Attached files
| file | filename |
|---|---|
| EX-14 - TIAA REAL ESTATE ACCOUNT | c64554_ex14.htm |
| EX-31 - TIAA REAL ESTATE ACCOUNT | c64664_ex31.htm |
| EX-32 - TIAA REAL ESTATE ACCOUNT | c64664_ex32.htm |
UNITED STATES
SECURITIES AND EXCHANGE COMMISSION
Washington, D.C. 20549
FORM 10-K
(Mark One)
S ANNUAL REPORT PURSUANT TO SECTION 13 OR 15(d) OF THE SECURITIES
EXCHANGE ACT OF 1934
For the fiscal year ended December 31, 2010
OR
£ TRANSITION REPORT PURSUANT TO SECTION 13 OR 15(d) OF THE SECURITIES EXCHANGE ACT OF 1934
For the transition period from to
Commission file number: 33-92990; 333-165286
TIAA REAL ESTATE ACCOUNT
(Exact name of registrant as specified in its charter)
NEW YORK
(State or other jurisdiction of incorporation or organization)
NOT APPLICABLE
(I.R.S. Employer Identification No.)
C/O TEACHERS INSURANCE AND
ANNUITY ASSOCIATION OF AMERICA
730 THIRD AVENUE
NEW YORK, NEW YORK 10017-3206
(Address of principal executive offices, including zip code)
Registrant’s telephone number, including area code: (212) 490-9000
Securities registered pursuant to Section 12(b) of the Act: None
Securities registered pursuant to Section 12(g) of the Act: None
Indicate by check mark if the registrant is a well-known seasoned issuer, as defined in Rule 405 of the Securities Act.
YES £ NO S
Indicate by check mark if the registrant is not required to file reports pursuant to Section 13 or Section 15(d) of the Exchange Act:
YES £ NO S
Indicate by check mark whether the Registrant (1) has filed all reports required to be filed by Section 13 or 15(d) of the Securities Exchange Act of 1934 during the preceding 12 months (or for such shorter period that the Registrant was required to file such reports), and (2) has been subject to such filing requirements for the past 90 days.
YES S NO £
Indicate by check mark if disclosure of delinquent filers pursuant to Item 405 or regulation S-K is not contained herein, and will not be contained, to the best of registrant’s knowledge, in definitive proxy or information statements incorporated by reference in Part III of this Form 10-K or any amendment to this Form 10-K: Not Applicable
Indicate by check mark whether the registrant has submitted electronically and posted on its corporate Web site, if any, every Interactive Data File required to be submitted and posted pursuant to Rule 405 of Regulation S-T (§232.405 of this chapter) during the preceding 12 months (or for such shorter period that the registrant was required to submit and post such files).
YES £ NO £
Indicate by check mark whether the registrant is a large accelerated filer, an accelerated filer, a non-accelerated filer, or smaller reporting company. See the definitions of “large accelerated filer,” “accelerated filer” and “smaller reporting company” in Rule 12b-2 of the Exchange Act. (Check one):
|
|
|
Large accelerated filer £ |
Accelerated filer £ |
|
Non-accelerated filer S |
Smaller Reporting Company £ |
|
(Do not check if a smaller reporting company) |
|
|
Indicate by check mark whether the registrant is a shell company (as defined in Rule 12b-2 of the Exchange Act).
YES £ NO S
Aggregate market value of voting stock held by non-affiliates: Not Applicable
Documents Incorporated by Reference: None
TABLE OF CONTENTS
Item
Page
Business
3
Risk Factors
8
Unresolved Staff Comments
20
Properties
20
Legal Proceedings
28
Reserved
28
Market for Registrant’s Securities, Related Stockholder Matters, and Issuer Purchases of Equity Securities
29
Selected Financial Data
30
Management’s Discussion and Analysis of Account’s Financial Condition and Results of Operations
32
Quantitative and Qualitative Disclosures about Market Risk
57
Financial Statements and Supplementary Data
59
Changes in and Disagreements with Accountants on Accounting and Financial Disclosure
92
Controls and Procedures
92
Other Information
92
Directors, Executive Officers, and Corporate Governance of the Registrant; Executive Compensation
93
Security Ownership of Certain Beneficial Owners and Management and Related Stockholder Matters
95
Certain Relationships and Related Transactions, and Director Independence
96
Principal Accountant Fees and Services
96
Exhibits and Financial Statement Schedules
97
98 2
General. The TIAA Real Estate Account (the “Real Estate Account”, the “Account” or the “Registrant”) was established on February 22, 1995, as an insurance company separate account of Teachers Insurance and Annuity Association of America (“TIAA”), a New York insurance company, by
resolution of TIAA’s Board of Trustees (the “Board”). The Account, which invests mainly in real estate and real estate-related investments, is a variable annuity investment option offered through individual, group and tax-deferred annuity contracts available to employees in the academic, medical, cultural and
research fields. The Account commenced operations on July 3, 1995, and interests in the Account were first offered to eligible participants on October 2, 1995. The Account offers individual and group accumulating annuity contracts (with contributions made on a pre-tax or after-tax basis), as well as individual lifetime and term-certain variable payout annuity contracts (including the payment of death benefits to beneficiaries). Investors are entitled to transfer funds to or
from the Account under certain circumstances. Funds invested in the Account for each category of contract are expressed in terms of units, and unit values will fluctuate depending on the Account’s performance. The Real Estate Account is designed as an option for retirement and tax-deferred savings plans for employees of non-profit and governmental institutions. TIAA currently offers the Real Estate Account under the following annuity contracts:
•
RA and GRAs (Retirement Annuities and Group Retirement Annuities) • SRAs (Supplemental Retirement Annuities) • GSRAs (Group Supplemental Retirement Annuities) • Retirement Choice and Retirement Choice Plus Annuity • GAs (Group Annuities) and Institutionally-Owned GSRAs • Classic and Roth IRAs (Individual Retirement Annuities) including SEP IRAs (Simplified Employee Pension Plans) • Keoghs • ATRAs (After-Tax Retirement Annuities) Investors should note that state regulatory approval may be pending for certain of these contracts and they may not currently be available in every state. The Account is regulated by the New York State Insurance Department (“NYID”) and the insurance departments of certain other jurisdictions in which the annuity contracts are offered. Although TIAA owns the assets of the Real Estate Account, and the Account’s obligations are obligations of TIAA, the
Account’s income, investment gains, and investment losses are credited to or charged against the assets of the Account without regard to TIAA’s other income, gains, or losses. Under New York insurance law, the Account cannot be charged with liabilities incurred by any other TIAA business activities or any other
TIAA separate account. Investment Objective. The Real Estate Account seeks favorable long-term returns primarily through rental income and appreciation of real estate and real estate-related investments owned by the Account. The Account will also invest in publicly-traded securities and short-term higher quality liquid
investments that are easily converted to cash to enable the Account to meet participant redemption requests, purchase or improve properties, or cover expense needs. Investment Strategy Real Estate-Related Investments. The Account intends to have between 75% and 85% of its net assets invested directly in real estate or real estate-related investments with the goal of producing favorable long-term returns primarily through rental income and appreciation. These investments may consist of: 3
•
Direct ownership interests in real estate, • Direct ownership of real estate through interests in joint ventures, • Indirect interests in real estate through real estate-related securities, such as:
•
real estate limited partnerships, • real estate investment trusts (REITs), which investments may consist of common or preferred stock interests, • investments in equity or debt securities of companies whose operations involve real estate (i.e., that primarily own or manage real estate) which may not be REITs, and • conventional mortgage loans, participating mortgage loans, and collateralized mortgage obligations, including commercial mortgage-backed securities (CMBS) and other similar investments. The Account’s principal strategy is to purchase direct ownership interests in income-producing real estate, primarily office, industrial, retail and multi-family residential properties. The Account is targeted to hold between 65% and 80% of the Account’s net assets in such direct ownership interests at any time.
Historically, over 70% of the Account’s net assets have been comprised of such direct ownership interests in real estate. In addition, while the Account is authorized to hold up to 25% of its net assets in liquid real estate-related securities, such as REITs and CMBS, management intends that the Account will not hold more than 10% of its net assets in such securities on a long-term basis. Historically, less than 10% of the Account’s
net assets have been comprised of interests in these securities. In particular, under the Account’s current investment guidelines, the Account is authorized to hold up to 10% of its net assets in CMBS. As of December 31, 2010, REIT securities comprised approximately 4.6% of the Account’s net assets, and the
Account held no CMBS as of such date. Non Real Estate-Related Investments. The Account will invest the remaining portion of its assets (targeted to be between 15% and 25% of its net assets) in publicly-traded, liquid investments; namely:
•
U.S. Treasury securities, • securities issued by U.S. government agencies or U.S. government sponsored entities, • corporate debt securities, • money market instruments, and • stock of companies that do not primarily own or manage real estate. However, from time to time (and most recently between late 2008 and mid 2010), the Account’s non real estate-related liquid investments may comprise less than 15% (and possibly less than 10%) of its assets (on a net basis and/or a gross basis), especially during and immediately following periods of significant net
participant outflows, in particular due to significant participant transfer activity. In addition, the Account, from time to time and on a temporary basis, may hold in excess of 25% of its net assets in non-real estate related liquid investments, particularly during times of significant inflows into the Account and/or there
is a lack of attractive real estate related investments available in the market. Liquid Securities. Primarily due to management’s need to manage fluctuations in cash flows, in particular during and immediately following periods of significant participant net transfer activity into or out of the Account, the Account may, on a temporary basis (i) exceed the upper end of its targeted holdings
(currently 35% of the Account’s net assets) in liquid securities of all types, including both publicly-traded non real estate-related liquid investments and liquid real estate-related securities, such as REITs and CMBS, or (ii) be below the low end of its targeted holdings in such liquid securities (currently 15% of the
Account’s net assets). The portion of the Account’s net assets invested in liquid investments of all types may exceed the upper end of its target, for example, if (i) the Account receives a large inflow of money in a short period of time, in particular due to significant participant transfer activity into the Account, (ii) the Account receives
significant proceeds from sales of direct real estate assets, (iii) there is a lack of attractive direct real estate investments 4
available on the market, and/or (iv) the Account anticipates more near-term cash needs, including to apply to acquire direct real estate investments, pay expenses or repay indebtedness. Foreign
Investments. The Account from time to time will also make foreign real
estate investments. Under the Account’s investment guidelines, investments
in direct foreign real estate, together with foreign real estate-related
securities and foreign non-real estate related liquid investments, may
not comprise more than 25% of the Account’s net assets. However, through
the date of this report, such foreign real estate related investments have
never represented more than 7.5% of the Account’s net assets and management
does not intend such foreign investments to exceed 10% of the Account’s
net assets. As of December 31, 2010, our foreign assets represented approximately
2.5% of the Account’s net assets (after netting out the fair value
of debt on our foreign properties). More detailed information concerning the composition of the Account’s properties, including the Account’s foreign investments and information regarding significant tenants in the Account’s properties, is contained below under the heading “Item 2. Properties.” Net Assets and Portfolio Investments: At December 31, 2010, the Account’s net assets totaled approximately $10.8 billion. As of that date, the Account’s investments in real estate properties, real estate joint ventures, limited partnerships and real estate-related marketable securities, net of the fair value of
mortgage loans payable on real estate, represented 77.6% of the Account’s net assets. At December 31, 2010, the Account held a total of 99 real estate property investments (including its interests in 11 real estate-related joint ventures), representing 75.0% of the Account’s total investments (measured on a gross asset value basis (“Total Investments”)). As of that date, the Account also held
investments in REIT equity securities (representing 3.9% of Total Investments), real estate limited partnerships (representing 2.1% of Total Investments), government agency notes (representing 11.8% of Total Investments) and U.S. Treasury securities (representing 7.2% of Total Investments). See the Account’s
audited financial statements for more information as to the Account’s investments as of December 31, 2010. Borrowing: The Account may borrow money and assume or obtain a mortgage on a property—i.e., make leveraged real estate investments. Under the Account’s current investment guidelines, management intends to maintain the Account’s loan to value ratio (as defined below) at or below 30%. However,
through December 31, 2011:
•
the Account will maintain outstanding debt in an aggregate principal amount not to exceed the aggregate principal amount of debt outstanding as of the date of adoption of such guidelines in July 2009 (approximately $4.0 billion); and • subject to this $4.0 billion limitation, the Account may incur and/or maintain debt on its properties (including (i) refinancing outstanding debt, (ii) assuming debt on the Account’s properties, (iii) extending the maturity date of outstanding debt and/or (iv) incurring new debt on its properties). The Account’s loan to value ratio at any time is based on the ratio of the outstanding principal amount of the Account’s debt to the Account’s total gross asset value. The Account’s total gross asset value, for these purposes, is equal to the total fair value of the Account’s assets (including the fair value of the
Account’s interest in joint ventures), with no reduction associated with any indebtedness on such assets. By December 31, 2011, management intends the Account’s loan to value ratio to be 30% or less and thereafter intends to maintain its loan to value ratio at or below 30% (measured at the time of incurrence and
after giving effect thereto). In calculating outstanding indebtedness, we will include only the Account’s actual percentage interest in any borrowings on a joint venture investment and not that of any joint venture partner. Also, at the time the Account (or a joint venture in which the Account is a partner) enters into
a revolving line of credit, management deems the maximum amount which may be drawn under that line of credit as fully incurred, regardless of whether the maximum amount available has been drawn from time to time. As of December 31, 2010, the aggregate principal amount of the Account’s outstanding debt (including the Account’s share of debt on its joint venture investments) was $3.5 billion and the Account’s loan to value ratio was approximately 24.3%. In times of high net inflow activity, in particular during times of high net participant transfer inflows, management may determine to apply a portion of such cash flows to make prepayments of indebtedness 5
prior to scheduled maturity, which would have the effect of reducing the Account’s loan to value ratio. Such prepayments may require the Account to pay fees or ‘yield maintenance’ amounts to lenders. In addition, while it has not done so as of the date of this report, the Account may obtain a line of credit to meet short-term cash needs, which line of credit may be unsecured and/or contain terms that may require the Account to secure a loan with one or more of its properties. Management expects the proceeds
from any such short-term borrowing would be used to meet the cash flow needs of the Account’s properties and real estate-related investments, but depending on the circumstances, proceeds could be used for Account-level funding needs (including the need to honor unexpected participant withdrawal activity). The Account may only borrow up to 70% of the then current value of a property, although construction loans may be for 100% of costs incurred in developing the property. Except for construction loans, any mortgage loans on a property will be non-recourse to the Account, meaning that if there is a default on a
loan in respect of a specific property, the lender will have recourse to (i.e., be able to foreclose on) only the property encumbered (or the joint venture owning the property), or to other specific Account properties that may have been pledged as security for the defaulted loan, but not to any other assets of the
Account. When possible, the Account will seek to have loans mature at varying times to limit the risks of borrowing. Risk Factors. The Account’s assets and income can be affected by a variety of risk factors. These risks are more fully described under Item 1A of this Report and in the Account’s prospectus (as supplemented from time to time). Personnel and Management. The Account does not directly employ any persons nor does the Account have its own management or board of directors. Rather, TIAA employees, under the direction and control of TIAA’s Board of Trustees and Investment Committee, manage the investment of the
Account’s assets, following investment management procedures TIAA has adopted for the Account. In addition, TIAA performs administration functions for the Account (which includes receiving and allocating premiums, calculating and making annuity payments and providing recordkeeping and other services).
Distribution services for the Account (which include, without limitation, distribution of the annuity contracts, advising existing annuity contract owners in connection with their accumulations and helping employers implement and manage retirement plans) are performed by TIAA-CREF Individual & Institutional
Services, LLC (“Services”), a wholly owned subsidiary of TIAA and registered broker-dealer and member of the Financial Industry Regulatory Authority (“FINRA”). TIAA and Services provide investment advisory, administration, and distribution services, as applicable, on an “at-cost” basis. Contracts. TIAA offers the Account as a variable option for the annuity contracts listed earlier in this Item 1, although some employer plans may not offer the Account as an option for certain contracts. Each payment to the Account buys a number of accumulation units. Similarly, any transfer or
withdrawal from the Account results in the redemption of a number of accumulation units. The price paid for an accumulation unit, and the price received for an accumulation unit when redeemed, is the accumulation unit value (which we sometimes call the “AUV”) calculated for the business day on which we
receive a participant’s purchase, redemption or transfer request in good order (unless a participant asks for a later date for a redemption or transfer). Subject to the terms of the contracts and a participant’s employer’s plan, a participant can move money to and from the Account in the following ways:
•
from the Account to a CREF investment account, a TIAA Access variable account (if available), TIAA’s traditional annuity or a fund (including TIAA-CREF affiliated funds) or other option available under the plan; • to the Account from a CREF investment account, a TIAA Access variable account (if available), TIAA’s traditional annuity (transfers from TIAA’s traditional annuity under RA, GRA or Retirement Choice contracts are subject to restrictions), a TIAA-CREF affiliated fund or from other companies/plans; • by withdrawing cash; and/or • by setting up a program of automatic withdrawals or transfers. Importantly, transfers out of the Account to a TIAA or CREF account or into another investment option can be executed on any business day but are limited to once per calendar quarter, although some plans may allow 6
systematic transfers that result in more than one transfer per calendar quarter. Other limited exceptions may apply. Also, transfers to CREF accounts or to certain other options may be restricted by an employer’s plan, current tax law or by the terms of a participant’s contract. In addition, effective March 31, 2011
(or such later date as indicated in the contract or contract endorsement), individual participants with contracts issued in certain jurisdictions will be limited from making internal transfers into their Account accumulation if, after giving effect to such transfer, the total value of such participant’s Account accumulation
(under all contracts issued to such participant) would exceed $150,000. See the Account’s prospectus for more information. Appraisals and Valuations. With respect to the Account’s real property investments, following the initial purchase of a property or the making of a mortgage loan on a property by the Account (at which time the Account normally receives an independent appraisal on such property), each of the Account’s
real properties are appraised, and mortgage loans are valued, at least once every calendar quarter or sooner as circumstances arise. Each of the Account’s real estate properties are appraised each quarter by an independent external state-certified (or its foreign equivalent) appraiser (which we refer to in this report
as an “independent appraiser”) who is a member of a professional appraisal organization. In addition, TIAA’s internal appraisal staff performs a review of each of these quarterly appraisals, in conjunction with the Account’s independent fiduciary, and TIAA’s internal appraisal staff or the independent fiduciary
may request an additional appraisal or valuation outside of this quarterly cycle. Any differences in the conclusions of TIAA’s internal appraisal staff and the independent appraiser will be reviewed by the independent fiduciary, which will make a final determination on the matter (which may include ordering a
subsequent independent appraisal). In general, the Account records appraisals of its real estate properties spread out throughout the quarter, which is intended to result in appraisal adjustments and thus adjustments to the valuations of its holdings (to the extent adjustments are made) happen regularly throughout each quarter and not on one specific
day in each period. In addition, an estimated daily equivalent of net operating income is taken into consideration and is adjusted for actual transactional activity. The remaining assets in the Account are primarily marketable securities that are priced on a daily basis. See “Management’s Discussion and Analysis of
Results of Operations and Financial Condition—Critical Accounting Policies” in this Form 10-K for more information on how each class of the Account’s investments are valued. Liquidity Guarantee. The TIAA general account provides the Account with a liquidity guarantee enabling the Account to have funds available to meet participant redemption, transfer or cash withdrawal requests. If the Account cannot fund participant requests from the Account’s own cash flow and
liquid investments, the TIAA General Account will fund them by purchasing accumulation units issued by the Account (accumulation units that are purchased by TIAA are generally referred to as “liquidity units”). This liquidity guarantee is required by the NYID. TIAA guarantees that participants can redeem
their accumulation units at the accumulation unit value next determined after their transfer or cash withdrawal request is received in good order. Liquidity units owned by TIAA are valued in the same manner as accumulation units owned by the Account’s participants. Importantly, however, this liquidity guarantee is not a guarantee of the investment performance of the Account or a guarantee of the value of a participant’s units. The Account pays TIAA for the liquidity guarantee through a daily deduction from the Account’s net assets. Primarily as a result of significant net
participant transfers in the second half of 2008 and the first half of 2009, pursuant to this liquidity guarantee obligation, the TIAA general account purchased an aggregate of $1.2 billion of liquidity units issued by the Account between December 2008 and June 2009. Since July 1, 2009 and through the date of filing
this Form 10-K, no further liquidity units have been purchased. As of the date of filing this Form 10-K, no accumulation units have been redeemed by TIAA. Management cannot predict when future accumulation unit purchases may be required under this liquidity guarantee, nor can management predict when such liquidity units will be redeemed in part, or in full. Please refer to the “Liquidity and Capital Resources” section in “Management’s Discussion and Analysis
of the Account’s Financial Condition and Results of Operations” for more information concerning the Liquidity Guarantee. Independent Fiduciary. Because TIAA’s ability to purchase and sell liquidity units raises certain technical issues under the Employee Retirement Income Security Act of 1974, as amended (“ERISA”), TIAA applied for and received a prohibited transaction exemption from the U.S. Department of Labor
in 1996 (PTE 96-76). In connection with the exemption, TIAA has appointed an independent fiduciary for the Account, with 7
overall responsibility for reviewing the Account’s transactions to determine whether they are in accordance with the Account’s investment guidelines. Real Estate Research Corporation, a real estate consulting firm whose principal offices are located in Chicago, Illinois, was appointed as independent fiduciary
effective March 1, 2006 and currently serves as the Account’s independent fiduciary. Its term expires in February 2012. The independent fiduciary’s responsibilities include:
•
reviewing and approving the Account’s investment guidelines and monitoring whether the Account’s investments comply with those guidelines; • reviewing and approving valuation procedures for the Account’s properties; • approving adjustments to any property valuations that change the value of the property or the Account as a whole above or below certain prescribed levels, or that are made within three months of the annual independent appraisal; • reviewing and approving how the Account values accumulation and annuity units; • approving the appointment of all independent appraisers; • reviewing the purchase and sale of units by TIAA to ensure that the Account uses the correct unit values; and • requiring appraisals besides those normally conducted, if the independent fiduciary believes that any of the properties have changed materially, or that an additional appraisal is necessary to ensure the Account has correctly valued a property. In addition, the independent fiduciary has certain responsibilities with respect to the Account that it had historically undertaken or is currently undertaking with respect to TIAA’s purchase and ownership of liquidity units, including among other things, reviewing the purchases and redemption of liquidity units by
TIAA to ensure the Account uses the correct unit values. In connection therewith, as set forth in PTE 96-76, the independent fiduciary’s responsibilities include:
•
establishing the percentage of total accumulation units that TIAA’s ownership should not exceed (the “trigger point”) and creating a method for changing the trigger point; • approving any adjustment of TIAA’s ownership interest in the Account and, in its discretion, requiring an adjustment if TIAA’s ownership of liquidity units reaches the trigger point; and • once the trigger point has been reached, participating in any program to reduce TIAA’s ownership in the Account by utilizing cash flow or liquid investments in the Account, or by utilizing the proceeds from asset sales. If the independent fiduciary were to determine that TIAA’s ownership should be reduced
following the trigger point, its role in participating in any asset sales program would include (i) participating in the selection of properties for sale, (ii) providing sales guidelines, and (iii) approving those sales if, in the independent fiduciary’s opinion, such sales are desirable to reduce TIAA’s ownership of
liquidity units. The independent fiduciary, which has the right to adjust the trigger point, has established the trigger point at 45% of the outstanding accumulation units and it will continue to monitor TIAA’s ownership interest in the Account and provide further recommendations as necessary. As of December 31, 2010, TIAA
owned 9.8% of the outstanding accumulation units of the Account. The independent fiduciary is vested with oversight and approval over any redemption of TIAA’s liquidity units, acting in the best interests of Real Estate Account participants. Available Information. The Account’s annual report on Form 10-K, and quarterly reports on Form 10-Q, and any amendments to those reports, filed by the Account with the Securities and Exchange Commission on or after the date hereof, can be accessed free of charge at www.tiaa-cref.org.
Information contained on this website is expressly not incorporated by reference into this Annual Report on Form 10-K. The value of your investment in the Account will fluctuate based on the value of the Account’s assets and the income the assets generate and the Account’s expenses. Participants can lose money by investing in the Account. There is risk associated with an investor attempting to “time” an investment in the
Account’s units, 8
or effecting a redemption of an investor’s units. The Account’s assets and income can be affected by many factors, and you should consider the specific risks presented below before investing in the Account. In particular, for a discussion of how forward-looking statements contained in this Annual Report on Form
10-K are subject to uncertainties that are difficult to predict, which may be beyond management’s control and which could cause actual results to differ materially from historical experience or management’s present expectations, please refer to the subsection entitled “Forward-Looking Statements,” which is
contained in the section entitled “Management’s Discussion and Analysis of the Account’s Financial Condition and Results of Operations.” RISKS ASSOCIATED WITH REAL ESTATE INVESTING General Risks of Acquiring and Owning Real Property: As referenced elsewhere in this report, the substantial majority of the Account’s net assets are comprised of direct ownership interests in real estate. As such, the Account is particularly subject to the risks inherent in acquiring and owning real property,
including in particular the following:
•
Adverse Global and Domestic Economic Conditions. The economic conditions in the markets where the Account’s properties are located may be adversely impacted by factors which include:
adverse domestic or global economic conditions, particularly in the event of a deep recession which results in significant employment losses across many sectors of the economy and reduced levels of consumer spending; • a weak market for real estate generally and/or in specific locations where the Account may own property; • the availability of financing (both for the Account and potential purchasers of the Account’s properties); • an oversupply of, or a reduced demand for, certain types of real estate properties; • business closings, industry or sector slowdowns, employment losses and related factors; • natural disasters, flooding and other significant and severe weather-related events, including those caused by global climate change; • terrorist attacks and/or other man-made events; and • decline in population or shifting demographics. The incidence of some or all of these factors could reduce occupancy, rental rates and the market value of the Account’s real properties or interests in investment vehicles (such as limited partnerships) which directly hold real properties.
•
Concentration Risk. The Account may experience periods in which its investments are geographically concentrated, either regionally or in certain markets with similar demographics. Further, while the Account seeks diversification across its four primary property types: office, industrial, retail and multi-family
residential properties, the Account may experience periods where it has concentration in one property type, increasing the potential exposure if there were to be an oversupply of, or a reduced demand for, certain types of real estate properties in the markets in which the Account operates. Also, the Account may experience periods in which its tenant base is concentrated within a particular industry sector. In particular, the Account owns and operates a number of industrial properties, which typically feature larger tenant concentration. The insolvency and/or closing of a single tenant in one of our
industrial properties may significantly impair the income generated by an industrial property, and may also depress the value of such property. If any or all of these events occur, the Account’s income and performance may be adversely impacted disproportionately by deteriorating economic conditions in those areas or industry sectors in which the Account’s investments are concentrated. Also, the Account could experience a more rapid negative
change in the value of its real estate investments than would be the case if its real estate investments were more diversified. 9
•
• Leasing Risk. A number of factors could cause the Account’s rental income, a key source of the Account’s revenue and investment return, to decline, which would adversely impact the Account’s results and investment returns. These factors include the following:
•
A property may be unable to attract new tenants or retain existing tenants. This situation could be exacerbated if a concentration of lease expirations occurred during any one time period or multiple tenants exercise early termination at the same time. • The financial condition of our tenants may be adversely impacted, particularly in a prolonged economic downturn. The Account could lose revenue if tenants do not pay rent when contractually obligated, request some form of rent relief and/or default under a lease at one of the Account’s properties. Such a
default could occur if a tenant declared bankruptcy, suffered from a lack of liquidity, failed to continue to operate its business or for other reasons. In the event of any such default, we may experience a delay in, or an inability to effect, the enforcement of our rights against that tenant, particularly if that
tenant filed for bankruptcy protection. Further, any disputes with tenants could involve costly and time consuming litigation. • In the event a tenant vacates its space at one of the Account’s properties, whether as a result of a default, the expiration of the lease term, rejection of the lease in bankruptcy or otherwise, given current market conditions, we may not be able to re-lease the vacant space either (i) for as much as the rent
payable under the previous lease or (ii) at all. Also, we may not be able to re-lease such space without incurring substantial expenditures for tenant improvements and other lease-up related costs, while still being obligated for any mortgage payments, real estate taxes and other expenditures related to the
property. • In some instances, our properties may be specifically suited to and/or outfitted for the particular needs of a certain tenant based on the type of business the tenant operates. For example, many companies desire space with an open floor plan. We may have difficulty obtaining a new tenant for any vacant space
in our properties, particularly if the floor plan limits the types of businesses that can use the space without major renovation, which may require us to incur substantial expense in re-planning the space. Also, upon expiration of a lease, the space preferences of our major tenants may no longer align with the
space they previously rented, which could cause those tenants to not renew their lease, or may require us to expend significant sums to reconfigure the space to their needs. • The Account owns and operates retail properties, which, in addition to the risks listed above, are subject to specific risks, including variations in rental revenues due to customary “percentage rent” clauses which may be in place for retail tenants and the insolvency and/or closing of an anchor tenant. Many
times, anchor tenants will be “big box” stores and other large retailers that can be particularly adversely impacted by a global recession and reduced consumer spending generally. Factors that can impact the level of consumer spending include increases in fuel and energy costs, residential and commercial real
estate and mortgage conditions, labor and healthcare costs, access to credit, consumer confidence and other macroeconomic factors. • Under certain circumstances, co-tenancy clauses in tenants’ leases may allow certain tenants in a retail property to terminate their leases, reduce or withhold rental payments when overall occupancy at the property falls below certain minimum levels. The insolvency and/or closing of an anchor tenant may also
cause such tenants to terminate their leases, or to fail to renew their leases at expiration.
•
Competition. The Account may face competition for real estate investments from multiple sources, including individuals, corporations, insurance companies or other insurance company separate accounts, as well as real estate limited partnerships, real estate investment funds, commercial developers, pension
plans, other institutional and foreign investors and other entities engaged in real estate investment activities. Some of these competitors may have similar financial and other resources as the Account, and/or they may have investment strategies and policies (including the ability to incur significantly more
leverage than the Account) that allow them to compete more aggressively for real estate investment opportunities, which could result in the Account paying higher prices for investments, experiencing delays in acquiring investments or failing to consummate such purchases. Any resulting delays in the
acquisition of investments, or the failure to consummate acquisitions the Account deems desirable, may increase the Account’s costs or otherwise adversely affect the Account’s investment results.
10
In addition, the Account’s properties may be located close to properties that are owned by other real estate investors and that compete with the Account for tenants. These competing properties may be better located, more suitable for tenants than our properties or have owners who may compete more
aggressively for tenants, resulting in a competitive advantage for these other properties. We may also face similar competition from other properties that may be developed in the future. This competition may limit the Account’s ability to lease space, increase its costs of securing tenants, limit our ability to
maximize our rents and/or require the Account to make capital improvements it otherwise would not, in order to make its properties more attractive to prospective tenants. • Operating Costs. A property’s cash flow could decrease if operating costs, such as property taxes, utilities, litigation expenses associated with a property, maintenance and insurance costs that are not reimbursed by tenants increase in relation to gross rental income, or if the property needs unanticipated repairs
and renovations. In addition, the Account’s expenses of owning and operating a property are not necessarily reduced when our income from a property is reduced. • Condemnation. A governmental agency may condemn and convert for a public use (i.e., through eminent domain) all or a portion of a property owned by the Account. While the Account would receive compensation in connection with any such condemnation, such compensation may not be in an amount the
Account believes represents equivalent value for the condemned property. Further, a partial condemnation could impair the ability of the Account to maximize the value of the property during its operation, including making it more difficult to find new tenants or retain existing tenants. Finally, a property
which has been subject to a partial condemnation may be more difficult to sell at a price the Account believes is appropriate. • Terrorism and Acts of War and Violence. Terrorist attacks may harm our property investments. The Account cannot assure you that there will not be further terrorist attacks against the United States, U.S. businesses or elsewhere in the world. These attacks or armed conflicts may directly or indirectly impact
the value of the property we own or that secure our loans. Losses resulting from these types of events may be uninsurable or not insurable to the full extent of the loss suffered. Moreover, any of these events could cause consumer confidence and spending to decrease or result in increased volatility in the United
States and worldwide financial markets and economy. Such events could also result in economic uncertainty in the United States or abroad. Adverse economic conditions resulting from terrorist activities could reduce demand for space in the Account’s properties and thereby reduce the value of the Account’s
properties and therefore your investment return. General Risks of Selling Real Estate Investments: Among the risks of selling real estate investments are:
The sale price of an Account property might differ, perhaps significantly, from its estimated or appraised value, leading to losses or reduced profits to the Account. • The Account might not be able to sell a property at a particular time for a price which management believes represents its fair or full value. This illiquidity may result from the cyclical nature of real estate, general economic conditions impacting the location of the property, disruption in the credit markets or
the availability of financing on favorable terms or at all, and the supply of and demand for available tenant space, among other reasons. This might make it difficult to raise cash quickly which could impair the Account’s liquidity position (particularly during any period of sustained significant net participant
outflows) and also could lead to Account losses. Further, the liquidity guarantee does not serve as a working capital facility or credit line to enhance the Account’s liquidity levels generally, as its purpose is tied to participants having the ability to redeem their accumulation units upon demand (thus, alleviating
the Account’s need to dispose of properties solely to increase liquidity levels in what management deems a suboptimal sales environment). • The Account may need to provide financing to a purchaser if no cash buyers are available, or if buyers are unable to receive financing on terms enabling them to consummate the purchase. Such seller financing introduces a risk that the counterparty may not perform its obligations to repay the amounts
borrowed from the Account to complete the purchase. • For any particular property, the Account may be required to make expenditures for improvements to, or to correct defects in, the property before the Account is able to market and/or sell the property. 11
•
Valuation and Appraisal Risks: Investments in the Account’s assets are stated at fair value, which is defined as the price that would be received to sell the asset in an orderly transaction between market participants at the measurement date. Determination of fair value, particularly for real estate assets, involves
significant judgment. Valuation of the Account’s real estate properties (which comprise a substantial majority of the Account’s net assets) are based on real estate appraisals, which are estimates of property values based on a professional’s opinion and may not be accurate predictors of the amount the Account
would actually receive if it sold a property. Appraisals can be subjective in certain respects and rely on a variety of assumptions and conditions at that property or in the market in which the property is located, which may change materially after the appraisal is conducted. Among other things, market prices for
comparable real estate may be volatile, in particular if there has been a lack of recent transaction activity in such market. Recent disruptions in the macroeconomy, real estate markets and the credit markets have led to a significant decline in transaction activity in most markets and sectors and the lack of
observable transaction data may have made it more difficult for an appraisal to determine the fair value of the Account’s real estate. In addition, a portion of the data used by appraisers is based on historical information at the time the appraisal is conducted, and subsequent changes to such data, after an appraiser
has used such data in connection with the appraisal, may not be adequately captured in the appraised value. Further, as the Account generally obtains appraisals on a quarterly basis, there may be circumstances in the period between appraisals or interim valuation adjustments in which the true realizable value of a property is not reflected in the Account’s daily net asset value calculation or in the Account’s periodic
financial statements. This disparity may be more apparent when the commercial and/or residential real estate markets experience an overall and possibly dramatic decline (or increase) in property values in a relatively short period of time between appraisals. If the appraised values of the Account’s properties as a whole are too high, those participants who purchased accumulation units prior to (i) a downward valuation adjustment of a property or multiple properties or (ii) a property or properties being sold for a lower price than the appraised value will be credited with
less of an interest than if the value had previously been adjusted downward. Also, those participants who redeem during any such period will have received more than their pro rata share of the value of the Account’s assets, to the detriment of other non-redeeming participants. In particular, appraised property
values may prove to be too high (as a whole) in a rapidly declining commercial real estate market. Further, implicit in the Account’s definition of fair value is a principal assumption that there will be a reasonable time to market a given property and that the property will be exchanged between a willing buyer and
willing seller in a non-distressed scenario. However, an appraised value may not reflect the actual realizable value that would be obtained in a rush sale where time was of the essence. Also, appraised values may lag actual realizable values to the extent there is significant and rapid economic deterioration in a
particular geographic market or a particular sector within a geographic market. If the appraised values of the Account’s properties as a whole are too low, those participants who redeem prior to (i) an upward valuation adjustment of a property or multiple properties or (ii) a property or properties being sold for a higher price than the appraised value will have received less than their pro rata
share of the value of the Account’s assets, and those participants who purchase units during any such period will be credited with more than their pro rata share of the value of the Account’s assets. Finally, the Account recognizes items of income (such as net operating income from real estate investments, distributions from real estate limited partnerships or joint ventures, or dividends from REIT stocks) and expense in many cases on an intermittent basis, where the Account cannot predict with certainty the
magnitude or the timing of such item. As such, even as the Account estimates items of net operating income on a daily basis, the AUV for the Account may fluctuate, perhaps significantly, from day to day, as a result of adjusting these estimates for the actual recognized item of income or expense. Investment Risk Associated with Participant Transactions: The amount we have available to invest in new properties and other real estate-related assets will depend, in large part, on the level of net participant transfers into or out of the Account as well as participant premiums into the Account. As noted elsewhere
in this report, the Account intends to hold between 15% and 25% of its net assets in investments other than real estate and real estate-related investments, comprised of publicly traded, liquid investments. These liquid assets are intended to be available to purchase real estate-related investments in accordance with
the Account’s investment objective and strategy and are also available to meet participant redemption requests and the Account’s expense needs (including, from time to time, obligations on debt). 12
In the second half of 2008 and in 2009, the Account experienced significant net participant transfers out of the Account. Due in large part to this activity, the TIAA liquidity guarantee was initially executed in December 2008. The Account experienced net participant outflows in each quarter of 2009, causing the
Account’s liquid assets to comprise less than 10% of the Account’s assets (on a net and total basis) throughout all of 2009 and into early 2010. Among other things, this continued shortfall in the amount of liquid assets impaired management’s ability to consummate new transactions. If the amount of net participant
transfers out of the Account were to recur, particularly in the high volumes similar to that experienced in late 2008 and 2009, we may not have enough available liquid assets to pursue, or consummate, new investment opportunities presented to us that are otherwise attractive to the Account. This, in turn, could
harm the Account’s returns. Even though net transfers out of the Account ceased in early 2010, there is no guarantee that redemption activity will not increase again, perhaps in a significant and rapid manner. Alternatively, periods of significant net transfer activity into the Account can result in the Account holding a higher percentage of its net assets in cash and cash equivalents than the Account’s managers would elect to hold under the Account’s long-term investment strategy. In the final three quarters of 2010, unlike
the first quarter of 2010, the Account experienced net participant transfer activity into the Account in the amount of $1.4 billion. As of December 31, 2010, the Account’s non real estate-related liquid assets comprised 22.3% of its net assets. At times, the portion of the Account’s net assets invested in these types of
liquid instruments may exceed 25%, particularly if the Account receives a large inflow of money in a short period of time, coupled with a lack of attractive real estate-related investments on the market. In an appreciating real estate market generally, this large percentage of assets held in liquid investments and not
in real estate and real estate-related investments may impair the Account’s overall returns. This scenario may be exacerbated in a low interest rate environment for U.S. Treasury securities and related highly liquid securities, such as has existed since 2009. In addition, to manage cash flow, the Account may
temporarily hold a higher percentage of its net assets in liquid real estate-related securities, such as REIT and CMBS securities, than its long-term targeted holdings in such securities, particularly during and immediately following times of significant net transfer activity into the Account. Such holdings could increase
the volatility of the Account’s returns. Risks of Borrowing: The Account acquires some of its properties subject to existing financing and from time to time borrows new funds at the time of purchase. Also, the Account may from time to time place new leverage on, increase the leverage already placed on, or refinance maturing debt on, existing
properties the Account owns. Under the Account’s current investment guidelines, the Account intends to maintain its loan to value ratio at or below 30% (measured at the time of incurrence and after giving effect thereto). As of December 31, 2010, the Account’s loan to value ratio was approximately 24.3%.
However, through December 31, 2011, the Account is permitted to maintain indebtedness, in the aggregate, either directly or through its joint venture investments, in an amount up to approximately $4.0 billion, which, as of December 31, 2010, would represent a loan to value ratio of approximately 27.7%. Also, the
Account may borrow up to 70% of the then-current value of a particular property. Non-construction mortgage loans on a property will be non-recourse to the Account. Among the risks of borrowing money or otherwise investing in a property subject to a mortgage are:
•
General Economic Conditions. General economic conditions, dislocations in the capital or credit markets generally or the market conditions then in effect in the real estate finance industry, may hinder the Account’s ability to obtain financing or refinancing for its property investments on favorable terms or at
all, regardless of the quality of the Account’s property for which financing or refinancing is sought. Such unfavorable terms might include high interest rates, increased fees and costs and restrictive covenants applicable to the Account’s operation of the property. Longer term disruptions in the capital and
credit markets as a result of uncertainty, changing or increased regulation, reduced alternatives or failures of significant financial institutions could adversely affect our access to financing necessary to make profitable real estate investments. Our failure to obtain financing or refinancing on favorable terms due
to the current state of the credit markets or otherwise could have an adverse impact on the returns of the Account. • Default Risk. The property may not generate sufficient cash flow to support the debt service on the loan, the property may fail to meet certain financial or operating covenants contained in the loan documents and/or the property may have negative equity (i.e., the loan balance exceeds the value of the
property). In any of these circumstances, we may default on the loan, including due to the failure to make required debt service payments when due. If a loan is in default, the Account may determine 13
that it is not economically desirable and/or in the best interests of the Account to continue to make payments on the loan (including accessing other sources of funds to support debt service on the loan), and/or the Account may not be able to otherwise remedy such default on commercially reasonable terms
or at all. In either case, the lender then could accelerate the outstanding amount due on the loan and/or foreclose on the underlying property, in which case the Account could lose the value of its investment in the foreclosed property. Further, any such default or acceleration could trigger a default under loan
agreements in respect of other Account properties pledged as security for the defaulted loan. Finally, any such default could increase the Account’s borrowing costs, or result in less favorable terms, with respect to financing future properties. • Balloon Maturities. If the Account obtains a mortgage loan that involves a balloon payment, there is a risk that the Account may not be able to make the lump sum principal payment due under the loan at the end of the loan term, or otherwise obtain adequate refinancing on terms commercially acceptable to
the Account or at all. The Account then may be forced to sell the property or other properties under unfavorable market conditions or default on its mortgage, resulting in the lender exercising its remedies, which may include repossession of the property, and the Account could lose the value of its investment
in that property. • Variable Interest Rate Risk. If the Account obtains variable-rate loans, the Account’s returns may be volatile when interest rates are volatile. Further, to the extent that the Account takes out fixed-rate loans and interest rates subsequently decline, this may cause the Account to pay interest at above-market
rates for a significant period of time. Any hedging activities the Account engages in to mitigate this risk may not fully protect the Account from the impact of interest rate volatility. • Valuation Risk. The market valuation of mortgage loans payable could have an adverse impact on the Account’s performance. Valuations of mortgage loans payable are generally based on the amount at which the liability could be transferred in a current transaction, exclusive of transaction costs, and such
valuations are subject to a number of assumptions and factors with respect to the loan and the underlying property, a change in any of which could cause the value of a mortgage loan to fluctuate. A general disruption in the credit markets, such as the disruption experienced in 2008 and 2009, may aggravate some or all of these risks. Risks of Joint Ownership: Investing in joint venture partnerships or other forms of joint property ownership may involve special risks, many of which are exacerbated when the consent of parties other than the Account are required to take action.
•
The co-venturer may have interests or goals inconsistent with those of the Account, including during times when a co-venturer may be experiencing financial difficulty. For example:
a co-venturer may desire a higher current income return on a particular investment than does the Account (which may be motivated by a longer-term investment horizon or exit strategy), or vice versa, which could cause difficulty in managing a particular asset; • a co-venturer may desire to maximize or minimize leverage in the venture, which may be at odds with the Account’s strategy; • a co-venturer may be more or less likely than the Account to agree to modify the terms of significant agreements (including loan agreements) binding the venture, or may significantly delay in reaching a determination whether to do so, each of which may frustrate the business objectives of the Account;
and • for reasons related to its own business strategy, a co-venturer may have different concentration standards as to its investments (geographically, by sector, or by tenant), which might frustrate the execution of the business plan for the joint venture.
•
The co-venturer may be unable to fulfill its obligations (such as to fund its pro rata share of committed capital, expenditures or guarantee obligations of the venture) during the term of such agreement or may become insolvent or bankrupt, any of which could expose the Account to greater liabilities than
expected and frustrate the investment objective of the venture.
14
•
• If a co-venturer doesn’t follow the Account’s instructions or adhere to the Account’s policies, the jointly owned properties, and consequently the Account, might be exposed to greater liabilities than expected. • The Account may have limited rights with respect to the underlying property pursuant to the terms of the joint venture, including the right to operate, manage or dispose of a property, and a co-venturer could have approval rights over the marketing or the ultimate sale of the underlying property. • The terms of the Account’s ventures often provide for complicated agreements which can impede our ability to direct the sale of the property owned by the venture at times the Account views most favorable. One such agreement is a ‘buy-sell’ right, which may force us to make a decision (either to buy our
co-venturer’s interest or sell our interest to our co-venturer) at inopportune times. • A co-venturer can make it harder for the Account to transfer its equity interest in the venture to a third party, which could adversely impact the valuation of the Account’s interest in the venture. Regulatory Risks: Government regulation at the federal, state and local levels, including, without limitation, zoning laws, rent control or rent stabilization laws, laws regulating housing on the Account’s multifamily residential properties, the Americans with Disabilities Act, property taxes and fiscal, accounting,
environmental or other government policies, could operate or change in a way that adversely affects the Account and its properties. For example, these regulations could raise the cost of acquiring, owning, improving or maintaining properties, present barriers to otherwise desirable investment opportunities or make
it harder to sell, rent, finance, or refinance properties either on economically desirable terms, or at all, due to the increased costs associated with regulatory compliance. Environmental Risks: The Account may be liable for damage to the environment or injury to individuals caused by hazardous substances used or found on its properties. Under various environmental regulations, the Account may also be liable, as a current or previous property owner or mortgagee, for the cost of
removing or cleaning up hazardous substances found on a property, even if it did not know of and wasn’t responsible for the hazardous substances. If any hazardous substances are present or the Account does not properly clean up any hazardous substances, or if the Account fails to comply with regulations
requiring it to actively monitor the business activities on its premises, the Account may have difficulty selling or renting a property or be liable for monetary penalties. Further, environmental laws may impose restrictions on the manner in which a property may be used, the tenants which may be allowed, or the
manner in which businesses may be operated, which may require the Account to expend funds. These laws may also cause the most ideal use of the property to differ from that originally contemplated and as a result could impair the Account’s returns. The cost of any required cleanup relating to a single real estate
investment (including remediation of contaminated property) and the Account’s potential liability for environmental damage, including paying personal injury claims and performing under indemnification obligations to third parties, could exceed the value of the Account’s investment in a property, the property’s
value, or in an extreme case, a significant portion of the Account’s assets. Finally, while the Account may from time to time acquire third-party insurance related to environmental risks, such insurance coverage may be inadequate to cover the full cost of any loss and would cause the Account to be reliant on the
financial health of our third-party insurer at the time any such claim is submitted. Uninsurable Losses: Certain catastrophic losses (e.g., from earthquakes, wars, terrorist acts, nuclear accidents, wind, floods or environmental or industrial hazards or accidents) may be uninsurable or so expensive to insure against that it is economically disadvantageous to buy insurance for them. Further, the terms
and conditions of the insurance coverage the Account has on its properties, in conjunction with the type of loss actually suffered at a property, may subject the property, or the Account as a whole, to a cap on insurance proceeds that is less than the loss or losses suffered. If a disaster that we have not insured against
occurs, if the insurance contains a high deductible, and/or if the aggregate insurance proceeds for a particular type of casualty are capped, the Account could lose some of its original investment and any future profits from the property. Also, the Account may not have sufficient access to internal or external sources
of funding to repair or reconstruct a damaged property to the extent insurance proceeds do not cover the full loss. In addition, some leases may permit a tenant to terminate its obligations in certain situations, regardless of whether those events are fully covered by insurance. In that case, the Account would not
receive rental income from the property while that tenant’s space is vacant, and any such vacancy might impact the value of that property. Finally, as with respect to all third-party insurance, we are reliant on the continued financial health of such 15
insurers and their ability to pay on valid claims. If the financial health of an insurer were to deteriorate quickly, we may not be able to find adequate coverage from another carrier on favorable terms, which could adversely impact the Account’s returns. Risks of Developing or Redeveloping Real Estate or Buying Recently Constructed Properties: If the Account chooses to develop or redevelop a property or buys a recently constructed property, it may face the following risks:
There may be delays or unexpected increases in the cost of property development, redevelopment and construction due to strikes, bad weather, material shortages, increases in material and labor costs or other events. • If the Account were viewed as developing or redeveloping underperforming properties, suffering losses on our investments, or defaulting on any loans on our properties, our reputation could be damaged. Damage to our reputation could make it more difficult to successfully develop or acquire properties in
the future and to continue to grow and expand our relationships with our lenders, venture partners and tenants. • Because external factors may have changed from when the project was originally conceived (e.g., slower growth in the local economy, higher interest rates, overbuilding in the area, or the regulatory and permitting environment), the property may not attract tenants on the schedule we originally planned and/
or may not operate at the income and expense levels first projected. Risks with Purchase-Leaseback Transactions: To the extent the Account invested in a purchase-leaseback transaction, the major risk is that the third party lessee will be unable to make required payments to the Account. If the leaseback interest is subordinate to other interests in the real property, such as a first
mortgage or other lien, the risk to the Account increases because the lessee may have to pay the senior lienholder to prevent foreclosure before it pays the Account. If the lessee defaults or the leaseback is terminated prematurely, the Account might not recover its investment unless the property is sold or leased on
favorable terms. RISKS OF INVESTING IN REAL ESTATE INVESTMENT TRUST SECURITIES The Account from time to time invests in REIT securities. The Account’s investments in REITs may increase, as a percentage of net assets, during periods in which the Account is experiencing large net inflow activity, in particular due to net participant transfers into the Account. As of December 31, 2010, REIT
securities comprised approximately 4.6% of the Account’s net assets. Investments in REIT securities are part of the Account’s real estate-related investment strategy and are subject to many of the same general risks associated with direct real property ownership. In particular, equity REITs may be affected by
changes in the value of the underlying properties owned by the entity, while mortgage REITs may be affected by the quality of any credit extended. In addition to these risks, because REIT investments are securities, they may be exposed to market risk and potentially significant price volatility due to changing
conditions in the financial markets and, in particular, changes in overall interest rates, regardless of the value of the underlying real estate such REIT may own. REITs do not pay federal income taxes if they distribute most of their earnings to their shareholders and meet other tax requirements. Many of the requirements to qualify as a REIT, however, are highly technical and complex. Failure to qualify as a REIT results in tax consequences, as well as disqualification from
operating as a REIT for a period of time. Consequently, if we invest in a REIT security that later fails to qualify as a REIT, this may adversely affect the performance of our investment. RISKS OF MORTGAGE-BACKED SECURITIES The Account from time to time has invested in mortgage-backed securities and may in the future invest in such securities. Mortgage-backed securities, such as CMBS, are subject to many of the same general risks inherent in real estate investing, making mortgage loans and investing in debt securities. The
underlying mortgage loans may experience defaults with greater frequency than projected when such mortgages were underwritten, which would impact the values of these securities, and could hamper our ability to sell such securities. In particular, these types of investments may be subject to prepayment risk or
extension risk (i.e., the risk that borrowers will repay the loans earlier or later than anticipated). If the underlying mortgage 16
•
assets experience faster than anticipated prepayments of principal, the Account could fail to recoup some or all of its initial investment in these securities, since the original price paid by the Account was based in part on assumptions regarding the receipt of interest payments. If the underlying mortgage assets are
repaid later than anticipated, the Account could lose the opportunity to reinvest the anticipated cash flows at a time when interest rates might be rising. The rate of prepayments depends on a variety of geographic, social and other functions, including prevailing market interest rates and general economic factors. Importantly, the market value of these securities is also highly sensitive to changes in interest rates, liquidity of the secondary market and economic conditions impacting financial institutions and the credit markets generally. Note that the potential for appreciation, which could otherwise be expected to result from a
decline in interest rates, may be limited by any increased prepayments. Further, volatility and disruption in the mortgage market and credit markets generally (such as was recently the case, particularly in 2008 and 2009) may cause there to be a very limited or even no secondary market for these securities and they
therefore may be harder to sell than other securities. RISKS OF U.S. GOVERNMENT AGENCY SECURITIES AND CORPORATE OBLIGATIONS The Account invests in securities issued by U.S. government agencies and U.S. government-sponsored entities. Some of these issuers may not have their securities backed by the full faith and credit of the U.S. government, which could adversely affect the pricing and value of such securities. Also, the Account
invests in corporate obligations (such as commercial paper) and while the Account seeks out such holdings in short-term, higher-quality liquid instruments, the ability of the Account to sell these securities may be uncertain, particularly when there are general dislocations in the finance or credit markets, such as has
recently been the case. Any such volatility could have a negative impact on the value of these securities. Further, transaction activity generally may fluctuate significantly from time to time, which could impair the Account’s ability to dispose of a security at a favorable time, regardless of the credit quality of the
underlying issuer. Further, inherent with investing in any corporate obligation is the risk that the credit quality of the issuer will deteriorate, which could cause the obligations to be downgraded and hamper the value or the liquidity of these securities. RISKS OF LIQUID INVESTMENTS The Account’s investments in liquid investments (whether real estate-related, such as REITs, CMBS or some mortgage loans receivable, or non real estate-related, such as cash equivalents and government securities, and whether debt or equity), are subject to the following general risks:
•
Financial / Credit Risk—The risk, for debt securities, that the issuer will not be able to pay principal and interest when due (and/or declare bankruptcy or be subject to receivership) and, for equity securities such as common or preferred stock, that the issuer’s current earnings will fall or that its overall financial
soundness will decline, reducing the security’s value. • Market Volatility Risk—The risk that the Account’s investments will experience price volatility due to changing conditions in the financial markets even regardless of the credit quality or financial condition of the underlying issuer. This risk is particularly acute to the extent the Account holds equity securities,
which have experienced significant short-term price volatility over the past year. Also, to the extent the Account holds debt securities, changes in overall interest rates can cause price fluctuations. • Interest Rate Volatility—The risk that interest rate volatility may affect the Account’s current income from an investment. • Deposit / Money Market Risk—The risk that, to the extent the Account’s cash held in bank deposit accounts exceeds federally insured limits as to that bank, the Account could experience losses if banks fail. In addition, there is some risk that investments held in money market accounts or funds can suffer
losses. Further, to the extent that a significant portion of the Account’s net assets at any particular time are comprised of cash, cash equivalents and non real estate-related liquid securities, the Account’s returns may suffer as compared to the return that could have been generated by more profitable real estate-related
investments. 17
RISKS OF FOREIGN INVESTMENTS In addition to other investment risks noted above, foreign investments present the following special risks:
•
The value of foreign investments or rental income can increase or decrease due to changes in currency rates, currency exchange control regulations, possible expropriation or confiscatory taxation, political, social, and economic developments and foreign regulations. The Account translates into U.S. dollars
purchases and sales of securities, income receipts and expense payments made in foreign currencies at the exchange rates prevailing on the respective dates of the transactions. The effect of any changes in currency exchange rates on investments and mortgage loans payable is included in the Account’s net
realized and unrealized gains and losses. As such, fluctuations in currency exchange rates may impair the Account’s returns. • The Account may, but is not required to, hedge its exposure to changes in currency rates, which could involve extra costs. Further, any hedging activities might not be successful. • Foreign real estate markets may have different liquidity and volatility attributes than U.S. markets. • The regulatory environment in non-U.S. jurisdictions may disfavor owners and operators of real estate investment properties, resulting in less predictable and/or economically harmful outcomes if the Account were to face a significant dispute with a tenant or with a regulator itself. • It may be more difficult to obtain and collect a judgment on foreign investments than on domestic investments, and the costs associated with contesting claims relating to foreign investments may exceed those costs associated with a similar claim on domestic investments. • We may invest from time to time in securities issued by (1) entities domiciled in foreign countries, (2) domestic affiliates of such entities and/or (3) foreign domiciled affiliates of domestic entities. Such investments could be subject to the risks associated with investments subject to foreign regulation, including
political unrest or the repatriation or nationalization of the issuer’s assets. These events could depress the value of such securities and/or make such securities harder to sell on favorable terms, if at all. RISKS OF INVESTING IN MORTGAGE LOANS The Account’s investment strategy includes, to a limited extent, investments in mortgage loans (i.e., the Account serving as lender).
•
General Risks of Mortgage Loans. The Account will be subject to the risks inherent in making mortgage loans, including:
The borrower may default on the loan, requiring that the Account foreclose on the underlying property to protect the value of its mortgage loan. Since its mortgage loans are usually non-recourse, the Account must rely solely on the value of a property for its security. • The larger the mortgage loan compared to the value of the property securing it, the greater the loan’s risk. Upon default, the Account may not be able to sell the property for its estimated or appraised value. Also, certain liens on the property, such as mechanics or tax liens, may have priority over the
Account’s security interest. • A deterioration in the financial condition of tenants, which could be caused by general or local economic conditions or other factors beyond the control of the Account, or the bankruptcy or insolvency of a major tenant, may adversely affect the income of a property, which could increase the likelihood that
the borrower will default under its obligations. • The borrower may be unable to make a lump sum principal payment due under a mortgage loan at the end of the loan term, unless it can refinance the mortgage loan with another lender. • If interest rates are volatile during the loan period, the Account’s variable-rate mortgage loans could have volatile yields. Further, to the extent the Account makes mortgage loans with fixed interest rates, it may receive lower yields than that which is then available in the market if interest rates rise
generally. 18
•
•
Prepayment Risks. The Account’s mortgage loan investments will
usually be subject to the risk that the borrower repays a loan early. Also,
we may be unable to reinvest the proceeds at as high an interest rate as
the original mortgage loan rate. • Interest
Limitations. The interest rate we charge on mortgage loans may
inadvertently violate state usury laws that limit rates, if, for example,
state law changes during the loan term. If this happens, we could incur
penalties or may be unable to enforce payment of the loan. • Risks
of Participations. To the extent the Account invested in a participating
mortgage, the following additional risks would apply:
•
The participation feature, in tying the Account’s returns to the performance of the underlying asset, might generate insufficient returns to make up for the higher interest rate the loan would have obtained without the participation feature. • In very limited circumstances, a court may characterize the Account’s participation interest as a partnership or joint venture with the borrower and the Account could lose the priority of its security interest or become liable for the borrower’s debts. CONFLICTS OF INTEREST WITHIN TIAA General. TIAA and its affiliates (including Teachers Advisors, Inc., its wholly owned subsidiary and a registered investment adviser) have interests in other real estate programs and accounts and also engage in other business activities and as such, they will have conflicts of interest in allocating their time between
the Account’s business and these other activities. Also, the Account may be buying properties at the same time as TIAA affiliates that may have similar investment objectives to those of the Account. There is also a risk that TIAA will choose a property that provides lower returns to the Account than a property
purchased by TIAA and its affiliates. Further, the Account will likely acquire properties in geographic areas where TIAA and its affiliates own properties. In addition, the Account may desire to sell a property at the same time another TIAA affiliate is selling a property in an overlapping market. Conflicts could
also arise because some properties owned by TIAA and its affiliates may compete with the Account’s properties for tenants. Among other things, if one of the TIAA entities attracts a tenant that the Account is competing for, the Account could suffer a loss of revenue due to delays in locating another suitable
tenant. TIAA has adopted allocation policies and procedures applicable to the purchasing conflicts scenario, but the resolution of such conflicts may be economically disadvantageous to the Account. As a result of TIAA’s and its affiliates’ obligations to other current and potential TIAA-sponsored investment
vehicles with similar objectives to those of the Account, there is no assurance that the Account will be able to take advantage of every attractive investment opportunity that otherwise is in accordance with the Account’s investment objectives. Liquidity Guarantee: In addition, as discussed elsewhere in this report, the TIAA General Account provides a liquidity guarantee to the Account. As of the date of this report, TIAA owns liquidity units purchased pursuant to this guarantee. While an independent fiduciary is responsible for establishing a “trigger
point” (a percentage of TIAA’s ownership of liquidity units beyond which TIAA’s ownership may be reduced at the fiduciary’s direction), there is no express cap on the amount TIAA may be obligated to fund under this guarantee. Further, the Account’s independent fiduciary will oversee any redemption of TIAA
liquidity units. TIAA’s ownership of liquidity units (including the potential for changes in its levels of ownership in the future) could result in the perception that TIAA is taking into account its own economic interests while serving as investment manager for the Account. In particular, the value of TIAA’s liquidity
units fluctuates in the same manner as the value of accumulation units held by all participants. Any perception of a conflict of interest could cause participants to transfer accumulations out of the Account to another investment option, which could have an adverse impact on the Account’s ability to act most
optimally upon its investment strategy. For a discussion of the relevant allocation policies and procedures TIAA has established as well as a summary of other conflicts of interest which may arise as a result of TIAA’s management of the Account, see “Establishing and Managing the Account—the Role of
TIAA—Conflicts of Interest.” NO OPPORTUNITY FOR PRIOR REVIEW OF PURCHASE Investors do not have the opportunity to evaluate the economic or financial merit of the purchase of a property or other investment before the Account completes the purchase, so investors will need to rely solely 19
on TIAA’s judgment and ability to select investments consistent with the Account’s investment objective and policies. Further, the Account may change its investment objective and pursue specific investments in accordance with any such amended investment objective without the consent of the Account’s
investors. RISKS OF REGISTRATION UNDER THE INVESTMENT COMPANY ACT OF 1940 The Account has not registered, and management intends to continue to operate the Account so that it will not have to register, as an “investment company” under the Investment Company Act of 1940, as amended (the “Investment Company Act”). Generally, a company is an “investment company” and required
to register under the Investment Company Act if, among other things, it holds itself out as being engaged primarily, or proposes to engage primarily, in the business of investing, reinvesting or trading in securities, or it is engaged or proposes to engage in the business of investing, reinvesting, owning, holding or
trading in securities and owns or proposes to acquire investment securities having a value exceeding 40% of the value of such company’s total assets (exclusive of government securities and cash items) on an unconsolidated basis. If the Account were obligated to register as an investment company, the Account would have to comply with a variety of substantive requirements under the Investment Company Act that impose, among other things, limitations on capital structure, restrictions on certain investments, compliance with reporting,
record keeping, voting and proxy disclosure requirements and other rules and regulations that could significantly increase its operating expenses and reduce its operating flexibility. To maintain compliance with the exemptions from the Investment Company Act, the Account may be unable to sell assets it would
otherwise want to sell and may be unable to purchase securities it would otherwise want to purchase, which might materially adversely impact the Account’s performance. ITEM 1B. UNRESOLVED STAFF COMMENTS. None. THE PROPERTIES—IN GENERAL In the table below, participants will find general information about each of the Account’s property investments as of December 31, 2010. The Account’s property investments include both properties that are wholly owned by the Account and properties owned by the Account’s joint venture investments. Certain
investments are comprised of a portfolio of properties. Fair value amounts are in thousands. OFFICE PROPERTIES
Property
Location
Year
Year
Rentable
Percent
Annual Avg.
Fair 1001 Pennsylvania Ave
Washington, DC
1987
2004
756,499
97
%
$
34.40
$
589,839
(4) Four Oaks Place
Houston, TX
1983
2004
1,758,378
93
%
17.14
383,676 Fourth & Madison
Seattle, WA
2002
2004
845,533
99
%
27.74
330,007
(4) 50 Fremont Street
San Francisco,
CA
1983
2004
810,089
98
%
27.98
315,072
(4) 780 Third Avenue
New York, NY
1984
1999
487,501
91
%
48.29
300,616 1 & 7 Westferry Circus
London, UK
1992, 1993
2005
396,140
98
%
48.63
260,045
(4)(5) 99 High Street
Boston, MA
1971
2005
731,204
84
%
34.64
255,014
(4) The Newbry
Boston, MA
1940-
1961(6)
2006
607,422
90
%
39.80
252,017 1900 K Street
Washington, DC
1996
2004
339,060
99
%
28.95
246,054 701 Brickell
Miami, FL
1986(8)
2002
676,149
92
%
31.87
201,170 Lincoln Centre
Dallas, TX
1984
2005
1,638,132
82
%
16.32
195,416
(4) 20
Built
Purchased
Area
(Sq. ft.)(1)
Leased
Base Rent
Per Leased
Sq. Ft.(2)
Value(3)
Property
Location
Year
Year
Rentable
Percent
Annual Avg.
Fair 275 Battery
San Francisco,
CA
1988
2005
475,138
87
%
$
30.98
$
180,364 1401 H Street NW
Washington, D.C.
1992
2006
340,656
92
%
34.65
179,294
(4) Wilshire Rodeo Plaza
Beverly Hills, CA
1935, 1984
2006
261,932
97
%
49.68
165,513
(4) Yahoo! Center(7)
Santa Monica,
CA
1984
2004
1,185,119
90
%
32.44
157,452 Mellon Financial Center at
One Boston Place(10)
Boston, MA
1970(8)
2002
804,444
89
%
42.45
150,276 Millennium Corporate Park
Redmond, WA
1999, 2000
2006
536,884
95
%
15.35
125,228 Ten & Twenty Westport Road
Wilton, CT
1974(8),
2001
2001
526,617
94
%
21.39
100,663 Urban Centre
Tampa, FL
1984, 1987
2005
548,056
83
%
19.21
89,727 The Ellipse at Ballston
Arlington, VA
1989
2006
194,972
91
%
26.29
76,716 Morris Corporate Center III
Parsippany, NJ
1990
2000
525,533
85
%
14.87
71,896 Oak Brook Regency Towers
Oakbrook, IL
1977(8)
2002
402,318
96
%
14.68
70,574 Treat Towers(11)
Walnut Creek,
CA
1999
2003
372,255
83
%
17.11
67,108 88 Kearny Street
San Francisco,
CA
1986
1999
227,160
84
%
37.54
65,407 Pacific Plaza
San Diego, CA
2000, 2002
2007
217,680
70
%
18.52
56,201
(4) One Virginia Square
Arlington, VA
1999
2004
116,077
100
%
37.68
51,700 Parkview Plaza
Oakbrook, IL
1990
1997
265,175
91
%
15.84
43,112 Wellpoint
Westlake Village,
CA
1986 1998
2006
216,571
100
%
16.75
41,000 West Lake North Business
Park
Westlake Village,
CA
2000
2004
197,288
78
%
19.97
40,765 Prominence in Buckhead(11)
Atlanta, GA
1999
2003
441,795
69
%
9.29
39,799 The North 40 Office
Complex
Boca Raton, FL
1983, 1984
2006
350,000
97
%
9.71
36,353 The Pointe on Tampa Bay
Tampa, FL
1982(8)
2002
253,296
78
%
10.17
35,188 Centerside I
San Diego, CA
1982
2004
202,913
68
%
19.30
34,000 Camelback Center
Phoenix, AZ
2001
2007
231,345
82
%
19.97
33,213 3 Hutton Centre
Santa Ana, CA
1985(8)
2003
198,217
81
%
19.21
32,195 8270 Greensboro Drive
McLean, VA
2000
2005
158,110
87
%
20.94
27,895 Needham Corporate Center
Needham, MA
1987
2001
138,259
90
%
15.60
18,566 Creeksides at Centerpoint
Kent, WA
1985
2006
218,166
53
%
5.28
16,611 Subtotal—Office Properties
87
%
$
5,335,742 Percent leased weighted by property fair value—Office(9)
92
% INDUSTRIAL PROPERTIES Ontario Industrial Portfolio
Various, CA
1997-1998
1998, 2000,
2004
3,981,894
100
%
3.08
223,700
(4) Dallas Industrial Portfolio
Dallas and
Coppell, TX
1997-2001
2000-2002
3,684,941
97
%
2.51
140,638 Rancho Cucamonga
Industrial Portfolio
Rancho
Cucamonga, CA
2000-2002
2000; 2001;
2002; 2004
1,490,235
100
%
2.92
83,400 Southern California RA
Industrial Portfolio
Los Angeles, CA
1982
2004
920,078
92
%
5.22
75,512 Great West Industrial
Portfolio
Rancho
Cucamonga and
Fontana, CA
2004-2005
2008
1,369,645
100
%
4.60
73,500 21
Built
Purchased
Area
(Sq. ft.)(1)
Leased
Base Rent
Per Leased
Sq. Ft.(2)
Value(3)
Property
Location
Year
Year
Rentable
Percent
Annual Avg.
Fair Rainier Corporate Park
Fife, WA
1991-1997
2003
1,104,646
94
%
$
4.15
$
66,800 Seneca Industrial Park
Pembroke Park,
FL
1999-2001
2007
882,182
90
%
3.75
63,267 Chicago Industrial Portfolio
Chicago and
Joliet, IL
1997-2000
1998; 2000
1,427,699
97
%
3.15
58,865 Regal Logistics Campus
Seattle, WA
1999-2004
2005
968,535
100
%
3.84
52,500 Chicago CALEast Industrial
Portfolio(13)
Chicago, IL
1974-2005
2003
1,145,152
98
%
3.81
50,801 Shawnee Ridge Industrial
Portfolio
Atlanta, GA
2000-2005
2005
1,422,922
90
%
2.75
49,001 Northern California RA
Industrial Portfolio
Oakland, CA
1981
2004
657,602
84
%
3.91
39,730 IDI National Portfolio(12)
Various, U.S.
1999-2004
2004
3,655,671
93
%
2.49
39,255 Atlanta Industrial Portfolio
Lawrenceville,
GA
1996-1999
2000
1,295,440
100
%
2.71
38,800 South River Road Industrial
Cranbury, NJ
1999
2001
858,957
100
%
3.85
38,465 Pinnacle Industrial/DFW
Trade Center
Grapevine. TX
2003, 2004,
2006
2006
899,200
100
%
3.65
38,400 GE Appliance East Coast
Distribution Facility
Perryville, MD
2003
2005
1,004,000
100
%
2.82
29,100 Broadlands Business Park
Elkton, MD
2006
2006
756,600
100
%
3.15
24,200 Northeast RA Industrial
Portfolio
Boston, MA
2000
2004
384,000
70
%
3.13
22,077 Centre Pointe and Valley
View
Los Angeles
County, CA
1965-1989
2004
307,685
81
%
4.78
19,946 Northwest RA Industrial
Portfolio
Seattle, WA
1996
2004
312,321
100
%
4.36
17,000 Summit Distribution Center
Memphis, TN
2002
2003
708,532
100
%
2.04
15,800 Konica Photo Imaging
Headquarters
Mahwah, NJ
1999
1999
168,000
100
%
6.27
14,505 Airways Distribution Center
Memphis, TN
2005
2006
556,600
—
%
0.00
12,113 UPS Distribution Facility
Fernley, NV
1998
1998
256,000
80
%
2.55
7,100 Subtotal—Industrial Properties
93
%
$
1,294,475 Percent leased weighted by property fair value—Industrial(9)
95
% RETAIL PROPERTIES DDR Joint Venture(14)
Various
Various
2007
12,205,571
83
%
10.40
303,866 The Florida Mall(15)
Orlando, FL
1986(8)
2002
986,972
99
%
40.06
238,966 Printemps de l’Homme
Paris, FR
1930
2007
142,363
100
%
77.27
223,743
(5) Florida Retail Portfolio(16)
Various, FL
1974-2005
2006
1,259,829
84
%
12.66
165,458 Miami International Mall(15)
Miami, FL
1982(8)
2002
291,500
96
%
38.36
93,221 Westwood Marketplace
Los Angeles, CA
1950(8)
2002
202,201
100
%
30.49
89,001 Mazza Gallerie
Washington, DC
1975
2004
293,935
93
%
15.76
76,000 Marketfair
West Windsor, NJ
1987
2006
240,297
94
%
23.56
66,245 West Town Mall(15)
Knoxville, TN
1972(8)
2002
772,648
98
%
22.58
50,613 Publix at Weston Commons
Weston, FL
2005
2006
126,922
99
%
24.09
45,200
(4) South Frisco Village
Frisco, TX
2002
2006
227,175
90
%
11.40
29,000
(4) Plainsboro Plaza
Plainsboro, NJ
1987
2005
218,653
78
%
9.52
27,504 Champlin Marketplace
Champlin, MN
1998-1999,
2005
2007
103,577
97
%
10.76
12,712 Suncrest Village
Orlando, FL
1987
2005
93,358
84
%
10.62
12,600
22
Built
Purchased
Area
(Sq. ft.)(1)
Leased
Base Rent
Per Leased
Sq. Ft.(2)
Value(3)
Property
Location
Year
Year
Rentable
Percent
Annual Avg.
Fair Plantation Grove
Ocoee, FL
1995
1995
73,655
91
%
$
9.46
$
9,400 Subtotal—Retail Properties
85
%
$
1,443,529 Percent leased weighted by property fair value—Retail(9)
93
% RESIDENTIAL PROPERTIES Houston Apartment
Portfolio(17)
Houston, TX
1984-2004
2006
N/A
98
%
N/A
186,924
(4) Palomino Park Apartments
Denver, CO
1996-2001
2005
N/A
95
%
N/A
168,708
(4) The Colorado
New York, NY
1987
1999
N/A
100
%
N/A
123,039
(4) Kierland Apartment
Portfolio(17)
Scottsdale, AZ
1996-2000
2006
N/A
97
%
N/A
96,002
(4) Ashford Meadows
Apartments
Herndon, VA
1998
2000
N/A
97
%
N/A
95,436
(4) The Legacy at Westwood
Apartments
Los Angeles, CA
2001
2002
N/A
95
%
N/A
93,242
(4) Larkspur Courts
Larkspur, CA
1991
1999
N/A
96
%
N/A
70,098 Regents Court Apartments
San Diego, CA
2001
2002
N/A
100
%
N/A
65,005
(4) South Florida Apartment
Portfolio
Boca Raton and
Plantation, FL
1986
2001
N/A
96
%
N/A
60,029 The Caruth
Dallas, TX
1999
2005
N/A
99
%
N/A
56,083
(4) 1050 Lenox Park
Atlanta, GA
2001
2005
N/A
97
%
N/A
50,805
(4) The Reserve at Sugarloaf
Duluth, GA
2000
2005
N/A
97
%
N/A
43,720
(4) The Lodge at Willow Creek
Denver, CO
1997
1997
N/A
96
%
N/A
39,709 The Maroneal
Houston, TX
1998
2005
N/A
94
%
N/A
37,614 Glenridge Walk
Atlanta, GA
1996, 2001
2005
N/A
98
%
N/A
33,605 Westcreek Apartments
Westlake Village,
CA
1988
1997
N/A
96
%
N/A
29,616 Lincoln Woods Apartments
Lafayette Hill,
PA
1991
1997
N/A
93
%
N/A
29,124 Quiet Water at Coquina
Lakes
Deerfield Beach,
FL
1995
2001
N/A
94
%
N/A
23,730 Phoenix Apartment
Greater Phoenix
Area, AZ
1995-1998
2006
N/A
96
%
N/A
22,978 The Fairways of Carolina
Margate, FL
1993
2001
N/A
98
%
N/A
22,317 Subtotal—Residential Properties
97
%
$
1,347,784 Percent leased weighted by property fair value—Residential(9)
97
% OTHER COMMERCIAL PROPERTIES Storage Portfolio I(18)
Various, U.S.
1972-1990
2003
2,295,410
84
%
$
10.12
$
52,812 Subtotal—Commercial Properties
$
8,126,558 Total—All Properties—Percent Leased weighted by property fair value
93
%
$
9,474,342
(1)
The square footage is an approximate measure and is subject to periodic remeasurement. (2) Based on total contractual rent for leases existing as of December 31, 2010. The contractual rent can be either on a gross or net basis, depending on the terms of the leases. (3) Fair value reflects the value determined in accordance with the procedures described in the Account’s prospectus and as stated in the Statement of Investments. (4) Property is subject to a mortgage. The fair
value shown represents the Account’s interest gross of debt. 23
Built
Purchased
Area
(Sq. ft.)(1)
Leased
Base Rent
Per Leased
Sq. Ft.(2)
Value(3)
Portfolio(17)
(5) 1 & 7 Westferry Circus is located in the United Kingdom. Printemps de l’Homme is located in France. The fair value of each property is converted from local currency to U.S. Dollars at the exchange rate as of December 31, 2010. (6) This property was renovated in 2004 and 2006. (7) This property is held in 50%/50% joint venture with Equity Office Properties Trust. Fair value shown reflects the value of the Account’s interest in the joint venture, net of debt. (8) Undergone extensive renovations since original construction. (9) Values shown are based on the property fair value weighted as a percent of the total fair value and based upon the percent leased for each property. (10) The
Account purchased a 50.25% interest in a private REIT, which owns this
property. A 49.70% interest is owned by Societe Immobiler Trans-Quebec,
and .05% is owned by 100 individuals. Fair value shown reflects the value
of the Account’s interest in the joint venture. (11) This
investment property is held in a 75%/25% joint venture with Equity Office
Properties Trust. Fair value shown reflects the value of the Account’s
interest in the joint venture. (12) This
investment property held in 60%/40% joint venture with Industrial Development
International. Fair value shown reflects the value of the Account’s
interest in the joint venture, net of debt. (13) A portion of this portfolio was sold in 2008. (14) This investment property consists of 43 properties located in 13 states and is held in a 85%/15% joint venture with Developers Diversified Realty Corporation (“DDR”). Fair value shown reflects the value of the Account’s interest in the joint venture, net of debt. (15) This investment property is held in a 50%/50% joint venture with the Simon Property Group. Fair value shown reflects the value of the Account’s interest in the joint venture, net of debt. (16) This investment property is held in a 80%/20% joint venture with Weingarten Realty Investors. Fair value shown reflects the value of the Account’s interest in the joint venture. This portfolio contains seven neighborhood and/or community shopping centers located in Ft. Lauderdale, Miami, Orlando, and Tampa, Florida areas. (17) A portion of this portfolio was sold in 2009. (18) This investment property is held in a 75%/25% joint venture with Storage USA. Fair value shown reflects the value of the Account’s interest in the joint venture, net of debt. Commercial (Non-Residential) Properties At December 31, 2010, the Account held 79 commercial (non-residential) property investments in its portfolio, including a portfolio of storage facilities located throughout the United States. Eleven of these property investments were held through joint ventures, and 29 were subject to mortgages (including seven
joint venture property investments). Although the terms vary under each lease, certain expenses, such as real estate taxes and other operating expenses are paid or reimbursed in whole or in part by the tenants. Management believes that the Account’s portfolio is diversified by both property type and geographic location. The portfolio consists of:
•
Office. 38 property investments containing approximately 18.6 million square feet located in 12 states, the District of Columbia and the United Kingdom. As of December 31, 2010, the Account’s office properties had an aggregate market value of approximately $5.3 billion. • Industrial. 25 property investments containing approximately 30.2 million square feet located in 11 states, including a 60% interest in a portfolio of industrial properties located throughout the United States. As of December 31, 2010, the Account’s industrial properties had an aggregate market value of
approximately $1.3 billion. • Retail. 15 property investments containing approximately 17.3 million square feet located in six states, the District of Columbia and Paris, France. As of December 31, 2010, the Account’s retail properties had an aggregate market value of approximately $1.4 billion. One of the retail property investments is an
85% interest in a portfolio containing 43 individual retail shopping centers located throughout the Eastern and Southeastern states. In addition, the Account has a 75% interest in a portfolio of storage facilities located throughout the United States containing approximately 2.3 million square feet. As of December 31, 2010, the Account’s interest in this portfolio had a market value of approximately $52.8 million. 24
As of December 31, 2010, the market value weighted average occupancy rate of the Account’s entire commercial real estate portfolio was 92.5%. On a weighted basis, the overall occupancy rate of the Account’s commercial real estate portfolio was 89.0%. The Account’s:
•
office property investments were 91.8% leased on a market value weighted basis and 86.7% leased on a weighted basis; • industrial property investments were 95.3% leased on a market value weighted basis and 92.8% leased on a weighted basis; • retail property investments were 92.7% leased on a market value weighted basis and 84.7% leased on a weighted basis; and • the storage portfolio was 84.0% leased. Major Tenants: The following tables list the Account’s ten most significant tenants based on the total space they occupied as of December 31, 2010 in each of the Account’s commercial property types. Major Office Tenants
Occupied Square Feet
Percentage of
Percentage of BHP Petroleum (Americas), Inc.(1)
510,659
2.7
%
0.8
% Deloitte and Touche USA LLP(1)
487,193
2.6
%
0.7
% Crowell & Moring LLP(1)
377,911
2.0
%
0.6
% The Bank of New York Mellon Corporation(2)
372,909
2.0
%
0.6
% Microsoft Corporation(1)
361,528
1.9
%
0.5
% Atmos Energy Corporation(1)
319,035
1.7
%
0.5
% GE Healthcare(1)
309,278
1.7
%
0.5
% Yahoo! Inc.(2)
302,324
1.6
%
0.5
% Metropolitan Life Insurance Co.(3)
243,349
1.3
%
0.4
% Pearson Education, Inc.(1)
225,299
1.2
%
0.3
% Major Industrial Tenants
Occupied Square Feet
Percentage of
Percentage of Wal-Mart Stores, Inc.(1)
1,099,112
3.6
%
1.7
% General Electric Company(1)
1,004,000
3.3
%
1.5
% Regal West Corporation(1)
968,535
3.2
%
1.5
% Restoration Hardware Inc.(1)
886,052
2.9
%
1.3
% Kuehne & Nagel(1)
840,902
2.8
%
1.3
% Kumho Tire U.S.A. Inc.(1)
830,485
2.7
%
1.3
% Tyco Healthcare Retail Group, Inc.(1)
800,000
2.6
%
1.2
% Michelin North America, Inc(1)
756,690
2.5
%
1.1
% Technicolor Videocassette of Michigan, Inc.(1)
708,532
2.3
%
1.1
% Del Monte Fresh Produce, N.A., Inc.(1)
689,660
2.3
%
1.0
% 25
Total Rentable
Area of
Account’s
Office Properties
Total Rentable
Area of
Non-Residential
Properties
Total Rentable
Area of
Account’s
Industrial Properties
Total Rentable
Area of
Non-Residential
Properties
Major Retail Tenants
Occupied Square Feet
Percentage of
Percentage of Publix Super Markets, Inc.(3)
490,634
2.8
%
0.7
% Dick’s Sporting Goods, Inc.(2)
477,486
2.8
%
0.7
% Wal-Mart Stores, Inc.(2)
415,056
2.4
%
0.6
% Ross Stores, Inc.(2)
414,732
2.4
%
0.6
% Belk, Inc.(2)
371,706
2.2
%
0.6
% PetSmart, Inc.(2)
370,037
2.1
%
0.6
% Michael’s Stores, Inc.(3)
359,047
2.1
%
0.5
% Bed Bath & Beyond Inc.(3)
350,418
2.0
%
0.5
% Kohl’s Corporation(2)
348,057
2.0
%
0.5
% Best Buy Co., Inc.(3)
277,720
1.6
%
0.4
%
(1)
Tenant occupied space within wholly owned property investments. (2) Tenant occupied space within joint venture investments. (3) Tenant occupied space within wholly owned property investments and joint venture investments. The following tables list the rentable area subject to expiring leases during the next five years, and an aggregate figure for expirations in 2016 and thereafter, in the Account’s commercial (non-residential) properties. While many of the leases contain renewal options with varying terms, these charts assume that none
of the tenants exercise their renewal options, including those with terms that expired on December 31, 2010 or are month to month leases. Office Properties Year of
Rentable Area
Percentage of 2011
1,904,179
10.2% 2012
1,259,844
6.8% 2013
1,521,804
8.2% 2014
2,222,745
11.9% 2015
1,895,299
10.2% 2016 and thereafter
7,135,067
38.3% Total
15,938,938
85.6% 26
Total Rentable
Area of
Account’s
Retail Properties
Total Rentable
Area of
Non-Residential
Properties
Lease Expiration
Subject to
Expiring Leases (sq. ft.)
Total Rentable
Area of Account’s
Office Properties
Represented by
Expiring Leases
Industrial Properties Year of
Rentable Area
Percentage of 2011
3,895,917
12.9% 2012
3,128,561
10.4% 2013
5,241,902
17.3% 2014
2,039,814
6.8% 2015
6,676,316
22.1% 2016 and thereafter
6,898,302
22.8% Total
27,880,812
92.3% Retail Properties Year of
Rentable Area
Percentage of 2011
1,694,912
9.8% 2012
1,882,945
10.9% 2013
1,769,038
10.2% 2014
1,307,870
7.6% 2015
1,466,010
8.5% 2016 and thereafter
6,321,120
36.6% Total
14,441,895
83.6% Residential properties The Account’s residential property portfolio currently consists of 20 property investments comprised of first class or luxury multi-family, garden, mid-rise, and high-rise apartment buildings. The portfolio contains approximately 8,600 units located in nine states and had a 97% occupancy rate as of December 31,
2010. Ten of the residential properties in the portfolio are subject to mortgages. The complexes generally contain one to three bedroom apartment units with a range of amenities, such as patios or balconies, washers and dryers, and central air conditioning. Many of these apartment communities have on-site fitness
facilities, including some with swimming pools. Rents on each of the properties tend to be comparable with competitive communities and are not subject to rent regulation. The Account is responsible for the expenses of operating its residential properties. As of December 31, 2010, the Account’s residential
properties had an aggregate market value of approximately $1.3 billion. The table below contains detailed information regarding the apartment complexes in the Account’s portfolio as of December 31, 2010. 27
Lease Expiration
Subject to
Expiring Leases (sq. ft.)
Total Rentable
Area of Account’s
Industrial Properties
Represented by
Expiring Leases
Lease Expiration
Subject to
Expiring Leases (sq. ft.)
Total Rentable
Area of Account’s
Retail Properties
Represented by
Expiring Leases
Property
Location
Number
Average
Avg. Rent Houston Apartment Porfolio(1)
Houston, TX
1,777
1,013
$
1,448 Palomino Park(1)
Highlands Ranch, CO
1,184
1,096
1,078 Kierland Apartment Portfolio(1)
Scottsdale, AZ
724
1,048
979 South Florida Apartment Portfolio(1)
Boca Raton and Plantation, FL
550
906
1,055 Ashford Meadows Apartments
Herndon, VA
440
1,050
1,569 Windsor at Lenox Park
Atlanta, GA
407
1,024
1,389 The Caruth
Dallas, TX
338
1,168
1,541 Reserve at Sugarloaf
Duluth, GA
333
1,220
1,031 The Lodge at Willow Creek
Lone Tree, CO
316
995
1,005 The Maroneal
Houston, TX
309
928
1,431 Glenridge Walk
Sandy Springs, GA
296
1,146
1,349 The Colorado
New York, NY
256
622
2,930 Regents Court
San Diego, CA
251
886
1,664 Larkspur Courts
Larkspur, CA
248
1,001
2,016 Phoenix Apartment Portfolio
Chandler, AZ
240
976
817 Lincoln Woods Apartments
Lafayette Hill, PA
216
774
1,250 The Fairways of Carolina
Margate, FL
208
1,026
1,189 Quiet Waters at Coquina Lakes
Deerfield Beach, FL
200
1,048
1,275 Legacy at Westwood
Los Angeles, CA
187
1,181
4,773 Westcreek
Westlake Village, CA
126
951
1,620
(1) The Account is party to various claims and routine litigation arising in the ordinary course of business. Management of the Account does not believe that the results of any such claims or litigation, individually or in the aggregate, will have a material effect on the Account’s business, financial position or results of
operations. 28
Of Units
Unit Size
(Square Feet)
Per Unit/
Per Month
Represents a portfolio containing multiple properties.
(a) Market Information. There is no established public trading market for securities issued by the Account. Accumulation units in the Account are sold to eligible participants at the Account’s current accumulation unit value, which is based on the value of the Account’s then current net assets and are
redeemable in accordance with the terms of the participant’s contract. For the period from January 1, 2010 to December 31, 2010, the high and low accumulation unit values for the Account were $219.173 and $188.943, respectively. For the period January 1, 2009 to December 31, 2009, the high and low
accumulation unit values for the Account were $267.644 and $193.376, respectively. Holders. The approximate number of Account contract owners at December 31, 2010 was 1,025,000. Dividends. Not applicable. Securities Authorized for Issuance under Equity Compensation Plans. Not applicable. (b) Use of Proceeds: Not applicable. (c) Purchases of Equity Securities by Issuer: Not applicable. 29
ITEM 6 SELECTED FINANCIAL DATA The following selected financial data should be considered in conjunction with the Account’s financial statements and notes provided in this Form 10-K (amounts in thousands except for per accumulation unit amounts).
Years Ended December 31,
2010
2009
2008
2007
2006 Investment income: Real estate income, net
$
421,162
$
479,657
$
500,434
$
529,412
$
444,783 Income from real estate joint ventures and limited partnerships
89,268
114,578
116,889
93,724
60,789 Dividends and interest
8,581
1,733
81,523
141,914
135,407 Total investment income
519,011
595,968
698,846
765,050
640,979 Expenses
95,779
95,473
153,040
140,294
83,449 Investment income, net
423,232
500,495
545,806
624,756
557,530 Net realized and unrealized gains (losses) on investments and mortgage loans payable
756,968
(3,612,505
)
(2,513,024
)
1,438,435
1,056,671 Net increase (decrease) in net assets resulting from operations
1,180,200
(3,112,010
)
(1,967,218
)
2,063,191
1,614,201 Participant transactions
1,743,026
(1,575,700
)
(4,339,995
)
1,464,653
1,969,781 TIAA Purchase of Liquidity Units
—
1,058,700
155,600
—
— Net increase (decrease) in net assets
$
2,923,226
$
(3,629,010
)
$
(6,151,613
)
$
3,527,844
$
3,583,982
Years Ended December 31,
2010
2009
2008
2007
2006 Total assets
$
12,839,962
$
9,912,703
$
13,576,954
$
19,232,767
$
15,759,961 Total liabilities
2,036,822
2,032,789
2,068,030
1,572,230
1,627,268 Total net assets
$
10,803,140
$
7,879,914
$
11,508,924
$
17,660,537
$
14,132,693 Number of accumulation units outstanding
48,070
39,473
41,542
55,106
50,146 Net asset value, per accumulation unit
$
219.173
$
193.454
$
267.348
$
311.410
$
273.650 Mortgage loans payable
$
1,860,157
$
1,858,110
$
1,830,040
$
1,392,093
$
1,437,149 30
Quarterly Selected Financial Information Data The following quarterly selected unaudited financial data for each full quarter of 2010 and 2009 are derived from the financial statements of the Account for the years ended December 31, 2010 and 2009 (amounts in thousands).
2010
Year Ended
For the Three Months Ended
March 31
June 30
September 30
December 31 Investment income, net
$
96,557
$
115,940
$
112,639
$
98,096
$
423,232 Net realized and unrealized (loss) gain on investments and mortgage loans payable
(249,065
)
240,970
300,772
464,291
756,968 Net (decrease) increase in net assets resulting from operations
$
(152,508
)
$
356,910
$
413,411
$
562,387
$
1,180,200 Total return
-1.94
%
4.44
%
4.68
%
5.68
%
13.29
%
2009
Year Ended
For the Three Months Ended
March 31
June 30
September 30
December 31 Investment income, net
$
119,440
$
130,429
$
135,536
$
115,090
$
500,495 Net realized and unrealized loss on investments and mortgage loans payable
(1,074,437
)
(1,166,159
)
(836,451
)
(535,458
)
(3,612,505
) Net decrease in net assets resulting from operations
$
(954,997
)
$
(1,035,730
)
$
(700,915
)
$
(420,368
)
$
(3,112,010
) Total return
-8.36
%
-9.96
%
-7.64
%
-5.05
%
-27.64
% 31
December 31, 2010
December 31, 2009
The following discussion and analysis of our financial condition and results of operations should be read together with our financial statements and notes contained in this report and with consideration to the sub-section entitled “Forward-Looking Statements,” which begins below, and the section entitled “Item 1A. Risk
Factors.” The past performance of the Account is not indicative of future results. Forward-Looking Statements Some statements in this Form 10-K which are not historical facts may be “forward-looking statements” within the meaning of Section 27A of the Securities Act of 1933, Section 21E of the Securities Exchange Act of 1934 and the Private Securities Litigation Reform Act of 1995. Forward-looking statements include
statements about management’s expectations, beliefs, intentions or strategies for the future, include the assumptions and beliefs underlying these forward-looking statements, and are based on current expectations, estimates and projections about the real estate industry, domestic and global economic conditions, including
conditions in the credit and capital markets, the sectors, and markets in which the Account invests and operates, and the transactions described in this Form 10-K. While management believes the assumptions underlying any of its forward-looking statements and information to be reasonable, such information may be
subject to uncertainties and may involve certain risks which may be difficult to predict and are beyond management’s control. These risks and uncertainties could cause actual results to differ materially from those contained in any forward-looking statement. These risks and uncertainties include, but are not limited to, the
following:
•
Acquiring and Owning Real Estate: The risks associated with acquiring and owning real property, including general economic and real estate market conditions, the availability of, and economic cost associated with, financing the Account’s properties, the risk that the Account’s properties become too concentrated
(whether by geography, sector or by tenant mix), competition for acquiring real estate properties, leasing risk (including tenant defaults) and the risk of uninsured losses at properties (including due to terrorism and acts of violence); • Selling Real Estate: The risk that the sales price of a property might differ, perhaps significantly, from its estimated or appraised value, leading to losses or reduced profits to the Account, the risk that the Account might not be able to sell a property at a particular time for a price which management believes
represents its fair or full value, the lack of availability of financing (for potential purchasers of the Account’s properties), disruptions in the credit and capital markets, and the risk that the Account may be required to make significant expenditures before the Account is able to market and/or sell a property; • Valuation: The risks associated with property valuations, including the fact that appraisals can be subjective in a number of respects, the fact that the Account’s appraisals are generally obtained on a quarterly basis and there may be periods in between appraisals of a property during which the value attributed to the
property for purposes of the Account’s daily accumulation unit value may be more or less than the actual realizable value of the property; • Borrowing: Risks associated with financing the Account’s properties, including the risk of default on loans secured by the Account’s properties (which could lead to foreclosure), the risk associated with high loan to value ratios on the Account’s properties (including the fact that the Account may have limited, or no
net value in such a property), the risk that significant sums of cash could be required to make principal and interest payments on the loans and the risk that the Account may not have the ability to obtain financing or refinancing on favorable terms (or at all), which may be aggravated by general disruptions in credit
and capital markets; • Participant Transactions and Cash Management: Investment risk associated with participant transactions, in particular that (i) significant net participant transfers out of the Account may impair our ability to pursue or consummate new investment opportunities that are otherwise attractive to the Account and/or may
result in sales of real estate-related assets to generate liquidity and (ii) significant net participant transfers into the Account may result, on a temporary basis, in our cash holdings and/or holdings in liquid real estate-related investments exceeding our long-term targeted holding levels; • Joint Venture Investments: The risks associated with joint venture partnerships, including the risk that a co-venturer may have interests or goals inconsistent with that of the Account, that a co-venturer may 32
have financial difficulties, and the risk that the Account may have limited rights with respect to operation of the property and transfer of the Account’s interest; • Regulatory Matters: Uncertainties associated with environmental and other regulatory matters; • Foreign Investments: The risks associated with purchasing, owning and disposing foreign investments (primarily real estate properties), including political risk and the risk associated with currency fluctuations; • Conflicts of Interests: Conflicts of interest associated with TIAA serving as investment manager of the Account and provider of the liquidity guarantee at the same time as TIAA and its affiliates are serving as an investment manager to other real estate accounts or funds, including conflicts associated with satisfying
its fiduciary duties to all such accounts and funds associated with purchasing, selling and leasing of properties; • Required Property Sales: The risk that, if TIAA were to own too large a percentage of the Account’s accumulation units through funding the liquidity guarantee (as determined by the independent fiduciary), the independent fiduciary could require the sales of properties to reduce TIAA’s ownership interest, which
sales could occur at times and at prices that depress the sale proceeds to the Account; and • Liquid Assets and Securities: Risks associated with investments in real estate-related liquid assets (which could include, from time to time, REIT securities and CMBS), and non-real estate-related liquid assets, including financial/credit risk, market volatility risk, interest rate volatility risk and deposit/money market
risk. More detailed discussions of certain of these risk factors are contained in the section of this Form 10-K entitled “Item 1A. Risk Factors” and in this section below and also in the section entitled “Item 7A. Quantitative and Qualitative Disclosures About Market Risk,” that could cause actual results to differ materially from
historical experience or management’s present expectations. Caution should be taken not to place undue reliance on management’s forward-looking statements, which represent management’s views only as of the date that this report is filed. Neither management nor the Account undertake any obligation to update publicly or revise any forward-looking statement, whether as a result
of new information, changed assumptions, future events or otherwise. Commercial real estate market statistics discussed in this section are obtained by the Account from sources that management considers reliable, but some of the data are preliminary for the year or quarter ended December 31, 2010 and may be subsequently revised. Prior period data may have been adjusted to reflect
updated calculations. Investors should not rely exclusively on the data presented below in forming a judgment regarding the current or prospective performance of the commercial real estate market generally. 2010 U.S. ECONOMIC AND COMMERCIAL REAL ESTATE OVERVIEW Economic and Capital Markets Overview and Outlook While the U.S. economic recovery slowed during the second half of the year, there were indications that it was back on track as 2010 came to a close. Federal Reserve Chairman Ben Bernanke noted in a January 7, 2011, testimony before the U.S. Senate Committee on the Federal Budget that there was “…increased
evidence that a self-sustaining recovery in consumer and business spending may be taking hold.” The housing market remains weak and the unemployment rate elevated, but the increase in consumer and business spending in the fourth quarter of 2010 suggested “…the pace of economic recovery seems likely to be
moderately stronger in 2011 than it was in 2010.” For 2010 as a whole, gross domestic product (“GDP”) grew 2.9%, including 2.6% growth in the third quarter and a preliminary estimate of 3.2% GDP growth in the fourth quarter. The increase in growth during the fourth quarter provided solid evidence that the
recovery is on a self-sustaining pace, but the U.S. economy has so far been unable to produce the job growth needed to absorb the large numbers of unemployed. In 2010, 1.1 million net new jobs were generated, leaving considerable ground to make up after the 8.5 million jobs that were lost during the recession.
Despite the official end to the recession in June 2009, the unemployment rate stood at an elevated 9.4% as 2010 drew to a close. 33
While macroeconomic conditions in the U.S. slightly strengthened in the fourth quarter, growth in Europe weakened, and prospects for the European economy in 2011 grew more tenuous as a result of the ongoing sovereign debt crisis. After the bailouts of Greece and Ireland were completed, focus was directed to
Portugal, Spain, and Italy, which also have sizeable deficits. Recently successful bond sales have temporarily assuaged fears of a further spread in the crisis, but investors remain skeptical that economic growth will be strong enough to achieve mandated deficit reductions, particularly given the planned cutbacks in
government spending. The European Central Bank has pledged to make use of all of the tools at its disposal, but the uncertainty associated with these countries poses significant risk for global capital markets. While growth in emerging markets has been robust, concerns about a real estate bubble in China along
with rising inflation in China, India and other developing nations has some potential to slow the global economy. Despite the uncertain macroeconomic environment, the Dow Jones Industrial Average added 7% in the fourth quarter of 2010 and gained 11% for 2010 as a whole. Similarly, the S&P 500 added 10% during the fourth quarter and 11% for the year. Investors responded positively to strong earnings reports from U.S.
companies, and particularly those with sizeable international operations. At the same time, gold prices soared due to surging demand from the developing world, the perception of gold as a safe haven in times of economic uncertainty and speculation. Following reports that the economic recovery had stalled, yields
on the 10-year Treasury hit a 2010 low of 2.38% early in the fourth quarter of 2010, but subsequently rose to close to 3.50% following the Federal Reserve’s announcement of additional Treasury purchases and the expectation that extension of the Bush-era tax cuts and other stimulus programs would produce
stronger economic growth in 2011. The dollar weakened against the euro and most other major currencies, giving up the gains from the first half of the year. Still, U.S. exports remained relatively strong during the second half of 2010 which benefited the manufacturing sector. Notwithstanding the various potential downside risks, most economists expect the U.S. economy to grow at a modest pace in 2011, and for economic activity to strengthen over the course of the year. Prospects for 2011 are encouraging due in part to the recent pickup in consumer spending which is expected to
continue in 2011. Consumer spending is expected to grow 2.6% in 2011 vs. 1.7% in 2010. The real driving force behind growth, however, is expected to remain with the business sector where investment spending will continue to thrive. Corporate profits soared in 2010 leaving businesses flush with cash and the
appetite for investment in equipment and software to improve operational efficiency. Economists expect capital spending to taper off over the course of 2011, but with businesses increasing hiring in order to meet growing demand for their products. The December 2010 consensus of economists surveyed by the Blue Chip Economic Indicators publication is for GDP to grow 2.6% in 2011, with GDP growing at a modest 2.5-2.7% rate in the first half of the year and at a slightly stronger 3.0-3.2% rate in the second half of the year. Again, growth of this magnitude
would not be strong enough to significantly reduce the unemployment rate. The mediocre growth expectations for 2011 reflect the ongoing drag from the depressed housing market, weak consumer confidence, tight credit for consumers and small businesses and the waning effects of 2009’s fiscal stimulus. At the
same time, the recently passed extension of Bush-era tax cuts and the fiscal stimulus accompanying it will add positively to growth as will the ongoing accommodative stance of monetary policy. The Fed’s second round of quantitative easing is underway, targeting $600 billion in purchases of longer-term Treasuries.
More importantly, this easing is intended to signal the Fed’s commitment to raising inflation closer to its target. Higher inflation expectations should stimulate spending or at least counteract any drag on growth from deflation fears. Recent trends in key economic indicators are summarized in the table below. The fourth quarter of 2010 saw a net gain of 384,000 jobs in the United States as compared to a loss of 91,000 during the third quarter of 2010. Growth in private sector employment (not shown below) has been relatively strong, growing
by 372,000 and 385,000 in the third and fourth quarters of 2010, respectively. In 2010 as a whole, the private sector generated 1.35 million jobs as compared with a loss of 222,000 government sector jobs (of which a large number were temporary 2010 Census workers). Still, private sector employment grew by 112,000
per month in 2010 which is short of the job growth that is necessary to absorb the 150,000 persons that entered the labor force each month. However, stronger employment growth is expected in 2011, with job gains expected to total 2.2 million in 2011, or over 180,000 per month, as shown in the table below. 34
Economic Indicators*
2010
2010Q1
2010Q2
2010Q3
2010Q4
Forecast
2011
2012 Economy(1) Gross Domestic Product (GDP)
2.9
%
3.7
%
1.7
%
2.6
%
3.2
%
3.1
%
3.2
% Employment Growth (Thousands)
1,124
261
570
-91
384
2,200
3,200 Interest Rates(2) 10 Year Treasury
3.22
%
3.72
%
3.49
%
2.79
%
2.86
%
3.50
%
4.20
% Federal Funds Rate
0.0-0.25
%
0.0-0.25
%
0.0-0.25
%
0.0-0.25
%
0.0-0.25
%
N/A
N/A Sources: BEA, BLS, Federal Reserve, Blue Chip Consensus Forecasts, and Economy.com.
*
Data subject to revision. (1) GDP growth rates are annual rates. (2) The Treasury rates are an average over the stated time period. The Federal Funds rates are as of the end of the stated time period. N/A indicates data not available. Other indicators of U.S. economic activity, such as those summarized in the table below, highlight the weaknesses that remain in the U.S. economy. Consumer confidence in 2010 inched up from its 2009 lows, but remained at a historically low level and was indicative of consumers’ cautious approach given the state
of the U.S. economy and job market. Consumer confidence has also been affected by the lackluster recovery of the housing market. While existing home sales rose 12.3% in December 2010, sales ran at a seasonally adjusted annual rate of 5.28 million homes, still 3% below the December 2009 level. Prices of
existing homes were stagnant in 2010 and the National Association of Realtors expects only minimal growth in home values in 2011. Similarly, new home sales in December 2010 were 8% below December 2009’s seasonally adjusted annual rate, and housing construction remains at historic lows as builders wait for
the overhang of vacant and foreclosed homes to be absorbed. The unemployment rate remained elevated at 9.4% as of December 2010. Broad Economic Indicators*
Full Year
October
November
December
2009
2010 Consumer Confidence (1985=100)
45.2
53.3
49.9
54.3
53.3 % Change from prior month or year Inflation (Consumer Price Index)
-0.4
%
1.6
%
0.2
%
0.1
%
0.5
% Retail Sales (excl. auto, parts & gas)
-2.0
%
4.5
%
0.8
%
0.6
%
0.4
% Existing Home Sales
4.9
%
-4.8
%
-2.2
%
6.1
%
12.3
% New Home Sales
-22.7
%
-14.4
%
-11.7
%
0.0
%
17.5
% Single-family Housing Starts
-28.4
%
5.8
%
-3.1
%
5.8
%
-9.0
% Annual or Monthly Average Unemployment Rate
9.3
%
9.6
%
9.7
%
9.8
%
9.4
%
*
Data subject to revision Inflation is the year-over-year percentage change in the unadjusted annual average. Sources: Conference Board, Census Bureau, Bureau of Labor Statistics, National Association of Realtors Reports from the twelve Federal Reserve Districts (“Districts”) contained in the January 2011 Beige Book indicated that economic growth continued to expand moderately in all Districts during the November to December 2010 period. Improvements were noted in the manufacturing, retail, and non-financial
services sectors in each of the twelve Districts. Manufacturing activity was characterized by a strong flow of new orders, with capacity utilization rates trending higher and approaching normal rates in a number of Districts. Consumer spending picked up, with retailers in most Districts reporting that 2010 holiday
sales were above those in 2009. Non-financial services’ activity increased steadily, with increased demand for information technology, advertising and consulting, and legal services. However, residential real estate markets remained weak in all Districts, and commercial real estate markets were mixed, with increased
leasing activity in several Districts, but “slow” and “subdued” construction in all Districts. Similarly, banking and financial 35
2010
2010
2010
services activity was mixed with loan demand either “stable”, “slightly softer”, or “slowly improving” despite improved credit quality. Labor markets firmed across the country, with no upward pressure on wages. All Districts reported employment levels that were rising modestly in at least some sectors. Similarly, in
eight of the twelve Districts, business contacts reportedly planned to continue or increase the pace of hiring in 2011. In short, reports from the 12 Districts provided anecdotal confirmation of a modest improvement in economic activity during the fourth quarter of 2010. Real Estate Market Conditions and Outlook Commercial real estate market statistics discussed in this section are obtained by the Account from sources that management considers reliable, but some of the data is preliminary for the quarter ended December 31, 2010 and may subsequently be revised. Prior period numbers may have been adjusted to reflect updated
data. Industry sources such as CB Richard Ellis Economic Advisors (“CBRE-EA”) calculate vacancy based on square footage. Except where otherwise noted, the Account’s vacancy data is calculated as a percentage of net rentable space leased, weighted by square footage, in keeping with industry standards. Investors
should not rely exclusively on the data presented below in forming a judgment regarding the current or prospective performance of the real estate market generally. Capital flows to commercial real estate picked up significantly over the course of 2010, culminating in property sales of $52 billion in the fourth quarter of 2010. According to Real Capital Analytics, commercial real estate sales totaled $132 billion in 2010 as a whole, which was double the volume in 2009. Still, 2010
sales remained some 75% below sales activity at the 2007 market peak. The increase in activity in 2010 was evidenced by an increase in the number of larger deals, an increase in the number of properties sold, and an increase in average deal size. Activity in New York, Washington, DC and San Francisco was
particularly strong and relatively stronger in other top markets. Office property sales saw a sizeable increase with a total $40 billion of property sold in the year, which represented an increase of 130% compared with 2009. Similarly, apartment property sales volume doubled while gains for retail and industrial
property were more modest. Aggregate sales volume increased in part because of distressed property sales which totaled some $24 billion. Still, Real Capital Analytics noted that the amount of distressed property declined modestly in the fourth quarter of 2010, which potentially signals a turning point in the market. In addition to stronger sales activity, commercial property prices increased in 2010. As shown below, Moody’s REAL Commercial Property Price Index (“Moody’s CPPI”) increased 2.8% in November 2010 (the most recent available data) compared with November 2009, with apartment properties and office
properties in top metropolitan areas recording the biggest increases. However, Moody’s CPPI is still down over 40% compared with the October 2007 peak.
Sales Price Change
National
Top 10 MSAs*
Nov 2009-
3Q09-
3Q09- All Property Types
2.8
% Apartments
15.5
%
3.5
% Industrial
-1.2
%
-9.6
% Office
4.4
%
21.9
% Retail
-11.6
%
-6.7
%
*
Based on the total value of property sold by Metropolitan Statistical Area (“MSA”)
Source: Moody’s/REAL CPPI By comparison, Green Street Advisors’ Commercial Property Price Index (“GSA CPPI”) indicated sizeable price increases in 2010 and from the market’s trough. The GSA CPPI increased 1% in December 2010, and was up 22% compared with December 2009; however, it is still 18% below the August 2007 cyclical
peak. The difference between Moody’s and Green Street’s indices is primarily due to methodology as Moody’s index uses property sales in combination with econometric models to estimate “same property” values. Moody’s results also include distressed property sales which have contributed to the index’s modest
recovery. By comparison, Green Street uses recent sales activity, changes in REIT company and property values, and anecdotal information from industry contacts to estimate overall commercial real estate values. Moreover, recent acquisitions by REITs, the greater interest in commercial real estate from
institutional buyers, foreign buyers and funds along with improved credit market conditions collectively suggest that prices have probably 36
Nov 2010
3Q10
3Q10
increased measurably from their lows. According to Green Street, three factors are responsible for the rebound in prices: (1) plunging return hurdles across most asset classes; (2) a dearth of distressed sellers; and (3) a quicker than expected rebound in fundamentals in some major property sectors. Commercial real estate investment returns improved steadily over the course of 2010 even though economic growth was lackluster. For the four quarter period ending December 2010, NCREIF Property Index returns were 4.6%, consisting of a 1.6% income return and a 3.0% capital return. Returns were positive
for every quarter of 2010 and across all property types. The rapid recovery of property values in the face of modest improvement in macroeconomic conditions and real estate market fundamentals has caused some analysts to voice concern. However, buyers are acting on the belief that economic conditions will continue to strengthen in 2011 and that real estate market
fundamentals will benefit from stronger economic growth. Indeed, real estate market conditions have already started to improve, albeit very slowly. Vacancy rates remain elevated, but they have largely stabilized and have inched down in a number of markets. Similarly, rents remain under downward pressure, but
leasing activity has picked up. Capitalization rates are still slightly higher than they were at the market peak such that cash-on-cash income returns for new acquisitions remain relatively attractive. In addition, pricing still appears attractive compared to replacement costs for most property types. Further, with rents
at a trough, prospects for rent growth over the longer term are promising given a pickup in employment growth, the dearth of construction, and expectations that construction will remain modest over the next several years. Data for the Account’s top five markets in terms of market value as of December 31, 2010 are provided below. These markets represent 42% of the Account’s total real estate portfolio and occupancies of the properties owned in all of these markets except Boston—Quincy, MA remained above 90% overall.
However, Account vacancies in the Boston office market are in-line with market vacancies as shown below.
Metropolitan Area
Account % Leased
# of Property
Metro Area
Metro Area Washington-Arlington-Alexandria DC-VA-MD-WV
96.2%
8
14.2%
10.6% Boston-Quincy MA
87.2%
5
7.4%
5.5% Los Angeles-Long Beach-Glendale CA
93.4%
8
7.2%
5.4% San Francisco-San Mateo-Redwood City CA
92.8%
4
6.7%
5.0% Houston-Bay Town-Sugar Land TX
94.6%
3
6.4%
4.8%
*
Weighted by market value, which differs from the calculations provided for market comparisons to CBRE-EA data and are used here to reflect the fair market value of the Account’s monetary investments in those markets.
Office According to CBRE-EA, the national office vacancy rate averaged 16.4% in the fourth quarter of 2010 as compared to 16.6% in the third quarter of 2010. By comparison, the vacancy rate for the Account’s office portfolio was 13.3% as of the fourth quarter of 2010, as compared with 14.2% in the third quarter of
2010. As shown in the table below, the average vacancy rates of the Account’s properties in its top markets generally declined or remained stable in the fourth quarter, with the exception of Washington, DC which increased slightly but still compared favorably to the 12.9% vacancy rate for the overall metro area.
The vacancy rate for the Account’s properties in Seattle, which declined sharply in the fourth quarter to 8.1%, is similarly well below the 16.8% for the overall metro area. Demand for office space is driven largely by job growth in the financial sector, where employment grew by a mere 3,000 jobs in the fourth
quarter of 2010, and professional and business services sectors, where employment grew by 96,000 jobs during the fourth quarter. The modest growth in office-using employment is a positive sign for U.S. office markets which were battered by sizeable job losses in the financial and professional and business services
sectors in 2008 and 2009. With stronger employment growth expected in 2011, office properties in the Account’s top markets appear well positioned to benefit. 37
Market Value
Weighted*
Investments
as a % of
Total Real
Estate Portfolio
as a % of
Total
Investments
Account Weighted
Metropolitan
Sector Metropolitan Area
Total Sector by
% of Total
2010Q3
2010Q4
2010Q3
2010Q4 Office National
14.2%
13.3%
16.6%
16.4% 1 Washington-Arlington-
$1,171.5
9.3%
5.8%
6.1%
13.1%
12.9% 2 Boston-Quincy MA
$675.9
5.4%
13.9%
13.8%
13.2%
13.0% 3 San Francisco-San Mateo-Redwood City CA
$560.8
4.4%
9.0%
8.4%
14.1%
13.7% 4 Seattle-Bellevue-Everett WA
$471.8
3.7%
9.3%
8.1%
16.8%
16.8% 5 Los Angeles-Long Beach-Glendale CA
$404.7
3.2%
20.5%
20.3%
17.2%
17.3%
*
Source: CBRE-EA. Vacancy is defined as the percentage of space vacant. The Account’s vacancy is defined as the weighted percentage of unleased space.
Industrial Conditions in the industrial market are influenced to a large degree by GDP growth, industrial production and international trade flows. Despite five consecutive quarters of GDP growth, growth in industrial production, and a pick up in trade, U.S. industrial market conditions remained weak. However, industrial
availabilities have declined for two consecutive quarters, which suggests that a recovery is slowly underway. According to CBRE-EA, the national industrial availability rate was 14.3% during the fourth quarter of 2010 as compared to 14.6% during the third quarter of 2010. By comparison, the vacancy rate for the
Account’s industrial property portfolio declined more sharply and averaged 7.2% in the fourth quarter of 2010 as compared with 9.2% in the third quarter of 2010. As shown in the table below, the average vacancy rate of the Account’s properties in all but one of its major markets was well below the comparative
market vacancy rate. The only exception was Los Angeles, where the average vacancy of the Account’s properties declined in the fourth quarter of 2010, but at 11.7% was still above the metro area average of 7.5%, as the re-leasing of space due to the expiration and default of several small tenants continues.
Account Weighted
Metropolitan
Sector Metropolitan Area
Total Sector by
% of Total
2010Q3
2010Q4
2010Q3
2010Q4 Industrial National
9.2%
7.2%
14.6%
14.3% 1 Riverside-San Bernardino-Ontario CA
$380.6
3.0%
0.0%
0.2%
15.5%
14.8% 2 Dallas-Plano-Irving TX
$179.0
1.4%
8.9%
7.2%
16.5%
15.9% 3 Chicago-Naperville-Joliet IL
$109.7
0.9%
1.9%
2.2%
15.8%
15.8% 4 Los Angeles-Long Beach-Glendale CA
$95.5
0.8%
15.8%
11.7%
7.8%
7.5% 5 Atlanta-Sandy Springs-
$87.8
0.7%
5.0%
5.0%
19.6%
19.0%
*
Source: CBRE-EA. Availability is defined as the percentage of space available for rent. The Account’s vacancy is defined as the weighted percentage of unleased space.
Multi-Family Preliminary data from CBRE-EA indicate that the recovery in the apartment market strengthened during the second half of 2010. Apartment vacancies averaged 6.0% as of fourth quarter 2010 as compared to 7.4% at year-end 2009. (Year-over-year comparisons are necessary to account for seasonal leasing
patterns.) The improvement in market conditions has been due to a decline in home-ownership rates resulting from the housing crisis and an increase in household formations as a result of modest job growth. Markets have also benefited from modest apartment construction. The vacancy rate of the Account’s multi-
family portfolio 38
Average Vacancy
Area Vacancy*
Metro Area ($M)
Investments
Alexandria DC-VA-MD-
WV
Average Vacancy
Area Availability*
Metro Area ($M)
Investments
Marietta GA
averaged 3.3% in the fourth quarter of 2010 versus 2.7% in the third quarter of 2010. As shown in the table below, the average vacancy rates for the Account’s properties in its top apartment markets were all well below their comparative market averages.
Account Weighted
Metropolitan
Sector Metropolitan Statistical Area
Total Sector by
% of Total
2010Q3
2010Q4
2010Q3
2010Q4 Apartment National
2.7%
3.3%
5.8%
6.0% 1 Houston-Bay Town-Sugar Land TX
$224.5
1.8%
3.3%
3.0%
9.7%
9.9% 2 Denver-Aurora CO
$208.4
1.7%
2.5%
4.7%
4.8%
4.7% 3 Atlanta-Sandy Springs-Marietta GA
$128.1
1.0%
1.9%
2.7%
9.3%
9.5% 5 New York-Wayne-White Plains NY-NJ
$123.0
1.0%
0.0%
0.0%
5.8%
5.5% 4 Phoenix-Mesa-Scottsdale AZ
$119.0
0.9%
3.4%
3.2%
9.6%
9.1%
*
Source: CBRE-EA. Vacancy is defined as the percentage of units vacant. The Account’s vacancy is defined as the weighted percentage of unleased space.
Retail Macroeconomic support for the retail sector strengthened over the course of 2010. While U.S. households remained cautious, they started spending again to refresh wardrobes and home décor. Advanced estimates from the U.S. Census Bureau indicated that retail sales excluding motor vehicles increased 2.6%
during the fourth quarter 2010 as compared to the third quarter. While 2010 comparisons are favorable partly because 2009 sales were extremely weak, many retailers have reported both healthy profits and sales growth. Most importantly, virtually all types of retailers, from discounters to department stores to luxury
retailers, have reported growth in “same store sales”, a key industry metric. Growth in consumer spending is expected to continue in 2011 as economic conditions improve. Availability rates in community and neighborhood shopping centers were unchanged in the fourth quarter of 2010 averaging 13.0% as
compared to 13.0% in the third quarter of 2010. The stabilization in availability rates coupled with growth in retail sales bodes well for retail market prospects. Reflective of both the modest improvement in the retail market and the challenging economic and leasing environment that remains, the vacancy rate for
the Account’s retail portfolio declined to 15.3% during the fourth quarter of 2010 from 16.3% in the third quarter of 2010. 2010 Summary and 2011 Outlook Typically lagging overall economic trends, commercial real estate market conditions responded to the economic recovery during the second half of 2010. Fundamentals do remain challenging, however, with minimal employment growth in particular keeping vacancy rates elevated. Rents in most markets and for
most property types have stabilized, but demand remains weak and tenants typically have multiple space options. However, with demand growing slowly and likely to continue to increase as the economy strengthens, Management believes there should be opportunities for the Account to achieve growth in property
rental income and portfolio net operating income as vacant space is leased and rent growth resumes. Further, there is very minimal new construction underway which, by limiting new supply, should allow vacancy rates to respond to improving demand. The turnaround in property values began in mid-2010 following
the expectation early in the year that the economic recovery was strengthening. Property values on average have recouped a modest amount of the 30-40% decline from the 2007 peak, which could provide the potential for further capital appreciation in 2011 and beyond. During 2010, Management continued efforts to realign geographic and property sector concentrations to target major markets and a balanced mix of property types. In support of this strategy, 24 individual properties were sold in 2010; one wholly owned property and 23 properties from within the Account’s joint
venture investments. The gross sales prices totaled $508.6 million ($92.5 million and $416.1 million related to a wholly owned property and properties within the Account’s investments in joint ventures, respectively). Of these sales, $119.4 million was sold in the fourth quarter, $92.5 million and $26.9 million related
to a wholly owned property and properties within the Account’s investments in joint ventures, respectively. Additionally, 39
Average Vacancy
Area Vacancy*
Metro Area ($M)
Investments
Management was successful in reducing the Account’s level of debt and significantly lowered the overall interest rate. As of December 31, 2010, the Account’s loan to value ratio was 24.3%. The Account’s commercial property portfolio was 92.5% leased at December 31, 2010. Account returns in the fourth quarter
of 2010 were bolstered by a 5.50% capital return and 1.79% income return. As shown in the graph below, returns for the fourth quarter of 2010 topped third quarter returns and were the highest quarterly returns in the Account’s history. Cash management will be the Account’s primary focus for 2011 in response to the significant inflows during 2010 which continued into the early part of 2011. Management intends to manage the inflow of funds to maximize the performance of the Account in accordance with its investment objectives and strategy.
This cash management will include the active pursuit of new acquisitions—primarily direct, privately owned real estate but such activity may also include liquid real estate-related securities, as it did in the second half of 2010. As the industry moves further into the recovery phase, the Account’s “core” investment
strategy will continue to focus on institutional quality properties and markets. Potential acquisitions will be evaluated in the context of overall Account objectives, with an emphasis on industrial, retail, and multi-family properties in order to reduce the Account’s exposure to the office sector and at the same time
diversifying the Account’s retail holdings. Management believes that the ongoing rebalancing of the portfolio has positioned the Account to build on the returns achieved in 2010. Investments as of December 31, 2010 As of December 31, 2010, the Account had total net assets of $10.8 billion, a 12.9% increase from the end of the third quarter of 2010 and a 37.1% increase from December 31, 2009. The increase in the Account’s net assets from December 31, 2009 to December 31, 2010 was primarily caused by an increase in
participant transactions into the account in addition to the appreciation in value of the Account’s wholly owned real estate properties and those owned in joint venture investments. As of December 31, 2010, the Account owned a total of 99 real estate property investments (88 of which were wholly owned, 11 of which were held in joint ventures). The real estate portfolio included 38 office property investments (four of which were held in joint ventures and one located in London, England), 25
industrial property investments (including one held in a joint venture), 20 apartment property investments, 15 retail property investments (including five held in joint ventures and one located in Paris, France), and one 75% owned joint venture interest in a portfolio of storage facilities. Of the 99 real estate property investments, 29 are subject to debt (including seven joint venture property investments). Total principal outstanding on the Account’s wholly owned real estate portfolio as of December 31, 2010 was $1.9 billion. The Account’s joint venture values shown in the Statement of Investments
are presented net of debt; however, when the debt of the Account’s joint ventures are also considered, total principal outstanding on the Account’s portfolio as of December 31, 2010 was $3.5 billion. As of December 31, 2010, the loan to value ratio of the Account is 24.3%. As of December 31, 2010, the Account
has no outstanding debt on which the Account itself is an obligor. 40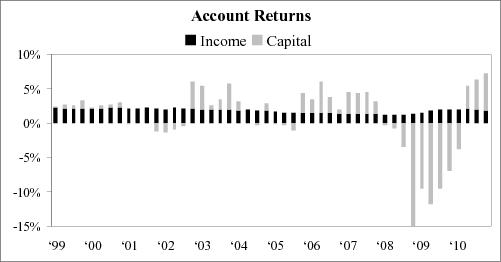
Management believes that the Account’s real estate portfolio is diversified by location and property type. The Account’s largest investment, 1001 Pennsylvania Avenue located in Washington, DC, represented 6.2% of total real estate investments and 4.7% of total investments. As discussed in the Account’s
prospectus, the Account does not intend to buy and sell its real estate investments simply to make short-term profits. Rather, the Account’s general strategy in selling real estate investments is to dispose of those assets that management believes (i) have maximized in value, (ii) have underperformed or face
deteriorating property-specific or market conditions, (iii) need significant capital infusions in the future, (iv) are appropriate to dispose of in order to remain consistent with the Account’s intent to diversify the Account by property type and geographic location, (including reallocating the Account’s exposure to or
away from certain property types in certain geographic locations), or (v) otherwise do not satisfy the investment objectives of the Account. The Account could reinvest any sale proceeds that it does not need to pay operating expenses or to meet debt service or redemption requests (e.g., cash withdrawals or
transfers, and any redemption of TIAA’s liquidity units in the future). During 2010 there were no property investment acquisitions. During 2010, the Account sold one wholly owned property investment for a net sales price of $91.9 million, its 50% interest in one joint venture for a net sales price of $28.5 million, and 22 retail properties in various locations by the Account’s DDR TC LLC joint venture (the “DDR Joint Venture”). The Account
holds an 85% interest in this joint venture. The Account’s portion of the net sales price was $47.2 million (after taking into account the pay down of $6.1 million and the assumption by the purchaser of the Account’s portion of debt on the properties equal to $329.5 million) and the Account realized a loss of $181.7
million, the majority of which had been previously recognized as an unrealized loss. Property Investments Sold in 2010
(In thousands)
Property Name Property Type City State
Net Sales Price Wholly Owned Inverness Center Office Birmingham AL
$
91,882 Joint Ventures Tyson’s Executive Plaza II(1) Office McLean VA
28,500 DDR TC LLC (2)(3) Retail Various Various
47,217 Total
$
167,599
(1)
The Account sold its entire 50% interest in this joint venture. (2) Represents the cumulative sale of 22 properties from within the Account’s investment from in the joint venture. (3) Net of $335.6 million of debt paid in conjunction with the sales. The following charts reflect the diversification of the Account’s real estate assets by region and property type and list its ten largest investments by gross market value. All information is based on the fair values of the investments at December 31, 2010. Diversification by Fair Value(1)
East
West
South
Midwest
Foreign(2)
Total Office
24.5
%
17.5
%
10.4
%
1.2
%
2.7
%
56.3
% Apartment
2.6
%
6.2
%
5.4
%
0.0
%
0.0
%
14.2
% Industrial
1.3
%
7.0
%
4.1
%
1.3
%
0.0
%
13.7
% Retail
3.2
%
0.9
%
8.5
%
0.3
%
2.4
%
15.3
% Storage
0.2
%
0.2
%
0.1
%
0.0
%
0.0
%
0.5
% Total
31.8
%
31.8
%
28.5
%
2.8
%
5.1
%
100.0
% 41
in thousands
(less selling expense)
(1)
Wholly-owned properties are represented at fair value and gross of any debt, while joint venture properties are represented at the net equity value. (2) Represents real estate investments in the United Kingdom and France. Properties in the “East” region are located in: CT, DC, DE, KY, MA, MD, ME, NC, NH, NJ, NY, PA, RI, SC, VA, VT, WV Properties in the “West” region are located in: AK, AZ, CA, CO, HI, ID, MT, NM, NV, OR, UT, WA, WY Properties in the “South” region are located in: AL, AR, FL, GA, LA, MS, OK, TN, TX Properties in the “Midwest” region are located in: IA, IL, IN, KS, MI, MN, MO, ND, NE, OH, SD, WI Top Ten Largest Real Estate Investments
Property Investment Name City State Type
Value ($M)(a)
Property as a
Property as a 1001 Pennsylvania Avenue Washington DC Office
589.8
(b)
6.23
4.67 Four Oaks Place Houston TX Office
383.7
4.05
3.04 Fourth and Madison Seattle WA Office
330.0
(c)
3.48
2.61 50 Fremont San Francisco CA Office
315.1
(d)
3.33
2.49 DDR Joint Venture Various USA Retail
303.9
(e)
3.21
2.40 780 Third Avenue New York City NY Office
300.6
3.17
2.38 Westferry Circus London UK Office
260.0
(f)
2.74
2.06 99 High Street Boston MA Office
255.0
(g)
2.69
2.02 The Newbry Boston MA Office
252.0
2.66
1.99 1900 K Street Washington DC Office
246.1
2.60
1.95
(a)
Value as reported in the December 31, 2010 Statement of Investments. Investments owned 100% by the Account are reported based on fair value. Investments in joint ventures are reported at fair value and are presented at the Account’s ownership interest which is net of any debt. (b) This property investment is presented gross of debt. The value of the Account’s interest less the fair value of leverage is $221.8 million. (c) This property investment is presented gross of debt. The value of the Account’s interest less the fair value of leverage is $150.7 million. (d) This property investment is presented gross of debt. The value of the Account’s interest less the fair value of leverage is $139.3 million. (e) This property is held in a 85%/15% joint venture with DDR, and consists of 43 retail properties located in 13 states and is presented net of debt with fair value of $987.1 million. (f) This property investment is presented gross of debt. The value of the Account’s interest less the fair value of leverage is $210.2 million. (g) This property investment is presented gross of debt. The value of the Account’s interest less the fair value of leverage is $183.8 million. As of December 31, 2010, the Account’s net assets totaled $10.8 billion. At December 31, 2010, the Account held 75.0% of its total investments in real estate and real estate joint ventures. The Account also held investments in government agency notes representing 11.8% of total investments, U.S. Treasury
securities representing 7.2% of total investments, real estate-related equity securities representing 3.9% of total investments, and real estate limited partnerships, representing 2.1% of total investments. 42
% of Total
Real Estate
Portfolio
% of Total
Investments
Results of Operations Year Ended December 31, 2010 Compared to Year Ended December 31, 2009 Performance The Account’s total return was 13.3% for the year ended December 31, 2010 as compared to -27.6% for the year ended 2009. The Account’s performance during the year ended December 31, 2010 reflects an increase in the aggregate value of the Account’s real estate property investments, including investments
owned in joint ventures and limited partnerships resulting from the strengthened economy, financial and credit markets. The Account’s annualized total returns over the one, three, five, and ten year periods ended December 31, 2010 were 13.3%, -11.1%, -1.8%, and 3.3%, respectively. As of December 31, 2010, the Account’s annualized total return since inception was 5.2%. The Account’s total net assets increased from $7.9 billion at December 31, 2009 to $10.8 billion at December 31, 2010. The primary driver of this 37.1% increase was net participant inflows into the Account in addition to appreciation in value of the Account’s wholly owned, joint venture, and limited partnership
real estate investments. Income and Expenses The table below shows the net investment income for the years ended December 31, 2010 and 2009 and the dollar and percentage changes for those periods (dollars in thousands).
Years Ended
Change
2010
2009
$
% INVESTMENT INCOME Real estate income, net: Rental income
$
862,529
$
948,315
$
(85,786
)
-9.0
% Real estate property level expenses and taxes: Operating expenses
219,976
238,705
(18,729
)
-7.8
% Real estate taxes
114,653
128,734
(14,081
)
-10.9
% Interest expense
106,738
101,219
5,519
5.5
% Total real estate property level expenses and taxes
441,367
468,658
(27,291
)
-5.8
% Real estate income, net
421,162
479,657
(58,495
)
-12.2
% Income from real estate joint ventures and limited partnerships
89,268
114,578
(25,310
)
-22.1
% Interest
2,963
1,733
1,230
71.0
% Dividends
5,618
—
5,618
N/M TOTAL INVESTMENT INCOME
519,011
595,968
(76,957
)
-12.9
% Expenses: Investment advisory charges
50,225
42,521
7,704
18.1
% Administrative charges
22,081
28,026
(5,945
)
-21.2
% Distribution charges
5,980
7,779
(1,799
)
-23.1
% Mortality and expense risk charges
4,373
4,736
(363
)
-7.7
% Liquidity guarantee charges
13,120
12,411
709
5.7
% TOTAL EXPENSES
95,779
95,473
306
0.3
% INVESTMENT INCOME, NET
$
423,232
$
500,495
$
(77,263
)
-15.4
% N/M—Not meaningful The $85.8 million decrease in real estate rental income for the year ended December 31, 2010 as compared to the same period in 2009 is primarily a result of the seven full and six partial wholly owned property investment sales that occurred in the second half of 2009. These disposed properties accounted for $54.0
million, or 62.9%, of the $85.8 million total change. The remaining $31.8 million is attributed to increased 43
December 31,
vacancies at certain properties, reduced rental rates, and rent concessions for renewed leases, as well as unfavorable common area adjustments resulting from the properties maintaining lower property operating expenses. Operating expenses declined 7.8% for the 12 months ended December 31, 2010 as compared to the same period in 2009 as a result of fewer property investments under management. Property investments that were sold accounted for $15.3 million, or 81.8%, of the total decline in operating expenses. The remaining
decreases in expenses were primarily related to decreases in security expenses, insurance, and professional fees. The expense declines were partially offset by increases in utilities, general building expenses, and bad debt expense. Real estate taxes decreased 10.9% for the year ended December 31, 2010 as compared to the prior year. This was a result of fewer property investments under management and lower tax assessments across the existing properties held by the Account. Interest expense increased $5.5 million, or 5.5%, for the year ended December 31, 2010 as compared to the same period in 2009. This increase is a result of higher interest rates on new loan agreements entered into by the Account during the year ended December 31, 2010 as compared to the loan agreements that
matured during 2010. See Note 9—Mortgage Loans Payable to the financial statements included herein. The $25.3 million decline in income from real estate joint ventures and limited partnerships for the year ended December 31, 2010 as compared to the same period in 2009 was primarily due to a decrease in revenues as a result of an increase in vacancies as well as rent concessions across the joint venture portfolios
held by the Account and the sale of 22 properties from within the DDR Joint Venture and the Account’s interest in Tyson’s Executive Plaza II during 2010. The Account incurred overall Account level expenses of $95.8 million for the year ended December 31, 2010, which represents a 0.3% increase from $95.5 million for 2009. Administrative and distribution charges declined as a result of the general decline in costs allocated to manage and distribute the Account and
the reduction in the average net assets of the Account. Unlike administrative and distribution charges, investment advisory charges do not decline at the same rate as average net assets as certain portions of investment advisory charges are fixed and not directly associated to the average net asset value of the
Account. Investment advisory charges increased primarily due to costs associated with new investments in technology. Mortality and expense risk charges declined during the year ended December 31, 2010 primarily due to lower average net assets as compared to the same period in 2009. Liquidity guarantee
expenses increased as a result of the increase in the fees that TIAA charges to provide the liquidity guarantee from 10 basis points to 15 basis points, which was effective as of May 1, 2009. 44
Net Realized and Unrealized Gains and Losses on Investments and Mortgage Loans Payable The table below shows the net realized and unrealized gain (loss) on investment and mortgage loans payable for the years ended December 31, 2010 and 2009 and the dollar and percentage changes for those periods (dollars in thousands).
Years Ended
Change
2010
2009
$
% NET REALIZED AND UNREALIZED GAIN (LOSS) ON INVESTMENTS AND MORTGAGE LOANS PAYABLE Net realized gain (loss) on investments: Real estate properties
$
(12,508
)
$
(281,798
)
$
269,290
-95.6
% Real estate joint ventures and limited partnerships
(185,753
)
—
(185,753
)
N/M Marketable securities
429
1
428
N/M Mortgage loans payable
—
(371
)
371
N/M Net realized (loss) on investments
(197,832
)
(282,168
)
84,336
-29.9
% Net change in unrealized appreciation (depreciation) on: Real estate properties
638,183
(2,244,931
)
2,883,114
-128.4
% Real estate joint ventures and limited partnerships
357,477
(1,030,179
)
1,387,656
-134.7
% Marketable securities
15,032
22
15,010
N/M Mortgage loans receivable
3,727
(494
)
4,221
N/M Mortgage loans payable
(59,619
)
(54,755
)
(4,864
)
8.9
% Net change in unrealized appreciation (depreciation) on investments and mortgage loans payable
954,800
(3,330,337
)
4,285,137
-128.7
% NET REALIZED AND UNREALIZED GAIN (LOSS) ON INVESTMENTS AND MORTGAGE LOANS PAYABLE
$
756,968
$
(3,612,505
)
$
4,369,473
-121.0
% N/M—Not meaningful During the year ended December 31, 2010, the Account experienced a net realized and unrealized gain on investments and mortgage loans payable of $757.0 million, compared to a net realized and unrealized loss of $3.6 billion for the year ended December 31, 2009. The net realized and unrealized gains on
investments and mortgage loans payable was primarily driven by net realized and unrealized gains on the Account’s wholly owned real estate property investments of $625.7 million for the year ended December 31, 2010 compared to a loss of $2.5 billion during the same period in 2009. The net realized and
unrealized gains in the Account continue to be due to improved market conditions and real estate values that occurred throughout the year 2010. For the two International properties held by the Account, the foreign exchange fluctuations (losses) for the year ended December 31, 2010 partially offset the total net
realized and unrealized gain by $20.3 million. The Account experienced losses from the foreign exchange fluctuation in the first two quarters of 2010, a reverse effect in the third quarter 2010 and stable rates during the fourth quarter of 2010. Real estate joint ventures and limited partnerships experienced a net realized and unrealized gain of $171.7 million for the year ended December 31, 2010, compared to a $1.0 billion loss for the year ended December 31, 2009. The net realized and unrealized gains on joint ventures and limited partnerships were due
to increases in value of the Account’s existing real estate assets, which reflected the net effects of an improving overall economy, and an increase in value of the underlying property investments within the joint ventures and limited partnership funds. During the year ended December 31, 2010, the Account’s marketable securities position was $2.9 billion, which was comprised of $495.3 million of real estate-related marketable securities and $2.4 billion of other securities such as U.S. Treasury securities and government agency notes. The net realized and
unrealized gain of $15.5 million experienced by the Account on marketable securities was primarily due to increases in the value of real estate-related equity securities. For the year ended December 31, 2010, the Account had a net unrealized gain on the mortgage loan receivable of $3.7 million compared to $0.5 million loss for the comparable period in 2009 as a result of the mortgage loan receivable being settled in full at its face value during September 2010. 45
December 31,
Mortgage loans payable experienced a net realized and unrealized loss of $59.6 million during the year ended December 31, 2010 compared to net realized and unrealized loss of $55.1 million in the comparable period in 2009. Valuation adjustments associated with mortgage loans payable are highly dependent upon
interest rates, spreads, investment return demands, the performance of the underlying real estate investment, and where applicable, foreign exchange. Of the $59.6 million realized and unrealized loss associated with mortgage loans payable, $66.2 million was related to valuation increases in mortgage loans payable
offset in part by foreign exchange fluctuations of $6.6 million. Year Ended December 31, 2009 Compared to Year Ended December 31, 2008 Performance The Account’s total return was -27.6% for the year ended December 31, 2009 as compared to -14.2% for the year ended December 31, 2008. The Account’s performance during the year ended December 31, 2009 reflects a decline in the aggregate net asset value of the Account’s real estate property investments,
including investments owned in joint ventures and limited partnerships, lower income from marketable securities and unrealized losses from the mortgage loans payable. The twelve months of 2009 saw continued valuation declines resulting from the weakened economy and tightened financial and credit markets.
Transaction activity continued to remain at historically low levels and capital depreciation occurred in most markets. The Account’s annualized total returns (after expenses) over the one, three, five, and ten year periods ended December 31, 2009 were -27.6%, -10.9%, -1.7% and 3.1% respectively. As of December 31, 2009, the Account’s annualized total return since inception was 4.7%. The Account’s total net assets decreased from $11.5 billion at December 31, 2008 to $7.9 billion at December 31, 2009. The primary driver of this 31.5% decrease was depreciation in value of the Account’s wholly owned, joint venture, and limited partnership real estate investments (86.0% of the decrease), while
net participant withdrawals and transfers out of the Account (net of the $1.1 billion of liquidity units purchased by TIAA) accounted for 14.0% of the decrease. Income and Expenses The table below shows the net investment income for the years ended December 31, 2009 and 2008 and the dollar and percentage changes for those periods (dollars in thousands).
Years Ended
Change
2009
2008
$
% INVESTMENT INCOME Real estate income, net: Rental income
$
948,315
$
979,295
$
(30,980
)
-3.2
% Real estate property level expenses and taxes: Operating expenses
238,705
257,351
(18,646
)
-7.2
% Real estate taxes
128,734
132,979
(4,245
)
-3.2
% Interest expense
101,219
88,531
12,688
14.3
% Total real estate property level expenses and taxes
468,658
478,861
(10,203
)
-2.1
% Real estate income, net
479,657
500,434
(20,777
)
-4.2
% Income from real estate joint ventures and limited partnerships
114,578
116,889
(2,311
)
-2.0
% Interest
1,733
76,444
(74,711
)
-97.7
% Dividends
—
5,079
(5,079
)
N/M TOTAL INVESTMENT INCOME
595,968
698,846
(102,878
)
-14.7
% Expenses: Investment advisory charges
42,521
47,622
(5,101
)
-10.7
% Administrative charges
28,026
58,080
(30,054
)
-51.7
% Distribution charges
7,779
19,497
(11,718
)
-60.1
% Mortality and expense risk charges
4,736
8,116
(3,380
)
-41.6
% Liquidity guarantee charges
12,411
19,725
(7,314
)
-37.1
% TOTAL EXPENSES
95,473
153,040
(57,567
)
-37.6
% INVESTMENT INCOME, NET
$
500,495
$
545,806
$
(45,311
)
-8.3
% N/M—Not meaningful 46
December 31,
The Account’s real estate holdings, including real estate joint ventures and limited partnerships, generated 99.7% and 88.3% of the Account’s total investment income (before deducting Account level expenses) during the years ended December 31, 2009 and 2008, respectively. The 14.7% decrease in the Account’s
total investment income was primarily due to a 97.9% decrease in the Account’s dividend income and interest income and a 4.2% decrease in net real estate income. Gross real estate rental income decreased by $31.0 million or 3.2% for the year ended December 31, 2009, as compared to the same period in 2008. Approximately $19.2 million of the decrease is primarily due to the property investment sales that occurred during 2008 and 2009. In addition to the reduction in rental
income due to property investment sales, the Account also experienced a decrease in revenue due to various property specific items such as rent concessions, lower rents, increased vacancies at certain properties and reductions in common charges for many properties as a result of lower overall property operating
expenses. Total real estate property level expenses and taxes for wholly owned property investments for the year ended December 31, 2009 decreased to $468.7 million as compared to $478.9 million of the year ended December 31, 2008. The overall decline in expenses is primarily due to a 7.2% decrease in operating
expenses, a 3.2% decrease in real estate taxes offset by a 14.3% increase in interest expense. Operating expenses decreased during 2009 primarily due to an overall reduction in repairs and maintenance, utility expense, insurance expense, bad debt expense, and various other miscellaneous operating expenses. In
addition to the reduction of general expenses, the property investment sales during 2008 and 2009 eliminated some operating expenses. Real estate taxes decreased due to lower tax assessments and reduced number of properties under management. The increase in interest expense is due to $557 million of new debt
financing that was obtained during the third and fourth quarters of 2008. Income from real estate joint ventures and limited partnerships was $114.6 million for the year ended December 31, 2009 compared to $116.9 million for the year ended December 31, 2008. This 2.0% decrease was due to a decrease in gross rental income from joint venture properties as a result of increased
vacancies and select rent reductions. More specifically, the DDR Joint Venture experienced an increase in vacancies in late 2008 which resulted in lower income in 2009. Investment income on the Account’s investments in marketable securities decreased 97.9%, from $81.5 million for the year ended December 31, 2008 to $1.7 million for the comparable period in 2009. The variance was due to the decrease in the rates of return on the marketable securities as well as a lower
marketable security invested balance for 2009 compared to the year ended December 31, 2008. The Account incurred overall Account level expenses of $95.5 million for the year ended December 31, 2009, which represents a 37.6% decrease from $153.0 million for the same period in 2008. The decreases in investment advisory and administrative and distribution charges are due to two factors. First, during the
first quarter of 2008, increased costs were allocated to the Account associated with new technology investments in 2008 that were reduced significantly during the year ended December 31, 2009. Finally, the general decline in the costs allocated to manage and distribute the Account is consistent with the reduction in
the average net assets of the Account. In the future, investment advisory charges are not expected to decline at the same rate as net assets as certain portions of these costs are not directly associated to the net asset value of the Account. Mortality and expense risk charges and liquidity guarantee expenses declined
during the year ended December 31, 2009 primarily due to lower net assets as compared to the same period in 2008. The decline of the liquidity guarantee expenses resulting from the decline in net assets was partially offset by the increase in the fees that TIAA charges to provide the liquidity guarantee from 10
basis points to 15 basis points which was effective as of May 1, 2009. 47
Net Realized and Unrealized Gains and Losses on Investments and Mortgage Loans Payable The table below shows the net realized and unrealized gain (loss) on investments and mortgage loans payable for the years ended December 31, 2009 and 2008 and the dollar and percentage changes for those periods (dollars in thousands).
Years Ending
Change
2009
2008
$
% NET REALIZED AND UNREALIZED GAIN (LOSS) ON INVESTMENTS AND MORTGAGE LOANS PAYABLE Net realized gain (loss) on investments: Real estate properties
$
(281,798
)
$
(18,097
)
$
(263,701
)
N/M Real estate joint ventures and limited partnerships
—
(17
)
17
N/M Marketable securities
1
(11,041
)
11,042
N/M Mortgage loans payable
(371
)
—
(371
)
N/M Net realized (loss) on investments
(282,168
)
(29,155
)
(253,013
)
867.8
% Net change in unrealized appreciation (depreciation) on: Real estate properties
(2,244,931
)
(1,905,930
)
(339,001
)
17.8
% Real estate joint ventures and limited partnerships
(1,030,179
)
(702,797
)
(327,382
)
46.6
% Marketable securities
22
15,820
(15,798
)
-99.9
% Mortgage loans receivable
(494
)
(753
)
259
-34.4
% Mortgage loans payable
(54,755
)
109,791
(164,546
)
-149.9
% Net change in unrealized appreciation (depreciation) on investments and mortgage loans payable
(3,330,337
)
(2,483,869
)
(846,468
)
34.1
% NET REALIZED AND UNREALIZED GAIN (LOSS) ON INVESTMENTS AND MORTGAGE LOANS PAYABLE
$
(3,612,505
)
$
(2,513,024
)
$
(1,099,481
)
43.8
% N/M—Not meaningful The Account had net realized and unrealized losses on investments and mortgage loans payable of $3.6 billion for the year ended December 31, 2009, a $1.1 billion increase when compared to a net realized and unrealized loss of $2.5 billion for the year ended December 31, 2008. The increase in net realized and
unrealized losses on investments and mortgage loans payable was primarily driven by net realized and unrealized losses on the Account’s wholly owned real estate property investments of $2.5 billion for the year ended December 31, 2009 compared to a loss of $1.9 billion during the same period in 2008. The
Account’s interests in joint ventures and limited partnerships posted a net realized and unrealized loss of $909.3 million and $120.9 million, respectively, for a net total of over $1.0 billion for the year ended December 31, 2009. When compared to the year ended December 31, 2008, joint ventures and limited
partnerships posted a net realized and unrealized loss of $652.4 million and $50.4 million, respectively, for a net total of $702.8 million. The net realized and unrealized losses on wholly owned real estate property investments and those held in joint ventures and limited partnerships were due to the decline in value of the Account’s existing real estate assets, which reflected the net effects of a weaker overall economy, a decline in value of the
underlying property investments within the joint ventures and limited partnership funds and continued shortage of liquidity in the commercial real estate markets during the year ended December 31, 2009. Real estate market values have declined throughout 2009 primarily due to increasing actual and projected
vacancy rates resulting in longer tenant replacement timeframes, lower market rents, and higher capitalization rates. Mortgage loans payable experienced a net realized and unrealized loss of $55.1 million during the year ended December 31, 2009 compared to net realized and unrealized gain of $109.8 million in the same period in 2008. Valuation adjustments associated with mortgage loans payable are highly dependent upon
interest rates, spreads, investment return demands, the performance of the underlying real estate investment, and where applicable, foreign exchange. Of the $55.1 million realized and unrealized loss, foreign exchange fluctuations (due to a weakening U.S. dollar during the year ended 2009) accounted for $23.8
million of the total year-to-date loss. The remaining $30.9 million loss related to mortgage payable values is reflected in the fluctuations in the U.S. Treasury rates and higher loan to value ratios on the Account’s underlying properties 48
December 31,
(as a result of the significant declines in property values) and a $0.4 million realized loss due to the debt that was assumed in connection with the sale of a property investment. During the year ended December 31, 2009, the Account also sold one retail property investment, one industrial property investment, five office property investments and eight partial apartment property investments for net proceeds of $394.8 million and realized a loss of $281.8 million. Liquidity and Capital Resources As of December 31, 2010 and 2009, the Account’s liquid assets (i.e., cash and non-real estate-related marketable securities) had a value of $2.4 billion and $696.1 million, respectively (22.3% and 8.8% of the Account’s net assets at such dates, respectively). When compared to December 31, 2009, the Account’s non-
real estate-related liquid assets have increased by $1.7 billion. This increase is primarily the result of increased net participant activity into the Account (in particular, transfers into the Account), income generated from its real estate investments, income earned from joint venture investments, and proceeds from
selective sales of real estate properties. During the twelve months ended December 31, 2010, the Account received $2.6 billion in premiums, which included $1.9 billion of participant transfers into the Account. The Account had outflows of $851.5 million in annuity payments, withdrawals and death benefits, which included $520.9 million of participant
transfers out of the Account. During the twelve months ended December 31, 2009, the Account received $1.1 billion in premiums, which included $362.3 million of participant transfers into the Account and excludes the $1.1 billion purchase of liquidity units by TIAA. The Account had outflows of $2.6 billion in
annuity, withdrawals and death benefits, which included $2.3 billion of participant transfers out of the Account. See Note 1—Organization and Significant Accounting Policies of the financial statements as included herein. Liquidity Guarantee Primarily as a result of significant net participant transfers out of the Account during late 2008 and early 2009, pursuant to TIAA’s existing liquidity guarantee obligation, the TIAA general account purchased $1.2 billion of accumulation units (“liquidity units”) issued by the Account in a number of separate
transactions between December 24, 2008 and June 1, 2009. Subsequent to June 1, 2009 and through the date of this report, the TIAA general account has not purchased any additional liquidity units. As disclosed under “Establishing and Managing the Account—the Role of TIAA—Liquidity Guarantee” in the
Account’s prospectus, in accordance with this liquidity guarantee obligation, TIAA guarantees that all participants in the Account may redeem their accumulation units at their accumulation unit value next determined after their transfer or cash withdrawal request is received in good order. Net participant transfers out of the Account significantly slowed following the first quarter of 2009, and net participant transfer activity turned to inflows in early 2010, which has continued through the date of this report. As a result, while management cannot predict whether any future TIAA liquidity unit
purchases will be required under the liquidity guarantee, it is unlikely that additional purchases will be required in the near term. However, management cannot predict for how long net inflows will continue to occur. In addition, effective March 31, 2011, individual participants will be limited from making internal
transfers into their Account accumulation if, after giving effect to such transfer, the total value of such participant’s Account accumulation (under all contracts issued to such participant) would exceed $150,000. This limitation is subject to certain exceptions and will be in effect in the jurisdictions that have approved
the limitation. Management expects that participant inflow activity will be tempered, perhaps to a significant degree, following the effective date of this limitation. If net outflows were again to occur (even if not at the same intensity as in 2008 and early 2009), it could have a negative impact on the Account’s
operations and returns and could require TIAA to purchase additional liquidity units, perhaps to a significant degree, as was the case in late 2008 and early 2009. TIAA’s obligation to provide Account participants liquidity through purchases of liquidity units is not subject to an express regulatory or contractual limitation, although as described in the paragraph below, the independent fiduciary may (but is not obligated to) require the reduction of TIAA’s interest through
sales of assets from the Account if TIAA’s interest exceeds the trigger point. Even if the independent fiduciary so requires, TIAA’s obligation to provide liquidity under the guarantee, which is required by the New York State Insurance Department, will continue. Management believes that TIAA has the ability to
meet its obligations under this liquidity guarantee. 49
Whenever TIAA owns liquidity units, the duties of the Account’s independent fiduciary, as part of its monitoring of the Account, include reviewing the purchase and redemption of liquidity units by TIAA to ensure the Account uses the correct accumulation unit values. In addition, the independent fiduciary’s
responsibilities include:
•
establishing the percentage of total accumulation units that TIAA’s ownership should not exceed (the “trigger point”) and creating a method for reviewing the trigger point; • approving any adjustment of TIAA’s ownership interest in the Account and, in its discretion, requiring an adjustment if TIAA’s ownership of liquidity units reaches the trigger point; and • once the trigger point has been reached, participating in any program to reduce TIAA’s ownership in the Account by utilizing cash flow or liquid investments in the Account, or by utilizing the proceeds from asset sales. If the independent fiduciary were to determine that TIAA’s ownership should be reduced
following the trigger point, its role in participating in any asset sales program would include (i) participating in the selection of properties for sale, (ii) providing sales guidelines and (iii) approving those sales if, in the independent fiduciary’s opinion, such sales are desirable to reduce TIAA’s ownership of
liquidity units. As of the date of this Form 10-K, the independent fiduciary, which has the right to adjust the trigger point, has established the trigger point at 45% of the outstanding accumulation units, and it will continue to monitor TIAA’s ownership interest in the Account and provide further recommendations as necessary. As
of December 31, 2010, TIAA owned 9.8% of the outstanding accumulation units of the Account. In establishing the appropriate trigger point, including whether or not to require certain actions once the trigger point has been reached, the independent fiduciary will assess, among other things and to the extent
consistent with the Prohibited Transaction Exemption (PTE 96-76) issued by the U.S. Department of Labor in 1996 with respect to the liquidity guarantee and the independent fiduciary’s duties under ERISA, the risk that a conflict of interest could arise due to the level of TIAA’s ownership interest in the Account. The independent fiduciary is vested with oversight and approval over any redemption of TIAA’s liquidity units, acting in the best interests of Real Estate Account participants. Management expects, unless the trigger point has been reached, redemptions of any liquidity units would only occur: (i) once the Account
has experienced net participant inflows for an extended period of time and (ii) if the Account is otherwise projected to maintain a level of non real estate-related liquid assets, taking into account reasonably foreseeable uses of cash (including for acquisition of real estate and real estate-related investments and
paying debt service and outstanding principal balances at maturity), above 25% of the Account’s net assets. While the Account held 22.3% of its net assets in non real estate-related liquid assets at December 31, 2010, as of the date of this report, management cannot predict when the independent fiduciary will
approve or require a redemption in part or in full of the liquidity units held by TIAA. The independent fiduciary, which oversees the guarantee features, will approve all redemptions of liquidity units, and may authorize or direct the redemption of TIAA’s liquidity units (or a portion thereof) at any time. Upon
termination and liquidation of the Account (wind-up), any liquidity units held by TIAA will be the last units redeemed, unless the independent fiduciary directs otherwise. The Account pays TIAA for the risk associated with providing the liquidity guarantee through a daily deduction from the Account’s net assets. The Account’s net investment income continues to be an additional source of liquidity for the Account. Net investment income decreased from $500.5 million for the twelve months ended December 31, 2009 to $423.2 million for the twelve months ended December 31, 2010. The total decline was a result of wholly
owned property investment sales that occurred in the second half of 2009, joint venture sale and joint venture property sales that occurred during 2010, as well as increased vacancies at certain properties, reduced rental rates, rent concessions for renewed leases, and lower common area charges resulting from the
properties maintaining lower property operating expenses in 2010. The Account’s investment strategy remains to invest between 75% and 85% of its net assets directly in real estate or real estate-related investments with the goal of producing favorable long-term returns primarily through rental income and appreciation. As of December 31, 2010, cash and real estate-related and
non real estate-related marketable securities comprised 26.9% of the Account’s net assets. The Account’s liquid assets continue to be available to purchase additional suitable real estate properties and to meet the Account’s debt obligations, expense needs, and participant redemption requests (i.e., cash withdrawals,
benefit payments, or transfers). 50
As of December 31, 2010, the Account had $263.0 million in principal amount of debt obligations due during 2011 of which $13.1 million was related to wholly owned real estate investments and $249.9 million was related to the Account’s share of debt associated with its investments in joint ventures. Management
believes that the Account, and the joint venture entities in which the Account invests, will have the ability to address these obligations in a number of ways, including among others, refinancing or extending such debt or repaying the principal due at maturity. Leverage The Account may borrow money and assume or obtain a mortgage on a property to make leveraged real estate investments. Also, to meet any short-term cash needs, the Account may obtain a line of credit that may be unsecured and/or contain terms that may require the Account to secure the loan with one or
more of its properties. The Account is authorized to borrow money in accordance with its investment guidelines. Under the Account’s current investment guidelines, the Account’s loan to value ratio (as described below) is to be maintained at or below 30%. However, until December 31, 2011, the Account is authorized to incur and/or
maintain indebtedness on its properties in an aggregate principal amount not to exceed the aggregate principal amount of debt outstanding as of the date of adoption of such guidelines in July 2009 ($4.0 billion). Such incurrences of debt from time to time may include:
•
placing new debt on properties; • refinancing outstanding debt; • assuming debt on acquired properties or interests in the Account’s properties; and/or • extending the maturity date of outstanding debt. In calculating this limit, only the Account’s actual percentage interest in any borrowings is included, and not that percentage interest held by any joint venture partner. Further, the Account may only borrow up to 70% of the then-current value of a property, although construction loans may be for 100% of the costs
incurred in developing a property. As of December 31, 2010 the Account did not have any construction loans. Also, at the time the Account (or a joint venture in which the Account is a partner) enters into a revolving line of credit, management deems the maximum amount which may be drawn under that line of
credit as fully incurred, regardless of whether the maximum amount available has been drawn from time to time. As of December 31, 2010, management reduced the Account’s ratio of outstanding principal amount of debt to total gross asset value (i.e., a “loan to value ratio”) to less than 30% and intends to maintain its loan to value ratio at or below 30% (this ratio is measured at the time of incurrence and after giving effect
thereto). The Account’s total gross asset value, for these purposes, is equal to the total fair value of the Account’s assets (including the fair value of the Account’s interest in joint ventures), with no reduction associated with any indebtedness on such assets. In times of high net inflow activity, in particular during times of high net participant transfer inflows, management may determine to apply a portion of such cash flows to make prepayments of indebtedness prior to scheduled maturity, which would have the effect of reducing the Account’s loan to value ratio. As of December 31, 2010, the Account’s loan to value ratio was 24.3%. Recent Transactions The following describes property transactions by the Account in the fourth quarter of 2010. Except as noted, the expenses for operating the properties purchased are either borne or reimbursed, in whole or in part, by the property tenants, although the terms vary under each lease. The Account is responsible for
operating expenses not reimbursed under the terms of a lease. All rental rates are quoted on an annual basis unless otherwise noted. Purchases None. 51
Sales DDR TC LLC On November 2, 2010, a retail property located in Southern Pines, North Carolina was sold by the Account’s DDR Joint Venture. The Account holds an 85.0% interest in the DDR Joint Venture. The Account’s portion of the net sales price was $1.3 million (net of the Account’s portion of debt on the property
equal to $2.5 million). The Account realized a loss from the sale of $1.4 million, the majority of which had been previously recognized as an unrealized loss in the Account’s Statements of Operations. The Account’s portion of its cost basis (excluding selling costs) in the property at the date of the sale was $5.2
million (excluding debt) according to the records of the Account. On November 9, 2010, a retail property located in Columbia, South Carolina was sold by the Account’s DDR Joint Venture. The Account’s portion of the sales price was $1.6 million. After consideration of the Account’s portion of debt on the property equal to $1.8 million, the Account contributed an additional
$0.3 million to the DDR Joint Venture as part of the closing of the sale. The Account realized a loss from the sale of $6.6 million, the majority of which had been previously recognized as an unrealized loss in the Account’s Statements of Operations. The Account’s portion of its cost basis (excluding selling costs) in
the property at the date of the sale was $8.2 million (excluding debt) according to the records of the Account. On December 23, 2010, four retail properties were sold in various locations by the Account’s DDR TC LLC joint venture with DDR. The Account’s portion of the net sales price was $18.8 million (net of the Account’s portion of debt on one of these properties equal to $1.8 million). The Account realized a loss
from the sale of $21.0 million, the majority of which had been previously recognized as an unrealized loss in the Account’s Statements of Operations. The Account’s portion of its cost basis (excluding selling costs) in the properties at the date of the sale was $41.6 million (excluding debt) according to the records of
the Account. Inverness Center On December 9, 2010, the Account sold an office property investment located in Birmingham, Alabama for a net sale price of $91.9 million and the Account realized a loss of $11.1 million from the sale, the majority of which had been previously recognized as an unrealized loss in the Account’s Statements of
Operations. The Account’s cost basis (excluding selling costs) in the property at the date of the sale was $103.0 million. Financings None. Contractual Obligations The following table sets forth a summary regarding the Account’s known contractual obligations, including required interest payments for those items that are interest bearing, at December 31, 2010 (amounts in thousands):
Amounts Due During Years Ending December 31,
2011
2012
2013
2014
2015
Thereafter
Total Mortgage Loans Payable: Principal Payments
$
13,082
$
215,236
$
552,853
$
225,273
$
462,525
$
373,945
$
1,842,914 Interest Payments(1)
105,265
104,863
93,349
63,860
35,766
59,589
462,692 Total Mortgage Loans Payable
118,347
320,099
646,202
289,133
498,291
433,534
2,305,606 Joint Venture Funding Commitments
263
—
—
—
—
—
263 Other Commitments(2)
33,689
—
—
—
—
—
33,689 Tenant improvements(3)
101,234
—
—
—
—
—
101,234 Total Contractual Obligations
$
253,533
$
320,099
$
646,202
$
289,133
$
498,291
$
433,534
$
2,440,792
(1)
These amounts represent interest payments due on mortgage loans payable of wholly owned real estate properties based on the stated rates and, where applicable, the foreign currency exchange rates at December 31, 2010. (2) This includes the Account’s commitment to purchase interest in four limited partnerships, which could be called by the partner at any time. (3) This amount represents tenant improvements and leasing inducements committed to by the Account in tenant leases that have not been incurred as of the year ended December 31, 2010. 52
Note that the Contractual Obligations table above does not include payments on debt held in Investments in Joint Ventures which are the obligation of the individual joint venture entities. See Note 7—Investments in Joint Ventures to the Account’s financial statements. Effects of Inflation and Increasing Operating Expenses Inflation, along with increased insurance, taxes, utilities and security costs, may increase property operating expenses in the future. Any such increases in operating expenses are generally billed to tenants either through contractual lease provisions in office, industrial, and retail properties or through rent increases in
apartment complexes. The Account remains responsible for the expenses for unleased space in a property as well as expenses which may not be reimbursed under the terms of an existing lease. Critical Accounting Policies The financial statements of the Account are prepared in conformity with accounting principles generally accepted in the United States of America. In preparing the Account’s financial statements, management is required to make estimates and judgments that affect the reported amounts of assets, liabilities, revenues, and expenses. Management bases its estimates on historical experience and assumptions that are believed to be reasonable under the
circumstances, the results of which form the basis for making judgments about the carrying value of assets and liabilities that are not readily apparent from other sources. Actual results may differ from these estimates. Determination of Investments at Fair Value: The Account reports all investments and investment related mortgage loans payable at fair value. The Financial Accounting Standards Board (“FASB”) has defined fair value as the price that would be received to sell an asset or paid to transfer a liability in an orderly
transaction between market participants. The following is a description of the valuation methodologies used to determine the fair value of the Account’s investments and investment related mortgage payables. Valuation of Real Estate Properties—Investments in real estate properties are stated at fair value, as determined in accordance with policies and procedures reviewed by the Investment Committee of the Board and in accordance with the responsibilities of the Board as a whole. Accordingly, the Account does not
record depreciation. Determination of fair value involves judgment because the actual fair value of real estate can be determined only by negotiation between the parties in a sales transaction. The Account’s primary objective when valuing its real estate investments will be to produce a valuation that represents a
reasonable estimate of the fair value of its investments. Implicit in the Account’s definition of fair value is the consummation of a sale as of a specified date and the passing of title from seller to buyer under conditions whereby:
•
Buyer and seller are typically motivated; • Both parties are well informed or well advised, and acting in what they consider their best interests; • A reasonable time is allowed for exposure in the open market; • Payment is made in terms of cash or in terms of financial arrangements comparable thereto; and • The price represents the normal consideration for the property sold unaffected by special or creative financing or sales concessions granted by anyone associated with the sale. Property and investment values are affected by, among other things, the availability of capital, occupancy rates, rental rates, and interest and inflation rates. As a result, determining real estate and investment values involves many assumptions. Key inputs and assumptions include rental income and expense
amounts, related rental income and expense growth rates, discount rates and capitalization rates. Valuation techniques include discounted cash flow analysis, prevailing market capitalization rates or multiples applied to earnings from the property, analysis of recent comparable sales transactions, actual sale
negotiations and bona fide purchase offers received from third parties. Amounts ultimately realized from each investment may vary significantly from the fair value presented. Real estate properties owned by the Account are initially valued based on an independent third party appraisal, as reviewed by TIAA’s internal appraisal staff and as applicable the Account’s independent fiduciary at the time of the closing of the purchase, which may result in a potential unrealized gain or loss 53
reflecting the difference between an investment’s fair value (i.e., exit price) and its cost basis (which is inclusive of transaction costs). Subsequently, each property is appraised each quarter by an independent third party appraiser, reviewed by TIAA’s internal appraisal staff and as applicable the Account’s independent fiduciary. In general, the Account obtains appraisals of its real estate properties spread out throughout the quarter, which is
intended to result in appraisal adjustments, and thus, adjustments to the valuations of its holdings (to the extent such adjustments are made) that happen regularly throughout each quarter and not on one specific day or month in each period. Further, management reserves the right to order an appraisal and/or conduct another valuation outside of the normal quarterly process when facts or circumstances at a specific property change. For example, under certain circumstances a valuation adjustment could be made when the account receives a bona fide
bid for the sale of a property held within the Account or one of the Account’s joint ventures. In addition, adjustments may be made for events or circumstances indicating an impairment of a tenant’s ability to pay amounts due to the Account under a lease (including due to a bankruptcy filing of that tenant).
Alternatively, adjustments may be made to reflect the execution or renewal of a significant lease. Also, adjustments may be made to reflect factors (such as sales values for comparable properties or local employment rate) bearing uniquely on a particular region in which the Account holds properties. TIAA’s
internal appraisal staff oversees the entire appraisal process, in conjunction with the Account’s independent fiduciary (the independent fiduciary is more fully described in the paragraph below). Any differences in the conclusions of TIAA’s internal appraisal staff and the independent appraiser will be reviewed by
the independent fiduciary, which will make a final determination on the matter (which may include ordering a subsequent independent appraisal). The independent fiduciary, Real Estate Research Corporation, has been appointed by a special subcommittee of the Investment Committee of the Board to, among other things, oversee the appraisal process. The independent fiduciary must approve all independent appraisers used by the Account. All appraisals are
performed in accordance with Uniform Standards of Professional Appraisal Practices, the real estate appraisal industry standards created by The Appraisal Foundation. Real estate appraisals are estimates of property values based on a professional’s opinion. Appraisals of properties held outside of the U.S. are
performed in accordance with industry standards commonly applied in the applicable jurisdiction. These independent appraisers are always expected to be MAI-designated members of the Appraisal Institute (or its European equivalent, Royal Institute of Chartered Surveyors) and state certified appraisers from
national or regional firms with relevant property type experience and market knowledge. Under the Account’s current procedures, each independent appraisal firm will be rotated off of a particular property at least every three years, although such appraisal firm may perform appraisals of other Account properties
subsequent to such rotation. Also, the independent fiduciary can require additional appraisals if factors or events have occurred that could materially change a property’s value (including those identified above) and such change is not reflected in the quarterly valuation review, or otherwise to ensure that the Account is valued appropriately.
The independent fiduciary must also approve any valuation change of real estate-related assets where a property’s value changed by more than 6% from the most recent independent annual appraisal, or if the value of the Account would change by more than 4% within any calendar quarter or more than 2% since
the prior calendar month. When a real estate property is subject to a mortgage, the property is valued independently of the mortgage and the property and mortgage fair values are reported separately (see “Valuation of Mortgage Loans Payable” below). The independent fiduciary reviews and approves all
mortgage valuation adjustments before such adjustments are recorded by the Account. The Account continues to use the revised value for each real estate property and mortgage loan payable to calculate the Account’s daily net asset value until the next valuation review or appraisal. Valuation of Real Estate Joint Ventures—Real estate joint ventures are stated at the fair value of the Account’s ownership interests of the underlying entities. The Account’s ownership interests are valued based on the fair value of the underlying real estate, any related mortgage loans payable, and other factors, such
as ownership percentage, ownership rights, buy/sell agreements, distribution provisions and capital call obligations. Upon the disposition of all real estate investments by an investee entity, the Account will continue to state its equity in the remaining net assets of the investee entity during the wind down period, if
any, which occurs prior to the dissolution of the investee entity. 54
Valuation of Real Estate Limited Partnerships—Limited partnership interests are stated at the fair value of the Account’s ownership in the partnership which is based on the most recent net asset value of the partnership, as reported by the sponsor. Since market quotations are not readily available, the limited
partnership interests are valued at fair value as determined in good faith under the direction of the Investment Committee of the Board and in accordance with the responsibilities of the Board as a whole. Valuation of Marketable Securities—Equity securities listed or traded on any national market or exchange are valued at the last sale price as of the close of the principal securities market or exchange on which such securities are traded or, if there is no sale, at the mean of the last bid and asked prices on such market
or exchange, exclusive of transaction costs. Debt securities, other than money market instruments, are generally valued at the most recent bid price or the equivalent quoted yield for such securities (or those of comparable maturity, quality and type). Money market instruments, with maturities of one year or less, are valued in the same manner as debt
securities or derived from a pricing matrix. Equity and fixed income securities traded on a foreign exchange or in foreign markets are valued using their closing values under the valuation methods generally accepted in the country where traded, as of the valuation date. This value is converted to U.S. dollars at the exchange rate in effect on the valuation day.
Under certain circumstances (for example, if there are significant movements in the United States markets and there is an expectation the securities traded on foreign markets will adjust based on such movements when the foreign markets open the next day), the Account may adjust the value of equity or fixed
income securities that trade on a foreign exchange or market after the foreign exchange or market has closed. Valuation of Mortgage Loans Receivable—Mortgage loans receivable are stated at fair value and are initially valued at the face amount of the mortgage loan funding. Subsequently, mortgage loans receivable are valued at least quarterly based on market factors, such as market interest rates and spreads for comparable
loans, the liquidity for mortgage loans of similar characteristics, the performance of the underlying collateral and the credit quality of the counterparty. Valuation of Mortgage Loans Payable—Mortgage loans payable are stated at fair value. The estimated fair value of mortgage loans payable are based on the amount at which the liability could be transferred to a third party exclusive of transaction costs. Mortgage loans payable are valued internally by TIAA’s
internal appraisal department, as reviewed by the Account’s independent fiduciary, at least quarterly based on market factors, such as market interest rates and spreads for comparable loans, the performance of the underlying collateral (such as the loan-to-value ratio and the cash flow of the underlying collateral),
the liquidity for mortgage loans of similar characteristics, the maturity date of the loan, the return demands of the market, and the credit quality of the Account. Interest expense for mortgage loans payable is recorded on the accrual basis taking into account the outstanding principal and contractual interest rates. See Note 6—Assets and Liabilities Measured at Fair Value on a Recurring Basis for further discussion and disclosure regarding the determination of the Account’s investments fair values. Foreign currency transactions and translation: Portfolio investments and other assets and liabilities denominated in foreign currencies are translated into U.S. dollars at the exchange rates prevailing at the end of the period. Purchases and sales of securities, income receipts and expense payments made in foreign
currencies are translated into U.S. dollars at the exchange rates prevailing on the respective dates of the transactions. The effect of any changes in foreign currency exchange rates on portfolio investments and mortgage loans payable are included in net realized and unrealized gains and losses on real estate
properties and mortgage loans payable. Net realized gains and losses on foreign currency transactions include disposition of foreign currencies, and currency gains and losses between the accrual and receipt dates of portfolio investment income and between the trade and settlement dates of portfolio investment
transactions. Accumulation and Annuity Funds: The accumulation fund represents the net assets attributable to participants in the accumulation phase of their investment (“Accumulation Fund”). The annuity fund represents the net assets attributable to the participants currently receiving annuity payments (“Annuity Fund”).
The net increase or decrease in net assets from investment operations is apportioned between the accounts based upon their relative daily net asset values. Once an Account participant begins receiving lifetime annuity income benefits, payment levels cannot be reduced as a result of the Account’s adverse mortality
experience. In addition, the contracts pursuant to which the Account is offered are required to stipulate the maximum expense charge for all Account level expenses that can be assessed, which is not to 55
exceed to 2.5% of average net assets per year. The Account pays a fee to TIAA to assume mortality and expense risks. Accounting for Investments: The investments held by the Account are accounted as follows: Real Estate Properties—Rent from real estate properties consists of all amounts earned under tenant operating leases, including base rent, recoveries of real estate taxes and other expenses and charges for miscellaneous services provided to tenants. Rental income is recognized in accordance with the billing terms of
the lease agreements. The Account bears the direct expenses of the real estate properties owned. These expenses include, but are not limited to, fees to local property management companies, property taxes, utilities, maintenance, repairs, insurance, and other operating and administrative costs. An estimate of the
net operating income earned from each real estate property is accrued by the Account on a daily basis and such estimates are adjusted when actual operating results are determined. Real Estate Joint Ventures—The Account has limited ownership interests in various real estate joint ventures (collectively, the “Joint Ventures”). The Account records its contributions as increases to its investments in the Joint Ventures, and distributions from the Joint Ventures are treated as income within income
from real estate joint ventures and limited partnerships in the Account’s Statements of Operations. Distributions that are identified as returns of capital or capital gains or losses are recorded as unrealized gains and realized gains and losses, respectively. Income from the Joint Ventures is recorded based on the
Account’s proportional interest of the income distributed by the Joint Ventures. Income earned by the Joint Venture, but not yet distributed to the Account by the Joint Ventures is recorded as unrealized gains and losses. Limited Partnerships—The Account has limited ownership interests in various private real estate funds (primarily limited partnerships) and a private real estate investment trust (collectively, the “Limited Partnerships”). The Account records its contributions as increases to the investments, and distributions from the
investments are treated as income within income from real estate joint ventures and limited partnerships in the Account’s Statements of Operations. Distributions that are identified as returns of capital or capital gains or losses are recorded as unrealized gains and realized gains and losses, respectively. Unrealized
gains and losses are recorded based upon the changes in the net asset values of the Limited Partnerships as determined from the financial statements of the Limited Partnerships when received by the Account. Prior to the receipt of the financial statements from the Limited Partnerships, the Account estimates the
value of its interest in good faith and will from time to time seek input from the issuer or the sponsor of the investment. Changes in value based on such estimates are recorded by the Account as unrealized gains and losses. Marketable Securities—Transactions in marketable securities are accounted for as of the date the securities are purchased or sold (trade date). Interest income is recorded as earned. Dividend income is recorded on the ex-dividend date within dividend income. Dividends that are identified as returns of capital or
capital gains or losses are recorded as unrealized gains and realized gains or losses, respectively. Realized gains and losses on securities transactions are accounted for on the specific identification method. Realized and Unrealized Gains and Losses—Unrealized gains and losses are recorded as the fair values of the Account’s investments are adjusted, and as discussed within the Real Estate Joint Ventures and Limited Partnership sections above. Realized gains and losses are recorded at the time an investment is sold or a
distribution is received from the Joint Ventures or Limited Partnerships. Real estate transactions are accounted for as of the date on which the purchase or sale transactions for the real estate properties close (settlement date). The Account recognizes a realized gain on the sale of a real estate property to the extent
that the contract sales price exceeds the cost-to-date of the property being sold. A realized loss occurs when the cost-to-date exceeds the sales price. Net Assets—The Account’s net assets as of the close of each valuation day are valued by taking the sum of:
•
the value of the Account’s cash; cash equivalents, and short-term and other debt instruments; • the value of the Account’s other securities and other non-real estate assets; • the value of the individual real properties (based on the most recent valuation of that property) and other real estate-related investments owned by the Account; • an estimate of the net operating income accrued by the Account from its properties, other real estate-related investments and non real estate-related investments (including short-term marketable securities) since the end of the prior valuation day; and 56
• actual net operating income earned from the Account’s properties, other real estate-related investments and non real estate-related investments (but only to the extent any such item of income differs from the estimated income accrued for on such investments). and then reducing the sum by liabilities held within the Account, including the daily investment management fee, administration and distribution fees and certain other expenses attributable to operating the Account. After the end of every quarter, the Account reconciles the amount of expenses deducted from the Account (which is established in order to approximate the costs that the Account will incur) with the expenses the Account actually incurred. If there is a difference, the Account adds it to or deducts it from the
Account in equal daily installments over the remaining days of the following quarter. Material differences may be repaid in the current calendar quarter. The Account’s at-cost deductions are based on projections of Account assets and overall expenses, and the size of any adjusting payments will be directly affected
by the difference between management’s projections and the Account’s actual assets or expenses. Federal Income Taxes: Based on provisions of the Internal Revenue Code, Section 817, the Account is taxed as a segregated asset account of TIAA and as such, the Account should incur no material federal income tax attributable to the net investment activity of the Account. Management has concluded that the
Account does not have any uncertain tax positions as of December 31, 2010. New Accounting Pronouncements In June 2009, the FASB issued Statement of Financial Accounting Standards No. 167, Amendments to FASB Interpretation No. 46(R) (“SFAS No. 167”), which amends guidance related to the identification of a variable interest entity, variable interests, the primary beneficiary, and expands required note
disclosures to provide greater transparency to the users of financial statements. In December 2009, the FASB issued Accounting Standards Update (“ASU”) No. 2009-17, “Improvements to Financial Reporting by Enterprises Involved with Variable Interest Entities,” which amended the Codification with the
guidance contained in SFAS No. 167. In February 2010, the FASB issued ASU No. 2010-10, “Amendments for Certain Investment Funds,” which defers the applicability of ASU No. 2009-17 in certain instances. These standards were effective on January 1, 2010 and did not result in a significant impact to the
Account’s financial position or results of operations. In January 2010, the FASB issued ASU No. 2010-06, “Improving Disclosures about Fair Value Measurements” which requires new disclosures related to transfers in and out of levels 1 and 2, and the separate disclosure of purchases, sales, issuances and settlements when reconciling activity in level 3. This ASU also
amends prior disclosure requirements to call for the disaggregation of assets and liabilities into appropriate subsets, and the disclosure of valuation techniques and inputs for recurring and nonrecurring fair value measurements in levels 2 and 3. The new disclosure requirement for reconciling level 3 activity is
effective January 1, 2011. All other new or amended disclosure requirements were effective January 1, 2010 for the Account and are reflected in the notes to the financial statements. These changes did not impact the Account’s financial position or results of operations. ITEM 7A. QUANTITATIVE AND QUALITATIVE DISCLOSURES ABOUT MARKET RISK. The Account’s real estate holdings, including real estate joint ventures and limited partnerships, which, as of December 31, 2010, represented 77.1% of the Account’s total investments, expose the Account to a variety of risks. These risks include, but are not limited to:
•
General Real Estate Risk—The risk that the Account’s property values or rental and occupancy rates could go down due to general economic conditions, a weak market for real estate generally, disruptions in the credit and/or capital markets, or changing supply and demand for certain types of properties; • Appraisal Risk—The risk that the sale price of an Account property (i.e., the value that would be determined by negotiations between independent parties) might differ substantially from its estimated or appraised value, leading to losses or reduced profits to the Account upon sale; • Risk Relating to Property Sales—The risk that the Account might not be able to sell a property at a particular time for its full value, particularly in a poor market. This might make it difficult to raise cash quickly and also could lead to Account losses; 57
• Risks of Borrowing—The risk that interest rate changes may impact Account returns if the Account takes out a mortgage on a property, buys a property subject to a mortgage or holds a property subject to a mortgage; and • Foreign Currency Risk—The risk that the value of the Account’s foreign investments, related debt, or rental income could increase or decrease due to changes in foreign currency exchange rates or foreign currency exchange control regulations, and hedging against such changes, if undertaken by the Account,
may entail additional costs and be unsuccessful. The Account believes the diversification of its real estate portfolio, both geographically and by sector, along with its quarterly valuation procedure, helps manage the real estate and appraisal risks described above. As of December 31, 2010, 22.9% of the Account’s total investments were comprised of marketable securities. As of December 31, 2010, marketable securities include high-quality debt instruments (i.e., government agency notes) and REIT securities. The Statement of Investments for the Account sets forth the
general financial terms of these instruments, along with their fair values, as determined in accordance with procedures described earlier in Critical Accounting Policies section above and in Note 1—Organization and Significant Accounting Policies to the Account’s financial statements included herewith. The Account’s
marketable securities are considered held for trading purposes. Currently, the Account does not invest in derivative financial investments, nor does the Account engage in any hedging activity. Risks associated with investments in real estate-related liquid assets (which could include, from time to time, REIT securities and CMBS), and non-real estate-related liquid assets, including financial/credit risk, market volatility risk, interest rate volatility risk and deposit/money market risk.
•
Financial/Credit Risk—The risk, for debt securities, that the issuer will not be able to pay principal and interest when due (and/or declare bankruptcy or be subject to receivership) and, for equity securities such as common or preferred stock, that the issuer’s current earnings will fall or that its overall financial
soundness will decline, reducing the security’s value. • Market Volatility Risk—The risk that the Account’s investments will experience price volatility due to changing conditions in the financial markets regardless of the credit quality or financial condition of the underlying issuer. This risk is particularly acute to the extent the Account holds equity securities, which
have experienced significant short-term price volatility over the past year. Also, to the extent the Account holds debt securities; changes in overall interest rates can cause price fluctuations. • Interest Rate Volatility—The risk that interest rate volatility may affect the Account’s current income from an investment. • Deposit/Money Market Risk—The risk that, to the extent the Account’s cash held in bank deposit accounts exceeds federally insured limits as to that bank, the Account could experience losses if banks fail. The Account does not believe it has exposure to significant concentration of deposit risk. In addition,
there is some risk that investments held in money market accounts can suffer losses. In addition, to the extent the Account were to hold mortgage-backed securities (including commercial mortgage-backed securities) these securities are subject to prepayment risk or extension risk (i.e., the risk that borrowers will repay the loans earlier or later than anticipated). If the underlying mortgage assets
experience faster than anticipated repayments of principal, the Account could fail to recoup some or all of its initial investment in these securities, since the original price paid by the Account was based in part on assumptions regarding the receipt of interest payments. If the underlying mortgage assets are repaid
later than anticipated, the Account could lose the opportunity to reinvest the anticipated cash flows at a time when interest rates might be rising. The rate of prepayment depends on a variety of geographic, social and other functions, including prevailing market interest rates and general economic factors. The
market value of these securities is also highly sensitive to changes in interest rates. Note that the potential for appreciation, which could otherwise be expected to result from a decline in interest rates, may be limited by any increased prepayments. These securities may be harder to sell than other securities. In addition to these risks, real estate equity securities (such as REIT stocks and mortgage-backed securities) would be subject to many of the same general risks inherent in real estate investing, making mortgage loans and investing in debt securities. For more information on the risks associated with all of the
Account’s investments, see Item 1.A. “Risk Factors” in this Form 10-K. 58
ITEM 8. FINANCIAL STATEMENTS AND SUPPLEMENTARY DATA. INDEX TO FINANCIAL STATEMENTS
Page
60
61
62
63
64
65
66
82
91 59
TIAA REAL ESTATE ACCOUNT
REPORT OF MANAGEMENT RESPONSIBILITY To the Participants of the The accompanying financial statements of the TIAA Real Estate Account (“Account”) of Teachers Insurance and Annuity Association of America (“TIAA”) are the responsibility of TIAA’s management. They have been prepared in accordance with accounting principles generally accepted in the United States of
America and have been presented fairly and objectively in accordance with such principles. TIAA has established and maintains an effective system of internal controls over financial reporting designed to provide reasonable assurance that assets are properly safeguarded, that transactions are properly executed in accordance with management’s authorization, and to carry out the ongoing responsibilities of
management for reliable financial statements. In addition, TIAA’s internal audit personnel provide regular reviews and assessments of the internal controls and operations of the Account, and the Senior Vice President of Internal Audit regularly reports to the Audit Committee of the TIAA Board of Trustees. The independent registered public accounting firm of PricewaterhouseCoopers LLP has audited the accompanying financial statements for the years ended December 31, 2010, 2009 and 2008. To maintain auditor independence and avoid even the appearance of a conflict of interest, it continues to be the Account’s
policy (consistent with TIAA’s specific auditor independence policies, which are designed to avoid such conflicts) that any management advisory or consulting services would be obtained from a firm other than the independent accounting firm. The independent auditors’ report expresses an independent opinion on
the fairness of presentation of the Account’s financial statements. The Audit Committee of the TIAA Board of Trustees, comprised entirely of independent, non-management trustees, meets regularly with management, representatives of the independent registered public accounting firm and internal audit group personnel to review matters relating to financial reporting, internal
controls and auditing. In addition to the annual independent audit of the Account’s financial statements, the New York State Insurance Department and other state insurance departments regularly examine the operations and financial statements of the Account as part of their periodic corporate examinations.
March 17, 2011
/s/ Roger W. Ferguson, Jr.
Roger W. Ferguson, Jr.
/s/ Virginia M. Wilson
Virginia M. Wilson 60
TIAA Real Estate Account:
President and
Chief Executive Officer
Executive Vice President and
Chief Financial Officer
To the Participants of the The TIAA Audit Committee (“Committee”) oversees the financial reporting process of the TIAA Real Estate Account (“Account”) on behalf of TIAA’s Board of Trustees. The Committee operates in accordance with a formal written charter (copies of which are available upon request) which describes the Audit
Committee’s responsibilities. All members of the Committee are independent, as defined under the listing standards of the New York Stock Exchange. Management has the primary responsibility for the Account’s financial statements, development and maintenance of a strong system of internal controls and disclosure controls, and compliance with applicable laws and regulations. In fulfilling its oversight responsibilities, the Committee reviewed and approved the
audit plans of the internal audit group and the independent registered public accounting firm in connection with their respective audits of the Account. The Committee also meets regularly with the internal audit group and the independent registered public accounting firm, both with and without management
present, to discuss the results of their examinations, their evaluation of internal controls, and the overall quality of financial reporting. As required by its charter, the Committee will evaluate rotation of the independent registered public accounting firm whenever circumstances warrant, but in no event will the
evaluation be later than between their fifth and tenth years of service. The Committee reviewed and discussed the accompanying audited financial statements with management, including a discussion of the quality and appropriateness of the accounting principles and financial reporting practices followed, the reasonableness of significant judgments, and the clarity and completeness of
disclosures in the financial statements. The Committee has also discussed the audited financial statements with PricewaterhouseCoopers LLP, the independent registered public accounting firm responsible for expressing an opinion on the conformity of these audited financial statements with accounting principles
generally accepted in the United States of America. The discussion with PricewaterhouseCoopers LLP focused on their judgments concerning the quality and appropriateness of the accounting principles and financial reporting practices followed by the Account, the clarity and completeness of the financial statements and related disclosures, and other significant
matters, such as any significant changes in accounting policies, internal controls, management judgments and estimates, and the nature of any uncertainties or unusual transactions. In addition, the Committee discussed with PricewaterhouseCoopers LLP the auditors’ independence from management and the
Account, and has received a written disclosure regarding such independence, as required by the Securities and Exchange Commission. Based on the review and discussions referred to above, the Committee has approved the release of the accompanying audited financial statements for publication and filing with appropriate regulatory authorities. Rosalie J. Wolf, Audit Committee Chair March 17, 2011 61
TIAA Real Estate Account:
Jeffrey R. Brown, Audit Committee Member
Lawrence H. Linden, Audit Committee Member
Donald K. Peterson, Audit Committee Member
David L. Shedlarz, Audit Committee Member
TIAA REAL ESTATE ACCOUNT
December 31,
December 31, ASSETS Investments, at fair value: Real estate properties
$
8,115,516
$
7,437,344 Real estate joint ventures and limited partnerships
1,629,110
1,514,876 Marketable securities: Real estate related
495,294
— Other
2,396,746
671,267 Mortgage loan receivable
—
71,273 Total investments
12,636,666
9,694,760 Cash and cash equivalents
12,932
24,859 Due from investment advisor
11,054
4,290 Other
179,310
188,794 TOTAL ASSETS
12,839,962
9,912,703 LIABILITIES Mortgage loans payable, at fair value—Note 9
1,860,157
1,858,110 Payable for securities transactions
—
49 Accrued real estate property level expenses
153,742
151,808 Security deposits held
22,923
22,822 TOTAL LIABILITIES
2,036,822
2,032,789 COMMITMENTS AND CONTINGENCIES—Note 12 NET ASSETS Accumulation Fund
10,535,737
7,636,115 Annuity Fund
267,403
243,799 TOTAL NET ASSETS
$
10,803,140
$
7,879,914 NUMBER OF ACCUMULATION UNITS OUTSTANDING—
48,070
39,473 NET ASSET VALUE, PER ACCUMULATION UNIT—Note 10
$
219.173
$
193.454 See notes to the financial statements. 62
STATEMENTS OF ASSETS AND LIABILITIES
(In thousands, except per accumulation unit amounts)
2010
2009
(cost: $9,449,056 and $9,408,978)
(cost: $2,223,304 and $2,437,795)
(cost: $480,363 and $–)
(cost: $2,396,615 and $671,235)
(cost: $– and $75,000)
(cost: $14,549,338 and $12,593,008)
(principal outstanding: $1,842,914 and $1,907,090)
Notes 10 and 11
TIAA REAL ESTATE ACCOUNT
Years Ended December 31,
2010
2009
2008 INVESTMENT INCOME Real estate income, net: Rental income
$
862,529
$
948,315
$
979,295 Real estate property level expenses and taxes: Operating expenses
219,976
238,705
257,351 Real estate taxes
114,653
128,734
132,979 Interest expense
106,738
101,219
88,531 Total real estate property level expenses and taxes
441,367
468,658
478,861 Real estate income, net
421,162
479,657
500,434 Income from real estate joint ventures and limited partnerships
89,268
114,578
116,889 Interest
2,963
1,733
76,444 Dividends
5,618
—
5,079 TOTAL INVESTMENT INCOME
519,011
595,968
698,846 Expenses—Note 2: Investment advisory charges
50,225
42,521
47,622 Administrative charges
22,081
28,026
58,080 Distribution charges
5,980
7,779
19,497 Mortality and expense risk charges
4,373
4,736
8,116 Liquidity guarantee charges
13,120
12,411
19,725 TOTAL EXPENSES
95,779
95,473
153,040 INVESTMENT INCOME, NET
423,232
500,495
545,806 NET REALIZED AND UNREALIZED GAIN (LOSS) ON INVESTMENTS AND MORTGAGE LOANS PAYABLE Net realized gain (loss) on investments: Real estate properties
(12,508
)
(281,798
)
(18,097
) Real estate joint ventures and limited partnerships
(185,753
)
—
(17
) Marketable securities
429
1
(11,041
) Mortgage loans payable
—
(371
)
— Net realized (loss) on investments
(197,832
)
(282,168
)
(29,155
) Net change in unrealized appreciation (depreciation) on: Real estate properties
638,183
(2,244,931
)
(1,905,930
) Real estate joint ventures and limited partnerships
357,477
(1,030,179
)
(702,797
) Marketable securities
15,032
22
15,820 Mortgage loans receivable
3,727
(494
)
(753
) Mortgage loans payable
(59,619
)
(54,755
)
109,791 Net change in unrealized appreciation (depreciation) on investments and mortgage loans payable
954,800
(3,330,337
)
(2,483,869
) NET REALIZED AND UNREALIZED
756,968
(3,612,505
)
(2,513,024
) NET INCREASE (DECREASE) IN NET ASSETS
$
1,180,200
$
(3,112,010
)
$
(1,967,218
) See notes to the financial statements. 63
STATEMENTS OF OPERATIONS
(In thousands)
GAIN (LOSS) ON INVESTMENTS
AND MORTGAGE LOANS PAYABLE
RESULTING FROM OPERATIONS
TIAA REAL ESTATE ACCOUNT
Years Ended December 31,
2010
2009
2008 FROM OPERATIONS Investment income, net
$
423,232
$
500,495
$
545,806 Net realized loss on investments
(197,832
)
(282,168
)
(29,155
) Net change in unrealized appreciation (depreciation) on investments and mortgage loans payable
954,800
(3,330,337
)
(2,483,869
) NET INCREASE (DECREASE) IN NET ASSETS
1,180,200
(3,112,010
)
(1,967,218
) FROM PARTICIPANT TRANSACTIONS Premiums
2,594,502
1,065,801
1,985,661 Purchase of Liquidity Units by TIAA
—
1,058,700
155,600 Annuity payments
(19,121
)
(26,872
)
(35,834
) Withdrawals and death benefits
(832,355
)
(2,614,629
)
(6,289,822
) NET INCREASE (DECREASE) IN NET
1,743,026
(517,000
)
(4,184,395
) NET INCREASE (DECREASE) IN NET ASSETS
2,923,226
(3,629,010
)
(6,151,613
) NET ASSETS Beginning of period
7,879,914
11,508,924
17,660,537 End of period
$
10,803,140
$
7,879,914
$
11,508,924 See notes to the financial statements. 64
STATEMENTS OF CHANGES IN NET ASSETS
(In thousands)
RESULTING FROM OPERATIONS
ASSETS RESULTING FROM
PARTICIPANT TRANSACTIONS
TIAA REAL ESTATE ACCOUNT
Years Ended December 31,
2010
2009
2008 CASH FLOWS FROM OPERATING ACTIVITIES Net increase (decrease) in net assets resulting from operations
$
1,180,200
$
(3,112,010
)
$
(1,967,218
) Adjustments to reconcile net increase (decrease) in net assets resulting from operations to net cash (used in) provided by operating activities: Net realized loss on investments
197,832
282,168
29,155 Net change in unrealized (appreciation) depreciation on investments and mortgage loans payable
(954,800
)
3,330,337
2,483,869 Purchase of real estate properties
—
—
(164,104
) Capital improvements on real estate properties
(130,367
)
(141,493
)
(131,926
) Proceeds from sale of real estate properties
91,882
408,794
93,113 Proceeds from mortgage loan receivable
75,000
—
— Proceeds from long term investments
97,239
—
480,952 Purchases of long term investments
(598,299
)
(81,308
)
(61,041
) (Increase) decrease in other investments
(1,646,761
)
(160,084
)
2,864,516 Decrease in payable for securities transactions
(49
)
(59
)
(758
) Change in due (from) to investment advisor
(6,764
)
(14,182
)
21,088 Decrease (increase) in other assets
8,744
14,319
(1,290
) (Decrease) increase in accrued real estate property level expenses
(11,340
)
(1,900
)
6,801 Increase (decrease) in security deposits held
101
(1,294
)
(516
) NET CASH (USED IN) PROVIDED BY
(1,697,382
)
523,288
3,652,641 CASH FLOWS FROM FINANCING ACTIVITIES Mortgage loans proceeds received
273,255
—
548,567 Principal payments of mortgage loans payable
(330,826
)
(3,556
)
(830
) Premiums
2,594,502
1,065,801
1,985,661 Purchase of Liquidity Units by TIAA
—
1,058,700
155,600 Annuity payments
(19,121
)
(26,872
)
(35,834
) Withdrawals and death benefits
(832,355
)
(2,614,629
)
(6,289,822
) NET CASH PROVIDED BY
1,685,455
(520,556
)
(3,636,658
) NET (DECREASE) INCREASE IN
(11,927
)
2,732
15,983 CASH AND CASH EQUIVALENTS Beginning of period
24,859
22,127
6,144 End of period
$
12,932
$
24,859
$
22,127 SUPPLEMENTAL DISCLOSURES: Cash paid for interest
$
106,075
$
102,572
$
88,723 Debt transferred in sale of property
$
—
$
(23,500
)
$
— See notes to the financial statements. 65
STATEMENTS OF CASH FLOWS
(In thousands)
OPERATING ACTIVITIES
(USED IN) FINANCING ACTIVITIES
CASH AND CASH EQUIVALENTS
TIAA REAL ESTATE ACCOUNT Note 1—Organization and Significant Accounting Policies Business: The TIAA Real Estate Account (“Account”) is a segregated investment account of Teachers Insurance and Annuity Association of America (“TIAA”) and was established by resolution of TIAA’s Board of Trustees (the “Board”) on February 22, 1995, under the insurance laws of the State of New York,
for the purpose of funding variable annuity contracts issued by TIAA. The Account offers individual and group accumulating annuity contracts (with contributions made on a pre-tax or after-tax basis), as well as individual lifetime and term-certain variable payout annuity contracts (including the payment of death
benefits to beneficiaries). Investors are entitled to transfer funds to or from the Account, and make withdrawals from the Account on a daily basis under certain circumstances. Funds invested in the Account for each category of contract are expressed in terms of units, and unit values will fluctuate depending on the
Account’s performance. The investment objective of the Account is a favorable long-term rate of return primarily through rental income and capital appreciation from real estate and real estate-related investments owned by the Account. The Account holds real estate properties directly and through subsidiaries wholly owned by TIAA for
the benefit of the Account. The Account also holds interests in real estate joint ventures and limited partnerships in which the Account does not hold a controlling interest; as such, such interests are not consolidated into these financial statements. The Account also has invested in mortgage loans receivable
collateralized by commercial real estate properties. Additionally, the Account invests in real estate-related and non real estate-related publicly-traded securities, cash and other instruments to maintain adequate liquidity levels for operating expenses, capital expenditures and to fund benefit payments (withdrawals,
transfers and related transactions). The financial statements were prepared in accordance with accounting principles generally accepted in the United States of America, which may require the use of estimates made by management. Actual results may vary from those estimates and such differences may be material. The following is a summary of the
significant accounting policies of the Account. Basis of Presentation: The accompanying financial statements include the Account and those subsidiaries wholly owned by TIAA for the benefit of the Account. All significant intercompany accounts and transactions between the Account and such subsidiaries have been eliminated. Determination of Investments at Fair Value: The Account reports all investments and investment related mortgage loans payable at fair value. The Financial Accounting Standards Board (“FASB”) has defined fair value as the price that would be received to sell an asset or paid to transfer a liability in an orderly
transaction between market participants. The following is a description of the valuation methodologies used to determine the fair value of the Account’s investments and investment related mortgage payables. Valuation of Real Estate Properties—Investments in real estate properties are stated at fair value, as determined in accordance with policies and procedures reviewed by the Investment Committee of the Board and in accordance with the responsibilities of the Board as a whole. Accordingly, the Account does not
record depreciation. Determination of fair value involves significant levels of judgment because the actual fair value of real estate can be determined only by negotiation between the parties in a sales transaction. The Account’s primary objective when valuing its real estate investments will be to produce a valuation
that represents a reasonable estimate of the fair value of its investments. Implicit in the Account’s definition of fair value is the consummation of a sale as of a specified date and the passing of title from seller to buyer under conditions whereby:
•
Buyer and seller are typically motivated; • Both parties are well informed or well advised, and acting in what they consider their best interests; • A reasonable time is allowed for exposure in the open market; 66
NOTES TO THE FINANCIAL STATEMENTS
• Payment is made in terms of cash or in terms of financial arrangements comparable thereto; and • The price represents the normal consideration for the property sold unaffected by special or creative financing or sales concessions granted by anyone associated with the sale. Property and investment values are affected by, among other things, the availability of capital, occupancy rates, rental rates, and interest and inflation rates. As a result, determining real estate and investment values involves many assumptions. Key inputs and assumptions include rental income and expense
amounts, related rental income and expense growth rates, discount rates and capitalization rates. Valuation techniques include discounted cash flow analysis, prevailing market capitalization rates or multiples applied to earnings from the property, analysis of recent comparable sales transactions, actual sale
negotiations and bona fide purchase offers received from third parties. Amounts ultimately realized from each investment may vary significantly from the fair value presented. Real estate properties owned by the Account are initially valued based on an independent third party appraisal, as reviewed by TIAA’s internal appraisal staff and as applicable the Account’s independent fiduciary at the time of the closing of the purchase, which may result in a potential unrealized gain or loss
reflecting the difference between an investment’s fair value (i.e., exit price) and its cost basis (which is inclusive of transaction costs). Subsequently, each property is appraised each quarter by an independent third party appraiser, reviewed by TIAA’s internal appraisal staff and as applicable the Account’s independent fiduciary. In general, the Account obtains appraisals of its real estate properties spread out throughout the quarter, which is
intended to result in appraisal adjustments, and thus, adjustments to the valuations of its holdings (to the extent such adjustments are made) that happen regularly throughout each quarter and not on one specific day or month in each period. Further, management reserves the right to order an appraisal and/or conduct another valuation outside of the normal quarterly process when facts or circumstances at a specific property change. For example, under certain circumstances a valuation adjustment could be made when the account receives a bona fide
bid for the sale of a property held within the Account or one of the Account’s joint ventures. In addition, adjustments may be made for events or circumstances indicating an impairment of a tenant’s ability to pay amounts due to the Account under a lease (including due to a bankruptcy filing of that tenant).
Alternatively, adjustments may be made to reflect the execution or renewal of a significant lease. Also, adjustments may be made to reflect factors (such as sales values for comparable properties or local employment rate) bearing uniquely on a particular region in which the Account holds properties. TIAA’s
internal appraisal staff oversees the entire appraisal process, in conjunction with the Account’s independent fiduciary (the independent fiduciary is more fully described in the paragraph below). Any differences in the conclusions of TIAA’s internal appraisal staff and the independent appraiser will be reviewed by
the independent fiduciary, which will make a final determination on the matter (which may include ordering a subsequent independent appraisal). The independent fiduciary, Real Estate Research Corporation has been appointed by a special subcommittee of the Investment Committee of the Board to, among other things, oversee the appraisal process. The independent fiduciary must approve all independent appraisers used by the Account. All appraisals are
performed in accordance with Uniform Standards of Professional Appraisal Practices, the real estate appraisal industry standards created by The Appraisal Foundation. Real estate appraisals are estimates of property values based on a professional’s opinion. Appraisals of properties held outside of the U.S. are
performed in accordance with industry standards commonly applied in the applicable jurisdiction. These independent appraisers are always expected to be MAI-designated members of the Appraisal Institute (or its European equivalent, Royal Institute of Chartered Surveyors) and state certified appraisers from
national or regional firms with relevant property type experience and market knowledge. Under the Account’s current procedures, each independent appraisal firm will be rotated off of a particular property at least every three years, although such appraisal firm may perform appraisals of other Account properties
subsequent to such rotation. Also, the independent fiduciary can require additional appraisals if factors or events have occurred that could materially change a property’s value (including those identified above) and such change is not reflected in the quarterly valuation review, or otherwise to ensure that the Account is valued appropriately.
The independent fiduciary must also approve any valuation change of real estate-related assets where a property’s value 67
changed by more than 6% from the most recent independent annual appraisal, or if the value of the Account would change by more than 4% within any calendar quarter or more than 2% since the prior calendar month. When a real estate property is subject to a mortgage, the property is valued independently of
the mortgage and the property and mortgage fair values are reported separately (see “Valuation of Mortgage Loans Payable” below). The independent fiduciary reviews and approves all mortgage valuation adjustments before such adjustments are recorded by the Account. The Account continues to use the revised
value for each real estate property and mortgage loan payable to calculate the Account’s daily net asset value until the next valuation review or appraisal. Valuation of Real Estate Joint Ventures—Real estate joint ventures are stated at the fair value of the Account’s ownership interests of the underlying entities. The Account’s ownership interests are valued based on the fair value of the underlying real estate, any related mortgage loans payable, and other factors, such
as ownership percentage, ownership rights, buy/sell agreements, distribution provisions and capital call obligations. Upon the disposition of all real estate investments by an investee entity, the Account will continue to state its equity in the remaining net assets of the investee entity during the wind down period, if
any, which occurs prior to the dissolution of the investee entity. Valuation of Real Estate Limited Partnerships—Limited partnership interests are stated at the fair value of the Account’s ownership in the partnership which is based on the most recent net asset value of the partnership, as reported by the sponsor. Since market quotations are not readily available, the limited
partnership interests are valued at fair value as determined in good faith under the direction of the Investment Committee of the Board and in accordance with the responsibilities of the Board as a whole. Valuation of Marketable Securities—Equity securities listed or traded on any national market or exchange are valued at the last sale price as of the close of the principal securities market or exchange on which such securities are traded or, if there is no sale, at the mean of the last bid and asked prices on such market
or exchange, exclusive of transaction costs. Debt securities, other than money market instruments, are generally valued at the most recent bid price or the equivalent quoted yield for such securities (or those of comparable maturity, quality and type). Money market instruments, with maturities of one year or less, are valued in the same manner as debt
securities or derived from a pricing matrix. Equity and fixed income securities traded on a foreign exchange or in foreign markets are valued using their closing values under the valuation methods generally accepted in the country where traded, as of the valuation date. This value is converted to U.S. dollars at the exchange rate in effect on the valuation day.
Under certain circumstances (for example, if there are significant movements in the United States markets and there is an expectation the securities traded on foreign markets will adjust based on such movements when the foreign markets open the next day), the Account may adjust the value of equity or fixed
income securities that trade on a foreign exchange or market after the foreign exchange or market has closed. Valuation of Mortgage Loans Receivable—Mortgage loans receivable are stated at fair value and are initially valued at the face amount of the mortgage loan funding. Subsequently, mortgage loans receivable are valued at least quarterly based on market factors, such as market interest rates and spreads for comparable
loans, the liquidity for mortgage loans of similar characteristics, the performance of the underlying collateral and the credit quality of the counterparty. Valuation of Mortgage Loans Payable—Mortgage loans payable are stated at fair value. The estimated fair values of mortgage loans payable are based on the amount at which the liability could be transferred to a third party exclusive of transaction costs. Mortgage loans payable are valued internally by TIAA’s
internal appraisal department, as reviewed by the Account’s independent fiduciary, at least quarterly based on market factors, such as market interest rates and spreads for comparable loans, the performance of the underlying collateral (such as the loan-to-value ratio and the cash flow of the underlying collateral),
the liquidity for mortgage loans of similar characteristics, the maturity date of the loan, the return demands of the market, and the credit quality of the Account. Interest expense for mortgage loans payable is recorded on the accrual basis taking into account the outstanding principal and contractual interest rates. See Note 6—Assets and Liabilities Measured at Fair Value on a Recurring Basis for further discussion and disclosure regarding the determination of the fair value of the Account’s investments. 68
Foreign currency transactions and translation: Portfolio investments and other assets and liabilities denominated in foreign currencies are translated into U.S. dollars at the exchange rates prevailing at the end of the period. Purchases and sales of securities, income receipts and expense payments made in foreign
currencies are translated into U.S. dollars at the exchange rates prevailing on the respective dates of the transactions. The effect of any changes in foreign currency exchange rates on portfolio investments and mortgage loans payable are included in net realized and unrealized gains and losses on real estate
properties and mortgage loans payable. Net realized gains and losses on foreign currency transactions include disposition of foreign currencies, and currency gains and losses between the accrual and receipt dates of portfolio investment income and between the trade and settlement dates of portfolio investment
transactions. Accumulation and Annuity Funds: The accumulation fund represents the net assets attributable to participants in the accumulation phase of their investment (“Accumulation Fund”). The annuity fund represents the net assets attributable to the participants currently receiving annuity payments (“Annuity Fund”).
The net increase or decrease in net assets from investment operations is apportioned between the accounts based upon their relative daily net asset values. Once an Account participant begins receiving lifetime annuity income benefits, payment levels are not adjusted as a result of the Account’s mortality
experience. In addition, the contracts pursuant to which the Account is offered are required to stipulate the maximum expense charge for all Account level expenses that can be assessed, which is not to exceed to 2.5% of average net assets per year. The Account pays a fee to TIAA to assume mortality and expense
risks. Accounting for Investments: The investments held by the Account are accounted as follows: Real Estate Properties—Rent from real estate properties consists of all amounts earned under tenant operating leases, including base rent, recoveries of real estate taxes and other expenses and charges for miscellaneous services provided to tenants. Rental income is recognized in accordance with the billing terms of
the lease agreements. The Account bears the direct expenses of the real estate properties owned. These expenses include, but are not limited to, fees to local property management companies, property taxes, utilities, maintenance, repairs, insurance, and other operating and administrative costs. An estimate of the
net operating income earned from each real estate property is accrued by the Account on a daily basis and such estimates are adjusted when actual operating results are determined. Real Estate Joint Ventures—The Account has limited ownership interests in various real estate joint ventures (collectively, the “Joint Ventures”). The Account records its contributions as increases to its investments in the Joint Ventures, and distributions from the Joint Ventures are treated as income within income
from real estate joint ventures and limited partnerships in the Account’s Statements of Operations. Distributions that are identified as returns of capital or capital gains or losses are recorded as unrealized gains and realized gains and losses, respectively. Income from the Joint Ventures is recorded based on the
Account’s proportional interest of the income distributed by the Joint Ventures. Income earned by the Joint Venture, but not yet distributed to the Account by the Joint Ventures is recorded as unrealized gains and losses. Limited Partnerships—The Account has limited ownership interests in various private real estate funds (primarily limited partnerships) and a private real estate investment trust (collectively, the “Limited Partnerships”). The Account records its contributions as increases to the investments, and distributions from the
investments are treated as income within income from real estate joint ventures and limited partnerships in the Account’s Statements of Operations. Distributions that are identified as returns of capital or capital gains or losses are recorded as unrealized gains and realized gains and losses, respectively. Unrealized
gains and losses are recorded based upon the changes in the net asset values of the Limited Partnerships as determined from the financial statements of the Limited Partnerships when received by the Account. Prior to the receipt of the financial statements from the Limited Partnerships, the Account estimates the
value of its interest in good faith and will from time to time seek input from the issuer or the sponsor of the investments. Changes in value based on such estimates are recorded by the Account as unrealized gains and losses. Marketable Securities—Transactions in marketable securities are accounted for as of the date the securities are purchased or sold (trade date). Interest income is recorded as earned. Dividend income is recorded on the ex-dividend date within dividend income. Dividends that are identified as returns of capital or
capital gains or losses are recorded as unrealized gains and realized gains and losses, respectively. Realized gains and losses on securities transactions are accounted for on the specific identification method. 69
Realized and Unrealized Gains and Losses—Unrealized gains and losses are recorded as the fair values of the Accounts investments are adjusted, and as discussed within the Real Estate Joint Ventures and Limited Partnership sections above. Realized gains and losses are recorded at the time an investment is sold or a distribution is received from the Joint Ventures or Limited Partnerships. Real estate transactions are accounted for as of the date on which the purchase or sale transactions for the real estate properties close (settlement date). The Account
recognizes a realized gain on the sale of a real estate property to the extent that the contract sales price exceeds the cost-to-date of the property being sold. A realized loss occurs when the cost-to-date exceeds the sales price. Net Assets—The Account’s net assets as of the close of each valuation day are valued by taking the sum of:
•
the value of the Account’s cash; cash equivalents, and short-term and other debt instruments; • the value of the Account’s other securities and other non-real estate assets; • the value of the individual real properties (based on the most recent valuation of that property) and other real estate-related investments owned by the Account; • an estimate of the net operating income accrued by the Account from its properties, other real estate-related investments and non real estate-related investments (including short-term marketable securities) since the end of the prior valuation day; and • actual net operating income earned from the Account’s properties, other real estate-related investments and non real estate-related investments (but only to the extent any such item of income differs from the estimated income accrued for on such investments). and then reducing the sum by liabilities held within the Account, including the daily investment management fee, administration and distribution fees, mortality and expense fee, and liquidity guarantee fee, and certain other expenses attributable to operating the Account. After the end of every quarter, the Account reconciles the amount of expenses deducted from the Account (which is established in order to approximate the costs that the Account will incur) with the expenses the Account actually incurred. If there is a difference, the Account adds it to or deducts it from the
Account in equal daily installments over the remaining days of the following quarter. Material differences may be repaid in the current calendar quarter. The Account’s at-cost deductions are based on projections of Account assets and overall expenses, and the size of any adjusting payments will be directly affected
by the difference between management’s projections and the Account’s actual assets or expenses. Cash and Cash Equivalents: Cash and cash equivalents are balances held by the Account in bank deposit accounts which, at times, exceed federally insured limits. The Account’s management monitors these balances to mitigate the exposure of risk due to concentration and has not experienced any losses from such
concentration. Federal Income Taxes: Based on provisions of the Internal Revenue Code, Section 817, the Account is taxed as a segregated asset account of TIAA and as such, the Account should incur no material federal income tax attributable to the net investment activity of the Account. Management has analyzed the
Account’s tax positions taken for all open federal income tax years (2005-2009) and has concluded no provisions for federal income tax is required as of December 31, 2010. Restricted Cash: The Account held $18.9 million and $12.9 million as of December 31, 2010 and 2009, respectively, in escrow accounts for property taxes, insurance, and various other property related matters as required by certain creditors related to the Account’s outstanding mortgage loans payable. These
amounts are recorded within other assets on the Statements of Assets and Liabilities. See Note 9—Mortgage Loans Payable for additional information regarding the Account’s outstanding mortgage loans payables. Changes in Net Assets: Premiums include premiums paid by existing accumulation unit holders in the Account and transfers into the Account. Withdrawals and death benefits include withdrawals out of the Account which include transfers out of the Account and required minimum distributions. 70
Due from Investment Advisor: Due to/from investment advisor represents amounts that were paid or received by TIAA on behalf of the Account. Amounts generally are paid or received by the Account within one or two business days and no interest is contractually charged on these amounts. Reclassifications: The Account has reclassified the presentation in the statements of changes in net assets with regard to transfers to and from TIAA, CREF Accounts, and TIAA-CREF Funds. Transfers into the Account have been reclassified to Premiums, and transfers out of the Account have been reclassified
amongst annuity and other periodic payments and withdrawals and death benefits as appropriate. Certain other prior period amounts have been reclassified to conform to the current presentation. These reclassifications did not affect the Account’s total net assets, results of operations or net changes in net assets previously reported. Note 2—Management Agreements and Arrangements Investment advisory services for the Account are provided by TIAA employees, under the direction of the Board and its Investment Committee, pursuant to investment management procedures adopted by TIAA for the Account. TIAA’s investment management decisions for the Account are subject to review by
the Account’s independent fiduciary. TIAA also provides all portfolio accounting and related services for the Account. The Account is a party to the Distribution Agreement for the Contracts Funded by the TIAA Real Estate Account (the “Distribution Agreement”), dated January 1, 2008, by and among TIAA, for itself and on behalf of the Account, and TIAA-CREF Individual and Institutional Services, LLC (“Services”), a wholly
owned subsidiary of TIAA, a registered broker-dealer and a member of the Financial Industry Regulatory Authority. Pursuant to the Distribution Agreement, Services performs distribution services for the Account which include, among other things, (i) distribution of annuity contracts issued by TIAA and funded
by the Account, (ii) advising existing annuity contract owners in connection with their accumulations and (iii) helping employers implement and manage retirement plans. In addition, TIAA performs administrative functions for the Account, which include, among other things, (i) computing the Account’s daily unit
value, (ii) maintaining accounting records and performing accounting services, (iii) receiving and allocating premiums, (iv) calculating and making annuity payments, (v) processing withdrawal requests, (vi) providing regulatory compliance and reporting services, (vii) maintaining the Account’s records of contract
ownership and (viii) otherwise assisting generally in all aspects of the Account’s operations. Both distribution services (pursuant to the Distribution Agreement) and administrative services are provided to the Account by Services and TIAA, as applicable, on an at cost basis. The Distribution Agreement is terminable by either party upon 60 days written notice and terminates automatically upon any assignment thereof. TIAA and Services provide their services at cost. TIAA and Services receive payments from the Account on a daily basis according to formulas established each year and adjusted periodically with the objective of keeping the payments as close as possible to the expenses actually incurred. Any differences between
actual expenses and the amounts paid by the Account are adjusted quarterly. TIAA also provides a liquidity guarantee to the Account, for a fee, to ensure that sufficient funds are available to meet participant transfer and cash withdrawal requests in the event that the Account’s cash flows and liquid investments are insufficient to fund such requests. TIAA ensures sufficient funds are
available for such transfer and withdrawal requests by purchasing accumulation units of the Account. See Note 3—Related Party Transactions below. To the extent TIAA owns accumulation units issued pursuant to the liquidity guarantee, the independent fiduciary monitors and oversees, among other things, TIAA’s ownership interest in the Account and may require TIAA to eventually redeem some of its units, particularly when the Account has uninvested
cash or liquid investments available. TIAA also receives a fee for assuming certain mortality and expense risks. The expenses for the services noted above that are provided to the Account by TIAA and Services are identified in the accompanying Statements of Operations and are reflected in Note 10—Condensed Financial Information. 71
Note 3—Related Party Transactions Pursuant to its existing liquidity guarantee obligation, as of December 31, 2010, the TIAA General Account owned 4.7 million accumulation units (which are generally referred to as “liquidity units”) issued by the Account. Since December 2008 and through December 31, 2010, TIAA paid an aggregate of $1.2
billion to purchase these liquidity units in multiple transactions. TIAA has purchased no liquidity units since June 1, 2009. In accordance with this liquidity guarantee obligation, TIAA guarantees that all participants in the Account may redeem their accumulation units at their accumulation unit value next determined after their transfer or cash withdrawal request is received in good order. liquidity units owned by TIAA are valued in
the same manner as accumulation units owned by the Account’s participants. Management believes that TIAA has the ability to meet its obligations under the liquidity guarantee. As discussed in the Account’s prospectus and in accordance with a prohibited transaction exemption from the U.S. Department of Labor (PTE 96-76), the Account’s independent fiduciary, Real Estate Research Corporation, has certain responsibilities with respect to the Account that it has undertaken or is
currently undertaking with respect to TIAA’s purchase of liquidity units, including among other things, reviewing the purchase and redemption of liquidity units by TIAA to ensure the Account uses the correct unit values. In addition, as set forth in PTE 96-76, the independent fiduciary’s responsibilities include:
•
establishing the percentage of total accumulation units that TIAA’s ownership should not exceed (the “trigger point”) and creating a method for changing the trigger point; • approving any adjustment of TIAA’s ownership interest in the Account and, in its discretion, requiring an adjustment if TIAA’s ownership of liquidity units reaches the trigger point; and • once the trigger point has been reached, participating in any program to reduce TIAA’s ownership in the Account by utilizing cash flow or liquid investments in the Account, or by utilizing the proceeds from asset sales. The independent fiduciary’s role in participating in any such asset sales program
would include (i) participating in the selection of properties for sale, (ii) providing sales guidelines and (iii) approving those sales if, in the independent fiduciary’s opinion, such sales are desirable to reduce TIAA’s ownership of liquidity units. The independent fiduciary, which has the right to adjust the trigger point, has established the trigger point at 45% of the outstanding accumulation units and it will continue to monitor TIAA’s ownership interest in the Account and provide further recommendations as necessary. As of December 31, 2010, TIAA
owned 9.8% of the outstanding accumulation units of the Account. As discussed in Note 2—Management Agreements and Arrangements, TIAA and Services provide services to the Account on an at cost basis. See Note 10—Condensed Financial Information for details of the expense charge and expense ratio. Note 4—Credit Risk Concentrations Concentrations of credit risk may arise when a number of properties or tenants are located in a similar geographic region such that the economic conditions of that region could impact tenants’ obligations to meet their contractual obligations or cause the values of individual properties to decline. The Account has
no significant concentrations of tenants as no single tenant has annual contract rent that makes up more than 2% of the rental income of the Account. 72
The substantial majority of the Account’s wholly owned real estate investments and investments in joint ventures are located in the United States. The following table represents the diversification of the Account’s portfolio by region and property type: Diversification by Fair Value(1)
East
West
South
Midwest
Foreign(2)
Total Office
24.5
%
17.5
%
10.4
%
1.2
%
2.7
%
56.3
% Apartment
2.6
%
6.2
%
5.4
%
0.0
%
0.0
%
14.2
% Industrial
1.3
%
7.0
%
4.1
%
1.3
%
0.0
%
13.7
% Retail
3.2
%
0.9
%
8.5
%
0.3
%
2.4
%
15.3
% Storage
0.2
%
0.2
%
0.1
%
0.0
%
0.0
%
0.5
% Total
31.8
%
31.8
%
28.5
%
2.8
%
5.1
%
100.0
%
(1)
Wholly-owned properties are represented at fair value and gross of any debt, while joint venture properties are represented at the net equity value. (2) Represents real estate investments in the United Kingdom and France. Properties in the “East” region are located in: CT, DC, DE, KY, MA, MD, ME, NC, NH, NJ, NY, PA, RI, SC, VA, VT, WV Properties in the “West” region are located in: AK, AZ, CA, CO, HI, ID, MT, NM, NV, OR, UT, WA, WY Properties in the “South” region are located in: AL, AR, FL, GA, LA, MS, OK, TN, TX Properties in the “Midwest” region are located in: IA, IL, IN, KS, MI, MN, MO, ND, NE, OH, SD, WI Note 5—Leases The Account’s wholly owned real estate properties are leased to tenants under operating lease agreements which expire on various dates through 2038. Aggregate minimum annual rentals for the wholly owned properties owned, excluding short-term residential leases, are as follows (in thousands):
Years Ending 2011
$
518,286 2012
472,741 2013
419,681 2014
356,530 2015
273,085 Thereafter
1,009,995 Total
$
3,050,318 Certain leases provide for additional rental amounts based upon the recovery of actual operating expenses in excess of specified base amounts. Note 6—Assets and Liabilities Measured at Fair Value on a Recurring Basis Valuation Hierarchy: The Account’s fair value measurements are grouped categorically into three levels, as defined by the FASB. The levels are defined as follows: Level 1—Valuations using unadjusted quoted prices for assets traded in active markets, such as stocks listed on the New York Stock Exchange. Active markets are defined as having the following characteristics for the measured asset or liability: (i) many transactions, (ii) current prices, (iii) price quotes not varying
substantially among market makers, (iv) narrow bid/ask spreads and (v) most information regarding the issuer is publicly available. Level 1 assets held by the Account are generally marketable equity securities. Level 2—Valuations for assets and liabilities traded in less active, dealer or broker markets. Fair values are primarily obtained from third party pricing services for identical or comparable assets or liabilities. Level 2 73
December 31,
inputs for fair value measurements are inputs, other than quoted prices included within Level 1, that are observable for the asset or liability, either directly or indirectly. Level 2 inputs include: a. Quoted prices for similar assets or liabilities in active markets; b. Quoted prices for identical or similar assets or liabilities in markets that are not active (that is, markets in which there are few transactions for the asset (or liability), the prices are not current, price quotations vary substantially either over time or among market makers (for example, some brokered
markets), or in which little information is released publicly); c. Inputs other than quoted prices that are observable within the market for the asset (or liability) (for example, interest rates and yield curves, volatilities, prepayment speeds, loss severities, credit risks, and default rates that are observable at commonly quoted intervals); and d. Inputs that are derived principally from or corroborated by observable market data by correlation or other means (for example, market-corroborated inputs). Examples of securities which may be held by the Account and included in Level 2 include certificates of deposit, commercial paper, government agency notes, variable notes, United States Treasury securities, and debt securities. Level 3—Valuations for assets and liabilities that are derived from other valuation methodologies, including pricing models, discounted cash flow models and similar techniques, and are not based on market exchange, dealer, or broker-traded transactions. Level 3 valuations incorporate certain assumptions and
projections that are not observable in the market, and require significant professional judgment in determining the fair value assigned to such assets or liabilities. Examples of Level 3 assets and liabilities which may be held by the Account from time to time include investments in real estate, investments in joint
ventures and limited partnerships, and mortgage loans receivable and payable. An investment’s categorization within the valuation hierarchy described above is based upon the lowest level of input that is significant to the fair value measurement. The Account’s determination of fair value is based upon quoted market prices, where available. If listed prices or quotes are not available, fair value is based upon vendor-provided, evaluated prices or internally-developed models that primarily use market-based or independently-sourced market data, including
interest rate yield curves, market spreads, and currency rates. Valuation adjustments will be made to reflect changes in credit quality, counterparty’s creditworthiness, the Account’s creditworthiness, liquidity, and other observable and unobservable inputs that are applied consistently over time. The methods described above are considered to produce fair values that represent a good faith estimate of what an unaffiliated buyer in the marketplace would pay to purchase the asset or would receive to transfer the liability. Since fair value calculations involve significant professional judgment in the application
of both observable and unobservable attributes, actual realizable values or future fair values may differ from amounts reported. Furthermore, while the Account believes its valuation methods are appropriate and consistent with other market participants, the use of different methodologies or assumptions to
determine the fair value of certain financial instruments, while reasonable, could result in different estimates of fair value at the reporting date. As discussed in Note 1—Organization and Significant Accounting Policies in more detail, the Account generally obtains independent third party appraisals on a quarterly
basis; there may be circumstances in the interim in which the true realizable value of a property is not reflected in the Account’s daily net asset value calculation or in the Account’s periodic financial statements. This disparity may be more apparent when the commercial and/or residential real estate markets
experience an overall and possibly dramatic decline (or increase) in property values in a relatively short period of time between appraisals. 74
The following tables show the major categories of assets and liabilities measured at fair value on a recurring basis as of December 31, 2010 and December 31, 2009, using unadjusted quoted prices in active markets for identical assets (Level 1); significant other observable inputs (Level 2); and significant
unobservable inputs (Level 3) (in thousands): Description
Level 1:
Level 2:
Level 3:
Total at Real estate properties
$
—
$
—
$
8,115,516
$
8,115,516 Real estate joint ventures
—
—
1,358,826
1,358,826 Limited partnerships
—
—
270,284
270,284 Marketable securities: Real estate related
495,294
—
—
495,294 Government agency notes
—
1,484,774
—
1,484,774 United States Treasury securities
—
911,972
—
911,972 Total Investments at December 31, 2010
$
495,294
$
2,396,746
$
9,744,626
$
12,636,666 Mortgage loans payable
$
—
$
—
$
(1,860,157
)
$
(1,860,157
) Description
Level 1:
Level 2:
Level 3:
Total at Real estate properties
$
—
$
—
$
7,437,344
$
7,437,344 Real estate joint ventures
—
—
1,314,603
1,314,603 Limited partnerships
—
—
200,273
200,273 Marketable securities: Government agency notes
—
465,092
—
465,092 United States Treasury securities
—
206,175
—
206,175 Mortgage loan receivable
—
—
71,273
71,273 Total Investments at December 31, 2009
$
—
$
671,267
$
9,023,493
$
9,694,760 Mortgage loans payable
$
—
$
—
$
(1,858,110
)
$
(1,858,110
) 75
Quoted
Prices in
Active Markets
for Identical
Assets
Significant
Other
Observable
Inputs
Significant
Unobservable
Inputs
December 31,
2010
Quoted
Prices in
Active Markets
for Identical
Assets
Significant
Other
Observable
Inputs
Significant
Unobservable
Inputs
December 31,
2009
The following tables show the reconciliation of the beginning and ending balances for assets and liabilities measured at fair value on a recurring basis using significant unobservable inputs (Level 3) during the years ended December 31, 2010 and December 31, 2009 (in thousands):
Real Estate
Real Estate
Limited
Mortgage
Total
Mortgage For the year ended Beginning balance
$
7,437,344
$
1,314,603
$
200,273
$
71,273
$
9,023,493
$
(1,858,110
) Total realized and unrealized gains (losses) included in changes in net assets
625,675
106,841
64,883
3,727
801,126
(59,619
) Purchases, sales, issuances, and settlements(1)
52,497
(62,618
)
5,128
(75,000
)
(79,993
)
57,572 Ending balance
$
8,115,516
$
1,358,826
$
270,284
—
$
9,744,626
$
(1,860,157
) For the year ended Beginning balance
$
10,305,040
$
2,176,711
$
286,485
$
71,767
$
12,840,003
$
(1,830,040
) Total realized and unrealized gains (losses) included in changes in net assets
(2,526,729
)
(909,324
)
(120,855
)
(494
)
(3,557,402
)
(55,126
) Purchases, sales, issuances, and settlements(1)
(340,967
)
47,216
34,643
—
(259,108
)
27,056 Ending balance
$
7,437,344
$
1,314,603
$
200,273
$
71,273
$
9,023,493
$
(1,858,110
)
(1)
This line includes the net of contributions, distributions, and accrued operating income for real estate joint ventures and limited partnerships, principal payments received on mortgage loan receivable and principal payments made on mortgage loans payable.
During the years ended December 31, 2010 and 2009 there were no transfers in or out of Levels 1, 2 or 3. The amount of total gains (losses) included in changes in net assets attributable to the change in unrealized gains (losses) relating to investments and mortgage loans payable using significant unobservable inputs still held as of the reporting date is as follows (in thousands):
Real Estate
Real Estate
Limited
Mortgage
Total
Mortgage For the year ended
$
628,044
$
113,326
$
64,883
$
—
$
806,253
$
(59,619
) For the year ended
$
(2,520,545
)
$
(909,324
)
$
(120,855
)
$
(494
)
$
(3,551,218
)
$
(54,881
) Note 7—Investments in Joint Ventures The Account owns interests in several real estate properties through joint ventures and receives distributions and allocations of profits and losses from the joint ventures based on the Account’s ownership interest percentages. Several of these joint ventures have mortgage loans payable on the properties owned by
the joint ventures. At December 31, 2010, the Account held 11 investments in joint ventures with non-controlling ownership interest percentages that ranged from 50% to 85%. Certain joint ventures are subject to adjusted distribution percentages when earnings in the investment reach a pre-determined threshold.
The Account’s equity in the joint ventures at December 31, 2010 and December 31, 2009 was $1.4 billion and $1.3 billion, respectively. The Account’s most significant joint venture investment is with the DDR TC LLC joint venture 76
Properties
Joint
Ventures
Partnerships
Loan
Receivable
Level 3
Investments
Loans
Payable
December 31, 2010
January 1, 2010
December 31, 2010
December 31, 2009
January 1, 2009
December 31, 2009
Properties
Joint
Ventures
Partnerships
Loan
Receivable
Level 3
Investments
Loans
Payable
December 31, 2010
December 31, 2009
(the “DDR Joint Venture”), which is the fifth largest investment in the Account as of December 31, 2010. On July 9, 2010, The Account sold its entire interest in the Teachers REA IV, LLC (Tyson’s Executive Plaza II) joint venture for a sales price of $28.5 million resulting in a realized loss of $3.5 million. The Account’s share of the mortgage loans payable within the joint venture investments at fair value was $1.6 billion and $1.8 billion at December 31, 2010 and December 31, 2009, respectively. The Account’s share in the outstanding principal of the mortgage loans payable on joint ventures was $1.6 billion and $2.0
billion at December 31, 2010 and December 31, 2009, respectively. During 2010, the Account contributed a total of $79.0 million to certain properties within the DDR Joint Venture to fund the Account’s share of debt associated with properties within the DDR Joint Venture that came due and was paid off during 2010. A condensed summary of the financial position and results of operations of the joint ventures are shown below (in thousands):
December 31, 2010
December 31, 2009 Assets Real estate properties, at fair value
$
4,454,893
$
4,618,202 Other assets
141,813
89,569 Total assets
$
4,596,706
$
4,707,771 Liabilities and Equity Mortgage loans payable, at fair value
$
2,276,928
$
2,526,666 Other liabilities
97,525
52,639 Total liabilities
2,374,453
2,579,305 Equity
2,222,253
2,128,466 Total liabilities and equity
$
4,596,706
$
4,707,771
Years Ended December 31,
2010
2009
2008 Operating Revenues and Expenses Revenues
$
466,479
$
519,239
$
562,031 Expenses
287,627
317,428
333,700 Excess of revenues over expenses
$
178,852
$
201,811
$
228,331 Principal payment schedule on mortgage loans payable within the joint ventures as of December 31, 2010 is as follows (in thousands):
Amount 2011*
$
310,369 2012
727,109 2013
96,148 2014
8,168 2015
258,660 Thereafter
931,521 Total maturities
$
2,331,975
*
Includes DDR Joint Venture revolving line of credit.
On April 30, 2010 one of the properties held within the DDR Joint Venture defaulted on its interest payment on the $7.4 million mortgage secured by such property. On April 30, 2010, the loan matured in accordance with its terms and the venture did not make the required pay off on such date. Currently, the
managing member of the venture is in negotiations with the lender regarding such defaults. These defaults on this non-recourse loan did not impact any of the other properties within the venture, the venture itself, or the Account. 77
Management of the Account monitors the financial position of the Account’s joint venture partners. To the extent that management of the Account determines that a joint venture partner has financial or liquidity concerns, management will evaluate all actions and remedies available to the Account under the
applicable joint venture agreement to minimize any potential adverse implications to the Account. Note 8—Investments in Limited Partnerships The Account invests in limited partnerships that own real estate properties and real estate-related securities and the Account receives distributions from the limited partnerships based on the Account’s ownership interest percentages. At December 31, 2010, the Account held five limited partnership investments and
one private real estate equity investment trust (all of which featured non-controlling ownership interests) with ownership interest percentages that ranged from 5.3% to 18.5%. Under the terms of the partnership agreements governing such investments, and based upon the expected term of each such partnership,
the partnerships could engage in liquidation activities beginning in 2012 through 2015. The Account’s ownership interest in limited partnerships was $270.3 million and $200.3 million at December 31, 2010 and December 31, 2009, respectively. Note 9—Mortgage Loans Payable At December 31, 2010, the Account had outstanding mortgage loans payable secured by the following properties (in thousands):
Property
Interest Rate and
Principal
Maturity Ontario Industrial Portfolio(1)
7.42% paid monthly
$
8,216
May 1, 2011 1 & 7 Westferry Circus(2)(5)
5.40% paid quarterly
210,150
November 15, 2012 Reserve at Sugarloaf(1)(5)
5.49% paid monthly
24,738
June 1, 2013 South Frisco Village
5.85% paid monthly
26,251
June 1, 2013 Fourth & Madison
6.40% paid monthly
145,000
August 21, 2013 1001 Pennsylvania Avenue
6.40% paid monthly
210,000
August 21, 2013 50 Fremont
6.40% paid monthly
135,000
August 21, 2013 Pacific Plaza(1)(5)
5.55% paid monthly
8,400
September 1, 2013 Wilshire Rodeo Plaza(5)
5.28% paid monthly
112,700
April 11, 2014 1401 H Street(1)(5)
5.97% paid monthly
113,677
December 7, 2014 1050 Lenox Park Apartments(5)(9)
4.43% paid monthly
24,000
August 1, 2015 San Montego Apartments(5)(6)(9)
4.47% paid monthly
21,780
August 1, 2015 Montecito Apartments(5)(6)(9)
4.47% paid monthly
20,250
August 1, 2015 Phoenician Apartments(5)(6)(9)
4.47% paid monthly
21,280
August 1, 2015 The Colorado(1)(5)
5.65% paid monthly
85,568
November 1, 2015 99 High Street
5.52% paid monthly
185,000
November 11, 2015 The Legacy at Westwood(1)(5)
5.95% paid monthly
40,999
December 1, 2015 Regents Court(1)(5)
5.76% paid monthly
35,011
December 1, 2015 The Caruth(1)(5)
5.71% paid monthly
40,949
December 1, 2015 Lincoln Centre
5.51% paid monthly
153,000
February 1, 2016 The Legend at Kierland(5)(7)(9)
4.97% paid monthly
21,825
August 1, 2017 The Tradition at Kierland(5)(7)(9)
4.97% paid monthly
25,800
August 1, 2017 Red Canyon at Palomino Park(5)(8)(9)
5.34% paid monthly
27,120
August 1, 2020 Green River at Palomino Park(5)(8)(9)
5.34% paid monthly
33,220
August 1, 2020 Blue Ridge at Palomino Park(5)(8)(9)
5.34% paid monthly
33,380
August 1, 2020 Ashford Meadows(5)(6)(9)
5.17% paid monthly
44,600
August 1, 2020 Publix at Weston Commons(5)
5.08% paid monthly
35,000
January 1, 2036 Total Principal Outstanding
1,842,914 Fair Value Adjustment(4)
17,243 Total mortgage loans payable, at fair value
$
1,860,157 78
Payment Frequency(3)
Amounts as of
December 31, 2010
(1)
The mortgage is adjusted monthly for principal payments. (2) The mortgage is denominated in British pounds and the principal payment had been converted to U.S. dollars using the exchange rate as of December 31, 2010. The interest rate is fixed. The cumulative foreign currency translation adjustment (since inception) was an unrealized gain of $22 million. (3) Interest rates are fixed, unless stated otherwise. (4) The fair value adjustment consists of the difference (positive or negative) between the principal amount of the outstanding debt and the fair value of the outstanding debt. See Note 1—Organization and Significant Accounting Policies. (5) These properties are each owned by separate wholly owned subsidiaries of TIAA for benefit of the Account. The assets and credit of each of these borrowing entities are not available to satisfy the debts and other obligations of the Account or any other entity or person other than such borrowing entity. (6) Represents mortgage loans payable on these individual properties which are held within the Houston Apartment Portfolio. (7) Represents mortgage loans payable on these individual properties which are held within the Kierland Apartment Portfolio. (8) Represents mortgage loans payable on these individual properties which are held within the Palomino Park Portfolio. Principal payment schedule on mortgage loans payable as of December 31, 2010 is due as follows (in thousands):
Amount 2011
$
13,082 2012
215,236 2013
552,853 2014
225,273 2015
462,525 Thereafter
373,945 Total maturities
$
1,842,914 79
Note 10—Condensed Financial Information Selected condensed financial information for an Accumulation Unit of the Account is presented below. Per Accumulation Unit data is calculated on average units outstanding.
Years Ended December 31,
2010
2009
2008
2007
2006 Per Accumulation Unit data: Rental income
$
19.516
$
22.649
$
18.794
$
17.975
$
16.717 Real estate property level expenses and taxes
9.987
11.193
9.190
8.338
7.807 Real estate income, net
9.529
11.456
9.604
9.637
8.910 Other income
2.214
2.778
3.808
4.289
3.931 Total income
11.743
14.234
13.412
13.926
12.841 Expense charges(1)
2.167
2.280
2.937
2.554
1.671 Investment income, net
9.576
11.954
10.475
11.372
11.170 Net realized and unrealized gain (loss) on investments and mortgage loans payable
16.143
(85.848
)
(54.541
)
26.389
22.530 Net (decrease) increase in Accumulation Unit Value
25.719
(73.894
)
(44.066
)
37.761
33.700 Accumulation Unit Value: Beginning of period
193.454
267.348
311.414
273.653
239.953 End of period
219.173
193.454
267.348
311.414
273.653 Total return
13.29%
(27.64
)%
(14.15
)%
13.80%
14.04% Ratios to Average net Assets: Expenses(1)
1.09%
1.01%
0.95%
0.87%
0.67% Investment income, net
4.84%
5.29%
3.38%
3.88%
4.49% Portfolio turnover rate: Real estate properties(2)
1.01%
0.75%
0.64%
5.59%
3.62% Marketable securities(3)
19.18%
0.00%
25.67%
13.03%
51.05% Accumulation Units outstanding at end of period (in thousands):
48,070
39,473
41,542
55,106
50,146 Net assets end of period (in thousands)
$
10,803,140
$
7,879,914
$
11,508,924
$
17,660,537
$
14,132,693
(1)
Expense charges per Accumulation Unit and the Ratio of Expenses to average net assets reflect the year to date Account-level expenses and exclude real estate property level expenses which are included in real estate income, net. If the real estate property level expenses were included, the expense charge per Accumulation Unit for the twelve months ended December 31, 2010 would be
$12.154 ($13.473, $12.127, $10.892, and $9.478 for the years ended December 31, 2009, 2008, 2007 and 2006, respectively), and the Ratio of Expenses to average net assets for the twelve months ended December 31, 2010 would be 6.14% (5.96%, 3.91%, 3.71%, and 3.81% for the years ended December 31, 2009, 2008, 2007 and 2006, respectively). (2) Real estate investment portfolio turnover rate is calculated by dividing the lesser of purchases or sales of real estate property investments (including contributions to, or return of capital distributions received from, existing joint venture and limited partnership investments) by the average value of the portfolio of real estate investments held during the period. (3) Marketable securities portfolio turnover rate is calculated by dividing the lesser of purchases or sales of securities, excluding securities having maturity dates at acquisition of one year or less, by the average value of the portfolio securities held during the period. Note 11—Accumulation Units Changes in the number of Accumulation Units outstanding were as follows (in thousands):
For The Years Ended
2010
2009
2008 Outstanding: Beginning of period
39,473
41,542
55,106 Credited for premiums
12,853
4,807
6,417 Credited for purchase of units by TIAA (see Note 3)
—
4,139
577 Annuity, other periodic payments, withdrawals and death benefits
(4,256
)
(11,015
)
(20,558
) End of period
48,070
39,473
41,542 80
Note 12—Commitments, Contingencies, and Subsequent Events Commitments—As of December 31, 2010, the Account had outstanding commitments to purchase additional interests in three of its limited partnership investments. As of December 31, 2010, the Account’s remaining commitments totaled $33.7 million, which can be called in full or in part by each limited partnership
at any time. As of December 31, 2010, the Account has committed to fund $0.3 million to one of its joint venture investments for an expansion project for that venture. As of December 31, 2010 the Account has committed a total of $101.2 million to various tenants for tenant improvements and leasing inducements which as of December 31, 2010 have not been incurred. Contingencies—The Account is party to various claims and routine litigation arising in the ordinary course of business. Management of the Account does not believe the results of any such claims or litigation, individually, or in the aggregate, will have a material effect on the Account’s business, financial position, or
results of operations. Subsequent Events—During February 2011, the revolving line of credit agreement held in the Account’s investment within the DDR Joint Venture was amended to extend the maturity date from February 2011 to February 2012. The maximum amount that may be drawn under this revolving line of credit agreement is
$213.0 million, reduced by any outstanding letters of credit. During February 2011, the Account purchased an additional $101.1 million of real estate-related marketable securities. Note 13—New Accounting Pronouncements In June 2009, the FASB issued Statement of Financial Accounting Standards No. 167, Amendments to FASB Interpretation No. 46(R) (“SFAS No. 167”), which amends guidance related to the identification of a variable interest entity, variable interests, the primary beneficiary, and expands required note
disclosures to provide greater transparency to the users of financial statements. In December 2009, the FASB issued Accounting Standards Update (“ASU”) No. 2009-17, “Improvements to Financial Reporting by Enterprises Involved with Variable Interest Entities,” which amended the Codification with the
guidance contained in SFAS No. 167. In February 2010, the FASB issued ASU No. 2010-10, “Amendments for Certain Investment Funds,” which defers the applicability of ASU No. 2009-17 in certain instances. These standards were effective on January 1, 2010 and did not result in a significant impact to the
Account’s financial position or results of operations. In January 2010, the FASB issued ASU No. 2010-06, “Improving Disclosures about Fair Value Measurements” which requires new disclosures related to transfers in and out of levels 1 and 2, and the separate disclosure of purchases, sales, issuances and settlements when reconciling activity in level 3. This ASU also
amends prior disclosure requirements to call for the disaggregation of assets and liabilities into appropriate subsets, and the disclosure of valuation techniques and inputs for recurring and nonrecurring fair value measurements in levels 2 and 3. The new disclosure requirement for reconciling level 3 activity is
effective January 1, 2011. All other new or amended disclosure requirements were effective January 1, 2010 for the Account and are reflected in the notes to the financial statements. These changes did not impact the Account’s financial position or results of operations. 81
REAL ESTATE PROPERTIES—64.22% and 76.71%
Location/Description
Type
Fair Value
2010
2009 Alabama: Inverness Center
Office
$
—
$
90,315 Arizona: Camelback Center
Office
33,213
37,774 Kierland Apartment Portfolio
Apartments
96,002
(1)
78,060 Phoenix Apartment Portfolio
Apartments
22,978
21,767 California: 3 Hutton Centre Drive
Office
32,195
28,752 50 Fremont Street
Office
315,072
(1)
284,283
(1) 88 Kearny Street
Office
65,407
61,600 275 Battery Street
Office
180,364
164,390 Rancho Cucamonga Industrial Portfolio
Industrial
83,400
57,327 Centerside I
Office
34,000
27,012 Centre Pointe and Valley View
Industrial
19,946
18,929 Great West Industrial Portfolio
Industrial
73,500
65,000 Larkspur Courts
Apartments
70,098
50,111 Northern CA RA Industrial Portfolio
Industrial
39,730
42,437 Ontario Industrial Portfolio
Industrial
223,700
(1)
167,998
(1) Pacific Plaza
Office
56,201
(1)
60,075
(1) Regents Court
Apartments
65,005
(1)
50,505
(1) Southern CA RA Industrial Portfolio
Industrial
75,512
75,817 The Legacy at Westwood
Apartments
93,242
(1)
77,836
(1) Wellpoint
Office
41,000
37,400 Westcreek
Apartments
29,616
23,061 West Lake North Business Park
Office
40,765
32,407 Westwood Marketplace
Retail
89,001
77,077 Wilshire Rodeo Plaza
Office
165,513
(1)
151,209
(1) Colorado: Palomino Park
Apartments
168,708
(1)
143,907 The Lodge at Willow Creek
Apartments
39,709
31,624 Connecticut: Ten & Twenty Westport Road
Office
100,663
126,860 Florida: 701 Brickell Avenue
Office
201,170
198,630
(1) North 40 Office Complex
Office
36,353
33,969 Plantation Grove
Retail
9,400
9,600 Pointe on Tampa Bay
Office
35,188
35,060 Publix at Weston Commons
Retail
45,200
(1)
38,100
(1) Quiet Waters at Coquina Lakes
Apartments
23,730
19,918 Seneca Industrial Park
Industrial
63,267
62,341 South Florida Apartment Portfolio
Apartments
60,029
48,366 Suncrest Village Shopping Center
Retail
12,600
12,329 The Fairways of Carolina
Apartments
22,317
18,628 Urban Centre
Office
89,727
80,282 See notes to the financial statements. 82
TIAA REAL ESTATE ACCOUNT
Location/Description
Type
Fair Value
2010
2009 France: Printemps de L’Homme
Retail
$
223,743
$
200,995 Georgia: Atlanta Industrial Portfolio
Industrial
38,800
39,519 Glenridge Walk
Apartments
33,605
30,326 Reserve at Sugarloaf
Apartments
43,720
(1)
37,710
(1) Shawnee Ridge Industrial Portfolio
Industrial
49,001
52,219 Windsor at Lenox Park
Apartments
50,805
(1)
48,223 Illinois: Chicago Caleast Industrial Portfolio
Industrial
50,801
48,304 Chicago Industrial Portfolio
Industrial
58,865
60,908 Oak Brook Regency Towers
Office
70,574
64,265 Parkview Plaza
Office
43,112
44,360 Maryland: Broadlands Business Park
Industrial
24,200
23,600 GE Appliance East Coast Distribution Facility
Industrial
29,100
28,900 Massachusetts: 99 High Street
Office
255,014
(1)
253,557
(1) Needham Corporate Center
Office
18,566
16,196 Northeast RA Industrial Portfolio
Industrial
22,077
24,845 The Newbry
Office
252,017
230,375 Minnesota: Champlin Marketplace
Retail
12,712
13,801 Nevada: Fernley Distribution Facility
Industrial
7,100
7,600 New Jersey: Konica Photo Imaging Headquarters
Industrial
14,505
15,100 Marketfair
Retail
66,245
65,594 Morris Corporate Center III
Office
71,896
66,478 Plainsboro Plaza
Retail
27,504
26,962 South River Road Industrial
Industrial
38,465
28,656 New York: 780 Third Avenue
Office
300,616
240,077 The Colorado
Apartments
123,039
(1)
110,144
(1) Pennsylvania: Lincoln Woods
Apartments
29,124
28,728 Tennessee: Airways Distribution Center
Industrial
12,113
12,600 Summit Distribution Center
Industrial
15,800
12,300 Texas: Dallas Industrial Portfolio
Industrial
140,638
125,275 Four Oaks Place
Office
383,676
409,027
(1) Houston Apartment Portfolio
Apartments
186,924
(1)
179,717 See notes to the financial statements. 83
STATEMENTS OF INVESTMENTS
December 31, 2010 and December 31, 2009
(Dollar values shown in thousands)
TIAA REAL ESTATE ACCOUNT
Location/Description
Type
Fair Value
2010
2009 Texas: (continued) Lincoln Centre
Office
$
195,416
(1)
$
202,029
(1) Pinnacle Industrial Portfolio
Industrial
38,400
34,148 South Frisco Village
Retail
29,000
(1)
26,900
(1) The Caruth
Apartments
56,083
(1)
49,641
(1) The Maroneal
Apartments
37,614
32,179 United Kingdom: 1 & 7 Westferry Circus
Office
260,045
(1)
239,036
(1) Virginia: 8270 Greensboro Drive
Office
27,895
34,200 Ashford Meadows Apartments
Apartments
95,436
(1)
71,105 One Virginia Square
Office
51,700
40,503 The Ellipse at Ballston
Office
76,716
65,505 Washington: Creeksides at Centerpoint
Office
16,611
18,724 Fourth and Madison
Office
330,007
(1)
295,000
(1) Millennium Corporate Park
Office
125,228
116,548 Northwest RA Industrial Portfolio
Industrial
17,000
17,800 Rainier Corporate Park
Industrial
66,800
65,277 Regal Logistics Campus
Industrial
52,500
47,955 Washington DC: 1001 Pennsylvania Avenue
Office
589,839
(1)
480,622
(1) 1401 H Street, NW
Office
179,294
(1)
143,555
(1) 1900 K Street, NW
Office
246,054
204,000 Mazza Gallerie
Retail
76,000
65,500 TOTAL REAL ESTATE PROPERTIES (Cost $9,449,056 and $9,408,978)
8,115,516
7,437,344 See notes to the financial statements. 84
STATEMENTS OF INVESTMENTS
December 31, 2010 and December 31, 2009
(Dollar values shown in thousands)
TIAA REAL ESTATE ACCOUNT OTHER REAL ESTATE-RELATED INVESTMENTS—12.89% and 15.63% REAL ESTATE JOINT VENTURES—10.75% and 13.56%
Location/Description
Fair Value
2010
2009 California: CA-Colorado Center LP Yahoo Center (50% Account Interest)
$
157,452
(2)
$
133,227
(2) CA-Treat Towers LP Treat Towers (75% Account Interest)
67,108
66,435 Florida: Florida Mall Associates, Ltd The Florida Mall (50% Account Interest)
238,966
(2)
252,432
(2) TREA Florida Retail, LLC Florida Retail Portfolio (80% Account Interest)
165,458
162,204 West Dade Associates Miami International Mall (50% Account Interest)
93,221
(2)
76,856
(2) Georgia: GA-Buckhead LLC Prominence in Buckhead (75% Account Interest)
39,799
30,952 Massachusetts: MA-One Boston Place REIT One Boston Place (50.25% Account Interest)
150,276
129,922 Tennessee: West Town Mall, LLC West Town Mall (50% Account Interest)
50,613
(2)
37,262
(2) Virginia: Teachers REA IV, LLC Tyson’s Executive Plaza II (50% Account Interest)
—
26,275 Various: DDR TC LLC DDR Joint Venture (85% Account Interest)
303,866
(2,3)
312,182
(2,3) Storage Portfolio I, LLC Storage Portfolio (75% Account Interest)
52,812
(2,3)
46,269
(2,3) Strategic Ind Portfolio I, LLC IDI Nationwide Industrial Portfolio (60% Account Interest)
39,255
(2,3)
40,587
(2,3) TOTAL REAL ESTATE JOINT VENTURES (Cost $1,922,397 and $2,142,016)
1,358,826
1,314,603 LIMITED PARTNERSHIPS—2.14% and 2.07% Cobalt Industrial REIT (10.998% Account Interest)
26,317
20,341 Colony Realty Partners LP (5.27% Account Interest)
18,100
12,123 Heitman Value Partners Fund (8.43% Account Interest)
17,300
13,736 Lion Gables Apartment Fund (18.46% Account Interest)
190,024
142,999 MONY/Transwestern Mezz RP II (16.67% Account Interest)
9,694
9,267 Transwestern Mezz Realty Partners III, LLC (11.708% Account Interest)
8,849
1,807 TOTAL LIMITED PARTNERSHIPS (Cost $300,907 and $295,779)
270,284
200,273 TOTAL REAL ESTATE JOINT VENTURES AND LIMITED PARTNERSHIPS (Cost $2,223,304 and $2,437,795)
1,629,110
1,514,876 See notes to the financial statements. 85
STATEMENTS OF INVESTMENTS
December 31, 2010 and December 31, 2009
(Dollar values shown in thousands)
TIAA REAL ESTATE ACCOUNT MARKETABLE SECURITIES—22.89% and 6.93%
Shares Issuer
Fair Value
2010
2009
2010
2009
50,398
— Acadia Realty Trust
$
919
$
—
11,416
— Agree Realty Corporation
299
—
2,574
— Alexander’s, Inc.
1,061
—
66,883
— Alexandria Real Estate Equities, Inc.
4,900
—
200,791
— AMB Property Corporation
6,367
—
81,463
— American Campus Communities, Inc.
2,587
—
142,051
— Apartment Investment and Management Company
3,671
—
65,637
— Ashford Hospitality Trust, Inc.
633
—
52,433
— Associated Estates Realty Corporation
802
—
102,725
— Avalonbay Communities, Inc.
11,562
—
155,007
— BioMed Realty Trust, Inc.
2,891
—
168,877
— Boston Properties, Inc.
14,540
—
157,851
— Brandywine Realty Trust
1,839
—
77,519
— BRE Properties, Inc.
3,372
—
83,321
— Camden Property Trust
4,498
—
37,593
— Campus Crest Communities, Inc.
527
—
75,517
— CapLease, Inc.
440
—
167,965
— CBL & Associates Properties, Inc.
2,939
—
70,256
— Cedar Shopping Centers, Inc.
442
—
8,763
— Chatham Lodging Trust
151
—
20,047
— Chesapeake Lodging Trust
377
—
54,270
— Cogdell Spencer Inc.
315
—
95,610
— Colonial Properties Trust
1,726
—
20,917
— CoreSite Realty Corporation
285
—
80,891
— Corporate Office Properties Trust
2,827
—
123,682
— Cousins Properties Incorporated
1,032
—
253,113
— DCT Industrial Trust Inc.
1,344
—
309,541
— Developers Diversified Realty Corporation
4,361
—
188,954
— DiamondRock Hospitality Company
2,267
—
107,907
— Digital Realty Trust, Inc.
5,562
—
113,097
— Douglas Emmett, Inc.
1,877
—
298,785
— Duke Realty Corporation
3,723
—
72,632
— DuPont Fabros Technology, Inc.
1,545
—
33,167
— EastGroup Properties, Inc.
1,404
—
65,151
— Education Realty Trust, Inc.
506
—
56,762
— Entertainment Properties Trust
2,625
—
37,659
— Equity Lifestyle Properties, Inc.
2,106
—
58,543
— Equity One, Inc.
1,064
—
339,604
— Equity Residential
17,642
—
38,018
— Essex Property Trust, Inc.
4,342
—
21,898
— Excel Trust, Inc.
265
—
107,440
— Extra Space Storage Inc.
1,869
—
73,740
— Federal Realty Investment Trust
5,747
—
122,336
— FelCor Lodging Trust Incorporated
861
—
71,146
— First Industrial Realty Trust, Inc.
623
—
57,529
— First Potomac Realty Trust
968
—
98,729
— Franklin Street Properties Corp.
1,407
—
560,577
— General Growth Properties, Inc.
8,678
—
28,271
— Getty Realty Corp.
884
—
10,676
— Gladstone Commercial Corporation
201
—
107,080
— Glimcher Realty Trust
899
— 86
STATEMENTS OF INVESTMENTS
December 31, 2010 and December 31, 2009
(Dollar values shown in thousands)
REAL ESTATE-RELATED MARKETABLE SECURITIES—3.92% and 0.00%
TIAA REAL ESTATE ACCOUNT
Shares Issuer
Fair Value
2010
2009
2010
2009
38,023
— Government Properties Income Trust
$
1,019
$
—
387,498
— HCP, Inc.
14,256
—
175,223
— Health Care REIT, Inc.
8,348
—
79,299
— Healthcare Realty Trust Incorporated
1,679
—
209,343
— Hersha Hospitality Trust
1,382
—
84,755
— Highwoods Properties, Inc.
2,699
—
45,795
— Home Properties, Inc.
2,541
—
150,100
— Hospitality Properties Trust
3,458
—
798,787
— Host Hotels & Resorts, Inc.
14,274
—
88,294
— HRPT Properties Trust
2,252
—
20,487
— Hudson Pacific Properties, Inc.
308
—
109,424
— Inland Real Estate Corporation
963
—
98,903
— Investors Real Estate Trust
887
—
1,500,000
— iShares Dow Jones US Real Estate Index Fund
83,943
—
61,706
— Kilroy Realty Corporation
2,250
—
485,461
— Kimco Realty Corporation
8,758
—
83,099
— Kite Realty Group Trust
450
—
86,269
— LaSalle Hotel Properties
2,278
—
165,849
— Lexington Realty Trust
1,318
—
138,566
— Liberty Property Trust
4,423
—
30,038
— LTC Properties, Inc.
843
—
93,900
— Mack-Cali Realty Corporation
3,104
—
53,134
— Maguire Properties, Inc.
146
—
136,282
— Medical Properties Trust, Inc.
1,476
—
41,729
— Mid-America Apartment Communities, Inc.
2,649
—
20,269
— Mission West Properties, Inc.
136
—
44,989
— Monmouth Real Estate Investment Corporation
382
—
34,293
— National Health Investors, Inc.
1,544
—
101,670
— National Retail Properties, Inc.
2,694
—
152,266
— Nationwide Health Properties, Inc.
5,539
—
120,251
— Omega Healthcare Investors, Inc.
2,698
—
16,016
— One Liberty Properties, Inc.
267
—
27,787
— Parkway Properties, Inc.
487
—
63,708
— Pennsylvania Real Estate Investment Trust
926
—
77,918
— Piedmont Office Realty Trust, Inc.
1,569
—
196,790
— Plum Creek Timber Company, Inc.
7,370
—
59,612
— Post Properties, Inc.
2,164
—
49,003
— Potlatch Corporation
1,595
—
681,117
— ProLogis
9,835
—
22,706
— PS Business Parks, Inc.
1,265
—
153,807
— Public Storage, Inc.
15,599
—
42,225
— Ramco-Gershenson Properties Trust
526
—
97,616
— Rayonier Inc.
5,127
—
141,919
— Realty Income Corporation
4,854
—
97,060
— Regency Centers Corporation
4,100
—
17,498
— Saul Centers, Inc.
829
—
150,706
— Senior Housing Properties Trust
3,306
—
352,460
— Simon Property Group, Inc.
35,066
—
93,168
— SL Green Realty Corp.
6,290
—
34,147
— Sovran Self Storage, Inc.
1,257
—
186,401
— Strategic Hotels & Resorts, Inc.
986
—
24,737
— Sun Communities, Inc.
824
—
29,324
— Sun Healthcare Group, Inc.
540
—
137,832
— Sunstone Hotel Investors, L.L.C.
1,424
— 87
STATEMENTS OF INVESTMENTS
December 31, 2010 and December 31, 2009
(Dollar values shown in thousands)
TIAA REAL ESTATE ACCOUNT
Shares Issuer
Fair Value
2010
2009
2010
2009
49,191
— Tanger Factory Outlet Centers, Inc.
$
2,518
$
—
50,042
— Taubman Centers, Inc.
2,526
—
11,532
— Terreno Realty Corporation
207
—
155,462
— The Macerich Company
7,364
—
220,400
— UDR, Inc.
5,184
—
5,400
— UMH Properties, Inc.
55
—
16,113
— Universal Health Realty Income Trust
589
—
27,120
— Urstadt Biddle Properties Inc.
527
—
119,610
— U-Store-It Trust
1,140
—
188,915
— Ventas, Inc.
9,914
—
219,149
— Vornado Realty Trust
18,262
—
78,376
— Washington Real Estate Investment Trust
2,429
—
142,411
— Weingarten Realty Investors
3,384
—
646,348
— Weyerhaeuser Company
12,235
—
22,256
— Winthrop Realty Trust
285
— TOTAL REAL ESTATE-RELATED MARKETABLE SECURITIES (Cost $480,363 and $—)
495,294
— OTHER MARKETABLE SECURITIES—18.97% and 6.93% GOVERNMENT AGENCY NOTES—11.75% and 4.80%
Principal Issuer
Yield(4)
Maturity
Fair Value
2010
2009
2010
2009
$
—
$
4,700 Fannie Mae Discount Notes
0.041%
1/13/10
$
—
$
4,700
—
25,000 Fannie Mae Discount Notes
0.091%
1/19/10
—
25,000
—
49,300 Fannie Mae Discount Notes
0.020%
1/27/10
—
49,299
—
25,000 Fannie Mae Discount Notes
0.051%
2/4/10
—
24,999
—
20,000 Fannie Mae Discount Notes
0.091%
2/8/10
—
19,999
—
18,873 Fannie Mae Discount Notes
0.071%
2/16/10
—
18,872
—
10,000 Fannie Mae Discount Notes
0.101%
3/1/10
—
9,999
—
17,470 Fannie Mae Discount Notes
0.167%
5/5/10
—
17,463
15,070
— Fannie Mae Discount Notes
0.172%
1/18/11
15,070
—
21,225
— Fannie Mae Discount Notes
0.172%
2/1/11
21,224
—
43,640
— Fannie Mae Discount Notes
0.183%
2/3/11
43,637
—
13,515
— Fannie Mae Discount Notes
0.183%
2/14/11
13,514
—
50,000
— Fannie Mae Discount Notes
0.137%
2/15/11
49,995
—
32,479
— Fannie Mae Discount Notes
0.162-0.178%
3/1/11
32,474
—
32,445
— Fannie Mae Discount Notes
0.172%
3/2/11
32,440
—
14,000
— Fannie Mae Discount Notes
0.162%
3/8/11
13,998
—
19,600
— Fannie Mae Discount Notes
0.178%
3/21/11
19,596
—
31,935
— Fannie Mae Discount Notes
0.162%
3/23/11
31,928
—
20,210
— Fannie Mae Discount Notes
0.178%
4/13/11
20,204
—
31,800
— Federal Farm Credit Bank Discount Notes
0.172%
5/9/11
31,786
—
—
10,990 Federal Home Loan Bank Discount Notes
0.001%
1/4/10
—
10,990
—
4,419 Federal Home Loan Bank Discount Notes
0.041%
1/13/10
—
4,419
—
44,000 Federal Home Loan Bank Discount Notes
0.081%
1/15/10
—
44,000
—
25,300 Federal Home Loan Bank Discount Notes
0.071%
1/22/10
—
25,300
—
41,200 Federal Home Loan Bank Discount Notes
0.051%
2/24/10
—
41,200 88
STATEMENTS OF INVESTMENTS
December 31, 2010 and December 31, 2009
(Dollar values shown in thousands)
Date
TIAA REAL ESTATE ACCOUNT
Principal Issuer
Yield(4)
Maturity
Fair Value
2010
2009
2010
2009
$
—
$
15,770 Federal Home Loan Bank Discount Notes
0.081%
3/5/10
$
—
$
15,770
29,975
— Federal Home Loan Bank Discount Notes
0.162%
1/5/11
29,975
—
25,000
— Federal Home Loan Bank Discount Notes
0.162%
1/7/11
25,000
—
30,000
— Federal Home Loan Bank Discount Notes
0.172%
1/12/11
30,000
—
50,000
— Federal Home Loan Bank Discount Notes
0.183%
1/14/11
49,999
—
30,000
— Federal Home Loan Bank Discount Notes
0.177%
1/19/11
29,999
—
15,800
— Federal Home Loan Bank Discount Notes
0.157%
1/20/11
15,800
—
30,000
— Federal Home Loan Bank Discount Notes
0.177%
1/21/11
29,999
—
36,400
— Federal Home Loan Bank Discount Notes
0.122%
1/26/11
36,399
—
49,977
— Federal Home Loan Bank Discount Notes
0.157-0.172%
1/28/11
49,975
—
39,060
— Federal Home Loan Bank Discount Notes
0.167-0.178%
2/2/11
39,057
—
30,000
— Federal Home Loan Bank Discount Notes
0.167%
2/4/11
29,998
—
20,115
— Federal Home Loan Bank Discount Notes
0.157%
2/9/11
20,113
—
47,000
— Federal Home Loan Bank Discount Notes
0.147%
2/16/11
46,995
—
41,381
— Federal Home Loan Bank Discount Notes
0.157-0.183%
2/18/11
41,377
—
35,415
— Federal Home Loan Bank Discount Notes
0.183%
2/23/11
35,411
—
25,000
— Federal Home Loan Bank Discount Notes
0.188%
2/25/11
24,997
—
32,810
— Federal Home Loan Bank Discount Notes
0.162%
3/9/11
32,804
—
27,700
— Federal Home Loan Bank Discount Notes
0.162%
3/11/11
27,695
—
25,000
— Federal Home Loan Bank Discount Notes
0.162%
3/16/11
24,995
—
23,810
— Federal Home Loan Bank Discount Notes
0.178%
4/15/11
23,803
—
16,115
— Federal Home Loan Bank Discount Notes
0.178%
4/29/11
16,109
—
20,000
— Federal Home Loan Bank Discount Notes
0.271%
5/6/11
19,996
—
100,000
— Federal Home Loan Bank Discount Notes
0.269%
8/12/11
99,978
—
—
10,000 Freddie Mac Discount Notes
0.091%
1/20/10
—
10,000
—
50,541 Freddie Mac Discount Notes
0.041-0.076%
1/25/10
—
50,540
—
11,800 Freddie Mac Discount Notes
0.051%
2/2/10
—
11,800
—
47,000 Freddie Mac Discount Notes
0.030%
2/16/10
—
46,998
—
19,010 Freddie Mac Discount Notes
0.132%
2/26/10
—
19,009
—
5,736 Freddie Mac Discount Notes
0.081%
3/1/10
—
5,736
—
9,000 Freddie Mac Discount Notes
0.071%
3/8/10
—
8,999
45,880
— Freddie Mac Discount Notes
0.157-0.162%
1/3/11
45,880
—
82,710
— Freddie Mac Discount Notes
0.183%
1/10/11
82,709
—
27,960
— Freddie Mac Discount Notes
0.152%
1/25/11
27,959
—
28,150
— Freddie Mac Discount Notes
0.172%
1/31/11
28,149
—
18,100
— Freddie Mac Discount Notes
0.142%
2/22/11
18,098
—
49,430
— Freddie Mac Discount Notes
0.162-0.178%
3/7/11
49,421
—
26,710
— Freddie Mac Discount Notes
0.162%
3/14/11
26,705
—
14,900
— Freddie Mac Discount Notes
0.172%
3/21/11
14,897
—
24,600
— Freddie Mac Discount Notes
0.183%
4/18/11
24,592
—
10,085
— Freddie Mac Discount Notes
0.193%
4/19/11
10,082
—
50,000
— Freddie Mac Discount Notes
0.252-0.257%
11/9/11
49,942
— TOTAL GOVERNMENT AGENCY NOTES (Cost $1,484,694 and $465,072)
1,484,774
465,092
UNITED STATES TREASURY SECURITIES—7.22% and 2.13%
—
24,515 United States Treasury Bills
0.066-0.152%
2/25/10
—
24,514
—
47,200 United States Treasury Bills
0.137-0.162%
4/22/10
—
47,189
—
52,530 United States Treasury Bills
0.122-0.147%
5/13/10
—
52,506 89
STATEMENTS OF INVESTMENTS
December 31, 2010 and December 31, 2009
(Dollar values shown in thousands)
Date
TIAA REAL ESTATE ACCOUNT
Principal Issuer
Yield(4)
Maturity
Fair Value
2010
2009
2010
2009
$
—
$
62,015 United States Treasury Bills
0.127-0.147%
5/20/10
$
—
$
61,981
—
20,000 United States Treasury Bills
0.137%
5/27/10
—
19,985
32,300
— United States Treasury Bills
0.130%
1/13/11
32,300
—
31,600
— United States Treasury Bills
0.152%
1/27/11
31,599
—
32,430
— United States Treasury Bills
0.129%
2/10/11
32,427
—
30,000
— United States Treasury Bills
0.133%
2/17/11
29,996
—
30,000
— United States Treasury Bills
0.140%
2/24/11
29,995
—
90,990
— United States Treasury Bills
0.106-0.137%
3/3/11
90,972
—
41,400
— United States Treasury Bills
0.132-0.178%
3/10/11
41,391
—
46,320
— United States Treasury Bills
0.142-0.163%
3/17/11
46,310
—
34,000
— United States Treasury Bills
0.141%
3/24/11
33,991
—
30,000
— United States Treasury Bills
0.147%
3/31/11
29,991
—
50,000
— United States Treasury Bills
0.137%
4/7/11
49,982
—
38,150
— United States Treasury Bills
0.173%
4/14/11
38,135
—
30,000
— United States Treasury Bills
0.173%
4/21/11
29,988
—
25,000
— United States Treasury Bills
0.173%
4/28/11
24,989
—
28,630
— United States Treasury Bills
0.153%
5/5/11
28,616
—
55,000
— United States Treasury Bills
0.162-0.184%
5/12/11
54,971
—
49,225
— United States Treasury Bills
0.190-0.210%
5/19/11
49,197
—
47,130
— United States Treasury Bills
0.170-0.200%
5/26/11
47,102
—
205
— United States Treasury Bills
0.167%
6/9/11
205
—
19,325
— United States Treasury Bills
0.178%
6/16/11
19,310
—
4,300
— United States Treasury Bills
0.181%
6/23/11
4,296
—
29,480
— United States Treasury Notes
0.148%
2/28/11
29,511
—
50,800
— United States Treasury Notes
0.174-0.227%
3/31/11
50,883
—
21,450
— United States Treasury Notes
0.245%
4/30/11
21,499
—
33,650
— United States Treasury Notes
0.237%
6/30/11
33,805
—
30,350
— United States Treasury Notes
0.273%
9/30/11
30,511
— TOTAL UNITED STATES TREASURY SECURITIES (Cost $911,921 and $206,163)
911,972
206,175 TOTAL OTHER MARKETABLE SECURITIES (Cost $2,396,615 and $671,235)
2,396,746
671,267 TOTAL MARKETABLE SECURITIES (Cost $2,876,978 and $671,235)
2,892,040
671,267
MORTGAGE LOAN RECEIVABLE—0.00% and 0.73%
Borrower
Current Rate(5)
—
75,000 Klingle Corporation
—
—
—
71,273 TOTAL MORTGAGE LOAN RECEIVABLE (Cost $— and $75,000)
—
71,273 TOTAL INVESTMENTS (Cost $14,549,338 and $12,593,008)
$
12,636,666
$
9,694,760
(1)
The investment has a mortgage loan payable outstanding, as indicated in Note 9. (2) The market value reflects the Account’s interest in the joint venture and is net of debt. (3) Properties within this investment are located throughout the United States. (4) Yield represents the annualized yield at the date of purchase. (5) At December 31, 2009, the interest rate on this investment was 1.04%, the loan was paid in full as of December 31, 2010. 90
STATEMENTS OF INVESTMENTS
December 31, 2010 and December 31, 2009
(Dollar values shown in thousands)
Date
REPORT OF INDEPENDENT REGISTERED PUBLIC ACCOUNTING FIRM To the Participants of the TIAA Real Estate Account and the Board of Trustees of Teachers Insurance and Annuity Association of America: In our opinion, the accompanying statements of assets and liabilities, including the statements of investments and the related statements of operations, changes in net assets and cash flows, present fairly, in all material respects, the financial position of the TIAA Real Estate Account (the “Account”) at December
31, 2010 and 2009, the results of its operations, the changes in its net assets and its cash flows for each of the three years in the period ended December 31, 2010 in conformity with accounting principles generally accepted in the United States of America. These financial statements are the responsibility of the
Account’s management. Our responsibility is to express an opinion on these financial statements based on our audits. We conducted our audits of these financial statements in accordance with the standards of the Public Company Accounting Oversight Board (United States). Those standards require that we plan
and perform the audit to obtain reasonable assurance about whether the financial statements are free of material misstatement. An audit includes examining, on a test basis, evidence supporting the amounts and disclosures in the financial statements, assessing the accounting principles used and significant estimates
made by management, and evaluating the overall financial statement presentation. We believe that our audits provide a reasonable basis for our opinion. /s/ PricewaterhouseCoopers LLP Charlotte, North Carolina 91
March 17, 2011
ADDITIONAL INFORMATION ITEM 9. CHANGES IN AND DISAGREEMENTS WITH ACCOUNTANTS ON ACCOUNTING AND FINANCIAL DISCLOSURE. Not applicable. ITEM 9A. CONTROLS AND PROCEDURES. (a) The registrant maintains a system of disclosure controls and procedures that are designed to provide reasonable assurance that information required to be disclosed in the registrant’s reports under the Securities Exchange Act of 1934, as amended (the “Exchange Act”), is recorded, processed, summarized and
reported within the time periods specified in the SEC’s rules and forms, and that such information is accumulated and communicated to management, including the registrant’s Chief Executive Officer and the Chief Financial Officer, as appropriate, to allow timely decisions regarding required disclosure. Under the supervision and participation of the registrant’s management, including the registrant’s CEO and CFO, the registrant conducted an evaluation of the effectiveness of the registrant’s disclosure controls and procedures as defined in Rule 13a-15(e) under the Exchange Act as of December 31, 2010. Based
upon management’s review, the CEO and the CFO concluded that the registrant’s disclosure controls and procedures were effective as of December 31, 2010. (b) Management’s Report on Internal Control over Financial Reporting. Management is responsible for establishing and maintaining adequate internal control over financial reporting for the Account. The Account’s internal control over financial reporting is a process designed under the supervision of
the Account’s Chief Executive Officer and Chief Financial Officer to provide reasonable assurance regarding the reliability of financial reporting and the preparation of the Account’s financial statements for external purposes in accordance with U.S. generally accepted accounting principles. Because of its inherent limitations, internal control over financial reporting may not prevent or detect misstatements. Also, projections of any evaluation of effectiveness to future periods are subject to the risk that controls may become inadequate because of changes in conditions, or that the degree of compliance
with the policies or procedures may deteriorate. Management has made a comprehensive review, evaluation, and assessment of the Account’s internal control over financial reporting as of December 31, 2010. In making its assessment of internal control over financial reporting, management used the criteria issued by the Committee of Sponsoring Organizations of
the Treadway Commission in Internal Control-Integrated Framework. Based on this assessment, management has concluded that as of December 31, 2010, the Account’s internal control over financial reporting was effective to provide reasonable assurance regarding the reliability of financial reporting and the
preparation of financial statements for external purposes in accordance with U.S. generally accepted accounting principles. This annual report does not include an attestation report of the registrant’s independent registered public accounting firm regarding internal control over financial reporting. Management’s report was not subject to attestation by the Registrant’s independent registered public accounting firm pursuant to the rules of
the U.S. Securities and Exchange Commission that permit the company to provide only management’s report in this annual report. (c) Changes in internal control over financial reporting. There have been no changes in the registrant’s internal control over financial reporting that occurred during the registrant’s last fiscal quarter that materially affected, or are reasonably likely to materially affect, the registrant’s internal control over
financial reporting. ITEM 9B. OTHER INFORMATION Not applicable. 92
ITEMS 10 AND 11. DIRECTORS, EXECUTIVE OFFICERS, AND CORPORATE GOVERNANCE OF THE REGISTRANT; EXECUTIVE COMPENSATION. The TIAA Real Estate Account has no officers or directors and no TIAA trustee or executive officer receives compensation from the Account. The Trustees and certain principal executive officers of TIAA as of March 1, 2011, their dates of birth, and their principal occupations during the last five years, are as
follows: Trustees Ronald L. Thompson, 6/17/49 Jeffrey R. Brown, 2/16/68 Robert C. Clark, 2/26/44 Lisa W. Hess, 8/8/55 Edward M. Hundert, M.D., 10/1/56 Lawrence H. Linden, 2/19/47 Maureen O’Hara, 6/13/53 Donald K. Peterson, 8/13/49 93
Former Chairman and Chief Executive Officer, Midwest Stamping and Manufacturing Company through 2005. Director, Chrysler Group, LLC and Washington University in St. Louis. Member, Plymouth Ventures Partnership II Advisory Board.
William G. Karnes Professor of Finance and Director of the Center for Business and Public Policy, University of Illinois at Urbana-Champaign. Research Associate of the National Bureau of Economic Research (NBER) and Associate Director of the NBER Retirement Research Center. Former member
of the Social Security Advisory Board from 2006 to 2008, and Director of the American Risk and Insurance Association and the Countryside School.
Harvard University Distinguished Service Professor and Austin Wakeman Scott Professor of Law, Harvard Law School, Harvard University; Formerly Dean and Royall Professor of Law, Harvard Law School from 1989 to 2003. Director, of the Hodson Trust, Time Warner, Inc. and Omnicom Group.
President and Managing Partner, Sky Top Capital. Former Chief Investment Officer of Loews Corporation from 2002 to 2008. Founding partner of Zesiger Capital Group. Trustee of the WT Grant Foundation, the Chapin School, and the Pomfret School.
Senior lecturer in Medical Ethics, Harvard Medical School. President, Case Western Reserve University from 2002 to 2006. Formerly, Dean, 2000-2002, University of Rochester School of Medicine and Dentistry, Professor of Medical Humanities and Psychiatry, 1997-2002. Board Member, Rock and Roll
Hall of Fame.
Retired Managing Director and former General Partner at Goldman Sachs, retiring in 2008. After joining Goldman Sachs in 1992, served at various times the Head of Technology, Head of Operations, and Co-Chairman of the Global Control and Compliance Committee. Founding Trustee of the Linden
Trust for Conservation, Trustee of Resources for the Future, Co-Chairman of the Board of Directors of the World Wildlife Fund and co-founder of, and senior advisor to, the Redstone Strategy Group. Member, Energy Initiative Advisory Board, Massachusetts Institute of Technology.
R.W. Purcell Professor of Finance at Johnson Graduate School of Management, Cornell University, where she has taught since 1979. Chair of the board of Investment Technology Group, Inc. since 2007, and member of the board since 2003. Director of New Star Financial, Inc. and Chair of the FINRA
Economic Advisory Board.
Former Chairman and Chief Executive Officer, Avaya Inc. from 2002 to 2006 and President and Chief Executive Officer from 2000-01 Formerly, Executive Vice President and Chief Financial Officer, Lucent Technologies from 1996 to 2000. Member and Former Chairman of the Board of Worcester
Polytechnic Institute, overseer of the Tuck School of Business Administration at Dartmouth College, and trustee of the Committee for Economic Development. Director of Sanford C. Bernstein Fund Inc.
Sidney A. Ribeau, 12/3/47 Dorothy K. Robinson, 2/18/51 David L. Shedlarz, 4/17/48 David F. Swensen, 1/26/54 Marta Tienda, 8/10/50 Rosalie J. Wolf, 5/8/41 Officer—Trustees Roger W. Ferguson, Jr., 10/28/51 Other TIAA Executive Officers Virginia M. Wilson, 7/22/54 94
President, Howard University since 2008. Formerly, President, Bowling Green State University, 1995-2008. Director, Worthington Industries.
Vice President and General Counsel, Yale University since 1995; Formerly General Counsel, Yale University, 1986-1995. Trustee, Newark Public Radio, Inc. Director, Yale Southern Observatory, Inc., Youth Rights Media, Inc., and Friends of New Haven Legal Assistance.
Retired Vice Chairman of Pfizer Inc. from 2006 to 2007, Executive Vice President from 1999 to 2005 and Chief Financial Officer of Pfizer from 1995 to 2005. Director, Pitney Bowes Inc., and the Hershey Corporation. Director, Multiple Sclerosis Society of New York City Chapter.
Chief Investment Officer, Yale University since 1985, and adjunct professor of investment strategy at Yale School of Management and lecturer in Yale’s Department of Economics. Member, Brookings Institution and President Obama’s Economic Recovery Advisory Board. Senior Trustee of the Carnegie
Institution for Science and Hamden Hall Country Day School. Fellow of the American Academy of Arts and Sciences.
Maurice P. During ‘22 Professor of Demographic Studies and Professor of Sociology in Public Affairs, Princeton University, since 1997. Visiting Research Scholar at the New York University Center for Advanced Research in Social Sciences, 2010 to 2011. Director, Office of Population Research,
Princeton University, 1998-2002. Commissioner, National Key Indicators Commission. Trustee, Sloan Foundation, and Jacobs Foundation. Member of Visiting Committee, Harvard University School of Government. Member, Adrenalina Research Advisory Board.
Managing Partner, Botanica Capital Partners LLC. Formerly, Senior Advisor and Managing Director, Offit Hall Capital Management LLC and its predecessor company, Laurel Management Company LLC from 2001 to 2003; formerly, Treasurer and Chief Investment Officer, The Rockefeller Foundation.
Director, North European Oil Royalty Trust, Director and former Chairman of The Sanford C. Bernstein Fund, Inc. Member of the Brock Capital Group, LLC.
President and Chief Executive Officer of TIAA and CREF since 2008. Formerly, Chairman of Swiss Re America Holding Corporation and Head of Financial Services and member of the Executive Committee, Swiss Re from 2006 to 2008; Vice Chairman and member of the Board of the U.S. Federal
Reserve from 1999 to 2006 and a member of its Board of Governors from 1997 to 1999; and Partner and Associate, McKinsey & Company from 1984 to 1997. Currently a member of the advisory board of Brevan Howard Asset Management LLP, a director of International Flavors and Fragrances, Inc., and a member
of the President’s Council on Jobs and Competitiveness. Fellow of the American Academy of Arts & Sciences and member of its Commission on the Humanities and Social Sciences. Board member at the Institute for Advanced Study, Memorial Sloan-Kettering Cancer Center, and the Committee for Economic
Development. Member of the Harvard University Visiting Committee for the Memorial Church, the Economic Club of New York, the Council on Foreign Relations and the Group of Thirty.
Executive Vice President and Chief Financial Officer, TIAA and CREF since 2010. Served from 2006 to 2009 as Executive Vice President and Chief Financial Officer of Wyndham Worldwide Corporation, one of the world’s largest hospitality firms, following its 2006 spin-off from Cendant Corporation, a
multinational holding company with operations in the real estate, travel, car rental, hospitality, mortgage banking and other service sectors. Served from 2003 to 2006 as Cendant’s Executive Vice President and Chief Accounting Officer. Corporate controller of MetLife, Inc. from 1999 to 2003 and was senior vice
president and controller of Transamerica Corporation (which was acquired by AEGON NV in 1999) from 1995 to 1999. Prior to 1995,
was an audit partner at Deloitte & Touche LLP. Currently a director of the Los Angeles Child Guidance Clinic and a trustee and vice chair for Catholic Charities in New York. Scott C. Evans, 5/11/59 Edward D. Van Dolsen, 4/21/58 Jorge Gutierrez, 11/26/61 William J. Mostyn III, 1/18/48 Portfolio Management Team Margaret A. Brandwein, 11/26/46 Thomas C. Garbutt, 10/12/58 Audit Committee Financial Expert On August 20, 2003, the Board of Trustees of TIAA determined that Rosalie J. Wolf was qualified and would serve as the audit committee financial expert on TIAA’s audit committee. Ms. Wolf is independent (as that term is used in Item 7(d)(3)(iv) of Schedule 14A under the Securities Exchange Act of 1934) and
has not accepted, directly or indirectly, any consulting, advisory or other compensatory fee from TIAA, other than in her capacity as Trustee. Code of Ethics The Board of Trustees of TIAA has a code of ethics for senior financial officers, including its principal executive officer, principal financial officer, principal accounting officer, or controller, and persons performing similar functions, in conformity with rules promulgated under the Sarbanes-Oxley Act of 2002. The
code of ethics is filed as an exhibit to this annual report. During the reporting period, there were no implicit or explicit waivers granted by the Registrant from any provision of the code of ethics. ITEM 12. SECURITY OWNERSHIP OF CERTAIN BENEFICIAL OWNERS AND MANAGEMENT AND RELATED STOCKHOLDER MATTERS. Not applicable. 95
Executive Vice President of TIAA since 1999 and Head of Asset Management since 2006 of TIAA and CREF, the TIAA-CREF Funds, the TIAA-CREF Life Funds and TIAA Separate Account VA-1 (collectively, the “TIAA-CREF Funds”). Also served as Chief Investment Officer of TIAA between
2004 and 2006 and the TIAA-CREF Funds between 2003 and 2006. Trustee, IFRS Foundation; member of the ABP Investment Committee of Stichting Pensioenfond BP/Algemene; and member of the Tufts University Investment Committee.
Executive Vice President and Chief Operating Officer of TIAA and CREF since 2010. Formerly Executive Vice President, Product Development and Management of TIAA from 2009 to 2010, Executive Vice President, Institutional Client Services from 2006 to 2009, and Executive Vice President, Product
Management of TIAA from 2005 to 2006, and Executive Vice President of the TIAA-CREF Funds since 2008. Also served as Senior Vice President, Pension Products from 2003 to 2006.
Vice President and Treasurer, TIAA, since September 2008. Assistant Treasurer, TIAA from 2004 to 2008.
Senior Vice President and Corporate Secretary of TIAA and the TIAA-CREF Funds since April 2008; Deputy General Counsel and Corporate Secretary of Bank of America Corporation from 2005 to 2007; Deputy General Counsel, Secretary and Corporate Governance Officer of The Gillette Company
from 1974 to 2005.
Managing Director and Portfolio Manager, TIAA Real Estate Account since 2004. From 2001 to 2004, Head of Commercial Mortgages—West Coast for TIAA.
Managing Director and Head of Global Real Estate, TIAA.
ITEM 13. CERTAIN RELATIONSHIPS AND RELATED TRANSACTIONS, AND DIRECTOR INDEPENDENCE. The TIAA general account plays a significant role in operating the Real Estate Account, including providing a liquidity guarantee, and investment advisory, administrative, and other services. In addition, Services, a wholly owned subsidiary of TIAA, provides distribution services for the Account. Liquidity Guarantee. If the Account’s liquid assets and its cash flow from operating activities and participant transactions are insufficient to fund redemption requests, the TIAA general account has agreed to purchase liquidity units. TIAA thereby guarantees that a participant can redeem accumulation
units at their net asset value next determined. For the year ended December 31, 2010, the Account expensed $13.1 million for this liquidity guarantee from TIAA through a daily deduction from the net assets of the Account. During 2010 and through the date of this annual report, the TIAA general account has not
purchased any additional liquidity units. Investment Advisory and Administration Services/Mortality and Expense Risks Borne by TIAA. Deductions are made each valuation day from the net assets of the Account for various services required to manage investments, administer the Account and distribute the contracts. These services are
performed at cost by TIAA and Services. Deductions are also made each valuation day to cover mortality and expense risks borne by TIAA. For the year ended December 31, 2010, the Account expensed $50.2 million for investment advisory services and $4.4 million for mortality and expense risks provided/borne by TIAA. For the same period, the Account expensed $28.1 million for administrative and distribution services provided by TIAA and
Services, respectively. ITEM 14. PRINCIPAL ACCOUNTANT FEES AND SERVICES. PricewaterhouseCoopers LLP (“PwC”) performs independent audits of the registrant’s financial statements. To maintain auditor independence and avoid even the appearance of conflicts of interest, the registrant, as a policy, does not engage PwC for management advisory or consulting services. Audit Fees. PwC’s fees for professional services rendered for the audits of the registrant’s annual financial statements for the years ended December 31, 2010 and 2009 and review of financial statements included in the registrant’s quarterly reports were $879,000 and $862,650, respectively. Audit-Related Fees. PwC audit-related fees services rendered to the registrant for the years ended December 31, 2010 and 2009 were $192,402 and $72,543, respectively. Tax Fees. PwC had no tax fees with respect to registrant for the years ended December 31, 2010 and 2009. All Other Fees. Other than as set forth above, there were no additional fees with respect to registrant. Preapproval Policy. In June of 2003, the audit committee of TIAA’s Board of Trustees (“Audit Committee”) adopted a Preapproval Policy for External Audit Firm Services (the “Policy”), which applies to the registrant. The Policy describes the types of services that may be provided by the independent
auditor to the registrant without impairing the auditor’s independence. Under the Policy, the Audit Committee is required to preapprove services to be performed by the registrant’s independent auditor in order to ensure that such services do not impair the auditor’s independence. The Policy requires the Audit Committee to: (i) appoint the independent auditor to perform the financial statement audit for the registrant and certain of its affiliates, including approving the terms of the engagement and (ii) preapprove the audit, audit-related and tax services to be provided by the independent
auditor and the fees to be charged for provision of such services from year to year. 96
ITEM 15. EXHIBITS AND FINANCIAL STATEMENT SCHEDULES.
(1)
(A)
Distribution Agreement for the Contracts Funded by the TIAA Real Estate Account, dated as of January 1, 2008, by and among Teachers Insurance and Annuity Association of America, for itself and on behalf of the Account, and TIAA-CREF Individual & Institutional Services, LLC.(5)
(3)
(A)
Charter of TIAA.(8)
(B)
Restated Bylaws of TIAA (as amended).(9)
(4)
(A)
Forms of RA, GRA, GSRA, SRA, IRA Real Estate Account Endorsements(2), Keogh Contract,(3) Retirement Select and Retirement Select Plus Contracts and Endorsements(1) and Retirement Choice and Retirement Choice Plus Contracts.(3)
(B)
Forms of Income-Paying Contracts(2)
(C)
Form of Contract Endorsement for Internal Transfer Limitation(10)
(10)
(A)
Independent Fiduciary Agreement, dated February 22, 2006, by and among TIAA, the Registrant, and Real Estate Research Corporation(4)
(B)
Amendment to Independent Fiduciary Agreement, dated December 17, 2008, between TIAA, on behalf of the Registrant, and Real Estate Research Corporation(6)
(C)
Custodian Agreement, dated as of March 3, 2008, by and between TIAA, on behalf of the Registrant, and State Street Bank and Trust Company, N.A.(7)
*(14)
Code of Ethics of TIAA
*(31)
Rule 13a-15(e)/15d-15(e) Certifications
*(32)
Section 1350 Certifications
*
Filed herewith. (1) Previously filed and incorporated herein by reference to the Account’s Pre-Effective Amendment No. 1 to the Registration Statement on Form S-1 filed April 29, 2004 (File No. 333-113602). (2) Previously filed and incorporated herein by reference to the Account’s Post-Effective Amendment No. 2 to the Registration Statement on Form S-1 filed April 30, 1996 (File No. 33-92990). (3) Previously filed and incorporated herein by reference to the Account’s Post-Effective Amendment No. 1 to the Registration Statement on Form S-1 filed May 2, 2005 (File No. 333-121493). (4) Previously filed and incorporated herein by reference to Exhibit 10.(a) to the Annual Report on Form 10-K of the Account for the period ended December 31, 2005, filed with the Commission on March 15, 2006 (File No. 33-92990). (5) Previously filed and incorporated herein by reference to the Account’s Current Report on Form 8-K, filed with the Commission on January 7, 2008 (File No. 33-92990). (6) Previously filed and incorporated herein by reference to the Account’s Current Report on Form 8-K, filed with the Commission on December 22, 2008 (File No. 33-92990). (7) Previously filed and incorporated herein by reference to Exhibit 10.(b) to the Annual Report on Form 10-K of the Account for the fiscal year ended December 31, 2007 and filed with the Commission on March 20, 2008 (File No. 33-92990). (8) Previously filed and incorporated by reference to Exhibit 3(A) to the Account’s Quarterly Report on Form 10-Q for the quarter ended June 30, 2009 and filed with the Commission on August 13, 2009 (File No. 33-92990). (9) Previously filed and incorporated by reference to Exhibit 3(B) to the Account’s Quarterly Report on Form 10-Q for the quarter ended June 30, 2009 and filed with the Commission on August 13, 2009 (File No. 33-92990). (10) Previously filed and incorporated by reference to Exhibit 4(C) to the Account’s Quarterly Report on Form 10-Q for the quarter ended September 30, 2010 and filed with the Commission on November 12, 2010 (File No. 33-92990). 97
Pursuant to the requirements of the Securities Exchange Act of 1934, as amended, the registrant, TIAA Real Estate Account, has duly caused this Annual Report on Form 10-K to be signed on its behalf by the undersigned, thereunto duly authorized, in New York, New York, on the 17 day of March, 2011.
TIAA REAL ESTATE ACCOUNT
By:
TEACHERS INSURANCE AND
March 17, 2011
By:
/s/ Roger W. Ferguson, Jr.
Roger W. Ferguson, Jr.
President and Chief Executive
Officer and Trustee Pursuant to the requirements of the Securities Exchange Act of 1934, as amended, this Report has been signed by the following trustees and officers of Teachers Insurance and Annuity Association of America, in the capacities and on the dates indicated.
Signature
Title
Date
/s/ ROGER W. FERGUSON, JR. President and Chief Executive Officer 3/17/11 /s/ VIRGINIA M. WILSON Executive Vice President and Chief Financial 3/17/11 /s/ RONALD L. THOMPSON Chairman of the Board of Trustees 3/17/11 /s/ JEFFREY R. BROWN Trustee 3/17/11 /s/ ROBERT C. CLARK Trustee 3/17/11 /s/ LISA W. HESS Trustee 3/17/11 /s/ EDWARD M. HUNDERT, M.D. Trustee 3/17/11 /s/ LAWRENCE H. LINDEN Trustee 3/17/11 /s/ MAUREEN O’HARA Trustee 3/17/11 /s/ DONALD K. PETERSON Trustee 3/17/11 /s/ SIDNEY A. RIBEAU Trustee 3/17/11 /s/ DOROTHY K. ROBINSON Trustee 3/17/11 /s/ DAVID L. SHEDLARZ Trustee 3/17/11 /s/ DAVID F. SWENSEN Trustee 3/17/11 /s/ MARTA
TIENDA Trustee 3/17/11 /s/ ROSALIE J. WOLF Trustee 3/17/11 98
ANNUITY ASSOCIATION OF AMERICA
(Principal Executive Officer) and Trustee
Officer (Principal Financial and Accounting Officer)
SUPPLEMENTAL INFORMATION TO BE FURNISHED WITH REPORTS FILED PURSUANT TO Because the Registrant has no voting securities, nor its own management or board of directors, no annual report or proxy materials will be sent to contract owners holding interests in the Account. 99
SECTION 15(D) OF THE ACT BY REGISTRANTS WHICH HAVE NOT REGISTERED
SECURITIES PURSUANT TO SECTION 12 OF THE ACT