Attached files
| file | filename |
|---|---|
| EX-99.2 - EXHIBIT 99.2 - UNITED COMMUNITY BANKS INC | ex99-2.pdf |
| EX-99.1 - EXHIBIT 99.1 - UNITED COMMUNITY BANKS INC | ex99-1.pdf |
| EX-99.1 - EXHIBIT 99.1 - UNITED COMMUNITY BANKS INC | tm2033845d1_ex99-1.htm |
| 8-K - FORM 8-K - UNITED COMMUNITY BANKS INC | tm2033845d1_8k.htm |
Exhibit 99.2

3 Q Investor Presentation October 20, 2020
Disclosures CAUTIONARY STATEMENT This Investor Presentation contains forward - looking statements about United Community Banks, Inc . (“United”), as defined in federal securities laws . Statements that are not historical or current facts, including statements about beliefs and expectations, are forward - looking statements and are based on information available to, and assumptions and estimates made by, management as of the date hereof . Because forward - looking statements involve inherent risks and uncertainties, our actual results may differ materially from those expressed or implied in any such statements . The COVID - 19 pandemic is adversely impacting United, its employees, customers , vendors, counterparties, and the communities that it serves . The ultimate extent of the impact of COVID — 19 on United’s financial position, results of operations, liquidity, and prospects is highly uncertain . United’s results could be adversely affected by, among other things, volatility in financial markets, continued deterioration of economic and business conditions, further increases in unemployment rates, deterioration in the credit quality of United’s loan portfolio, deterioration in the value of United’s investment securities, and changes in statutes, regulations, and regulatory policies or practices . For a discussion of these and other risks that may cause such forward - looking statements to differ materially from actual results, please refer to United’s filings with the Securities and Exchange Commission, including its 2019 Annual Report on Form 10 - K and Form 10 - Q for the quarters ended March 31 , 2020 and June 30 , 2020 under the sections entitled “Cautionary Note Regarding Forward - Looking Statements” and “Risk Factors . ” Forward - looking statements speak only as of the date they are made, and we undertake no obligation to update or revise forward - looking statements . NON - GAAP MEASURES This Investor Presentation includes financial information determined by methods other than in accordance with generally accepted accounting principles (“GAAP”) . This financial information includes certain operating performance measures, which exclude merger - related and other charges that are not considered part of recurring operations . Such measures include : “Earnings per share – operating,” “Diluted earnings per share – operating,” “Tangible book value per share,” “Return on common equity – operating,” “Return on tangible common equity – operating,” “Return on assets – operating ,” “Return on assets – pre - tax pre - provision, excluding merger - related and other charges,” “ Efficiency ratio – operating,” “Expenses – operating,” and “Tangible common equity to tangible assets . ” Management has included these non - GAAP measures because it believes these measures may provide useful supplemental information for evaluating United’s underlying performance trends . Further, management uses these measures in managing and evaluating United’s business and intends to refer to them in discussions about our operations and performance . Operating performance measures should be viewed in addition to, and not as an alternative to or substitute for, measures determined in accordance with GAAP, and are not necessarily comparable to non - GAAP measures that may be presented by other companies . To the extent applicable, reconciliations of these non - GAAP measures to the most directly comparable GAAP measures can be found in the ‘Non - GAAP Reconciliation Tables’ included in the exhibits to this Presentation . 2

163 BANKING OFFICES ACROSS THE SOUTHEAST #1 IN CUSTOMER SATISFACTION with Retail Banking in the Southeast – J.D. Power United Community Banks, Inc. $ 17.2 BILLION IN ASSETS $2.4 BILLION IN AUA (1) $ 14.6 BILLION IN TOTAL DEPOSITS WORLD’S BEST BANKS in 2019 & 2020 - Forbes 2020 TOP WORKPLACES In S.C. & Atlanta – Greenville Business Magazine & Atlanta Journal Constitution BEST IN CLASS CUSTOMER SATISFACTION - Customer Service Profiles $0.18 QUARTERLY DIVIDEND UP 6% YOY 3 Regional Full Service Branch Network National Navitas and SBA Markets Premier Southeast Regional Bank x Metro - focused branch network with locations in the fastest growing MSAs in the Southeast x 156 branches, 7 loan production sites, and 4 mortgage loan offices across five SE states x Recent expansion into key Florida markets with Seaside acquisition x Top 10 market share in GA and SC x Proven ability to integrate bank transactions – 8 transactions over the past 10 years Committed to Service Since 1950 Extended Navitas and SBA Markets $11.8 BILLION IN TOTAL LOANS Company Overview 13.1% TIER 1 RBC 100 BEST BANKS IN AMERICA f or the seventh consecutive year - Forbes x Offered in 48 states across the continental U.S. x SBA business has both in - footprint and national business (4 specific verticals) x Navitas subsidiary is a small ticket essential use commercial equipment finance provider (1) Assets Under Administration Branches United Community Seaside Bank and Trust

$20.16 $21.22 $21.45 $15.90 $16.95 $17.09 3Q19 2Q20 3Q20 Book Value Per Share GAAP Tangible $0.52 Diluted earnings per share – GAAP $0.55 Diluted earnings per share – operating 1.07% Return on average assets - GAAP 1.14% Return on average assets - operating 1.93% PTPP ROA - operating 0.25% Cost of Deposits 10.1% Return on common equity - GAAP 13.5% Return on tangible common equity - operating 6% YOY growth in b ook value per share 7% YOY growth in tangible book value per share Annualized 3 Q EOP c ore loan growth of 8 % or $227 mm 36% DDA / Total Deposits 3 Q20 Highlights (1) See non - GAAP reconciliation table slides in the Appendix for a reconciliation of operating performance measures to GAAP performance $0.60 $0.32 $0.52 $0.63 $0.32 $0.55 3Q19 2Q20 3Q20 Diluted Earnings Per Share GAAP Operating (1) 1.51% 0.71% 1.07% 1.58% 0.72% 1.14% 3Q19 2Q20 3Q20 Return on Assets GAAP Operating $0.17 $0.18 $0.18 3Q19 2Q20 3Q20 Dividends Per Share Dividends per share (1) (1) (1) 4 (1) (1) (1)

High Quality Balance Sheet / Earnings Strength 5 Capital x 2 Q20 TCE + reserves is substantially higher compared to peers; providing greater stability and protection against losses x UCBI ranks 15 th highest among the 50 KRX peers (1) Pre - tax pre - provision - operating ROA calculated as ROA minus the effect of income tax expense, provision expense and merger - related and other charges Source: S&P Global Markets Profitability x 2 Q20 PTPP ROA - operating is 19% higher compared to peers x UCBI ranks 12 th highest PTPP ROA among the 50 KRX peers Liquidity x Significantly lower 2Q20 loan to deposit ratio compared to peers x UCBI has the 12 th lowest loan to deposit ratio among the 50 KRX peers Funding x Funding base comprised mostly of core deposits; 2Q20 funding costs remain below the peer median x UCBI ranks 23 rd lowest among the 50 KRX peers 1.87% 1.58% UCBI KRX Median PTPP ROA - operating (1) 0.38% 0.40% UCBI KRX Median Cost of Deposits 81% 90% UCBI KRX Median Average Loans / Deposits % 14.00% 13.07% UCBI KRX Median TCE + ALLL / Total Loans

$62.1 $67.8 11.4% 9.0% 5.7% 2.9% (1) Includes MSAs with a population of greater than 300,000 (2) Data by MSA shown on a weighted average basis by deposits Located in Most of the Top 20 Markets in the Region United / Seaside MSA Presence (Branch and or LPO) Projected Population Growth (2 ) 2021 – 2026 (%) Projected Household Income Growth (2) 2021 – 2026 (%) Median Household Income (2) ($ in thousands) High - Growth MSAs in the Southeast UCBI Focused on High - Growth MSAs in Southeast National Avg. National Avg. National Avg. 6 Fastest Growing ‘21 – ’26 Proj. ’21 ‘26 Proj. Median Southeast MSAs (1) Pop. Growth % Population Household Income 1.Myrtle Beach, SC 8.49 518,050 $62,042 2.Cape Coral, FL 7.42 785,277 $68,827 3.Raleigh, NC 7.30 1,420,576 $91,380 4.Charleston, SC 7.30 823,428 $78,951 5.Orlando, FL 7.09 2,685,903 $72,412 6.Lakeland, FL 6.98 738,482 $62,730 7.Naples, FL 6.96 393,750 $84,332 8.Spartanburg, SC 6.81 327,475 $66,443 9.Sarasota, FL 6.79 855,242 $73,471 10.Charlotte, NC 6.61 2,696,789 $77,692 11.Wilmington, NC 6.57 304,661 $60,070 12.Jacksonville, FL 6.17 1,602,120 $73,563 13.Port St. Lucie, FL 6.10 495,076 $68,635 14.Greenville, SC 6.08 937,813 $68,413 15.Tampa, FL 6.06 3,257,479 $67,300 16.Durham-Chapel Hill, NC 5.93 655,218 $74,713 17.Nashville, TN 5.91 1,980,990 $80,404 18.Fayetteville, AR 5.88 550,113 $71,570 19.Daytona Beach, FL 5.81 678,826 $65,579 20.Atlanta, GA 5.73 6,137,994 $85,730

39% 9% 21% 1% 11% 6% 2% 11% Residential Mortgage Diversified Loan Portfolio Reduces Risk 3Q20 Total Loans $11.8 billion (1) C&I includes commercial and industrial loans, owner - occupied CRE loans and Navitas (equipment finance) loans x Loans increased $1.67 billion in 3Q20, with $1.44 billion coming from Seaside x 3Q20 core loan growth of $227 million, or 8% annualized x 3Q20 Seaside loan growth of $11.8 million 7 C&I Commercial Construction CRE Other Consumer PPP Home Equity Residential Construction (1)

8 x The allowance for credit losses increased $30 million in 3Q20 and $81 million from year - end x We reviewed multiple scenarios and examined and stressed our inputs x The current environment is inherently unpredictable due to the impact of COVID - 19; w e continuously review multiple economic scenarios and the potential mitigants of government action Allowance for Credit Losses (ACL) $ in millions x Day 2 provision for Non - PCD acquired loans was $9.8 million plus $0.9 million for unfunded commitments for a total of $10.7 million Note: Includes PPP loans, which have an interest mark of approximately $2.6 million Seaside Purchase Accounting Marks % of Total Credit Mark Interest Mark Total Mark PCD Loans 19% $11.1 $8.8 $19.9 Non-PCD Loans 81% $8.0 $18.3 $26.3 ACL - Loans 62,089$ 68,969$ 81,905$ 103,669$ 134,256$ ACL - Unfunded Commitments 3,458$ 5,329$ 6,470$ 12,100$ 11,920$ ACL - Allowance for Credit Losses* 65,547$ 0.74% 74,298$ 88,375$ 0.99% 115,769$ 1.28% 146,176$ 1.39% 4Q19 Day 1 CECL 1/1/2020 1Q20 2Q20 3Q20 * Excluding PPP loans

Strong Credit Quality in 3Q 9 x 3 Q20 NCOs of $2.5 million, or 0.09% annualized • The quarter b enefited from $4.2 million of recoveries x The provision for credit losses was $21.8 million, including $10.7 million Day 2 CECL provision for Seaside x NPAs relatively flat compared to last quarter and last year 0.12% 0.25% 0.09% 3Q19 2Q20 3Q20 $3.1 $33.5 $21.8 3Q19 2Q20 3Q20 0.24% 0.32% 0.29% 3Q19 2Q20 3Q20 Net Charge - Offs as % of Average Loans Provision for Credit Losses $ in millions Non - Performing Assets as % of Total Assets

Loan Deferrals Improved Significantly in 3Q 10 x Loan payment deferrals have continued to improve from a peak of $1.9 billion, or 15.9% of the total loan portfolio as of June 30 th to $365 million, or 3.1% of the total loan portfolio as September 30 th (1) June 30, 2020 loan deferrals include Seaside’s results, although the acquisition closed on July 1, 2020. Payment Deferrals by Loan Type $ in thousands $ Deferred % of Total Loan Portfolio % of Category Total $ Deferred % of Total Loan Portfolio % of Category Total Hotels 219,169 1.88% 70.8% 122,601 1.04% 37.9% Restaurants 128,570 0.93% 39.5% 118,800 1.01% 35.2% Senior Care 107,880 1.10% 20.9% 44,384 0.38% 8.5% Equipment Finance 181,914 8.97% 23.4% 19,773 0.17% 2.4% All Other Commercial 1,044,297 1.56% 14.2% 45,030 0.38% 0.6% One-to-Four Family 160,893 1.38% 7.4% 13,972 0.12% 0.6% Other Consumer 6,857 0.06% 3.3% 466 0.00% 0.2% Total 1,849,580$ 15.89% 365,026$ 3.08% June 30, 2020 September 30, 2020

Capital Ratios Remain Strong x Capital ratios significantly above “well capitalized ” x Closed the Seaside acquisition on 7/1/2020, which reduced our capital ratios as expected x Quarterly dividend of $0.18 per share 3 Q20 Highlights CET1 Ratio (%) Tier 1 Ratio (%) Total Capital Ratio (%) Holding Company 3Q19 1Q20 2 Q20 3Q20 * Common Equity Tier 1 Capital 12.4 % 12.9 % 12.9 % 12.3 % Tier 1 Risk - Based Capital 12.7 13.1 14.0 13.1 Total Risk - Based Capital 14.5 14.9 16.1 15.2 Leverage 10.2 10.4 10.3 9.4 Tangible Common Equity to Tangible Assets 10.2 10.2 9.1 8.9 12.0% 12.2% 13.0% 12.9% 12.9% 12.3% 4Q17 4Q18 4Q19 1Q20 2Q20 3Q20* 12.2% 12.4% 13.2% 13.1% 14.0% 13.1% 4Q17 4Q18 4Q19 1Q20 2Q20 3Q20* 13.1% 14.3% 15.0% 14.9% 16.1% 15.2% 4Q17 4Q18 4Q19 1Q20 2Q20 3Q20* *3Q20 regulatory capital ratios are preliminary 11

$119.3 $109.3 $128.5 3Q19 2Q20 3Q20 Net Interest Revenue / Margin (1) $ in millions x Net interest margin decreased by 15 bps from 2Q20, resulting from 23 bps of core margin pressure offset by a 8 bps increase in purchased loan accretion x Of the core margin pressure,10 bps resulted from the full impact of excess liquidity from 2Q’s liquidity and PPP increases 4.12% 3.42% 3.27% Net Interest Revenue Net Interest Margin (1) Net interest margin is calculated on a fully - taxable equivalent basis (1) 12 3 Q20 NIM Compression 3.42% 3.27% - 0.10% - 0.13% 0.08% 2Q NIM Excess Liquidity / PPP Low Interest Rates / Seaside Purchased Loan Accretion 3Q NIM (%)

36% 21% 24% 6% 13% DDA MMDA Savings Time NOW x Total deposits up $ 1.9 billion from 2Q20 • Seaside contributed $1.8 billion to total deposits in 3Q20 x Core transaction deposits excluding Seaside were up $0.4 billion, or 15 % annualized from 2Q20 and up $2.3 billion, or 32% YOY • Seaside added $1.2 billion of core transaction deposits in 3Q20 x Cost of deposits down 13 bps to 0.25% in 3Q20, driven by continued noninterest bearing deposit growth and rate cuts Valuable Deposit Mix 3 Q20 Total Deposits $ 14.6 billion 3 Q20 Highlights Strong Core Deposit Growth Over Time 13 4Q18 4Q19 1Q20 2Q20 3Q20 Total Deposits Trend $ in billions DDA NOW MMDA Savings Time $10.5 $10.9 $11.0 $12.7 $14.6 (1) Transaction accounts include demand deposits, interest - bearing demand, money market and savings accounts, excluding public funds deposits
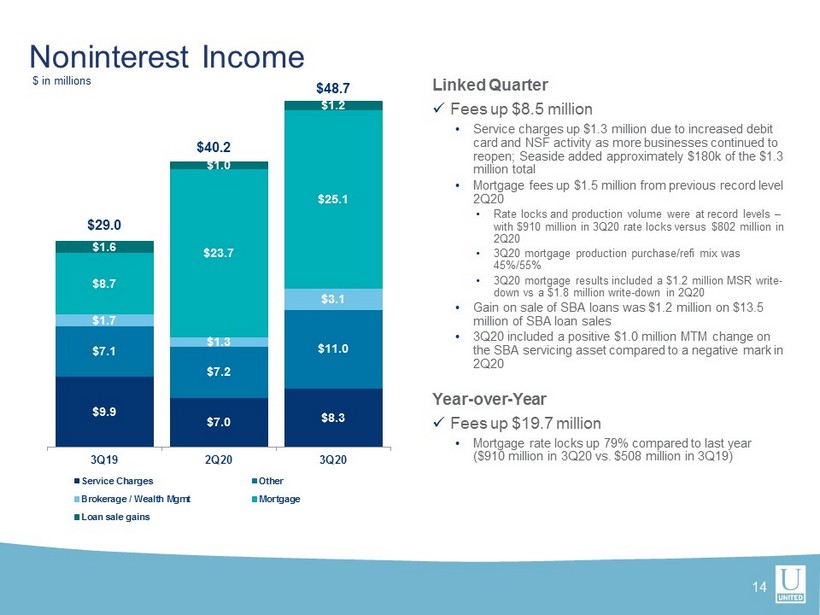
Noninterest Income $ in millions $9.9 $7.0 $8.3 $7.1 $7.2 $11.0 $1.7 $1.3 $3.1 $8.7 $23.7 $25.1 $1.6 $1.0 $1.2 3Q19 2Q20 3Q20 Service Charges Other Brokerage / Wealth Mgmt Mortgage Loan sale gains $ 29.0 $40.2 $48.7 Linked Quarter x Fees up $8.5 million • Service charges up $1.3 million due to increased debit card and NSF activity as more businesses continued to reopen; Seaside added approximately $180k of the $1.3 million total • Mortgage fees up $ 1.5 million from previous record level 2Q20 • Rate locks and production volume were at record levels – with $910 million in 3Q20 rate locks versus $802 million in 2Q20 • 3Q20 mortgage production purchase/refi mix was 45%/55% • 3 Q20 mortgage results included a $1.2 million MSR write - down vs a $1.8 million write - down in 2Q20 • Gain on sale of SBA loans was $1.2 million on $13.5 million of SBA loan sales • 3Q20 included a positive $1.0 million MTM change on the SBA servicing asset compared to a negative mark in 2Q20 Year - over - Year x Fees up $19.7 million • Mortgage rate locks up 79% compared to last year ($910 million in 3 Q20 vs. $508 million in 3Q19) 14

15 x UCBI funded 10,994 PPP loans totaling $1.1 billion with an average loan size of $106 thousand x Seaside funded 789 PPP loans totaling $220 million with an average loan size of $278 thousand x 56% of our PPP customers, representing $719 million in loans, have input completed forgiveness materials into our portal x The SBA has put forth a streamlined forgiveness process for loans $50,000 and below; UCBI has 6,508 of such loans totaling $124 million. The 6,508 individual loans represents 60% of our total n umber of loans PPP Update $0.2 $1.1 $- $0.2 $0.4 $0.6 $0.8 $1.0 $1.2 PPP Totals $ billions
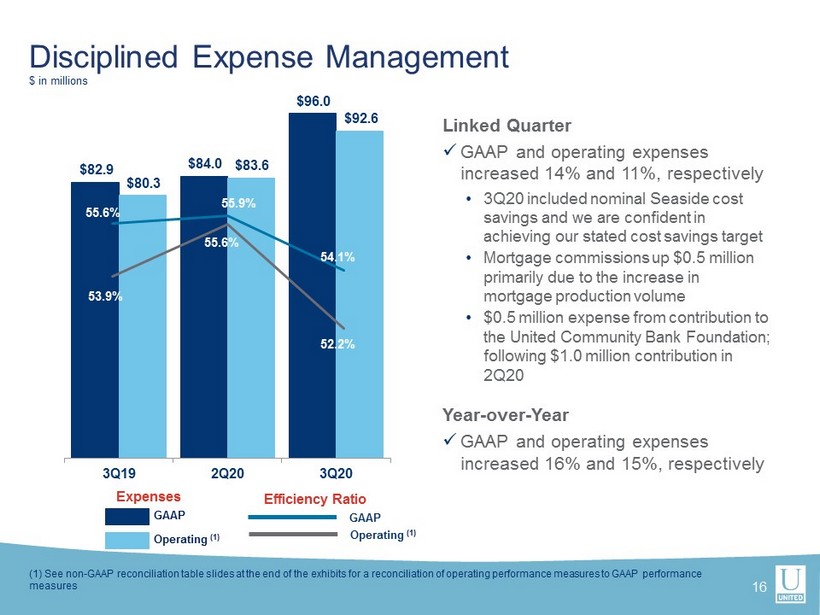
$82.9 $84.0 $96.0 $80.3 $83.6 $92.6 3Q19 2Q20 3Q20 55.6% 55.9% 54.1% 53.9% 55.6% 52.2% GAAP Operating (1) Efficiency Ratio Expenses Disciplined Expense Management $ in millions Linked Quarter x GAAP and operating expenses increased 14% and 11%, respectively • 3Q20 included nominal Seaside cost savings and we are confident in achieving our stated cost savings target • Mortgage commissions up $0.5 million primarily due to the increase in mortgage production volume • $0.5 million expense from contribution to the United Community Bank Foundation; following $1.0 million contribution in 2Q20 Year - over - Year x GAAP and operating expenses increased 16% and 15%, respectively Operating (1) GAAP (1) See non - GAAP reconciliation table slides at the end of the exhibits for a reconciliation of operating performance measures to GAAP p erformance measures 16
Digital Adoption Increasing 17 x Website: x 19.5% increase in ucbi.com users YOY x Since March, 65,000 users have at least started an online application to open a loan/deposit account or enroll in online banking x Digital Banking: x YTD, 15% of all new consumer deposit accounts were opened online x 135% increase YoY in online account opening x Active online/mobile banking users up 9% YTD x Social Media: x Social media followers up 22% YTD x 24% YOY growth in traffic from social media channels to ucbi.com

Member FDIC. © 2020 United Community Bank 3 Q INVESTOR PRESENTATION Exhibits

x Continuous review and enhancements to credit policy x Quarterly reviews of portfolio limits and concentrations x Centralized underwriting and approval process for consumer credit x Distributed Regional Credit Officers (reporting to Credit) for commercial x Dedicated Special Assets team x Eight of the top twelve credit leaders recruited post - crisis Strong Credit Culture & Disciplined Credit Processes x In 2014, centralized and streamlined consumer underwriting and related functions x Significantly strengthened commercial process for approvals and monitoring x CEO with deep knowledge and experience in credit x 2015 Rob Edwards brought in to lead team (BB&T, TD Bank) x Senior credit risk team includes seasoned banking veterans with significant large bank credit risk experience, through multiple cycles x Granular portfolio, with concentration limits set for all segments of the portfolio x Five state franchise with mix of metro and rural markets x Recent expansion into Florida market with Three Shores acquisition x Diversification with national Navitas and SBA businesses x Construction & CRE ratio as a percentage of Total RBC = 69 %/197% x C&D > 30% in cycle, now 10.5% x Land within C&D is only 19% of total C&D x Navitas 7.0% of loans x Granular product concentration limits Process Change Add Significant Talent Concentration Management: Size Concentration Management: Product Concentration Management: Geography 1 2 3 4 5 Structure Policy Exposure & Industry Limits $ in millions House Lending Limit Relationship Limit Legal Lending Limit Top 25 Relationships (6% total loans) $ 42 3 20 35 706 SNC’s outstanding 292 SNC’s committed 434 x Weekly Senior Credit Committee; approval required for all relationship exposure > $12.5 million x Continuous external loan review x Monthly commercial asset quality review x Monthly retail asset quality review meetings Process BUILT TO OUTPERFORM IN THE NEXT CYCLE 19

Retail CRE 20 x Top 50 Retail CRE loans totaled $322 million outstanding, 3% of total loans as of 3Q20 x Average loan size of approximately $4.8 million x Seaside has $44 million of retail CRE as of 3Q20 28% 12% 23% 27% 10% Top 50 UCBI Retail CRE - Property Type Grocery Anchored Single Tenant Anchored Unanchored Mixed Use

Selected Segments – Restaurants & Hotels 21 x Restaurant loans outstanding totaled $337.1 million as of 3Q20, or 3% of total loans x As of 3Q20, $119 million of UCBI restaurant loans were deferred, which equated to approximately 35% of the total restaurant portfolio commitments x Hotel loans outstanding totaled $329.6 million as of 3Q20, or 3% of total loans x Loan to value low at 53% on average for UCBI portfolio x Top Tier UCBI brands represent approximately 56% of total outstanding exposure x Over 50% of hotel loan exposures are located within Atlanta, Columbia, Myrtle Beach, Greenville, Savannah and Florence x As of 3Q20, $122 million of UCBI hotel loans were deferred, which equated to approximately 37% of the total hotel portfolio outstanding (1) Excluding PPP loans 78% 12% 2% 2% 6% Hotels by Product CRE Construction SBA Seaside (1) Navitas 33% 5% 16% 14% 29% 3% Restaurants by Product (1) Owner Occupied RE Construction C&I SBA Navitas Seaside

x Navitas 3 Q20 NCOs = 0.93% x Navitas had a >4% 3 Q20 pretax ROA and could withstand ~ 4.9% in annualized credit losses before reporting a net loss x Navitas ’ cumulative net loss rates have approximated 2 % for the last 10 years x Navitas ACL - Loans equated to 1.87% as of 3Q20 x Rating agencies have historically assigned Navitas originations with expected through - the - cycle loss rates of 3.1% to 3.8 % Credit Quality — Navitas 22 0.67% 0.87% 0.93% 3Q19 2Q20 3Q20 Net Charge - Offs as % of Average Loans x Total Navitas deferrals are only 2% of the total Navitas loan portfolio at 3Q20, improved 90% from 2Q20 x Of Navitas’ top 5 loan categories by industry type, 10% of Navitas’ fitness facility loans are deferred, making up 32% of total Navitas deferrals 1.27% 0.37% 10.24% 3.96% 0.54% Eating Places Physician Offices Fitness Facilities Salons Local Trucking Deferral % by Category for Top 5 Categories 3Q20

Expanding Mortgage Throughout the Footprint x We have been consistently investing in our mortgage business x The total number originators were relatively flat in 2019 and 2020, however we have been continually upgrading talent over the past few quarters, including the lift out of a 15 person team in Raleigh in 3Q19 x Mortgage production per originator, per quarter increased to $6.9 million in 3Q20, or 75% above 3Q19 x Purchase / Refi mix has shifted from 70% / 30% in 3Q19 to 55% / 45% in 3Q20 x Technology investments have also paid off as we have been able to market to our existing customers and also have enabled us to cut processing costs and process times x We continue to hire mortgage originators and are optimistic about the opportunity to overlay the business on the Seaside franchise 4Q18 1Q19 2Q19 3Q19 4Q19 1Q20 2Q20 3Q20 Loans Sold ($ millions) $132 $111 $153 $220 $226 $259 $397 $402 Gain on Sale % 2.6% 2.7% 3.7% 3.4% 3.7% 2.9% 4.5% 5.4% 23 251 312 390 508 411 801 802 910 10 9 13 15 15 17 25 25 5 10 15 20 25 30 100 300 500 700 900 1,100 4Q18 1Q19 2Q19 3Q19 4Q19 1Q20 2Q20 3Q20 Funded Locks / MLO Mortgage Locks ($) Mortgage Locks Mortgage Locks ($ millions) Funded Locks / MLO

Non - GAAP Reconciliation Tables $ in thousands, except per share data 24 ( 1) Merger - related and other charges for 3Q19 include $ 64 thousand of intangible amortization resulting from payments made to executives under their change of control agreements. The resulting intangible assets were being amortized over 12 to 24 months. 3Q19 4Q19 1Q20 2Q20 3Q20 (1) Expenses Expenses - GAAP 82,924$ 81,424$ 81,538$ 83,980$ 95,981$ Merger-related and other charges (2,605) 74 (808) (397) (3,361) Expenses - Operating 80,319$ 81,498$ 80,730$ 83,583$ 92,620$ Diluted Earnings per share Diluted earnings per share - GAAP 0.60$ 0.61$ 0.40$ 0.32$ 0.52$ Merger-related and other charges 0.03 - 0.01 - 0.03 Diluted earnings per share - Operating 0.63 0.61 0.41 0.32 0.55 Book Value per share Book Value per share - GAAP 20.16$ 20.53$ 20.80$ 21.22$ 21.45$ Effect of goodwill and other intangibles (4.26) (4.25) (4.28) (4.27) (4.36) Tangible book value per share 15.90$ 16.28$ 16.52$ 16.95$ 17.09$ Return on Tangible Common Equity Return on common equity - GAAP 12.16 % 12.07 % 7.85 % 6.17 % 10.06 % Effect of merger-related and other charges 0.51 (0.01) 0.16 0.08 0.63 Return on common equity - Operating 12.67 12.06 8.01 6.25 10.69 Effect of goodwill and intangibles 3.71 3.43 2.56 1.84 2.83 Return on tangible common equity - Operating 16.38 % 15.49 % 10.57 % 8.09 % 13.52 %

Non - GAAP Reconciliation Tables $ in thousands, except per share data (1) Merger - related and other charges for 3Q19 include $ 64 thousand of intangible amortization resulting from payments made to executives under their change of control agreements. The resulting intangible assets were being amortized over 12 to 24 months. 25 3Q19 4Q19 1Q20 2Q20 3Q20 (1) Return on Assets Return on assets - GAAP 1.51 % 1.50 % 0.99 % 0.71 % 1.07 % Merger-related and other charges 0.07 - 0.02 0.01 0.07 Return on assets - Operating 1.58 % 1.50 % 1.01 % 0.72 % 1.14 % Return on Assets to return on assets- pre-tax pre-provision Return on assets - GAAP 1.51 % 1.50 % 0.99 % 0.71 % 1.07 % Income tax expense 0.44 0.39 0.27 0.20 0.28 Provision for credit losses 0.10 0.11 0.69 0.95 0.51 Return on assets - pre-tax, pre-provision 2.05 2.00 1.95 1.86 1.86 Merger-related and other charges 0.08 - 0.03 0.01 0.07 Return on assets - pre-tax, pre-provision, excluding merger-related and other charges 2.13 % 2.00 % 1.98 % 1.87 % 1.93 % Efficiency Ratio Efficiency Ratio - GAAP 55.64 % 54.87 % 56.15 % 55.86 % 54.14 % Merger-related and other charges (1.74) 0.05 (0.56) (0.27) (1.90) Efficiency Ratio - Operating 53.90 % 54.92 % 55.59 % 55.59 % 52.24 % Tangible common equity to tangible assets Equity to assets ratio - GAAP 12.53 % 12.66 % 12.54 % 11.81 % 11.47 % Effect of goodwill and other intangibles (2.37) (2.34) (2.32) (2.05) (2.01) Effect of preferred equity - - - (0.64) (0.57) Tangible common equity to tangible assets ratio 10.16 % 10.32 % 10.22 % 9.12 % 8.89 %

Glossary 26 ACL – Allowance for Credit Losses MSA – Metropolitan Statistical Area ALLL – Allowance for Loan Losses MSR – Mortgage Servicing Rights Asset AUA – Assets Under Administration NCO – Net Charge-Offs BPS – Basis Points NIM – Net Interest Margin C&I – Commercial and Industrial NPA – Non-Performing Asset C&D – Commercial and Development NSF – Non-sufficient Funds CECL – Current Expected Credit Losses OO RE – Owner Occupied Commercial Real Estate CET1 – Common Equity Tier 1 Capital PCD – Loans Purchased with Credit Deterioration CRE – Commercial Real Estate PPP – Paycheck Protection Program CSP – Customer Service Profiles PTPP – Pre-Tax, Pre-Provision Earnings DDA – Demand Deposit Account RBC – Risk Based Capital EOP – End of Period ROA – Return on Assets GAAP – Accounting Principles Generally Accepted in the United States of America SBA – United States Small Business Administration KRX – KBW Nasdaq Regional Banking Index TCE – Tangible Common Equity LPO – Loan Production Office USDA – United States Department of Agriculture MLO – Mortgage Loan Officer YOY – Year over Year MTM – Marked-to-market