Attached files
| file | filename |
|---|---|
| EX-99.1 - EX-99.1 - INDUS REALTY TRUST, INC. | grif-20201008xex99d1.htm |
| 8-K - 8-K - INDUS REALTY TRUST, INC. | grif-20201008x8k.htm |
Exhibit 99.2
| FY Q3 2020 SUPPLEMENTAL OCTOBER 2020 |
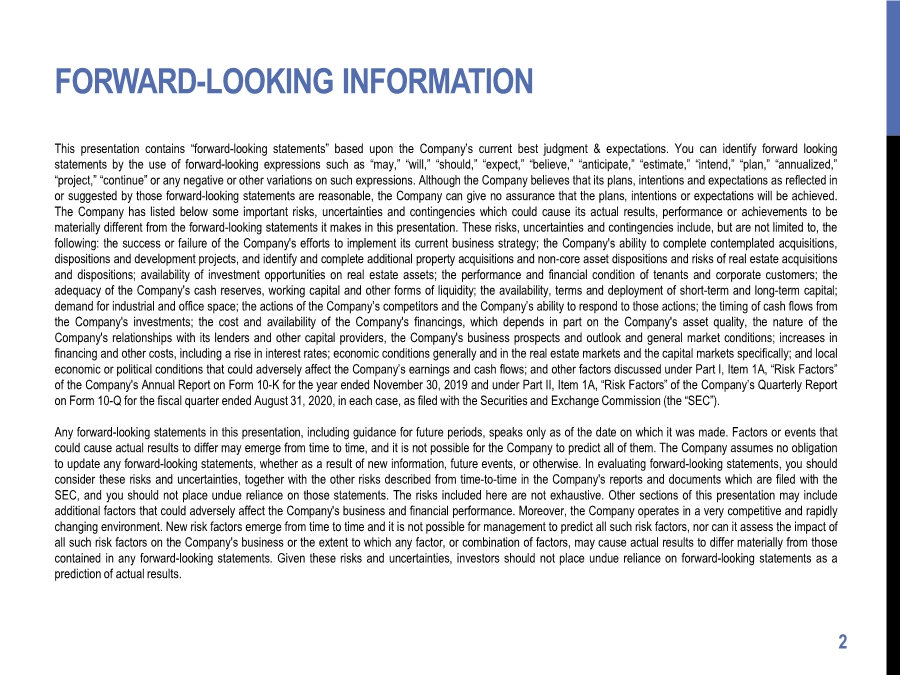
| FORWARD-LOOKING INFORMATION 2 This presentation contains “forward-looking statements” based upon the Company’s current best judgment & expectations. You can identify forward looking statements by the use of forward-looking expressions such as “may,” “will,” “should,” “expect,” “believe,” “anticipate,” “estimate,” “intend,” “plan,” “annualized,” “project,” “continue” or any negative or other variations on such expressions. Although the Company believes that its plans, intentions and expectations as reflected in or suggested by those forward-looking statements are reasonable, the Company can give no assurance that the plans, intentions or expectations will be achieved. The Company has listed below some important risks, uncertainties and contingencies which could cause its actual results, performance or achievements to be materially different from the forward-looking statements it makes in this presentation. These risks, uncertainties and contingencies include, but are not limited to, the following: the success or failure of the Company's efforts to implement its current business strategy; the Company's ability to complete contemplated acquisitions, dispositions and development projects, and identify and complete additional property acquisitions and non-core asset dispositions and risks of real estate acquisitions and dispositions; availability of investment opportunities on real estate assets; the performance and financial condition of tenants and corporate customers; the adequacy of the Company's cash reserves, working capital and other forms of liquidity; the availability, terms and deployment of short-term and long-term capital; demand for industrial and office space; the actions of the Company’s competitors and the Company’s ability to respond to those actions; the timing of cash flows from the Company's investments; the cost and availability of the Company's financings, which depends in part on the Company's asset quality, the nature of the Company's relationships with its lenders and other capital providers, the Company's business prospects and outlook and general market conditions; increases in financing and other costs, including a rise in interest rates; economic conditions generally and in the real estate markets and the capital markets specifically; and local economic or political conditions that could adversely affect the Company’s earnings and cash flows; and other factors discussed under Part I, Item 1A, “Risk Factors” of the Company's Annual Report on Form 10-K for the year ended November 30, 2019 and under Part II, Item 1A, “Risk Factors” of the Company’s Quarterly Report on Form 10-Q for the fiscal quarter ended August 31, 2020, in each case, as filed with the Securities and Exchange Commission (the “SEC”). Any forward-looking statements in this presentation, including guidance for future periods, speaks only as of the date on which it was made. Factors or events that could cause actual results to differ may emerge from time to time, and it is not possible for the Company to predict all of them. The Company assumes no obligation to update any forward-looking statements, whether as a result of new information, future events, or otherwise. In evaluating forward-looking statements, you should consider these risks and uncertainties, together with the other risks described from time-to-time in the Company's reports and documents which are filed with the SEC, and you should not place undue reliance on those statements. The risks included here are not exhaustive. Other sections of this presentation may include additional factors that could adversely affect the Company's business and financial performance. Moreover, the Company operates in a very competitive and rapidly changing environment. New risk factors emerge from time to time and it is not possible for management to predict all such risk factors, nor can it assess the impact of all such risk factors on the Company's business or the extent to which any factor, or combination of factors, may cause actual results to differ materially from those contained in any forward-looking statements. Given these risks and uncertainties, investors should not place undue reliance on forward-looking statements as a prediction of actual results. |
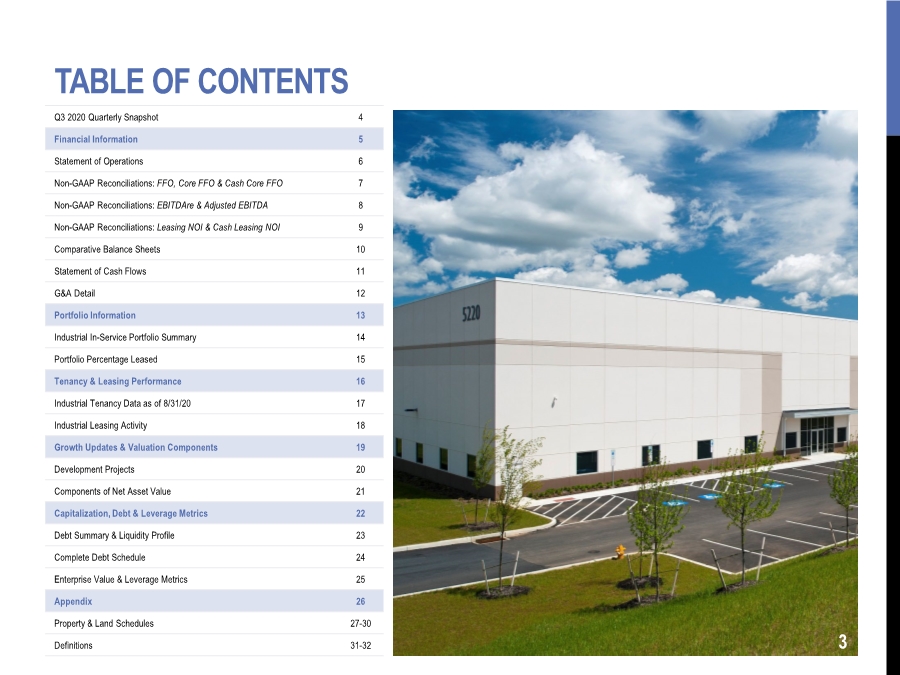
| TABLE OF CONTENTS 3 Q3 2020 Quarterly Snapshot 4 Financial Information 5 Statement of Operations 6 Non-GAAP Reconciliations: FFO, Core FFO & Cash Core FFO 7 Non-GAAP Reconciliations: EBITDAre & Adjusted EBITDA 8 Non-GAAP Reconciliations: Leasing NOI & Cash Leasing NOI 9 Comparative Balance Sheets 10 Statement of Cash Flows 11 G&A Detail 12 Portfolio Information 13 Industrial In-Service Portfolio Summary 14 Portfolio Percentage Leased 15 Tenancy & Leasing Performance 16 Industrial Tenancy Data as of 8/31/20 17 Industrial Leasing Activity 18 Growth Updates & Valuation Components 19 Development Projects 20 Components of Net Asset Value 21 Capitalization, Debt & Leverage Metrics 22 Debt Summary & Liquidity Profile 23 Complete Debt Schedule 24 Enterprise Value & Leverage Metrics 25 Appendix 26 Property & Land Schedules 27-30 Definitions 31-32 |
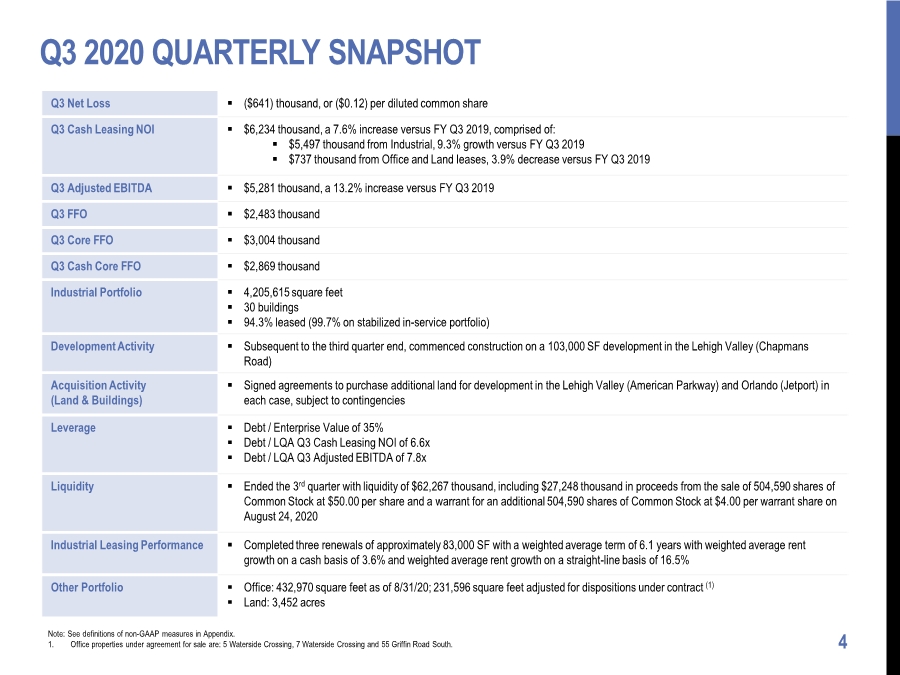
| Q3 2020 QUARTERLY SNAPSHOT 4 Q3 Net Loss . ($641) thousand, or ($0.12) per diluted common share Q3 Cash Leasing NOI . $6,234 thousand, a 7.6% increase versus FY Q3 2019, comprised of: . $5,497 thousand from Industrial, 9.3% growth versus FY Q3 2019 . $737 thousand from Office and Land leases, 3.9% decrease versus FY Q3 2019 Q3 Adjusted EBITDA . $5,281 thousand, a 13.2% increase versus FY Q3 2019 Q3 FFO . $2,483 thousand Q3 Core FFO . $3,004 thousand Q3 Cash Core FFO . $2,869 thousand Industrial Portfolio . 4,205,615 square feet . 30 buildings . 94.3% leased (99.7% on stabilized in-service portfolio) Development Activity . Subsequent to the third quarter end, commenced construction on a 103,000 SF development in the Lehigh Valley (Chapmans Road) Acquisition Activity (Land & Buildings) . Signed agreements to purchase additional land for development in the Lehigh Valley (American Parkway) and Orlando (Jetport) in each case, subject to contingencies Leverage . Debt / Enterprise Value of 35% . Debt / LQA Q3 Cash Leasing NOI of 6.6x . Debt / LQA Q3 Adjusted EBITDA of 7.8x Liquidity . Ended the 3rd quarter with liquidity of $62,267 thousand, including $27,248 thousand in proceeds from the sale of 504,590 shares of Common Stock at $50.00 per share and a warrant for an additional 504,590 shares of Common Stock at $4.00 per warrant share on August 24, 2020 Industrial Leasing Performance . Completed three renewals of approximately 83,000 SF with a weighted average term of 6.1 years with weighted average rent growth on a cash basis of 3.6% and weighted average rent growth on a straight-line basis of 16.5% Other Portfolio . Office: 432,970 square feet as of 8/31/20; 231,596 square feet adjusted for dispositions under contract (1) . Land: 3,452 acres Note: See definitions of non-GAAP measures in Appendix. 1. Office properties under agreement for sale are: 5 Waterside Crossing, 7 Waterside Crossing and 55 Griffin Road South. |
| FINANCIAL INFORMATION 5 |

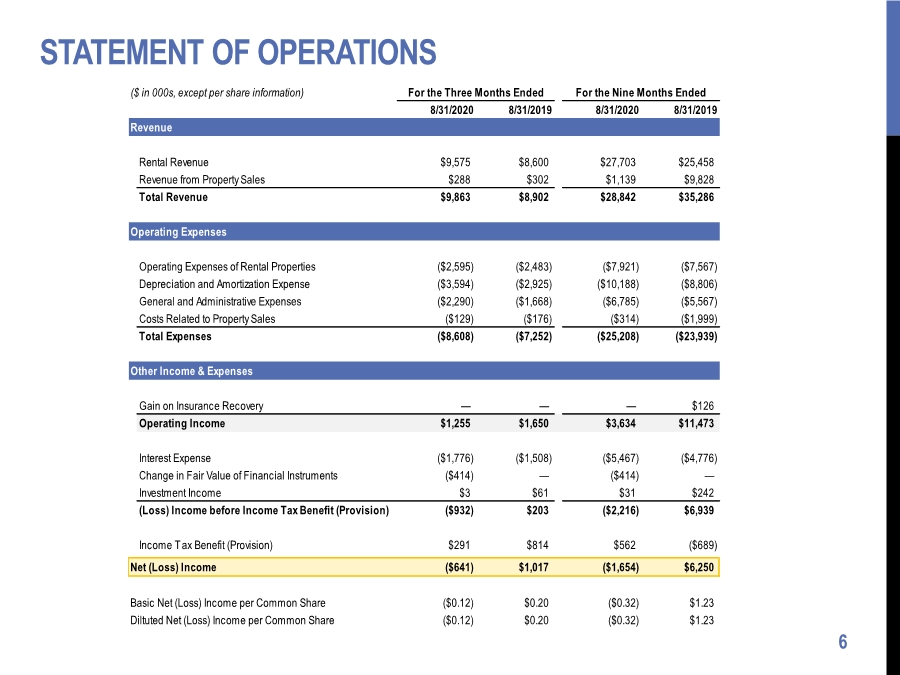
| STATEMENT OF OPERATIONS 6 ($ in 000s, except per share information) For the Three Months Ended For the Nine Months Ended 8/31/2020 8/31/2019 8/31/2020 8/31/2019 Revenue Rental Revenue $9,575 $8,600 $27,703 $25,458 Revenue from Property Sales $288 $302 $1,139 $9,828 Total Revenue $9,863 $8,902 $28,842 $35,286 Operating Expenses Operating Expenses of Rental Properties ($2,595) ($2,483) ($7,921) ($7,567) Depreciation and Amortization Expense ($3,594) ($2,925) ($10,188) ($8,806) General and Administrative Expenses ($2,290) ($1,668) ($6,785) ($5,567) Costs Related to Property Sales ($129) ($176) ($314) ($1,999) Total Expenses ($8,608) ($7,252) ($25,208) ($23,939) Other Income & Expenses Gain on Insurance Recovery — — — $126 Operating Income $1,255 $1,650 $3,634 $11,473 Interest Expense ($1,776) ($1,508) ($5,467) ($4,776) Change in Fair Value of Financial Instruments ($414) — ($414) — Investment Income $3 $61 $31 $242 (Loss) Income before Income Tax Benefit (Provision) ($932) $203 ($2,216) $6,939 Income Tax Benefit (Provision) $291 $814 $562 ($689) Net (Loss) Income ($641) $1,017 ($1,654) $6,250 Basic Net (Loss) Income per Common Share ($0.12) $0.20 ($0.32) $1.23 Diltuted Net (Loss) Income per Common Share ($0.12) $0.20 ($0.32) $1.23 |
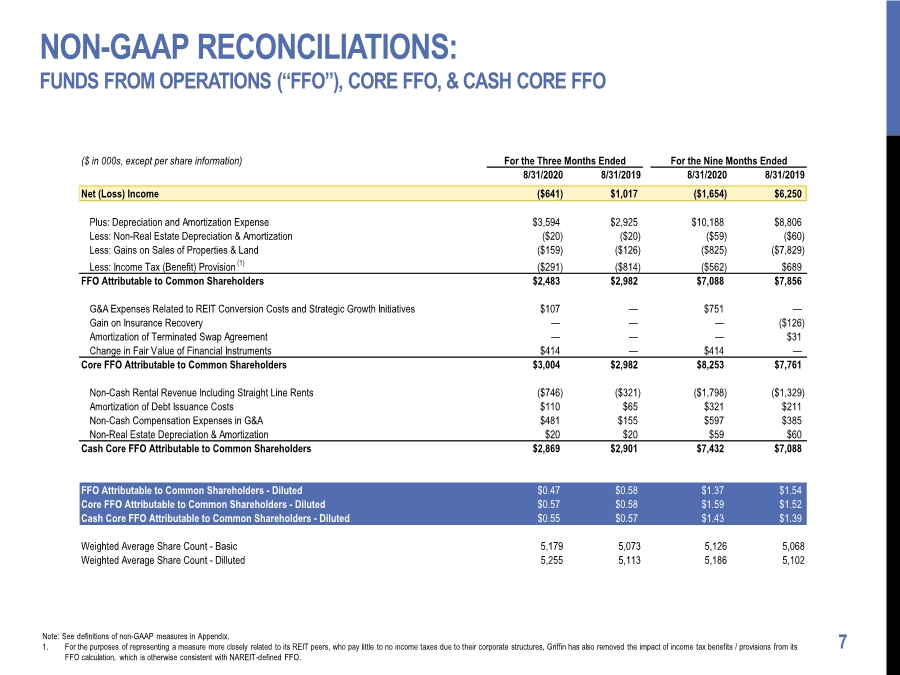
| NON-GAAP RECONCILIATIONS: FUNDS FROM OPERATIONS (“FFO”), CORE FFO, & CASH CORE FFO 7 Note: See definitions of non-GAAP measures in Appendix. 1. For the purposes of representing a measure more closely related to its REIT peers, who pay little to no income taxes due to their corporate structures, Griffin has also removed the impact of income tax benefits / provisions from its FFO calculation, which is otherwise consistent with NAREIT-defined FFO. ($ in 000s, except per share information) For the Three Months Ended For the Nine Months Ended 8/31/2020 8/31/2019 8/31/2020 8/31/2019 Net (Loss) Income ($641) $1,017 ($1,654) $6,250 Plus: Depreciation and Amortization Expense $3,594 $2,925 $10,188 $8,806 Less: Non-Real Estate Depreciation & Amortization ($20) ($20) ($59) ($60) Less: Gains on Sales of Properties & Land ($159) ($126) ($825) ($7,829) Less: Income Tax (Benefit) Provision (1) ($291) ($814) ($562) $689 FFO Attributable to Common Shareholders $2,483 $2,982 $7,088 $7,856 G&A Expenses Related to REIT Conversion Costs and Strategic Growth Initiatives $107 — $751 — Gain on Insurance Recovery — — — ($126) Amortization of Terminated Swap Agreement — — — $31 Change in Fair Value of Financial Instruments $414 — $414 — Core FFO Attributable to Common Shareholders $3,004 $2,982 $8,253 $7,761 Non-Cash Rental Revenue Including Straight Line Rents ($746) ($321) ($1,798) ($1,329) Amortization of Debt Issuance Costs $110 $65 $321 $211 Non-Cash Compensation Expenses in G&A $481 $155 $597 $385 Non-Real Estate Depreciation & Amortization $20 $20 $59 $60 Cash Core FFO Attributable to Common Shareholders $2,869 $2,901 $7,432 $7,088 FFO Attributable to Common Shareholders - Diluted $0.47 $0.58 $1.37 $1.54 Core FFO Attributable to Common Shareholders - Diluted $0.57 $0.58 $1.59 $1.52 Cash Core FFO Attributable to Common Shareholders - Diluted $0.55 $0.57 $1.43 $1.39 Weighted Average Share Count - Basic 5,179 5,073 5,126 5,068 Weighted Average Share Count - Dilluted 5,255 5,113 5,186 5,102 |
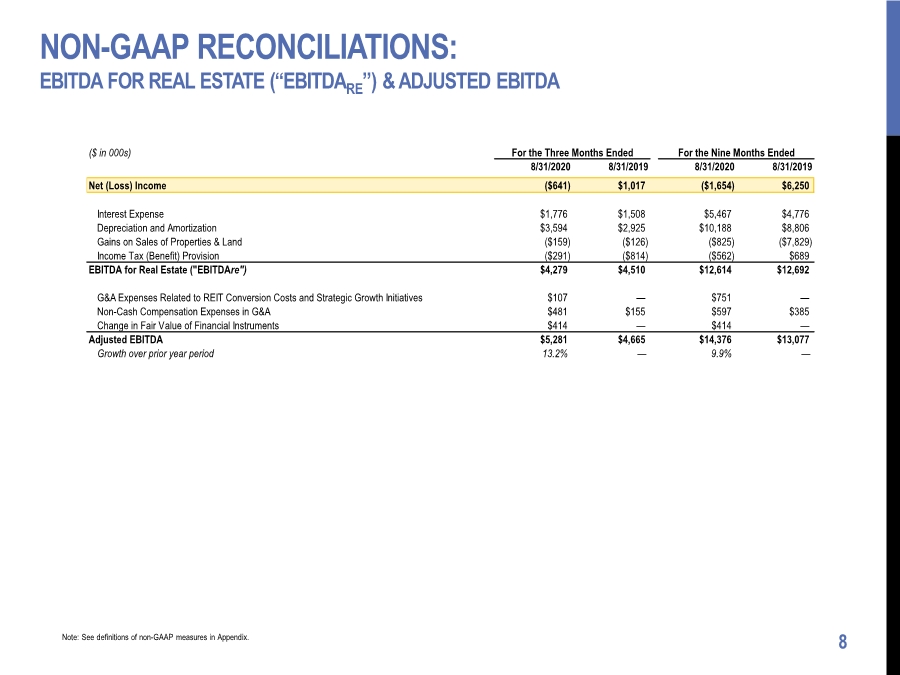
| NON-GAAP RECONCILIATIONS: EBITDA FOR REAL ESTATE (“EBITDARE”) & ADJUSTED EBITDA 8 Note: See definitions of non-GAAP measures in Appendix. ($ in 000s) For the Three Months Ended For the Nine Months Ended 8/31/2020 8/31/2019 8/31/2020 8/31/2019 Net (Loss) Income ($641) $1,017 ($1,654) $6,250 Interest Expense $1,776 $1,508 $5,467 $4,776 Depreciation and Amortization $3,594 $2,925 $10,188 $8,806 Gains on Sales of Properties & Land ($159) ($126) ($825) ($7,829) Income Tax (Benefit) Provision ($291) ($814) ($562) $689 EBITDA for Real Estate ("EBITDAre") $4,279 $4,510 $12,614 $12,692 G&A Expenses Related to REIT Conversion Costs and Strategic Growth Initiatives $107 — $751 — Non-Cash Compensation Expenses in G&A $481 $155 $597 $385 Change in Fair Value of Financial Instruments $414 — $414 — Adjusted EBITDA $5,281 $4,665 $14,376 $13,077 Growth over prior year period 13.2% — 9.9% — |
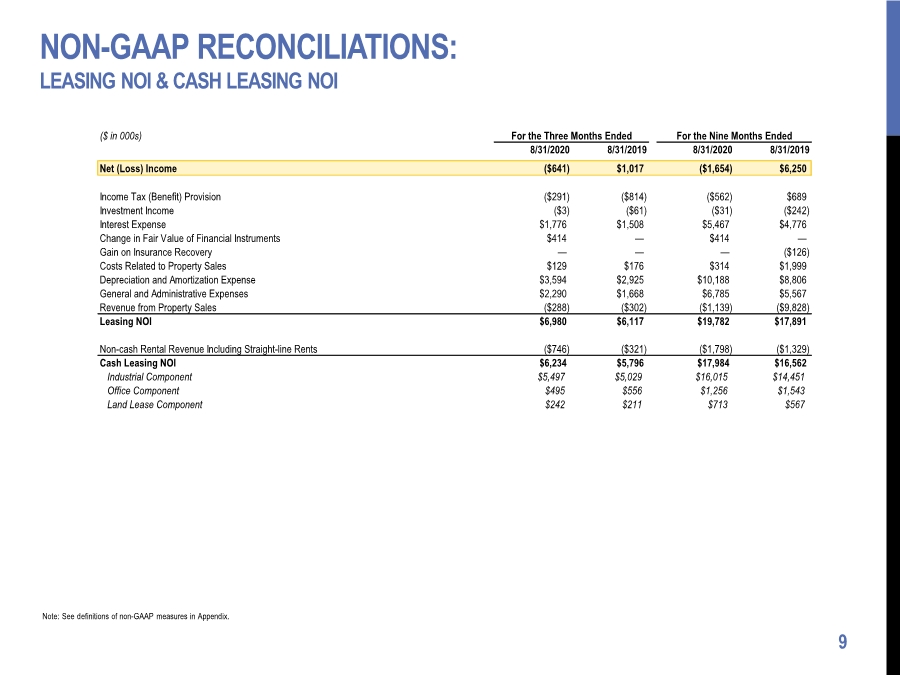
| NON-GAAP RECONCILIATIONS: LEASING NOI & CASH LEASING NOI 9 Note: See definitions of non-GAAP measures in Appendix. ($ in 000s) For the Three Months Ended For the Nine Months Ended 8/31/2020 8/31/2019 8/31/2020 8/31/2019 Net (Loss) Income ($641) $1,017 ($1,654) $6,250 Income Tax (Benefit) Provision ($291) ($814) ($562) $689 Investment Income ($3) ($61) ($31) ($242) Interest Expense $1,776 $1,508 $5,467 $4,776 Change in Fair Value of Financial Instruments $414 — $414 — Gain on Insurance Recovery — — — ($126) Costs Related to Property Sales $129 $176 $314 $1,999 Depreciation and Amortization Expense $3,594 $2,925 $10,188 $8,806 General and Administrative Expenses $2,290 $1,668 $6,785 $5,567 Revenue from Property Sales ($288) ($302) ($1,139) ($9,828) Leasing NOI $6,980 $6,117 $19,782 $17,891 Non-cash Rental Revenue Including Straight-line Rents ($746) ($321) ($1,798) ($1,329) Cash Leasing NOI $6,234 $5,796 $17,984 $16,562 Industrial Component $5,497 $5,029 $16,015 $14,451 Office Component $495 $556 $1,256 $1,543 Land Lease Component $242 $211 $713 $567 |
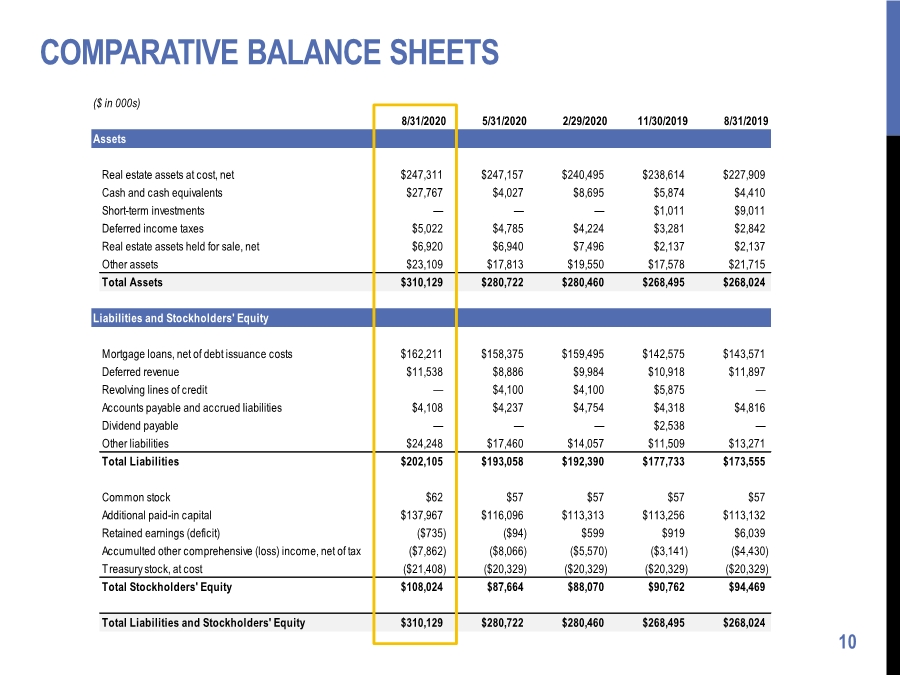
| ($ in 000s) 8/31/2020 5/31/2020 2/29/2020 11/30/2019 8/31/2019 Assets Real estate assets at cost, net $247,311 $247,157 $240,495 $238,614 $227,909 Cash and cash equivalents $27,767 $4,027 $8,695 $5,874 $4,410 Short-term investments — — — $1,011 $9,011 Deferred income taxes $5,022 $4,785 $4,224 $3,281 $2,842 Real estate assets held for sale, net $6,920 $6,940 $7,496 $2,137 $2,137 Other assets $23,109 $17,813 $19,550 $17,578 $21,715 Total Assets $310,129 $280,722 $280,460 $268,495 $268,024 Liabilities and Stockholders' Equity Mortgage loans, net of debt issuance costs $162,211 $158,375 $159,495 $142,575 $143,571 Deferred revenue $11,538 $8,886 $9,984 $10,918 $11,897 Revolving lines of credit — $4,100 $4,100 $5,875 — Accounts payable and accrued liabilities $4,108 $4,237 $4,754 $4,318 $4,816 Dividend payable — — — $2,538 — Other liabilities $24,248 $17,460 $14,057 $11,509 $13,271 Total Liabilities $202,105 $193,058 $192,390 $177,733 $173,555 Common stock $62 $57 $57 $57 $57 Additional paid-in capital $137,967 $116,096 $113,313 $113,256 $113,132 Retained earnings (deficit) ($735) ($94) $599 $919 $6,039 Accumulted other comprehensive (loss) income, net of tax ($7,862) ($8,066) ($5,570) ($3,141) ($4,430) Treasury stock, at cost ($21,408) ($20,329) ($20,329) ($20,329) ($20,329) Total Stockholders' Equity $108,024 $87,664 $88,070 $90,762 $94,469 Total Liabilities and Stockholders' Equity $310,129 $280,722 $280,460 $268,495 $268,024 COMPARATIVE BALANCE SHEETS 10 |
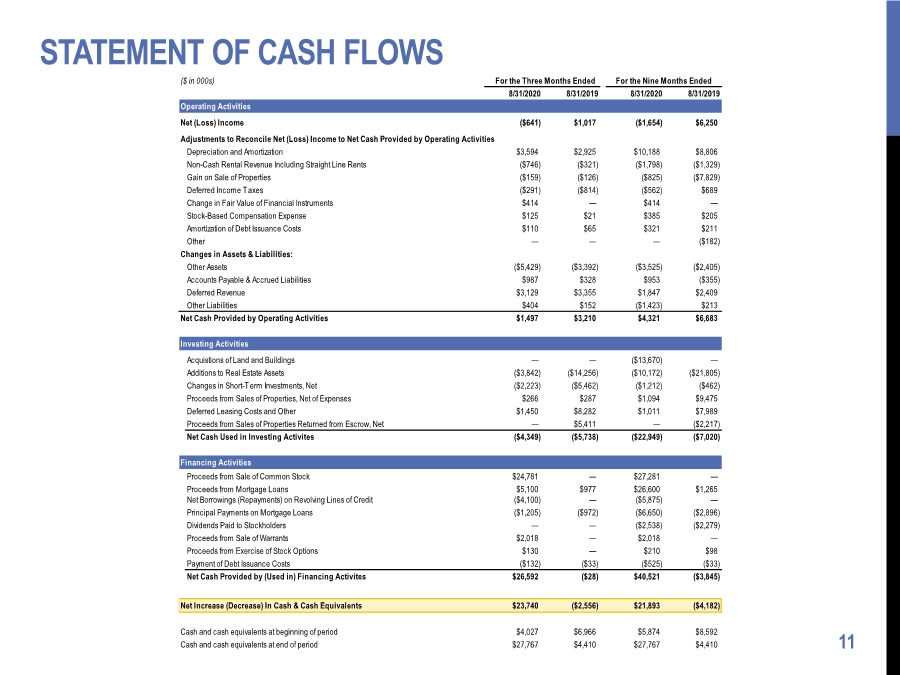
| STATEMENT OF CASH FLOWS 11 ($ in 000s) For the Three Months Ended For the Nine Months Ended 8/31/2020 8/31/2019 8/31/2020 8/31/2019 Operating Activities Net (Loss) Income ($641) $1,017 ($1,654) $6,250 Adjustments to Reconcile Net (Loss) Income to Net Cash Provided by Operating Activities Depreciation and Amortization $3,594 $2,925 $10,188 $8,806 Non-Cash Rental Revenue Including Straight Line Rents ($746) ($321) ($1,798) ($1,329) Gain on Sale of Properties ($159) ($126) ($825) ($7,829) Deferred Income Taxes ($291) ($814) ($562) $689 Change in Fair Value of Financial Instruments $414 — $414 — Stock-Based Compensation Expense $125 $21 $385 $205 Amortization of Debt Issuance Costs $110 $65 $321 $211 Other — — — ($182) Changes in Assets & Liabilities: Other Assets ($5,429) ($3,392) ($3,525) ($2,405) Accounts Payable & Accrued Liabilities $987 $328 $953 ($355) Deferred Revenue $3,129 $3,355 $1,847 $2,409 Other Liabilities $404 $152 ($1,423) $213 Net Cash Provided by Operating Activities $1,497 $3,210 $4,321 $6,683 Investing Activities Acquistions of Land and Buildings — — ($13,670) — Additions to Real Estate Assets ($3,842) ($14,256) ($10,172) ($21,805) Changes in Short-Term Investments, Net ($2,223) ($5,462) ($1,212) ($462) Proceeds from Sales of Properties, Net of Expenses $266 $287 $1,094 $9,475 Deferred Leasing Costs and Other $1,450 $8,282 $1,011 $7,989 Proceeds from Sales of Properties Returned from Escrow, Net — $5,411 — ($2,217) Net Cash Used in Investing Activites ($4,349) ($5,738) ($22,949) ($7,020) Financing Activities Proceeds from Sale of Common Stock $24,781 — $27,281 — Proceeds from Mortgage Loans $5,100 $977 $26,600 $1,265 Net Borrowings (Repayments) on Revolving Lines of Credit ($4,100) — ($5,875) — Principal Payments on Mortgage Loans ($1,205) ($972) ($6,650) ($2,896) Dividends Paid to Stockholders — — ($2,538) ($2,279) Proceeds from Sale of Warrants $2,018 — $2,018 — Proceeds from Exercise of Stock Options $130 — $210 $98 Payment of Debt Issuance Costs ($132) ($33) ($525) ($33) Net Cash Provided by (Used in) Financing Activites $26,592 ($28) $40,521 ($3,845) Net Increase (Decrease) In Cash & Cash Equivalents $23,740 ($2,556) $21,893 ($4,182) Cash and cash equivalents at beginning of period $4,027 $6,966 $5,874 $8,592 Cash and cash equivalents at end of period $27,767 $4,410 $27,767 $4,410 |
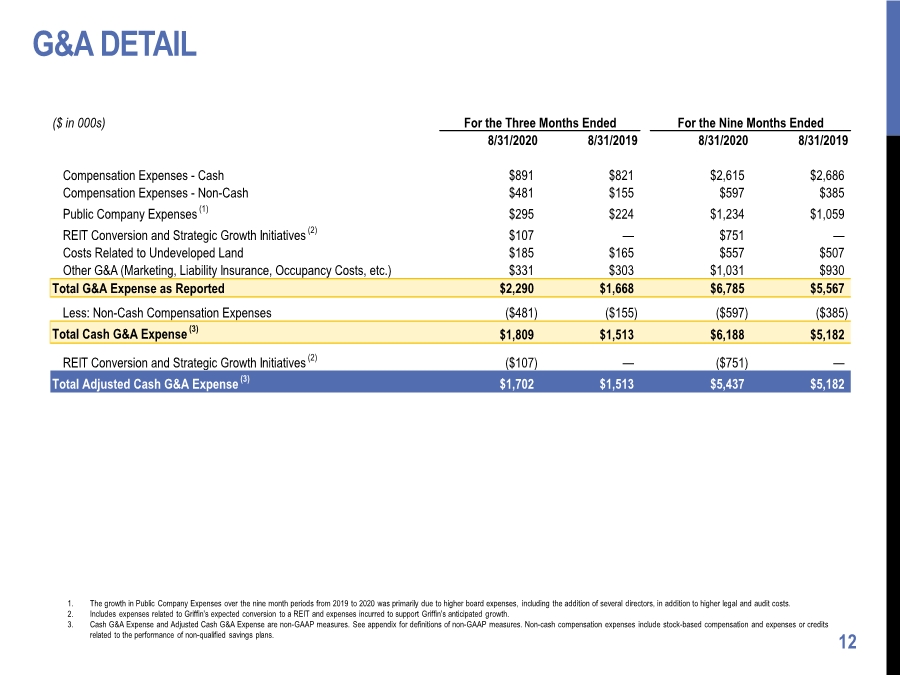
| G&A DETAIL 12 1. The growth in Public Company Expenses over the nine month periods from 2019 to 2020 was primarily due to higher board expenses, including the addition of several directors, in addition to higher legal and audit costs. 2. Includes expenses related to Griffin’s expected conversion to a REIT and expenses incurred to support Griffin’s anticipated growth. 3. Cash G&A Expense and Adjusted Cash G&A Expense are non-GAAP measures. See appendix for definitions of non-GAAP measures. Non-cash compensation expenses include stock-based compensation and expenses or credits related to the performance of non-qualified savings plans. ($ in 000s) For the Three Months Ended For the Nine Months Ended 8/31/2020 8/31/2019 8/31/2020 8/31/2019 Compensation Expenses - Cash $891 $821 $2,615 $2,686 Compensation Expenses - Non-Cash $481 $155 $597 $385 Public Company Expenses (1) $295 $224 $1,234 $1,059 REIT Conversion and Strategic Growth Initiatives (2) $107 — $751 — Costs Related to Undeveloped Land $185 $165 $557 $507 Other G&A (Marketing, Liability Insurance, Occupancy Costs, etc.) $331 $303 $1,031 $930 Total G&A Expense as Reported $2,290 $1,668 $6,785 $5,567 Less: Non-Cash Compensation Expenses ($481) ($155) ($597) ($385) Total Cash G&A Expense (3) $1,809 $1,513 $6,188 $5,182 REIT Conversion and Strategic Growth Initiatives (2) ($107) — ($751) — Total Adjusted Cash G&A Expense (3) $1,702 $1,513 $5,437 $5,182 |
| PORTFOLIO INFORMATION 13 |

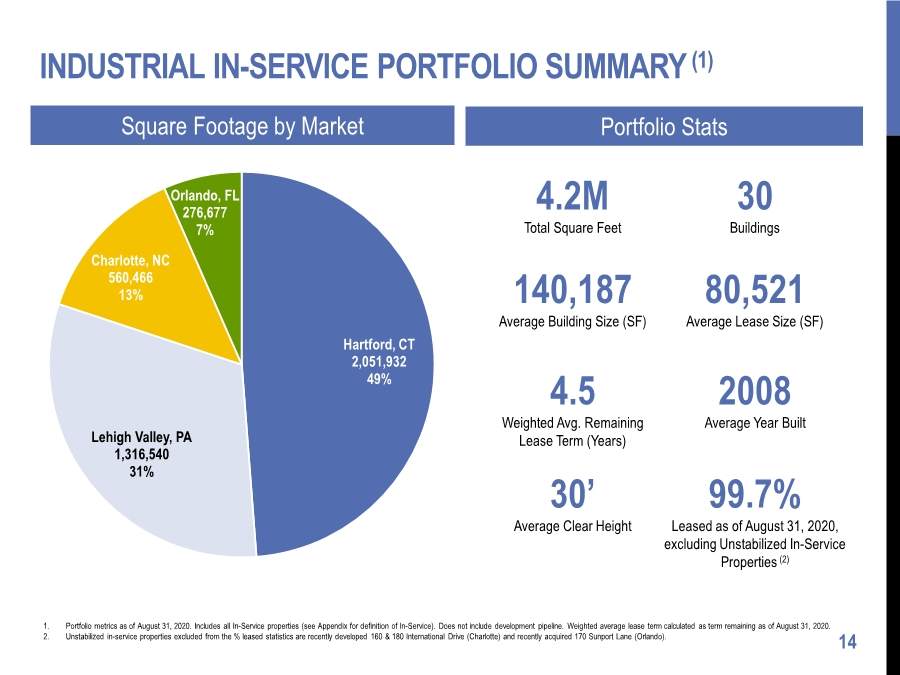
| INDUSTRIAL IN-SERVICE PORTFOLIO SUMMARY (1) 14 1. Portfolio metrics as of August 31, 2020. Includes all In-Service properties (see Appendix for definition of In-Service). Does not include development pipeline. Weighted average lease term calculated as term remaining as of August 31, 2020. 2. Unstabilized in-service properties excluded from the % leased statistics are recently developed 160 & 180 International Drive (Charlotte) and recently acquired 170 Sunport Lane (Orlando). 4.2M Total Square Feet 30 Buildings 4.5 Weighted Avg. Remaining Lease Term (Years) 80,521 Average Lease Size (SF) 2008 Average Year Built 30’ Average Clear Height Hartford, CT 2,051,932 49% Lehigh Valley, PA 1,316,540 31% Charlotte, NC 560,466 13% Orlando, FL 276,677 7% Square Footage by Market Portfolio Stats 140,187 Average Building Size (SF) 99.7% Leased as of August 31, 2020, excluding Unstabilized In-Service Properties (2) |
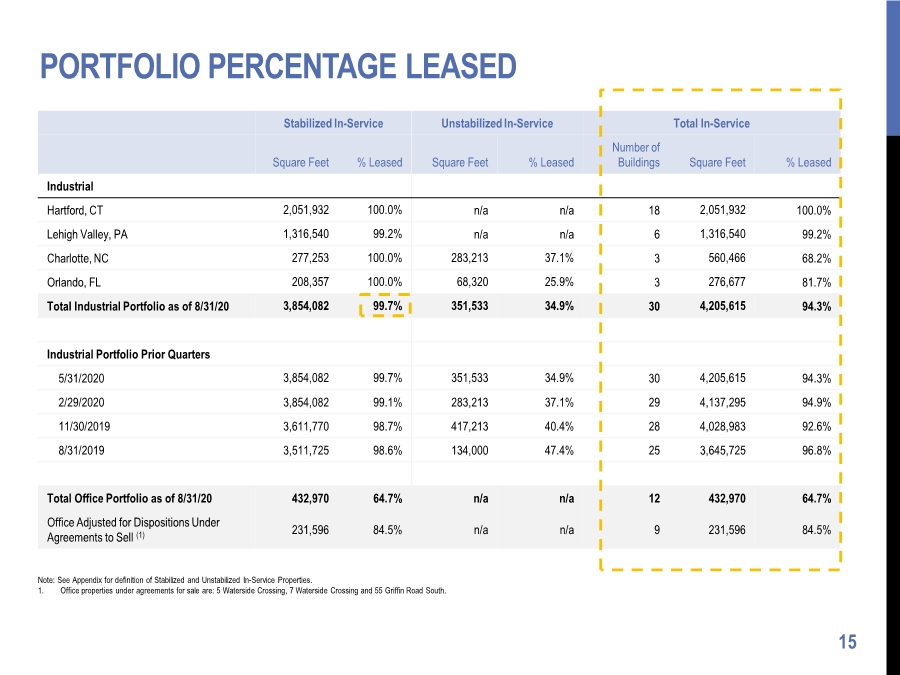
| PORTFOLIO PERCENTAGE LEASED 15 Note: See Appendix for definition of Stabilized and Unstabilized In-Service Properties. 1. Office properties under agreements for sale are: 5 Waterside Crossing, 7 Waterside Crossing and 55 Griffin Road South. Stabilized In-Service Unstabilized In-Service Total In-Service Square Feet % Leased Square Feet % Leased Number of Buildings Square Feet % Leased Industrial Hartford, CT 2,051,932 100.0% n/a n/a 18 2,051,932 100.0% Lehigh Valley, PA 1,316,540 99.2% n/a n/a 6 1,316,540 99.2% Charlotte, NC 277,253 100.0% 283,213 37.1% 3 560,466 68.2% Orlando, FL 208,357 100.0% 68,320 25.9% 3 276,677 81.7% Total Industrial Portfolio as of 8/31/20 3,854,082 99.7% 351,533 34.9% 30 4,205,615 94.3% Industrial Portfolio Prior Quarters 5/31/2020 3,854,082 99.7% 351,533 34.9% 30 4,205,615 94.3% 2/29/2020 3,854,082 99.1% 283,213 37.1% 29 4,137,295 94.9% 11/30/2019 3,611,770 98.7% 417,213 40.4% 28 4,028,983 92.6% 8/31/2019 3,511,725 98.6% 134,000 47.4% 25 3,645,725 96.8% Total Office Portfolio as of 8/31/20 432,970 64.7% n/a n/a 12 432,970 64.7% Office Adjusted for Dispositions Under Agreements to Sell (1) 231,596 84.5% n/a n/a 9 231,596 84.5% |
| TENANCY & LEASING PERFORMANCE 16 |
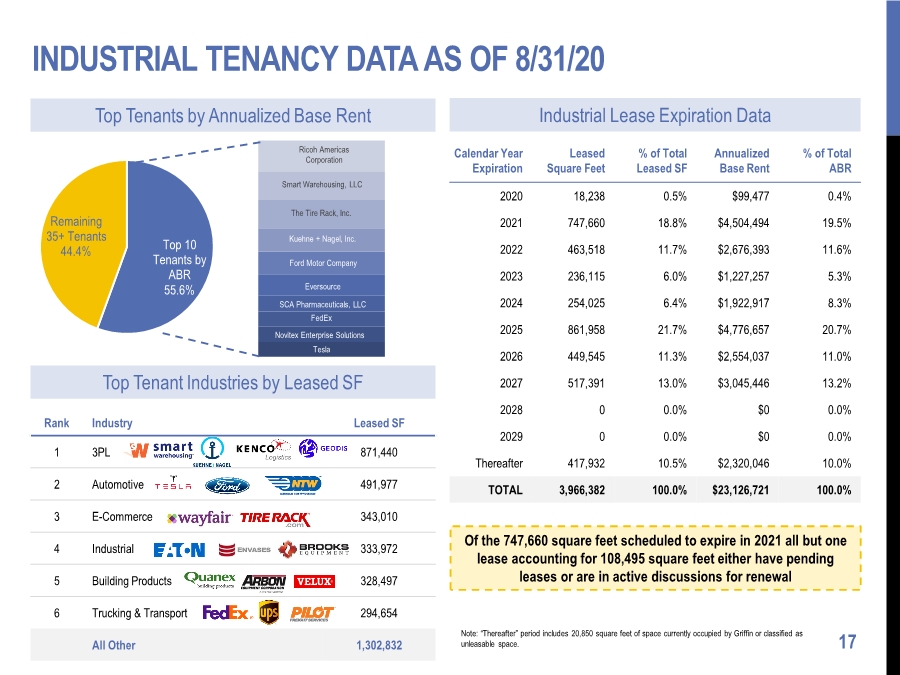
| INDUSTRIAL TENANCY DATA AS OF 8/31/20 17 Top Tenants by Annualized Base Rent Top Tenant Industries by Leased SF Industrial Lease Expiration Data Top 10 Tenants by ABR 55.6% Remaining 35+ Tenants 44.4% Tesla Novitex Enterprise Solutions FedEx SCA Pharmaceuticals, LLC Eversource Ford Motor Company Kuehne + Nagel, Inc. The Tire Rack, Inc. Smart Warehousing, LLC Ricoh Americas Corporation Rank Industry Leased SF 1 3PL 871,440 2 Automotive 491,977 3 E-Commerce 343,010 4 Industrial 333,972 5 Building Products 328,497 6 Trucking & Transport 294,654 All Other 1,302,832 Calendar Year Expiration Leased Square Feet % of Total Leased SF Annualized Base Rent % of Total ABR 2020 18,238 0.5% $99,477 0.4% 2021 747,660 18.8% $4,504,494 19.5% 2022 463,518 11.7% $2,676,393 11.6% 2023 236,115 6.0% $1,227,257 5.3% 2024 254,025 6.4% $1,922,917 8.3% 2025 861,958 21.7% $4,776,657 20.7% 2026 449,545 11.3% $2,554,037 11.0% 2027 517,391 13.0% $3,045,446 13.2% 2028 0 0.0% $0 0.0% 2029 0 0.0% $0 0.0% Thereafter 417,932 10.5% $2,320,046 10.0% TOTAL 3,966,382 100.0% $23,126,721 100.0% Note: “Thereafter” period includes 20,850 square feet of space currently occupied by Griffin or classified as unleasable space. Of the 747,660 square feet scheduled to expire in 2021 all but one lease accounting for 108,495 square feet either have pending leases or are in active discussions for renewal |
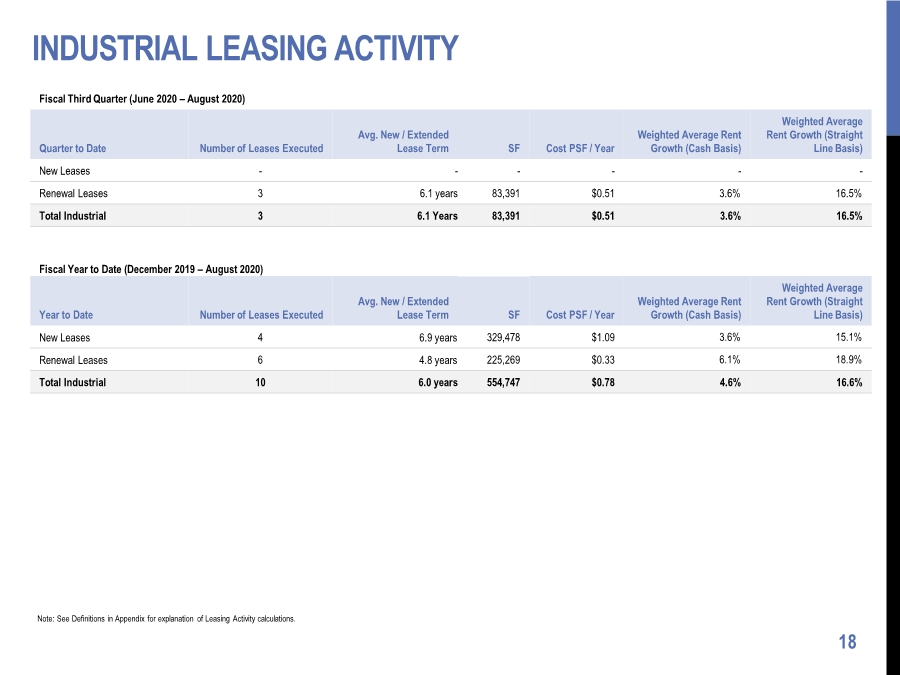
| INDUSTRIAL LEASING ACTIVITY 18 Fiscal Third Quarter (June 2020 – August 2020) Quarter to Date Number of Leases Executed Avg. New / Extended Lease Term SF Cost PSF / Year Weighted Average Rent Growth (Cash Basis) Weighted Average Rent Growth (Straight Line Basis) New Leases - - - - - - Renewal Leases 3 6.1 years 83,391 $0.51 3.6% 16.5% Total Industrial 3 6.1 Years 83,391 $0.51 3.6% 16.5% Fiscal Year to Date (December 2019 – August 2020) Year to Date Number of Leases Executed Avg. New / Extended Lease Term SF Cost PSF / Year Weighted Average Rent Growth (Cash Basis) Weighted Average Rent Growth (Straight Line Basis) New Leases 4 6.9 years 329,478 $1.09 3.6% 15.1% Renewal Leases 6 4.8 years 225,269 $0.33 6.1% 18.9% Total Industrial 10 6.0 years 554,747 $0.78 4.6% 16.6% Note: See Definitions in Appendix for explanation of Leasing Activity calculations. |
| GROWTH UPDATES & VALUATION COMPONENTS 19 |
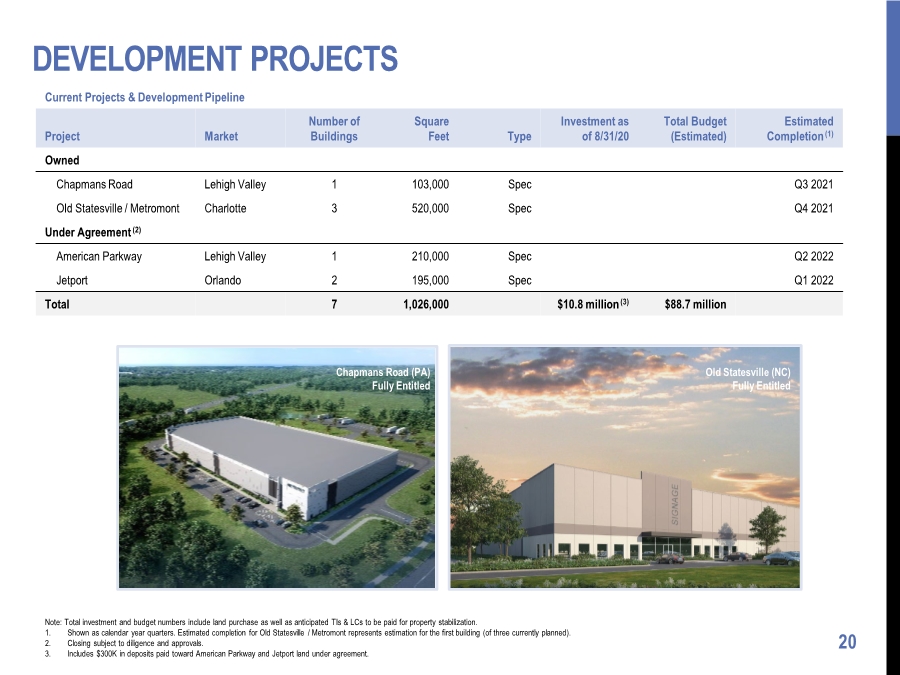
| DEVELOPMENT PROJECTS 20 Current Projects & Development Pipeline Project Market Number of Buildings Square Feet Type Investment as of 8/31/20 Total Budget (Estimated) Estimated Completion(1) Owned Chapmans Road Lehigh Valley 1 103,000 Spec Q3 2021 Old Statesville / Metromont Charlotte 3 520,000 Spec Q4 2021 Under Agreement (2) American Parkway Lehigh Valley 1 210,000 Spec Q2 2022 Jetport Orlando 2 195,000 Spec Q1 2022 Total 7 1,026,000 $10.8 million (3) $88.7 million Note: Total investment and budget numbers include land purchase as well as anticipated TIs & LCs to be paid for property stabilization. 1. Shown as calendar year quarters. Estimated completion for Old Statesville / Metromont represents estimation for the first building (of three currently planned). 2. Closing subject to diligence and approvals. 3. Includes $300K in deposits paid toward American Parkway and Jetport land under agreement. Chapmans Road (PA) Fully Entitled Old Statesville (NC) Fully Entitled |
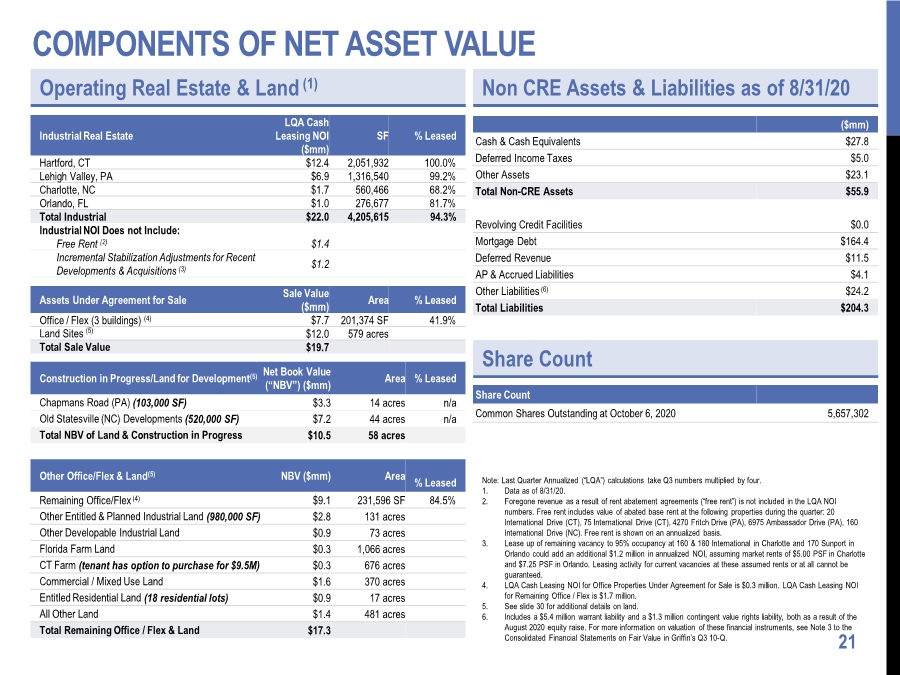
| COMPONENTS OF NET ASSET VALUE 21 Operating Real Estate & Land (1) Note: Last Quarter Annualized (“LQA”) calculations take Q3 numbers multiplied by four. 1. Data as of 8/31/20. 2. Foregone revenue as a result of rent abatement agreements (“free rent”) is not included in the LQA NOI numbers. Free rent includes value of abated base rent at the following properties during the quarter: 20 International Drive (CT), 75 International Drive (CT), 4270 Fritch Drive (PA), 6975 Ambassador Drive (PA), 160 International Drive (NC). Free rent is shown on an annualized basis. 3. Lease up of remaining vacancy to 95% occupancy at 160 & 180 International in Charlotte and 170 Sunport in Orlando could add an additional $1.2 million in annualized NOI, assuming market rents of $5.00 PSF in Charlotte and $7.25 PSF in Orlando. Leasing activity for current vacancies at these assumed rents or at all cannot be guaranteed. 4. LQA Cash Leasing NOI for Office Properties Under Agreement for Sale is $0.3 million. LQA Cash Leasing NOI for Remaining Office / Flex is $1.7 million. 5. See slide 30 for additional details on land. 6. Includes a $5.4 million warrant liability and a $1.3 million contingent value rights liability, both as a result of the August 2020 equity raise. For more information on valuation of these financial instruments, see Note 3 to the Consolidated Financial Statements on Fair Value in Griffin’s Q3 10-Q. Industrial Real Estate LQA Cash Leasing NOI ($mm) SF % Leased Hartford, CT $12.4 2,051,932 100.0% Lehigh Valley, PA $6.9 1,316,540 99.2% Charlotte, NC $1.7 560,466 68.2% Orlando, FL $1.0 276,677 81.7% Total Industrial $22.0 4,205,615 94.3% Industrial NOI Does not Include: Free Rent (2) $1.4 Incremental Stabilization Adjustments for Recent Developments & Acquisitions (3) $1.2 Assets Under Agreement for Sale Sale Value ($mm) Area % Leased Office / Flex (3 buildings) (4) $7.7 201,374 SF 41.9% Land Sites (5) $12.0 579 acres Total Sale Value $19.7 Non CRE Assets & Liabilities as of 8/31/20 Share Count ($mm) Cash & Cash Equivalents $27.8 Deferred Income Taxes $5.0 Other Assets $23.1 Total Non-CRE Assets $55.9 Revolving Credit Facilities $0.0 Mortgage Debt $164.4 Deferred Revenue $11.5 AP & Accrued Liabilities $4.1 Other Liabilities (6) $24.2 Total Liabilities $204.3 Share Count Common Shares Outstanding at October 6, 2020 5,657,302 Construction in Progress/Land for Development(5) Net Book Value (“NBV”) ($mm) Area % Leased Chapmans Road (PA) (103,000 SF) $3.3 14 acres n/a Old Statesville (NC) Developments (520,000 SF) $7.2 44 acres n/a Total NBV of Land & Construction in Progress $10.5 58 acres Other Office/Flex & Land(5) NBV ($mm) Area % Leased Remaining Office/Flex (4) $9.1 231,596 SF 84.5% Other Entitled & Planned Industrial Land (980,000 SF) $2.8 131 acres Other Developable Industrial Land $0.9 73 acres Florida Farm Land $0.3 1,066 acres CT Farm (tenant has option to purchase for $9.5M) $0.3 676 acres Commercial / Mixed Use Land $1.6 370 acres Entitled Residential Land (18 residential lots) $0.9 17 acres All Other Land $1.4 481 acres Total Remaining Office / Flex & Land $17.3 |
| CAPITALIZATION, DEBT & LEVERAGE METRICS 22 |
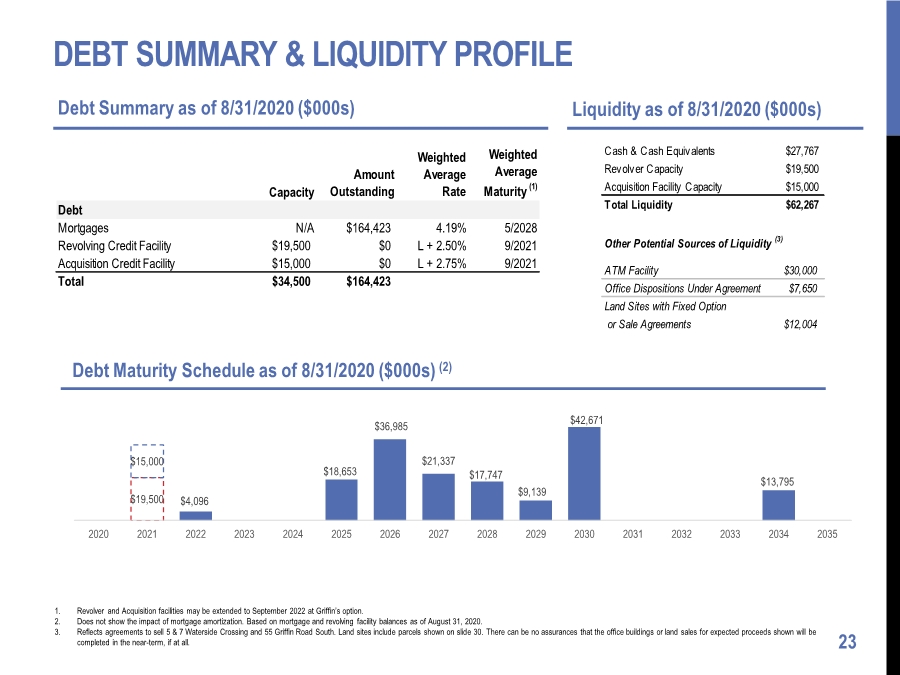
| DEBT SUMMARY & LIQUIDITY PROFILE 23 Debt Summary as of 8/31/2020 ($000s) Liquidity as of 8/31/2020 ($000s) Debt Maturity Schedule as of 8/31/2020 ($000s) (2) 1. Revolver and Acquisition facilities may be extended to September 2022 at Griffin’s option. 2. Does not show the impact of mortgage amortization. Based on mortgage and revolving facility balances as of August 31, 2020. 3. Reflects agreements to sell 5 & 7 Waterside Crossing and 55 Griffin Road South. Land sites include parcels shown on slide 30. There can be no assurances that the office buildings or land sales for expected proceeds shown will be completed in the near-term, if at all. $4,096 $18,653 $36,985 $21,337 $17,747 $9,139 $42,671 $13,795 $19,500 $15,000 2020 2021 2022 2023 2024 2025 2026 2027 2028 2029 2030 2031 2032 2033 2034 2035 Capacity Amount Outstanding Weighted Average Rate Weighted Average Maturity (1) Debt Mortgages N/A $164,423 4.19% 5/2028 Revolving Credit Facility $19,500 $0 L + 2.50% 9/2021 Acquisition Credit Facility $15,000 $0 L + 2.75% 9/2021 Total $34,500 $164,423 Cash & Cash Equivalents $27,767 Revolver Capacity $19,500 Acquisition Facility Capacity $15,000 Total Liquidity $62,267 Other Potential Sources of Liquidity (3) ATM Facility $30,000 Office Dispositions Under Agreement $7,650 Land Sites with Fixed Option or Sale Agreements $12,004 |
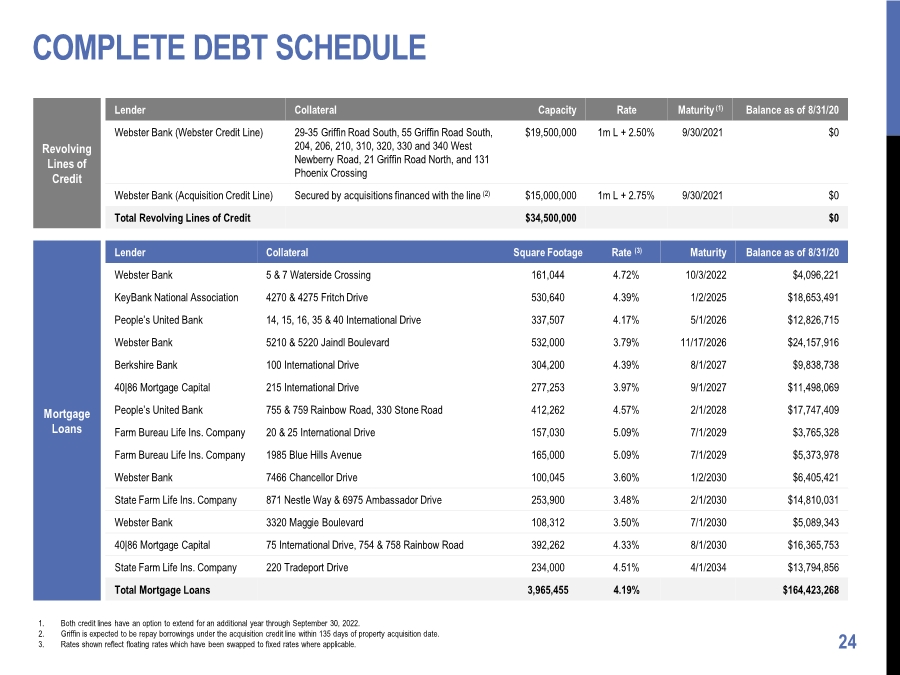
| COMPLETE DEBT SCHEDULE 24 Lender Collateral Square Footage Rate (3) Maturity Balance as of 8/31/20 Webster Bank 5 & 7 Waterside Crossing 161,044 4.72% 10/3/2022 $4,096,221 KeyBank National Association 4270 & 4275 Fritch Drive 530,640 4.39% 1/2/2025 $18,653,491 People’s United Bank 14, 15, 16, 35 & 40 International Drive 337,507 4.17% 5/1/2026 $12,826,715 Webster Bank 5210 & 5220 Jaindl Boulevard 532,000 3.79% 11/17/2026 $24,157,916 Berkshire Bank 100 International Drive 304,200 4.39% 8/1/2027 $9,838,738 40|86 Mortgage Capital 215 International Drive 277,253 3.97% 9/1/2027 $11,498,069 People’s United Bank 755 & 759 Rainbow Road, 330 Stone Road 412,262 4.57% 2/1/2028 $17,747,409 Farm Bureau Life Ins. Company 20 & 25 International Drive 157,030 5.09% 7/1/2029 $3,765,328 Farm Bureau Life Ins. Company 1985 Blue Hills Avenue 165,000 5.09% 7/1/2029 $5,373,978 Webster Bank 7466 Chancellor Drive 100,045 3.60% 1/2/2030 $6,405,421 State Farm Life Ins. Company 871 Nestle Way & 6975 Ambassador Drive 253,900 3.48% 2/1/2030 $14,810,031 Webster Bank 3320 Maggie Boulevard 108,312 3.50% 7/1/2030 $5,089,343 40|86 Mortgage Capital 75 International Drive, 754 & 758 Rainbow Road 392,262 4.33% 8/1/2030 $16,365,753 State Farm Life Ins. Company 220 Tradeport Drive 234,000 4.51% 4/1/2034 $13,794,856 Total Mortgage Loans 3,965,455 4.19% $164,423,268 Lender Collateral Capacity Rate Maturity (1) Balance as of 8/31/20 Webster Bank (Webster Credit Line) 29-35 Griffin Road South, 55 Griffin Road South, 204, 206, 210, 310, 320, 330 and 340 West Newberry Road, 21 Griffin Road North, and 131 Phoenix Crossing $19,500,000 1m L + 2.50% 9/30/2021 $0 Webster Bank (Acquisition Credit Line) Secured by acquisitions financed with the line (2) $15,000,000 1m L + 2.75% 9/30/2021 $0 Total Revolving Lines of Credit $34,500,000 $0 Revolving Lines of Credit Mortgage Loans 1. Both credit lines have an option to extend for an additional year through September 30, 2022. 2. Griffin is expected to be repay borrowings under the acquisition credit line within 135 days of property acquisition date. 3. Rates shown reflect floating rates which have been swapped to fixed rates where applicable. |
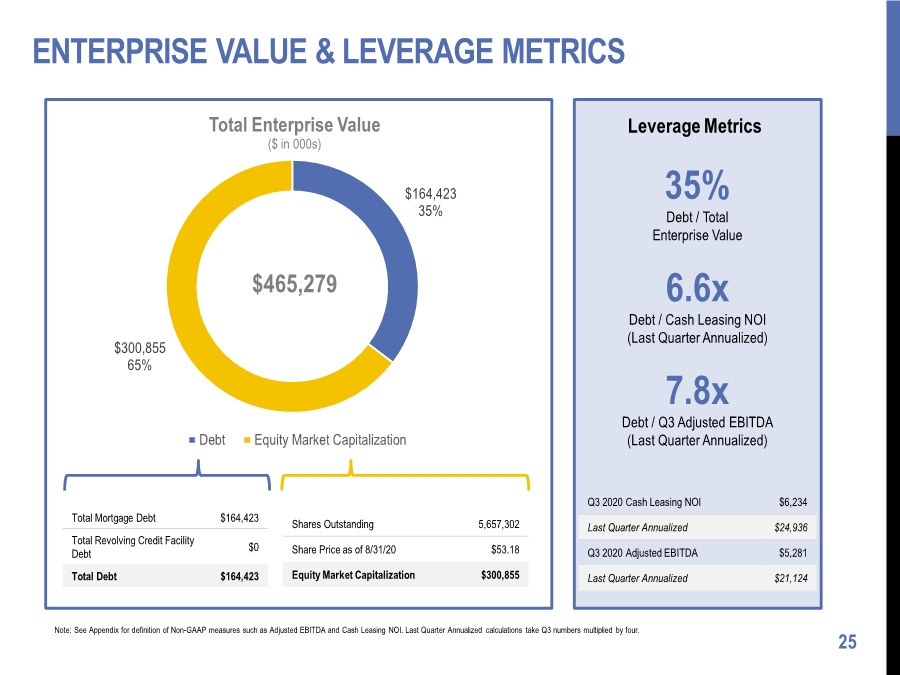
| ENTERPRISE VALUE & LEVERAGE METRICS 25 $164,423 35% $300,855 65% Total Enterprise Value ($ in 000s) Debt Equity Market Capitalization $465,279 Total Mortgage Debt $164,423 Total Revolving Credit Facility Debt $0 Total Debt $164,423 Shares Outstanding 5,657,302 Share Price as of 8/31/20 $53.18 Equity Market Capitalization $300,855 7.8x Debt / Q3 Adjusted EBITDA (Last Quarter Annualized) 6.6x Debt / Cash Leasing NOI (Last Quarter Annualized) 35% Debt / Total Enterprise Value Leverage Metrics Q3 2020 Cash Leasing NOI $6,234 Last Quarter Annualized $24,936 Q3 2020 Adjusted EBITDA $5,281 Last Quarter Annualized $21,124 Note: See Appendix for definition of Non-GAAP measures such as Adjusted EBITDA and Cash Leasing NOI. Last Quarter Annualized calculations take Q3 numbers multiplied by four. |
| APPENDIX 26 |

| PROPERTY & LAND DETAILS 27 |

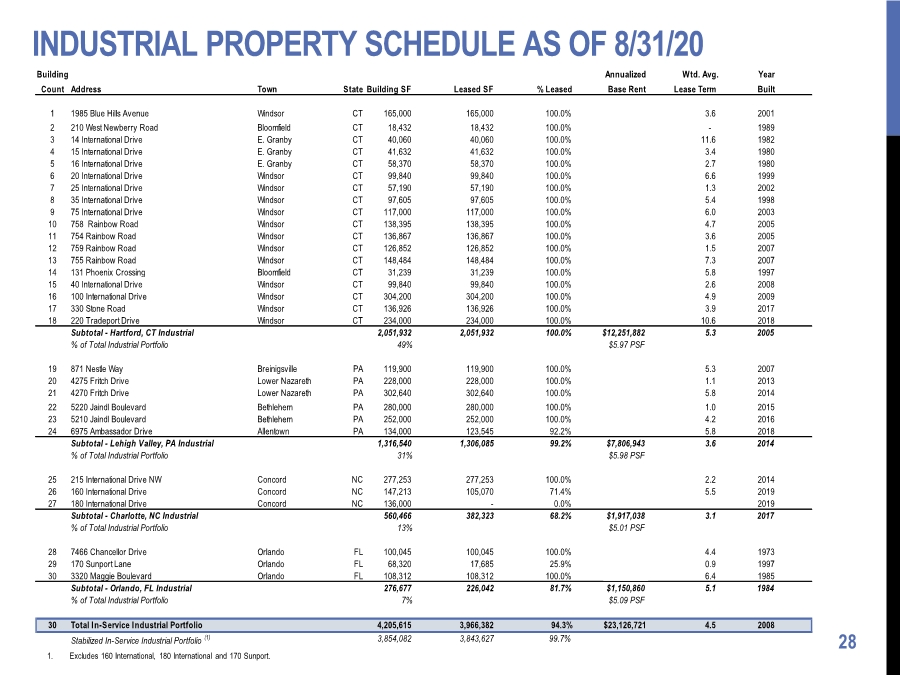
| INDUSTRIAL PROPERTY SCHEDULE AS OF 8/31/20 28 1. Excludes 160 International, 180 International and 170 Sunport. Building Annualized Wtd. Avg. Year Count Address Town State Building SF Leased SF % Leased Base Rent Lease Term Built 1 1985 Blue Hills Avenue Windsor CT 165,000 165,000 100.0% $1,278,750 3.6 2001 2 210 West Newberry Road Bloomfield CT 18,432 18,432 100.0% $0 - 1989 3 14 International Drive E. Granby CT 40,060 40,060 100.0% $220,330 11.6 1982 4 15 International Drive E. Granby CT 41,632 41,632 100.0% $218,007 3.4 1980 5 16 International Drive E. Granby CT 58,370 58,370 100.0% $350,815 2.7 1980 6 20 International Drive Windsor CT 99,840 99,840 100.0% $755,183 6.6 1999 7 25 International Drive Windsor CT 57,190 57,190 100.0% $340,587 1.3 2002 8 35 International Drive Windsor CT 97,605 97,605 100.0% $557,229 5.4 1998 9 75 International Drive Windsor CT 117,000 117,000 100.0% $632,760 6.0 2003 10 758 Rainbow Road Windsor CT 138,395 138,395 100.0% $822,052 4.7 2005 11 754 Rainbow Road Windsor CT 136,867 136,867 100.0% $792,303 3.6 2005 12 759 Rainbow Road Windsor CT 126,852 126,852 100.0% $751,281 1.5 2007 13 755 Rainbow Road Windsor CT 148,484 148,484 100.0% $939,067 7.3 2007 14 131 Phoenix Crossing Bloomfield CT 31,239 31,239 100.0% $152,591 5.8 1997 15 40 International Drive Windsor CT 99,840 99,840 100.0% $605,707 2.6 2008 16 100 International Drive Windsor CT 304,200 304,200 100.0% $1,688,310 4.9 2009 17 330 Stone Road Windsor CT 136,926 136,926 100.0% $801,410 3.9 2017 18 220 Tradeport Drive Windsor CT 234,000 234,000 100.0% $1,345,500 10.6 2018 Subtotal - Hartford, CT Industrial 2,051,932 2,051,932 100.0% $12,251,882 5.3 2005 % of Total Industrial Portfolio 49% $5.97 PSF 19 871 Nestle Way Breinigsville PA 119,900 119,900 100.0% $653,455 5.3 2007 20 4275 Fritch Drive Lower Nazareth PA 228,000 228,000 100.0% $1,374,840 1.1 2013 21 4270 Fritch Drive Lower Nazareth PA 302,640 302,640 100.0% $1,703,863 5.8 2014 22 5220 Jaindl Boulevard Bethlehem PA 280,000 280,000 100.0% $1,838,952 1.0 2015 23 5210 Jaindl Boulevard Bethlehem PA 252,000 252,000 100.0% $1,436,322 4.2 2016 24 6975 Ambassador Drive Allentown PA 134,000 123,545 92.2% $799,510 5.8 2018 Subtotal - Lehigh Valley, PA Industrial 1,316,540 1,306,085 99.2% $7,806,943 3.6 2014 % of Total Industrial Portfolio 31% $5.98 PSF 25 215 International Drive NW Concord NC 277,253 277,253 100.0% $1,313,455 2.2 2014 26 160 International Drive Concord NC 147,213 105,070 71.4% $603,583 5.5 2019 27 180 International Drive Concord NC 136,000 - 0.0% $0 2019 Subtotal - Charlotte, NC Industrial 560,466 382,323 68.2% $1,917,038 3.1 2017 % of Total Industrial Portfolio 13% $5.01 PSF 28 7466 Chancellor Drive Orlando FL 100,045 100,045 100.0% $540,243 4.4 1973 29 170 Sunport Lane Orlando FL 68,320 17,685 25.9% $112,379 0.9 1997 30 3320 Maggie Boulevard Orlando FL 108,312 108,312 100.0% $498,238 6.4 1985 Subtotal - Orlando, FL Industrial 276,677 226,042 81.7% $1,150,860 5.1 1984 % of Total Industrial Portfolio 7% $5.09 PSF 30 Total In-Service Industrial Portfolio 4,205,615 3,966,382 94.3% $23,126,721 4.5 2008 Stabilized In-Service Industrial Portfolio (1) 3,854,082 3,843,627 99.7% |
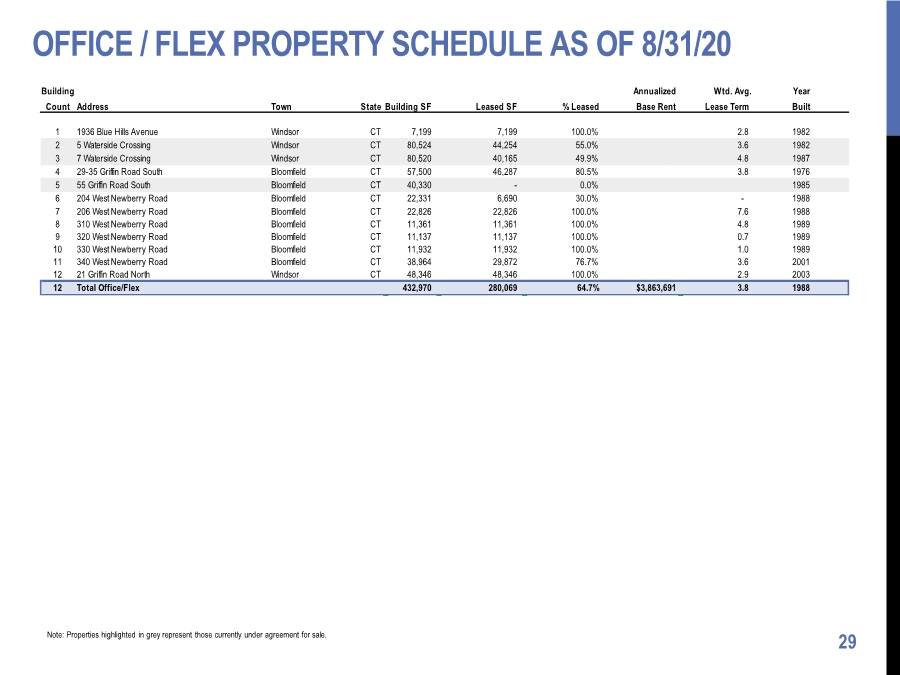
| OFFICE / FLEX PROPERTY SCHEDULE AS OF 8/31/20 29 Note: Properties highlighted in grey represent those currently under agreement for sale. Building Annualized Wtd. Avg. Year Count Address Town State Building SF Leased SF % Leased Base Rent Lease Term Built 1 1936 Blue Hills Avenue Windsor CT 7,199 7,199 100.0% $72,000 2.8 1982 2 5 Waterside Crossing Windsor CT 80,524 44,254 55.0% $702,258 3.6 1982 3 7 Waterside Crossing Windsor CT 80,520 40,165 49.9% $634,527 4.8 1987 4 29-35 Griffin Road South Bloomfield CT 57,500 46,287 80.5% $349,397 3.8 1976 5 55 Griffin Road South Bloomfield CT 40,330 - 0.0% $0 1985 6 204 West Newberry Road Bloomfield CT 22,331 6,690 30.0% $0 - 1988 7 206 West Newberry Road Bloomfield CT 22,826 22,826 100.0% $339,423 7.6 1988 8 310 West Newberry Road Bloomfield CT 11,361 11,361 100.0% $161,729 4.8 1989 9 320 West Newberry Road Bloomfield CT 11,137 11,137 100.0% $161,487 0.7 1989 10 330 West Newberry Road Bloomfield CT 11,932 11,932 100.0% $175,863 1.0 1989 11 340 West Newberry Road Bloomfield CT 38,964 29,872 76.7% $434,416 3.6 2001 12 21 Griffin Road North Windsor CT 48,346 48,346 100.0% $832,592 2.9 2003 12 Total Office/Flex 432,970 280,069 64.7% $3,863,691 3.8 1988 |
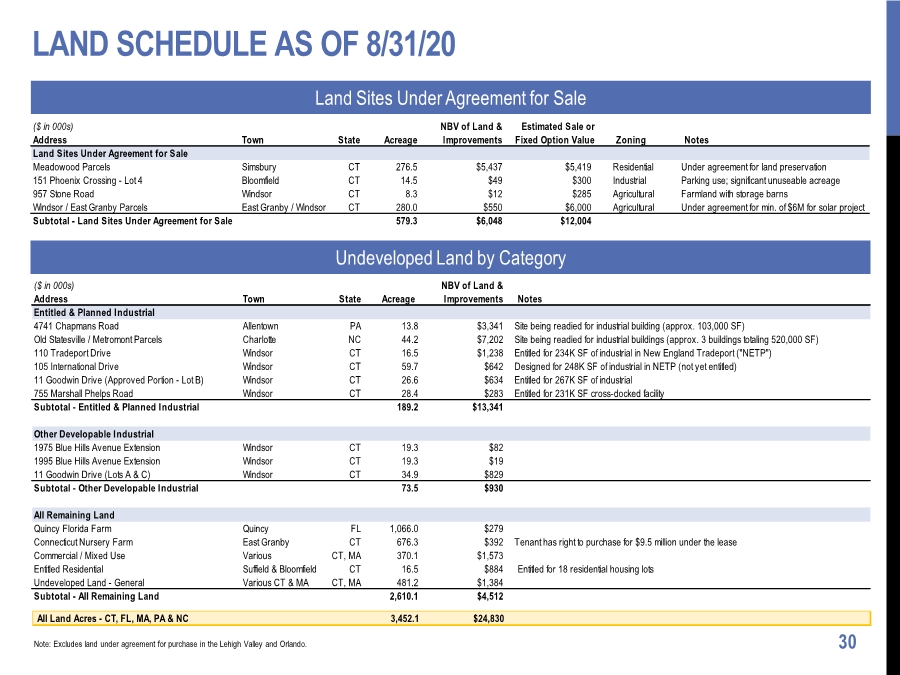
| LAND SCHEDULE AS OF 8/31/20 30 Note: Excludes land under agreement for purchase in the Lehigh Valley and Orlando. Undeveloped Land by Category Land Sites Under Agreement for Sale ($ in 000s) Address Town State Acreage NBV of Land & Improvements Estimated Sale or Fixed Option Value Zoning Notes Land Sites Under Agreement for Sale Meadowood Parcels Simsbury CT 276.5 $5,437 $5,419 Residential Under agreement for land preservation 151 Phoenix Crossing - Lot 4 Bloomfield CT 14.5 $49 $300 Industrial Parking use; significant unuseable acreage 957 Stone Road Windsor CT 8.3 $12 $285 Agricultural Farmland with storage barns Windsor / East Granby Parcels East Granby / Windsor CT 280.0 $550 $6,000 Agricultural Under agreement for min. of $6M for solar project Subtotal - Land Sites Under Agreement for Sale 579.3 $6,048 $12,004 ($ in 000s) Address Town State Acreage NBV of Land & Improvements Notes Entitled & Planned Industrial 4741 Chapmans Road Allentown PA 13.8 $3,341 Site being readied for industrial building (approx. 103,000 SF) Old Statesville / Metromont Parcels Charlotte NC 44.2 $7,202 Site being readied for industrial buildings (approx. 3 buildings totaling 520,000 SF) 110 Tradeport Drive Windsor CT 16.5 $1,238 Entitled for 234K SF of industrial in New England Tradeport ("NETP") 105 International Drive Windsor CT 59.7 $642 Designed for 248K SF of industrial in NETP (not yet entitled) 11 Goodwin Drive (Approved Portion - Lot B) Windsor CT 26.6 $634 Entitled for 267K SF of industrial 755 Marshall Phelps Road Windsor CT 28.4 $283 Entitled for 231K SF cross-docked facility Subtotal - Entitled & Planned Industrial 189.2 $13,341 Other Developable Industrial 1975 Blue Hills Avenue Extension Windsor CT 19.3 $82 1995 Blue Hills Avenue Extension Windsor CT 19.3 $19 11 Goodwin Drive (Lots A & C) Windsor CT 34.9 $829 Subtotal - Other Developable Industrial 73.5 $930 All Remaining Land Quincy Florida Farm Quincy FL 1,066.0 $279 Connecticut Nursery Farm East Granby CT 676.3 $392 Tenant has right to purchase for $9.5 million under the lease Commercial / Mixed Use Various CT, MA 370.1 $1,573 Entitled Residential Suffield & Bloomfield CT 16.5 $884 Entitled for 18 residential housing lots Undeveloped Land - General Various CT & MA CT, MA 481.2 $1,384 Subtotal - All Remaining Land 2,610.1 $4,512 All Land Acres - CT, FL, MA, PA & NC 3,452.1 $24,830 |
| DEFINITIONS 31 |

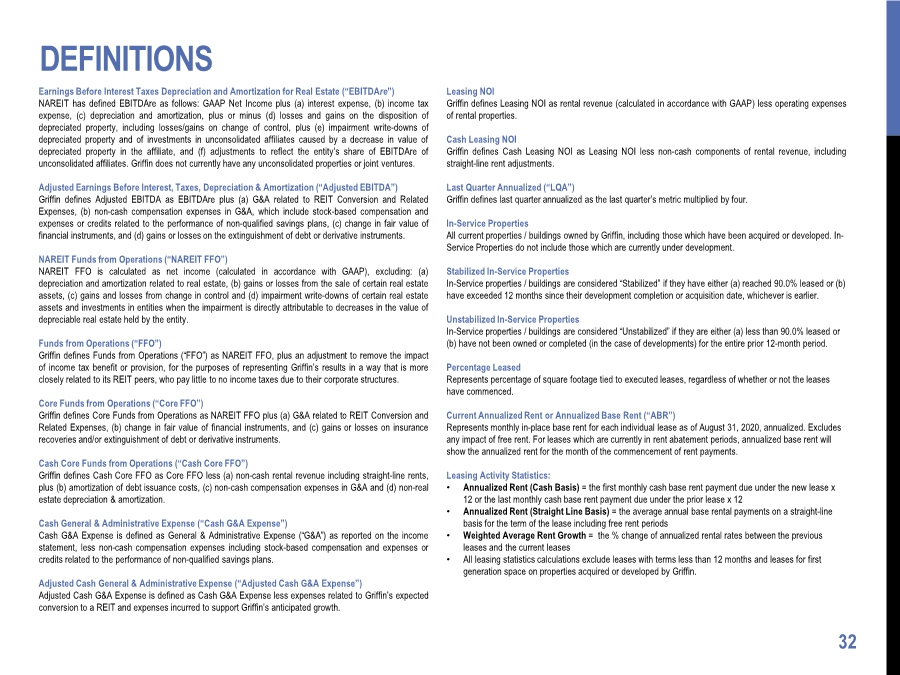
| DEFINITIONS 32 Earnings Before Interest Taxes Depreciation and Amortization for Real Estate (“EBITDAre”) NAREIT has defined EBITDAre as follows: GAAP Net Income plus (a) interest expense, (b) income tax expense, (c) depreciation and amortization, plus or minus (d) losses and gains on the disposition of depreciated property, including losses/gains on change of control, plus (e) impairment write-downs of depreciated property and of investments in unconsolidated affiliates caused by a decrease in value of depreciated property in the affiliate, and (f) adjustments to reflect the entity’s share of EBITDAre of unconsolidated affiliates. Griffin does not currently have any unconsolidated properties or joint ventures. Adjusted Earnings Before Interest, Taxes, Depreciation & Amortization (“Adjusted EBITDA”) Griffin defines Adjusted EBITDA as EBITDAre plus (a) G&A related to REIT Conversion and Related Expenses, (b) non-cash compensation expenses in G&A, which include stock-based compensation and expenses or credits related to the performance of non-qualified savings plans, (c) change in fair value of financial instruments, and (d) gains or losses on the extinguishment of debt or derivative instruments. NAREIT Funds from Operations (“NAREIT FFO”) NAREIT FFO is calculated as net income (calculated in accordance with GAAP), excluding: (a) depreciation and amortization related to real estate, (b) gains or losses from the sale of certain real estate assets, (c) gains and losses from change in control and (d) impairment write-downs of certain real estate assets and investments in entities when the impairment is directly attributable to decreases in the value of depreciable real estate held by the entity. Funds from Operations (“FFO”) Griffin defines Funds from Operations (“FFO”) as NAREIT FFO, plus an adjustment to remove the impact of income tax benefit or provision, for the purposes of representing Griffin’s results in a way that is more closely related to its REIT peers, who pay little to no income taxes due to their corporate structures. Core Funds from Operations (“Core FFO”) Griffin defines Core Funds from Operations as NAREIT FFO plus (a) G&A related to REIT Conversion and Related Expenses, (b) change in fair value of financial instruments, and (c) gains or losses on insurance recoveries and/or extinguishment of debt or derivative instruments. Cash Core Funds from Operations (“Cash Core FFO”) Griffin defines Cash Core FFO as Core FFO less (a) non-cash rental revenue including straight-line rents, plus (b) amortization of debt issuance costs, (c) non-cash compensation expenses in G&A and (d) non-real estate depreciation & amortization. Cash General & Administrative Expense (“Cash G&A Expense”) Cash G&A Expense is defined as General & Administrative Expense (“G&A”) as reported on the income statement, less non-cash compensation expenses including stock-based compensation and expenses or credits related to the performance of non-qualified savings plans. Adjusted Cash General & Administrative Expense (“Adjusted Cash G&A Expense”) Adjusted Cash G&A Expense is defined as Cash G&A Expense less expenses related to Griffin’s expected conversion to a REIT and expenses incurred to support Griffin’s anticipated growth. Leasing NOI Griffin defines Leasing NOI as rental revenue (calculated in accordance with GAAP) less operating expenses of rental properties. Cash Leasing NOI Griffin defines Cash Leasing NOI as Leasing NOI less non-cash components of rental revenue, including straight-line rent adjustments. Last Quarter Annualized (“LQA”) Griffin defines last quarter annualized as the last quarter’s metric multiplied by four. In-Service Properties All current properties / buildings owned by Griffin, including those which have been acquired or developed. In- Service Properties do not include those which are currently under development. Stabilized In-Service Properties In-Service properties / buildings are considered “Stabilized” if they have either (a) reached 90.0% leased or (b) have exceeded 12 months since their development completion or acquisition date, whichever is earlier. Unstabilized In-Service Properties In-Service properties / buildings are considered “Unstabilized” if they are either (a) less than 90.0% leased or (b) have not been owned or completed (in the case of developments) for the entire prior 12-month period. Percentage Leased Represents percentage of square footage tied to executed leases, regardless of whether or not the leases have commenced. Current Annualized Rent or Annualized Base Rent (“ABR”) Represents monthly in-place base rent for each individual lease as of August 31, 2020, annualized. Excludes any impact of free rent. For leases which are currently in rent abatement periods, annualized base rent will show the annualized rent for the month of the commencement of rent payments. Leasing Activity Statistics: • Annualized Rent (Cash Basis) = the first monthly cash base rent payment due under the new lease x 12 or the last monthly cash base rent payment due under the prior lease x 12 • Annualized Rent (Straight Line Basis) = the average annual base rental payments on a straight-line basis for the term of the lease including free rent periods • Weighted Average Rent Growth = the % change of annualized rental rates between the previous leases and the current leases • All leasing statistics calculations exclude leases with terms less than 12 months and leases for first generation space on properties acquired or developed by Griffin. |