Attached files
| file | filename |
|---|---|
| EX-99.1 - EX-99.1 - Yellow Corp | d26768dex991.htm |
| 8-K - 8-K - Yellow Corp | d26768d8k.htm |

YRC WORLDWIDE second QUARTER 2020 EARNINGS CONFERENCE CALL Exhibit 99.2

($ in millions) Term Loan Lease Financing Obligations CDA Notes UST Tranche B UST Tranche A Capital Structure Overview Tranche A of $300M will be used to cover short-term contractual obligations and certain other obligations including pension and healthcare payments and will carry an interest rate of LIBOR plus 3.5%, consisting of 1.5% cash and 2.0% payment in kind Tranche B of $400M will be used for essential capital investment in trailers and tractors and is expected to carry an interest rate of LIBOR plus 3.5% in cash

Largest debt instruments and the current labor agreement mature at various dates in 2024 Focused on Operational Execution Runway 3.5 years IBT March ABL Facility Jan. Term Loan June CDA Notes December UST Loan Sept. Capital Structure and Labor Timeline Today 2020 2021 2022 2023 2024

COVENANT WAIVER THROUGH 3Q21 LTM Adjusted EBITDA Covenant
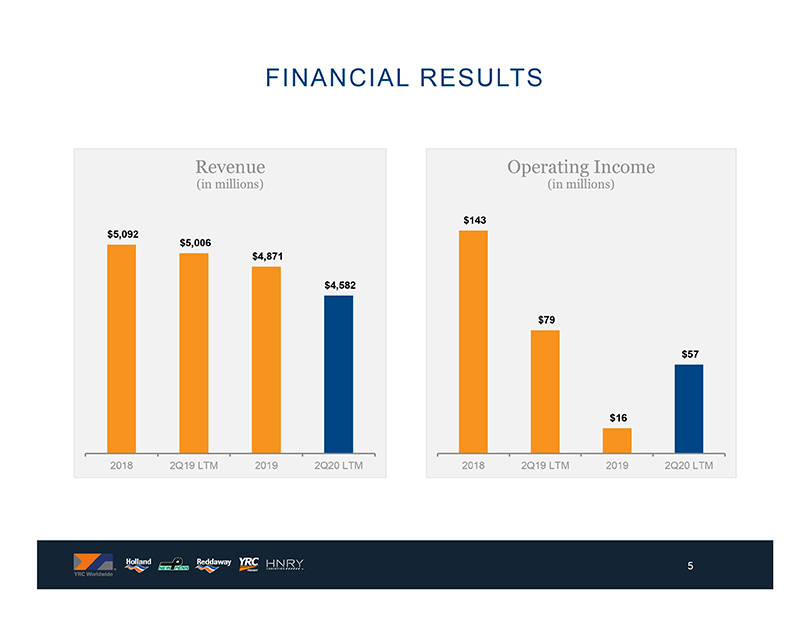
FINANCIAL RESULTS Revenue (in millions) $5,092 $5,006 $4,871 $4,582 2018 2Q19 LTM 2019 2Q20 LTM Operating Income (in millions) $143 $79 $57 $16 2018 2Q19 LTM 2019 2Q20 LTM 5

Financial results

Operating statistics (a) Percent change based on unrounded figures and not the rounded figures presented YoY % (a) 43951 43982 44012 Total LTL tonnage per day -22.560840232032962 0 -14.477907686330004 0 -8.5871408908211109 Total tonnage per day -20.300098945219812 0 -12.08650868507698 0 -6.6500041508973933 (a) Percent change based on unrounded figures and not the rounded figures presented. YRC Worldwide Inc. Instructions: Statistics 1 Update linking as appropriate Quarterly Comparison 2 Review check totals at the bottom 2Q20 2Q19 YoY % (a) Workdays 63 63.5 Total LTL tonnage (in thousands) 2,283.875474999998 2,701.5138614999951 -15.48858660187171 Total LTL tonnage per day (in thousands) 36.239484880952375 42.543525377952676 -14.817861098711962 Total LTL shipments (in thousands) 4,002.5230000000001 4,803.3660029999992 -16.672537601753085 Total LTL shipments per day (in thousands) 63.532111111111114 75.64355910236219 -16.011208535100327 Total picked up LTL revenue/cwt. $ 20.36191984175321 $ 21.602098871077715 -5.7410117263417249 Total picked up LTL revenue/cwt. (excl. FSC) $ 18.482311463191166 $ 18.981663538910954 -2.6307076547645805 Total picked up LTL revenue/shipment $ 232.29370891260297 $ 242.9894765514909 -4.4017410921173923 Total picked up LTL revenue/shipment (excl. FSC) $ 210.85068168566801 $ 213.51371989005187 -1.2472445357399931 Total LTL weight/shipment (in pounds) 1,140.8241988865523 1,124.8419794838587 1.4208412998621454 Total tonnage (in thousands) 2,925.6072372285003 3,375.386518499995 -13.325267456225262 Total tonnage per day (in thousands) 46.438210114738098 53.155693204724329 -12.637372753496892 Total shipments (in thousands) 4,122.4669999999996 4,911.6400029999995 -16.067403199704739 Total shipments per day (in thousands) 65.435984126984124 77.348661464566916 -15.401271479067466 Total picked up revenue/cwt. $ 17.404447132189908 $ 18.723793467924271 -7.0463623623841745 Total picked up revenue/cwt. (excl. FSC) $ 15.854703214829874 $ 16.508140654713461 -3.9582740028145804 Total picked up revenue/shipment $ 247.02963778677002 $ 257.34801413868951 -4.0095030017829174 Total picked up revenue/shipment (excl. FSC) $ 225.03338156213866 $ 226.8951119275323 -0.82052466867962126 Total weight/shipment (in pounds) 1,419.3478018033863 1,374.4437770025204 3.2670688719472887 YTD 2020 YTD 2020 YoY % (a) Workdays 128.5 126.5 Total LTL tonnage (in thousands) 4,827.4644900000003 5,225.6539764999998 -7.6198976872689128 Total LTL tonnage per day (in thousands) 37.567817042801558 41.309517600790514 -9.0577202913581196 Total LTL shipments (in thousands) 8,325.3169999999991 9,259.920059999989 -10.084952232842085 Total LTL shipments per day (in thousands) 64.788459143968865 73.194403209486154 -11.484408229218078 Total picked up LTL revenue/cwt. $ 20.50066733583246 $ 21.561997714207742 -4.9222265600925468 Total picked up LTL revenue/cwt. (excl. FSC) $ 18.368976074782271 $ 19.000419555905225 -3.3233133577132237 Total picked up LTL revenue/shipment $ 237.74768837038667 $ 243.38356077144184 -2.3156339660704273 Total picked up LTL revenue/shipment (excl. FSC) $ 213.02631411793934 $ 214.46944893331587 -0.67288596233827525 Total LTL weight/shipment (in pounds) 1,159.7070694124923 1,128.7616481429745 2.7415372696643958 Total tonnage (in thousands) 6,159.2479377250002 6,529.7527829999999 -5.6741021840765109 Total tonnage per day (in thousands) 47.93189056595331 51.618599075098814 -7.1422095430792085 Total shipments (in thousands) 8,548.4269999999997 9,460.5710059999983 -9.6415322650346038 Total shipments per day (in thousands) 66.524723735408557 74.787122577075081 -11.047889739508769 Total picked up revenue/cwt. $ 17.532648059986521 $ 18.68665502154635 -6.1755673245383962 Total picked up revenue/cwt. (excl. FSC) $ 15.765753409627408 $ 16.515185183576421 -4.537834517861099 Total picked up revenue/shipment $ 252.6498182796208 $ 257.95321985219982 -2.0559547873128796 Total picked up revenue/shipment (excl. FSC) $ 227.18842700517536 $ 227.97794413429196 -0.3463129436115685 Total weight/shipment (in pounds) 1,441.248663818502 1,380.4140952715768 4.3907673297373195 (a) Percent change based on unrounded figures and not the rounded figures presented. QTD Check 0 0 0 YTD Check 0

KEY SEGMENT INFORMATION (a) Percent change based on unrounded figures and not the rounded figures presented YRC Worldwide Inc. Instructions: Statistics 1 Update linking as appropriate Quarterly Comparison 2 Review check totals at the bottom 2Q20 2Q19 YoY % (a) Workdays 63 63.5 Total LTL tonnage (in thousands) 2,283.875474999998 2,701.5138614999951 -15.48858660187171 Total LTL tonnage per day (in thousands) 36.239484880952375 42.543525377952676 -14.817861098711962 Total LTL shipments (in thousands) 4,002.5230000000001 4,803.3660029999992 -16.672537601753085 Total LTL shipments per day (in thousands) 63.532111111111114 75.64355910236219 -16.011208535100327 Total picked up LTL revenue/cwt. $ 20.36191984175321 $ 21.602098871077715 -5.7410117263417249 Total picked up LTL revenue/cwt. (excl. FSC) $ 18.482311463191166 $ 18.981663538910954 -2.6307076547645805 Total picked up LTL revenue/shipment $ 232.29370891260297 $ 242.9894765514909 -4.4017410921173923 Total picked up LTL revenue/shipment (excl. FSC) $ 210.85068168566801 $ 213.51371989005187 -1.2472445357399931 Total LTL weight/shipment (in pounds) 1,140.8241988865523 1,124.8419794838587 1.4208412998621454 Total tonnage (in thousands) 2,925.6072372285003 3,375.386518499995 -13.325267456225262 Total tonnage per day (in thousands) 46.438210114738098 53.155693204724329 -12.637372753496892 Total shipments (in thousands) 4,122.4669999999996 4,911.6400029999995 -16.067403199704739 Total shipments per day (in thousands) 65.435984126984124 77.348661464566916 -15.401271479067466 Total picked up revenue/cwt. $ 17.404447132189908 $ 18.723793467924271 -7.0463623623841745 Total picked up revenue/cwt. (excl. FSC) $ 15.854703214829874 $ 16.508140654713461 -3.9582740028145804 Total picked up revenue/shipment $ 247.02963778677002 $ 257.34801413868951 -4.0095030017829174 Total picked up revenue/shipment (excl. FSC) $ 225.03338156213866 $ 226.8951119275323 -0.82052466867962126 Total weight/shipment (in pounds) 1,419.3478018033863 1,374.4437770025204 3.2670688719472887 YTD 2020 YTD 2019 YoY % (a) Workdays 128.5 126.5 Total LTL tonnage (in thousands) 4,827.4644900000003 5,225.6539764999998 -7.6198976872689128 Total LTL tonnage per day (in thousands) 37.567817042801558 41.309517600790514 -9.0577202913581196 Total LTL shipments (in thousands) 8,325.3169999999991 9,259.920059999989 -10.084952232842085 Total LTL shipments per day (in thousands) 64.788459143968865 73.194403209486154 -11.484408229218078 Total picked up LTL revenue/cwt. $ 20.50066733583246 $ 21.561997714207742 -4.9222265600925468 Total picked up LTL revenue/cwt. (excl. FSC) $ 18.368976074782271 $ 19.000419555905225 -3.3233133577132237 Total picked up LTL revenue/shipment $ 237.74768837038667 $ 243.38356077144184 -2.3156339660704273 Total picked up LTL revenue/shipment (excl. FSC) $ 213.02631411793934 $ 214.46944893331587 -0.67288596233827525 Total LTL weight/shipment (in pounds) 1,159.7070694124923 1,128.7616481429745 2.7415372696643958 Total tonnage (in thousands) 6,159.2479377250002 6,529.7527829999999 -5.6741021840765109 Total tonnage per day (in thousands) 47.93189056595331 51.618599075098814 -7.1422095430792085 Total shipments (in thousands) 8,548.4269999999997 9,460.5710059999983 -9.6415322650346038 Total shipments per day (in thousands) 66.524723735408557 74.787122577075081 -11.047889739508769 Total picked up revenue/cwt. $ 17.532648059986521 $ 18.68665502154635 -6.1755673245383962 Total picked up revenue/cwt. (excl. FSC) $ 15.765753409627408 $ 16.515185183576421 -4.537834517861099 Total picked up revenue/shipment $ 252.6498182796208 $ 257.95321985219982 -2.0559547873128796 Total picked up revenue/shipment (excl. FSC) $ 227.18842700517536 $ 227.97794413429196 -0.3463129436115685 Total weight/shipment (in pounds) 1,441.248663818502 1,380.4140952715768 4.3907673297373195 (a) Percent change based on unrounded figures and not the rounded figures presented. QTD Check 0 0 0 YTD Check 0

($ in millions) Adjusted Ebitda reconciliation YRCW Inc. Reconciliation of Net (Loss) Income to Adjusted EBITDA LTM LTM LTM LTM LTM LTM 2015 2016 2017 2018 2019 2Q 2018 2Q 2019 4Q 2019 1Q 2020 2Q 2020 4Q 2018 1Q 2019 2Q 2019 4Q 2019 1Q 2020 2Q 2020 Reconciliation of net income (loss) to adjusted EBITDA Net income (loss) $0.7 $21.5 $-10.8 $20.2 $-,103.99999999999928 $14.4 $-23.6 $-15.299999999999827 $4.3 $-37.099999999999909 $20.2 $-14.299999999999862 $-52.299999999999869 $-,103.99999999999983 $-50.599999999999831 $-64.099999999999739 Interest expense, net 107.1 103 102.4 104.5 109.9 25.5 27.799999999999997 27.900000000000006 28.2 40.200000000000003 104.5 105.5 107.8 109.9 111.60000000000001 124.00000000000001 Income tax (benefit) expense -5.0999999999999996 3.1 -7.3 11.1 -4.3 10.4 9.1 -3.1999999999999997 -0.4 -7.5 11.1 14.3 13.000000000000002 -4.2999999999999989 5 -11.6 Depreciation and amortization 163.69999999999999 159.80000000000001 147.69999999999999 147.69999999999999 152.4 37.599999999999994 38.5 36.700000000000003 35.700000000000003 34.200000000000003 147.69999999999999 150 150.9 152.4 148.10000000000002 143.80000000000001 EBITDA $266.39999999999998 $287.39999999999998 232 283.5 154.00000000000074 $87.899999999999991 51.8 46.100000000000179 67.800000000000011 29.800000000000097 $283.5 $255.50000000000011 219.40000000000015 154.00000000000017 214.10000000000019 192.10000000000028 Adjustments pursuant to Term Loan Agreement: Gains on property disposals, net 1.9 -14.6 -0.6 -20.8 -13.7 2.2000000000000002 -6.1999999999999993 -10.1 -39.299999999999997 -6 -20.8 -22.4 -30.8 -13.7 -54.599999999999994 -54.4 Noncash reserve changes 0 0 0 0 16.100000000000001 0 16 2.1000000000000014 0.3 2.7 0 0 16 16.100000000000001 16.400000000000002 3.1000000000000014 Impairment charges 0 0 0 0 8.1999999999999993 0 0 0 0 0 0 8.1999999999999993 8.1999999999999993 8.1999999999999993 0 0 Letter of credit expense 8.8000000000000007 7.7 6.8 6.6 6.5 1.7 1.6 1.7000000000000002 1.6 1.6 6.6 6.5 6.4 6.5000000000000009 6.5 6.5 Permitted dispositions and other 0.4 3 1.2 0.3 -0.9 0.19999999999999996 0 0.1 0.2 0 0.3 -1.3000000000000003 -1.5 -0.9 0.4 0.4 Equity-based compensation expense 8.5 7.3 6.5 6.3 6.3 3.1999999999999997 1.1000000000000001 1.1000000000000001 2 1.2000000000000002 6.3 6.9999999999999991 4.9000000000000004 6.3000000000000007 6 6.1000000000000005 Loss on extinguishment of debt 0.6 0 0 0 11.2 0 0 0 0 0 0 0 0 11.2 11.2 11.2 Non-union pension settlement charge 28.7 0 7.6 10.9 1.8 0 0 0.1 0 0 10.9 10.9 10.9 1.8 1.8 1.8 Other, net #REF! #REF! 2.2999999999999998 0.1 2.9 1.4 1 0.6 -1.6 2.1 0.1 2.2999999999999998 1.9 2.9000000000000004 0.19999999999999973 1.3 Expense amounts subject to 10% threshold 5.0999999999999996 0 8.1 COVID-19 0 0 0 0.2 3.6999999999999997 0 0 0 0 0.2 3.9 Other, net 20.9 18.2 3.8 4.0999999999999996 4.0999999999999996 2.9 2.8000000000000003 7.7 25.5 25.799999999999997 18.2 12.4 11.1 Adjusted EBITDA prior to 10% threshold 274.2000000000001 307.8 210.60000000000073 96.600000000000009 69.399999999999991 45.800000000000189 34.100000000000016 37.900000000000098 294.60000000000002 292.2000000000001 261.20000000000016 210.60000000000016 214.60000000000019 183.10000000000028 Adjustments pursuant to TTM calculation 0.2 0 0 0 0 0 -2.1 1.5 0 0 2.2999999999999998 0 -2.1 0 0 0 hardcode for LTM! Adjusted EBITDA #REF! #REF! $274.2000000000001 $307.8 $210.60000000000073 $96.600000000000009 $67.3 $47.300000000000189 $34.100000000000016 $37.900000000000098 $591.5 $292.2000000000001 $259.10000000000014 $210.60000000000016 $214.60000000000019 $183.10000000000028