Attached files
Table of Contents
UNITED STATES
SECURITIES AND EXCHANGE COMMISSION
WASHINGTON, D.C. 20549
FORM 10-K
| x | ANNUAL REPORT PURSUANT TO SECTION 13 OR 15(d) OF THE SECURITIES EXCHANGE ACT OF 1934 |
For the fiscal year ended December 31, 2009
OR
| ¨ | TRANSITION REPORT PURSUANT TO SECTION 13 OR 15(d) OF THE SECURITIES EXCHANGE ACT OF 1934 |
For the transition period from to
Commission file number 0-12255
YRC WORLDWIDE INC.
(Exact name of registrant as specified in its charter)
| Delaware | 48-0948788 | |
| (State or other jurisdiction of | (I.R.S. Employer | |
| incorporation or organization) | Identification No.) | |
| 10990 Roe Avenue, Overland Park, Kansas | 66211 | |
| (Address of principal executive offices) | (Zip Code) | |
Registrant’s telephone number, including area code: (913) 696-6100
Securities registered pursuant to Section 12(b) of the Act:
| Title of each class |
Name of each exchange on which registered | |
| Common Stock, $0.01 par value per share | The NASDAQ Stock Market LLC |
Securities registered pursuant to Section 12(g) of the Act: NONE
Indicate by check mark if the registrant is a well-known seasoned issuer, as defined in Rule 405 of the Securities Act.
Yes ¨ No x
Indicate by check mark if the registrant is not required to file reports pursuant to Section 13 or Section 15(d) of the Exchange Act.
Yes ¨ No x
Indicate by check mark whether the registrant (1) has filed all reports required to be filed by Section 13 or 15(d) of the Securities Exchange Act of 1934 during the preceding 12 months (or for such shorter period that the registrant was required to file such reports), and (2) has been subject to such filing requirements for the past 90 days.
Yes x No ¨
Indicate by check mark whether the registrant has submitted electronically and posted on its corporate Web site, if any, every Interactive Data File required to be submitted and posted pursuant to Rule 405 of Regulation S-T during the preceding 12 months (or for such shorter period that the registrant was required to submit and post such files).
Yes ¨ No ¨
Indicate by check mark if disclosure of delinquent filers pursuant to Item 405 of Regulation S-K is not contained herein, and will not be contained, to the best of registrant’s knowledge, in definitive proxy or information statements incorporated by reference in Part III of this Form 10-K or any amendment to this Form 10-K. x
Table of Contents
Indicate by check mark whether the registrant is a large accelerated filer, an accelerated filer, a non-accelerated filer, or a smaller reporting company. See definitions of “large accelerated filer,” “accelerated filer” and “smaller reporting company” in Rule 12b-2 of the Exchange Act.
| Large accelerated filer ¨ | Accelerated filer x | Non-accelerated filer ¨ | Smaller reporting company ¨ | |||
| (Do not check if a smaller reporting company |
Indicate by check mark whether the registrant is a shell company (as defined in Rule 12b-2 of the Act).
Yes ¨ No x
As of June 30, 2009, the aggregate market value of the registrant’s common stock held by non-affiliates of the registrant was $101,469,441 based on the closing sale price as reported on the NASDAQ Global Select Market.
Indicate the number of shares outstanding of each of the registrant’s classes of common stock, as of the latest practicable date.
| Class |
Outstanding at February 28, 2010 | |
| Common Stock, $0.01 Par Value Per Share |
1,020,745,435 shares |
DOCUMENTS INCORPORATED BY REFERENCE
Pursuant to General Instruction G to Form 10-K, information required by Part III of this Form 10-K, either is incorporated herein by reference to a definitive proxy statement filed with the SEC no later than 120 days after the end of the fiscal year covered by this Form 10-K or will be included in an amendment to this Form 10-K filed with the SEC no later than 120 days after the end of the fiscal year covered by this Form 10-K.
Table of Contents
Form 10-K
Year Ended December 31, 2009
Index
| Item |
Page | |
| PART I |
||
| 4 | ||
| 11 | ||
| 16 | ||
| 16 | ||
| 16 | ||
| 16 | ||
| PART II |
||
| 17 | ||
| 19 | ||
| 7. Management’s Discussion and Analysis of Financial Condition and Results of Operations |
20 | |
| 7A. Quantitative and Qualitative Disclosures About Market Risk |
52 | |
| 53 | ||
| 9. Changes in and Disagreements With Accountants on Accounting and Financial Disclosure |
112 | |
| 112 | ||
| 112 | ||
| PART III |
||
| 113 | ||
| 114 | ||
| 12. Security Ownership of Certain Beneficial Owners and Management |
114 | |
| 13. Certain Relationships and Related Transactions, and Director Independence |
115 | |
| 115 | ||
| PART IV |
||
| 116 | ||
| 116 | ||
| Report of Independent Registered Public Accounting Firm on Financial Statement Schedule |
122 | |
| 123 | ||
| 124 | ||
3
Table of Contents
Note on Forward-Looking Statements
This entire annual report, including (among other items) “Item 7, Management’s Discussion and Analysis of Financial Condition and Results of Operations” and certain statements in the Notes to Consolidated Financial Statements contained in “Item 8, Financial Statements and Supplementary Data”, includes forward-looking statements within the meaning of Section 27A of the Securities Act of 1933, as amended, and Section 21E of the Securities Exchange Act of 1934, as amended (each a “forward-looking statement”). Forward-looking statements include those preceded by, followed by or including the words “should,” “could,” “may,” “expect,” “believe,” “estimate” or similar expressions. Our actual results could differ materially from those projected by these forward-looking statements due to a number of factors, including (without limitation) our ability to generate sufficient cash flows and liquidity to fund operations, which raises substantial doubt about our ability to continue as a going concern, inflation, inclement weather, price and availability of fuel, sudden changes in the cost of fuel or the index upon which the Company bases its fuel surcharge, competitor pricing activity, expense volatility, including (without limitation) expense volatility due to changes in rail service or pricing of rail service, ability to capture cost reductions, changes in equity and debt markets, a downturn in general or regional economic activity, effects of a terrorist attack, and labor relations, including (without limitation), the impact of work rules, work stoppages, strikes or other disruptions, any obligations to multi-employer health, welfare and pension plans, wage requirements and employee satisfaction, the risk factors included in “Item 1A – Risk Factors” and the risk factors that are from time to time included in the Company’s reports filed with the Securities and Exchange Commission (the “SEC”).
PART I
| Item 1. | Business |
General Description of the Business
YRC Worldwide Inc. (also referred to as “YRC Worldwide”, “the Company”, “we”, “us” or “our”), one of the largest transportation service providers in the world, is a holding company that through wholly owned operating subsidiaries offers its customers a wide range of transportation services. These services include global, national and regional transportation as well as logistics. Our operating subsidiaries include the following:
| • | YRC National Transportation (“National Transportation”) is the reporting unit for our transportation service providers focused on business opportunities in regional, national and international services. This unit includes our less-than-truckload (“LTL”) subsidiary YRC Inc. (“YRC”), which was formed through the March 2009 integration of our former Yellow Transportation and Roadway networks. National Transportation provides for the movement of industrial, commercial and retail goods, primarily through centralized management and customer facing organizations. National Transportation also includes YRC Reimer, a subsidiary located in Canada that specializes in shipments into, across and out of Canada. Approximately 37% of National Transportation shipments are completed in two days or less. In addition to the United States (“U.S.”) and Canada, National Transportation also serves parts of Mexico, Puerto Rico and Guam. |
| • | YRC Regional Transportation (“Regional Transportation”) is the reporting unit for our transportation service providers focused on business opportunities in the regional and next-day delivery markets. Regional Transportation is comprised of New Penn Motor Express (“New Penn”), Holland and Reddaway. These companies each provide regional, next-day ground services in their respective regions through a network of facilities located across the U.S., Canada, Mexico and Puerto Rico. Approximately 93% of Regional Transportation LTL shipments are completed in two days or less. |
| • | YRC Logistics plans and coordinates the movement of goods worldwide to provide customers a single source for logistics management solutions. YRC Logistics delivers a wide range of global logistics management services, with the ability to provide customers improved return-on-investment results through logistics services and technology management solutions. |
| • | YRC Truckload (“Truckload”) reflects the results of Glen Moore, a provider of truckload services throughout the U.S. |
For revenue and other information regarding these segments, see the “Business Segments” note to our consolidated financial statements.
Incorporated in Delaware in 1983 and headquartered in Overland Park, Kansas, we employed approximately 36,000 people as of December 31, 2009. The mailing address of our headquarters is 10990 Roe Avenue, Overland Park, Kansas 66211, and our telephone number is (913) 696-6100. Our website is www.yrcw.com. Through the “SEC Filings” link on our website, we make available the following filings as soon as reasonably practicable after they are electronically filed with or furnished to the SEC: our Annual Report on Form 10-K, Quarterly Reports on Form 10-Q, Current Reports on Form 8-K, and any amendments to those reports filed or furnished pursuant to Section 13(a) or 15(d) of the Securities Exchange Act of 1934, as amended. All of these filings may be viewed or printed from our website free of charge.
4
Table of Contents
Narrative Description of the Business
Operating Units
YRC National Transportation
Through September 30, 2008, National Transportation was comprised of the Company’s two largest LTL subsidiaries, Yellow Transportation and Roadway. In October 2008, these two subsidiaries merged and changed the name of the surviving entity to YRC, headquartered in Overland Park, Kansas. YRC continued to operate Yellow Transportation and Roadway as two separate divisions, each with a distinct, separate transportation network of terminal and transportation routes and each continuing their respective brand names. Prior to the merger, Yellow Transportation and Roadway were in many cases operating out of different parts of the same facility. In October 2008, YRC began to integrate the Yellow Transportation and Roadway networks by installing common management at locations where the divisions shared a facility and by having only one local pickup and delivery function at certain locations. On March 1, 2009, YRC fully combined both networks into a single network with a single management structure, a single set of routes and one technology platform. This combination eliminated the two divisions. This network is operated under the brand YRC, although the legacy brand names, Yellow Transportation and Roadway, will continue to exist in the marketplace and be phased out over time as equipment and sales collateral bearing these brands is replaced.
National Transportation offers a full range of services for the transportation of industrial, commercial and retail goods in regional, national and international markets, primarily through the operation of owned or leased equipment in their respective North American surface distribution networks. Transportation services are provided for various categories of goods, which may include (among others) apparel, appliances, automotive parts, chemicals, food, furniture, glass, machinery, metal, metal products, non-bulk petroleum products, rubber, textiles, wood and other manufactured products or components. National Transportation provides both LTL services, which combines shipments from multiple customers on a single trailer, and truckload services. Most deliveries are LTL shipments with truckload services offered to maximize equipment utilization and reduce empty miles (the distance empty or partially full trailers travel back to origin to balance the network). National Transportation provides higher-margin specialized services, including guaranteed expedited services, time-specific deliveries, cross-border services, coast-to-coast air delivery, global transportation, product returns, temperature-sensitive shipment protection and government material shipments.
National Transportation serves more than 350,000 manufacturing, wholesale, retail and government customers throughout North America. National Transportation’s 22,000 employees are dedicated to operating its expansive network which supports over 225,000 shipments in transit at any time. National Transportation shipments have an average shipment size of 1,200 pounds and travel an average distance of roughly 1,200 miles. Approximately 37% of shipments are delivered in two days or less. Operations research and engineering teams centrally coordinate the equipment, routing, sequencing and timing necessary to transport shipments through our network. At December 31, 2009, National Transportation had 11,704 owned tractors, 1,239 leased tractors, 50,083 owned trailers and 3,244 leased trailers. The National Transportation network includes 339 strategically located facilities with 18,470 doors. National Transportation accounted for 66% of our total operating revenue in 2009, 70% of our total operating revenue in 2008 and 69% of our total operating revenue in 2007.
National Transportation provides services throughout North America, including within Puerto Rico, Guam, Alaska and Hawaii. National Transportation also has affiliates that provide services in Mexico and Canada.
National Transportation has one of the largest network of LTL service centers, equipment and transportation professionals throughout North America and provides flexible and efficient supply chain solutions including:
| • | Guaranteed PrecisionTM – a guaranteed on-time service with constant shipment monitoring and more direct points than any other guaranteed standard delivery service. |
| • | Expedited PrecisionTM – comprised of two key offerings including: |
| • | YRC Time-CriticalTM – Expedited, emergency and window deliveries via ground or air anywhere in North America with shipment arrival timed to the hour, day, or span of days and a 100% on-time guarantee. Guaranteed multiple-day window deliveries meet a retail industry need to reduce chargeback fees. |
| • | YRC Time-AdvantangeTM – Cost-effective blend of ground and air transportation to provide highly reliable deliveries at any speed throughout North America, with both expedited and deferred air capabilities. |
5
Table of Contents
| • | Specialized SolutionsTM – includes a variety of services to meet industry and customer-specific needs with offerings such as Custom Projects, Consolidation and Distribution, Reverse Logistics, Residential, Exhibit Services and Shipment Protection through Insulated Covers and our patented Sealed DividerTM and Sealed TrailerTM services that are designed for products that are difficult or expensive to package for shipping, are of high value, or need verifiable security throughout the transit. |
| • | my.yrc.com – a secure e-commerce website offering online resources for supply chain visibility and shipment management in real time. |
| • | Global Services – Global offerings in cooperation with YRC Logistics provide air, ocean and ground transportation and logistics services at any point in the supply chain; Standard Forwarding, Global Logistics, Transportation Management, Flow Through and Pool Distribution and Dedicated Warehouse. |
YRC Reimer
Founded in 1952, YRC Reimer, a wholly owned subsidiary of YRC, offers Canadian shippers a selection of direct connections within Canada, throughout North America and around the world. YRC Reimer is also a part of YRC and its network and information systems are completely integrated with those of YRC enabling YRC Reimer to provide seamless cross-border services between Canada, Mexico and the U.S. and markets overseas.
YRC Regional Transportation
Regional Transportation is comprised of New Penn, Holland and Reddaway. Together, the Regional Transportation companies deliver services in the next-day, second-day and time-sensitive markets, which are among the fastest-growing transportation segments. The Regional Transportation service portfolio includes:
| • | Regional delivery – including next-day local area delivery and second-day services; consolidation/distribution services; protect-from-freezing and hazardous materials handling; and a variety of other specialized offerings. |
| • | Expedited delivery – including day-definite, hour-definite and time definite capabilities. |
| • | Inter-regional delivery – combining our best-in-class regional networks with reliable sleeper teams, Regional Transportation provides reliable, high-value services between our regional operations. |
| • | Cross-border delivery – through strategic partnerships, the Regional Transportation companies provide full-service capabilities between the U.S. and Canada, Mexico and Puerto Rico. |
| • | my.yrcregional.com and NewPenn.com – are both leading edge e-commerce websites offering secure and customized online resources to manage transportation activity. |
The Regional Transportation companies are described as follows:
| • | New Penn Motor Express, headquartered in Lebanon, Pennsylvania, provides local next-day, day-definite, and time-definite services through a network located in the Northeastern United States; Quebec, Canada; and Puerto Rico. |
| • | Holland, headquartered in Holland, Michigan, provides local next-day, regional and expedited services through a network located in the Midwestern, Southeastern and portions of the Northeast United States. Holland also provides service to the provinces of Ontario and Quebec, Canada. |
| • | Reddaway, headquartered in Clackamas, Oregon, provides local next-day, regional and expedited services through a network located in California, the Pacific Northwest, the Rocky Mountain States and the Southwest. Additionally Reddaway provides services to Alaska and to the provinces of Alberta and British Columbia, Canada. |
The Regional Transportation companies serve more than 155,000 manufacturing, wholesale, retail and government customers throughout North America. At December 31, 2009, the Regional Transportation network included 132 service centers with 6,851 doors, and the fleet included 6,655 tractors and 14,636 trailers. Regional Transportation’s over 10,000 employees are dedicated to supporting the delivery of over 9.5 million shipments annually.
Headquartered in Overland Park, Kansas, the Regional Transportation companies accounted for 25% of our total operating revenue in 2009, 22% of our total operating revenue in 2008 and 24% of the total operating revenue in 2007.
6
Table of Contents
YRC Logistics
YRC Logistics is a global logistics services provider that plans and coordinates the movement of goods worldwide to provide customers a single source for logistics management solutions.
YRC Logistics delivers a wide range of global and domestic logistics services, with the ability to provide clients services through the design, implementation and execution of innovative logistics solutions. Our broad portfolio of services makes it possible to offer end-to-end supply chain solutions supported by the visibility of Web-native technology. YRC Logistics’ service portfolio includes the following services:
Distribution Services that include:
| • | Flow through and pool distribution |
| • | Dedicated warehousing |
| • | Value-added services |
Global Services that include:
| • | International freight forwarding |
| • | Customs brokerage |
| • | Value-added services |
Transportation Services that include:
| • | Truckload brokerage |
| • | Domestic freight forwarding |
| • | Transportation management |
In November 2009, YRC Logistics sold its dedicated contract carriage division that was previously a part of Transportation Services.
In August 2008, YRC Logistics acquired 65% of Shanghai Jiayu Logistics Co., Ltd., one of the largest providers of less-than-truckload ground transportation services in China, with over 30,000 customers and 1,400 employees in 170 locations. The Company also has a 50% ownership interest in JHJ International Transportation Co., Ltd., a Shanghai, China-based freight forwarder with 1,200 employees in 60 locations.
At December 31, 2009, YRC Logistics had more than 1,600 employees in North America, Asia, Latin America, and Europe (predominately in the United Kingdom). Based in Overland Park, Kansas, YRC Logistics’ network includes 25 service centers with 660 doors and the fleet includes 244 tractors and 871 trailers. YRC Logistics operates its Global Services from 38 locations across the country. YRC Logistics accounted for 8% of our total operating revenue in 2009, 7% of our total operating revenue in 2008 and 6% of our total operating revenue in 2007.
YRC Truckload
Glen Moore, headquartered in Carlisle, Pennsylvania, provides spot, dedicated and single-source customized truckload services on both a regional and national level through the use of company and team-based drivers. Glen Moore has two primary domiciles located in Carlisle, Pennsylvania, and Knoxville, Tennessee.
At December 31, 2009, Glen Moore had more than 750 employees in North America. YRC Truckload accounted for 1% of our total operating revenue in 2009, 2008 and 2007.
Shared Services
We began 2009 with three wholly owned subsidiaries that provided shared support services across the YRC Worldwide enterprise. During 2009 we consolidated these services into one legal entity, YRC Enterprise Services, and dissolved YRC Assurance Co. Ltd. (“YRC Assurance”).
YRC Enterprise Services, headquartered in Overland Park, Kansas, has approximately 1,600 employees and is the surviving entity from the December 31, 2009, merger of YRC Worldwide Technologies and YRC North American Transportation. YRC Enterprise Services provides a wide variety of centrally managed support and technology services to our operating companies. These services span nearly all functions, including components of finance, operations support, sales, marketing, information technology and security. Enterprise Solutions Group, a division that provides sales and marketing services to our operating subsidiaries for an identified group of large accounts who desire to buy services from more than one of these operating subsidiaries in a coordinated manner, is a part of YRC Enterprise Services.
7
Table of Contents
YRC Assurance was the Company’s captive insurance company, domiciled in Bermuda and a wholly owned and consolidated subsidiary of YRC Worldwide. YRC Assurance insured certain of our subsidiaries for certain of their respective self-insured obligations for workers’ compensation liabilities. As a part of our 2009 restructuring, we dissolved YRC Assurance and as a result, the operating companies who received insurance from YRC Assurance are now directly self-insured for their workers’ compensation liabilities.
In addition to the above, YRC Worldwide provides certain services to its subsidiaries such as legal, risk management, finance and coordination services. Each of our shared services organizations charges the operating companies for their services, either based upon usage or on an overhead allocation basis.
Competition
Perhaps more than any other time in recent history, customers have a wide range of choices in transportation providers. The companies of YRC Worldwide believe that flexibility, responsiveness, service quality, technology, a broad service portfolio and overall brand strategy are important competitive differentiators. YRC Worldwide companies are focused on helping customers reduce total transportation costs by using transportation expertise and a solutions approach to solving supply chain challenges.
Few U.S.-based transportation companies offer comparable transportation and logistics capabilities. By integrating traditional ground, expedited, air, ocean and managed transportation capabilities, we provide business organizations with a single-source solution to supply chain challenges globally. Our market studies show a continued preference among customers for transportation and logistics providers based on “service value,” which is the relationship between overall quality and price. We believe that we can compete against any transportation and logistics competitor from an overall value perspective.
Many competitors across the full spectrum of the transportation industry experienced reduced shipment and tonnage levels in 2009 during the global economic recession. As a result, many reduced the size and scope of terminal networks, staffing levels and service offerings to adjust to new business levels in the marketplace. YRC Worldwide companies also made similar adjustments, but remain among the few providers that are capable of offering broad capabilities across wide geographies, modes of transportation and unique customer bases to meet the broadest of customer supply chain needs.
The companies of YRC Worldwide – YRC, YRC Reimer, YRC Logistics, New Penn, Holland, Reddaway and Glen Moore – operate in a highly competitive environment. Their competitors include global, integrated transportation services providers; global forwarders; national transportation services providers; regional or interregional providers; and small, intraregional transportation companies. The companies of YRC Worldwide also compete against providers within several modes of transportation including: LTL, truckload, air and ocean cargo, rail, transportation consolidators and privately owned fleets.
Ground-based transportation includes private fleets and two “for-hire” provider groups. The private provider segment consists of fleets owned by companies who move their own goods. The two “for-hire” groups are based on typical shipment sizes that transportation service companies handle. Truckload refers to providers transporting shipments that generally fill an entire 48- or 53-foot trailer and LTL or “shared load” refers to providers transporting goods from multiple shippers in a single load that would not fill a full-sized trailer on their own.
Shared load or LTL transportation providers consolidate numerous orders generally ranging from 100 to 10,000 pounds from varying businesses at individual service centers – in close proximity to where those shipments originated. Utilizing expansive networks of pickup and delivery operations around these local service centers, shipments are moved between origin and destination utilizing distribution centers when necessary, where consolidation and deconsolidation of loads occurs. Depending on the distance shipped, shared load providers (asset and non-asset based) are often classified into one of four sub-groups:
| • | Regional – Average distance is typically less than 500 miles with a focus on one- and two-day delivery times. Regional transportation companies can move shipments directly to their respective destination centers, which increases service reliability and avoids costs associated with intermediate handling. |
| • | Interregional – Average distance is usually between 500 and 1,000 miles with a focus on two- and three-day delivery times. There is a competitive overlap between regional and national providers in this category as each group sees the interregional segment as a growth opportunity, and there are no providers focusing exclusively on this sector. |
8
Table of Contents
| • | National – Average distance is typically in excess of 1,000 miles with focus on two- to five-day delivery times. National providers rely on interim shipment handling through a network of terminals, which require numerous satellite service centers, multiple distribution centers, and a relay network. To gain service and cost advantages, they often ship directly between service centers, minimizing intermediate handling. |
| • | Global – providing freight forwarding and final-mile delivery services to companies shipping to and from multiple regions around the world. This service can be offered through a combination of owned assets or through a purchased transportation or third-party logistics model. |
Competitive cost of entry into the asset-based LTL sector on a small scale, within a limited service area, is relatively small (although more than in other sectors of the transportation industry). The larger the service area, the greater the barriers to entry, due primarily to the need for additional equipment and facilities associated with broader geographic service coverage. Broader market coverage in the competitive transportation landscape also requires increased technology investment and the ability to capture cost efficiencies from shipment density (scale), making entry on a national basis more difficult.
YRC and YRC Logistics (through transportation management services) provide service in all four sub-groups. New Penn, Holland, Reddaway and YRC Glen Moore compete in the regional, interregional and national transportation marketplace. Each brand competes against a number of providers in these markets from small firms with one or two vehicles, to global competitors with thousands of physical assets. Whereas there are competitors with this multi-dimensional approach, there are few in the traditional LTL segment with as comprehensive an offering in those categories as those provided collectively by YRC Worldwide.
The competition specifically for YRC Logistics includes all of the same types of providers mentioned previously in addition to transportation management systems providers, domestic and international freight forwarders, freight brokers, warehouse management providers, and third-party logistics companies.
Even in tough economic conditions, YRC Worldwide expanded portions of its service offering in 2009 to respond to changes being made by significant supply chain managers in the retail segment. These changes create a window in which deliveries must be made to retailer distribution facilities. These changes generally best fit operationally in a 3-4 day network under normal operating conditions. YRC networks are uniquely situated to meet these changing market conditions. Some competitors offer “window” delivery services to meet these supply chain needs, but many must modify network operations to fit this change in the marketplace and face risk to operating efficiency as a result.
Regulation
National Transportation, Regional Transportation, Truckload and other interstate carriers were substantially deregulated following the enactment of the Motor Carrier Act of 1980, the Trucking Industry Regulatory Reform Act of 1994, the Federal Aviation Administration Authorization of 1994 and the ICC Termination Act of 1995. Prices and services are now largely free of regulatory controls, although the states retained the right to require compliance with safety and insurance requirements, and interstate motor carriers remain subject to regulatory controls that agencies within the U.S. Department of Transportation impose.
Our operating companies are subject to regulatory and legislative changes, which can affect our economics and those of our competitors. Various federal and state agencies regulate us, and our operations are also subject to various federal, foreign, state, provincial and local environmental laws and regulations dealing with transportation, storage, presence, use, disposal and handling of hazardous materials, discharge of storm-water and underground fuel storage tanks. We are also subject to regulations to combat terrorism that the U.S. Department of Homeland Security and other agencies impose. See risk factors related to our compliance with laws and regulations in Item 1A of this report.
Environmental Matters
Our operations are subject to U.S. federal, foreign, state, provincial and local regulations with regard to air and water quality and other environmental matters. We believe that we are in substantial compliance with these regulations. Regulation in this area continues to evolve and changes in standards of enforcement of existing regulations, as well as the enactment and enforcement of new legislation may require us and our customers to modify, supplement or replace equipment or facilities or to change or discontinue present methods of operation.
Our operating companies store fuel for use in our revenue equipment in approximately 300 underground storage tanks (“UST”) located throughout the U.S. Maintenance of such USTs is regulated at the federal and, in some cases, state level. The USTs are required to have leak detection systems and are required to be extracted upon our exiting the property. Traditionally upon sale of properties containing USTs, the UST is considered an asset in the transaction and as such, we contractually transfer this removal obligation to the buyer.
9
Table of Contents
During 2009, we spent approximately $10.9 million to comply with U.S. federal, state and local provisions regulating the discharge of materials into the environment or otherwise relating to the protection of the environment (collectively, “Environmental Regulations”). In 2010, we expect to spend approximately $9 million to comply with the Environmental Regulations. Based upon current information, we believe that our compliance with Environmental Regulations will not have a material adverse effect upon our capital expenditures, results of operation and competitive position because we have either made adequate reserves for such compliance expenditures or the cost for such compliance is expected to be small in comparison with our overall net worth.
We estimate that we will incur approximately $0.5 million in capital expenditures for environmental control equipment during 2010. We believe that capital expenditures for environmental control equipment for 2010 will not have a material adverse effect upon our financial condition because the aggregate amount of these expenditures is expected to be immaterial.
The Comprehensive Environmental Response, Compensation and Liability Act (known as the “Superfund Act”) imposes liability for the release of a “hazardous substance” into the environment. Superfund liability is imposed without regard to fault and even if the waste disposal was in compliance with then current laws and regulations. With the joint and several liabilities imposed under the Superfund Act, a potentially responsible party (“PRP”) may be required to pay more than its proportional share of such environmental remediation. Several of our subsidiaries have been identified as PRPs at various sites discussed below. The U.S. Environmental Protection Agency (the “EPA”) and appropriate state agencies are supervising investigative and cleanup activities at these sites. The EPA has identified the former Yellow Transportation (now a part of YRC) as a PRP for three locations: Angeles Chemical Co., Santa Fe Springs, CA; Alburn Incinerator, Inc., Chicago, IL; and IWI, Inc., Summit, IL. We estimate that the combined potential costs at these sites will not exceed $0.2 million. With respect to these sites, it appears that YRC delivered minimal amounts of waste to these sites, which is de minimis in relation to other respondents. The EPA has identified the former Roadway Express (now a part of YRC) as a PRP for eight locations: Operating Industries Site, Monterey Park, CA; BEMS Landfill, Mt. Holly, NJ; Double Eagle Site, Oklahoma City, OK; Jones Industrial, South Brunswick, NJ; Voda Petroleum, Clarksville City, TX; Ward Transformer, Raleigh, NC; Roosevelt Irrigation District, Phoenix, AZ and Berry’s Creek, Carlstadt, NJ. We estimate that combined potential costs at the first six sites will not exceed $1.0 million. The EPA has notified YRC and 140 other potential parties of their potential responsibility status at the Berry’s Creek site where YRC owns and operates a service center in the watershed area that discharges into Berry’s Creek. We estimate the Berry’s Creek potential cost to be $0.6 million. Roosevelt Irrigation District has notified YRC and other potential parties for their responsibility of remediation of contaminated groundwater wells. We estimate YRC’s potential for Roosevelt Irrigation District to be $0.55 million. The EPA has identified USF Red Star, a non-operating subsidiary, as a PRP at six locations: Champion Chemical, Marlboro, NJ; Booth Oil, N. Tonawanda, NJ; Quanta Resources, Syracuse, NY and three separate landfills in Byron, NJ, Moira, NY and Palmer, MA. We believe the potential combined costs at these sites to be $0.4 million. The EPA has identified Holland as a PRP for one location, Horton Sales Piedmont Site, Greenville County, SC. We believe the potential cost at this site to be immaterial.
While PRPs in Superfund actions have joint and several liabilities for all costs of remediation, it is not possible at this time to quantify our ultimate exposure because the projects are either in the investigative or early remediation stage. Based upon current information, we do not believe that probable or reasonably possible expenditures in connection with the sites described above are likely to have a material adverse effect on our financial condition or results of operations because:
| • | To the extent necessary, we have established adequate reserves to cover the estimate we presently believe will be our liability with respect to the matter; |
| • | We and our subsidiaries have only limited or de minimis involvement in the sites based upon a volumetric calculation; |
| • | Other PRPs involved in the sites have substantial assets and may reasonably be expected to pay their share of the cost of remediation; |
| • | We have adequate resources to cover the ultimate liability; and |
| • | We believe that our ultimate liability is relatively small compared with our overall net worth. |
We are subject to various other governmental proceedings and regulations, including foreign regulations, relating to environmental matters, but we do not believe that any of these matters are likely to have a material adverse effect on our financial condition or results of operation.
10
Table of Contents
This section, “Environmental Matters,” contains forward-looking statements within the meaning of Section 27A of the Securities Act of 1933, as amended, and Section 21E of the Securities Exchange Act of 1934, as amended. The words “believe”, “expect”, “will”, “estimate”, “may” and similar expressions are intended to identify forward-looking statements. Our expectations regarding our compliance with Environmental Regulations and our expenditures to comply with Environmental Regulations, including (without limitation) our capital expenditures on environmental control equipment, and the effect that liability from Environmental Regulation or Superfund sites may have on our financial condition or results of operations, are only our forecasts regarding these matters. These forecasts may be substantially different from actual results, which may be affected by the following factors: changes in Environmental Regulations; unexpected, adverse outcomes with respect to sites where we have been named as a PRP, including (without limitation) the sites described above; the discovery of new sites of which we are not aware and where additional expenditures may be required to comply with Environmental Regulations; an unexpected discharge of hazardous materials in the course of our business or operations; an acquisition of one or more new businesses; a catastrophic event causing discharges into the environment of hydrocarbons; the inability of other PRPs to pay their share of liability for a Superfund site; and a material change in the allocation to us of the volume of discharge and a resulting change in our liability as a PRP with respect to a site.
Economic Factors and Seasonality
Our business is subject to a number of general economic factors that may have a material adverse effect on the results of our operations, many of which are largely out of our control. These include recessionary economic cycles and downturns in customers’ business cycles, particularly in market segments and industries, such as retail and manufacturing, where we have a significant concentration of customers. Economic conditions may adversely affect our customers’ business levels, the amount of transportation services they need and their ability to pay for our services. We operate in a highly price-sensitive and competitive industry, making pricing, customer service, effective asset utilization and cost control major competitive factors. All of our revenues are subject to seasonal variations. Customers tend to reduce shipments just prior to and then after the winter holiday season, and operating expenses as a percent of revenue tend to be higher in the winter months primarily due to colder weather. Generally, the first quarter and the fourth quarters are the weakest while the second and third quarters are the strongest. The availability and cost of labor can significantly impact our cost structure and earnings.
Financial Information About Geographic Areas
Our revenue from foreign sources is largely derived from Canada, the United Kingdom, Asia, Latin America and Mexico. We have certain long-lived assets located in these areas as well. We discuss this information in the “Business Segments” note to our consolidated financial statements.
| Item 1A. | Risk Factors |
In addition to the risks and uncertainties contained elsewhere in this report or in our other SEC filings, the following risk factors should be considered carefully in evaluating us. These risks could have a material adverse effect on our business, financial condition and results of operations.
Our recurring losses from operations, negative operating cash flows and need to obtain cash flow from operations or adequate funding to fund our comprehensive recovery plan raise substantial doubt as to our ability to continue as a going concern.
In their report dated March 16, 2010, which is also included in this Form 10-K, our independent registered public accounting firm stated that our consolidated financial statements were prepared assuming we would continue as a going concern; however, our significant declines in operations, cash flows and liquidity raise substantial doubt about our ability to continue as a going concern. Our accompanying financial statements have been prepared assuming that we will continue as a going concern (which contemplates the realization of assets and discharge of liabilities in the normal course of business for the foreseeable future). These financial statements do not include any adjustments that might result from the outcome of this uncertainty. If we are unable to fund our operations through operating cash flows, existing credit facilities, sales of non-strategic assets and business lines and other capital market transactions, we would consider in court and out of court restructuring alternatives.
We face significant liquidity challenges in the near term which could adversely affect our financial condition.
In light of our recent operating results, we have satisfied our short term liquidity needs through a combination of borrowings under our credit facilities and, to a more significant degree, retained proceeds from asset sales and sale/leaseback financing transactions. In an effort to further manage liquidity, we have also instituted the deferral of pension plan payments and the payment of certain interest and fees. As our operating results improve, we expect that cash generated from operations will reduce our need to continue to rely upon these sources of liquidity to meet our short term funding requirements. The wage reduction and temporary pension contribution cessation has also improved our liquidity position; however, the temporary pension contribution cessation ends at the end of 2010. To continue to have sufficient liquidity to meet our cash flow requirements during 2010:
| • | our operating results must continue to stabilize or recover quarter-over-quarter and shipping volumes must continue to stabilize or recover quarter-over-quarter; |
11
Table of Contents
| • | we must continue to have access to our credit facilities; |
| • | we must continue to defer at least through 2010 payment of: |
| • | interest and fees to our lenders under the Credit Agreement |
| • | interest and facility fees to purchasers of our accounts receivable pursuant to the ABS Facility |
| • | interest and principal to our pension funds pursuant to the Contribution Deferral Agreement; |
| • | our wage reductions and temporary cessation of pension contributions must continue; |
| • | we must complete the sale/leaseback and real estate sale transactions currently under contract as anticipated; and |
| • | we must continue to implement and realize substantial cost savings measures to match our costs with business levels and to continue to become more efficient. |
Some or all of these factors may be beyond our control. We also cannot give assurance that we will continue to maintain covenant compliance under our financing facilities, Contribution Deferral Agreement and labor agreements, the failure of which would have a material adverse effect on our business, financial condition and operating results. See “Management’s Discussion and Analysis of Financial Condition and Results of Operations—Financial Condition—Liquidity” for additional information regarding our liquidity.
Our substantial leverage and debt service obligations could adversely affect our financial condition.
We have substantial debt and, as a result, significant debt service obligations. As of December 31, 2009, we had approximately $1.1 billion of secured indebtedness outstanding. We may not be able to generate cash sufficient to pay the principal of, interest on and other amounts due in respect of our indebtedness when due.
Our substantial level of debt, debt service obligations and restrictions under our financing facilities could have important effects on our financial condition. These effects may include:
| • | making it more difficult for us to satisfy our debt obligations; |
| • | limiting our ability to obtain additional financing on satisfactory terms to fund our working capital requirements, capital expenditures, acquisitions, investments, debt service requirements and other general corporate requirements; |
| • | increasing our vulnerability to general economic downturns, competition and industry conditions, which could place us at a competitive disadvantage compared to our competitors that are less leveraged; |
| • | reducing the availability of our cash flow to fund our working capital requirements, capital expenditures, acquisitions, investments and other general corporate requirements because we will be required to use a substantial portion of our cash flow to service debt obligations; and |
| • | limiting our flexibility in planning for, or reacting to, changes in our business and the industry in which we operate. |
Our ability to pay principal and interest on our debt obligations will depend upon our future operating performance and the availability of refinancing debt. If we are unable to service our debt and fund our business, we may be forced to reduce or delay capital expenditures, seek additional debt financing or equity capital, restructure or refinance our debt or sell assets.
We are subject to general economic factors that are largely out of our control, any of which could have a material adverse effect on our business, financial condition and results of operations.
Our business is subject to a number of general economic factors that may adversely affect our business, financial condition and results of operations, many of which are largely out of our control. These factors include recessionary economic cycles and downturns in customers’ business cycles and changes in their business practices, particularly in market segments and industries, such as retail and manufacturing, where we have a significant concentration of customers. Economic conditions may adversely affect our customers’ business levels, the amount of transportation services they need and their ability to pay for our services. Due to our high fixed-cost structure, in the short-term it is difficult for us to adjust expenses proportionally with fluctuations in volume levels. Customers encountering adverse economic conditions represent a greater potential for loss, and we may be required to increase our reserve for bad-debt losses.
12
Table of Contents
We are subject to business risks and increasing costs associated with the transportation industry that are largely out of our control, any of which could have a material adverse effect on our business, financial condition and results of operations.
We are subject to business risks and increasing costs associated with the transportation industry that are largely out of our control, any of which could adversely affect our business, financial condition and results of operations. The factors contributing to these risks and costs include weather, excess capacity in the transportation industry, interest rates, fuel prices and taxes, fuel surcharge collection, terrorist attacks, license and registration fees, insurance premiums and self-insurance levels, difficulty in recruiting and retaining qualified drivers, the risk of outbreak of epidemical illnesses, the risk of widespread disruption of our technology systems, and increasing equipment and operational costs. Our results of operations may also be affected by seasonal factors.
We operate in a highly competitive industry, and our business will suffer if we are unable to adequately address potential downward pricing pressures and other factors that could have a material adverse effect on our business, financial condition and results of operations.
Numerous competitive factors could adversely affect our business, financial condition and results of operations. These factors include the following:
| • | We compete with many other transportation service providers of varying sizes, some of which have a lower cost structure, more equipment and greater capital resources than we do or have other competitive advantages. |
| • | Some of our competitors periodically reduce their prices to gain business, especially during times of reduced growth rates in the economy, which limits our ability to maintain or increase prices or maintain or grow our business. |
| • | Our customers may negotiate rates or contracts that minimize or eliminate our ability to offset fuel price increases through a fuel surcharge on our customers. |
| • | Many customers reduce the number of carriers they use by selecting so-called “core carriers” as approved transportation service providers, and in some instances, we may not be selected. |
| • | Many customers periodically accept bids from multiple carriers for their shipping needs, and this process may depress prices or result in the loss of some business to competitors. |
| • | The trend towards consolidation in the ground transportation industry may create other large carriers with greater financial resources and other competitive advantages relating to their size. |
| • | Advances in technology require increased investments to remain competitive, and our customers may not be willing to accept higher prices to cover the cost of these investments. |
| • | Competition from non-asset-based logistics and freight brokerage companies may adversely affect our customer relationships and prices. |
If our relationship with our employees were to deteriorate, we may be faced with labor disruptions or stoppages, which could have a material adverse effect on our business, financial condition and results of operations and place us at a disadvantage relative to non-union competitors.
Virtually all of our operating subsidiaries have employees who are represented by the International Brotherhood of Teamsters (the “IBT”). These employees represent approximately 70% of our workforce.
Each of our YRC, New Penn and Holland business units employ most of their unionized employees under the terms of a common national master freight agreement with the IBT, as supplemented by additional regional supplements and local agreements. The IBT members ratified a five-year agreement that took effect on April 1, 2008, and will expire on March 31, 2013, as modified by the Amended and Restated Memorandum of Understanding on the Job Security Plan, dated July 9, 2009. The IBT also represents a number of employees at Reddaway, Glen Moore, Reimer and YRC Logistics under more localized agreements, which have wages, benefit contributions and other terms and conditions that better fit the cost structure and operating models of these business units.
Certain of our subsidiaries are regularly subject to grievances, arbitration proceedings and other claims concerning alleged past and current non-compliance with applicable labor law and collective bargaining agreements.
13
Table of Contents
Neither we nor any of our subsidiaries can predict the outcome of any of the matters discussed above. These matters, if resolved in a manner unfavorable to us, could have a material adverse effect on our business, financial condition and results of operations.
Our pension expense and funding obligations are expected to increase significantly as a result of the weak performance of financial markets and its effect on plan assets.
Our future funding obligations for our U.S. defined benefit pension plans qualified with the Internal Revenue Service depend upon the future performance of assets set aside in trusts for these plans, the level of interest rates used to determine funding levels, the level of benefits provided for by the plans, actuarial data in healthcare inflation trend rates, and experience and any changes in government laws and regulations.
If the market values of the securities held by the multi-employer plans that provide our IBT represented employees with pension benefits continue to decline, our pension expenses would further increase upon the expiration of our collective bargaining agreements and, as a result, could materially adversely affect our business. Decreases in interest rates that are not offset by contributions and asset returns could also increase our obligations under such plans.
Ongoing self-insurance and claims expenses could have a material adverse effect on our business, financial condition and results of operations.
Our future insurance and claims expenses might exceed historical levels. We currently self-insure for a majority of our claims exposure resulting from cargo loss, personal injury, property damage and workers’ compensation. If the number or severity of claims for which we are self-insured increases, our business, financial condition and results of operations could be adversely affected, and we may have to post additional letters of credit to state workers’ compensation authorities or insurers to support our insurance policies. If we lose our ability to self insure, our insurance costs could materially increase, and we may find it difficult to obtain adequate levels of insurance coverage.
We have significant ongoing capital requirements that could have a material adverse effect on our business, financial condition and results of operations if we are unable to generate sufficient cash from operations.
Our business is capital intensive. If we are unable to generate sufficient cash from operations to fund our capital requirements, we may have to limit our growth, utilize our existing capital, or enter into additional financing arrangements, including leasing arrangements, or operate our revenue equipment (including tractors and trailers) for longer periods resulting in increased maintenance costs, any of which could reduce our income. Although we expect reduced capital expenditures due to the integration of Yellow Transportation and Roadway, if our cash from operations and existing financing arrangements are not sufficient to fund our capital requirements, we may not be able to obtain additional financing at all or on terms acceptable to us.
We operate in an industry subject to extensive government regulations, and costs of compliance with, or liability for violation of, existing or future regulations could significantly increase our costs of doing business.
The U.S. Departments of Transportation and Homeland Security and various federal, state, local and foreign agencies exercise broad powers over our business, generally governing such activities as authorization to engage in motor carrier operations, safety and permits to conduct transportation business. We may also become subject to new or more restrictive regulations that the Departments of Transportation and Homeland Security, the Occupational Safety and Health Administration, the Environmental Protection Agency or other authorities impose, including regulations relating to engine exhaust emissions, the hours of service that our drivers may provide in any one time period, security and other matters. Compliance with these regulations could substantially impair equipment productivity and increase our costs.
We are subject to various environmental laws and regulations, and costs of compliance with, or liabilities for violations of, existing or future laws and regulations could significantly increase our costs of doing business.
Our operations are subject to environmental laws and regulations dealing with, among other things, the handling of hazardous materials, underground fuel storage tanks and discharge and retention of storm water. We operate in industrial areas, where truck terminals and other industrial activities are located, and where groundwater or other forms of environmental contamination may have occurred. Our operations involve the risks of fuel spillage or seepage, environmental damage and hazardous waste disposal, among others. If we are involved in a spill or other accident involving hazardous substances, or if we are found to be in violation of applicable environmental laws or regulations, it could significantly increase our cost of doing business. Under specific environmental laws and regulations, we could be held responsible for all of the costs relating to any contamination at our past or present terminals and at third-party waste disposal sites. If we fail to comply with applicable environmental laws and regulations, we could be subject to substantial fines or penalties and to civil and criminal liability.
14
Table of Contents
In addition, as global warming issues become more prevalent, federal and local governments and our customers are beginning to respond to these issues. This increased focus on sustainability may result in new regulations and customer requirements that could negatively affect us. This could cause us to incur additional direct costs or to make changes to our operations in order to comply with any new regulations and customer requirements, as well as increased indirect costs or loss of revenue resulting from, among other things, our customers incurring additional compliance costs that affect our costs and revenues. We could also lose revenue if our customers divert business from us because we haven’t complied with their sustainability requirements. These costs, changes and loss of revenue could have a material adverse affect on our business, financial condition and results of operations.
Our management team is an important part of our business and loss of key personnel could impair our success.
We benefit from the leadership and experience of our senior management team and depend on their continued services to successfully implement our business strategy. We have an employment agreement with William D. Zollars, our chief executive officer, and we also have agreements with other members of our management team that have provisions that encourage their continued employment with us. The loss of key personnel could have a material adverse effect on our business, financial condition and results of operations.
Our business may be harmed by anti-terrorism measures.
In the aftermath of the terrorist attacks on the United States, federal, state and municipal authorities have implemented and are implementing various security measures, including checkpoints and travel restrictions on large trucks. Although many companies will be adversely affected by any slowdown in the availability of freight transportation, the negative impact could affect our business disproportionately. For example, we offer specialized services that guarantee on-time delivery. If the security measures disrupt or impede the timing of our deliveries, we may fail to meet the needs of our customers, or may incur increased expenses to do so. We cannot assure you that these measures will not significantly increase our costs and reduce our operating margins and income.
The outcome of legal proceedings and IRS audits to which the Company and its subsidiaries are a party could have a material adverse effect on our businesses, financial condition and results of operations.
The Company and its subsidiaries are a party to various legal proceedings, including claims related to personal injury, property damage, cargo loss, workers’ compensation, employment discrimination, breach of contract, multi-employer pension plan withdrawal liability and antitrust violations. See the “Commitments, Contingencies and Uncertainties” note to our consolidated financial statements. The IRS may issue adverse tax determinations in connection with its audit of our prior year tax returns or the returns of a consolidated group that we acquired in 2005. See the “Income Taxes” note to our consolidated financial statements. We may incur significant expenses defending these legal proceedings and IRS audits. In addition, we may be required to pay significant awards, settlements or taxes in connection with these proceedings and audits, which could have a material adverse effect on our businesses, financial condition and results of operations.
We may not obtain the projected benefits and cost savings from operational changes and performance improvement initiatives.
In response to our business environment, we initiated operational changes and process improvements to reduce costs and improve financial performance. The changes and initiatives included integrating our Yellow Transportation and Roadway networks, reorganizing our management, reducing corporate overhead, closing redundant offices and eliminating unnecessary activities. There is no assurance that these changes and improvements will be successful or that we will not have to initiate additional changes and improvements in order to achieve the projected benefits and cost savings.
If we are unable to meet the continued listing requirements of NASDAQ, our common stock currently listed on the NASDAQ may be delisted which would have an adverse effect on the market liquidity for our common stock.
The NASDAQ’s continued listing requirements provide, among other requirements, that the minimum bid price of our common stock not fall below $1.00 per share for 30 consecutive business days. On March 3, 2010, we received from the NASDAQ a notice of non-compliance with the minimum bid price requirement and we have a grace period of 180 calendar days, or until August 30, 2010, to regain compliance with this requirement. In order to regain compliance, the closing price of our common stock must be $1.00 or greater for a minimum of 10 consecutive business days during the 180-day grace period. On February 17, 2010, we received shareholder approval of an amendment to our certificate of incorporation that permits our board of directors to effect a reverse stock split within a range from 5:1 to 25:1. We are restricted by the terms of our new 6% convertible senior notes from effecting the reverse stock split prior to April 24, 2010. There can be no assurance that our common stock will not be subject to delisting.
Delisting of our common stock would have an adverse effect on the market liquidity of our common stock and, as a result, the market price for our common stock could become more volatile. Further, delisting also could make it more difficult for us to raise additional capital.
15
Table of Contents
| Item 1B. | Unresolved Staff Comments |
Not applicable.
| Item 2. | Properties |
At December 31, 2009, we operated a total of 511 transportation service centers located in 50 states, Puerto Rico, Canada and Mexico. Of this total, 224 were owned and 287 were leased, generally with lease terms of ten years with renewal options. The number of vehicle back-in doors totaled 25,983, of which 15,030 were at owned facilities and 10,953 were at leased facilities. The transportation service centers vary in size ranging from one to three doors at small local facilities, to over 426 doors at the largest consolidation and distribution facility. In addition, we and our subsidiaries own and occupy general office buildings in Akron, Ohio; Lebanon, Pennsylvania; Carlisle, Pennsylvania; and Holland, Michigan. We also lease and occupy general office buildings in Overland Park, Kansas, Clackamas, Oregon and Winnipeg, Manitoba. Our owned transportation service centers and office buildings serve as collateral under our Credit Agreement.
Our facilities and equipment are adequate to meet current business requirements in 2010. Refer to “Item 7, Management’s Discussion and Analysis of Financial Condition and Results of Operations”, for a more detailed discussion of expectations regarding capital spending in 2010.
| Item 3. | Legal Proceedings |
We discuss legal proceedings in the “Commitments, Contingencies, and Uncertainties” note to our consolidated financial statements.
| Item 4. | Reserved |
16
Table of Contents
PART II
| Item 5. | Market for Registrant’s Common Equity, Related Stockholder Matters and Issuer Purchases of Equity Securities. |
As of February 28, 2010, approximately 16,100 shareholders of record held YRC Worldwide common stock. Prior to December 31, 2009, our only class of stock outstanding was common stock, traded on the NASDAQ Stock Market. Trading activity averaged 6,420,000 shares per day during 2009, up from 2,410,000 per day in 2008. The NASDAQ Stock Market quotes prices for our common stock under the symbol “YRCW.” On December 31, 2009 we issued 4,345,514 shares of Class A preferred stock as part of a debt-for-equity exchange. As of February 28, 2010, 150,569 shares of Class A preferred stock remain outstanding, with the balance having been converted into 924,062,483 common shares. The Class A preferred stock is not listed on any exchange. The high and low prices at which YRC Worldwide common stock traded for each calendar quarter in 2009 and 2008 are shown below.
Quarterly Financial Information (unaudited)
| (in thousands, except per share data) |
First Quarter |
Second Quarter |
Third Quarter |
Fourth Quarter |
||||||||||||
| 2009 (a) |
||||||||||||||||
| Operating revenue |
$ | 1,502,795 | $ | 1,328,080 | $ | 1,306,338 | $ | 1,145,565 | ||||||||
| Losses (gains) on property disposals, net |
1,593 | (1,006 | ) | (11,142 | ) | 4,631 | ||||||||||
| Operating income (loss) |
(379,247 | ) | (299,706 | ) | (117,953 | ) | (87,045 | ) | ||||||||
| Net income (loss) |
(273,782 | ) | (309,037 | ) | (158,736 | ) | 119,536 | |||||||||
| Diluted earnings (loss) per share |
(4.61 | ) | (5.20 | ) | (2.67 | ) | 1.64 | |||||||||
| Common stock: |
||||||||||||||||
| High |
5.45 | 5.94 | 6.18 | 4.83 | ||||||||||||
| Low |
1.48 | 1.52 | 0.89 | 0.80 | ||||||||||||
| 2008 (b) |
||||||||||||||||
| Operating revenue |
$ | 2,232,592 | $ | 2,398,728 | $ | 2,380,258 | $ | 1,928,823 | ||||||||
| Losses (gains) on property disposals, net |
3,486 | 3,053 | (15,466 | ) | (10,156 | ) | ||||||||||
| Operating income (loss) |
(53,443 | ) | 71,254 | (756,621 | ) | (335,316 | ) | |||||||||
| Net income (loss) |
(46,370 | ) | 35,779 | (720,877 | ) | (244,905 | ) | |||||||||
| Diluted earnings (loss) per share |
(0.82 | ) | 0.62 | (12.58 | ) | (4.15 | ) | |||||||||
| Common stock: |
||||||||||||||||
| High |
19.80 | 20.95 | 22.52 | 11.87 | ||||||||||||
| Low |
10.99 | 11.90 | 11.52 | 1.20 | ||||||||||||
| (a) | The second quarter of 2009 includes a $30.4 million equity investment impairment. The fourth quarter of 2009 includes a $193.9 million gain on debt redemption related to our debt-for-equity exchange completed in December 2009 and a $9.1 million entry to correct restructuring expense previously recognized in the second and third quarters of 2009. |
| (b) | The second and third quarters of 2008 include curtailment gains of $34.1 million and $63.3 million, respectively, related to the curtailment of postretirement healthcare and pension benefits, respectively. The third and fourth quarters of 2008 include impairment charges of $823.1 million and $200.3 million, respectively. |
On March 3, 2010, the Company received a letter from the NASDAQ Stock Market that the Company’s common stock per share closing price was less than $1.00 for 30 consecutive trading days. To remain listed on the NASDAQ Stock Market, the Company’s common stock must close above a per share price of $1.00 for at least 10 consecutive trading days during a 180-day grace period ending August 30, 2010. Utilizing the shareholder approval of the reverse stock split described in “Liquidity – Exchange Offers”, the Company expects to effect a reverse stock split to attempt compliance with the NASDAQ minimum bid price rule within the 180-day grace period that the NASDAQ Stock Market permits. However, pursuant to the Note Purchase Agreement (defined below); the Company has agreed not to implement the reverse stock split prior to April 24, 2010.
Purchases of Equity Securities by the Issuer
In April 2006, our Board of Directors approved a stock repurchase program that authorized the Company to repurchase up to $100 million of its common stock. During 2007, the Company purchased 1.1 million shares under this program at a weighted-average cost of $31.13 per share for a total cost of $35.0 million. At December 31, 2009, $45 million remains available under the authorized program. Our current Credit Agreement does not permit us to purchase additional shares under this program.
17
Table of Contents
Dividends
We did not declare any cash dividends on our common stock in 2009, 2008 or 2007. Our current Credit Agreement does not permit us to declare any dividends on any of our outstanding capital stock.
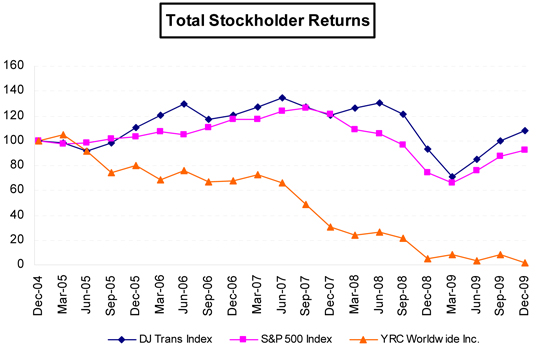
Common Stock Performance
Set forth below is a line graph comparing the quarterly percentage change in the cumulative total stockholder return of the Company’s common stock against the cumulative total return of the S&P Composite-500 Stock Index and the Dow Jones Transportation Average Stock Index for the period of five years commencing December 31, 2004 and ending December 31, 2009.
18
Table of Contents
| Item 6. | Selected Financial Data |
In their report dated March 16, 2010, which is also included in this Form 10-K, our independent registered public accounting firm stated that our consolidated financial statements were prepared assuming we would continue as a going concern; however, our significant declines in operations, cash flows and liquidity raise substantial doubt about our ability to continue as a going concern. The following Selected Financial Data taken from our accompanying financial statements have been prepared assuming that we will continue as a going concern (which contemplates the realization of assets and discharge of liabilities in the normal course of business for the foreseeable future). These financial statements do not include any adjustments that might result from the outcome of this uncertainty.
| (in thousands except per share data) |
2009 | 2008 | 2007 | 2006 | 2005(a) | |||||||||||||||
| For the Year |
||||||||||||||||||||
| Operating revenue |
$ | 5,282,778 | $ | 8,940,401 | $ | 9,621,316 | $ | 9,918,690 | $ | 8,741,557 | ||||||||||
| Depreciation and amortization expense (b) |
255,212 | 264,291 | 255,603 | 274,184 | 250,562 | |||||||||||||||
| Gains on property disposals, net |
(5,924 | ) | (19,083 | ) | (5,820 | ) | (8,360 | ) | (5,388 | ) | ||||||||||
| Impairment charges |
— | 1,023,376 | 781,875 | — | — | |||||||||||||||
| Total operating expenses |
6,166,729 | 10,014,527 | 10,186,442 | 9,373,256 | 8,205,247 | |||||||||||||||
| Operating income (loss) |
(883,951 | ) | (1,074,126 | ) | (565,126 | ) | 545,434 | 536,310 | ||||||||||||
| Interest expense (e) |
161,923 | 80,999 | 91,852 | 90,852 | 66,463 | |||||||||||||||
| Other nonoperating expenses |
8,329 | (6,171 | ) | (2,169 | ) | 1,718 | 676 | |||||||||||||
| Equity investment impairment |
30,374 | — | — | — | — | |||||||||||||||
| Gain on debt redemption |
(193,872 | ) | (2,400 | ) | — | — | — | |||||||||||||
| Income tax provision (benefit) |
(268,686 | ) | (170,181 | ) | (14,447 | ) | 178,213 | 183,022 | ||||||||||||
| Net income (loss) (e) |
(622,019 | ) | (976,373 | ) | (640,362 | ) | 274,651 | 286,149 | ||||||||||||
| Net capital (proceeds) expenditures |
(95,769 | ) | 34,686 | 338,424 | 303,057 | 256,435 | ||||||||||||||
| Net cash (used in) provided by operating activities |
(378,297 | ) | 219,820 | 392,598 | 532,304 | 497,677 | ||||||||||||||
| At Year-End |
||||||||||||||||||||
| Net property and equipment |
1,839,478 | 2,200,977 | 2,380,473 | 2,269,846 | 2,205,792 | |||||||||||||||
| Total assets |
3,032,074 | 3,966,113 | 5,062,623 | 5,851,759 | 5,734,189 | |||||||||||||||
| Long-term debt, less current portion (e) |
935,782 | 787,415 | 807,940 | 1,041,296 | 1,092,793 | |||||||||||||||
| ABS facility |
146,285 | 147,000 | 180,000 | 225,000 | 374,970 | |||||||||||||||
| Total debt (e) |
1,132,909 | 1,349,736 | 1,219,895 | 1,266,296 | 1,467,763 | |||||||||||||||
| Total shareholders’ equity (c) |
167,190 | 481,451 | 1,621,342 | 2,203,567 | 1,949,487 | |||||||||||||||
| Measurements |
||||||||||||||||||||
| Basic per share data: |
||||||||||||||||||||
| Net income (loss) (e) |
(10.44 | ) | (16.96 | ) | (11.20 | ) | 4.79 | 5.26 | ||||||||||||
| Average common shares outstanding – basic |
59,582 | 57,583 | 57,154 | 57,361 | 54,358 | |||||||||||||||
| Diluted per share data: |
||||||||||||||||||||
| Net income (loss) (e) |
(10.44 | ) | (16.96 | ) | (11.20 | ) | 4.71 | 5.03 | ||||||||||||
| Average common shares outstanding – diluted |
59,582 | 57,583 | 57,154 | 58,339 | 56,905 | |||||||||||||||
| Debt to capitalization |
87.1 | % | 73.7 | % | 42.9 | % | 36.5 | % | 43.0 | % | ||||||||||
| Shareholders’ equity per share |
1.74 | 8.11 | 28.59 | 38.53 | 34.03 | |||||||||||||||
| Common stock price range: |
||||||||||||||||||||
| High |
6.18 | 22.52 | 47.09 | 51.54 | 63.40 | |||||||||||||||
| Low |
0.80 | 1.20 | 15.87 | 35.27 | 39.25 | |||||||||||||||
| Other Data |
||||||||||||||||||||
| Number of employees |
36,000 | 55,000 | 63,000 | 66,000 | 68,000 | |||||||||||||||
| Operating ratio: (d) |
||||||||||||||||||||
| National Transportation |
121.3 | % | 111.9 | % | 97.6 | % | 93.8 | % | 93.1 | % | ||||||||||
| Regional Transportation |
109.6 | % | 107.5 | % | 130.7 | % | 94.3 | % | 94.5 | % | ||||||||||
| YRC Logistics |
101.1 | % | 124.1 | % | 99.2 | % | 97.8 | % | 96.6 | % | ||||||||||
| Truckload |
107.7 | % | 109.7 | % | 105.2 | % | 93.6 | % | 94.8 | % | ||||||||||
| (a) | Includes the results of all YRC Worldwide entities including USF entities from the date of acquisition, May 24, 2005. |
| (b) | Depreciation lives and salvage values were revised effective July 1, 2006. |
| (c) | SFAS No. 158 (now included in FASB ASC Topic 715) “Employees; Accounting for Defined Benefit Pension and Other Postretirement Plans,” was adopted effective December 31, 2006. |
| (d) | Represents total operating expenses divided by operating revenue. |
| (e) | FASB Staff Position ABP 14-1, “Accounting for Convertible Debt Instruments that may be Settled in Cash upon Conversion (Including Partial Cash Settlement)” (now included in FASB ASC Topic 470) relative to accounting for convertible debt instruments was adopted on January 1, 2009, with retrospective application for all periods presented. |
19
Table of Contents
| Item 7. | Management’s Discussion and Analysis of Financial Condition and Results of Operations |
“Management’s Discussion and Analysis of Financial Condition and Results of Operations” contains forward-looking statements within the meaning of Section 27A of the Securities Act of 1933, as amended, and Section 21E of the Securities Exchange Act of 1934, as amended. See the introductory section immediately prior to “Part I” and risk factors in “Item 1A” of this report regarding these statements.
Overview
YRC Worldwide Inc., one of the largest transportation service providers in the world, is a holding company that through wholly owned operating subsidiaries offers its customers a wide range of transportation services. These operating subsidiaries are primarily represented by National Transportation, a reporting unit that includes YRC, formed through the merger of Yellow Transportation and Roadway (YRC is a leading transportation service provider offering a full range of regional, national and international services); Regional Transportation, a reporting unit for our transportation service providers focused on business opportunities in the regional and next-day delivery markets; YRC Logistics, a global logistics management company that plans and coordinates the movement of goods worldwide to provide customers a single source for logistics management solutions; and Truckload, which reflects the results of Glen Moore, a provider of truckload services throughout the U.S. These companies represent our reporting segments and are more fully described in “Item 1 – Business”.
The following management’s discussion and analysis explains the main factors impacting our results of operations, liquidity and capital expenditures and the critical accounting policies of YRC Worldwide. This information should be read in conjunction with the accompanying financial statements and notes thereto, as well as our detailed discussion of risk factors included in Item 1A.
Our Operating Environment
We operate in a highly competitive environment, yet one where we believe the right value proposition for our customers permits us to recover our cost of capital over the business cycle. The recent economic recession in the U.S. as well as global financial concerns has impacted the competitiveness of our industry and created unique challenges for both our company and our customers. Over the last several years, significant changes have occurred in our operating environment, including: consolidation and liquidation of LTL carriers; the increased presence of large global, service providers; and increasing needs and demands of our customers. We continue to proactively address these changes through our strategy of being a global transportation services provider. Since 2004, our focus has been twofold – capitalizing on the synergies presented from several acquisitions, both asset and non-asset based, and expanding globally to firmly position ourselves as a true end-to-end service provider. The synergy efforts addressed following the Roadway and USF acquisitions were initially internally focused and included combining routine, non-customer facing processes. In 2008, we initiated the integration of the Yellow Transportation and Roadway networks. This integration, completed in March 2009, has resulted in a larger overall network, branded YRC, yet eliminated several redundancies in the former two processes.
We will continue to face challenges in the environment which we operate, primarily due to the changing competitive landscape, meeting our stakeholders’ demands and reduced demand for transportation services as the economy experiences a sluggish recovery out of the recent recession. We expect competitive LTL pricing trends to continue during the upcoming year but at a more rational level than in 2009. Specific economic areas that impact our ability to generate profits and cash flows include the levels of consumer spending, manufacturing and overall economic activity. We monitor these areas primarily through several common economic indices, including the gross domestic product (“GDP”) and the industrial production index (“IPI”). Real GDP measures the value of goods and services produced in the U.S., excluding inflation, and the IPI measures the physical units and inputs into the U.S. production process. Over time the IPI has been a relatively good indicator for general levels of freight volume available in our markets. We manage the impact of our customers’ spending, manufacturing and economic activity through, among others, pricing discipline, cost management programs, liquidity management, investment in technology and continuous improvement programs. In 2008 and 2007, market conditions were especially weak and contributed to resulting impairment charges of the value of goodwill and certain tradenames totaling $1,023.4 million and $781.9 million, respectively. The depressed market continued in 2009 and, coupled with customer concerns over our financial stability, led to a significant reduction in the number of shipments we transported. As a result we instituted significant cost reduction programs. We believe that we will continue to face competition stemming from excess capacity in the market in the near term.
Investments and Dispositions
In August 2008, we completed the purchase of a 65% equity interest in Shanghai Jiayu Logistics Co., Ltd. (“Jiayu”), a Shanghai, China ground transportation company with a purchase price of $59.4 million including transaction costs. We account for our ownership in Jiayu using the equity method of accounting and record our portion of the financial results of Jiayu one month in arrears. In 2009, we recognized an impairment on this equity method investment of $30.4 million. This investment is a part of our YRC Logistics segment and is included in “Other assets” in the accompanying consolidated balance sheets.
20
Table of Contents
In November 2009, we sold the dedicated contract carriage business line to Greatwide Dedicated Transport, LLC for $34 million. This business line was part of our YRC Logistics segment.
Results of Operations
This section focuses on the highlights and significant items that impacted our operating results over the last three years. We will discuss the areas that caused material fluctuations and required specific evaluation by management.
Consolidated Results
Our consolidated results include the results of each of the operating segments discussed below and corporate charges for the periods presented. A more detailed discussion of the operating results of our segments is presented below.
The following table summarizes the statements of consolidated operations for the three years ended December 31:
| Percent Change | ||||||||||||||||||
| (in millions) |
2009 | 2008 | 2007 | 2009 vs. 2008 | 2008 vs. 2007 | |||||||||||||
| Operating revenue |
$ | 5,282.8 | $ | 8,940.4 | $ | 9,621.3 | (40.9 | %) | (7.1 | %) | ||||||||
| Impairment charges |
— | 1,023.4 | 781.9 | 100 | % | 30.9 | % | |||||||||||
| Operating income (loss) |
(884.0 | ) | (1,074.1 | ) | (565.1 | ) | 17.7 | % | (90.1 | %) | ||||||||
| Nonoperating expenses, net |
6.7 | 72.4 | 89.7 | (90.7 | %) | (19.3 | %) | |||||||||||
| Net income (loss) |
$ | (622.0 | ) | $ | (976.4 | ) | $ | (640.4 | ) | 36.3 | % | (52.5 | %) | |||||
2009 compared to 2008
Consolidated operating revenue decreased by 40.9% during the year ended December 31, 2009 as compared to the same period in 2008, which is reflective of decreased revenue at all of our operating companies. The decreased operating revenue is a result of lower volumes and yield across the operating companies as well as decreased fuel surcharge revenue. Our volumes were impacted by multiple factors, most notably lower demand for transportation services driven by a weak economy and business diversion due to customer concerns surrounding the integration of the former Yellow Transportation and Roadway networks and our financial stability. The declines in yield are a factor of excess capacity in the transportation sector resulting in increased competition for lower freight volumes in light of lower demand for transportation services.
Consolidated operating revenue includes fuel surcharge revenue. Fuel surcharges are common throughout our industry and represent an amount that we charge to customers that adjusts with changing fuel prices. We base our fuel surcharges on a published national index and adjust them weekly. Rapid material changes in the index or our cost of fuel can positively or negatively impact our revenue and operating income versus prior periods as there is a lag in the Company’s adjustment of base rates in response to changes in fuel surcharge. Fuel surcharge is an accepted and important component of the overall pricing of our services to our customers. Without an industry accepted fuel surcharge program, our base pricing for our transportation services would require changes. We believe the distinction between base rates and fuel surcharge has blurred over time, and it is impractical to clearly separate all the different factors that influence the price that our customers are willing to pay. In general, under our present fuel surcharge program, we believe rising fuel costs are beneficial to us, and falling fuel costs are detrimental to us, in the short term.
Absent the impairment charges taken in 2008, consolidated operating loss increased significantly during the year ended December 31, 2009 versus the comparable amount for the same period in 2008. Significant volume declines within our National Transportation and Regional Transportation segments and material customer losses within our YRC Logistics segment resulted in an operating loss of $884.0 million for the year ended December 31, 2009, a significantly larger operating loss from the prior year comparable period. Operating expenses for the year ended December 31, 2009 were down $2,824.4 million or 31.4% as compared to the same period in 2008 and were comprised of a $1,558.8 million decrease in salaries, wages and benefits, a $754.9 million decrease in operating expenses and supplies, a $428.6 million decrease in purchased transportation, which is attributable to declining volumes and improved carrier pricing due to the depressed economy, a $86.3 million decrease in other operating expenses and a $9.1 million decrease in depreciation . These expense reductions however did not keep pace with the significant revenue decline, resulting in the increased operating loss for the year ended December 31, 2009.
21
Table of Contents
Consolidated operating results for the year ended December 31, 2008, include non-cash impairment charges of $1,023.4 million representing write offs of goodwill associated with our National Transportation and YRC Logistics segments, a write off of our Roadway tradename due to the introduction of YRC as our new brand, a write off of the USF brand (a part of the Regional Transportation segment) as we will no longer support this brand, and a reduction in the tradename value attributed to YRC Reimer (a part of the National Transportation segment). There were no similar impairment charges during the year ended December 31, 2009.
The decrease in salaries, wages and benefits in the year ended December 31, 2009 as compared to the same period in 2008, is largely due to a 10% wage reduction for most union (increased to 15% effective August 2009) and non-union employees offset by increased workers’ compensation expense of $61.0 million due to unfavorable development of current year and prior year claims. Additionally, the decrease in salaries and benefits including pension expense is a result of lower headcount in the current year due to lower volumes partially offset by increased severance benefits of $30.6 million. Pension expense in 2009 is also reduced compared to 2008 as a result of the cessation of contributions in the second half of 2009 as approved by the participating Teamster bargaining units. The decrease in operating expenses and supplies is a result of lower fuel costs of 60.9%, due to lower diesel prices and reduced miles driven, lower vehicle maintenance expense of 31.4% partially offset by an increase in bad debt expense of $11.6 million or 30.2%, an increase in professional services of $42.2 million or 38.8% and costs associated with lease terminations of $19.6 million resulting from integration activities. Finally, the decrease in other operating expenses is due to a number of factors including a decrease in discretionary spend for travel and employee activities.
During the year ended December 31, 2009, we recognized net gains on the sale of property and equipment partially offset by the fair value adjustments for property and equipment held for sale of $5.9 million compared to net gains of $19.1 million for the same period in 2008.
Nonoperating expenses consisted primarily of interest expense that increased significantly for the year ended December 31, 2009 versus the comparable period in 2008. Increased borrowing costs throughout 2009 resulted in increased interest expense of $80.9 million versus the comparable period in 2008. Interest expense in the year ended December 31, 2009, attributable to items that were not present in 2008, included expense related to lease financing obligations of $23.5 million and deferred pension obligations of $4.8 million. Amortization of deferred debt costs increased $24.8 million during the year ended December 31, 2009 compared to the same period in 2008. Offsetting these 2009 increases was the reduction in interest expense of $16.1 million related to notes redeemed in November 2008. Additionally, nonoperating expenses during the year ended December 31, 2009 included a $193.9 million gain on the debt-for-equity exchange completed in December 2009 and discussed in the “Liquidity” section of this report. Finally, nonoperating expenses during the year ended December 31, 2009 also included an impairment charge of $30.4 million related to our investment in Jiayu. This adjustment was required as the estimated current fair value, using a discounted cash flow model, was less than our investment. This was primarily the result of different assumptions with respect to revenue growth rates from the initial valuation to those assumed in the current economic environment.
Our effective tax rate for the year ended December 31, 2009 was 30.2% compared to 14.8% for the same period in 2008. Significant items impacting the 2009 rate include a state tax benefit, gain on debt redemption, certain permanent items and a valuation allowance established for certain deferred tax assets. We recognize valuation allowances on deferred tax assets if, based on the weight of the evidence, we believe that some or all of our deferred tax assets will not be realized. Changes in valuation allowances are included in our tax provision in the period of change. In determining whether a valuation allowance is warranted, we evaluate factors such as prior years’ earnings history, expected future earnings, loss carry-back and carry-forward periods, reversals of existing deferred tax liabilities and tax planning strategies that potentially enhance the likelihood of the realization of a deferred tax asset.
2008 compared to 2007
Consolidated operating revenue decreased by $680.9 million during the year ended December 31, 2008, as compared to the same period in 2007, which was reflective of decreased revenue at all of our operating companies with the exception of our Truckload segment whose revenue was slightly greater than the same period in 2007. Overall, volumes and to a lesser extent yield were lower in 2008 versus 2007 offset by increased fuel surcharge revenue. The U.S. economic recession and its impact on the tangible goods and other sectors directly impacted our ability to grow and maintain operating revenue. The recession limited our ability somewhat to correctly discern the exact reason for revenue declines; however, we believed certain customers diverted volumes from our network in response to concerns regarding our financial stability. Also contributing to the revenue decline was the closure of 27 service centers in the Regional Transportation network in February 2008.
As discussed, we believe as it relates to fuel surcharge programs that rising fuel costs are beneficial to us, and falling fuel costs are detrimental to us, in the short term. However, as fuel prices reached record highs during the first half of 2008, we experienced a higher percentage of customers whose increased fuel surcharge revenue did not cover our increased fuel costs. As fuel prices began to retreat in the second half of 2008, a more typical relation returned between fuel cost and fuel surcharge revenue.
22
Table of Contents
Consolidated operating results for the year ended December 31, 2008 included the impairment charge of $1,023.4 million previously disclosed. In the year ended December 31, 2007, we recorded impairment charges of $781.9 million which represented a write off of goodwill associated with our Regional Transportation segment as well as reductions in the tradename values attributed to USF (a part of the Regional Transportation segment) and Roadway (a part of the National Transportation segment.) Absent these impairment charges, consolidated operating income decreased by $267.5 million during the year ended December 31, 2008, as compared to the same period in 2007. The decline in consolidated operating income in 2008 was attributable to erosion in volume and base pricing and higher contractual labor rates in our National Transportation and our Regional Transportation segments as well as a challenging economy and tough competitive environment. Regional Transportation was challenged by the difficult economic conditions, especially in the industrial sector in the Upper Midwest, which significantly impacted volumes, and operational difficulties associated with the combination of Reddaway and USF Bestway in 2007. Our asset based companies experienced significantly higher fuel costs in 2008 as compared to 2007 as reflected in the increase in “Operating expenses and supplies” in the accompanying statements of consolidated operations. Fuel costs also drove higher purchased transportation costs in 2008 versus 2007. These increases were partially offset by $88.7 million net curtailment and settlement gains included in “Salaries, wages and employees’ benefits” in the accompanying consolidated statement of operations, primarily related to the elimination of postretirement healthcare benefits pursuant to a plan amendment for certain current and retired Roadway employees and the freezing of future benefit accruals under our non-union defined benefit plans effective July 1, 2008. During the year ended December 31, 2008, we continued to target cost control initiatives at all of our operating companies which was necessary given the volatility in the domestic markets and the overall tepid consumer spending patterns.
Our consolidated operating income during the year ended December 31, 2008, was also unfavorably impacted by $23.0 million of restructuring charges. During the first quarter of 2008, we closed 27 service centers in the Regional Transportation networks. These closures contributed to approximately $12.4 million of the reorganization charges. The majority of these closures were in the former USF Bestway footprint and represented locations that we inserted in the Reddaway network in 2007. This combination led to challenging operational difficulties and resulted in the 2008 closure of the former USF Bestway locations. A smaller portion of the closures were in the Holland network and represented locations in the former USF Dugan network. In addition, we incurred severance and reorganization charges during 2008 of approximately $8.9 million resulting from continued realignment of our operations, and we closed a YRC Logistics facility in the United Kingdom and terminated a YRC Logistics service offering which resulted in closure charges, primarily lease cancellation charges, of approximately $1.2 million and $0.5 million, respectively. In 2007 we recorded $11.3 million of restructuring charges, primarily severance and acceleration of stock compensation charges related to terminated executives. During the year ended December 31, 2008, we recognized gains on the sale of property and equipment offset by fair value adjustments for property of $19.1 million compared to gains of $5.8 million on the sale of property and equipment during the year ended December 31, 2007.
Nonoperating expenses for the year ended December 31, 2008, decreased $17.3 million from the year ended December 31, 2007. Lower overall borrowings throughout 2008 contributed to decreased interest expense of $11.5 million versus 2007. The 2008 period also reflected decreased interest related to withdrawal liabilities to USF Red Star multi-employer pension plans of $1.5 million offset by an increase in amortization of deferred debt costs of $1.1 million and a decrease in amortization of debt premiums of $1.0 million. Nonoperating expenses also included the impacts of foreign currency which increased favorably $5.7 million in 2008 versus 2007. Interest income, net financing transaction costs and earnings of joint ventures are also included in nonoperating expenses.
Our effective tax rate for the year ended December 31, 2008, was 14.8% compared to 2.2% for the year ended December 31, 2007. Significant items impacting the 2008 rate included goodwill impairment charges and certain nondeductible expenses partially offset by benefits associated with various state jurisdictions and an alternative fuel tax credit. The effective tax rate for 2007 was more proportionately impacted by the goodwill impairment charges.
23
Table of Contents
National Transportation Results
National Transportation represented approximately 66%, 70% and 69% of our consolidated revenue in 2009, 2008 and 2007, respectively. The table below provides summary information for National Transportation for the three years ended December 31:
| Percent Change | ||||||||||||||||||
| (in millions) |
2009 | 2008 | 2007 | 2009 vs. 2008 | 2008 vs. 2007 | |||||||||||||
| Operating revenue |
$ | 3,489.3 | $ | 6,304.9 | $ | 6,657.8 | (44.7 | %) | (5.3 | %) | ||||||||
| Impairment charges |
— | 776.7 | 76.6 | 100 | % | 914.0 | % | |||||||||||
| Operating income (loss) |
(742.8 | ) | (749.4 | ) | 159.3 | (0.8 | %) | n/m | (c) | |||||||||
| Operating ratio(a) |
121.3 | % | 111.9 | % | 97.6 | % | 9.4pp | (b) | 14.3 | pp | ||||||||
| (a) | Represents total operating expenses divided by operating revenue. |
| (b) | Percentage points. |
| (c) | Not meaningful. |
2009 compared to 2008
National Transportation reported operating revenue of $3,489.3 million in 2009, a decline of $2,815.6 million or 44.7% compared to the prior year. The two primary components of operating revenue are volume, comprised of the number of shipments and weight per shipment, and price or yield, usually evaluated on a per hundred weight basis. The decline in operating revenue was largely driven by a 38.7% decline in total picked up tonnage per day. The decline in total picked up tonnage per day was made up of a 36.0% decline in total shipments per day and a 4.3% decrease in total weight per shipment.
The decline in shipments and tonnage resulted from a weakened economy and the diversion of freight by customers to other carriers. As the economy has continued to deteriorate, industry capacity is more readily available and market competition for available shipments has intensified. Additionally, we believe that customers diverted freight during certain periods in 2009 due to the integration of the former Yellow Transportation and Roadway networks and uncertainty around our financial stability. We believe that the impact of freight diversion in 2009 is substantially greater than the impact in 2008 that resulted from uncertainty and timing around union labor negotiations. The decline in tonnage was impacted further by a 9.3% decrease in revenue per hundred weight resulting mostly from lower fuel surcharge revenue and higher than normal revenue adjustments, primarily rerates, related to the 2009 integration of Yellow Transportation and Roadway.
Operating loss for National Transportation was $742.8 million in 2009 compared to operating loss of $749.4 million in the prior year period which included a non-cash charge of $776.7 million relating to the impairment of goodwill and tradenames of Roadway and Reimer Express Lines. Absent this charge, operating income for National Transportation was $27.3 million in 2008. Revenue in 2009 was lower by $2,815.6 million while total costs decreased by $2,045.5 million in 2009 excluding the impact of the prior period impairment charge. The cost declines consisted primarily of lower salaries, wages and benefits of $1,171.5 million, lower operating expenses and supplies of $482.1 million, lower purchased transportation costs of $315.6 million, and lower other operating expenses of $79.2 million.
In October 2008, Yellow and Roadway legally merged and changed the legal name of the surviving entity to YRC Inc. The intention of management was to integrate the operations, technology and processes of both companies into one company. The integration process was completed in March 2009.
The decrease in salaries, wages and benefits of $1,205.0 million during 2009 is a result of substantial headcount reductions, the 10% wage reductions for most union (increased to 15% effective August 2009) and non-union employees, offset by increased workers’ compensation expense of $41.3 million. In addition to volume decreases, a further reduction in benefits expense resulted from the ratification by certain labor unions of a temporary cessation of pension contributions to certain of our multi-employer union pension funds effective throughout the second half of 2009. These reductions were partially offset by severance charges in 2009 of $26.8 million, as compared to $9.1 million in 2008 and stock compensation expense of $16.1 million in 2009 related to the February 2009 union equity award. Salaries and benefits in 2008 included curtailment gains of $95.1 million and were partially offset by pension settlement costs of $6.9 million related to the lump sum provision of the Roadway pension plan. The curtailment gains related to the freezing of future benefit accruals under pension plans covering Yellow Transportation and Roadway non-union employees as well as termination of the Roadway postretirement medical plan.
Operating expenses and supplies were lower due mostly to a decrease in fuel costs. Fuel and oil costs were 65.2% lower in 2009 compared to 2008 as a result of lower volumes and a decrease in fuel costs. This decline was partially offset by an increase in bad debt expense of $17.0 million in current year compared to prior year reflective of an increase of bankruptcies and credit risks in our customer base as well as higher costs associated with the YRC integration.
24
Table of Contents
The decline in purchased transportation during 2009 versus prior year resulted primarily from lower volumes. Rail costs were down 46.9% due to lower volume and substantially lower fuel surcharges compared to the prior year period while other purchased transportation costs were down 41.2%.
Other operating expenses decreased mostly due to lower operating taxes and licenses of $47.3 million primarily due to lower fuel taxes reflective of lower miles driven, a general liability claims expense decrease of $6.6 million related to lower volume, lower cargo claims expense in 2009 of $16.1 million due to fewer shipments offset by higher claims experience, and lower depreciation of $7.7 million due to reduced facilities and fleet downsizing.
2008 compared to 2007
National Transportation reported operating revenue of $6,304.9 million in 2008, a decline of $352.9 million or 5.3% compared to the prior year. The decline in operating revenue was largely driven by a 9.9% decline in total picked up tonnage per day. The decline in total picked up tonnage per day was made up of an 11.2% decline in total shipments per day and a 1.5% increase in total weight per shipment.
The tonnage decline was primarily the result of a weak economy. As the economy weakened, capacity became more readily available and competition for available loads intensified. Additionally, we believe certain customers diverted some freight to our competitors in early 2008 while we were finalizing our union labor contract and again in late 2008 due to uncertainty around a proposed amendment to our union labor agreement, which was subsequently ratified by the union, as well as perceived uncertainty around our financial stability.
The decline in total tonnage per day was partially offset by a 4.1% increase in total revenue per hundred weight. The increase in total revenue per hundred weight was the result of higher fuel surcharge revenue associated with substantially higher diesel fuel prices in 2008 compared to the prior year. Fuel prices were higher overall in 2008 compared to 2007 despite a significant and rapid decline in fuel prices in the fourth quarter of 2008.
The operating loss for National Transportation in 2008 included a non-cash charge of $776.7 million primarily relating to the impairment of goodwill and tradenames of Roadway and Reimer Express Lines, both a part of National Transportation. The prior year also contained an impairment charge in the amount of $76.6 million. Absent these charges, operating income for National Transportation was $27.3 million in 2008, a decline of $208.6 million or 88.4% compared to 2007. This decrease was primarily the result of lower revenue of $352.9 million, higher operating expenses and supplies of $134.4 million and higher purchased transportation of $39.1 million, partially offset by lower salaries, wages and benefits of $310.8 million (which includes pension and postretirement medical curtailment gains) and by lower other operating expenses of $6.6 million.
An impairment charge was taken against goodwill and tradenames for Roadway and Reimer Express Lines in the third quarter of 2008 in the amount of $635.9 million. Deteriorating economic conditions in 2008 were a primary factor in calculating the fair value of goodwill and tradenames and the resulting write-down. Additionally, management elected to discontinue the use of the Roadway name in marketing efforts which resulted in a fourth quarter charge to the Roadway tradename of $140.8 million. In 2007, an impairment charge was taken against tradenames for Roadway and Reimer.
Operating expenses and supplies were higher due mostly to an increase in fuel costs. Fuel and oil costs were 25.3% higher in 2008 compared to 2007 despite fewer shipments and despite a substantial decline in fuel prices during the fourth quarter of 2008. Additionally, bad debt expense in 2008 was $6.3 million or 29.3% higher than the prior year reflective of increased bankruptcies in our customer base.
Purchased transportation was higher due mostly to increased motor carrier costs combined with a change in administering certain intercompany transactions.
The decline in salaries, wages and benefits during 2008 was due mostly to lower hourly wages and benefits of $174.0 million and lower salaries and benefits of $136.0 million. Hourly wages and benefits declined as a result of lower volume but were partially offset by contractual wage and benefit increases effective April 1, 2008, and August 1, 2008, respectively. Salaries and benefits included curtailment gains of $95.1 million in the second and third quarters of 2008 as well as the impact of substantial headcount reductions during the year and were partially offset by pension settlement costs of $6.9 million related to the lump sum provision of the Roadway pension plan. The curtailment gains relate to the freezing of future benefit accruals under pension plans covering Yellow Transportation and Roadway non-union employees as well as termination of the Roadway postretirement medical plan.
25
Table of Contents
Other operating expenses decreased mostly due to lower operating taxes and licenses of $7.9 million primarily due to lower fuel taxes reflective of lower miles or volume. General liability claims expense increased $16.1 million in 2008 compared to 2007 due to unfavorable experience related to road accidents. Cargo claims expense in 2008 was $18.4 million lower than 2007 due to lower shipments and better claims experience. Net gains were recorded on the disposal of property of $11.5 million in 2008 compared to a net gain of $8.3 million in 2007. The 2008 gain was reflective of our initiative to combine duplicate locations within the YRC network and monetize these real estate holdings.
During 2008, reorganization and settlement costs, primarily severance costs associated with headcount reductions including certain management changes, were $9.1 million. In 2007, severance costs were $6.7 million due primarily to the combination of management structures of Yellow Transportation and Roadway to form National Transportation in the first quarter of 2007.
Regional Transportation Results
Regional Transportation represented approximately 25%, 22% and 24% of our consolidated revenue in 2009, 2008 and 2007, respectively.
The table below provides summary financial information for Regional Transportation for the three years ended December 31:
| Percent Change | ||||||||||||||||||
| (in millions) |
2009 | 2008 | 2007 | 2009 vs. 2008 | 2008 vs. 2007 | |||||||||||||
| Operating revenue |
$ | 1,322.6 | $ | 1,974.1 | $ | 2,280.4 | (33.0 | %) | (13.4 | %) | ||||||||
| Impairment charges |
— | 89.7 | 705.3 | 100 | % | (87.3 | %) | |||||||||||
| Operating income (loss) |
(126.7 | ) | (147.8 | ) | (700.8 | ) | 14.2 | % | 78.9 | % | ||||||||
| Operating ratio(a) |
109.6 | % | 107.5 | % | 130.7 | % | 2.1pp | (b) | (23.2 | pp) | ||||||||
| (a) | Represents total operating expenses divided by operating revenue. |
| (b) | Percentage points. |
2009 compared to 2008
Regional Transportation reported operating revenue of $1,322.6 million for 2009, representing a decrease of $651.5 million, or 33.0% from 2008. The two primary components of operating revenue are volume, comprised of the number of shipments and weight per shipment, and price or yield, usually evaluated on a per hundred weight basis. Total weight per day was down 24.9%, representing a 22.1% decline in total shipments per day and a 3.7% lower total weight per shipment compared to 2008. Shipment volumes were negatively impacted by a continued weak economy, the diversion of freight in 2009 due to uncertainty around our financial stability and the closure of service centers during 2009.
Total revenue per hundred weight decreased 10.2% in 2009 as compared to 2008, primarily due to lower fuel surcharge revenue associated with lower diesel fuel prices and the impact of continued pricing pressure on our base rates. A meaningful portion of our regional footprint is concentrated in the Upper Midwest where business levels and pricing negotiations have been especially difficult due to the economic challenges in this geographic area.
Operating loss for Regional Transportation was $126.7 million for 2009, an improvement of $21.1 million from 2008, consisting of a $651.5 million decline in revenue and a $672.6 million decrease in operating expenses. The operating loss for 2008 includes an impairment charge of $89.7 million related to the reduction in fair value of the USF trade name as noted below. Absent this impairment charge, the $126.7 million operating loss for 2009 would have been compared to an operating loss of $58.1 million for 2008, consisting of a $651.5 million decline in revenue and a $582.9 million decrease in operating expenses. Regional Transportation has reduced most operating expenses in proportion to lower business volumes. Expense decreases in 2009 were in salaries, wages and benefits of $332.8 million, operating expenses and supplies of $204.1 million, purchased transportation of $31.8 million, depreciation and amortization of $0.3 million and other operating expenses of $19.3 million. Expense increases in 2009 were in losses on property disposals of $5.4 million.
Salaries, wages and benefits expense decreased 26.1% reflecting lower employee levels and increased productivity as well as a 10% pay reduction which took effect in 2009 for most union and non-union employees and an additional 5% reduction for union employees which took effect in August 2009. In addition, a reduction in benefits expense resulted from the ratification by certain labor unions of a temporary cessation of pension contributions to certain of our multi-employer pension funds effective throughout the second half of 2009. These decreases were partially offset by severance costs (primarily for employees at closed facilities), equity ownership program costs for union employees (who received common stock in exchange for wage reduction approval) and
26
Table of Contents
higher workers’ compensation costs mostly as a result of unfavorable development factors and increased letter of credit fees supporting certain workers’ compensation programs. Operating expenses and supplies decreased 40.9% reflecting a 22.2% reduction in costs other than fuel and a 56.9% decrease in fuel costs (primarily due to lower fuel prices and lower volumes). Costs were lower in the areas of equipment maintenance, facility maintenance, driver expenses and tolls as a result of lower business volumes, effective cost management and terminal closures. Purchased transportation was 35.0% lower due to lower business volumes and the in-sourcing of certain linehaul transportation from third-party providers. Depreciation and amortization expense was 0.5% lower due primarily to a smaller equipment fleet mostly offset by a change during 2009 to reduce the life of customer related intangible assets which increased amortization expense. Other operating expenses were 18.5% lower, mainly in the areas of fuel taxes, property taxes, licenses and cargo claims primarily due to lower business volumes, partially offset by a higher provision for bodily injury and property damage claims due to unfavorable claim development.
Regional Transportation incurred $7.2 million of employee severance and lease termination costs in 2009 for the closure of five Holland service centers in September 2009 and 13 in March 2009 as part of continuing efforts to optimize our networks and reduce costs. Similar types of costs amounting to $12.4 million were incurred in 2008 related to the closure of six service centers at Holland and 21 service centers at Reddaway during February 2008. Costs in both years were recorded in salaries, wages and employees’ benefits expense and operating expenses and supplies expense.
Losses on property disposals were $2.0 million in 2009 compared to a $3.4 million gain in 2008, primarily due to gains on facility sales in 2008.
2008 compared to 2007
Regional Transportation reported operating revenue of $1,974.1 million for 2008, representing a decrease of $306.3 million, or 13.4% from 2007. The decreased operating revenue was driven by lower business volumes, partially offset by improved pricing including improved fuel surcharge revenue. Total weight per day was down 16.4%, representing a 16.5% decline in total shipments per day and a flat total weight per shipment compared to 2007. Shipment volumes were negatively impacted by a continued weak economy and the closure of six service centers at Holland and 21 service centers at Reddaway in mid-February 2008.
Total revenue per hundred weight increased 2.9% in 2008 as compared to 2007, primarily due to higher fuel surcharge revenue associated with higher diesel fuel prices, partly offset by pricing pressure on our base rates.
Operating loss for Regional Transportation in 2008 included an impairment charge of $89.7 million related to the reduction in fair value of the USF tradename. We continued to incorporate all business units in our master branding strategy and elected to discontinue the use of the USF name in marketing efforts. The 2007 results include a $705.3 million non-cash impairment charge relating to goodwill and intangible assets. Absent these charges, the operating loss was $58.1 million for 2008, a decrease of $62.6 million from 2007, consisting of a $306.3 million decline in revenue and a $243.7 million decrease in operating expenses. Regional Transportation has reduced most operating expenses in proportion to lower business volumes. Expense decreases in 2008 were in salaries, wages and benefits of $185.7 million, operating expenses and supplies of $16.2 million, purchased transportation of $24.4 million, depreciation and amortization of $1.1 million and other operating expenses of $16.9 million. Expense increases in 2008 were in gains/losses on property disposals of $0.6 million.
Salaries, wages and benefits expense decreased 12.7% reflecting lower employee levels and improved productivity, partly offset by annual/contractual salary, wage and benefit increases, and higher workers’ compensation costs as a result of favorable adjustments in 2007. Operating expenses and supplies decreased 3.1% compared to 2007 reflecting a 13.5% reduction in costs other than fuel and a 7.9% increase in fuel costs (primarily due to higher fuel prices partially offset by lower volumes). Costs were lower in the areas of equipment maintenance, facilities, travel, driver hotels and meals and uncollectible revenue as a result of lower business volumes, effective cost management and terminal closures in 2008. Purchased transportation was 21.2% lower due to lower business volumes and the in-sourcing of certain linehaul transportation from third-party providers. Depreciation was 1.6% lower due to a smaller equipment fleet, mostly offset by the impact of newer equipment. Other operating expenses were 14.0% lower mainly in the areas of operating taxes, licenses and insurance primarily due to lower business volumes.
Regional Transportation incurred $12.4 million of employee severance and lease termination costs in 2008 related to the closure of service centers at Holland and Reddaway during February 2008. Similar types of costs amounting to $7.9 million were incurred in 2007 related to the closure of Bestway and the consolidation of terminals into Reddaway’s California network. Costs in both years were recorded in salaries, wages and employees’ benefits expense and operating expenses and supplies expense.
Property disposals resulted in a gain of $3.4 million in 2008 compared to a gain of $4.0 million in 2007, primarily due to the sale of terminal facilities in each year.
27
Table of Contents
YRC Logistics Results
YRC Logistics represented approximately 8%, 7% and 6% of our consolidated revenue in 2009, 2008 and 2007, respectively. The table below provides summary financial information for YRC Logistics for the three years ended December 31:
| Percent Change | ||||||||||||||||||
| (in millions) |
2009 | 2008 | 2007 | 2009 vs. 2008 | 2008 vs. 2007 | |||||||||||||
| Operating revenue |
$ | 411.7 | $ | 621.7 | $ | 623.2 | (33.8 | %) | (0.2 | %) | ||||||||
| Impairment charges |
— | 157.0 | — | 100 | % | 100 | % | |||||||||||
| Operating income (loss) |
(4.5 | ) | (149.9 | ) | 5.2 | 97.0 | % | n/m | (c) | |||||||||
| Operating ratio(a) |
101.1 | % | 124.1 | % | 99.2 | % | (23.0pp | )(b) | 24.9 | pp | ||||||||
| (a) | Represents total operating expenses divided by operating revenue. |
| (b) | Percentage points. |
| (c) | Not meaningful. |
2009 compared to 2008
For the year ended December 31, 2009, YRC Logistics revenue decreased by $210.0 million or 33.8%. YRC Logistics recognized revenue declines in 2009 in each of its service offerings as overall business volumes continued to erode as a result of the sluggish global economy following the recent global recession. Sluggish conditions in the retail sector, certain customer losses and YRC Logistics’ decision to exit its domestic ocean service offering in June 2008 were the main drivers behind the decline in revenue for the distribution services group. Revenue declines in the transportation services group resulted from a continued weak manufacturing and construction sector and certain customer losses. Poor global economic conditions, especially in Europe and Asia, resulted in lower volumes and shipment counts for the year ended December 31, 2009 causing global services revenue to decline. YRC Logistics also experienced revenue declines due to customer diversions related to concerns regarding our financial stability.
Operating loss improved from a loss of $149.9 million for the year ended December 31, 2008 to a loss of $4.5 million for the year ended December 31, 2009. As previously discussed, the year ended December 31, 2008, included a write off of goodwill of $157.0 million with no comparable amount for the year ended December 31, 2009. Absent this charge, operating income decreased from $7.1 million for the year ended December 31, 2008 to a loss of $4.5 million for the year ended December 31, 2009. This decrease reflects a 33.8% reduction in revenue and a 32.3% reduction in expenses as compared to 2008. Salaries, wages and employees’ benefits decreased 27.4% for the year ended December 31, 2009 compared to 2008, which includes a $3.5 million reduction in incentive compensation, a $3.0 million reduction in workers’ compensation and the remaining decrease attributed to a 10% wage reduction for most employees and an overall reduced workforce. Purchased transportation decreased 40.1% for the year ended December 31, 2009 compared to the year ended December 31, 2008 due to both reduced volume and carrier cost. Claims expense for both bodily injury and cargo increased 54.6% during the year ended December 31, 2009 versus 2008 due to specific increases for serious accidents as well as increased cargo claims experience primarily for exiting contractual customers.
In November 2009, YRC Logistics sold its dedicated contract carriage or “fleet” business for $34 million including certain holdback amounts of $1.8 million for indemnification and working capital targets. This business line was a part of the transportation services group and had revenue of $73.8 million and operating income of $7.1 million for the year ended December 31, 2009.
2008 compared to 2007
For the year ended December 31, 2008, YRC Logistics revenue decreased by $1.5 million or 0.2%. Revenue and expense associated with the fulfillment of certain of National Transportation’s domestic forwarding business line were recorded within the National Transportation segment effective July 2007. Previously such revenue and related expense were recorded in the YRC Logistics segment. The transfer of this revenue resulted in a decrease in revenue of $23.6 million for 2008 compared to 2007 with minimal impact on operating income as the corresponding purchased transportation was also transferred. Excluding this revenue, YRC Logistics revenue increased by $22.1 million or 3.5% driven by customer growth and increased volumes in both global services of $23.2 million and dedicated fleet of $12.2 million. Increases in these services were partially offset by shrinking volumes in distribution services caused by weakening economic conditions in the retail sector and YRC Logistics’ decision to exit its domestic ocean service offering.
Operating loss for the year ended December 31, 2008, included an impairment charge related to the reduction in fair value of the YRC Logistics reporting unit resulting in a write off of goodwill of $157.0 million. There was no comparable charge in 2007. Absent this charge, operating income increased by $1.9 million from $5.2 million in 2007 to $7.1 million in 2008. During 2008, YRC Logistics exited a warehousing contract in the United Kingdom and its domestic ocean service offering along with other
28
Table of Contents
restructuring and severance charges resulting in $1.7 million of expense. Similar restructuring items in 2007 resulted in a $3.3 million restructuring and severance charge and $0.7 million of losses from property disposals. Restructuring charges in 2008 were offset by a $6.0 million gain from the sale of real estate. In 2008, YRC Logistics experienced increased provisions for uncollectible accounts of $2.5 million compared to 2007 primarily due to economic conditions our customers were facing and stale accounts.
Truckload Results
Truckload represented approximately 1% of our consolidated revenue in 2009, 2008 and 2007, respectively. The table below provides summary financial information for Truckload for the three years ended December 31:
| Percent Change | ||||||||||||||||||
| (in millions) |
2009 | 2008 | 2007 | 2009 vs. 2008 | 2008 vs. 2007 | |||||||||||||
| Operating revenue |
$ | 112.4 | $ | 120.5 | $ | 112.9 | (6.7 | %) | 6.7 | % | ||||||||
| Operating income (loss) |
(8.7 | ) | (11.6 | ) | (5.9 | ) | 25.0 | % | (96.6 | %) | ||||||||
| Operating ratio(a) |
107.7 | % | 109.7 | % | 105.2 | % | (2.0pp | )(b) | 4.5 | pp | ||||||||
| (a) | Represents total operating expenses divided by operating revenue. |
| (b) | Percentage points. |
2009 compared to 2008
Truckload reported 2009 operating revenue of $112.4 million, representing a decrease of $8.1 million or 6.7% from 2008. The two primary components of truckload operating revenue are volume, comprised of the miles driven, and price, usually evaluated on a revenue per mile basis. Total miles driven per day increased 11.8% in 2009 as compared to 2008, due primarily to higher use of Truckload services by YRC Worldwide operating companies partially offset by the soft economy. However, revenue per mile was down 16.1%, due primarily to lower fuel surcharge revenue associated with lower diesel fuel prices.
Operating loss for Truckload was $8.7 million for 2009, an improvement of $2.9 million from 2008, consisting of an $8.1 million decrease in revenue and an $11.0 million decrease in operating expenses. Expense decreases were primarily in the areas of fuel (lower diesel prices partially offset by higher miles driven which consumed more gallons), driver recruiting, purchased transportation, equipment depreciation, bodily injury and property damage claims and losses on equipment disposals. Increased operating expenses were primarily volume related higher wages and benefits costs of $5.7 million and higher vehicle maintenance costs.
2008 compared to 2007
Truckload reported 2008 operating revenue of $120.5 million, representing an increase of $7.6 million or 6.7% from 2007. Total miles driven per day were up 1.9% in 2008 as compared to 2007 due primarily to higher use of Truckload services by YRC Worldwide operating companies partially offset by the soft economy. Revenue per mile was up 4.2%, due primarily to increased fuel surcharge revenue associated with higher diesel fuel prices.
The operating loss for 2008 was $11.6 million, as compared to an operating loss of $5.9 million for 2007, consisting of a $7.6 million increase in revenue and a $13.3 million increase in operating expenses. Increased operating expenses were primarily in the areas of fuel costs (higher diesel prices and higher miles driven), salaries and wages (higher miles driven and annual compensation rate increases), driver recruiting costs and tolls. Decreased operating expenses were primarily due to lower purchased transportation costs of $1.2 million and lower losses on equipment disposals of $1.5 million.
29
Table of Contents
Financial Condition
Liquidity
The economic environment in 2009 had a dramatic effect on our industry as we experienced the greatest U.S. recession since World War II. This great recession substantially and negatively impacted our customers’ needs to ship and, therefore, negatively impacted the volume of shipments that we handled and the price that we received for our services. As a result, we experienced lower year-over-year revenue (primarily a function of declining volume), greater operating losses and negative cash flow. In addition, we believe that many of our existing customers reduced their business with us due to their concerns regarding our financial condition and the integration of our national business in March 2009, which contributed to our operating losses and operating cash flow deficits.
As a part of our comprehensive recovery plan, we have executed on a number of significant initiatives during 2009 to respond to these conditions, which are described more fully below. As we continue to improve our service and stabilize our financial condition, we anticipate the return of shipping volume from customers who have shifted their business to other providers because of their concerns regarding our financial condition. However, we cannot predict how quickly and to what extent this business will return. On a sequential basis, while revenue declines continued, our operating results improved from the second quarter to the third quarter of 2009 by $182 million and by $31 million from the third quarter to the fourth quarter of 2009, and our operating cash flow deficits decreased from the second quarter to the third quarter of 2009 by $77 million and by $10 million from the third quarter to the fourth quarter of 2009. Sequential improvements were driven by successful cost reductions and liquidity actions within our comprehensive recovery plan which we discuss below.
Comprehensive Recovery Plan
In light of the current economic environment and the resulting challenging business conditions, we have implemented or are in the process of implementing the following actions (among others) as part of our comprehensive recovery plan to reduce our cost structure and improve our operating results, cash flow from operations, liquidity and financial condition:
| • | the integration in March 2009 of our Yellow Transportation and Roadway networks into a single service network, now branded “YRC”. See “—YRC Integration” below. |
| • | the discontinuation in March 2009 of the geographic service overlap between our Holland and New Penn networks. |
| • | the first quarter implementation of a 10% wage reduction for substantially all of our employees (both union and non-union). See “—Ratification of Collective Bargaining Agreement Modification” below. |
| • | the deferral of payment of certain contributions to our union multi-employer pension funds, mostly in the first half of 2009, pursuant to a Contribution Deferral Agreement. See “—Pension Contribution Deferral Obligations” below. |
| • | reductions in the number of terminals to right-size our transportation networks to current shipment volumes. At December 31, 2008, we operated 711 terminals; at December 31, 2009, we reduced the number of terminals we operate to 511. |
| • | the August 2009 implementation of an additional 5% wage reduction for substantially all of our union employees. |
| • | the temporary cessation of pension contributions to certain of our union multi-employer pension funds starting in July 2009 through December 31, 2010, which cessation eliminates the need to recognize expense for these contributions during this period. See “—Ratification of Collective Bargaining Agreement Modification” below. |
| • | suspension of company matching 401(k) contributions for non-union employees |
| • | the sale of excess property and equipment, primarily resulting from the integration of the Yellow Transportation and Roadway networks |
| • | the sale and leaseback of core operating facilities. See “—Lease Financing Transactions” below. |
| • | reductions in our workforce to scale our business to current shipping volumes. At December 31, 2008, we had approximately 55,000 employees; at December 31, 2009, our workforce was reduced to approximately 36,000 employees. |
| • | other cost reduction measures in general, administrative and other areas. |
| • | changes to our overall risk management structure to reduce our letter of credit requirements. |
| • | amendments to our Credit Agreement (defined below) to provide us greater access to the liquidity that our revolving credit facility provides and the deferral of interest and fees that we pay to our lenders, subject to the conditions that the amended Credit Agreement requires. See “—Credit Agreement” below. |
| • | a renewal and amendment of our ABS Facility (defined below) to defer a significant portion of the fees in connection with our ABS Facility, subject to certain conditions. See “—ABS Facility” below. |
| • | an amendment to our Contribution Deferral Agreement, pursuant to which certain of our union multi-employer pension funds agreed to defer the payment of interest on our deferred obligations, and to defer the beginning of installment payments of previously deferred contributions, in each case, subject to the conditions that the Contribution Deferral Agreement requires. See “—Pension Contribution Deferral Obligations” below. |
30
Table of Contents
| • | our completion of an exchange offer (the “Exchange Offer”) to exchange a significant portion of our outstanding 8 1/2% USF senior notes and contingent convertible notes for common stock
and preferred stock of the Company. |
| • | the execution of a Note Purchase Agreement (defined below) in February 2010 for the issuance of up to $70 million of 6% Notes (defined below) and the subsequent issuance of $49.8 million of the 6% Notes used to satisfy the $45 million remaining 8 1/2% USF senior notes. See “—Convertible Notes Placement Transaction” below. |
Certain of these actions are further described below. The final execution of our comprehensive recovery plan has certain risks that are not within our control that may adversely impact our liquidity and compliance with the financial covenants in our credit facilities. See “—Risks and Uncertainties Regarding Future Liquidity” below.
YRC Integration
In March 2009, we completed the integration of our Yellow Transportation and Roadway networks into one service network, now branded “YRC”. During the integration, we believe that many of our customers reduced their shipments with us to mitigate their risks from our integration. As our service improved from the March 2009 integration, many of these customers returned their shipping volumes to us, and we added new customers. However, these volumes did not return as quickly as we had anticipated. As a result of the successful integration, we have been able to implement a number of significant cost savings actions, including reducing the number of terminals, reducing headcount and decreasing our fleet size.
Ratification of Collective Bargaining Agreement Modification
In August 2009, the employees in most of our bargaining units who are represented by the International Brotherhood of Teamsters (the “Teamsters”) ratified a modification to our collective bargaining agreement. The modification provides (among other things) the following:
| • | a temporary cessation of the requirement for the Company’s subsidiaries to make contributions on behalf of most of the Company’s Teamster represented employees to union multi-employer pension funds from July 2009 through December 31, 2010. These contributions will not need to be repaid in the future and, therefore, will be a cost reduction during this period. |
| • | a 15% wage reduction (which includes the 10% wage reduction previously implemented in January 2009) for most of the Company’s Teamster represented employees that is in effect until our current collective bargaining agreement expires at the end of March 2013. |
| • | a reduction in the increase in contributions to multiemployer health and welfare plans from $1.00 per hour for each year to $0.20 per hour that occurred on August 1, 2009 and to $0.40 per hour that is scheduled for August 1, 2010. |
| • | the establishment of a stock option plan (and related stock appreciation rights plan) for participating union employees, providing for options to purchase 263.7 million shares of the Company’s common stock. This stock option plan (and the related stock appreciate rights plan) were established on March 1, 2010. Under the plans each qualified employee will receive an equal number of options and stock appreciation rights. The vast majority of options (and related stock appreciation rights) were granted on March 1, 2010 with a strike price of 48 cents per share. The stock options were granted subject to approval by the Company’s shareholders. If, at a meeting called to approve these options, the shareholders of the Company approve the options, the stock appreciation rights will be terminated and forfeited. If the Company’s shareholders do not approve the options, the options will be terminated and forfeited and the stock appreciation rights will remain in their place. |
| • | during the period in which the temporary pension contribution cessation is in effect, subject to the approval of the Company’s board of directors, which approval may not be unreasonably withheld, the Company is required to appoint a director that the Teamsters nominate. This person has not yet been nominated. |
As with prior ratification elections, a small number of the bargaining units representing less than 10% of our Teamster employees did not initially ratify the labor agreement modifications in August 2009. The Company and the Teamsters have since addressed employee concerns and most of these units have either subsequently ratified the modifications or have merged or will merge with other bargaining units that have previously ratified the modifications. In one case, a unit representing less than 2% of our Teamster employees has approved the temporary cessation of the contributions for unit employees to a multi-employer pension fund. The Company has continued to discuss with this unit the ratification of the other provisions of the collective bargaining agreement modification. Dockworkers represented by another unit (representing less than 3.5% of Teamster employees) have merged with another bargaining unit that has previously implemented the modifications. Even so, the Company has only implemented the temporary pension contribution cessation provisions of the modifications as these employees have rejected the modification in prior ratification votes. The Company believes that it can impose all of the labor agreement modifications due to the merger of the unit with another larger bargaining unit that previously ratified the modifications. However, the Company is working with these employees to determine if they will consensually approve the modifications to avoid a labor dispute with this unit. Another group representing less than 5% of our Teamster employees, mostly Reddaway employees, continues to consider the modifications. These Reddaway units do not impact contributions to multi-employer pension funds, as the units do not currently participate in these funds.
31
Table of Contents
CREDIT FACILITIES
We have two primary liquidity vehicles:
| • | the Credit Agreement dated as of August 17, 2007 (as amended, the “Credit Agreement”), among the Company, certain of our subsidiaries, JPMorgan Chase, National Association, as administrative agent, and the other agents and lenders named therein, and |
| • | an asset based securitization facility (as amended, the “ABS Facility”), whereby we receive financing through the sale of certain of our accounts receivable. |
The Credit Agreement and the ABS Facility are collectively referred to herein as the “credit facilities”.
Credit Agreement
The Credit Agreement provides us with a $950 million senior revolving credit facility, including sublimits available for borrowings under certain foreign currencies and for letters of credit, and a senior term loan in an aggregate outstanding principal amount of approximately $111.5 million. During 2009, the Company entered into a number of amendments to the Credit Agreement that address liquidity and covenant relief. Set forth below is a discussion of the terms of the Credit Agreement in its current form after giving effect to these amendments.
— Revolver Reserve
The revolver reserve is a sub-portion of the $950 million senior revolving credit facility. The revolver reserve is equal to the amount of mandatory prepayments that we make under the Credit Agreement of a varying percentage of net cash proceeds from certain asset sales starting in 2009. These asset sales included sales of excess real estate, real estate subject to sale and leaseback transactions and the Company’s fleet business that was part of YRC Logistics.
The total amount of the revolver reserve was approximately $160 million at December 31, 2009. The Credit Agreement divides the revolver reserve into three blocks:
| • | the existing revolver reserve (performance) block; this block was approximately $56 million and fully drawn upon as of January 6, 2010; this block will be decreased by mandatory prepayments of net cash proceeds from certain asset sales and any excess cash flow sweeps; |
| • | the existing revolver reserve (payroll) block; this block remains at $50 million until termination of the Credit Agreement, and the Company has not drawn this block as of March 16, 2010; and |
| • | the new revolver reserve block; this block was approximately $53.8 million at December 31, 2009, and the Company has not drawn this block as of March 16, 2010; this block will be increased by mandatory prepayments of net cash proceeds from certain asset sales and any excess cash flow sweeps. |
Each block comprising a portion of the revolver reserve has its own separate conditions to borrowing, which include of particular note:
| • | existing revolver reserve (performance) block |
| • | after giving effect to each borrowing, unrestricted Permitted Investments (as defined in the Credit Agreement) are less than or equal to $125 million (or, $100 million to the extent that any Permitted Interim Loans (as defined in the Credit Agreement) are outstanding) (the “Anti-Cash Hoarding Condition”); |
| • | either (i) the Company meets certain specified minimum weekly operating thresholds based on earnings before interest, taxes, depreciation and amortization (“EBITDA”) and maintains certain monthly selling, general and administrative (“SG&A”) expense amounts below specified maximum thresholds or (ii) 66 2/3% of the lenders approve the borrowing; |
| • | existing revolver reserve (payroll) block |
| • | satisfaction of the Anti-Cash Hoarding Condition; |
| • | the Company has Interim Loan Availability (as defined in the Credit Agreement) and the draw on such existing revolver reserve (payroll) block does not exceed the Interim Loan Availability; |
32
Table of Contents
| • | new revolver reserve block |
| • | satisfaction of the Anti-Cash Hoarding Condition; |
| • | the existing revolver reserve (performance) block has been fully borrowed; |
| • | the Company obtains the approval of 66 2/3% of the lenders; and |
| • | the Company pays all amounts outstanding under our 5% Notes that retain a put right to require it to repurchase such notes prior to February 2013. |
As of March 16, 2010, we would meet the conditions to borrowing of the existing revolver reserve (payroll) block. Pursuant to the Credit Agreement, on January 1, 2012 (or such later date as may be agreed to by 66 2/3% of the lenders), subject to early termination upon a Deferral Termination Event (defined below), the revolving commitments will be permanently reduced by an amount equal to the reserve amount.
— Interest and Fee Deferrals
The lenders agreed to defer the payment of revolver and term loan interest, letter of credit fees and commitment fees, subject to the deferral exceptions and termination events discussed below, for the period:
| • | beginning December 31, 2009, and |
| • | ending on December 31, 2010, subject to an extension until December 31, 2011 if agreed to by 66 2/3 % of the lenders. |
As of February 28, 2010 and December 31, 2009, the amounts deferred under the above provision were $32.2 million and $19.1 million, respectively. The Company expects the deferred interest and fees to be approximately $20 million per quarter. Deferred amounts are due on December 31, 2011.
— Deferral Exceptions and Termination Events
There are exceptions and termination events with respect to the interest and fee deferral described above, including (among others) the following:
| • | no further interest and fees will be deferred and all previously deferred amounts will become payable at the election of a majority of the lenders, upon the occurrence of certain specified events, including (among others) the following, unless 66 2/3% of the lenders agree otherwise (each, a “Deferral Termination Event”): |
| • | the modification to our collective bargaining agreement (described above in “—Ratification of Collective Bargaining Agreement Ratification”) terminates or is amended or otherwise modified (including, by the operation of any “snapback” or similar provisions) in any way that is adverse to the Company or the lenders in a manner that could reasonably be expected, individually or in the aggregate, to result in an impact of greater than $5 million in any calendar year; |
| • | the Company amends or otherwise modifies the Contribution Deferral Agreement and related agreements in any way that is adverse to the Company or the lenders; or |
| • | the Company makes any cash payment of any pension fund obligations and any interest thereon that the Company deferred in 2009 under the Contribution Deferral Agreement other than: |
| • | payments of proceeds resulting from the sale of real property that collateralizes the deferred pension obligations and which the pension funds have a first lien; or |
| • | payments of permitted fees and expenses. |
| • | no further interest and fees will be deferred upon any cash payment (other than payments described in the preceding bullets) of any pension fund liabilities (and any interest thereon) due prior to December 31, 2011 other than certain permitted payments, including payments to the Company’s single employer pension plans that are required to be made pursuant to ERISA and payments to certain multiemployer pension plans that generally are not participating in the Contribution Deferral Agreement (each, a “Deferral Suspension Event”). Any deferred interest and fees will not become due and payable solely as a result of a Deferral Suspension Event. |
| • | commencing on January 1, 2011, |
| • | if after giving effect to an interest or fee payment on the applicable interest or fee payment date, the Available Interest Payment Amount (as defined in the Credit Agreement) on the interest or fee payment date would be equal to or greater than $150 million, the Company must make such payment in full in cash on the interest or fee payment date, and |
| • | to the extent that the Available Interest Payment Amount on any business day exceeds $225 million, the Company must apply the excess over $225 million to pay previously deferred interest and fees. |
33
Table of Contents
— Mandatory Prepayments
Under the Credit Agreement, we are obligated to make mandatory prepayments on an annual basis of any excess cash flow (as defined in the Credit Agreement) and upon the receipt of net cash proceeds from certain asset sales and the issuance of equity and if we have an average liquidity amount for the immediately preceding five business days in excess of $250 million. The percentage of net cash proceeds received and the manner in which they are applied varies as set forth in greater detail in the Credit Agreement.
On March 11, 2010, we entered into Amendment No. 16 to the Credit Agreement, which provides that, upon obtaining the consent of each pension fund party to the Contribution Deferral Agreement, 100% of the net cash proceeds received from certain permitted dispositions must each be used to make a mandatory prepayment, as follows:
| • | 50% of such net cash proceeds will be applied against the non-revolver reserve portion of the revolver and may be reborrowed, subject to satisfaction of the applicable borrowing conditions, and |
| • | the other 50% of such net cash proceeds will be applied against the revolver reserve (and will result in a corresponding commitment reduction thereto). |
Prior to the consent of the pension funds, any net cash proceeds received from these permitted dispositions will be applied in the manner set forth in the Credit Agreement prior to Amendment No. 16.
— Asset Sales
The Credit Agreement allowed us to receive up to $400 million of net cash proceeds from asset sales in 2009 and allows us to receive up to $200 million of net cash proceeds from asset sales in 2010 and up to 10% of our consolidated total assets during each fiscal year thereafter, which limits do not include net cash proceeds received from certain asset sales, including the following:
| • | the sale of real estate that constitutes first lien collateral of the pension funds pursuant to the Contribution Deferral Agreement, |
| • | the initial sale and lease back transaction completed with NATMI Truck Terminals, LLC (“NATMI”) in the first half of 2009, and |
| • | permitted dispositions approved by a majority of the lenders. |
We may only consummate future sale and leaseback transactions if a majority of our bank lenders approve or have previously approved the transactions.
— Financial Covenants
The Credit Agreement requires that the Company maintain minimum consolidated EBITDA and maximum capital expenditure levels, as follows:
| Period |
Minimum Consolidated EBITDA | ||
| For the quarter ending on June 30, 2010 |
$ | 31.5 million | |
| For the two consecutive quarters ending September 30, 2010 |
$ | 107 million | |
| For the three consecutive quarters ending December 31, 2010 |
$ | 173 million | |
| For the four consecutive quarters ending March 31, 2011 |
$ | 270 million | |
| For the four consecutive quarters ending June 30, 2011 |
$ | 270 million | |
| For the four consecutive quarters ending September 30, 2011 |
$ | 280 million | |
| For the four consecutive quarters ending December 31, 2011 |
$ | 270 million | |
| For the four consecutive quarters ending March 31, 2012 |
$ | 300 million | |
| For the four consecutive quarters ending June 30, 2012 |
$ | 330 million | |
34
Table of Contents
| Period |
Maximum Capital Expenditures | ||
| For the fourth fiscal quarter in 2009 | $ | 30 million | |
| For the four consecutive quarters ending December 31, 2009 | $ | 60 million | |
| For any single quarter in 2010 | $ | 57.5 million | |
| For the four consecutive quarters ending December 31, 2010 | $ | 115 million | |
| For any single quarter in 2011 | $ | 72.5 million | |
| For the four consecutive quarters ending December 31, 2011 | $ | 145 million | |
| For any single quarter in 2012 | $ | 50 million | |
Our Minimum Available Cash (as defined in the Credit Agreement) covenant requires that, (i) commencing on April 1, 2010, we have at least $25 million of Available Cash (as defined in the Credit Agreement) at all times, and (ii) commencing October 1, 2010, we have at least $50 million of Available Cash at all times thereafter. Available Cash is determined on each business day based on the average Available Cash as of the end of business for the immediately preceding three business days.
— Annual Financial Statements
On March 11, 2010, we entered into Amendment No. 16 to the Credit Agreement that modified the affirmative covenant that required receipt of financial statements for fiscal year ended 2009 with an audit opinion that did not include a “going concern” exception to permit receipt of an audit opinion with a “going concern” exception.
As of December 31, 2009 and the date of this report, we were in compliance with the covenants of our Credit Agreement.
— Teamster Approval of the Credit Agreement
The August 2009 modification to our collective bargaining agreement with the Teamsters requires, among other things, that we enter into a bank amendment that is acceptable to the Teamsters. The Teamsters National Freight Industry Negotiating Committee (“TNFINC”) certified to us that Amendment No. 12 to the Credit Agreement was satisfactory to the Teamsters, subject to the following conditions (among others):
| • | if the Company requests a borrowing or letter of credit pursuant to the Credit Agreement under circumstances where 66 2/3% of the lenders must approve the borrowing or letter of credit, then 66 2/3% of the lenders do so approve the borrowing or letter of credit |
| • | the lenders under the Credit Agreement continue to defer revolver and term loan interest, letter of credit fees and commitment fees in 2011 |
| • | to the extent a Default or an Event of Default (as each are defined in the Credit Agreement) occurs or additional amendments to the Credit Agreement are consummated, no lender: |
| • | exercises any remedies that result in the acceleration of the payment of any of the obligations under the Credit Agreement; |
| • | amends or provides waivers with respect to the Credit Agreement that result in any further increase in interest or fees under the Credit Agreement; |
| • | obtains a judgment to foreclose on any collateral securing the obligations under the Credit Agreement; or |
| • | takes any similar type of collection action in court or before an arbitral proceeding. |
If any of these conditions are not met, TNFINC reserved the right to declare the modification to the collective bargaining agreement ineffective and terminate the modification on a prospective basis.
ABS Facility
During 2009, the Company entered into a number of amendments to its ABS Facility that address liquidity and covenant relief. Below we discuss aspects of the ABS Facility in its current form after giving effect to these amendments.
The ABS Facility is scheduled to expire on October 26, 2010.
35
Table of Contents
Our ABS Facility is a facility with a maturity of less than one year because many of the purchasers of our accounts receivable underlying our ABS Facility finance their purchases by issuing short term notes in the commercial paper markets backed by these and other companies’ receivables. We have, in the past, routinely renewed our ABS Facility at or before its scheduled expiration, which currently is October 26, 2010. If we are unable to extend or renew our ABS Facility or replace it with an alternative financing, there is a substantial risk that we could not repay the entire facility or have funds sufficient to operate our business.
The aggregate commitments under the ABS Facility are currently $400 million, and the letter of credit facility sublimit is $84 million. At December 31, 2009, there was no available capacity based on qualifying accounts receivables and certain other provisions under the ABS Facility.
In addition, certain calculations under the ABS Facility reduce the impact of previous certain negative effects that the integration of Yellow Transportation and Roadway has had on those calculations, due to rating adjustments and the timing of customer payments. As a result of these amendments in 2009, the obligation to repay outstanding amounts under the ABS Facility due to those integration effects has been reduced or eliminated.
The financial covenants under the ABS facility for Minimum Consolidated EBITDA (as defined in the ABS Facility), available cash requirements and capital expenditures are consistent with the Credit Agreement’s covenants. See “—Credit Agreement—Financial Covenants” above.
As of December 31, 2009 and the date of this report, we were in compliance with the covenants of our ABS Facility.
Some of the fees and interest due during the term of the ABS Facility have been deferred. The $10.0 million fee that was due on October 30, 2009 has been deferred until the earliest to occur of the following dates or events (the “Deferred Fee Payment Date”):
| • | October 26, 2010, |
| • | the Amortization Date (as defined in the ABS Facility), and |
| • | the occurrence of a Deferral Termination Event. |
The portion of current letter of credit fees, program fees and administration fees in excess of the fees in place prior to February 12, 2009 were deferred also until the Deferred Fee Payment Date. As of February 28, 2010 and December 31, 2009, amounts deferred under the above provisions were $13.9 million and $11.4 million, respectively. The Company expects these deferred fees to be approximately $4 million per quarter. All deferred fees will accrue and be payable on the Deferred Fee Payment Date; provided, that, if the advance rate on the ABS Facility exceeds 50% on any business day, all or a portion of deferred fees will be immediately payable in an amount sufficient to reduce the effective advance rate to 50%. Upon the occurrence of a Deferral Suspension Event, the Company will no longer be permitted to defer fees under the ABS Facility; however, previously deferred fees will not become due and payable solely as a result of the occurrence of a Deferral Suspension Event.
OTHER FINANCING TRANSACTIONS
Lease Financing Transactions
We have entered into several lease financing transactions with various parties, including NATMI and Estes Express Lines (“Estes”). The underlying transactions included providing title of certain real estate assets to the issuer in exchange for agreed upon proceeds; however, the transactions did not meet the accounting definition of a “sale leaseback” and as such, the assets remain on our balance sheet and long-term debt (titled Lease Financing Obligations) is reflected on our balance sheet in the amount of the proceeds. We are required to make monthly lease payments, which are recorded as principal and interest payments under these arrangements, generally over a term of ten years.
The table below summarizes our lease financing transactions through December 31, 2009:
| Lessor |
Original Contract Amount |
Contracts completed during 2009 |
Contracts completed subsequent to December 31, 2009 |
Contract modifications |
Remaining contracted amount to close |
Effective interest rates | ||||||||||||
| NATMI |
$ | 184.4 | $ | 153.8 | $ | — | $ | (30.6 | ) | $ | — | 10.3%-18.4% | ||||||
| Estes |
122.0 | 110.3 | — | (11.7 | ) | — | 10.0% | |||||||||||
| Other |
153.3 | 67.4 | 4.4 | (31.2 | ) | 50.3 | 10.0%-14.1% | |||||||||||
| Total |
$ | 459.7 | $ | 331.5 | $ | 4.4 | $ | (73.5 | ) | $ | 50.3 | |||||||
36
Table of Contents
We have used the proceeds received from the above transactions, as follows:
| (in millions) |
Year ended December 31, 2009 |
|||
| Proceeds received |
$ | 331.5 | ||
| Amounts required to be escrowed with lessor |
(11.5 | ) | ||
| Transaction costs |
(4.5 | ) | ||
| Net proceeds received |
315.5 | |||
| Amounts required to be remitted to Revolver Reserve |
(93.1 | ) | ||
| Amounts available for working capital purposes |
$ | 222.4 | ||
In addition to the $93.1 million referenced in the table above, we were required to repay borrowings under the revolving loan by an additional $66.7 million as a result of additional asset sales, including permitted dispositions, thereby making the total of the existing revolver reserve equal to $159.8 million on December 31, 2009.
The Credit Agreement requires any net cash proceeds from real estate asset sales (other than approximately $117 million in net cash proceeds received in the initial sale and leaseback transaction completed with NATMI in the first half of 2009 and sales of real estate on which the pension funds have a first priority security interest under the Contribution Deferral Agreement) received on or after January 1, 2009 to be applied as follows:
| • | with respect to the first $300 million of such net cash proceeds, 50% of such proceeds shall be used to prepay amounts outstanding under the Credit Agreement and the remaining 50% shall be retained by the Company; as of February 28, 2010, the Company had not yet generated the full amount of $300 million in such net cash proceeds; |
| • | with respect to such net cash proceeds in excess of $300 million and less than or equal to $500 million, 75% of such proceeds shall be used to prepay amounts outstanding under the Credit Agreement and the remaining 25% shall be retained by the Company; and |
| • | with respect to such net cash proceeds that exceed $500 million, all of such proceeds shall be used to prepay amounts outstanding under the Credit Agreement. |
The Credit Agreement requires that the prepayments (using the applicable prepayment percentage) described above shall be applied
| • | first, to repay any outstanding permitted interim loans (as defined in the Credit Agreement); |
| • | second, to repay any outstanding loans from the new revolver reserve block; |
| • | third, to repay any outstanding loans from the existing revolver reserve block (with a concurrent permanent commitment reduction of the existing revolver reserve (performance) block and the new revolver reserve block being increased by such prepayment amount); and |
| • | fourth, to repay any other outstanding revolver loans (with a concurrent permanent commitment reduction of such other outstanding revolver loans) and increase the new revolver reserve block by such prepayment amount. |
As of December 31, 2009, the Company had received approximately $294.0 million of net cash proceeds from real estate assets sales and permitted dispositions subject to the above prepayment requirements.
Pension Contribution Deferral Obligations
We have entered into a Contribution Deferral Agreement, along with several amendments thereto, with 26 union multi-employer pension funds, which provide retirement benefits to certain of our union represented employees, whereby pension contributions originally due to the funds were converted to debt. At December 31, 2009, $153.0 million of deferred contributions were subject to the terms of the Contribution Deferral Agreement. In addition, we have deferred certain additional pension contributions of $10.7 million to certain of these pension funds and are working with the applicable funds to execute additional joinder agreements to formally add these amounts to the Contribution Deferral Agreement. At December 31, 2009, these amounts related to pension contributions earned and accrued for union employee hours worked prior to the cessation of contributions that the modification to the collective bargaining agreement provides. See “—Ratification of Collective Bargaining Agreement Modification” above. These amounts are classified as “Wages, vacations and employees’ benefits” in our consolidated balance sheet.
The deferred amounts bear interest at the applicable interest rate set forth in the trust documentation that governs each pension fund and range from 4% to 18% as of December 31, 2009.
37
Table of Contents
— Amortization and Interest Deferral
Outstanding deferred pension payments under the Contribution Deferral Agreement were originally required to be paid to the funds in one payment of $3.6 million in June 2009 with thirty-six equal monthly installments of the remainder payable on the 15th day of each calendar month commencing on January 15, 2010 (each a “CDA Amortization Payment”) and interest payments under the Contribution Deferral Agreement (each a “CDA Interest Payment”) were originally required to be made to the funds in arrears on the fifteenth day of each calendar month. However, all CDA Amortization Payments and CDA Interest Payments due from December 31, 2009 through the end of 2010 have been deferred until December 31, 2011; provided, that the CDA Amortization Payments and CDA Interest Payments will become due at the election of the majority of the pension funds on December 31, 2010 if 90% of the pension funds do not approve a continuation of the deferral of CDA Amortization Payments and CDA Interest Payments for calendar year 2011. In addition, all deferred interest and amortization payments will become payable at the election of the majority of the pension funds, and no new amounts may be deferred, upon the earliest to occur of:
| • | any Deferral Termination Event under the Credit Agreement; |
| • | certain events of default; and |
| • | the amendment, modification, supplementation or alteration of the Credit Agreement that imposes any mandatory prepayment, commitment reduction, additional interest or fee or any other incremental payment to the Lenders under the Credit Agreement not required as of the effective date of the CDA Amendment unless the pension funds receive a proportionate additional payment in respect of the deferred pension obligations at the time an additional payment to the lenders under the Credit Agreement is required pursuant to the terms of the amendment, modification, supplementation or alteration. Granting of consent by the lenders under the Credit Agreement to permit an asset sale does not by itself trigger the provision described in the prior sentence. |
— Liquidity Mandatory Prepayment
The Company is required to prepay obligations under the Contribution Deferral Agreement if Liquidity (as defined in the Contribution Deferral Agreement) is greater than $250 million after deducting any amount due under the Credit Agreement by virtue of the Credit Agreement liquidity mandatory prepayment (as described in the Credit Agreement Amendment section above); provided that such prepayment obligation does not arise unless and until the excess Liquidity amount is equal to or greater than $1 million at any time. Under the Contribution Deferral Agreement, the calculation of Liquidity (as defined in the Contribution Deferral Agreement) conforms to the definition of Liquidity in the Credit Agreement.
— Collateral
As part of the Contribution Deferral Agreement, in exchange for the deferral of the contribution obligations, we pledged identified real property to the pension funds so that the pension funds have a first priority security interest in certain of the identified real property and a second priority security interest in other identified real property located throughout the U.S. and Mexico. We are required to prepay the deferred obligations to the extent that we sell any of the first lien property pledged to the pension funds with the net proceeds from the sale. We have made payments of $18.3 million pursuant to such sales to reduce our obligations to the pension funds during the year ended December 31, 2009 leaving a balance of $153.0 million as of December 31, 2009.
Exchange Offers
On December 31, 2009, we completed exchange offers with certain holders of our outstanding debt securities (the “Exchange Offers”), whereby we exchanged 36.5 million shares of our common stock and 4.3 million shares of our Class A convertible preferred stock (957.2 million shares of common stock, on an as-if converted basis) for $470.2 million in aggregate principal amount of our notes and $5.2 million of accrued interest.
The outstanding note aggregate principal amounts before and after the December 31, 2009 exchange are as follows:
| (in millions) |
Principal amount outstanding before the exchange |
Principal amount exchanged |
Principal amount outstanding after the exchange | ||||||
| 8 1/2% USF senior notes |
$ | 150.0 | $ | 105.0 | $ | 45.0 | |||
| 5% contingent convertible notes |
236.8 | 216.8 | 20.0 | ||||||
| 3.375% contingent convertible notes |
150.0 | 148.4 | 1.6 | ||||||
| Total |
$ | 536.8 | $ | 470.2 | $ | 66.6 | |||
38
Table of Contents
On February 17, 2010, the Company’s stockholders at a special meeting approved the following:
| • | an amendment to the Company’s Certificate of Incorporation to reduce the par value of the Company’s common stock from $1.00 to $0.01 per share; and increase the number of authorized shares of the Company’s capital stock from 125 million shares to 2.05 billion shares of which five million shares are preferred stock, par value $1.00 per share, and two billion shares are common stock, par value $0.01 per share; and |
| • | an amendment to the Company’s Certificate of Incorporation to effect a reverse stock split of the Company’s common stock following the effectiveness of the par value reduction and the authorized share increase described above, at a ratio that will be determined by the Company’s board of directors and that will be within a range of one-to-five to one-for-25; and reduce the number of authorized shares of the Company’s common stock by the reverse split ratio; |
On February 17, 2010, the Company filed the amendment to its Certificate of Incorporation to increase its authorized common stock and change the par value of the stock. Effective with that amendment, 4,194,945 shares of the Class A preferred stock converted into 924,062,483 shares of common stock at a ratio of 220.28 shares of common stock for each share of Class A preferred stock, except to the extent such a conversion would cause the holder of Class A preferred stock to hold more than 9.9% of the common stock of the Company. As a result of this provision, 150,569 shares of preferred stock did not convert to common shares and thereby remain outstanding at February 28, 2010. All shares of Class A preferred stock outstanding on August 17, 2011 will automatically convert into common stock at the conversion ratio in effect on that date.
On March 3, 2010, the Company received a letter from the NASDAQ Stock Market that the Company’s common stock per share closing price was less than $1.00 for 30 consecutive trading days. To remain listed on the NASDAQ Stock Market the Company’s common stock must close above a per share price of $1.00 for at least 10 consecutive trading days during a 180-day grace period ending August 30, 2010. Utilizing the shareholder approval of the reverse stock split described above, the Company expects to effect a reverse stock split to attempt compliance with the NASDAQ minimum bid price rule within the 180-day grace period that the NASDAQ Stock Market permits. However, pursuant to the Note Purchase Agreement (defined below); the Company has agreed not to implement the reverse stock split prior to April 24, 2010.
Convertible Note Placement Transaction
On February 11, 2010, the Company entered into a Note Purchase Agreement (the “Note Purchase Agreement”) with certain investors pursuant to which the investors agreed to purchase from the Company $70.0 million in aggregate principal amount of the Company’s 6% Senior Convertible Notes due 2014 (the “6% Notes”) in a private placement. The purchase and sale of the 6% Notes were structured to occur in two closings. Pursuant to the Note Purchase Agreement, we sold $49.8 million of the 6% Notes to the investors in the first closing on February 23, 2010 and are obligated to sell an additional $20.2 million of 6% Notes to the investors in the second closing, assuming the closing conditions in the Note Purchase Agreement are met.
— Escrow Agreement
In connection with the sale of the 6% Notes, the Company entered into an Escrow Agreement (the “Escrow Agreement”) dated February 23, 2010, with the investors and U.S. Bank National Association, as escrow agent (the “Escrow Agent”). On February 23, 2010, the investors deposited an aggregate amount of $70 million in cash in an escrow account, which represents the aggregate purchase price for all of the 6% Notes contemplated to be sold by the Company to the investors pursuant to the Note Purchase Agreement.
At the first closing of the sale of the 6% Notes on February 23, 2010, the Escrow Agent disbursed funds from the escrow account in an amount sufficient to satisfy and discharge the Company’s outstanding 8 1/2% USF senior notes that were not previously exchanged in the Exchange Offers. See “—Exchange Offers” above.
As part of the Exchange Offers, a majority of the holders of the Company’s 5.0% Net Share Settled Contingent Convertible Senior Notes due 2023 (the “5% Notes”) consented to amend the terms of the indenture governing the 5% Notes (the “5% Indenture”) to remove the right of the 5% Note holders to put their 5% Notes to the Company for repurchase in August 2010. The trustee under the 5% Indenture disputed the ability of the Company to amend the 5% Indenture to remove the put right based on the trustee’s view that more than a majority in interest of the 5% Note holders were required to so amend the 5% Indenture. The Company vigorously disagrees with the trustee’s position, and the Company has subsequently brought a lawsuit against the trustee to cause the trustee to effect the amendment.
If the Company is unsuccessful in its litigation to amend the 5% Indenture to remove the put right, the Company will use the proceeds from the second closing of the sale of the 6% Notes to repurchase any of its 5.0% Notes that the Company is required to repurchase pursuant to exercises of put rights by the holders of the 5% Notes. To the extent that the Company prevails in court or through settlement in amending the 5% Indenture to eliminate the put rights, the Company will use the proceeds of the second closing of the 6% Notes for general corporate purposes.
39
Table of Contents
— Terms of the 6% Notes
The 6% Notes bear interest at a rate of 6.0% per annum. The Company must pay interest on the 6% Notes semi-annually commencing on or prior to the six month anniversary of the first closing. The Company must pay interest on the 6% Notes in cash; provided that the Company is permitted to pay interest on the 6% Notes through the issuance of additional shares of its common stock if:
| • | the Company is not permitted to pay cash interest pursuant to the terms of any of its existing senior financing facilities or |
| • | the Company determines that it lacks sufficient funds to necessary to pay cash interest. |
The Company’s Credit Agreement prohibits the Company from paying cash interest on the Notes during the period the lenders are deferring interest and fee payments. Therefore, during 2010, and potentially beyond 2010 depending on certain conditions under the Credit Agreement, the Company anticipates paying interest through the issuance of additional shares of the Company’s common stock.
The 6% Notes will mature on February 15, 2014. The Company may not redeem the 6% Notes prior to the stated maturity. Holders may require the Company to repurchase all or a portion of their 6% Notes upon a fundamental change, such as a change in control or sale of all or substantially all of the Company’s assets, as further defined in the indenture governing the 6% Notes (the “6% Indenture”), at 100% of the principal amount of the 6% Notes, plus accrued and unpaid interest, and liquidated damages, if any, to the date of repurchase, payable in cash.
A registration rights agreement, entered into on February 11, 2010 between the Company and the investors, requires the Company to register the 6% Notes and the common stock issuable on account of the 6% Notes with the SEC for public resale. The Company filed an initial registration statement on Form S-3 with the SEC on February 12, 2010. The registration statement must be declared effective by the SEC on or before April 30, 2010 (or earlier depending on certain conditions set forth in the registration rights agreement), or the Company must pay liquidated damages to the holders of the 6% Notes.
The 6% Notes are convertible, at the note holder’s option, prior to the maturity date into shares of the Company’s common stock. The 6% Notes are initially convertible at a conversion price of $0.43 per share, which is equal to a conversion rate of approximately 2,326 shares per $1,000 principal amount of 6% Notes, subject to certain adjustments. The 6% Notes provide for caps within the second anniversary of the first closing such that a holder and its affiliates is not entitled to convert its 6% Notes to the extent that the holder and its affiliates would hold greater than 4.9% of the then outstanding common stock after such conversion, unless timely waived by the holder. The 6% Notes also provide a cap through stated maturity such that any holder and its affiliates is not entitled to convert its notes to the extent that the holder and its affiliates would own greater than 9.9% of the voting power of Company’s stock. Assuming that all of the outstanding aggregate principal amount of $49.8 million of 6% Notes had been converted at the note holders’ option as of February 28, 2010, an aggregate of 147,091,849 shares of our common stock would have been issued as a result of such conversion, including the make whole premium described below. As of the date of this report, no shares of common stock have been issued on account of the 6% Notes.
Beginning on February 23, 2012, the Company may convert the 6% Notes pursuant to a mandatory conversion into shares of its common stock if the market price of the Company’s common stock meets certain thresholds.
Noteholders who convert their 6% Notes at their option or whose 6% Notes are converted in a mandatory conversion at the Company’s option will also receive a make whole premium paid in shares of the Company’s common stock. The make whole premium will be payable in additional shares of common stock and will be calculated based on the remaining interest payments on the 6% Notes that would have been received through the original scheduled maturity date of the 6% Notes.
The 6% Notes are the Company’s senior unsecured obligations and rank equally with all of its other senior unsecured indebtedness and senior to any of its subordinated indebtedness outstanding or incurred in the future. The 6% Notes are guaranteed by certain of the Company’s current domestic operating subsidiaries and any additional domestic subsidiaries that are required to become a guarantor under the terms of the 6% Indenture. The 6% Notes will be effectively subordinated to any of the Company’s or its guarantor subsidiaries’ secured debt, including its senior secured bank financing and any indebtedness of any of its non-guarantor subsidiaries.
The 6% Indenture provides that the maximum number of shares of the Company’s common stock that can be issued in respect of the 6% Notes upon conversion or with respect to the payment of interest or in connection with the make whole premium or otherwise shall be limited to 201,880,000 shares of common stock for $70 million in aggregate principal amount of the 6% Notes as of
40
Table of Contents
February 23, 2010, subject to certain adjustments. If the limit is reached, no holder is entitled to any other consideration on account of shares not issued. This limitation terminates if the holders of the Company’s common stock approve the termination of this limitation.
EXISTING LIQUIDITY POSITION
The following table provides details of the outstanding components and unused available (deficit) capacity under the Credit Agreement and ABS Facility at December 31, 2009 and 2008 after giving consideration to the amendments discussed above:
| (in millions) |
2009 | 2008 | ||||||
| Capacity: |
||||||||
| Revolving loan |
$ | 950.0 | $ | 950.0 | ||||
| ABS Facility |
400.0 | 500.0 | ||||||
| Total maximum capacity |
1,350.0 | 1,450.0 | ||||||
| Amounts outstanding: |
||||||||
| Revolving loan |
(329.1 | ) | (515.0 | ) | ||||
| Letters of credit (12/31/09: $ 461.1 revolver; $77.2 ABS Facility) |
(538.3 | ) | (460.5 | ) | ||||
| ABS Facility borrowings |
(146.3 | ) | (147.0 | ) | ||||
| ABS usage for captive insurance company (see below) |
— | (221.0 | ) | |||||
| Total outstanding |
(1,013.7 | ) | (1,343.5 | ) | ||||
| ABS limitations |
(178.2 | ) | (64.6 | ) | ||||
| Revolver reserve |
(159.8 | ) | — | |||||
| Total restricted capacity |
(338.0 | ) | (64.6 | ) | ||||
| Unrestricted unused capacity (deficit) (12/31/09: $- revolver; $(1.7) ABS Facility) |
$ | (1.7 | ) | $ | 41.9 | |||
As we sold certain assets, we used the net cash proceeds to pay down the outstanding revolving loan balance. The Credit Agreement provides that we increase the revolver reserves with a certain accumulated portion of those proceeds, which amount reduces our availability under the revolver by the same portion of those proceeds unless certain conditions to access and use revolver reserves for our liquidity needs are satisfied. As a result of this provision, the available capacity of our revolver was reduced by $159.8 million at December 31, 2009. There was no similar amount at December 31, 2008. After considering the revolver reserve amount of $159.8 million and outstanding usage, there was no unused available capacity under the revolving loan at December 31, 2009. We were in an overdrawn position of $1.7 million with respect to our ABS Facility at December 31, 2009. We remitted the necessary funds January 4, 2010, to remain in compliance with our ABS Facility.
The ABS Facility provides capacity of up to $400 million based on qualifying accounts receivable of the Company and certain other provisions. However, at December 31, 2009, such provisions supported available capacity under the ABS Facility of $221.8 million. Considering this limitation and outstanding usage, there was no unused available capacity under the ABS Facility at December 31, 2009.
YRC Assurance Co. Ltd. (“YRC Assurance”) was the Company’s captive insurance company domiciled in Bermuda and a wholly owned and consolidated subsidiary of YRC Worldwide. YRC Assurance insured certain of our subsidiaries for certain of their respective self-insured obligations for workers’ compensation liabilities. Certain qualifying investments were made by YRC Assurance as required by Bermuda regulations. These investments included purchasing a position in the underlying receivables supporting our ABS Facility. As a result, as shown in the table above, our capacity under the ABS Facility was reduced by YRC Assurance’s investment in receivables of $221.0 million at December 31, 2008. Our Credit Agreement required us to cease the participation of YRC Assurance in the ABS Facility. We have complied with this requirement, and YRC Assurance was dissolved. As a result of these transactions, the operating companies who received insurance from YRC Assurance are now directly self-insured for their workers’ compensation liabilities.
RISKS AND UNCERTAINTIES REGARDING FUTURE LIQUIDITY
In light of our recent operating results, we have satisfied our short term liquidity needs through a combination of borrowings under our credit facilities and, to a more significant degree, retained proceeds from asset sales and sale/leaseback financing transactions. In an effort to further manage liquidity, we have also instituted the deferral of pension plan payments and certain interest and fees. As our operating results improve, we expect that cash generated from operations will reduce our need to continue to rely upon these
41
Table of Contents
sources of liquidity to meet our short term funding requirements. The wage reduction and temporary pension contribution cessation has also improved our liquidity position; however, the temporary pension contribution cessation ends at the end of 2010. To continue to have sufficient liquidity to meet our cash flow requirements during 2010:
| • | our operating results must continue to stabilize or recover quarter-over-quarter and shipping volumes must continue to stabilize or recover quarter-over-quarter; |
| • | we must continue to have access to our credit facilities; |
| • | we must continue to defer at least through 2010 payment of: |
| • | interest and fees to our lenders under the Credit Agreement |
| • | interest and facility fees to purchasers of our accounts receivable pursuant to the ABS Facility |
| • | interest and principal to our pension funds pursuant to the Contribution Deferral Agreement; |
| • | our wage reductions and temporary cessation of pension contributions must continue; |
| • | we must complete the sale/leaseback and real estate sale transactions currently under contract as anticipated; and |
| • | we must continue to implement and realize substantial cost savings measures to match our costs with business levels and to continue to become more efficient. |
We expect our business to experience its usual seasonal low point in of the first quarter of 2010. This low point was further impacted in January and February 2010 by severe and widespread bad weather in North America. As our business reaches this seasonal low point, we will need continued access to the additional liquidity that our Credit Agreement and ABS Facility provide as well as continued progress in a combination of increasing our shipment volumes, maintaining or increasing our yield and successfully implementing cost reductions in order for us to have sufficient liquidity to fund our operations.
During December 2009, some of our customers were concerned that we would not complete the Exchange Offers as we extended the Exchange Offers multiple times to increase note holder participation to levels that would satisfy our lenders. These customers diverted much of their business to other providers because of these concerns. On December 31, 2009, we completed the Exchange Offers. After completion of the Exchange Offers, $66.6 million principal amount of 8 1/2% USF senior notes and contingent convertible notes remained outstanding. In February 2010, we entered into the Note Purchase Agreement to address these outstanding note maturities. During January and February 2010, we experienced a return of some of our customers’ business as their concerns with our ability to complete the Exchange Offers and address the outstanding note maturities were alleviated. We expect further return of customer business but there can be no assurance that our expectations will be realized.
In January and February, returning customer volume was offset by a reduction in volumes due to particularly bad winter weather, especially in locations in the United States that do not usually experience winter weather conditions to the degree that were experienced in this winter season. During days that most of the United States was clear of this weather, we have experienced returning customer shipments from some of our customers who had been concerned about our financial condition prior to the completion of the Exchange Offers and the Note Purchase Agreement.
With lower business volumes from customer diversion and weather, our accounts receivables levels were reduced. This, in turn, reduces the amount of qualified receivables that we can finance through our ABS Facility during the first quarter of 2010. We expect business volumes to increase from their lows in usual seasonal patterns as we enter Spring 2010 and as more customers return to shipping with us. Assuming our expectations are met, we will incur additional expense to service this increased business prior to having the financing under our ABS Facility that the qualified accounts receivable from this business will provide us.
The accompanying financial statements have been prepared assuming that the Company will continue as a going concern. The uncertainty regarding the Company’s ability to generate sufficient cash flows and liquidity to fund operations raises substantial doubt about the Company’s ability to continue as a going concern (which contemplates the realization of assets and discharge of liabilities in the normal course of business for the foreseeable future). These financial statements do not include any adjustments that might result from the outcome of this uncertainty. If we are unable to fund our operations through operating cash flows, existing credit facilities, sales of non-strategic assets and business lines and other capital market transactions, we would consider in court and out of court restructuring alternatives.
We expect to continue to monitor our liquidity carefully, work to reduce this uncertainty and address our cash needs through a combination of one or more of the following actions:
| • | in February 2010, we received a refund of $82.4 million from the Internal Revenue Service for federal income tax credits from recent tax carryback legislation; |
| • | we continue to, and expect to implement further cost actions and efficiency improvements; |
| • | we will continue to aggressively seek additional and return business from customers; |
42
Table of Contents
| • | we are aggressively pursuing the Company’s litigation against the trustee under the 5% Indenture. If the Company is successful in its litigation and meets the closing conditions under the Note Purchase Agreement and Escrow Agreement to sell and issue additional 6% Notes, the Company can utilize the remaining $20.2 million of proceeds in the escrow account with its Escrow Agent for general corporate purposes; |
| • | if appropriate, we may sell additional equity or pursue other capital market transactions; |
| • | we may consider selling non-strategic assets or business lines; and |
| • | we expect to carefully manage receipts and disbursements, including amounts and timing, focusing on reducing days sales outstanding and managing days payables outstanding. |
Forward-Looking Statements in “Liquidity”
Our beliefs regarding liquidity sufficiency are forward-looking statements within the meaning of Section 27A of the Securities Act of 1933, as amended, and Section 21 of the Securities Exchange Act of 1934, as amended. Forward-looking statements are indicated by words such as “expected”, “will” and other similar words.
Contingent Convertible Notes
The balance sheet classification of our contingent convertible notes between short-term and long-term is dependent upon certain conversion triggers, as defined in the applicable indenture. The contingent convertible notes include a provision whereby the note holder can require immediate conversion of the notes if, among other reasons, the credit rating on the contingent convertible notes assigned by Moody’s is lower than B2 or if the credit rating assigned by S&P is lower than B. At December 31, 2009 and 2008, the conversion trigger was met, and accordingly, the contingent convertible notes have been classified as a short-term liability in the accompanying consolidated balance sheets. Based upon this particular conversion right and based upon an assumed market price of our stock of $0.50 per share, which approximates the current market price, our aggregate obligation for full satisfaction of the $21.7 million par value of contingent convertible notes would require cash payments of $0.3 million. Our Credit Agreement will not allow us to pay more than $1 million in cash payments with respect to the conversion of these notes unless 66 2/3% of the lenders approve the excess payments.
Cash Flow Measurements
We use free cash flow as a measurement to determine the cash flow available to fund strategic capital allocation alternatives and nondiscretionary expenditures including debt service requirements. Free cash flow indicates cash available to fund additional capital expenditures, to reduce outstanding debt (including current maturities), or to invest in our growth strategies. This measurement is used for internal management purposes and should not be construed as a better measurement than net cash from operating activities as defined by generally accepted accounting principles.
The following table illustrates our calculation for determining free cash flow for the years ended December 31:
| (in millions) |
2009 | 2008 | 2007 | |||||||||
| Net cash (used in) provided by operating activities |
$ | (378.3 | ) | $ | 219.8 | $ | 392.6 | |||||
| Net property and equipment (additions) proceeds |
95.8 | (34.7 | ) | (338.4 | ) | |||||||
| Proceeds from disposition of a business line |
31.9 | — | — | |||||||||
| Investment in affiliate |
— | (46.1 | ) | (1.6 | ) | |||||||
| Proceeds from stock options |
— | 0.1 | 6.5 | |||||||||
| Free cash flow |
$ | (250.6 | ) | $ | 139.1 | $ | 59.1 | |||||
Operating cash flows deteriorated during the year ended December 31, 2009, and were impacted by the reduction of general business volumes in 2009 with dramatically lower revenue and an even larger reduction in operating income. The 2009 operating cash activities also include approximately $171.4 million of pension expense charges that have been converted to long-term debt. Absent this conversion, 2009 cash used by operating activities would have been increased by this same amount.
Operating cash flows decreased $172.8 million during the year ended December 31, 2008, versus the same period in 2007. Cash from operations was impacted by the reduction of general business volumes in 2008 with lower revenue and an even larger reduction in operating income. Lower business volumes contributed to a reduction in accounts receivable from 2007 to 2008 of $236.9 million. Non-union pension contributions in 2008 were $4.0 million versus contributions of $134.3 million in 2007.
43
Table of Contents
In 2009, net property and equipment additions decreased by $130.5 million compared to 2008. Gross property and equipment additions for 2009 were $37.3 million versus $162.3 million for 2008 with the decrease primarily due to a strategic decision to reduce overall capital expenditures due in part to the National Transportation integration. Revenue equipment purchases of $17.0 million were down in 2009 from 2008 due to increased leasing of $18.9 million of revenue equipment. Proceeds on land and structure sales in 2009 were $102.9 million versus $110.8 million in 2008 as we sold excess properties resulting primarily from our network integration efforts. See a more detailed discussion of 2009 and 2008 activity below in “Capital Expenditures”.
In 2008, net property and equipment additions decreased by $303.7 million compared to 2007. Gross property and equipment additions for 2008 were $162.3 million versus $393.8 million for 2007 with the decrease primarily due to a strategic decision to reduce overall capital expenditures due in part to the National Transportation integration. Revenue equipment purchases of $85.5 million were down in 2008 from 2007 due to increased leasing of $87.1 million of revenue equipment. Proceeds on land sales in 2008 were $110.8 million versus $47.7 million in 2007 as we sold excess properties resulting primarily from our network integration efforts. See a more detailed discussion of 2008 and 2007 activity below in “Capital Expenditures”.
Other than the property and equipment activity discussed above, investing activities in 2008 also includes $46.1 million used to purchase a 65% equity interest in Shanghai Jiayu Logistics Co., Ltd. while 2007 includes transaction costs associated with the acquisition of Jiayu and other immaterial investments.
Net cash provided by financing activities for 2009 was $16.7 million versus cash provided by financing activities of $134.2 million for 2008. The 2009 activity is a result of an $83.5 million increase in debt due to the addition of our lease financing obligations and pension deferral obligations, offset by $60.8 million of debt issuance costs related to the modification of our Credit Agreement and $6.0 million of equity issuance costs related to the debt-for-equity exchange we completed in December 2009. The 2008 activity is a result of a $145.6 million increase in debt, offset by $11.4 million of debt issuance costs related to the modification and expansion of our Credit Agreement. The 2007 activity is a result of $35.0 million of common stock repurchases, $39.9 million of net debt reduction and $1.3 million of debt issuance costs offset by stock option proceeds of $6.5 million.
Capital Expenditures
Our capital expenditures focus primarily on revenue equipment replacement, land and structures, investments in information technology and acquisitions. As reflected on our consolidated balance sheets, our business is capital intensive with significant investments in service center facilities and a fleet of tractors and trailers. We determine the amount and timing of capital expenditures based on numerous factors, including anticipated growth, economic conditions, new or expanded services, regulatory actions and availability of financing.
The table below summarizes our actual net capital expenditures (proceeds) by type and investments for the years ended December 31:
| (in millions) |
2009 | 2008 | 2007 | ||||||||
| Revenue equipment |
$ | (8.6 | ) | $ | 68.5 | $ | 261.4 | ||||
| Land, structures and technology |
(87.2 | ) | (33.8 | ) | 77.0 | ||||||
| Total net capital expenditures |
(95.8 | ) | 34.7 | 338.4 | |||||||
| Acquisition of companies and affiliates |
— | 46.1 | 1.6 | ||||||||
| Disposition of a business line |
(31.9 | ) | — | — | |||||||
| Total |
$ | (127.7 | ) | $ | 80.8 | $ | 340.0 | ||||
As a result of the March 2009 National Transportation integration, we were able to dispose of a sizeable portion of our older revenue equipment units and generated net proceeds of $8.6 million. This amount includes $16.9 million of capital expenditures for necessary replacement equipment. In 2008, we elected to lease new revenue equipment under $87.1 million of operating leases. Proceeds on land sales, primarily excess properties, in 2009 were $102.9 million versus $110.8 million in 2008 and $47.7 million in 2007. Our 2009 technology expenditures decreased $31.9 million versus 2008 as we changed our information technology efforts from building new tools to data migration related to the National Transportation integration, the costs of which cannot be capitalized. We expect 2010 net capital spending to approximate $50 to $100 million inclusive of any additional operating leases we might enter. Our ability to fund capital expenditures will depend on the achievement of operating cash flows, availability of existing credit facilities, sales of non-strategic assets and business lines and other capital market transactions. See “Liquidity – Risks and Uncertainties Regarding Liquidity”.
44
Table of Contents
Our expectation regarding our ability to fund capital expenditures out of existing financing facilities and cash flow is only our forecast regarding this matter. This forecast may be substantially different from actual results. In addition to the factors previously described in “Liquidity – Risks and Uncertainties Regarding Liquidity”, the introduction to “Part I” and the risk factors listed in “Item 1A” of this report, the following factors could affect levels of capital expenditures: the accuracy of our estimates regarding our spending requirements; the occurrence of any unanticipated acquisition opportunities; changes in our strategic direction; the need to spend additional capital on cost reduction opportunities; the need to replace any unanticipated losses in capital assets and our ability to dispose of excess real estate at our anticipated sales price.
Non-union Pension Obligations
We provide defined benefit pension plans for certain employees not covered by collective bargaining agreements. The two largest plans are the qualified plans for Yellow Transportation and Roadway (which were merged to form YRC). The Yellow Transportation and Roadway qualified plans cover approximately 14,000 employees including those currently receiving benefits and those who have left the company with deferred benefits. On January 1, 2004, the existing qualified benefit plans were closed to new participants. On July 1, 2008, benefits for all participants were frozen.
Although the benefits have been frozen, we expect pension funding to remain an area of management focus over the next several years. The Pension Protection Act of 2006 encouraged companies to fully fund their benefit obligation. However, the recent significant market declines have impacted our ability to aggressively fund these plans. The Worker, Retiree and Employer Recovery Act of 2008 has provided modest relief from the market events in 2008 by decreasing short term contribution requirements. We intend to make the required minimum contributions specified by the legislation. Given the dependence on the economy and the significant amounts involved, pension funding could have a material impact on our liquidity. Using our current plan assumptions, which include an assumed 8.25% return on assets and a discount rate of 6.15%, we either recorded or expect to record the following for all YRC sponsored pension plans.
| (in millions) |
Cash Funding |
Pension Expense |
Under Funded Status at December 31 | ||||||
| 2009 Actual |
$ | 3.3 | $ | 13.6 | $ | 339.6 | |||
| 2010 Expected |
14.0 | 15.6 | 338.2 | ||||||
| 2011 Expected |
82.1 | 14.7 | 264.7 | ||||||
| 2012 Expected |
72.5 | 11.4 | 195.3 | ||||||
| 2013 Expected |
69.4 | 9.1 | 123.4 | ||||||
| 2014 Expected |
60.3 | 2.9 | 55.5 | ||||||
We have projected these costs assuming no changes to current assumptions other than asset returns. For purposes of projecting cash contributions, we have projected asset returns using an assumption of 8.25% per year. If actual asset returns fall short of the 8.25% assumption by 1% per year, total cash funding would be $11.2 million higher over the next five years. In addition, if interest rates decrease 100 basis points from January 1, 2010 levels, total cash funding would be $91.5 million higher over the next five years.
The above discussion includes forward-looking statements as indicated by “expect” and “estimate” and the actual results may be materially different. Factors that affect these results include actual return on plan assets and discount rate changes among others.
Contractual Obligations and Other Commercial Commitments
The following tables provide aggregated information regarding our contractual obligations and commercial commitments as of December 31, 2009. Most of these obligations and commitments have been discussed in detail either in the preceding paragraphs or the notes to the financial statements. The tables do not include expected pension funding as disclosed separately in the previous section.
45
Table of Contents
Contractual Cash Obligations
| Payments Due by Period | ||||||||||||||||
| (in millions) |
Less than 1 year |
2-3 years |
4-5 years |
After 5 years |
Total | |||||||||||
| Balance sheet obligations:(a) |
||||||||||||||||
| ABS borrowings |
$ | 146.3 | $ | — | $ | — | $ | — | $ | 146.3 | ||||||
| Long-term debt including interest(b) |
74.2 | (c) | 563.4 | — | — | 637.6 | ||||||||||
| Lease financing obligations |
38.4 | 79.6 | 83.1 | 212.1 | 413.2 | |||||||||||
| Pension deferral obligations |
— | 169.8 | — | — | 169.8 | |||||||||||
| Workers’ compensation and other claims obligations |
155.6 | 180.4 | 85.7 | 141.4 | 563.1 | |||||||||||
| Off balance sheet obligations: |
||||||||||||||||
| Operating leases |
86.2 | 92.4 | 30.0 | 25.5 | 234.1 | |||||||||||
| Capital expenditures |
6.3 | — | — | — | 6.3 | |||||||||||
| Total contractual obligations |
$ | 507.0 | $ | 1,085.6 | $ | 198.8 | $ | 379.0 | $ | 2,170.4 | ||||||
| (a) | Total liabilities for unrecognized tax benefits as of December 31, 2009, were $84.8 million and are classified on the Company’s consolidated balance sheet within “Other Current and Accrued Liabilities”. |
| (b) | Long-term debt maturities are reflected by contractual maturity for all obligations other than the contingent convertible senior notes. These notes are instead presented based on the earliest possible redemption date defined as the first date on which the note holders have the option to require us to purchase their notes at par. At December 31, 2009, these notes are convertible for cash payments of approximately $0.3 million based on an assumed market price of $0.50 per share for our common stock. Should the note holders elect to exercise the conversion options, cash payments of $0.3 million would be less than those presented in the table above. See the discussion in Liquidity of this noteholder put right. |
| (c) | The USF Senior Notes have been included in the less than one year column for long-term debt as we are contractual obligated to redeem these notes in 2010; however, as of December 31, 2009 these notes have been classified as long-term debt in the accompanying balance sheet because these notes were satisfied and discharged in February 2010 with the proceeds from the 6% Notes. |
During the year ended December 31, 2009, we entered into new operating leases for revenue equipment of approximately $18.9 million. We expect in the ordinary course of business that our operating leases will be renewed or replaced as they expire. The leases generally provide for fixed and escalating rentals and contingent escalating rentals based on the Consumer Price Index not to exceed certain specified amounts. We record rent expense for our operating leases on a straight-line basis over the base term of the lease agreements. In many cases our subsidiaries enter into leases and a parent guarantee is issued. The maximum amount of undiscounted future payments under the guarantee are the same as the contractual cash obligations disclosed above.
Other Commercial Commitments
The following table reflects other commercial commitments or potential cash outflows that may result from a contingent event, such as a need to borrow short-term funds due to insufficient free cash flow.
| Amount of Commitment Expiration Per Period |
||||||||||||||||
| (in millions) |
Less than 1 year |
2-3 years |
4-5 years |
After 5 years |
Total | |||||||||||
| Unused line of credit |
$ | (1.7 | ) | $ | 159.8 | $ | — | $ | — | $ | 158.1 | |||||
| Letters of credit |
538.3 | — | — | — | 538.3 | |||||||||||
| Surety bonds |
163.6 | 0.1 | — | — | 163.7 | |||||||||||
| Total commercial commitments |
$ | 700.2 | $ | 159.9 | $ | — | $ | — | $ | 860.1 | ||||||
46
Table of Contents
Critical Accounting Policies
Preparation of our financial statements requires accounting policies that involve significant estimates and judgments regarding the amounts included in the financial statements and disclosed in the accompanying notes to the financial statements. We continually review the appropriateness of our accounting policies and the accuracy of our estimates including discussion with the Audit/Ethics Committee of our Board of Directors who make recommendations to management regarding these policies. Even with a thorough process, estimates must be adjusted based on changing circumstances and new information. Management has identified the policies described below as requiring significant judgment and having a potential material impact to our financial statements.
Revenue Reserves
We consider our policies regarding revenue-related reserves as critical based on their significance in evaluating our financial performance by management and investors. We have an extensive system that allows us to accurately capture, record and control all relevant information necessary to effectively manage our revenue reserves.
For shipments in transit, National Transportation, Regional Transportation and Truckload record revenue based on the percentage of service completed as of the period end and accrue delivery costs as incurred. In addition, National Transportation, Regional Transportation and Truckload recognize revenue on a gross basis because the entities are the primary obligors even when they use other transportation service providers who act on their behalf. National Transportation, Regional Transportation and Truckload remain responsible to their customers for complete and proper shipment, including the risk of physical loss or damage of the goods and cargo claims issues. YRC Logistics recognizes revenue upon the completion of services. In certain logistics transactions where YRC Logistics acts as an agent, revenue is recorded on a net basis. Net revenue represents revenue charged to customers less third-party transportation costs. Where YRC Logistics acts as principal, it records revenue from these transactions on a gross basis, without deducting transportation costs. Management believes these policies most accurately reflect revenue as earned. Our revenue-related reserves involve three primary estimates: shipments in transit, rerate reserves and uncollectible accounts.
Shipments in Transit
We assign pricing to bills of lading at the time of shipment based primarily on the weight, general classification of the product, the shipping destination and individual customer discounts. This process is referred to as rating. At the end of each period, we estimate the amount of revenue earned on shipments in transit based on actual shipments picked up and scheduled delivery dates. We calculate a percentage of completion using this data and the day of the week on which the period ends. Management believes this provides a reasonable estimation of the revenue actually earned.
Rerate Reserves
At various points throughout our customer invoicing process, incorrect ratings (ie. prices) could be identified based on many factors, including weight verifications or updated customer discounts. Although the majority of rerating occurs in the same month as the original rating, a portion occurs during the following periods. We accrue a reserve for rerating based on historical trends. At December 31, 2009 and 2008, our financial statements included a rerate reserve of $27.9 million and $24.3 million, respectively. The increase in the rerate reserve from 2008 to 2009 was primarily due to the higher than normal revenue adjustment experience resulting from the 2009 YRC network change and related impact on the billing process.
Uncollectible Accounts
We record an allowance for doubtful accounts primarily based on historical uncollectible amounts. We also take into account known factors surrounding specific customers and overall collection trends. Our process involves performing ongoing credit evaluations of customers, including the market in which they operate and the overall economic conditions. We continually review historical trends and make adjustments to the allowance for doubtful accounts as appropriate. Our allowance for doubtful accounts totaled $36.1 million and $32.0 million as of December 31, 2009 and 2008, respectively, and reflects additional provision in 2009 due to increased bankruptcy and credit risk activity in our customer base.
Claims and Self-Insurance
We are self-insured up to certain limits for workers’ compensation, cargo loss and damage, property damage and liability claims. We measure the liabilities associated with workers’ compensation and property damage and liability claims primarily through actuarial methods that an independent third party performs. Actuarial methods include estimates for the undiscounted liability for claims reported, for claims incurred but not reported and for certain future administrative costs. These estimates are based on historical loss experience and judgments about the present and expected levels of costs per claim and the time required to settle claims. The effect
47
Table of Contents
of future inflation for costs is considered in the actuarial analyses. Actual claims may vary from these estimates due to a number of factors, including but not limited to, accident frequency and severity, claims management, changes in healthcare costs and overall economic conditions. We discount the actuarial calculations of claims liabilities for each calendar year to present value based on the average U.S. Treasury rate, during the calendar year of occurrence, for maturities that match the initial expected payout of the liabilities. As of December 31, 2009 and 2008, we had $536.8 million and $495.7 million accrued for claims and insurance, respectively. The increased reserve in 2009 is due to poor experience in both current year and prior year workers’ compensation claims.
Pension
Effective July 1, 2008, YRC Worldwide froze its qualified and nonqualified defined benefit pension plans for all participating employees not covered by collective bargaining agreements. Given the frozen status of the plans, the key estimates in determining pension cost are return on plan assets and discount rate, each of which are discussed below.
Return on Plan Assets
The assumption for expected return on plan assets represents a long-term assumption of our portfolio performance that can impact our pension expense. With $644 million of plan assets for the YRC Worldwide funded pension plans, a 50-basis-point decrease in the assumption for expected rate of return on assets would increase annual pension expense by approximately $3.1 million and would have no effect on the underfunded pension liability reflected on the balance sheet.
We believe our 2010 expected rate of return of 8.25% is appropriate based on our investment portfolio as well as a review of other objective indices. Although plan investments are subject to short-term market volatility, we believe they are well diversified and closely managed. Our asset allocation as of December 31, 2009 consisted of 61% equities, 32% in debt securities, and 7% in other investments. This allocation is consistent with the long-term target asset allocation for the plans. We will continue to review our expected long-term rate of return on an annual basis and revise appropriately. Refer to our discussion of “Nonunion Pension Obligations” under the “Financial Condition” section for details of actual and anticipated pension charges.
Discount Rate
The discount rate refers to the interest rate used to discount the estimated future benefit payments to their present value, also referred to as the benefit obligation. The discount rate allows us to estimate what it would cost to settle the pension obligations as of the measurement date, December 31, and impacts the following year’s pension cost. We determine the discount rate by choosing a portfolio of high quality (those rated AA- or higher by Standard & Poors) non-callable bonds such that the coupons and maturities approximate our expected benefit payments. When developing the bond portfolio, there are some years when benefit payments are expected with no corresponding bond maturing. In these instances, we estimated the appropriate bond using the characteristics of similar duration bonds. This analysis is traditionally reperformed on a biannual basis (most recent as of December 31, 2009) or more frequently when specific events require a current analysis. For the years that we do not prepare a bond matching analysis, we utilize a spread against a specific index, the Citigroup Pension Liability Index, which is consistent with the actual spread observed in the year the analysis is performed.
Although the discount rate used requires little judgment, changes in the discount rate can significantly impact our pension cost. For example, a 50-basis-point decrease in our discount rate would increase annual pension expense by approximately $0.7 million and increase our underfunded pension liability reflected in shareholders’ equity by approximately $61.4 million, net of tax, assuming all other factors remain constant. Changes in the discount rate do not have a direct impact on cash funding requirements. The discount rate can fluctuate considerably over periods depending on overall economic conditions that impact long-term corporate bond yields. At December 31, 2009 and 2008, we used a discount rate to determine benefit obligations of 6.15% and 6.52%, respectively.
Gains and Losses
Gains and losses occur due to changes in the amount of either the projected benefit obligation or plan assets from experience different than assumed and from changes in assumptions. We recognize an amortization of the net gain or loss as a component of net pension cost for a year if, as of the beginning of the year, that net gain or loss exceeds ten percent of the greater of the benefit obligation or the market-related value of plan assets. If an amortization is required, it equals the amount of net gain or loss that exceeds the ten percent corridor, amortized over the average remaining life expectancy of plan participants.
As of year end 2009, the pension plans have net losses of $257.0 million and a projected benefit obligation of $983.1 million. The average remaining life expectancy of plan participants is approximately 29 years. For 2010, we expect to amortize approximately $5.3 million of the net loss. The comparable amortization amounts for 2009 and 2008 were $3.9 million and $1.0 million, respectively.
48
Table of Contents
Multi-Employer Pension Plans
YRC, New Penn, Holland and Reddaway contribute to approximately 37 separate multi-employer pension plans for employees that our collective bargaining agreements cover (approximately 70% of total YRC Worldwide employees). The pension plans provide defined benefits to retired participants.
We do not directly manage multi-employer plans. Trustees, half of whom the International Brotherhood of Teamsters (the “Teamsters”) appoints and half of whom various contributing employers appoint, manage the trusts covering these plans.
Our labor agreements with the Teamsters determine the amounts of our contributions to these plans. We recognize as net pension cost the contractually required contribution for the period and recognize as a liability any contributions due and unpaid.
From January to August 2009, we have deferred payment of certain of our contributions to multi-employer pension funds. These deferred payments have been expensed and the liability recorded as either debt or deferred contribution obligations. See “Liquidity – Pension Contribution Deferral Obligations”. From August 2009 through December 2010, our obligations to make certain multi-employer pension contributions under certain of our collective bargaining agreements have been temporarily terminated, so no expense is required to be recognized. See “Liquidity – Ratification of Collective Bargaining Agreement Modification.”
In 2006, the Pension Protection Act became law and modified both the Internal Revenue Code (as amended, the “Code”) as it applies to multi-employer pension plans and the Employment Retirement Income Security Act of 1974 (as amended, “ERISA”). The Code and ERISA (in each case, as so modified) and related regulations establish minimum funding requirements for multi-employer pension plans. The funding status of these plans is determined by the following factors:
| • | the number of participating active and retired employees |
| • | the number of contributing employers |
| • | the amount of each employer’s contractual contribution requirements |
| • | the investment returns of the plans |
| • | plan administrative costs |
| • | the number of employees and retirees participating in the plan who no longer have a contributing employer |
| • | the discount rate used to determine the funding status |
| • | the actuarial attributes of plan participants (such as age, estimated life and number of years until retirement) |
| • | the benefits defined by the plan |
If any of our multi-employer pension plans fails to:
| • | meet minimum funding requirements |
| • | meet a required funding improvement or rehabilitation plan that the Pension Protection Act may require for certain of our underfunded plans |
| • | obtain from the IRS certain changes to or a waiver of the requirements in how the applicable plan calculates its funding levels or |
| • | reduce pension benefits to a level where the requirements are met |
the Pension Protection Act could require us to make additional contributions to the multi-employer pension plan from five to ten percent of the contributions that our labor agreement requires until the labor agreement expires. Our labor agreement, however, provides that if additional contributions are required, that money designated for certain other benefits would be reallocated to pay for the additional contributions.
If we fail to make our required contributions to a multi-employer plan under a funding improvement or rehabilitation plan or if the benchmarks that an applicable funding improvement plan provides are not met by the end of a prescribed period, the IRS could impose an excise tax on us with respect to the plan. These excise taxes are not contributed to the deficient funds, but rather are deposited in the United States general treasury funds. The Company does not believe that the temporary termination of certain of its contributions to applicable multi-employer pension funds from August 2009 through December 2010 will give rise to these excise taxes as these contributions are not required for this period.
Depending on the amount involved, a requirement to increase contributions beyond our contractually agreed rate or the imposition of an excise tax on us could have a material adverse impact on the financial results of YRC Worldwide.
49
Table of Contents
Funded status of the Central States Plan
The plan administrators and trustees of multi-employer plans do not routinely provide us with current information regarding the status of each multi-employer pension plan’s funding. However, the Pension Protection Act requires multi-employer pension plans to file routine reports with the IRS, the Department of Labor and other interested parties for plan years that began after January 1, 2008. At this time, the information that we are providing in this Form 10-K regarding the funding status, funded percentage or our portion of multi-employer plan theoretical withdrawal liabilities is based on publicly available information, which is often dated, and on the limited information available from plan administrators or plan trustees, which may not be independently validated.
The Pension Protection Act provides that certain plans with a funded percentage of less than 65% will be deemed to be in critical status. Plans in critical status must create a rehabilitation plan to exit critical status within periods that the Pension Protection Act prescribes. The Central States Southeast and Southwest Areas Pension Plan (the “Central States Plan”) provides retirement benefits to approximately 35% of our total employees. The Central States Plan has reported that it is in critical status and indicated that the employer contribution levels of our new collective bargaining agreement effective April 1, 2008, are sufficient to meet the requirements of the rehabilitation plan without additional contributions.
Contingent Withdrawal Liabilities
Because of the significant declines in the financial markets in late 2008 and early 2009 followed by a recovery in those markets later in 2009, it is not possible to estimate the impact of funded status of the plans without information directly from the funds. Most plans are expected to be better funded at the end of 2009 than 2008, recovering some, but not nearly all, of the financial market losses that they experienced in late 2008 and early 2009. Even so, much of our information has been provided from public filings using publicly available plan asset values from the end of 2008. We believe that our portion of the contingent liability in the case of a full withdrawal or termination from all of the multi-employer pension plans to which we contribute would be an estimated $7 billion on a pre-tax basis before taking into consideration the recent market recovery. If the Company were subject to withdrawal liability with respect to a plan, ERISA provides that a withdrawing employer can pay the obligation in a lump sum or over time determined by the employer’s annual contribution rate prior to withdrawal, which, in some cases, could be up to 20 years. Even so, our applicable subsidiaries have no current intention of taking any action that would subject us to payment of material withdrawal obligations.
Property and Equipment and Definite Life Intangibles
Impairment Testing
We review property and equipment and definite life intangibles for impairment whenever events or changes in circumstances indicate that the carrying amount of an asset may not be recoverable. We evaluate recoverability of assets to be held and used by comparing the carrying amount of an asset to future net cash flows expected to be generated by the asset. If such assets are considered to be impaired, the impairment to be recognized is measured by the amount by which the carrying amount of the assets exceeds the fair value of the assets. Assets to be disposed of are reported at the lower of the carrying amount or fair value less costs to sell.
We believe that the accounting estimate related to asset impairment is a critical accounting estimate because: (1) it requires our management to make assumptions about future revenues over the life of the asset, and (2) the impact that recognizing an impairment would have on our financial position, as well as our results of operations, could be material. Management’s assumptions about future revenues require significant judgment because actual revenues have fluctuated in the past and may continue to do so. In estimating future revenues, we use our internal business forecasts. We develop our forecasts based on recent revenue data for existing services and other industry and economic factors. To the extent that YRC is unable to achieve forecasted improvements in shipping volumes and pricing initiatives or realize forecasted cost savings, the Company may incur significant impairment losses on property and equipment or intangible assets.
Depreciable Lives of Assets
We review the appropriateness of depreciable lives for each category of property and equipment. These studies utilize models, which take into account actual usage, physical wear and tear, and replacement history to calculate remaining life of our asset base. For revenue equipment, we consider the optimal life cycle usage of each type of equipment, including the ability to utilize the equipment in different parts of the fleet or at different operating units in the organization. Capital, engine replacement, refurbishment and maintenance costs are considered in determining total cost of ownership and related useful lives for purposes of depreciation recognition. We also make assumptions regarding future conditions in determining potential salvage values. These assumptions impact the amount of depreciation expense recognized in the period and any gain or loss once the asset is disposed.
50
Table of Contents
Goodwill and Indefinite Life Intangibles
Indefinite life intangibles are assessed at least annually for impairment or more frequently if indicators of impairment exist. Indefinite life intangibles, primarily tradenames, are tested by comparing the carrying amount to fair value generally using the relief from royalty method (an income approach). As of December 31, 2009 and 2008, we had no goodwill included in our consolidated balance sheets.
We believe that the accounting estimate related to indefinite life intangibles is a critical accounting estimate because (1) it requires our management to make assumptions about fair values, and (2) the impact of recognizing an impairment could be material to our financial position, as well as our results of operations. Management’s assumptions about fair values require considerable judgment because changes in broad economic factors and industry factors can result in variable and volatile fair values. Assumptions with respect to rates used to discount cash flows, a key input, are dependent upon interest rates and the cost of capital at a point in time.
Recent Accounting Pronouncements
In January 2010, the FASB issued “Fair Value Measurements and Disclosures—Improving Disclosures about Fair Value Measurements” (ASU 2010-06), which requires new disclosures and reasons for transfers of financial assets and liabilities between Levels 1 and 2. ASU 2010-06 also clarifies that fair value measurement disclosures are required for each class of financial asset and liability, which may be a subset of a caption in the consolidated balance sheets, and those disclosures should include a discussion of inputs and valuation techniques. It further clarifies that the reconciliation of Level 3 measurements should separately present purchases, sales, issuances, and settlements instead of netting these changes. With respect to matters other than Level 3 measurements, ASU 2010-06 is effective for fiscal years and interim periods beginning on or after December 15, 2009 (i.e., the quarter ending March 31, 2010, for us). New guidance related to Level 3 measurements is effective for fiscal years and interim periods beginning on or after December 15, 2010 (i.e., the quarter ending March 31, 2011, for us). We are currently evaluating the impact of ASU 2010-06 on our disclosures.
51
Table of Contents
| Item 7A. | Quantitative and Qualitative Disclosures About Market Risk |
Market Risk Position
We have exposure to a variety of market risks, including the effects of interest rates, foreign exchange rates and fuel prices.
Risk from Interest Rates
To provide adequate funding through seasonal business cycles and minimize overall borrowing costs, we utilize both fixed rate and variable rate financial instruments with varying maturities. At December 31, 2009, we had approximately 10% of our outstanding debt at fixed rates. If interest rates for our variable rate long-term debt had averaged 10% more during the year, our interest expense would have increased, and income before taxes would have decreased by $2.2 million and $1.2 million for the years ended December 31, 2009 and 2008, respectively.
The table below provides information regarding our interest rate risk related to fixed-rate debt as of December 31, 2009. Principal cash flows are by contractual maturity.
| (in millions) |
2010 | 2011 | 2012 | 2013 | 2014 | Thereafter | Total | ||||||||||||||||
| Fixed-rate debt |
$ | 27.6 | $ | — | $ | — | $ | — | $ | 45.0 | $ | — | $ | 72.6 | |||||||||
| Average interest rate |
5.13 | % | — | — | — | 8.50 | % | — | |||||||||||||||
The fair values of our fixed-rate debt of $47.6 million and $212.7 million have been calculated based on the quoted market prices at December 31, 2009 and 2008, respectively. The market price for the contingent convertible senior notes, included in the preceding amounts, reflects the combination of debt and equity components of the convertible instrument.
Foreign Exchange Rates
Revenue, operating expenses, assets and liabilities of our Canadian, Mexican, Asian, South American and United Kingdom subsidiaries are denominated in local currencies, thereby creating exposure to fluctuations in exchange rates. The risks related to foreign currency exchange rates are not material to our consolidated financial position or results of operations.
Fuel Price Volatility
National Transportation, Regional Transportation and Truckload currently have effective fuel surcharge programs in place. As discussed previously, these programs are well established within the industry and customer acceptance of fuel surcharges remains high. Since the amount of fuel surcharge is based on average, national diesel fuel prices and is reset weekly, our exposure to fuel price volatility is significantly reduced.
52
Table of Contents
| Item 8. | Financial Statements and Supplementary Data |
CONSOLIDATED BALANCE SHEETS
YRC Worldwide Inc. and Subsidiaries
| (in thousands except per share data) |
December 31, 2009 |
December 31, 2008 |
||||||
| Assets |
||||||||
| Current Assets: |
||||||||
| Cash and cash equivalents |
$ | 97,788 | $ | 325,349 | ||||
| Accounts receivable, less allowances of $36,059 and $31,998 |
515,807 | 837,055 | ||||||
| Fuel and operating supplies |
18,407 | 24,719 | ||||||
| Deferred income taxes, net |
106,997 | 133,781 | ||||||
| Prepaid expenses and other |
119,821 | 139,601 | ||||||
| Total current assets |
858,820 | 1,460,505 | ||||||
| Property and Equipment: |
||||||||
| Land |
363,690 | 413,953 | ||||||
| Structures |
1,023,625 | 1,104,818 | ||||||
| Revenue equipment |
1,657,126 | 1,873,274 | ||||||
| Technology equipment and software |
291,026 | 316,361 | ||||||
| Other |
253,007 | 269,475 | ||||||
| 3,588,474 | 3,977,881 | |||||||
| Less – accumulated depreciation |
(1,748,996 | ) | (1,776,904 | ) | ||||
| Net property and equipment |
1,839,478 | 2,200,977 | ||||||
| Intangibles, net |
163,544 | 184,769 | ||||||
| Other assets |
170,232 | 119,862 | ||||||
| Total assets |
$ | 3,032,074 | $ | 3,966,113 | ||||
| Liabilities and Shareholders’ Equity |
||||||||
| Current Liabilities: |
||||||||
| Accounts payable |
$ | 198,725 | $ | 333,910 | ||||
| Wages, vacations and employees’ benefits |
216,074 | 356,410 | ||||||
| Claims and insurance accruals |
171,920 | 171,425 | ||||||
| Other current and accrued liabilities |
225,982 | 318,569 | ||||||
| Asset backed securitization borrowings |
146,285 | 147,000 | ||||||
| Current maturities of long-term debt |
50,842 | 415,321 | ||||||
| Total current liabilities |
1,009,828 | 1,742,635 | ||||||
| Other Liabilities: |
||||||||
| Long-term debt, less current portion |
935,782 | 787,415 | ||||||
| Deferred income taxes, net |
146,576 | 242,663 | ||||||
| Pension and postretirement |
351,861 | 370,031 | ||||||
| Claims and other liabilities |
420,837 | 341,918 | ||||||
| Commitments and Contingencies |
||||||||
| Shareholders’ Equity: |
||||||||
| Preferred stock, $1.00 par value per share – authorized 5,000 shares, issued 4,346, liquidation preference $217,300 |
4,346 | — | ||||||
| Common stock, $0.01 par value per share – authorized 2,000,000 shares, issued 99,122 and 62,413 shares |
991 | 624 | ||||||
| Capital surplus |
1,576,349 | 1,301,375 | ||||||
| Accumulated deficit |
(1,177,280 | ) | (555,261 | ) | ||||
| Accumulated other comprehensive loss |
(144,479 | ) | (172,550 | ) | ||||
| Treasury stock, at cost (3,079 shares) |
(92,737 | ) | (92,737 | ) | ||||
| Total shareholders’ equity |
167,190 | 481,451 | ||||||
| Total liabilities and shareholders’ equity |
$ | 3,032,074 | $ | 3,966,113 | ||||
The notes to consolidated financial statements are an integral part of these statements.
53
Table of Contents
STATEMENTS OF CONSOLIDATED OPERATIONS
YRC Worldwide Inc. and Subsidiaries
For the years ended December 31
| (in thousands except per share data) |
2009 | 2008 | 2007 | |||||||||
| Operating Revenue |
$ | 5,282,778 | $ | 8,940,401 | $ | 9,621,316 | ||||||
| Operating Expenses: |
||||||||||||
| Salaries, wages and employees’ benefits |
3,709,702 | 5,268,457 | 5,755,904 | |||||||||
| Operating expenses and supplies |
1,236,573 | 1,991,446 | 1,871,058 | |||||||||
| Purchased transportation |
646,685 | 1,075,286 | 1,089,041 | |||||||||
| Depreciation and amortization |
255,212 | 264,291 | 255,603 | |||||||||
| Other operating expenses |
324,481 | 410,754 | 438,781 | |||||||||
| Gains on property disposals, net |
(5,924 | ) | (19,083 | ) | (5,820 | ) | ||||||
| Impairment charges |
— | 1,023,376 | 781,875 | |||||||||
| Total operating expenses |
6,166,729 | 10,014,527 | 10,186,442 | |||||||||
| Operating loss |
(883,951 | ) | (1,074,126 | ) | (565,126 | ) | ||||||
| Nonoperating (Income) Expenses: |
||||||||||||
| Interest expense |
161,923 | 80,999 | 91,852 | |||||||||
| Equity investment impairment |
30,374 | — | — | |||||||||
| Gain on debt redemption, net |
(193,872 | ) | (2,400 | ) | — | |||||||
| Interest income |
(874 | ) | (4,293 | ) | (4,372 | ) | ||||||
| Other, net |
9,203 | (1,878 | ) | 2,203 | ||||||||
| Nonoperating (income) expenses, net |
6,754 | 72,428 | 89,683 | |||||||||
| Loss Before Income Taxes |
(890,705 | ) | (1,146,554 | ) | (654,809 | ) | ||||||
| Income Tax Benefit |
(268,686 | ) | (170,181 | ) | (14,447 | ) | ||||||
| Net Loss |
$ | (622,019 | ) | $ | (976,373 | ) | $ | (640,362 | ) | |||
| Weighted Average Common Shares Outstanding - Basic |
59,582 | 57,583 | 57,154 | |||||||||
| Weighted Average Common Shares Outstanding - Diluted |
59,582 | 57,583 | 57,154 | |||||||||
| Basic Loss Per Share |
$ | (10.44 | ) | $ | (16.96 | ) | $ | (11.20 | ) | |||
| Diluted Loss Per Share |
$ | (10.44 | ) | $ | (16.96 | ) | $ | (11.20 | ) | |||
The notes to consolidated financial statements are an integral part of these statements.
54
Table of Contents
STATEMENTS OF CONSOLIDATED CASH FLOWS
YRC Worldwide Inc. and Subsidiaries
For the years ended December 31
| (in thousands) |
2009 | 2008 | 2007 | |||||||||
| Operating Activities: |
||||||||||||
| Net loss |
$ | (622,019 | ) | $ | (976,373 | ) | $ | (640,362 | ) | |||
| Noncash items included in net loss: |
||||||||||||
| Depreciation and amortization |
255,212 | 264,291 | 255,603 | |||||||||
| Stock compensation expense |
31,290 | 10,499 | 14,884 | |||||||||
| Impairment charges |
— | 1,023,376 | 781,875 | |||||||||
| Deferred income tax provision, net |
(201,847 | ) | (159,463 | ) | 7,422 | |||||||
| Gains on debt redemptions, net |
(193,872 | ) | (2,400 | ) | — | |||||||
| Equity investment impairment |
30,374 | — | — | |||||||||
| Gains on property disposals, net |
(5,924 | ) | (19,115 | ) | (7,547 | ) | ||||||
| Curtailment gains, net |
— | (88,690 | ) | — | ||||||||
| Amortization of deferred debt costs |
29,120 | 4,305 | 2,652 | |||||||||
| Other noncash items |
9,659 | (14,318 | ) | (4,519 | ) | |||||||
| Changes in assets and liabilities, net: |
||||||||||||
| Accounts receivable |
312,024 | 236,860 | 107,497 | |||||||||
| Accounts payable |
(141,053 | ) | (53,904 | ) | (9,320 | ) | ||||||
| Other operating assets |
28,389 | 33,374 | (3,904 | ) | ||||||||
| Other operating liabilities |
90,350 | (38,622 | ) | (111,683 | ) | |||||||
| Net cash provided by (used in) operating activities |
(378,297 | ) | 219,820 | 392,598 | ||||||||
| Investing Activities: |
||||||||||||
| Acquisition of property and equipment |
(37,292 | ) | (162,276 | ) | (393,763 | ) | ||||||
| Proceeds from disposal of property and equipment |
133,061 | 127,590 | 55,339 | |||||||||
| Disposition of business line |
31,948 | — | — | |||||||||
| Investment in affiliate |
— | (46,133 | ) | (1,608 | ) | |||||||
| Other |
6,363 | (6,115 | ) | (1,055 | ) | |||||||
| Net cash provided by (used in) investing activities |
134,080 | (86,934 | ) | (341,087 | ) | |||||||
| Financing Activities: |
||||||||||||
| Asset backed securitization borrowings, net |
(715 | ) | (33,000 | ) | (45,000 | ) | ||||||
| Issuance of long-term debt |
331,542 | 510,400 | 155,096 | |||||||||
| Repayment of long-term debt |
(247,285 | ) | (331,816 | ) | (150,000 | ) | ||||||
| Debt issuance costs |
(60,853 | ) | (11,404 | ) | (1,298 | ) | ||||||
| Equity issuance costs |
(6,033 | ) | — | — | ||||||||
| Treasury stock purchases |
— | — | (34,997 | ) | ||||||||
| Proceeds from exercise of stock options |
— | 50 | 6,530 | |||||||||
| Net cash provided by (used in) financing activities |
16,656 | 134,230 | (69,669 | ) | ||||||||
| Net Increase (Decrease) In Cash and Cash Equivalents |
(227,561 | ) | 267,116 | (18,158 | ) | |||||||
| Cash and Cash Equivalents, Beginning of Year |
325,349 | 58,233 | 76,391 | |||||||||
| Cash and Cash Equivalents, End of Year |
$ | 97,788 | $ | 325,349 | $ | 58,233 | ||||||
| Supplemental Cash Flow Information: |
||||||||||||
| Income tax refund, net |
$ | (35,885 | ) | $ | (46,463 | ) | $ | (48,132 | ) | |||
| Interest paid |
72,823 | 70,945 | 84,076 | |||||||||
| Pension contribution deferral transferred to debt |
171,351 | — | — | |||||||||
| Debt redeemed for equity consideration |
463,063 | 13,163 | — | |||||||||
| Employer 401(k) contributions settled in common stock |
— | 8,108 | 9,548 | |||||||||
The notes to consolidated financial statements are an integral part of these statements.
55
Table of Contents
STATEMENTS OF CONSOLIDATED SHAREHOLDERS’ EQUITY
YRC Worldwide Inc. and Subsidiaries
For the years ended December 31
| (in thousands) |
2009 | 2008 | 2007 | |||||||||
| Preferred Stock |
||||||||||||
| Beginning balance |
$ | — | $ | — | $ | — | ||||||
| Issuance of equity in exchange for debt |
4,346 | — | — | |||||||||
| Ending balance |
4,346 | — | — | |||||||||
| Common Stock |
||||||||||||
| Beginning balance |
624 | 615 | 609 | |||||||||
| Issuance of equity in exchange for debt |
365 | — | — | |||||||||
| Exercise of stock options |
— | — | 2 | |||||||||
| Issuance of equity awards, net |
2 | 3 | 1 | |||||||||
| Employer contribution to 401(k) plan |
— | 6 | 3 | |||||||||
| Ending balance |
991 | 624 | 615 | |||||||||
| Capital Surplus |
||||||||||||
| Beginning balance |
1,301,375 | 1,287,835 | 1,255,825 | |||||||||
| Issuance of equity in exchange for debt, net of $20.8 million of transaction costs ($12.7 million, net of tax) |
246,427 | — | — | |||||||||
| Exercise of stock options, including tax benefits |
— | 47 | 6,528 | |||||||||
| Share-based compensation |
28,013 | 5,750 | 14,748 | |||||||||
| Employer contribution to 401(k) plan |
— | 8,102 | 9,545 | |||||||||
| Other, net |
534 | (359 | ) | 1,189 | ||||||||
| Ending balance |
1,576,349 | 1,301,375 | 1,287,835 | |||||||||
| Retained Earnings (Accumulated Deficit) |
||||||||||||
| Beginning balance |
(555,261 | ) | 465,177 | 1,111,285 | ||||||||
| Cumulative effect – adoption of FIN 48, “Accounting for Uncertainty in Income Taxes” |
— | — | (5,746 | ) | ||||||||
| Exchange of 1.7 million shares of treasury stock for $13.2 million contingent convertible notes |
— | (44,065 | ) | — | ||||||||
| Net loss |
(622,019 | ) | (976,373 | ) | (640,362 | ) | ||||||
| Ending balance |
(1,177,280 | ) | (555,261 | ) | 465,177 | |||||||
| Accumulated Other Comprehensive Loss |
||||||||||||
| Beginning balance |
(172,550 | ) | 12,329 | (54,534 | ) | |||||||
| Pension, net of tax: |
||||||||||||
| Net pension gains (losses) |
14,935 | (171,831 | ) | 45,345 | ||||||||
| Reclassification of net losses (gains) to net income |
2,429 | (20,711 | ) | 5,452 | ||||||||
| Curtailment and settlement adjustments |
846 | 23,058 | — | |||||||||
| Foreign currency translation adjustments |
9,861 | (15,395 | ) | 16,066 | ||||||||
| Ending balance |
(144,479 | ) | (172,550 | ) | 12,329 | |||||||
| Treasury Stock, At Cost |
||||||||||||
| Beginning balance |
(92,737 | ) | (144,614 | ) | (109,617 | ) | ||||||
| Treasury stock purchases |
— | — | (34,997 | ) | ||||||||
| Exchange of 1.7 million shares of treasury stock for $13.2 million contingent convertible notes |
— | 51,877 | — | |||||||||
| Ending balance |
(92,737 | ) | (92,737 | ) | (144,614 | ) | ||||||
| Total Shareholders’ Equity |
$ | 167,190 | $ | 481,451 | $ | 1,621,342 | ||||||
The notes to consolidated financial statements are an integral part of these statements.
56
Table of Contents
STATEMENTS OF COMPREHENSIVE INCOME (LOSS)
YRC Worldwide Inc. and Subsidiaries
For the years ended December 31
| (in thousands) |
2009 | 2008 | 2007 | |||||||||
| Net loss |
$ | (622,019 | ) | $ | (976,373 | ) | $ | (640,362 | ) | |||
| Other comprehensive income (loss), net of tax: |
||||||||||||
| Pension: |
||||||||||||
| Net prior service cost |
6 | 588 | 980 | |||||||||
| Net actuarial gains (losses) |
17,358 | (193,130 | ) | 49,817 | ||||||||
| Curtailment and settlement adjustments |
846 | 23,058 | — | |||||||||
| Changes in foreign currency translation adjustments |
9,861 | (15,395 | ) | 16,066 | ||||||||
| Other comprehensive income (loss) |
28,071 | (184,879 | ) | 66,863 | ||||||||
| Comprehensive loss |
$ | (593,948 | ) | $ | (1,161,252 | ) | $ | (573,499 | ) | |||
The notes to consolidated financial statements are an integral part of these statements.
Notes to Consolidated Financial Statements
YRC Worldwide Inc. and Subsidiaries
Description of Business
YRC Worldwide Inc. (also referred to as “YRC Worldwide”, “the Company”, “we”, “us” or “our”), one of the largest transportation service providers in the world, is a holding company that through wholly owned operating subsidiaries offers its customers a wide range of transportation services. These services include global, national and regional transportation as well as logistics. Our operating subsidiaries include the following:
| • | YRC National Transportation (“National Transportation”) is the reporting unit for our transportation service providers focused on business opportunities in regional, national and international services. This unit includes our less-than-truckload (“LTL”) subsidiary YRC Inc. (“YRC”), which was formed through the March 2009 integration of our former Yellow Transportation and Roadway networks. National Transportation provides for the movement of industrial, commercial and retail goods, primarily through centralized management and customer facing organizations. National Transportation also includes YRC Reimer (formerly Reimer Express Lines), a subsidiary located in Canada that specializes in shipments into, across and out of Canada. In addition to the United States (“U.S.”) and Canada, National Transportation also serves parts of Mexico, Puerto Rico and Guam. |
| • | YRC Regional Transportation (“Regional Transportation”) is the reporting unit for our transportation service providers focused on business opportunities in the regional and next-day delivery markets. Regional Transportation is comprised of New Penn Motor Express (“New Penn”), Holland and Reddaway. These companies each provide regional, next-day ground services in their respective regions through a network of facilities located across the United States; Quebec, Canada; Mexico and Puerto Rico. In 2006, Regional Transportation also included USF Bestway. In February 2007, the majority of USF Bestway’s operations were consolidated into Reddaway. |
| • | YRC Logistics plans and coordinates the movement of goods worldwide to provide customers a single source for logistics management solutions. YRC Logistics delivers a wide range of global logistics management services, with the ability to provide customers improved return-on-investment results through logistics services and technology management solutions. |
| • | YRC Truckload (“Truckload”) reflects the results of Glen Moore, a provider of truckload services throughout the U.S. |
Liquidity and Ability to Continue as a Going Concern
Our consolidated financial statements were prepared assuming we would continue as a going concern; however, our ability to generate sufficient cash flows and liquidity to fund operations raises substantial doubt about our ability to continue as a going concern. Our accompanying financial statements have been prepared assuming that we will continue as a going concern (which contemplates the realization of assets and discharge of liabilities in the normal course of business for the foreseeable future). These financial statements do not include any adjustments that might result from the outcome of this uncertainty. If we are unable to fund our operations through operating cash flows, existing credit facilities, sales of non-strategic assets and business lines and other capital market transactions, we would consider in court and out of court restructuring alternatives.
57
Table of Contents
1. Principles of Consolidation and Summary of Accounting Policies
The accompanying consolidated financial statements include the accounts of YRC Worldwide and its wholly owned subsidiaries. All significant intercompany accounts and transactions have been eliminated in consolidation. We report on a calendar year basis. The quarters of the Regional Transportation companies (with the exception of New Penn) consist of thirteen weeks that end on a Saturday either before or after the end of March, June and September, whereas all other operating segment quarters end on the natural calendar quarter end. Investments in non-majority owned affiliates or those in which we do not have control where the entity is either not a variable interest entity or YRC Worldwide is not the primary beneficiary are accounted for on the equity method. There are no noncontrolling (minority) interests in our consolidated subsidiaries; consequently, all of our shareholders’ equity (deficit), net income (loss) and comprehensive income (loss) for the period’s presented are attributable to controlling interests. Management makes estimates and assumptions that affect the amounts reported in the consolidated financial statements and notes. Actual results could differ from those estimates.
Accounting policies refer to specific accounting principles and the methods of applying those principles to fairly present our financial position and results of operations in accordance with generally accepted accounting principles. The policies discussed below include those that management has determined to be the most appropriate in preparing our financial statements and are not otherwise discussed in a separate note.
Cash and Cash Equivalents
Cash and cash equivalents include demand deposits and highly liquid investments purchased with maturities of three months or less.
Under the Company’s cash management system, checks issued but not presented to banks frequently result in book overdraft balances for accounting purposes which are classified within accounts payable in the accompanying consolidated balance sheets. The change in book overdrafts are reported as a component of operating cash flows for accounts payable as they do not represent bank overdrafts.
Concentration of Credit Risks and Other
We sell services and extend credit based on an evaluation of the customer’s financial condition, without requiring collateral. Exposure to losses on receivables is principally dependent on each customer’s financial condition. We monitor our exposure for credit losses and maintain allowances for anticipated losses.
At December 31, 2009, approximately 70% of our labor force was subject to collective bargaining agreements, which predominantly expire in 2013. In January 2009, the primary labor agreement was modified to reflect a 10% reduction in all wages, inclusive of scheduled increases, through the remaining life of the agreement of March 31, 2013. The modification also suspended any cost of living increases through 2013. In July 2009, the primary labor agreement was again modified to reflect an additional 5% reduction in all wages through the remaining life of the agreement of March 31, 2013. See the “Liquidity” note for further discussion regarding 2009 modifications to our labor agreement.
In conjunction with the reductions agreed to by our union employees, effective January 1, 2009, the salaries of all non-union employees were reduced 10%. This reduction was a permanent reduction to base salaries.
Revenue Recognition
For shipments in transit, National Transportation, Regional Transportation and Truckload record revenue based on the percentage of service completed as of the period end and accrue delivery costs as incurred. The percentage of service completed for each shipment is based on how far along in the shipment cycle each shipment is in relation to standard transit days. Standard transit days are defined as our published service days between origin zip code and destination zip code. Based on historical cost and engineering studies, certain percentages of revenue are determined to be earned during each stage of the shipment cycle, such as initial pick up, long distance transportation, intermediate transfer and customer delivery. Using standard transit times, we analyze each shipment in transit at a particular period end to determine what stage the shipment is in. We apply that stage’s percentage of revenue earned factor to the rated revenue for that shipment to determine the revenue dollars earned by that shipment in the current period. The total revenue earned is accumulated for all shipments in transit at a particular period end and recorded as operating revenue.
In addition, National Transportation, Regional Transportation and Truckload recognize revenue on a gross basis because the entities are the primary obligors even when they use other transportation service providers who act on their behalf. National Transportation, Regional Transportation and Truckload remain responsible to their customers for complete and proper shipment, including the risk of physical loss or damage of the goods and cargo claims issues. We assign pricing to bills of lading at the time of shipment based
58
Table of Contents
primarily on the weight, general classification of the product, the shipping destination and individual customer discounts. This process is referred to as rating. At various points throughout our process, incorrect ratings could be identified based on many factors, including weight verifications or updated customer discounts. Although the majority of rerating occurs in the same month as the original rating, a portion occurs during the following periods. We accrue a reserve for rerating based on historical trends. The rerate reserve is included as a reduction to “Accounts receivable” in the accompanying consolidated balance sheets.
YRC Logistics recognizes revenue upon the completion of services. In certain logistics transactions where YRC Logistics acts as an agent, revenue is recorded on a net basis. Net revenue represents revenue charged to customers less third party transportation costs. Where YRC Logistics acts as principal, it records revenue from these transactions on a gross basis, without deducting transportation costs. Management believes these policies most accurately reflect revenue as earned.
Foreign Currency
Our functional currency is the U.S. dollar, whereas, our foreign operations utilize the local currency as their functional currency. Accordingly, for purposes of translating foreign subsidiary financial statements to the U.S. dollar reporting currency, assets and liabilities of our foreign operations are translated at the fiscal year end exchange rates and income and expenses are translated monthly at the average exchange rates for each respective month. Foreign currency gains and losses resulting from foreign currency transactions resulted in a $0.4 million loss, $0.3 million gain and a $5.4 million loss during 2009, 2008 and 2007, respectively, and are included in “Other nonoperating (income) expense” in the accompanying statements of consolidated operations.
Claims and Insurance Accruals
Claims and insurance accruals, both current and long-term, reflect the estimated cost of claims for workers’ compensation, cargo loss and damage, and property damage and liability that insurance does not cover. We base reserves for workers’ compensation and property damage and liability claims primarily upon actuarial analyses that independent actuaries prepare. These reserves are discounted to present value using a risk-free rate based on the year of occurrence. The risk-free rate is the U.S. Treasury rate for maturities that match the expected payout of such claims and was 1.4%, 2.2% and 4.3% for workers’ compensation claims incurred for the years ended and as of December 31, 2009, 2008 and 2007, respectively. The rate was 1.0%, 2.0% and 4.4% for property damage and liability claims incurred for the years ended and as of December 31, 2009, 2008 and 2007, respectively. The process of determining reserve requirements utilizes historical trends and involves an evaluation of accident frequency and severity, claims management, changes in health care costs and certain future administrative costs. The effect of future inflation for costs is considered in the actuarial analyses. Adjustments to previously established reserves are included in operating results in the year of adjustment. As of December 31, 2009 and 2008, we had $536.8 million and $495.7 million, respectively, accrued for claims and insurance.
Expected aggregate undiscounted amounts and material changes to these amounts as of December 31 are presented below:
| (in millions) |
Workers’ Compensation |
Property Damage and Liability Claims |
Total | |||||||||
| Undiscounted amounts at December 31, 2007 |
$ | 427.4 | $ | 87.3 | $ | 514.7 | ||||||
| New claims reported |
134.8 | 47.2 | 182.0 | |||||||||
| Claim payments |
(137.7 | ) | (42.9 | ) | (180.6 | ) | ||||||
| Change in estimate on prior year claims |
(9.0 | ) | 13.0 | 4.0 | ||||||||
| Undiscounted amount at December 31, 2008 |
$ | 415.5 | $ | 104.6 | $ | 520.1 | ||||||
| New claims reported |
145.8 | 33.5 | 179.3 | |||||||||
| Claim payments |
(136.2 | ) | (45.8 | ) | (182.0 | ) | ||||||
| Change in estimate on prior year claims |
26.6 | 19.1 | 45.7 | |||||||||
| Undiscounted amount at December 31, 2009 |
$ | 451.7 | $ | 111.4 | $ | 563.1 | ||||||
| Discounted amount at December 31, 2009 |
$ | 404.1 | $ | 107.7 | $ | 511.8 | ||||||
In addition to the amounts above, accruals for cargo claims and other insurance related amounts, none of which are discounted, totaled $25.0 million and $34.5 million at December 31, 2009 and 2008, respectively.
59
Table of Contents
Estimated cash payments for existing liabilities for the next five years and thereafter are as follows:
| (in millions) |
Workers’ Compensation |
Property Damage and Liability Claims |
Total | ||||||
| 2010 |
$ | 117.4 | $ | 38.2 | $ | 155.6 | |||
| 2011 |
78.2 | 28.9 | 107.1 | ||||||
| 2012 |
53.7 | 19.6 | 73.3 | ||||||
| 2013 |
38.7 | 11.9 | 50.6 | ||||||
| 2014 |
28.9 | 6.2 | 35.1 | ||||||
| Thereafter |
134.8 | 6.6 | 141.4 | ||||||
| Total |
$ | 451.7 | $ | 111.4 | $ | 563.1 | |||
Stock-Based Compensation
We have various stock-based employee compensation plans, which are described more fully in the “Stock Compensation Plans” note. Effective January 1, 2006, we adopted the fair value recognition provisions of SFAS No. 123(R), “Share-Based Payment” (now included in FASB ASC Topic 718). We recognize compensation costs for non-vested shares and compensation cost for all share-based payments (i.e., options) granted prior to, but not yet vested as of, January 1, 2006, based on the grant date fair value estimated in accordance with the original provisions of SFAS No. 123. Additionally, we recognize compensation cost for all share-based payments granted subsequent to January 1, 2006, on a straight-line basis over the requisite service period (generally three to four years) based on the grant-date fair value estimated in accordance with the provisions of SFAS No. 123(R).
Property and Equipment
We carry property and equipment at cost less accumulated depreciation. We compute depreciation using the straight-line method based on the following service lives:
| Years | ||
| Structures |
10 – 30 | |
| Revenue equipment |
10 – 20 | |
| Technology equipment and software |
3 – 7 | |
| Other |
3 – 10 |
We charge maintenance and repairs to expense as incurred, and capitalize replacements and improvements when these costs extend the useful life of the asset. We utilize certain terminals and equipment under operating leases. Leasehold improvements are capitalized and amortized over the original lease term.
Our investment in technology equipment and software consists primarily of customer service and freight management equipment and related software. We capitalize certain costs associated with developing or obtaining internal-use software. Capitalizable costs include external direct costs of materials and services utilized in developing or obtaining the software, payroll and payroll-related costs for employees directly associated with the project. For the years ended December 31, 2009, 2008 and 2007, we capitalized $1.6 million, $12.6 million, and $26.8 million, respectively, which were primarily payroll and payroll-related costs.
For the years ended December 31, 2009, 2008 and 2007, depreciation expense was $233.7 million, $246.8 million, and $237.3 million, respectively.
Impairment of Long-Lived Assets
If facts and circumstances indicate that the carrying amount of identifiable amortizable intangibles and property, plant and equipment may be impaired, we would perform an evaluation of recoverability in accordance with SFAS No. 144, “Accounting for the Impairment or Disposal of Long-Lived Assets” (now included in FASB ASC Topic 360). If an evaluation were required, we would compare the estimated future undiscounted cash flows associated with the asset to the asset’s carrying amount to determine if a reduction to the carrying amount is required. The carrying amount of an impaired asset would be reduced to fair value.
Based on current economic conditions in 2009 and on the results of our 2008 impairment tests for goodwill as discussed below, we determined a review of impairment of long-lived assets was necessary as of December 31, 2009 and 2008. Our analysis of undiscounted cash flows indicated no impairment charge for long-lived assets was required at December 31, 2009 and 2008.
60
Table of Contents
Asset Retirement Obligations
We record estimated liabilities for the cost to return leased property to its original condition at the end of a lease term. Revisions to these liabilities for such costs may occur due to changes in the estimates for real property lease restoration costs, or changes in regulations or agreements affecting these obligations. These obligations could also include removal of underground storage tanks at leased or owned properties. Our accrual also includes amounts for restoration of U.S. federal “Superfund” sites. When we have been identified as a potentially responsible party in a Superfund site, we accrue our share of the estimated remediation costs of the site based on the ratio of the estimated volume of waste contributed to the site by us to the total volume of waste at the site. At December 31, 2009 and 2008, our estimated asset retirement obligations totaled $8.1 million and $6.8 million, respectively. These amounts are included in “Other current and accrued liabilities” in the accompanying consolidated balance sheets.
Assets Held for Sale
When we plan to dispose of property or equipment by sale, the asset is carried in the financial statements at the lower of the carrying amount or estimated fair value, less cost to sell, and is reclassified to assets held for sale. Additionally, after such reclassification, there is no further depreciation taken on the asset. For an asset to be classified as held for sale, management must approve and commit to a formal plan, the sale should be anticipated during the ensuing year and the asset must be actively marketed, be available for immediate sale, and meet certain other specified criteria. At December 31, 2009 and 2008, the net book value of assets held for sale was approximately $112.8 million and $32.4 million, respectively. This amount is included in “Property and equipment” in the accompanying consolidated balance sheets. We recorded charges of $25.9 million, $7.3 million and $1.1 million for the years ended December 31, 2009, 2008 and 2007, respectively, to reduce properties and equipment held for sale to estimated fair value, less cost to sell. These charges are included in “Gains on property disposals, net” in the accompanying statements of operations.
Fair Value Measurements
We determined fair value measurements used in our consolidated financial statements based upon the price that would be received to sell an asset or paid to transfer a liability in an orderly transaction between market participants at the measurement date. The fair value hierarchy distinguishes between (1) market participant assumptions developed based on market data obtained from independent sources (observable inputs) and (2) an entity’s own assumptions about market participant assumptions developed based on the best information available in circumstances (unobservable inputs). The fair value hierarchy consists of three broad levels, which gives the highest priority to unadjusted quoted prices in active markets for identical assets or liabilities (Level 1) and the lowest priority to unobservable inputs (Level 3). The three levels of the fair value hierarchy are described below:
| • | Level 1 – Valuations based on quoted prices in active markets for identical assets or liabilities that the entity has the ability to access. |
| • | Level 2 – Valuations based on quoted prices for similar assets or liabilities, quoted prices in markets that are not active, or other inputs that are observable or can be corroborated by observable a data for substantially the full term of the assets or liabilities. |
| • | Level 3 – Valuations based on inputs that are supported by little or no market activity and that are significant to the fair value of the assets or liabilities. |
The carrying value of cash and cash equivalents, accounts receivable, accounts payable and asset backed securitization borrowings approximates their fair value due to the short-term nature of these instruments. See the “Debt and Financing” note for discussion regarding the fair value of current and long-term debt obligations.
Earnings from Equity Method Investments
We account for our ownership in certain joint ventures under the equity method and accordingly, recognize our share of the respective joint ventures earnings in “Other nonoperating (income) expense” in the accompanying statements of operations.
61
Table of Contents
The following reflects the components of these results for the years ended December 31:
| (in millions) |
2009 | 2008 | 2007 | ||||||||
| Our share of joint venture (earnings) losses |
$ | 2.0 | $ | (3.3 | ) | $ | (2.9 | ) | |||
| Additional depreciation and amortization as required by purchase accounting |
1.5 | 1.0 | 1.3 | ||||||||
| Impairment charge (Jiayu) |
30.4 | — | — | ||||||||
| Net equity method (earnings) losses |
$ | 33.9 | $ | (2.3 | ) | $ | (1.6 | ) | |||
Reclassifications
Certain amounts within the prior year have been reclassified to conform with the current year presentation. We reclassified certain reorganization and settlement costs to their related expense accounts to make the presentation comparable to 2009. Additionally, we reclassified $2.4 million of 2008 net gains on debt redemptions to conform to the current year presentation.
2. Investment and Disposition
Shanghai Jiayu Logistics Co., Ltd.
On August 19, 2008, we completed the purchase of a 65% equity interest in Shanghai Jiayu Logistics Co., Ltd. (“Jiayu”), a Shanghai, China ground transportation company with a purchase price of $53.6 million and final working capital settlement amounts of $5.8 million. Based on the 2008 results of Jiayu, we have the option to purchase the remaining 35% of the shares of Jiayu for approximately $14 million. We account for our ownership in Jiayu using the equity method of accounting because the minority shareholder has significant veto rights that preclude our ability to control Jiayu, and record our portion of the financial results of Jiayu one month in arrears. The minority shareholder is entitled to appoint two of the five board of directors and, many material actions require unanimous vote by this board including approval of customer contracts, transfer, sale, lease or other disposition of assets, approval of any capital expenditure, approval of material lease agreements and loan agreements and adoption or termination of any group employee benefit plan. The minority shareholder serves as the Jiayu Chief Executive Officer and in that role performs a variety of management functions including approval of short-term budgets. In addition, the two minority directors can veto decisions regarding the hiring or retention of the Jiayu Chief Executive Officer and his compensation. These conditions are considered substantive participating rights within the meaning of EITF 96-16, “Investor’s Accounting for an Investee When the Investor Has a Majority of the Voting Interest but the Minority Shareholder or Shareholders Have Certain Approval or Veto Rights” (now included in FASB ASC Topic 810) and accordingly, preclude our ability to consolidate Jiayu in our consolidated financial statements for the years ended December 31, 2009 and 2008. Our portion of the results of Jiayu have been included in our financial statements since the date of acquisition.
This investment is a part of our YRC Logistics segment, and is included in “Other assets” in the accompanying consolidated balance sheets. As of December 31, 2009, the excess of our investment over our interest in Jiayu’s equity is approximately $13.2 million.
During the year ended December 31, 2009, we determined our investment with respect to Jiayu incurred an other than temporary impairment. This is primarily the result of different assumptions with respect to revenue growth rates from the initial valuation to those assumed in the current economic environment as well as certain liquidity challenges experienced by Jiayu. As a result, we recognized an impairment charge for this equity method investment of $30.4 million in the year ended December 31, 2009. This amount is classified as a non-operating expense in the accompanying statements of operations. No such amount was recorded during the year ended December 31, 2008.
Disposition
On November 23, 2009, we sold our dedicated contract carriage or “fleet” business line to Greatwide Dedicated Transport, LLC for $34 million. This amount includes $1.8 million of holdbacks for indemnification and working capital adjustments to be settled by the second quarter of 2011. Fleet was part of our YRC Logistics segment and the disposition did not have a material impact to our financial statements. The proceeds from the sale were used to repay our revolving credit facility.
3. Goodwill and Intangibles
Goodwill is recognized for the excess of the purchase price over the fair value of tangible and identifiable intangible net assets of businesses acquired. In accordance with SFAS No. 142, “Goodwill and other Intangible Assets”, (now included in FASB ASC Topic 350) to the extent we have goodwill recorded in our financial statements we test goodwill for impairment on an annual basis in the
62
Table of Contents
fourth quarter or more frequently if we believe indicators of impairment exist. Following significant impairment charges in 2008 and 2007, we had no goodwill as of December 31, 2009 and 2008. The performance of the test involved a two-step process. First, a comparison of the fair values of the applicable reporting units with their aggregate carrying values, including goodwill, was performed. We generally determined the fair value of our reporting units using the income approach valuation methodology that included a discounted cash flow method as well as other generally accepted valuation methodologies. If the carrying amount of a reporting unit exceeded the reporting unit’s fair value, we performed the second step of the goodwill impairment test to determine the amount of impairment loss. The second step included comparing the implied fair value of the affected reporting unit’s goodwill with the carrying value of that goodwill.
During 2008, our operating performance continued to decline as compared to prior year and our share price and market capitalization remained depressed as compared to book value. Overall U.S. economic trends were declining as seen in most indices including those applicable to the retail sector, manufacturing, construction and housing. Declining economic activity, evidenced by these trends, negatively impacted the volume of freight we serviced and the price we received for our services. These trends coupled with our decreased year over year quarterly earnings along with the decrease in our market capitalization prompted management to conclude indicators of impairment existed at September 30, 2008 and again at November 30, 2008. We assessed the current fair value of our reporting units and indefinite-lived intangibles based on an income approach using estimation models including a discounted cash flow as well as assumptions related to market multiple of earnings. As a result of these processes, we determined the book value of goodwill and certain indefinite lived intangibles (tradenames) was impaired.
During the year ended December 31, 2007, we performed our annual impairment test of goodwill during the fourth quarter based on market conditions as of the beginning of our fourth quarter in 2007 and determined that our Regional Transportation segment goodwill was impaired. The 2008 and 2007 impairment charges were primarily due to decreased operating income, both actual and forecasted, the estimated timing of economic recovery of this sector triangulated with a specific, point-in-time fair value using current market conditions.
The following table shows the changes in the carrying amount of goodwill attributable to each applicable segment:
| (in millions) |
National Transportation |
YRC Logistics |
Total | |||||||||
| Balances at December 31, 2007 |
$ | 542.7 | $ | 158.0 | $ | 700.7 | ||||||
| Impairment charge |
(541.8 | ) | (157.0 | ) | (698.8 | ) | ||||||
| Change in foreign currency exchange rates |
(0.9 | ) | (1.0 | ) | (1.9 | ) | ||||||
| Balances at December 31, 2008 and 2009 |
$ | — | $ | — | $ | — | ||||||
A tax benefit of $4.6 million was recognized on the goodwill impairment charges in 2008.
The components of amortizable intangible assets are as follows at December 31:
| 2009 | 2008 | |||||||||||||
| (in millions) |
Weighted Average Life (years) |
Gross Carrying Amount |
Accumulated Amortization |
Gross Carrying Amount |
Accumulated Amortization | |||||||||
| Customer related |
11.9 | $ | 215.0 | $ | 87.2 | $ | 214.2 | $ | 65.4 | |||||
| Marketing related |
5.6 | 3.6 | 3.2 | 3.5 | 2.6 | |||||||||
| Technology based |
5.0 | 25.6 | 25.0 | 25.6 | 23.3 | |||||||||
| Intangible assets |
$ | 244.2 | $ | 115.4 | $ | 243.3 | $ | 91.3 | ||||||
During the year ended December 31, 2009, we determined indicators of impairment, primarily volume reductions in all of our reporting segments, were present. We performed certain tests consisting of discounted cash flow models and determined that the lives assigned to certain customer relationships should be reduced to better align with actual attrition rates. This resulted in additional amortization of $4.2 million during the year ended December 31, 2009.
Amortization expense for intangible assets, recognized on a straight line basis including the 2009 acceleration, was $21.5 million, $17.5 million and $18.3 million for the years ending December 31, 2009, 2008 and 2007, respectively. Estimated amortization expense for the next five years is as follows:
| (in millions) |
2010 | 2011 | 2012 | 2013 | 2014 | ||||||||||
| Estimated amortization expense |
$ | 20.0 | $ | 19.0 | $ | 19.0 | $ | 19.0 | $ | 19.0 | |||||
63
Table of Contents
Total marketing related intangible assets with indefinite lives, primarily tradenames, are not subject to amortization, but are subjected to an impairment test at least annually and as triggering events may occur. The impairment test for tradenames consists of a comparison of the fair value of the intangible asset with its carrying amount. An impairment loss is recognized for the amount by which the carrying amount exceeds the fair value of the asset. In making this assessment, we utilized the relief from royalty method, an income approach, which includes assumptions as to future revenue, applicable royalty rate and cost of capital, among others.
During the year ended December 31, 2008, we impaired two tradenames via an abandonment of the underlying brands, Roadway and USF. The Roadway brand along with the Yellow Transportation brand have collectively been replaced by the YRC brand, our new National Transportation brand. The USF brand has been removed from our marketing efforts and therefore no longer has continuing value.
The following table shows the pre-tax changes in the carrying amount of our indefinite lived tradenames attributable to each applicable segment:
| (in millions) |
National Transportation |
Regional Transportation |
Total | |||||||||
| Balances at December 31, 2007 |
$ | 252.7 | $ | 110.4 | $ | 363.1 | ||||||
| Impairment charges |
(234.9 | ) | (89.7 | ) | (324.6 | ) | ||||||
| Tax related purchase accounting adjustments |
(2.8 | ) | — | (2.8 | ) | |||||||
| Change in foreign currency exchange rates |
(2.9 | ) | — | (2.9 | ) | |||||||
| Balances at December 31, 2008 |
12.1 | 20.7 | 32.8 | |||||||||
| Change in foreign currency exchange rates |
1.9 | — | 1.9 | |||||||||
| Balances at December 31, 2009 |
$ | 14.0 | $ | 20.7 | $ | 34.7 | ||||||
The 2008 impairment charges net of tax were $147.9 million and $57.5 million for National Transportation (the Roadway and Reimer Express Lines tradenames) and Regional Transportation (the USF tradename), respectively.
During the fourth quarter of 2008, adjustments were made to deferred taxes at Roadway (included in National Transportation) relating to pre-acquisition balances. In accordance with purchase accounting rules, in the absence of any goodwill (which was written off in the third quarter of 2008) all of these adjustments were offset to indefinite lived tradenames.
4. Restructuring
During 2009, we closed 18 service centers that were previously a part of the Regional Transportation networks. As a part of this action, we incurred certain restructuring charges of approximately $7.2 million consisting of employee severance costs of $4.2 million and lease cancellations and other incremental costs of $3.0 million. Also during 2009, we integrated our Yellow Transportation and Roadway networks into a single transportation network branded “YRC”. We incurred severance costs of $43.6 million, including $26.8 million in the National Transportation segment and $9.7 million in our Corporate segment as we reduced headcount in response to both the YRC integration and lower volumes. Our National Transportation segment also recorded an $18.4 million charge consisting of contract and lease cancellations related to the YRC integration. Finally, our YRC Logistics segment recorded $2.9 million of severance and $2.3 million of lease cancellation costs primarily in response to lower business levels.
In February 2008, we closed 27 service centers that were previously a part of Regional Transportation’s networks. As a part of this action, we incurred certain restructuring charges of approximately $12.4 million consisting of employee severance, lease cancellations and other incremental costs. In 2008, we also reduced our non-union headcount throughout the Company with a significant portion within the National Transportation segment. This action resulted in employee separation charges of approximately $8.9 million during the year ended December 31, 2008. Additionally, we closed a YRC Logistics facility in the United Kingdom and terminated a YRC Logistics service offering which resulted in closure charges, primarily lease cancellation charges, of approximately $1.2 million and $0.5 million, respectively.
During the year ended December 31, 2007, we announced several changes in our operations and incurred related restructuring charges. These organizational changes initially included bringing the management of Yellow Transportation and Roadway under one organization established as YRC National Transportation. In 2007, we also announced the consolidation of Reddaway and USF Bestway, two subsidiaries within our Regional Transportation segment. As part of the consolidation, effective February 12, 2007, we no longer market the USF Bestway brand. A final 2007 change resulted from YRC Logistics closing its Montgomery, Alabama flow through and warehousing facility. We incurred certain restructuring and other closure related charges in conjunction with these organizational changes consisting primarily of employee separation and contract termination costs.
64
Table of Contents
We reassess the accrual requirements under the above restructuring efforts at the end of each reporting period. Restructuring charges are included in “Salaries, wages and employees’ benefits” as it relates to employee separation costs and “Operating expenses and supplies” as it relates to contract terminations and other costs in the accompanying statements of operations.
A rollforward of the restructuring accrual is set forth below:
| (in millions) |
Employee Separation |
Contract Termination and Other Costs |
Total | |||||||||
| Balance at December 31, 2006 |
$ | 1.0 | $ | 6.5 | $ | 7.5 | ||||||
| Restructuring charges |
8.9 | 2.4 | 11.3 | |||||||||
| Adjustments (a) |
(0.5 | ) | (2.9 | ) | (3.4 | ) | ||||||
| Payments |
(5.8 | ) | (3.6 | ) | (9.4 | ) | ||||||
| Balance at December 31, 2007 |
$ | 3.6 | $ | 2.4 | $ | 6.0 | ||||||
| Restructuring charges |
13.0 | 10.0 | 23.0 | |||||||||
| Adjustments (a) |
— | (0.6 | ) | (0.6 | ) | |||||||
| Payments |
(10.4 | ) | (7.2 | ) | (17.6 | ) | ||||||
| Balance at December 31, 2008 |
$ | 6.2 | $ | 4.6 | $ | 10.8 | ||||||
| Restructuring charges |
43.6 | 23.9 | 67.5 | |||||||||
| Payments |
(43.3 | ) | (8.9 | ) | (52.2 | ) | ||||||
| Balance at December 31, 2009 |
$ | 6.5 | $ | 19.6 | $ | 26.1 | ||||||
| (a) | Included in adjustments are amounts credited to goodwill in accordance with purchase accounting requirements and reduction to accruals. |
5. Other Assets
The primary components of other assets at December 31 are as follows:
| (in millions) |
2009 | 2008 | ||||
| Equity method investments: |
||||||
| JHJ International Transportation Co., Ltd. |
$ | 42.0 | $ | 47.7 | ||
| Shanghai Jiayu Logistics Co., Ltd. |
16.1 | 44.6 | ||||
| Deferred debt costs |
87.4 | 16.1 | ||||
| Other |
24.7 | 11.5 | ||||
| Total |
$ | 170.2 | $ | 119.9 | ||
During the year ended December 31, 2009, we received dividends in the amount of $6.6 million from our China joint venture, JHJ International Transportation Co., Ltd.
The decrease in the value of our Jiayu investment in 2009 is primarily due to the impairment of $30.4 million previously discussed.
6. Employee Benefits
Pension and Other Postretirement Benefit Plans
Qualified and Nonqualified Defined Benefit Pension Plans
With the exception of YRC Logistics, Regional Transportation, YRC Reimer and certain of our other foreign subsidiaries, YRC Worldwide and its operating subsidiaries sponsor qualified and nonqualified defined benefit pension plans for most employees not covered by collective bargaining agreements (approximately 14,000 current, former and retired employees). Qualified and nonqualified pension benefits are based on years of service and the employees’ covered earnings. Employees covered by collective bargaining agreements participate in various multi-employer pension plans to which YRC Worldwide contributes, as discussed later in this section. YRC Logistics and Regional Transportation do not offer defined benefit pension plans and instead offer retirement benefits through either contributory 401(k) savings plans or profit sharing plans, as discussed later in this footnote. The existing YRC Worldwide defined benefit pension plans closed to new participants effective January 1, 2004 and were frozen effective July 1, 2008 as discussed below.
Our actuarial valuation measurement date for our pension plans and postretirement benefit plan (discussed below) is December 31.
65
Table of Contents
Other Postretirement Benefit Plan
Roadway sponsored a postretirement healthcare benefit plan that covers non-union employees of Roadway hired before February 1, 1997. Health care benefits under this plan end when the participant attains age 65.
Curtailment and Settlement Events
Effective June 1, 2008, we amended the postretirement healthcare benefit plan discussed above. This amendment eliminated cost sharing benefits for active employees that retire on or after June 1, 2008, provided for the current cost sharing provisions to retirees to terminate December 31, 2008, and allows retirees to participate in our healthcare programs on a full-cost basis effective January 1, 2009. As a result of these actions, we performed a remeasurement of the plan liability at June 1, 2008, factoring in applicable plan changes as well as an increase in the discount rate used in the calculation from 6.61% to 6.84%. The curtailment (via the amendment) and remeasurement of this plan resulted in a gain of $34.1 million during the year ended December 31, 2008, and is included in “Salaries, wages and employees’ benefits” in the accompanying statements of operations.
Effective July 1, 2008, we curtailed our defined benefit pension plans that cover approximately 14,000 employees not covered by collective bargaining agreements. As a result of this action, future benefit accruals were frozen effective July 1, 2008. However, employees may achieve early retirement eligibility based on age and continued service. We performed a remeasurement of these plans as of July 1, 2008, using a discount rate of 7.19%. The curtailment of these plans resulted in a gain of $63.3 million during the year ended December 31, 2008, and is included in “Salaries, wages and employees’ benefits” in the accompanying statements of operations.
As a result of the curtailment, the service and interest costs for the pension plans were reduced in the second half of 2008. At the same time, lump sum benefit payments increased during this period requiring a settlement charge of $8.7 million during the year ended December 31, 2008, and is included in “Salaries, wages and employees’ benefits” in the accompanying statements of operations.
During the year ended December 31, 2007, certain executives separated from the Company resulting in termination benefit costs of $1.5 million and settlement costs of $2.8 million. These amounts are presented herein as settlement costs of $4.3 million and are classified as “Salaries, wages and employees’ benefits” in the accompanying consolidated statement of operations.
66
Table of Contents
Funded Status
The reconciliation of the beginning and ending balances of the projected benefit obligation and the fair value of plan assets for the years ended December 31, 2009 and 2008, and the funded status at December 31, 2009 and 2008, is as follows:
| Pension Benefits | Other Postretirement Benefits |
|||||||||||
| (in millions) |
2009 | 2008 | 2008 | |||||||||
| Change in benefit obligation: |
||||||||||||
| Benefit obligation at prior year end |
$ | 961.8 | $ | 1,065.9 | $ | 32.3 | ||||||
| Service cost |
3.3 | 20.3 | 0.1 | |||||||||
| Interest cost |
61.1 | 65.8 | 0.7 | |||||||||
| Participant contributions |
— | — | 1.7 | |||||||||
| Benefits paid |
(93.3 | ) | (91.6 | ) | (5.8 | ) | ||||||
| Actuarial (gain) loss |
49.3 | (6.4 | ) | (5.1 | ) | |||||||
| Curtailment gain |
— | (91.1 | ) | — | ||||||||
| Plan amendments |
— | — | (23.9 | ) | ||||||||
| Other |
0.9 | (1.1 | ) | — | ||||||||
| Benefit obligation at year end |
$ | 983.1 | $ | 961.8 | $ | — | ||||||
| Change in plan assets: |
||||||||||||
| Fair value of plan assets at prior year end |
$ | 601.5 | $ | 928.9 | $ | — | ||||||
| Actual return on plan assets |
130.8 | (238.1 | ) | — | ||||||||
| Employer contributions |
3.3 | 4.0 | 4.1 | |||||||||
| Participant contributions |
— | — | 1.7 | |||||||||
| Benefits paid |
(93.3 | ) | (91.6 | ) | (5.8 | ) | ||||||
| Other |
1.2 | (1.7 | ) | — | ||||||||
| Fair value of plan assets at year end |
$ | 643.5 | $ | 601.5 | $ | — | ||||||
| Funded status at year end |
$ | (339.6 | ) | $ | (360.3 | ) | $ | — | ||||
The underfunded status of the plans of $339.6 million and $360.3 million at December 31, 2009 and 2008, respectively, is recognized in the accompanying consolidated balance sheets as shown in the table below. No plan assets are expected to be returned to the Company during the year ended December 31, 2010.
Benefit Plan Obligations
Amounts recognized in the consolidated balance sheets for pension benefits at December 31 are as follows:
| Pension Benefits | ||||||
| (in millions) |
2009 | 2008 | ||||
| Noncurrent assets |
$ | 2.2 | $ | 2.4 | ||
| Current liabilities |
2.2 | 2.6 | ||||
| Noncurrent liabilities |
339.6 | 360.1 | ||||
Amounts recognized in accumulated other comprehensive income at December 31 consist of:
| Pension Benefits | ||||||
| (in millions) |
2009 | 2008 | ||||
| Net actuarial loss |
$ | 257.0 | $ | 287.0 | ||
| Prior service cost |
0.1 | 0.1 | ||||
| Total |
$ | 257.1 | $ | 287.1 | ||
As shown above, included in accumulated other comprehensive income at December 31, 2009, are the following amounts that have not yet been recognized in net periodic pension cost: unrecognized prior service costs of $0.1 million and unrecognized actuarial losses of $257.0 million ($162.6 million, net of tax). The prior service cost included in accumulated other comprehensive income and expected to be recognized in net periodic pension cost during the year ended December 31, 2010, is immaterial and the actuarial loss included in accumulated other comprehensive income and expected to be recognized in net periodic cost during the year ended December 31, 2010, is $5.3 million ($3.3 million, net of tax).
67
Table of Contents
The total accumulated benefit obligation for all plans was $981.9 million and $960.7 million at December 31, 2009 and 2008, respectively.
Information for pension plans with an accumulated benefit obligation (“ABO”) in excess of plan assets at December 31:
| 2009 | 2008 | |||||||||||||||||
| (in millions) |
ABO Exceeds Assets |
Assets Exceed ABO |
Total | ABO Exceeds Assets |
Assets Exceed ABO |
Total | ||||||||||||
| Projected benefit obligation |
$ | 976.9 | $ | 6.2 | $ | 983.1 | $ | 956.2 | $ | 5.6 | $ | 961.8 | ||||||
| Accumulated benefit obligation |
976.9 | 5.0 | 981.9 | 956.2 | 4.5 | 960.7 | ||||||||||||
| Fair value of plan assets |
635.1 | 8.4 | 643.5 | 593.5 | 8.0 | 601.5 | ||||||||||||
Assumptions
Weighted average actuarial assumptions used to determine benefit obligations at December 31:
| Pension Benefits | Other Postretirement Benefits | |||||||
| 2009 | 2008 | 2008 | ||||||
| Discount rate |
6.15 | % | 6.52 | % | 6.52% | |||
Weighted average assumptions used to determine net periodic benefit cost for the years ended December 31:
| Pension Benefits | Other Postretirement Benefits |
||||||||||||||
| 2009 | 2008 | 2007 | 2008 | 2007 | |||||||||||
| Discount rate |
6.52 | % | 6.61 | %(a) | 6.12 | % | 6.61 | % | 6.12 | % | |||||
| Discount rate |
— | 7.19 | %(b) | — | 6.84 | % | — | ||||||||
| Rate of increase in compensation levels |
4.00 | % | 4.15 | % | 3.74 | % | — | — | |||||||
| Expected rate of return on assets |
8.50 | % | 8.50 | % | 8.75 | % | — | — | |||||||
| (a) | Pre 2008 curtailment |
| (b) | Post 2008 curtailment |
The discount rate refers to the interest rate used to discount the estimated future benefit payments to their present value, also referred to as the benefit obligation. The discount rate allows us to estimate what it would cost to settle the pension obligations as of the measurement date, December 31, and is used as the interest rate factor in the following year’s pension cost. We determine the discount rate by choosing a portfolio of high quality (those rated AA- or higher by Standard & Poors) non-callable bonds such that the coupons and maturities approximate our expected benefit payments. When developing the bond portfolio, there are some years when benefit payments are expected with no corresponding bond maturing. In these instances, we estimated the appropriate bond by interpolating yield characteristics between the bond maturing in the immediately proceeding year and the bond maturing in the next available year. This analysis is performed on a biannual basis (most recent as of December 31, 2009) or more frequently when specific events require a current analysis. For the years that we do not prepare a bond matching analysis, we utilize a spread against a specific index, the Citigroup Pension Liability Index, which is consistent with the actual spread observed in the year the analysis is performed.
In determining the expected rate of return on assets, we consider our historical experience in the plans’ investment portfolio, historical market data and long-term historical relationships as well as a review of other objective indices including current market factors such as inflation and interest rates. Although plan investments are subject to short-term market volatility, we believe they are well diversified and closely managed. Our asset allocation as of December 31, 2009, consisted of 61% in equities, 32% in debt securities and 7% in a specific hedge fund. These allocations are consistent with the targeted long-term asset allocation for the plans. Based on various market factors, we selected an expected rate of return on assets of 8.25% effective for the 2009 valuation. We will continue to review our expected long-term rate of return on an annual basis and revise appropriately. The pension trust holds no YRC Worldwide securities.
68
Table of Contents
Future Contributions and Benefit Payments
We expect to contribute approximately $14.0 million to our pension plans in 2010.
Expected benefit payments for each of the next five years ended December 31 are as follows:
| (in millions) |
2010 | 2011 | 2012 | 2013 | 2014 | 2015-2019 | ||||||||||||
| Expected benefit payments |
$ | 56.1 | $ | 57.4 | $ | 59.6 | $ | 62.7 | $ | 65.1 | $ | 357.9 | ||||||
Pension and Other Postretirement Costs
The components of our net periodic pension cost, other postretirement costs and other amounts recognized in other comprehensive income for the years ended December 31, 2009, 2008 and 2007 were as follows:
| Pension Costs | Other Postretirement Costs |
|||||||||||||||||||
| (in millions) |
2009 | 2008 | 2007 | 2008 | 2007 | |||||||||||||||
| Net periodic benefit cost: |
||||||||||||||||||||
| Service cost |
$ | 3.3 | $ | 20.3 | $ | 39.3 | $ | 0.1 | $ | 0.4 | ||||||||||
| Interest cost |
61.1 | 65.8 | 65.5 | 0.7 | 1.9 | |||||||||||||||
| Expected return on plan assets |
(56.0 | ) | (70.3 | ) | (69.7 | ) | — | — | ||||||||||||
| Amortization of prior service cost |
— | 0.6 | 1.4 | (23.6 | ) | 0.2 | ||||||||||||||
| Amortization of net loss (gain) |
3.9 | 1.0 | 7.9 | (10.7 | ) | (0.2 | ) | |||||||||||||
| Curtailment and settlement (gains) loss, net |
1.3 | (54.6 | ) | 4.3 | — | — | ||||||||||||||
| Net periodic pension cost (benefit) |
$ | 13.6 | $ | (37.2 | ) | $ | 48.7 | $ | (33.5 | ) | $ | 2.3 | ||||||||
| Other changes in plan assets and benefit obligations recognized in other comprehensive income (loss): |
||||||||||||||||||||
| Net loss (gain) |
$ | (29.3 | ) | $ | 301.0 | $ | (77.5 | ) | $ | 5.7 | $ | (1.2 | ) | |||||||
| Prior service cost |
— | (0.6 | ) | (1.3 | ) | (0.3 | ) | (0.2 | ) | |||||||||||
| Curtailment and settlement loss |
(1.3 | ) | (36.4 | ) | — | — | — | |||||||||||||
| Total recognized in other comprehensive income |
(30.6 | ) | 264.0 | (78.8 | ) | 5.4 | (1.4 | ) | ||||||||||||
| Total recognized in net periodic benefit cost and other comprehensive income |
$ | (17.0 | ) | $ | 226.8 | $ | (30.1 | ) | $ | (28.1 | ) | $ | 0.9 | |||||||
The amortization of prior service costs and net gain above totaling $34.3 million for other postretirement costs for the year ended December 31, 2008, includes the effect of the plan amendment that curtailed benefits under this plan.
During the years ended December 31, 2009, 2008 and 2007, the income tax provision related to amounts in other comprehensive income (net gain and prior service cost) was $11.8 million, $98.9 million and $29.4 million, respectively.
Fair Value Measurement
Our pension assets are stated at fair value. Fair value is the price that would be received to sell an asset or paid to transfer a liability in an orderly transaction between market participants at the measurement date. The majority of our assets are invested in common/collective trust funds that are valued at quoted redemption values that represent the net asset values of units held at year-end which we have determined approximates fair value. This process of using the net asset value to approximate fair value is permitted under ASU 2009-12, “Investments in Certain Entities that Calculate Net Asset Value per Share (or its Equivalent)” which we adopted as of December 31, 2009.
Alternative investments, including investments in hedge funds do not have readily available market values. These estimated fair values may differ significantly from the values that would have been used had a ready market for these investments existed, and such differences could be material. Investments in hedge funds that do not have an established market are valued at net asset values as determined by the investment managers, which we have determined approximates fair value.
69
Table of Contents
The table below details by level, within the fair value hierarchy, the pension assets at fair value as of December 31, 2009:
| Pension Assets at Fair Value as of December 31, 2009 | ||||||||||||
| (in millions) |
Level 1 | Level 2 | Level 3 | Total | ||||||||
| Common/collective trust funds: |
||||||||||||
| Equity funds |
$ | — | $ | 391.9 | $ | — | $ | 391.9 | ||||
| Fixed income funds |
— | 204.4 | — | 204.4 | ||||||||
| Hedge funds |
— | — | 41.1 | 41.1 | ||||||||
| Interest bearing fund |
6.1 | — | — | 6.1 | ||||||||
| Total Plan Assets |
$ | 6.1 | $ | 596.3 | $ | 41.1 | $ | 643.5 | ||||
The table below presents the activity of our assets measured at fair value on a recurring basis using significant unobservable inputs (Level 3) for the year ended December 31, 2009:
| (in millions) |
Hedge funds | ||
| Balance, beginning of year |
$ | 38.0 | |
| Purchases and settlements, net |
— | ||
| Unrealized gain |
3.1 | ||
| Balance, end of year |
$ | 41.1 | |
Executive Supplemental Retirement Benefits
We maintain individual benefit arrangements for a limited number of current and former senior executives that are accounted for in accordance with APB No. 12, “Deferred Compensation Contracts” (now included in FASB ASC Topic 710). The obligation is unfunded and is actuarially determined using a discount rate of 8.25%, a lump sum rate based on the Moody’s bond rate and the RP-2000 mortality table. At December 31, 2009 and 2008, we have accrued $10.8 million and $9.9 million, respectively, for this plan. The long-term obligation is classified in “Pension and postretirement liabilities” in the accompanying balance sheets. The related expense for these arrangements is not material.
Multi-Employer Plans
YRC, New Penn, Holland and Reddaway contribute to approximately 90 separate multi-employer health, welfare and pension plans for employees that our collective bargaining agreements cover (approximately 70% of total YRC Worldwide employees), including 37 pension plans. Our labor agreements with the International Brotherhood of Teamsters (the “Teamsters”) determine the amounts of these contributions. The pension plans provide defined benefits to retired participants. We recognize as net pension cost the contractually required contribution for the period and recognize as a liability any contributions due and unpaid. We do not directly manage multi-employer plans. The trusts covering these plans are generally managed by trustees, half of whom the Teamsters appoint and half of whom various contributing employers appoint. We expensed the following amounts to these plans for the years ended December 31:
| (in millions) |
2009 | 2008 | 2007 | ||||||
| Health and welfare |
$ | 407.2 | $ | 532.4 | $ | 555.3 | |||
| Pension |
267.1 | 554.1 | 578.0 | ||||||
| Total |
$ | 674.3 | $ | 1,086.5 | $ | 1,133.3 | |||
The decrease in expense in 2009 is due to a reduction in union headcount and a cessation of pension benefits in the second half of 2009. See further discussion in the “Liquidity” note.
From January to August 2009, we have deferred payment of certain of our contributions to multi-employer pension funds. These deferred payments have been expensed and the liability recorded as either debt or deferred contribution obligations. From August 2009 through December 2010, our obligations to make certain multi-employer pension contributions under certain of our collective bargaining agreements have been temporarily terminated, so no expense is required to be recognized. See the “Liquidity” Note for further discussion.
In 2006, the Pension Protection Act became law and modified both the Internal Revenue Code (as amended, the “Code”) as it applies to multi-employer pension plans and the Employment Retirement Income Security Act of 1974 (as amended, “ERISA”). The Code and ERISA (in each case, as so modified) and related regulations establish minimum funding requirements for multi-employer pension plans. The funding status of these plans is determined by the following factors:
| • | the number of participating active and retired employees |
70
Table of Contents
| • | the number of contributing employers |
| • | the amount of each employer’s contractual contribution requirements |
| • | the investment returns of the plans |
| • | plan administrative costs |
| • | the number of employees and retirees participating in the plan who no longer have a contributing employer |
| • | the discount rate used to determine the funding status |
| • | the actuarial attributes of plan participants (such as age, estimated life and number of years until retirement) |
| • | the benefits defined by the plan |
If any of our multi-employer pension plans fails to:
| • | meet minimum funding requirements; |
| • | meet a required funding improvement or rehabilitation plan that the Pension Protection Act may require for certain of our underfunded plans’ |
| • | obtain from the IRS certain changes to or a waiver of the requirements in how the applicable plan calculates its funding levels; or |
| • | reduce pension benefits to a level where the requirements are met, |
the Pension Protection Act could require us to make additional contributions to the multi-employer pension plan from five to ten percent of the contributions that our labor agreement requires until the labor agreement expires. Our labor agreement, however, provides that if additional contributions are required that money designated for certain other benefits would be reallocated to pay for the additional contributions.
If we fail to make our required contributions to a multi-employer plan under a funding improvement or rehabilitation plan or if the benchmarks that an applicable funding improvement plan provides are not met by the end of a prescribed period, the IRS could impose an excise tax on us with respect to the plan. These excise taxes are not contributed to the deficient funds, but rather are deposited in the United States general treasury funds. The Company does not believe that the temporary termination of certain of its contributions to applicable multi-employer pension funds from August 2009 through December 2010 will give rise to these excise taxes as these contributions are not required for this period.
Depending on the amount involved, a requirement to increase contributions beyond our contractually agreed rate or the imposition of an excise tax on us could have a material adverse impact on the financial results of YRC Worldwide.
As discussed above, pension benefits and in turn our contributions ceased in July 2009 in accordance with the terms of our modified labor agreement. This cessation expires January 1, 2011 at which point we expect to resume contributions. We do not believe the temporary cessation precludes our exposure with respect to funding obligations or excise tax possibilities.
401(k) Savings Plans and Profit Sharing Plans
Effective December 31, 2008, we merged all domestic 401(k) savings plans and profit sharing plans into the YRC Retirement Savings Plan that continues to provide for both fixed matching percentage and a discretionary amount. In light of the current economy, as of January 1, 2009, we have suspended all employer matching contributions.
YRC Worldwide and its operating subsidiaries sponsored defined contribution plans, primarily for employees that collective bargaining agreements do not cover. The plans principally consist of contributory 401(k) savings plans and noncontributory plans. In 2008 and 2007, the YRC Worldwide contributory 401(k) savings plan (YRC Retirement Savings Plan) consisted of both a fixed matching percentage and a discretionary amount. The maximum nondiscretionary company match for the YRC Worldwide plan is equal to 25% of the first 6% in cash and 25% of the first 6% in YRC Worldwide common stock, for a total match of 50% of the first 6% of before-tax participant contributions. Effective in October 2008, the entire employer match was satisfied with cash versus cash and common stock. Any discretionary contributions for the YRC Worldwide 401(k) savings plan are determined annually by the Board of Directors and may be in the form of cash, stock or other property. YRC Regional Transportation sponsored a 401(k) plan for its operating companies where eligible employees can contribute up to 50% of their cash compensation and each of the operating companies may also contribute a discretionary amount. New Penn sponsored a 401(k) plan that, effective January 1, 2007, provided for a company match similar to that provided by the YRC Worldwide plan. Employer contributions for the year ended December 31, 2008 and 2007, were $24.7 million and $31.0 million, respectively. No amounts were contributed in 2009.
71
Table of Contents
Effective January 1, 2004, YRC Worldwide established a noncontributory profit sharing plan that included a nondiscretionary company contribution based on years of participation service and compensation, with a maximum fixed contribution of 5% of compensation for more than ten years of participation service. This profit sharing plan also provided for a discretionary performance based contribution of a maximum of 2 1/2% of compensation. The Board of Directors determined any discretionary contributions annually. Contributions have been made in cash. In May 2008, this plan was suspended and effective December 31, 2008, merged into the YRC Retirement Savings Plan. New Penn provided a noncontributory profit sharing plan for employees not covered by collective bargaining agreements. Any contributions were discretionary employer contributions. Employer contributions to our noncontributory profit sharing plans in 2008 and 2007, totaled $5.4 million and $3.8 million, respectively. No amounts were contributed in 2009.
Our employees covered under collective bargaining agreements may also participate in union-sponsored 401(k) plans. We do not make employer contributions to the plans on their behalf.
Performance Incentive Awards
YRC Worldwide and its operating subsidiaries each provide annual performance incentive awards and more frequent sales incentive awards to certain non-union employees, which are based primarily on actual operating results achieved compared to targeted operating results or sales targets and are paid in cash. Operating income in 2009, 2008 and 2007, included performance incentive expense for non-union employees of $8.0 million, $21.9 million, and $22.7 million, respectively. We generally pay annual performance incentive awards in the first quarter of the following year and sales performance incentive awards on a monthly basis.
Other
We provide a performance based long-term incentive plan to key management personnel that provides the opportunity annually to earn cash and share unit awards based on a certain defined performance period. In addition, we utilize share units to further compensate certain levels of management and our Board of Directors. The share units are more fully described in the “Stock Compensation Plans” footnote. During the years ended December 31, 2009, 2008 and 2007, compensation expense related to these awards was $6.9 million, $8.4 million and $14.3 million, respectively.
7. Liquidity
The economic environment in 2009 had a dramatic effect on our industry as we experienced the greatest U.S. recession since World War II. This great recession substantially and negatively impacted our customers’ needs to ship and, therefore, negatively impacted the volume of shipments that we handled and the price that we received for our services. As a result, we experienced lower year-over-year revenue (primarily a function of declining volume), greater operating losses and negative cash flow. In addition, we believe that many of our existing customers reduced their business with us due to their concerns regarding our financial condition and the integration of our national business in March 2009, which contributed to our operating losses and operating cash flow deficits.
As a part of our comprehensive recovery plan, we have executed on a number of significant initiatives during 2009 to respond to these conditions, which are described more fully below. As we continue to improve our service and stabilize our financial condition, we anticipate the return of shipping volume from customers who have shifted their business to other providers because of their concerns regarding our financial condition. However, we cannot predict how quickly and to what extent this business will return. On a sequential basis, while revenue declines continued, our operating results improved from the second quarter to the third quarter of 2009 by $182 million and by $31 million from the third quarter to the fourth quarter of 2009, and our operating cash flow deficits decreased from the second quarter to the third quarter of 2009 by $77 million and by $10 million from the third quarter to the fourth quarter of 2009. Sequential improvements were driven by successful cost reductions and liquidity actions within our comprehensive recovery plan which we discuss below.
Comprehensive Recovery Plan
In light of the current economic environment and the resulting challenging business conditions, we have implemented or are in the process of implementing the following actions (among others) as part of our comprehensive recovery plan to reduce our cost structure and improve our operating results, cash flow from operations, liquidity and financial condition:
| • | the integration in March 2009 of our Yellow Transportation and Roadway networks into a single service network, now branded “YRC”. See “—YRC Integration” below. |
| • | the discontinuation in March 2009 of the geographic service overlap between our Holland and New Penn networks. |
| • | the first quarter implementation of a 10% wage reduction for substantially all of our employees (both union and non-union). See “—Ratification of Collective Bargaining Agreement Modification” below. |
72
Table of Contents
| • | the deferral of payment of certain contributions to our union multi-employer pension funds, mostly in the first half of 2009, pursuant to a Contribution Deferral Agreement. See “—Pension Contribution Deferral Obligations” below. |
| • | reductions in the number of terminals to right-size our transportation networks to current shipment volumes. At December 31, 2008, we operated 711 terminals; at December 31, 2009, we reduced the number of terminals we operate to 511. |
| • | the August 2009 implementation of an additional 5% wage reduction for substantially all of our union employees. See “—Ratification of Collective Bargaining Agreement Modification” below. |
| • | the temporary cessation of pension contributions to certain of our union multi-employer pension funds starting in July 2009 through December 31, 2010, which cessation eliminates the need to recognize expense for these contributions during this period. See “—Ratification of Collective Bargaining Agreement Modification” below. |
| • | suspension of company matching 401(k) contributions for non-union employees |
| • | the sale of excess property and equipment, primarily resulting from the integration of the Yellow Transportation and Roadway networks |
| • | the sale and leaseback of core operating facilities. See “—Lease Financing Transactions” below. |
| • | reductions in our workforce to scale our business to current shipping volumes. At December 31, 2008, we had approximately 55,000 employees; at December 31, 2009, our workforce was reduced to approximately 36,000 employees. |
| • | other cost reduction measures in general, administrative and other areas. |
| • | changes to our overall risk management structure to reduce our letter of credit requirements. |
| • | amendments to our Credit Agreement (defined below) to provide us greater access to the liquidity that our revolving credit facility provides and the deferral of interest and fees that we pay to our lenders, subject to the conditions that the amended Credit Agreement requires. See “—Credit Agreement” below. |
| • | a renewal and amendment of our ABS Facility (defined below) to defer a significant portion of the fees in connection with our ABS Facility, subject to certain conditions. See “—ABS Facility” below. |
| • | an amendment to our Contribution Deferral Agreement, pursuant to which certain of our union multi-employer pension funds agreed to defer the payment of interest on our deferred obligations, and to defer the beginning of installment payments of previously deferred contributions, in each case, subject to the conditions that the Contribution Deferral Agreement requires. See “—Pension Contribution Deferral Obligations” below. |
| • | our completion of an exchange offer (the “Exchange Offer”) to exchange a significant portion of our outstanding 8 1/2% USF senior notes and contingent convertible notes for common stock and preferred stock of the Company. See “—Exchange Offers” below. |
| • | the execution of a Note Purchase Agreement (defined below) in February 2010 for the issuance of up to $70 million of 6% Notes (defined below) and the subsequent issuance of $49.8 million of the 6% Notes used to satisfy the $45 million remaining 8 1/2% USF senior notes. See “—Convertible Notes Placement Transaction” below. |
Certain of these actions are further described below. The final execution of our comprehensive recovery plan has certain risks that are not within our control that may adversely impact our liquidity and compliance with the financial covenants in our credit facilities. See “—Risks and Uncertainties Regarding Future Liquidity” below.
YRC Integration
In March 2009, we completed the integration of our Yellow Transportation and Roadway networks into one service network, now branded “YRC”. During the integration, we believe that many of our customers reduced their shipments with us to mitigate their risks from our integration. As our service improved from the March 2009 integration, many of these customers returned their shipping volumes to us, and we added new customers. However, these volumes did not return as quickly as we had anticipated. As a result of the successful integration, we have been able to implement a number of significant cost savings actions, including reducing the number of terminals, reducing headcount and decreasing our fleet size.
Ratification of Collective Bargaining Agreement Modification
In August 2009, the employees in most of our bargaining units who are represented by the International Brotherhood of Teamsters (the “Teamsters”) ratified a modification to our collective bargaining agreement. The modification provides (among other things) the following:
| • | a temporary cessation of the requirement for the Company’s subsidiaries to make contributions on behalf of most of the Company’s Teamster represented employees to union multi-employer pension funds from July 2009 through December 31, 2010. These contributions will not need to be repaid in the future and, therefore, will be a cost reduction during this period. |
| • | a 15% wage reduction (which includes the 10% wage reduction previously implemented in January 2009) for most of the Company’s Teamster represented employees that is in effect until our current collective bargaining agreement expires at the end of March 2013. |
73
Table of Contents
| • | a reduction in the increase in contributions to multiemployer health and welfare plans from $1.00 per hour for each year to $0.20 per hour that occurred on August 1, 2009 and to $0.40 per hour that is scheduled for August 1, 2010. |
| • | the establishment of a stock option plan (and related stock appreciation rights plan) for participating union employees, providing for options to purchase 263.7 million shares of the Company’s common stock. This stock option plan (and the related stock appreciate rights plan) were established on March 1, 2010. Under the plans each qualified employee will receive an equal number of options and stock appreciation rights. The vast majority of options (and related stock appreciation rights) were granted on March 1, 2010 with a strike price of 48 cents per share. The stock options were granted subject to approval by the Company’s shareholders. If, at a meeting called to approve these options, the shareholders of the Company approve the options, the stock appreciation rights will be terminated and forfeited. If the Company’s shareholders do not approve the options, the options will be terminated and forfeited and the stock appreciation rights will remain in their place. |
| • | during the period in which the temporary pension contribution cessation is in effect, subject to the approval of the Company’s board of directors, which approval may not be unreasonably withheld, the Company is required to appoint a director that the Teamsters nominate. This person has not yet been nominated. |
As with prior ratification elections, a small number of the bargaining units representing less than 10% of our Teamster employees did not initially ratify the labor agreement modifications in August 2009. The Company and the Teamsters have since addressed employee concerns and most of these units have either subsequently ratified the modifications or have merged or will merge with other bargaining units that have previously ratified the modifications. In one case, a unit representing less than 2% of our Teamster employees has approved the temporary cessation of the contributions for unit employees to a multi-employer pension fund. The Company has continued to discuss with this unit the ratification of the other provisions of the collective bargaining agreement modification. Dockworkers represented by another unit (representing less than 3.5% of Teamster employees) have merged with another bargaining unit that has previously implemented the modifications. Even so, the Company has only implemented the temporary pension contribution cessation provisions of the modifications as these employees have rejected the modification in prior ratification votes. The Company believes that it can impose all of the labor agreement modifications due to the merger of the unit with another larger bargaining unit that previously ratified the modifications. However, the Company is working with these employees to determine if they will consensually approve the modifications to avoid a labor dispute with this unit. Another group representing less than 5% of our Teamster employees, mostly Reddaway employees, continues to consider the modifications. These Reddaway units do not impact contributions to multi-employer pension funds, as the units do not currently participate in these funds.
CREDIT FACILITIES
We have two primary liquidity vehicles:
| • | the Credit Agreement dated as of August 17, 2007 (as amended, the “Credit Agreement”), among the Company, certain of our subsidiaries, JPMorgan Chase, National Association, as administrative agent, and the other agents and lenders named therein, and |
| • | an asset based securitization facility (as amended, the “ABS Facility”), whereby we receive financing through the sale of certain of our accounts receivable. |
The Credit Agreement and the ABS Facility are collectively referred to herein as the “credit facilities”.
Credit Agreement
The Credit Agreement provides us with a $950 million senior revolving credit facility, including sublimits available for borrowings under certain foreign currencies and for letters of credit, and a senior term loan in an aggregate outstanding principal amount of approximately $111.5 million. During 2009, the Company entered into a number of amendments to the Credit Agreement that address liquidity and covenant relief. Set forth below is a discussion of the terms of the Credit Agreement in its current form after giving effect to these amendments.
— Revolver Reserve
The revolver reserve is a sub-portion of the $950 million senior revolving credit facility. The revolver reserve is equal to the amount of mandatory prepayments that we make under the Credit Agreement of a varying percentage of net cash proceeds from certain asset sales starting in 2009. These asset sales included sales of excess real estate, real estate subject to sale and leaseback transactions and the Company’s fleet business that was part of YRC Logistics.
74
Table of Contents
The total amount of the revolver reserve was approximately $160 million at December 31, 2009. The Credit Agreement divides the revolver reserve into three blocks:
| • | the existing revolver reserve (performance) block; this block was approximately $56 million and fully drawn upon as of January 6, 2010; this block will be decreased by mandatory prepayments of net cash proceeds from certain asset sales and any excess cash flow sweeps; |
| • | the existing revolver reserve (payroll) block; this block remains at $50 million until termination of the Credit Agreement, and the Company has not drawn this block as of March 16, 2010; and |
| • | the new revolver reserve block; this block was approximately $53.8 million at December 31, 2009, and the Company has not drawn this block as of March 16, 2010; this block will be increased by mandatory prepayments of net cash proceeds from certain asset sales and any excess cash flow sweeps. |
Each block comprising a portion of the revolver reserve has its own separate conditions to borrowing, which include of particular note:
| • | existing revolver reserve (performance) block |
| • | after giving effect to each borrowing, unrestricted Permitted Investments (as defined in the Credit Agreement) are less than or equal to $125 million (or, $100 million to the extent that any Permitted Interim Loans (as defined in the Credit Agreement) are outstanding) (the “Anti-Cash Hoarding Condition”); |
| • | either (i) the Company meets certain specified minimum weekly operating thresholds based on earnings before interest, taxes, depreciation and amortization (“EBITDA”) and maintains certain monthly selling, general and administrative (“SG&A”) expense amounts below specified maximum thresholds or (ii) 66 2/3% of the lenders approve the borrowing; |
| • | existing revolver reserve (payroll) block |
| • | satisfaction of the Anti-Cash Hoarding Condition; |
| • | the Company has Interim Loan Availability (as defined in the Credit Agreement) and the draw on such existing revolver reserve (payroll) block does not exceed the Interim Loan Availability; |
| • | new revolver reserve block |
| • | satisfaction of the Anti-Cash Hoarding Condition; |
| • | the existing revolver reserve (performance) block has been fully borrowed; |
| • | the Company obtains the approval of 66 2/3% of the lenders; and |
| • | the Company pays all amounts outstanding under our 5% Notes that retain a put right to require it to repurchase such notes prior to February 2013. |
As of March 16, 2010, we would meet the conditions to borrowing of the existing revolver reserve (payroll) block. Pursuant to the Credit Agreement, on January 1, 2012 (or such later date as may be agreed to by 66 2/3% of the lenders), subject to early termination upon a Deferral Termination Event (defined below), the revolving commitments will be permanently reduced by an amount equal to the reserve amount.
— Interest and Fee Deferrals
The lenders agreed to defer the payment of revolver and term loan interest, letter of credit fees and commitment fees, subject to the deferral exceptions and termination events discussed below, for the period:
| • | beginning December 31, 2009, and |
| • | ending on December 31, 2010, subject to an extension until December 31, 2011 if agreed to by 66 2/3% of the lenders. |
As of February 28, 2010 and December 31, 2009, the amounts deferred under the above provision were $32.2 million and $19.1 million, respectively. The Company expects the deferred interest and fees to be approximately $20 million per quarter. Deferred amounts are due on December 31, 2011.
— Deferral Exceptions and Termination Events
There are exceptions and termination events with respect to the interest and fee deferral described above, including (among others) the following:
| • | no further interest and fees will be deferred and all previously deferred amounts will become payable at the election of a majority of the lenders, upon the occurrence of certain specified events, including (among others) the following, unless 66 2/3% of the lenders agree otherwise (each, a “Deferral Termination Event”): |
| • | the modification to our collective bargaining agreement (described above in “—Ratification of Collective Bargaining Agreement Ratification”) terminates or is amended or otherwise modified (including, by the operation of any “snapback” or similar provisions) in any way that is adverse to the Company or the lenders in a manner that could reasonably be expected, individually or in the aggregate, to result in an impact of greater than $5 million in any calendar year; |
75
Table of Contents
| • | the Company amends or otherwise modifies the Contribution Deferral Agreement and related agreements in any way that is adverse to the Company or the lenders; or |
| • | the Company makes any cash payment of any pension fund obligations and any interest thereon that the Company deferred in 2009 under the Contribution Deferral Agreement other than: |
| • | payments of proceeds resulting from the sale of real property that collateralizes the deferred pension obligations and which the pension funds have a first lien; or |
| • | payments of permitted fees and expenses. |
| • | no further interest and fees will be deferred upon any cash payment (other than payments described in the preceding bullets) of any pension fund liabilities (and any interest thereon) due prior to December 31, 2011 other than certain permitted payments, including payments to the Company’s single employer pension plans that are required to be made pursuant to ERISA and payments to certain multiemployer pension plans that generally are not participating in the Contribution Deferral Agreement (each, a “Deferral Suspension Event”). Any deferred interest and fees will not become due and payable solely as a result of a Deferral Suspension Event. |
| • | commencing on January 1, 2011, |
| • | if after giving effect to an interest or fee payment on the applicable interest or fee payment date, the Available Interest Payment Amount (as defined in the Credit Agreement) on the interest or fee payment date would be equal to or greater than $150 million, the Company must make such payment in full in cash on the interest or fee payment date, and |
| • | to the extent that the Available Interest Payment Amount on any business day exceeds $225 million, the Company must apply the excess over $225 million to pay previously deferred interest and fees. |
— Mandatory Prepayments
Under the Credit Agreement, we are obligated to make mandatory prepayments on an annual basis of any excess cash flow (as defined in the Credit Agreement) and upon the receipt of net cash proceeds from certain asset sales and the issuance of equity and if we have an average liquidity amount for the immediately preceding five business days in excess of $250 million. The percentage of net cash proceeds received and the manner in which they are applied varies as set forth in greater detail in the Credit Agreement.
On March 11, 2010, we entered into Amendment No. 16 to the Credit Agreement, which provides that, upon obtaining the consent of each pension fund party to the Contribution Deferral Agreement, 100% of the net cash proceeds received from certain permitted dispositions must each be used to make a mandatory prepayment, as follows:
| • | 50% of such net cash proceeds will be applied against the non-revolver reserve portion of the revolver and may be reborrowed, subject to satisfaction of the applicable borrowing conditions, and |
| • | the other 50% of such net cash proceeds will be applied against the revolver reserve (and will result in a corresponding commitment reduction thereto). |
Prior to the consent of the pension funds, any net cash proceeds received from these permitted dispositions will be applied in the manner set forth in the Credit Agreement prior to Amendment No. 16.
— Asset Sales
The Credit Agreement allowed us to receive up to $400 million of net cash proceeds from asset sales in 2009 and allows us to receive up to $200 million of net cash proceeds from asset sales in 2010 and up to 10% of our consolidated total assets during each fiscal year thereafter, which limits do not include net cash proceeds received from certain asset sales, including the following:
| • | the sale of real estate that constitutes first lien collateral of the pension funds pursuant to the Contribution Deferral Agreement, |
| • | the initial sale and lease back transaction completed with NATMI Truck Terminals, LLC (“NATMI”) in the first half of 2009, and |
| • | permitted dispositions approved by a majority of the lenders. |
We may only consummate future sale and leaseback transactions if a majority of our bank lenders approve or have previously approved the transactions.
76
Table of Contents
— Financial Covenants
The Credit Agreement requires that the Company maintain minimum consolidated EBITDA and maximum capital expenditure levels, as follows:
| Period |
Minimum Consolidated EBITDA | ||
| For the quarter ending on June 30, 2010 |
$ | 31.5 million | |
| For the two consecutive quarters ending September 30, 2010 |
$ | 107 million | |
| For the three consecutive quarters ending December 31, 2010 |
$ | 173 million | |
| For the four consecutive quarters ending March 31, 2011 |
$ | 270 million | |
| For the four consecutive quarters ending June 30, 2011 |
$ | 270 million | |
| For the four consecutive quarters ending September 30, 2011 |
$ | 280 million | |
| For the four consecutive quarters ending December 31, 2011 |
$ | 270 million | |
| For the four consecutive quarters ending March 31, 2012 |
$ | 300 million | |
| For the four consecutive quarters ending June 30, 2012 |
$ | 330 million | |
| Period |
Maximum Capital Expenditures | ||
| For the fourth fiscal quarter in 2009 |
$ | 30 million | |
| For the four consecutive quarters ending December 31, 2009 |
$ | 60 million | |
| For any single quarter in 2010 |
$ | 57.5 million | |
| For the four consecutive quarters ending December 31, 2010 |
$ | 115 million | |
| For any single quarter in 2011 |
$ | 72.5 million | |
| For the four consecutive quarters ending December 31, 2011 |
$ | 145 million | |
| For any single quarter in 2012 |
$ | 50 million | |
Our Minimum Available Cash (as defined in the Credit Agreement) covenant requires that, (i) commencing on April 1, 2010, we have at least $25 million of Available Cash (as defined in the Credit Agreement) at all times, and (ii) commencing October 1, 2010, we have at least $50 million of Available Cash at all times thereafter. Available Cash is determined on each business day based on the average Available Cash as of the end of business for the immediately preceding three business days.
— Annual Financial Statements
On March 11, 2010, we entered into Amendment No. 16 to the Credit Agreement that modified the affirmative covenant that required receipt of financial statements for fiscal year ended 2009 with an audit opinion that did not include a “going concern” exception to permit receipt of an audit opinion with a “going concern” exception.
As of December 31, 2009 and the date of this report, we were in compliance with the covenants of our Credit Agreement.
— Teamster Approval of the Credit Agreement
The August 2009 modification to our collective bargaining agreement with the Teamsters requires, among other things, that we enter into a bank amendment that is acceptable to the Teamsters. The Teamsters National Freight Industry Negotiating Committee (“TNFINC”) certified to us that Amendment No. 12 to the Credit Agreement was satisfactory to the Teamsters, subject to the following conditions (among others):
| • | if the Company requests a borrowing or letter of credit pursuant to the Credit Agreement under circumstances where 66 2/3% of the lenders must approve the borrowing or letter of credit, then 66 2/3% of the lenders do so approve the borrowing or letter of credit |
| • | the lenders under the Credit Agreement continue to defer revolver and term loan interest, letter of credit fees and commitment fees in 2011 |
| • | to the extent a Default or an Event of Default (as each are defined in the Credit Agreement) occurs or additional amendments to the Credit Agreement are consummated, no lender: |
| • | exercises any remedies that result in the acceleration of the payment of any of the obligations under the Credit Agreement; |
77
Table of Contents
| • | amends or provides waivers with respect to the Credit Agreement that result in any further increase in interest or fees under the Credit Agreement; |
| • | obtains a judgment to foreclose on any collateral securing the obligations under the Credit Agreement; or |
| • | takes any similar type of collection action in court or before an arbitral proceeding. |
If any of these conditions are not met, TNFINC reserved the right to declare the modification to the collective bargaining agreement ineffective and terminate the modification on a prospective basis.
ABS Facility
During 2009, the Company entered into a number of amendments to its ABS Facility that address liquidity and covenant relief. Below we discuss aspects of the ABS Facility in its current form after giving effect to these amendments.
The ABS Facility is scheduled to expire on October 26, 2010.
Our ABS Facility is a facility with a maturity of less than one year because many of the purchasers of our accounts receivable underlying our ABS Facility finance their purchases by issuing short term notes in the commercial paper markets backed by these and other companies’ receivables. We have, in the past, routinely renewed our ABS Facility at or before its scheduled expiration, which currently is October 26, 2010. If we are unable to extend or renew our ABS Facility or replace it with an alternative financing, there is a substantial risk that we could not repay the entire facility or have funds sufficient to operate our business.
The aggregate commitments under the ABS Facility are currently $400 million, and the letter of credit facility sublimit is $84 million. At December 31, 2009, there was no available capacity based on qualifying accounts receivables and certain other provisions under the ABS Facility.
In addition, certain calculations under the ABS Facility reduce the impact of previous certain negative effects that the integration of Yellow Transportation and Roadway has had on those calculations, due to rating adjustments and the timing of customer payments. As a result of these amendments in 2009, the obligation to repay outstanding amounts under the ABS Facility due to those integration effects has been reduced or eliminated.
The financial covenants under the ABS facility for Minimum Consolidated EBITDA (as defined in the ABS Facility), available cash requirements and capital expenditures are consistent with the Credit Agreement’s covenants. See “—Credit Agreement—Financial Covenants” above.
As of December 31, 2009 and the date of this report, we were in compliance with the covenants of our ABS Facility.
Some of the fees and interest due during the term of the ABS Facility have been deferred. The $10.0 million fee that was due on October 30, 2009 has been deferred until the earliest to occur of the following dates or events (the “Deferred Fee Payment Date”):
| • | October 26, 2010, |
| • | the Amortization Date (as defined in the ABS Facility), and |
| • | the occurrence of a Deferral Termination Event. |
The portion of current letter of credit fees, program fees and administration fees in excess of the fees in place prior to February 12, 2009 were deferred also until the Deferred Fee Payment Date. As of February 28, 2010 and December 31, 2009, amounts deferred under the above provisions were $13.9 million and $11.4 million, respectively. The Company expects these deferred fees to be approximately $4 million per quarter. All deferred fees will accrue and be payable on the Deferred Fee Payment Date; provided, that, if the advance rate on the ABS Facility exceeds 50% on any business day, all or a portion of deferred fees will be immediately payable in an amount sufficient to reduce the effective advance rate to 50%. Upon the occurrence of a Deferral Suspension Event, the Company will no longer be permitted to defer fees under the ABS Facility; however, previously deferred fees will not become due and payable solely as a result of the occurrence of a Deferral Suspension Event.
78
Table of Contents
OTHER FINANCING TRANSACTIONS
Lease Financing Transactions
We have entered into several lease financing transactions with various parties, including NATMI and Estes Express Lines (“Estes”). The underlying transactions included providing title of certain real estate assets to the issuer in exchange for agreed upon proceeds; however, the transactions did not meet the accounting definition of a “sale leaseback” and as such, the assets remain on our balance sheet and long-term debt (titled Lease Financing Obligations) is reflected on our balance sheet in the amount of the proceeds. We are required to make monthly lease payments, which are recorded as principal and interest payments under these arrangements, generally over a term of ten years.
The table below summarizes our lease financing transactions through December 31, 2009:
| Lessor |
Original Contract Amount |
Contracts completed during 2009 |
Contracts completed subsequent to December 31, 2009 |
Contract modifications |
Remaining contracted amount to close |
Effective interest rates | ||||||||||||
| NATMI |
$ | 184.4 | $ | 153.8 | $ | — | $ | (30.6 | ) | $ | — | 10.3%-18.4% | ||||||
| Estes |
122.0 | 110.3 | — | (11.7 | ) | — | 10.0% | |||||||||||
| Other |
153.3 | 67.4 | 4.4 | (31.2 | ) | 50.3 | 10.0%-14.1% | |||||||||||
| Total |
$ | 459.7 | $ | 331.5 | $ | 4.4 | $ | (73.5 | ) | $ | 50.3 | |||||||
We have used the proceeds received from the above transactions, as follows:
| (in millions) |
Year ended December 31, 2009 |
|||
| Proceeds received |
$ | 331.5 | ||
| Amounts required to be escrowed with lessor |
(11.5 | ) | ||
| Transaction costs |
(4.5 | ) | ||
| Net proceeds received |
315.5 | |||
| Amounts required to be remitted to Revolver Reserve |
(93.1 | ) | ||
| Amounts available for working capital purposes |
$ | 222.4 | ||
In addition to the $93.1 million referenced in the table above, we were required to repay borrowings under the revolving loan by an additional $66.7 million as a result of additional asset sales, including permitted dispositions, thereby making the total of the existing revolver reserve equal to $159.8 million on December 31, 2009.
The Credit Agreement requires any net cash proceeds from real estate asset sales (other than approximately $117 million in net cash proceeds received in the initial sale and leaseback transaction completed with NATMI in the first half of 2009 and sales of real estate on which the pension funds have a first priority security interest under the Contribution Deferral Agreement) received on or after January 1, 2009 to be applied as follows:
| • | with respect to the first $300 million of such net cash proceeds, 50% of such proceeds shall be used to prepay amounts outstanding under the Credit Agreement and the remaining 50% shall be retained by the Company; as of February 28, 2010, the Company had not yet generated the full amount of $300 million in such net cash proceeds; |
| • | with respect to such net cash proceeds in excess of $300 million and less than or equal to $500 million, 75% of such proceeds shall be used to prepay amounts outstanding under the Credit Agreement and the remaining 25% shall be retained by the Company; and |
| • | with respect to such net cash proceeds that exceed $500 million, all of such proceeds shall be used to prepay amounts outstanding under the Credit Agreement. |
The Credit Agreement requires that the prepayments (using the applicable prepayment percentage) described above shall be applied
| • | first, to repay any outstanding permitted interim loans (as defined in the Credit Agreement); |
| • | second, to repay any outstanding loans from the new revolver reserve block; |
| • | third, to repay any outstanding loans from the existing revolver reserve block (with a concurrent permanent commitment reduction of the existing revolver reserve (performance) block and the new revolver reserve block being increased by such prepayment amount); and |
79
Table of Contents
| • | fourth, to repay any other outstanding revolver loans (with a concurrent permanent commitment reduction of such other outstanding revolver loans) and increase the new revolver reserve block by such prepayment amount. |
As of December 31, 2009, the Company had received approximately $294.0 million of net cash proceeds from real estate assets sales and permitted dispositions subject to the above prepayment requirements.
Pension Contribution Deferral Obligations
We have entered into a Contribution Deferral Agreement, along with several amendments thereto, with 26 union multi-employer pension funds, which provide retirement benefits to certain of our union represented employees, whereby pension contributions originally due to the funds were converted to debt. At December 31, 2009, $153.0 million of deferred contributions were subject to the terms of the Contribution Deferral Agreement. In addition, we have deferred certain additional pension contributions of $10.7 million to certain of these pension funds and are working with the applicable funds to execute additional joinder agreements to formally add these amounts to the Contribution Deferral Agreement. At December 31, 2009, these amounts related to pension contributions earned and accrued for union employee hours worked prior to the cessation of contributions that the modification to the collective bargaining agreement provides. See “—Ratification of Collective Bargaining Agreement Modification” above. These amounts are classified as “Wages, vacations and employees’ benefits” in our consolidated balance sheet.
The deferred amounts bear interest at the applicable interest rate set forth in the trust documentation that governs each pension fund and range from 4% to 18% as of December 31, 2009.
— Amortization and Interest Deferral
Outstanding deferred pension payments under the Contribution Deferral Agreement were originally required to be paid to the funds in one payment of $3.6 million in June 2009 with thirty-six equal monthly installments of the remainder payable on the 15th day of each calendar month commencing on January 15, 2010 (each a “CDA Amortization Payment”) and interest payments under the Contribution Deferral Agreement (each a “CDA Interest Payment”) were originally required to be made to the funds in arrears on the fifteenth day of each calendar month. However, all CDA Amortization Payments and CDA Interest Payments due from December 31, 2009 through the end of 2010 have been deferred until December 31, 2011; provided, that the CDA Amortization Payments and CDA Interest Payments will become due at the election of the majority of the pension funds on December 31, 2010 if 90% of the pension funds do not approve a continuation of the deferral of CDA Amortization Payments and CDA Interest Payments for calendar year 2011. In addition, all deferred interest and amortization payments will become payable at the election of the majority of the pension funds, and no new amounts may be deferred, upon the earliest to occur of:
| • | any Deferral Termination Event under the Credit Agreement; |
| • | certain events of default; and |
| • | the amendment, modification, supplementation or alteration of the Credit Agreement that imposes any mandatory prepayment, commitment reduction, additional interest or fee or any other incremental payment to the Lenders under the Credit Agreement not required as of the effective date of the CDA Amendment unless the pension funds receive a proportionate additional payment in respect of the deferred pension obligations at the time an additional payment to the lenders under the Credit Agreement is required pursuant to the terms of the amendment, modification, supplementation or alteration. Granting of consent by the lenders under the Credit Agreement to permit an asset sale does not by itself trigger the provision described in the prior sentence. |
— Liquidity Mandatory Prepayment
The Company is required to prepay obligations under the Contribution Deferral Agreement if Liquidity (as defined in the Contribution Deferral Agreement) is greater than $250 million after deducting any amount due under the Credit Agreement by virtue of the Credit Agreement liquidity mandatory prepayment (as described in the Credit Agreement Amendment section above); provided that such prepayment obligation does not arise unless and until the excess Liquidity amount is equal to or greater than $1 million at any time. Under the Contribution Deferral Agreement, the calculation of Liquidity (as defined in the Contribution Deferral Agreement) conforms to the definition of Liquidity in the Credit Agreement.
— Collateral
As part of the Contribution Deferral Agreement, in exchange for the deferral of the contribution obligations, we pledged identified real property to the pension funds so that the pension funds have a first priority security interest in certain of the identified real property and a second priority security interest in other identified real property located throughout the U.S. and Mexico. We are required to prepay the deferred obligations to the extent that we sell any of the first lien property pledged to the pension funds with the net proceeds from the sale. We have made payments of $18.3 million pursuant to such sales to reduce our obligations to the pension funds during the year ended December 31, 2009 leaving a balance of $153.0 million as of December 31, 2009.
80
Table of Contents
Exchange Offers
On December 31, 2009, we completed exchange offers with certain holders of our outstanding debt securities (the “Exchange Offers”), whereby we exchanged 36.5 million shares of our common stock and 4.3 million shares of our Class A convertible preferred stock (957.2 million shares of common stock, on an as-if converted basis) for $470.2 million in aggregate principal amount of our notes and $5.2 million of accrued interest.
The outstanding note aggregate principal amounts before and after the December 31, 2009 exchange are as follows:
| (in millions) |
Principal amount outstanding before the exchange |
Principal amount exchanged |
Principal amount outstanding after the exchange | ||||||
| 8 1/2% USF senior notes |
$ | 150.0 | $ | 105.0 | $ | 45.0 | |||
| 5% contingent convertible notes |
236.8 | 216.8 | 20.0 | ||||||
| 3.375% contingent convertible notes |
150.0 | 148.4 | 1.6 | ||||||
| Total |
$ | 536.8 | $ | 470.2 | $ | 66.6 | |||
On February 17, 2010, the Company’s stockholders at a special meeting approved the following:
| • | an amendment to the Company’s Certificate of Incorporation to reduce the par value of the Company’s common stock from $1.00 to $0.01 per share; and increase the number of authorized shares of the Company’s capital stock from 125 million shares to 2.05 billion shares of which five million shares are preferred stock, par value $1.00 per share, and two billion shares are common stock, par value $0.01 per share; and |
| • | an amendment to the Company’s Certificate of Incorporation to effect a reverse stock split of the Company’s common stock following the effectiveness of the par value reduction and the authorized share increase described above, at a ratio that will be determined by the Company’s board of directors and that will be within a range of one-to-five to one-for-25; and reduce the number of authorized shares of the Company’s common stock by the reverse split ratio; |
On February 17, 2010, the Company filed the amendment to its Certificate of Incorporation to increase its authorized common stock and change the par value of the stock. Effective with that amendment, 4,194,945 shares of the Class A preferred stock converted into 924,062,483 shares of common stock at a ratio of 220.28 shares of common stock for each share of Class A preferred stock, except to the extent such a conversion would cause the holder of Class A preferred stock to hold more than 9.9% of the common stock of the Company. As a result of this provision, 150,569 shares of preferred stock did not convert to common shares and thereby remain outstanding at February 28, 2010. All shares of Class A preferred stock outstanding on August 17, 2011 will automatically convert into common stock at the conversion ratio in effect on that date.
On March 3, 2010, the Company received a letter from the NASDAQ Stock Market that the Company’s common stock per share closing price was less than $1.00 for 30 consecutive trading days. To remain listed on the NASDAQ Stock Market the Company’s common stock must close above a per share price of $1.00 for at least 10 consecutive trading days during a 180-day grace period ending August 30, 2010. Utilizing the shareholder approval of the reverse stock split described above, the Company expects to effect a reverse stock split to attempt compliance with the NASDAQ minimum bid price rule within the 180-day grace period that the NASDAQ Stock Market permits. However, pursuant to the Note Purchase Agreement (defined below); the Company has agreed not to implement the reverse stock split prior to April 24, 2010.
Convertible Note Placement Transaction
On February 11, 2010, the Company entered into a Note Purchase Agreement (the “Note Purchase Agreement”) with certain investors pursuant to which the investors agreed to purchase from the Company $70.0 million in aggregate principal amount of the Company’s 6% Senior Convertible Notes due 2014 (the “6% Notes”) in a private placement. The purchase and sale of the 6% Notes were structured to occur in two closings. Pursuant to the Note Purchase Agreement, we sold $49.8 million of the 6% Notes to the investors in the first closing on February 23, 2010 and are obligated to sell an additional $20.2 million of 6% Notes to the investors in the second closing, assuming the closing conditions in the Note Purchase Agreement are met.
81
Table of Contents
— Escrow Agreement
In connection with the sale of the 6% Notes, the Company entered into an Escrow Agreement (the “Escrow Agreement”) dated February 23, 2010, with the investors and U.S. Bank National Association, as escrow agent (the “Escrow Agent”). On February 23, 2010, the investors deposited an aggregate amount of $70 million in cash in an escrow account, which represents the aggregate purchase price for all of the 6% Notes contemplated to be sold by the Company to the investors pursuant to the Note Purchase Agreement.
At the first closing of the sale of the 6% Notes on February 23, 2010, the Escrow Agent disbursed funds from the escrow account in an amount sufficient to satisfy and discharge the Company’s outstanding 8 1/2% USF senior notes that were not previously exchanged in the Exchange Offers. See “—Exchange Offers” above.
As part of the Exchange Offers, a majority of the holders of the Company’s 5.0% Net Share Settled Contingent Convertible Senior Notes due 2023 (the “5% Notes”) consented to amend the terms of the indenture governing the 5% Notes (the “5% Indenture”) to remove the right of the 5% Note holders to put their 5% Notes to the Company for repurchase in August 2010. The trustee under the 5% Indenture disputed the ability of the Company to amend the 5% Indenture to remove the put right based on the trustee’s view that more than a majority in interest of the 5% Note holders were required to so amend the 5% Indenture. The Company vigorously disagrees with the trustee’s position, and the Company has subsequently brought a lawsuit against the trustee to cause the trustee to effect the amendment.
If the Company is unsuccessful in its litigation to amend the 5% Indenture to remove the put right, the Company will use the proceeds from the second closing of the sale of the 6% Notes to repurchase any of its 5.0% Notes that the Company is required to repurchase pursuant to exercises of put rights by the holders of the 5% Notes. To the extent that the Company prevails in court or through settlement in amending the 5% Indenture to eliminate the put rights, the Company will use the proceeds of the second closing of the 6% Notes for general corporate purposes.
— Terms of the 6% Notes
The 6% Notes bear interest at a rate of 6.0% per annum. The Company must pay interest on the 6% Notes semi-annually commencing on or prior to the six month anniversary of the first closing. The Company must pay interest on the 6% Notes in cash; provided that the Company is permitted to pay interest on the 6% Notes through the issuance of additional shares of its common stock if:
| • | the Company is not permitted to pay cash interest pursuant to the terms of any of its existing senior financing facilities or |
| • | the Company determines that it lacks sufficient funds to necessary to pay cash interest. |
The Company’s Credit Agreement prohibits the Company from paying cash interest on the Notes during the period the lenders are deferring interest and fee payments. Therefore, during 2010, and potentially beyond 2010 depending on certain conditions under the Credit Agreement, the Company anticipates paying interest through the issuance of additional shares of the Company’s common stock.
The 6% Notes will mature on February 15, 2014. The Company may not redeem the 6% Notes prior to the stated maturity. Holders may require the Company to repurchase all or a portion of their 6% Notes upon a fundamental change, such as a change in control or sale of all or substantially all of the Company’s assets, as further defined in the indenture governing the 6% Notes (the “6% Indenture”), at 100% of the principal amount of the 6% Notes, plus accrued and unpaid interest, and liquidated damages, if any, to the date of repurchase, payable in cash.
A registration rights agreement, entered into on February 11, 2010 between the Company and the investors, requires the Company to register the 6% Notes and the common stock issuable on account of the 6% Notes with the SEC for public resale. The Company filed an initial registration statement on Form S-3 with the SEC on February 12, 2010. The registration statement must be declared effective by the SEC on or before April 30, 2010 (or earlier depending on certain conditions set forth in the registration rights agreement), or the Company must pay liquidated damages to the holders of the 6% Notes.
The 6% Notes are convertible, at the note holder’s option, prior to the maturity date into shares of the Company’s common stock. The 6% Notes are initially convertible at a conversion price of $0.43 per share, which is equal to a conversion rate of approximately 2,326 shares per $1,000 principal amount of 6% Notes, subject to certain adjustments. The 6% Notes provide for caps within the second anniversary of the first closing such that a holder and its affiliates is not entitled to convert its 6% Notes to the extent that the holder and its affiliates would hold greater than 4.9% of the then outstanding common stock after such conversion, unless timely waived by the holder. The 6% Notes also provide a cap through stated maturity such that any holder and its affiliates is not entitled to convert its notes to the extent that the holder and its affiliates would own greater than 9.9% of the voting power of Company’s stock. Assuming that all of the outstanding aggregate principal amount of $49.8 million of 6% Notes had been converted at the note
82
Table of Contents
holders’ option as of February 28, 2010, an aggregate of 147,091,849 shares of our common stock would have been issued as a result of such conversion, including the make whole premium described below. As of the date of this report, no shares of common stock have been issued on account of the 6% Notes.
Beginning on February 23, 2012, the Company may convert the 6% Notes pursuant to a mandatory conversion into shares of its common stock if the market price of the Company’s common stock meets certain thresholds.
Noteholders who convert their 6% Notes at their option or whose 6% Notes are converted in a mandatory conversion at the Company’s option will also receive a make whole premium paid in shares of the Company’s common stock. The make whole premium will be payable in additional shares of common stock and will be calculated based on the remaining interest payments on the 6% Notes that would have been received through the original scheduled maturity date of the 6% Notes.
The 6% Notes are the Company’s senior unsecured obligations and rank equally with all of its other senior unsecured indebtedness and senior to any of its subordinated indebtedness outstanding or incurred in the future. The 6% Notes are guaranteed by certain of the Company’s current domestic operating subsidiaries and any additional domestic subsidiaries that are required to become a guarantor under the terms of the 6% Indenture. The 6% Notes will be effectively subordinated to any of the Company’s or its guarantor subsidiaries’ secured debt, including its senior secured bank financing and any indebtedness of any of its non-guarantor subsidiaries.
The 6% Indenture provides that the maximum number of shares of the Company’s common stock that can be issued in respect of the 6% Notes upon conversion or with respect to the payment of interest or in connection with the make whole premium or otherwise shall be limited to 201,880,000 shares of common stock for $70 million in aggregate principal amount of the 6% Notes as of February 23, 2010, subject to certain adjustments. If the limit is reached, no holder is entitled to any other consideration on account of shares not issued. This limitation terminates if the holders of the Company’s common stock approve the termination of this limitation.
EXISTING LIQUIDITY POSITION
The following table provides details of the outstanding components and unused available (deficit) capacity under the Credit Agreement and ABS Facility at December 31, 2009 and 2008 after giving consideration to the amendments discussed above:
| (in millions) |
2009 | 2008 | ||||||
| Capacity: |
||||||||
| Revolving loan |
$ | 950.0 | $ | 950.0 | ||||
| ABS Facility |
400.0 | 500.0 | ||||||
| Total maximum capacity |
1,350.0 | 1,450.0 | ||||||
| Amounts outstanding: |
||||||||
| Revolving loan |
(329.1 | ) | (515.0 | ) | ||||
| Letters of credit (12/31/09: $ 461.1 revolver; $77.2 ABS Facility) |
(538.3 | ) | (460.5 | ) | ||||
| ABS Facility borrowings |
(146.3 | ) | (147.0 | ) | ||||
| ABS usage for captive insurance company (see below) |
— | (221.0 | ) | |||||
| Total outstanding |
(1,013.7 | ) | (1,343.5 | ) | ||||
| ABS limitations |
(178.2 | ) | (64.6 | ) | ||||
| Revolver reserve |
(159.8 | ) | — | |||||
| Total restricted capacity |
(338.0 | ) | (64.6 | ) | ||||
| Unrestricted unused capacity (deficit) (12/31/09: $- revolver; $(1.7) ABS Facility) |
$ | (1.7 | ) | $ | 41.9 | |||
As we sold certain assets, we used the net cash proceeds to pay down the outstanding revolving loan balance. The Credit Agreement provides that we increase the revolver reserves with a certain accumulated portion of those proceeds, which amount reduces our availability under the revolver by the same portion of those proceeds unless certain conditions to access and use revolver reserves for our liquidity needs are satisfied. As a result of this provision, the available capacity of our revolver was reduced by $159.8 million at December 31, 2009. There was no similar amount at December 31, 2008. After considering the revolver reserve amount of $159.8 million and outstanding usage, there was no unused available capacity under the revolving loan at December 31, 2009. We were in an overdrawn position of $1.7 million with respect to our ABS Facility at December 31, 2009. We remitted the necessary funds January 4, 2010, to remain in compliance with our ABS Facility.
83
Table of Contents
The ABS Facility provides capacity of up to $400 million based on qualifying accounts receivable of the Company and certain other provisions. However, at December 31, 2009, such provisions supported available capacity under the ABS Facility of $221.8 million. Considering this limitation and outstanding usage, there was no unused available capacity under the ABS Facility at December 31, 2009.
YRC Assurance Co. Ltd. (“YRC Assurance”) was the Company’s captive insurance company domiciled in Bermuda and a wholly owned and consolidated subsidiary of YRC Worldwide. YRC Assurance insured certain of our subsidiaries for certain of their respective self-insured obligations for workers’ compensation liabilities. Certain qualifying investments were made by YRC Assurance as required by Bermuda regulations. These investments included purchasing a position in the underlying receivables supporting our ABS Facility. As a result, as shown in the table above, our capacity under the ABS Facility was reduced by YRC Assurance’s investment in receivables of $221.0 million at December 31, 2008. Our Credit Agreement required us to cease the participation of YRC Assurance in the ABS Facility. We have complied with this requirement, and YRC Assurance was dissolved. As a result of these transactions, the operating companies who received insurance from YRC Assurance are now directly self-insured for their workers’ compensation liabilities.
RISKS AND UNCERTAINTIES REGARDING FUTURE LIQUIDITY
In light of our recent operating results, we have satisfied our short term liquidity needs through a combination of borrowings under our credit facilities and, to a more significant degree, retained proceeds from asset sales and sale/leaseback financing transactions. In an effort to further manage liquidity, we have also instituted the deferral of pension plan payments and certain interest and fees. As our operating results improve, we expect that cash generated from operations will reduce our need to continue to rely upon these sources of liquidity to meet our short term funding requirements. The wage reduction and temporary pension contribution cessation has also improved our liquidity position; however, the temporary pension contribution cessation ends at the end of 2010. To continue to have sufficient liquidity to meet our cash flow requirements during 2010:
| • | our operating results must continue to stabilize or recover quarter-over-quarter and shipping volumes must continue to stabilize or recover quarter-over-quarter; |
| • | we must continue to have access to our credit facilities; |
| • | we must continue to defer at least through 2010 payment of: |
| • | interest and fees to our lenders under the Credit Agreement |
| • | interest and facility fees to purchasers of our accounts receivable pursuant to the ABS Facility |
| • | interest and principal to our pension funds pursuant to the Contribution Deferral Agreement; |
| • | our wage reductions and temporary cessation of pension contributions must continue; |
| • | we must complete the sale/leaseback and real estate sale transactions currently under contract as anticipated; and |
| • | we must continue to implement and realize substantial cost savings measures to match our costs with business levels and to continue to become more efficient. |
We expect our business to experience its usual seasonal low point in of the first quarter of 2010. This low point was further impacted in January and February 2010 by severe and widespread bad weather in North America. As our business reaches this seasonal low point, we will need continued access to the additional liquidity that our Credit Agreement and ABS Facility provide as well as continued progress in a combination of increasing our shipment volumes, maintaining or increasing our yield and successfully implementing cost reductions in order for us to have sufficient liquidity to fund our operations.
During December 2009, some of our customers were concerned that we would not complete the Exchange Offers as we extended the Exchange Offers multiple times to increase note holder participation to levels that would satisfy our lenders. These customers diverted much of their business to other providers because of these concerns. On December 31, 2009, we completed the Exchange Offers. After completion of the Exchange Offers, $66.6 million principal amount of 8 1/2% USF senior notes and contingent convertible notes remained outstanding. In February 2010, we entered into the Note Purchase Agreement to address these outstanding note maturities. During January and February 2010, we experienced a return of some of our customers’ business as their concerns with our ability to complete the Exchange Offers and address the outstanding note maturities were alleviated. We expect further return of customer business but there can be no assurance that our expectations will be realized.
In January and February, returning customer volume was offset by a reduction in volumes due to particularly bad winter weather, especially in locations in the United States that do not usually experience winter weather conditions to the degree that were experienced in this winter season. During days that most of the United States was clear of this weather, we have experienced returning customer shipments from some of our customers who had been concerned about our financial condition prior to the completion of the Exchange Offers and the Note Purchase Agreement.
84
Table of Contents
With lower business volumes from customer diversion and weather, our accounts receivables levels were reduced. This, in turn, reduces the amount of qualified receivables that we can finance through our ABS Facility during the first quarter of 2010. We expect business volumes to increase from their lows in usual seasonal patterns as we enter Spring 2010 and as more customers return to shipping with us. Assuming our expectations are met, we will incur additional expense to service this increased business prior to having the financing under our ABS Facility that the qualified accounts receivable from this business will provide us.
The accompanying financial statements have been prepared assuming that the Company will continue as a going concern. The uncertainty regarding the Company’s ability to generate sufficient cash flows and liquidity to fund operations raises substantial doubt about the Company’s ability to continue as a going concern (which contemplates the realization of assets and discharge of liabilities in the normal course of business for the foreseeable future). These financial statements do not include any adjustments that might result from the outcome of this uncertainty. If we are unable to fund our operations through operating cash flows, existing credit facilities, sales of non-strategic assets and business lines and other capital market transactions, we would consider in court and out of court restructuring alternatives.
We expect to continue to monitor our liquidity carefully, work to reduce this uncertainty and address our cash needs through a combination of one or more of the following actions:
| • | in February 2010, we received a refund of $82.4 million from the Internal Revenue Service for federal income tax credits from recent tax carryback legislation; |
| • | we continue to, and expect to implement further cost actions and efficiency improvements; |
| • | we will continue to aggressively seek additional and return business from customers; |
| • | we are aggressively pursuing the Company’s litigation against the trustee under the 5% Indenture. If the Company is successful in its litigation and meets the closing conditions under the Note Purchase Agreement and Escrow Agreement to sell and issue additional 6% Notes, the Company can utilize the remaining $20.2 million of proceeds in the escrow account with its Escrow Agent for general corporate purposes; |
| • | if appropriate, we may sell additional equity or pursue other capital market transactions; |
| • | we may consider selling non-strategic assets or business lines; and |
| • | we expect to carefully manage receipts and disbursements, including amounts and timing, focusing on reducing days sales outstanding and managing days payables outstanding. |
8. Debt and Financing
At December 31, total debt consisted of the following:
| (in millions) |
2009 | 2008 | ||||||
| Revolving credit facility |
$ | 329.1 | $ | 515.0 | ||||
| Term loan |
112.6 | 150.0 | ||||||
| ABS borrowings, secured by accounts receivable |
146.3 | 147.0 | ||||||
| USF senior notes |
45.3 | 154.9 | ||||||
| Contingent convertible senior notes |
21.7 | 375.8 | ||||||
| Pension contribution deferral obligations |
153.0 | — | ||||||
| Lease financing obligations |
318.9 | — | ||||||
| Industrial development bonds |
6.0 | 7.0 | ||||||
| Total debt |
$ | 1,132.9 | $ | 1,349.7 | ||||
| Current maturities of long-term debt |
(27.6 | ) | (415.3 | ) | ||||
| Current maturities of lease financing obligations |
(2.7 | ) | — | |||||
| Current maturities of pension contribution deferral obligations |
(20.5 | ) | — | |||||
| ABS borrowings |
(146.3 | ) | (147.0 | ) | ||||
| Long-term debt |
$ | 935.8 | $ | 787.4 | ||||
Senior Credit Facility
Our Credit Agreement, dated as of August 17, 2007, (the “Credit Agreement”) as amended, provides the Company with a $950 million senior revolving credit facility, including sublimits available for borrowings under certain foreign currencies, and a $111.5 million senior term loan. During 2009, we entered into a number of amendments to its Credit Agreement that address liquidity and covenant relief as discussed in the previous “Liquidity” note. The Credit Agreement, expiring August 17, 2012 also provides for letters of credit to be issued that would, in turn, reduce the borrowing capacity under the revolving credit facility. As of December 31, 2009, $329.1 million was drawn under the revolving credit facility, the term loan of $111.5 million was outstanding and $461.1 million letters of credit were issued. Based on these outstanding amounts, we had no unrestricted unused capacity under the credit agreement at December 31, 2009.
85
Table of Contents
The revolving credit facility and term loan bear interest at LIBOR (with a floor of 350 basis points) plus 650 basis points (10.0% at December 31, 2009). Additionally, we are obligated to pay a facility fee equal to 1.0% of the total revolving credit facility commitment and a participation fee equal to 6.5% of outstanding letters of credit.
The Credit Agreement is secured by the following collateral of the Company and its domestic subsidiaries (i) receivables not secured by the ABS Facility, (ii) intercompany notes not secured by the ABS Facility, (iii) fee-owned real estate parcels, (iv) all rolling stock, (v) 100% of the stock of all domestic subsidiaries of the Company and (vi) 65% of the stock of first-tier foreign subsidiaries of the Company.
In connection with the various amendments to the Credit Agreement, we incurred fees to the consenting lenders and other third parties of approximately $71.5 million of which $31.8 million has been deferred until December 31, 2011 and is included in “Claims and other liabilities” in the accompanying consolidated balance sheets.
Asset-Backed Securitization Facility
On February 12, 2009 and October 27, 2009, we renewed and amended our asset-backed securitization (“ABS”) facility. The renewed facility will expire on October 26, 2010. The renewed facility (i) reduced the financing limit available under the ABS facility to $400 million ($500 million at December 31, 2008), (ii) reduced the letters of credit sublimit to $84 million ($105 million at December 31, 2008) and added a letter of credit fee of 350 basis points, (iii) conformed the financial ratios to be consistent with the Credit Agreement described above, (iv) increased the loss and discount reserve ratio requirements, (v) increased the administrative fee (calculated based on financing limit) and program fee (calculated based on utilization) to 275 basis points, respectively and (vi) terminated YRC Assurance as a purchaser under the ABS Facility. The interest rate under the ABS facility for conduits continues to be a variable rate based on A1/P1 rated commercial paper with an approximate interest rate of 0.35% at December 31, 2009, plus the program fee. The interest rate for Wachovia Bank, National Association is one-month LIBOR (with a floor of 350 basis points), plus 650 basis points (10.0% at December 31, 2009 and 2008), as Wachovia no longer uses a conduit to purchase receivables under the ABS facility. All borrowings under the ABS facility are reflected on our balance sheet.
Throughout 2009 we entered into several amendments with respect to our ABS Facility. The ABS Facility amendments have amended certain Trigger Events (as defined in the ABS Facility) to make the Minimum Consolidated EBITDA (as defined in the ABS Facility) and maximum capital expenditure requirements consistent with the Credit Agreement. In addition, certain calculations under the ABS Facility were amended to reduce the impact of certain negative effects that the integration of Yellow Transportation and Roadway has had on those calculations, due to rating adjustments and the timing of customer payments. As a result of the amendments, the obligation to repay outstanding amounts under the ABS Facility due to those integration effects has been reduced or eliminated. We are currently in compliance with the requirements of the ABS Facility.
In conjunction with the 2009 renewals and amendments of the ABS Facility, we incurred fees to the consenting lenders and other third parties of approximately $23.6 million including the $10 million fee referred to in the “Liquidity” note which payment was deferred.
The ABS facility utilizes the accounts receivable of the following subsidiaries of the Company: YRC Inc.; USF Holland Inc.; and USF Reddaway Inc. (the “Originators”). Yellow Roadway Receivables Funding Corporation (“YRRFC”), a special purpose entity and wholly owned subsidiary of the Company, operates the ABS facility. Under the terms of the renewed ABS facility, the Originators may transfer trade receivables to YRRFC, which is designed to isolate the receivables for bankruptcy purposes. A third-party conduit or committed purchaser must purchase from YRRFC an undivided ownership interest in those receivables. The percentage ownership interest in receivables that the conduits or committed purchasers purchase may increase or decrease over time, depending on the characteristics of the receivables, including delinquency rates and debtor concentrations.
The Company unconditionally guarantees to YRRFC the full and punctual payment and performance of each of the Originators obligations under the ABS facility. YRRFC has pledged its right, title and interest in the guarantee to the Administrative Agent, for the benefit of the purchasers, under the Third Amended and Restated Receivables Purchase Agreement.
86
Table of Contents
The table below provides the borrowing and repayment activity under the ABS facility, as well as the resulting balances, for the years ending December 31 of each period presented:
| (in millions) |
2009 | 2008 | ||||||
| ABS obligations outstanding at January 1 |
$ | 147.0 | $ | 180.0 | ||||
| Transfer of receivables to conduit (borrowings) |
175.1 | 701.0 | ||||||
| Redemptions from conduit (repayments) |
(175.8 | ) | (734.0 | ) | ||||
| ABS obligations outstanding at December 31 |
$ | 146.3 | $ | 147.0 | ||||
At December 31, 2009, our underlying accounts receivable supported total capacity under the ABS Facility of $221.8 million. In addition to the $146.3 million outstanding above, the ABS facility capacity was also reduced by outstanding letters of credit of $77.2 million resulting in an overdrawn position of $1.7 million at December 31, 2009. This is permitted under the ABS Facility provided that we cure the position on the following business day. We remitted the necessary funds January 4, 2010, to remain in compliance with our ABS Facility.
USF Senior Notes
As part of our acquisition of USF and by virtue of the merger agreement, we assumed $150 million aggregate principal amount of 8.5% senior notes due April 15, 2010, with interest payments due semi-annually on April 15 and October 15, and $100 million aggregate principal amount of 6.5% senior notes due May 1, 2009, with interest payments due semi-annually on May 1 and November 1 (collectively “USF Senior Notes”). We redeemed the 6.5% senior notes due May 1, 2009, on November 3, 2008, using funds borrowed under our Credit Facility. We incurred a pre-tax loss on redemption of $2.6 million and accelerated the recognition of $0.5 million of premium amortization, which are included in “Gain on debt redemption, net” in the accompanying statement of operations.
In December 2009, we exchanged $105.0 million in aggregate principal amount of USF Senior Notes in our debt-for-equity transaction previously discussed. After the exchange, $45 million in aggregate principal amount remained outstanding as of December 31, 2009, and has been classified as long-term debt in the accompanying balance sheet because these notes were satisfied and discharged in February 2010 with the proceeds from the 6% Notes.
The USF Senior Notes were revalued as part of purchase accounting and assigned a fair value of $272.2 million on May 24, 2005, with $18.6 million fair value adjustment to the 2010 notes and $3.6 million fair value adjustment to the 2009 notes. The premium over the face value of the USF Senior Notes is being amortized as a reduction to interest expense over the remaining life of the notes. As part of the debt-for-equity exchange in December 2009, we accelerated recognition of $0.8 million of premium amortization. The unamortized premium at December 31, 2009 and 2008, was $0.3 million and $4.9 million, respectively.
Roadway Senior Notes
As part of our acquisition of Roadway and by virtue of the merger agreement, we assumed $225.0 million face value of 8.25% senior notes due in full on December 1, 2008, (“Roadway Senior Notes”), with interest payments due semi-annually on June 1 and December 1. We redeemed these notes on November 3, 2008, using funds borrowed under our Credit Agreement. We incurred a pre-tax loss on redemption of $1.3 million and accelerated the recognition of $0.5 million of premium amortization that are included in “Gain on debt redemption, net” in the accompanying statement of operations for the year ended December 31, 2008.
Contingent Convertible Notes
On August 8, 2003, we closed the sale of $200 million of 5.0% contingent convertible senior notes due 2023 (“contingent convertible senior notes”) and on August 15, 2003 we closed the sale of an additional $50 million of the notes pursuant to the exercise of the option of the initial purchasers. We received net proceeds from the sales of $242.5 million, after fees.
On November 25, 2003, we closed the sale of $150 million of 3.375% contingent convertible senior notes due 2023. We received net proceeds from the offering of $145.5 million, after fees, and used the proceeds to fund the acquisition of Roadway.
In December 2004, we completed exchange offers pursuant to which holders of the 5% contingent convertible senior notes and the 3.375% contingent convertible senior notes (collectively, the “Existing Notes”) could exchange their Existing Notes for an equal amount of our 5% net share settled contingent convertible senior notes due 2023 and 3.375% net share settled contingent convertible senior notes due 2023 (collectively, the “New Notes”), respectively. The New Notes contain a net share settlement feature that, upon conversion, provides for the Company to settle the principal amount of the New Notes in cash and the excess value in common stock, as well as an additional change of control feature. The results of the exchange offer included $247.7 million aggregate principal
87
Table of Contents
amount of the $250 million of 5% contingent convertible senior notes outstanding and $144.6 million aggregate principal amount of the $150 million of 3.375% contingent convertible senior notes outstanding, representing 99.06% and 96.41%, respectively, of the Existing Notes validly and timely tendered in exchange for an equal principal amount of the New Notes.
In October 2008, we exchanged 1.7 million shares of common stock previously held in treasury for $13.2 million principal amount of our outstanding 5% net share settled contingent convertible senior notes due 2023. Based on the closing price of our common stock on the exchange dates, we recognized a pre-tax gain of approximately $5.3 million related to the exchanges. This gain is included in “Gain on debt redemption, net” in the accompanying statement of operations.
In December 2009, we exchanged $365.2 million in aggregate principal amount of the notes in our debt-for-equity transaction. After the exchange, $21.7 million in aggregate principal remained outstanding as of December 31, 2009.
The balance sheet classification of the New Notes between short-term and long-term was dependent upon certain conversion triggers, as defined in the applicable indenture. The contingent convertible notes included a provision whereby the note holder could require immediate conversion of the notes if, among other reasons, our credit rating for the new notes assigned by Moody’s was lower than B2 or if our credit rating for the new notes assigned by S&P was lower than B. At December 31, 2009 and 2008, our credit ratings were below these thresholds meeting the conversion trigger, and accordingly, the contingent convertible notes were classified as a short-term liability in the accompanying 2009 and 2008 consolidated balance sheets.
In May 2008, the FASB issued ASC 470-20-65-1 relative to accounting for convertible debt instruments that may be settled in cash (formerly FASB Staff Position No. APB 14-1, “Accounting for Convertible Debt Instruments that may be Settled in Cash upon Conversion (Including Partial Cash Settlement)”. This guidance clarifies that issuers of convertible debt instruments that may be settled in cash upon conversion (including partial cash settlement) should separately account for the liability and equity components in a manner that will reflect the entity’s nonconvertible debt borrowing rate when interest cost is recognized in subsequent periods. We adopted this guidance on January 1, 2009.
Bond Exchange
On December 31, 2009, we completed exchange offers with certain holders of our outstanding debt securities (the “Exchange Offers”) whereby we exchanged 36.5 million shares of our common stock and 4.3 million shares of our Class A convertible preferred stock (957.2 million shares of common stock, on an as-if converted basis) for $470.2 million in aggregate principal amount of our notes and $5.2 million of accrued interest.
The outstanding note aggregate principal amounts before and after the December 31, 2009 exchange are as follows:
| (in millions) |
Principal amount outstanding before the exchange |
Principal amount exchanged |
Principal amount outstanding after the exchange | ||||||
| 8 1/2% USF senior notes |
$ | 150.0 | $ | 105.0 | $ | 45.0 | |||
| 5% contingent convertible notes |
236.8 | 216.8 | 20.0 | ||||||
| 3.375% contingent convertible notes |
150.0 | 148.4 | 1.6 | ||||||
| Total |
$ | 536.8 | $ | 470.2 | $ | 66.6 | |||
We accounted for the exchange of the notes for shares of our common and preferred stock as a troubled debt restructuring as a grant of equity in full settlement of the debt since the exchange consideration, consisting of shares of our common stock, received for any old notes tendered would result in the full settlement of the old notes exchanged. With respect to the contingent convertible notes, the fair value of such notes was compared to their carrying value to compute the related gain of $184.8 million. In addition, the carrying amount of the USF notes tendered was greater than the fair value of the shares of our common and preferred stock issued pursuant to the exchange consideration and resulted in a gain of $9.1 million. Collectively, these gains represent $2.27 per share for the year ended December 31, 2009.
In connection with the share issuances in exchange for old notes, we incurred $20.8 million of transaction costs that have been classified as a charge to capital surplus in the accompanying 2009 consolidated balance sheet.
88
Table of Contents
6% Convertible Senior Notes Due 2014
As previously discussed, on February 11, 2010, we entered into a note purchase agreement with certain investors pursuant to which such investors agreed, subject to the terms and conditions set forth therein, to purchase from us up to $70 million in aggregate principal amount of our notes. The notes bear interest at 6% payable on February and August of each year. The purchase and sale of the 6% Notes were structured to occur in two closings. Pursuant to the note purchase agreement, we sold $49.8 million of the 6% Notes to the investors in the first closing on February 23, 2010 and are obligated to sell an additional $20.2 million of 6% Notes to the investors in the second closing, assuming the closing conditions in the note purchase agreement are met. We have not yet finalized the accounting as it relates to the various components of the indenture, however, expect certain embedded derivatives to be assessed a fair value and in turn, impact the effective interest rate of the notes.
Industrial Development Bonds
We had loan guarantees, mortgages, and lease contracts in connection with the issuance of industrial development bonds (“IDBs”) used to acquire, construct or expand terminal facilities. As of December 31, 2009, $6.0 million was outstanding and was paid in full in January 2010.
Maturities
The principal maturities of total debt for the next five years and thereafter are as follows:
| (in millions) |
IDBs | Contingent Convertible Senior Notes |
USF Senior Notes (a) |
Term Loan (b) |
Revolver | ABS | Lease Financing Obligation |
Pension Deferral |
Total | ||||||||||||||||||
| 2010 |
$ | 6.0 | $ | 21.7 | $ | — | $ | — | $ | — | $ | 146.3 | $ | 2.7 | $ | — | $ | 176.7 | |||||||||
| 2011 |
— | — | — | — | — | — | 1.5 | 102.0 | 103.5 | ||||||||||||||||||
| 2012 |
— | — | — | 111.5 | 329.1 | — | 2.6 | 51.0 | 494.2 | ||||||||||||||||||
| 2013 |
— | — | — | — | — | — | 3.7 | — | 3.7 | ||||||||||||||||||
| 2014 |
— | — | 45.0 | — | — | — | 5.3 | — | 50.3 | ||||||||||||||||||
| Thereafter |
— | — | — | — | — | — | 303.1 | — | 303.1 | ||||||||||||||||||
| Total |
$ | 6.0 | $ | 21.7 | $ | 45.0 | $ | 111.5 | $ | 329.1 | $ | 146.3 | $ | 318.9 | $ | 153.0 | $ | 1,131.5 | |||||||||
| (a) | As discussed above, the USF senior notes due 2010 had a carrying value of $45.3 million at December 31, 2009, and a principal maturity value of $45.0 million and has been classified as long-term debt in the accompanying balance sheet because these notes were satisfied and discharged in February 2010 with the proceeds from the 6% Notes. |
| (b) | The term loan due 2012 had a carrying value of $112.6 at December 31, 2009, and a principal maturity value of $111.5 million. |
Based on the borrowing rates currently available to us for debt with similar terms and remaining maturities and the quoted market prices for the USF senior notes due 2010 and the contingent convertible senior notes (level two inputs for fair value measurements as defined in SFAS No. 157, “Fair Value Measurements”, now included in FASB ASC Topic 820), the fair value of fixed-rate debt at December 31, 2009 and 2008, was approximately $47.6 million and $212.7 million, respectively. The carrying amount of such fixed-rate debt at December 31, 2009 and 2008 was $73.0 million and $537.7 million, respectively.
9. Stock Compensation Plans
We maintain a long-term incentive and equity award plan that provides for the issuance of stock-based compensation. In May 2008, our stockholders approved an amendment to this plan to increase the number of shares of Company common stock available for awards under the plan by 3 million shares (from 3.43 million to 6.43 million) and to eliminate the requirement that shares available for grant under the plan be reduced by two shares for each share to be issued pursuant to “full value awards”, which are restricted stock, share units, performance awards and other stock-based awards. As of December 31, 2009, 1.8 million shares remain available for issuance. The plan permits the issuance of restricted stock and share units, as well as options, stock appreciation rights, and performance stock and performance stock unit awards. Awards under the plan can be satisfied in cash or shares at the discretion of the Board of Directors. According to the plan provisions, the share units provide the holders the right to receive one share of our common stock upon vesting of one share unit. The plan requires the exercise price of any option equal to the closing market price of our common stock on the date of grant.
89
Table of Contents
A summary of activity in our stock option plans is presented in the following table:
| Shares (in thousands) |
Weighted Average Exercise Price |
Weighted Average Remaining Contractual Term (years) |
Aggregate Intrinsic Value (in millions) | ||||||||
| Outstanding at December 31, 2006 |
448 | $ | 24.48 | ||||||||
| Granted |
— | — | |||||||||
| Exercised |
(221 | ) | 22.59 | ||||||||
| Forfeited / expired |
(11 | ) | 26.91 | ||||||||
| Outstanding at December 31, 2007 |
216 | 26.29 | |||||||||
| Granted |
1,046 | 18.81 | |||||||||
| Exercised |
(3 | ) | 14.57 | ||||||||
| Forfeited / expired |
(68 | ) | 21.18 | ||||||||
| Outstanding at December 31, 2008 |
1,191 | 20.05 | |||||||||
| Granted |
16,281 | 3.61 | |||||||||
| Exercised |
— | — | |||||||||
| Forfeited / expired |
(1,759 | ) | 4.73 | ||||||||
| Outstanding at December 31, 2009 |
15,713 | 4.73 | 9.0 | $ | — | ||||||
| Exercisable at December 31, 2009 |
481 | 21.00 | 6.2 | — | |||||||
The total intrinsic value of options exercised was not material for the years ended December 31, 2009 or December 31, 2008. For the year ended December 31, 2007, the intrinsic value of options exercised was $4.7 million.
On January 2, 2009, we awarded our non-union employees options to purchase up to an aggregate of 5.3 million shares of our common stock at an exercise price equal to $3.34 per share. The options will vest at the rate of 25% per year and will expire in 10 years. The options were granted subject to shareholder approval, which was received on May 14, 2009 at our annual shareholder meeting.
On January 2, 2009, we also adopted a Non-Union Employee Stock Appreciation Right (“SAR”) Plan that awarded up to 5.3 million cash settled SARs. These SARs terminated on May 14, 2009, upon the shareholder approval of the Non-Union Employee Option Plan discussed above.
The fair value of each option award was estimated on the date the grant was approved by shareholders using the Black-Scholes-Merton pricing model. Expected volatilities were estimated using historical volatility of our common stock. We used historical data to estimate option exercise and employee termination within the valuation model; separate groups of employees that have similar historical exercise behavior were considered separately for valuation purposes. The expected term of options granted was derived from the output of the valuation model and represents the period of time that options granted are expected to be outstanding. The risk-free rate for periods within the contractual life of the option is based on the U.S. Treasury yield curve in effect at the time of grant.
We valued the award granted under the Non-Union Employee Option Plan in 2009 using the above described model with the following weighted average assumptions:
| 2009 | ||||
| Dividend yield |
— | % | ||
| Expected volatility |
88.3 | % | ||
| Risk-free interest rate |
1.6 | % | ||
| Expected option life (years) |
4.0 | |||
| Fair value per option |
$ | 2.06 | ||
Based on the above fair value calculation, we recognized compensation expense of $1.9 million related to these outstanding stock option awards for the year ended December 31, 2009 which is included in “Salaries, wages and employees’ benefits” in our accompanying statement of consolidated operations. Compensation expense will continue to be recognized ratably over the vesting period.
On February 12, 2009, we formalized a Union Employee Option Plan that provides for a grant of up to 11.4 million options to purchase our common stock at an exercise price equal to $3.74 per share. As a part of the union wage reduction, we agreed to award a certain equity interest to all effected union employees. These options vested immediately and are exercisable after a twelve month period beginning for a substantial majority of options in February 2009. These options were granted subject to shareholder approval, which was received on May 14, 2009, at our annual shareholder meeting.
90
Table of Contents
On February 12, 2009, we also formalized the Union Employee Stock Appreciation Right Plan that provided for a grant of up to 11.4 million cash settled SARs. These SARs terminated on May 14, 2009 upon the shareholder approval of the Union Employee Option Plan discussed above.
We valued the award granted under the Union Employee Option Plan in 2009 using the above described model with the following weighted average assumptions:
| 2009 | ||||
| Dividend yield |
— | % | ||
| Expected volatility |
120.6 | % | ||
| Risk-free interest rate |
0.9 | % | ||
| Expected option life (years) |
2.0 | |||
| Fair value per option |
$ | 1.91 | ||
As of December 31, 2009, only 11.0 million stock options of the 11.4 million available under the Union Employee Option Plan had been distributed; accordingly, we recognized expense only on the stock options granted. This expense was recognized on the grant date as the options vested immediately versus over a period of time. Based on the fair value calculation above, we recognized compensation expense of $21.0 million related to these outstanding stock option awards for the year ended December 31, 2009, which is included in “Salaries, wages and employees’ benefits” in our accompanying statement of consolidated operations.
On March 1, 2010, we formalized the Second Union Employee Option plan that provides for a grant of up to 263.7 million options to purchase our common stock at an exercise price equal to $0.48 per share. These options vest immediately and are exercisable upon shareholder approval. These options are subject to shareholder approval as a part of our annual shareholder meeting planned for mid year 2010. If such approval is not granted, the options automatically terminate.
On March 1, 2010, we also formalized the Second Union Employee Stock Appreciation Right Plan that provides for a grant of up to 263.7 million cash settled SARs. These SARs vest immediately, are exercisable after a twelve month period and automatically terminate if the Union Employee Option Plan is approved by our shareholders.
In May 2008, we granted option awards to purchase approximately 1.0 million shares of our common stock to approximately 2,200 employees. This one-time grant was made in lieu of a portion of the employees’ annual incentive opportunity for 2008. The options vest in one-third increments on January 1, 2009, 2010 and 2011, and expire ten years from the date of the grant.
We valued the options granted in 2008 using the above described model with the following weighted average assumptions:
| 2008 | ||||
| Dividend yield |
— | % | ||
| Expected volatility |
48.1 | % | ||
| Risk-free interest rate |
2.7 | % | ||
| Expected option life (years) |
3.0 | |||
| Fair value per option |
$ | 6.59 | ||
During the year ended December 31, 2007, we did not grant any option awards.
91
Table of Contents
The following table summarizes information about stock options outstanding as of December 31, 2009:
| Options Outstanding | Options Exercisable | |||||||||||
| Range of exercise prices |
Shares (in thousands) |
Weighted Average Remaining Contractual Years |
Weighted Average Exercise price |
Shares (in thousands) |
Weighted Average Exercise price | |||||||
| $ 0.00 – 3.34 |
3,636 | 8.79 | $ | 3.33 | 15 | $ | 3.34 | |||||
| $ 3.35 – 3.74 |
11,033 | 9.12 | 3.74 | — | — | |||||||
| $ 3.75 – 18.81 |
54 | 0.91 | 15.65 | 53 | 15.60 | |||||||
| $ 18.82 – 20.00 |
872 | 8.21 | 18.82 | 295 | 18.82 | |||||||
| $ 20.00 and over |
118 | 3.59 | 31.17 | 118 | 31.17 | |||||||
A summary of the activity of our nonvested restricted stock and share unit awards is presented in the following table:
| Shares (in thousands) |
Weighted Average Grant-Date Fair Value | |||||
| Nonvested at December 31, 2006 |
988 | $ | 47.36 | |||
| Granted |
307 | 39.99 | ||||
| Vested |
(178 | ) | 40.06 | |||
| Forfeited |
(36 | ) | 47.60 | |||
| Nonvested at December 31, 2007 |
1,081 | 46.46 | ||||
| Granted |
519 | 14.99 | ||||
| Vested |
(367 | ) | 48.88 | |||
| Forfeited |
(58 | ) | 36.06 | |||
| Nonvested at December 31, 2008 |
1,175 | 32.32 | ||||
| Granted |
872 | 3.48 | ||||
| Vested |
(215 | ) | 44.52 | |||
| Forfeited |
(47 | ) | 26.12 | |||
| Nonvested at December 31, 2009 |
1,785 | 16.91 | ||||
We recognize expense on a straight-line basis over the vesting term. The vesting provisions for the restricted stock units and the related number of units awarded during the year ended December 31 are as follows:
| Units (in thousands) | ||||||
| Vesting Terms |
2009 | 2008 | 2007 | |||
| • 100% on the third anniversary of the date of grant |
682 | 482 | 275 | |||
| • Ratably over three years |
190 | 37 | 32 | |||
| Total restricted stock units granted |
872 | 519 | 307 | |||
During the year ended December 31, 2007, we severed certain executives and in turn accelerated the expense associated with their share unit awards of $5.1 million. As of December 31, 2009 and 2008, there was $4.4 million and $9.3 million, respectively of unrecognized compensation expense related to nonvested share-based compensation arrangements. That expense is expected to be recognized over a weighted-average period of 1.6 years. The fair value of nonvested shares is determined based on the closing trading price of our shares on the grant date. The fair value of shares vested during the years ended December 31, 2009 and 2008, was not material.
At December 31, 2009, none of the outstanding awards under our stock compensation plans provide dividend participation features.
10. Income Taxes
We use the liability method to reflect income taxes on our financial statements. We recognize deferred tax assets and liabilities by applying enacted tax rates to the differences between the carrying value of existing assets and liabilities and their respective tax basis and to loss carryforwards. Realizable tax credit carryforwards are recorded as deferred tax assets. The effect on deferred tax assets and liabilities of a change in tax rates is recognized in income in the period that the change occurs. We assess the validity of deferred
92
Table of Contents
tax assets and loss and tax credit carryforwards and provide valuation allowances when we determine it is more likely than not that such assets, losses, or credits will not be realized. We have not recognized deferred taxes relative to foreign subsidiaries’ earnings that are deemed to be permanently reinvested. Any related taxes associated with such earnings are not material.
Deferred tax liabilities (assets) were comprised of the following at December 31:
| (in millions) |
2009 | 2008 | ||||||
| Depreciation |
$ | 390.3 | $ | 489.3 | ||||
| Prepaid expenses and other |
4.5 | 17.5 | ||||||
| Deferred revenue |
11.0 | 22.2 | ||||||
| Intangibles |
37.6 | 42.7 | ||||||
| Gain on debt redemption |
65.2 | — | ||||||
| Other |
16.8 | 57.4 | ||||||
| Gross tax liabilities |
525.4 | 629.1 | ||||||
| Claims and insurance |
(216.2 | ) | (186.3 | ) | ||||
| Allowance for doubtful accounts |
(10.1 | ) | (10.8 | ) | ||||
| Net operating loss carryforwards |
(82.8 | ) | (82.1 | ) | ||||
| Employee benefit accruals |
(213.1 | ) | (197.4 | ) | ||||
| Revenue reserves |
(5.8 | ) | (5.8 | ) | ||||
| Other |
(68.4 | ) | (37.8 | ) | ||||
| Gross tax assets |
(596.4 | ) | (520.2 | ) | ||||
| Less Valuation allowance |
110.6 | — | ||||||
| Net tax assets |
(485.8 | ) | (520.2 | ) | ||||
| Net tax liability |
$ | 39.6 | $ | 108.9 | ||||
Current income tax receivable was $78.9 million and $45.8 million as of December 31, 2009 and 2008, respectively, and is included in “Prepaid expenses and other” in the accompanying balance sheets.
The Company has filed refund claims carrying back the 2009 taxable loss pursuant to the extended carryback provisions enacted by the United States Congress in November 2009 and received a refund of $82.4 million in February 2010. As of December 31, 2009, the Company has a remaining 2008 Net Operating Loss carryforward (after prior carryback to the extent allowed) of approximately $147 million which will expire in 2028 if not used. As of December 31, 2009, the Company has foreign tax credit carryforwards of approximately $15.9 million which will expire between 2014 and 2018 if not used.
During 2009 a valuation allowance of $110.6 million was established for certain deferred tax assets because, based on available sources of taxable income and limits on tax attributes resulting from the deemed change of ownership following the debt-for-equity exchange at December 31, 2009, it is more likely than not that those assets will not be realized.
A reconciliation between income taxes at the federal statutory rate and the consolidated effective tax rate follows:
| 2009 | 2008 | 2007 | |||||||
| Federal statutory rate |
35.0 | % | 35.0 | % | 35.0 | % | |||
| State income taxes, net |
(0.1 | ) | 0.5 | 0.2 | |||||
| Goodwill and equity investment impairment |
(1.2 | ) | (21.0 | ) | (34.1 | ) | |||
| Nondeductible business expenses |
(0.3 | ) | (0.4 | ) | (0.7 | ) | |||
| Gain on debt redemption |
5.8 | — | — | ||||||
| Foreign tax credit and rate differential |
(1.1 | ) | (1.4 | ) | (0.1 | ) | |||
| Valuation allowance |
(12.4 | ) | — | — | |||||
| Alternative fuel tax credit |
— | 0.6 | 1.4 | ||||||
| Other, net |
4.5 | 1.5 | 0.5 | ||||||
| Effective tax rate |
30.2 | % | 14.8 | % | 2.2 | % | |||
93
Table of Contents
The income tax provision (benefit) consisted of the following:
| (in millions) |
2009 | 2008 | 2007 | |||||||||
| Current: |
||||||||||||
| U.S federal |
$ | (75.6 | ) | $ | (18.6 | ) | $ | (22.3 | ) | |||
| State |
1.4 | 3.6 | (4.4 | ) | ||||||||
| Foreign |
7.3 | 4.3 | 4.8 | |||||||||
| Current income tax provision (benefit) |
$ | (66.9 | ) | $ | (10.7 | ) | $ | (21.9 | ) | |||
| Deferred: |
||||||||||||
| U.S federal |
$ | (167.3 | ) | $ | (140.4 | ) | $ | 4.3 | ||||
| State |
(32.7 | ) | (17.2 | ) | 2.4 | |||||||
| Foreign |
(1.8 | ) | (1.9 | ) | 0.8 | |||||||
| Deferred income tax provision (benefit) |
$ | (201.8 | ) | $ | (159.5 | ) | $ | 7.5 | ||||
| Income tax provision (benefit) |
$ | (268.7 | ) | $ | (170.2 | ) | $ | (14.4 | ) | |||
| Based on the income (loss) before income taxes: |
||||||||||||
| Domestic |
$ | (859.1 | ) | $ | (1,108.8 | ) | $ | (665.8 | ) | |||
| Foreign |
(31.6 | ) | (37.8 | ) | 11.0 | |||||||
| Income (loss) before income taxes |
$ | (890.7 | ) | $ | (1,146.6 | ) | $ | (654.8 | ) | |||
Uncertain Tax Positions
A rollforward of the total amount of unrecognized tax benefits for the years ended December 31 is as follows:
| (in millions) |
2009 | 2008 | ||||||
| Unrecognized tax benefits at January 1 |
$ | 199.8 | $ | 75.9 | ||||
| Increases related to: |
||||||||
| Tax positions taken during a prior period |
2.1 | 6.4 | ||||||
| Tax positions taken during the current period |
0.8 | 119.1 | ||||||
| Decreases related to: |
||||||||
| Tax positions taken during a prior period |
(118.6 | ) | (2.2 | ) | ||||
| Lapse of applicable statute of limitations |
(0.4 | ) | (0.1 | ) | ||||
| Settlements with taxing authorities |
1.1 | 0.7 | ||||||
| Unrecognized tax benefits at December 31 |
$ | 84.8 | $ | 199.8 | ||||
Included in the $84.8 million of unrecognized tax benefits at December 31, 2009 was $81.5 million of benefits that, if recognized, would affect the effective tax rate. We accrued $7.0 million of interest on uncertain tax positions during the year ended December 31, 2009 and $5.6 million for each of the years ended December 31, 2008 and 2007 and the total amount of interest accrued for uncertain tax positions is $20.8 million and $13.0 million as of December 31, 2009 and 2008, respectively. We have not accrued any penalties relative to uncertain tax positions. We have elected to treat interest and penalties on uncertain tax positions as interest expense and other operating expenses, respectively.
Reasonably possible changes in the next twelve months in the amount of unrecognized tax benefits relate to the following tax positions:
The United States Internal Revenue Service (“IRS”) has audited the Company’s 2005 tax return and proposed an adjustment relative to the deduction claimed for contributions to union pension plans. We have protested the adjustment and expect to litigate the issue. The additional tax that could result from the adjustment is approximately $51.1 million.
The IRS has audited certain pre-acquisition tax returns for a consolidated group acquired in 2005 and disallowed a 2002 loss related to the disposition of the stock of a member of that group. We believe the loss is fully deductible and have started litigation to resolve the issue. The additional tax that could result should the loss ultimately be totally denied is approximately $36.5 million.
94
Table of Contents
In connection with their audit of the Company’s 2005 tax return the IRS has proposed adjustments relative to certain transactions of our captive insurance company, YRC Assurance Co., Ltd. (“YRCA”). We believe the proposed adjustments are not valid and expect to litigate the issue. As a result of a change in 2008 from the facts of 2005, additional deductions claimed by YRCA may be at risk. However, any change by IRS to the 2005-2008 tax returns would be fully offset by a corresponding increase in the 2009 taxable loss that would be carried back to those years, resulting in no net tax exposure.
Tax years that remain subject to examination for our major tax jurisdictions as of December 31, 2009:
| Pre-acquisition tax years | ||||||
| YRC Worldwide | USF Corporation | Roadway (a) | ||||
| Statute remains open |
2005-2009 | 2000-2004 | 2001-03 | |||
| Tax years currently under examination/exam completed |
2005-2008 | 2000-2004 | 2001-03 | |||
| Tax years not examined |
2009 | None | None | |||
| (a) | Years ending on or before December 11, 2003. |
11. Business Segments
We report financial and descriptive information about our reportable operating segments on a basis consistent with that used internally for evaluating segment performance and allocating resources to segments. We evaluate performance primarily on operating income and return on capital.
We have four reportable segments, which are strategic business units that offer complementary transportation services to their customers. National Transportation includes carriers that provide comprehensive regional, national and international transportation services. Regional Transportation is comprised of carriers that focus primarily on business opportunities in the regional and next-day delivery markets. YRC Logistics provides domestic and international freight forwarding, distribution, cross-dock services, multi-modal brokerage services and transportation management services. Truckload consists of Glen Moore, a domestic truckload carrier.
The accounting policies of the segments are the same as those described in the “Principles of Consolidation and Summary of Accounting Policies” note. We charge management fees and other corporate services to our segments based on the direct benefits received or as a percentage of revenue. Corporate and other operating losses represent operating expenses of the holding company, including compensation and benefits and professional services for all periods presented. In 2009, operating losses included $4.0 million of stock compensation expense offset by $2.1 million of income related to favorable reserve adjustments associated with business lines previously shut down now included in the corporate and other segment. In 2008, corporate operating losses included $2.6 million of stock compensation expense as well as $4.8 million of software write offs. In 2007, corporate operating losses included executive severance of $9.5 million offset by reduced professional services fees and stock compensation expense totaling $3.5 million. Corporate identifiable assets primarily refer to cash, cash equivalents, technology assets and deferred debt issuance costs as well as our investment in JHJ. Intersegment revenue relates to transportation services between our segments.
Revenue from foreign sources totaled $270.2 million, $422.3 million, and $385.5 million in 2009, 2008 and 2007, respectively, and is largely derived from Canada, the United Kingdom, Asia, Latin America and Mexico. Long-lived assets located in foreign countries totaled $26.7 million, $24.2 million and $27.6 million at December 31, 2009, 2008 and 2007, respectively.
95
Table of Contents
The following table summarizes our operations by business segment:
| (in millions) |
National (a) Transportation |
Regional Transportation |
YRC Logistics |
Truckload | Corporate / Eliminations |
Consolidated | ||||||||||||||||||
| 2009 |
||||||||||||||||||||||||
| External revenue |
$ | 3,489.3 | $ | 1,322.4 | $ | 399.6 | $ | 71.5 | $ | — | $ | 5,282.8 | ||||||||||||
| Intersegment revenue |
— | 0.2 | 12.1 | 40.9 | (53.2 | ) | — | |||||||||||||||||
| Operating income (loss) |
(742.8 | ) | (126.7 | ) | (4.5 | ) | (8.7 | ) | (1.3 | ) | (884.0 | ) | ||||||||||||
| Identifiable assets |
1,807.8 | 1,023.0 | 128.4 | 59.6 | 13.3 | 3,032.1 | ||||||||||||||||||
| Capital expenditures, net |
(89.0 | ) | (13.2 | ) | 0.6 | 0.1 | 5.7 | (95.8 | ) | |||||||||||||||
| Depreciation and amortization |
131.0 | 66.2 | 13.6 | 9.0 | 35.4 | 255.2 | ||||||||||||||||||
| Impairment charges |
— | — | 30.4 | — | — | 30.4 | ||||||||||||||||||
| 2008 |
||||||||||||||||||||||||
| External revenue |
$ | 6,303.2 | $ | 1,973.4 | $ | 584.6 | $ | 79.2 | $ | — | $ | 8,940.4 | ||||||||||||
| Intersegment revenue |
1.7 | 0.7 | 37.1 | 41.3 | (80.8 | ) | — | |||||||||||||||||
| Operating income (loss) |
(749.4 | ) | (147.8 | ) | (149.9 | ) | (11.6 | ) | (15.4 | ) | (1,074.1 | ) | ||||||||||||
| Identifiable assets |
2,362.6 | 1,207.8 | 229.3 | 71.4 | 95.0 | 3,966.1 | ||||||||||||||||||
| Capital expenditures, net |
52.3 | (3.8 | ) | (27.9 | ) | (0.5 | ) | 14.6 | 34.7 | |||||||||||||||
| Depreciation and amortization |
138.7 | 66.5 | 15.9 | 10.5 | 32.7 | 264.3 | ||||||||||||||||||
| Impairment charges |
776.7 | 89.7 | 157.0 | — | — | 1,023.4 | ||||||||||||||||||
| 2007 |
||||||||||||||||||||||||
| External revenue |
$ | 6,654.7 | $ | 2,280.4 | $ | 597.0 | $ | 89.2 | $ | — | $ | 9,621.3 | ||||||||||||
| Intersegment revenue |
3.1 | — | 26.2 | 23.7 | (53.0 | ) | — | |||||||||||||||||
| Operating income (loss) |
159.3 | (700.8 | ) | 5.2 | (5.9 | ) | (22.9 | ) | (565.1 | ) | ||||||||||||||
| Identifiable assets |
3,139.1 | 1,424.0 | 426.4 | 80.9 | (7.8 | ) | 5,062.6 | |||||||||||||||||
| Capital expenditures, net |
174.0 | 81.7 | 18.6 | 15.0 | 49.1 | 338.4 | ||||||||||||||||||
| Depreciation and amortization(a) |
142.4 | 67.6 | 15.8 | 9.9 | 19.9 | 255.6 | ||||||||||||||||||
| Impairment charges |
76.6 | 705.3 | — | — | — | 781.9 | ||||||||||||||||||
| (a) | Included in the depreciation and amortization balance in the National Transportation segment for 2007 is approximately $9 million of allocated costs related to certain abandoned technology projects previously considered in-process. As National Transportation moved to a common technology platform, these projects were identified as non-strategic and not a part of the future direction of the reporting unit. |
12. Shareholders’ Equity
On December 31, 2009, we issued 4.3 million shares of preferred stock in exchange for certain outstanding notes. The Class A preferred stock has a par value of $1.00 per share and a liquidation preference of $50.00 per share; holders are entitled to vote with holders of common stock on an as-if converted basis, and each share of preferred stock is entitled to 220.28 votes per share. The preferred stock does not accrue dividends and is not subject to any mandatory redemption. Our preferred stock was recorded at $90.67 per share and is classified as a Level 3 instrument within the fair value hierarchy, as its valuation requires substantial judgement and estimation of factors that are not currently observable in the market due to the lack of tracking of the preferred stock at December 31, 2009.
On February 17, 2010, the Company’s stockholders at a special meeting approved the following:
| • | an amendment to the Company’s Certificate of Incorporation to reduce the par value of the Company’s common stock from $1.00 to $0.01 per share; and increase the number of authorized shares of the Company’s capital stock from 125 million shares to 2.05 billion shares of which five million shares are preferred stock, par value $1.00 per share, and two billion shares are common stock, par value $0.01 per share; and |
| • | an amendment to the Company’s Certificate of Incorporation to effect a reverse stock split of the Company’s common stock following the effectiveness of the par value reduction and the authorized share increase described above, at a ratio that will be determined by the Company’s board of directors and that will be within a range of one-to-five to one-for-25; and reduce the number of authorized shares of the Company’s common stock by the reverse split ratio; |
On February 17, 2010, the Company filed the amendment to its Certificate of Incorporation to increase its authorized common stock and change the par value of the stock. Effective with that amendment, 4,194,945 shares of the Class A preferred stock converted into 924,062,483 shares of common stock at a ratio of 220.28 shares of common stock for each share of Class A preferred stock, except to the extent such a conversion would cause the holder of Class A preferred stock to hold more than 9.9% of the common stock of the Company. As a result of this provision, 150,569 shares of preferred stock did not convert to common shares and thereby remain outstanding at February 28, 2010.
96
Table of Contents
Our consolidated financial statements have been retroactively restated to reflect the change in the par value of our common stock for all periods presented, which resulted in a reclassification of $60.3 million from common stock to capital surplus at January 1, 2007.
The following reflects the activity in the shares of our common stock for the years ended December 31:
| (in thousands) |
2009 | 2008 | 2007 | |||
| Beginning balance |
62,413 | 61,514 | 60,876 | |||
| Issuance of equity in exchange for debt |
36,504 | — | — | |||
| Exercise of stock options |
— | 3 | 221 | |||
| Issuance of equity awards, net |
205 | 249 | 119 | |||
| Employer contribution to 401(k) plan |
— | 647 | 298 | |||
| Ending balance |
99,122 | 62,413 | 61,514 | |||
13. Earnings per Common Share
Due to the issuance of the Class A preferred stock on December 31, 2009, we have adopted EITF Issue No. 03-6, “Participating Securities and the Two-Class Method under FASB Statement No. 128”, (now included in FASB ASC Topic 26010-45-60) which provides clarification of what is meant by a “participating security” and provides guidance on applying the two-class method for computing earnings per share (“EPS”). The new preferred stock is determined to be a participating security as it may participate in dividends with common stockholders according to a predetermined formula. However, due to our current loss position and that fact that no dividends have been declared or paid as of December 31, 2009, the two class method does not impact our basic or diluted EPS calculation for any of the periods presented in the accompanying statements of consolidated operations.
We present both basic and diluted EPS amounts. Basic EPS is calculated by dividing net income (loss) by the weighted average number of common shares outstanding during the year. Diluted EPS is based upon the weighted average number of common and common equivalent shares outstanding during the year which is calculated using the treasury stock method for stock options and restricted stock units, the if-converted method for preferred stock, and assumes conversion of our convertible senior notes based on the related fiscal year financial data.
| (in thousands except per share data) |
2009 | 2008 | 2007 | |||||||||
| Numerator: |
||||||||||||
| Net loss for basic and diluted loss per share |
$ | (622,019 | ) | $ | (976,373 | ) | $ | (640,362 | ) | |||
| Denominator: |
||||||||||||
| Weighted average number of common shares outstanding |
59,582 | 57,583 | 57,154 | |||||||||
| Basic loss per share |
$ | (10.44 | ) | $ | (16.96 | ) | $ | (11.20 | ) | |||
| Diluted loss per share |
$ | (10.44 | ) | $ | (16.96 | ) | $ | (11.20 | ) | |||
The impacts of the preferred stock, certain options and restricted stock units were excluded from the calculation of diluted earnings per share because the effects are antidilutive. In addition, the computation of the assumed conversion of the convertible senior notes includes inputs of the year-to-date average stock price relative to the stated conversion price. If this relationship is such that the year-to-date average stock price is less then the stated conversion price, the computed shares would be antidilutive under the treasury stock method.
Antidilutive options and share units were 17,498,000, 2,366,000 and 1,297,000 at December 31, 2009, 2008 and 2007, respectively. Antidilutive convertible senior note conversion shares were 177,000 at December 31, 2009, 2008 and 2007.
14. Commitments, Contingencies, and Uncertainties
Financial Matters
We incur rental expenses under noncancelable lease agreements for certain buildings and operating equipment. Rental expense is charged to “Operating expense and supplies” or “Purchased transportation” on the accompanying statements of operations. Rental expense was $142.9 million, $156.8 million, and $144.6 million for the years ended December 31, 2009, 2008 and 2007, respectively.
97
Table of Contents
At December 31, 2009, we were committed under noncancelable lease agreements requiring minimum annual rentals payable as follows:
| (in millions) |
2010 | 2011 | 2012 | 2013 | 2014 | Thereafter | ||||||||||||
| Minimum annual rentals |
$ | 86.2 | $ | 57.2 | $ | 35.2 | $ | 19.4 | $ | 10.6 | $ | 25.5 | ||||||
We expect in the ordinary course of business that leases will be renewed or replaced as they expire. The leases provide for fixed and escalating rentals and contingent escalating rentals based on the Consumer Price Index not to exceed certain specified amounts. We record rent expense for our operating leases on a straight-line basis over the base term of the lease agreements. In many cases our leases are entered into by a subsidiary and a parent guarantee is issued. The maximum potential amount of undiscounted future payments under the guarantee are the same as the minimum annual rentals disclosed above.
Projected 2010 net capital expenditures are expected to be $50 to $100 million of which approximately $6.3 million was committed at December 31, 2009.
Class Action Lawsuit
On July 30, 2007, Farm Water Technological Services, Inc. d/b/a Water Tech, and C.B.J.T. d/b/a Agricultural Supply, on behalf of themselves and other plaintiffs, filed a putative class action lawsuit against the Company and 10 other companies engaged in the LTL trucking business in the United States District Court for the Southern District of California. Other plaintiffs filed similar cases in various courts across the nation, and in December 2007, the courts consolidated these cases in the United States District Court for the Northern District of Georgia. The plaintiffs alleged that the defendants, including the Company, conspired to fix fuel surcharges in violation of federal antitrust law and sought unspecified treble damages, injunctive relief, attorneys’ fees and costs of litigation. In March 2009, the court dismissed the plaintiffs’ consolidated action with prejudice.
USF Red Star
In 2004, USF Red Star, a USF subsidiary that operated in the Northeastern U.S. was shut down. We acquired USF in 2005. Due to the shutdown, USF, now our wholly owned subsidiary, was subject to withdrawal liability under the Multi-Employer Pension Plan Amendment Act of 1980 for six multi-employer pension plans. Based on information that USF had received from these plans, we estimated that USF Red Star could be liable for up to approximately $79 million. However, we also estimated that approximately $13 million of this liability could be abated because of contributions that Yellow Transportation, Roadway, New Penn and USF Holland made to one of these six plans. Thus, at the May 2005 purchase date, we reserved approximately $66 million, representing the present value, for these liabilities. We recognized those liabilities as an obligation assumed on the acquisition date of USF, resulting in additional goodwill.
During 2006, we received notification of the successful abatement of one of the six plans. During the year ended December 31, 2007, we reached a settlement agreement with all of the remaining plans aside from the plan that denied our abatement claim in 2006. As a part of the settlements, we agreed to pay $35.8 million to be released from the obligations. As we previously accrued $42.2 million for these obligations, resulting gains on settlement of $6.4 million were recorded during 2007 and are included in “Salaries, wages and employees’ benefits” in the accompanying consolidated statement of operations. Our USF Red Star withdrawal liability at December 31, 2008, was $7.2 million and was presented in “Claims and other liabilities” in the consolidated balance sheets. During the year ended December 31, 2009 we successfully negotiated the settlement of the remaining fund and agreed to pay $3.5 million to be released from the obligation resulting in a gain on settlement of $2.3 million which is included in “Salaries, wages and employees’ benefits” in the accompanying consolidated statement of operations. At December 31, 2009 our USF Red Star withdrawal liability was zero.
Contingent Convertible Notes Litigation
On January 28, 2010, the Company filed a petition for declaratory judgment in the district court of Johnson County, Kansas against Deutsche Bank Trust Company Americas, as trustee for the Company’s 3.375% Net Share Settled Contingent Convertible Senior Notes due 2023 and the Company’s 5.0% Net Share Settled Contingent Convertible Senior Notes due 2023 (together, the “Notes”). The Company is seeking declaratory judgment that the indentures governing the Notes should be modified to eliminate a repurchase right at the option of holders and certain restrictions on mergers and transfers of assets as proposed in the Company’s recently completed debt-for-equity exchange. Deutsche Bank Trust Company Americas has removed the case to the United States District Court for the District of Kansas.
98
Table of Contents
401(k) Class Action Suit
Three class action complaints were filed in the U.S. District Court for the District of Kansas against the Company and certain of its officers and directors, alleging violations of the Employee Retirement Income Security Act of 1974 (as amended, “ERISA”) based on similar allegations and causes of action. On November 17, 2009, Eva L. Hanna and Shelley F. Whitson, former participants in the Yellow Roadway Corporation Retirement Plan, filed a class action complaint on behalf of certain persons participating in the plan (or plans that merged with the plan) from April 6, 2009 to the present; on December 7, 2009, Daniel J. Cambra, a participant in the Yellow Roadway Corporation Retirement Savings Plan, filed a class action complaint on behalf of certain persons participating in the plan (or plans that merged with the plan) from October 25, 2007 to the present; and on January 15, 2010, Patrick M. Couch, a participant in one of the merged 401(k) plans, filed a class action complaint on behalf of certain persons participating in the plan (or plans that merged with the plan) from March 23, 2006 to the present.
In general, the complaints allege that the defendants breached their fiduciary duties under ERISA by providing participants Company common stock as part of their matching contributions and by not removing the stock fund as an investment option in the plans in light of the Company’s financial condition. Although some Company matching contributions were made in Company common stock, participants were not permitted to invest their own contributions in the Company stock fund. The complaints allege that the defendants failed to prudently and loyally manage the plans and assets of the plans; imprudently invested in Company common stock; failed to monitor fiduciaries and provide them with accurate information; breached the duty to properly appoint, monitor, and inform the Benefits Administrative Committee; misrepresented and failed to disclose adverse financial information; breached the duty to avoid conflict of interest; and are subject to co-fiduciary liability. Each of the complaints seeks, among other things, an order compelling defendants to make good to the plan all losses resulting from the alleged breaches of fiduciary duty, attorneys’ fees, and other injunctive and equitable relief. Based on the three separate complaints previously filed, the Company believes the allegations are without merit and intends to vigorously contest the claims.
On March 3, 2010, the Court entered an order consolidating the three cases. Pursuant to the order, the plaintiffs must file an amended consolidated complaint by April 1, 2010. We anticipate that plaintiffs will name as additional defendants certain former officers of the Company in addition to those current officers and directors that have already been named.
Other Legal Matters
We are involved in other litigation or proceedings that arise in ordinary business activities. We insure against these risks to the extent deemed prudent by our management, but no assurance can be given that the nature and amount of such insurance will be sufficient to fully indemnify us against liabilities arising out of pending and future legal proceedings. Many of these insurance policies contain self-insured retentions in amounts we deem prudent. Based on our current assessment of information available as of the date of these financial statements, we believe that our financial statements include adequate provisions for estimated costs and losses that may be incurred with regard to the litigation and proceedings to which we are a party.
99
Table of Contents
15. Condensed Consolidating Financial Statements
Guarantees of the Contingent Convertible Senior Notes
In August 2003, YRC Worldwide issued 5.0% contingent convertible senior notes due 2023. In November 2003, we issued 3.375% contingent convertible senior notes due 2023. In December 2004, we completed exchange offers pursuant to which holders of the contingent convertible senior notes could exchange their notes for an equal amount of net share settled contingent convertible senior notes. In December 2009, substantially all of the contingent convertible senior notes were exchanged for shares of our common and preferred stock. In connection with the contingent convertible senior notes, the following 100% owned subsidiaries of YRC Worldwide have issued guarantees in favor of the holders of the contingent convertible senior notes: YRC Inc., YRC Worldwide Technologies, Inc., YRC Logistics, Inc., YRC Logistics Global, LLC, Globe.com Lines, Inc., Roadway LLC, and Roadway Next Day Corporation. Each of the guarantees is full and unconditional and joint and several.
The condensed consolidating financial statements are presented in lieu of separate financial statements and other related disclosures of the subsidiary guarantors and issuer because management does not believe that separate financial statements and related disclosures would be material to investors. There are currently no significant restrictions on the ability of YRC Worldwide or any guarantor to obtain funds from its subsidiaries by dividend or loan.
The following represents condensed consolidating financial information as of December 31, 2009 and 2008, with respect to the financial position and for the years ended December 31, 2009, 2008 and 2007, for results of operations and cash flows of YRC Worldwide and its subsidiaries. The Parent column presents the financial information of YRC Worldwide, the primary obligor of the contingent convertible senior notes. The Guarantor Subsidiaries column presents the financial information of all guarantor subsidiaries of the contingent convertible senior notes. The Non-Guarantor Subsidiaries column presents the financial information of all non-guarantor subsidiaries, including those subsidiaries that are governed by foreign laws and Yellow Roadway Receivables Funding Corporation, the special-purpose entity that is associated with our ABS agreement.
Condensed Consolidating Balance Sheets
| December 31, 2009 (in millions) |
Parent | Guarantor Subsidiaries |
Non-Guarantor Subsidiaries |
Eliminations | Consolidated | |||||||||||||||
| Cash and cash equivalents |
$ | 69 | $ | 9 | $ | 20 | $ | — | $ | 98 | ||||||||||
| Intercompany advances receivable |
— | (54 | ) | 54 | — | — | ||||||||||||||
| Accounts receivable, net |
10 | 16 | 490 | — | 516 | |||||||||||||||
| Prepaid expenses and other |
71 | 132 | 42 | — | 245 | |||||||||||||||
| Total current assets |
150 | 103 | 606 | — | 859 | |||||||||||||||
| Property and equipment |
— | 2,591 | 997 | — | 3,588 | |||||||||||||||
| Less – accumulated depreciation |
— | (1,422 | ) | (327 | ) | — | (1,749 | ) | ||||||||||||
| Net property and equipment |
— | 1,169 | 670 | — | 1,839 | |||||||||||||||
| Investment in subsidiaries |
2,999 | (37 | ) | 236 | (3,198 | ) | — | |||||||||||||
| Receivable from affiliate |
(314 | ) | 213 | 101 | — | — | ||||||||||||||
| Intangibles and other assets |
337 | 191 | 156 | (350 | ) | 334 | ||||||||||||||
| Total assets |
$ | 3,172 | $ | 1,639 | $ | 1,769 | $ | (3,548 | ) | $ | 3,032 | |||||||||
| Intercompany advances payable |
$ | 146 | $ | 209 | $ | (155 | ) | $ | (200 | ) | $ | — | ||||||||
| Accounts payable |
32 | 108 | 59 | — | 199 | |||||||||||||||
| Wages, vacations and employees’ benefits |
33 | 132 | 51 | — | 216 | |||||||||||||||
| Claims and insurance accruals |
147 | 18 | 7 | — | 172 | |||||||||||||||
| Other current and accrued liabilities |
46 | 135 | 45 | — | 226 | |||||||||||||||
| Asset-backed securitization borrowings |
— | — | 146 | — | 146 | |||||||||||||||
| Current maturities of long-term debt |
45 | 6 | — | — | 51 | |||||||||||||||
| Total current liabilities |
449 | 608 | 153 | (200 | ) | 1,010 | ||||||||||||||
| Payable to affiliate |
— | (75 | ) | 225 | (150 | ) | — | |||||||||||||
| Long-term debt, less current portion |
891 | — | 45 | — | 936 | |||||||||||||||
| Deferred income taxes, net |
85 | (36 | ) | 97 | — | 146 | ||||||||||||||
| Pension and postretirement |
352 | — | — | — | 352 | |||||||||||||||
| Claims and other liabilities |
414 | 5 | 2 | — | 421 | |||||||||||||||
| Commitments and contingencies |
||||||||||||||||||||
| Shareholders’ equity |
981 | 1,137 | 1,247 | (3,198 | ) | 167 | ||||||||||||||
| Total liabilities and shareholders’ equity |
$ | 3,172 | $ | 1,639 | $ | 1,769 | $ | (3,548 | ) | $ | 3,032 | |||||||||
100
Table of Contents
| December 31, 2008 (in millions) |
Parent | Guarantor Subsidiaries |
Non-Guarantor Subsidiaries |
Eliminations | Consolidated | |||||||||||||||
| Cash and cash equivalents |
$ | 295 | $ | 9 | $ | 21 | $ | — | $ | 325 | ||||||||||
| Intercompany advances receivable |
— | (71 | ) | 71 | — | — | ||||||||||||||
| Accounts receivable, net |
2 | (16 | ) | 858 | (7 | ) | 837 | |||||||||||||
| Prepaid expenses and other |
25 | 203 | 70 | — | 298 | |||||||||||||||
| Total current assets |
322 | 125 | 1,020 | (7 | ) | 1,460 | ||||||||||||||
| Property and equipment |
— | 2,914 | 1,064 | — | 3,978 | |||||||||||||||
| Less – accumulated depreciation |
— | (1,492 | ) | (285 | ) | — | (1,777 | ) | ||||||||||||
| Net property and equipment |
— | 1,422 | 779 | — | 2,201 | |||||||||||||||
| Investment in subsidiaries |
3,377 | 93 | 203 | (3,673 | ) | — | ||||||||||||||
| Receivable from affiliate |
(712 | ) | 321 | 391 | — | — | ||||||||||||||
| Intangibles and other assets |
268 | 200 | 188 | (351 | ) | 305 | ||||||||||||||
| Total assets |
$ | 3,255 | $ | 2,161 | $ | 2,581 | $ | (4,031 | ) | $ | 3,966 | |||||||||
| Intercompany advances payable |
$ | 283 | $ | (105 | ) | $ | 25 | $ | (203 | ) | $ | — | ||||||||
| Accounts payable |
11 | 244 | 80 | (1 | ) | 334 | ||||||||||||||
| Wages, vacations and employees’ benefits |
20 | 242 | 95 | — | 357 | |||||||||||||||
| Claims and insurance accruals |
38 | 25 | 108 | — | 171 | |||||||||||||||
| Other current and accrued liabilities |
18 | 132 | 171 | (2 | ) | 319 | ||||||||||||||
| Current maturities of long-term debt |
414 | 1 | 147 | — | 562 | |||||||||||||||
| Total current liabilities |
784 | 539 | 626 | (206 | ) | 1,743 | ||||||||||||||
| Payable to affiliate |
(47 | ) | (23 | ) | 221 | (151 | ) | — | ||||||||||||
| Long-term debt, less current portion |
626 | 6 | 155 | — | 787 | |||||||||||||||
| Deferred income taxes, net |
20 | 199 | 24 | — | 243 | |||||||||||||||
| Pension and postretirement |
370 | — | — | — | 370 | |||||||||||||||
| Claims and other liabilities |
94 | 2 | 246 | — | 342 | |||||||||||||||
| Commitments and contingencies |
||||||||||||||||||||
| Shareholders’ equity |
1,408 | 1,438 | 1,309 | (3,674 | ) | 481 | ||||||||||||||
| Total liabilities and shareholders’ equity |
$ | 3,255 | $ | 2,161 | $ | 2,581 | $ | (4,031 | ) | $ | 3,966 | |||||||||
Condensed Consolidating Statements of Operations
| For the year ended December 31, 2009 (in millions) |
Parent | Guarantor Subsidiaries |
Non-Guarantor Subsidiaries |
Eliminations | Consolidated | |||||||||||||||
| Operating revenue |
$ | — | $ | 3,423 | $ | 1,913 | $ | (53 | ) | $ | 5,283 | |||||||||
| Operating expenses: |
||||||||||||||||||||
| Salaries, wages and employees’ benefits |
36 | 2,532 | 1,142 | — | 3,710 | |||||||||||||||
| Operating expenses and supplies |
(32 | ) | 748 | 522 | (1 | ) | 1,237 | |||||||||||||
| Purchased transportation |
— | 479 | 221 | (53 | ) | 647 | ||||||||||||||
| Depreciation and amortization |
— | 165 | 90 | — | 255 | |||||||||||||||
| Other operating expenses |
2 | 216 | 106 | — | 324 | |||||||||||||||
| Gains on property disposals, net |
— | (8 | ) | 2 | — | (6 | ) | |||||||||||||
| Total operating expenses |
6 | 4,132 | 2,083 | (54 | ) | 6,167 | ||||||||||||||
| Operating income (loss) |
(6 | ) | (709 | ) | (170 | ) | 1 | (884 | ) | |||||||||||
| Nonoperating (income) expenses: |
||||||||||||||||||||
| Interest expense |
115 | 3 | 44 | — | 162 | |||||||||||||||
| Equity investment impairment |
— | — | 30 | — | 30 | |||||||||||||||
| Gain on debt redemption, net |
(194 | ) | — | — | — | (194 | ) | |||||||||||||
| Interest income |
— | — | (1 | ) | — | (1 | ) | |||||||||||||
| Other, net |
70 | (19 | ) | (42 | ) | 1 | 10 | |||||||||||||
| Nonoperating (income) expenses, net |
(9 | ) | (16 | ) | 31 | 1 | 7 | |||||||||||||
| Income (loss) before income taxes |
3 | (693 | ) | (201 | ) | — | (891 | ) | ||||||||||||
| Income tax provision (benefit) |
56 | (282 | ) | (43 | ) | — | (269 | ) | ||||||||||||
| Net loss |
$ | (53 | ) | $ | (411 | ) | $ | (158 | ) | $ | — | $ | (622 | ) | ||||||
101
Table of Contents
| For the year ended December 31, 2008 (in millions) |
Parent | Guarantor Subsidiaries |
Non-Guarantor Subsidiaries |
Eliminations | Consolidated | |||||||||||||||
| Operating revenue |
$ | — | $ | 6,237 | $ | 2,784 | $ | (81 | ) | $ | 8,940 | |||||||||
| Operating expenses: |
||||||||||||||||||||
| Salaries, wages and employees’ benefits |
27 | 3,505 | 1,737 | — | 5,269 | |||||||||||||||
| Operating expenses and supplies |
(18 | ) | 1,362 | 648 | (1 | ) | 1,991 | |||||||||||||
| Purchased transportation |
— | 800 | 356 | (81 | ) | 1,075 | ||||||||||||||
| Depreciation and amortization |
— | 168 | 96 | — | 264 | |||||||||||||||
| Other operating expenses |
— | 286 | 124 | — | 410 | |||||||||||||||
| Gains on property disposals, net |
— | (11 | ) | (8 | ) | — | (19 | ) | ||||||||||||
| Impairment charges |
— | 775 | 249 | — | 1,024 | |||||||||||||||
| Total operating expenses |
9 | 6,885 | 3,202 | (82 | ) | 10,014 | ||||||||||||||
| Operating income (loss) |
(9 | ) | (648 | ) | (418 | ) | 1 | (1,074 | ) | |||||||||||
| Nonoperating (income) expenses: |
||||||||||||||||||||
| Interest expense |
39 | 17 | 25 | — | 81 | |||||||||||||||
| Interest income |
(2 | ) | — | (3 | ) | — | (5 | ) | ||||||||||||
| Other, net |
21 | 185 | (211 | ) | 1 | (4 | ) | |||||||||||||
| Nonoperating (income) expenses, net |
58 | 202 | (189 | ) | 1 | 72 | ||||||||||||||
| Loss before income taxes |
(67 | ) | (850 | ) | (229 | ) | — | (1,146 | ) | |||||||||||
| Income tax benefit |
(24 | ) | (112 | ) | (34 | ) | — | (170 | ) | |||||||||||
| Net loss |
$ | (43 | ) | $ | (738 | ) | $ | (195 | ) | $ | — | $ | (976 | ) | ||||||
| For the year ended December 31, 2007 (in millions) |
Parent | Guarantor Subsidiaries |
Non-Guarantor Subsidiaries |
Eliminations | Consolidated | |||||||||||||||
| Operating revenue |
$ | 45 | $ | 6,724 | $ | 3,233 | $ | (381 | ) | $ | 9,621 | |||||||||
| Operating expenses: |
||||||||||||||||||||
| Salaries, wages and employees’ benefits |
43 | 3,804 | 1,908 | — | 5,755 | |||||||||||||||
| Operating expenses and supplies |
28 | 1,345 | 847 | (348 | ) | 1,872 | ||||||||||||||
| Purchased transportation |
— | 780 | 344 | (35 | ) | 1,089 | ||||||||||||||
| Depreciation and amortization |
— | 159 | 97 | — | 256 | |||||||||||||||
| Other operating expenses |
— | 296 | 142 | — | 438 | |||||||||||||||
| (Gains) losses on property disposals, net |
— | (8 | ) | 2 | — | (6 | ) | |||||||||||||
| Impairment charges |
— | 76 | 706 | — | 782 | |||||||||||||||
| Total operating expenses |
71 | 6,452 | 4,046 | (383 | ) | 10,186 | ||||||||||||||
| Operating income (loss) |
(26 | ) | 272 | (813 | ) | 2 | (565 | ) | ||||||||||||
| Nonoperating (income) expenses: |
||||||||||||||||||||
| Interest expense |
39 | 18 | 35 | — | 92 | |||||||||||||||
| Interest income |
(3 | ) | — | (1 | ) | — | (4 | ) | ||||||||||||
| Other, net |
30 | 195 | (225 | ) | 2 | 2 | ||||||||||||||
| Nonoperating (income) expenses, net |
66 | 213 | (191 | ) | 2 | 90 | ||||||||||||||
| Income (loss) before income taxes |
(92 | ) | 59 | (622 | ) | — | (655 | ) | ||||||||||||
| Income tax provision (benefit) |
(27 | ) | 7 | 5 | — | (15 | ) | |||||||||||||
| Net income (loss) |
$ | (65 | ) | $ | 52 | $ | (627 | ) | $ | — | $ | (640 | ) | |||||||
102
Table of Contents
Condensed Consolidating Statements of Cash Flows
| For the year ended December 31, 2009 (in millions) |
Parent | Guarantor Subsidiaries |
Non-Guarantor Subsidiaries |
Eliminations | Consolidated | ||||||||||||||
| Operating activities: |
|||||||||||||||||||
| Net cash provided by (used in) operating activities |
$ | (108 | ) | $ | (636 | ) | $ | 366 | $ | — | $ | (378 | ) | ||||||
| Investing activities: |
|||||||||||||||||||
| Acquisition of property and equipment |
— | (28 | ) | (9 | ) | — | (37 | ) | |||||||||||
| Proceeds from disposal of property and equipment |
— | 113 | 20 | — | 133 | ||||||||||||||
| Disposition of business line |
— | 32 | — | — | 32 | ||||||||||||||
| Other |
6 | 3 | (3 | ) | — | 6 | |||||||||||||
| Net cash provided by investing activities |
6 | 120 | 8 | — | 134 | ||||||||||||||
| Financing activities: |
|||||||||||||||||||
| Asset-backed securitization borrowings (payments), net |
— | — | (1 | ) | — | (1 | ) | ||||||||||||
| Issuance of long-term debt |
332 | — | — | — | 332 | ||||||||||||||
| Repayment of long-term debt |
(246 | ) | (1 | ) | — | — | (247 | ) | |||||||||||
| Debt issuance costs |
(47 | ) | — | (14 | ) | — | (61 | ) | |||||||||||
| Equity issuance costs |
(6 | ) | — | — | — | (6 | ) | ||||||||||||
| Intercompany advances / repayments |
(157 | ) | 517 | (360 | ) | — | — | ||||||||||||
| Net cash provided by (used in) financing activities |
(124 | ) | 516 | (375 | ) | — | 17 | ||||||||||||
| Net decrease in cash and cash equivalents |
(226 | ) | — | (1 | ) | — | (227 | ) | |||||||||||
| Cash and cash equivalents, beginning of year |
295 | 9 | 21 | — | 325 | ||||||||||||||
| Cash and cash equivalents, end of year |
$ | 69 | $ | 9 | $ | 20 | $ | — | $ | 98 | |||||||||
| For the year ended December 31, 2008 (in millions) |
Parent | Guarantor Subsidiaries |
Non-Guarantor Subsidiaries |
Eliminations | Consolidated | ||||||||||||||
| Operating activities: |
|||||||||||||||||||
| Net cash provided by (used in) operating activities |
$ | 40 | $ | (59 | ) | $ | 239 | $ | — | $ | 220 | ||||||||
| Investing activities: |
|||||||||||||||||||
| Acquisition of property and equipment |
— | (120 | ) | (42 | ) | — | (162 | ) | |||||||||||
| Proceeds from disposal of property and equipment |
— | 45 | 82 | — | 127 | ||||||||||||||
| Investment in Affiliate |
— | — | (46 | ) | — | (46 | ) | ||||||||||||
| Other |
— | — | (6 | ) | — | (6 | ) | ||||||||||||
| Net cash used in investing activities |
— | (75 | ) | (12 | ) | — | (87 | ) | |||||||||||
| Financing activities: |
|||||||||||||||||||
| Asset-backed securitization borrowings (payments), net |
— | — | (33 | ) | — | (33 | ) | ||||||||||||
| Issuance of long-term debt |
510 | — | — | — | 510 | ||||||||||||||
| Repayment of long-term debt |
— | (229 | ) | (103 | ) | — | (332 | ) | |||||||||||
| Debt issuance costs |
(11 | ) | — | — | — | (11 | ) | ||||||||||||
| Intercompany advances / repayments |
(270 | ) | 357 | (87 | ) | — | — | ||||||||||||
| Net cash provided by (used in) financing activities |
229 | 128 | (223 | ) | — | 134 | |||||||||||||
| Net increase (decrease) in cash and cash equivalents |
269 | (6 | ) | 4 | — | 267 | |||||||||||||
| Cash and cash equivalents, beginning of year |
26 | 15 | 17 | — | 58 | ||||||||||||||
| Cash and cash equivalents, end of year |
$ | 295 | $ | 9 | $ | 21 | $ | — | $ | 325 | |||||||||
103
Table of Contents
| For the year ended December 31, 2007 (in millions) |
Parent | Guarantor Subsidiaries |
Non-Guarantor Subsidiaries |
Eliminations | Consolidated | ||||||||||||||
| Operating activities: |
|||||||||||||||||||
| Net cash provided by (used in) operating activities |
$ | (219 | ) | $ | 417 | $ | 195 | $ | — | $ | 393 | ||||||||
| Investing activities: |
|||||||||||||||||||
| Acquisition of property and equipment |
— | (251 | ) | (143 | ) | — | (394 | ) | |||||||||||
| Proceeds from disposal of property and equipment |
— | 23 | 32 | — | 55 | ||||||||||||||
| Other |
(2 | ) | 1 | (1 | ) | — | (2 | ) | |||||||||||
| Net cash used in investing activities |
(2 | ) | (227 | ) | (112 | ) | — | (341 | ) | ||||||||||
| Financing activities: |
|||||||||||||||||||
| Asset-backed securitization borrowings (payments), net |
— | — | (45 | ) | — | (45 | ) | ||||||||||||
| Issuance of long-term debt |
154 | — | 1 | — | 155 | ||||||||||||||
| Repayment of long-term debt |
(150 | ) | — | — | — | (150 | ) | ||||||||||||
| Debt issuance costs |
(1 | ) | — | — | — | (1 | ) | ||||||||||||
| Treasury stock purchases |
(35 | ) | — | — | — | (35 | ) | ||||||||||||
| Proceeds from exercise of stock options |
6 | — | — | — | 6 | ||||||||||||||
| Intercompany advances / repayments |
253 | (196 | ) | (57 | ) | — | — | ||||||||||||
| Net cash provided by (used in) financing activities |
227 | (196 | ) | (101 | ) | — | (70 | ) | |||||||||||
| Net increase (decrease) in cash and cash equivalents |
6 | (6 | ) | (18 | ) | — | (18 | ) | |||||||||||
| Cash and cash equivalents, beginning of year |
20 | 21 | 35 | — | 76 | ||||||||||||||
| Cash and cash equivalents, end of year |
$ | 26 | $ | 15 | $ | 17 | $ | — | $ | 58 | |||||||||
104
Table of Contents
Guarantees of the Convertible Senior Notes Due 2014
On February 11, 2010, we entered into a note purchase agreement with certain investors pursuant to which such investors agreed, subject to the terms and conditions set forth therein, to purchase from us up to $70 million in aggregate principal amount of our new 6% convertible senior notes due 2014 (the “convertible senior notes”). The purchase and sale of the convertible senior notes were structured to occur in two closings. Pursuant to the note purchase agreement, we sold $49.8 million of the convertible senior notes to the investors in the first closing on February 23, 2010 and are obligated to sell an additional $20.2 million of convertible senior notes to the investors in the second closing, assuming the closing conditions in the note purchase agreement are met. In connection with these notes, the following 100% owned subsidiaries of YRC Worldwide have issued guarantees in favor of the holders of the notes: YRC Inc., YRC Enterprise Services, Inc., YRC Logistics, Inc., YRC Logistics Global, LLC, Globe.com Lines, Inc., Roadway LLC, Roadway Next Day Corporation, YRC Regional Transportation, Inc., USF Sales Corporation, USF Holland Inc., USF Reddaway Inc., USF Glen Moore Inc., YRC Logistics Services, Inc. and IMUA Handling Corporation. Each of the guarantees is full and unconditional and joint and several.
The condensed consolidating financial statements are presented in lieu of separate financial statements and other related disclosures of the subsidiary guarantors and issuer because management does not believe that such separate financial statements and related disclosures would be material to investors. There are currently no significant restrictions on the ability of YRC Worldwide or any guarantor to obtain funds from its subsidiaries by dividend or loan.
The following represents condensed consolidating financial information as of December 31, 2009 and 2008, with respect to the financial position and for the years ended December 31, 2009, 2008 and 2007, for results of operations and cash flows of YRC Worldwide and its subsidiaries. The Parent column presents the financial information of YRC Worldwide, the primary obligor of the convertible senior notes. The Guarantor Subsidiaries column presents the financial information of all guarantor subsidiaries of the convertible senior notes. The Non-Guarantor Subsidiaries column presents the financial information of all non-guarantor subsidiaries, including those subsidiaries that are governed by foreign laws and Yellow Roadway Receivables Funding Corporation, the special-purpose entity that is associated with our ABS agreement.
Condensed Consolidating Balance Sheets
| December 31, 2009 (in millions) |
Parent | Guarantor Subsidiaries |
Non-Guarantor Subsidiaries |
Eliminations | Consolidated | |||||||||||||||
| Cash and cash equivalents |
$ | 69 | $ | 10 | $ | 19 | $ | — | $ | 98 | ||||||||||
| Intercompany advances receivable |
— | (59 | ) | 59 | — | — | ||||||||||||||
| Accounts receivable, net |
10 | 33 | 473 | — | 516 | |||||||||||||||
| Prepaid expenses and other |
71 | 163 | 11 | — | 245 | |||||||||||||||
| Total current assets |
150 | 147 | 562 | — | 859 | |||||||||||||||
| Property and equipment |
— | 3,390 | 198 | — | 3,588 | |||||||||||||||
| Less – accumulated depreciation |
— | (1,664 | ) | (85 | ) | — | (1,749 | ) | ||||||||||||
| Net property and equipment |
— | 1,726 | 113 | — | 1,839 | |||||||||||||||
| Investment in subsidiaries |
2,999 | 164 | 35 | (3,198 | ) | — | ||||||||||||||
| Receivable from affiliate |
(314 | ) | 484 | (170 | ) | — | — | |||||||||||||
| Intangibles and other assets |
337 | 248 | 99 | (350 | ) | 334 | ||||||||||||||
| Total assets |
$ | 3,172 | $ | 2,769 | $ | 639 | $ | (3,548 | ) | $ | 3,032 | |||||||||
| Intercompany advances payable |
$ | 146 | $ | 174 | $ | (120 | ) | $ | (200 | ) | $ | — | ||||||||
| Accounts payable |
32 | 132 | 35 | — | 199 | |||||||||||||||
| Wages, vacations and employees’ benefits |
33 | 169 | 14 | — | 216 | |||||||||||||||
| Claims and insurance accruals |
147 | 21 | 4 | — | 172 | |||||||||||||||
| Other current and accrued liabilities |
46 | 169 | 11 | — | 226 | |||||||||||||||
| Asset-backed securitization borrowings |
— | — | 146 | — | 146 | |||||||||||||||
| Current maturities of long-term debt |
— | 51 | — | — | 51 | |||||||||||||||
| Total current liabilities |
404 | 716 | 90 | (200 | ) | 1,010 | ||||||||||||||
| Payable to affiliate |
— | (2 | ) | 152 | (150 | ) | — | |||||||||||||
| Long-term debt, less current portion |
936 | — | — | — | 936 | |||||||||||||||
| Deferred income taxes, net |
85 | 48 | 13 | — | 146 | |||||||||||||||
| Pension and postretirement |
352 | — | — | — | 352 | |||||||||||||||
| Claims and other liabilities |
414 | 7 | — | — | 421 | |||||||||||||||
| Commitments and contingencies |
||||||||||||||||||||
| Shareholders’ equity |
981 | 2,000 | 384 | (3,198 | ) | 167 | ||||||||||||||
| Total liabilities and shareholders’ equity |
$ | 3,172 | $ | 2,769 | $ | 639 | $ | (3,548 | ) | $ | 3,032 | |||||||||
105
Table of Contents
| December 31, 2008 (in millions) |
Parent | Guarantor Subsidiaries |
Non-Guarantor Subsidiaries |
Eliminations | Consolidated | |||||||||||||||
| Cash and cash equivalents |
$ | 295 | $ | 13 | $ | 17 | $ | — | $ | 325 | ||||||||||
| Intercompany advances receivable |
— | (79 | ) | 79 | — | — | ||||||||||||||
| Accounts receivable, net |
2 | (19 | ) | 857 | (3 | ) | 837 | |||||||||||||
| Prepaid expenses and other |
25 | 278 | (5 | ) | — | 298 | ||||||||||||||
| Total current assets |
322 | 193 | 948 | (3 | ) | 1,460 | ||||||||||||||
| Property and equipment |
— | 3,790 | 188 | — | 3,978 | |||||||||||||||
| Less – accumulated depreciation |
— | (1,707 | ) | (70 | ) | — | (1,777 | ) | ||||||||||||
| Net property and equipment |
— | 2,083 | 118 | — | 2,201 | |||||||||||||||
| Investment in subsidiaries |
3,377 | 194 | 1 | (3,572 | ) | — | ||||||||||||||
| Receivable from affiliate |
(712 | ) | 620 | 92 | — | — | ||||||||||||||
| Intangibles and other assets |
268 | 271 | 117 | (351 | ) | 305 | ||||||||||||||
| Total assets |
$ | 3,255 | $ | 3,361 | $ | 1,276 | $ | (3,926 | ) | $ | 3,966 | |||||||||
| Intercompany advances payable |
$ | 283 | $ | (142 | ) | $ | 62 | $ | (203 | ) | $ | — | ||||||||
| Accounts payable |
11 | 290 | 33 | — | 334 | |||||||||||||||
| Wages, vacations and employees’ benefits |
20 | 317 | 20 | — | 357 | |||||||||||||||
| Claims and insurance accruals |
38 | 31 | 102 | — | 171 | |||||||||||||||
| Other current and accrued liabilities |
18 | 173 | 128 | — | 319 | |||||||||||||||
| Asset-backed securitization borrowings |
— | — | 147 | — | 147 | |||||||||||||||
| Current maturities of long-term debt |
414 | 1 | — | — | 415 | |||||||||||||||
| Total current liabilities |
784 | 670 | 492 | (203 | ) | 1,743 | ||||||||||||||
| Payable to affiliate |
(47 | ) | 48 | 150 | (151 | ) | — | |||||||||||||
| Long-term debt, less current portion |
626 | 161 | — | — | 787 | |||||||||||||||
| Deferred income taxes, net |
20 | 305 | (82 | ) | — | 243 | ||||||||||||||
| Pension and postretirement |
370 | — | — | — | 370 | |||||||||||||||
| Claims and other liabilities |
94 | 7 | 241 | — | 342 | |||||||||||||||
| Commitments and contingencies |
||||||||||||||||||||
| Shareholders’ equity |
1,408 | 2,170 | 475 | (3,572 | ) | 481 | ||||||||||||||
| Total liabilities and shareholders’ equity |
$ | 3,255 | $ | 3,361 | $ | 1,276 | $ | (3,926 | ) | $ | 3,966 | |||||||||
Condensed Consolidating Statements of Operations
| For the year ended December 31, 2009 (in millions) |
Parent | Guarantor Subsidiaries |
Non-Guarantor Subsidiaries |
Eliminations | Consolidated | |||||||||||||||
| Operating revenue |
$ | — | $ | 4,765 | $ | 530 | $ | (12 | ) | $ | 5,283 | |||||||||
| Operating expenses: |
||||||||||||||||||||
| Salaries, wages and employees’ benefits |
36 | 3,438 | 236 | — | 3,710 | |||||||||||||||
| Operating expenses and supplies |
(32 | ) | 1,129 | 140 | — | 1,237 | ||||||||||||||
| Purchased transportation |
— | 501 | 158 | (12 | ) | 647 | ||||||||||||||
| Depreciation and amortization |
— | 237 | 18 | — | 255 | |||||||||||||||
| Other operating expenses |
2 | 305 | 17 | — | 324 | |||||||||||||||
| Gains on property disposals, net |
— | (5 | ) | (1 | ) | — | (6 | ) | ||||||||||||
| Total operating expenses |
6 | 5,605 | 568 | (12 | ) | 6,167 | ||||||||||||||
| Operating loss |
(6 | ) | (840 | ) | (38 | ) | — | (884 | ) | |||||||||||
| Nonoperating (income) expenses: |
||||||||||||||||||||
| Interest expense |
115 | 13 | 34 | — | 162 | |||||||||||||||
| Equity investment impairment |
— | — | 30 | — | 30 | |||||||||||||||
| Gain on debt redemption, net |
(194 | ) | — | — | — | (194 | ) | |||||||||||||
| Interest income |
— | — | (1 | ) | — | (1 | ) | |||||||||||||
| Other, net |
70 | (49 | ) | (11 | ) | — | 10 | |||||||||||||
| Nonoperating (income) expenses, net |
(9 | ) | (36 | ) | 52 | — | 7 | |||||||||||||
| Income (loss) before income taxes |
3 | (804 | ) | (90 | ) | — | (891 | ) | ||||||||||||
| Income tax provision (benefit) |
56 | (327 | ) | 2 | — | (269 | ) | |||||||||||||
| Net loss |
$ | (53 | ) | $ | (477 | ) | $ | (92 | ) | $ | — | $ | (622 | ) | ||||||
106
Table of Contents
| For the year ended December 31, 2008 (in millions) |
Parent | Guarantor Subsidiaries |
Non-Guarantor Subsidiaries |
Eliminations | Consolidated | |||||||||||||||
| Operating revenue |
$ | — | $ | 8,260 | $ | 719 | $ | (39 | ) | $ | 8,940 | |||||||||
| Operating expenses: |
||||||||||||||||||||
| Salaries, wages and employees’ benefits |
27 | 4,838 | 403 | — | 5,268 | |||||||||||||||
| Operating expenses and supplies |
(18 | ) | 1,858 | 152 | — | 1,992 | ||||||||||||||
| Purchased transportation |
— | 868 | 246 | (39 | ) | 1,075 | ||||||||||||||
| Depreciation and amortization |
— | 245 | 19 | — | 264 | |||||||||||||||
| Other operating expenses |
— | 393 | 17 | — | 410 | |||||||||||||||
| Gains on property disposals, net |
— | (19 | ) | — | — | (19 | ) | |||||||||||||
| Impairment charges |
— | 973 | 51 | — | 1,024 | |||||||||||||||
| Total operating expenses |
9 | 9,156 | 888 | (39 | ) | 10,014 | ||||||||||||||
| Operating loss |
(9 | ) | (896 | ) | (169 | ) | — | (1,074 | ) | |||||||||||
| Nonoperating (income) expenses: |
||||||||||||||||||||
| Interest expense |
39 | 31 | 11 | — | 81 | |||||||||||||||
| Interest income |
(2 | ) | — | (3 | ) | — | (5 | ) | ||||||||||||
| Other, net |
21 | 217 | (242 | ) | — | (4 | ) | |||||||||||||
| Nonoperating (income) expenses, net |
58 | 248 | (234 | ) | — | 72 | ||||||||||||||
| Income (loss) before income taxes |
(67 | ) | (1,144 | ) | 65 | — | (1,146 | ) | ||||||||||||
| Income tax provision (benefit) |
(24 | ) | (192 | ) | 46 | — | (170 | ) | ||||||||||||
| Net income (loss) |
$ | (43 | ) | $ | (952 | ) | $ | 19 | $ | — | $ | (976 | ) | |||||||
| For the year ended December 31, 2007 (in millions) |
Parent | Guarantor Subsidiaries |
Non-Guarantor Subsidiaries |
Eliminations | Consolidated | |||||||||||||||
| Operating revenue |
$ | 45 | $ | 9,169 | $ | 760 | $ | (353 | ) | $ | 9,621 | |||||||||
| Operating expenses: |
||||||||||||||||||||
| Salaries, wages and employees’ benefits |
44 | 5,247 | 465 | — | 5,756 | |||||||||||||||
| Operating expenses and supplies |
27 | 2,016 | 154 | (326 | ) | 1,871 | ||||||||||||||
| Purchased transportation |
— | 902 | 216 | (29 | ) | 1,089 | ||||||||||||||
| Depreciation and amortization |
— | 235 | 21 | — | 256 | |||||||||||||||
| Other operating expenses |
— | 417 | 21 | — | 438 | |||||||||||||||
| (Gains) losses on property disposals, net |
— | (9 | ) | 3 | — | (6 | ) | |||||||||||||
| Impairment charges |
— | 721 | 61 | — | 782 | |||||||||||||||
| Total operating expenses |
71 | 9,529 | 941 | (355 | ) | 10,186 | ||||||||||||||
| Operating income (loss) |
(26 | ) | (360 | ) | (181 | ) | 2 | (565 | ) | |||||||||||
| Nonoperating (income) expenses: |
||||||||||||||||||||
| Interest expense |
39 | 34 | 19 | — | 92 | |||||||||||||||
| Interest income |
(3 | ) | (1 | ) | — | — | (4 | ) | ||||||||||||
| Other, net |
30 | 220 | (250 | ) | 2 | 2 | ||||||||||||||
| Nonoperating (income) expenses, net |
66 | 253 | (231 | ) | 2 | 90 | ||||||||||||||
| Income (loss) before income taxes |
(92 | ) | (613 | ) | 50 | — | (655 | ) | ||||||||||||
| Income tax provision (benefit) |
(27 | ) | (27 | ) | 39 | — | (15 | ) | ||||||||||||
| Net income (loss) |
$ | (65 | ) | $ | (586 | ) | $ | 11 | $ | — | $ | (640 | ) | |||||||
107
Table of Contents
Condensed Consolidating Statements of Cash Flows
| For the year ended December 31, 2009 (in millions) |
Parent | Guarantor Subsidiaries |
Non-Guarantor Subsidiaries |
Eliminations | Consolidated | ||||||||||||||
| Operating activities: |
|||||||||||||||||||
| Net cash provided by (used in) operating activities |
$ | (108 | ) | $ | (681 | ) | $ | 411 | $ | — | $ | (378 | ) | ||||||
| Investing activities: |
|||||||||||||||||||
| Acquisition of property and equipment |
— | (34 | ) | (3 | ) | — | (37 | ) | |||||||||||
| Proceeds from disposal of property and equipment |
— | 131 | 2 | — | 133 | ||||||||||||||
| Disposition of business line |
— | 32 | — | — | 32 | ||||||||||||||
| Other |
6 | 3 | (3 | ) | — | 6 | |||||||||||||
| Net cash provided by (used in) investing activities |
6 | 132 | (4 | ) | — | 134 | |||||||||||||
| Financing activities: |
|||||||||||||||||||
| Asset-backed securitization borrowings (payments), net |
— | — | (1 | ) | — | (1 | ) | ||||||||||||
| Issuance of long-term debt |
332 | — | — | — | 332 | ||||||||||||||
| Repayment of long-term debt |
(246 | ) | (1 | ) | — | — | (247 | ) | |||||||||||
| Debt issuance costs |
(47 | ) | — | (14 | ) | — | (61 | ) | |||||||||||
| Equity issuance costs |
(6 | ) | — | — | — | (6 | ) | ||||||||||||
| Intercompany advances / repayments |
(157 | ) | 547 | (390 | ) | — | — | ||||||||||||
| Net cash provided by (used in) financing activities |
(124 | ) | 546 | (405 | ) | — | 17 | ||||||||||||
| Net increase (decrease) in cash and cash equivalents |
(226 | ) | (3 | ) | 2 | — | (227 | ) | |||||||||||
| Cash and cash equivalents, beginning of year |
295 | 13 | 17 | — | 325 | ||||||||||||||
| Cash and cash equivalents, end of year |
$ | 69 | $ | 10 | $ | 19 | $ | — | $ | 98 | |||||||||
| For the year ended December 31, 2008 (in millions) |
Parent | Guarantor Subsidiaries |
Non-Guarantor Subsidiaries |
Eliminations | Consolidated | ||||||||||||||
| Operating activities: |
|||||||||||||||||||
| Net cash provided by (used in) operating activities |
$ | 40 | $ | (151 | ) | $ | 331 | $ | — | $ | 220 | ||||||||
| Investing activities: |
|||||||||||||||||||
| Acquisition of property and equipment |
— | (154 | ) | (8 | ) | — | (162 | ) | |||||||||||
| Proceeds from disposal of property and equipment |
— | 114 | 13 | — | 127 | ||||||||||||||
| Investment in affiliate |
— | (1 | ) | (45 | ) | — | (46 | ) | |||||||||||
| Other |
— | — | (6 | ) | — | (6 | ) | ||||||||||||
| Net cash used in investing activities |
— | (41 | ) | (46 | ) | — | (87 | ) | |||||||||||
| Financing activities: |
|||||||||||||||||||
| Asset-backed securitization borrowings (payments), net |
— | — | (33 | ) | — | (33 | ) | ||||||||||||
| Issuance of long-term debt |
510 | — | — | — | 510 | ||||||||||||||
| Repayment of long-term debt |
— | (332 | ) | — | — | (332 | ) | ||||||||||||
| Debt issuance costs |
(11 | ) | — | — | — | (11 | ) | ||||||||||||
| Intercompany advances / repayments |
(270 | ) | 520 | (250 | ) | — | — | ||||||||||||
| Net cash provided by (used in) financing activities |
229 | 188 | (283 | ) | — | 134 | |||||||||||||
| Net increase (decrease) in cash and cash equivalents |
269 | (4 | ) | 2 | — | 267 | |||||||||||||
| Cash and cash equivalents, beginning of year |
26 | 17 | 15 | — | 58 | ||||||||||||||
| Cash and cash equivalents, end of year |
$ | 295 | $ | 13 | $ | 17 | $ | — | $ | 325 | |||||||||
108
Table of Contents
| For the year ended December 31, 2007 (in millions) |
Parent | Guarantor Subsidiaries |
Non-Guarantor Subsidiaries |
Eliminations | Consolidated | ||||||||||||||
| Operating activities: |
|||||||||||||||||||
| Net cash provided by (used in) operating activities |
$ | (219 | ) | $ | 500 | $ | 112 | $ | — | $ | 393 | ||||||||
| Investing activities: |
|||||||||||||||||||
| Acquisition of property and equipment |
— | (369 | ) | (25 | ) | — | (394 | ) | |||||||||||
| Proceeds from disposal of property and equipment |
— | 55 | — | — | 55 | ||||||||||||||
| Other |
(2 | ) | 2 | (2 | ) | — | (2 | ) | |||||||||||
| Net cash used in investing activities |
(2 | ) | (312 | ) | (27 | ) | — | (341 | ) | ||||||||||
| Financing activities: |
|||||||||||||||||||
| Asset-backed securitization borrowings (payments), net |
— | — | (45 | ) | — | (45 | ) | ||||||||||||
| Issuance of long-term debt |
154 | — | 1 | — | 155 | ||||||||||||||
| Repayment of long-term debt |
(150 | ) | — | — | — | (150 | ) | ||||||||||||
| Debt issuance costs |
(1 | ) | — | — | — | (1 | ) | ||||||||||||
| Treasury stock purchases |
(35 | ) | — | — | — | (35 | ) | ||||||||||||
| Proceeds from exercise of stock options |
6 | — | — | — | 6 | ||||||||||||||
| Intercompany advances / repayments |
253 | (196 | ) | (57 | ) | — | — | ||||||||||||
| Net cash provided by (used in) financing activities |
227 | (196 | ) | (101 | ) | — | (70 | ) | |||||||||||
| Net increase (decrease) in cash and cash equivalents |
6 | (8 | ) | (16 | ) | — | (18 | ) | |||||||||||
| Cash and cash equivalents, beginning of year |
20 | 25 | 31 | — | 76 | ||||||||||||||
| Cash and cash equivalents, end of year |
$ | 26 | $ | 17 | $ | 15 | $ | — | $ | 58 | |||||||||
109
Table of Contents
Report of Independent Registered Public Accounting Firm
The Board of Directors and Shareholders
YRC Worldwide Inc.:
We have audited the accompanying consolidated balance sheets of YRC Worldwide Inc. and subsidiaries (the Company) as of December 31, 2009 and 2008, and the related consolidated statements of operations, cash flows, shareholders’ equity and comprehensive income (loss) for each of the years in the three-year period ended December 31, 2009. These consolidated financial statements are the responsibility of the Company’s management. Our responsibility is to express an opinion on these consolidated financial statements based on our audits.
We conducted our audits in accordance with the standards of the Public Company Accounting Oversight Board (United States). Those standards require that we plan and perform the audit to obtain reasonable assurance about whether the financial statements are free of material misstatement. An audit includes examining, on a test basis, evidence supporting the amounts and disclosures in the financial statements. An audit also includes assessing the accounting principles used and significant estimates made by management, as well as evaluating the overall financial statement presentation. We believe that our audits provide a reasonable basis for our opinion.
In our opinion, the consolidated financial statements referred to above present fairly, in all material respects, the financial position of the Company as of December 31, 2009 and 2008, and the results of their operations and their cash flows for each of the years in the three-year period ended December 31, 2009, in conformity with U.S. generally accepted accounting principles.
The accompanying consolidated financial statements have been prepared assuming that the Company will continue as a going concern. As discussed in Note 7 to the consolidated financial statements, the Company has experienced significant declines in operations, cash flows, and liquidity. These conditions raise substantial doubt about the Company’s ability to continue as a going concern. Management’s plans in regard to these matters are also described in Note 7. The consolidated financial statements do not include any adjustments that might result from the outcome of this uncertainty.
We also have audited, in accordance with the standards of the Public Company Accounting oversight Board (United States), YRC Worldwide Inc.’s internal control over financial reporting as of December 31, 2009, based on criteria established in Internal Control – Integrated Framework issued by the Committee of Sponsoring Organizations of the Treadway Commission (COSO), and our report dated March 16, 2010, expressed an unqualified opinion on the effectiveness of YRC Worldwide Inc.’s internal control over financial reporting.
| /s/ KPMG LLP |
| Kansas City, Missouri |
| March 16, 2010 |
110
Table of Contents
Report of Independent Registered Public Accounting Firm
The Board of Directors and Shareholders
YRC Worldwide Inc.:
We have audited YRC Worldwide Inc.’s internal control over financial reporting as of December 31, 2009, based on criteria established in Internal Control – Integrated Framework issued by the Committee of Sponsoring Organizations of the Treadway Commission (COSO). YRC Worldwide Inc.’s management is responsible for maintaining effective internal control over financial reporting and for its assessment of the effectiveness of internal control over financial reporting, included in the accompanying Management’s Report on Internal Control Over Financial Reporting. Our responsibility is to express an opinion on YRC Worldwide Inc.’s internal control over financial reporting based on our audit.
We conducted our audit in accordance with the standards of the Public Company Accounting Oversight Board (United States). Those standards require that we plan and perform the audit to obtain reasonable assurance about whether effective internal control over financial reporting was maintained in all material respects. Our audit included obtaining an understanding of internal control over financial reporting, assessing the risk that a material weakness exists, and testing and evaluating the design and operating effectiveness of internal control based on the assessed risk. Our audit also included performing such other procedures as we considered necessary in the circumstances. We believe that our audit provides a reasonable basis for our opinion.
A company’s internal control over financial reporting is a process designed to provide reasonable assurance regarding the reliability of financial reporting and the preparation of financial statements for external purposes in accordance with generally accepted accounting principles. A company’s internal control over financial reporting includes those policies and procedures that (1) pertain to the maintenance of records that, in reasonable detail, accurately and fairly reflect the transactions and dispositions of the assets of the company; (2) provide reasonable assurance that transactions are recorded as necessary to permit preparation of financial statements in accordance with generally accepted accounting principles, and that receipts and expenditures of the company are being made only in accordance with authorizations of management and directors of the company; and (3) provide reasonable assurance regarding prevention or timely detection of unauthorized acquisition, use, or disposition of the company’s assets that could have a material effect on the financial statements.
Because of its inherent limitations, internal control over financial reporting may not prevent or detect misstatements. Also, projections of any evaluation of effectiveness to future periods are subject to the risk that controls may become inadequate because of changes in conditions, or that the degree of compliance with the policies or procedures may deteriorate.
In our opinion, YRC Worldwide Inc. maintained, in all material respects, effective internal control over financial reporting as of December 31, 2009, based on criteria established in Internal Control – Integrated Framework issued by the Committee of Sponsoring Organizations of the Treadway Commission.
We also have audited, in accordance with the standards of the Public Company Accounting Oversight Board (United States), the consolidated balance sheets of YRC Worldwide Inc. and subsidiaries as of December 31, 2009 and 2008, and the related consolidated statements of operations, cash flows, shareholders’ equity and comprehensive income (loss) for each of the years in the three-year period ended December 31, 2009, and our report dated March 16, 2010 expressed an unqualified opinion on those consolidated financial statements.
The audit report on the consolidated financial statements of YRC Worldwide Inc. and subsidiaries referred to above contains an explanatory paragraph that states that the Company has experienced significant declines in operations, cash flows and liquidity and these conditions raise substantial doubt about the Company’s ability to continue as a going concern. The consolidated financial statements do not include any adjustments that might result from the outcome of this uncertainty.
| /s/ KPMG LLP |
| Kansas City, Missouri |
| March 16, 2010 |
111
Table of Contents
| Item 9. | Changes in and Disagreements with Accountants on Accounting and Financial Disclosure |
Not applicable.
| Item 9A. | Controls and Procedures |
Evaluation of Disclosure Controls and Procedures
As required by the Securities and Exchange Act of 1934, as amended (the “Exchange Act”), we maintain disclosure controls and procedures designed to ensure that information we are required to disclose in reports that we file or submit under the Exchange Act, is recorded, processed, summarized and reported within the time periods specified in the SEC’s rules and forms. Our disclosure controls and procedures include, without limitation, controls and procedures designed to ensure that information we are required to disclose in reports that we file or submit under the Exchange Act is accumulated and communicated to our management, including our principal executive and principal financial officers, as appropriate to allow timely decisions regarding required disclosure. Our management, with the participation of our principal executive and financial officers, has evaluated our disclosure controls and procedures as of December 31, 2009 and has concluded that our disclosure controls and procedures were effective as of December 31, 2009.
Management’s Report on Internal Control Over Financial Reporting
The Company’s management is responsible for establishing and maintaining effective internal control over our financial reporting, which is designed to provide reasonable assurance regarding the reliability of financial reporting and the preparation of financial statements for external purposes in accordance with generally accepted accounting principles.
Our management assessed the effectiveness of our system of internal control over financial reporting as of December 31, 2009. In making this assessment, our management used the criteria for effective internal control over financial reporting described in “Internal Control – Integrated Framework” that the Committee of Sponsoring Organizations of the Treadway Commission issued.
Based on its assessment using those criteria, our management concluded that, as of December 31, 2009, our system of internal control over financial reporting was effective.
KPMG LLP, the registered independent public accounting firm that audited our December 31, 2009 consolidated financial statements, has issued an attestation report on our system of internal control over financial reporting. The KPMG LLP attestation report is included herein.
Changes in Internal Control Over Financial Reporting
There were no changes in the Company’s internal control over financial reporting that occurred during the fiscal quarter ended December 31, 2009 that have materially affected, or are reasonably likely to materially affect, the Company’s internal control over financial reporting.
| Item 9B. | Other Information |
On March 11, 2010, the Company entered into Amendment No. 16 to the Credit Agreement (the “Credit Agreement Amendment”) which amends the Credit Agreement, dated as of August 17, 2007, as amended, among the Company, certain of our subsidiaries, JPMorgan Chase, National Association, as administrative agent, and the other agents and lenders party thereto.
The principal terms of the Credit Agreement Amendment are set forth herein under the heading “Management’s Discussion and Analysis of Financial Condition and Results of Operations—Financial Condition—Liquidity—Credit Facilities—Credit Agreement” and incorporated herein by reference.
A copy of the Credit Agreement Amendment is attached as Exhibit 10.1.11 hereto and is incorporated by reference. The description of the principal terms of the Credit Agreement Amendment is qualified in its entirety by reference thereto.
112
Table of Contents
PART III
| Item 10. | Directors and Executive Officers of the Registrant |
Pursuant to General Instruction G to Form 10-K, the information required by this item, other than information regarding our executive officers and our code of ethics which is set forth below, either is incorporated herein by reference to a definitive proxy statement filed with the SEC no later than 120 days after the end of the fiscal year covered by this Form 10-K or will be included in an amendment to this Form 10-K filed with the SEC no later than 120 days after the end of the fiscal year covered by this Form 10-K.
The following are our executive officers as of March 16, 2010, each of whom serves until his or her successor has been elected and qualified or until his or her earlier resignation or removal:
| Name |
Age | Position(s) Held | ||
| William D. Zollars |
62 | Chairman of the Board and Chief Executive Officer of YRC Worldwide (since November 1999); President of YRC Worldwide (November 1999 – October 2009); President of Yellow Transportation (1996 – 1999); Senior Vice President of Ryder Integrated Logistics, Inc. (1994 –1996). | ||
| Timothy A. Wicks |
44 | President and Chief Operating Officer of YRC Worldwide (since October 2009); Executive Vice President and Chief Financial Officer of YRC Worldwide (October 2008 – October 2009); Senior Vice President, Strategic Growth Initiatives (2006 – 2008), Senior Vice President, Product Development and Management (2004 – 2006), Vice President, Platinum Broker Service (2003 – 2004), and Vice President, Consumer Solutions (2002 – 2003) of United Healthcare (healthcare insurance). | ||
| Sheila K. Taylor |
36 | Executive Vice President and Chief Financial Officer of YRC Worldwide (since October 2009); Vice President – Investor Relations of YRC Worldwide (January 2008 – October 2009): Treasurer of YRC Worldwide (June 2009 – October 2009); Vice President – Finance of Yellow Transportation (January 2007 – August 2008); various director and manager titles in finance, corporate development and investor relations with YRC Worldwide (July 2002 – January 2007). | ||
| Michael J. Smid |
54 | Chief Operations Officer of YRC Worldwide (since June 2009); President of YRC Inc. (since October 2008); President of YRC Enterprise Services (since 2007); President of YRC National Transportation (2007); President and Chief Executive Officer of Roadway Express (2005 – 2007); President and Chief Integration Officer of YRC Worldwide Enterprise Services (2004 – 2005); Executive Vice President and Chief Administrative Officer of Yellow Transportation (2000 – 2004). | ||
| Daniel J. Churay |
47 | Executive Vice President, General Counsel and Secretary of YRC Worldwide (since September 2002). | ||
113
Table of Contents
| Phil J. Gaines |
46 | Chief Accounting Officer of YRC Worldwide (since October 2009); Senior Vice President – Finance of YRC Worldwide (since June 2009); Senior Vice President and Chief Financial Officer of YRC Inc. and YRC Enterprise Services (since January 2009); President of Yellow Transportation (July 2008 – February 2009); Senior Vice President and Chief Financial Officer of YRC North American Transportation (January 2008 – July 2008); Senior Vice President and Chief Financial Officer of YRC National Transportation (January 2007 – December 2007); Senior Vice President – Investor Relations, Government Relations and Corporate Development of YRC Worldwide (August 2005 – January 2007); Senior Vice President – Finance and Administration of Yellow Transportation (December 2003 – August 2005). | ||
| James G. Kissinger |
53 | Executive Vice President – Human Resources of YRC Worldwide (since January 2008); Senior Vice President – Corporate Operations, Aircell (telecommunications) (2006 – 2007); Senior Vice President – Human Resources, Sprint Nextel Corporation (telecommunications) (1984 – 2006). | ||
| John A. Garcia |
56 | Executive Vice President and Chief Sales Officer of YRC Worldwide (since June 2009); President, CDMA Business Unit (October 2007 – November 2008), Chief Marketing Officer (September 2006 – October 2007), Senior Vice President – Product Development (July 2005 – September 2006), President, Sprint/Cable Joint Venture (2005) of Sprint Nextel Corporation (telecommunications). | ||
| Richard Williamson |
53 | Chief Strategy Officer of YRC Worldwide (since August 2009); Managing Director of Alvarez & Marsal (restructuring and performance improvement consulting) (since 2001). | ||
We have adopted a written Code of Conduct that applies to all of our directors, officers and employees, including our chief executive officer, chief financial officer and chief accounting officer. It is available under “Board Committee Charters & Code of Conduct” on our website located at www.yrcw.com. We intend to disclose any amendments to, or waivers from, any provision of our Code of Conduct that applies to our chief executive officer, chief financial officer or chief accounting officer by posting such information on our website located at www.yrcw.com.
| Item 11. | Executive Compensation |
Pursuant to General Instruction G to Form 10-K, the information required by this item either is incorporated herein by reference to a definitive proxy statement filed with the SEC no later than 120 days after the end of the fiscal year covered by this Form 10-K or will be included in an amendment to this Form 10-K filed with the SEC no later than 120 days after the end of the fiscal year covered by this Form 10-K.
| Item 12. | Security Ownership of Certain Beneficial Owners and Management |
Pursuant to General Instruction G to Form 10-K, the information required by this item either is incorporated herein by reference to a definitive proxy statement filed with the SEC no later than 120 days after the end of the fiscal year covered by this Form 10-K or will be included in an amendment to this Form 10-K filed with the SEC no later than 120 days after the end of the fiscal year covered by this Form 10-K.
114
Table of Contents
| Item 13. | Certain Relationships and Related Transactions, and Director Independence |
Pursuant to General Instruction G to Form 10-K, the information required by this item either is incorporated herein by reference to a definitive proxy statement filed with the SEC no later than 120 days after the end of the fiscal year covered by this Form 10-K or will be included in an amendment to this Form 10-K filed with the SEC no later than 120 days after the end of the fiscal year covered by this Form 10-K.
| Item 14. | Principal Accounting Fees and Services |
Pursuant to General Instruction G to Form 10-K, the information required by this item either is incorporated herein by reference to a definitive proxy statement filed with the SEC no later than 120 days after the end of the fiscal year covered by this Form 10-K or will be included in an amendment to this Form 10-K filed with the SEC no later than 120 days after the end of the fiscal year covered by this Form 10-K.
115
Table of Contents
PART IV
| Item 15. | Exhibits, Financial Statement Schedules |
(a)(1) Financial Statements
The consolidated financial statements of the Company included under Item 8 – Financial Statements and Supplementary Data.
(a)(2) Financial Statement Schedules
Report of Independent Registered Public Accounting Firm on Financial Statement Schedule on page 94.
Schedule II – Valuation and Qualifying Accounts for the years ended December 31, 2009, 2008 and 2007, on page 95.
| 2.1* | Asset Purchase Agreement dated November 23, 2009 between YRC Logistics Services, Inc. and Greatwide Dedicated Transport, LLC. | |
| 3.1.1 | Certificate of Incorporation of the Company (incorporated by reference to Exhibit 3.1 to Annual Report on Form 10-K for the year ended December 31, 2002, filed on March 6, 2003, File No. 000-12255). | |
| 3.1.2 | Certificate of Amendment to the Certificate of Incorporation of the Company changing the name of the Company to Yellow Roadway Corporation (incorporated by reference to Exhibit 4.2 to Registration Statement on Form S-8, filed on December 23, 2003, File No. 333-111499). | |
| 3.1.3 | Certificate of Ownership and Merger, merging YRC Worldwide Inc. into Yellow Roadway Corporation, effecting a name change to YRC Worldwide Inc. (incorporated by reference to Exhibit 3.1 to Current Report on Form 8-K, filed on January 3, 2006, File No. 000-12255). | |
| 3.1.4* | Certificate of Amendment to the Certificate of Incorporation of the Company reducing the par value of the Company’s common stock and increasing the number of authorized shares. | |
| 3.1.5 | Certificate of Designations, Preferences, Powers and Rights of Convertible Preferred Stock (incorporated by reference to Exhibit 3.1 to Current Report on Form 8-K, filed on January 7, 2010, File No. 000-12255). | |
| 3.2 | Bylaws of the Company, as amended through May 14, 2009 (incorporated by reference to Exhibit 3.1 to Current Report on Form 8-K, filed on May 14, 2009, File No. 000-12255). | |
| 4.1 | Certificate of Incorporation of the Company (incorporated by reference to Exhibit 3.1.1 to this Annual Report on Form 10-K), as amended by Certificate of Amendment to the Certificate of Incorporation (incorporated by reference to Exhibit 3.1.2 to this Annual Report on Form 10-K), Certificate of Ownership and Merger (incorporated by reference to Exhibit 3.1.3 to this Annual Report on Form 10-K), Certificate of Amendment to the Certificate of Incorporation (incorporated by reference to Exhibit 3.1.4 to this Annual Report on Form 10-K) and Certificate of Designations, Preferences, Powers and Rights of Convertible Preferred Stock (incorporated by reference to Exhibit 3.1.5 to this Annual Report on Form 10-K). | |
| 4.2 | Bylaws of the Company (incorporated by reference to Exhibit 3.2 to this Annual Report on Form 10-K). | |
| 4.3.1 | Indenture, dated as of May 5, 1999, among YRC Regional Transportation, Inc. (formerly, USFreightways Corporation), the Guarantors named therein and NBD Bank, as trustee (incorporated by reference to Exhibit 4.11 to Registration Statement on Form S-4, filed on June 21, 2005, File No. 333-126006). | |
| 4.3.2 | Form of 8 1/2% Guaranteed Note due April 15, 2010 issued by YRC Regional Transportation, Inc. (formerly, USFreightways Corporation) (incorporated by reference to Exhibit 4.13 to Registration Statement on Form S-4, filed on June 21, 2005, File No. 333-126006). | |
| 4.3.3 | Supplemental Indenture, dated as of June 27, 2005, among the Company, as New Guarantor, YRC Regional Transportation, Inc. (formerly, USF Corporation), the Existing Guarantor Subsidiaries under the Indenture and J.P. Morgan Trust Company, National Association as Trustee, supplementing the Indenture, dated as of May 5, 1999 (as supplemented and in effect as of the date of the Supplemental Indenture), relating to the YRC Regional Transportation, Inc. (formerly USFreightways Corporation) 8 1/2% Guaranteed Notes due April 15, 2010 (incorporated by reference to Exhibit 4.6 to the Annual Report on Form 10-K for the year ended December 31, 2005, filed on March 15, 2006, File No. 000-12255). | |
116
Table of Contents
| 4.3.4 | Supplemental Indenture, dated as of December 31, 2009, between YRC Regional Transportation, Inc. (formerly USFreightways Corporation), the guarantors signatory thereto, and The Bank of New York Mellon Trust Company, N.A. (successor-in-interest to NBD Bank), as trustee, supplementing the Indenture, dated as of May 5, 1999 (as supplemented and in effect as of the date of the Supplemental Indenture), relating to the 8 1/2% Guaranteed Notes due April 15, 2010 (incorporated by reference to Exhibit 4.3 to Current Report on Form 8-K, filed on January 7, 2010, File No. 000-12255). | |
| 4.4.1 | Indenture (including form of note) dated December 31, 2004, among the Company, certain subsidiary guarantors and Deutsche Bank Trust Company Americas, as trustee, relating to the Company’s 5.0% Net Share Settled Contingent Convertible Senior Notes due 2023 (incorporated by reference to Exhibit 4.7 to Amendment No. 1 to Registration Statement on Form S-4/A, filed on November 30, 2004, File No. 333-119990). | |
| 4.4.2 | Supplemental Indenture, dated as of December 31, 2009, between the Company, the guarantors signatory thereto and Deutsche Bank Trust Company Americas, as trustee, supplementing the Indenture, dated as of December 31, 2004 (as supplemented and in effect as of the date of the Supplemental Indenture), relating to the 5.0% Net Share Settled Contingent Convertible Senior Notes due 2023 (incorporated by reference to Exhibit 4.2 to Current Report on Form 8-K, filed on January 7, 2010, File No. 000-12255). | |
| 4.5.1 | Indenture (including form of note) dated December 31, 2004, among the Company, certain subsidiary guarantors and Deutsche Bank Trust Company Americas, as trustee, relating to the Company’s 3.375% Net Share Settled Contingent Convertible Senior Notes due 2023 (incorporated by reference to Exhibit 4.8 to Amendment No. 1 to Registration Statement on Form S-4/A, filed on November 30, 2004, File No. 333-119990). | |
| 4.5.2 | Supplemental Indenture, dated as of December 31, 2009, between the Company, the guarantors signatory thereto and Deutsche Bank Trust Company Americas, as trustee, supplementing the Indenture, dated as of December 31, 2004 (as supplemented and in effect as of the date of the Supplemental Indenture), relating to the 3.375% Net Share Settled Contingent Convertible Senior notes due 2023 (incorporated by reference to Exhibit 4.1 to Current Report on Form 8-K, filed on January 7, 2010, File No. 000-12255). | |
| 4.6 | Mutual Release, dated as of December 31, 2009, by and among the Company, YRC Regional Transportation, Inc. and certain holders of 8 1/2% Guaranteed Notes due April 15, 2010, 3.375% Contingent Convertible Senior Notes due 2023, 3.375% Net Share Settled Contingent Convertible Senior Notes due 2023, 5% Contingent Convertible Senior Notes due 2023 and 5% Net Share Settled Contingent Convertible Senior Notes due 2023 (incorporated by reference to Exhibit 1.1 to Current Report on Form 8-K, filed on January 7, 2010, File No. 000-12255). | |
| 4.7 | Registration Rights Agreement, dated as of February 11, 2010, by and among the Company and persons defined as Purchasers and Guarantors therein (incorporated by reference to Exhibit 4.2 to Current Report on Form 8-K, filed on February 11, 2010, File No. 000-12255). | |
| 4.8 | Indenture (including form of note), dated as of February 23, 2010, by and among the Company, as issuer, the Guarantors and US Bank, National Association, as trustee, relating to the Company’s 6% Convertible Senior Notes due 2014 (incorporated by reference to Exhibit 4.1 to Current Report on Form 8-K, filed on February 24, 2010, File No. 000-12255). | |
| (10) Material Contracts | ||
| 10.1.1 | Credit Agreement, dated as of August 17, 2007, among the Company; the Canadian Borrowers and UK Borrowers party thereto; the Lenders party thereto; Bank of America, N.A. and SunTrust Bank, as Syndication Agents; U.S. Bank National Association, Wachovia Bank, N.A. and The Bank of Tokyo-Mitsubishi UFJ, Ltd., Chicago Branch, as Documentation Agents; JP Morgan Chase Bank, National Association, Toronto Branch, as Canadian Agent; J.P. Morgan Europe Limited, as UK Agent; and JPMorgan Chase Bank, National Association, as Administrative Agent (hereinafter referred to as the “Credit Agreement”) (incorporated by reference to Exhibit 10.1 to Current Report on Form 8-K, filed on August 22, 2007, File No. 000-12255). | |
| 10.1.2 | Amendment No. 1, dated as of April 18, 2008, to the Credit Agreement (incorporated by reference to Exhibit 10.1 to Current Report on Form 8-K, filed on April 21, 2008, File No. 000-12255). | |
| 10.1.3 | Waiver No. 1, dated as of January 15, 2009, to the Credit Agreement (incorporated by reference to Exhibit 10.1 to Current Report on Form 8-K, filed on January 22, 2009, File No. 000-12255). | |
117
Table of Contents
| 10.1.4 | Waiver and Amendment No. 2, dated as of February 12, 2009, and Consent, Waiver and Amendment No. 3, dated February 27, 2009, to the Credit Agreement (incorporated by
reference to Exhibit 10.1.4 to Annual Report on Form 10-K for the year ended December 31, 2008, filed on March 2, 2009, File No. 000-12255). | |
| 10.1.5 | Amendment No. 4, dated April 15, 2009, to the Credit Agreement (incorporated by reference to Exhibit 10.3 to Quarterly Report on Form 10-Q for the quarter ended March 31, 2009, filed on May 11, 2009, File No. 000-12255). | |
| 10.1.6 | Amendment No. 5 (dated as of May 14, 2009), Amendment No. 6 (dated as of May 15, 2009) and Amendment No. 7 (dated as of June 17, 2009) to the Credit Agreement (incorporated by reference to Exhibit 10.2 to Quarterly Report on Form 10-Q for the quarter ended June 30, 2009, filed on August 10, 2009, File No. 000-12255). | |
| 10.1.7 | Amendment No. 8 (dated as of July 13, 2009), Amendment No. 9 (dated as of July 30, 2009), Amendment No. 10 (dated as of August 28, 2009), Waiver and Amendment No. 11 (dated as of October 9, 2009) and Waiver (dated as of October 26, 2009) to the Credit Agreement (incorporated by reference to Exhibit 10.1 to Quarterly Report on Form 10-Q for the quarter ended September 30, 2009, filed on November 9, 2009, File No. 000-12255). | |
| 10.1.8 | Amendment No. 12 (dated as of October 27, 2009) to the Credit Agreement (incorporated by reference to Exhibit 10.2 to Quarterly Report on Form 10-Q for the quarter ended September 30, 2009, filed on November 9, 2009, File No. 000-12255). | |
| 10.1.9* | Amendment No. 13 (dated as of December 15, 2009) and Amendment No. 14 (dated as of December 21, 2009) to the Credit Agreement. | |
| 10.1.10 | Amendment No. 15 (dated as of February 10, 2010) to the Credit Agreement (incorporated by reference to Exhibit 99.3 to Current Report on Form 8-K, filed on February 11, 2010, File No. 000-12255). | |
| 10.1.11* | Amendment No. 16 (dated as of March 11, 2010) to the Credit Agreement. | |
| 10.2.1 | Third Amended and Restated Receivables Purchase Agreement, dated as of April 18, 2008, among Yellow Roadway Receivables Funding Corporation, as Seller; Falcon Asset Securitization Company LLC, Three Pillars Funding LLC and Amsterdam Funding Corporation, as Conduits; YRC Assurance Co. Ltd., as an uncommitted purchaser; the financial institutions party thereto as Committed Purchasers; Wachovia Bank, National Association, as Wachovia Agent and LC Issuer; SunTrust Robinson Humphrey, Inc., as Three Pillars Agent, The Royal Bank of Scotland plc (successor to ABN AMRO Bank, N.V.), as Amsterdam Agent, and JPMorgan Chase Bank, N.A., as Falcon Agent and as Administrative Agent (hereinafter referred to as the “ABS Facility”) (incorporated by reference to Exhibit 10.2 to Current Report on Form 8-K, filed on April 21, 2008, File No. 000-12255). | |
| 10.2.2 | Omnibus Consent and Amendment No. 1 to the ABS Facility, Amendment No. 4 to Receivables Sale Agreement among YRC Inc., USF Reddaway, Inc. and USF Holland, Inc., as Originators, and Yellow Roadway Receivables Funding Corporation, as Seller (hereinafter referred to as the “ABS Sale Agreement”) and Amendment No. 1 to Performance Undertaking, dated as of September 25, 2008, (incorporated by reference to Exhibit 10.1 to Quarterly Report on Form 10-Q for the quarter ended September 30, 2008, filed on November 10, 2008, File No. 000-12255). | |
| 10.2.3 | Limited Waiver and Second Amendment, dated as of January 15, 2009, to the ABS Facility (incorporated by reference to Exhibit 10.2 to Current Report on Form 8-K, filed on January 22, 2009, File No. 000-12255). | |
| 10.2.4 | Omnibus Amendment [Waiver and Amendment No. 3 to the ABS Facility, and Amendment No. 4 to ABS Sale Agreement], dated as of February 12, 2009, and Waiver and Amendment No. 4 to the ABS Facility, dated February 27, 2009 (incorporated by reference to Exhibit 10.2.4 to Annual Report on Form 10-K for the year ended December 31, 2008, filed on March 2, 2009, File No. 000-12255). | |
| 10.2.5 | Amendment No. 5 (dated May 15, 2009) and Amendment No. 6 (dated May 20, 2009) to the ABS Facility (incorporated by reference to Exhibit 10.3 to Quarterly Report on Form 10-Q for the quarter ended June 30, 2009, filed on August 10, 2009, File No. 000-12255). | |
| 10.2.6 | Amendment No. 7 (dated July 30, 2009), Amendment No. 8 (dated August 28, 2009), Omnibus Amendment No. 9 (dated September 14, 2009), Amendment No. 10 (dated September 22, 2009), Waiver and Amendment No. 11 (dated October 9, 2009), Omnibus Amendment No. 12 (dated October 15, 2009) and Waiver and Amendment No. 13 (dated October 26, 2009) to the ABS Facility (incorporated by reference to Exhibit 10.3 to Quarterly Report on Form 10-Q for the quarter ended September 30, 2009, filed on November 9, 2009, File No. 000-12255). | |
| 10.2.7 | Amendment No. 14 (dated October 27, 2009) to the ABS Facility (incorporated by reference to Exhibit 10.4 to Quarterly Report on Form 10-Q for the quarter ended September 30, 2009, filed on November 9, 2009, File No. 000-12255). | |
| 10.2.8* | Amendment No. 15 (dated as of December 15, 2009) and Amendment No. 16 (dated as of December 21, 2009) to the ABS Facility. | |
| 10.3.1 | National Master Freight Agreement, effective April 1, 2008, among the International Brotherhood of Teamsters, YRC Inc. (formerly, Yellow Transportation, Inc. and Roadway Express, Inc.), USF Holland Inc. and New Penn Motor Express, Inc. (incorporated by reference to Exhibit 10.1 to Current Report on Form 8-K, filed on February 11, 2008, File No. 000-12255). | |
118
Table of Contents
| 10.3.2 | Amended and Restated Memorandum of Understanding on the Job Security Plan, dated July 9, 2009, among the International Brotherhood of Teamsters, YRC Inc., USF Holland Inc. and New Penn Motor Express, Inc. (incorporated by reference to Exhibit 10.1 to Current Report on Form 8-K, filed on July 14, 2009, File No. 000-12255). | |
| 10.4.1 | Contribution Deferral Agreement, dated as of June 17, 2009, by and between YRC Inc., USF Holland, Inc., New Penn Motor Express, Inc., USF Reddaway Inc., the Trustees for the Central States, Southeast and Southwest Areas Pension Fund and the other Funds from time to time party thereto and Wilmington Trust Company, as Agent (hereinafter referred to as the “Contribution Deferral Agreement”) (incorporated by reference to Exhibit 10.4 to Quarterly Report on Form 10-Q for the quarter ended June 30, 2009, filed on August 10, 2009, File No. 000-12255). | |
| 10.4.2 | Consent and Amendment Agreement (dated September 22, 2009) and Amendment 2 (dated November 5, 2009) to Contribution Deferral Agreement (incorporated by reference to Exhibit 10.5 to Quarterly Report on Form 10-Q for the quarter ended September 30, 2009, filed on November 9, 2009, File No. 000-12255). | |
| 10.4.3 | Amendment 3 (dated February 10, 2010) to Contribution Deferral Agreement (incorporated by reference to Exhibit 99.4 to Current Report on Form 8-K, filed on February 11, 2010, File No. 000-12255). | |
| 10.5.1 | Real Estate Sales Contract, effective December 19, 2008, between NATMI Truck Terminals, LLC and the Company, as amended by Amendment No. 1, effective January 21, 2009, and Amendment No. 2, effective February 12, 2009 (incorporated by reference to Exhibit 10.4 to Annual Report on Form 10-K for the year ended December 31, 2008, filed on March 2, 2009, File No. 000-12255). | |
| 10.5.2 | Amendment No. 3 (effective March 6, 2009), Amendment No. 4 (effective March 31, 2009) and Amendment No. 5 (effective April 21, 2009) to Real Estate Sales Contract, effective December 19, 2008, between NATMI Truck Terminals, LLC and the Company (incorporated by reference to Exhibit 10.8 to Quarterly Report on Form 10-Q for the quarter ended March 31, 2009, filed on May 11, 2009, File No. 000-12255). | |
| 10.6 | Form of Real Estate Sales Contract, dated February 13, 2009, between Estes Express Lines and YRC Inc., USF Reddaway, Inc. or USF Holland Inc. (incorporated by reference to Exhibit 10.9 to Quarterly Report on Form 10-Q for the quarter ended March 31, 2009, filed on May 11, 2009, File No. 000-12255). | |
| 10.7.1 | Real Estate Sales Contract, effective August 14, 2009, between North American Terminals Management, Inc. and the Company (hereinafter referred to as “First Pool Real Estate Sales Contract”) and First Amendment (effective August 21, 2009), Second Amendment (effective September 21, 2009), Third Amendment (effective September 23, 2009), Fourth Amendment (effective October 7, 2009), Fifth Amendment (effective October 9, 2009) and Sixth Amendment (effective November 4, 2009) to First Pool Real Estate Sales Contract (incorporated by reference to Exhibit 10.6 to Quarterly Report on Form 10-Q for the quarter ended September 30, 2009, filed on November 9, 2009, File No. 000-12255). | |
| 10.7.2 | Real Estate Sales Contract, effective August 14, 2009, between North American Terminals Management, Inc. and the Company (hereinafter referred to as “Second Pool Real Estate Sales Contract”) and First Amendment (effective August 21, 2009), Second Amendment (effective September 21, 2009) and Third Amendment (effective November 4, 2009) to Second Pool Real Estate Sales Contract (incorporated by reference to Exhibit 10.7 to Quarterly Report on Form 10-Q for the quarter ended September 30, 2009, filed on November 9, 2009, File No. 000-12255). | |
| 10.7.3* | Fourth Amendment (effective November 23, 2009), Fifth Amendment (effective December 2, 2009), Sixth Amendment (effective December 3, 2009), Seventh Amendment (effective December 9, 2009), Eighth Amendment (effective December 23, 2009) and Ninth Amendment (effective January 15, 2010) to Second Pool Real Estate Sales Contract. | |
| 10.8 | Reserved | |
| 10.9 | Note Purchase Agreement, dated February 11, 2010, by and among the Company, the investors listed on the Schedule of Buyers attached as Annex I thereto, and the subsidiaries of the Company listed on the Schedule of Guarantors attached as Annex II thereto (incorporated by reference to Exhibit 99.1 to Current Report on Form 8-K, filed on February 11, 2010, File No. 000-12255). | |
| 10.10 | Escrow Agreement, dated as of February 23, 2010, by and among the Company, the persons defined as Buyers therein, and U.S. Bank National Association, as escrow agent (incorporated by reference to Exhibit 99.1 to Current Report on Form 8-K, filed on February 24, 2010, File No. 000-12255). | |
| (10) Management Contracts, Compensatory Plans and Arrangements | ||
| 10.11.1 | YRC Worldwide Inc. Director Compensation Plan (incorporated by reference to Exhibit 10.2 to Quarterly Report on Form 10-Q for the quarter ended September 30, 2008, filed on November 10, 2008, File No. 000-12255). | |
| 10.11.2 | Form of Director Share Unit Agreement (incorporated by reference to Exhibit 10.1 to Current Report on Form 8-K, filed on July 25, 2005, File No. 000-12255). | |
| 10.12.1 | Employment Agreement dated January 25, 2006, by and between the Company and William D. Zollars (incorporated by reference to Exhibit 10.2 to Current Report on Form 8-K, filed on January 26, 2006, File No. 000-12255). | |
| 10.12.2 | Amendment effective December 30, 2008 to Employment Agreement, dated as of January 25, 2006, by and between the Company and William D. Zollars (incorporated by reference to Exhibit 10.2 to Current Report on Form 8-K, filed on January 6, 2009, File No. 000-12255). | |
| 10.13 | Form of Indemnification Agreement between the Company and each of its directors and executive officers (incorporated by reference to Exhibit 10.5 to Current Report on Form 8-K, filed on March 15, 2007, File No. 000-12255). | |
119
Table of Contents
| 10.14 | Form of Executive Severance Agreement between the Company and each of the following executive officers: William D. Zollars, Timothy A. Wicks, Sheila K. Taylor, Michael J. Smid, Daniel J. Churay, Phil J. Gaines, James G. Kissinger and John A. Garcia (incorporated by reference to Exhibit 10.10 to Quarterly Report on Form 10-Q for the quarter ended March 31, 2009, filed on May 11, 2009, File No. 000-12255). | |
| 10.15 | YRC Worldwide Inc. Executive Severance Policy (incorporated by reference to Exhibit 10.9 to Quarterly Report on Form 10-Q for the quarter ended September 30, 2009, filed on November 9, 2009, File No. 000-12255). | |
| 10.16 | Yellow Corporation 1996 Stock Option Plan (incorporated by reference to Exhibit 10.6 to the Annual Report on Form 10-K for the year ended December 31, 2002, filed on March 6, 2003, Reg. No. 000-12255). | |
| 10.17 | Yellow Corporation 1997 Stock Option Plan (incorporated by reference to Exhibit 10.11 to the Annual Report on Form 10-K for the year ended December 31, 2004, filed on March 15, 2005, Reg. No. 000-12255). | |
| 10.18 | Yellow Corporation 1999 Stock Option Plan (incorporated by reference to Exhibit 4 to the Registration Statement on Form S-8, filed on November 9, 2000, File No. 333-49620). | |
| 10.19 | Yellow Corporation 2002 Stock Option and Share Award Plan (incorporated by reference to Exhibit 4 to the Registration Statement on Form S-8, filed on May 15, 2002, File No. 333-88268). | |
| 10.20 | Form of Stock Option Agreement (incorporated by reference to Exhibit 10.8 to Annual Report on Form 10-K for the year ended December 31, 2002, filed on March 6, 2003, File No. 000-12255). | |
| 10.21 | YRC Worldwide Inc. 2004 Long-Term Incentive and Equity Award Plan (incorporated by reference to Exhibit 10.1 to Current Report on Form 8-K filed on May 19, 2008, File No. 000-12255). | |
| 10.22 | Form of Share Unit Agreement (incorporated by reference to Exhibit 10.18 to the Annual Report on Form 10-K for the year ended December 31, 2007, filed on February 29, 2008, File No. 000-12255). | |
| 10.23 | Form of Nonqualified Stock Option Agreement (incorporated by reference to Exhibit 10.2 to Current Report on Form 8-K filed on May 19, 2008, File No. 000-12255). | |
| 10.24 | YRC Worldwide Inc. Long-Term Incentive Plan (incorporated by reference to Exhibit 10.19 to the Annual Report on Form 10-K for the year ended December 31, 2007, filed on February 29, 2008, File No. 000-12255). | |
| 10.25 | YRC Worldwide Inc. Annual Incentive Bonus Program (incorporated by reference to Exhibit 10.2 to Current Report on Form 8-K, filed on May 23, 2007, File No. 000-12255). | |
| 10.26.1 | YRC Worldwide Inc. Supplemental Executive Pension Plan (Effective January 1, 2005) (incorporated by reference to Exhibit 10.1 to Current Report on Form 8-K, filed on July 25, 2006, File No. 000-12255). | |
| 10.26.2 | Amendment to YRC Worldwide Inc. Supplemental Executive Pension Plan (incorporated by reference to Exhibit 10.3 to the Current Report on Form 8-K, filed on July 8, 2008, File No. 000-12255). | |
| 10.27.1 | YRC Worldwide Inc. Defined Contribution Supplemental Executive Retirement Plan (Effective January 1, 2005) (incorporated by reference to Exhibit 10.2 to Current Report on Form 8-K, filed on July 25, 2006, File No. 000-12255). | |
| 10.27.2 | Amendment to YRC Worldwide Inc. Defined Contribution Supplemental Executive Retirement Plan (incorporated by reference to Exhibit 10.21.2 to Annual Report on Form 10-K for the year ended December 31, 2008, filed on March 2, 2009, File No. 000-12255). | |
| 10.28.1 | Yellow Corporation Pension Plan, amended and restated as of January 1, 2004 (incorporated by reference to Exhibit 10.28 to Annual Report on Form 10-K for the year ended December 31, 2003, filed on March 15, 2004, File No. 000-12255). | |
| 10.28.2 | Amendment No. 1 to Yellow Corporation Pension Plan, as amended and restated as of January 1, 2004 (incorporated by reference to Exhibit 10.2 to Quarterly Report on Form 10-Q for the quarter ended September 30, 2005, filed on November 9, 2005, File No. 000-12255). | |
| 10.28.3 | Amendment No. 2 to Yellow Corporation Pension Plan, as amended and restated as of January 1, 2004 (incorporated by reference to Exhibit 10.26 to Annual Report on Form 10-K for the year ended December 31, 2005, filed on March 15, 2006, File No. 000-12255). | |
| 10.28.4 | Amendment No. 3 to Yellow Corporation Pension Plan, as amended and restated as of January 1, 2004 (incorporated by reference to Exhibit 10.2 to the Current Report on Form 8-K, filed on July 8, 2008, File No. 000-12255). | |
| 10.28.5 | Amendment No. 4 to Yellow Corporation Pension Plan, as amended and restated as of January 1, 2004 (incorporated by reference to Exhibit 10.22.5 to Annual Report on Form 10-K for the
year ended December 31, 2008, filed on March 2, 2009, File No. 000-12255). | |
| 10.28.6* | Amendment No. 5 and Amendment No. 6 to Yellow Corporation Pension Plan, as amended and restated as of January 1, 2004. | |
| 10.29 | YRC Worldwide Inc. Non-Union Employee Option Plan (incorporated by reference to Exhibit 10.3 to Current Report on Form 8-K, filed on January 6, 2009, File No. 000-12255). | |
| 10.30 | YRC Worldwide Inc. Union Employee Option Plan (incorporated by reference to Exhibit 10.25 to Annual Report on Form 10-K for the year ended December 31, 2008, filed on March 2, 2009, File No. 000-12255). | |
| 10.31 | YRC Worldwide Inc. Second Union Employee Option Plan (incorporated by reference to Exhibit 10.1 to Current Report on Form 8-K, filed on March 5, 2010, File No. 000-12255). | |
| 10.32 | YRC Worldwide Inc. Second Union Employee Stock Appreciation Right Plan (incorporated by reference to Exhibit 10.2 to Current Report on Form 8-K, filed on March 5, 2010, File No. 000-12255). | |
120
Table of Contents
| 10.33 | Form of YRC Worldwide Inc. Cash Performance and Restricted Stock Award Agreement (incorporated by reference to Exhibit 10.1 Current Report on Form 8-K, filed on April 3, 2009, File No. 000-12255). | |
| 10.34 | Retention Payment, Non-Competition, Non-Solicitation, Non-Disparagement, and Confidentiality Agreement dated June 2, 2009 by and between the Company and Michael J. Smid (incorporated by reference to Exhibit 10.1 to Current Report on Form 8-K, filed on June 2, 2009, File No. 000-12255). | |
| 10.35* | Form of Non-Competition, Non-Solicitation, Non-Disparagement and Confidentiality Agreement between the Company and each of the following executive officers: Sheila K. Taylor and Daniel J. Churay. | |
| 10.38* | Non-Competition, Non-Solicitation, Non-Disparagement and Confidentiality Agreement dated December 16, 2008 by and between the Company and Phil J. Gaines (as amended by that certain letter agreement dated November 24, 2009). | |
| 10.39* | Non-Competition, Non-Solicitation, Non-Disparagement and Confidentiality Agreement dated January 6, 2010 by and between the Company and Timothy A. Wicks. | |
| 21.1* | Subsidiaries of the Company. | |
| 23.1* | Consent of KPMG LLP, Independent Registered Public Accounting Firm. | |
| 31.1* | Certification of William D. Zollars pursuant to Exchange Act Rules 13a-14 and 15d-14, as adopted pursuant to Section 302 of the Sarbanes-Oxley Act of 2002. | |
| 31.2* | Certification of Sheila K. Taylor pursuant to Exchange Act Rules 13a-14 and 15d-14, as adopted pursuant to Section 302 of the Sarbanes-Oxley Act of 2002. | |
| 32.1* | Certification of William D. Zollars pursuant to 18 U.S.C. Section 1350, as adopted pursuant to Section 906 of the Sarbanes-Oxley Act of 2002. | |
| 32.2* | Certification of Sheila K. Taylor pursuant to 18 U.S.C. Section 1350, as adopted pursuant to Section 906 of the Sarbanes-Oxley Act of 2002. | |
| * | Indicates documents filed herewith. |
121
Table of Contents
Report of Independent Registered Public Accounting Firm
The Board of Directors and Shareholders
YRC Worldwide Inc.:
Under date of March 16, 2010, we reported on the consolidated balance sheets of YRC Worldwide Inc. and subsidiaries (the Company) as of December 31, 2009 and 2008, and the related consolidated statements of operations, cash flows, shareholders’ equity and comprehensive income (loss) for each of the years in the three-year period ended December 31, 2009, which are included in this annual report on Form 10-K of YRC Worldwide Inc. for the fiscal year ended December 31, 2009. In connection with our audits of the aforementioned consolidated financial statements, we also audited the related consolidated financial statement schedule of valuation and qualifying accounts (Schedule II). This financial statement schedule is the responsibility of the Company’s management. Our responsibility is to express an opinion on this financial statement schedule based on our audits.
In our opinion, such financial statement schedule, when considered in relation to the basic consolidated financial statements taken as a whole, presents fairly, in all material respects, the information set forth therein.
The audit report on the consolidated financial statements of YRC Worldwide Inc. and subsidiaries referred to above contains an explanatory paragraph that states that the Company has experienced significant declines in operations, cash flows and liquidity and these conditions raise substantial doubt about the Company’s ability to continue as a going concern. The financial statement schedule included in this annual report does not include any adjustments that might result from the outcome of this uncertainty.
| /s/ KPMG LLP |
| Kansas City, Missouri |
| March 16, 2010 |
122
Table of Contents
YRC Worldwide Inc. and Subsidiaries
Valuation and Qualifying Accounts
For the Years Ended December 31, 2009, 2008 and 2007
| COL. A |
COL. B | COL. C | COL. D | COL. E | ||||||||||||
| Additions | ||||||||||||||||
| -1- | -2- | |||||||||||||||
| Description | Balance, Beginning Of Year |
Charged To Costs/ Expenses |
Charged To Other Accounts |
Deductions (a) | Balance, End Of Year | |||||||||||
| (in millions) | ||||||||||||||||
| Year ended December 31, 2009: |
||||||||||||||||
| Deducted from asset account - Allowance for uncollectible accounts |
$ | 32.0 | $ | 50.4 | $ | — | $ | (46.3 | ) | $ | 36.1 | |||||
| Added to liability account - Claims and insurance accruals |
$ | 495.7 | $ | 308.9 | $ | — | $ | (267.8 | ) | $ | 536.8 | |||||
| Year ended December 31, 2008: |
||||||||||||||||
| Deducted from asset account - Allowance for uncollectible accounts |
$ | 34.9 | $ | 36.7 | $ | — | $ | (39.6 | ) | $ | 32.0 | |||||
| Added to liability account - Claims and insurance accruals |
$ | 478.3 | $ | 298.0 | $ | — | $ | (280.6 | ) | $ | 495.7 | |||||
| Year ended December 31, 2007: |
||||||||||||||||
| Deducted from asset account - Allowance for uncollectible accounts |
$ | 35.7 | $ | 31.5 | $ | — | $ | (32.3 | ) | $ | 34.9 | |||||
| Added to liability account - Claims and insurance accruals |
$ | 504.4 | $ | 297.8 | $ | — | $ | (323.9 | ) | $ | 478.3 | |||||
| (a) | Regarding the allowance for uncollectible accounts, amounts primarily relate to uncollectible accounts written off, net of recoveries. For the claims and insurance accruals, amounts primarily relate to payments of claims and insurance. |
123
Table of Contents
Pursuant to the requirements of Section 13 or 15(d) of the Securities Exchange Act of 1934, the registrant has duly caused this report to be signed on its behalf by the undersigned, thereunto duly authorized.
| YRC Worldwide Inc. | ||
| BY: | /s/ William D. Zollars | |
| William D. Zollars | ||
| Chairman of the Board of Directors | ||
| & Chief Executive Officer | ||
March 16, 2010
Pursuant to the requirements of the Securities Exchange Act of 1934, this report has been signed below by the following persons on behalf of the registrant and in the capacities and on the dates indicated.
| /s/ William D. Zollars William D. Zollars |
Chairman of the Board of Directors & Chief Executive Officer |
March 16, 2010 | ||
| /s/ Sheila K. Taylor Sheila K. Taylor |
Executive Vice President & Chief Financial Officer | March 16, 2010 | ||
| /s/ Phil J. Gaines Phil J. Gaines |
Senior Vice President & Chief Accounting Officer | March 16, 2010 | ||
| /s/ Michael T. Byrnes Michael T. Byrnes |
Director | March 16, 2010 | ||
| /s/ Cassandra C. Carr Cassandra C. Carr |
Director | March 16, 2010 | ||
| /s/ Howard M. Dean Howard M. Dean |
Director | March 16, 2010 | ||
| /s/ Dennis E. Foster Dennis E. Foster |
Director | March 16, 2010 | ||
| /s/ Phillip J. Meek Phillip J. Meek |
Director | March 16, 2010 | ||
| /s/ Mark A. Schulz Mark A. Schulz |
Director | March 16, 2010 | ||
| /s/ William L. Trubeck William L. Trubeck |
Director | March 16, 2010 | ||
| /s/ Carl W. Vogt Carl W. Vogt |
Director | March 16, 2010 | ||
124