Attached files
| file | filename |
|---|---|
| EX-99.1 - EX-99.1 - Professional Holding Corp. | tmb-20200727xex99d1.htm |
| 8-K - 8-K - Professional Holding Corp. | tmb-20200727x8k.htm |
Exhibit 99.2
| SECOND QUARTER 2020 EARNINGS PRESENTATION PAGE EARNINGS PRESENTATION SECOND QUARTER 2020 PFHD:NASDAQ |

| SECOND QUARTER 2020 EARNINGS PRESENTATION PAGE 2 FORWARD LOOKING STATEMENTS ! This slide presentation contains forward-looking statements within the meaning of the Private Securities Litigation Reform Act of 1995. Any statements contained in this presentation that are not statements of historical fact may be deemed to be forward-looking statements, including, without limitation, statements preceded by, followed by or including words such as “anticipate,” “intend,” “believe,” “estimate,” “plan,” “seek,” “project” or “expect,” “may,” “will,” “would,” “could” or “should” and similar expressions. Forward looking statements represent the Company’s current expectations, plans or forecasts and involve significant risks and uncertainties. Several important factors could cause actual results to differ materially from those in the forward-looking statements. Those factors include, without limitation, current and future economic and market conditions, including those that could impact credit quality and the ability to generate loans and gather deposits; the duration, extent and impact of the COVID-19 pandemic, including the governments’ responses to the pandemic, on our and our customers’ operations, personnel, and business activity (including developments and volatility), as well as COVID-19’s impact on the credit quality of our loan portfolio and financial markets and general economic conditions; the effects of our lack of a diversified loan portfolio and concentration in the South Florida market; the impact of current and future interest rates and expectations concerning the actual timing and amount of interest rate movements; competition; our ability to execute business plans; geopolitical developments; legislative and regulatory developments; inflation or deflation; market fluctuations; natural disasters (including pandemics such as COVID-19); potential business uncertainties related to the integration of Marquis Bancorp (MBI), including into our operations critical accounting estimates; and other factors described in our Form 10-K for the year ended December 31, 2019, Form 10-Q for the fiscal quarter ended March 31, 2020 and other filings with the Securities and Exchange Commission. The Company disclaims any obligation to update any of the forward-looking statements included herein to reflect future events or developments or changes in expectations, except as may be required by law. |
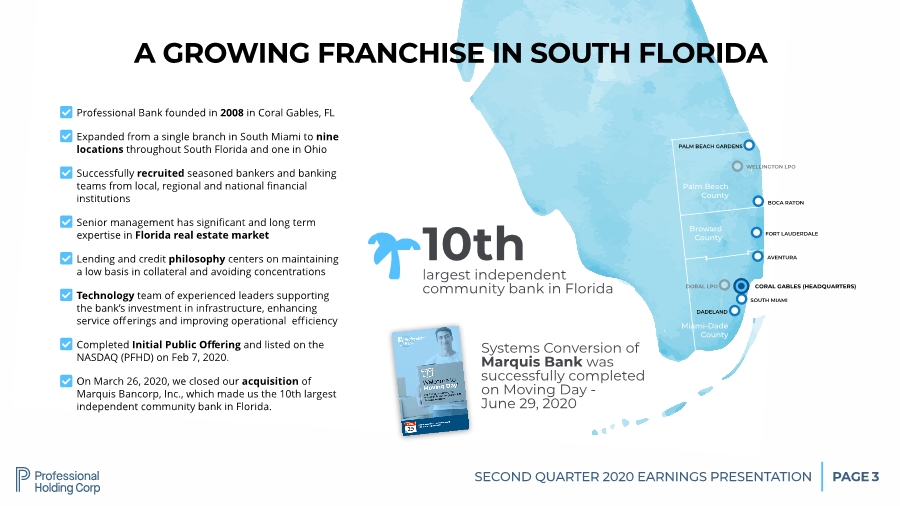
| SECOND QUARTER 2020 EARNINGS PRESENTATION PAGE CORAL GABLES (HEADQUARTERS) SOUTH MIAMI FORT LAUDERDALE BOCA RATON WELLINGTON LPO DADELAND PALM BEACH GARDENS DORAL LPO Palm Beach County Broward County Miami-Dade County 3 A GROWING FRANCHISE IN SOUTH FLORIDA 10th largest independent community bank in Florida ! Systems Conversion of Marquis Bank was successfully completed on Moving Day - June 29, 2020 Professional Bank founded in 2008 in Coral Gables, FL Expanded from a single branch in South Miami to nine locations throughout South Florida and one in Ohio Successfully recruited seasoned bankers and banking teams from local, regional and national financial institutions Senior management has significant and long term expertise in Florida real estate market Lending and credit philosophy centers on maintaining a low basis in collateral and avoiding concentrations Technology team of experienced leaders supporting the bank’s investment in infrastructure, enhancing service offerings and improving operational efficiency Completed Initial Public Offering and listed on the NASDAQ (PFHD) on Feb 7, 2020. On March 26, 2020, we closed our acquisition of Marquis Bancorp, Inc., which made us the 10th largest independent community bank in Florida. " " " " " " " " AVENTURA |
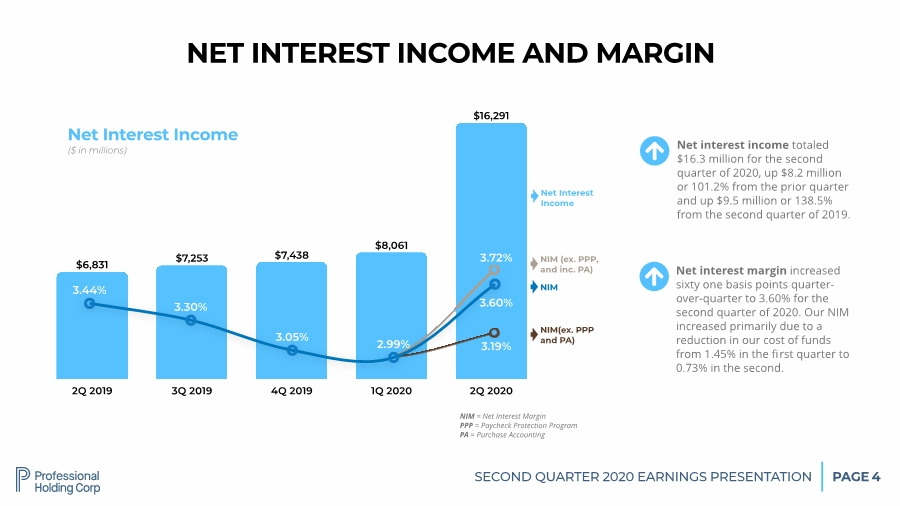
| SECOND QUARTER 2020 EARNINGS PRESENTATION PAGE 4 2Q 2019 3Q 2019 4Q 2019 1Q 2020 2Q 2020 $16,291 $8,061 $7,438 $7,253 $6,831 NET INTEREST INCOME AND MARGIN Net Interest Income ($ in millions) Net Interest Income NIM " Net interest income totaled $16.3 million for the second quarter of 2020, up $8.2 million or 101.2% from the prior quarter and up $9.5 million or 138.5% from the second quarter of 2019. " Net interest margin increased sixty one basis points quarter- over-quarter to 3.60% for the second quarter of 2020. Our NIM increased primarily due to a reduction in our cost of funds from 1.45% in the first quarter to 0.73% in the second. NIM (ex. PPP, and inc. PA) 3.72% 3.19% 3.60% NIM(ex. PPP and PA) NIM = Net Interest Margin PPP = Paycheck Protection Program PA = Purchase Accounting 3.60% 2.99% 3.05% 3.30% 3.44% |
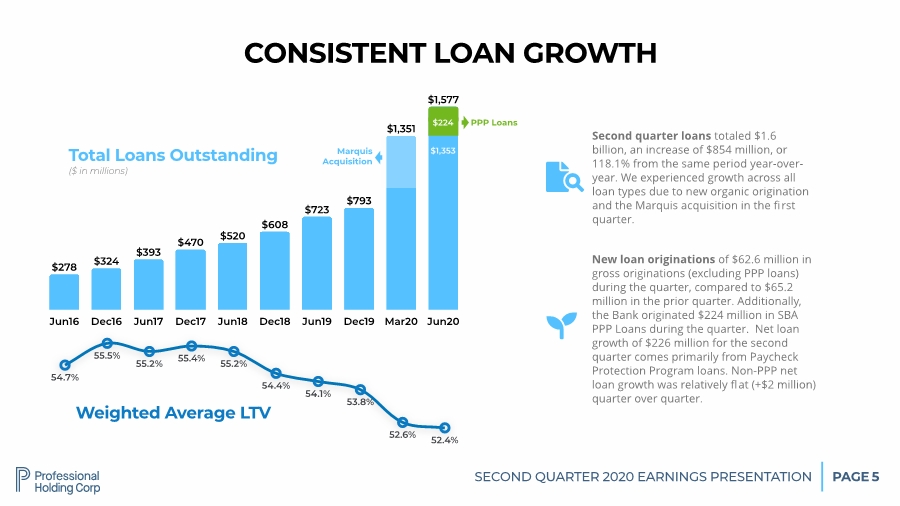
| SECOND QUARTER 2020 EARNINGS PRESENTATION PAGE 5 Jun16 Dec16 Jun17 Dec17 Jun18 Dec18 Jun19 Dec19 Mar20 Jun20 $1,577 $1,351 $793 $723 $608 $520 $470 $393 $324 $278 CONSISTENT LOAN GROWTH Total Loans Outstanding ($ in millions) # Second quarter loans totaled $1.6 billion, an increase of $854 million, or 118.1% from the same period year-over- year. We experienced growth across all loan types due to new organic origination and the Marquis acquisition in the first quarter. 52.4% 52.6% 53.8% 54.1% 54.4% 55.2% 55.4% 55.2% 55.5% 54.7% Weighted Average LTV $ New loan originations of $62.6 million in gross originations (excluding PPP loans) during the quarter, compared to $65.2 million in the prior quarter. Additionally, the Bank originated $224 million in SBA PPP Loans during the quarter. Net loan growth of $226 million for the second quarter comes primarily from Paycheck Protection Program loans. Non-PPP net loan growth was relatively flat (+$2 million) quarter over quarter. PPP Loans Marquis Acquisition $1,353 $224 |
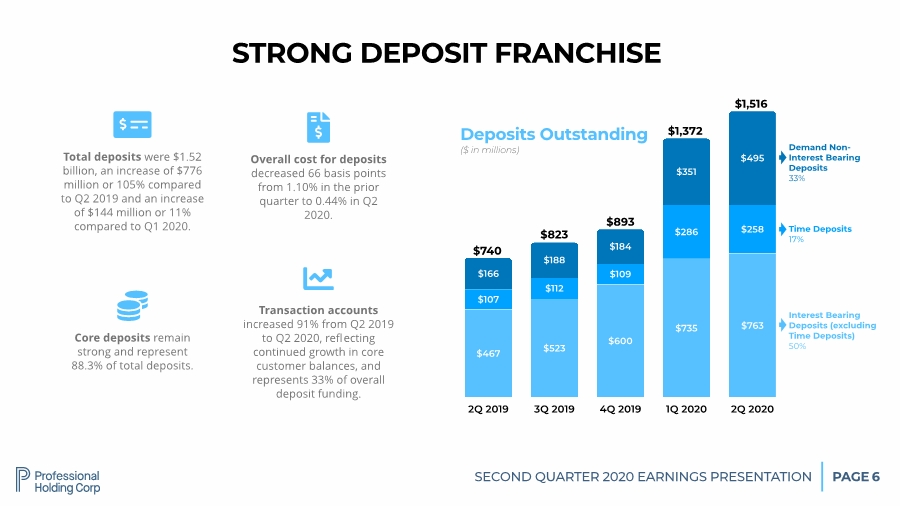
| SECOND QUARTER 2020 EARNINGS PRESENTATION PAGE 6 2Q 2019 3Q 2019 4Q 2019 1Q 2020 2Q 2020 $495 $351 $184 $188 $166 $258 $286 $109 $112 $107 $763 $735 $600 $523 $467 STRONG DEPOSIT FRANCHISE Deposits Outstanding ($ in millions) $740 $823 $893 $1,516 Interest Bearing Deposits (excluding Time Deposits) 50% Time Deposits 17% Demand Non- Interest Bearing Deposits 33% # Total deposits were $1.52 billion, an increase of $776 million or 105% compared to Q2 2019 and an increase of $144 million or 11% compared to Q1 2020. Overall cost for deposits decreased 66 basis points from 1.10% in the prior quarter to 0.44% in Q2 2020. $ Core deposits remain strong and represent 88.3% of total deposits. % Transaction accounts increased 91% from Q2 2019 to Q2 2020, reflecting continued growth in core customer balances, and represents 33% of overall deposit funding. & $1,372 |
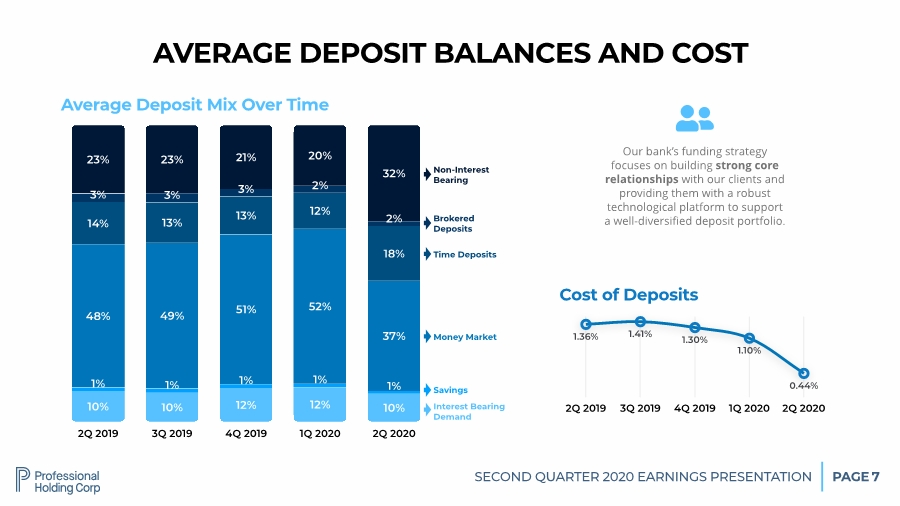
| SECOND QUARTER 2020 EARNINGS PRESENTATION PAGE 7 2Q 2019 3Q 2019 4Q 2019 1Q 2020 2Q 2020 32% 20% 21% 23% 23% 2% 2% 3% 3% 3% 18% 12% 13% 13% 14% 37% 52% 51% 49% 48% 1% 1% 1% 1% 1% 10% 12% 12% 10% 10% Average Deposit Mix Over Time Interest Bearing Demand Savings Money Market Our bank’s funding strategy focuses on building strong core relationships with our clients and providing them with a robust technological platform to support a well-diversified deposit portfolio. ' 2Q 2019 3Q 2019 4Q 2019 1Q 2020 2Q 2020 0.44% 1.10% 1.30% 1.41% 1.36% Cost of Deposits Time Deposits Brokered Deposits Non-Interest Bearing AVERAGE DEPOSIT BALANCES AND COST |
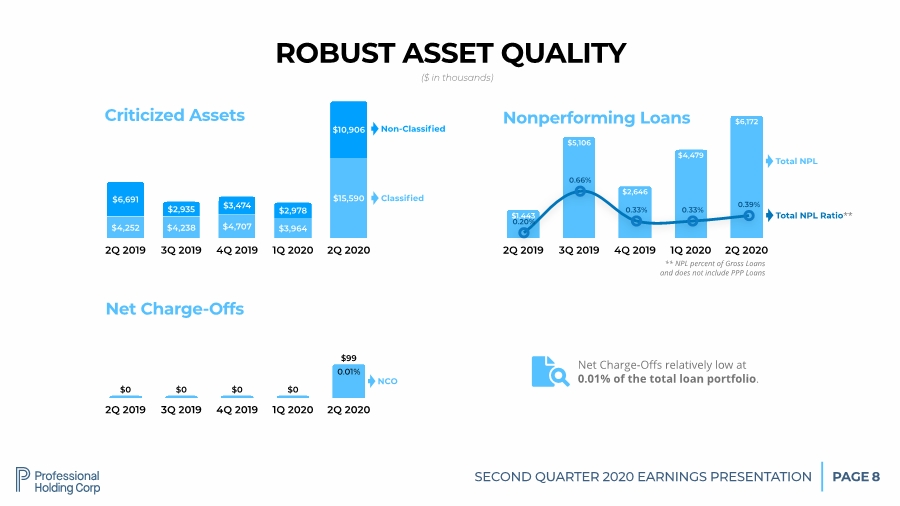
| SECOND QUARTER 2020 EARNINGS PRESENTATION PAGE 8 ROBUST ASSET QUALITY 2Q 2019 3Q 2019 4Q 2019 1Q 2020 2Q 2020 $99 $0 $0 $0 $0 Net Charge-Offs NCO 2Q 2019 3Q 2019 4Q 2019 1Q 2020 2Q 2020 $10,906 $2,978 $3,474 $2,935 $6,691 $15,590 $3,964 $4,707 $4,238 $4,252 Criticized Assets Classified Non-Classified 2Q 2019 3Q 2019 4Q 2019 1Q 2020 2Q 2020 $6,172 $4,479 $2,646 $5,106 $1,443 Nonperforming Loans Total NPL Total NPL Ratio** 0.39% 0.33% 0.33% 0.66% 0.20% ** NPL percent of Gross Loans and does not include PPP Loans ($ in thousands) # Net Charge-Offs relatively low at 0.01% of the total loan portfolio. 0.01% |
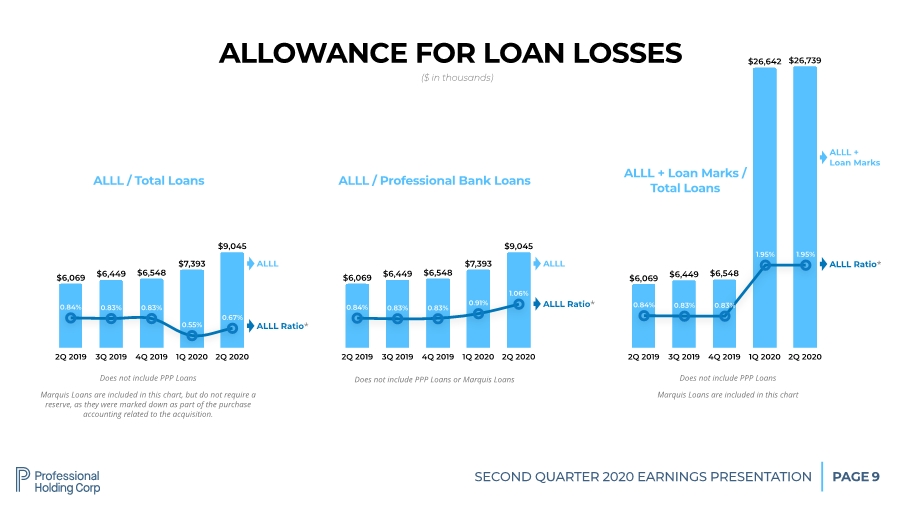
| SECOND QUARTER 2020 EARNINGS PRESENTATION PAGE 9 ALLOWANCE FOR LOAN LOSSES 2Q 2019 3Q 2019 4Q 2019 1Q 2020 2Q 2020 $9,045 $7,393 $6,548 $6,449 $6,069 ALLL / Total Loans ALLL ALLL Ratio* 0.67% 0.55% 0.83% 0.83% 0.84% Does not include PPP Loans Marquis Loans are included in this chart, but do not require a reserve, as they were marked down as part of the purchase accounting related to the acquisition. ($ in thousands) 2Q 2019 3Q 2019 4Q 2019 1Q 2020 2Q 2020 $26,739 $26,642 $6,548 $6,449 $6,069 ALLL + Loan Marks ALLL Ratio* 1.95% 1.95% 0.83% 0.83% 0.84% 2Q 2019 3Q 2019 4Q 2019 1Q 2020 2Q 2020 $9,045 $7,393 $6,548 $6,449 $6,069 ALLL ALLL Ratio* 1.06% 0.91% 0.83% 0.83% 0.84% Does not include PPP Loans or Marquis Loans ALLL / Professional Bank Loans ALLL + Loan Marks / Total Loans Does not include PPP Loans Marquis Loans are included in this chart |
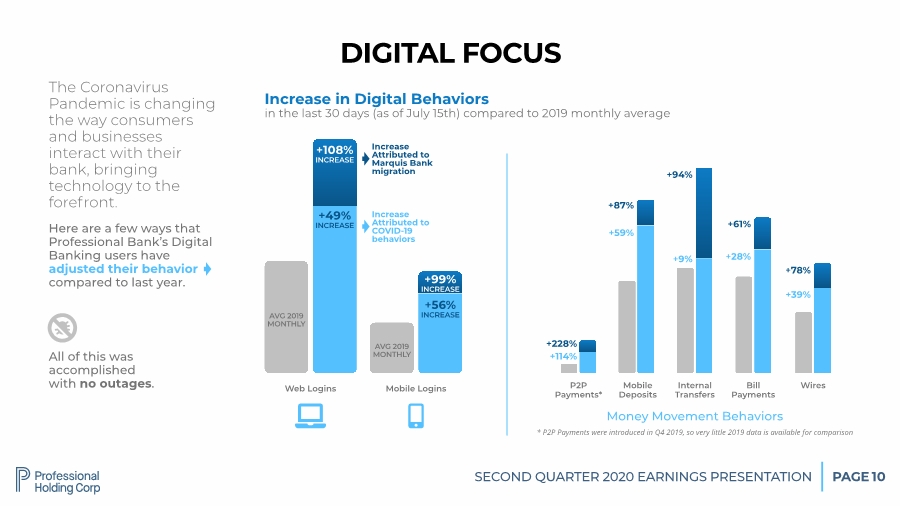
| SECOND QUARTER 2020 EARNINGS PRESENTATION PAGE 10 DIGITAL FOCUS The Coronavirus Pandemic is changing the way consumers and businesses interact with their bank, bringing technology to the forefront. Here are a few ways that Professional Bank’s Digital Banking users have adjusted their behavior compared to last year. All of this was accomplished with no outages. P2P Payments* Mobile Deposits Internal Transfers Bill Payments Wires Web Logins ( ) % Increase in Digital Behaviors in the last 30 days (as of July 15th) compared to 2019 monthly average +108% INCREASE +49% INCREASE AVG 2019 MONTHLY Mobile Logins +99% INCREASE +56% INCREASE AVG 2019 MONTHLY Increase Attributed to COVID-19 behaviors Increase Attributed to Marquis Bank migration +114% +228% +59% +87% +9% +94% +28% +61% +39% +78% Money Movement Behaviors * P2P Payments were introduced in Q4 2019, so very little 2019 data is available for comparison |
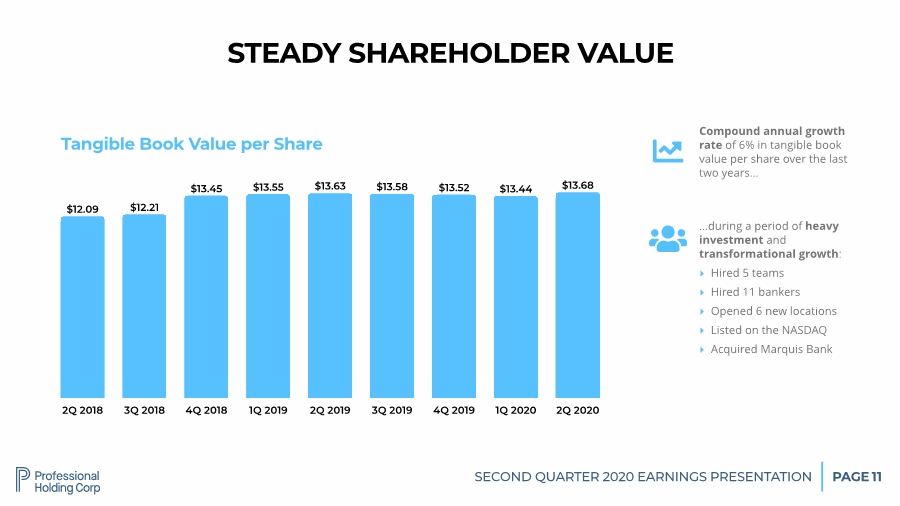
| SECOND QUARTER 2020 EARNINGS PRESENTATION PAGE 11 2Q 2018 3Q 2018 4Q 2018 1Q 2019 2Q 2019 3Q 2019 4Q 2019 1Q 2020 2Q 2020 $13.68 $13.44 $13.52 $13.58 $13.63 $13.55 $13.45 $12.21 $12.09 STEADY SHAREHOLDER VALUE Tangible Book Value per Share & Compound annual growth rate of 6% in tangible book value per share over the last two years… ' …during a period of heavy investment and transformational growth: ‣ Hired 5 teams ‣ Hired 11 bankers ‣ Opened 6 new locations ‣ Listed on the NASDAQ ‣ Acquired Marquis Bank |
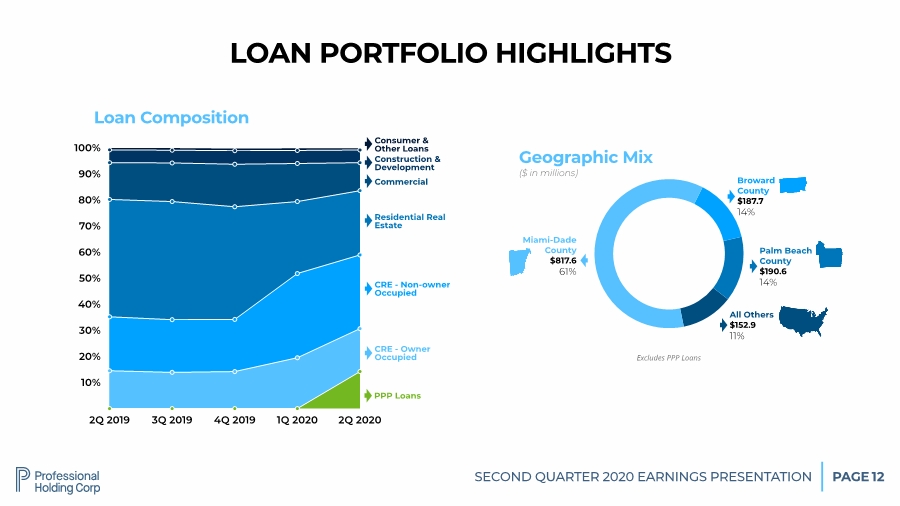
| SECOND QUARTER 2020 EARNINGS PRESENTATION PAGE 12 Geographic Mix ($ in millions) Miami-Dade County $817.6 61% Broward County $187.7 14% Palm Beach County $190.6 14% LOAN PORTFOLIO HIGHLIGHTS 10% 20% 30% 40% 50% 60% 70% 80% 90% 100% 2Q 2019 3Q 2019 4Q 2019 1Q 2020 2Q 2020 Loan Composition CRE - Owner Occupied CRE - Non-owner Occupied Residential Real Estate Commercial Construction & Development Consumer & Other Loans All Others $152.9 11% Excludes PPP Loans PPP Loans |
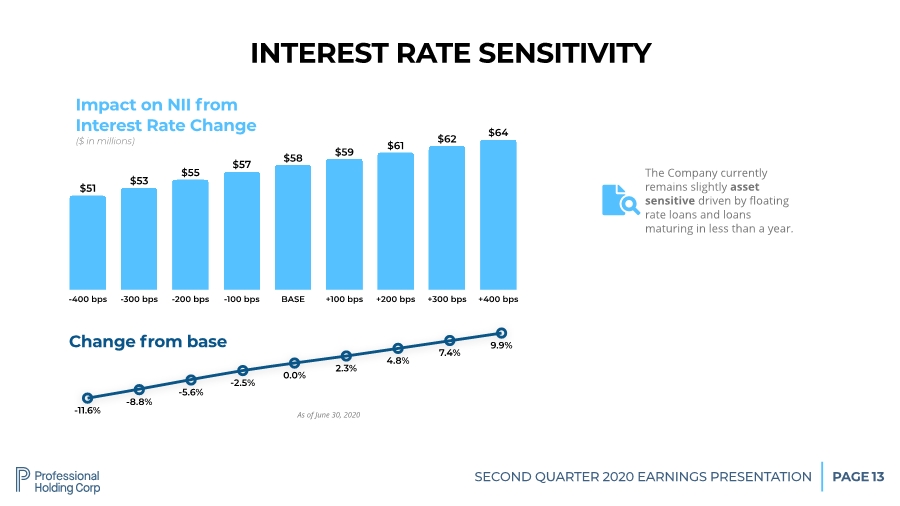
| SECOND QUARTER 2020 EARNINGS PRESENTATION PAGE 13 -400 bps -300 bps -200 bps -100 bps BASE +100 bps +200 bps +300 bps +400 bps $64 $62 $61 $59 $58 $57 $55 $53 $51 INTEREST RATE SENSITIVITY Impact on NII from Interest Rate Change ($ in millions) # The Company currently remains slightly asset sensitive driven by floating rate loans and loans maturing in less than a year. 9.9% 7.4% 4.8% 2.3% 0.0% -2.5% -5.6% -8.8% -11.6% Change from base As of June 30, 2020 |
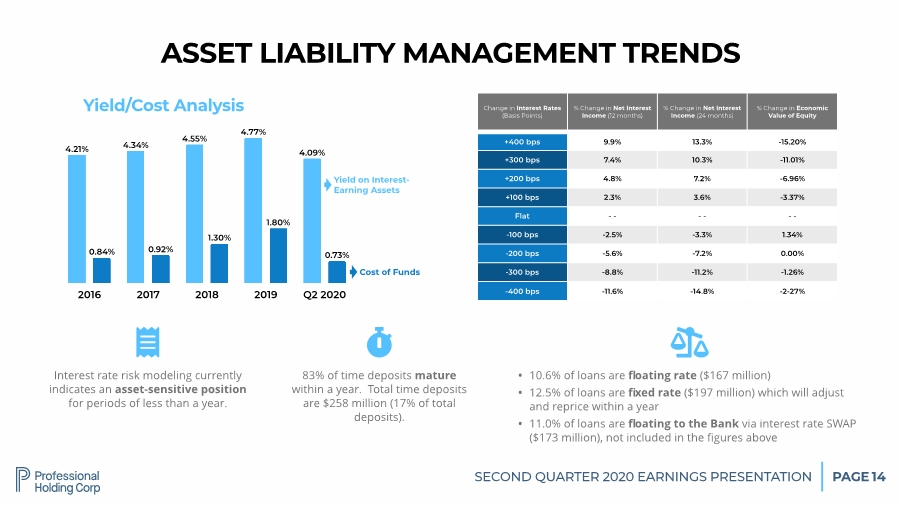
| SECOND QUARTER 2020 EARNINGS PRESENTATION PAGE 14 Interest rate risk modeling currently indicates an asset-sensitive position for periods of less than a year. ( ASSET LIABILITY MANAGEMENT TRENDS • 10.6% of loans are floating rate ($167 million) • 12.5% of loans are fixed rate ($197 million) which will adjust and reprice within a year • 11.0% of loans are floating to the Bank via interest rate SWAP ($173 million), not included in the figures above ) 83% of time deposits mature within a year. Total time deposits are $258 million (17% of total deposits). * 2016 2017 2018 2019 Q2 2020 0.73% 1.80% 1.30% 0.92% 0.84% 4.09% 4.77% 4.55% 4.34% 4.21% Yield/Cost Analysis Yield on Interest- Earning Assets Cost of Funds Change in Interest Rates (Basis Points) % Change in Net Interest Income (12 months) % Change in Net Interest Income (24 months) % Change in Economic Value of Equity +400 bps 9.9% 13.3% -15.20% +300 bps 7.4% 10.3% -11.01% +200 bps 4.8% 7.2% -6.96% +100 bps 2.3% 3.6% -3.37% Flat - - - - - - -100 bps -2.5% -3.3% 1.34% -200 bps -5.6% -7.2% 0.00% -300 bps -8.8% -11.2% -1.26% -400 bps -11.6% -14.8% -2-27% |
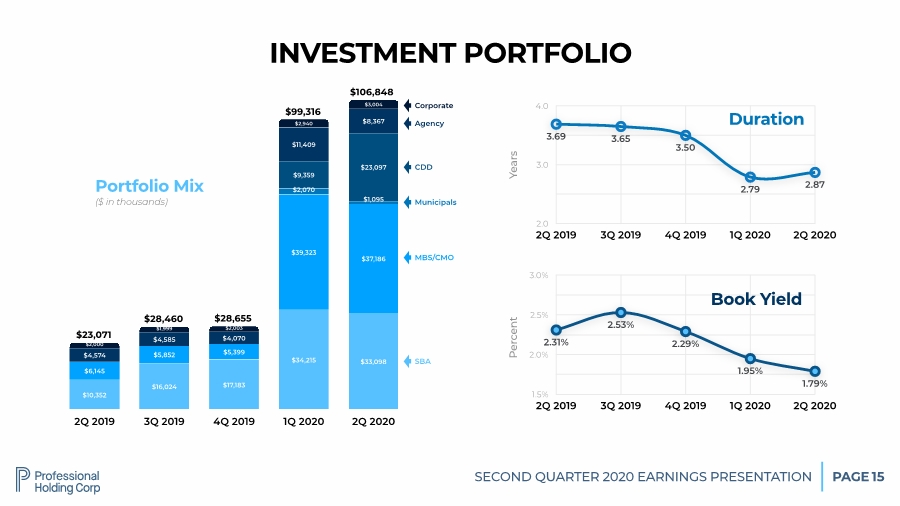
| SECOND QUARTER 2020 EARNINGS PRESENTATION PAGE 1.5% 2.0% 2.5% 3.0% 2Q 2019 3Q 2019 4Q 2019 1Q 2020 2Q 2020 1.79% 1.95% 2.29% 2.53% 2.31% 15 2Q 2019 3Q 2019 4Q 2019 1Q 2020 2Q 2020 $3,004 $2,940 $2,003 $1,999 $2,000 $8,367 $11,409 $4,070 $4,585 $4,574 $23,097 $9,359 $1,095 $2,070 $37,186 $39,323 $5,399 $5,852 $6,145 $33,098 $34,215 $17,183 $16,024 $10,352 Portfolio Mix ($ in thousands) SBA MBS/CMO Municipals CDD Agency INVESTMENT PORTFOLIO 2.0 3.0 4.0 2Q 2019 3Q 2019 4Q 2019 1Q 2020 2Q 2020 2.87 2.79 3.50 3.65 3.69 Book Yield Duration Corporate $23,071 $28,460 $28,655 $106,848 $99,316 Years Percent |
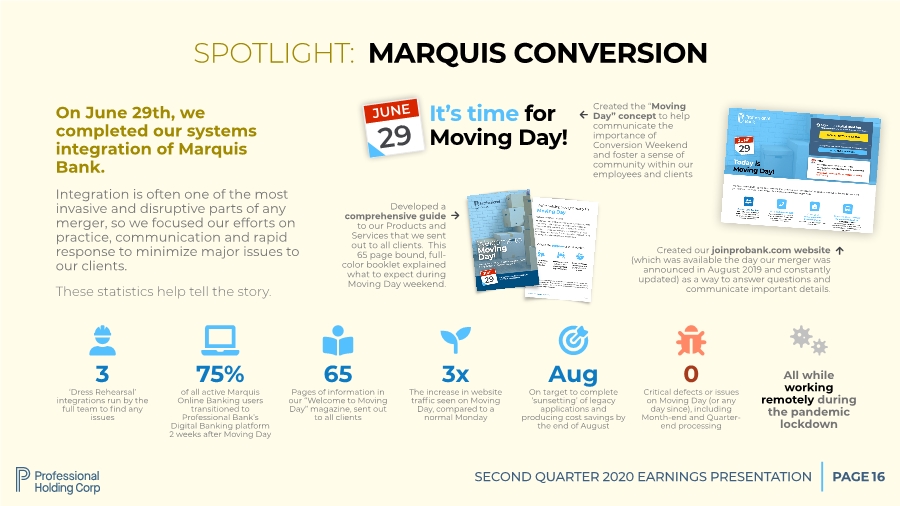
| SECOND QUARTER 2020 EARNINGS PRESENTATION PAGE 16 On June 29th, we completed our systems integration of Marquis Bank. Integration is often one of the most invasive and disruptive parts of any merger, so we focused our efforts on practice, communication and rapid response to minimize major issues to our clients. These statistics help tell the story. 3 ‘Dress Rehearsal’ integrations run by the full team to find any issues + Aug On target to complete ‘sunsetting’ of legacy applications and producing cost savings by the end of August , 75% of all active Marquis Online Banking users transitioned to Professional Bank’s Digital Banking platform 2 weeks after Moving Day ( 65 Pages of information in our “Welcome to Moving Day” magazine, sent out to all clients * SPOTLIGHT: MARQUIS CONVERSION It’s time for Moving Day! 29 JUNE 0 Critical defects or issues on Moving Day (or any day since), including Month-end and Quarter- end processing + 3x The increase in website traffic seen on Moving Day, compared to a normal Monday , All while working remotely during the pandemic lockdown 略 Created the “Moving Day” concept to help communicate the importance of Conversion Weekend and foster a sense of community within our employees and clients Developed a comprehensive guide to our Products and Services that we sent out to all clients. This 65 page bound, full- color booklet explained what to expect during Moving Day weekend. Created our joinprobank.com website (which was available the day our merger was announced in August 2019 and constantly updated) as a way to answer questions and communicate important details. . . / |
| OPERATIONAL RESPONSE AND BANK PREPAREDNESS COVID-19 |

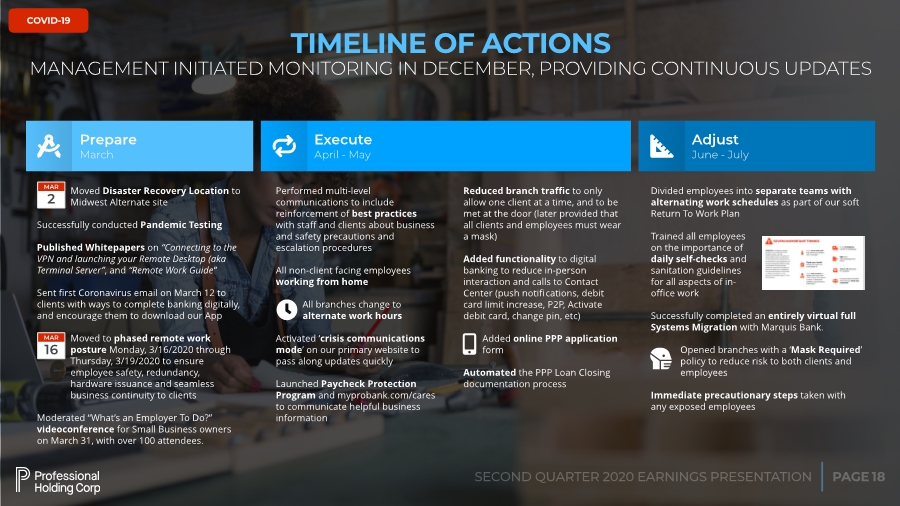
| PAGE SECOND QUARTER 2020 EARNINGS PRESENTATION COVID-19 18 TIMELINE OF ACTIONS MANAGEMENT INITIATED MONITORING IN DECEMBER, PROVIDING CONTINUOUS UPDATES Prepare March Execute April - May Adjust June - July 0 1 2 Moved Disaster Recovery Location to Midwest Alternate site Successfully conducted Pandemic Testing Published Whitepapers on “Connecting to the VPN and launching your Remote Desktop (aka Terminal Server”, and “Remote Work Guide” Sent first Coronavirus email on March 12 to clients with ways to complete banking digitally, and encourage them to download our App Moved to phased remote work posture Monday, 3/16/2020 through Thursday, 3/19/2020 to ensure employee safety, redundancy, hardware issuance and seamless business continuity to clients Moderated “What’s an Employer To Do?” videoconference for Small Business owners on March 31, with over 100 attendees. 2 MAR Performed multi-level communications to include reinforcement of best practices with staff and clients about business and safety precautions and escalation procedures All non-client facing employees working from home All branches change to alternate work hours Activated ‘crisis communications mode’ on our primary website to pass along updates quickly Launched Paycheck Protection Program and myprobank.com/cares to communicate helpful business information Reduced branch traffic to only allow one client at a time, and to be met at the door (later provided that all clients and employees must wear a mask) Added functionality to digital banking to reduce in-person interaction and calls to Contact Center (push notifications, debit card limit increase, P2P, Activate debit card, change pin, etc) Added online PPP application form Automated the PPP Loan Closing documentation process 16 MAR - ) Divided employees into separate teams with alternating work schedules as part of our soft Return To Work Plan Trained all employees on the importance of daily self-checks and sanitation guidelines for all aspects of in- office work Successfully completed an entirely virtual full Systems Migration with Marquis Bank. Opened branches with a ‘Mask Required’ policy to reduce risk to both clients and employees Immediate precautionary steps taken with any exposed employees 北 |
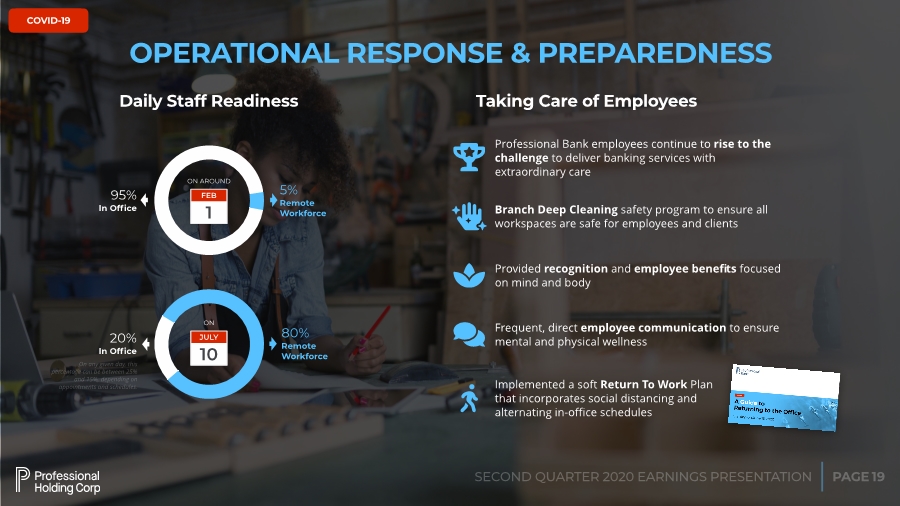
| PAGE SECOND QUARTER 2020 EARNINGS PRESENTATION COVID-19 19 Daily Staff Readiness 5% Remote Workforce 95% In Office OPERATIONAL RESPONSE & PREPAREDNESS 4 Professional Bank employees continue to rise to the challenge to deliver banking services with extraordinary care Taking Care of Employees 諾 Branch Deep Cleaning safety program to ensure all workspaces are safe for employees and clients 6 Provided recognition and employee benefits focused on mind and body 1 FEB ON AROUND 10 JULY ON On any given day, this percentage can be between 25% and 15%, depending on appointments and schedules. 80% Remote Workforce 20% In Office 7 Implemented a soft Return To Work Plan that incorporates social distancing and alternating in-office schedules 8 Frequent, direct employee communication to ensure mental and physical wellness |
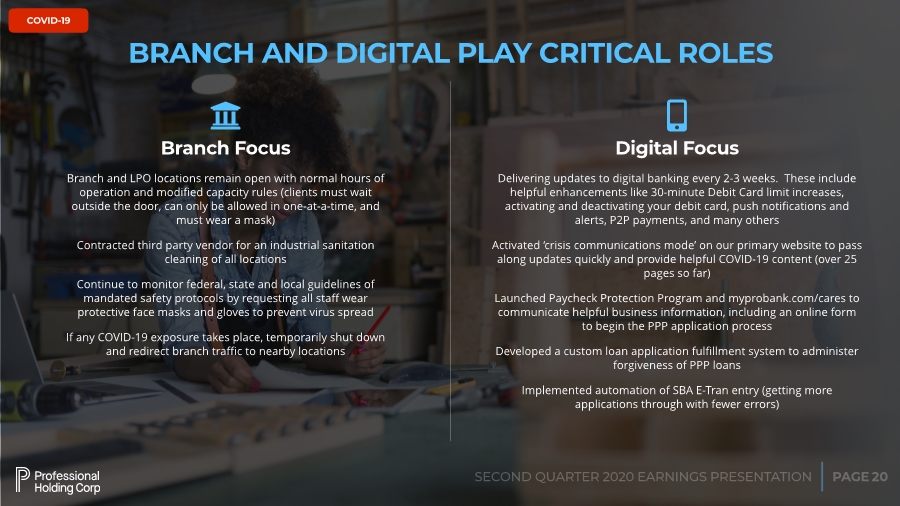
| PAGE SECOND QUARTER 2020 EARNINGS PRESENTATION COVID-19 20 BRANCH AND DIGITAL PLAY CRITICAL ROLES 9 Branch Focus Digital Focus : Delivering updates to digital banking every 2-3 weeks. These include helpful enhancements like 30-minute Debit Card limit increases, activating and deactivating your debit card, push notifications and alerts, P2P payments, and many others Activated ‘crisis communications mode’ on our primary website to pass along updates quickly and provide helpful COVID-19 content (over 25 pages so far) Launched Paycheck Protection Program and myprobank.com/cares to communicate helpful business information, including an online form to begin the PPP application process Developed a custom loan application fulfillment system to administer forgiveness of PPP loans Implemented automation of SBA E-Tran entry (getting more applications through with fewer errors) Branch and LPO locations remain open with normal hours of operation and modified capacity rules (clients must wait outside the door, can only be allowed in one-at-a-time, and must wear a mask) Contracted third party vendor for an industrial sanitation cleaning of all locations Continue to monitor federal, state and local guidelines of mandated safety protocols by requesting all staff wear protective face masks and gloves to prevent virus spread If any COVID-19 exposure takes place, temporarily shut down and redirect branch traffic to nearby locations |
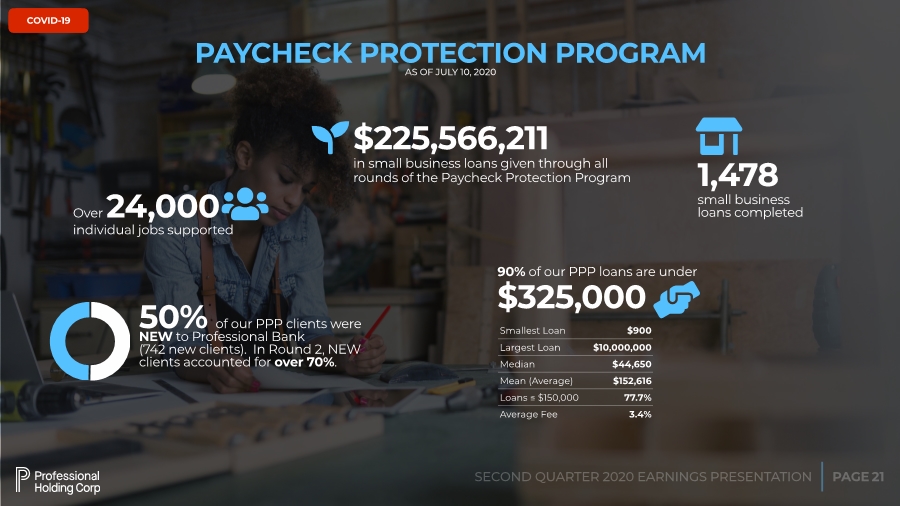
| PAGE SECOND QUARTER 2020 EARNINGS PRESENTATION COVID-19 21 Over 24,000 individual jobs supported . PAYCHECK PROTECTION PROGRAM AS OF JULY 10, 2020 1,478 small business loans completed / COVID-19 $225,566,211 in small business loans given through all rounds of the Paycheck Protection Program , 50% of our PPP clients were NEW to Professional Bank (742 new clients). In Round 2, NEW clients accounted for over 70%. 90% of our PPP loans are under $325,000 0 Smallest Loan $900 Largest Loan $10,000,000 Median $44,650 Mean (Average) $152,616 Loans ≦ $150,000 77.7% Average Fee 3.4% |
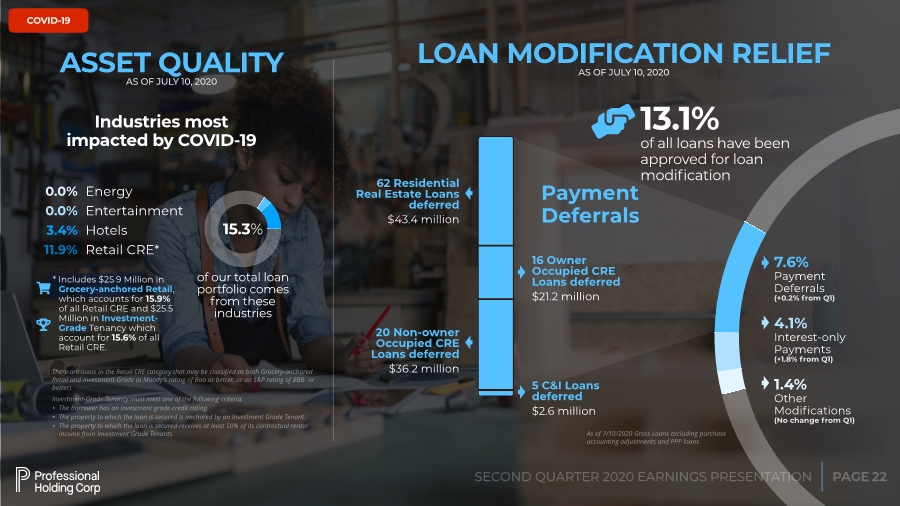
| PAGE SECOND QUARTER 2020 EARNINGS PRESENTATION COVID-19 22 ASSET QUALITY AS OF JULY 10, 2020 Energy Entertainment Hotels Retail CRE* Industries most impacted by COVID-19 0.0% 0.0% 3.4% 11.9% 13.1% of all loans have been approved for loan modification Payment Deferrals 20 Non-owner Occupied CRE Loans deferred $36.2 million 62 Residential Real Estate Loans deferred $43.4 million 16 Owner Occupied CRE Loans deferred $21.2 million 5 C&I Loans deferred $2.6 million LOAN MODIFICATION RELIEF AS OF JULY 10, 2020 7.6% Payment Deferrals (+0.2% from Q1) 4.1% Interest-only Payments (+1.8% from Q1) 1.4% Other Modifications (No change from Q1) 0 As of 7/10/2020 Gross Loans excluding purchase accounting adjustments and PPP loans of our total loan portfolio comes from these industries 15.3% * Includes $25.9 Million in Grocery-anchored Retail, which accounts for 15.9% of all Retail CRE and $25.5 Million in Investment- Grade Tenancy which account for 15.6% of all Retail CRE. ; 4 There are loans in the Retail CRE category that may be classified as both Grocery-anchored Retail and Investment-Grade (a Moody’s rating of Baa or better, or an S&P rating of BBB- or better). Investment-Grade Tenancy must meet one of the following criteria: • The Borrower has an investment grade credit rating. • The property to which the loan is secured is anchored by an Investment Grade Tenant. • The property to which the loan is secured receives at least 50% of its contractual rental income from Investment Grade Tenants. |
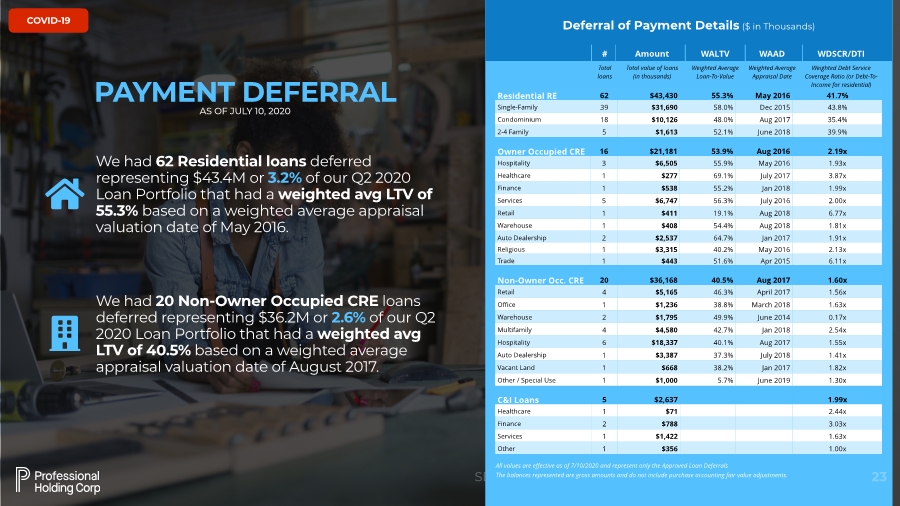
| PAGE SECOND QUARTER 2020 EARNINGS PRESENTATION COVID-19 23 C&I Loans 5 $2,637 1.99x Healthcare 1 $71 2.44x Finance 2 $788 3.03x Services 1 $1,422 1.63x Other 1 $356 1.00x All values are effective as of 7/10/2020 and represent only the Approved Loan Deferrals The balances represented are gross amounts and do not include purchase accounting fair value adjustments. # Amount WALTV WAAD WDSCR/DTI Total loans Total value of loans (in thousands) Weighted Average Loan-To-Value Weighted Average Appraisal Date Weighted Debt Service Coverage Ratio (or Debt-To- Income for residential) Non-Owner Occ. CRE 20 $36,168 40.5% Aug 2017 1.60x Retail 4 $5,165 46.3% April 2017 1.56x Office 1 $1,236 38.8% March 2018 1.63x Warehouse 2 $1,795 49.9% June 2014 0.17x Multifamily 4 $4,580 42.7% Jan 2018 2.54x Hospitality 6 $18,337 40.1% Aug 2017 1.55x Auto Dealership 1 $3,387 37.3% July 2018 1.41x Vacant Land 1 $668 38.2% Jan 2017 1.82x Other / Special Use 1 $1,000 5.7% June 2019 1.30x Owner Occupied CRE 16 $21,181 53.9% Aug 2016 2.19x Hospitality 3 $6,505 55.9% May 2016 1.93x Healthcare 1 $277 69.1% July 2017 3.87x Finance 1 $538 55.2% Jan 2018 1.99x Services 5 $6,747 56.3% July 2016 2.00x Retail 1 $411 19.1% Aug 2018 6.77x Warehouse 1 $408 54.4% Aug 2018 1.81x Auto Dealership 2 $2,537 64.7% Jan 2017 1.91x Religious 1 $3,315 40.2% May 2016 2.13x Trade 1 $443 51.6% Apr 2015 6.11x Residential RE 62 $43,430 55.3% May 2016 41.7% Single-Family 39 $31,690 58.0% Dec 2015 43.8% Condominium 18 $10,126 48.0% Aug 2017 35.4% 2-4 Family 5 $1,613 52.1% June 2018 39.9% Deferral of Payment Details ($ in Thousands) PAYMENT DEFERRAL AS OF JULY 10, 2020 We had 62 Residential loans deferred representing $43.4M or 3.2% of our Q2 2020 Loan Portfolio that had a weighted avg LTV of 55.3% based on a weighted average appraisal valuation date of May 2016. 1 We had 20 Non-Owner Occupied CRE loans deferred representing $36.2M or 2.6% of our Q2 2020 Loan Portfolio that had a weighted avg LTV of 40.5% based on a weighted average appraisal valuation date of August 2017. 2 |
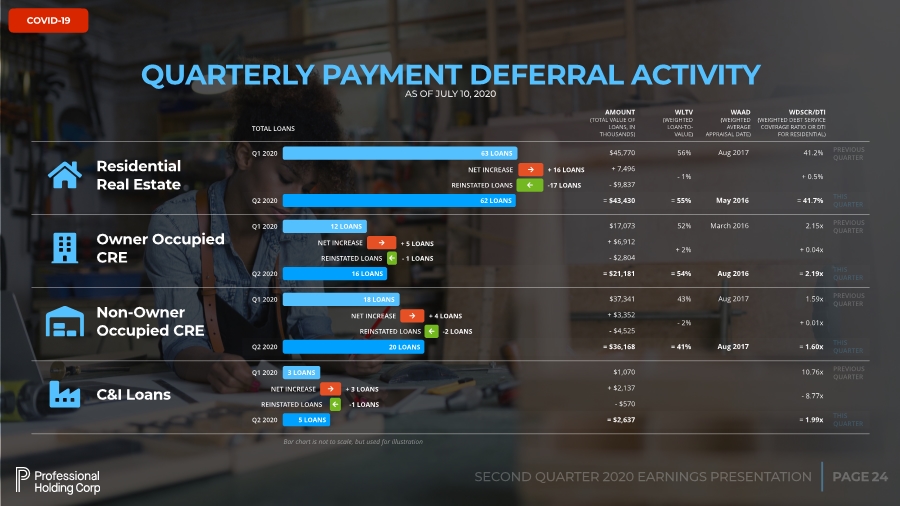
| PAGE SECOND QUARTER 2020 EARNINGS PRESENTATION COVID-19 24 QUARTERLY PAYMENT DEFERRAL ACTIVITY AS OF JULY 10, 2020 < Q1 2020 Residential Real Estate 63 LOANS Q2 2020 62 LOANS NET INCREASE / + 16 LOANS REINSTATED LOANS . -17 LOANS $45,770 + 7,496 - $9,837 = $43,430 56% - 1% = 55% TOTAL LOANS AMOUNT (TOTAL VALUE OF LOANS, IN THOUSANDS) THIS QUARTER 41.2% + 0.5% = 41.7% WLTV (WEIGHTED LOAN-TO- VALUE) Aug 2017 May 2016 WAAD (WEIGHTED AVERAGE APPRAISAL DATE) WDSCR/DTI (WEIGHTED DEBT SERVICE COVERAGE RATIO OR DTI FOR RESIDENTIAL) PREVIOUS QUARTER = Q1 2020 Owner Occupied CRE 12 LOANS Q2 2020 16 LOANS NET INCREASE / + 5 LOANS REINSTATED LOANS . - 1 LOANS $17,073 + $6,912 - $2,804 = $21,181 52% + 2% = 54% THIS QUARTER 2.15x + 0.04x = 2.19x March 2016 Aug 2016 PREVIOUS QUARTER > Q1 2020 Non-Owner Occupied CRE 18 LOANS Q2 2020 20 LOANS NET INCREASE / + 4 LOANS REINSTATED LOANS . -2 LOANS $37,341 + $3,352 - $4,525 = $36,168 43% - 2% = 41% THIS QUARTER 1.59x + 0.01x = 1.60x Aug 2017 Aug 2017 PREVIOUS QUARTER ? Q1 2020 C&I Loans 3 LOANS Q2 2020 5 LOANS NET INCREASE / + 3 LOANS REINSTATED LOANS . -1 LOANS $1,070 + $2,137 - $570 = $2,637 THIS QUARTER 10.76x - 8.77x = 1.99x PREVIOUS QUARTER Bar chart is not to scale, but used for illustration |