Attached files
| file | filename |
|---|---|
| EX-32.2 - EX-32.2 - Professional Holding Corp. | pfhd-20201231ex322e3caf9.htm |
| EX-32.1 - EX-32.1 - Professional Holding Corp. | pfhd-20201231ex321bf43ff.htm |
| EX-31.2 - EX-31.2 - Professional Holding Corp. | pfhd-20201231ex312bab2ea.htm |
| EX-31.1 - EX-31.1 - Professional Holding Corp. | pfhd-20201231ex31191ed16.htm |
| EX-4.1 - EX-4.1 - Professional Holding Corp. | pfhd-20201231ex416d5598f.htm |
UNITED STATES
SECURITIES AND EXCHANGE COMMISSION
Washington, D.C. 20549
FORM 10-K
☒ ANNUAL REPORT PURSUANT TO SECTION 13 OR 15(d) OF THE SECURITIES EXCHANGE ACT OF 1934
For the fiscal year ended December 31, 2020
□ TRANSITION REPORT PURSUANT TO SECTION 13 OR 15(d) OF THE SECURITIES EXCHANGE ACT OF 1934
For the transition period from _______ to _________
Commission File No. 001-39215
Professional Holding Corp.
(Exact name of Registrant as specified in its charter)
Florida |
| |
| 46-5144312 |
|---|---|---|---|---|
(State or other jurisdiction of | | | | (I.R.S. Employer |
incorporation or organization) | | | | Identification Number) |
396 Alhambra Circle, Suite 255
Coral Gables, FL 33134 (786) 483-1757
(Address, including zip code, and telephone number, including area code, of Registrant’s principal executive offices)
Securities registered pursuant to Section 12(b) of the Act:
|
|
|
|
|
Title of each class: |
| Trading Symbol |
| Name of each exchange on which registered: |
Class A Common Stock |
| PFHD |
| NASDAQ Global Select Market |
Securities registered pursuant to Section 12(g) of the Act: None.
Indicate by check mark if the registrant is a well-known seasoned issuer, as defined in Rule 405 of the Securities Act. Yes ☐ No ☒
Indicate by check mark if the registrant is not required to file reports pursuant to Section 13 or Section 15(d) of the Act. Yes ☐ No ☒
Indicate by check mark whether the registrant: (1) has filed all reports required to be filed by Section 13 or 15(d) of the Securities Exchange Act of 1934 during the preceding 12 months (or for such shorter period that the registrant was required to file such reports), and (2) has been subject to such filing requirements for the past 90 days. Yes ☒ No ☐
Indicate by check mark whether the registrant has submitted electronically every Interactive Data File required to be submitted pursuant to Rule 405 of Regulation S-T (§ 232.405 of this chapter) during the preceding 12 months (or for such shorter period that the registrant was required to submit such files). Yes ☒ No ☐
Indicate by check mark whether the registrant is a large accelerated filer, an accelerated filer, a non-accelerated filer, a smaller reporting company, or an emerging growth company. See the definitions of “large accelerated filer,” “accelerated filer”, “smaller reporting company”, and "emerging growth company" in Rule 12b-2 of the Exchange Act.
Large accelerated filer | ◻ | | Accelerated filer | ◻ |
Non-accelerated filer | ⌧ | | Smaller reporting company | ⌧ |
| | | Emerging growth company | ⌧ |
If an emerging growth company, indicate by check mark if the registrant has elected not to use the extended transition period for complying with any new or revised financial accounting standards provided pursuant to Section 13(a) of the Exchange Act. ☐
Indicate by check mark whether the registrant has filed a report on and attestation to its management’s assessment of the effectiveness of its internal control over financial reporting under Section 404(b) of the Sarbanes-Oxley Act (15 U.S.C. 7262(b)) by the registered public accounting firm that prepared or issued its audit report. ☐
Indicate by check mark whether the registrant is a shell company (as defined by Rule 12b-2 of the Exchange Act). ☐ Yes ☐ No ☒
The aggregate market value of the voting and non-voting stock of the registrant, based on the closing price of the common stock on June 30, 2020, was approximately $170.1 million.
The number of shares outstanding of Professional Holding Corporation common stock, par value $0.01 per share, as of March 19, 2021, was 13,659,103.
DOCUMENTS INCORPORATED BY REFERENCE
Certain portions of the registrant’s Proxy Statement for the 2021 Annual Meeting of Shareholders (the “2021 Proxy Statement”) are incorporated by reference into Part III of this report.
| | |
| | |
3 | ||
| | |
11 | ||
| | |
34 | ||
| | |
34 | ||
| | |
35 | ||
| | |
35 | ||
| | |
| | |
| | |
Market for Registrant’s Common Equity, Related Stockholder Matters, and Issuer Purchases | 35 | |
| | |
36 | ||
| | |
Management’s Discussion and Analysis of Financial Condition and Results of Operations | 36 | |
| | |
70 | ||
| | |
F-1 | ||
| | |
Changes in and Disagreements with Accountants on Accounting and Financial Disclosure | 70 | |
| | |
70 | ||
| | |
72 | ||
| | |
| | |
| | |
72 | ||
| | |
72 | ||
| | |
Security Ownership of Certain Beneficial Owners and Management and Related Stockholder Matters | 72 | |
| | |
Certain Relationships and Related Transactions, and Director Independence | 72 | |
| | |
72 | ||
| | |
| | |
| | |
73 | ||
| | |
75 |
i
When used in this report, “the Company,” “we,” and “our” may refer to Professional Holding Corp. individually, Professional Holding Corp. and its subsidiaries, or our wholly owned subsidiary Professional Bank.
AVAILABLE INFORMATION
The public may read and copy any materials the Company files with the Securities and Exchange Commission (the “SEC”) at the SEC’s Public Reference Room at 100 F Street, N.E. Washington, D.C. 20549 (information on the operation of that Public Reference Room is available by calling the SEC at 1-800-SEC-0330). The SEC also maintains a website that contains reports, proxy and information statements, and other information regarding issuers that file electronically with the SEC at http://www.sec.gov.
The Company makes available on its website www.proholdco.com its code of ethics and charters of the Audit Committee, Compensation Committee and Nominating and Corporate Governance Committee of the Board of Directors. You can also register for our email notification service at www.proholdco.com. Neither our website nor the information contained on that site, or connected to that site, is incorporated by reference into the Annual Report on Form 10-K.
ii
CAUTIONARY NOTE REGARDING FORWARD-LOOKING INFORMATION
This Annual Report on Form 10-K contains certain forward-looking statements, as defined in Section 27A of the Securities Act of 1933, as amended (the “Securities Act”), and Section 21E of the Securities Exchange Act of 1934, as amended (the “Exchange Act”). Such forward-looking statements reflect our current opinions, expectations, beliefs, plans, objectives, assumptions, or projections regarding, among other things, future events or future results, in contrast with statements that reflect historical facts. These statements are often, but not always, made through the use of conditional words such as “anticipate,” “intend,” “believe,” “estimate,” “plan,” “seek,” “project,” or “expect,” “may,” “will,” “would,” “could” or “should” or the negative versions of these terms or other comparable terminology. These forward-looking statements are not historical facts, and are based on current expectations, estimates and projections about our industry, management’s beliefs and certain assumptions made by management, many of which, by their nature, are inherently uncertain and beyond our control. Accordingly, we caution you that any such forward-looking statements are not guarantees of future performance and are subject to risks, assumptions and uncertainties that are difficult to predict. Although we believe that the expectations reflected in these forward-looking statements are reasonable as of the date made, actual results may prove to be materially different from the results expressed or implied by the forward-looking statements.
Important factors related to forward-looking statements may include, among others, risks and assumptions regarding:
| ● | the strength of the United States economy, in general, and the strength of the local economies in which we conduct operations; |
| ● | our ability to successfully manage interest rate risk, credit risk, liquidity risk, and other risks inherent to our industry; |
| ● | potential disruptions from viruses and pandemics, including the duration and severity of the COVID-19 pandemic, both in our principal area of operations and nationally, including the ultimate impact of the pandemic on the economy in general and on our operations; |
| ● | the effects of our lack of a diversified loan portfolio and concentration in the South Florida market, including the risks of geographic, depositor, and industry concentrations, including our concentration in loans secured by real estate; |
| ● | the frequency and magnitude of foreclosure of our loans; |
| ● | our ability to fund and manage our growth, both organic growth as well as growth through other means, such as future acquisitions; |
| ● | acquisition integration risks, including potential deposit attrition, higher than expected costs, customer loss, business disruption and the inability to realize benefits and cost savings from, and limit any unexpected liabilities associated with, any business combinations; |
| ● | the accuracy of our financial statement estimates and assumptions, including the estimates used for our loan loss reserve and deferred tax asset valuation allowance; |
| ● | changes in accounting principles, policies, practices or guidelines, including the effects of forthcoming CECL implementation; |
| ● | our ability to comply with the extensive laws and regulations to which we are subject, including the laws for each jurisdiction where we operate; |
| ● | negative publicity and the impact on our reputation; |
| ● | legislative or regulatory changes; |
| ● | the Bank’s ability to make cash distributions to us and our ability to declare and pay dividends, the payment of which is subject to our capital and other requirements; |
1
| ● | increased competition and its effect on pricing of our products and services as well as our margins; |
| ● | changes in the securities, real estate markets and commodities markets; |
| ● | our ability to attract and retain highly qualified personnel; |
| ● | technological changes; |
| ● | cybersecurity risks including security breaches, computer viruses, data processing system failures and errors, and identity theft, could result in the disclosure of confidential information; |
| ● | our ability to manage operational risks, including, but not limited to, client, employee, or third-party fraud; |
| ● | changes in monetary and fiscal policies of the United States Government and the Federal Reserve; |
| ● | inflation, interest rate, unemployment rate, market, and monetary fluctuations; |
| ● | the efficiency and effectiveness of our internal control environment; |
| ● | the ability of our third-party service providers’ to continue providing services to us and clients without interruption; |
| ● | the effects of harsh weather conditions, including hurricanes, and man-made disasters; |
| ● | potential business interruptions from catastrophic events such as terrorist attacks, active shooter situations, and advanced persistent threat groups; |
| ● | the willingness of clients to accept third-party products and services rather than our products and services and vice versa; |
| ● | changes in consumer spending and saving habits; |
| ● | growth and profitability of our noninterest income; |
| ● | anti-takeover provisions under federal and state law as well as our governing documents; |
If one or more events related to these or other risks or uncertainties materialize or intensify, or if our underlying assumptions prove to be incorrect, actual results may differ materially from what we anticipate. Accordingly, you are cautioned not to place undue reliance on these forward-looking statements. The forward-looking statements included in this prospectus are made only as of the date of the Annual Report on Form 10-K. New factors emerge from time to time, and it is not possible for us to predict which will arise. We do not undertake, and specifically decline, any obligation to update any such statements or to publicly announce the results of any revisions to any of such statements to reflect future events or developments, except as may be required by law.
2
General
Professional Holding Corp., a Florida corporation ("PFHD", together with its subsidiaries, the "Company") is the bank holding company for Professional Bank, a Florida banking corporation (the "Bank"). The Company is registered as a financial holding company pursuant to the Bank Holding Company Act of 1956, as amended (the "Holding Company Act") and is subject to supervision and regulation by the Board of Governors of the Federal Reserve System (the "Federal Reserve"). We were incorporated in 2014 and are headquartered in Coral Gables, Florida. We operate primarily through our wholly owned subsidiary, Professional Bank, a Florida state-chartered bank, which commenced operations in 2008. We focus on providing creative, relationship-driven commercial banking products and services designed to meet the needs of our clients. Our clients are small to medium sized businesses, the owners and operators of these businesses, and other professionals and entrepreneurs. We conduct our banking operations from nine branch locations in the Miami-Fort Lauderdale-West Palm Beach or Miami-Dade metropolitan statistical area, or MSA, which encompasses three rapidly growing counties in Florida: Miami-Dade, Broward, and Palm Beach. Not including investment banks, savings and loan associations or non-US parent banks we are the tenth largest independent community bank in Florida. Additionally, we have a Digital Innovation Center located in Cleveland, Ohio and in November 2020 we opened a Loan Production Office in New England that specializes in search fund lending.
Our Digital Innovation Center in Cleveland supports our investments in digital and technology. We have successfully recruited technology professionals from national banking institutions and global consulting firms with experience in transformational digital experiences and capabilities. This team has successfully executed on our integration of Marquis Bancorp, Inc. (“MBI”), whom we acquired in March 2020, as well as deployed competitively differentiated digital assets such as our real-time person-to-person, or P2P, payments offering service. We believe that our technology platform allows us to compete with larger financial institutions by offering a cutting-edge digital client experiences that can be specifically tailored to multiple demographics, while also continuing the customized concierge service that our clients have come to expect.
On February 7, 2020, we completed our initial public offering (“IPO”) of 3,565,000 shares of our Class A Common Stock. The principal market on which our Class A Common Stock trades is the Nasdaq Global Select Market under the symbol “PFHD.”
On March 26, 2020, we closed the acquisition of MBI, and its wholly owned subsidiary, Marquis Bank, a Florida state-chartered bank. Each share of MBI common stock outstanding was converted into 1.2048 shares of our Class A Common Stock, with cash paid in lieu of any fractional shares. At the closing of the acquisition we issued approximately 4,227,816 shares of our Class A Common Stock. In addition, all stock options of MBI granted and outstanding on the closing date of the merger were converted into an option to purchase shares of our Class A Common Stock based on the exchange ratio. Upon completion of the acquisition, the pro forma combined company had approximately $1.7 billion in total assets, net loans of $1.3 billion and total deposits of $1.4 billion, excluding purchase accounting adjustments.
Market and Economic Overview
The Miami-Dade MSA, which encompasses Miami-Dade, Broward, and Palm Beach counties, and is characterized by a rapidly growing population, a high level of job growth, an affordable cost of living and a pro-growth business climate is among the most vibrant in the United States. The Miami-Dade MSA is one of the top MSAs in the Southeast as measured by both deposits and population and is one of the largest business markets in Florida. We expect the Florida market, as well as the consolidation in the banking industry within the state, to provide us with opportunities for growth.
Prior to the economic effect of the COVID-19 pandemic, the region’s unemployment rate had remained below the national average for the last several years. Currently, while the region's unemployment rate has increased significantly, it is still below the national average. While the hotel and hospitality sector in our market has been and continues to be impacted by the COVID-19 pandemic, overall, the employment metrics in our market has demonstrated resiliency when
3
compared to the impact of the pandemic on the overall employment metrics for the nation. As of February 2020, Florida’s seasonally adjusted unemployment rate fell to a record low of 2.8% which was the 11th lowest unemployment rate in the country. However, the effects of the COVID-19 pandemic and government travel restrictions and shutdowns led to a sharp rise with the unemployment rate reaching an all-time high of 13.8% by April 2020. As of June 2020, Florida’s unemployment rate landed at 10.4% as businesses used federal stimulus aid to re-hire employees and government-mandated restrictions were eased. This was further improved during the fourth quarter of 2020 with the Florida unemployment rate dropping to 6.5%. Volatility in global economic markets, continued domestic political turmoil and various episodes of geopolitical unrest continue to cause uncertainty and volatility in the financial markets. Overall, while challenges remain, the Company’s management is encouraged by the resiliency of the current economic environment in our markets and the prospects for continued growth of the Company.
Strategic Outlook
We believe that we have developed a reputation in our market for highly customized services, and we continue to seek new ways to meet our clients’ financial needs. We offer a full line of deposit products, cash management services and commercial and residential loan programs, as well as online/digital and mobile banking capabilities. We firmly believe our clients place value on our local and timely decision-making, coupled with the high-quality service that we provide. Approaching our clients’ challenges from a different point of view is at the heart of our culture, as our bankers are extremely familiar with our clients’ businesses, enabling us to more accurately assess risk, while developing mutually acceptable credit structures for the Bank and its clients.
We believe our investments in people, our platform and technology, as well as our ongoing efforts to attract talented banking professionals, positions us for future growth and enhanced profitability. We have invested in additional team members who are working so that we can own more of our digital experience with the intent of providing our clients new, unique, and satisfying offerings. Our focus, culture, brand, and reputation throughout our market enhance our ability to continue to grow organically, successfully recruit talented bankers and pursue opportunistic acquisitions in the future.
Our goal is to continue our growth to service increasingly larger and sophisticated clients, while remaining agile enough to be a leading speed-based competitor in acquiring new clients. In an effort to keep our operating costs low while continuing to seek opportunities for growth, we have typically established new banking teams in lower cost loan production offices before committing to opening a more expensive full-service branch. By establishing banking teams in lower cost loan production offices, we can avoid long-term lease commitments, costly branch improvements and related costs until our new banking team has attracted a sufficient number of banking relationships and earning assets. Once the newly hired team achieves a certain financial scale, we evaluate the economics of opening a full-service branch. This strategy has allowed us to achieve significant growth while prudently managing our expansion costs and maintaining our strong credit quality.
|
| Date Loan |
| |
| Total Deposits as of | |
| | Production Office | | Date of Branch | | 12/31/2020 | |
Current Locations | | (LPO) Opened | | Opening / Conversion | | (thousands) | |
South Miami |
| — |
| Aug. 2008 | | $ | 530,579 |
Coral Gables |
| — |
| Jan. 2014 | | $ | 497,157 |
Palm Beach Gardens |
| Feb. 2016 |
| Nov. 2017 | | $ | 171,046 |
Boca Raton |
| Mar. 2017 |
| May 2019 | | $ | 135,678 |
Fort Lauderdale |
| Oct. 2017 |
| Mar. 2020* | | $ | 105,128 |
Dadeland |
| — |
| May 2019 | | $ | 35,401 |
Doral |
| Jul. 2019 |
| Nov. 2020 | | $ | 45,725 |
Wellington |
| Jul. 2019 |
| Jul. 2020 | | $ | 17,373 |
Aventura | | — | | Mar. 2020* | | $ | 121,456 |
New Hampshire LPO | | Nov. 2020 | | — | | | — |
*Acquired through the business combination of MBI. | | | | | | | |
4
We believe both culture and brand are at the core of our messaging when attracting and retaining both bankers and clients. We believe continued consolidation throughout Florida will provide us with additional opportunities to grow in both our current footprint and into other Florida metropolitan areas. To capitalize on these opportunities, we intend to (i) continue to evaluate lift-outs of high-performing banking teams, (ii) leverage the relationships and contacts of our existing bankers to identify and target suitable business and individual clients, and (iii) develop comprehensive banking relationships with these businesses and individuals by delivering competitive banking products and services comparable to that of larger institutions while providing the superior client service expected of a smaller community bank.
We are subject to state and federal banking laws and regulations that govern virtually all aspects of our operations. Any changes in applicable laws, regulations or the enforcement thereof may materially affect our business and prospects. Proposed legislative or regulatory changes may also affect our operations. The following description summarizes some of the laws and regulations to which we are subject. References to applicable statutes and regulations are brief summaries, do not purport to be complete, and are qualified in their entirety by reference to such statutes and regulations. The Company and the Bank are Affirmative Action/Equal Opportunity Employers.
Supervision and Regulation
Banking is a complex, highly regulated industry. Consequently, our growth and earnings performance can be affected, not only by management decisions and general and local economic conditions, but also by the statutes administered by and the regulations and policies of, various governmental regulatory authorities. These authorities include, but are not limited to, the Federal Reserve, Federal Deposit Insurance Corporation (the “FDIC”), and the Florida Office of Financial Regulation. The primary goals of the bank regulatory scheme are to maintain a safe and sound banking system and to facilitate the conduct of sound monetary policy. In furtherance of those goals, the U.S. Congress and the individual states have created numerous regulatory agencies and enacted numerous laws, such as the Dodd-Frank Act, that govern banks and the banking industry. The system of supervision and regulation applicable to the Company establishes a comprehensive framework for our operations and is intended primarily for the protection of the FDIC’s deposit insurance funds, our depositors and the public, rather than the stockholders and creditors.
The Company and its subsidiary bank are required to file annual and quarterly reports with various regulatory authorities, including the Federal Reserve and the Florida Office of Financial Regulation. The Federal Reserve and the Florida Office of Financial Regulation may examine a bank holding company or any of its subsidiaries and charge the for the cost of such an examination. The Company is also subject to reporting and disclosure requirements under state and federal securities laws.
New regulations and statutes are regularly proposed that contain wide-ranging proposals for altering the structures, regulations and competitive relationships of financial institutions operating in the United States. The federal banking agencies have issued a number of significant new regulations as a result of the Dodd-Frank Act and a number of additional regulations are pending or may be proposed. We cannot predict whether or in what form any proposed regulation or statute will be adopted or the extent to which any of our businesses may be affected by any new regulation or statute.
The following is an attempt to summarize some of the relevant laws, rules and regulations governing banks and bank holding companies, but does not purport to be a complete summary of all applicable laws, rules and regulations governing banks. The descriptions are qualified in their entirety by reference to the specific statutes and regulations discussed.
Holding Company Regulation
We are registered with the Board of Governors of the Federal Reserve as a financial holding company under the Bank Holding Company Act of 1956, or BHC Act. As a result, we are subject to supervisory regulation and examination by the Federal Reserve. The Gramm-Leach-Bliley Act, the BHC Act, and other federal laws subject financial holding companies to restrictions on the types of activities in which they may engage, and to a range of supervisory requirements and activities, including regulatory enforcement actions for violations of laws and regulations.
5
Permitted Activities
The Gramm-Leach-Bliley Act modernized the United States banking system by: (i) allowing bank holding companies that qualify as “financial holding companies,” such as Professional Holding Corp., to engage in a broad range of financial and related activities; (ii) allowing insurers and other financial service companies to acquire banks; (iii) removing restrictions that applied to bank holding company ownership of securities firms and mutual fund advisory companies; and (iv) establishing the overall regulatory scheme applicable to bank holding companies that also engage in insurance and securities operations. Activities that are financial in nature are broadly defined to include not only banking, insurance, and securities activities, but also merchant banking and additional activities that the Federal Reserve, in consultation with the Secretary of the Treasury, determines to be financial in nature, incidental to such financial activities, or complementary activities that do not pose a substantial risk to the safety and soundness of depository institutions or the financial system generally. To maintain financial holding company status, a bank holding company and all subsidiary depository institutions must be well managed and “well capitalized.” Additionally, all subsidiary depository institutions must have received at least a “Satisfactory” rating on their most recent Community Reinvestment Act examination. Failure to meet these requirements may result in limitations on activities and acquisitions.
Safe and Sound Banking Practices
Bank holding companies and their non-banking subsidiaries are prohibited from engaging in activities that represent unsafe and unsound banking practices or that constitute a violation of law or regulations. Additionally, consistent with the Dodd-Frank Act codification of the Federal Reserve’s long-standing policy, bank holding companies must serve as a source of financial strength for their subsidiary banks. Under this requirement, the Company is expected to commit resources to support Professional Bank, including at times when the Company may not be in a financial position to provide such resources.
The Federal Reserve has stated that, as a matter of prudence, a bank holding company generally should not maintain a rate of distributions to stockholders unless its available net income has been sufficient to fully fund the distributions and the prospective rate of earnings retention appears consistent with a bank holding company’s capital needs, asset quality and overall financial condition. In addition, we are subject to certain restrictions on the making of distributions as a result of the requirement that our subsidiary bank maintains an adequate level of capital as described below. Limitations on our subsidiary bank paying dividends could, in turn, affect our ability to pay dividends to our stockholders. The Federal Reserve also has the authority to regulate the debt of bank holding companies, including the authority to impose interest rate ceilings and reserve requirements on such debt. Under certain circumstances the Federal Reserve may require a bank holding company to file written notice and obtain its approval prior to purchasing or redeeming its equity securities unless certain conditions are met.
Capital Regulations
The Federal Reserve imposes certain capital requirements on financial holding companies under the BHC Act, including a minimum leverage ratio and a minimum ratio of “qualifying” capital to risk-weighted assets. These rules are complex and are evolving as U.S. and international regulatory authorities propose and enact enhanced capital and liquidity rules. The Company seeks to manage its capital position to maintain sufficient capital to meet these regulatory guidelines and to support our business activities. Subject to its capital requirements and certain other restrictions, we are generally able to borrow money to make a capital contribution to the Bank, and such loans may be repaid from dividends paid from the Bank to us. We are also able to raise capital for contributions to the Bank by issuing securities, subject to compliance with federal and state securities laws.
Changes in Control
Subject to certain exceptions, the BHC Act and the Change in Bank Control Act of 1978 (“CBCA”), together with the applicable regulations, require Federal Reserve approval (or, depending on the circumstances, no notice of disapproval) prior to any acquisition of “control” of a bank or bank holding company. Under the BHC Act, a company (a broadly defined term that includes partnerships among other things) that acquires the power, directly or indirectly, to direct the management or policies of an insured depository institution or to vote 25% or more of any class of voting
6
securities of any insured depository institution is deemed to control the institution and to be a bank holding company. A company that acquires less than 5% of any class of voting security (and that does not exhibit the other control factors) is presumed not to have control. For ownership levels between the 5% and 25% thresholds, the Federal Reserve has adopted a rule that outlines circumstances in which control may or may not exist.
Under the CBCA, if an individual or a company that acquires 10% or more of any class of voting securities of an insured depository institution or its holding company and either that institution or company has registered securities under Section 12 of the Exchange Act, or no other person will own a greater percentage of that class of voting securities immediately after the acquisition, then that investor is presumed to have control and may be required to file a change in bank control notice with the institution’s or the holding company’s primary federal regulator. Our Class A Common Stock is registered under Section 12 of the Exchange Act.
As a financial holding company, we are required to obtain prior approval from the Federal Reserve before (i) acquiring all or substantially all of the assets of a bank or bank holding company, (ii) acquiring direct or indirect ownership or control of more than 5% of the outstanding voting stock of any bank or bank holding company (unless we own a majority of such bank’s voting shares), or (iii) acquiring, merging or consolidating with any other bank or bank holding company. In determining whether to approve a proposed bank acquisition, federal bank regulators will consider, among other factors, the effect of the acquisition on competition, the public benefits expected to be received from the acquisition, the projected capital ratios and levels on a post-acquisition basis, and the companies records of addressing the credit needs of the communities they serve, including the needs of low and moderate income neighborhoods, consistent with the safe and sound operation of the bank, under the Community Reinvestment Act of 1977.
Under Florida law, a person or entity proposing to directly or indirectly acquire control of a Florida bank must also obtain permission from the Florida Office of Financial Regulation. Florida statutes define “control” as either (i) indirectly or directly owning, controlling or having power to vote 25% or more of the voting securities of a bank; (ii) controlling the election of a majority of directors of a bank; (iii) owning, controlling, or having power to vote 10% or more of the voting securities as well as directly or indirectly exercising a controlling influence over management or policies of a bank; or (iv) as determined by the Florida Office of Financial Regulation. These requirements will affect us because the Bank is chartered under Florida law and changes in control of the Company are indirect changes in control of the Bank.
Tying
Financial holding companies and their affiliates are prohibited from tying the provision of certain services, such as extending credit, to other services or products offered by the holding company or its affiliates, such as deposit products.
Bank Regulation
Professional Bank is a state-chartered commercial banking institution that is chartered by and headquartered in the State of Florida and is subject to supervision and regulation by the Florida Office of Financial Regulation. The Florida Office of Financial Regulation supervises and regulates all areas of our operations including, without limitation, the making of loans, the issuance of securities, the conduct of our corporate affairs, the satisfaction of capital adequacy requirements, the payment of dividends, and the establishment or closing of banking centers. We are also a member bank of the Federal Reserve System, which makes our operations subject to broad federal regulation and oversight by the Federal Reserve. In addition, our deposit accounts are insured by the Deposit Insurance Fund administered by the FDIC to the maximum extent permitted by law, and the FDIC has certain supervisory and enforcement powers over us.
As a state-chartered bank in the State of Florida, we are empowered by statute, subject to the limitations contained in those statutes, to take and pay interest on, savings and time deposits, to accept demand deposits, to make loans on residential and other real estate, to make consumer and commercial loans, to invest, with certain limitations, in equity securities and in debt obligations of banks and corporations and to provide various other banking services for the benefit of our clients. Various consumer laws and regulations also affect our operations, including state usury laws, laws relating to fiduciaries, consumer credit and equal credit opportunity laws, and fair credit reporting. In addition, the Federal Deposit Insurance Corporation Improvement Act of 1991, or FDICIA, prohibits insured state-chartered institutions from
7
conducting activities that are not permitted for national banks. A bank, however, may engage in an otherwise prohibited activity if it meets its minimum capital requirements and the FDIC determines that the activity does not present a significant risk to the Deposit Insurance Fund (“DIF”).
As part of FDICIA’s efforts to promote the safety and soundness of depository institutions and their holding companies, appropriate federal banking regulators are required to have in place regulations specifying operational and management standards (addressing internal controls, loan documentation, credit underwriting and interest rate risk), asset quality and earnings. The Federal Reserve and the FDIC have extensive authority to police unsafe or unsound practices and violations of applicable laws and regulations by depository institutions and their holding companies.
The ability of Professional Bank, as a Florida state-chartered bank, to pay dividends is restricted under the Florida law as well as the rules and requirements of the Federal Reserve. As discussed above, Professional Bank is also subject to certain restrictions on the payment of dividends as a result of the requirement that it maintain an adequate level of capital in accordance with guidelines promulgated from time to time by the federal regulators.
Capital Adequacy
In addition to the capital rules applicable to both banks and bank holding companies discussed above, under the prompt corrective action regulations, the federal bank regulators are required and authorized to take supervisory actions against undercapitalized banks. The severity of the action depends upon the capital category in which the institution is placed. Generally, subject to a narrow exception, banking regulators must appoint a receiver or conservator for an institution that is “critically undercapitalized.” The federal banking agencies have specified by regulation the relevant capital level for each category. An institution that is categorized as “undercapitalized,” “significantly undercapitalized,” or “critically undercapitalized” is required to submit an acceptable capital restoration plan to its appropriate federal banking agency. Failure to meet capital guidelines could subject our subsidiary bank to a variety of enforcement remedies, including issuance of a capital directive, the termination of deposit insurance by the FDIC, a prohibition on accepting brokered deposits and other restrictions on our business.
Deposit Insurance
The FDIC insures the deposits of federally insured banks up to prescribed statutory limits for each depositor, through the DIF and safeguards the safety and soundness of the banking and thrift industries. The amount of FDIC assessments paid by each insured depository institution is based on its relative risk of default as measured by regulatory capital ratios and other supervisory factors.
The FDIC’s deposit insurance premium assessment is based on an institution’s average consolidated total assets minus average tangible equity. At least semi-annually, the FDIC will update its loss and income projections for the DIF and, if needed, will increase or decrease assessment rates, following notice-and-comment rulemaking, if required. Deposit insurance assessment rates are subject to change by the FDIC and will be impacted by the overall economy and the stability of the banking industry as a whole. Any future increases in FDIC insurance premiums may have a material and adverse effect on our earnings.
Restrictions on Transactions with Affiliates
Section 23A of the Federal Reserve Act imposes quantitative and qualitative limits on transactions between a bank and any affiliate and requires certain levels of collateral for such loans. It also limits the amount of advances to third parties which are collateralized by the securities or obligations of the Company. Section 23B of the Federal Reserve Act requires that certain transactions between the Company’s subsidiary bank and its affiliates must be on terms substantially the same, or at least as favorable, as those prevailing at the time for comparable transactions with or involving other nonaffiliated companies.
8
Community Reinvestment Act
The Community Reinvestment Act and its corresponding regulations are intended to encourage banks to help meet the credit needs of the communities they serve, including low and moderate income neighborhoods, consistent with safe and sound banking practices. These regulations provide for regulatory assessment of a bank’s record in meeting the credit needs of its market area. Federal banking agencies are required to publicly disclose each bank’s rating under the Community Reinvestment Act. The Federal Reserve considers a bank’s Community Reinvestment Act rating when the bank submits an application to establish bank branches, merge with another bank, or acquire the assets and assume the liabilities of another bank. In the case of a financial holding company, the Community Reinvestment Act performance record of all banks involved in a merger or acquisition are reviewed in connection with the application to acquire ownership or control of shares or assets of a bank or to merge with another bank or bank holding company. An unsatisfactory record can substantially delay or block a transaction. We received a satisfactory rating on our most recent Community Reinvestment Act assessment.
Anti-Money Laundering
The USA PATRIOT Act provides the federal government with additional powers to address terrorist threats through enhanced domestic security measures, expanded surveillance powers, increased information sharing and broadened anti-money laundering requirements. By way of amendments to the Bank Secrecy Act, or BSA, the USA PATRIOT Act puts in place measures intended to encourage information sharing among bank regulatory and law enforcement agencies. In addition, certain provisions of the USA PATRIOT Act impose affirmative obligations on a broad range of financial institutions.
The USA PATRIOT Act and the related Federal Reserve regulations require banks to establish anti-money laundering programs that include, at a minimum:
| ● | internal policies, procedures and controls designed to implement and maintain the savings association’s compliance with all the requirements of the USA PATRIOT Act, the BSA and related laws and regulations; |
| ● | systems and procedures for monitoring and reporting of suspicious transactions and activities; a designated compliance officer; |
| ● | employee training; |
| ● | an independent audit function to test the anti-money laundering program; |
| ● | procedures to verify the identity of each client upon the opening of accounts; and |
| ● | heightened due diligence policies, procedures, and controls applicable to certain foreign accounts and relationships. |
Additionally, the USA PATRIOT Act requires each financial institution to develop a customer identification program, or CIP, as part of its anti-money laundering program. The key components of the CIP are identification, verification, government list comparison, notice and record retention. The purpose of the CIP is to enable the financial institution to determine the identity and anticipated account activity of each customer. To make this determination, among other things, the financial institution must collect certain information from customers at the time they enter the customer relationship with the financial institution. This information must be verified within a reasonable time. Furthermore, all customers must be screened against any CIP-related government lists of known or suspected terrorists. On May 11, 2018, the United States Treasury’s Financial Crimes Enforcement Network issued a final rule under the BSA requiring banks to identify and verify the identity of the natural persons behind their customers that are legal entities — the beneficial owners. We and our affiliates have adopted policies, procedures and controls designed to comply with the BSA and the USA PATRIOT Act.
Moreover, South Florida has been designated as a “High Intensity Financial Crime Area,” or HIFCA, by FinCEN and a “High Intensity Drug Trafficking Area,” or HIDTA, by the Office of National Drug Control Policy. The HIFCA program is intended to concentrate law enforcement efforts to combat money laundering efforts in higher-risk areas. The
9
HIDTA designation makes it possible for local agencies to benefit from ongoing HIDTA-coordinated program initiatives that are working to reduce drug use. There is also increased scrutiny of compliance with the sanctions programs and rules administered and enforced by the Treasury Department’s Office of Foreign Assets Control.
Consumer Laws and Regulations
The Bank is also subject to other federal and state consumer laws and regulations that are designed to protect consumers in transactions with banks. While the list set forth below is not exhaustive, these laws and regulations include the Truth in Lending Act, the Truth in Savings Act, the Electronic Funds Transfer Act, the Expedited Funds Availability Act, the Check Clearing for the 21st Century Act, the Fair Credit Reporting Act, the Fair Debt Collection Practices Act, the Equal Credit Opportunity Act, the Fair Housing Act, the Home Mortgage Disclosure Act, the Fair and Accurate Credit Transactions Act, the Mortgage Disclosure Improvement Act, and the Real Estate Settlement Procedures Act, among others. These laws and regulations mandate certain disclosure requirements and regulate the manner in which financial institutions must deal with clients when taking deposits or making loans to such clients. The Bank must comply with the applicable provisions of these consumer protection laws and regulations as part of its ongoing client relations.
In addition, the Consumer Financial Protection Bureau issues regulations and standards under these federal consumer protection laws that affect our consumer businesses. These include regulations setting “ability to repay” standards for residential mortgage loans and mortgage loan servicing and originator compensation standards, which generally require creditors to make a reasonable, good faith determination of a consumer’s ability to repay any consumer credit transaction secured by a dwelling (excluding an open-end credit plan, timeshare plan, reverse mortgage, or temporary loan) and establishes certain protections from liability under this requirement for loans that meet the requirements of the “qualified mortgage” safe harbor. In addition, on October 3, 2015, the new TILA-RESPA Integrated Disclosure, or TRID, rules for mortgage closings took effect for new loan applications. The new TRID rules were further amended in 2017.
Coronavirus Pandemic
In early March 2020, it became apparent that novel coronavirus COVID-19 was going to have a negative impact in the United States and the Company began preparing for potential disruptions and government limitations of activity in the markets in which we serve. This included testing of our remote access systems and enhancing awareness to our digital banking offerings. We believe that our investments in technology, digital platforms, and electronic banking should allow our customers and employees to transact business even during times of uncertainty. We also increased our oversight and analysis of credits in vulnerable industries such as hotels and hospitality in an attempt to improve loan performance and reduce credit risk. Given the fluidity of the situation, the duration and broader impact of the COVID-19 pandemic on the extended economy, financial markets, and our business remain unknown.
In response to the COVID-19 pandemic, we updated operating protocols to ensure the virtual availability of our banking services, while prioritizing the health and safety of clients and associates. Our associates, support teams and management largely continue to work remotely; however, associates located in the Company's corporate offices and operations centers began to gradually return to those locations at reduced capacity levels in the third and fourth quarter of 2020. We continue to focus on enhancing remote, mobile, and online processes.
To assist clients during the COVID-19 pandemic, the Company implemented distinct COVID-19 relief programs to provide payment deferral and other waivers. The Bank redeployed associate resources to rapidly meet the influx of requests in response to the passage of the CARES Act, and the establishment of the Paycheck Protection Program (“PPP”). As of December 31, 2020, we had 1,296 active PPP loans remaining totaling $190.0 million gross.
Further, during the year ended December 31, 2020, we had $199.8 million in loans for which repayment was deferred to provide relief to borrowers adversely impacted by the COVID-19 pandemic. These deferrals consisted of $61.3 million of loans in which borrowers were temporarily making interest-only payments and $117.8 million of loans in which borrowers were provided temporary relief from full principal and interest payments.
10
Implications of Being an Emerging Growth Company
We are an “emerging growth company” as defined in the Jumpstart Our Business Startups Act of 2012, or the JOBS Act. As an emerging growth company, we may take advantage of specified reduced disclosure and other requirements that are otherwise applicable generally to public companies.
We may take advantage of these exemptions up until the last day of the fiscal year following the fifth anniversary of our initial public (which will be on June 30, 2025) or such earlier time that we are no longer an emerging growth company. We would cease to be an emerging growth company earlier if we have more than $1.07 billion in annual revenue, we have more than $700.0 million in market value of our stock held by non-affiliates (and we have been a public company for at least 12 months and have filed one Annual Report on Form 10-K) or we issue more than $1 billion of non-convertible debt securities over a three-year period. We may choose to take advantage of some, but not all, of the available exemptions. We have taken advantage of certain reduced reporting obligations in this Annual Report on Form 10-K. These include an attestation of our internal controls, as required by Section 404(b) of the Sarbanes-Oxley Act, and scaled disclosures in our MD&A and Selected Financial Data which exclude periods prior to the earliest period presented in our initial registration statements. Accordingly, the information contained herein may be different than the information you receive from other public companies in which you hold stock.
In addition, the JOBS Act provides that an emerging growth company can take advantage of an extended transition period for complying with new or revised accounting standards. This allows an emerging growth company to delay the adoption of certain accounting standards until those standards would otherwise apply to private companies. We have elected to avail ourselves of this exemption and, therefore, while we are an emerging growth company we will not be subject to new or revised accounting standards at the same time that they become applicable to other public companies that are not emerging growth companies.
Human Capital Resources
The Company respects and values diversity throughout our organization and the community. Diversity and inclusion are integral parts of our organization’s culture. We seek the active engagement and participation of people with multiple backgrounds and ethnicities. We are taking steps to create programs to ensure that we are organized in a way where the unique contributions of each individual in the Company is recognized and supported. Each team member is to be treated fairly with equal access to opportunities and resources for success. We are developing programs programs to attract, develop and retain talented individuals in the communities we serve, such as an Employee Engagement Group, which is tasked with ensuring diversity, interaction, ideas for community involvement, charitable activities, work process improvement, and feedback on issues and concerns. We are developing programs that facilitate socially conscious relationships and address the needs of our communities. Additionally, we run homebuyer educational and financial literacy workshops in an effort to reach the financing needs of our communities.
We are committed and focused on the health and safety of our team members, customers, and communities. In response to the COVID-19 pandemic, we updated operating protocols to ensure the virtual availability of our banking services, while prioritizing the health and safety of clients and team members. Our team members, support teams, and management largely continue to work remotely; however, associates located in the Company's corporate offices and operations centers began to gradually return to those locations at reduced capacity levels in the third and fourth quarter of 2020. We continue to focus on enhancing remote, mobile, and online processes. Despite such continued uncertainty, the health and well-being of our team members and customers will always be a priority.
Summary of Risk Factors
COVID-19 Risks
| ● | We granted payment deferrals to borrowers that experienced financial hardship due to the COVID-19 pandemic. If those borrowers are unable to resume making payments the Company will experience an increase in non-accrual loans, which could adversely affect our earnings and financial condition. |
11
| ● | We may experience losses, expenses, and reputational harm arising out of the origination of PPP loans. |
Risks Related to the Economy, Financial Markets
| ● | Our business operations and lending activities are concentrated in South Florida, which makes us more sensitive to adverse changes in the local economy than our more geographically diversified competitors. |
| ● | Weak economic conditions could adversely affect our business and operations. |
Credit Risks
| ● | Our allowance for loan losses may not be sufficient to absorb potential losses in our loan portfolio. |
| ● | We may not be able to manage our credit risk adequately, which could lead to unexpected losses. |
| ● | Appraisals and other valuation techniques we use in evaluating and monitoring loans secured by real property may not accurately reflect the net value of the collateral. |
| ● | We engage in lending secured by real estate and may be forced to foreclose on and own the underlying real estate, subjecting us to the costs and potential risks, including environmental liabilities, associated with the ownership of real property. Further consumer protection initiatives or changes in state or federal law may substantially raise the cost of foreclosure or prevent us from foreclosing. |
| ● | Our financial condition, earnings, and asset quality could be adversely affected if we are required to repurchase loans originated for sale. |
Risks Related to Interest Rates and Liquidty
| ● | We may incur losses if we are unable to successfully manage interest rate risk. |
| ● | We could recognize losses on investment securities held in our securities portfolio. |
| ● | Changes to and replacement of the LIBOR Benchmark Interest Rate may adversely affect our business, financial condition, and results of operations. |
| ● | A lack of liquidity could impair our ability to fund operations and adversely impact our business, financial condition, and results of operations. |
Operational Risks
| ● | Natural disasters and severe weather events in Florida, including hurricanes, can have an adverse impact on our business, financial condition, and operations. |
| ● | We face strong competition from financial services companies and other companies that offering banking services. |
| ● | We may be unable to attract and retain highly qualified personnel, which could adversely and materially affect our competitive position. |
| ● | We rely heavily on our executive management team and we could be adversely affected by the unexpected loss of their services. |
| ● | System failure or breaches of our network security could subject us to increased operating costs as well as litigation and other potential losses. |
| ● | We have a continuing need for technological change, and we may not have the resources to implement new technology effectively. |
| ● | We are subject to certain operational risks, including, but not limited to, client, employee or third-party fraud and data processing system failures and errors. |
Strategic Risks
| ● | We may not effectively execute on our expansion strategy, which may adversely affect our ability to maintain our historical growth and earnings trends. |
| ● | We may grow through mergers or acquisitions, a strategy which may not be successful or, if successful, may produce risks in integrating and managing the merged or acquired companies and may dilute our shareholders. |
12
| ● | We may not efficiently or effectively create an internal control environment. A failure to maintain effective internal control over financial reporting could impair the reliability of our financial statements, which could harm our business, impair investor confidence and our access to the capital markets, cause the price of our Class A Common Stock to decline, and subject us to regulatory penalties. |
Financial Statement Risks
| ● | The accuracy of our financial statements and related disclosures could be affected if the judgments, assumptions or estimates used in our critical accounting policies are inaccurate. |
| ● | We have identified a material weakness in our internal control over financial reporting, and we cannot assure you that additional material weaknesses or significant deficiencies will not occur in the future. |
| ● | Changes in accounting standards or regulatory interpretations of existing standards could materially impact our financial statements and disclosures. |
Regulatory and Government Risks
| ● | We operate in a highly regulated environment, and the laws and regulations that govern our operations, lending activities, corporate governance, executive compensation and accounting principles, or changes in them, or our failure to comply with them, could adversely affect us. |
| ● | Legislative and regulatory actions taken now or in the future may increase our costs and impact our business, governance structure, financial condition, or results of operations. |
| ● | Federal banking agencies periodically conduct examinations of our business, including compliance with laws and regulations. Our failure to comply with any supervisory actions to which we are or become subject could adversely affect us. |
| ● | Increases in FDIC insurance premiums could adversely affect our earnings and results of operations. |
| ● | The Federal Reserve may require us to commit capital resources to support the Bank. |
| ● | Monetary policies and regulations of the Federal Reserve could adversely affect our business, financial condition, and results of operations. |
| ● | We are dependent upon the Bank for cash flow, and the Bank’s ability to make cash distributions and pay dividends is subject to restrictions. |
Other Risks
| ● | The market price of our Class A Common Stock may be subject to substantial fluctuations, which may make it difficult for you to sell your shares at the volume, prices, and times desired. |
An investment in our common stock is subject to risks inherent in our business. The following discussion highlights the risks that management believes are material for our Company, but do not necessarily include all the risks that we may face. You should carefully consider the risk factors and uncertainties described below and elsewhere in this Annual Report on Form 10-K in evaluating an investment in our common stock.
Risks Related to the COVID-19 Pandemic
The recent global COVID-19 pandemic has led to significant economic uncertainty and if prolonged could adversely harm our customers and our future results of operations.
The COVID-19 pandemic continues to negatively impact economic and commercial activity and financial markets, both globally and within the United States. Early in the pandemic, stay-at-home orders, travel restrictions and closure of non-essential businesses resulted in significant business and operational disruptions, including business closures, supply chain disruptions, and mass layoffs and furloughs. Though these early restrictions have generally been lifted or eased, continuing capacity restrictions and health and safety recommendations that discourage travel and encourage continued physical distancing and teleworking have limited the ability of businesses to return to pre-pandemic levels of activity and employment. To date, the COVID-19 pandemic has:
13
| ● | caused some of our borrowers to be unable to meet existing payment obligations, particularly those borrowers disproportionately affected by business closures and travel restrictions, such as those operating in the travel, lodging, and retail, industries; |
| ● | caused us to increase its allowance for credit losses; and |
| ● | caused changes in consumer and business spending, borrowing, and saving habits, which has affected the demand for loans and other products and services we offer, as well as the creditworthiness of potential and current borrowers. |
Moreover, we face increased technology and operational risk as a result of a significant number of non-branch personnel working remotely. Such risks include technology controls not working as effectively and operational procedures and controls not being as effective or effectively adhered to in a remote work environment.
Certain actions taken by United States or other governmental authorities, including the Federal Reserve, that are intended to mitigate the macroeconomic effects of the COVID-19 pandemic may cause additional harm to our business. In March 2020, the Federal Open Market Committee of the Federal Reserve reduced the target range for the federal funds rate to between 0.0% and 0.25%, compared to the previous target of between 1.00% and 1.25%. Decreases in short-term interest rates have a negative impact on our results, as we have certain assets that are sensitive to changes in interest rates.
The extent to which the COVID-19 pandemic will ultimately affect our business is unknown and will depend, among other things, on the duration of the pandemic, the actions undertaken by national, state and local governments and health officials to contain the virus or mitigate its effects, the safety and effectiveness of the vaccines that have been developed and the ability of pharmaceutical companies and governments to manufacture and distribute those vaccines, the ability of these vaccines to prevent both transmission and infection, including with respect to new variants of the virus that causes COVID-19, and how quickly and to what extent economic conditions improve and normal business and operating conditions resume. The longer the pandemic persists, the more pronounced the ultimate effects are likely to be.
The continuation of the COVID-19 pandemic and the efforts to contain the virus, including business restrictions and continued social distancing, could:
| ● | result in increases in loan delinquencies, problem assets, and foreclosures; |
| ● | cause the value of collateral for loans, especially real estate, to decline in value; |
| ● | reduce the availability and productivity of our employees, including our executive officers, we may not be successful in finding and integrating suitable successors in the event of key employee loss or unavailability; |
| ● | negatively impact the business and operations of third-party service providers that perform critical services for our business; and |
| ● | cause the net worth and liquidity of loan guarantors to decline, impairing their ability to honor commitments to us. |
Any one or a combination of the above events could have a material, adverse effect on our business, financial condition, and results of operations.
We have granted payment deferrals to borrowers that have experienced financial hardship due to COVID-19, and if those borrowers are unable to resume making payments the Company will experience an increase in non-accrual loans, which could adversely affect our earnings and financial condition.
Consistent with the public encouragement from federal and state financial institution regulators during the COVID-19 pandemic in the United States, we worked constructively with borrowers who experienced financial hardship because of the pandemic. Our efforts include negotiating accommodations or forbearance arrangements that temporarily reduce or defer the borrowers’ monthly payments due to us. Generally, these accommodations are for three to six months and allow customers to temporarily cease making principal and/or interest payments. In some cases, we have provided
14
borrowers second accommodations. During the year ended December 31, 2020, we approved $199.8 million in payment relief modifications that were granted under the CARES Act guidance associated with the treatment of TDRs. Since the inception of the CARES Act, $187.8 million of these loans either have been reinstated to their original payment terms or have been paid off. Upon the expiration of the deferral period, borrowers are required to resume making previously scheduled loan payments. If borrowers are unable to make timely loan payments after their deferral period ends, their loans will be classified. An increase in classified loans could cause the Company to increase its allowance for credit losses, which would adversely affect the Company’s earnings and financial condition.
We may experience losses, additional expense and reputational harm arising out of the origination of PPP loans.
The Company, through the Bank, is a participant in the Payroll Protection Program (“PPP”). As of December 31, 2020, the Company had originated $226.2 million of PPP loans representing 1,506 small business loans to borrowers. Under the PPP, small businesses, other entities, and individuals can apply for loans from existing SBA lenders and other approved regulated lenders that enroll in the program, subject to numerous limitations and eligibility criteria. The Bank is participating as a lender in the PPP. We may incur losses on PPP loans if the loans are not forgiven, the borrower’s default, the SBA does not honor its guarantee due to an error made by us in making the loan, and/or the ineligibility of the borrower or otherwise. In addition, we may experience reputational harm arising out of our origination of PPP loans because of reports of borrower fraud, concerns about whether small businesses sufficiently benefited from the program, and government administration of the loan forgiveness process. Because of the short timeframe between the passing of the CARES Act and the opening of the PPP, there is ambiguity in the laws, rules, and guidance regarding the operation of the PPP, which exposes the Company to risks relating to noncompliance with the PPP. Further, there have been lawsuits, including one against the Bank, alleging that various PPP lenders improperly prioritized existing customers when those lenders approved PPP loans and that various PPP lenders failed to pay required agency fees to third parties who allegedly assisted businesses with PPP loan applications. We may experience additional expense and reputational harm arising out of the Bank’s origination of PPP loans in defense of such lawsuits.
Risks Related to the Economy, Financial Markets
Our business operations and lending activities are concentrated in South Florida, and we are more sensitive to adverse changes in the local economy than our more geographically diversified competitors.
Unlike many of our larger competitors that maintain significant operations located outside of our market area, the majority of our clients are concentrated in South Florida. In addition, we have a high concentration of loans secured by real estate located in South Florida. As of December 31, 2020, approximately $1.3 billion, or 75.5%, of our loans, included real estate as a component of collateral. Additionally, approximately 90.1% of our real estate loans have real estate collateral located in South Florida. Therefore, our success depends upon the general economic conditions in this area, which may differ from the economic conditions in other areas of the United States or the United States generally.
Our real estate collateral provides an alternate source of repayment in the event of default by the borrower; however, the value of the collateral may decline during the time the credit is outstanding. The concentration of our loans in the South Florida area subjects us to risk that a downturn in the economy or recession in this area could result in a decrease in loan originations and increases in delinquencies and foreclosures, which would have a greater effect on us than if our lending were more geographically diversified. If we are required to liquidate the collateral securing a loan during a period of reduced real estate values to satisfy the debt, our earnings and capital could be adversely affected. Moreover, since a large portion of our portfolio is secured by properties located in South Florida, the occurrence of a natural disaster, such as a hurricane or flood, or a man-made disaster could result in a decline in loan originations, a decline in the value or destruction of mortgaged properties and an increase in the risk of delinquencies, foreclosures or loss on loans originated by us. We may suffer further losses due to the decline in the value of the properties underlying our mortgage loans, which would have an adverse impact on our results of operations and financial condition.
As a result, our operations and profitability may be more adversely affected by a local economic downturn in South Florida than those of our more geographically diverse competitors. A downturn in the local economy generally may lead to loan losses that are not offset by operations in other markets; it may also reduce the ability of our clients to grow or maintain their deposits with us. For these reasons, any regional or local economic downturn that affects South Florida, or
15
existing or prospective borrowers or depositors in South Florida, could have a material adverse effect on our business, financial condition, and results of operations. From time to time, our Bank may provide financing to clients who live or have companies or properties located outside our core market. In such cases, we would face similar local market risk in those communities for these clients.
Our business and operations may be adversely affected in numerous and complex ways by weak economic conditions.
Our business and operations, which primarily consist of lending money to clients in the form of loans, borrowing money from clients in the form of deposits, and investing in securities, are sensitive to general business and economic conditions in the United States. In recent years there has been a gradual improvement in the United States economy as evidenced by a rebound in the housing market, lower unemployment, and higher equity capital markets; however, economic growth has been uneven, and opinions vary on the strength and direction of the economy. If the United States economy weakens (as is possible due to changing conditions being caused by the COVID-19 pandemic and the response thereto), our growth and profitability from our lending, deposit and investment operations could be adversely affected. Uncertainty about the federal fiscal policymaking process, the medium- and long-term fiscal outlook of the federal government and future tax rates are concerns for United States businesses, consumers, and investors. Uncertainties also have arisen regarding the potential for a reversal or renegotiation of international trade agreements and the impact such actions and other policies the new administration may have on economic and market conditions. Such market instability may hinder future United States economic growth, which could adversely affect our assets, business, cash flow, financial condition, liquidity, prospects, and results of operations.
Credit Risks
Our allowance for loan losses may not be sufficient to absorb potential losses in our loan portfolio.
We maintain an allowance for loan losses that represents management’s judgment of probable losses and risks inherent in our loan portfolio. As of December 31, 2020, our allowance for loan losses totaled $16.3 million, which represented approximately 1.10% of our total loans, net of overdrafts and excluding PPP loans (non-GAAP, see Explanation of Certain Unaudited Non-GAAP Financial Measures). The level of the allowance reflects management’s continuing evaluation of general economic conditions, present political and regulatory conditions, diversification and seasoning of the loan portfolio, historic loss experience, identified credit problems, delinquency levels, and adequacy of collateral. Determining the appropriate level of our allowance for loan losses is inherently subjective and requires management to make significant estimates of and assumptions regarding current credit risks and future trends, all of which may undergo material changes.
Inaccurate management assumptions, the deterioration of economic conditions affecting borrowers, new information regarding existing loans, identification, or the deterioration of additional problem loans, acquisition of problem loans and other factors (including third-party review and analysis), both within and outside of our control, may require us to increase our allowance for loan losses. In addition, our regulators, as an integral part of their periodic examinations, review our methodology for calculating, and the adequacy of, our allowance for loan losses and may direct us to make additions to the allowance based on their judgments about information available to them at the time of their examination. Further, if actual charge-offs in future periods exceed the amounts allocated to our allowance for loan losses, we may need additional provisions for loan losses to restore the adequacy of our allowance for loan losses. Finally, the measure of our allowance for loan losses depends on the adoption and interpretation of accounting standards. The Financial Accounting Standards Board, or FASB, recently issued a new credit impairment model, the Current Expected Credit Loss, or CECL model, which is expected to become applicable to us on January 1, 2023, after the FASB elected to delay implementation for smaller reporting companies. CECL will require financial institutions to estimate and develop a provision for credit losses over the lifetime of the loan at origination, as opposed to reserving for incurred or probable losses up to the balance sheet date. Under the CECL model, credit deterioration would be reflected in the income statement in the period of origination or acquisition of a loan, with changes in expected credit losses due to further credit deterioration or improvement reflected in the periods in which the expectation changes. Accordingly, the CECL model could require financial institutions, like the Bank, to increase their allowances for loan losses. Moreover, the CECL model may create more volatility in our level of allowance for loan losses. If we are required to materially increase our
16
level of allowance for loan losses for any reason, such increase could adversely affect our business, prospects, cash flow, liquidity, financial condition, and results of operations.
We may not be able to manage our credit risk adequately, which could lead to unexpected losses.
Our primary business involves making loans to clients. The business of lending is inherently risky because the principal of or interest on the loan may not be repaid timely or at all or the value of any collateral supporting the loan may be insufficient to cover our outstanding exposure. These risks may be affected by the strength of the borrower’s business sector and local, regional, and national market and economic conditions. Many of our loans are made to small to medium sized businesses that may be less able to withstand competitive, economic, and financial pressures than larger borrowers. Our risk management practices, such as monitoring the concentration of our loans within specific industries, and our credit approval practices may not adequately reduce credit risk. Further, our credit administration personnel, policies and procedures may not adequately adapt to changes in economic or any other conditions affecting clients and the quality of the loan portfolio. A failure to effectively manage credit risk associated with our loan portfolio could lead to unexpected losses and have an adverse effect on our business, financial condition, and results of operations.
Our commercial real estate and real estate construction loan portfolio exposes us to credit risks that may be greater than the risks related to other types of loans.
As of December 31, 2020, approximately $777.8 million, or 46.7%, of our loan portfolio was comprised of nonresidential real estate loans (including owner-occupied commercial real estate loans) and approximately $99.9 million, or 6.0%, of our total loans held for investment were construction and development loans. Further, as of December 31, 2020, our commercial real estate loans (excluding owner-occupied commercial real estate loans) totaled 33.5% and our construction and development loans totaled 6.8% of our total risk-weighted assets, respectively. These loans typically involve repayment that depends upon income generated, or expected to be generated, by the property securing the loan and may be adversely affected by changes in the economy or local market conditions. These loans expose a lender to the risk of having to liquidate the collateral securing these loans at times when there may be significant fluctuation of commercial real estate values. Unexpected deterioration in the credit quality of our commercial real estate loan portfolio could require us to increase our allowance for loan losses, which would reduce our profitability and could have an adverse effect on our business, financial condition, and results of operations.
Construction loans also involve risks because loan funds are secured by a project under construction, the value of which is uncertain prior to completion. It can be difficult to accurately evaluate the total funds required to complete a project, and construction lending often involves the disbursement of substantial funds with repayment dependent, in part, on the success of the ultimate project rather than the ability of a borrower or guarantor to repay the loan. If we are forced to foreclose on a project prior to completion, we may be unable to recover the entire unpaid portion of the loan. In addition, we may be required to fund additional amounts to complete a project, incur taxes, maintenance and compliance costs for a foreclosed property and may have to hold the property for an indeterminate period of time, any of which could adversely affect our business, prospects, cash flow, liquidity, financial condition and results of operations.
A portion of our loan portfolio is comprised of commercial loans secured by receivables, inventory, equipment or other commercial collateral, the deterioration in value of which could expose us to credit losses.
As of December 31, 2020, approximately $206.7 million, or 12.4%, of our total loans held for investment were commercial (excluding PPP) loans to businesses. In general, these loans are collateralized by general business assets, including, among other things, accounts receivable, inventory and equipment, and most are backed by a personal guaranty of the borrower or principal. These commercial loans are typically larger in amount than loans to individuals and, therefore, have the potential for larger losses on a single loan basis. Additionally, the repayment of commercial loans is subject to the ongoing business operations of the borrower. The collateral securing such loans generally includes movable property such as equipment and inventory, which may decline in value more rapidly than we anticipate, exposing us to increased credit risk. Significant adverse changes in the economy or local market conditions in which our commercial lending clients operate could cause rapid declines in loan collectability and the values associated with general business assets resulting in inadequate collateral coverage that may expose us to credit losses and could adversely affect our business, prospects, cash flow, liquidity, financial condition, and results of operations.
17
Appraisals and other valuation techniques we use in evaluating and monitoring loans secured by real property may not accurately reflect the net value of the collateral.
In considering whether to make a loan secured by real property, we generally require an appraisal of the property; however, an appraisal is only an estimate of the value of the property at the time the appraisal is made and, as real estate values may change significantly in value in relatively short periods of time (especially in periods of heightened economic uncertainty), the appraisal may not accurately describe the net value of the real property collateral after the loan is made. As a result, we may not be able to recover the full amount of any remaining indebtedness when we foreclose on and sell the relevant property, which could have an adverse effect on our business, financial condition, and results of operations.
We engage in lending secured by real estate and may be forced to foreclose on the collateral and own the underlying real estate, subjecting us to the costs and potential risks associated with the ownership of real property, or consumer protection initiatives or changes in state or federal law may substantially raise the cost of foreclosure or prevent us from foreclosing at all.
Since we originate loans secured by real estate, we may have to foreclose on the collateral property to protect our investment and may thereafter own and operate such property, in which case we would be exposed to the risks inherent in the ownership of real estate. The dollar amount that we, as a mortgagee, may realize after a foreclosure depends on factors outside of our control, including, but not limited to, general or local economic conditions, environmental cleanup liabilities, assessments, interest rates, real estate tax rates, operating expenses of the mortgaged properties, our ability to obtain and maintain adequate occupancy of the properties, zoning laws, governmental and regulatory rules, and natural disasters. Our inability to manage the amount of costs or size of the risks associated with the ownership of real estate, or write-downs in the value of other real estate owned, or OREO, could have an adverse effect on our business, financial condition, and results of operations.
Additionally, consumer protection initiatives or changes in state or federal law may substantially increase the time and expenses associated with the foreclosure process or prevent us from foreclosing at all. A number of states in recent years have either considered or adopted foreclosure reform laws that make it substantially more difficult and expensive for lenders to foreclose on properties in default. Additionally, federal regulators have prosecuted a number of mortgage servicing companies for alleged consumer law violations. If new state or federal laws or regulations are ultimately enacted that significantly raise the cost of foreclosure or raise outright barriers, they could have an adverse effect on our business, financial condition, and results of operations.
Our financial condition, earnings and asset quality could be adversely affected if we are required to repurchase loans originated for sale.
We originate residential mortgage loans for sale to secondary market investors, subject to contractually specified and limited recourse provisions. Because the loans are intended to be originated within investor guidelines, using designated automated underwriting and product-specific requirements as part of the loan application, the loans sold have a limited recourse provision. In general, we may be required to repurchase a previously sold mortgage loan or indemnify an investor if there is non-compliance with defined loan origination or documentation standards including fraud, negligence, material misstatement in the loan documents, or non-compliance with applicable law. In addition, we may have an obligation to repurchase a loan if the mortgagor has defaulted early in the loan term or return profits made should the loan prepay within a short period. The potential mortgagor early default repurchase period is up to approximately 12 months after sale of the loan to the investor. The recourse period for fraud, material misstatement, breach of representations and warranties, non-compliance with law or similar matters could be as long as the term of the loan. Mortgages subject to recourse are collateralized by single-family residential properties. From January 1, 2013, through December 31, 2020, we have not repurchased any loans due to default, fraud, breach of representations, material misstatement, legal non-compliance, or early prepayment. Should such loan repurchases become a material issue, our earnings and asset quality could be adversely impacted, which could adversely impact business, financial condition, and results of operations.
18
We may be subject to environmental liabilities in connection with the real properties we own and the foreclosure on real estate assets securing our loan portfolio.
In the course of our business, we may foreclose on and take title to real estate or otherwise be deemed to be in control of property that serves as collateral on loans we make. As a result, we could be subject to environmental liabilities with respect to those properties. We may be held liable to governmental entities or to third parties for property damage, personal injury, investigation and clean-up costs incurred by these parties in connection with environmental contamination, or we may be required to investigate or clean up hazardous or toxic substances or chemical releases at a property. The costs associated with investigation or remediation activities could be substantial. In addition, if we are the owner or former owner of a contaminated site, we may be subject to common law claims by third parties based on damages and costs resulting from environmental contamination emanating from the property.
The cost of removal or abatement may substantially exceed the value of the affected properties or the loans secured by those properties, we may not have adequate remedies against the prior owners or other responsible parties with respect to such matters and we may not be able to resell the affected properties either before or after completion of any such removal or abatement procedures. Other actions we may take to minimize the impact of environmental liabilities may not fully insulate us from such liabilities. Furthermore, despite these actions on our part, the value of the property as collateral will generally be substantially reduced or we may elect not to foreclose on the property and, as a result, we may suffer a loss upon collection of the loan. Any significant environmental liabilities could have an adverse effect on our business, financial condition, and results of operations.
Risks Related to Interest Rates and Liquidity
We may incur losses if we are unable to successfully manage interest rate risk.
Our profitability depends to a large extent on Professional Bank’s net interest income, which is the difference between income on interest earning assets, such as loans and investment securities, and expense on interest-bearing liabilities such as deposits and borrowings. Our net interest income may be reduced if: (i) more interest earning assets than interest-bearing liabilities reprice or mature during a time when interest rates are declining or (ii) more interest-bearing liabilities than interest earning assets reprice or mature during a time when interest rates are rising.
Changes in the difference between short-term and long-term interest rates may also harm our business, and we are unable to predict changes in market interest rates, which are affected by many factors beyond our control. We generally use short-term deposits to fund longer-term assets, such as loans. When interest rates change, assets and liabilities with shorter terms reprice more quickly than those with longer terms, which could have a material adverse effect on our net interest margin. If market interest rates rise rapidly, interest rate adjustment caps may also limit increases in the interest rates on adjustable-rate loans, which could further reduce our net interest income. Additionally, continued price competition for deposits will adversely affect our net interest margin.
Additionally, interest rate increases often result in larger payment requirements for our borrowers with variable rate loans, which increases the potential for default and could result in a decrease in the demand for loans. At the same time, the marketability of the property securing a loan may be adversely affected by any reduced demand resulting from higher interest rates. An increase in interest rates that adversely affects the ability of borrowers to pay the principal or interest on loans may lead to an increase in nonperforming assets and a reversal of income previously recognized, which could have an adverse effect on our results of operations and cash flows. Further, when we place a loan on nonaccrual status, we reverse any accrued but unpaid interest receivable, which decreases interest income. At the same time, we continue to incur costs to fund the loan, which is reflected as interest expense, without any interest income to offset the associated funding expense. Thus, an increase in the amount of nonperforming assets would have an adverse impact on net interest income.
In a declining interest rate environment, there may be an increase in prepayments on loans as borrowers refinance their loans at lower rates. In addition, in a low interest rate environment, loan clients often pursue long-term fixed rate credits, which could adversely affect our earnings and net interest margin if rates later increase. If short-term interest rates remain at their historically low levels for a prolonged period and assuming longer-term interest rates fall further, we
19
could experience net interest margin compression as our interest earning assets would continue to reprice downward while our interest-bearing liability rates could fail to decline in tandem. Such an occurrence would have an adverse effect on our net interest income and could have an adverse effect on our business, financial condition, and results of operations.
We could recognize losses on investment securities held in our securities portfolio, particularly if interest rates increase or economic and market conditions deteriorate.
While we generally invest a significant majority of our total assets in loans (our loan to asset ratio was 81.0% as of December 31, 2020), we also invest a portion of our total assets (4.6% as of December 31, 2020) in investment securities with the primary objectives of providing a source of liquidity, providing an appropriate return on funds invested, managing interest rate risk, meeting pledging requirements and meeting regulatory capital requirements. As of December 31, 2020, the fair value of our available for sale investment securities portfolio was $87.5 million, which included a net unrealized gain of approximately $1.2 million.
Factors beyond our control can significantly and adversely influence the fair value of securities in our portfolio. For example, fixed-rate securities are generally subject to decreases in market value when interest rates rise. Additional factors that could influence the value of the securities in our portfolio include, but are not limited to, rating agency downgrades of the securities, defaults by the issuer or individual borrowers with respect to the underlying securities and instability in the credit markets. Any of the foregoing factors could cause other-than-temporary impairment in future periods and result in realized and/or unrealized losses. The process for determining whether impairment is other-than-temporary usually requires difficult, subjective judgments about the future financial performance and liquidity of the issuer and any collateral underlying the security as well as the Company’s intent and ability to hold the security for a sufficient period of time to allow for any anticipated recovery in fair value in order to assess the probability of receiving all contractual principal and interest payments on the security. Because of changing economic and market conditions affecting interest rates, the financial condition of issuers of the securities and the performance of the underlying collateral, we may recognize realized and/or unrealized losses in future periods, which could have an adverse effect on our business, financial condition and results of operations.
Changes to and replacement of the LIBOR Benchmark Interest Rate may adversely affect our business, financial condition, and results of operations.
The Company has certain loans, interest rate swap agreements, investment securities and debt obligations whose interest rate is indexed to the London InterBank Offered Rate (LIBOR). In 2017, the United Kingdom’s Financial Conduct Authority, which is responsible for regulating LIBOR, has announced that the publication of LIBOR is not guaranteed beyond 2021. On November 30, 2020, the administrator of LIBOR announced its intention to (i) cease the publication of the one-week and two-month United States dollar LIBOR after December 31, 2021, and (ii) cease the publication of all other tenors of United States dollar LIBOR (one, three, six and 12 month LIBOR) after June 30, 2023.The Alternative Reference Rates Committee (a group of private-market participants convened by the Federal Reserve Board and the Federal Reserve Bank of New York) has identified the Secured Overnight Financing Rate, or SOFR, as the recommend alternative to LIBOR. Uncertainty as to the adoption, market acceptance or availability of SOFR or other alternative reference rates may adversely affect the value of LIBOR-based loans and securities in the Company’s portfolio and may impact the availability and cost of hedging instruments and borrowings. The language in the Company’s LIBOR-based contracts and financial instruments has developed over time and may have various events that trigger when a successor index to LIBOR would be selected. If a trigger is satisfied, contracts and financial instruments may give the Company or the calculation agent, as applicable, discretion over the selection of the substitute index for the calculation of interest rates. The implementation of a substitute index for the calculation of interest rates under the Company’s loan agreements may result in the Company incurring significant expenses in effecting the transition and may result in disputes or litigation with customers over the appropriateness or comparability to LIBOR of the substitute index, any of which could have an adverse effect on the Company’s results of operations. To mitigate the risks associated with the expected discontinuation of LIBOR, the Company has ceased originating LIBOR-linked residential mortgage loans, implemented fallback language for LIBOR-linked commercial loans, adhered to the International Swaps and Derivatives Association 2020 Fallbacks Protocol for interest rate swap agreements, and has
20
updated or is in the process of updating its systems to accommodate SOFR-linked loans. In accordance with regulatory guidance, the Company intends to stop entering new LIBOR transactions by the end of 2021.
A lack of liquidity could impair our ability to fund operations and adversely impact our business, financial condition, and results of operations.
Liquidity is essential to our business. Liquidity risk is the potential that we will be unable to meet our obligations as they come due because of an inability to liquidate assets or obtain adequate funding. We rely on our ability to generate deposits and effectively manage the repayment and maturity schedules of our loans and investment securities, respectively, to provide adequate liquidity to fund our operations. If we are unable to raise funds through deposits, borrowings, sales of our investment securities, sales of loans or other sources, it could have a substantial negative effect on our liquidity and our ability to continue our growth strategy.
Our most important source of funds is deposits. As of December 31, 2020, approximately $947.4 million, or 57.1%, of our total deposits were negotiable order of withdrawal, or NOW, savings, and money market accounts. Historically our savings, money market deposit and NOW accounts have been stable sources of funds. However, these deposits are subject to potentially dramatic fluctuations in availability or price due to factors that may be outside of our control, such as a loss of confidence by clients in us or the banking sector generally, client perceptions of our financial health and general reputation, increasing competitive pressures from other financial services firms for consumer or corporate client deposits, changes in interest rates and returns on other investment classes, any of which could result in significant outflows of deposits within short periods of time or significant changes in pricing necessary to maintain current client deposits or attract additional deposits, increasing our funding costs and reducing our net interest income and net income.
Additional liquidity may be provided by our ability to borrow from the Federal Home Loan Bank of Atlanta, or the FHLB, and the Federal Reserve Bank of Atlanta. As of December 31, 2020, we had $40.0 million of advances from the FHLB outstanding. We also may borrow funds from third-party lenders, such as other financial institutions. Our access to funding sources in amounts adequate to finance or capitalize our activities, or on terms that are acceptable to us, could be impaired by factors that affect us directly or the financial services industry or economy in general, such as disruptions in the financial markets or negative views and expectations about the prospects for the financial services industry. Our access to funding sources could also be affected by one or more adverse regulatory actions against us.
Any decline in available funding or cost of liquidity could adversely impact our ability to originate loans, invest in securities, meet our expenses, or fulfill obligations such as repaying our borrowings or meeting deposit withdrawal demands, any of which could, in turn, have an adverse effect on our business, financial condition, and results of operations.
We have several large depositor relationships, the loss of which could force us to fund our business through more expensive and less stable sources.
As of December 31, 2020, our ten largest depositors accounted for approximately $270.9 million in deposits, or approximately 16.3% of our total deposits. Withdrawals of deposits by any one of our largest depositors could force us to rely more heavily on more expensive and less stable funding sources. Consequently, the occurrence of any of these events could have a material adverse effect on our business, financial condition, and results of operations.
Operational Risks
Natural disasters and severe weather events in Florida, including hurricanes, can have an adverse impact on our business, financial condition, and operations.
Our operations and our client base are primarily located in South Florida. This region is vulnerable to natural disasters and severe weather events or acts of God, such as hurricanes or tropical storms, which can have an adverse impact on our business, financial condition, and operations, cause widespread property damage and have the potential to significantly depress the local economies in which we operate. Future adverse weather events in Florida could potentially result in extensive and costly property damage to businesses and residences, depress the value of property
21
serving as collateral for our loans, force the relocation of residents, and significantly disrupt economic activity in the region. For example, in September 2017, Hurricane Irma caused significant damage and disruption to local business operations.
We cannot predict the extent of damage that may result from such adverse weather events, which will depend on a variety of factors that are beyond our control, including, but not limited to, the severity and duration of the event, the timing and level of government responsiveness and the pace of economic recovery. In addition, the nature, frequency and severity of these adverse weather events and other natural disasters may be exacerbated by climate change. If a significant adverse weather event, or other natural disaster were to occur, it could have a materially adverse impact on our financial condition, results of operations and our business, as well as potentially increase our exposure to credit and liquidity risks.
We face strong competition from financial services companies and other companies that offer banking services.
We operate in the highly competitive financial services industry and face significant competition for clients from financial institutions located both within and beyond our current market. We compete with commercial banks, savings banks, credit unions, mortgage banking firms, consumer finance companies, securities brokerage firms, insurance companies, money market funds, non-bank financial services companies and other community banks and super-regional and national financial institutions operating within or near the areas we serve. Certain competitors often are larger, operate in more markets and have far greater resources and are able to conduct more intensive and broader-based promotional efforts to reach both commercial and individual clients. In addition, as client preferences and expectations continue to evolve, technology has lowered barriers to entry and made it possible for banks to expand their geographic reach by providing services over the internet and for non-banks to offer products and services traditionally provided by banks, such as automatic transfer and automatic payment systems.
The banking industry is experiencing rapid changes in technology and, as a result, our future success will depend in part on our ability to address our clients’ needs by using technology. Client loyalty can be influenced by a competitor’s new products, especially offerings that could provide cost savings or a higher return to the client. Increased lending activity of competing banks has also led to increased competitive pressures on loan rates and terms for high quality credits. We may not be able to compete successfully with other financial institutions in our market, and we may have to pay higher interest rates to attract deposits and accept lower yields to attract loans, resulting in lower net interest margins and reduced profitability.
Moreover, many of our non-bank competitors are not subject to the same extensive regulations that govern our activities and may have greater flexibility in competing for business. We also face strong competition from credit unions, which are exempt from the payment of income taxes and, as a result, can frequently offer lower rates on loans or pay higher rates on deposits. The financial services industry could also become even more competitive as a result of legislative, regulatory, and technological changes and continued consolidation. In addition, some of our current commercial banking clients may seek alternative banking sources as they develop needs for credit facilities larger than we may be able to accommodate. Our inability to compete successfully in the markets in which we operate could have an adverse effect on our business, financial condition, liquidity, prospects, or results of operations.
We may be unable to attract and retain highly qualified personnel, which could adversely and materially affect our competitive position.
Our future success depends on our ability to attract and retain our executive officers and other key employees. We may be unable to attract or retain qualified management and other key personnel in the future due to the intense competition for qualified personnel among companies in the financial services business and related businesses, particularly in the South Florida area in which we operate. Consequently, we could have difficulty attracting or retaining experienced personnel and may be required to spend significant time and expend significant financial resources in our employee recruitment and retention efforts. Many of the other financial services companies with which we compete for qualified personnel have greater financial and other resources and risk profiles different from ours. They also may provide more diverse opportunities and better chances for career advancement. Some of these characteristics may be more appealing to high quality candidates than that which we may offer. If we are unable to attract and retain the
22
necessary personnel to accomplish our business objectives, we may have difficulty implementing our business strategy and achieving our business objectives.
We rely heavily on our executive management team, including our Chairman and Chief Executive Officer, Daniel R. Sheehan, and other key employees, and we could be adversely affected by the unexpected loss of their services.
We are led by an experienced core management team with substantial experience in the market we serve, and our operating strategy focuses on providing products and services through long-term relationship managers and maintaining good relationships between our largest clients and our senior management team. Accordingly, our success depends in large part on the performance of these key personnel, including our Chairman and Chief Executive Officer, Daniel R. Sheehan, as well as on our ability to attract, motivate and retain highly qualified senior and middle management employees. Competition for employees is intense and the process of locating key personnel with the combination of skills and attributes required to execute our business plan may be lengthy. If any of our executive officers or other key personnel leaves us, our financial condition and results of operations may suffer due to the loss of their skills, knowledge of our market, and years of industry experience and the difficulty of promptly finding qualified personnel to replace them. Additionally, our executive officers’ and key employees’ community involvement and diverse and extensive local business relationships are important to our success.
Our operations could be interrupted if our third-party service providers experience difficulty, terminate their services or fail to comply with banking regulations.
We outsource some of our operational activities and accordingly depend on relationships with third-party providers for services such as core systems support, informational website hosting, internet services, online account opening and other processing services. Our business depends on the successful and uninterrupted functioning of our information technology and telecommunications systems, many of which also depend on third party providers. The failure of these systems, a cybersecurity breach involving any of our third-party service providers or the termination or change in terms of a third-party software license or service agreement on which any of these systems is based could interrupt our operations. Because our information technology and telecommunications systems interface with and depend on third-party systems, we could experience service denials if demand for such services exceeds capacity or such third-party systems fail or experience interruptions. Replacing vendors or addressing other issues with our third-party service providers could entail significant delay, expense, and disruption of service.
As a result, if these third-party service providers experience difficulties, are subject to cybersecurity breaches, or terminate their services, and we are unable to replace them with other service providers, particularly on a timely basis, our operations could be interrupted. If an interruption were to continue for a significant period of time, our business, financial condition, and results of operations could be adversely affected. Even if we are able to replace third-party service providers, it may be at a higher cost to us, which could adversely affect our business, prospects, cash flow, liquidity, financial condition, and results of operations.
Accordingly, our operations could be interrupted if any of our third-party service providers experience difficulty, are subject to cybersecurity breaches, terminate their services or fail to comply with banking regulations, which could adversely affect our business, financial condition and results of operations. In addition, our failure to adequately oversee the actions of our third-party service providers could result in regulatory actions against the Bank, which could adversely affect our business, prospects, cash flow, liquidity, financial condition, and results of operations.
System failure or breaches of our network security could subject us to increased operating costs as well as litigation and other potential losses.
Our computer systems and network infrastructure could be vulnerable to hardware and cybersecurity issues. Our operations are dependent upon our ability to protect our hardware equipment against damage from fire, power loss, telecommunications failure, or a similar catastrophic event. Threats to data security, including unauthorized access and cyber-attacks, rapidly emerge and change, exposing us to additional costs for protection or remediation and competing time constraints to secure our data in accordance with client expectations and statutory and regulatory requirements. We could also experience a breach by intentional or negligent conduct on the part of employees or other internal sources.
23
Any damage or failure that causes an interruption in our operations could have an adverse effect on our financial condition, and results of operations.
Our operations are also dependent upon our ability to protect our computer systems and network infrastructure, including our digital, mobile and internet banking activities, against damage from physical break-ins, cybersecurity breaches and other disruptive problems caused by the internet or other users. Such computer break-ins and other disruptions would jeopardize the security of sensitive data stored in and transmitted through our computer systems and network infrastructure, which may result in significant liability, damage our reputation and inhibit the use of our internet banking services by current and potential clients. We regularly add additional security measures to our computer systems and network infrastructure and implement procedures to mitigate the possibility of cybersecurity breaches, including firewalls and penetration testing. However, it is not feasible to defend against every risk being posed by changing technologies as well as criminals’ intent on committing cyber-crime, particularly given their increasing sophistication, and our security measures may not prevent a system breach.
Controls employed by our information technology department and third-party vendors could prove inadequate. We could also experience a breach by intentional or negligent conduct on the part of our employees or other internal sources, software bugs or other technical malfunctions, or other causes. As a result of any of these threats, our client accounts may become vulnerable to account takeover schemes or cyber-fraud. Our systems and those of our third-party vendors may also become vulnerable to damage or disruption due to circumstances beyond our or their control, such as from network failures, viruses and malware, power anomalies or outages, natural disasters, and catastrophic events. A breach of our security or that of a third-party vendor that results in unauthorized access to our data could expose us to a disruption or challenges relating to our daily operations, as well as to data loss, litigation, damages, fines and penalties, significant increases in compliance costs and reputational damage, any of which could have an adverse effect on our business, financial condition, and results of operations.
We have a continuing need for technological change, and we may not have the resources to implement new technology effectively, or we may experience operational challenges when implementing new technology or technology needed to compete effectively with larger institutions may not be available to us on a cost-effective basis.
The financial services industry is undergoing rapid technological change, with frequent introductions of new technology-driven products and services. In addition to serving clients better, the effective use of technology increases efficiency and enables financial institutions to reduce costs. Our future success will depend, at least in part, upon our ability to address the needs of our clients by using technology to provide products and services that will satisfy client demands for convenience as well as to create additional efficiencies in our operations as we continue to grow and expand our products and service offerings. We hope to address these demands through, among other things, our Digital Innovation Center and digital banking platform. However, we may experience operational and other challenges as we implement these new technologies or products, which could impair our ability to realize the anticipated benefits from such new technologies or require us to incur significant costs to meet any such challenges in a timely manner.
Many of our larger competitors have substantially greater resources to invest in technological improvements, and we may not be able to implement new technology-driven products and services timely, effectively or at all or be successful in marketing these products and services to our clients. Third parties upon whom we rely for our technology needs may not be able to develop on a cost-effective basis systems that will enable us to keep pace with such developments or we may, in order to remain competitive, be required to make significant capital expenditures, which may increase our overall expenses and have a material adverse effect on our net income. As a result, our competitors may be able to offer additional or superior products compared to those that we will be able to provide, which would put us at a competitive disadvantage. We may lose clients seeking new technology-driven products and services to the extent we are unable to provide such products and services. Accordingly, the ability to keep pace with technological change is important, and the failure to do so could adversely affect our business, prospects, cash flow, liquidity, financial condition, and results of operations.
24
We are subject to certain operational risks, including, but not limited to, client, employee or third-party fraud and data processing system failures and errors.
Employee errors and employee or client misconduct could subject us to financial losses or regulatory sanctions and seriously harm our reputation. Misconduct by our employees could include hiding unauthorized activities from us, improper or unauthorized activities on behalf of our clients or improper use of confidential information. It is not always possible to prevent employee errors and misconduct, and the precautions we take to prevent and detect this activity may not be effective in all cases. Employee errors could also subject us to financial claims for negligence.
We have implemented a system of internal controls designed to mitigate operational risks, including data processing system failures and errors and client or employee fraud, as well as insurance coverage designed to protect us from material losses associated with these risks, including losses resulting from any associated business interruption. If our internal controls fail to prevent or detect an occurrence, or if any resulting loss is not insured or exceeds applicable insurance limits, it could adversely affect our business, prospects, cash flow, liquidity, financial condition, and results of operations.
When we originate loans, we rely heavily upon information supplied by third parties, including the information contained in credit applications, property appraisals, title information, equipment pricing and valuation and employment and income documentation, in deciding which loans we will originate, as well as the terms of those loans. If any of the information upon which we rely is misrepresented, either fraudulently or inadvertently, and the misrepresentation is not detected prior to funding, the value of the loan may be significantly lower than expected, or we may fund a loan that we would not have funded or on terms that do not comply with our general underwriting standards. Whether a misrepresentation is made by the applicant, the borrower, one of our employees or another third party, we generally bear the risk of loss associated with the misrepresentation. A loan subject to a material misrepresentation is typically unsellable or subject to repurchase if it is sold prior to detection of the misrepresentation. The sources of the misrepresentations are often difficult to locate, and it is often difficult to recover any of the resulting monetary losses we may suffer, which could adversely affect our business, financial condition, and results of operations.
We are subject to claims and litigation pertaining to intellectual property.
Banking and other financial services companies, such as our Company, rely on technology companies and consultants to provide information technology products and services necessary to support their day-to-day operations. Technology companies frequently enter into litigation based on allegations of patent infringement or other violations of intellectual property rights. Competitors of our vendors, or other individuals or companies, may from time to time claim to hold intellectual property sold or assigned to us. Such claims may increase in the future as the financial services sector becomes more reliant on information technology vendors. The plaintiffs in these actions frequently seek injunctions and substantial damages.
Regardless of the scope or validity of such patents or other intellectual property rights, or the merits of any claims by potential or actual litigants, we may have to engage in protracted litigation. Such litigation is often expensive, time-consuming, disruptive to our operations, and distracting to management. If we are found to infringe on one or more patents or violate the terms of a license or infringe on other intellectual property rights, we may be required to pay substantial damages or royalties to a third party. In certain cases, we may consider entering into licensing agreements for disputed intellectual property, although no assurance can be given that such licenses can be obtained on acceptable terms or that litigation will not occur. These licenses may also significantly increase our operating expenses. If legal matters related to intellectual property claims were resolved against us or settled, we could be required to make payments in amounts that could have an adverse effect on our business, financial condition, and results of operations.
25
Strategic Risks
We may not effectively execute on our expansion strategy, which may adversely affect our ability to maintain our historical growth and earnings trends.
We have grown rapidly over the last several years. Financial institutions that grow rapidly can experience significant difficulties as a result of rapid growth. Our primary expansion strategy focuses on organic growth, supplemented by acquisitions of banking teams or other financial institutions; however, we may not be able to successfully execute on these aspects of our expansion strategy, which may cause our future growth rate to decline below our recent historical levels, or may prevent us from growing at all. More specifically, we may not be able to generate sufficient new loans and deposits within acceptable risk and expense tolerances or obtain the personnel or funding necessary for additional growth. Various factors, such as economic conditions and competition with other financial institutions, may impede or restrict the growth of our operations. Further, we may be unable to attract and retain experienced bankers, which could adversely affect our growth. The success of our strategy also depends on our ability to manage our growth effectively, which in turn depends on various factors, including our ability to adapt our credit, operational, technology and governance infrastructure to accommodate expanded operations. Even if we are successful in continuing our growth, such growth may not offer the same levels of potential profitability, and we may not be successful in controlling costs and maintaining asset quality in the face of that growth. Accordingly, our inability to maintain growth or to effectively manage growth, could have an adverse effect on our business, financial condition, and results of operations.
We may grow through mergers or acquisitions, a strategy which may not be successful or, if successful, may produce risks in successfully integrating and managing the merged companies or acquisitions and may dilute our shareholders.
As part of our growth strategy, we may pursue mergers and acquisitions of banks and non-bank financial services companies within or outside our principal market areas. We regularly seek to identify and explore specific acquisition opportunities as part of our ongoing business practices. We may also explore other strategic opportunities both within and outside of our current market. We face significant competition from numerous other financial services institutions, many of which will have greater financial resources or more liquid securities than we do, when considering acquisition opportunities. Accordingly, attractive acquisition opportunities may not be available to us. There can be no assurance that we will be successful in identifying or completing any future acquisitions.
Our continued pace of growth may require us to raise additional capital in the future to fund such growth, and the unavailability of additional capital on terms acceptable to us could adversely affect us or our growth.
We believe that we will have sufficient capital to meet our capital needs for our current growth plans. However, we will continue to need capital to support our longer-term growth plans. If capital is not available on favorable terms when we need it, we will have to either issue additional shares of common stock or other securities on less than desirable terms or reduce our rate of growth until market conditions become more favorable. Either of such events could have a material adverse effect on our business, financial condition, and results of operations.
As a new public company, we may not efficiently or effectively create an effective internal control environment, and any future failure to maintain effective internal control over financial reporting could impair the reliability of our financial statements, which in turn could harm our business, impair investor confidence in the accuracy and completeness of our financial reports and our access to the capital markets and cause the price of our Class A Common Stock to decline and subject us to regulatory penalties.
Our management is responsible for establishing and maintaining adequate internal control over financial reporting and for evaluating and reporting on that system of internal control. Our internal control over financial reporting consists of a process designed to provide reasonable assurance regarding the reliability of financial reporting and the preparation of financial statements for external purposes in accordance with GAAP. As a public company, we are required to comply with the Sarbanes-Oxley Act and other rules that govern public companies, which we previously were not required to comply with as a private company.
26
In addition, if we fail to achieve and maintain the adequacy of our internal controls, as such standards are modified, supplemented, or amended from time to time, we may not be able to ensure that we will be able to conclude on an ongoing basis that we have effective internal controls over financial reporting in accordance with Section 404 of the Sarbanes-Oxley Act. We cannot be certain as to the timing of completion of our evaluation, testing, and any remediation actions or the impact of the same on our operations. If we are not able to implement the requirements of Section 404 of the Sarbanes-Oxley Act in a timely manner or with adequate compliance, our independent registered public accounting firm may issue an adverse opinion due to ineffective internal controls over financial reporting, and we may be subject to sanctions or investigations by regulatory authorities, such as the SEC. As a result, there could be a negative reaction in the financial markets due to a loss of confidence in the reliability of our financial statements. In addition, we may be required to incur costs in improving our internal control system and hiring additional personnel. Any such action could negatively affect our results of operations and cash flows and the price of our Class A Common Stock may decline.
Financial Statement Risks
The accuracy of our financial statements and related disclosures could be affected if the judgments, assumptions or estimates used in our critical accounting policies are inaccurate.
The preparation of our financial statements and related disclosures in conformity with GAAP requires us to make judgments, assumptions and estimates that affect the amounts reported in our consolidated financial statements and accompanying notes. Our critical accounting policies, which are included in the section captioned “Management’s Discussion and Analysis of Financial Condition and Results of Operations” in this annual report, describe those significant accounting policies and methods used in the preparation of our consolidated financial statements that we consider critical because they require judgments, assumptions and estimates that materially affect our consolidated financial statements and related disclosures. As a result, if future events or regulatory views concerning such analysis differ significantly from the judgments, assumptions and estimates in our critical accounting policies, those events or assumptions could have a material impact on our consolidated financial statements and related disclosures, in each case resulting in our need to revise or restate prior period financial statements, cause damage to our reputation and the price of our Class A Common Stock and adversely affect our business, prospects, cash flow, liquidity, financial condition and results of operations.
We have identified a material weakness in our internal control over financial reporting, and we cannot assure you that additional material weaknesses or significant deficiencies will not occur in the future. If our internal control over financial reporting or our disclosure controls and procedures are not effective, we may not be able to accurately report our financial results or prevent fraud, which may cause investors to lose confidence in our reported financial information and may lead to a decline in our stock price.
Management maintains and regularly monitors, reviews, and updates the Company’s internal control over financial reporting and disclosure controls and procedures. Any failure or circumvention of our controls and procedures or failure to comply with regulations related to controls and procedures could have a material adverse effect on our business, results of operations, and financial condition. The Company’s management, with the supervision of the Chief Accounting Officer and the Chief Executive Officer, conducted an evaluation of the Company’s internal control over financial reporting and disclosure controls and procedures as of December 31, 2020. Based on that evaluation, management determined that, as of December 31, 2020, management observed deficiencies associated with infrequent significant transactions in the Company’s control environment. On a standalone basis these items do not rise to a material weakness; however, in the aggregate, they result in a material weakness. The specific control deficiencies are described in Part II - Item 9A “Controls and Procedures - Management’s Annual Report on Internal Control Over Financial Reporting” contained in this Form 10K. A material weakness is a deficiency, or a combination of deficiencies, in internal control over financial reporting such that there is a reasonable possibility that a material misstatement of our annual or interim consolidated financial statements would not be prevented or detected on a timely basis. The material weakness identified in management’s report did not result in any material misstatement in our consolidated financial statements or any changes to previously reported financial results.
We have implemented remedial measures intended to address the control deficiencies that led to the material weakness. However, if the remedial measures we have implemented are insufficient, or if additional material
27
weaknesses, or significant deficiencies in our internal control over financial reporting or in our disclosure controls and procedures occur in the future, we may not be able to report our financial results in an accurate and timely manner, prevent or detect fraud, or provide reliable financial information pursuant to our reporting obligations, which could have a material adverse effect on our business, financial condition, and results of operations.
Changes in accounting standards or regulatory interpretations of existing standards could materially impact our financial statements and disclosures.
From time to time the FASB or the SEC may change the financial accounting and reporting standards that govern the preparation of our financial statements. These changes may subject us to new or changing accounting and reporting standards. In addition, the bodies that interpret the accounting standards (such as banking regulators or outside auditors) may change their interpretations or positions on how new or existing standards should be applied, which in many cases may be beyond our control, can be hard to predict and can materially impact how we record and report our financial condition and results of operations. In some cases, we could be required to apply a new or revised standard retrospectively, or apply an existing standard differently and retrospectively, in each case resulting in our needing to revise or restate prior period financial statements, which could materially change our financial statements and related disclosures, cause damage to our reputation, adversely impact our business, financial condition and results of operations, and the price of our Class A Common Stock.
Our management team depends on data and modeling in their decision-making and inaccurate data or modeling approaches could negatively impact our decision-making ability or possibly subject us to regulatory scrutiny in the future.
We rely heavily on statistical and quantitative models and other quantitative analyses for bank decision-making, and the use of such analyses is becoming increasingly widespread in our operations. Liquidity stress testing, interest rate sensitivity analysis, the identification of possible violations of anti-money laundering regulations are all examples of areas in which we are dependent on models and the data that underlies them. While we believe these quantitative techniques and approaches improve our decision-making, they also create the possibility that faulty data or flawed quantitative approaches could negatively impact our decision-making ability. Secondarily, because of the complexity inherent in these approaches, misunderstanding or misuse of their outputs could similarly result in poor decision-making and have a negative impact on our business, financial condition, and results of operations.
Regulatory and Governmental Risks
We operate in a highly regulated environment, and the laws and regulations that govern our operations, corporate governance, executive compensation and accounting principles, or changes in them, or our failure to comply with them, could adversely affect us.
Banking is highly regulated under federal and state law. As such, we are subject to extensive regulation, supervision and legal requirements that govern almost all aspects of our operations. These laws and regulations are not intended to protect our shareholders. Rather, these laws and regulations are intended to protect clients, depositors, the Deposit Insurance Fund, and the overall financial stability of the United States. These laws and regulations, among other matters, prescribe minimum capital requirements, impose limitations on the business activities in which we can engage, limit the dividends or distributions that the Bank may pay to the Company, and restrict the ability of institutions to guarantee our debt and impose certain specific accounting requirements on us that may be more restrictive. Compliance with laws and regulations can be difficult and costly, and changes to laws and regulations often impose additional operating costs. Our failure to comply with these laws and regulations, even if the failure follows good faith effort or reflects a difference in interpretation, could subject us to restrictions on our business activities, enforcement actions and fines and other penalties, any of which could adversely affect our results of operations, regulatory capital levels and the price of our securities. Further, any new laws, rules and regulations, such as were imposed under the Dodd-Frank Wall Street Reform and Consumer Protection Act, or the Dodd Frank Act, could make compliance more difficult or expensive or otherwise adversely affect our business, prospects, cash flow, liquidity, financial condition, and results of operations.
28
Legislative and regulatory actions taken now or in the future may increase our costs and impact our business, governance structure, financial condition, or results of operations.
Economic conditions that contributed to the financial crisis in 2008, particularly in the financial markets, resulted in government regulatory agencies and political bodies placing increased focus and scrutiny on the financial services industry. The Dodd-Frank Act, which was enacted in 2010 in response to the financial crisis, significantly changed the regulation of financial institutions and the financial services industry. The Dodd-Frank Act and the regulations thereunder have affected both large and small financial institutions. The Dodd-Frank Act, among other things, imposed new capital requirements on bank holding companies; changed the base for Federal Deposit Insurance Corporation, or FDIC, insurance assessments to a bank’s average consolidated total assets minus average tangible equity, rather than upon its deposit base; permanently raised the current standard deposit insurance limit to $250,000; and expanded the FDIC’s authority to raise insurance premiums. The Dodd-Frank Act established the Consumer Financial Protection Bureau, or CFPB, as an independent entity within the Federal Reserve, which has broad rulemaking, supervisory and enforcement authority over consumer financial products and services, including deposit products, residential mortgages, and home-equity loans, and contains provisions on residential mortgage-related matters that address steering incentives, determinations as to a borrower’s ability to repay, prepayment penalties and disclosures to borrowers. Although the applicability of certain elements of the Dodd-Frank Act is limited to institutions with more than $10 billion in assets, there can be no guarantee that such applicability will not be extended in the future or that regulators or other third parties will not seek to impose such requirements on institutions with less than $10 billion in assets, such as the Bank. Compliance with the Dodd-Frank Act and its implementing regulations has and may continue to result in additional operating and compliance costs that could have a material adverse effect on our business, financial condition, results of operations and growth prospects.
On May 24, 2018, President Trump signed into law the “Economic Growth, Regulatory Relief and Consumer Protection Act,” or the Regulatory Relief Act, which amends parts of the Dodd-Frank Act, as well as other laws that involve regulation of the financial industry. While the Regulatory Relief Act keeps in place fundamental aspects of the Dodd-Frank Act’s regulatory framework, it does change the regulatory framework for depository institutions with assets under $10 billion, such as the Bank, as well as easing some requirements for larger depository institutions. As more fully discussed under “Supervision and Regulation-Regulatory Relief Act,” the legislation includes a number of provisions which are favorable to bank holding companies, or BHCs, with total consolidated assets of less than $10 billion, such as the Company, and also makes changes to consumer mortgage and credit reporting regulations and to the authorities of the agencies that regulate the financial industry.
Federal and state regulatory agencies frequently adopt changes to their regulations or change the manner in which existing regulations are applied. Regulatory or legislative changes to laws applicable to the financial industry, if enacted or adopted, may impact the profitability of our business activities, require more oversight, or change certain of our business practices, including the ability to offer new products, obtain financing, attract deposits, make loans and achieve satisfactory interest spreads and could expose us to additional costs, including increased compliance costs. These changes also may require us to invest significant management attention and resources to make any necessary changes to operations to comply and could have an adverse effect on our business, financial condition, and results of operations.
Federal banking agencies periodically conduct examinations of our business, including compliance with laws and regulations, and our failure to comply with any supervisory actions to which we are or become subject as a result of such examinations could adversely affect us.
As part of the bank regulatory process, the Federal Reserve and the Florida Office of Financial Regulation periodically conduct examinations of our business, including compliance with laws and regulations. If, as a result of an examination, one of these agencies were to determine that the financial condition, capital resources, asset quality, earnings prospects, management, liquidity, asset sensitivity, risk management or other aspects of any of our operations have become unsatisfactory, or that the Company, the Bank or their respective management were in violation of any law or regulation, it could take a number of different remedial actions as it deems appropriate. These actions include the power to enjoin “unsafe or unsound” practices, to require affirmative actions to correct any conditions resulting from any violation or practice, to issue an administrative order that can be judicially enforced, to direct an increase in our capital levels, to restrict our growth, to assess civil monetary penalties against us, the Bank or their respective officers or
29
directors, to remove officers and directors and, if it is concluded that such conditions cannot be corrected or there is an imminent risk of loss to depositors, to terminate the Bank’s deposit insurance. If we become subject to such regulatory actions, our business, financial condition, results of operations and reputation could be adversely affected.
Financial institutions, such as the Bank, face a risk of noncompliance and enforcement action with the Bank Secrecy Act and other anti-money laundering statutes and regulations.
The Bank Secrecy Act, the Uniting and Strengthening America by Providing Appropriate Tools Required to Intercept and Obstruct Terrorism Act of 2001, or the USA PATRIOT Act, and other laws and regulations require financial institutions, among other duties, to institute and maintain an effective anti-money laundering program and file suspicious activity and currency transaction reports as appropriate. The Financial Crimes Enforcement Network, or FinCEN, established by the United States Department of the Treasury to administer the Bank Secrecy Act, is authorized to impose significant civil money penalties for violations of those requirements and has recently engaged in coordinated enforcement efforts with the individual federal banking regulators, as well as the United States Department of Justice, Drug Enforcement Administration and the Internal Revenue Service. Additionally, South Florida has been designated as a “High Intensity Financial Crime Area,” or HIFCA, by FinCEN and a “High Intensity Drug Trafficking Area,” or HIDTA, by the Office of National Drug Control Policy. The HIFCA program is intended to concentrate law enforcement efforts to combat money laundering efforts in higher-risk areas. The HIDTA designation makes it possible for local agencies to benefit from ongoing HIDTA-coordinated program initiatives that are working to reduce drug use. There is also increased scrutiny of compliance with the sanctions programs and rules administered and enforced by the Treasury Department’s Office of Foreign Assets Control.
In order to comply with regulations, guidelines and examination procedures in this area, we have dedicated significant resources to our anti-money laundering program, especially due to the regulatory focus on financial and other institutions located in South Florida. If our policies, procedures and systems are deemed deficient, we could be subject to liability, including fines and regulatory actions such as restrictions on our ability to pay dividends and the inability to obtain regulatory approvals to proceed with certain aspects of our business plans, including acquisitions and de novo branching.
We are subject to numerous laws and regulations of certain regulatory agencies, such as the CFPB, designed to protect consumers, including the Community Reinvestment Act, or CRA, and fair lending laws, and failure to comply with these laws could lead to a wide variety of sanctions.
The CRA directs all insured depository institutions to help meet the credit needs of the local communities in which they are located, including low- and moderate-income neighborhoods. Each institution is examined periodically by its primary federal regulator, which assesses the institution’s performance. The Equal Credit Opportunity Act, the Fair Housing Act and other fair lending laws and regulations impose nondiscriminatory lending requirements on financial institutions. The CFPB, the United States Department of Justice, the Federal Reserve, and other federal agencies are responsible for enforcing these laws and regulations. The CFPB was created under the Dodd-Frank Act to centralize responsibility for consumer financial protection with broad rulemaking authority to administer and carry out the purposes and objectives of federal consumer financial laws with respect to all financial institutions that offer financial products and services to consumers. The CFPB is also authorized to prescribe rules applicable to any covered person or service provider, identifying and prohibiting acts or practices that are “unfair, deceptive, or abusive” in connection with any transaction with a consumer for a consumer financial product or service, or the offering of a consumer financial product. The ongoing broad rulemaking powers of the CFPB have potential to have a significant impact on the operations of financial institutions offering consumer financial products or services.
A successful regulatory challenge to our performance under the CRA, fair lending or consumer lending laws and regulations could result in a wide variety of sanctions, including damages and civil money penalties, injunctive relief, restrictions on mergers and acquisitions activity, restrictions on expansion, and restrictions on entering new business lines. Private parties may also have the ability to challenge an institution’s performance under fair lending laws in private class action litigation. Such actions could have an adverse effect on our business, financial condition and results of operations.
30
Increases in FDIC insurance premiums could adversely affect our earnings and results of operations.
The deposits of our bank are insured by the FDIC up to legal limits and, accordingly, subject it to the payment of FDIC deposit insurance assessments. In order to maintain a strong funding position and restore the reserve ratios of the Deposit Insurance Fund following the financial crisis, the FDIC increased deposit insurance assessment rates and charged special assessments to all FDIC-insured financial institutions. Although the FDIC has since reduced premiums for most FDIC-insured institutions of our size, increases in assessment rates or special assessments may occur in the future, especially if there are significant additional financial institution failures. Any future special assessments increase in assessment rates or required prepayments in FDIC insurance premiums could reduce our profitability or limit our ability to pursue certain business opportunities, which could have a material adverse effect on our business, financial condition, and results of operations.
The Federal Reserve may require us to commit capital resources to support the Bank.
The Federal Reserve requires a bank holding company to act as a source of financial and managerial strength to its subsidiary banks and to commit resources to support its subsidiary banks. Under the “source of strength” doctrine that was codified by the Dodd-Frank Act, the Federal Reserve may require a bank holding company to make capital injections into a troubled subsidiary bank at times when the bank holding company may not be inclined to do so and may charge the bank holding company with engaging in unsafe and unsound practices for failure to commit resources to such a subsidiary bank. Accordingly, we could be required to provide financial assistance to the Bank if it experiences financial distress.
A capital injection may be required at a time when our resources are limited, and we may be required to borrow the funds or raise capital to make the required capital injection. Any loan by a bank holding company to its subsidiary bank is subordinate in right of payment to deposits and certain other indebtedness of such subsidiary bank. In the event of a bank holding company’s bankruptcy, the bankruptcy trustee will assume any commitment by the holding company to a federal bank regulatory agency to maintain the capital of a subsidiary bank. Moreover, bankruptcy law provides that claims based on any such commitment will be entitled to a priority of payment over the claims of the holding company’s general unsecured creditors, including the holders of any note obligations. Thus, any borrowing by a bank holding company for the purpose of making a capital injection to a subsidiary bank often becomes more difficult and expensive relative to other corporate borrowings.
We could be adversely affected by the soundness of other financial institutions.
Financial services institutions are interrelated as a result of trading, clearing, counterparty or other relationships. We have exposure to many different industries and counterparties, and routinely execute transactions with counterparties in the financial services industry, including commercial banks, brokers and dealers, investment banks and other institutional clients. Many of these transactions expose us to credit risk in the event of a default by a counterparty or client. In addition, our credit risk may be exacerbated when our collateral cannot be foreclosed upon or is liquidated at prices not sufficient to recover the full amount of the credit or derivative exposure due. Any such losses could adversely affect our business, prospects, cash flow, liquidity, financial condition, and results of operations.
Monetary policies and regulations of the Federal Reserve could adversely affect our business, financial condition and results of operations.
In addition to being affected by general economic conditions, our earnings and growth are affected by the policies of the Federal Reserve. An important function of the Federal Reserve is to regulate the United States money supply and credit conditions. Among the instruments used by the Federal Reserve to implement these objectives are open market purchases and sales of securities by the Federal Reserve, adjustments of both the discount rate and the federal funds rate and changes in reserve requirements against bank deposits. These instruments are used in varying combinations to influence overall economic growth and the distribution of credit, bank loans, investments, and deposits. Their use also affects interest rates charged on loans or paid on deposits. The monetary policies and regulations of the Federal Reserve have had a significant effect on the operating results of commercial banks in the past and are expected to continue to do
31
so in the future. Although we cannot determine the effects of such policies on us at this time, such policies could adversely affect our business, prospects, cash flow, liquidity, financial condition, and results of operations.
Our future ability to pay dividends is subject to restrictions.
Holders of our Class A Common Stock are only entitled to receive dividends when, as and if declared by our Board out of funds legally available for dividends. Moreover, our ability to declare and pay dividends to our shareholders is highly dependent upon the ability of the Bank to pay dividends to us, the payment of which is subject to laws and regulations governing banks and financial institutions.
We have not paid any cash dividends on our capital stock since inception and we do not plan to pay cash dividends in the foreseeable future. Any declaration and payment of dividends on our common stock in the future will depend on regulatory restrictions, our earnings and financial condition, our liquidity and capital requirements, the general economic climate, contractual restrictions, our ability to service any equity or debt obligations senior to our common stock and other factors deemed relevant by our Board. Furthermore, consistent with our strategic plans, growth initiatives, capital availability, projected liquidity needs and other factors, we have made, and will continue to make, capital management decisions and policies that could adversely affect the amount of dividends, if any, paid to our shareholders. See “Dividend Policy.”
Furthermore, the Federal Reserve has indicated that bank holding companies should carefully review their dividend policy in relation to the organization’s overall asset quality, current and prospective earnings and the level, composition, and quality of capital. The guidance provides that we inform and consult with the Federal Reserve prior to declaring and paying a dividend that exceeds earnings for the period for which the dividend is being paid or that could result in an adverse change to our capital structure, which could impact our ability to pay dividends in the future.
We are dependent upon the Bank for cash flow, and the Bank’s ability to make cash distributions is restricted.
Our primary asset is the Bank. We depend upon the Bank for cash distributions (through dividends on the Bank’s common stock) that we use to pay our operating expenses and satisfy our other financial obligations. Federal statutes, regulations and policies restrict the Bank’s ability to make cash distributions to us. These statutes and regulations require, among other things, that the Bank maintain certain levels of capital to pay a dividend. Further, the Bank’s regulators have the ability to restrict the Bank’s payment of dividends by supervisory action. If the Bank is unable to pay dividends to us, we may not be able to satisfy our obligations or, if applicable, pay dividends on our Class A common stock.
General Risk Factors
The market price of our Class A Common Stock may be subject to substantial fluctuations, which may make it difficult for you to sell your shares at the volume, prices, and times desired.
The market price of our Class A Common Stock may be highly volatile, which may make it difficult for you to resell your shares at the volume, prices, and times desired. There are many factors that may affect the market price and trading volume of our Class A Common Stock, including, without limitation, the risks discussed elsewhere in this “Risk Factors” section and:
| ● | actual or anticipated fluctuations in our operating results, financial condition or asset quality; |
| ● | changes in economic or business conditions; |
| ● | the effects of, and changes in, trade, monetary and fiscal policies, including the interest rate policies of the Federal Reserve; |
| ● | publication of research reports about us, our competitors or the financial services industry generally, or changes in, or failure to meet, securities analysts’ estimates of our financial and operating performance, or lack of research reports by industry analysts or the cessation of coverage; |
32
| ● | operating and stock price performance of companies that investors deem comparable to us; |
| ● | additional or anticipated sales of our Class A Common Stock or other securities by us or our existing shareholders; |
| ● | additions, departures or inability to retain of key personnel; |
| ● | perceptions and speculations in the marketplace regarding our competitors or us; |
| ● | price and volume fluctuations in the overall stock market from time to time; |
| ● | litigation involving us, our industry or both; |
| ● | investigations by regulators into our operations or those of our competitors; |
| ● | new laws or regulations or new interpretations of existing laws or regulations applicable to our business; |
| ● | changes in accounting standards, policies, guidelines, interpretations or principles; |
| ● | the financial projections we may provide to the public, any changes in those projections or our failure to meet those projections; |
| ● | actual or anticipated developments in our business, our competitors’ businesses or the competitive landscape generally; |
| ● | developments or disputes concerning our intellectual property or other proprietary rights; |
| ● | significant acquisitions or business combinations, strategic partnerships, joint ventures or capital commitments by or involving our competitors or us; |
| ● | other economic, competitive, governmental, regulatory or technological factors affecting our operations, pricing, products and services; and |
| ● | other news, announcements or disclosures (whether by us or others) related to us, our competitors, our core market or the financial services industry. |
The stock market and, in particular, the market for financial institution stocks have experienced substantial fluctuations in recent years, which in many cases have been unrelated to the operating performance and prospects of particular companies. In addition, significant fluctuations in the trading volume in our Class A Common Stock may cause significant price variations to occur. Increased market volatility may materially and adversely affect the market price of our Class A Common Stock, which could make it difficult to sell your shares at the volume, prices, and times desired.
In addition, in the past, following periods of volatility in the overall market and the market price of a particular company’s securities, securities class action litigation has often been instituted against these companies. Such litigation, if instituted against us, could result in substantial costs and a diversion of our management’s attention and resources.
Levels or types of insurance coverage may not adequately cover claims.
We maintain insurance to protect against certain types of claims associated with our operations, but our coverage may not adequately cover all claims. Depending on our assumptions regarding level of risk, availability, cost, and other considerations, we purchase differing amounts of insurance from time to time and for various business lines. Our coverage is subject to deductibles, exclusions, and policy limits. If our level of insurance is inadequate or a loss is not covered, we could suffer a loss that may have a negative impact on our financial results or operations.
33
We are an “emerging growth company,” and the reduced reporting requirements applicable to emerging growth companies may make our Class A Common Stock less attractive to investors.
We are an “emerging growth company,” as defined in the JOBS Act. For as long as we continue to be an emerging growth company, we may take advantage of exemptions from various reporting requirements that are applicable to other public companies but not to “emerging growth companies,” including, but not limited to:
| ● | being permitted to provide only two years of audited financial statements, in addition to any required unaudited interim financial statements, with correspondingly reduced “Management’s Discussion and Analysis of Financial Condition and Results of Operations” disclosure; |
| ● | not being required to comply with the auditor attestation requirements in the assessment of our internal control over financial reporting under Section 404 of the Sarbanes-Oxley Act; |
| ● | not being required to comply with any requirement that may be adopted by the Public Company Accounting Oversight Board regarding mandatory audit firm rotation or a supplement to the auditor’s report providing additional information about the audit and the financial statements; |
| ● | reduced disclosure obligations regarding executive compensation in our periodic reports and proxy statements; and |
| ● | exemptions from the requirements of holding a nonbinding advisory vote on executive compensation and shareholder approval of any golden parachute payments not previously approved. |
We will remain an emerging growth company until the earliest to occur of (1) the last day of the fiscal year (a) following the fifth anniversary of the completion of our offering, (b) in which we have total annual gross revenue of at least $1.07 billion, or (c) in which we are deemed to be a large accelerated filer, which means the market value of our Class A common stock that is held by non-affiliates exceeds $700 million as of the prior December 31st, and (2) the date on which we have issued more than $1.0 billion in non-convertible debt during the prior three-year period. Investors may find our common stock less attractive if we choose to rely on these exemptions. If some investors find our common stock less attractive as a result of any choices to reduce future disclosure, there may be a less active trading market for our common stock and the price of our common stock may be more volatile.
Under the JOBS Act, emerging growth companies can also delay adopting new or revised accounting standards until such time as those standards apply to private companies. We have elected to take advantage of this benefit and, as a result, our future financial statements may not be directly comparable to those of other public companies, including other financial institutions, which have implemented such new or revised accounting standards until we implement such new or revised accounting standards.
Item 1B. Unresolved Staff Comments
None.
Our holding company owns no real property. Our corporate office is located at 396 Alhambra Circle, Suite 255, Coral Gables, Florida 33134. At the end of 2020, our Company, through the Bank, operated a total of nine branches in the Miami-Fort Lauderdale-West Palm Beach or Miami-Dade metropolitan statistical area, or MSA, which encompasses three rapidly growing counties in Florida: Miami-Dade, Broward, and Palm Beach. The Company also has a loan production office in Bedford, NH and the Digital Innovation Center in Cleveland, OH. See Note 6 to the “Notes to Consolidated Financial Statements” included in this Report on Form 10-K and “Management’s Discussion and Analysis of Financial Condition and Results of Operations” for additional information regarding our premises and equipment.
34
We are periodically party to or otherwise involved in legal proceedings arising in the normal course of business, such as claims to enforce liens, claims involving the making and servicing of real property loans, and other issues incident to its businesses. We do not believe any pending or threatened legal proceedings in the ordinary course would have a material adverse effect on our consolidated results of operations or consolidated financial position.
Item 4.Mine Safety Disclosures
Not applicable.
Item 5. Market for Registrant’s Common Equity, Related Stockholder Matters and Issuer Purchases of Equity Securities.
(a) Market Information.
Since February 7, 2020, the principal market on which our Class A Common Stock is traded is the Nasdaq Global Select Market under the symbol “PFHD.” As of December 31, 2020, there were 369 registered shareholders of our Class A Common Stock.
Prior to our listing on the Nasdaq Global Select Market there was not an established public trading market, although quotations for our Class A Common Stock were reported on the OTC Pink, or the Pink Open Market, under the symbol “PFHD.” The over-the-counter market for our Class A Common Stock is sporadic and at times limited and the prices at which such transactions occurred may not necessarily reflect the price that would be paid for our Class A Common Stock in an active market. Any over-the-counter market quotations reflect inter-dealer prices, without retail mark-up, mark-down or commission and may not necessarily represent actual transactions.
Historical Closing Prices of Our Class A Common Stock | ||||||
Quarter Ended |
| High |
| Low | ||
First Quarter 2021 (through March 19, 2021) | | $ | 19.22 |
| $ | 14.97 |
Fourth Quarter 2020 | | $ | 18.00 |
| $ | 13.34 |
Third Quarter 2020 | | $ | 14.35 |
| $ | 10.45 |
Second Quarter 2020 | | $ | 17.75 |
| $ | 12.70 |
First Quarter 2020 | | $ | 20.00 |
| $ | 14.24 |
Fourth Quarter 2019 | | $ | 19.00 |
| $ | 17.87 |
Third Quarter 2019 | | $ | 18.50 |
| $ | 17.37 |
Second Quarter 2019 | | $ | 17.62 |
| $ | 17.27 |
First Quarter 2019 | | $ | 17.80 |
| $ | 15.20 |
The listing of our Class A Common Stock on the Nasdaq Global Market has resulted in a more active trading market for our Class A Common Stock. However, we cannot assure that a liquid trading market for our Class A Common Stock will be sustained. You may not be able to sell your shares quickly or at the market price if trading in our common stock is not active.
Because we are a bank holding company and currently do not engage directly in business activities of a material nature, our ability to pay dividends to our shareholders depends, in large part, upon our receipt of dividends from the Bank, which is also subject to numerous limitations on the payment of dividends under federal banking laws, regulations and policies.
Additionally, under the terms of subordinated notes due 2026 and callable in 2021, and the related subordinated note purchase agreements, which we assumed upon consummation of our acquisition of MBI, we are not permitted to declare or pay any dividends on our capital stock if an event of default occurs under the terms of the subordinated notes,
35
excluding any dividends or distributions in shares of, or options, warrants or rights to subscribe for or purchase shares of, any class of our common stock and any declaration of a non-cash dividend in connection with the implementation of a shareholders’ rights plan.
Holders of our Class A Common Stock are only entitled to receive dividends when and if declared by our Board out of funds legally available for dividends. We have never paid any cash dividends on our common stock and we do not intend to pay dividends for the foreseeable future. As a Florida corporation, we are only permitted to pay dividends to shareholders if, after giving effect to the dividend, (i) the Company is able to pay its debts as they become due in the ordinary course of business and (ii) the Company’s assets exceeds the sum of Company’s (A) liabilities plus (B) the amount that would be needed for the Company to satisfy the preferential rights upon dissolution of shareholders whose preferential rights are superior to those receiving the dividend, if any.
(b) Use of Proceeds.
On February 7, 2020, the Company completed its initial public offering of 3,565,000 shares of its Class A Common Stock at a public offering price of $18.50 per share, or an aggregate offering price of $57,350,000. The offering, for which the managing underwriters were Stephens Inc. and Keefe, Bruyette & Woods, was registered under the Securities Act (Registration No. 333-235822) and resulted in total net proceeds to the Company of approximately $61.3 million, after deducting an underwriting discount of 7%, before expenses (approximately $1.6 million).
As of December 31, 2020, we used approximately $3.3 million in MBI business combination expenses, $10.0 million to paydown our line of credit with Valley National Bank, with the remaining proceeds pushed down to the Bank for the purchase of additional securities for the investment portfolio and general corporate purposes, including working capital and capital expenditures. None of the proceeds were used as payments to our directors or officers (or their associates), or to our affiliates or 10% shareholders.
(c) Purchases of Equity Securities by Issuer and Other Affiliates.
As detailed in our 10-Q Part II, Item 2 for the third quarter 2020, second quarter 2020 and first quarter 2020 on March 2, 2020, the Company’s Board of Directors authorized the purchase from time to time of up to $10.0 million of the Company’s Class A Common Stock. Under this program, shares may be repurchased in privately negotiated and/or open market transactions, including under plans complying with Rule 10b5-1 under the Exchange Act. Share repurchase activity during the three months ended December 31, 2020 is shown below:
| | | | | | Total Number of | | Approximate Dollar | ||
| | | | | | Shares Purchased | | Value of Shares that | ||
| | Total Number of | | Average Price | | as part of Public | | May yet be Purchased | ||
Periods |
| Shares Purchased |
| Paid per Share |
| Announced Plan* |
| Under the Plan | ||
October 1, 2020 to October 31, 2020: |
| - | | | — |
| - | | | 5,022,844 |
November 1, 2020 to November 30, 2020: |
| 5,637 | | | 13.64 |
| 5,637 | | | 4,945,955 |
December 1, 2020 to December 31, 2020: |
| - | | | — |
| - | | | 4,945,955 |
Total - 4th Quarter | | 5,637 | | $ | 13.64 | | 320,931 | | $ | 4,945,955 |
*The plan to purchase equity securities totaling $10 million was approved on March 2, 2020, with no expiration date.
Item 6. Selected Financial Data
Two years of financial data of the Company is set forth on page F-1 of this Annual Report on Form 10-K.
Item 7. Management’s Discussion and Analysis of Financial Condition and Results of Operations
The following is Management’s Discussion and Analysis of the Financial Condition and Results of Operations (“MD&A”) of Professional Holding Corp. (“the Company”) for the year ended December 31, 2020 and 2019. This discussion should be read in conjunction with the Consolidated Financial Statements and related footnotes of our Company presented in Item 8. Financial Statements and Supplementary Data. In addition to historical information, this
36
discussion contains forward-looking statements that involve risks, uncertainties and assumptions that could cause actual results to differ materially from management’s expectations. Factors that could cause such differences include, but are not limited to, those described in the section titled “Cautionary Note Regarding Forward-Looking Information.”
Overview
Net income for Professional Holding Corp. and subsidiaries (the “Company”) for the year ended December 31, 2020, was $8.3 million ($0.67 per diluted common share) compared to $2.3 million ($0.40 per diluted common share) for the year ended December 31, 2019, representing a 255.5% increase in net income and a 67.5% increase in earnings per diluted common share. The results from 2020 included closing our initial public offering, completion of the acquisition and integration of Marquis Bancorp Inc. (“MBI”) and expanding our market share despite a worldwide pandemic.
Highlights of our performance and financial condition as of and for the year ended December 31, 2020 and other key events that occurred during 2020 are provided below.
Results of Operations for the Year Ended December 31, 2020
| ● | Net income of $8.3 million, an increase of $6.0 million, or 255.5%, compared to the same period in 2019. |
| ● | Net interest income of $60.1 million, an increase of $32.0 million, or 114.1%, compared to the same period in 2019. |
| ● | Noninterest income totaled $4.3 million, an increase of $1.5 million, or 53.3%, compared to the same period in 2019. |
| ● | Noninterest expense of $43.6 million, an increase of $16.6 million, or 61.6%, compared to the same period in 2019. MBI business combination expenses and additional full-time employees were primarily responsible for the increase. |
| ● | Pre-tax pre-provision earnings (non-GAAP, see Explanation of Certain Unaudited Non-GAAP Financial Measures) was $20.7 million for the current year, an increase of $16.8 million, or 438.1%, compared to pre-tax pre-provision earnings of $3.9 million in the previous year. |
Financial Condition
At December 31, 2020:
| ● | Total assets grew to $2.1 billion, an increase of $1.0 billion, or 95.3%, compared to December 31, 2019 due to the MBI business combination, our participation in the Paycheck Protection Program (PPP), with some of these loans match funded with PPPLF advances of $101.4 million, and new organic growth. At December 31, 2020, the Company had a gross PPP loan balance of $190.0 million. |
| ● | Net loans grew to $1.6 billion, an increase of $0.9 billion, or 109.5%, compared to December 31, 2019. We experienced growth across all loan types due to new organic originations (including PPP) of $0.6 billion, acquisitions of $0.5 billion, offset by net paybacks and advances of approximately $0.3 billion, for the year ended December 31, 2020. |
| ● | Nonperforming assets totaled $10.4 million, an increase of $8.1 million, or 357.6%, compared to $2.3 million at December 31, 2019. As part of our continued evaluation of a credit where the borrower, Coex Coffee International Inc. (“Coex”) petitioned the court for an Assignment for the Benefit of Creditors, the Company classified the full loan amount of $8.3 million as substandard non-accrual as of December 31, 2020. |
| ● | The Company maintained its strong capital position. As of December 31, 2020, the Company was well-capitalized, with a total risk-based capital ratio of 14.7%, a tier 1 risk-based capital ratio of 12.9%, a common equity tier 1 capital ratio of 12.9%, and a leverage ratio of 10.0%. As of December 31, 2020, and 2019, all of |
37
| our regulatory capital ratios exceeded the thresholds to be well-capitalized under the applicable bank regulatory requirements. |
| ● | The Company recorded adjustments to the original fair value estimates of the MBI valuation in the fourth quarter. |
Other Highlights
| ● | In February 2020, we announced the closing of our initial public offering of 3,565,000 shares of Class A Common Stock, which included an additional 465,000 shares in connection with the exercise in full of the underwriters’ option to purchase additional shares |
| ● | In March 2020, we closed on our acquisition of MBI and its wholly owned subsidiary, Marquis Bank. |
| ● | In June 2020, we successfully completed our systems conversion of MBI. |
| ● | In November 2020, we opened our new loan production office in Bedford, NH to service our new search fund lending business. |
| ● | We participated in the PPP and processed/closed/funded 1,506 small business loans representing $226.2 million in relief proceeds throughout 2020. |
Acquisition of MBI
On March 26, 2020, we closed our acquisition with MBI and its wholly owned subsidiary, Marquis Bank, headquartered in Coral Gables, Florida. This acquisition resulted in the growth of the balance sheet, net interest income, and non-interest income and expense from the prior year. The Company identified $539.9 million of acquired loans with a book balance, prior to fair value adjustments. An initial fair value adjustment of $19.3 million was recorded through goodwill. Measurement period adjustments related to other fair value factors totaled $5.3 million for the year ended December 31, 2020 and will amortize through interest income over the remaining life of each loan. The acquisition has already provided increased credit portfolio diversity and increased lending capacity and accelerated our growth strategy and profitability targets.
COVID-19 Operational Response and Bank Preparedness
The outbreak of the novel coronavirus COVID-19, which was declared a pandemic by the World Health Organization on March 11, 2020, has led to adverse impacts on the global economy and created uncertainty in the world’s financial markets.
The Company continues to work within the COVID-19 pandemic response plans which were originally established in the Spring of 2020. The Company continues to update these plans to ensure that they comply with the latest governmental guidelines and health conditions. As conditions permit, these plans facilitate our staff judiciously and safely returning to the office. On December 31, 2020, approximately 35% of our staff was working in the office while approximately 65% was working by remote access. This compares to July 10, 2020, when 20% of our staff was working in the office and 80% was working by remote access.
In response to the COVID-19 pandemic we have:
| ● | The Company participated in the PPP and processed/closed/funded 1,506 small business loans representing $226.2 million in relief proceeds throughout 2020. The majority of these loans were initially pledged to the Federal Reserve as part of the PPPLF. The PPPLF pledged loans are non-recourse to the Company. In addition, we paid off approximately $123.6 million in PPPLF advances during the year ended December 31, 2020 and had a balance of $101.4 million remaining as of December 31, 2020. |
| ● | The Company added an online PPP application form and automated the PPP loan closing documentation process. |
38
| ● | As of December 31, 2020, we have reviewed and processed numerous debt service relief requests in accordance with Section 4013 of the CARES Act and interagency guidelines published by federal banking regulators on March 13, 2020. As currently interpreted by the agencies, the guidelines assert that short-term modifications made on good faith for reasons related to the COVID-19 pandemic to borrowers who were current prior to such relief are not considered Troubled Debt Restructurings (TDRs). These modifications include deferrals of principal and interest, modification to interest only, and deferrals to escrow requirements. The modifications have varying terms up to six months. |
| ● | During the year ended December 31, 2020, the Company approved $199.8 million in payment relief modifications that were granted under the CARES Act guidance associated with the treatment of TDRs. Since the inception of the CARES Act, $187.8 million of these loans either have been reinstated to their original payment terms or have been paid off. As of December 31, 2020, there were 13 loans measured with a fair value of $11.1 million, that remain under the exemption from TDR classification as provided for in the CARES Act. |
| ● | To manage credit risk, the Company increased oversight and analysis of loans to borrowers in vulnerable industries, such as hotels and hospitality. As of December 31, 2020, these loans have a balance of $54.3 million. For the year ended December 31, 2020, $30.6 million of these loans were provided payment relief consistent with Section 4013 of the CARES Act and the interagency guidelines published on March 13, 2020, and as of December 31, 2020, $28.3 million has been reinstated and returned to normal payment schedules, with one deferred loan remaining in this group. |
The economic effects of the COVID-19 pandemic have significantly impacted and continue to significantly impact business and economic activity in the United States and around the world. There have been full and partial business closures, increases in unemployment as workers are furloughed, laid off, or had hours limited. Such disruptions could adversely affect our loan and deposit fee income as well as create downward pressure on the quality of our loan portfolio possibly leading to an increase in loan charge-offs.
The COVID-19 pandemic is an unprecedented event that has created high levels of uncertainty. We are vigilantly monitoring global events and actions being taken by various Federal and State Agencies. We have maintained interim periodic communications with our regulators and have not experienced any material deposit outflows to date and frequently communicate with our credit clients.
Given the fluidity of the situation, management cannot predict the long-term impact of the COVID-19 pandemic on the Company for 2021 or beyond.
Results of Operations for the Years Ended December 31, 2020 and 2019
Net Income
The following table sets forth the principal components of net income for the periods indicated.
| | Years Ended December 31, | | ||||||
(Dollars in thousands) |
| 2020 |
| 2019 |
| Change |
| ||
Interest income | | $ | 69,099 | | $ | 39,210 |
| 76.2 | % |
Interest expense | |
| 9,046 | |
| 11,167 |
| (19.0) | % |
Net Interest income | |
| 60,053 | |
| 28,043 |
| 114.1 | % |
Provision for loan losses | |
| 10,017 | |
| 862 |
| 1,062.1 | % |
Net interest income after provision | |
| 50,036 | |
| 27,181 |
| 84.1 | % |
Noninterest income | |
| 4,306 | |
| 2,808 |
| 53.3 | % |
Noninterest expense | |
| 43,620 | |
| 26,997 |
| 61.6 | % |
Income before income taxes | |
| 10,722 | |
| 2,992 |
| 258.4 | % |
Income tax expense | |
| 2,417 | |
| 656 |
| 268.4 | % |
Net income | | $ | 8,305 | | $ | 2,336 |
| 255.5 | % |
39
Net income for the year ended December 31, 2020, was $8.3 million, an increase of $6.0 million, or 255.5%, from net income for the year ended December 31, 2019, of $2.3 million. Interest income increased $29.9 million while interest expense decreased $2.1 million, resulting in a net interest income increase of $32.0 million for the year ended December 31, 2020, compared to the same period in the prior year. The increase in our interest income was primarily due to an increase in interest earning assets, primarily from the MBI business combination, our participation in the SBA’s PPP, with some of these loans match funded with PPPLF advances of $101.4 million. Provision for loan losses increased by $9.1 million for the year ended December 31, 2020, compared to the same period in the prior year primarily due to a specific reserve of $7.6 million recorded to address the impairment of the loans made to one of its borrowers, Coex Coffee International Inc. (“Coex”) (See “Management’s Discussion and Analysis of Financial Condition and Results of Operations - Coex Coffee International Inc.”). Noninterest income increased $1.5 million and noninterest expense increased $16.6 million for the year ended December 31, 2020, compared to the same period in the prior year. The increase in noninterest expense for the year ended December 31, 2020, compared to the same period in the prior year was primarily a result of the MBI business combination expenses as well as increases in occupancy and equipment expense due to the opening of two new bank branches and the digital innovation center and increases in professional services expense due to costs related to building the organizational infrastructure of a publicly traded company.
Net Interest Income and Net Interest Margin Analysis
We analyze our ability to maximize income generated from interest earning assets and control the interest expenses of our liabilities, measured as net interest income, through our net interest margin and net interest spread. Net interest income is the difference between the interest and fees earned on interest earning assets, such as loans and securities, and the interest expense paid on interest bearing liabilities, such as deposits and borrowings, which are used to fund those assets. Net interest margin is a ratio calculated as annualized net interest income divided by average interest earning assets for the same period. Net interest spread is the difference between average interest rates earned on interest earning assets and average interest rates paid on interest-bearing liabilities.
Changes in market interest rates and the interest rates we earn on interest earning assets or pay on interest-bearing liabilities, as well as in the volume and types of interest earning assets, interest bearing and noninterest-bearing liabilities and shareholders’ equity, are usually the largest drivers of periodic changes in net interest income, net interest margin and net interest spread. Fluctuations in market interest rates are driven by many factors, including governmental monetary policies, inflation, deflation, macroeconomic developments, changes in unemployment rates, the money supply, political and international conditions and conditions in domestic and foreign financial markets. Periodic changes in the volume and types of loans in our loan portfolio are affected by, among other factors, the economic and competitive conditions in the Miami-Dade MSA, as well as developments affecting the real estate, technology, government services, hospitality and tourism and financial services sectors within the Miami-Dade MSA. Our ability to respond to changes in these factors by using effective asset-liability management techniques is critical to maintaining the stability of our net interest income and net interest margin as our primary sources of earnings.
The following table shows the average outstanding balance of each principal category of our assets, liabilities and shareholders’ equity, together with the average yields on our assets and the average costs of our liabilities for the periods
40
indicated. Such yields and costs are calculated by dividing the annualized income or expense by the average daily balances of the corresponding assets or liabilities for the same period.
| | For the Year Ended December 31, | | ||||||||||||||
| | 2020 | | 2019 | | ||||||||||||
|
| Average |
| Interest |
| |
| Average |
| Interest |
| |
| ||||
| | Outstanding | | Income/ | | Average | | Outstanding | | Income/ | | Average | | ||||
(Dollars in thousands) | | Balance | | Expense(4) | | Yield/Rate | | Balance | | Expense(4) | | Yield/Rate | | ||||
Assets |
| |
|
| |
|
|
|
| |
|
| |
|
|
|
|
Interest earning assets |
| |
|
| |
|
|
|
| |
|
| |
|
|
|
|
Interest-bearing deposits | | $ | 197,812 | | $ | 740 |
| 0.37 | % | $ | 80,448 | | $ | 1,659 |
| 2.06 | % |
Federal funds sold | |
| 39,566 | |
| 172 |
| 0.43 | % |
| 25,284 | |
| 581 |
| 2.30 | % |
Federal Reserve Bank stock, FHLB stock and other corporate stock | |
| 7,550 | |
| 414 |
| 5.48 | % |
| 5,357 | |
| 274 |
| 5.11 | % |
Investment securities | |
| 90,110 | |
| 1,477 |
| 1.64 | % |
| 27,841 | |
| 675 |
| 2.42 | % |
Loans(1) | |
| 1,379,880 | |
| 66,296 |
| 4.80 | % |
| 700,064 | |
| 36,021 |
| 5.15 | % |
Total interest earning assets | |
| 1,714,918 | |
| 69,099 |
| 4.03 | % |
| 838,994 | |
| 39,210 |
| 4.67 | % |
Noninterest earning assets | |
| 100,358 | |
|
|
| | |
| 50,215 | |
|
|
|
| |
Total assets | |
| 1,815,276 | |
|
|
| | |
| 889,209 | |
|
|
|
| |
Liabilities and shareholders’ equity | |
|
| |
|
|
| | |
|
| |
|
|
|
| |
Interest-bearing liabilities | |
|
| |
|
|
| | |
|
| |
|
|
|
| |
Interest-bearing deposits | |
| 989,664 | |
| 6,777 |
| 0.68 | % |
| 580,822 | |
| 10,072 |
| 1.73 | % |
Borrowed funds | |
| 204,364 | |
| 2,269 |
| 1.11 | % |
| 47,485 | |
| 1,095 |
| 2.31 | % |
Total interest-bearing liabilities | |
| 1,194,028 | |
| 9,046 |
| 0.76 | % |
| 628,307 | |
| 11,167 |
| 1.78 | % |
Noninterest-bearing liabilities | |
|
| |
|
|
| | |
|
| |
|
|
|
| |
Noninterest-bearing deposits | |
| 410,357 | |
|
|
| | |
| 164,963 | |
|
|
|
| |
Other noninterest-bearing liabilities | |
| 17,675 | |
|
|
| | |
| 16,547 | |
|
|
|
| |
Shareholders’ equity | |
| 193,216 | |
|
|
| | |
| 79,392 | |
|
|
|
| |
Total liabilities and shareholders’ equity | | $ | 1,815,276 | |
|
|
| | | $ | 889,209 | |
|
|
|
| |
Net interest spread(2) | |
|
| |
|
|
| 3.27 | % |
|
| |
|
|
| 2.90 | % |
Net interest income | |
|
| | $ | 60,053 |
| | |
|
| | $ | 28,043 |
|
| |
Net interest margin(3) | |
|
| |
|
|
| 3.50 | % |
|
| |
|
|
| 3.34 | % |
| (1) | Includes nonaccrual loans. |
| (2) | Net interest spread is the difference between interest rates earned on interest earning assets and interest rates paid on interest-bearing liabilities. |
| (3) | Net interest margin is a ratio of net interest income to average interest earning assets for the same period. |
| (4) | Interest income on loans includes loan fees of $4.4 million and $0.8 million for the years ended December 31, 2020 and 2019, respectively. |
41
The following table presents information regarding the dollar amount of changes in interest income and interest expense for the periods indicated for each major component of interest earning assets and interest-bearing liabilities and distinguishes between the changes attributable to changes in volume and changes attributable to changes in interest rates. For purposes of this table, changes attributable to both rate and volume that cannot be segregated have been proportionately allocated to both volume and rate.
| | For the Year Ended December 31, 2020 | |||||||
| | Compared to 2019 | |||||||
| | Change Due To | | | | ||||
(Dollars in thousands) |
| Volume |
| Rate |
| Total | |||
Interest income |
| |
|
| |
|
| |
|
Interest-bearing deposits | | $ | 2,420 | | $ | (3,339) | | $ | (919) |
Federal funds sold | |
| 328 | |
| (737) | |
| (409) |
Federal Reserve Bank stock, Federal Home Loan Bank stock and other corporate stock | |
| 113 | |
| 27 | |
| 140 |
Investment securities | |
| 1,510 | |
| (708) | |
| 802 |
Loans | |
| 34,979 | |
| (4,704) | |
| 30,275 |
Total | | $ | 39,350 | | $ | (9,461) | | $ | 29,889 |
Interest expense | |
|
| |
|
| |
|
|
Interest-bearing deposits | |
| 7,088 | |
| (10,383) | |
| (3,295) |
Borrowed funds | |
| 3,622 | |
| (2,448) | |
| 1,174 |
Total | | $ | 10,710 | | $ | (12,831) | | $ | (2,121) |
Net interest income increased by $32.0 million to $60.1 million for the year ended December 31, 2020 compared to the year ended December 31, 2019. Our total interest income was impacted by an increase in interest earning assets, primarily due to the MBI business combination, our participation in the SBA’s PPP, with some of these loans match funded with PPPLF advances of $101.4 million, and new organic growth. Average total interest earning assets were $1.7 billion for the year ended December 31, 2020 compared with $0.8 billion for the year ended December 31, 2019. The annualized yield on those interest earning assets decreased 64 basis points from 4.67% for the year ended December 31, 2019 to 4.03% for the year ended December 31, 2020 due to the reductions in the federal funds target interest rates by the Federal Reserve as well as loans repricing, coupled with higher yielding loan payoffs. Our yield on interest earning assets declined during the year ended December 31, 2020, which was partially offset by lower interest expense on our interest-bearing deposits and earnings credits accumulated during the year of $26.5 thousand. The increase in the average balance of interest earning assets was driven primarily by growth in our loan portfolio of $0.9 billion, representing an increase of 109.5%, to $1.6 billion for the year ended December 31, 2020 compared to $0.7 billion for the year ended December 31, 2019.
Average interest-bearing liabilities increased by $0.6 billion, or 90.0%, from $0.6 billion for the year ended December 31, 2019 to $1.2 billion for the year ended December 31, 2020. The increase was primarily due to a $0.4 billion, or 70.4%, increase in the average balance of interest-bearing deposits. The increase in the average balance of interest-bearing deposits was primarily due to increases in certificates of deposit and money market accounts for the year ended December 31, 2020 compared to for the year ended December 31, 2019, and, to a lesser extent, negotiable order of withdrawal accounts, or NOW accounts. The annualized average interest rate paid on average interest-bearing liabilities decreased to 0.76% for the year ended December 31, 2020 compared to 1.78% for the year ended December 31, 2019, while the annualized average interest rate paid on interest-bearing deposits decreased 105 basis points to 0.68% and the annualized average interest rate paid on borrowed funds increased by 120 basis points to 1.11%. The decreases in annualized average interest rates primarily reflected a decrease in market interest rates due to decreases in the federal funds target interest rate during the year ended December 31, 2020. For year ended December 31, 2020, our average other noninterest-bearing liabilities increased $1.2 million, or 6.8%, to $17.7 million from $16.5 million during the year ended December 31, 2019. Average noninterest-bearing deposits also increased $245.4 million, or 148.8%, from $165.0 million to $410.4 million for the same periods. For the year ended December 31, 2020, our annual net interest margin was 3.50% and net interest spread was 3.27%. For the year ended December 31, 2019, annual net interest margin was 3.34% and net interest spread was 2.90%. Our net interest margin was adversely affected by 0.16% during the year ended December 31, 2020, compared to the same period in 2019, as a result of the recent reductions in the federal funds target interest rates as well as continued declines in the 10-year treasury yield, average rates earned on
42
interest earning assets and average rates paid on our interest-bearing deposits generally declined during the year ended December 31, 2020. Correspondingly new loans were priced at lower yields in comparison to previously held loans which led to numerous loan payoffs at the beginning of 2020 compared to 2019.
Provision for Loan Losses
The provision for loan losses is a charge to income in order to bring our allowance for loan losses to a level deemed appropriate by management. For a description of the factors taken into account by our management in determining the allowance for loan losses see “Management’s Discussion and Analysis of Financial Condition and Results of Operations - Allowance for Loan Losses.”
Our provision for loan losses amounted to $10.0 million for 2020 and $0.9 million for 2019. The increase from 2019 to 2020 was primarily due to a specific reserve of $7.6 million recorded to address the impairment of the Coex loan, the growth of our loan portfolio and the anticipated decline in worldwide economic activity due the actual and projected effects of COVID-19. Our allowance for loan losses as a percentage of total loans, net of overdrafts and excluding PPP loans was 1.10% and 0.83% for the years ended December 31, 2020 and 2019, respectively (non-GAAP, see Explanation of Certain Unaudited Non-GAAP Financial Measures). The increase was primarily due to the Company addressing the impairment of the Coex loan in the third quarter of 2020. See “Management’s Discussion and Analysis of Financial Condition and Results of Operations - Coex Coffee International Inc.” We recorded three net charge-offs for $0.3 million for the year ended December 31, 2020. We did not record any net charge-offs for the year ended December 31, 2019. As of December 31, 2020, MBI purchase accounting loan marks were $18.8 million.
Noninterest Income
Our primary sources of recurring noninterest income are service charges on deposit accounts, income from Bank owned life insurance, origination fees for Small Business Administration, or SBA loans, swap referral fees and other fees and charges. Noninterest income does not include loan origination fees to the extent they exceed the direct loan origination costs, which are generally recognized over the life of the related loan as an adjustment to yield using the interest method. The following table presents the major categories of noninterest income for the periods indicated.
| | Year Ended December 31, | | ||||||
(Dollars in thousands) |
| 2020 |
| 2019 |
| Increase (Decrease) |
| ||
Noninterest income |
| |
|
| |
|
|
|
|
Service charges on deposit accounts | | $ | 1,196 | | $ | 273 | | 338.1 | % |
Income from Bank owned life insurance | |
| 502 | |
| 409 | | 22.7 | % |
Gain on sale and call of securities | |
| 37 | |
| 8 | | 362.5 | % |
SBA origination fees | |
| 114 | |
| 79 | | 44.3 | % |
SWAP referral fees | |
| 1,026 | |
| 922 | | 11.3 | % |
Loans Held for Sale | | | 808 | | | 303 | | 166.7 | % |
Other | | | 623 | | | 814 | | (23.5) | % |
Total noninterest income | | $ | 4,306 | | $ | 2,808 | | 53.3 | % |
Noninterest income for 2020 was $4.3 million, a $1.5 million or 53.3% increase compared to noninterest income of $2.8 million for 2019. The increase was primarily due an increase in deposit accounts service charges, of $0.9 million, or 338.1%, during the year ended December 31, 2020 compared to 2019 due to deposit growth. We also experienced an increase in revenue from loans held for sale of $0.5 million, or 166.7% during the year ended December 31, 2020 compared to 2019.
Noninterest Expense
Generally, noninterest expense is composed of all employee expenses and costs associated with operating our facilities, obtaining and retaining client relationships and providing banking services. The largest component of noninterest expense is salaries and employee benefits. Noninterest expense also includes operational expenses, such as occupancy and equipment expenses, professional fees, acquisition expenses, data processing expenses, advertising
43
expenses, loan processing expenses and other general and administrative expenses, including FDIC assessments, communications, travel, meals, training, supplies and postage. The following table presents the major categories of noninterest expense for the periods indicated.
| | Year Ended December 31, | | ||||||
| | | | | | | | Increase | |
(Dollars in thousands) |
| 2020 |
| 2019 |
| (Decrease) |
| ||
Noninterest expense |
| |
|
| |
|
|
|
|
Salaries and employee benefits | | $ | 25,579 | | $ | 18,521 | | 38.1 | % |
Occupancy and equipment | |
| 4,292 | |
| 2,567 | | 67.2 | % |
Data processing | |
| 1,276 | |
| 498 | | 156.2 | % |
Marketing | |
| 545 | |
| 410 | | 32.9 | % |
Professional fees | |
| 2,373 | |
| 1,253 | | 89.4 | % |
Acquisition expenses | | | 3,328 | | | — | | 100.0 | % |
Regulatory assessments | | | 1,112 | | | 600 | | 85.3 | % |
Other | | | 5,115 | | | 3,148 | | 62.5 | % |
Total noninterest expense | | $ | 43,620 | | $ | 26,997 | | 61.6 | % |
Noninterest expense amounted to $43.6 million in 2020, an increase of $16.6 million, or 61.6%, compared to $27.0 million for the year ended December 31, 2019. The increase was primarily due to the MBI business combination expenses as well as an increase in salaries and benefits from increased employee headcount, increases in occupancy and equipment expense due to the opening of two new bank branches and the digital innovation center, increases in professional services expense due to costs related to building the organizational infrastructure of a publicly traded company and a charitable contribution of $0.3 million to the AAA Scholarship Foundation.
Income Tax Expense
The amount of income tax expense we incur is influenced by the amounts of our pre-tax income, and other nondeductible expenses. Deferred tax assets and liabilities are reflected at current income tax rates in effect for the period in which the deferred tax assets and liabilities are expected to be realized or settled. As changes in tax laws or rates are enacted, such as the Tax Act, deferred tax assets and liabilities are adjusted through the provision for income taxes. Valuation allowances are established when necessary to reduce deferred tax assets to the amount expected to be realized.
Income tax expense was $2.4 million for 2020 and $0.7 million for 2019. Our effective tax rates for 2020 and 2019 were 22.5% and 21.9%, respectively.
Financial Condition
Our total assets grew to $2.1 billion at December 31, 2020, an increase of $1.0 billion, or 95.3%, compared to December 31, 2019 as a result of the MBI acquisition, our participation in the SBA’s PPP, with some of these loans match funded with PPPLF advances of $101.4 million, and new organic growth. At December 31, 2020, the Company had a gross PPP loan balance of $190.0 million. Net loans grew across all loan types due to new organic originations (including PPP) of $0.6 billion, acquisitions of $0.5 billion, offset by net paybacks and advances of approximately $0.3 billion, resulting in total net loan gowth of $0.9 billion, or 109.5%, for the year ended December 31, 2020. Interest-bearing deposits increased $0.5 billion, or 67.1%, during the year ended December 31, 2020, due to the acquisition as well as organic growth which provided us with additional capital to fund our growing loan pipeline. Shareholders’ equity increased $136.3 million, or 171.8%, to $215.6 million at December 31, 2020 compared to December 31, 2019, primarily due to the acquisition of MBI and the closing of our IPO. Net income resulted in an increase to retained earnings of $8.3 million as of December 31, 2020.
44
Interest-Bearing Deposits at Other Financial Institutions
Cash that is not immediately needed to fund loans by the Bank is invested in liquid assets that also earn interest, including deposits with other financial institutions. For the year ended December 31, 2020, interest-bearing deposits at other financial institutions decreased $21.3 million, or 14.1%, to $129.3 million from $150.6 million at December 31, 2019. The decrease was primarily due to our desire to increase our investment portfolio by purchasing securities with higher returns.
Investment Securities
We use our securities portfolio to provide a secondary source of liquidity, achieve additional interest income through higher yields on funds invested (compared to other options, such as interest-bearing deposits at other banks or fed funds sold), manage interest rate risk, and meet both collateral and regulatory capital requirements.
Securities may be classified as either trading, held-to-maturity or available-for-sale. Trading securities (if any) are held principally for resale and recorded at their fair value with changes in fair value included in income. Held-to-maturity securities are those which the Company has the positive intent and ability to hold to maturity and are reported at amortized cost. Equity securities are carried at fair value, with changes in fair value reported in net income. Equity securities without readily determinable fair values are carried at cost, minus impairment, if any, plus or minus changes resulting from observable price changes in orderly transactions for the identical or a similar investment. Available-for-sale securities consist of securities not classified as trading securities nor as held-to maturity securities. Unrealized holding gains and losses on available-for-sale securities are excluded from income and reported in comprehensive income or loss. Gains and losses on the sale of available-for-sale securities are recorded on the trade date and are determined using the specific-identification method. Premiums and discounts on securities available for sale are recognized in interest income using the interest method over the period to maturity.
Our investment portfolio increased by $65.5 million, or 220.9%, to $95.1 million at December 31, 2020, from $29.6 million at December 31, 2019. The investment of a portion of the proceeds from the Company’s initial public offering and MBI acquisition are the primary reason for this increase. The Company invested these proceeds into liquid assets to fund loan growth, as well as securities available for sale. To supplement interest income earned on the Company’s loan portfolio, the Company invests in high quality mortgage-backed securities, government agency bonds, corporate bonds, community development district bonds, and equity securities (including mutual funds).
45
The following tables summarize the contractual maturities and weighted-average yields of investment securities as of December 31, 2020 and 2019 and the amortized cost and carrying value of those securities as of the indicated dates.
| | December 31, 2020 | | December 31, 2019 | ||||||||
(Dollars in thousands) |
| Book Value |
| Fair Value |
| Book Value |
| Fair Value | ||||
Securities Available for Sale |
| |
|
| |
|
| |
|
| |
|
Small Business Administration loan pools | | $ | 30,678 | | $ | 30,556 | | $ | 17,303 | | $ | 17,183 |
Mortgage-backed securities | |
| 28,514 | |
| 28,922 | |
| 5,237 | |
| 5,185 |
United States agency obligations | |
| 3,000 | |
| 3,122 | |
| 4,000 | |
| 4,070 |
Community Development District bonds | |
| 20,582 | |
| 21,299 | |
| — | |
| — |
Municipals | | | 1,064 | | | 1,099 | | | — | | | — |
Corporate bonds | |
| 2,501 | |
| 2,510 | |
| 2,000 | |
| 2,003 |
Total | | $ | 86,339 | | $ | 87,508 | | $ | 28,540 | | $ | 28,441 |
Securities Held to Maturity | |
|
| |
|
| |
|
| |
|
|
Mortgage-backed securities | | | 345 | | | 359 | | | — | | | — |
United States Treasury | | | 202 | | | 202 | | | — | | | — |
Foreign Bonds | |
| 1,000 | | | 1,000 | |
| 214 | |
| 224 |
Total | | $ | 1,547 | | $ | 1,561 | | $ | 214 | | $ | 224 |
Equity Securities | |
|
| |
|
| |
|
| |
|
|
Mutual Funds | |
| 6,005 | |
| 6,005 | |
| 971 | |
| 971 |
Total | | $ | 6,005 | | $ | 6,005 | | $ | 971 | | $ | 971 |
| | | | | | More than One Year | | More than Five Years | | | | | | | | | | | | ||||||||||
| | One Year or Less | | Through Five Years | | Through 10 Years | | More than 10 Years | | Total | | ||||||||||||||||||
| | | | | Weighted | | | | | Weighted | | | | | Weighted | | | | | Weighted | | | | | | | | Weighted | |
At December 31, 2020 | | | | Average | | | | Average | | | | Average | | | | Average | | | | | | | Average | | |||||
(Dollars in thousands) |
| Book Value |
| Yield | | Book Value |
| Yield | | Book Value |
| Yield | | Book Value |
| Yield | | Book Value |
| Fair Value |
| Yield | | ||||||
Securities Available for Sale | | |
| |
|
| |
| |
|
| |
| |
| | | | | | | |
| | |
| |
| |
Small Business Administration loan pools | | $ | 5 | | — | % | $ | 22 | | 1.22 | % | $ | 23,082 | | 1.34 | % | $ | 7,569 | | 1.52 | % | $ | 30,678 | | $ | 30,556 | | 1.39 | % |
Mortgage-backed securities | |
| — | | — | % |
| — | | — | % |
| 6,197 | | 0.56 | % |
| 22,317 | | 1.38 | % |
| 28,514 | |
| 28,922 | | 1.20 | % |
United States agency obligations | |
| — | | — | % |
| 3,000 | | 2.64 | % |
| — | | — | % |
| — | | — | % |
| 3,000 | |
| 3,122 | | 2.64 | % |
Community Development District bonds | | | 1,257 | | 3.85 | % | | 18,612 | | 3.86 | % | | 398 | | 4.70 | % | | 315 | | 3.00 | % | | 20,582 | | | 21,299 | | 3.86 | % |
Municipals | | | — | | — | % | | 532 | | 1.64 | % | | 532 | | 1.86 | % | | — | | — | % | | 1,064 | | | 1,099 | | 1.75 | % |
Corporate bonds | |
| 1,001 | | 0.96 | % |
| 1,500 | | 1.29 | % |
| — | | — | % |
| — | | — | % |
| 2,501 | |
| 2,510 | | 1.13 | % |
Total | | $ | 2,263 | | 2.56 | % | $ | 23,666 | | 3.49 | % | $ | 30,209 | | 1.23 | % | $ | 30,201 | | 1.43 | % | $ | 86,339 | | $ | 87,508 | | 1.96 | % |
Securities Held to Maturity | |
| | | | | | | | | | | | | | | | | | | | | | | | | | | |
Mortgage-backed securities | | | — | | — | % | | — | | — | % | | — | | — | % | | 345 | | 2.33 | % | | 345 | | | 359 | | 2.33 | % |
United States Treasury | | | 202 | | 0.18 | % | | — | | — | % | | — | | — | % | | — | | — | % | | 202 | | | 202 | | 0.18 | % |
Foreign Bonds | | | 1,000 | | 0.72 | % | | — | | — | % | | — | | — | % | | — | | — | % | | 1,000 | | | 1,000 | | 0.72 | % |
Total | | $ | 1,202 | | 0.63 | % | $ | — | | — | % | $ | — | | — | % | $ | 345 | | 2.33 | % | $ | 1,547 | | $ | 1,561 | | 1.01 | % |
Equity Securities | |
| | |
| |
|
| |
| |
|
| |
| |
|
| |
| |
|
| |
|
| |
| |
Mutual Funds | |
| 6,005 | | 1.48 | % |
| — | | — | % |
| — | | — | % |
| — | | — | % |
| 6,005 | |
| 6,005 | | 1.48 | % |
Total | | $ | 6,005 | | 1.48 | % | $ | — | | — | % | $ | — | | — | % | $ | — | | — | % | $ | 6,005 | | $ | 6,005 | | 1.48 | % |
Loan Portfolio
Our primary source of income is derived from interest earned on loans. Our loan portfolio consists of loans secured by real estate as well as commercial business loans, construction and development and other consumer loans. Our loan clients primarily consist of small to medium sized businesses, the owners and operators of these businesses as well as other professionals and entrepreneurs. Our owner-occupied and investment commercial real estate loans, residential construction loans and commercial business loans provide us with higher risk-adjusted returns, shorter maturities and more sensitivity to interest rate fluctuations, and are complemented by our relatively lower risk residential real estate loans to individuals. Our lending activities are principally directed to our market area consisting of the Miami-Dade
46
MSA. The following table summarizes and provides additional information about certain segments of our loan portfolio as of the dates indicated.
| | December 31, 2020 | | December 31, 2019 | | ||||||
(Dollars in thousands) |
| Amount |
| Percent |
| Amount |
| Percent |
| ||
Commercial real estate | | $ | 777,776 |
| 46.7 | % | $ | 270,981 |
| 34.2 | % |
Owner Occupied | |
| 286,992 |
| — | |
| 112,618 |
| — | |
Non-Owner Occupied | |
| 490,784 |
| — | |
| 158,363 |
| — | |
Residential real estate | |
| 380,491 |
| 22.8 | % |
| 342,257 |
| 43.2 | % |
Commercial (Non-PPP) | |
| 206,665 |
| 12.4 | % |
| 129,477 |
| 16.3 | % |
Commercial (PPP) | | | 189,977 | | 11.4 | % | | — | | — | % |
Construction and development | |
| 99,883 |
| 6.0 | % |
| 41,465 |
| 5.2 | % |
Consumer and other loans | |
| 11,688 |
| 0.7 | % |
| 8,287 |
| 1.1 | % |
Total loans | | $ | 1,666,480 |
| 100.0 | % | $ | 792,467 |
| 100.0 | % |
Unearned loan origination (fees) costs, net | |
| (5,578) |
|
| |
| (752) |
|
| |
Allowance for loan losses | |
| (16,259) |
|
| |
| (6,548) |
|
| |
Loans, net | | $ | 1,644,643 |
|
| | $ | 785,167 |
|
| |
Commercial Real Estate Loans. We originate both owner-occupied and non-owner-occupied commercial real estate loans. These loans may be more adversely affected by conditions in the real estate markets or in the general economy. Commercial real estate loans that are secured by owner-occupied commercial real estate and primarily collateralized by operating cash flows are also included in this category of loans. As of December 31, 2020, we had $287.0 million of owner-occupied commercial real estate loans and $490.8 million of investment commercial real estate loans, representing 36.9% and 63.1%, respectively, of our commercial real estate portfolio. As of December 31, 2020, the average loan balance of loans in our commercial real estate loan portfolio was approximately $1.2 million for owner-occupied and $1.6 million for non-owner-occupied. Commercial real estate loan terms are generally extended for 10 years or less and amortize generally over 25 years or less. Terms of 15 years are permitted where the loan is fully amortized over the term of the loan. The maximum loan to value is generally, 80% of the market value or purchase price, but may be as high as 90% for SBA 504 owner-occupied loans. Our credit policy also usually requires a minimum debt service coverage ratio of 1.20x. As of December 31, 2020, our weighted-average loan-to-value ratios for owner-occupied and non-owner-occupied commercial real estate were 46.9% and 50.8%, respectively and debt service coverage ratios were 2.33x and 1.74x, respectively. The interest rates on our commercial real estate loans have initial fixed rate terms that adjust typically at five years and we routinely charge an origination fee for our services. We generally require personal guarantees from the principal owners of the business, supported by a review of the principal owners’ personal financial statements and global debt service obligations. All commercial real estate loans with an outstanding balance of $1.0 million or more are reviewed at least annually. The properties securing the portfolio are located primarily
47
throughout our market and are generally diverse in terms of type. This diversity helps reduce the exposure to adverse economic events that affect any single industry.
| | As of December 31, 2020 |
| |||
(Dollars in thousands) | | Amount | | Percent |
| |
Commercial Real Estate |
| |
|
|
| |
Auto (Car Lot/Auto Repair) | | $ | 22,483 |
| 2.9 | % |
Educational Facility | |
| 14,328 |
| 1.8 | % |
Gas Station | |
| 64,162 |
| 8.2 | % |
Hotel | |
| 54,324 |
| 7.0 | % |
Mixed Use | | | 29,987 | | 3.9 | % |
Multifamily | |
| 98,837 |
| 12.7 | % |
Office | |
| 111,850 |
| 14.4 | % |
Other / Special Use | |
| 41,739 |
| 5.4 | % |
Religious Facility | |
| 8,450 |
| 1.1 | % |
Retail | |
| 192,105 |
| 24.7 | % |
Vacant Land | |
| 7,847 |
| 1.0 | % |
Warehouse | |
| 131,664 |
| 16.9 | % |
Total | | $ | 777,776 |
| 100.0 | % |
| | As of December 31, 2020 |
| |||
(Dollars in thousands) |
| Amount |
| Percent |
| |
Commercial Real Estate |
| |
|
|
| |
Broward | | $ | 118,408 |
| 15.2 | % |
Miami-Dade | |
| 501,168 |
| 64.4 | % |
Palm Beach | |
| 113,405 |
| 14.6 | % |
Other FL County | |
| 27,154 |
| 3.5 | % |
Out of State | |
| 17,641 |
| 2.3 | % |
Total | | $ | 777,776 |
| 100.0 | % |
As of December 31, 2020, non-owner occupied commercial real estate loans of $490.8 million represented 33.5% of total risk-weighted assets.
Construction and Development Loans. The majority of our construction loans are offered within the Miami-Dade MSA to builders primarily for the construction of single-family homes and condominium and townhouse conversions or renovations and, to a lesser extent, to individuals. Our construction loans typically have terms of 12 to 18 months with the goal of transitioning the borrowers to permanent financing or re-underwriting and selling into the secondary market. According to our credit policy, the loan to value ratio may not exceed the lesser of 80% of the appraised value, as established by an independent appraisal, or 85% of costs for residential construction and 90% of costs for SBA 504 loans. As of December 31, 2020, our weighted average loan-to-value ratio on our construction, vacant land, and land development loans were 57.3%, 53.5% and 47.9%, respectively. All construction and development loans require an interest reserve account, which is sufficient to pay the loan through completion of the project. We conduct annual stress testing of our construction loan portfolio and closely monitor underlying real estate conditions as well as our borrowers’ trends of sales valuations as compared to underwriting valuations as part of our ongoing risk management efforts. We
48
also closely monitor our borrowers’ progress in construction buildout and strictly enforce our original underwriting guidelines for construction milestones and completion timelines.
| | As of December 31, 2020 |
| |||
(Dollars in thousands) | | Amount | | Percent |
| |
Construction & Development |
| |
|
|
| |
1 – 4 Family Construction | | $ | 45,209 |
| 45.3 | % |
Commercial Construction | |
| 34,082 |
| 34.1 | % |
Land Development | |
| 5,789 |
| 5.8 | % |
Vacant Land | |
| 14,803 |
| 14.8 | % |
Total | | $ | 99,883 |
| 100.0 | % |
| | As of December 31, 2020 |
| |||
(Dollars in thousands) |
| Amount |
| Percent |
| |
Construction & Development |
| |
|
|
| |
Broward | | $ | 21,737 |
| 21.8 | % |
Miami-Dade | |
| 57,192 |
| 57.3 | % |
Palm Beach | |
| 15,137 |
| 15.2 | % |
Other FL County | |
| 5,817 |
| 5.8 | % |
Total | | $ | 99,883 |
| 100.0 | % |
As of December 31, 2020, total construction and land development loans of $99.9 million represented 6.8% of total risk-weighted assets.
Residential Real Estate Loans. We offer one-to-four family mortgage loans primarily on owner-occupied primary residences which make up approximately 80% of our residential loan portfolio and, to a lesser extent, investor-owned residences, which make up approximately 20% of our residential loan portfolio. Our residential loans also include home equity lines of credit, which totaled approximately $60.2 million, or approximately 15.8% of our residential loan portfolio as of December 31, 2020. The average loan balance of closed-end residential loans in our residential portfolio was approximately $0.7 million as of December 31, 2020. Our one-to-four family residential loans have a relatively small balance spread between many individual borrowers compared to our other loan categories. Our owner-occupied residential real estate loans usually have fixed rates for five or seven years and adjust on an annual basis after the initial term based on a typical maturity of 30 years. Upon the implementation of rules under the Dodd-Frank Wall Street Reform and Consumer Protection Act, the origination, closing and servicing of the traditional residential loan products became much more complex, which led to increased cost of compliance and training. As a result, many banks exited the business, which created an opportunity for the banks that remained in the space. While the use of technology, and other related origination strategies have allowed non-bank originators to gain significant market share over the last several years, traditional banks that made investments in personnel and technology to comply with the new requirements have typically experienced loan growth. Unlike many of our competitors, we have been able to effectively compete in the residential loan market, while simultaneously doing the same in the commercial loan market which has enabled us to establish a broader and deeper relationship with our borrowers. Additionally, by offering a full line of residential loan products, the owners of the many small to medium sized businesses that we lend to use us, instead of a competitor, for financing a personal residence. This greater bandwidth to the same market has been a significant contributor to our
49
growth and market share in South Florida. The following chart shows our residential real estate portfolio by loan type and the weighted average loan-to-value ratio for each loan type.
| | As of December 31, 2020 |
| |||||
(Dollars in thousands) |
| Amount |
| Percent |
| LTV (%) |
| |
Residential Real Estate | |
|
|
|
|
|
| |
Owner Occupied | | $ | 270,960 |
| 71.2 | % | 57.8 | % |
Investor Owned Residences | | | 48,026 | | 12.6 | % | 50.7 | % |
HELOC | | | 60,235 | | 15.8 | % | 57.1 | % |
Loans Held for Sale and PennyMac | | | 1,270 | | 0.3 | % | 0.0 | % |
Total | | $ | 380,491 | | 100.0 | % | | |
Commercial Loans (non-PPP). In addition to our other loan products, we provide general commercial loans, including commercial lines of credit, working capital loans, term loans, equipment financing, letters of credit and other loan products, primarily in our market, and underwritten based on each borrower’s ability to service debt from income. These loans are primarily made based on the identified cash flows of the borrower, as determined based on a review of the client’s financial statements, and secondarily, on the underlying collateral provided by the borrower. The average loan balance of the non-PPP loans in our commercial loan portfolio was $0.5 million as of December 31, 2020. For commercial loans over $0.5 million, a global cash flow analysis is generally required, which forms the basis for the credit approval, “Global cash flow” is defined as a cash flow calculation which includes all income sources of all principals in the transaction as well as all debt payments, including the debt service associated with the proposed transaction. In general, a minimum 1.20x debt service coverage is preferred, but in no event may the debt service coverage ratio be less than 1.00x. As of December 31, 2020, the debt service coverage ratio for our Bank commercial loan portfolio was approximately 2.35x for non-PPP loans, excluding approximately 3.7% of the commercial loan portfolio that is cash secured. Most commercial business loans are secured by a lien on general business assets including, among other things, available real estate, accounts receivable, promissory notes, inventory and equipment, and we generally obtain a personal guaranty from the borrower or other principal. The following chart shows our commercial loan portfolio by industry segment as of December 31, 2020.
| | As of December 31, 2020 |
| |||
(Dollars in thousands) | | Amount | | Percent |
| |
Commercial Loans |
| |
|
|
| |
Business Products | | $ | 1,163 |
| 0.6 | % |
Business Services | |
| 29,584 |
| 14.3 | % |
Communication | |
| 17,740 |
| 8.6 | % |
Construction | |
| 19,269 |
| 9.3 | % |
Finance | |
| 56,652 |
| 27.4 | % |
Healthcare | |
| 7,379 |
| 3.6 | % |
Services | |
| 23,319 |
| 11.3 | % |
Technology | |
| 853 |
| 0.4 | % |
Trade | |
| 44,359 |
| 21.5 | % |
Transportation | | | 2,928 | | 1.4 | |
Other | |
| 3,419 |
| 1.7 | % |
Total | | $ | 206,665 |
| 100.0 | % |
Paycheck Protection Program (PPP). The Company has participated in the PPP offered through the United States Small Business Administration (SBA) by way of the Coronavirus Aid Relief and Economic Security (CARES) Act that was passed at the end of the first quarter 2020. As a qualified SBA lender, the Company was automatically authorized to originate PPP loans. To help clients, the Company added an online PPP application form and automated the PPP loan closing documentation process. The Company processed, closed and funded 1,506 loans representing $226.2 million in relief proceeds throughout 2020. The majority of these loans were initially pledged to the Federal Reserve as part of the Paycheck Protection Program Liquidity Facility (PPPLF). The PPPLF pledged loans are non-recourse to the Bank. These loans are guaranteed by the government and as such no loan loss reserves have been recorded for these loans. In addition, the Company paid off approximately $123.6 million in PPPLF advances during the year ended December 31, 2020, and
50
had a balance of $101.4 million remaining as of December 31, 2020. At December 31, 2020, the Company had a gross PPP loan balance of $190.0 million. Interest income on loans include PPP loan fees. PPP loan fees recognized during the year ended December 31, 2020 were $2.5 million.
Consumer and Other Loans. We offer consumer, or retail credit, to individuals for household, family, or other personal expenditures. Generally, these are either in the form of closed-end/installment credit loans or open-end/revolving credit loans. Occasionally, we will make unsecured consumer loans to highly qualified clients. Repayment terms are generally shorter in nature.
The following chart illustrates our gross loans net of unearned income and weighted average loan-to-value ratio for our collateralized loan portfolio as of the end of the months indicated.
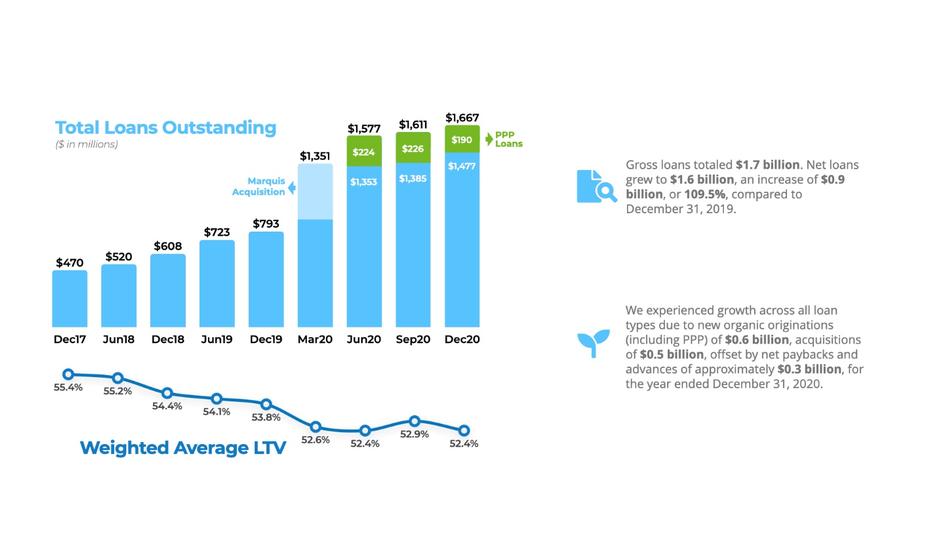
The repayment of loans is a source of additional liquidity for us. The following table details maturities and sensitivity to interest rate changes for our loan portfolio at December 31, 2020.
| | December 31, 2020 | ||||||||||
|
| Due in One |
| Due in One to |
| Due After |
| | | |||
(Dollars in thousands) | | Year or Less | | Five Years | | Five Years | | Total | ||||
Commercial Real Estate | | $ | 63,277 | | $ | 221,328 | | $ | 493,171 | | $ | 777,776 |
Residential Real Estate | |
| 16,386 | |
| 23,832 | |
| 340,273 | |
| 380,491 |
Commercial* | |
| 93,338 | |
| 232,428 | |
| 70,876 | |
| 396,642 |
Construction and Development | |
| 37,205 | |
| 30,165 | |
| 32,513 | |
| 99,883 |
Consumer and Other | |
| 5,619 | |
| 3,855 | |
| 2,214 | |
| 11,688 |
Total loans | | $ | 215,825 | | $ | 511,608 | | $ | 939,047 | | $ | 1,666,480 |
Amounts with fixed rates | | $ | 110,152 | | $ | 473,839 | | $ | 910,452 | | $ | 1,494,443 |
Amounts with floating rates | | $ | 105,673 | | $ | 37,769 | | $ | 28,595 | | $ | 172,037 |
*Includes Paycheck Protection Program (PPP) loans. | | | | | | | | | | | | |
51
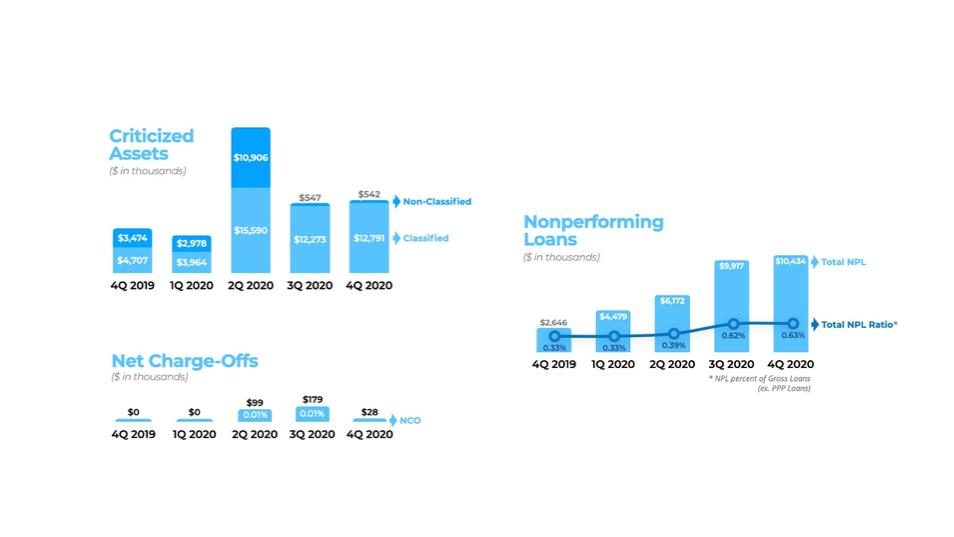
Nonperforming Assets
Loans are considered past due if the required principal and interest payments have not been received as of the date such payments were due. Loans are placed on nonaccrual status when, in management’s opinion, the borrower may be unable to meet payment obligations as they become due, as well as when required by regulatory provisions. Loans may be placed on nonaccrual status regardless of whether or not such loans are considered past due. In general, we place loans on nonaccrual status when they become 90 days past due. We also place loans on nonaccrual status if they are less than 90 days past due if the collection of principal or interest is in doubt. When interest accrual is discontinued, all unpaid accrued interest is reversed from income. Interest income is subsequently recognized only to the extent cash payments are received in excess of principal due. Loans are returned to accrual status when all the principal and interest amounts contractually due are brought current and future payments are, in management’s opinion, reasonably assured. Any loan which the Bank deems to be uncollectible, in whole or in part, is charged off to the extent of the anticipated loss. Loans that are past due for 180 days or more are charged off unless the loan is well secured and in the process of collection. We currently have no loans that are 90 days or greater past due and accruing as of December 31, 2020.
We believe our disciplined lending approach and focused management of nonperforming assets has resulted in sound asset quality and timely resolution of problem assets. We have several procedures in place to assist us in maintaining the overall quality of our loan portfolio, such as annual reviews of the underlying financial performance of all commercial loans in excess of $1.0 million. We also engage in annual stress testing of the loan portfolio, and proactive collection and timely disposition of past due loans. Our bankers follow established underwriting guidelines, and we also monitor our delinquency levels for any negative trends. As a result, we have, in recent years, experienced a relatively low level of nonperforming assets. We had nonperforming assets of $10.4 and $2.3 million as of December 31, 2020 and 2019, or 0.51% and 0.22% of total assets, respectively. Occasionally, loans that we make will be impacted due to the occurrence of unforeseen events, such as COVID-19, which was a primary factor in the recent increase in our nonperforming assets relative to our historically low, near-zero levels. However, we believe that our low loan-to-value loan portfolio is well positioned to withstand these types of discrete events as they occur from time. There
52
can be no assurance, however, that our loan portfolio will not become subject to increasing pressures from deteriorating borrower credit due to general economic conditions.
(Dollars in thousands) |
| December 31, 2020 |
| December 31, 2019 |
| ||
Nonaccrual Loans | | | | | | | |
Commercial real estate | | $ | — | | $ | — | |
Residential real estate | |
| — | |
| 483 | |
Commercial | |
| 9,127 | |
| 1,797 | |
Construction and development | |
| — | |
| — | |
Consumer and other loans | |
| 1,307 | |
| — | |
Accruing loans 90 or more days past due | |
| — | |
| — | |
Total nonperforming loans | | $ | 10,434 | | $ | 2,280 | |
Other real estate owned | |
| — | |
| — | |
Total nonperforming assets | | $ | 10,434 | | $ | 2,280 | |
Restructured loans-nonaccrual | | $ | — | | $ | — | |
Restructured loans-accruing | | $ | 298 | | $ | 367 | |
Ratio of nonperforming loans to total loans | |
| 0.63 | % |
| 0.33 | % |
Ratio of nonperforming assets to total assets | |
| 0.51 | % |
| 0.22 | % |
Coex Coffee International Inc.
The Company learned on July 15, 2020 that one of its borrowers, Coex Coffee International Inc. (“Coex”), filed a Petition Commencing an Assignment for the Benefit of Creditors in the 11th Judicial Circuit Court in Miami-Dade County, Florida. This state court action is similar to a federal bankruptcy case where the assignee is tasked, under the oversight of a judge, with the repayment of creditors of a troubled entity. The court has appointed Philip Von Kahle as the “Assignee.” Coex was primarily in the business of purchasing and selling green coffee beans. Coex financed its business through various credit facilities from ten financial institutions in an amount totaling $191.9 million. On July 15, 2020, the Company had a total of thirty-one (31) advances to Coex for the purchase of coffee from growers for period of up to 90 days with an aggregate outstanding balance of $12.4 million. However, the Company had a current balance of $8.3 million net of a participation, without recourse, to another financial institution. The loans are collateralized by coffee beans and the proceeds from coffee sales. While at the time of petition, the advances were current, the preliminary records reviewed by the Assignee indicate that certain loan documents, including purchase orders, were fraudulent and that only $1.2 million of the associated value may have been attributed as collateral against the aggregate outstanding balance. In the third quarter of 2020, the Company recorded an impairment of $7.6 million against the Coex loan. The Company continues to vigorously pursue all courses of action available to mitigate potential losses, including a potential insurance claim, in order to recover as much of the current outstanding balance as possible. At this time, the Company is unable to provide any assurances whether these courses of action will ultimately be successful.
Credit Quality Indicators
We strive to manage and control credit risk in our loan portfolio by adhering to well-defined underwriting criteria and account administration standards established by our management team and approved by our Board. We employ a dedicated Chief Risk Officer and have established a Risk Committee at the Bank level which oversees, among other things, risks associated with our lending activities and enterprise risk management. Our written loan policies document underwriting standards, approval levels, exposure limits and other limits or standards that our management team and Board deem appropriate for an institution of our size and character. Loan portfolio diversification at the obligor, product and geographic levels are actively managed to mitigate concentration risk, to the extent possible. In addition, credit risk management includes an independent credit review process that assesses compliance with policies, risk rating standards and other critical credit information. In addition, we adhere to sound credit principles and evaluate our clients’ borrowing needs and capacity to repay, in conjunction with their character and financial history. Our management team and Board place significant emphasis on balancing a healthy risk profile and sustainable growth. Specifically, our approach to lending seeks to balance the risks necessary to achieve our strategic goals while ensuring that our risks are appropriately managed and remain within our defined limits. We believe that our credit culture is a key factor in our relatively low levels of nonperforming loans and nonperforming assets compared to other institutions within our market.
53
We categorize loans into risk categories based on relevant information about the ability of borrowers to service their debt including: current financial information, historical payment experience, credit documentation, public information, and current economic trends, among other factors. Generally, all credits greater than $1.0 million, other than residential real estate loans, are reviewed no less than annually to monitor and adjust, if necessary, the credit risk profile. Loans classified as “substandard” or “special mention” are reviewed quarterly for further evaluation to determine if they are appropriately classified and whether there is any impairment. Beyond the annual review, all loans are graded at initial issuance. In addition, during the renewal process of any loan, as well as if a loan becomes past due, we will determine the appropriate loan grade. Loans excluded from the review process above are generally classified as “pass” credits until: (a) they become past due; (b) management becomes aware of deterioration in the credit worthiness of the borrower; or (c) the client contacts us for a modification. In these circumstances, the loan is specifically evaluated for potential reclassification to special mention, substandard, doubtful, or even a charged-off status. We use the following definitions for risk ratings:
Pass. A Pass loan’s primary source of loan repayment is satisfactory, with secondary sources very likely to be realized if necessary. The pass category includes the following:
| ● | Riskless: Loans that are fully secured by liquid, properly margined collateral (listed stock, bonds, or other securities; savings accounts; certificates of deposit; loans or that portion thereof which are guaranteed by the United States Government or agencies backed by the “full faith and credit” thereof; loans secured by properly executed letters of credit from prime financial institutions). |
| ● | High Quality Risk: Loans to recognized national companies and well-seasoned companies that enjoy ready access to capital markets or to a range of financing alternatives. Borrower’s public debt offerings are accorded highest ratings by recognized rating agencies, e.g., Moody’s or Standard & Poor’s. Companies display sound financial conditions and consistent superior income performance. The borrower’s trends and those of the industry to which it belongs are positive. |
| ● | Satisfactory Risk: Loans to borrowers, reasonably well established, that display satisfactory financial conditions, operating results and excellent future potential. Capacity to service debt is amply demonstrated. Current financial strength, while financially adequate, may be deficient in a number of respects. Normal comfort levels are achieved through a closely monitored collateral position and/or the strength of outside guarantors. |
| ● | Moderate Risk: Loans to borrowers who are in non-compliance with periodic reporting requirements of the loan agreement, and any other credit file documentation deficiencies, which do not otherwise affect the borrower’s credit risk profile. This may include borrowers who fail to supply updated financial information that supports the adequacy of the primary source of repayment to service the Bank’s debt and prevents bank management to evaluate the borrower’s current debt service capacity. Existing loans will include those with consistent track records of timely loan payments, no material adverse changes to underlying collateral, and no material adverse changes to guarantor(s) financial capacity, evidenced by public record searches. |
Special mention. A Special Mention loan has potential weaknesses that deserve management’s close attention. If left uncorrected, these potential weaknesses may result in the deterioration of the repayment prospects for the asset or our credit position at some future date. Special Mention loans are not adversely classified and do not expose an institution to sufficient risk to warrant adverse classification.
Substandard. A Substandard loan is inadequately protected by the current sound worth and paying capacity of the obligor or of the collateral pledged, if any. Loans so classified must have a well-defined weakness or weaknesses that jeopardizes the liquidation of the debt. They are characterized by the distinct possibility that we will sustain some loss if the deficiencies are not corrected.
Doubtful. A loan classified Doubtful has all the weaknesses inherent in one classified Substandard with the added characteristics that the weaknesses make collection or liquidation in full, on the basis of currently existing facts, conditions, and values, highly questionable and improbable.
54
Loss. A loan classified Loss is considered uncollectible and of such little value that continuance as a bankable asset is not warranted. This classification does not mean that the asset has absolutely no recovery or salvage value, but rather it is not practical or desirable to defer writing off this basically worthless asset even though partial recovery may be affected in the future. Based on the most recent analysis performed, the risk category of loans by class of loans is as follows:
| | | | | Special | | | | | | | | | | |
(Dollars in thousands) |
| Pass |
| Mention |
| Substandard |
| Doubtful |
| Total | |||||
December 31, 2020 | | | | | | | | | | | | | | | |
Commercial real estate | | $ | 775,420 | | $ | — | | $ | 2,356 | | $ | — | | $ | 777,776 |
Residential real estate | |
| 380,062 | |
| 429 | |
| — | |
| — | |
| 380,491 |
Commercial | |
| 387,403 | |
| 112 | |
| 9,127 | |
| — | |
| 396,642 |
Construction and development | |
| 99,883 | |
| — | |
| — | |
| — | |
| 99,883 |
Consumer | |
| 10,381 | |
| — | |
| 1,307 | |
| — | |
| 11,688 |
Total | | $ | 1,653,149 | | $ | 541 | | $ | 12,790 | | $ | — | | $ | 1,666,480 |
December 31, 2019 | |
|
| |
|
| |
|
| |
|
| |
|
|
Commercial real estate | | $ | 266,346 | | $ | 2,207 | | $ | 2,428 | | $ | — | | $ | 270,981 |
Residential real estate | |
| 341,819 | |
| 438 | |
| — | |
| — | |
| 342,257 |
Commercial | |
| 126,851 | |
| 829 | |
| 1,797 | |
| — | |
| 129,477 |
Construction and development | |
| 41,465 | |
| — | |
| — | |
| — | |
| 41,465 |
Consumer | |
| 8,287 | |
| — | |
| — | |
| — | |
| 8,287 |
Total | | $ | 784,768 | | $ | 3,474 | | $ | 4,225 | | $ | — | | $ | 792,467 |
Allowance for Loan Losses
We believe that we maintain our allowance for loan losses at a level sufficient to provide for probable incurred credit losses inherent in the loan portfolio as of the balance sheet date. Credit losses arise from the borrowers’ inability or unwillingness to repay, and from other risks inherent in the lending process including collateral risk, operations risk, concentration risk, and economic risk. We consider all of these risks of lending when assessing the adequacy of our allowance. The allowance for loan losses is established through a provision charged to expense. Loans are charged-off against the allowance when losses are probable and reasonably quantifiable. Our allowance for loan losses is based on management’s judgment of overall credit quality, which is a significant estimate based on a detailed analysis of the loan portfolio. Our allowance can and will change based on revisions to our assessment of our loan portfolio’s overall credit quality and other risk factors both internal and external to us.
We evaluate the adequacy of the allowance for loan losses on a quarterly basis. The allowance consists of two components. The first component consists of those amounts reserved for impaired loans. A loan is deemed impaired when, based on current information and events, it is probable that the Bank will not be able to collect all amounts due (principal and interest), according to the contractual terms of the loan agreement. Loans are monitored for potential impairment through our ongoing loan review procedures and portfolio analysis. Classified loans and past due loans over a specific dollar amount, and all troubled debt restructurings are individually evaluated for impairment.
The approach for assigning reserves for the impaired loans is determined by the dollar amount of the loan and loan type. Impairment measurement for loans over a specific dollar are determined on an individual loan basis with the amount reserved dependent on whether repayment of the loan is dependent on the liquidation of collateral or from some other source of repayment. If repayment is dependent on the sale of collateral, the reserve is equivalent to the recorded investment in the loan less the fair value of the collateral after estimated sales expenses. If repayment is not dependent on the sale of collateral, the reserve is equivalent to the recorded investment in the loan less the estimated cash flows discounted using the loan’s effective interest rate. The discounted value of the cash flows is based on the anticipated timing of the receipt of cash payments from the borrower. The reserve allocations for individually measured impaired loans are sensitive to the extent market conditions or the actual timing of cash receipts change. Impairment reserves for smaller-balance loans under a specific dollar amount are assigned on a pooled basis utilizing loss factors for impaired loans of a similar nature.
55
The second component is a general reserve on all loans other than those identified as impaired. General reserves are assigned to various homogenous loan pools, including commercial, commercial real estate, construction and development, residential real estate, and consumer. General reserves are assigned based on historical loan loss ratios determined by loan pool and internal risk ratings that are adjusted for various internal and external risk factors unique to each loan pool. The following table analyzes the activity in the allowance over the past two years.
| | For the Year Ended December 31, | | ||||
(Dollars in thousands) |
| 2020 |
| 2019 |
| ||
Balance at beginning of period | | $ | 6,548 | | $ | 5,685 | |
Charge-offs | |
|
| |
|
| |
Commercial real estate | |
| — | |
| — | |
Residential real estate | |
| (207) | |
| — | |
Commercial | |
| (99) | |
| — | |
Construction and development | |
| — | |
| — | |
Consumer and other | |
| — | |
| — | |
Total Charge-offs | |
| (306) | |
| — | |
Recoveries | |
|
| |
|
| |
Commercial real estate | |
| — | |
| — | |
Residential real estate | |
| — | |
| — | |
Commercial | |
| — | |
| — | |
Construction and development | |
| — | |
| — | |
Consumer and other | |
| — | |
| 1 | |
Total recoveries | |
| — | |
| 1 | |
Net charge-offs (recoveries) | |
| (306) | |
| — | |
Provision for loan losses | |
| 10,017 | |
| 862 | |
Balance at end of period | | $ | 16,259 | | $ | 6,548 | |
Ratio of net charge-offs to average loans | |
| — | % |
| — | % |
ALLL as a percentage of loans (excluding PPP loans) at end of period | |
| 1.10 | % |
| 0.83 | % |
ALLL as a multiple of net charge-offs | |
| 53.1 | |
| N/A | |
ALLL as a percentage of nonperforming loans | |
| 155.8 | % |
| 287.2 | % |
Our allowance for loan losses was $16.3 million at December 31, 2020 compared to $6.5 million at December 31, 2019, an increase in the allowance of 150.8%. The increase was primarily due to the growth of our loan portfolio, the anticipated decline in worldwide economic activity due to the actual and projected effects of COVID-19, and a specific reserve of $7.6 million on the loan facility for Coex Coffee International. At December 31, 2020, our allowance for loan losses was 1.10% of total loans, net of overdrafts and excluding PPP loans (non-GAAP, see Explanation of Certain Unaudited Non-GAAP Financial Measures) and provided coverage of 155.8% of our nonperforming loans, compared to an allowance for loan losses to total gross loans (net of overdrafts) ratio of 0.83% as of December 31, 2019. We believe our allowance at December 31, 2020 was adequate to absorb potential losses inherent in our loan portfolio. As of December 31, 2020, MBI purchase accounting loan marks were $18.8 million.The following table provides an allocation of the allowance for loan losses to specific loan types as of the end of the fiscal year for each of the past two years.
| | December 31, 2020 | | December 31, 2019 | | ||||||
(Dollars in thousands) |
| Allowance |
| Percent |
| Allowance |
| Percent |
| ||
Commercial real estate | | $ | 3,159 |
| 19.4 | % | $ | 1,845 |
| 28.2 | % |
Residential real estate | |
| 2,177 |
| 13.4 | % |
| 3,115 |
| 47.6 | % |
Commercial | |
| 10,462 |
| 64.3 | % |
| 1,235 |
| 18.9 | % |
Construction and development | |
| 388 |
| 2.4 | % |
| 272 |
| 4.2 | % |
Consumer and other | |
| 73 |
| 0.4 | % |
| 81 |
| 1.2 | % |
Total allowance for loan losses | | $ | 16,259 |
| 100.0 | % | $ | 6,548 |
| 100.0 | % |
At December 31, 2020, the recorded investment in impaired loans (consisting of nonaccrual loans, troubled debt restructured loans, loans past due 90 days or more and still accruing interest and other loans based on management’
56
judgment) was $13.1 million, of which there were three impaired loans with a recorded investment of $10.4 million on nonaccrual with an allowance $8.3 million and one substandard accruing loan with a recorded investment of $2.4 million with no allowance. At December 31, 2019, the recorded investment in impaired loans was $5.1 million, $1.1 million of which required a specific reserve of $0.6 million. The increase was primarily due to the impairment of the Coex loan in the third quarter of 2020.
Impaired loans also include certain loans that were modified as troubled debt restructurings, or TDRs. At December 31, 2020, we had two loans amounting to $0.3 million that were considered to be TDRs, compared to two loans amounting to $0.4 million at December 31, 2019. We did not allocate any specific reserves to loans that have been modified as TDRs as of December 31, 2020 or 2019.
Deposits
Deposits are our primary source of funding. We offer a variety of deposit products including checking, NOW, savings, money market and time accounts all of which we actively market at competitive pricing. We generate deposits from our consumer and commercial clients through the efforts of our private bankers. We supplement our deposits with wholesale funding sources such as Quickrate and brokered deposits. However, we do not significantly rely on wholesale funding sources, which are generally viewed as less stable compared to core deposits due to the relatively higher price elasticity of demand for deposits from wholesale sources. As of December 31, 2020 and 2019, these wholesale deposits represented 4.3% and 4.6%, respectively, of our total deposits.
Interest-bearing deposits increased $475.3 million, or 67.1%, from December 31, 2019 to December 31, 2020 primarily due to a $317.3 million increase in money market account balances and a $127.2 million increase in certificates of deposit. In order to fund our loan growth, all of our bankers are actively involved with our strategic efforts and are incentivized to grow core deposits. The average rate paid on interest-bearing deposits decreased 105 basis points from 1.73% for the year ended December 31, 2019 to 0.68% for the year ended December 31, 2020. The decrease in average rates paid on interest-bearing deposits was a result of a continued decrease in market rates of interest during the year ended December 31, 2020. As of December 31, 2020, we had approximately $30.1 million in brokered deposits, 1.8% of total deposits, an increase of approximately $7.5 million, or 33.2% from December 31, 2019. We did not obtain these brokered deposits through a deposit listing agency, but rather through an existing relationship with the Bank and through the business combination with MBI. As of December 31, 2020, we had approximately $0.5 million in outstanding brokered deposits that were assumed through the business combination with MBI and are included in the total brokered deposits. These deposits meet the regulatory definition of brokered deposits and are reported accordingly.
| | For the Year Ended | | For the Year Ended | | ||||||
| | December 31, 2020 | | December 31, 2019 | | ||||||
| | Average | | | | Average | | | | ||
(Dollars in thousands) |
| Balance |
| Average Rate |
| Balance |
| Average Rate |
| ||
NOW accounts | | $ | 54,070 | | 0.35 | % | $ | 33,329 | | 0.42 | % |
Money market accounts | |
| 701,084 |
| 0.78 | % |
| 435,349 |
| 1.71 | % |
Savings accounts | |
| 15,496 |
| 0.55 | % |
| 8,678 |
| 1.35 | % |
Certificates of deposit | |
| 218,951 |
| 1.52 | % |
| 103,466 |
| 2.27 | % |
Total interest-bearing deposits | |
| 989,601 |
| 0.91 | % |
| 580,822 |
| 1.73 | % |
Noninterest-bearing deposits | |
| 410,357 |
| — | % |
| 164,963 |
| — | % |
Total deposits | | $ | 1,399,958 |
| 0.65 | % | $ | 745,785 |
| 1.35 | % |
57
The following table presents the ending balances and percentage of total deposits for the periods indicated.
| | For the Year Ended | | For the Year Ended | | ||||||
| | December 31, 2020 | | December 31, 2019 | | ||||||
| | Ending | | | | Ending | | | | ||
(Dollars in thousands) |
| Balance |
| % of Total |
| Balance |
| % of Total |
| ||
NOW accounts | | $ | 60,995 | | 3.7 | % | $ | 39,826 | | 4.5 | % |
Money market accounts | |
| 865,625 |
| 52.2 | % |
| 548,366 |
| 61.4 | % |
Savings accounts | |
| 20,750 |
| 1.3 | % |
| 11,126 |
| 1.2 | % |
Certificates of deposit | |
| 236,575 |
| 14.3 | % |
| 109,344 |
| 12.2 | % |
Total interest-bearing deposits | |
| 1,183,945 |
| 71.3 | % |
| 708,662 |
| 79.4 | % |
Noninterest-bearing deposits | |
| 475,598 |
| 28.7 | % |
| 184,211 |
| 20.6 | % |
Total deposits | | $ | 1,659,543 | | 100 | % | $ | 892,873 | | 100 | % |
The following table presents the maturities of our certificates of deposit as of December 31, 2020.
|
| | |
| Over |
| Over Six |
| | |
| | | ||
| | Three | | Three | | Months | | | | | | | |||
| | Months or | | Through | | Through | | Over | | | | ||||
(Dollars in thousands) | | Less | | Six Months | | 12 Months | | 12 Months | | Total | |||||
$100,000 or more | | $ | 55,434 | | $ | 45,229 | | $ | 61,067 | | $ | 54,730 | | $ | 216,460 |
Less than $100,000 | |
| 5,422 | |
| 3,390 | |
| 6,698 | |
| 4,605 | |
| 20,115 |
Total | | $ | 60,856 | | $ | 48,619 | | $ | 67,765 | | $ | 59,335 | | $ | 236,575 |
Borrowings
We primarily use short-term and long-term borrowings to supplement deposits to fund our lending and investment activities.
FHLB Advances. The FHLB allows us to borrow up to 25% of our assets on a blanket floating lien status collateralized by certain securities and loans. As of December 31, 2020, approximately $189.9 million in loans were pledged as collateral for our FHLB borrowings. We utilize these borrowings to meet liquidity needs and to fund certain fixed rate loans in our portfolio. As of December 31, 2020, we had $40.0 million in outstanding advances and $109.7 million in additional available borrowing capacity from the FHLB based on the collateral that we have currently pledged. The following table sets forth certain information on our FHLB borrowings during the periods presented.
| | Year Ended | | Year Ended | | ||
(Dollars in thousands) |
| December 31, 2020 |
| December 31, 2019 | | ||
Amount outstanding at period-end | | $ | 40,000 | | $ | 55,000 | |
Weighted average interest rate at period-end | |
| 1.96 | % |
| 2.10 | % |
Maximum month-end balance during period | | $ | 70,000 | | $ | 55,000 | |
Average balance outstanding during period | |
| 58,210 | |
| 47,301 | |
Weighted average interest rate during period | |
| 1.63 | % |
| 2.30 | % |
Federal Reserve Bank of Atlanta. The Federal Reserve Bank of Atlanta has an available borrower in custody arrangement which allows us to borrow on a collateralized basis. No advances were outstanding under this facility as of December 31, 2020.
Loan Participations. The Company reclassified three loans, originally recorded net of participations in March as part of the MBI acquisition in accordance with ASC Topic 860 Transfers and Servicing. As a result, both loans and other borrowings increased by $13.2 million during the fourth quarter due to the reclassification. A review of the original
58
participation documentation revealed that the agreements did not contain certain technical attributes required to qualify for sales treatment. These reclassifications do not impact earnings or capital.
PPPLF Advances. The Company participated in the PPP and processed, closed and funded 1,506 small business loans representing $226.2 million in relief proceeds throughout 2020. The majority of these loans were initially pledged to the Federal Reserve as part of the Paycheck Protection Program Liquidity Facility (PPPLF). The PPPLF pledged loans are non-recourse to the Company. These loans are guaranteed by the government and as such no loan loss reserves have been recorded for these loans. In addition, the Company paid off approximately $123.6 million in PPPLF advances during the year ended December 31, 2020, and had a balance of $101.4 million remaining as of December 31, 2020. Interest income on loans include PPP loan fees.
Subordinated Debt. On March 26, 2020, pursuant to terms of the acquisition, the Company assumed the subordinated notes payable of MBI at its fair value of $10.3 million. According to the terms of the subordinated note, the principal amount due is $10.0 million with a 7% fixed rate until October 30, 2021 and a variable rate thereafter at LIBOR plus 576 basis points. The note matures on October 30, 2026 and can be redeemed by the Company anytime on or after October 30, 2021. The subordinated debt was fair valued at a premium of $0.5 million and will be amortized over the expected life.
Valley National Line of Credit. On December 19, 2019, the Company entered a $10.0 million secured revolving line of credit with Valley National Bank, N.A. Amounts drawn under this line of credit bears interest at the Prime Rate, as announced by The Wall Street Journal from time to time as its prime rate, and its obligations under this line of credit are secured by all the issued and outstanding shares of capital stock of the Bank, which we have pledged as security. On January 7, 2021 (the “Closing Date”) the Company and Valley National Bank, entered an amendment, among other things, extended the maturity date of the note to March 19, 2021. No other material terms of the note changed. The principal balance outstanding pursuant to the Note on the Closing Date was $0.
Liquidity and Capital Resources
Capital Resources
Shareholders’ equity increased $136.3 million, or 171.8%, to $215.6 million at December 31, 2020 compared to December 31, 2019, primarily due to the acquisition of MBI and the closing of our IPO. Net income resulted in an increase to retained earnings of $8.3 million for the year ended December 31, 2020. Shareholders’ equity decreased $0.4 million for the year ended December 31, 2019 compared to 2018, primarily due to our repurchase of 225,000 shares of Class A Common Stock for an aggregate purchase price of $3.9 million. Net income resulted in an increase to retained earnings of $2.3 million as of December 31, 2019.
We are subject to various regulatory capital requirements administered by the federal banking agencies. Failure to meet minimum capital requirements can initiate certain mandatory and possibly additional discretionary actions by regulators that, if undertaken, could have a material effect on our financial statements. Under capital adequacy guidelines and the regulatory framework for prompt corrective action, we must meet specific capital guidelines that involve quantitative measures of our assets, liabilities, and certain off-balance sheet items as calculated under regulatory accounting practices. The capital amounts and classifications are also subject to qualitative judgments by the regulators about components, risk weightings, and other factors.
Quantitative measures established by regulation to ensure capital adequacy require us to maintain minimum ratios of common equity Tier 1, Tier 2, and total capital as a percentage of assets and off-balance sheet exposures, adjusted for risk weights ranging from 0% to 150%. We are also required to maintain capital at a minimum level based on quarterly average assets, which is known as the leverage ratio.
In July 2013, federal bank regulatory agencies issued a final rule that revised their risk-based capital requirements and the method for calculating risk-weighted assets to make them consistent with certain standards that were developed by Basel III and certain provisions of the Dodd-Frank Act. The final rule applies to all depository institutions and bank holding companies and savings and loan holding companies with total consolidated assets of more than $1 billion, which
59
we refer to below as “covered” banking organizations. We were required to implement the new Basel III capital standards as of January 1, 2015 and January 1, 2019, respectively.
As of December 31, 2020, we were in compliance with all applicable regulatory capital requirements to which we were subject, and the Bank was classified as “well capitalized” for purposes of the prompt corrective action regulations. As we deploy our capital and continue to grow our operations, our regulatory capital levels may decrease depending on our level of earnings. However, we intend to monitor and control our growth in order to remain in compliance with all regulatory capital standards applicable to us.
The following table presents our regulatory capital ratios as of the dates indicated. The amounts presented exclude the capital conservation buffer.
| | | | | | | | | | | | Minimum to be well | | |||
| | Actual | | Minimum for capital adequacy | | capitalized | | |||||||||
(Dollars in thousands) |
| Amount |
| Ratio |
| Amount |
| Ratio |
| Amount |
| Ratio |
| |||
December 31, 2020 |
| |
|
|
|
| |
|
|
|
| |
|
|
| |
Total capital ratio |
| |
|
| |
| |
|
|
|
| |
|
|
| |
Bank | | $ | 176,633 |
| 12.0 | % | $ | 117,298 |
| 8.0 | % | $ | 146,623 |
| 10.0 | % |
Company | |
| 215,977 |
| 14.7 | % |
| 117,298 |
| 8.0 | % |
| N/A |
| N/A | |
Tier 1 capital ratio | |
|
|
| | |
|
|
|
| |
|
|
|
| |
Bank | |
| 159,448 |
| 10.9 | % |
| 87,974 |
| 6.0 | % |
| 117,298 |
| 8.0 | % |
Company | |
| 188,639 |
| 12.9 | % |
| 87,974 |
| 6.0 | % |
| N/A |
| N/A | |
Tier1 leverage ratio | |
|
|
| | |
|
|
|
| |
|
|
|
| |
Bank | |
| 159,448 |
| 8.4 | % |
| 75,723 |
| 4.0 | % |
| 94,654 |
| 5.0 | % |
Company | |
| 188,639 |
| 10.0 | % |
| 75,723 |
| 4.0 | % |
| N/A |
| N/A | |
Common equity tier 1 capital ratio | |
|
|
| | |
| |
|
| |
|
|
|
| |
Bank | |
| 159,448 |
| 10.9 | % |
| 65,980 |
| 4.5 | % |
| 95,305 |
| 6.5 | % |
Company | |
| 188,639 |
| 12.9 | % |
| 65,980 |
| 4.5 | % |
| N/A |
| N/A | |
| | | | | | | | | | | | Minimum to be well |
| |||
| | Actual | | Minimum for capital adequacy | | capitalized |
| |||||||||
(Dollars in thousands) |
| Amount |
| Ratio |
| Amount |
| Ratio |
| Amount |
| Ratio |
| |||
December 31, 2019 | |
|
|
|
| |
|
|
|
| |
|
|
|
| |
Total capital ratio | |
|
|
|
| |
|
|
|
| |
|
|
|
| |
Bank | | $ | 95,662 |
| 13.6 | % | $ | 56,091 |
| 8.0 | % | $ | 70,114 |
| 10.0 | % |
Company | |
| 86,531 |
| 12.3 | % |
| 56,091 |
| 8.0 | % |
| N/A |
| N/A | |
Tier 1 capital ratio | |
|
|
|
| |
|
|
|
| |
|
|
|
| |
Bank | |
| 88,506 |
| 12.6 | % |
| 42,069 |
| 6.0 | % |
| 56,091 |
| 8.0 | % |
Company | |
| 79,375 |
| 11.3 | % |
| 42,069 |
| 6.0 | % |
| N/A |
| N/A | |
Tier1 leverage ratio | |
|
|
|
| |
|
|
|
| |
|
|
|
| |
Bank | |
| 88,506 |
| 8.7 | % |
| 40,889 |
| 4.0 | % |
| 51,112 |
| 5.0 | % |
Company | |
| 79,375 |
| 7.8 | % |
| 40,889 |
| 4.0 | % |
| N/A |
| N/A | |
Common equity tier 1 capital ratio | |
|
|
|
| |
|
|
|
| |
|
|
|
| |
Bank | |
| 88,506 |
| 12.6 | % |
| 31,551 |
| 4.5 | % |
| 45,574 |
| 6.5 | % |
Company | |
| 79,375 |
| 11.3 | % |
| 31,551 |
| 4.5 | % |
| N/A |
| N/A | |
Liquidity
In general terms, liquidity is a measurement of our ability to meet our cash needs. Our objective in managing our liquidity is to maintain our ability to fund loan commitments, purchase securities, accommodate deposit withdrawals or repay other liabilities in accordance with their terms, without an adverse impact on our current or future earnings. Our liquidity strategy is guided by policies that are formulated and monitored by our Asset Liability Management Committee, or ALCO, and senior management, including our Liquidity Contingency Policy, and which take into account the marketability of assets, the sources and stability of funding and the level of unfunded commitments. We regularly evaluate all of our various funding sources with an emphasis on accessibility, stability, reliability and cost-effectiveness.
60
Our principal source of funding has been our clients’ deposits, supplemented by our short-term borrowings, primarily from FHLB borrowings. We believe that the cash generated from operations, our borrowing capacity and our access to capital resources are sufficient to meet our future operating capital and funding requirements.
At December 31, 2020, we had the ability to generate approximately $313.7 million in additional liquidity through available resources. In addition to the primary borrowing outlets mentioned above, we also have the ability to generate liquidity by borrowing from the Federal Reserve Discount Window and through brokered deposits. We recognize the importance of maintaining liquidity and have developed a Contingent Liquidity Plan, which addresses various liquidity stress levels and our response and action based on the level of severity. We periodically test our credit facilities for access to the funds, but also understand that as the severity of the liquidity level increases, certain credit facilities may no longer be available. We conduct quarterly liquidity stress tests and the results are reported to our Asset-Liability Management Committee and our Board. We believe the liquidity available to us is sufficient to meet our ongoing needs.
We also view our investment portfolio as a liquidity source and have the option to pledge securities in our portfolio as collateral for borrowings or deposits, and/or sell selected securities. Our portfolio primarily consists of debt issued by the federal government and governmental agencies. The weighted-average maturity of our portfolio was 3.02 years and 3.50 years at December 31, 2020 and 2019, respectively, and had a net unrealized pre-tax gain of $1.2 million and pre-tax loss of $0.1, respectively, in our available for sale securities portfolio as of those dates.
As we deploy our capital and continue to grow our operations, we maintain cash in our Holding Company for added liquidity. As of December 31, 2020, cash held at the Holding Company was approximately $38.5 million. Our average net overnight funds sold position (defined as funds sold plus interest-bearing deposits with other banks less funds purchased) was $39.6 million during the year ended December 31, 2020 compared to an average net overnight funds sold position of $25.3 million for the year ended December 31, 2019.
We expect our capital expenditures over the next 12 months to be approximately $0.8 million, which will consist primarily of investments in digital capabilities, technology purchases for our new banking offices, business applications and information technology security needs. We expect that these capital expenditures will be funded with existing resources without impairing our ability to meet our ongoing obligations.
Inflation
The impact of inflation on the banking industry differs significantly from that of other industries in which a large portion of total resources are invested in fixed assets such as property, plant and equipment. Assets and liabilities of financial institutions are primarily all monetary in nature, and therefore are principally impacted by interest rates rather than changing prices. While the general level of inflation underlies most interest rates, interest rates react more to changes in the expected rate of inflation and to changes in monetary and fiscal policy.
Contractual Obligations
We have contractual obligations to make future payments on debt and lease agreements. While our liquidity monitoring and management consider both present and future demands for and sources of liquidity, the following table
61
of contractual commitments focuses only on future obligations and summarizes our contractual obligations as of December 31, 2020.
| | | | | | | | Due After | | | | | | | |
| | | | | Due after One | | Three | | | | | | | ||
| | Due in One | | Through Three | | Through | | Due After | | | | ||||
(Dollars in thousands) |
| Year or Less |
| Years |
| Five Years |
| Five Years |
| Total | |||||
FHLB advances | | $ | — | | $ | — | | $ | 30,000 | | $ | 10,000 | | $ | 40,000 |
PPPLF advances | | | — | | | 92,785 | | | 8,573 | | | — | | | 101,358 |
Loan participations | | | — | | | 11,984 | | | — | | | 1,231 | | | 13,215 |
Certificates of deposit $100,000 or more | |
| 161,730 | |
| 54,151 | |
| 579 | |
| — | |
| 216,460 |
Certificates of deposit less than $100,000 | |
| 15,510 | |
| 4,481 | |
| 124 | |
| — | |
| 20,115 |
Operating leases | |
| 1,515 | |
| 2,688 | |
| 2,212 | |
| 1,137 | |
| 7,552 |
Subordinated debt | | | — | | | — | | | — | | | 10,153 | | | 10,153 |
Total | | $ | 178,755 | | $ | 166,089 | | $ | 41,488 | | $ | 22,521 | | $ | 408,853 |
Off-Balance Sheet Items
In the normal course of business, we enter into various transactions that, in accordance with GAAP, are not included in our consolidated balance sheets. We enter into these transactions to meet the financing needs of our clients. These transactions include commitments to extend credit and issue letters of credit, which involve, to varying degrees, elements of credit risk and interest rate risk in excess of the amounts recognized in our consolidated balance sheets. Our exposure to credit loss is represented by the contractual amounts of these commitments. The same credit policies and procedures are used in making these commitments as for on-balance sheet instruments. We are not aware of any accounting loss to be incurred by funding these commitments, however we maintain an allowance for off-balance sheet credit risk which is recorded in other liabilities on the consolidated balance sheet.
Our commitments associated with outstanding letters of credit and commitments to extend credit expiring by period as of the date indicated are summarized below. Since commitments associated with letters of credit and commitments to extend credit may expire unused, the amounts shown do not necessarily reflect the actual future cash funding requirements.
(Dollars in thousands) |
| December 31, 2020 |
| December 31, 2019 | ||
Unfunded lines of credit | | $ | 356,955 | | $ | 112,838 |
Commitments to extend credit | |
| 40,629 | |
| 23,052 |
Letters of credit | |
| 13,036 | |
| 9,168 |
Total credit extension commitments | | $ | 410,620 | | $ | 145,058 |
Unfunded lines of credit represent unused portions of credit facilities to our current borrowers that represent no change in credit risk in our portfolio. Lines of credit generally have variable interest rates. The maximum potential amount of future payments we could be required to make is represented by the contractual amount of the commitment, less the amount of any advances made.
Letters of credit are conditional commitments issued by us to guarantee the performance of a client to a third party. In the event of nonperformance by the client in accordance with the terms of the agreement with the third party, we would be required to fund the commitment. If the commitment is funded, we would be entitled to seek recovery from the client from the underlying collateral, which can include commercial real estate, physical plant and property, inventory, receivables, cash or marketable securities.
Our policies generally require that letter of credit arrangements contain security and debt covenants similar to those contained in loan agreements and our credit risk associated with issuing letters of credit is similar to the credit risk involved in extending loan facilities to our clients. The effect on our revenue, expenses, cash flows, and liquidity of the
62
unused portions of these letters of credit commitments and letters of credit cannot be precisely predicted because there is no guarantee that the lines of credit will be used.
Commitments to extend credit are agreements to lend funds to a client, as long as there is no violation of any condition established in the contract, for a specific purpose. Commitments generally have variable interest rates, fixed expiration dates or other termination clauses and may require payment of a fee. Since many of the commitments are expected to expire without being fully drawn, the total commitment amounts disclosed above do not necessarily represent future cash requirements. We evaluate each client’s creditworthiness on a case-by-case basis. The amount of collateral obtained, if considered necessary by us, upon extension of credit is based on management’s credit evaluation of the client.
We enter into forward commitments for the delivery of mortgage loans in our current pipeline. Interest rate lock commitments are entered into in order to economically hedge the effect of changes in interest rates resulting from our commitments to fund the loans. These commitments to fund mortgage loans, to be sold into the secondary market, (interest rate lock commitments) and forward commitments for the future delivery of mortgage loans to third party investors are considered derivatives. We attempt to minimize our exposure to loss under credit commitments by subjecting them to the same credit approval and monitoring procedures as we do for on-balance sheet instruments.
Certain Performance Metrics
The following table shows the return on average assets (computed as net income divided by average total assets), return on average equity (computed as net income divided by average equity) and average equity to average assets ratios for the years ended December 31, 2020 and 2019.
|
| Year Ended | | Year Ended | |
|
| December 31, 2020 | | December 31, 2019 |
|
Return on Average Assets | | 0.46 | % | 0.26 | % |
Return on Average Equity | | 4.30 | % | 2.94 | % |
Average Equity to Average Assets | | 10.64 | % | 8.93 | % |
Market Risk and Interest Rate Sensitivity
Overview
Market risk arises from changes in interest rates, exchange rates, commodity prices, and equity prices. We have risk management policies designed to monitor and limit exposure to market risk and we do not participate in activities that give rise to significant market risk involving exchange rates, commodity prices, or equity prices. In asset and liability management activities, our policies are designed to minimize structural interest rate risk.
Interest Rate Risk Management
Our net income is largely dependent on net interest income. Net interest income is susceptible to interest rate risk to the degree that interest-bearing liabilities mature or reprice on a different basis than interest earning assets. When interest-bearing liabilities mature or reprice more quickly than interest earning assets in a given period, a significant increase in market rates of interest could adversely affect net interest income. Similarly, when interest earning assets mature or reprice more quickly than interest-bearing liabilities, falling market interest rates could result in a decrease in net interest income. Net interest income is also affected by changes in the portion of interest earning assets that are funded by interest-bearing liabilities rather than by other sources of funds, such as noninterest-bearing deposits and shareholders’ equity.
We have established what we believe to be a comprehensive interest rate risk management policy, which is administered by ALCO. The policy establishes limits of risk, which are quantitative measures of the percentage change in net interest income (a measure of net interest income at risk) and the fair value of equity capital (a measure of economic value of equity, or EVE, at risk) resulting from a hypothetical change in interest rates for maturities from one
63
day to 30 years. We measure the potential adverse impacts that changing interest rates may have on our short-term earnings, long-term value, and liquidity by employing simulation analysis through the use of computer modeling. The simulation model captures optionality factors such as call features and interest rate caps and floors imbedded in investment and loan portfolio contracts. As with any method of gauging interest rate risk, there are certain shortcomings inherent in the interest rate modeling methodology used by us. When interest rates change, actual movements in different categories of interest earning assets and interest-bearing liabilities, loan prepayments, and withdrawals of time and other deposits, may deviate significantly from assumptions used in the model. Finally, the methodology does not measure or reflect the impact that higher rates may have on adjustable-rate loan clients’ ability to service their debts, or the impact of rate changes on demand for loan and deposit products.
The balance sheet is subject to testing for interest rate shock possibilities to indicate the inherent interest rate risk. We prepare a current base case and several alternative interest rate simulations (-400, -300, -200, -100,+100, +200, +300 and +400 basis points (bps)), at least once per quarter, and report the analysis to ALCO and our Board. We augment our interest rate shock analysis with alternative interest rate scenarios on a quarterly basis that may include ramps, parallel shifts, and a flattening or steepening of the yield curve (non-parallel shift). In addition, more frequent forecasts may be produced when interest rates are particularly uncertain or when other business conditions so dictate.
Our goal is to structure the balance sheet so that net interest earnings at risk over a 12-month period and the economic value of equity at risk do not exceed policy guidelines at the various interest rate shock levels. We attempt to achieve this goal by balancing, within policy limits, the volume of floating-rate liabilities with a similar volume of floating-rate assets, by keeping the average maturity of fixed-rate asset and liability contracts reasonably matched, by managing the mix of our core deposits, and by adjusting our rates to market conditions on a continuing basis.
Analysis
The following table indicates that, for periods less than one year, rate-sensitive assets exceeded rate-sensitive liabilities, resulting in a slightly asset-sensitive position. For a bank with an asset-sensitive position, otherwise referred to as a positive gap, rising interest rates would generally be expected to have a positive effect on net interest income, and falling interest rates would generally be expected to have the opposite effect.
64
REPRICING GAP
| | | | | After One | | After Three | | | | | | | | | | ||
| | | | | Month | | Months | | | | | Greater than | | | | |||
December 31, 2020 | | Within One | | Through Three | | Through | | Within One | | One Year | | | ||||||
(Dollars in thousands) |
| Month |
| Months |
| 12 Months |
| Year |
| or Nonsensitive |
| Total | ||||||
Assets |
| |
|
| |
|
| |
|
| |
|
| |
|
| |
|
Interest earning assets |
| |
|
| |
|
| |
|
| |
|
| |
|
| |
|
Loans(1) | | $ | 377,045 | | $ | 111,078 | | $ | 404,364 | | $ | 892,487 | | $ | 752,156 | | $ | 1,644,643 |
Securities | |
| 16,577 | |
| 24,451 | |
| 7,145 | |
| 48,173 | |
| 46,887 | |
| 95,060 |
Interest-bearing deposits at other financial institutions | |
| 191,347 | |
| 249 | |
| — | |
| 191,596 | |
| — | |
| 191,596 |
Federal funds sold | | | 25,376 | | | — | | | — | | | 25,376 | | | — | | | 25,376 |
FHLB & FRB stock | |
| 7,991 | |
| — | |
| — | |
| 7,991 | |
| — | |
| 7,991 |
Total interest earning assets | | $ | 618,336 | | $ | 135,778 | | $ | 411,509 | | $ | 1,165,623 | | $ | 799,043 | | $ | 1,964,666 |
Liabilities | |
|
| |
|
| |
|
| |
|
| |
|
| |
|
|
Interest-bearing liabilities | |
|
| |
|
| |
|
| |
|
| |
|
| |
|
|
Interest-bearing deposits | | $ | 535,111 | | $ | 42,664 | | $ | 140,695 | | $ | 718,470 | | $ | 704,498 | | $ | 1,422,968 |
Time deposits | |
| 13,507 | |
| 47,349 | |
| 116,384 | |
| 177,240 | |
| 59,335 | |
| 236,575 |
Total interest-bearing deposits | |
| 548,618 | |
| 90,013 | |
| 257,079 | |
| 895,710 | |
| 763,833 | |
| 1,659,543 |
Securities sold under agreements to repurchase | |
| — | |
| — | |
| — | |
| — | |
| — | |
| — |
FHLB advances | |
| — | |
| — | |
| — | |
| — | |
| 40,000 | |
| 40,000 |
PPPLF advances | | | — | | | — | | | — | | | — | | | 101,358 | | | 101,358 |
Loan participations | | | — | | | — | | | — | | | — | | | 13,215 | | | 13,215 |
Subordinated debt | |
| — | |
| — | |
| — | |
| — | |
| 10,153 | |
| 10,153 |
Total interest-bearing liabilities | | $ | 548,618 | | $ | 90,013 | | $ | 257,079 | | $ | 895,710 | | $ | 928,559 | | $ | 1,824,269 |
Period gap | | $ | 69,718 | | $ | 45,765 | | $ | 154,430 | | $ | 269,913 | | $ | (129,516) | |
|
|
Cumulative gap | | $ | 69,718 | | $ | 115,483 | | $ | 269,913 | | $ | 269,913 | | $ | 140,397 | |
|
|
Ratio of cumulative gap to total earning assets | |
| 11.28 | % |
| 85.05 | % |
| 65.59 | % |
| 23.16 | % |
| 17.57 | % |
|
|
Ratio of cumulative gap to cumulative total earning assets | |
| 3.55 | % |
| 5.88 | % |
| 13.74 | % |
| 13.74 | % |
| 7.15 | % |
|
|
| (1) | Includes loans held for resale |
| (2) | Includes FRB and FHLB stock, which has been historically redeemable at par. |
65
CASH FLOW GAP
|
| | |
| After One |
| After Three |
| | |
| | |
|
| | ||
| | | | | Month | | Months | | | | | Greater than | |
| | |||
December 31, 2020 | | Within One | | Through Three | | Through | | Within One | | One Year | |
| | |||||
(Dollars in thousands) | | Month | | Months | | 12 Months | | Year | | or Nonsensitive | | Total | ||||||
Assets |
| |
|
| |
|
| |
|
| |
|
| |
|
| |
|
Interest earning assets |
| |
|
| |
|
| |
|
| |
|
| |
|
| |
|
Loans(1) | | $ | 38,765 | | $ | 60,738 | | $ | 87,359 | | $ | 186,862 | | $ | 1,457,781 | | $ | 1,644,643 |
Securities | |
| 14,664 | |
| 2,132 | |
| 10,118 | |
| 26,914 | |
| 68,146 | |
| 95,060 |
Interest-bearing deposits at other financial institutions | |
| 191,347 | |
| 249 | |
| — | |
| 191,596 | | | — | |
| 191,596 |
Federal funds sold | | | 25,376 | | | — | | | — | | | 25,376 | | | — | | | 25,376 |
FHLB & FRB stock | |
| — | |
| — | |
| — | |
| — | |
| 7,991 | |
| 7,991 |
Total interest earning assets | | $ | 270,152 | | $ | 63,119 | | $ | 97,477 | | $ | 430,748 | | $ | 1,533,918 | | $ | 1,964,666 |
Liabilities | |
|
| |
|
| |
|
| |
|
| |
|
| |
|
|
Interest-bearing liabilities | |
|
| |
|
| |
|
| |
|
| |
|
| |
|
|
Interest-bearing deposits | | $ | 34,971 | | $ | 69,940 | | $ | 263,440 | | $ | 368,351 | | $ | 1,054,617 | | $ | 1,422,968 |
Time deposits | |
| 13,507 | |
| 47,349 | |
| 116,384 | |
| 177,240 | |
| 59,335 | |
| 236,575 |
Total interest-bearing deposits | |
| 48,478 | |
| 117,289 | |
| 379,824 | |
| 545,591 | |
| 1,113,952 | |
| 1,659,543 |
Securities sold under agreements to repurchase | |
| — | |
| — | |
| — | |
| — | |
| — | |
| — |
FHLB advances | |
| — | |
| — | |
| — | |
| — | |
| 40,000 | |
| 40,000 |
PPPLF advances | | | — | | | — | | | — | | | — | | | 101,358 | | | 101,358 |
Loan participations | | | — | | | — | | | — | | | — | | | 13,215 | | | 13,215 |
Subordinated debt | |
| — | |
| — | |
| — | |
| — | |
| 10,153 | |
| 10,153 |
Total interest-bearing liabilities | | $ | 48,478 | | $ | 117,289 | | $ | 379,824 | | $ | 545,591 | | $ | 1,278,678 | | $ | 1,824,269 |
Period gap | | $ | 221,674 | | $ | (54,170) | | $ | (282,347) | | $ | (114,843) | | $ | 255,240 | |
| |
Cumulative gap | | $ | 221,674 | | $ | 167,504 | | $ | (114,843) | | $ | (114,843) | | $ | 140,397 | |
| |
Ratio of cumulative gap to total earning assets | |
| 82.06 | % |
| 265.38 | % |
| (117.82) | % |
| (26.66) | % |
| 9.15 | % |
| |
| (1) | Includes loans held for sale |
| (2) | Includes FRB and FHLB stock, which has been historically redeemable at par. |
Measures of net interest income at risk produced by simulation analysis are indicators of an institution’s short-term performance in alternative rate environments. These measures are typically based upon a relatively brief period, and do not necessarily indicate the long-term prospects or economic value of the institution.
66
The following table summarizes the results of our net interest income at risk analysis in simulating the change in net interest income and fair value of equity over a 12-month and 24-month horizon as of December 31, 2020, 2019 and 2018.
Net Interest Income at Risk – 12 months |
| -400bps |
| -300bps |
| -200bps |
| -100bps |
| Flat |
| +100bps |
| +200bps |
| +300bps |
| +400bps |
|
Policy Limit |
| (20.0) | % | (15.0) | % | (10.0) | % | (5.0) | % | N/A |
| 10.0 | % | 15.0 | % | 20.0 | % | 25.0 | % |
December 31, 2020 |
| (3.1) | % | (2.4) | % | (1.2) | % | (0.2) | % | N/A |
| 1.5 | % | 3.5 | % | 5.5 | % | 7.3 | % |
December 31, 2019 |
| (9.9) | % | (6.6) | % | (4.7) | % | (1.6) | % | N/A |
| 0.6 | % | 0.8 | % | 1.0 | % | 1.2 | % |
December 31, 2018 |
| (11.8) | % | (8.2) | % | (5.6) | % | (4.3) | % | N/A |
| 3.6 | % | 7.0 | % | 10.5 | % | 13.9 | % |
| | | | | | | | | | | | | | | | | | | |
Net Interest Income at Risk – 24 months |
| -400bps |
| -300bps |
| -200bps |
| -100bps |
| Flat |
| +100bps |
| +200bps |
| +300bps |
| +400bps |
|
Policy Limit |
| (20.0) | % | (15.0) | % | (10.0) | % | (5.0) | % | N/A |
| 10.0 | % | 15.0 | % | 20.0 | % | 25.0 | % |
December 31, 2020 |
| (4.3) | % | (3.6) | % | (2.6) | % | (1.8) | % | N/A |
| 5.8 | % | 12.0 | % | 17.9 | % | 23.6 | % |
December 31, 2019 |
| (16.1) | % | (12.0) | % | (7.7) | % | (2.7) | % | N/A |
| 1.3 | % | 2.3 | % | 3.1 | % | 3.7 | % |
December 31, 2018 |
| (18.4) | % | (13.7) | % | (10.2) | % | (6.2) | % | N/A |
| 5.0 | % | 9.8 | % | 14.7 | % | 19.6 | % |
Using an EVE, we analyze the risk to capital from the effects of various interest rate scenarios through a long-term discounted cash flow model. This measures the difference between the economic value of our assets and the economic value of our liabilities, which is an estimate of liquidation value. While this provides some value as a risk measurement tool, management believes net interest income at risk is more appropriate in accordance with the going concern principle.
The following table illustrates the results of our EVE analysis as of December 31, 2020, 2019 and 2018.
Economic Value of Equity as of |
| -400bps |
| -300bps |
| -200bps |
| -100bps |
| Flat |
| +100bps |
| +200bps |
| +300bps |
| +400bps |
|
Policy Limit |
| (30.0) | % | (20.0) | % | (15.0) | % | (10.0) | % | N/A |
| 17.5 | % | 22.5 | % | 27.5 | % | 37.5 | % |
December 31, 2020 |
| 0.8 | % | 1.5 | % | 2.6 | % | 2.5 | % | N/A |
| (2.5) | % | (5.1) | % | (8.1) | % | (11.3) | % |
December 31, 2019 |
| (5.3) | % | (0.4) | % | 0.7 | % | 0.6 | % | N/A |
| (3.7) | % | (8.2) | % | (13.2) | % | (19.0) | % |
December 31, 2018 |
| (4.2) | % | (0.7) | % | 1.8 | % | (0.5) | % | N/A |
| (2.6) | % | (5.0) | % | (7.2) | % | (9.7) | % |
Critical Accounting Policies and Estimates
Our consolidated financial statements are prepared in accordance with United States GAAP and with general practices within the financial services industry. Application of these principles requires management to make estimates and assumptions that affect the amounts reported in the consolidated financial statements and accompanying notes. We base our estimates on historical experience and on various other assumptions that we believe to be reasonable under current circumstances. These assumptions form the basis for our judgments about the carrying values of assets and liabilities that are not readily available from independent, objective sources. We evaluate our estimates on an ongoing basis. Use of alternative assumptions may have resulted in significantly different estimates. Actual results may differ from these estimates.
We have identified the following accounting policies and estimates that, due to the difficult, subjective, or complex judgments and assumptions inherent in those policies and estimates and the potential sensitivity of the financial statements to those judgments and assumptions, are critical to an understanding of our financial condition and results of operations. We believe that the judgments, estimates and assumptions used in the preparation of the consolidated financial statements are appropriate.
Allowance for Loan Losses
The allowance for loan losses provides for probable incurred losses in the loan portfolio based upon management’s best assessment of the loan portfolio at each balance sheet date. It is maintained at a level estimated to be adequate to absorb potential losses through periodic charges to the provision for loan losses.
The allowance for loan losses consists of specific and general reserves. Specific reserves relate to loans classified as impaired. Loans are considered impaired when, based on current information and events, it is probable that we will be
67
unable to collect all amounts due in accordance with the contractual terms of the loan. Impaired loans include troubled debt restructurings, and performing and nonperforming loans. Impaired loans are reviewed individually and a specific allowance is allocated, if necessary, based on evaluation of either the fair value of the collateral underlying the loan or the present value of future cash flows calculated using the loan’s existing interest rate. General reserves relate to the remainder of the loan portfolio, including overdrawn deposit accounts, and are based on evaluation of a number of factors, such as current economic conditions, the quality and composition of the loan portfolio, loss history, and other relevant factors.
Our loans are generally secured by specific items of collateral including real property, consumer assets, and business assets. However, the ability of borrowers to honor their contractual repayment obligations is substantially dependent on changing economic conditions. Because of the uncertainties associated with economic conditions, collateral values, and future cash flows on impaired loans, it is reasonably possible that management’s estimate of loan losses in the loan portfolio and the amount of the allowance needed may change in the future. The determination of the allowance for loan losses is, in large part, based on estimates that are particularly susceptible to significant changes in the economic environment and market conditions. In situations where the repayment of a loan is dependent on the value of the underlying collateral, an independent appraisal of the collateral’s current market value is customarily obtained and used in the determination of the allowance for loan loss.
While management uses available information to recognize losses on loans, further reductions in the carrying amounts of loans may be necessary based on changes in economic conditions. Also regulatory agencies, as an integral part of their examination process, periodically review management’s assessments of the adequacy of the allowance for loan losses. Such agencies may require us to recognize additional losses based on their judgments about information available to them at the time of their examination.
Fair Value Measurements
Fair value is the price that would be received to sell an asset or paid to transfer a liability in the principal or most advantageous market for an asset or liability in an orderly transaction between market participants at the measurement date. The degree of management judgment involved in determining the fair value of a financial instrument is dependent upon the availability of quoted market prices or observable market inputs. For financial instruments that are traded actively and have quoted market prices or observable market inputs, there is minimal subjectivity involved in measuring fair value. However, when quoted market prices or observable market inputs are not fully available, significant management judgment may be necessary to estimate fair value. In developing our fair value estimates, we maximize the use of observable inputs and minimize the use of unobservable inputs.
The fair value hierarchy defines Level 1 valuations as those based on quoted prices (unadjusted) for identical assets or liabilities in active markets. Level 2 valuations include inputs based on quoted prices for similar assets or liabilities in active markets, and inputs that are observable for the asset or liability, either directly or indirectly, for substantially the full term of the financial instrument. Level 3 valuations are based on at least one significant assumption not observable in the market, or significant management judgment or estimation, some of which may be internally developed.
Financial assets that are recorded at fair value on a recurring basis include investment securities available for sale, and loans held for sale. Determining the fair values of assets and liabilities, especially the loan portfolio, core deposit intangibles and goodwill, is a complicated process involving significant judgement regarding methods and assumptions used to calculate the estimated fair values. As of December 31, 2020, MBI purchase accounting loan marks were $18.8 million.
Recent Accounting Pronouncements
The following provides a brief description of accounting standards that have been issued but are not yet adopted that could have a material effect on our financial statements. Please also refer to the Notes to our consolidated financial statements included in this annual report for a full description of recent accounting pronouncements, including the respective expected dates of adoption and anticipated effects on our results of operations and financial condition.
68
ASU 2016-13, Financial Instruments — Credit Losses (Topic 326)
In June 2016, FASB issued guidance to replace the incurred loss model with an expected loss model, which is referred to as the current expected credit loss, or CECL, model. The CECL model is applicable to the measurement of credit losses on financial assets measured at amortized cost, including loan receivables and held to maturity debt securities. It also applies to off-balance sheet credit exposures not accounted for as insurance (i.e. loan commitments, standby letters of credit, financial guarantees and other similar instruments). We anticipated that this ASU would be effective for us on January 1, 2021, but the FASB announced on October 16, 2019, a delay of the effective date of ASU 2016-13 for smaller reporting companies until January 1, 2023. We are in the process of evaluating and implementing changes to credit loss estimation models and related processes. Updates to business processes and the documentation of accounting policy decisions are ongoing. We may recognize an increase in the allowance for credit losses upon adoption, recorded as a one-time cumulative adjustment to retained earnings. However, the magnitude of the impact on our consolidated financial statements has not yet been determined.
ASU 2019-12, Income Taxes (Topic 740)
In December 2019, FASB issued guidance which simplifies the accounting for income taxes by removing multiple exceptions to the general principals in Topic 740. The standard is effective for public business entities for fiscal years, and for interim periods within those fiscal years, beginning after December 15, 2020. The Company does not expect the adoption of this standard to have a material impact on the Company’s Consolidated Financial Statements.
ASU 2020-04, Reference Rate Reform (Topic 848)
In March 2020, FASB issued guidance which provides optional guidance to ease the accounting burden in accounting for, or recognizing the effects from, reference rate reform on financial reporting. The new standard is a result of the London Interbank Offered Rate ("LIBOR") likely being discontinued as an available benchmark rate. The standard is elective and provides optional expedients and exceptions for applying GAAP to contracts, hedging relationships, or other transactions that reference LIBOR, or another reference rate expected to be discontinued. The amendments in the update are effective for all entities between March 12, 2020 and December 31, 2022. The Company has established a cross-functional working group to guide the Company’s transition from LIBOR and has begun efforts to transition to alternative rates consistent with industry timelines. The Company has identified its products that utilize LIBOR and has implemented enhanced fallback language to facilitate the transition to alternative reference rates. The Company is evaluating existing platforms and systems and preparing to offer new rates.
FIL-36-2020, Interagency Statement on Loan Modifications and Reporting for Financial Institutions Working with Customers Affected by the Coronavirus
On March 22, 2020, the federal banking agencies issued an “Interagency Statement on Loan Modifications and Reporting for Financial Institutions Working with Customers Affected by the Coronavirus”, which was subsequently clarified and revised by an interagency statement issued on April 7, 2020. This guidance encourages financial institutions to work prudently with borrowers that may be unable to meet their contractual obligations because of the effects of the COVID-19 pandemic. The guidance explains that the staffs of the FASB and the federal banking agencies have concluded that short-term modifications (e.g. six months) made on a good faith basis to borrowers who were current as of the implementation date of a relief program are not Troubled Debt Restructurings (“TDRs”). The Coronavirus Aid, Relief and Economic Security Act (CARES Act) was signed into law on March 27, 2020 and has subsequently been amended several times. Section 4013 of the CARES Act also addressed COVID-19 pandemic related modifications and specified that COVID-19 pandemic related modifications on loans that were current as of December 31, 2019 are not TDRs. Modifications were executed in the second and third quarters of 2020. The majority of the loan modifications we made for customers involved three to six month forbearance payments which were added to the end of the note.
During the year ended December 31, 2020, the Company approved $199.8 million in payment relief modifications that were granted under the CARES Act guidance associated with the treatment of TDRs. Since the inception of the CARES Act, $187.8 million of these loans either have been reinstated to their original payment terms or have been paid
69
off. As of December 31, 2020, there were 13 loans measured with a fair value of $11.1 million, that remain under the exemption from TDR classification as provided for in the CARES Act. To manage credit risk, the Company increased oversight and analysis of loans to borrowers in vulnerable industries, such as hotels and hospitality. As of December 31, 2020, these loans have a balance of $54.3 million. For the year ended December 31, 2020, $30.6 million of these loans were provided payment relief consistent with Section 4013 of the CARES Act and the interagency guidelines published on March 13, 2020, and as of December 31, 2020, $28.3 million has been reinstated and returned to normal payment schedules, with one deferred loan remaining in this group.
Explanation of Certain unaudited non-GAAP Financial Measures
This Annual Report on Form 10-K contains financial information determined by methods other than United States GAAP, including adjusted net income and adjusted net income per share, which we refer to “non-GAAP financial measures.” The table below provides a reconciliation between these non-GAAP measures and net income and net income per share, which are the most comparable GAAP measures.
Management uses these non-GAAP financial measures in its analysis of the Company’s performance and believes these measures are useful supplemental information that can enhance investors’ understanding of the Company’s business and performance without considering taxes or provisions for loan losses and can be useful when comparing performance with other financial institutions. However, these non-GAAP financial measures should not be considered in isolation or as a substitute for the comparable GAAP measures.
Reconciliation of non-GAAP Financial Measures
Reconciliation of non-GAAP Earnings and Adjusted Earnings
| | Year Ended | | ||||
| | December 31, | | ||||
(Dollar amounts in thousands, except per share data) |
| 2020 |
| 2019 | | ||
Net interest income (GAAP) | | $ | 60,053 | | $ | 28,043 | |
Total non-interest income | | | 4,306 | | | 2,808 | |
Total non-interest expense | | | 43,620 | | | 26,997 | |
Pre-tax pre-provision earnings (non-GAAP) | | $ | 20,739 | | $ | 3,854 | |
Total adjustments to non-interest expense | | | (3,328) | | | — | |
Adjusted pre-tax pre-provision earnings (non-GAAP) | | $ | 24,067 | | $ | 3,854 | |
Adjusted return on average assets (non-GAAP) | |
| | |
| | |
Annualized pre-tax pre-provision ROAA (non-GAAP) | | | 1.14 | % | | 0.43 | % |
Adjusted annualized pre-tax pre-provision ROAA (non-GAAP) | |
| 1.33 | % |
| 0.43 | % |
Reconciliation of non-GAAP Allowance for Loan Loss
| | December 31, | | ||||
| | 2020 |
| 2019 | | ||
Total Loans (GAAP) | | $ | 1,666,480 | | $ | 792,467 | |
Less PPP loans | | $ | 189,977 | | $ | - | |
Total loans held for investment (non-GAAP) | | $ | 1,476,503 | | $ | 792,467 | |
Allowance for Loan Loss | | $ | 16,259 | | $ | 6,548 | |
Allowance for Loan Loss as a % of Total Loans (GAAP) | | | 0.98 | % | | 0.83 | % |
Allowance for Loan Loss as a % of total loans held for investment (non-GAAP) | | | 1.10 | % | | 0.83 | % |
Item 7a Quantitative and Qualitative Disclosures About Market Risk
See Item 7, page 36.
70
Item 8. Financial Statements and Supplementary Data
Report of Independent Registered Public Accounting Firm
Shareholders and the Board of Directors of Professional Holding Corp.
Coral Gables, Florida
Opinion on the Financial Statements
We have audited the accompanying consolidated balance sheets of Professional Holding Corp. (the "Company") as of December 31, 2020 and 2019, the related consolidated statements of income and comprehensive income, stockholders’ equity, and cash flows for the years then ended, and the related notes (collectively referred to as the "financial statements"). In our opinion, the financial statements present fairly, in all material respects, the financial position of the Company as of December 31, 2020 and 2019, and the results of its operations and its cash flows for the years then ended, in conformity with accounting principles generally accepted in the United States of America.
Basis for Opinion
These financial statements are the responsibility of the Company's management. Our responsibility is to express an opinion on the Company's financial statements based on our audits. We are a public accounting firm registered with the Public Company Accounting Oversight Board (United States) ("PCAOB") and are required to be independent with respect to the Company in accordance with the United States federal securities laws and the applicable rules and regulations of the Securities and Exchange Commission and the PCAOB.
We conducted our audits in accordance with the standards of the PCAOB. Those standards require that we plan and perform the audit to obtain reasonable assurance about whether the financial statements are free of material misstatement, whether due to error or fraud. The Company is not required to have, nor were we engaged to perform, an audit of its internal control over financial reporting. As part of our audits we are required to obtain an understanding of internal control over financial reporting but not for the purpose of expressing an opinion on the effectiveness of the Company's internal control over financial reporting. Accordingly, we express no such opinion.
Our audits included performing procedures to assess the risks of material misstatement of the financial statements, whether due to error or fraud, and performing procedures that respond to those risks. Such procedures included examining, on a test basis, evidence regarding the amounts and disclosures in the financial statements. Our audits also included evaluating the accounting principles used and significant estimates made by management, as well as evaluating the overall presentation of the financial statements. We believe that our audits provide a reasonable basis for our opinion.
/s/ Crowe LLP
Crowe LLP
We have served as the Company’s auditor since 2016.
Atlanta, Georgia
March 26, 2021
F-1
PROFESSIONAL HOLDING CORP.
CONSOLIDATED BALANCE SHEETS
December 31, 2020 and 2019
(Dollar amounts in thousands, except share data)
|
| December 31, |
| December 31, | ||
| | 2020 | | 2019 | ||
ASSETS |
| |
|
| |
|
Cash and due from banks | | $ | 62,305 | | $ | 21,408 |
Interest-bearing deposits | |
| 129,291 | |
| 150,572 |
Federal funds sold | |
| 25,376 | |
| 26,970 |
Cash and cash equivalents | |
| 216,972 | |
| 198,950 |
Securities available for sale, at fair value | |
| 87,508 | |
| 28,441 |
Securities held to maturity (fair value December 31, 2020 – $1,561, December 31, 2019 – $224) | |
| 1,547 | |
| 214 |
Equity securities | |
| 6,005 | |
| 971 |
Loans, net of allowance of $16,259 and $6,548 as of December 31, 2020, and December 31, 2019, respectively | |
| 1,644,643 | |
| 785,167 |
Federal Home Loan Bank stock, at cost | |
| 3,229 | |
| 2,994 |
Federal Reserve Bank stock, at cost | |
| 4,762 | |
| 2,074 |
Accrued interest receivable | |
| 6,666 | |
| 2,498 |
Premises and equipment, net | |
| 4,370 | |
| 4,307 |
Bank owned life insurance | |
| 37,360 | |
| 16,858 |
Goodwill | | | 24,621 | | | — |
Core deposit intangibles | | | 1,422 | | | — |
Other assets | |
| 18,165 | |
| 10,667 |
| | $ | 2,057,270 | | $ | 1,053,141 |
LIABILITIES AND STOCKHOLDERS’ EQUITY | |
| | |
| |
Deposits | |
| | |
| |
Demand – non-interest bearing | | $ | 475,598 | | $ | 184,211 |
Demand – interest bearing | |
| 947,370 | |
| 599,318 |
Time deposits | |
| 236,575 | |
| 109,344 |
Total deposits | |
| 1,659,543 | |
| 892,873 |
Federal Home Loan Bank advances | |
| 40,000 | |
| 55,000 |
Subordinated debt | | | 10,153 | | | — |
Official checks | |
| 4,447 | |
| 6,191 |
Line of credit | | | — | | | 9,999 |
Other borrowings | | | 114,573 | | | — |
Accrued interest and other liabilities | |
| 12,989 | |
| 9,776 |
Total liabilities | |
| 1,841,705 | |
| 973,839 |
Commitments and contingent liabilities | |
| | |
| |
Stockholders’ equity | |
| | |
| |
Preferred stock, 10,000,000 shares authorized, none issued | |
| — | |
| — |
Class A Voting Common stock, $0.01 par value; authorized 50,000,000 shares, issued 14,100,760 and outstanding 13,534,829 shares as of December 31, 2020, and authorized 50,000,000 shares, issued 5,360,262 and outstanding 5,115,262 shares at December 31, 2019 | |
| 141 | |
| 53 |
Class B Non-Voting Common stock, $0.01 par value; 10,000,000 shares authorized, none issued and outstanding at December 31, 2020, and 752,184 shares issued and outstanding at December 31, 2019 | |
| — | |
| 7 |
Treasury stock, at cost | |
| (9,209) | |
| (4,155) |
Additional paid-in capital | |
| 208,995 | |
| 77,019 |
Retained earnings | |
| 14,756 | |
| 6,451 |
Accumulated other comprehensive income (loss) | |
| 882 | |
| (73) |
Total stockholders’ equity | |
| 215,565 | |
| 79,302 |
| | $ | 2,057,270 | | $ | 1,053,141 |
See accompanying notes.
F-2
PROFESSIONAL HOLDING CORP.
CONSOLIDATED STATEMENTS OF INCOME AND COMPREHENSIVE INCOME
For the years ended December 31, 2020 and 2019
(Dollar amounts in thousands, except share data)
| | Year Ended December 31, | ||||
|
| 2020 |
| 2019 | ||
Interest income | | | | | | |
Loans, including fees | | $ | 66,296 | | $ | 36,021 |
Taxable securities | |
| 1,477 | |
| 675 |
Dividend income on restricted stock | |
| 414 | |
| 252 |
Other | |
| 912 | |
| 2,262 |
Total interest income | |
| 69,099 | |
| 39,210 |
| | | | | | |
Interest expense | |
| | |
|
|
Deposits | |
| 6,777 | |
| 10,072 |
Federal Home Loan Bank advances | |
| 964 | |
| 1,089 |
Other borrowings | | | 1,305 | | | 6 |
Total interest expense | |
| 9,046 | |
| 11,167 |
| | | | | | |
Net interest income | |
| 60,053 | |
| 28,043 |
Provision for loan losses | |
| 10,017 | |
| 862 |
Net interest income after provision for loan losses | |
| 50,036 | |
| 27,181 |
| | | | | | |
Non-interest income | |
| | |
|
|
Service charges on deposit accounts | |
| 1,196 | |
| 273 |
Income from Bank owned life insurance | |
| 502 | |
| 409 |
Gain on sale and call of securities | | | 37 | | | 8 |
SBA origination fees | | | 114 | | | 79 |
SWAP referral fees | | | 1,026 | | | 922 |
Loans Held for Sale | | | 808 | | | 303 |
Other | |
| 623 | |
| 814 |
Total non-interest income | |
| 4,306 | |
| 2,808 |
| | | | | | |
Non-interest expense | |
| | |
| |
Salaries and employee benefits | |
| 25,579 | |
| 18,521 |
Occupancy and equipment | |
| 4,292 | |
| 2,567 |
Data processing | |
| 1,276 | |
| 498 |
Marketing | |
| 545 | |
| 410 |
Professional fees | |
| 2,373 | |
| 1,253 |
Acquisition expenses | | | 3,328 | | | — |
Regulatory assessments | |
| 1,112 | |
| 600 |
Other | |
| 5,115 | |
| 3,148 |
Total non-interest expense | |
| 43,620 | |
| 26,997 |
| | | | | | |
Income before income taxes | |
| 10,722 | |
| 2,992 |
Income tax provision | |
| 2,417 | |
| 656 |
Net income | |
| 8,305 | |
| 2,336 |
| | | | | | |
Earnings per share: | |
| | |
|
|
Basic | | $ | 0.69 | | $ | 0.40 |
Diluted | | $ | 0.67 | | $ | 0.40 |
| | | | | | |
Other comprehensive income: | |
| | |
|
|
Unrealized holding gain on securities available for sale | |
| 1,265 | |
| 412 |
Tax effect | |
| (310) | |
| (104) |
Other comprehensive gain, net of tax | |
| 955 | |
| 308 |
Comprehensive income | | $ | 9,260 | | $ | 2,644 |
See accompanying notes.
F-3
PROFESSIONAL HOLDING CORP.
CONSOLIDATED STATEMENTS OF STOCKHOLDERS’ EQUITY
For the years ended December 31, 2020 and 2019
(Dollar amounts in thousands, except share data)
| | | | | | | | | | | | | | | | Accumulated | | | | |
| | | | | | | | | | Additional | | | | | Other | | | | ||
| | Common Stock | | Treasury | | Paid-in | | Retained | | Comprehensive | | | | |||||||
| | Shares | | Amount | | Stock | | Capital | | Earnings |
| Income (Loss) | | Total | ||||||
Balance at January 1, 2019 | | 5,923,884 |
| $ | 59 |
| $ | (220) |
| $ | 76,152 |
| $ | 4,115 |
| $ | (425) |
| $ | 79,681 |
Issuance of common stock, net of issuance cost |
| 59,997 | |
| 1 |
| | — |
| | 672 |
| | — |
| | — |
| | 673 |
Employee stock purchase plan |
| 6,666 | |
| — |
| | — |
| | 115 |
| | — |
| | — |
| | 115 |
Stock based compensation |
| 101,899 | |
| — |
| | — |
| | 80 |
| | — |
| | — |
| | 80 |
Treasury stock |
| (225,000) | |
| — |
| | (3,935) |
| | — |
| | — |
| | — |
| | (3,935) |
Net income |
| — | |
| — |
| | — |
| | — |
| | 2,336 |
| | — |
| | 2,336 |
Other comprehensive income |
| — | |
| — |
| | — |
| | — |
| | — |
| | 352 |
| | 352 |
Balance at December 31, 2019 |
| 5,867,446 | | $ | 60 | | $ | (4,155) | | $ | 77,019 | | $ | 6,451 | | $ | (73) | | $ | 79,302 |
| | | | | | | | | | | | | | | | | | | | |
Balance at January 1, 2020 |
| 5,867,446 |
| $ | 60 |
| $ | (4,155) |
| $ | 77,019 |
| $ | 6,451 |
| $ | (73) |
| $ | 79,302 |
Issuance of common stock, net of issuance cost |
| 3,717,328 | |
| 39 |
| | — |
| | 60,928 |
| | — |
| | — |
| | 60,967 |
Marquis Bancorp (MBI) acquisition | | 4,227,816 | |
| 42 |
| | — |
| | 69,993 |
| | — |
| | — |
| | 70,035 |
Employee stock purchase plan |
| 7,194 | |
| — |
| | — |
| | 106 |
| | — |
| | — |
| | 106 |
Stock based compensation |
| 35,976 | |
| — |
| | — |
| | 959 |
| | — |
| | — |
| | 959 |
Treasury stock |
| (320,931) | |
| — |
| | (5,054) |
| | (10) |
| | — |
| | — |
| | (5,064) |
Net income |
| — | |
| — |
| | — |
| | — |
| | 8,305 |
| | — |
| | 8,305 |
Other comprehensive income |
| — | |
| — |
| | — |
| | — |
| | — |
| | 955 |
| | 955 |
Balance at December 31, 2020 |
| 13,534,829 | | $ | 141 |
| $ | (9,209) |
| $ | 208,995 |
| $ | 14,756 |
| $ | 882 |
| $ | 215,565 |
See accompanying notes.
F-4
PROFESSIONAL HOLDING CORP.
CONSOLIDATED STATEMENTS OF CASH FLOWS
For the years ended December 31, 2020 and 2019
(Dollar amounts in thousands, except share data)
| | Year Ended December 31, | ||||
|
| 2020 |
| 2019 | ||
Cash flows from operating activities |
| |
|
| |
|
Net income (loss) | | $ | 8,305 | | $ | 2,336 |
Adjustments to reconcile net income to net cash from operating activities | |
|
| |
|
|
Provision for loan losses | |
| 10,017 | |
| 862 |
Deferred income tax benefit | |
| (1,898) | |
| (230) |
Depreciation and amortization | |
| 1,341 | |
| 1,369 |
Gain on sale of securities | | | (4) | | | (3) |
Gain on call of securities | | | (33) | | | (5) |
Equity unrealized change in market value | | | (34) | | | (29) |
Net amortization of securities | |
| 3,331 | |
| 546 |
Net amortization of deferred loan fees | |
| (4,358) | |
| 455 |
Employee stock purchase plan | | | 106 | | | 115 |
Stock compensation | |
| 959 | |
| 80 |
Income from bank owned life insurance | |
| (502) | |
| (409) |
Changes in operating assets and liabilities: | |
|
| |
|
|
Accrued interest receivable | |
| (2,643) | |
| (519) |
Other assets | |
| 3,454 | |
| (478) |
Official checks, accrued interest, interest payable and other liabilities | |
| (3,416) | |
| 2,280 |
Net cash provided by operating activities | |
| 14,625 | |
| 6,370 |
| | | | | | |
Cash flows from investing activities | |
|
| |
|
|
Proceeds from maturities and paydowns of securities available for sale | |
| 17,651 | |
| 5,306 |
Proceeds from calls of securities available for sale | | | 9,132 | | | 500 |
Proceeds from paydowns of securities held to maturity | |
| 122 | |
| 44 |
Purchase of securities available for sale | |
| (62,795) | |
| (19,227) |
Proceeds from sale of securities available for sale | | | 1,735 | | | 4,501 |
Purchase of equity securities | | | (5,000) | | | — |
Loans originations, net of principal repayments | |
| (347,601) | |
| (185,004) |
Proceeds from sale of loans | | | 10,985 | | | — |
Purchase of Federal Reserve Bank stock | |
| (2,688) | |
| (602) |
Purchase of Federal Home Loan Bank Stock | |
| (235) | |
| (802) |
Purchase of company owned life insurance | | | (20,000) | | | (8,000) |
Purchases of premises and equipment | |
| (591) | |
| (2,327) |
Proceeds from acquisition | | | 26,860 | | | — |
Net cash used in investing activities | |
| (372,425) | |
| (205,611) |
| | | | | | |
Cash flows from financing activities | |
|
| |
|
|
Net increase in deposits | |
| 268,560 | |
| 289,571 |
Proceeds from issuance of stock, net of issuance costs | |
| 60,967 | |
| 673 |
Purchase of treasury stock | | | (5,064) | | | (3,935) |
Proceeds from Federal Home Loan Bank advances | |
| 10,000 | |
| 30,000 |
Repayments of Federal Home Loan advances | |
| (50,000) | |
| (15,000) |
Proceeds from line of credit | | | — | | | 9,999 |
Repayment of line of credit | | | (9,999) | | | — |
Proceeds from PPPLF advances | | | 225,004 | | | — |
Repayments of PPPLF advances | | | (123,646) | | | — |
Net cash provided by financing activities | |
| 375,822 | |
| 311,308 |
| | | | | | |
Increase in cash and cash equivalents | |
| 18,022 | |
| 112,067 |
| | | | | | |
Cash and cash equivalents at beginning of period | |
| 198,950 | |
| 86,883 |
| | | | | | |
Cash and cash equivalents at end of period | | $ | 216,972 | | $ | 198,950 |
| | | | | | |
Supplemental cash flow information: | |
|
| |
|
|
Cash paid during the period for interest | | $ | 10,556 | | $ | 11,130 |
Cash paid during the period for taxes | |
| 3,018 | |
| 1,017 |
| | | | | | |
Supplemental noncash disclosures: | |
|
| |
|
|
Recognition of participation loans as secured borrowings | | $ | 13,215 | | $ | — |
Lease liabilities arising from obtaining right of use assets | | $ | 2,027 | | $ | 5,673 |
Total assets acquired | | | 583,797 | | | — |
Total liabilities assumed | | | 538,383 | | | — |
See accompanying notes.
F-5
PROFESSIONAL HOLDING CORP.
NOTES TO CONSOLIDATED FINANCIAL STATEMENTS
For the years ended December 31, 2020 and 2019
(Tables in thousands, except share data)
NOTE 1 — SUMMARY OF SIGNIFICANT ACCOUNTING POLICIES
Nature of organization and corporate reorganization: Professional Holding Corp. (the Corporation and/or the Company) is a financial holding company headquartered in Coral Gables, Florida, with one wholly owned subsidiary, Professional Bank, a Florida-chartered commercial bank (the Bank). Professional Holding Corp. was formed on January 14, 2014 and became the sole shareholder of the Bank on July 1, 2014 through the consummation of a statutory share exchange with the Bank’s then current shareholders whereby holders of the Bank’s common stock were exchanged for an equal number of shares of the Company’s Class A Voting Common Stock, par value $0.01 per share. On March 26, 2020, the Company closed its acquisition of Marquis Bancorp. (MBI) and its wholly owned subsidiary, Marquis Bank, headquartered in Coral Gables, Florida. Each share of MBI common stock issued and outstanding immediately prior to closing was converted into 1.2048 shares of the Company’s Class A common stock, with cash paid in lieu of fractional shares. The Company’s assets consist of cash and business activity as of December 31, 2020 and 2019 pertaining to the investment in the Bank.
Professional Bank commenced banking operations on September 8, 2008. The Bank is focused on meeting the financial service needs of individuals and businesses in South Florida. The Bank offers a full complement of commercial banking products and services. Deposit products include traditional checking, savings and money market accounts, as well as IRAs and certificates of deposit. The Bank’s deposits are insured up to applicable limits by the Federal Deposit Insurance Corporation (the FDIC). Lending products include commercial loans, residential mortgage loans, home equity lines of credit, installment loans and consumer lines of credit. The Bank is subject to regulation, examination and supervision by the Federal Reserve Bank (its primary regulator), the FDIC and the Office of Financial Regulation for the State of Florida (the OFR).
The consolidated financial statements include Professional Holding Corp. and its wholly-owned subsidiary, Professional Bank. Intercompany transactions and balances are eliminated in consolidation. In the opinion of management, all adjustments (consisting of normal recurring accruals) considered necessary for a fair presentation have been included. Certain prior period amounts have been reclassified to conform to the current period presentation.
Concentration risks: Most of the Company’s business activity is with customers located in South Florida. Therefore, the Company’s exposure to credit risk is significantly affected by changes in the economy of Miami-Dade, Broward and Palm Beach counties.
A summary of the Company’s significant accounting policies is as follows:
Use of estimates: In preparation of these consolidated financial statements in conformity with accounting principles generally accepted in the United States of America requires management to make estimates and assumptions that affect the reported amounts of assets and liabilities and disclosures of contingent assets and liabilities at the date of the financial statements and reported amounts of revenues and expenses during the reporting periods. Actual results could differ from those estimates.
The outbreak of the coronavirus COVID-19 pandemic, which was declared a pandemic by the World Health Organization on March 11, 2020, has led to adverse impacts on the global economy and created uncertainty in world financial markets. The economic effects of the coronavirus COVID-19 pandemic have significantly impacted business and economic activity in the United States and around the world. There have been full and partial business closures, increases in unemployment as workers are furloughed, laid off, or had hours limited.
The coronavirus COVID-19 pandemic is an unprecedented event that has created high levels of uncertainty. We are hopeful that the CARES Act and derivative programs will continue to be a stabilizing force for 2021 and beyond, and we are vigilantly monitoring global events and actions being taken by various Federal and State Agencies. We have
F-6
maintained interim periodic communications with our regulators and have not experienced any material deposit outflows to date and frequently communicate with our credit clients. Given the fluidity of the situation, management cannot predict the long-term impact of COVID-19 pandemic for 2021 or beyond.
Cash Flows: For purposes of the statement of cash flows, cash and cash equivalents include cash, due from bank, interest-earning deposits, and federal funds sold, all of which had origination maturities of less than 90 days. Net cash flows are reported for customer loan and deposit transactions, federal funds purchased and repurchase agreements.
Banks are required to maintain cash reserves in the form of vault cash or in an account with the Federal Reserve Bank or in noninterest-earning accounts with other qualified banks. This requirement is based on the Bank’s amount of transaction deposit accounts. The Bank’s cash reserve requirements at December 31, 2020 was $0, and at December 31, 2019 was $14.9 million, respectively.
Securities: Securities may be classified as either trading, held-to-maturity or available-for-sale. Trading securities (if any) are held principally for resale and recorded at their fair value with changes in fair value included in income. Held-to-maturity securities are those which the Company has the positive intent and ability to hold to maturity and are reported at amortized cost. Equity securities are carried at fair value, with changes in fair value reported in net income. Equity securities without readily determinable fair values are carried at cost, minus impairment, if any, plus or minus changes resulting from observable price changes in orderly transactions for the identical or a similar investment. Available-for-sale securities consist of securities not classified as trading securities nor as held-to maturity securities. Unrealized holding gains and losses on available-for-sale securities are excluded from income and reported in comprehensive income or loss. Gains and losses on the sale of available-for-sale securities are recorded on the trade date and are determined using the specific-identification method. Premiums and discounts on securities available for sale are recognized in interest income using the interest method over the period to maturity or call date as applicable pursuant ot ASU 2017-08. There were no investment securities classified as trading as of December 31, 2020 and 2019.
Management evaluates securities for other-than-temporary impairment (OTTI) on at least a quarterly basis, and more frequently when economic or market conditions warrant such an evaluation. For securities in an unrealized loss position, management considers the extent and duration of the unrealized loss, and the financial condition and near-term prospects of the issuer. Management also assesses whether it intends to sell, or it is more likely than not that it will be required to sell, a security in an unrealized loss position before recovery of its amortized cost basis. If either of the criteria regarding intent or requirement to sell is met, the entire difference between amortized cost and fair value is recognized as impairment through earnings. For debt securities that do not meet the aforementioned criteria, the amount of impairment is split into two components as follows: (1) OTTI related to credit loss, which must be recognized in the income statement and (2) OTTI related to other factors, which is recognized in other comprehensive income. The credit loss is defined as the difference between the present value of the cash flows expected to be collected and the amortized cost basis. For equity securities, the entire amount of impairment is recognized through income (if any).
Loans: Loans that management has the intent and the Bank has the ability to hold for the foreseeable future or until maturity or pay-off are reported at their outstanding principal balance, adjusted for any charge-offs, the allowance for loan losses, and any deferred fees or costs.
All interest accrued but not collected for loans that are placed on nonaccrual or charged-off is reversed against interest income. The interest on these loans is accounted for on the cash-basis or cost-recovery method, until qualifying for return to accrual status. Loans are returned to accrual status when all the principal and interest amounts contractually due are brought current and future payments are reasonably assured.
Allowance for loan losses: The allowance for loan losses, a valuation allowance for probable incurred credit losses, is established as losses are estimated to have occurred through a provision for loan losses charged to income. Loan losses are charged against the allowance when management believes the uncollectability of a loan balance is probable. Subsequent recoveries, if any, are credited to the allowance.
The Company has divided the loan portfolio into five portfolio segments and classes, each with different risk characteristics and methodologies for assessing risk. All loans are underwritten in accordance with polices set forth and
F-7
approved by the Company’s Board of Directors. The portfolio segments and class are the same and are identified by the Company as follows:
Commercial real estate: Commercial real estate loans consist of loans to finance real estate purchases, refinancing’s, expansions and improvements to commercial properties. These loans are secured by first liens on office buildings, apartments, farms, retail and mixed-use properties, churches, warehouses and restaurants located within the market area. Additionally, in response to the COVID-19 pandemic, the Company has granted loans to qualified businesses under the Paycheck Protection Program. The Company’s underwriting analysis includes credit verification, independent appraisals, a review of the borrower’s financial condition, and a detailed analysis of the borrower’s underlying cash flows. Commercial real estate loans are usually larger than residential loans and involve greater credit risk. The repayment of these loans largely depends on the results of operations and management of these properties. Adverse economic conditions also affect the repayment ability to a greater extent than that of residential real estate loans.
Residential real estate: The Company originates mostly adjustable-rate mortgage loans for the purchase or refinance of residential properties. These loans are collateralized by first or second mortgages on owner-occupied, second homes or investment residential properties located in the Company’s market area. The Company’s underwriting analysis includes repayment capacity and source, value of the underlying property and credit history stability.
Commercial: Commercial business loans and lines of credit consist of loans to small- and medium-sized companies in the Company’s market area. Commercial loans are generally used for working capital purposes or for acquiring equipment, inventory or furniture. Primarily all of the Company’s commercial loans are secured loans, along with a small amount of unsecured loans. The Company’s underwriting analysis consists of a review of the financial statements of the borrower, the lending history of the borrower, the debt service capabilities of the borrower, the projected cash flows of the business, the value of the collateral, if any, and whether the loan is guaranteed by the principals of the borrower. These loans are generally secured by accounts receivable, inventory and equipment. Commercial loans are typically made on the basis of the borrower’s ability to make repayment from the cash flow of the borrower’s business, which makes them of higher risk than residential loans and the collateral securing commercial loans may be difficult to appraise and may fluctuate in value based on the success of the business. The Company seeks to minimize these risks through our underwriting standards.
Construction and land development: Construction loans consist of loans to individuals for the construction of their primary residences and, to a limited extent, loans to builders and commercial borrowers. To the extent construction loans are not made to owner-occupants of single-family homes, they are more vulnerable to changes in economic conditions. Further, the nature of these loans is such that they are more difficult to evaluate and monitor. The risk of loss on a construction loan is dependent largely upon the accuracy of the initial estimate of the property’s value upon completion of the project and the estimated cost (including interest) of the project.
Consumer and other: Consumer loans mainly consist of variable-rate and fixed-rate personal loans and lines of credit and installment loans. Most of the Company’s consumer loans share approximately the same level of risk as residential mortgages.
The allowance for loan losses is evaluated on a regular basis by management and is based upon management’s periodic review of the collectability of the loans in light of historical experience, the nature and volume of the loan portfolio, adverse situations that may affect the borrower’s ability to repay, estimated value of any underlying collateral and prevailing economic conditions. The allowance for loan losses is also reviewed by the Board of Directors on a quarterly basis. This evaluation is inherently subjective as it requires estimates that are susceptible to significant revision as more information becomes available.
The allowance consists of specific and general components. The specific component relates to loans that are considered impaired. For such loans, an allowance is established when the discounted expected future cash flows or collateral value or observable market price of the impaired loan is lower than the carrying value of that loan. The general component covers all other loans and is based on historical loss experience (if any) adjusted for qualitative factors.
F-8
The historical loss component of the allowance is determined by a combination of losses recognized by portfolio segment over the preceding five years, if any, and if no losses were recognized, the Bank uses historical loss data from peer banks. This is supplemented by the risks for each portfolio segment. Risk factors impacting loans in each of the portfolio segments include changes in property values and changes in credit availability. The historical experience and/or peer bank risk factors are adjusted for qualitative factors such as economic conditions including trends in real estate sales, housing statistics, local unemployment rates, commercial and retail vacancy rates and the past due loans and default rates as well as other trends or uncertainties that could affect management’s estimate of probable incurred losses.
A loan is considered impaired when, based on current information and events, it is probable that the Company will be unable to collect the scheduled payments of principal or interest when due according to the original contractual terms of the loan agreement. Factors considered by management in determining impairment include payment status, collateral value, and the probability of collecting scheduled principal and interest payments when due. Loans that experience insignificant payment delays and payment shortfalls generally are not classified as impaired. Management determines the significance of payment delays and payment shortfalls on a case-by-case basis, taking into consideration all of the circumstances surrounding the loan and the borrower, including the length of the delay, the reasons for the delay, the borrower’s prior payment record, and the amount of the shortfall in relation to the principal and interest owed. Impairment is measured on a loan-by-loan basis for each class of loans by either the present value of expected future cash flows discounted at the loan’s effective interest rate, the loan’s obtainable market price, or the fair value of the collateral if the loan is collateral-dependent.
Troubled debt restructurings are separately identified for impairment disclosures and are measured at the present value of estimated future cash flows using the loan’s effective rate at inception. If a troubled debt restructuring is considered to be a collateral dependent loan, the loan is reported, net, at the fair value of the collateral. For troubled debt restructurings that subsequently default, the Company determines the amount of reserve in accordance with the accounting policy for the allowance for loan losses.
Federal Reserve Bank stock (FRB): The Company is a member of its regional Federal Reserve Bank. FRB stock is carried at cost, classified as a restricted security and periodically evaluated for impairment based on the ultimate recovery of par value.
Federal Home Loan Bank stock (FHLB): The Bank is a member of the FHLB system. Members are required to own a certain amount of stock based on the level of borrowings and other factors. FHLB stock is carried at cost, classified as a restricted security and periodically evaluated for impairment based on the ultimate recovery of par value.
Foreclosed assets: Assets acquired through or instead of loan foreclosure are initially recorded at fair value less costs to sell when acquired, establishing a new cost basis. These assets are subsequently accounted for at lower of cost or fair value less estimated costs to sell. If fair value declines subsequent to foreclosure, a valuation allowance is recorded through expense. Operating costs after acquisition are expensed. As of December 31, 2020 and 2019, there were no foreclosed assets.
Premises and equipment: Leasehold improvements, computer hardware and software, furniture, fixtures and equipment are stated at cost less accumulated depreciation and amortization. Depreciation and amortization are computed using the straight-line method over the shorter of the estimated useful life of each type of asset or the length of time the Company expects to lease the property.
Company-owned life insurance: Company-owned life insurance is recorded at the estimated amount that can be realized under the insurance contract at the consolidated balance sheet date, which is the cash surrender value adjusted for other changes or amounts that are probable at settlement.
Transfer of financial assets: Transfers of financial assets or a participating interest in an entire financial asset are accounted for as sales, when control over the assets has been surrendered. Control over transferred assets is deemed to be surrendered when: (1) the assets have been isolated from the Company, (2) the transferee obtains the right (free of conditions that constrain it from taking advantage of that right) to pledge or exchange the transferred assets, and (3) the
F-9
Company does not maintain effective control over the transferred assets through an agreement to repurchase them before their maturity.
Off-balance sheet financial instruments: In the ordinary course of business, the Company has entered into off-balance sheet financial instruments consisting of unused lines of credit, commitments to extend credit and standby letters of credit. Such financial instruments are recorded in the financial statements when they are funded.
Share-based compensation: Compensation cost is recognized for stock options and restricted stock awards issued to employees, based on the fair value of these awards at the date of grant. A Black Scholes model is utilized to estimate the fair value of stock options, while the market price of the Company’s common stock at the date of grant is used for restricted stock awards.
Compensation cost is recognized over the required service period, generally defined as the vesting period. For awards with graded vesting, compensation cost is recognized on a straight-line basis over the requisite service period for the entire award if conditions are met for recognition.
Income taxes: Income tax expense is the total of the current year income tax due or refundable and the change in deferred tax assets and liabilities. Deferred tax assets and liabilities are the expected future tax amounts for the temporary differences between carrying amounts and tax bases of assets and liabilities, computed using enacted tax rates. A valuation allowance, if needed, reduces deferred tax assets to the amount expected to be realized.
A tax position is recognized as a benefit only if it is “more likely than not” that the tax position would be sustained in a tax examination, with a tax examination being presumed to occur. The amount recognized is the largest amount of tax benefit that is greater than 50% likely of being realized on examination. For tax positions not meeting the “more likely than not” test, no tax benefit is recorded.
The Company recognizes interest and/or penalties related to income tax matters in income tax expense.
Earnings per Common Share: Basic earnings per common share is net income divided by the weighted average number of common shares outstanding during the period. Diluted earnings per common share includes the dilutive effect of additional potential common shares issuable under stock options.
Comprehensive income: GAAP requires that recognized revenue, expenses, gains and losses be included in net income. Although certain changes in assets and liabilities, such as unrealized gains and losses on available-for-sale securities, are reported as a separate component of the equity section of the balance sheets, such items, along with net income, are components of comprehensive income.
Loss contingencies: Loss contingencies, including claims and legal actions arising in the ordinary course of business (if any), are recorded as liabilities when the likelihood of loss is probable, and an amount or range of loss can be reasonably estimated. Management does not currently believe there are such matters that will have a material effect on the consolidated financial statements.
Dividend restriction: Banking regulations require maintaining certain capital levels and may limit the dividends paid by the bank to the holding company or by the holding company to shareholders.
Operating Segments: While the chief decision-makers monitor the revenue streams of the various products and services, operations are managed and financial performance is evaluated on a Company-wide basis. Discrete financial information is not available other than on a Company-wide basis. Accordingly, all of the financial services operations are considered by management to be aggregated in one reportable operating segment.
Adoption of new accounting pronouncements:
FIL-36-2020: On March 22, 2020, the federal banking agencies issued an “Interagency Statement on Loan Modifications and Reporting for Financial Institutions Working with Customers Affected by the Coronavirus”, which
F-10
was subsequently clarified and revised by an interagency statement issued on April 7, 2020. This guidance encourages financial institutions to work prudently with borrowers that may be unable to meet their contractual obligations because of the effects of the COVID-19 pandemic. The guidance explains that the staffs of the FASB and the federal banking agencies have concluded that short-term modifications (e.g. six months) made on a good faith basis to borrowers who were current as of the implementation date of a relief program are not Troubled Debt Restructurings (“TDRs”). The Coronavirus Aid, Relief and Economic Security Act (CARES Act) was signed into law on March 27, 2020 and has subsequently been amended several times. Section 4013 of the CARES Act also addressed COVID-19 pandemic related modifications and specified that COVID-19 pandemic related modifications on loans that were current as of December 31, 2019 are not TDRs. Modifications were executed in the second and third quarters of 2020. The majority of the loan modifications we made for customers involved three to six month forbearance payments which were added to the end of the note.
During the year ended December 31, 2020, the Company approved $199.8 million in payment relief modifications that were granted under the CARES Act guidance associated with the treatment of TDRs. Since the inception of the CARES Act, $187.8 million of these loans either have been reinstated to their original payment terms or have been paid off. As of December 31, 2020, there were 13 loans measured with a fair value of $11.1 million, that remain under the exemption from TDR classification as provided for in the CARES Act. To manage credit risk, the Company increased oversight and analysis of loans to borrowers in vulnerable industries, such as hotels and hospitality. As of December 31, 2020, these loans have a balance of $54.3 million. For the year ended December 31, 2020, $30.6 million of these loans were provided payment relief consistent with Section 4013 of the CARES Act and the interagency guidelines published on March 13, 2020, and as of December 31, 2020, $28.3 million has been reinstated and returned to normal payment schedules, with one deferred loan remaining in this group.
New accounting standards that have not yet been adopted:
The following provides a brief description of accounting standards that have been issued but are not yet adopted that could have a material effect on the Company’s financial statements:
ASU 2016-13, Financial Instruments – Credit Losses (Topic 326) | |
Description | In June 2016, FASB issued guidance to replace the incurred loss model with an expected loss model, which is referred to as the current expected credit loss (CECL) model. The CECL model is applicable to the measurement of credit losses on financial assets measured at amortized cost, including loan receivables and held to maturity debt securities. It also applies to off-balance sheet credit exposures not accounted for as insurance (i.e. loan commitments, standby letters of credit, financial guarantees and other similar instruments). |
Date of Adoption | For PBEs that are non-SEC filers and for SEC filers that are considered small reporting companies, it is effective for January 1, 2023. Early adoption is still permitted. |
Effect on the Consolidated Financial Statements | The Company's management is in the process of evaluating credit loss estimation models. Updates to business processes and the documentation of accounting policy decisions are ongoing. The company may recognize an increase in the allowance for credit losses upon adoption, recorded as a one-time cumulative adjustment to retained earnings. However, the magnitude of the impact on the Company's consolidated financial statements has not yet been determined. The Company will adopt this accounting standard effective January 1, 2023. |
ASU 2019-12: In December 2019, FASB released ASU 2019-12 - Income Taxes (Topic 740), which simplifies the accounting for income taxes by removing multiple exceptions to the general principals in Topic 740. The standard is effective for public business entities for fiscal years, and for interim periods within those fiscal years, beginning after December 15, 2020. The Company does not expect the adoption of this standard to have a material impact on the Company’s Consolidated Financial Statements.
ASU 2020-04: In March 2020, FASB released ASU 2020-04 - Reference Rate Reform (Topic 848), which provides optional guidance to ease the accounting burden in accounting for, or recognizing the effects from, reference rate reform
F-11
on financial reporting. The new standard is a result of the London Interbank Offered Rate ("LIBOR") likely being discontinued as an available benchmark rate. The standard is elective and provides optional expedients and exceptions for applying GAAP to contracts, hedging relationships, or other transactions that reference LIBOR, or another reference rate expected to be discontinued. The amendments in the update are effective for all entities between March 12, 2020 and December 31, 2022. The Company has established a cross-functional working group to guide the Company’s transition from LIBOR and has begun efforts to transition to alternative rates consistent with industry timelines. The Company has identified its products that utilize LIBOR and has implemented enhanced fallback language to facilitate the transition to alternative reference rates. The Company is evaluating existing platforms and systems and preparing to offer new rates.
NOTE 2 — EARNINGS PER SHARE
Basic earnings per common share is computed by dividing net income available to common shareholders by the weighted average number of shares of common stock outstanding during the year. Diluted earnings per common share is computed by dividing net income available to common shareholders by the weighted average number of shares of common stock outstanding plus the effect of employee stock options during the year.
| | Year Ended December 31, | ||||
|
| 2020 |
| 2019 | ||
Basic earnings per share: |
| |
|
| |
|
Net Income | | $ | 8,305 | | $ | 2,336 |
Total weighted average common stock outstanding | |
| 12,042,477 | |
| 5,850,816 |
Net income per share | | $ | 0.69 | | $ | 0.40 |
Diluted earnings per share: | |
| | |
| |
Net Income | | $ | 8,305 | | $ | 2,336 |
Total weighted average common stock outstanding | |
| 12,042,477 | |
| 5,850,816 |
Add: Dilutive effect of employee stock options | | | 390,040 | | | 37,793 |
Total weighted average diluted stock outstanding | | | 12,432,517 | | | 5,888,609 |
Net income per share | | $ | 0.67 | | $ | 0.40 |
For the year ended December 31, 2020, there were 442,838 stock options that were anti-dilutive. For the year ended December 31, 2019, there were no stock options that were anti-dilutive.
F-12
NOTE 3 — SECURITIES
The following table summarizes the amortized cost and fair value of securities available-for-sale and securities held-to-maturity at December 31, 2020 and 2019 and the corresponding amounts of gross unrealized gains and losses recognized in accumulated other comprehensive loss and gross unrecognized gains and losses:
|
| | |
| Gross |
| Gross |
| | | ||
| | Amortized | | Unrealized | | Unrealized | | | | |||
December 31, 2020 | | Cost | | Gains | | Losses | | Fair Value | ||||
Available-for-sale | | | | | | | | | | | | |
Small Business Administration loan pools | | $ | 30,678 | | $ | 77 | | $ | (199) | | $ | 30,556 |
Mortgage-backed securities | |
| 28,514 | |
| 438 | |
| (30) | |
| 28,922 |
United States agency obligations | | | 3,000 | | | 122 | | | - | | | 3,122 |
Community Development District bonds | | | 20,582 | | | 717 | | | - | | | 21,299 |
Municipals | | | 1,064 | | | 35 | | | - | | | 1,099 |
Corporate bonds | |
| 2,501 | |
| 9 | |
| - | |
| 2,510 |
Total available-for-sale | | $ | 86,339 | | $ | 1,398 | | $ | (229) | | $ | 87,508 |
| | | | | | | | | | | | |
|
| | |
| Gross |
| Gross |
|
| | ||
| | Amortized | | Unrecognized | | Unrecognized | | | | |||
| | Cost | | Gains | | Losses | | Fair Value | ||||
Held-to-Maturity | |
|
| |
|
| |
|
| |
|
|
Mortgage-backed securities | | $ | 345 | | $ | 14 | | $ | — | | $ | 359 |
United States Treasury | | | 202 | | | — | | | — | | | 202 |
Foreign Bonds | | | 1,000 | | | — | | | — | | | 1,000 |
Total Held-to-Maturity | | $ | 1,547 | | $ | 14 | | $ | — | | $ | 1,561 |
|
| | |
| Gross |
| Gross |
| | | ||
| | Amortized | | Unrealized | | Unrealized | | Fair | ||||
December 31, 2019 | | Cost | | Gains | | Losses | | Value | ||||
Available-for-sale |
| |
|
| |
|
| |
|
| |
|
Small Business Administration loan pools | | $ | 17,303 | | $ | 19 | | $ | (139) | | $ | 17,183 |
Mortgage-backed securities | |
| 5,237 | |
| — | |
| (52) | |
| 5,185 |
United States agency obligations | | | 4,000 | | | 70 | | | — | | | 4,070 |
Corporate bonds | |
| 2,000 | |
| 3 | |
| — | |
| 2,003 |
Total available-for-sale | | $ | 28,540 | | $ | 92 | | $ | (191) | | $ | 28,441 |
| | | | | | | | | | | | |
|
| | |
| Gross |
| Gross | | | | ||
| | Amortized | | Unrecognized | | Unrecognized | | Fair | ||||
| | Cost | | Gains | | Losses |
| Value | ||||
Held-to-Maturity |
| |
|
| |
|
| |
|
| |
|
Mortgage-backed securities | | $ | 214 | | $ | 10 | | $ | — | | $ | 224 |
Total Held-to-Maturity | | $ | 214 | | $ | 10 | | $ | — | | $ | 224 |
As of December 31, 2020 and 2019, Corporate bonds are comprised primarily of investments in the financial services industry. During the year ended December 31, 2020 the net investment portfolio increased by $65.5 million as a result of purchases and acquisitions. Proceeds from the sales of securities during the year ended December 31, 2020 were $1.7 million, with gross realized gains of $4 thousand. Proceeds from the calls of securities during the year ended December 31, 2020 were $9.1 million, with gross realized gains of $33 thousand. Proceeds from the sales and calls of securities during the year ended December 31, 2019 were $4.5 million and $0.5 million, respectively. Securities pledged as of December 31, 2020 and December 31, 2019 were $12.5 million and $14.9 million, respectively.
The scheduled maturities of securities as of December 31, 2020 are as follows. The amortized cost and fair value of debt securities are shown by contractual maturity. Expected maturities may differ from contractual maturities if
F-13
borrowers have the right to call or prepay obligations with or without call or prepayment penalties. Securities not due at a single maturity date are shown separately.
| | December 31, 2020 | ||||
|
| Amortized |
| Fair | ||
| | Cost | | Value | ||
Available-for-sale | | | | | | |
Due in one year or less | | $ | 1,001 | | $ | 1,001 |
Due after one year through five years | |
| 24,900 | |
| 25,736 |
Due after five years through ten years | | | 931 | | | 969 |
Due after ten years | | | 315 | | | 324 |
Subtotal | | $ | 27,147 | | $ | 28,030 |
| | | | | | |
Small Business Administration loan pools | | $ | 30,678 | | $ | 30,556 |
Mortgage-backed securities | | | 28,514 | | | 28,922 |
Total available-for-sale | | $ | 86,339 | | $ | 87,508 |
| | | | | | |
Held-to-maturity | | | | | | |
Due in one year or less | | $ | 1,202 | | $ | 1,202 |
Due after one year through five years | | | — | | | — |
Subtotal | | $ | 1,202 | | $ | 1,202 |
| | | | | | |
Mortgage-backed securities | | $ | 345 | | $ | 359 |
Total held-to-maturity | | $ | 1,547 | | $ | 1,561 |
At December 31, 2020 and 2019, there were no holdings of securities of any one issuer, other than the United States Government and its agencies, in an amount greater than 10% of shareholders’ equity.
The tables below indicate the fair value of debt securities with unrealized losses and for the period of time of which these losses were outstanding at December 31, 2020 and 2019, respectively, aggregated by major security type and length of time in a continuous unrealized loss position:
| | Less Than 12 Months | | 12 Months or Longer | | Total | ||||||||||||
|
| Fair |
| Unrealized |
| Fair |
| Unrealized |
| Fair |
| Unrealized | ||||||
| | Value | | Losses | | Value | | Losses | | Value | | Losses | ||||||
December 31, 2020 | | | | | | | | | | | | | | | | | | |
Available-for-sale | | | | | | | | | | | | | | | | | | |
Small Business Administration loan pools | | $ | 18,849 | | $ | (133) | | $ | 8,945 | | $ | (66) | | $ | 27,794 | | $ | (199) |
Mortgage-backed securities | |
| 5,839 | |
| — | |
| 2,510 | |
| (30) | |
| 8,349 | |
| (30) |
United States agency obligations | | | 227 | | | — | | | — | | | — | | | 227 | | | — |
Community Development District bonds | | | — | | | — | | | — | | | — | | | — | | | — |
Municipals | | | — | | | — | | | — | | | — | | | — | | | — |
Corporate bonds | |
| — | |
| — | |
| — | |
| — | |
| — | |
| — |
Total available-for-sale | | $ | 24,915 | | $ | (133) | | $ | 11,455 | | $ | (96) | | $ | 36,370 | | $ | (229) |
| | | | | | | | | | | | | | | | | | |
December 31, 2019 | |
|
| |
|
| |
|
| |
|
| |
|
| |
|
|
Available-for-sale | |
|
| |
|
| |
|
| |
|
| |
|
| |
|
|
SBA loan pools | | $ | 9,984 | | $ | (63) | | $ | 4,035 | | $ | (76) | | $ | 14,019 | | $ | (139) |
Mortgage-backed | |
| 1,914 | |
| (24) | |
| 2,541 | |
| (28) | |
| 4,455 | |
| (52) |
United States agency obligations | |
| — | | | — | | | — | | | — | |
| — | |
| — |
Corporate bonds | |
| — | |
| — | |
| — | |
| — | |
| — | |
| — |
Total available-for-sale | | $ | 11,898 | | $ | (87) | | $ | 6,576 | | $ | (104) | | $ | 18,474 | | $ | (191) |
F-14
The unrealized holding losses within the investment portfolio are considered to be temporary and are mainly due to changes in the interest rate cycle. The unrealized loss positions may fluctuate positively or negatively with changes in interest rates or spreads. Since SBA loan pools and mortgage-backed securities are government sponsored entities that are highly rated, the decline in fair value is attributable to changes in interest rates and not credit quality. The Company does not have any securities in an OTTI position. The Company does not have the intent to sell these securities and it is likely that it will not be required to sell the securities before their anticipated recovery. The Company does not consider these securities to be other-than-temporarily impaired at December 31, 2020. No credit losses were recognized in operations during the years ended December 31, 2020 and 2019.
NOTE 4 — LOANS
Loans at December 31, 2020 and 2019 were as follows:
|
| 2020 |
| 2019 | ||
Commercial real estate | | $ | 777,776 | | $ | 270,981 |
Residential real estate | |
| 380,491 | |
| 342,257 |
Commercial | |
| 396,642 | |
| 129,477 |
Construction and land development | |
| 99,883 | |
| 41,465 |
Consumer and other | |
| 11,688 | |
| 8,287 |
| |
| 1,666,480 | |
| 792,467 |
Less – | | | | | | |
Unearned loan origination (fees) costs, net | |
| (5,578) | |
| (752) |
Allowance for loan losses | |
| (16,259) | |
| (6,548) |
| | $ | 1,644,643 | | $ | 785,167 |
The recorded investment in loans excludes accrued interest receivable due to immateriality.
There are no loans over 90 days past due and accruing as of December 31, 2020 and 2019.
The following table presents the aging of the recorded investment in past due loans as of December 31, 2020 and 2019 by class of loans:
| | 30 – 59 | | 60 – 89 | | Greater than | | | | | | | | | | | | | |||
| | Days | | Days | | 89 Days | | | | | Total | | Loans Not | | | | |||||
|
| Past Due |
| Past Due |
| Past Due |
| Nonaccrual |
| Past Due |
| Past Due |
| Total | |||||||
December 31, 2020 |
| |
|
| |
|
| |
| | |
| | |
|
| |
|
| |
|
Commercial real estate | | $ | — | | $ | — | | $ | — | | $ | — | | $ | — | | $ | 777,776 | | $ | 777,776 |
Residential real estate | |
| 1,303 | |
| — | |
| — | |
| — | |
| 1,303 | |
| 379,188 | |
| 380,491 |
Commercial | |
| 278 | |
| — | |
| — | |
| 9,127 | |
| 9,405 | |
| 387,237 | |
| 396,642 |
Construction and land development | |
| — | |
| — | |
| — | |
| — | |
| — | |
| 99,883 | |
| 99,883 |
Consumer and other | |
| — | |
| — | |
| — | | | 1,307 | | | 1,307 | |
| 10,381 | |
| 11,688 |
Total | | $ | 1,581 | | $ | — | | $ | — | | $ | 10,434 | | $ | 12,015 | | $ | 1,654,465 | | $ | 1,666,480 |
| | 30 – 59 | | 60 – 89 | | Greater than | | | | | | | | | | | | | |||
| | Days | | Days | | 89 Days | | | | | Total | | Loans Not | | | | |||||
|
| Past Due |
| Past Due |
| Past Due |
| Nonaccrual |
| Past Due |
| Past Due |
| Total | |||||||
December 31, 2019 | | | | | | | | | | | | | | | | | | | | | |
Commercial real estate | | $ | — | | $ | 2,428 | | $ | — | | $ | — | | $ | 2,428 | | $ | 268,553 | | $ | 270,981 |
Residential real estate | |
| 304 | |
| — | |
| — | |
| 483 | |
| 787 | |
| 341,470 | |
| 342,257 |
Commercial | |
| — | |
| 134 | |
| — | |
| 1,797 | |
| 1,931 | |
| 127,546 | |
| 129,477 |
Construction and land development | |
| — | |
| — | |
| — | |
| — | |
| — | |
| 41,465 | |
| 41,465 |
Consumer and other | |
| — | |
| — | |
| — | | | — | | | — | |
| 8,287 | |
| 8,287 |
Total | | $ | 304 | | $ | 2,562 | | $ | — | | $ | 2,280 | | $ | 5,146 | | $ | 787,321 | | $ | 792,467 |
F-15
At December 31, 2020, there were six impaired loans with both unpaid principal balance and recorded investments totaling $13.1 million, of which there were three impaired loans with a recorded investment of $10.4 million on nonaccrual with an allowance of $8.3 million and one substandard accruing loan with a recorded investment of $2.4 million with no allowance. The average net investment on the impaired residential real estate and commercial loans during 2020 was $2.2 million. The residential real estate loans had $12.7 thousand of interest income recognized during the year ended December 31, 2020, which was equal to the cash basis interest income.
At December 31, 2019, there were five impaired loans (consisting of nonaccrual loans, troubled debt restructured loans, loans past due 90 days or more and still accruing interest and other loans based on management’s judgment) with recorded investments totaling $4.0 million with no allowance. The bank had three loans totaling $2.3 million on nonaccrual as of December 31, 2019. At December 31, 2019, there was one commercial loan impaired with a recorded investment of $1.1 million with a $626 thousand allowance. The average net investment on the impaired residential real estate and commercial loans during 2019 was $846 thousand. The residential real estate loans had $17 thousand of interest income recognized during the year ended December 31, 2019, which was equal to cash basis interest income.
Troubled Debt Restructurings:
The principal carrying balances of loans that met the criteria for consideration as a troubled debt restructuring were $0.3 million and $0.4 million as of December 31, 2020 and December 31, 2019, respectively. The Company has allocated no specific reserves to customers whose loan terms have been modified in troubled debt restructurings as of December 31, 2020 and December 31, 2019. The Company has not committed any additional amounts to customers whose loans are classified as a troubled debt restructuring.
There were no loans modified as troubled debt restructurings during the period ending December 31, 2020 or December 31, 2019.
Credit Quality Indicators:
The Company categorizes loans into risk categories based on relevant information about the ability of borrowers to service their debt including: current financial information, historical payment experience, credit documentation, public information, and current economic trends, among other factors. Generally, all credits greater than $0.5 million are reviewed no less than annually to monitor and adjust, if necessary, the credit risk profile. Loans classified as substandard or special mention are reviewed quarterly by the Company for further evaluation to determine if they are appropriately classified and whether there is any impairment. Beyond the annual review, all loans are graded upon initial issuance. In addition, during the renewal process of any loan, as well as if a loan becomes past due, the Company will determine the appropriate loan grade.
Loans excluded from the review process above are generally classified as pass credits until: (a) they become past due; (b) management becomes aware of deterioration in the credit worthiness of the borrower; or (c) the customer contacts the Company for a modification. In these circumstances, the loan is specifically evaluated for potential classification as to special mention, substandard, doubtful, or even charged-off. The Company uses the following definitions for risk ratings:
Pass: A Pass loan’s primary source of loan repayment is satisfactory, with secondary sources very likely to be realized if necessary. The pass category includes the following:
Riskless: Loans that are fully secured by liquid, properly margined collateral (listed stock, bonds, or other securities; savings accounts; certificates of deposit; loans or that portion thereof which are guaranteed by the United States Government or agencies backed by the “full faith and credit” thereof; loans secured by properly executed letters of credit from prime financial institutions).
High Quality Risk: Loans to recognized national companies and well-seasoned companies that enjoy ready access to major capital markets or to a range of financing alternatives. Borrower’s public debt offerings are accorded highest
F-16
ratings by recognized rating agencies, e.g., Moody’s or Standard & Poor’s. Companies display sound financial conditions and consistent superior income performance. The borrower’s trends and those of the industry to which it belongs are positive.
Satisfactory Risk: Loans to borrowers, reasonably well established, that display satisfactory financial conditions, operating results and excellent future potential. Capacity to service debt is amply demonstrated. Current financial strength, while financially adequate, may be deficient in a number of respects. Normal comfort levels are achieved through a closely monitored collateral position and/or the strength of outside guarantors.
Moderate Risk: Loans to borrowers who are in non-compliance with periodic reporting requirements of the loan agreement, and any other credit file documentation deficiencies, which do not otherwise affect the borrower’s credit risk profile. This may include borrowers who fail to supply updated financial information that supports the adequacy of the primary source of repayment to service the Bank’s debt and prevents bank management to evaluate the borrower’s current debt service capacity. Existing loans will include those with consistent track record of timely loan payments, no material adverse changes to underlying collateral, and no material adverse change to guarantor(s) financial capacity, evidenced by public record searches.
Special mention: A Special Mention loan has potential weaknesses that deserve management’s close attention. If left uncorrected, these potential weaknesses may result in the deterioration of the repayment prospects for the asset or the Company’s credit position at some future date. Special Mention loans are not adversely classified and do not expose an institution to sufficient risk to warrant adverse classification.
Substandard: A Substandard loan is inadequately protected by the current sound worth and paying capacity of the obligor or of the collateral pledged, if any. Loans so classified must have a well-defined weakness or weaknesses that jeopardize the liquidation of the debt. They are characterized by the distinct possibility that the Company will sustain some loss if the deficiencies are not corrected.
Doubtful: A loan classified Doubtful has all the weaknesses inherent in one classified Substandard with the added characteristics that the weaknesses make collection or liquidation in full, on the basis of currently existing facts, conditions, and values, highly questionable and improbable.
Loss: A loan classified Loss is considered uncollectible and of such little value that continuance as a bankable asset is not warranted. This classification does not mean that the asset has absolutely no recovery or salvage value, but rather it is not practical or desirable to defer writing off this basically worthless asset even though partial recovery may be affected in the future.
F-17
Based on the most recent analysis performed, the risk category of loans by class of loans is as follows:
| | | | | Special | | | | | | | | | | |
(Dollars in thousands) |
| Pass |
| Mention |
| Substandard |
| Doubtful |
| Total | |||||
December 31, 2020 | | | |
| | |
| | |
| | |
| | |
Commercial real estate | | $ | 775,420 | | $ | — | | $ | 2,356 | | $ | — | | $ | 777,776 |
Residential real estate | |
| 380,062 |
|
| 429 |
|
| — |
|
| — |
|
| 380,491 |
Commercial | |
| 387,403 |
|
| 112 |
|
| 9,127 |
|
| — |
|
| 396,642 |
Construction and land development | |
| 99,883 |
|
| — |
|
| — |
|
| — |
|
| 99,883 |
Consumer | |
| 10,381 |
|
| — |
|
| 1,307 |
|
| — |
|
| 11,688 |
Total | | $ | 1,653,149 |
| $ | 541 |
| $ | 12,790 |
| $ | — |
| $ | 1,666,480 |
| | | |
| | |
| | |
| | |
| | |
December 31, 2019 | | | | | | | | | | | | | | | |
Commercial real estate | | $ | 266,346 | | $ | 2,207 | | $ | 2,428 | | $ | — | | $ | 270,981 |
Residential real estate | |
| 341,819 |
|
| 438 |
|
| — |
|
| — |
|
| 342,257 |
Commercial | |
| 126,851 |
|
| 829 |
|
| 1,797 |
|
| — |
|
| 129,477 |
Construction and land development | |
| 41,465 |
|
| — |
|
| — |
|
| — |
|
| 41,465 |
Consumer | |
| 8,287 |
|
| — |
|
| — |
|
| — |
|
| 8,287 |
Total | | $ | 784,768 |
| $ | 3,474 |
| $ | 4,225 |
| $ | — |
| $ | 792,467 |
Purchased Credit Impaired Loans:
The Company has purchased loans, for which there was, at acquisition, evidence of deterioration of credit quality since origination and it was probable, at acquisition, that all contractually required payments would not be collected. The carrying amount of those loans is as follows:
(Dollars in thousands) |
| December 31, 2020 | |
Commercial real estate | | $ | — |
Residential real estate | |
| 405 |
Commercial | |
| 746 |
Construction and development | |
| 3,732 |
Consumer and other loans | |
| — |
Carrying amount | | $ | 4,883 |
Accretable yield, or income expected to be collected, is as follows:
(Dollars in thousands) |
| 2020 | |
Balance at January 1 | | $ | — |
New loans purchased | |
| (545) |
Adjustment of income | |
| (85) |
Reclassifications from nonaccretable difference | |
| — |
Disposals | |
| — |
Balance at December 31 | | $ | (630) |
For those purchased credit impaired loans disclosed above, no allowances for loan losses were recorded through the year ended December 31, 2020.
The credit fair value adjustment on purchased credit impairment (“PCI”) loans represents the portion of the loan balances that have been deemed uncollectible based on the Company’s expectations of future cash flows for each
F-18
respective loan. PCI loans purchased on March 26, 2020, for which it was probable at acquisition that all contractually required payments would not be collected are as follows:
(Dollars in thousands) |
| March 26, 2020 | |
Contractually required principal and interest by loan type | | | |
Commercial real estate | | $ | 427 |
Residential real estate | |
| 604 |
Commercial | |
| 2,176 |
Construction and development | |
| 5,614 |
Consumer and other loans | |
| - |
Total | | $ | 8,821 |
Contractual cash flows not expected to be collected (nonaccretable discount) | | | |
Commercial real estate | | $ | 80 |
Residential real estate | |
| 138 |
Commercial | |
| 1,123 |
Construction and development | |
| 2,297 |
Consumer and other loans | |
| - |
Total | | $ | 3,638 |
| | | |
Expected cash flows | | $ | 5,183 |
Interest component of expected cash flows (accretable discount) | | | (545) |
Fair value of PCI loans accounted for under ASC 310-30 | | $ | 4,638 |
Non-Performing Assets
The Company learned on July 15, 2020 that one of its borrowers, Coex Coffee International Inc. (“Coex”), filed a Petition Commencing an Assignment for the Benefit of Creditors in the 11th Judicial Circuit Court in Miami-Dade County, Florida. This state court action is similar to a federal bankruptcy case where the assignee is tasked, under the oversight of a judge, with the repayment of creditors of a troubled entity. Coex was primarily in the business of purchasing and selling green coffee beans and financed its business through various credit facilities from ten financial institutions in an amount totaling $191.9 million. On July 15, 2020, the Company had a total of thirty-one (31) advances to Coex for the purchase of coffee from growers for period of up to 90 days with an aggregate outstanding balance of $12.4 million. However, the Company had a current balance of $8.3 million net of a participation, without recourse, to another financial institution. The loans are collateralized by coffee beans and the proceeds from coffee sales. While at the time of petition, the advances were current, the preliminary records reviewed by the Assignee indicate that certain loan documents, including purchase orders, were fraudulent and that only $1.2 million of the associated value may have been attributed as collateral against the aggregate outstanding balance. In the third quarter of 2020, the Company recorded an impairment of $7.6 million against the Coex loan. The Company continues to vigorously pursue all courses of action available to mitigate potential losses, including a potential insurance claim, in order to recover as much of the current outstanding balance as possible. At this time, the Company is unable to provide any assurances whether these courses of action will ultimately be successful.
Paycheck Protection Program (PPP)
The Company has participated in the PPP offered through the United States Small Business Administration (SBA) by way of the Coronavirus Aid Relief and Economic Security (CARES) Act that was passed at the end of the first quarter 2020. As a qualified SBA lender, the Company was automatically authorized to originate PPP loans. To help clients, the Company added an online PPP application form and automated the PPP loan closing documentation process. The Company processed, closed and funded 1,506 small business loans representing $226.2 million in relief proceeds throughout 2020. The majority of these loans were intially pledged to the Federal Reserve as part of the Paycheck Protection Program Liquidity Facility (PPPLF). The PPPLF pledged loans are non-recourse to the Company. These loans are guaranteed by the government and as such no loan loss reserves have been recorded for these loans. In addition, the Company paid off approximately $123.6 million in PPPLF advances during the year ended
F-19
December 31, 2020, and had a balance of $101.4 million remaining as of December 31, 2020. Interest income on loans include PPP loan fees. PPP loan fees recognized during the year ended December 31, 2020 was $2.5 million.
Debt Service Relief Requests Related to COVID-19
As of December 31, 2020, the Company has reviewed and processed numerous debt service relief requests in accordance with Section 4013 of the CARES Act and interagency guidelines published by federal banking regulators on March 13, 2020. As currently interpreted by the agencies, the guidelines assert that short-term modifications made on good faith for reasons related to the COVID-19 pandemic to borrowers who were current prior to such relief are not considered TDRs. These modifications include deferrals of principal and interest, modification to interest only, and deferrals to escrow requirements. The modifications have varying terms up to six months.
Further, during the year ended December 31, 2020, the Company has approved $199.8 million in payment relief modifications that were granted under the Cares Act guidance associated with the treatment of TDRs. Since the inception of the CARES Act, $187.8 million of these loans either have been reinstated to their original payment terms or have been paid off. As of December 31, 2020, there remained 13 loans measured with a fair value of $11.1 million, that remain under the exemption from TDR classification as provided for in the CARES Act.
To manage credit risk, after the outbreak of the COVID-19 pandemic, the Company increased oversight and analysis of loans to borrowers in vulnerable industries such as hotels and hospitality. As of December 31, 2020, these loans have a balance of $54.3 million. For the year ended December 31, 2020, $30.6 million of these loans where provided payment relief consistent with Section 4013 of the CARES Act and the interagency guidelines published on March 13, 2020, and as of December 31, 2020, $28.3 million has been reinstated and returned to normal payment schedules, with one deferred loan remaining in this group.
NOTE 5 — ALLOWANCE FOR LOAN LOSSES
The following table presents the balance in the allowance for loan losses and the recorded investment in loans by portfolio segment and based on the impairment method for the years ended December 31, 2020 and 2019:
| | | | | | | | | | | Construction | | | | | | ||
| | Commercial | | Residential | | | | | and land | | Consumer | | | | ||||
|
| Real Estate |
| Real Estate |
| Commercial |
| Development |
| and Other |
| Total | ||||||
December 31, 2020 |
| |
|
| |
|
| |
|
| |
|
| |
|
| |
|
Allowance for loan losses: |
| |
|
| |
|
| |
|
| |
|
| |
|
| |
|
Beginning balance | | $ | 1,845 | | $ | 3,115 | | $ | 1,235 | | $ | 272 | | $ | 81 | | $ | 6,548 |
Provision for loan losses | |
| 1,314 | |
| (731) | |
| 9,326 | |
| 116 | |
| (8) | |
| 10,017 |
Loans charged-off | |
| - | |
| (207) | |
| (99) | |
| - | |
| - | |
| (306) |
Recoveries | |
| - | |
| - | |
| - | |
| - | |
| - | |
| - |
Total ending allowance balance | | $ | 3,159 | | $ | 2,177 | | $ | 10,462 | | $ | 388 | | $ | 73 | | $ | 16,259 |
| | | | | | | | | | | Construction | | | | | | | |
| | Commercial | | Residential | | | | | and land | | Consumer | | | | ||||
|
| Real Estate |
| Real Estate |
| Commercial |
| Development |
| and Other |
| Total | ||||||
December 31, 2019 |
| |
|
| |
|
| |
|
| |
|
| |
|
| |
|
Allowance for loan losses: |
| |
|
| |
|
| |
|
| |
|
| |
|
| |
|
Beginning balance | | $ | 1,435 | | $ | 1,822 | | $ | 2,106 | | $ | 262 | | $ | 60 | | $ | 5,685 |
Provision for loan losses | |
| 410 | |
| 1,293 | |
| (871) | |
| 10 | |
| 20 | |
| 862 |
Loans charged-off | |
| — | |
| — | |
| — | |
| — | |
| — | |
| — |
Recoveries | |
| — | |
| — | |
| — | |
| — | |
| 1 | |
| 1 |
Total ending allowance balance | | $ | 1,845 | | $ | 3,115 | | $ | 1,235 | | $ | 272 | | $ | 81 | | $ | 6,548 |
F-20
| | | | | | | | | | | Construction | | | | | | ||
| | Commercial | | Residential | | | | | and Land | | Consumer | | | | ||||
|
| Real Estate |
| Real Estate |
| Commercial |
| Development |
| and Other |
| Total | ||||||
December 31, 2020 | |
|
| |
|
| |
|
| |
|
| |
|
| |
|
|
Allowance for loan losses: | | | | | | | | | | | | | | | | | | |
Ending allowance balance attributable to loans | | | | | | | | | | | | | | | | | | |
Individually evaluated for impairment | | $ | — | | $ | — | | $ | 8,309 | | $ | — | | $ | — | | $ | 8,309 |
Purchased Credit Impaired (PCI) loans | | | — | | | — | | | — | | | — | | | — | | | — |
Collectively evaluated for impairment | | | 3,159 | | | 2,177 | | | 2,153 | | | 388 | | | 73 | | | 7,950 |
Total ending allowance balance | | $ | 3,159 | | $ | 2,177 | | $ | 10,462 | | $ | 388 | | $ | 73 | | $ | 16,259 |
| | | | | | | | | | | | | | | | | | |
Loans: | | | | | | | | | | | | | | | | | | |
Loans individually evaluated for impairment | | $ | 2,356 | | $ | 298 | | $ | 9,127 | | $ | — | | $ | 1,307 | | $ | 13,088 |
Loans collectively evaluated for impairment | | | 775,420 | | | 380,193 | | | 387,515 | | | 99,883 | | | 10,381 | | | 1,653,392 |
Total ending loans balance | | $ | 777,776 | | $ | 380,491 | | $ | 396,642 | | $ | 99,883 | | $ | 11,688 | | $ | 1,666,480 |
| | | | | | | | | | | | | | | | | | |
December 31, 2019 | | | | | | | | | | | | | | | | | | |
Allowance for loan losses: | | | | | | | | | | | | | | | | | | |
Ending allowance balance attributable to loans | | | | | | | | | | | | | | | | | | |
Individually evaluated for impairment | | $ | — | | $ | — | | $ | 626 | | $ | — | | $ | — | | $ | 626 |
Collectively evaluated for impairment | | | 1,845 | | | 3,115 | | | 609 | | | 272 | | | 81 | | | 5,922 |
Total ending allowance balance | | $ | 1,845 | | $ | 3,115 | | $ | 1,235 | | $ | 272 | | $ | 81 | | $ | 6,548 |
| | | | | | | | | | | | | | | | | | |
Loans: | | | | | | | | | | | | | | | | | | |
Loans individually evaluated for impairment | | $ | 2,428 | | $ | 483 | | $ | 1,797 | | $ | — | | $ | — | | $ | 4,708 |
Loans collectively evaluated for impairment | | | 268,553 | | | 341,774 | | | 127,680 | | | 41,465 | | | 8,287 | | | 787,759 |
Total ending loans balance | | $ | 270,981 | | $ | 342,257 | | $ | 129,477 | | $ | 41,465 | | $ | 8,287 | | $ | 792,467 |
NOTE 6 — PREMISES AND EQUIPMENT
Company premises and equipment, net at December 31, 2020 and 2019 are comprised of the following:
|
| 2020 |
| 2019 | ||
Furniture, fixture and equipment | | $ | 1,694 |
| $ | 1,124 |
Computer, hardware and software | |
| 2,260 |
|
| 1,639 |
Leasehold improvements | |
| 3,537 |
|
| 3,310 |
Corporate Branding | |
| 118 |
|
| 118 |
| |
| 7,609 | |
| 6,191 |
Accumulated depreciation and amortization | |
| (3,239) |
|
| (1,884) |
| | $ | 4,370 | | $ | 4,307 |
Depreciation and amortization expense was $1.3 million and $1.4 million in 2020 and 2019, respectively.
NOTE 7 — TIME DEPOSITS
Time deposits exceeding $250 thousand were approximately $154.0 million and $62.7 million at December 31, 2020 and 2019, respectively.
F-21
Scheduled maturities of time deposits at December 31, 2020 are as follows:
Year ending December 31 |
| Amount | |
2021 |
| $ | 177,241 |
2022 |
|
| 56,978 |
2023 |
|
| 1,653 |
2024 |
|
| 703 |
2025 |
|
| — |
| | $ | 236,575 |
NOTE 8 — BORROWINGS
Federal Home Loan Bank Advances
At December 31, 2020 and 2019, advances from the Federal Home Loan Bank were as follows:
|
| 2020 |
| 2019 | ||
Maturities of 2020 through 2030, fixed rate at rates from 0.81% to 1.42%, averaging 1.12% | | $ | 10,000 | | $ | 5,000 |
Maturities of 2019 through 2024, floating rate at rates from 1.86% to 2.46%, averaging 2.24% | |
| 30,000 | |
| 50,000 |
| | $ | 40,000 | | $ | 55,000 |
Each advance is payable at its maturity date, with a prepayment penalty for fixed rate advances. The advances were collateralized by $189.9 million and $125.1 million of first mortgage loans under a blanket lien arrangement at December 31, 2020 and 2019, respectively. Based on this collateral and the Company’s holdings of FHLB stock, the Company is eligible to borrow up to a total of $109.7 million at December 31, 2020.
Payments over the next five years are as follows:
2021 |
| $ | — |
2022 | | | — |
2023 | | | — |
2024 | | | 30,000 |
2025 | | | — |
Federal Reserve Bank of Atlanta.
The Federal Reserve Bank of Atlanta has an available borrower in custody arrangement which allows us to borrow on a collateralized basis. No advances were outstanding under this facility as of December 31, 2020.
Loan Participations
The Company reclassified three loans, originally recorded net of participations in March as part of the MBI acquisition in accordance with ASC Topic 860 Transfers and Servicing. As a result, both loans and other borrowings increased by $13.2 million during the fourth quarter due to the reclassification. A review of the original participation documentation revealed that the agreements did not contain certain technical attributes required to qualify for sales treatment. These reclassifications do not impact earnings or capital.
PPPLF Advances
The Company participated in the PPP and processed, closed and funded 1,506 small business loans representing $226.2 million in relief proceeds throughout 2020. The majority of these loans were intially pledged to the Federal Reserve as part of the PPPLF. The PPPLF pledged loans are non-recourse to the Company. These loans are guaranteed by the
F-22
government and as such no loan loss reserves have been recorded for these loans. In addition, the Company paid off approximately $123.6 million in PPPLF advances during the year ended December 31, 2020, and had a balance of $101.4 million remaining as of December 31, 2020. Interest income on loans include PPP loan fees. PPP loan fees recognized during the year ended December 31, 2020 was $2.5 million.
Subordinated Debt
On March 26, 2020, pursuant to terms of the acquisition, the Company assumed the subordinated notes payable of MBI at its fair value of $10.3 million. According to the terms of the subordinated note, the principal amount due is $10.0 million with a 7% fixed rate until October 30, 2021 and a variable rate thereafter at LIBOR plus 576 basis points. The note matures on October 30, 2026 and can be redeemed by the Company anytime on or after October 30, 2021. The subordinated debt was fair valued at a premium of $0.5 million and will be amortized over the expected life.
Valley National Line of Credit
On December 19, 2019, the Company entered into a new $10.0 million secured revolving line of credit with Valley National Bank, N.A. Amounts drawn under this line of credit bears interest at the Prime Rate, as announced by The Wall Street Journal from time to time as its prime rate, and its obligations under this line of credit are secured by all of the issued and outstanding shares of capital stock of the Company, which we have pledged as security. Outstanding principal and interest under the line of credit is payable at maturity on December 19, 2020. As of December 31, 2019, approximately $10.0 million was drawn under this line of credit, the proceeds of which were primarily used to provide additional capital to support continued growth and also to cover expenses incurred in connection with entering into the line of credit. On February 12, 2020 the Company used a portion of the net proceeds from its IPO to repay all of the outstanding principal and accrued interest under the line of credit with Valley National Bank, N.A.
NOTE 9 — COMMON STOCK AND PREFERRED STOCK
Class A Voting Common Stock
The Company has Class A voting common stock with a par value of $0.01 per share. As of December 31, 2020, there are 50,000,000 shares authorized as Class A of which 13,534,829 are outstanding. During the year ended December 31, 2020, the Company issued 7,989,865 Class A shares, inclusive of 3,565,000 shares in completion of its initial public offering, 4,227,816 shares in the business combination with MBI and 7,194 shares of employee stock purchase.
During the year ended December 31, 2020, the Company exchanged 752,184 shares of Class B non-voting stock for an equal number of Class A voting stock pursuant to the Investor Rights Agreement, dated February 17, 2017. As a result of the exchanges, 752,184 shares of the Company’s Class B common stock were cancelled, and 752,184 shares of the Company’s Class A common stock were issued.
Furthermore, the Company cancelled 1,551 restricted shares of Class A common stock and repurchased 320,931 shares of Class A common stock during the year ended December 31, 2020.
Class B Non-voting Common Stock
The Company has Class B Non-voting common stock with a par value of $0.01 per share. As of December 31, 2020, there are 10,000,000 shares authorized as Class B, none of which are outstanding. During the year ended December 31, 2020, the Company exchanged 752,184 shares of Class B non-voting stock for an equal number of Class A voting stock pursuant to the Investor Rights Agreement, dated as of February 17, 2017, by and between the Company, Mendon Capital QP LP, Iron Road Multi-Strategy Fund LP, Mendon Capital Master Fund Ltd., Mendon Global Long/Short Financial QP Fund Ltd., and RMB Mendon Financial Services Fund. As a result of the exchanges, 752,184 shares of the Company’s Class B common stock were cancelled, and 752,184 shares of the Company’s Class A common stock were issued. Following these exchanges, the Company no longer has any shares of Class B common stock outstanding.
F-23
Preferred Stock
The Company has 10,000,000 shares of undesignated and unissued preferred stock.
NOTE 10 — INCOME TAXES
Components of the provision for income taxes for the years ended December 31, 2020 and 2019 are as follows:
|
| 2020 |
| 2019 | ||
Current provision |
| |
|
| |
|
Federal | | $ | 3,849 | | $ | 686 |
State | |
| 466 | |
| 200 |
| | | | | | |
Deferred provision | |
|
| |
|
|
Federal | |
| (1,556) | |
| (181) |
State | |
| (342) | |
| (49) |
| | $ | 2,417 | | $ | 656 |
The difference between the financial statement tax provision and amounts computed by applying the statutory federal income tax rate is due primarily to state taxes and permanent items.
|
| 2020 |
| 2019 |
|
Federal statutory rate times financial statement income |
| 21.0 | % | 21.0 | % |
Effect of: |
|
|
|
| |
State taxes, net of federal benefit |
| 0.9 | % | 3.5 | % |
Tax-exempt interest |
| (1.0) | % | — | % |
Earnings from company owned life insurance |
| (1.0) | % | (2.9) | % |
Acquisition costs | | 1.3 | % | — | % |
Change in rate |
| — | % | 1.8 | % |
Other, net |
| 1.3 | % | (1.5) | % |
|
| 22.5 | % | 21.9 | % |
The composition of the deferred tax assets:
|
| 2020 |
| 2019 | ||
Deferred Tax assets: |
| |
|
| |
|
Allowance for loan losses | | $ | 4,205 | | $ | 1,722 |
Preopening expenses | |
| 66 | |
| 56 |
Fair value adjustments | | | 4,469 | | | — |
Stock-based compensation | |
| 821 | |
| 86 |
Deferred loan fees | |
| 1,368 | |
| 184 |
Deferred rent | |
| 111 | |
| 81 |
Unrealized loss on securities available for sale | |
| — | |
| 24 |
Other | |
| 3 | |
| 21 |
| |
| 11,043 | |
| 2,174 |
| | | | | | |
Deferred Tax liabilities: | | | | | | |
Property and equipment | |
| (518) | |
| (315) |
Unrealized gain on securities available for sale | | | (286) | | | — |
| |
| (804) | |
| (315) |
Net deferred tax asset | | $ | 10,239 | | $ | 1,859 |
In assessing the realizability of deferred tax assets, management considered whether it is more likely than not that some portion or all of the deferred tax assets will be realized using all available evidence, both positive and negative.
F-24
The ultimate realization of deferred tax assets is dependent upon the generation of future taxable income during the periods in which those temporary differences become deductible.
At December 31, 2020, the Company had no amounts recorded for uncertain tax positions. The Company does not expect the total amount of unrecognized tax benefits to significantly increase in the next twelve months. The Company recognizes interest and penalties related to income tax matters in income tax expense. The Company is subject to United States federal income tax as well as income tax of the state of Florida. The Company is not subject to examination by taxing authorities for years prior to 2017.
NOTE 11 — RELATED PARTY TRANSACTIONS
In the ordinary course of business, the Bank grants loans to and accepts deposits from executive officers, directors, and their affiliates. The amount of related party loans at December 31, 2020 and 2019 were $9.1 million and $4.4 million, respectively.
Loans to principal officers, directors and their affiliates at December 31, 2020 and 2019 were as follows:
|
| 2020 |
| 2019 | ||
Balance at January 1, | | $ | 4,388 | | $ | 4,476 |
New loans | |
| 2,500 | |
| — |
MBI acquisition | | | 757 | | | — |
PPP | | | 1,682 | | | — |
Effect of changes in composition of related parties | |
| — | |
| — |
Repayments | |
| (190) | |
| (88) |
Balance at December 31, | | $ | 9,137 | | $ | 4,388 |
Deposits from principal officers, directors and their affiliates at December 31, 2020 and 2019 were $12.1 million and $11.4 million, respectively.
NOTE 12 — OTHER EMPLOYEE BENEFITS
The Company, through the Bank, has adopted a 401(k) benefit plan (the Plan) covering substantially all eligible employees and contains a safe harbor provision whereby all employees who initially enroll are 100% vested. The Company, at its discretion, matches the employees’ annual contribution up to 4% of their annual salary. The Company contributed approximately $0.6 million and $0.4 million to the Plan in 2020 and 2019, respectively.
NOTE 13 — FAIR VALUE
Fair value is the exchange price that would be received for an asset or paid to transfer a liability (exit price) in the principal or most advantageous market for the asset or liability in an orderly transaction between market participants on the measurement date. There are three levels of inputs that may be used to measure fair values:
Level 1 — Quoted prices (unadjusted) for identical assets or liabilities in active markets that the entity has the ability to access as of the measurement date.
Level 2 — Significant other observable inputs other than Level 1 prices such as quoted prices for similar assets or liabilities; quoted prices in markets that are not active; or other inputs that are observable or can be corroborated by observable market data.
Level 3 — Significant unobservable inputs that reflect a Company’s own assumptions about the assumptions that market participants would use in pricing an asset or liability.
F-25
The Company used the following methods and significant assumptions to estimate fair value:
Cash and cash equivalents: The carrying amounts of cash and cash equivalents approximate their fair value.
Securities available for sale: Where quoted prices are available in an active market, securities are classified within Level 1 of the valuation hierarchy. Level 1 securities include highly liquid government bonds, certain mortgage products and exchange-traded equities. If quoted market prices are not available, then fair values are estimated by using pricing models, quoted prices of securities with similar characteristics, or discounted cash flows. Examples of such instruments, which would generally be classified within Level 2 of the valuation hierarchy, include certain collateralized mortgage and debt obligations, corporate bonds, municipal bonds and United States agency notes. In certain cases where there is limited activity or less transparency around inputs to the valuation, securities are classified within Level 3 of the valuation hierarchy. Securities classified within Level 3 might include certain residual interests in securitizations and other less liquid securities. As of December 31, 2020 and 2019, all securities available for sale were Level 2.
Securities held-to-maturity: Reported at fair value utilizing level 2 inputs. The estimated fair value is determined based on market quotes when available. If not available, quoted market prices of similar securities, discounted cash flow analysis, pricing models and observable market data are used in determining fair market value.
Equity securities: The Company values equity securities at readily determinable market values based on the closing price at the end of each period. Changes in fair value are recognized through net income.
Loans: Fair values are estimated for portfolios of loans with similar characteristics. Loans are segregated by type, such as commercial or residential mortgage. Each loan category is further segmented into fixed and adjustable rate interest terms as well as performing and non-performing categories. The fair value of loans is calculated by discounting scheduled cash flows through the estimated life including prepayment considerations and estimated market discount rates that reflect the risks inherent to the loan. The calculation of the fair value considers market driven variables including credit related factors and reflects an exit price as defined in ASC Topic 820.
Federal Home Loan Bank stock: It is not practical to determine fair value due to restrictions placed on transferability.
Federal Reserve Bank stock: It is not practical to determine fair value due to restrictions placed on transferability.
Accrued interest receivable: The carrying amounts of accrued interest approximate their fair values.
Deposits: The fair values disclosed for demand, NOW, money-market and savings deposits are, by definition, equal to the amount payable on demand at the reporting date (carrying amount). Fair values for fixed-rate time deposits are estimated using current market rates offered for remaining or similar maturities.
Federal Home Loan Bank advances: Fair values are estimated using discounted cash flow analysis based on the Company’s current incremental borrowing rates for similar types of borrowing arrangements.
Line of Credit: The carrying amounts of the line of credit approximate their fair values.
Off-balance-sheet instruments: Fair values for off-balance-sheet lending commitments are based on fees currently charged to enter into similar agreements, taking into account the remaining terms of the agreements and the counterparties’ credit standing.
F-26
Assets and Liabilities Measured on a Recurring Basis
Assets and liabilities measured at fair value on a recurring basis, are summarized below:
| | | | | Fair Value Measurements | |||||||
| | | | | at December 31, 2020 Using: | |||||||
| | | | | | | | Significant | | | | |
| | | | | Quoted Prices in | | Other | | Significant | |||
| | | | | Active Markets for | | Observable | | Unobservable | |||
| | Fair | | Identical Assets | | Inputs | | Inputs | ||||
December 31, 2020 |
| Value |
| (Level 1) |
| (Level 2) |
| (Level 3) | ||||
Available-for-sale |
| |
|
| |
|
| |
|
| |
|
Small Business Administration loan pools | | $ | 30,556 | | $ | — | | $ | 30,556 | | $ | — |
Mortgage-backed securities | |
| 28,922 | |
| — | |
| 28,922 | |
| — |
United States agency obligations | | | 3,122 | | | — | | | 3,122 | | | — |
Community Development District bonds | | | 21,299 | | | — | | | 21,299 | | | — |
Municipals | | | 1,099 | | | — | | | 1,099 | | | — |
Corporate bonds | |
| 2,510 | |
| — | |
| 2,510 | |
| — |
Total | | $ | 87,508 | | $ | — | | $ | 87,508 | | $ | — |
Equity |
| |
|
| |
|
| |
|
| |
|
Mutual funds | | $ | 6,005 | | $ | 6,005 | | $ | — | | $ | — |
Total | | $ | 6,005 | | $ | 6,005 | | $ | — | | $ | — |
| | | | | Fair Value Measurements | |||||||
| | | | | at December 31, 2019 Using: | |||||||
| | | | | | | | Significant | | | | |
| | | | | Quoted Prices in | | Other | | Significant | |||
| | | | | Active Markets for | | Observable | | Unobservable | |||
| | Fair | | Identical Assets | | Inputs | | Inputs | ||||
December 31, 2019 |
| Value |
| (Level 1) |
| (Level 2) |
| (Level 3) | ||||
Available-for-sale |
| |
|
| |
|
| |
|
| |
|
SBA loans pools | | $ | 17,183 | | $ | — | | $ | 17,183 | | $ | — |
Mortgage-backed securities | |
| 5,185 | |
| — | |
| 5,185 | |
| — |
United States agency obligations | |
| 4,070 | |
| — | |
| 4,070 | |
| — |
Corporate bonds | |
| 2,003 | |
| — | |
| 2,003 | |
| — |
Total | | $ | 28,441 | | $ | — | | $ | 28,441 | | $ | — |
Equity |
| |
|
| |
|
| |
|
| |
|
Mutual funds | | $ | 971 | | $ | — | | $ | 971 | | $ | — |
Total | | $ | 971 | | $ | — | | $ | 971 | | $ | — |
There were no securities reclassified into or out of Level 3 during the year ended December 31, 2020 and 2019.
Impaired loans: The fair value of impaired loans with specific allocations of the allowance for loan losses is generally based on recent real estate appraisals. These appraisals may utilize a single valuation approach or a combination of approaches including comparable sales and the income approach. Adjustments are routinely made in the appraisal process by the independent appraisers to adjust for differences between the comparable sales and income data available for similar loans and collateral underlying such loans. Such adjustments result in a Level 3 classification of the inputs for determining fair value. Non-real estate collateral may be valued using an appraisal, net book value per the borrower’s financial statements, or aging reports, adjusted or discounted based on management’s historical knowledge, changes in market conditions from the time of the valuation, and management’s expertise and knowledge of the client and client’s business, resulting in a Level 3 fair value classification. Impaired loans are evaluated on a quarterly basis for additional impairment and adjusted in accordance with the allowance policy.
Specifically, regarding the Coex Coffee International Loan, the carrying amount of the loan for impairment purposes was determined based on the note outstanding balance at December 31, 2020, less the non-recourse amount sold to our participant, yielding a carrying value of $8.3 million. The fair value of the collateral was determined based on
F-27
a review of preliminary information obtained from the Assignee related to the collectability of the purchase order advances and adjusted for estimated legal and Assignee related costs. When netted in the same percentage as the non-recourse portion of the loan, the net fair value of collateral was noted as $0.6 million. The net result of these calculations provides for a specific reserve of $7.6 million within the ALLL associated with the Coex Coffee International loan or approximately 92% of the carrying value of the loan.
Assets measured at fair value on a non-recurring basis are summarized below:
| | | | | Fair Value Measurements | ||||||||||
| | | | | at December 31, 2020 Using: | ||||||||||
| | | | | | | | Significant | | | | | | | |
| | | | | Quoted Prices in | | Other | | Significant | | | | |||
| | Total at | | Active Markets for | | Observable | | Unobservable | | | | ||||
| | December 31, | | Identical Assets | | Inputs | | Inputs | | Total Gains | |||||
(Dollars in thousands) |
| 2020 |
| (Level 1) |
| (Level 2) |
| (Level 3) |
| (Losses) | |||||
Impaired Loans: |
| |
|
| |
|
| |
|
| |
| | |
|
Commercial real estate | | $ | — | | $ | — | | $ | — | | $ | — | | $ | — |
Residential real estate | |
| — | |
| — | |
| — | |
| — | |
| — |
Commercial | | | 818 | | | — | | | — | | | 818 | | | (8,309) |
Construction and land development | | | — | | | — | | | — | | | — | | | — |
Consumer and other | |
| — | |
| — | |
| — | |
| — | |
| — |
Total | | $ | 818 | | $ | — | | $ | — | | $ | 818 | | $ | (8,309) |
| | | | | Fair Value Measurements | ||||||||||
| | | | | at December 31, 2019 Using: | ||||||||||
| | | | | | | | Significant | | | | | | | |
| | | | | Quoted Prices in | | Other | | Significant | | | | |||
| | Total at | | Active Markets for | | Observable | | Unobservable | | | | ||||
| | December 31, | | Identical Assets | | Inputs | | Inputs | | Total Gains | |||||
(Dollars in thousands) |
| 2019 |
| (Level 1) |
| (Level 2) |
| (Level 3) |
| (Losses) | |||||
Impaired Loans: |
| |
|
| |
|
| |
|
| |
| | |
|
Commercial real estate | | $ | — | | $ | — | | $ | — | | $ | — | | $ | — |
Residential real estate | |
| — | |
| — | |
| — | |
| — | |
| — |
Commercial | | | 442 | | | — | | | — | | | 442 | | | (627) |
Construction and land development | | | — | | | — | | | — | | | — | | | — |
Consumer and other | |
| — | |
| — | |
| — | |
| — | |
| — |
Total | | $ | 442 | | $ | — | | $ | — | | $ | 442 | | $ | (627) |
As shown above our impaired loans consist solely of commercial loans considered to be Level 3. These Level 3 loans have significant unobservable inputs such as appraisal adjustments for local market conditions and economic factors that may result in changes in value of an assets over time.
F-28
The table below presents the approximate carrying amount and estimated fair value of the Company’s financial instruments (in thousands):
| | December 31, 2020 | ||||||
| | Carrying | | Fair | | Fair Value | ||
|
| Amount |
| Value |
| Hierarchy | ||
Financial Assets: |
| |
|
| |
|
|
|
Cash & Due from Banks, including interest bearing deposits | | $ | 191,597 | | $ | 191,597 |
| Level 1 |
Federal Funds Sold | |
| 25,375 | |
| 25,375 |
| Level 1 |
Securities, Available for Sale | |
| 87,508 | |
| 87,508 |
| Level 2 |
Securities, Held to Maturity | |
| 1,547 | |
| 1,561 |
| Level 2 |
Securities, Equity | |
| 6,005 | |
| 6,005 |
| Level 1 |
Loans, net | |
| 1,644,643 | |
| 1,654,671 |
| Level 3 |
Bank Owned Life Insurance | |
| 37,360 | |
| 37,360 |
| Level 2 |
Accrued Interest Receivable | |
| 6,666 | |
| 6,666 |
| Level 1, 2 & 3 |
| | | | | | | | |
Financial Liabilities: | |
|
| |
|
|
|
|
Deposits | |
| 1,659,543 | |
| 1,693,331 |
| Level 2 |
Federal Home Loan Bank Advances | |
| 40,000 | |
| 37,927 |
| Level 2 |
Subordinated Debt | | | 10,153 | | | 10,153 | | Level 2 |
PPPLF Advances | | | 101,358 | | | 101,519 | | Level 2 |
Loan Participations | | | 13,215 | | | 13,215 | | Level 2 |
Accrued Interest Payable | |
| 546 | |
| 546 |
| Level 2 |
| | December 31, 2019 | ||||||
| | Carrying | | Fair | | Fair Value | ||
|
| Amount |
| Value |
| Hierarchy | ||
Financial Assets: |
| |
|
| |
|
|
|
Cash & Due from Banks, including interest bearing deposits | | $ | 171,980 | | $ | 171,980 |
| Level 1 |
Federal Funds Sold | |
| 26,970 | |
| 26,970 |
| Level 1 |
Securities, Available for Sale | |
| 28,441 | |
| 28,441 |
| Level 2 |
Securities, Held to Maturity | |
| 214 | |
| 224 |
| Level 2 |
Securities, Equity | |
| 971 | |
| 971 |
| Level 2 |
Loans, net | |
| 785,167 | |
| 796,924 |
| Level 3 |
Bank Owned Life Insurance | |
| 16,858 | |
| 16,858 |
| Level 2 |
Accrued Interest Receivable | |
| 2,498 | |
| 2,498 |
| Level 1, 2 & 3 |
| | | | | | | | |
Financial Liabilities: | |
|
| |
|
|
|
|
Deposits | |
| 892,873 | |
| 883,225 |
| Level 2 |
Federal Home Loan Bank Advances | |
| 55,000 | |
| 54,649 |
| Level 2 |
Line of Credit | | | 9,999 | | | 9,999 | | Level 1 |
Accrued Interest Payable | |
| 373 | |
| 373 |
| Level 2 |
NOTE 14 — LOAN COMMITMENTS AND OTHER RELATED ACTIVITIES
Some financial instruments, such as loan commitments, credit lines, letters of credit, and overdraft protection, are issued to meet customer financing needs. These are agreements to provide credit or to support the credit of others, as long as conditions established in the contract are met, and usually have expiration dates. Commitments may expire without being used. Off-balance-sheet risk to credit loss exists up to the face amount of these instruments, although material losses are not anticipated. The same credit policies are used to make such commitments as are used for loans, including obtaining collateral at exercise of the commitment.
F-29
The contractual amounts of financial instruments with off-balance-sheet risk at December 31, 2020 and 2019 were as follows:
|
| 2020 |
| 2019 | ||
Available lines of credit | | $ | 355,927 | | $ | 112,838 |
Unfunded loan commitments – fixed | |
| 28,414 | |
| 11,497 |
Unfunded loan commitments – variable | |
| 12,215 | |
| 11,555 |
Standby letters of credit | |
| 13,036 | |
| 8,103 |
Commercial letters of credit | |
| 1,028 | |
| 1,065 |
Total credit extension commitments | | $ | 410,620 | | $ | 145,058 |
NOTE 15 — DIVIDENDS
The Company is limited in the amount of cash dividends that it may pay. The amount of cash dividends that may be paid is based on the Company’s net income of the current year combined with the Bank’s retained income of the preceding two years, as defined by state banking regulations. However, for any dividend declaration, the Company must consider additional factors such as the amount of current period net income, liquidity, asset quality, capital adequacy and economic conditions at the Bank. It is likely that these factors would further limit the amount of dividends which the Company could declare. In addition, bank regulators have the authority to prohibit banks from paying dividends if they deem such payment to be an unsafe or unsound practice.
NOTE 16 — REGULATORY CAPITAL MATTERS
Banks and bank holding companies are subject to regulatory capital requirements administered by federal banking agencies. Capital adequacy guidelines and, additionally for banks, prompt corrective action regulations, involve quantitative measures of assets, liabilities, and certain off-balance-sheet items calculated under regulatory accounting practices. Capital amounts and classifications are also subject to qualitative judgments by regulators. Failure to meet capital requirements can initiate regulatory action. The final rules implementing Basel Committee on Banking Supervision’s capital guidelines for United States banks (Basel III rules) became effective for the Bank on January 1, 2015 with full compliance with all of the requirements being phased in over a multi-year schedule, and fully phased in by January 1, 2019. Under the Basel III rules, the Bank must hold a capital conservation buffer above the adequately capitalized risk-based capital ratios. The capital conservation buffer was phased in from 0.0% for 2015 to 2.50% by 2019. The capital conservation buffer for 2020 is 2.50% and for 2019 was 2.50%. The net unrealized gain or loss on available for sale securities is not included in computing regulatory capital. Management believes as of December 31, 2020, the Bank met all capital adequacy requirements to which it was subject.
Prompt corrective action regulations provide five classifications: well capitalized, adequately capitalized, undercapitalized, significantly undercapitalized, and critically undercapitalized, although these terms are not used to represent overall financial condition. If adequately capitalized, regulatory approval is required to accept brokered deposits. If undercapitalized, capital distributions are limited, as is asset growth and expansion, and capital restoration plans are required. At December 31, 2020 and 2019, the most recent regulatory notifications categorized the Bank as well capitalized under the regulatory framework for prompt corrective action. There are no conditions or events since that notification that management believes have changed the institution’s category. Based on changes to the Federal Reserve’s definition of a “Small Bank Holding Company” that increased the threshold to $3 billion in assets in August 2018, the Company is not currently subject to separate minimum capital measurements. At such time as the Company reaches the $3 billion asset level, it will again be subject to capital measurements independent of the Bank. For comparison purposes, the Company’s ratios are included in following discussion as well, all of which would have exceeded the “well-capitalized” level had the Company been subject to separate capital minimums.
F-30
Actual and required capital amounts and ratios are presented below at December 31, 2020 and 2019. The required amounts for capital adequacy shown below do not include the capital conservation buffer previously discussed.
|
| | | | |
| Required for |
| Well Capitalized |
| ||||||
| | | | | | | Capital Adequacy | | Prompt Corrective |
| ||||||
| | Actual | | Purposes | | Action Regulations |
| |||||||||
|
| Amount |
| Ratio |
| Amount |
| Ratio |
| Amount |
| Ratio |
| |||
2020 |
| |
|
|
|
| |
|
|
|
| |
|
|
| |
Total Capital ratio |
| |
|
|
|
| |
|
|
|
| |
|
|
| |
Bank | | $ | 176,633 |
| 12.0 | % | $ | 117,298 |
| 8.0 | % | $ | 146,623 |
| 10.0 | % |
Company | |
| 215,977 |
| 14.7 | % |
| 117,298 |
| 8.0 | % |
| N/A |
| N/A | |
Tier 1 Capital ratio | |
| |
| | |
| |
| | |
|
|
| | |
Bank | |
| 159,448 |
| 10.9 | % |
| 87,974 |
| 6.0 | % |
| 117,298 |
| 8.0 | % |
Company | |
| 188,639 |
| 12.9 | % |
| 87,974 |
| 6.0 | % |
| N/A |
| N/A | |
Tier 1 Leverage ratio | |
| |
| | |
| |
| | |
|
|
| | |
Bank | |
| 159,448 |
| 8.4 | % |
| 75,723 |
| 4.0 | % |
| 94,654 |
| 5.0 | % |
Company | |
| 188,639 |
| 10.0 | % |
| 75,723 |
| 4.0 | % |
| N/A |
| N/A | |
Common Equity Tier 1 | |
| |
| | |
| |
| | |
|
|
| | |
Bank | |
| 159,448 |
| 10.9 | % |
| 65,980 |
| 4.5 | % |
| 95,305 |
| 6.5 | % |
Company | |
| 188,639 |
| 12.9 | % |
| 65,980 |
| 4.5 | % |
| N/A |
| N/A | |
| | | | | | | | | | | | | | | | |
2019 | |
|
|
|
| |
|
|
|
| |
|
|
|
| |
Total Capital ratio | |
|
|
|
| |
|
|
|
| |
|
|
|
| |
Bank | | $ | 95,662 |
| 13.6 | % | $ | 56,091 |
| 8.0 | % | $ | 70,114 |
| 10.0 | % |
Company | |
| 86,531 |
| 12.3 | % |
| 56,091 |
| 8.0 | % |
| N/A |
| N/A | |
Tier 1 Capital ratio | |
|
|
|
| |
|
|
|
| |
|
|
|
| |
Bank | |
| 88,506 |
| 12.6 | % |
| 42,069 |
| 6.0 | % |
| 56,091 |
| 8.0 | % |
Company | |
| 79,375 |
| 11.3 | % |
| 42,069 |
| 6.0 | % |
| N/A |
| N/A | |
Tier 1 Leverage ratio | |
|
|
| | |
|
|
|
| |
|
|
|
| |
Bank | |
| 88,506 |
| 8.7 | % |
| 40,889 |
| 4.0 | % |
| 51,112 |
| 5.0 | % |
Company | |
| 79,375 |
| 7.8 | % |
| 40,889 |
| 4.0 | % |
| N/A |
| N/A | |
Common Equity Tier 1 | |
|
|
|
| |
|
|
|
| |
|
|
|
| |
Bank | |
| 88,506 |
| 12.6 | % |
| 31,551 |
| 4.5 | % |
| 45,574 |
| 6.5 | % |
Company | |
| 79,375 |
| 11.3 | % |
| 31,551 |
| 4.5 | % |
| N/A |
| N/A | |
NOTE 17 — LEGAL CONTINGENCIES
The Company is subject to legal proceedings and claims, which arise in the ordinary course of business. In the opinion of management, the amount of ultimate liability with respect to these actions will not materially affect the financial position or results of operations of the Company.
NOTE 18 — STOCK BASED COMPENSATION
Stock Option Plan
The Company’s 2009 Employee Share Option Plan (the Plan, as amended in April 2012), permits the grant of share options to certain key employees and directors for up to 265,000 shares of common stock. Option awards are generally granted with an exercise price equal to the market price of the Company common stock at the date of grant; those option awards have vesting periods up to three years and have a ten-year contractual term. Currently, the Company has a sufficient number of shares to satisfy expected share option exercises.
The fair value of each option award is estimated on the date of grant using a closed form option valuation (Black-Scholes) model that uses the assumptions noted in the table below. The expected volatility is the five year volatility of the Company stocks in the NASDAQ OMX ABA Community Bank Index. The computation of expected life is
F-31
calculated based on the simplified method. The risk free interest rate for all periods is based upon a zero coupon United States Treasury bond with a similar life as the option at the time of grant.
There were no stock options granted during the year ended December 31, 2020. The per share weighted-average grant-date fair value of options granted was $6.65 during the year ended December 31, 2019 using the Black-Scholes option-pricing model with the following weighted-average assumptions:
|
| 2020 |
| 2019 |
|
Expected volatility |
| — | % | 29.24 | % |
Risk-free interest rate |
| — | % | 2.53 | % |
Expected life |
| — |
| 7 years | |
Expected dividends |
| — |
| — | |
A summary of stock options were as follows:
|
| |
| | |
| Weighted- |
| | |
| | | | Weighted- | | Average | | | | |
| | | | Average | | Remaining | | Aggregate | ||
| | Stock | | Exercise | | Contractual | | Intrinsic | ||
| | Options | | Price | | Term | | Value | ||
| | | | | | | | | | |
Balance at January 1, 2020 |
| 152,100 | | $ | 13.03 | | | | | |
Granted | | — | | | — | | | | | |
MBI Acquisition |
| 998,769 | |
| 10.17 | | | | | |
Exercised |
| (152,328) | |
| 8.77 | | | | | |
Expired |
| (1,045) | |
| 8.31 | | | | | |
Forfeited |
| (9,153) | |
| 7.05 |
| | | | |
Balance at December 31, 2020 |
| 988,343 | |
| 10.84 |
| 5.02 | | $ | 4,587 |
Exercisable at December 31, 2020 |
| 965,561 | | $ | 10.79 |
| 4.98 | | $ | 4,525 |
At December 31, 2020 and 2019, there was $49 thousand and $60 thousand of total unrecognized compensation expense related to nonvested share-based compensation arrangements granted under the Plan, respectively. The cost is expected to be recognized over a weighted-average period of two years. The total fair value of shares vesting and recognized as compensation expense was approximately $243 thousand and $59 thousand for the years ended December 31, 2020 and 2019, respectively. Additionally, during the year ended December 31, 2020 there were 7,819 shares of Class A common stock issued for cashless option exercises at a weighted-average exercise price of $6.64 and during the year ended December 31, 2019 there were 683 shares of Class A common stock issued for cashless option exercises at a weighted-average exercise price of $12.50.
During 2014, the Plan was modified with the Corporate reorganization described in Note 1 whereby the Company assumed the same provisions of the Plan established at the Bank in previous years. The options exchanged were equal in fair value and in terms to the original options received. No additional compensation expense was recognized as a result of the modification.
Employee Stock Purchase Plan
The Company’s 2014 Associate Stock Purchase Plan allows employees to purchase stock at a discounted price of fair market-value. The maximum amount of shares available under the plan is 2,000,000. The discount is 5% of fair market value with the difference recorded as compensation expense. The maximum an employee can participate is $25 thousand per calendar year. The December 31, 2020 fair value of the stock was determined based on the market price of the common stock ($15.43 per share).
F-32
Stock Appreciation Rights
The Company’s 2012 Stock Appreciation Rights Plan (SARs, as amended in 2014) is a grant awarded to selected employees and directors in recognition of their current and future contributions to the Company. A SAR unit provides the employee or director a “right” to the future appreciation of value in a share of common stock of the Company. The SAR unit is awarded at the then fair market value of the stock share as of the date of the grant (base price). As the stock appreciates in value, the difference between the base price and the fair market value is the potential benefit to the employee after it vests. Unlike a stock option, the employee is not required to pay any amount to exercise the SAR as the net amount of the increase in the stock value is paid (either in cash or stock) at the payment date after vesting occurs.
The SAR unit becomes vested at the earlier of: (i) five years of continuous service with the Company from the date of the grant; (ii) upon a liquidity event of the Company; and (iii) death or disability. Units granted under the SAR agreements have a base price ranging from $11.50 to $18.25 per common stock as of December 31, 2020. Total available units under the SAR program amount to 1.2 million as of December 31, 2020.
There were no SARs granted in 2020 and a total of 10,000 granted in 2019. There were no SARs exercised or forfeited for the year ended December 31, 2020. There were no SARs exercised or forfeited for the year ended December 31, 2019. As of December 31, 2020, the company determined that a payout to employees under the SAR plan is unlikely and therefore no accrual has been made. Total SARs outstanding as of December 31, 2020 were 954,500.
Restricted Stock
An award of restricted stock involves the immediate transfer by the Company to the participant of a specific number of shares of our Class A Common Stock, which are subject to a risk of forfeiture and a restriction on transferability. This restriction will lapse following a stated period of time. The participant does not pay for the restricted stock and has all of the rights of a holder of a share of our Class A Common Stock (except for the restriction on transferability), including the right to vote and receive dividends unless otherwise determined by the Compensation Committee and set forth in the award agreement.
The Company has limited the aggregate number of shares of our Class A Common Stock to be awarded under the 2019 Equity Incentive Plan as restricted stock to 300,000 shares. The Company has 97,398 shares of restricted stock outstanding, at a weighted average exercise price of $18.32 to employees under the 2019 Equity Incentive Plan as of December 31, 2020, for which the Company did not receive, nor will it receive, any monetary consideration. Therefore there were 202,602 resticted shares available to be issued at December 31, 2020. As of December 31, 2020 there was approximately $1.7 million in unrecognized compensation expense in regards to restricted stock that will be recognized over a three year period.
NOTE 19 — LEASES
ASC 842 establishes a right-of-use (“ROU”) model that requires a lessee to recognize a ROU asset and lease liability on the balance sheet for all leases with a term longer than 12 months. Leases are classified as finance or operating, with classification affecting the pattern and classification of expense recognition in the income statement. The Company’s ROU assets are classified under premises and equipment on the Balance Sheet. The ROU liabilities are under other liabilities. The Company recorded $2.0 million and $6.0 million during the year ended December 31, 2020 and 2019, respectively. The total amount of ROU was $6.5 million and $6.4 million at December 31, 2020 and 2019, respectively.
The Company leases certain properties and equipment under operating leases that resulted in the recognition of ROU Lease Assets of $5,673 and Lease Liabilities of $6,025 on the Company’s Condensed Consolidated Balance Sheets as of January 1, 2019.
ASC 842 was effective on January 1, 2019. A modified retrospective transition approach is required, applying the new standard to all leases existing at the date of initial application. The Company chose to use the adoption date of January 1, 2019 for ASC 842. As such, all periods presented after January 1, 2019 are under ASC 842 whereas periods
F-33
presented prior to January 1, 2019 are in accordance with prior lease accounting of ASC 840. Financial information was not updated and the disclosures required under ASC 842 was not provided for dates and periods before January 1, 2019.
ASC 842 provides a number of optional practical expedients in transition. The Company has elected the package of practical expedients, which permits the Company not to reassess under the new standard the prior conclusions about lease identification, lease classification and initial direct costs. The Company also elected the use of the hindsight, a practical expedient which permits the use of information available after lease inception to determine the lease term via the knowledge of renewal options exercised not available as of the leases inception. The practical expedient pertaining to land easements is not applicable to the Company.
ASC 842 also requires certain accounting elections for ongoing application of ASC 842. The Company elected the short-term lease recognition exemption for all leases that qualify, meaning those with terms under twelve months. ROU assets or lease liabilities are not to be recognized for short-term leases. The Company also elected the practical expedient to not separate lease and non-lease components for all leases, the majority of which consist of real estate common area maintenance expenses. However, since these non-lease items are subject to change, they are treated and disclosed as variable payments in the quantitative disclosures below. Consequently, ASC 842’s changed guidance on contract components will not significantly affect our financial reporting. Similarly, ASC 842’s narrowed definition of initial direct costs will not significantly affect financial reporting.
Lessee Leases
The majority of the Company’s lessee leases are operating leases and consist of leased real estate for branches and operations centers. Options to extend and renew leases are generally exercised under normal circumstances. Advance notification is required prior to termination, and any noticing period is often limited to the months prior to renewal. Variable payments generally consist of common area maintenance and taxes. Rent escalations are generally specified by a payment schedule or are subject to a defined formula. The Company also elected the practical expedient to not separate lease and non-lease components for all leases, the majority of which consist of real estate common area maintenance expenses. Generally, leases do not include guaranteed residual values, but instead typically specify that the leased premises are to be returned in satisfactory condition with the Company liable for damages.
For operating leases, the lease liability and ROU asset (before adjustments) are recorded at the present value of future lease payments. ASC 842 requires the use of the lease interest rate; however, this rate is typically not known. As an alternative, ASC 842 permits the use of an entity’s fully secured incremental borrowing rate. The Company is electing to utilize the FHLB Atlanta Fixed Rate Advance index, as it is the most actively used institution-specific collateralized borrowing source available to the Company.
Lease cost for the year ended December 31, 2020 and 2019 consists of:
| | Year Ended | | Year Ended | ||
|
| December 31, 2020 |
| December 31, 2019 | ||
Operating Lease and Interest Cost | | $ | 1,816 | | $ | 1,007 |
Variable Lease Cost | |
| 490 | |
| 379 |
Total Lease Cost | | $ | 2,306 | | $ | 1,386 |
F-34
The following table provides supplemental information related to leases for the year ended December 31, 2020 and 2019:
| | Year Ended | | Year Ended | | ||
|
| December 31, 2020 |
| December 31, 2019 | | ||
Operating Lease - Operating Cash Flows (Fixed Payments) | | $ | 1,816 | | $ | 1,007 | |
Operating Lease - Operating Cash Flows (Liability Reduction) | | $ | 1,900 | | $ | 699 | |
New ROU Assets - Operating Leases | | $ | 2,027 | | $ | — | |
Weighted Average Lease Term (Years) - Operating Leases | | | 5.60 | | | 6.91 | |
Weighted Average Discount Rate - Operating Leases | | | 3.11 | % | | 3.27 | % |
A maturity analysis of operating lease liabilities and reconciliation of the undiscounted cash flows to the total operating lease liabilities as of December 31, 2020 is as follows:
|
| December 31, 2020 | |
Operating lease payments due: |
| |
|
Within one year | | $ | 1,515 |
After one but within two years | |
| 1,325 |
After two but within three years | | | 1,364 |
After three but within four years | | | 1,136 |
After four years but within five years | | | 1,075 |
After five years | | | 1,137 |
Total undiscounted cash flows | | | 7,552 |
Discount on cash flows | | | (1,051) |
Total operating lease liabilities | | $ | 6,501 |
Lessor Leases
ASC 842 also impacted lessor accounting. Currently the Company does not have any lessor leases (formerly known as capital leases) to report on its financials.
Lease Termination
On June 19, 2020, the Company exercised an option to early terminate a lease for a former operational office of Marquis Bank and a branch located in Coral Gables (the “Closed Offices”). The Closed Offices were located less than one mile from the Bank’s already established Coral Gables location. The cost to exercise the option on the Closed Offices was $322.8 thousand and decreased the life of the lease by approximately 15 months. As a result of exercising the option, the lease will terminate in March 2021 as opposed to June 2022. This option resulted in savings of over $400 thousand in lease payments plus expenses. The cost of the option is being amortized through the end of the lease in March 2021.
F-35
NOTE 20 — PROFESSIONAL HOLDING CORP. (PARENT COMPANY ONLY) CONDENSED FINANCIAL INFORMATION
Balance Sheets
(In thousands) |
| 2020 |
| 2019 | ||
Assets | | | | | | |
Cash | | $ | 38,547 | | $ | 305 |
Investment in subsidiaries | |
| 186,373 | |
| 88,431 |
Other assets | |
| 50 | |
| 676 |
| | $ | 224,970 | | $ | 89,412 |
Liabilities and Shareholders’ Equity | | | | | | |
Line of credit | | | — | | | 9,999 |
Subordinated debt | | | 10,153 | | | — |
Other liabilities | |
| (748) | |
| 111 |
Shareholders’ equity | |
| 215,565 | |
| 79,302 |
| | $ | 224,970 | | $ | 89,412 |
Statements of Income
(In thousands) |
| 2020 |
| 2019 | ||
Income | | $ | — | | $ | — |
Interest expenses | |
| 458 | |
| 7 |
Non-interest expenses | |
| 3,347 | |
| 1,094 |
Income (loss) before income taxes and equity in undistributed income of subsidiaries | | $ | (3,805) | | $ | (1,101) |
Income tax provision (benefit) | |
| (787) | |
| — |
Income (loss) before equity in undistributed income of subsidiaries | |
| (3,018) | |
| (1,101) |
Equity in undistributed income of subsidiaries | |
| 11,323 | |
| 3,437 |
Net Income | | $ | 8,305 | |
| 2,336 |
F-36
Statement of Cash Flows
(In thousands) |
| 2020 |
| 2019 | ||
Cash flows from operating activities | | | | | | |
Adjustments to reconcile net income to net cash from operating activities: |
| |
|
| |
|
Net income (loss) | | $ | 8,305 | | $ | 2,336 |
Equity in undistributed income of subsidiaries | |
| (11,323) | |
| (3,437) |
Depreciation and amortization | | | 133 | | | — |
Net (increase) decrease in other assets | |
| 626 | |
| (676) |
Net increase (decrease) in other liabilities | |
| 9,294 | |
| (93) |
Net cash used in operating activities | |
| 7,035 | |
| (1,870) |
| | | | | | |
Cash flows from investing activities | |
|
| |
|
|
Investment in subsidiaries | |
| (112,657) | |
| (22,555) |
Proceeds from acquisition | | | 26,860 | | | — |
Net cash used in investing activities | |
| (85,797) | |
| (22,555) |
| |
|
| |
|
|
Cash flows from financing activities | | | | | | |
Issuance of common stock, net of related expense | |
| 60,967 | |
| 673 |
Stock based employment benefit plans | |
| 1,065 | |
| 195 |
MBI acquisition | | | 70,035 | | | — |
Proceeds from line of credit | | | — | | | 9,999 |
Repayment of line of credit | | | (9,999) | | | — |
Purchase of treasury stock | | | (5,064) | | | (3,935) |
Net cash provided by financing activities | |
| 117,004 | |
| 6,932 |
| | | | | | |
Increase in cash and cash equivalents | |
| 38,242 | |
| (17,493) |
Cash and cash equivalents at beginning of year | |
| 305 | |
| 17,798 |
Cash and cash equivalents at end of year | | $ | 38,547 | | $ | 305 |
Supplemental cash flow information: | |
|
| |
|
|
Cash paid during the year for taxes | | $ | 3,018 | | $ | 1,017 |
NOTE 21 — BUSINESS COMBINATION
Acquisition of Marquis Bancorp, Inc.
On March 26, 2020, the Company closed its acquisition of Marquis Bancorp. (MBI) and its wholly owned subsidiary, Marquis Bank, headquartered in Coral Gables, Florida. Each share of MBI common stock issued and outstanding immediately prior to closing was converted into 1.2048 shares of the Company’s Class A common stock, with cash paid in lieu of fractional shares. The Company issued 4,227,816 shares of its Class A Common Stock as consideration in the acquisition. No MBI shareholders exercised appraisal rights. In addition, all stock options of MBI granted and outstanding on the closing date of the acquisition were converted into an option to purchase shares of the Company’s Class A Common Stock based on the exchange ratio.
MBI results of operations were included in the Company’s results beginning March 27, 2020. Acquisition-related costs of $3.3 million are included in non-interest expense in the Company’s income statement for the year ended December 31, 2020. The fair value of the Class A common shares issued as part of the consideration paid for MBI was determined on the basis of the closing price of the Company’s common shares on the acquisition date. The fair value of options included a measurement period adjustment to incorporate the fair value of options using the Black Scholes method.
The acquisition of MBI was accounted for under the acquisition method in accordance with ASC Topic 805, Business Combinations. Goodwill of $24.6 million arising from the acquisition consisted of operational efficiencies and
F-37
potential cost savings through consolidating and integrating MBI’s operations into the Company’s existing operations. The fair values initially assigned to assets acquired and liabilities assumed are preliminary and could change for up to one year after the closing date of the acquisition of MBI as new information and circumstances relative to closing date fair values become known. Fair value estimates are deemed preliminary due to pending evaluations of reports from the Company’s third-party valuation specialists, appraisals and other financial information. The Company continues to evaluate and adjust as necessary, the fair values assigned to assets acquired and liabilities assumed through the acquisition of MBI. Determining the fair values of assets and liabilities, especially the loan portfolio, core deposit intangibles, goodwill and time deposits is a complicated process involving significant judgment regarding methods and assumptions used to calculate the estimated fair values. The following tables summarize the consideration paid for MBI and the estimated fair values of the assets acquired, and liabilities assumed at the date of the MBI acquisition, net of total consideration paid:
| | Estimated | | Measurement | | Adjusted | |||
| | Fair Value at | | Period | | Estimated | |||
(In thousands, except per share data) |
| March 26, 2020 |
| Adjustments |
| Fair Value | |||
Number of MBI common shares outstanding |
| | 3,509,143 | | | - | | | 3,509,143 |
Per share exchange ratio | | | 1.2048 | | | - | | | 1.2048 |
Number of shares of common stock issued | | | 4,227,816 | | | - | | | 4,227,816 |
Multiplied by common stock price per share on March 26, 2020 | | $ | 15.21 | | $ | - | | $ | 15.21 |
Value of common stock issued | | | 64,305 | | | - | | | 64,305 |
Cash paid in lieu of fractional shares | | | 1 | | | - | | | 1 |
Fair value of MBI stock options converted to PFHD options | | | 393 | | | 5,336 | | | 5,729 |
Fair value of total consideration transferred | | $ | 64,699 | | $ | 5,336 | | $ | 70,035 |
| | | | | | | | | |
Recognized amounts of identifiable assets acquired and liabilities assumed | | | | | | | | | |
Cash and cash equivalents | | $ | 26,860 | | $ | - | | $ | 26,860 |
Securities, available for sale | | | 26,811 | | | 218 | | | 27,029 |
Securities, held to maturity | | | 1,458 | | | 8 | | | 1,466 |
Loans | | | 520,606 | | | (5,302) | | | 515,304 |
Premises and equipment | | | 824 | | | - | | | 824 |
Accrued interest receivable | | | 1,525 | | | - | | | 1,525 |
Core deposit intangibles | | | 3,964 | | | (2,318) | | | 1,646 |
Other assets | | | 7,157 | | | 1,986 | | | 9,143 |
Total assets acquired | | | 589,205 | | | (5,408) | | | 583,797 |
| | | | | | | | | |
Deposits | | | 497,166 | | | 944 | | | 498,110 |
Federal Home Loan Bank advances | | | 25,103 | | | - | | | 25,103 |
Subordinated notes payable | | | 9,920 | | | 365 | | | 10,285 |
Accrued interest payable | | | 610 | | | - | | | 610 |
Other liabilities | | | 6,604 | | | (2,329) | | | 4,275 |
Total liabilities assumed | | | 539,403 | | | (1,020) | | | 538,383 |
| | | | | | | | | |
Total identifiable net assets | | | 49,802 | | | (4,388) | | | 45,414 |
| | | | | | | | | |
Goodwill | | $ | 14,897 | | $ | 9,724 | | $ | 24,621 |
Acquired loans are initially recorded at their acquisition-date fair values using Level 3 inputs. Refer to Note 13, Fair Value, for a discussion of the fair value hierarchy. Fair values are based on a discounted cash flow methodology that involves assumptions and judgments as to credit risk, expected lifetime losses, environmental factors, discount rates, expected payments and expected prepayments. Specifically, the Company has prepared three separate loan fair value adjustments that it believes a market participant might employ in estimating the entire fair value adjustment necessary under ASC 820-10 for the acquired loan portfolio. The three separate fair valuation methodologies employed are: (i) an
F-38
interest rate loan fair value adjustment, (ii) a general credit fair value adjustment, and (iii) a specific credit fair value adjustment for purchased credit impaired (“PCI”) loans subject to ASC 310-30 provisions. The acquired loans were recorded at fair value at the acquisition date without carryover of MBI’s previously established allowance for loan losses. The fair value of the financial assets acquired included loans receivable with a book balance, prior to fair value adjustments, of $539.9 million.
The credit fair value adjustment on PCI loans represents the portion of the loan balances that have been deemed uncollectible based on the Company’s expectations of future cash flows for each respective loan. The fair value of purchased financial assets with credit deterioration was $4.6 million on the date of acquisition. The gross contractual amounts receivable relating to the purchased financial assets with credit deterioration was $8.8 million. The Company estimates, on the date of acquisition, that $3.6 million of the contractual cash flows specific to the purchased financial assets with credit deterioration will not be collected.
For loans acquired without evidence of credit deterioration, the Company prepared interest rate loan fair value and credit fair value adjustments. Loans were grouped into homogeneous pools by characteristics such as loan type, term, collateral and rate. Market rates for similar loans were obtained from various internal and external data sources and reviewed for reasonableness. Fair value adjustments related to loans acquired without evidence of credit deterioration will be recognized as interest income over the expected life of the loans.
For PCI loans, acquired with evidence of credit deterioration, the Company prepared a specific credit risk fair value adjustment in accordance with ASC 310-30. The fair value adjustment of $3.5 million represents the present value of expected cash flows at market participant discount rates in accordance with ASC 310-30. The accretable discount will be recognized on a level yield basis.
The fair value of the core deposit intangible was determined based on a discounted cash flow method using a discount rate commensurate with market participants. To calculate cash flows, the sum of deposit account servicing costs (net of deposit fee income) and interest expense on deposits was compared to the cost of alternative funding sources available to the Company. The expected cash flows of the deposit base included estimated attrition rates. The core deposit intangible asset was valued at $1.6 million and will be amortized over ten years using the sum-of-the years digit method.
The fair value adjustment for time deposits represents a discount from the value of the contractual repayments of fixed-maturity deposits using prevailing market interest rates for similar-term time deposits. The time deposit was valued at $2.8 million and is being amortized into income on a level yield amortization method over the contractual life of the deposits.
The fair value adjustment of FHLB advances was determined based upon an estimated fair value received from the FHLB Atlanta. The FHLB advances was valued at $0.1 million and will be amortized into the remaining life of the advances.
The fair value of subordinated debt was determined by using a discounted cash flow method using a market participant discount rate for similar instruments. The subordinated debt was fair valued at a premium of $0.5 million and will be amortized over the expected life of the debt.
In connection with the acquisition of MBI, the Company recorded a net deferred income tax asset of $5.4 million related to MBI’s effects of fair value adjustments resulting from applying the purchase method of accounting.
F-39
The following table presents supplemental pro-forma information as if the acquisition had occurred at the beginning of 2019. The pro-forma financial information is not necessarily indicative of the results of operations that would have occurred had the transactions been effected on January 1, 2019.
| | Year ended | |
(In thousands, except per share data) |
| December 31, 2019 | |
Net interest income | | $ | 56,895 |
Net income | | $ | 14,389 |
EPS - basic | | $ | 2.46 |
EPS - diluted | | $ | 2.44 |
NOTE 22 — SUBSEQUENT EVENTS
Common Stock
During the period January 1, 2021 through March 19, 2021, the Company issued 181,963 shares of Class A common stock and repurchased 54,479 shares of Class A common stock. Furthermore, there were 3,210 shares of Class A common stock elected to be withheld for taxes on the vesting of a portion of restricted stock.
F-40
Item 9. Changes in and Disagreements with Accountants on Accounting and Financial Disclosures
None.
Item 9A. Controls and Procedures
Disclosure controls are procedures that are designed with the objective of ensuring that information required to be disclosed in our reports filed under the Exchange Act, such as this Report, is recorded, processed, summarized, and reported within the time period specified in the SEC’s rules and forms. Disclosure controls are also designed with the objective of ensuring that such information is accumulated and communicated to our management, including the principal executive officer and principal financial and accounting officer, as appropriate to allow timely decisions regarding required disclosure.
We do not expect that our disclosure controls and procedures will prevent all errors and instances of fraud. Disclosure controls and procedures, no matter how well conceived and operated, can provide only reasonable, not absolute, assurance that the objectives of the disclosure controls and procedures are met. Further, the design of disclosure controls and procedures must reflect the fact that there are resource constraints, and the benefits must be considered relative to the costs. Because of the inherent limitations in all disclosure controls and procedures, no evaluation of disclosure controls and procedures can provide absolute assurance that we have detected all our control deficiencies and instances of fraud, if any. The design of disclosure controls and procedures also is based partly on certain assumptions about the likelihood of future events, and there can be no assurance that any design will succeed in achieving it stated goals under all potential future considerations.
(a)Evaluation of Controls and Procedures
Our management evaluated, with the participation of our principal executive officer and principal accounting officer (the “Certifying Officers”), the effectiveness of our disclosure controls and procedures as of December 31, 2020, pursuant to Rule 13a-15(b) under the Exchange Act. Based on that evaluation, our Certifying Officers concluded that, as of December 31, 2020, that the Company’s disclosure controls and procedures were not effective because of the material weakness described below.
(b)Changes in Internal Control Over Financial Reporting
Other than the remediation efforts with respect to the material weakness as described below, we did not make any changes in our internal control over financial reporting (as defined in Rules 13a-15(e) and 15d-15(f) under the Exchange Act) during the year ended December 31, 2020, that have materially affected or are reasonably likely to materially affect our internal control over financial reporting.
Internal control over financial reporting refers to the process designed by, or under the supervision of, our Certifying Officers, and effected by our board of directors, management, and other personnel, to provide reasonable assurance regarding the reliability of financial reporting and the preparation of financial statements for external purposes in accordance with generally accepted accounting principles, and includes those policies and procedures that:
| (1) | Pertain to the maintenance of records that in reasonable detail accurately and fairly reflect the transactions and dispositions of the assets of the Company; |
| (2) | Provide reasonable assurance that transactions are recorded as necessary to permit preparation of financial statements in accordance with generally accepted accounting principles, and that receipts and expenditures of the Company are being made only in accordance with authorizations of managements and directors of the Company; and |
70
| (3) | Provide reasonable assurance regarding prevention or timely detection of unauthorized acquisition, use or disposition of the Company’s assets that could have a material effect on the financial statements. |
Internal control over financial reporting cannot provide absolute assurance of achieving financial reporting objectives because of its inherent limitations. Internal control over financial reporting is a process that involves human diligence and compliance and is subject to lapses in judgment and breakdowns resulting from human failures. Internal control over financial reporting also can be circumvented by collusion or improper management override. Because of such limitations, there is a risk that material misstatements may not be prevented or detected on a timely basis by internal control over financial reporting. However, these inherent limitations are known features of the financial reporting process. Therefore, it is possible to design into the process safeguards to reduce, though not eliminate, this risk.
Management is responsible for establishing and maintaining adequate internal control over financial reporting for the Company. Management has used the framework set forth in the 2013 report entitled “Internal Control—Integrated Framework” published by the Committee of Sponsoring Organizations (“COSO”) of the Treadway Commission to evaluate the effectiveness of the Company’s internal control over financial reporting. Management has concluded that the Company’s internal control over financial reporting was not effective as of the end of the most recent fiscal year, due to a material weakness surrounding controls addressing infrequent significant transactions.
In connection with its internal control testing procedures, management observed deficiencies associated with controls that address infrequent significant transactions in the Company’s control environment, that in the aggregate, result in a material weakness. None of the identified control deficiencies resulted in material misstatements related to the Company’s interim or annual financial statements as the identified errors were determined to be immaterial.
Management review controls that address the proper and timely recording of certain infrequent significant transactions were not designed or did not operate with an appropriate level of precision as follows:
•Accounting for Participation Loan Sales
During the quarter ended September 30, 2020, management identified certain participations that were recorded as sales that did not qualify for sales accounting treatment under ASC 860. The control that surrounded new loan originations and the due diligence control over acquired loans was not designed effectively as it did not incorporate an evaluation for the proper accounting treatment under ASC 860. Management has implemented controls designed to ensure all participations (newly originated or purchased by way of acquisitions) are reviewed for ASC 860 compliance.
•Recording of Inter-company Capital Transactions
For the quarter ended March 31, 2020, our control did not operate effectively to identify an inter-company capital transaction that should have been eliminated. Management has implemented controls and procedures to ensure that any inter-company balances from accounts are properly eliminated upon consolidation of the Bank with the Holding Company for financial reporting purposes.
•Business Combination Accounting
Pursuant to the MBI acquisition, Management made estimates regarding the fair value of the assets acquired and liabilities assumed. These fair values were preliminarily recorded and disclosed as such in the Company’s Form 10-Qs for March 31, June 30, and September 30, 2020. During the fourth quarter ended December 31, 2020, an adjustment was made to the fair value estimate for consideration paid related to converted stock options. The valuation of MBI was complicated by the onset of the COVID-19 pandemic and closing the MBI acquisition close to the quarter end closing. While the measurement period allows up to one year for new information and circumstances related to closing date fair values for assets and liabilities, management’s control was not designed to identify that the fair value of converted stock options was reasonably determinable in a more timely manner. To address this situation the Company has engaged
71
additional experienced consultants to assist in such valuations in the future and is in the process of working with these consultants to develop controls to assure that such valuations are timely recorded and adjusted.
As a result of the items above, it is noted that management review controls that address the proper and timely recording of certain infrequent significant transactions were not designed or did not operate with a sufficient level of precision. Based on our evaluation of the identified errors resulting from the material weakness in internal controls, management determined there were no material misstatements in the Company’s interim or annual financial statements resulting from the material weakness observed with respect to accounting for participation loan sales, recording of inter-company capital transactions, and/or business combination accounting.
Management reviewed the items described above with the Audit Committee of the Company’s Board of Directors. Management, with the oversight of the Audit Committee, is developing and implementing the controls and procedures described above starting in the fourth quarter of 2020 and will continue to take steps necessary that management and the Audit Committee believe will remediate the control deficiencies. However, the identified control deficiencies that led to the material weaknesses in internal control over financial reporting will not be considered fully addressed until the new and additional controls, processes, and procedures described above have been in operation for a sufficient period to allow the Company’s management to conclude, through testing, that the controls are operating effectively, and the material weaknesses have been fully remediated.
Not applicable.
Item 10. Directors, Executive Officers and Corporate Governance
The informations required by Item 10 is incorporated by reference to the information that appears under the headings Board Meetings and Committees in our Proxy Statement for the 2021 Annual Meeting of Shareholders.
Item 11. Executive Compensation
The informations required by Item 11 is incorporated by reference to the information that appears under the headings Executive Compensation in our Proxy Statement for the 2021 Annual Meeting of Shareholders.
Item 12. Security Ownership of Certain Beneficial Owners and Management and Related Stockholder Matters
The informations required by Item 12 is incorporated by reference to the information that appears under the headings Beneficial Owners in our Proxy Statement for the 2021 Annual Meeting of Shareholders.
Item 13. Certain Relationships and Related Transactions, and Director Independence
The informations required by Item 13 is incorporated by reference to the information that appears under the headings Certain Relationships and Related Transactions, and Director Independence in our Proxy Statement for the 2021 Annual Meeting of Shareholders.
Item 14. Principal Accountant Fees and Services
The informations required by Item 14 is incorporated by reference to the information that appears under the headings Ratification of Auditors in our Proxy Statement for the 2021 Annual Meeting of Shareholders.
72
Item 15. Exhibits, Financial Statement Schedules
The following documents are filed as part of this report:
| (1) | Financial Statements: |
| i) | Report of Independent Registered Public Accounting Firm |
| ii) | Consolidated Statement of Income for the years ended December 31, 2020 and 2019 |
| iii) | Consolidated Balance Sheet at December 31, 2020 and 2019 |
| iv) | Consolidated Statement of Changes in Shareholder Equity for the years ended December 31, 2020 and 2019 |
| v) | Consolidated Statement of Cash Flows for the years ended December 31, 2020 and 2019 |
| vi) | Notes to Consolidated Financial Statements |
| (2) | Schedules: None. |
| (3) | Index to Exhibits |
EXHIBIT INDEX
Exhibit No. |
| Description of Exhibit |
|---|---|---|
2.1 | | |
3.1 | | |
3.2 | | |
3.3 | | |
4.1** | | |
10.1 | | |
10.2 | | |
10.3 | | |
10.4 | | |
10.5 | | |
10.6 | |
73
Exhibit No. |
| Description of Exhibit |
|---|---|---|
10.7 | | |
10.8 | | |
10.9 | | |
10.10 | | |
10.11 | | |
10.12 | | |
10.13 | | |
10.14 | | |
10.15 | | |
10.16 | | |
10.17 | | |
10.18 | | |
10.19 | | |
10.20 | | |
10.21 | | |
10.22 | | |
10.23 | | |
10.24 | | |
10.25 | | |
10.26 | |
74
Exhibit No. |
| Description of Exhibit |
|---|---|---|
10.27 | | |
21.1 | | |
31.1** | | Certification of the CEO pursuant to Sec. 301 of the Sarbanes Oxley Act of 2002. |
31.2** | | Certification of the CAO pursuant to Sec. 301 of the Sarbanes Oxley Act of 2002. |
32.1** | | |
32.2** | | |
101 | | XBRL Instance Document |
101 | | XBRL Taxonomy Extension Schema Document |
101 | | XBRL Taxonomy Extension Calculation Linkbase Document |
101 | | XBRL Taxonomy Definition Linkbase Document |
101 | | XBRL Taxonomy Extension Labels Linkbase Document |
101 | | XBRL Taxonomy Extension Presentation Linkbase Document |
** Filed as exhibits with this Report on Form 10-K.
Not applicable.
75
SIGNATURES
Pursuant to the requirements of the Securities Exchange Act of 1943, the registrant has duly caused this Report to be signed on its behalf by the undersigned, thereunto duly authorized on March 26, 2021.
| PROFESSIONAL HOLDING CORP. | |
| | |
By: | /s/Daniel R.Sheehan | |
| | Daniel R. Sheehan |
| | Chairman and Chief Executive Officer |
Pursuant to the requirements of the Securities Exchange Act of 1943, this Report has been signed by the following persons in the capacities set forth opposite their names and on the dates indicated.
Signature |
| Title |
| Date |
| | | | |
/s/ Daniel R. Sheehan | | Chairman and Chief Executive Officer | | March 26, 2021 |
Daniel R. Sheehan | | (Principal Executive Officer) | | |
| | | | |
/s/ Mary Usategui | | Chief Accounting Officer | | March 26, 2021 |
Mary Usategui | | (Principal Financial Officer and Principal Accounting Officer) | | |
| | | | |
/s/ Margaret Blakey | | Director | | March 26, 2021 |
Margaret Blakey | | | | |
| | | | |
/s/ Rolando DiGasbarro | | Director | | March 26, 2021 |
Rolando DiGasbarro | | | | |
| | | | |
/s/ Norman Edelcup | | Director | | March 26, 2021 |
Norman Edelcup | | | | |
| | | | |
/s/ Carlos M.Garcia | | Director | | March 26, 2021 |
Carlos M. Garcia | | | | |
| | | | |
/s/ Jon L. Gorney | | Director | | March 26, 2021 |
Jon L. Gorney | | | | |
| | | | |
/s/ Abel L. Iglesias | | Director | | March 26, 2021 |
Abel L. Iglesias | | | | |
| | | | |
/s/ Herbert Martens, Jr | | Director | | March 26, 2021 |
Herbert Martens, Jr. | | | | |
| | | | |
/s/ Ava L. Parker | | Director | | March 26, 2021 |
Ava L. Parker | | | | |
| | | | |
/s/ Lawrence Schimmel | | Director | | March 26, 2021 |
Dr. Lawrence Schimmel, M.D. | | | | |
| | | | |
/s/ Anton V. Schutz | | Director | | March 26, 2021 |
Anton V. Schutz | | | | |
76