Attached files
| file | filename |
|---|---|
| EX-32.2 - EX-32.2 - Professional Holding Corp. | pfhd-20200630ex322077151.htm |
| EX-32.1 - EX-32.1 - Professional Holding Corp. | pfhd-20200630ex32140384f.htm |
| EX-31.2 - EX-31.2 - Professional Holding Corp. | pfhd-20200630ex3126eeb51.htm |
| EX-31.1 - EX-31.1 - Professional Holding Corp. | pfhd-20200630ex311474c5f.htm |
UNITED STATES
SECURITIES AND EXCHANGE COMMISSION
Washington, D.C. 20549
FORM 10-Q
Quarterly report pursuant to Section 13 or 15(d) of
the Securities Exchange Act of 1934
For the quarterly period ended |
| Commission file |
June 30, 2020 | | number 001‑39215 |
Professional Holding Corp.
(Exact name of Registrant as specified in its charter)
Florida |
| |
| 46-5144312 |
|---|---|---|---|---|
(State or other jurisdiction of | | | | (I.R.S. Employer |
incorporation or organization) | | | | Identification Number) |
396 Alhambra Circle, Suite 255
Coral Gables, FL 33134 (786) 483-1757
(Address, including zip code, and telephone number, including area code, of Registrant’s principal executive offices)
Securities registered pursuant to Section 12(b) of the Act:
Title of each class: |
| Trading Symbol |
| Name of each exchange on which registered: |
Class A Common Stock |
| PFHD |
| NASDAQ Global Select Market |
Indicate by check mark whether the registrant (1) has filed all reports required to be filed by Section 13 or 15(d) of the Securities Exchange Act of 1934 during the preceding 12 months (or for such shorter period that the registrant was required to file such reports), and (2) has been subject to such filing requirements for the past 90 days. ☒ Yes ☐ No
Indicate by check mark whether the registrant has submitted electronically every Interactive Data File required to be submitted pursuant to Rule 405 of Regulation S-T (§232.405 of this chapter) during the preceding 12 months (or for such shorter period that the registrant was required to submit such files). ☒ Yes ☐ No
Indicate by check mark whether the registrant is a large accelerated filer, an accelerated filer, a non-accelerated filer, a smaller reporting company, or an emerging growth company. See the definitions of “large accelerated filer,” “accelerated filer,” “smaller reporting company,” and “emerging growth company” in Rule 12b-2 of the Exchange Act.
| | | |
Large accelerated filer | ☐ | Accelerated filer | ☐ |
| | | |
Non-accelerated filer | ☐ | Smaller reporting company | ☒ |
| | | |
| | Emerging growth company | ☒ |
| | | |
If an emerging growth company, indicate by check mark if the registrant has elected not to use the extended transition period for complying with any new or revised financial accounting standards provided pursuant to Section 13(a) of the Exchange Act. ☐
Indicate by check mark whether the registrant is a shell company (as defined in Rule 12b-2 of the Exchange Act). ☐ Yes ☒ No
Number of shares of common stock outstanding as of August 12, 2020: 13,450,393
| 3 | ||
| | | |
| 3 | ||
| | | |
| Management’s Discussion and Analysis of Financial Condition and Results of Operations | 24 | |
| | | |
| 58 | ||
| | | |
| 58 | ||
| | | |
| 58 | ||
| | | |
| 58 | ||
| | | |
| 58 | ||
| | | |
| 59 | ||
| | | |
| 60 | ||
| | | |
| 60 | ||
| | | |
| 60 | ||
| | | |
| 60 | ||
| | | |
2
Item 1. Consolidated Financial Statements (unaudited).
PROFESSIONAL HOLDING CORP.
CONDENSED CONSOLIDATED BALANCE SHEETS (Unaudited)
(Dollar amounts in thousands, except share data)
|
| June 30, |
| December 31, | ||
| | 2020 | | 2019 | ||
ASSETS |
| |
|
| |
|
Cash and due from banks | | $ | 38,034 | | $ | 21,408 |
Interest-bearing deposits | |
| 215,007 | |
| 150,572 |
Federal funds sold | |
| 39,444 | |
| 26,970 |
Cash and cash equivalents | |
| 292,485 | |
| 198,950 |
Securities available for sale, at fair value | |
| 105,213 | |
| 28,441 |
Securities held to maturity (fair value June 30, 2020 – $1,652, December 31, 2019 – $224) | |
| 1,635 | |
| 214 |
Equity securities | |
| 995 | |
| 971 |
Loans, net of allowance of $9,045 and $6,548 as of June 30, 2020 and December 31, 2019, respectively | |
| 1,559,861 | |
| 785,167 |
Federal Home Loan Bank stock, at cost | |
| 4,291 | |
| 2,994 |
Federal Reserve Bank stock, at cost | |
| 4,745 | |
| 2,074 |
Accrued interest receivable | |
| 5,495 | |
| 2,498 |
Premises and equipment, net | |
| 5,300 | |
| 4,307 |
Bank owned life insurance | |
| 17,113 | |
| 16,858 |
Goodwill | | | 14,728 | | | — |
Core deposit intangibles | | | 3,783 | | | — |
Other assets | |
| 16,108 | |
| 10,667 |
| | $ | 2,031,752 | | $ | 1,053,141 |
LIABILITIES AND STOCKHOLDERS’ EQUITY | |
| | |
| |
Deposits | |
| | |
| |
Demand – non-interest bearing | | $ | 495,086 | | $ | 184,211 |
Demand – interest bearing | |
| 763,108 | |
| 599,318 |
Time deposits | |
| 258,249 | |
| 109,344 |
Total deposits | |
| 1,516,443 | |
| 892,873 |
Federal Home Loan Bank advances | |
| 65,077 | |
| 55,000 |
Subordinated debt | | | 9,932 | | | — |
Official checks | |
| 4,439 | |
| 6,191 |
Line of credit | | | — | | | 9,999 |
PPPLF advances | | | 218,080 | | | — |
Accrued interest and other liabilities | |
| 15,347 | |
| 9,776 |
Total liabilities | |
| 1,829,318 | |
| 973,839 |
Commitments and contingent liabilities | |
| | |
| |
Stockholders’ equity | |
| | |
| |
Preferred stock, 10,000,000 shares authorized, none issued | |
| — | |
| — |
Class A Voting Common stock, $0.01 par value; authorized 50,000,000 shares, issued 13,252,745 and outstanding 12,692,451 shares as of June 30, 2020 and authorized 50,000,000 shares, issued 5,360,262 and outstanding 5,115,262 shares at December 31, 2019 | |
| 132 | |
| 53 |
Class B Non-Voting Common stock, $0.01 par value; 10,000,000 shares authorized,752,184 shares issued and outstanding at June 30, 2020 and December 31, 2019 | |
| 7 | |
| 7 |
Treasury stock, at cost | |
| (9,132) | |
| (4,155) |
Additional paid-in capital | |
| 202,438 | |
| 77,019 |
Retained earnings | |
| 8,265 | |
| 6,451 |
Accumulated other comprehensive gain (loss) | |
| 724 | |
| (73) |
Total stockholders’ equity | |
| 202,434 | |
| 79,302 |
| | $ | 2,031,752 | | $ | 1,053,141 |
3
PROFESSIONAL HOLDING CORP.
CONDENSED CONSOLIDATED STATEMENTS OF INCOME AND COMPREHENSIVE INCOME (Unaudited)
(Dollar amounts in thousands, except share data)
| | | | | | | | | | | | | |
| | Three Months Ended June 30, | | | Six Months Ended June 30, | ||||||||
|
| 2020 |
| 2019 |
|
| 2020 |
| 2019 | ||||
Interest income | | | | | | | | | | | | | |
Loans, including fees | | $ | 17,897 | | $ | 8,712 | | | $ | 27,912 | | $ | 16,787 |
Taxable securities | |
| 438 | |
| 161 | | |
| 660 | |
| 332 |
Dividend income on restricted stock | |
| 131 | |
| 70 | | |
| 210 | |
| 127 |
Other | |
| 56 | |
| 555 | | |
| 760 | |
| 1,024 |
Total interest income | |
| 18,522 | |
| 9,498 | | |
| 29,542 | |
| 18,270 |
| | | | | | | | | | | | | |
Interest expense | |
| | |
|
| | |
| | |
|
|
Deposits | |
| 1,617 | |
| 2,398 | | |
| 4,243 | |
| 4,411 |
Federal Home Loan Bank advances | |
| 287 | |
| 269 | | |
| 565 | |
| 507 |
Other borrowings | | | 327 | | | — | | | | 382 | | | — |
Total interest expense | |
| 2,231 | |
| 2,667 | | |
| 5,190 | |
| 4,918 |
| | | | | | | | | | | | | |
Net interest income | |
| 16,291 | |
| 6,831 | | |
| 24,352 | |
| 13,352 |
Provision for loan losses | |
| 1,750 | |
| 495 | | |
| 2,595 | |
| 382 |
Net interest income after provision for loan losses | |
| 14,541 | |
| 6,336 | | |
| 21,757 | |
| 12,970 |
| | | | | | | | | | | | | |
Non-interest income | |
| | |
|
| | |
| | |
|
|
Service charges on deposit accounts | |
| 307 | |
| 281 | | |
| 529 | |
| 357 |
Income from Bank owned life insurance | |
| 126 | |
| 85 | | |
| 255 | |
| 142 |
Gain on sale and call of securities | | | 11 | | | 3 | | | | 15 | | | 3 |
Other | |
| 524 | |
| 554 | | |
| 1,025 | |
| 781 |
Total non-interest income | |
| 968 | |
| 923 | | |
| 1,824 | |
| 1,283 |
| | | | | | | | | | | | | |
Non-interest expense | |
| | |
|
| | |
| | |
|
|
Salaries and employee benefits | |
| 6,912 | |
| 4,558 | | |
| 12,175 | |
| 8,872 |
Occupancy and equipment | |
| 1,081 | |
| 602 | | |
| 1,855 | |
| 1,123 |
Data processing | |
| 421 | |
| 162 | | |
| 597 | |
| 324 |
Marketing | |
| 151 | |
| 133 | | |
| 288 | |
| 272 |
Professional fees | |
| 806 | |
| 307 | | |
| 1,161 | |
| 582 |
Acquisition expenses | | | 560 | | | — | | | | 2,223 | | | — |
Regulatory assessments | |
| 300 | |
| 145 | | |
| 514 | |
| 307 |
Other | |
| 1,317 | |
| 630 | | |
| 2,221 | |
| 1,567 |
Total non-interest expense | |
| 11,548 | |
| 6,537 | | |
| 21,034 | |
| 13,047 |
| | | | | | | | | | | | | |
Income before income taxes | |
| 3,961 | |
| 722 | | |
| 2,547 | |
| 1,206 |
Income tax provision | |
| 830 | |
| 223 | | |
| 733 | |
| 352 |
Net income | |
| 3,131 | |
| 499 | | |
| 1,814 | |
| 854 |
| | | | | | | | | | | | | |
Earnings (loss) per share: | |
| | |
|
| | |
| | |
|
|
Basic | | $ | 0.23 | | $ | 0.08 | | | $ | 0.16 | | $ | 0.14 |
Diluted | | $ | 0.22 | | $ | 0.08 | | | $ | 0.15 | | $ | 0.14 |
| | | | | | | | | | | | | |
Other comprehensive income: | |
| | |
|
| | |
| | |
|
|
Unrealized holding gain (loss) on securities available for sale | |
| 743 | |
| 215 | | |
| 1,068 | |
| 483 |
Tax effect | |
| (188) | |
| (54) | | |
| (271) | |
| (122) |
Other comprehensive gain (loss), net of tax | |
| 555 | |
| 161 | | |
| 797 | |
| 361 |
Comprehensive income (loss) | | $ | 3,686 | | $ | 660 | | | $ | 2,611 | | $ | 1,215 |
4
PROFESSIONAL HOLDING CORP.
CONSOLIDATED STATEMENTS OF STOCKHOLDERS’ EQUITY (Unaudited)
(Dollar amounts in thousands, except share data)
| | | | | | | | | | | | | | | | Accumulated | | | | |
| | | | | | | | | | Additional | | | | | Other | | | | ||
| | Common Stock | | Treasury | | Paid-in | | Retained | | Comprehensive | | | | |||||||
| | Shares | | Amount | | Stock | | Capital | | Earnings |
| Income (Loss) | | Total | ||||||
Balance at March 31, 2020 | | 13,537,565 |
| $ | 138 |
| $ | (6,257) |
| $ | 201,670 |
| $ | 5,134 |
| $ | 169 |
| $ | 200,854 |
Issuance of common stock, net of issuance cost |
| 89,167 | |
| 1 |
| | — |
| | 450 |
| | — |
| | — |
| | 451 |
Treasury stock |
| (182,097) | |
| — |
| | (2,875) |
| | (5) |
| | — |
| | — |
| | (2,880) |
Employee stock purchase plan |
| — | |
| — |
| | — |
| | 27 |
| | — |
| | — |
| | 27 |
Net income |
| — | |
| — |
| | — |
| | — |
| | 3,131 |
| | — |
| | 3,131 |
Other comprehensive gain |
| — | |
| — |
| | — |
| | — |
| | — |
| | 555 |
| | 555 |
Stock based compensation |
| — | |
| — |
| | — |
| | 296 |
| | — |
| | — |
| | 296 |
Balance at June 30, 2020 |
| 13,444,635 | | $ | 139 | | $ | (9,132) | | $ | 202,438 | | $ | 8,265 | | $ | 724 | | $ | 202,434 |
| | | | | | | | | | | | | | | | | | | | |
Balance at March 31, 2019 | | 5,916,987 |
| $ | 60 |
| $ | (393) |
| $ | 76,244 |
| $ | 4,470 |
| $ | (225) |
| $ | 80,156 |
Issuance of common stock, net of issuance cost |
| 36,000 | |
| — |
| | — |
| | 330 |
| | — |
| | — |
| | 330 |
Treasury stock |
| (15,000) | |
| — |
| | (262) |
| | — |
| | — |
| | — |
| | (262) |
Employee stock purchase plan |
| — | |
| — |
| | — |
| | 30 |
| | — |
| | — |
| | 30 |
Net income |
| — | |
| — |
| | — |
| | — |
| | 499 |
| | — |
| | 499 |
Other comprehensive gain |
| — | |
| — |
| | — |
| | — |
| | — |
| | 161 |
| | 161 |
Stock based compensation |
| — | |
| — |
| | — |
| | 8 |
| | — |
| | — |
| | 8 |
Balance at June 30, 2019 |
| 5,937,987 | | $ | 60 | | $ | (655) | | $ | 76,612 | | $ | 4,969 | | $ | (64) | | $ | 80,922 |
| | | | | | | | | | | | | | | | | | | | |
Balance at December 31, 2019 |
| 5,867,446 |
| $ | 60 |
| $ | (4,155) |
| $ | 77,019 |
| $ | 6,451 |
| $ | (73) |
| $ | 79,302 |
Issuance of common stock, net of Issuance cost |
| 3,664,667 | |
| 37 |
| | — |
| | 60,221 |
| | — |
| | — |
| | 60,258 |
Treasury stock |
| (315,294) | |
| — |
| | (4,977) |
| | (9) |
| | — |
| | — |
| | (4,986) |
Marquis Bancorp (MBI) acquisition | | 4,227,816 | |
| 42 |
| | — |
| | 64,657 |
| | — |
| | — |
| | 64,699 |
Employee stock purchase plan |
| — | |
| — |
| | — |
| | 58 |
| | — |
| | — |
| | 58 |
Net income |
| — | |
| — |
| | — |
| | — |
| | 1,814 |
| | — |
| | 1,814 |
Other comprehensive gain |
| — | |
| — |
| | — |
| | — |
| | — |
| | 797 |
| | 797 |
Stock based compensation |
| — | |
| — |
| | — |
| | 492 |
| | — |
| | — |
| | 492 |
Balance at June 30, 2020 |
| 13,444,635 | |
| 139 |
| | (9,132) |
| | 202,438 |
| | 8,265 |
| | 724 |
| | 202,434 |
| | | | | | | | | | | | | | | | | | | | |
Balance at January 1, 2019 | | 5,923,884 |
| $ | 59 |
| $ | (220) |
| $ | 76,152 |
| $ | 4,115 |
| $ | (425) |
| $ | 79,681 |
Issuance of common stock, net of Issuance cost |
| 39,103 | |
| 1 |
| | — |
| | 385 |
| | — |
| | — |
| | 386 |
Treasury stock |
| (25,000) | |
| — |
| | (435) |
| | — |
| | — |
| | — |
| | (435) |
Employee stock purchase plan |
| — | |
| — |
| | — |
| | 57 |
| | — |
| | — |
| | 57 |
Net income |
| — | |
| — |
| | — |
| | — |
| | 854 |
| | — |
| | 854 |
Other comprehensive gain |
| — | |
| — |
| | — |
| | — |
| | — |
| | 361 |
| | 361 |
Stock based compensation |
| — | |
| — |
| | — |
| | 18 |
| | — |
| | — |
| | 18 |
Balance at June 30, 2019 |
| 5,937,987 | | $ | 60 | | $ | (655) | | $ | 76,612 | | $ | 4,969 | | $ | (64) | | $ | 80,922 |
5
PROFESSIONAL HOLDING CORP.
CONSOLIDATED STATEMENTS OF CASH FLOWS (Unaudited)
(Dollar amounts in thousands, except share data)
| | Six Months Ended June 30, | ||||
|
| 2020 |
| 2019 | ||
Cash flows from operating activities |
| |
|
| |
|
Net income (loss) | | $ | 1,814 | | $ | 854 |
Adjustments to reconcile net income to net cash from operating activities | |
|
| |
|
|
Provision for loan losses | |
| 2,595 | |
| 382 |
Deferred income tax benefit | |
| (499) | |
| 199 |
Depreciation and amortization | |
| 739 | |
| 156 |
Gain on sale of securities | | | 4 | | | 3 |
Gain on call of securities | | | 11 | | | — |
Equity unrealized change in market value | | | (24) | | | — |
Net amortization of securities | |
| (936) | |
| (278) |
Net amortization of deferred loan fees | |
| 1,118 | |
| 407 |
Employee stock purchase plan | | | 58 | | | — |
Stock compensation | |
| 492 | |
| 57 |
Income from bank owned life insurance | |
| (255) | |
| (142) |
Changes in operating assets and liabilities: | |
|
| |
|
|
Accrued interest receivable | |
| (1,472) | |
| (466) |
Other assets | |
| 1,887 | |
| (635) |
Official checks, accrued interest, interest payable and other liabilities | |
| (3,395) | |
| 7,194 |
Net cash provided by operating activities | |
| 2,137 | |
| 7,731 |
| | | | | | |
Cash flows from investing activities | |
|
| |
|
|
Proceeds from maturities and paydowns of securities available for sale | |
| 6,256 | |
| 285 |
Proceeds from calls of securities available for sale | | | 4,835 | | | 2,805 |
Proceeds from paydowns of securities held to maturity | |
| 44 | |
| 22 |
Purchase of securities available for sale | |
| (60,693) | |
| (10,308) |
Sale of securities available for sale | | | 1,739 | | | 4,504 |
Loans originations, net of principal repayments | |
| (257,801) | |
| (115,113) |
Proceeds from sale of loan | | | 110 | | | — |
Purchase of Federal Reserve Bank stock | |
| (2,671) | |
| (361) |
Purchase of Federal Home Loan Bank Stock | |
| (1,297) | |
| (1,015) |
Proceeds of Federal Home Loan Bank Stock | | | — | | | 425 |
Purchase of company owned life insurance | | | — | | | (8,000) |
Purchases of premises and equipment | |
| (741) | |
| (490) |
Proceeds from acquisition | | | 26,860 | | | — |
Net cash used in investing activities | |
| (283,359) | |
| (127,246) |
| | | | | | |
Cash flows from financing activities | |
|
| |
|
|
Net increase (decrease) in deposits | |
| 126,404 | |
| 136,456 |
Proceeds from issuance of stock, net of issuance costs | |
| 60,258 | |
| 404 |
Purchase of treasury stock | | | (4,986) | | | (435) |
Proceeds from Federal Home Loan Bank advances | |
| 10,000 | |
| 20,000 |
Repayments of Federal Home Loan advances | |
| (25,000) | |
| (10,000) |
Repayment of line of credit | | | (9,999) | | | — |
Proceeds from PPPLF advances | | | 218,080 | | | — |
Net cash provided by financing activities | |
| 374,757 | |
| 146,425 |
| | | | | | |
Increase in cash and cash equivalents | |
| 93,535 | |
| 26,910 |
| | | | | | |
Cash and cash equivalents at beginning of period | |
| 198,950 | |
| 86,883 |
| | | | | | |
Cash and cash equivalents at end of period | | $ | 292,485 | | $ | 113,793 |
| | | | | | |
Supplemental cash flow information: | |
|
| |
|
|
Cash paid during the period for interest | | $ | 4,907 | | $ | 4,891 |
Cash paid during the period for taxes | |
| 20 | |
| 389 |
| | | | | | |
Supplemental noncash disclosures: | |
|
| |
|
|
Other comprehensive gain (loss) – change in unrealized gain (loss) on securities available for sale, net of tax | | $ | 797 | | $ | 361 |
Lease liabilities arising from obtaining right of use assets | | | 1,620 | | | 5,673 |
Total asset acquired | | | 589,374 | | | — |
Total liabilities assumed | | | 539,403 | | | — |
6
PROFESSIONAL HOLDING CORP.
NOTES TO CONDENSED CONSOLIDATED FINANCIAL STATEMENTS (Unaudited)
(Tables in thousands, except share data)
NOTE 1 — SUMMARY OF SIGNIFICANT ACCOUNTING POLICIES
Basis of Presentation:
The accompanying unaudited condensed consolidated financial statements of Professional Holding Corp. and its subsidiary, Professional Bank (the “Bank” and collectively with Professional Holding Corp., the “Company”) have been prepared in accordance with U.S. generally accepted accounting principles for interim financial information. Accordingly, they do not include all of the information and footnotes required by U.S. generally accepted accounting principles for complete financial statements. In the opinion of management, all adjustments (consisting of normal recurring accruals) considered necessary for a fair presentation have been included. Certain prior period amounts have been reclassified to conform to the current period presentation.
Operating results for the six months ended June 30, 2020 are not necessarily indicative of the results that may be expected for the year ending December 31, 2020 or any other period. For further information, refer to the consolidated financial statements and footnotes thereto included in the Company’s Annual Report on Form 10-K for the year ended December 31, 2019.
Use of Estimates:
The preparation of these financial statements in conformity with accounting principles generally accepted in the United States of America requires management to make estimates and assumptions that affect the reported amounts of assets and liabilities and disclosures of contingent assets and liabilities at the date of the financial statements and the reported amounts of revenues and expenses during the reporting periods. Actual results could differ from those estimates.
The outbreak of the novel coronavirus COVID-19, which was declared a pandemic by the World Health Organization on March 11, 2020, has led to adverse impacts on the global economy and created uncertainty in world financial markets. The economic effects of the coronavirus COVID-19 pandemic have significantly impacted business and economic activity in the U.S. and around the world. There have been full and partial business closures, increases in unemployment as workers are furloughed, laid off, or had hours limited. Such disruptions could adversely affect our loan and deposit fee income as well as create downward pressure on the quality of our loan portfolio possibly leading to an increase in loan charge-offs.
The coronavirus COVID-19 is an unprecedented event that has created high levels of uncertainty. We are hopeful that the CARES Act and derivative programs will be a stabilizing force for the next 90 to 180 days, and we are vigilantly monitoring global events and actions being taken by various Federal and State Agencies. We have maintained interim periodic communications with our regulators and have not experienced any material deposit outflows to date and frequently communicate with our credit clients. Given the fluidity of the situation, management cannot predict the long-term impact of novel coronavirus COVID-19 for the remainder of 2020 or beyond.
7
New accounting standards that have not yet been adopted:
The following provides a brief description of accounting standards that have been issued but are not yet adopted that could have a material effect on the Company’s financial statements:
ASU 2016-13, Financial Instruments – Credit Losses (Topic 326) | |
Description | In June 2016, FASB issued guidance to replace the incurred loss model with an expected loss model, which is referred to as the current expected credit loss (CECL) model. The CECL model is applicable to the measurement of credit losses on financial assets measured at amortized cost, including loan receivables and held to maturity debt securities. It also applies to off-balance sheet credit exposures not accounted for as insurance (i.e. loan commitments, standby letters of credit, financial guarantees and other similar instruments). |
Date of Adoption | For PBEs that are non-SEC filers and for SEC filers that are considered emerging growth companies, it is effective for January 1, 2023. Early adoption is still permitted. |
Effect on the Consolidated Financial Statements | The Company's management is in the process of evaluating credit loss estimation models. Updates to business processes and the documentation of accounting policy decisions are ongoing. The company may recognize an increase in the allowance for credit losses upon adoption, recorded as a one-time cumulative adjustment to retained earnings. However, the magnitude of the impact on the Company's consolidated financial statements has not yet been determined. The Company will adopt this accounting standard effective January 1, 2023. |
NOTE 2 — EARNINGS PER SHARE
Basic earnings per common share is computed by dividing net income available to common shareholders by the weighted average number of shares of common stock outstanding during the year. Diluted earnings per common share is computed by dividing net income available to common shareholders by the weighted average number of shares of common stock outstanding plus the effect of employee stock options during the year.
| | Three Months Ended June 30, | | Six Months Ended June 30, | ||||||||
|
| 2020 |
| 2019 | | 2020 |
| 2019 | ||||
Basic earnings per share: |
| |
|
| |
| | |
|
| |
|
Net Income(loss) | | $ | 3,131 | | $ | 499 | | $ | 1,814 | | $ | 854 |
Total weighted average common stock outstanding | |
| 13,416 | |
| 5,919 | |
| 11,517 | |
| 5,920 |
Net income(loss) per share | | $ | 0.23 | | $ | 0.08 | | $ | 0.16 | | $ | 0.14 |
Diluted earnings per share: | |
| | |
| | |
| | |
| |
Net Income | | $ | 3,131 | | $ | 499 | | $ | 1,814 | | $ | 854 |
Total weighted average common stock outstanding | |
| 13,416 | |
| 5,919 | |
| 11,517 | |
| 5,920 |
Add: Dilutive effect of employee stock options | | | 518 | | | 204 | | | 527 | | | 214 |
Total weighted average diluted stock outstanding | | | 13,934 | | | 6,123 | | | 12,044 | | | 6,134 |
Net income per share | | $ | 0.22 | | $ | 0.08 | | $ | 0.15 | | $ | 0.14 |
For the three months ended June 30, 2020 and 2019 there were 29 thousand and no stock options that were anti-dilutive, respectively. For the six months ended June 30, 2020 and 2019 there were 29 thousand and no stock options that were anti-dilutive, respectively.
8
NOTE 3 — SECURITIES
The following table summarizes the amortized cost and fair value of securities available-for-sale and securities held-to-maturity at June 30, 2020 and December 31, 2019 and the corresponding amounts of gross unrealized gains and losses recognized in accumulated other comprehensive loss and gross unrecognized gains and losses:
|
| | |
| Gross |
| Gross |
| | | ||
| | Amortized | | Unrealized | | Unrealized | | | | |||
June 30, 2020 | | Cost | | Gains | | Losses | | Fair Value | ||||
Available-for-sale | | | | | | | | | | | | |
Small Business Administration loan pools | | $ | 33,340 | | $ | 35 | | $ | (277) | | $ | 33,098 |
Mortgage-backed securities | |
| 36,201 | |
| 572 | |
| (17) | |
| 36,756 |
U.S. agency obligations | | | 8,015 | | | 149 | | | (1) | | | 8,163 |
Community Development District bonds | | | 22,616 | | | 489 | | | (8) | | | 23,097 |
Municipals | | | 1,070 | | | 25 | | | - | | | 1,095 |
Corporate bonds | |
| 3,002 | |
| 3 | |
| (1) | |
| 3,004 |
Total available-for-sale | | $ | 104,244 | | $ | 1,273 | | $ | (304) | | $ | 105,213 |
| | | | | | | | | | | | |
|
| | |
| Gross |
| Gross |
|
| | ||
| | Amortized | | Unrecognized | | Unrecognized | | | | |||
| | Cost | | Gains | | Losses | | Fair Value | ||||
Held-to-Maturity | |
|
| |
|
| |
|
| |
|
|
Mortgage-backed securities | | $ | 430 | | $ | 19 | | $ | — | | $ | 449 |
US Treasury | | | 204 | | | — | | | — | | | 204 |
Foreign Bonds | | | 1,001 | | | — | | | (2) | | | 999 |
Total Held-to-Maturity | | $ | 1,635 | | $ | 19 | | $ | (2) | | $ | 1,652 |
|
| | |
| Gross |
| Gross |
| | | ||
| | Amortized | | Unrealized | | Unrealized | | Fair | ||||
December 31, 2019 | | Cost | | Gains | | Losses | | Value | ||||
Available-for-sale |
| |
|
| |
|
| |
|
| |
|
Small Business Administration loan pools | | $ | 17,303 | | $ | 19 | | $ | (139) | | $ | 17,183 |
Mortgage-backed securities | |
| 5,237 | |
| — | |
| (52) | |
| 5,185 |
U.S. agency obligations | | | 4,000 | | | 70 | | | — | | | 4,070 |
Corporate bonds | |
| 2,000 | |
| 3 | |
| — | |
| 2,003 |
Total available-for-sale | | $ | 28,540 | | $ | 92 | | $ | (191) | | $ | 28,441 |
| | | | | | | | | | | | |
|
| | |
| Gross |
| Gross | | | | ||
| | Amortized | | Unrecognized | | Unrecognized | | Fair | ||||
| | Cost | | Gains | | Losses |
| Value | ||||
Held-to-Maturity |
| |
|
| |
|
| |
|
| |
|
Mortgage-backed securities | | $ | 214 | | $ | 10 | | $ | — | | $ | 224 |
Total Held-to-Maturity | | $ | 214 | | $ | 10 | | $ | — | | $ | 224 |
As of June 30, 2020 and December 31, 2019, Corporate bonds are comprised of investments in the financial services industry. During the six months ended June 30, 2020, the net investment portfolio increased by $78.2 million as a result of purchases and acquisitions. Proceeds from sales of securities during the three and six months ended June 30, 2020 were $0 and $1.7 million, with gross realized gains of $0 and $4 thousand, respectively. Proceeds from calls of securities during the three and six months ended June 30, 2020 were $4.8 million and $4.8 million, with gross realized gains of $11 and $11 thousand, respectively. Proceeds from sales and calls of securities for the year ended December 31, 2019 were $4.5 million and $0.5 million, respectively. Securities pledged as of June 30, 2020, and December 31, 2019 were $13.6 million and $14.9 million, respectively.
9
The scheduled maturities of securities as of June 30, 2020 are as follows. The amortized cost and fair value of debt securities are shown by contractual maturity. Expected maturities may differ from contractual maturities if borrowers have the right to call or prepay obligations with or without call or prepayment penalties. Securities not due at a single maturity date are shown separately.
| | June 30, 2020 | ||||
|
| Amortized |
| Fair | ||
| | Cost | | Value | ||
Available-for-sale | | | | | | |
Due in one year or less | | $ | 4,013 | | $ | 4,014 |
Due after one year through five years | |
| 26,880 | |
| 27,463 |
Due after five years through ten years | | | 3,495 | | | 3,573 |
Due after ten years | | | 315 | | | 309 |
Subtotal | | $ | 34,703 | | $ | 35,359 |
| | | | | | |
SBA loan pools | | $ | 33,340 | | $ | 33,098 |
Mortgage-backed securities | | | 36,201 | | | 36,756 |
Total available-for-sale | | $ | 104,244 | | $ | 105,213 |
| | | | | | |
Held-to-maturity | | | | | | |
Due in one year or less | | $ | 204 | | $ | 204 |
Due after one year through five years | | | 1,001 | | | 999 |
Subtotal | | $ | 1,205 | | $ | 1,203 |
| | | | | | |
Mortgage-backed securities | | $ | 430 | | $ | 449 |
Total held-to-maturity | | $ | 1,635 | | $ | 1,652 |
At June 30, 2020 and December 31, 2019, there were no holdings of securities of any one issuer, other than the U.S. Government and its agencies, in an amount greater than 10% of shareholders’ equity.
The tables below indicate the fair value of debt securities with unrealized losses and for the period of time of which these losses were outstanding at June 30, 2020 and December 31, 2019, respectively, aggregated by major security type and length of time in a continuous unrealized loss position:
| | Less Than 12 Months | | 12 Months or Longer | | Total | ||||||||||||
|
| Fair |
| Unrealized |
| Fair |
| Unrealized |
| Fair |
| Unrealized | ||||||
| | Value | | Losses | | Value | | Losses | | Value | | Losses | ||||||
| | | | | | | | | | | | | | | | | | |
June 30, 2020 | | | | | | | | | | | | | | | | | | |
Available-for-sale | | | | | | | | | | | | | | | | | | |
Small Business Administration loan pools | | $ | 25,008 | | $ | (204) | | $ | 4,278 | | $ | (73) | | $ | 29,286 | | $ | (277) |
Mortgage-backed securities | |
| 2,970 | |
| (17) | |
| — | |
| — | |
| 2,970 | |
| (17) |
U.S. agency obligations | | | 2,004 | | | (1) | | | — | | | — | | | 2,004 | | | (1) |
Community Development District bonds | | | 587 | | | (8) | | | — | | | — | | | 587 | | | (8) |
Municipals | | | — | | | — | | | — | | | — | | | — | | | — |
Corporate bonds | |
| 1,000 | |
| (1) | |
| — | |
| — | |
| 1,000 | |
| (1) |
Total available-for-sale | | $ | 31,569 | | $ | (231) | | $ | 4,278 | | $ | (73) | | $ | 35,847 | | $ | (304) |
| | | | | | | | | | | | | | | | | | |
December 31, 2019 | |
|
| |
|
| |
|
| |
|
| |
|
| |
|
|
Available-for-sale | |
|
| |
|
| |
|
| |
|
| |
|
| |
|
|
SBA loan pools | | $ | 9,984 | | $ | (63) | | $ | 4,035 | | $ | (76) | | $ | 14,019 | | $ | (139) |
Mortgage-backed | |
| 1,914 | |
| (24) | |
| 2,541 | |
| (28) | |
| 4,455 | |
| (52) |
U.S. agency obligations | |
| — | | | — | | | — | | | — | |
| — | |
| — |
Corporate bonds | |
| — | |
| — | |
| — | |
| — | |
| — | |
| — |
Total available-for-sale | | $ | 11,898 | | $ | (87) | | $ | 6,576 | | $ | (104) | | $ | 18,474 | | $ | (191) |
The unrealized holding losses within the investment portfolio are considered to be temporary and are mainly due to changes in the interest rate cycle. The unrealized loss positions may fluctuate positively or negatively with changes in interest rates or spreads. Because
10
the decline in fair value is attributable to changes in interest rates and not credit quality, since we do not have any securities in an OTTI position, and because the Company does not have the intent to sell these securities and it is likely that it will not be required to sell the securities before their anticipated recovery, the Company does not consider these securities to be other-than-temporarily impaired at June 30, 2020. No credit losses were recognized in operations during for the six months ended June 30, 2020 or during 2019.
NOTE 4 — LOANS
Loans at June 30, 2020 and December 31, 2019 were as follows:
| | | | | | |
|
| June 30, 2020 |
| December 31, 2019 | ||
Commercial real estate | | $ | 704,947 | | $ | 270,981 |
Residential real estate | |
| 388,613 | |
| 342,257 |
Commercial | |
| 393,020 | |
| 129,477 |
Construction and development | |
| 76,684 | |
| 41,465 |
Consumer and other loans | |
| 13,281 | |
| 8,287 |
| |
| 1,576,545 | |
| 792,467 |
Less – | | | | | | |
Unearned loan origination (fees) costs, net | |
| (7,639) | |
| (752) |
Allowance for loan losses | |
| (9,045) | |
| (6,548) |
| | $ | 1,559,861 | | $ | 785,167 |
The recorded investment in loans excludes accrued interest receivable due to immateriality.
The bank had five loans totaling $4.5 million on nonaccrual as of June 30, 2020. The bank had three loans totaling $2.3 million on nonaccrual as of December 31, 2019.
There are two loans with a balance of $1.6 million at 90 days past due still accruing as of June 30, 2020 and no loans over 90 days past due and accruing as of December 31, 2019.
The following table presents the aging of the recorded investment in past due loans as of June 30, 2020 and December 31, 2019 by class of loans:
| | 30 – 59 | | 60 – 89 | | Greater than | | | | | | | | | | | | | |||
| | Days | | Days | | 89 Days | | | | | Total | | Loans Not | | | | |||||
|
| Past Due |
| Past Due |
| Past Due |
| Nonaccrual |
| Past Due |
| Past Due |
| Total | |||||||
June 30, 2020 |
| |
|
| |
|
| |
| | |
| | |
|
| |
|
| |
|
Commercial real estate | | $ | — | | $ | 2,399 | | $ | — | | $ | 305 | | $ | 2,704 | | $ | 702,243 | | $ | 704,947 |
Residential real estate | |
| 641 | |
| 854 | |
| 300 | |
| 3,150 | |
| 4,945 | |
| 383,668 | |
| 388,613 |
Commercial | |
| — | |
| — | |
| — | |
| 1,069 | |
| 1,069 | |
| 391,951 | |
| 393,020 |
Construction and land development | |
| — | |
| — | |
| — | |
| — | |
| — | |
| 76,684 | |
| 76,684 |
Consumer and other | |
| — | |
| — | |
| 1,348 | | | — | | | 1,348 | |
| 11,933 | |
| 13,281 |
Total | | $ | 641 | | $ | 3,253 | | $ | 1,648 | | $ | 4,524 | | $ | 10,066 | | $ | 1,566,479 | | $ | 1,576,545 |
| | | | | | | | | | | | | | | | | | | | | |
| | 30 – 59 | | 60 – 89 | | Greater than | | | | | | | | | | | | | |||
| | Days | | Days | | 89 Days | | | | | Total | | Loans Not | | | | |||||
|
| Past Due |
| Past Due |
| Past Due |
| Nonaccrual |
| Past Due |
| Past Due |
| Total | |||||||
December 31, 2019 | | | | | | | | | | | | | | | | | | | | | |
Commercial real estate | | $ | — | | $ | 2,428 | | $ | — | | $ | — | | $ | 2,428 | | $ | 268,553 | | $ | 270,981 |
Residential real estate | |
| 304 | |
| — | |
| — | |
| 483 | |
| 787 | |
| 341,470 | |
| 342,257 |
Commercial | |
| — | |
| 134 | |
| — | |
| 1,797 | |
| 1,931 | |
| 127,546 | |
| 129,477 |
Construction and land development | |
| — | |
| — | |
| — | |
| — | |
| — | |
| 41,465 | |
| 41,465 |
Consumer and other | |
| — | |
| — | |
| — | | | — | | | — | |
| 8,287 | |
| 8,287 |
Total | | $ | 304 | | $ | 2,562 | | $ | — | | $ | 2,280 | | $ | 5,146 | | $ | 787,321 | | $ | 792,467 |
11
At June 30, 2020, there were eight impaired loans with recorded investments totaling $16.1 million, of which there was one impaired loan with a recorded investment of $1.1 million with an allowance of $625 thousand. The average net investment on the impaired residential real estate and commercial loans during the three months ended June 30, 2020 were $1.6 million. Residential real estate loans had $29 thousand and $63 thousand interest income recognized for the three and six months ended June 30, 2020, which was equal to the cash basis interest income. At December 31, 2019, there were five impaired loans (consisting of nonaccrual loans, troubled debt restructured loans, loans past due 90 days or more and still accruing interest and other loans based on management’s judgment) with recorded investments totaling $3.6 million with no allowance. At December 31, 2019, there was one commercial loan impaired with a recorded investment of $1.1 million with a $626 thousand allowance. The average net investment on the impaired residential real estate and commercial loans during 2019 was $846 thousand. The residential real estate loans had $17 thousand interest income recognized which was equal to cash basis interest income.
Troubled Debt Restructurings:
The principal carrying balances of loans that met the criteria for consideration as troubled debt restructurings were $334 thousand and $367 thousand as of June 30, 2020 and December 31, 2019, respectively. The Company has allocated no specific reserves to customers whose loan terms have been modified in troubled debt restructurings as of June 30, 2020 and December 31, 2019. The Company has not committed any additional amounts to customers whose loans are classified as a troubled debt restructuring.
Credit Quality Indicators:
The Company categorizes loans into risk categories based on relevant information about the ability of borrowers to service their debt including: current financial information, historical payment experience, credit documentation, public information, and current economic trends, among other factors. Generally, all credits greater than $0.5 million are reviewed at least annually to monitor and adjust, if necessary, the credit risk profile. Loans classified as substandard or special mention are reviewed quarterly by the Company for further evaluation to determine if they are appropriately classified and whether there is any impairment. Beyond the annual review, all loans are graded upon initial issuance. In addition, during the renewal process of any loan, as well as if a loan becomes past due, the Company will determine the appropriate loan grade.
Loans excluded from the review process above are generally classified as pass credits until: (a) they become past due; (b) management becomes aware of deterioration in the credit-worthiness of the borrower; or (c) the customer contacts the Company for a modification. In these circumstances, the loan is specifically evaluated for potential classification as to special mention, substandard, doubtful, or even charged-off. The Company uses the following definitions for risk ratings:
Pass: A Pass loan’s primary source of loan repayment is satisfactory, with secondary sources very likely to be realized if necessary. The pass category includes the following:
Riskless: Loans that are fully secured by liquid, properly margined collateral (listed stock, bonds, or other securities; savings accounts; certificates of deposit; loans or that portion thereof which are guaranteed by the U.S. Government or agencies backed by the “full faith and credit” thereof; loans secured by properly executed letters of credit from prime financial institutions).
High Quality Risk: Loans to recognized national companies and well-seasoned companies that enjoy ready access to major capital markets or to a range of financing alternatives. Borrower’s public debt offerings are accorded highest ratings by recognized rating agencies, e.g., Moody’s or Standard & Poor’s. Companies display sound financial conditions and consistent superior income performance. The borrower’s trends and those of the industry to which it belongs are positive.
Satisfactory Risk: Loans to borrowers, reasonably well established, that display satisfactory financial conditions, operating results and excellent future potential. Capacity to service debt is amply demonstrated. Current financial strength, while financially adequate, may be deficient in a number of respects. Normal comfort levels are achieved through a closely monitored collateral position and/or the strength of outside guarantors.
Moderate Risk: Loans to borrowers who are in non-compliance with periodic reporting requirements of the loan agreement, and any other credit file documentation deficiencies, which do not otherwise affect the borrower’s credit risk profile. This may include borrowers who fail to supply updated financial information that supports the adequacy of the primary source of repayment to service the Bank’s debt and prevents bank management to evaluate the borrower’s current debt service capacity. Existing loans will include those with consistent track record of timely loan payments, no material adverse changes to underlying collateral, and no material adverse change to guarantor(s) financial capacity, evidenced by public record searches.
12
Special mention: A Special Mention loan has potential weaknesses that deserve management’s close attention. If left uncorrected, these potential weaknesses may result in the deterioration of the repayment prospects for the asset or the Company’s credit position at some future date. Special Mention loans are not adversely classified and do not expose an institution to sufficient risk to warrant adverse classification.
Substandard: A Substandard loan is inadequately protected by the current sound worth and paying capacity of the obligor or of the collateral pledged, if any. Loans so classified must have a well-defined weakness or weaknesses that jeopardize the liquidation of the debt. They are characterized by the distinct possibility that the Company will sustain some loss if the deficiencies are not corrected.
Doubtful: A loan classified Doubtful has all the weaknesses inherent in one classified Substandard with the added characteristics that the weaknesses make collection or liquidation in full, on the basis of currently existing facts, conditions, and values, highly questionable and improbable.
Loss: A loan classified Loss is considered uncollectible and of such little value that continuance as a bankable asset is not warranted. This classification does not mean that the asset has absolutely no recovery or salvage value, but rather it is not practical or desirable to defer writing off this basically worthless asset even though partial recovery may be affected in the future.
Based on the most recent analysis performed, the risk category of loans by class of loans is as follows:
| | | | | Special | | | | | | | | | | |
(Dollars in thousands) |
| Pass |
| Mention |
| Substandard |
| Doubtful |
| Total | |||||
June 30, 2020 | | | |
| | |
| | |
| | |
| | |
Commercial real estate | | $ | 700,637 | | $ | 1,606 | | $ | 2,704 | | $ | — | | $ | 704,947 |
Residential real estate | |
| 376,743 |
|
| 8,908 |
|
| 2,962 |
|
| — |
|
| 388,613 |
Commercial | |
| 382,705 |
|
| 391 |
|
| 9,924 |
|
| — |
|
| 393,020 |
Construction and land development | |
| 76,684 |
|
| — |
|
| — |
|
| — |
|
| 76,684 |
Consumer | |
| 13,281 |
|
| — |
|
| — |
|
| — |
|
| 13,281 |
Total | | $ | 1,550,050 |
| $ | 10,905 |
| $ | 15,590 |
| $ | — |
| $ | 1,576,545 |
| | | |
| | |
| | |
| | |
| | |
December 31, 2019 | | | | | | | | | | | | | | | |
Commercial real estate | | $ | 266,346 | | $ | 2,207 | | $ | 2,428 | | $ | — | | $ | 270,981 |
Residential real estate | |
| 341,819 |
|
| 438 |
|
| — |
|
| — |
|
| 342,257 |
Commercial | |
| 126,851 |
|
| 829 |
|
| 1,797 |
|
| — |
|
| 129,477 |
Construction and land development | |
| 41,465 |
|
| — |
|
| — |
|
| — |
|
| 41,465 |
Consumer | |
| 8,287 |
|
| — |
|
| — |
|
| — |
|
| 8,287 |
Total | | $ | 784,768 |
| $ | 3,474 |
| $ | 4,225 |
| $ | — |
| $ | 792,467 |
Purchased Credit Impaired Loans:
The Company has purchased loans, for which there was, at acquisition, evidence of deterioration of credit quality since origination and it was probable, at acquisition, that all contractually required payments would not be collected. The carrying amount of those loans is as follows:
| | | |
(Dollars in thousands) |
| June 30, 2020 | |
Commercial real estate | | $ | 305 |
Residential real estate | |
| 402 |
Commercial | |
| 725 |
Construction and development | |
| 3,063 |
Consumer and other loans | |
| — |
Carrying amount | | $ | 4,495 |
13
Accretable yield, or income expected to be collected, is as follows:
(Dollars in thousands) |
| 2020 | |
Balance at January 1 | | $ | — |
New loans purchased | |
| (418) |
Accretion of income | |
| (18) |
Reclassifications from nonaccretable difference | |
| — |
Disposals | |
| — |
Balance at June 30 | | $ | (436) |
For those purchased credit impaired loans disclosed above, no allowances for loan losses were reversed through the six months ended June 30, 2020.
The credit fair value adjustment on purchased credit impairment (“PCI”) loans represents the portion of the loan balances that have been deemed uncollectible based on the Company’s expectations of future cash flows for each respective loan. PCI loans purchased during the six months ended June 30, 2020, for which it was probable at acquisition that all contractually required payments would not be collected are as follows:
(Dollars in thousands) |
| March 26, 2020 | |
Contractually required principal and interest by loan type | | | |
Commercial real estate | | $ | 415 |
Residential real estate | |
| 590 |
Commercial | |
| 2,324 |
Construction and development | |
| 5,639 |
Consumer and other loans | |
| - |
Total | | $ | 8,968 |
Contractual cash flows not expected to be collected (nonaccretable discount) | | | |
Commercial real estate | | $ | 68 |
Residential real estate | |
| 126 |
Commercial | |
| 1,519 |
Construction and development | |
| 2,818 |
Consumer and other loans | |
| - |
Total | | $ | 4,531 |
| | | |
Expected cash flows | | $ | 4,437 |
Interest component of expected cash flows (accretable discount) | | | (418) |
Fair value of PCI loans accounted for under ASC 310-30 | | $ | 4,019 |
Paycheck Protection Program (PPP)
The Company has participated in the Paycheck Protection Program (PPP) offered through the U.S. Small Business Administration (SBA) by way of the Coronavirus Aid Relief and Economic Security (CARES) Act that was passed at the end of the first quarter 2020. As a qualified SBA lender, the Company was automatically authorized to originate PPP loans. To help clients, the Company added an online PPP application form and automated the PPP loan closing documentation process. As of June 30, 2020, the Company has processed, closed and funded more than 1,400 loans representing $224.0 million in relief proceeds. The majority of these loans have been pledged to the Federal Reserve as part of the Paycheck Protection Program Liquidity Facility (PPPLF). The PPPLF pledged loans are non-recourse to the Bank. Interest income on loans include PPP loan fees. PPP loan fees recognized during the three and six months ended June 30, 2020 were $675.0 thousand.
Debt Service Relief Requests Related to COVID-19
As of June 30, 2020, we have reviewed and processed numerous debt service relief requests in accordance with Section 4013 of the CARES Act and interagency guidelines published by federal banking regulators on March 13, 2020. As currently interpreted by the agencies, the guidelines assert that short-term modifications made on good faith for reasons related to the COVID-19 pandemic to
14
borrowers who were current prior to such relief are not considered TDRs. These modifications include deferrals of principal and interest, modification to interest only, and deferrals to escrow requirements. The modifications have varying terms up to six months.
To manage credit risk, the Company increased oversight and analysis of $44.1 million of loans to borrowers in vulnerable industries such as hotels and hospitality. As of June 30, 2020, $30.7 million of these loans where provided payment relief consistent with Section 4013 of the CARES Act and the interagency guidelines published on March 13, 2020 and are performing under the terms of those modifications. The remaining loans in this group continue to perform according to their terms.
NOTE 5 — ALLOWANCE FOR LOAN LOSSES
The following table presents the balance in the allowance for loan losses and the recorded investment in loans by portfolio segment and based on the impairment method for the three and six months ended June 30, 2020 and 2019:
| | | | | | | | | | | Construction | | | | | | ||
| | Commercial | | Residential | | | | | and land | | Consumer | | | | ||||
|
| Real Estate |
| Real Estate |
| Commercial |
| Development |
| and Other |
| Total | ||||||
Three months ended June 30, 2020 |
| |
|
| |
|
| |
|
| |
|
| |
|
| |
|
Allowance for loan losses: |
| |
|
| |
|
| |
|
| |
|
| |
|
| |
|
Beginning balance | | $ | 2,661 | | $ | 3,260 | | $ | 963 | | $ | 451 | | $ | 59 | | $ | 7,394 |
Provision for loan losses | |
| 131 | |
| 249 | |
| 1,202 | |
| 26 | |
| 142 | |
| 1,750 |
Loans charged-off | |
| - | |
| - | |
| - | |
| - | |
| (99) | |
| (99) |
Recoveries | |
| - | |
| - | |
| - | |
| - | |
| - | |
| - |
Total ending allowance balance | | $ | 2,792 | | $ | 3,509 | | $ | 2,165 | | $ | 477 | | $ | 102 | | $ | 9,045 |
| | | | | | | | | | | Construction | | | | | | | |
| | Commercial | | Residential | | | | | and land | | Consumer | | | | ||||
|
| Real Estate |
| Real Estate |
| Commercial |
| Development |
| and Other |
| Total | ||||||
Three months ended June 30, 2019 |
| |
|
| |
|
| |
|
| |
|
| |
|
| |
|
Allowance for loan losses: |
| |
|
| |
|
| |
|
| |
|
| |
|
| |
|
Beginning balance | | $ | 1,086 | | $ | 2,544 | | $ | 1,527 | | $ | 344 | | $ | 71 | | $ | 5,572 |
Provision for loan losses | |
| 225 | |
| 115 | |
| 51 | |
| 27 | |
| 77 | |
| 495 |
Loans charged-off | |
| — | |
| — | |
| — | |
| — | |
| — | |
| — |
Recoveries | |
| — | |
| — | |
| — | |
| — | |
| 2 | |
| 2 |
Total ending allowance balance | | $ | 1,311 | | $ | 2,659 | | $ | 1,578 | | $ | 371 | | $ | 150 | | $ | 6,069 |
| | | | | | | | | | | Construction | | | | | | ||
| | Commercial | | Residential | | | | | and land | | Consumer | | | | ||||
|
| Real Estate |
| Real Estate |
| Commercial |
| Development |
| and Other |
| Total | ||||||
Six months ended June 30, 2020 |
| |
|
| |
|
| |
|
| |
|
| |
|
| |
|
Allowance for loan losses: |
| |
|
| |
|
| |
|
| |
|
| |
|
| |
|
Beginning balance | | $ | 1,845 | | $ | 3,116 | | $ | 1,235 | | $ | 272 | | $ | 81 | | $ | 6,549 |
Provision for loan losses | |
| 947 | |
| 393 | |
| 930 | |
| 205 | |
| 120 | |
| 2,595 |
Loans charged-off | |
| — | |
| — | |
| — | |
| — | |
| (99) | |
| (99) |
Recoveries | |
| — | |
| — | |
| — | |
| — | |
| — | |
| — |
Total ending allowance balance | | $ | 2,792 | | $ | 3,509 | | $ | 2,165 | | $ | 477 | | $ | 102 | | $ | 9,045 |
15
| | | | | | | | | | | Construction | | | | | | | |
| | Commercial | | Residential | | | | | and land | | Consumer | | | | ||||
|
| Real Estate |
| Real Estate |
| Commercial |
| Development |
| and Other |
| Total | ||||||
Six months ended June 30, 2019 |
| |
|
| |
|
| |
|
| |
|
| |
|
| |
|
Allowance for loan losses: |
| |
|
| |
|
| |
|
| |
|
| |
|
| |
|
Beginning balance | | $ | 1,435 | | $ | 1,822 | | $ | 2,106 | | $ | 262 | | $ | 60 | | $ | 5,685 |
Provision for loan losses | |
| (124) | |
| 837 | |
| (528) | |
| 109 | |
| 88 | |
| 382 |
Loans charged-off | |
| — | |
| — | |
| — | |
| — | |
| — | |
| — |
Recoveries | |
| — | |
| — | |
| — | |
| — | |
| 2 | |
| 2 |
Total ending allowance balance | | $ | 1,311 | | $ | 2,659 | | $ | 1,578 | | $ | 371 | | $ | 150 | | $ | 6,069 |
| | | | | | | | | | | Construction | | | | | | ||
| | Commercial | | Residential | | | | | and Land | | Consumer | | | | ||||
|
| Real Estate |
| Real Estate |
| Commercial |
| Development |
| and Other |
| Total | ||||||
June 30, 2020 | |
|
| |
|
| |
|
| |
|
| |
|
| |
|
|
Allowance for loan losses: | | | | | | | | | | | | | | | | | | |
Ending allowance balance attributable to loans | | | | | | | | | | | | | | | | | | |
Individually evaluated for impairment | | $ | — | | $ | — | | $ | 625 | | $ | — | | $ | — | | $ | 625 |
Purchased Credit Impaired (PCI) loans | | | — | | | — | | | — | | | — | | | — | | | — |
Collectively evaluated for impairment | | | 2,792 | | | 3,509 | | | 1,540 | | | 477 | | | 102 | | | 8,420 |
Total ending allowance balance | | $ | 2,792 | | $ | 3,509 | | $ | 2,165 | | $ | 477 | | $ | 102 | | $ | 9,045 |
| | | | | | | | | | | | | | | | | | |
Loans: | | | | | | | | | | | | | | | | | | |
Loans individually evaluated for impairment | | $ | 2,704 | | $ | 3,484 | | $ | 9,924 | | $ | — | | $ | — | | $ | 16,112 |
Loans collectively evaluated for impairment | | | 702,243 | | | 385,129 | | | 383,096 | | | 76,684 | | | 13,281 | | | 1,560,433 |
Total ending loans balance | | $ | 704,947 | | $ | 388,613 | | $ | 393,020 | | $ | 76,684 | | $ | 13,281 | | $ | 1,576,545 |
| | | | | | | | | | | | | | | | | | |
December 31, 2019 | | | | | | | | | | | | | | | | | | |
Allowance for loan losses: | | | | | | | | | | | | | | | | | | |
Ending allowance balance attributable to loans | | | | | | | | | | | | | | | | | | |
Individually evaluated for impairment | | $ | — | | $ | — | | $ | 626 | | $ | — | | $ | — | | $ | 626 |
Collectively evaluated for impairment | | | 1,845 | | | 3,116 | | | 609 | | | 272 | | | 81 | | | 5,923 |
Total ending allowance balance | | $ | 1,845 | | $ | 3,116 | | $ | 1,235 | | $ | 272 | | $ | 81 | | $ | 6,549 |
| | | | | | | | | | | | | | | | | | |
Loans: | | | | | | | | | | | | | | | | | | |
Loans individually evaluated for impairment | | $ | 2,428 | | $ | 483 | | $ | 1,797 | | $ | — | | $ | — | | $ | 4,708 |
Loans collectively evaluated for impairment | | | 268,553 | | | 341,774 | | | 127,680 | | | 41,465 | | | 8,287 | | | 787,759 |
Total ending loans balance | | $ | 270,981 | | $ | 342,257 | | $ | 129,477 | | $ | 41,465 | | $ | 8,287 | | $ | 792,467 |
NOTE 6 — FAIR VALUE
Fair value is the exchange price that would be received for an asset or paid to transfer a liability (exit price) in the principal or most advantageous market for the asset or liability in an orderly transaction between market participants on the measurement date. There are three levels of inputs that may be used to measure fair values:
Level 1 — Quoted prices (unadjusted) for identical assets or liabilities in active markets that the entity has the ability to access as of the measurement date.
Level 2 — Significant other observable inputs other than Level 1 prices such as quoted prices for similar assets or liabilities; quoted prices in markets that are not active; or other inputs that are observable or can be corroborated by observable market data.
Level 3 — Significant unobservable inputs that reflect a Company’s own assumptions about the assumptions that market participants would use in pricing an asset or liability.
16
The Company used the following methods and significant assumptions to estimate fair value:
Securities available for sale: Where quoted prices are available in an active market, securities are classified within Level 1 of the valuation hierarchy. Level 1 securities include highly liquid government bonds, certain mortgage products and exchange-traded equities. If quoted market prices are not available, then fair values are estimated by using pricing models, quoted prices of securities with similar characteristics, or discounted cash flows. Examples of such instruments, which would generally be classified within Level 2 of the valuation hierarchy, include certain collateralized mortgage and debt obligations, corporate bonds, municipal bonds and U.S. agency notes. In certain cases where there is limited activity or less transparency around inputs to the valuation, securities are classified within Level 3 of the valuation hierarchy. Securities classified within Level 3 might include certain residual interests in securitizations and other less liquid securities. As of June 30, 2020 and December 31, 2019, all securities available for sale were Level 2.
Equity securities: The Company values equity securities at readily determinable market value at the end of each period. Changes in fair value are recognized through net income.
Assets and Liabilities Measured on a Recurring Basis
Assets and liabilities measured at fair value on a recurring basis, are summarized below:
| | | | | | | | | | | | |
| | | | | Fair Value Measurements | |||||||
| | | | | at June 30, 2020 Using: | |||||||
| | | | | | | | Significant | | | | |
| | | | | Quoted Prices in | | Other | | Significant | |||
| | | | | Active Markets for | | Observable | | Unobservable | |||
| | Fair | | Identical Assets | | Inputs | | Inputs | ||||
June 30, 2020 |
| Value |
| (Level 1) |
| (Level 2) |
| (Level 3) | ||||
Available-for-sale |
| |
|
| |
|
| |
|
| |
|
Small Business Administration loan pools | | $ | 33,098 | | $ | — | | $ | 33,098 | | $ | — |
Mortgage-backed securities | |
| 36,756 | |
| — | |
| 36,756 | |
| — |
U.S. agency obligations | | | 8,163 | | | — | | | 8,163 | | | — |
Community Development District bonds | | | 23,097 | | | — | | | 23,097 | | | — |
Municipals | | | 1,095 | | | — | | | 1,095 | | | — |
Corporate bonds | |
| 3,004 | |
| — | |
| 3,004 | |
| — |
Total | | $ | 105,213 | | $ | — | | $ | 105,213 | | $ | — |
Equity |
| |
|
| |
|
| |
|
| |
|
Mutual funds | | $ | 995 | | $ | — | | $ | 995 | | $ | — |
Total | | $ | 995 | | $ | — | | $ | 995 | | $ | — |
| | | | | Fair Value Measurements | |||||||
| | | | | at December 31, 2019 Using: | |||||||
| | | | | | | | Significant | | | | |
| | | | | Quoted Prices in | | Other | | significant | |||
| | | | | Active Markets for | | Observable | | Unobservable | |||
| | Fair | | Identical Assets | | Inputs | | Inputs | ||||
December 31, 2019 |
| Value |
| (Level 1) |
| (Level 2) |
| (Level 3) | ||||
Available-for-sale |
| |
|
| |
|
| |
|
| |
|
SBA loans pools | | $ | 17,183 | | $ | — | | $ | 17,183 | | $ | — |
Mortgage-backed securities | |
| 5,185 | |
| — | |
| 5,185 | |
| — |
U.S. agency obligations | |
| 4,070 | |
| — | |
| 4,070 | |
| — |
Corporate bonds | |
| 2,003 | |
| — | |
| 2,003 | |
| — |
Total | | $ | 28,441 | | $ | — | | $ | 28,441 | | $ | — |
Equity |
| |
|
| |
|
| |
|
| |
|
Mutual funds | | $ | 971 | | $ | — | | $ | 971 | | $ | — |
Total | | $ | 971 | | $ | — | | $ | 971 | | $ | — |
There were no securities reclassified into or out of Level 3 during the six months ended June 30, 2020 or for the year ended December 31, 2019.
17
Assets measured at fair value on a non-recurring basis are summarized below:
| | | | | Fair Value Measurements | ||||||||||
| | | | | at June 30, 2020 Using: | ||||||||||
| | | | | | | | Significant | | | | | | | |
| | | | | Quoted Prices in | | Other | | Significant | | | | |||
| | Total at | | Active Markets for | | Observable | | Unobservable | | | | ||||
| | June 30, | | Identical Assets | | Inputs | | Inputs | | Total Gains | |||||
(Dollars in thousands) |
| 2020 |
| (Level 1) |
| (Level 2) |
| (Level 3) |
| (Losses) | |||||
Impaired Loans: |
| |
|
| |
|
| |
|
| |
| | |
|
Commercial real estate | | $ | — | | $ | — | | $ | — | | $ | — | | $ | — |
Residential real estate | |
| — | |
| — | |
| — | |
| — | |
| — |
Commercial | | | 444 | | | — | | | — | | | 444 | | | (625) |
Construction and land development | | | — | | | — | | | — | | | — | | | — |
Consumer and other | |
| — | |
| — | |
| — | |
| — | |
| — |
Total | | $ | 444 | | $ | — | | $ | — | | $ | 444 | | $ | (625) |
| | | | | Fair Value Measurements | ||||||||||
| | | | | at December 31, 2019 Using: | ||||||||||
| | | | | | | | Significant | | | | | | | |
| | | | | Quoted Prices in | | Other | | Significant | | | | |||
| | Total at | | Active Markets for | | Observable | | Unobservable | | | | ||||
| | December 31, | | Identical Assets | | Inputs | | Inputs | | Total Gains | |||||
(Dollars in thousands) |
| 2019 |
| (Level 1) |
| (Level 2) |
| (Level 3) |
| (Losses) | |||||
Impaired Loans: |
| |
|
| |
|
| |
|
| |
| | |
|
Commercial real estate | | $ | — | | $ | — | | $ | — | | $ | — | | $ | — |
Residential real estate | |
| — | |
| — | |
| — | |
| — | |
| — |
Commercial | | | 442 | | | — | | | — | | | 442 | | | (627) |
Construction and land development | | | — | | | — | | | — | | | — | | | — |
Consumer and other | |
| — | |
| — | |
| — | |
| — | |
| — |
Total | | $ | 442 | | $ | — | | $ | — | | $ | 442 | | $ | (627) |
As shown above our impaired loans consist solely of commercial loans considered to be Level 3. These Level 3 loans have significant unobservable inputs such as appraisal adjustments for local market conditions and economic factors that may result in changes in value of an assets over time.
The table below presents the approximate carrying amount and estimated fair value of the Bank’s financial instruments (in thousands):
| | June 30, 2020 | ||||||
| | Carrying | | Fair | | Fair Value | ||
|
| Amount |
| Value |
| Hierarchy | ||
Financial Assets: |
| |
|
| |
|
|
|
Cash & Due from Banks, including interest bearing deposits | | $ | 253,041 | | $ | 253,041 |
| Level 1 |
Federal Funds Sold | |
| 39,444 | |
| 39,444 |
| Level 1 |
Securities, Available for Sale | |
| 105,213 | |
| 105,213 |
| Level 2 |
Securities, Held to Maturity | |
| 1,635 | |
| 1,652 |
| Level 2 |
Securities, Equity | |
| 995 | |
| 995 |
| Level 2 |
Loans, net | |
| 1,559,861 | |
| 1,583,195 |
| Level 3 |
Company Owned Life Insurance | |
| 17,113 | |
| 17,113 |
| Level 2 |
Accrued Interest Receivable | |
| 5,495 | |
| 5,495 |
| Level 1, 2 & 3 |
| | | | | | | | |
Financial Liabilities: | |
|
| |
|
|
|
|
Deposits | |
| 1,516,443 | |
| 1,547,642 |
| Level 2 |
Federal Home Loan Bank Advances | |
| 65,077 | |
| 62,357 |
| Level 2 |
Accrued Interest Payable | |
| 541 | |
| 541 |
| Level 2 |
18
| | December 31, 2019 | ||||||
| | Carrying | | Fair | | Fair Value | ||
|
| Amount |
| Value |
| Hierarchy | ||
Financial Assets: |
| |
|
| |
|
|
|
Cash & Due from Banks, including interest bearing deposits | | $ | 171,980 | | $ | 171,980 |
| Level 1 |
Federal Funds Sold | |
| 26,970 | |
| 26,970 |
| Level 1 |
Securities, Available for Sale | |
| 28,441 | |
| 28,441 |
| Level 2 |
Securities, Held to Maturity | |
| 214 | |
| 224 |
| Level 2 |
Securities, Equity | |
| 971 | |
| 971 |
| Level 2 |
Loans, net | |
| 785,167 | |
| 796,924 |
| Level 3 |
Company Owned Life Insurance | |
| 16,858 | |
| 16,858 |
| Level 2 |
Accrued Interest Receivable | |
| 2,498 | |
| 2,498 |
| Level 1, 2 & 3 |
| | | | | | | | |
Financial Liabilities: | |
|
| |
|
|
|
|
Deposits | |
| 892,873 | |
| 883,225 |
| Level 2 |
Federal Home Loan Bank Advances | |
| 55,000 | |
| 54,649 |
| Level 2 |
Line of Credit | | | 9,999 | | | 9,999 | | Level 1 |
Accrued Interest Payable | |
| 373 | |
| 373 |
| Level 2 |
NOTE 7 — LEASES
ASC 842 establishes a right-of-use (“ROU”) model that requires a lessee to recognize a ROU asset and lease liability on the balance sheet for all leases with a term longer than 12 months. Leases are classified as finance or operating, with classification affecting the pattern and classification of expense recognition in the income statement. The Company’s ROU assets are classified under premises and equipment on the Balance Sheet. The ROU liabilities are classified under other liabilities. The Company recorded $1.6 million during the six months ended June 30, 2020 and $6.0 million during the year ended December 31, 2019. The total amount of ROU was $7.3 and $6.4 million at June 30, 2020 and December 31, 2019, respectively.
The Company leases certain properties and equipment under operating leases that resulted in the recognition of ROU Lease Assets of $5,673 and Lease Liabilities of $6,025 on the Company’s Condensed Consolidated Balance Sheets as of January 1, 2019.
ASC 842 was effective on January 1, 2019. A modified retrospective transition approach is required, applying the new standard to all leases existing at the date of initial application. The Company chose to use the adoption date of January 1, 2019 for ASC 842. As such, all periods presented after January 1, 2019 are under ASC 842 whereas periods presented prior to January 1, 2019 are in accordance with prior lease accounting of ASC 840. Financial information was not updated and the disclosures required under ASC 842 was not provided for dates and periods before January 1, 2019.
ASC 842 provides a number of optional practical expedients in transition. The Company has elected the package of practical expedients, which permits the Company not to reassess under the new standard the prior conclusions about lease identification, lease classification and initial direct costs. The Company also elected the use of the hindsight, a practical expedient which permits the use of information available after lease inception to determine the lease term via the knowledge of renewal options exercised not available as of the leases inception. The practical expedient pertaining to land easements is not applicable to the Company.
ASC 842 also requires certain accounting elections for ongoing application of ASC 842. The Company elected the short-term lease recognition exemption for all leases that qualify, meaning those with terms under twelve months. ROU assets or lease liabilities are not to be recognized for short-term leases. The Company also elected the practical expedient to not separate lease and non-lease components for all leases, the majority of which consist of real estate common area maintenance expenses. However, since these non-lease items are subject to change, they are treated and disclosed as variable payments in the quantitative disclosures below. Consequently, ASC 842’s changed guidance on contract components will not significantly affect our financial reporting. Similarly, ASC 842’s narrowed definition of initial direct costs will not significantly affect financial reporting.
Lessee Leases
The majority of the Company’s lessee leases are operating leases and consist of leased real estate for branches and operations centers. Options to extend and renew leases are generally exercised under normal circumstances. Advance notification is required prior to termination, and any noticing period is often limited to the months prior to renewal. Variable payments generally consist of common area maintenance and taxes. Rent escalations are generally specified by a payment schedule or are subject to a defined formula. The Company also elected the practical expedient to not separate lease and non-lease components for all leases, the majority of which consist of real estate common area maintenance expenses. Generally, leases do not include guaranteed residual values, but instead typically specify that the leased premises are to be returned in satisfactory condition with the Company liable for damages.
19
For operating leases, the lease liability and ROU asset (before adjustments) are recorded at the present value of future lease payments. ASC 842 requires the use of the lease interest rate; however, this rate is typically not known. As an alternative, ASC 842 permits the use of an entity’s fully secured incremental borrowing rate. The Company is electing to utilize the Federal Home Loan Bank (“FHLB”) Atlanta Fixed Rate Advance index, as it is the most actively used institution-specific collateralized borrowing source available to the Company.
Lease cost for the three and six months ended June 30, 2020 and 2019 consists of:
| | Three-month | | Three-month | | Six-month | | Six-month | ||||
| | period ended | | period ended | | period ended | | period ended | ||||
|
| June 30, 2020 | | June 30, 2019 | | June 30, 2020 | | June 30, 2019 | ||||
Operating Lease and Interest Cost | | $ | 445 | | $ | 255 | | $ | 756 | | $ | 444 |
Variable Lease Cost | |
| 142 | |
| 82 | |
| 249 | |
| 177 |
Total Lease Cost | | $ | 587 | | $ | 337 | | $ | 1,005 | | $ | 621 |
The following table provides supplemental information related to leases for the three and six months ended June 30, 2020 and 2019:
| | | | | | | | | | | | | |
| | Three-month | | Three-month | | Six-month | | Six-month | | ||||
| | period ended | | period ended | | period ended | | period ended | | ||||
|
| June 30, 2020 | | June 30, 2019 | | June 30, 2020 | | June 30, 2019 | | ||||
Operating Lease - Operating Cash Flows (Fixed Payments) | | $ | 445 | | $ | 255 | | $ | 756 | | $ | 444 | |
Operating Lease - Operating Cash Flows (Liability Reduction) | | $ | 416 | | $ | 203 | | $ | 669 | | $ | 203 | |
New ROU Assets - Operating Leases | | $ | — | | $ | 411 | | $ | 1,620 | | $ | 411 | |
Weighted Average Lease Term (Years) - Operating Leases | | | | | | | | | 6.02 | | | 7.47 | |
Weighted Average Discount Rate - Operating Leases | | | | % | | | % | | 3.02 | % | | 3.07 | % |
A maturity analysis of operating lease liabilities and reconciliation of the undiscounted cash flows to the total operating lease liabilities as of June 30, 2020 is as follows:
| | | |
|
| June 30, 2020 | |
Operating lease payments due: |
| |
|
Within one year | | $ | 1,604 |
After one but within two years | |
| 1,223 |
After two but within three years | | | 1,204 |
After three but within four years | | | 1,134 |
After four years but within five years | | | 944 |
After five years | | | 1,587 |
Total undiscounted cash flows | | | 7,696 |
Discount on cash flows | | | (373) |
Total operating lease liabilities | | $ | 7,323 |
Lessor Leases
ASC 842 also impacted lessor accounting. Currently the Company does not have any lessor leases (formerly known as capital leases) to report on its financials.
Lease Termination
On June 19, 2020, the Company exercised an option to early terminate a lease for a former operational office of Marquis Bank and a branch located in Coral Gables (the “Closed Offices”). The Closed Offices were located less than one mile from the Bank’s already established Coral Gables location. The cost to exercise the option on the Closed Offices was $322.8 thousand and decreased the life of the lease by approximately 15 months. As a result of exercising the option, the lease will terminate in March 2021 as opposed to June 2022. This resulted in a savings of over $400 thousand in lease payments plus expenses. The cost of the option will be amortized through the end of the lease in March 2021.
20
NOTE 8 — BUSINESS COMBINATION
Acquisition of Marquis Bancorp, Inc.
On March 26, 2020, we closed our acquisition with Marquis Bancorp. (MBI) and its wholly owned subsidiary, Marquis Bank, headquartered in Coral Gables, Florida. Each share of MBI common stock issued and outstanding immediately prior to closing was converted into 1.2048 shares of the Company’s Class A common stock, with cash paid in lieu of fractional shares. The Company issued 4,227,816 shares of its Class A Common Stock as consideration in the acquisition. No MBI shareholders exercised appraisal rights. In addition, all stock options of MBI granted and outstanding on the closing date of the acquisition were converted into an option to purchase shares of our Class A Common Stock based on the exchange ratio.
MBI results of operations were included in the Company’s results beginning March 27, 2020. Acquisition-related costs of $0.6 and $2.2 million are included in non-interest expense in the Company’s income statement for the three and six months ended June 30, 2020 and 2019, respectively. The fair value of the Class A common shares issued as part of the consideration paid for MBI was determined on the basis of the closing price of the Company’s common shares on the acquisition date.
The acquisition of MBI was accounted for under the acquisition method in accordance with ASC Topic 805, Business Combinations. Goodwill of $14.7 million arising from the acquisition consisted of operational efficiencies and potential cost savings through consolidating and integrating MBI’s operations into the Company’s existing operations. The fair values initially assigned to assets acquired and liabilities assumed are preliminary and could change for up to one year after the closing date of the acquisition of MBI as new information and circumstances relative to closing date fair values are known. Determining the fair values of assets and liabilities, especially the loan portfolio, core deposit intangibles, and goodwill, is a complicated process involving significant judgment regarding
21
methods and assumptions used to calculate the estimated fair values. The following table summarizes the consideration paid for MBI and the estimated fair values of the assets acquired, and liabilities assumed at the date of the MBI acquisition, net of total consideration paid:
| | | |
| | Estimated | |
| | Fair Value at | |
(In thousands, except per share data) |
| March 26, 2020 | |
Number of MBI common shares outstanding |
| | 3,509,143 |
Per share exchange ratio | | | 1.2048 |
Number of shares of common stock issued | | | 4,227,816 |
Multiplied by common stock price per share on March 26, 2020 | | $ | 15.21 |
Value of common stock issued | | | 64,305 |
Cash paid in lieu of fractional shares | | | 1 |
Fair value of MBI stock options converted to PFHD options | | | 393 |
Fair value of total consideration transferred | | $ | 64,699 |
| | | |
Recognized amounts of identifiable assets acquired and liabilities assumed | | | |
Cash and cash equivalents | | $ | 26,860 |
Securities, Available for Sale | | | 27,029 |
Securities, Held to Maturity | | | 1,466 |
Loans | | | 520,606 |
Premises and equipment | | | 824 |
Accrued interest receivable | | | 1,525 |
Core deposit intangibles | | | 3,964 |
Other assets | | | 7,100 |
Total asset acquired | | | 589,374 |
| | | |
Deposits | | | 497,166 |
Federal Home Loan Bank advances | | | 25,103 |
Subordinated notes payable | | | 9,920 |
Accrued interest payable | | | 610 |
Other Liabilities | | | 6,604 |
Total liabilities assumed | | | 539,403 |
| | | |
Total identifiable net assets | | | 49,971 |
| | | |
Goodwill | | $ | 14,728 |
Acquired loans are initially recorded at their acquisition-date fair values using Level 3 inputs. Refer to Note 6, Fair Value, for a discussion of the fair value hierarchy. Fair values are based on a discounted cash flow methodology that involves assumptions and judgments as to credit risk, expected lifetime losses, environmental factors, discount rates, expected payments and expected prepayments. Specifically, the Company has prepared three separate loan fair value adjustments that it believes a market participant might employ in estimating the entire fair value adjustment necessary under ASC 820-10 for the acquired loan portfolio. The three separate fair valuation methodologies employed are: (i) an interest rate loan fair value adjustment, (ii) a general credit fair value adjustment, and (iii) a specific credit fair value adjustment for purchased credit impaired (“PCI”) loans subject to ASC 310-30 provisions. The acquired loans were recorded at fair value at the acquisition date without carryover of MBI’s previously established allowance for loan losses. The fair value of the financial assets acquired included loans receivable with a book balance, prior to fair value adjustments, of $539.9 million.
22
The table below illustrates the fair value adjustments made to the amortized cost basis to present the fair value of the loans acquired.
|
| March 26, 2020 | |
Gross principal balance | | $ | 539,855 |
Interest rate fair value adjustment on performing loans | | | 3,109 |
Credit fair value adjustment on performing loans | | | (18,242) |
Fair value adjustment on PCI loans | |
| (4,116) |
Fair value of acquired loans | | $ | 520,606 |
The credit fair value adjustment on PCI loans represents the portion of the loan balances that have been deemed uncollectible based on the Company’s expectations of future cash flows for each respective loan.
| | | |
|
| March 26, 2020 | |
Contractually required principal and interest at acquisition | | $ | 8,968 |
Contractual cash flows not expected to be collected (nonaccretable discount, includes principal and interest) | | | (4,531) |
Expected cash flows at acquisition | | | 4,437 |
Interest component of expected cash flows (accretable discount) | | | (418) |
Fair value of PCI loans accounted for under ASC-310-30 | | $ | 4,019 |
For loans acquired without evidence of credit deterioration, the Company prepared interest rate loan fair value and credit fair value adjustments. Loans were grouped into homogeneous pools by characteristics such as loan type, term, collateral and rate. Market rates for similar loans were obtained from various internal and external data sources and reviewed for reasonableness. A present value approach was utilized to calculate the interest rate fair value premium of $3.1 million. Additionally, for loans acquired without credit deterioration, a credit fair value adjustment was calculated using a two-part credit fair value analysis: (i) expected lifetime credit migration losses, and (ii) estimated fair value adjustment for certain qualitative factors. A credit fair value discount of $18.2 million was determined. Both the interest rate and credit fair value adjustments related to loans acquired without evidence of credit deterioration will be recognized as interest income over the expected life of the loans.
For PCI loans, acquired with evidence of credit deterioration, the Company prepared a specific credit risk fair value adjustment in accordance with ASC 310-30. The fair value adjustment of $4.1 million represents the present value of expected cash flows at market participant discount rates in accordance with ASC 310-30. This fair value adjustment was segregated into 2 pieces: (i) non-accretable discount which represents the portion of the loan balances that has been deemed uncollectible of $4.5 million, and (ii) accretable discount of $0.4 million which would represent an adjustment for the expected future cash flows discounted at a market participant discount rate. The accretable discount will be recognized on a level yield basis.
The fair value of the core deposit intangible was determined based on a discounted cash flow method using a discount rate commensurate with market participants. To calculate cash flows, the sum of deposit account servicing costs (net of deposit fee income) and interest expense on deposits was compared to the cost of alternative funding sources available to the Company. The expected cash flows of the deposit base included estimated attrition rates. The core deposit intangible asset was valued at $4.0 million and will be amortized over ten years using the sum-of-the years digit method.
The fair value adjustment for time deposits represents a discount from the value of the contractual repayments of fixed-maturity deposits using prevailing market interest rates for similar-term time deposits. The time deposit was valued at $1.8 million is being amortized into income on a level yield amortization method over the contractual life of the deposits.
The fair value adjustment of FHLB advances was determined based upon an estimated fair value received from the FHLB Atlanta. The FHLB advances was valued at $0.1 million and will be amortized into the remaining life of the Advances.
The fair value of subordinated debt was determined by using a discounted cash flow method using a market participant discount rate for similar instruments. The subordinated debt was fair valued at a discount of $80 thousand and will be amortized over the expected life of the debt.
In connection with the acquisition of MBI, the Company recorded a net deferred income tax asset of $3.4 million related to MBI’s effects of fair value adjustments resulting from applying the purchase method of accounting.
23
The following table presents supplemental pro-forma information as if the acquisition had occurred at the beginning of 2019. The pro-forma financial information is not necessarily indicative of the results of operations that would have occurred had the transactions been effected on January 1, 2019.
| | Three months ended | | Six months ended | ||
(In thousands, except per share data) |
| June 30, 2019 | | June 30, 2019 | ||
Net interest income | | $ | 8,142 | | $ | 16,398 |
Net income | |
| 1,347 | |
| 2,867 |
EPS - basic | | $ | 0.23 | | $ | 0.48 |
EPS - diluted | | $ | 0.22 | | $ | 0.47 |
NOTE 9 — SUBSEQUENT EVENTS
Coex Coffee International Inc.
The Company learned on July 15, 2020 that one of its borrowers, Coex Coffee International Inc. (“Coex”), filed a Petition Commencing an Assignment for the Benefit of Creditors in the 11th Judicial Circuit Court in Miami-Dade County, Florida. Coex is primarily in the business of purchasing and selling green coffee beans. Coex has financed its business through various credit facilities from ten financial institutions in an amount totaling $191.9 million. The Company currently has a total of thirty-one (31) advances to Coex for the purchase of coffee from growers for periods of up to 90 days with an aggregate outstanding balance of $12.4 million. However, $4.1 million has been participated out without recourse to another financial institution leaving the Company with a current balance of $8.3 million as of July 10, 2020. The loans are required to be over-collateralized. While at the time of petition, the advances were current, through court documents and legal inquiry (by the Company’s counsel), the Company is presently investigating the status of its security and collateral. The situation remains fluid and as more information is obtained by the Company, we will evaluate the status and reserve associated with this loan. As part of our evaluation of the Coex credit, the Company classified $8.9 million as performing substandard as of June 30, 2020.
Item 2. Management’s Discussion and Analysis of Financial Condition and Results of Operations.
The following is Management’s Discussion and Analysis of the Financial Condition and Results of Operations (“MD&A”) of Professional Holding Corp. (the “Company”) for the three and six months ended June 30, 2020. This MD&A should be read in conjunction with the financial statements above and with the Company’s Annual Report on Form 10-K for the year ended December 31, 2019 (the “2019 Form 10-K”) and Form 10-Q for the quarter ended March 31, 2020 (the “First Quarter 10-Q”).
Cautionary Note Regarding Forward Looking Information
This Quarterly Report on Form 10-Q contains certain forward-looking statements, as defined in Section 27A of the Securities Act of 1933, as amended (the “Securities Act”), and Section 21E of the Securities Exchange Act of 1934, as amended (the “Exchange Act”). Such forward-looking statements reflect our current opinions, expectations, beliefs, plans, objectives, assumptions or projections regarding, among other things, future events or future results, in contrast with statements that reflect historical facts. These statements are often, but not always, made through the use of conditional words such as “anticipate,” “intend,” “believe,” “estimate,” “plan,” “seek,” “project” or “expect,” “may,” “will,” “would,” “could” or “should” or the negative versions of these terms or other comparable terminology. These forward-looking statements are not historical facts, and are based on current expectations, estimates and projections about our industry, management’s beliefs and certain assumptions made by management, many of which, by their nature, are inherently uncertain and beyond our control. Accordingly, we caution you that any such forward-looking statements are not guarantees of future performance and are subject to risks, assumptions and uncertainties that are difficult to predict. Although we believe that the expectations reflected in these forward-looking statements are reasonable as of the date made, actual results may prove to be materially different from the results expressed or implied by the forward-looking statements.
Important factors related to forward-looking statements may include, among others, risks and assumptions regarding:
| ● | the duration and severity of the COVID 19 pandemic, both in our principal area of operations and nationally, and the impact of the pandemic, including the government’s responses to the pandemic, on our and our customers’ operations, personnel, and business activity (including developments and volatility), as well as the pandemic’s impact on the credit quality of our loan portfolio and on financial market and general economic conditions. |
24
| ● | the strength of the United States economy in general and the strength of the local economies in which we conduct operations; |
| ● | the effects of our lack of a diversified loan portfolio and concentration in the South Florida market, including the risks of geographic, depositor, and industry concentrations, including our concentration in loans secured by real estate; |
| ● | the frequency and magnitude of foreclosure of our loans; |
| ● | changes in the securities, real estate markets and commodities markets (including fluctuations in the price of coffee or oil); |
| ● | our ability to successfully manage interest rate risk, credit risk, liquidity risk, and other risks inherent to our industry; |
| ● | the accuracy of our financial statement estimates and assumptions, including the estimates used for our loan loss reserve and deferred tax asset valuation allowance; |
| ● | increased competition and its effect on pricing of our products and services as well as our margins; |
| ● | legislative or regulatory changes; |
| ● | potential business uncertainties as we integrate MBI into our operations, including into our operations critical accounting estimates; |
| ● | our ability to comply with the extensive laws and regulations to which we are subject, including the laws for each jurisdiction where we operate; |
| ● | the Bank’s ability to make cash distributions to us and our ability to declare and pay dividends, the payment of which is subject to our capital and other requirements; |
| ● | changes in accounting principles, policies, practices or guidelines, including the effects of forthcoming CECL implementation; |
| ● | our ability to fund and manage our growth, both organic growth as well as growth through other means, such as future acquisitions; |
| ● | negative publicity and the impact on our reputation; |
| ● | our ability to attract and retain highly qualified personnel; |
| ● | technological changes; |
| ● | cybersecurity risks including security breaches, computer viruses, and data processing system failures and errors; |
| ● | our ability to manage operational risks, including, but not limited to, client, employee, or third-party fraud; |
| ● | changes in monetary and fiscal policies of the U.S. Government and the Federal Reserve; |
| ● | inflation, interest rate, unemployment rate, market, and monetary fluctuations; |
| ● | the efficiency and effectiveness of our internal control environment; |
| ● | the ability of our third-party service providers to continue providing services to us and clients without interruption; |
| ● | geopolitical developments; |
25
| ● | the effects of harsh weather conditions, including hurricanes, and other natural disasters (including pandemics such as COVID-19) man-made disasters; |
| ● | potential business interruptions from catastrophic events such as terrorist attacks, active shooter situations, and advanced persistent threat groups; |
| ● | the willingness of clients to accept third-party products and services rather than our products and services and vice versa; |
| ● | changes in consumer spending and saving habits; |
| ● | growth and profitability of our noninterest income; and |
| ● | anti-takeover provisions under federal and state law as well as our governing documents. |
If one or more events related to these or other risks or uncertainties materialize or intensify, or if our underlying assumptions prove to be incorrect, actual results may differ materially from what we anticipate. Accordingly, you are cautioned not to place undue reliance on these forward-looking statements. The forward-looking statements included in this prospectus are made only as of the date of the Quarterly Report on Form 10-Q. New factors emerge from time to time, and it is not possible for us to predict which will arise. We do not undertake, and specifically decline, any obligation to update any such statements or to publicly announce the results of any revisions to any of such statements to reflect future events or developments, except as may be required by law.
Executive Overview
Highlights of our performance and financial condition as of and for the three and six months ended June 30, 2020 and other key events that have occurred during 2020 are provided below.
Results of Operations for the three months ended June 30, 2020
| ● | Net interest income was $16.3 million, an increase of $9.5 million, or 139.7%, compared to the same period in 2019. |
| ● | For the current quarter, net income was $3.1 million compared to $0.5 million for the same period in 2019. Pre-tax pre-provision net income (non-GAAP, see explanation of Certain unaudited non-GAAP Financial Measures) was $5.7 million for the quarter, an increase of $6.1 million compared to a loss of ($0.6) million in the previous quarter, and a 375% increase compared to the $1.2 million during the same period in 2019. |
| ● | Noninterest income totaled $1.0 million for the second quarter 2020 unchanged from the second quarter 2019. |
| ● | Noninterest expense totaled $11.5 million, an increase of $5.0 million, or 76.9%, compared to the same period in 2019. Increases in employee headcount and MBI acquisition expenses were primarily responsible for the increase. |
Results of Operations for the six months ended June 30, 2020
| ● | Net income of $1.8 million, an increase of $1.0 million, or 112.4%, compared to the same period in 2019. |
| ● | Net interest income of $24.4 million, an increase of $11.0 million, or 82.4%, compared to the same period in 2019. This increase was primarily due to loan growth, partially offset by an increase in total deposits. |
| ● | Provision for loan losses was $2.6 million, an increase of approximately $2.2 million, or 579.3%, compared to the same period in 2019. The increase from 2019 to 2020 was due to reserving additional provisions for the increase in loan growth coupled with the deterioration of the macroeconomic environment. |
| ● | Noninterest income totaled $1.8 million, an increase of $0.5 million, or 42.2%, compared to the same period in 2019. This increase was primarily due to increased service charges on deposit accounts and an increase in our SWAP referral fees. |
26
| ● | Noninterest expense of $21.0 million, which represented an increase of $8.0 million, or 61.2%, compared to the same period in 2019. This increase was primarily due to increased employee headcount and acquisition expenses. |
Financial Condition
| ● | Total assets increased to $2.0 billion, which represented an increase of $978.6 million, or 92.9%, compared to December 31, 2019. This increase was largely attributable to the completion of the acquisition of MBI and our participation in the SBA Paycheck Protection Program (PPP) funding. New loan originations were $62.6 million for the quarter, compared to $65.2 million the prior quarter, excluding PPP loans. Net new, non-PPP loan growth was relatively flat, with a modest $2.0 million increase. |
| ● | Processed, closed and funded more than 1,400 PPP loans representing $224.0 million in relief proceeds. The majority of these loans have been pledged to the Federal Reserve as part of the Paycheck Protection Program Liquidity Facility (PPPLF). The amount pledged as of July 10, 2020 was $223.4 million. |
| ● | Net loans increased to $1.6 billion, an increase of $774.7 million, or 98.7%, compared to December 31, 2019. We experienced growth across all loan types due to new organic origination, the MBI merger in the first quarter, and participation in the Payroll Protection Program. |
| ● | Nonperforming assets totaled $6.2 million, which includes seven loans classified as nonperforming and accruing over 90 days past due. There were three loans classified as nonperforming and no loans accruing loans over 90 days past due as of December 31, 2019. |
| ● | The Company maintained its strong capital position. As of June 30, 2020, we were well-capitalized, with a total risk-based capital ratio of 16.0%, a tier 1 risk-based capital ratio of 14.3%, a common equity tier 1 capital ratio of 10.5%, and a leverage ratio of 14.3%. As of December 31, 2019, all of our regulatory capital ratios exceeded the thresholds to be well-capitalized under the applicable bank regulatory requirements. |
| ● | Lending activity for the six months ended June 30, 2020 included new originations (including PPP) of $0.3 million, acquisitions of $0.5 million offset by net paybacks and advances of approximately $15 thousand. |
COVID-19 Operational Response and Bank Preparedness
The outbreak of the novel coronavirus COVID-19, which was declared a pandemic by the World Health Organization on March 11, 2020, has led to adverse impacts on the global economy and created uncertainty in the world’s financial markets.
In early March 2020, the Company began preparing for potential disruptions and government limitations of activity relating to the COVID-19 pandemic. Preparations included: (i) conducting COVID-19 testing, (ii) publishing a “work from home” guide for our employees, (iii) phasing in remote operations with a focus on employee safety, redundancy, and business continuity, and (iv) hardware upgrades. The hardware upgrades included increased mobile/laptop capabilities, increased VPN licenses & bandwidth, and expanded technologies for video and conference line functionality.
The Company issued multi-level communications including the reinforcement of best practices with staff and clients about business and safety precautions and escalation procedures. Steps were taken to reduce branch traffic; additionally, all non-client facing employees are working remotely. Policies and Procedures have been established to (i) take immediate precautionary steps with any employee exposed to COVID-19 and (ii) for the eventual safe and orderly return to the office. The policy and procedures incorporate social distancing procedures and alternating in-office schedules. Branches are given regularly scheduled deep cleanings to ensure workspaces are safe for our employees and clients. In February 2020, 95% of our employees were working in the office and 5% were working remotely. On, July 10, 2020, approximately 20% of our employees were working in the office and 80% working remotely.
In response to the COVID 19 pandemic we have:
| ● | Participated in the SBA Paycheck Protection Program. As of July 10, 2020, we have approved more than 1,400 loans representing over $225 million in relief proceeds. These loans as of July 10, 2020 have been pledged to the Federal Reserve as part of the Paycheck Protection Program Liquidity Facility (PPPLF). The PPPLF pledged loans are non-recourse to the Bank. |
| ● | We added an online PPP application form and automated the PPP loan closing documentation process. |
27
| ● | As of July 10, 2020, we have reviewed and processed 181 debt service relief requests in accordance with Section 4013 of the CARES Act and the Interagency guidelines published on March 13, 2020. As currently interpreted by the agencies, the guidelines assert that short-term modifications made on good faith for reasons related to the COVID-19 pandemic to borrowers who were current prior to such relief are not considered troubled debt restructurings. These modifications include deferrals of principal and interest, modification to interest only, and deferrals to escrow requirements. The modifications have varying terms up to six months. As of July 10, 2020, 13.1% of all loans have been approved for modification. Payment deferrals represent 7.6% of all loans and are comprised of 62 residential real estate loans totaling $43.4 million, 16 loans secured by owner occupied commercial real estate totaling $21.2 million, 20 loans collateralized by non-owner occupied commercial real estate totaling $36.2 million and 5 commercial and industrial loans totaling $2.6 million. |
| ● | To manage credit risk, the Company increased oversight and analysis of $44.1 million of loans to borrowers in vulnerable industries such as hotels and hospitality. As of July 10, 2020, $30.7 million of these loans where provided payment relief consistent with Section 4013 of the CARES Act and the Interagency Guidelines published on March 13, 2020 and are performing under the terms of those modifications. The remaining loans in this group continue to perform according to their terms. |
The economic effects of the COVID-19 pandemic have significantly impacted business and economic activity in the U.S. and around the world. There have been full and partial business closures, increases in unemployment as workers are furloughed, laid off, or had hours limited. Such disruptions could adversely affect our loan and deposit fee income as well as create downward pressure on the quality of our loan portfolio possibly leading to an increase in loan charge-offs.
The COVID-19 pandemic is an unprecedented event that has created high levels of uncertainty. We are vigilantly monitoring global events and actions being taken by various Federal and State Agencies. We have maintained interim periodic communications with our regulators and have not experienced any material deposit outflows to date and frequently communicate with our credit clients.
Given the fluidity of the situation, management cannot predict the long-term impact of the COVID-19 pandemic on the Company for the remainder of 2020 or beyond.
Results of Operations for the Three Months Ended June 30, 2020 and 2019
Net Income
The following table sets forth the principal components of net income for the periods indicated.
| | | | | | | | | |
| | Three Months Ended June 30, |
| ||||||
(Dollars in thousands) |
| 2020 |
| 2019 |
| Change |
| ||
Interest income | | $ | 18,522 | | $ | 9,498 |
| 95.0 | % |
Interest expense | |
| 2,231 | |
| 2,667 |
| (16.3) | % |
Net Interest income | |
| 16,291 | |
| 6,831 |
| 138.5 | % |
Provision for loan losses | |
| 1,750 | |
| 495 |
| (253.5) | % |
Net interest income after provision | |
| 14,541 | |
| 6,336 |
| 129.5 | % |
Noninterest income | |
| 968 | |
| 923 |
| 4.9 | % |
Noninterest expense | |
| 11,548 | |
| 6,537 |
| 76.7 | % |
Income before income taxes | |
| 3,961 | |
| 722 |
| 448.6 | % |
Income tax expense | |
| 830 | |
| 223 |
| (272.2) | % |
Net income | | $ | 3,131 | | $ | 499 |
| 527.5 | % |
Net income for the three months ended June 30, 2020 was $3.1 million, an increase of $2.6 million, or 527.5%, from net income for the three months ended June 30, 2019 of $0.5 million. Interest income increased $9.0 million while interest expense decreased $0.4 million, resulting in a net interest income increase of $9.5 million for the three months ended June 30, 2020 compared to the same period in the prior year. The increase in our interest income was primarily due to our growth and yield from our loan portfolio. Provision for loan losses increased by $1.3 million for the three months ended June 30, 2020 compared to the same period in the prior year. The increased provision was intended to address the elevated credit risk levels related to the COVID-19 pandemic. The increase in noninterest expense for the three months ended June 30, 2020 compared to the same period in the prior year was primarily a result of increased employee headcount and acquisition expenses.
28
Net Interest Income and Net Interest Margin Analysis
We analyze our ability to maximize income generated from interest earning assets and control the interest expenses associated with our liabilities, measured as net interest income, through our net interest margin and net interest spread. Net interest income is the difference between the interest and fees earned on interest earning assets, such as loans and securities, and the interest expense paid on interest bearing liabilities, such as deposits and borrowings, which are used to fund those assets. Net interest margin is a ratio calculated as annualized net interest income divided by average interest earning assets for the same period. Net interest spread is the difference between average interest rates earned on interest earning assets and average interest rates paid on interest-bearing liabilities.
Changes in market interest rates and the interest rates we earn on interest earning assets or pay on interest-bearing liabilities, as well as in the volume and types of interest earning assets, interest bearing and noninterest-bearing liabilities and shareholders’ equity, are usually the largest drivers of periodic changes in net interest income, net interest margin and net interest spread. Fluctuations in market interest rates are driven by many factors, including governmental monetary policies, inflation, deflation, macroeconomic developments, changes in unemployment rates, the money supply, political and international conditions and conditions in domestic and foreign financial markets. Periodic changes in the volume and types of loans in our loan portfolio are affected by, among other factors, the economic and competitive conditions in the Miami-Dade MSA, as well as developments affecting the real estate, technology, government services, hospitality and tourism and financial services sectors within the Miami-Dade MSA. Our ability to respond to changes in these factors by using effective asset-liability management techniques is critical to maintaining the stability of our net interest income and net interest margin as our primary sources of earnings.
The following table shows the average outstanding balance of each principal category of our assets, liabilities and shareholders’ equity, together with the average yields on our assets and the average costs of our liabilities for the periods indicated. Such yields and costs are calculated by dividing the annualized income or expense by the average daily balances of the corresponding assets or liabilities for the same period.
| | For the Three Months Ended June 30, | |||||||||||||||
| | 2020 | | 2019 | | ||||||||||||
|
| Average |
| Interest |
| |
| Average |
| Interest |
| |
| ||||
| | Outstanding | | Income/ | | Average | | Outstanding | | Income/ | | Average | | ||||
(Dollars in thousands) | | Balance | | Expense(4) | | Yield/Rate | | Balance | | Expense(4) | | Yield/Rate | | ||||
Assets |
| |
|
| |
|
|
|
| |
|
| |
|
|
|
|
Interest earning assets |
| |
|
| |
|
|
|
| |
|
| |
|
|
|
|
Interest-bearing deposits | | $ | 170,658 | | $ | 44 |
| 0.10 | % | $ | 65,671 | | $ | 403 |
| 2.49 | % |
Federal funds sold | |
| 32,965 | |
| 12 |
| 0.15 | % |
| 23,723 | |
| 152 |
| 2.60 | % |
Federal Reserve Bank stock, FHLB stock and other corporate stock | |
| 7,598 | |
| 131 |
| 6.93 | % |
| 4,291 | |
| 70 |
| 6.62 | % |
Investment securities | |
| 109,338 | |
| 438 |
| 1.61 | % |
| 28,930 | |
| 161 |
| 2.26 | % |
Loans(1) | |
| 1,501,590 | |
| 17,897 |
| 4.79 | % |
| 673,884 | |
| 8,712 |
| 5.24 | % |
Total interest earning assets | |
| 1,822,149 | |
| 18,522 |
| 4.09 | % |
| 796,499 | |
| 9,498 |
| 4.84 | % |
Noninterest earning assets | |
| 102,663 | |
|
|
| | |
| 47,026 | |
|
|
|
| |
Total assets | |
| 1,924,812 | |
|
|
| | |
| 843,525 | |
|
|
|
| |
Liabilities and shareholders’ equity | |
|
| |
|
|
| | |
|
| |
|
|
|
| |
Interest-bearing liabilities | |
|
| |
|
|
| | |
|
| |
|
|
|
| |
Interest-bearing deposits | |
| 994,972 | |
| 1,617 |
| 0.65 | % |
| 543,668 | |
| 2,398 |
| 1.79 | % |
Borrowed funds | |
| 230,516 | |
| 614 |
| 1.07 | % |
| 45,055 | |
| 269 |
| 2.42 | % |
Total interest-bearing liabilities | |
| 1,225,488 | |
| 2,231 |
| 0.73 | % |
| 588,723 | |
| 2,667 |
| 1.84 | % |
Noninterest-bearing liabilities | |
|
| |
|
|
| | |
|
| |
|
|
|
| |
Noninterest-bearing deposits | |
| 475,613 | |
|
|
| | |
| 162,269 | |
|
|
|
| |
Other noninterest-bearing liabilities | |
| 19,540 | |
|
|
| | |
| 12,438 | |
|
|
|
| |
Shareholders’ equity | |
| 204,171 | |
|
|
| | |
| 80,095 | |
|
|
|
| |
Total liabilities and shareholders’ equity | | $ | 1,924,812 | |
|
|
| | | $ | 843,525 | |
|
|
|
| |
Net interest spread(2) | |
|
| |
|
|
| 3.36 | % |
|
| |
|
|
| 3.00 | % |
Net interest income | |
|
| | $ | 16,291 |
| | |
|
| | $ | 6,831 |
|
| |
Net interest margin(3) | |
|
| |
|
|
| 3.60 | % |
|
| |
|
|
| 3.48 | % |
| (1) | Includes nonaccrual loans. |
| (2) | Net interest spread is the difference between interest rates earned on interest earning assets and interest rates paid on interest-bearing liabilities. |
| (3) | Net interest margin is a ratio of net interest income to average interest earning assets for the same period. |
| (4) | Interest income on loans includes loan fees of $891 thousand and $148 thousand for the three months ended June 30, 2020 and 2019, respectively. |
29
The following table presents information regarding the dollar amount of changes in interest income and interest expense for the periods indicated for each major component of interest earning assets and interest-bearing liabilities and distinguishes between the changes attributable to changes in volume and changes attributable to changes in interest rates. For purposes of this table, changes attributable to both rate and volume that cannot be segregated have been proportionately allocated to both volume and rate.
| | | | | | | | | |
| | For the Three Months Ended June 30, 2020 | |||||||
| | Compared to 2019 | |||||||
| | Change Due To | | | | ||||
(Dollars in thousands) |
| Volume |
| Rate |
| Total | |||
Interest income |
| |
|
| |
|
| |
|
Interest-bearing deposits | | $ | 643 | | $ | (1,002) | | $ | (359) |
Federal funds sold | |
| 60 | |
| (200) | |
| (140) |
Federal Reserve Bank stock, Federal Home Loan Bank stock and other corporate stock | |
| 54 | |
| 7 | |
| 61 |
Investment securities | |
| 448 | |
| (171) | |
| 277 |
Loans | |
| 10,701 | |
| (1,516) | |
| 9,185 |
Total | | $ | 11,906 | | $ | (2,882) | | $ | 9,024 |
Interest expense | |
|
| |
|
| |
|
|
Interest-bearing deposits | |
| 1,991 | |
| (2,772) | |
| (781) |
Borrowed funds | |
| 1,106 | |
| (761) | |
| 345 |
Total | | $ | 3,097 | | $ | (3,533) | | $ | (436) |
Net interest income increased by $9.5 million to $16.3 million for the three months ended June 30, 2020 compared to the three months ended June 30, 2019. Our total interest income was impacted by an increase in interest earning assets, primarily due to growth in our loan portfolio. Average total interest earning assets were $1.8 billion for the three months ended June 30, 2020 compared with $0.8 billion for the three months ended June 30, 2019. The annualized yield on those interest earning assets decreased 75 basis points from 4.84% for the three months ended June 30, 2019 to 4.09% for the three months ended June 30, 2020 due to the recent reductions in the federal funds target interest rates by the Federal Reserve. Our yield on interest earning assets declined during the second quarter of 2020, which was partially offset by lower interest expense on our interest-bearing deposits. The increase in the average balance of interest earning assets was driven almost entirely by growth in our loan portfolio of $844.1 million, representing an increase of 117.9%, to $1.6 billion for the three months ended June 30, 2020 compared to $715.8 million for the three months ended June 30, 2019.
Average interest-bearing liabilities increased by $636.8 million, or 108.2%, from $588.7 million for the three months ended June 30, 2019 to $1.2 billion for the three months ended June 30, 2020. The increase was primarily due to a $451.3 million increase in the average balance of interest-bearing deposits, or 83.0%. The increase in the average balance of interest-bearing deposits was primarily due to increases in certificates of deposit and money market accounts for the three months ended June 30, 2020 compared to the three months ended June 30, 2019, and, to a lesser extent, negotiable order of withdrawal accounts, or NOW accounts. The annualized average interest rate paid on average interest-bearing liabilities decreased to 0.73% for the three months ended June 30, 2020 compared to 1.84% for the three months ended June 30, 2019, annualized average interest rate paid on interest-bearing deposits decreased 114 basis points to 0.65% and the annualized average interest rate paid on borrowed funds decreased by 135 basis points to 1.07%. The decreases in annualized average interest rates primarily reflected a decrease in market interest rates due to decreases in the federal funds target interest rate during the three months ended June 30, 2020. For the three months ended June 30, 2020, our average other noninterest-bearing liabilities increased $7.1 million, or 57.1%, to $19.5 million from $12.4 million during the three months ended June 30, 2019. Average noninterest-bearing deposits also increased $313.3 million, or 193.1%, from $162.3 million to $475.6 million for the same periods. For the three months ended June 30, 2020, our annual net interest margin was 3.60% and net interest spread was 3.36%. For the three months ended June 30, 2019, annual net interest margin was 3.48% and net interest spread was 3.00%. Our net interest margin was positively affected by 0.12% during the three months ended June 30, 2020, compared to the same period in 2019 because rates paid on our interest-bearing deposits, our primary funding source, decreased greater than loan yields, which were also adversely impacted due to falling yields on 10-year treasury notes. As a result of the recent reductions in the federal funds target interest rates as well as continued declines in the 10-year treasury yield, average rates earned on interest earning assets and average rates paid on our interest-bearing deposits generally declined during the three months ended June 30, 2020. Correspondingly new loans were priced at lower yields in comparison to previously held loans which led to numerous loan payoffs in 2020 compared to 2019.
30
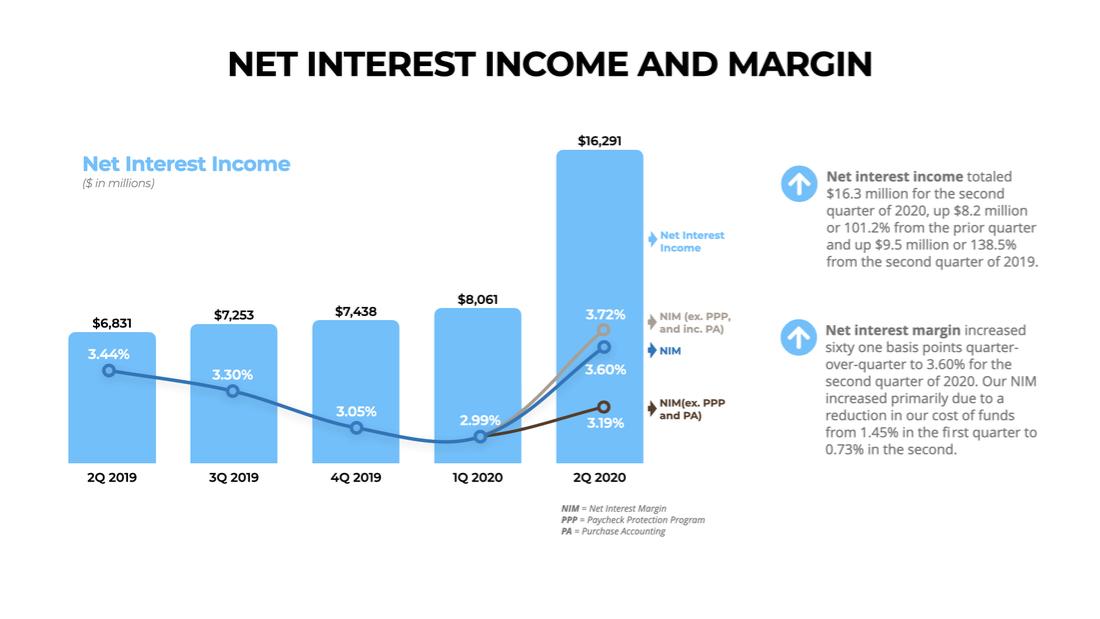
Provision for Loan Losses
The provision for loan losses is a charge to income in order to bring our allowance for loan losses to a level deemed appropriate by management. For a description of the factors taken into account by our management in determining the allowance for loan losses see “Management’s Discussion and Analysis of Financial Condition and Results of Operations - Allowance for Loan Losses.”
Our provision for loan losses amounted to $1.8 million for the three months ended June 30, 2020 and $0.5 million for the three months ended June 30, 2019. The increase from 2019 to 2020 was due to reserving additional provisions to address the elevated credit risk levels related to the COVID-19 pandemic. Our allowance for loan losses as a percentage of total loans (excluding PPP loans) was 0.67% at June 30, 2020 compared to 0.83% at December 31, 2019. The decrease was primarily the result of extraordinary loan growth from the acquisition. The acquired loans were recorded at fair value at the acquisition date without carryover of MBI’s previously established allowance for loan losses. The fair value marks on acquired loans include credit losses. We recorded one net charge-off for $0.1 million for the three months ended June 30, 2020. We did not record any net charge-offs for the three months ended June 30, 2019.
Noninterest Income
Our primary sources of recurring noninterest income are service charges on deposit accounts, mortgage banking revenue, interest rate swap referral fees, origination fees for Small Business Administration, or SBA loans, and other fees and charges. Noninterest income does not include loan origination fees to the extent they exceed the direct loan origination costs, which are generally recognized over the life of
31
the related loan as an adjustment to yield using the interest method. The following table presents the major categories of noninterest income for the periods indicated.
| | | | | | | | | |
| | Three Months Ended June 30, | | ||||||
(Dollars in thousands) |
| 2020 |
| 2019 |
| Increase (Decrease) |
| ||
Noninterest income |
| |
|
| |
|
|
|
|
Deposit account service charges | | $ | 307 | | $ | 281 | | 9.3 | % |
Mortgage banking revenue | |
| 225 | |
| 34 | | 561.8 | % |
Gain on sale of securities | |
| 11 | |
| 3 | | 266.7 | % |
Swap referral fees | |
| 210 | |
| 465 | | (54.8) | % |
SBA origination fees | |
| 114 | |
| 64 | | 78.1 | % |
Other fees and charges | | | 101 | | | 76 | | 32.9 | % |
Total noninterest income | | $ | 968 | | $ | 923 | | 4.9 | % |
Noninterest income for the three months ended June 30, 2020 was $1.0 million, a $0.04 million or 4.9% increase compared to noninterest income of $0.9 million for the three months ended June 30, 2019. The increase was primarily due to an increase in mortgage banking revenues, of $0.2 million, or 561.8%, during the three months ended June 30, 2020 compared to the three months ended June 30, 2019 due to selling fixed long-term mortgages to third party investors.
Noninterest Expense
Generally, noninterest expense is composed of all employee expenses and costs associated with operating our facilities, obtaining and retaining client relationships and providing banking services. The largest component of noninterest expense is salaries and employee benefits. Noninterest expense also includes operational expenses, such as occupancy and equipment expenses, professional fees, data processing expenses, advertising expenses, loan processing expenses and other general and administrative expenses, including FDIC assessments, communications, travel, meals, training, supplies and postage. The following table presents the major categories of noninterest expense for the periods indicated.
| | | | | | | | | |
| | Three Months Ended June 30, | | ||||||
| | | | | | | | Increase | |
(Dollars in thousands) |
| 2020 |
| 2019 |
| (Decrease) |
| ||
Noninterest expense |
| |
|
| |
|
|
|
|
Salaries and employee benefits | | $ | 6,912 | | $ | 4,558 | | 51.6 | % |
Occupancy and equipment | |
| 1,081 | |
| 602 | | 79.6 | % |
Data processing | |
| 421 | |
| 162 | | 159.9 | % |
Marketing | |
| 151 | |
| 133 | | 13.5 | % |
Professional fees | |
| 806 | |
| 307 | | 162.5 | % |
Acquisition expenses | | | 560 | | | — | | 100.0 | % |
Regulatory assessments | | | 300 | | | 145 | | 106.9 | % |
Other | | | 1,317 | | | 630 | | 109.0 | % |
Total noninterest expense | | $ | 11,548 | | $ | 6,537 | | 76.7 | % |
Noninterest expense amounted to $11.5 million for the three months ended June 30, 2020, an increase of $5.0 million, or 76.7%, compared to $6.5 million for the three months ended June 30, 2019. The increase was primarily due to the acquisition expenses and an increase in salaries and benefits from increased employee headcount, increases in occupancy and equipment expense due to the opening of two new branches and the digital innovation center, and professional services expense due to costs related to building the organizational infrastructure of a publicly traded company.
Income Tax Expense
The amount of income tax expense we incur is influenced by the amounts of our pre-tax income, and other nondeductible expenses. Deferred tax assets and liabilities are reflected at current income tax rates in effect for the period in which the deferred tax assets and liabilities are expected to be realized or settled. As changes in tax laws or rates are enacted, such as the Tax Act, deferred tax assets and liabilities are adjusted through the provision for income taxes. Valuation allowances are established when necessary to reduce deferred tax assets to the amount expected to be realized.
32
Income tax provision was $0.8 million for the three months ended June 30, 2020 compared to $0.2 million for the three months ended June 30, 2019. Our effective tax rates for those periods were 21.0% and 30.9%, respectively. The decrease in the effective tax rate was primarily due to the increase in tax-exempt interest income and the retroactive reduction of the 2018 Florida income tax rate, as well as the decrease in non-deductible expenses.
Results of Operations for the Six Months Ended June 30, 2020 and 2019
Net Income
The following table sets forth the principal components of net income for the periods indicated.
| | | | | | | | | |
| | Six Months Ended June 30, |
| ||||||
(Dollars in thousands) |
| 2020 |
| 2019 |
| Change |
| ||
Interest income | | $ | 29,542 | | $ | 18,270 |
| 61.7 | % |
Interest expense | |
| 5,190 | |
| 4,918 |
| 5.5 | % |
Net Interest income | |
| 24,352 | |
| 13,352 |
| 82.4 | % |
Provision for loan losses | |
| 2,595 | |
| 382 |
| (579.3) | % |
Net interest income after provision | |
| 21,757 | |
| 12,970 |
| 67.7 | % |
Noninterest income | |
| 1,824 | |
| 1,283 |
| 42.2 | % |
Noninterest expense | |
| 21,034 | |
| 13,047 |
| 61.2 | % |
Income before income taxes | |
| 2,547 | |
| 1,206 |
| 111.2 | % |
Income tax expense | |
| 733 | |
| 352 |
| (108.2) | % |
Net income | | $ | 1,814 | | $ | 854 |
| 112.4 | % |
Net income for the six months ended June 30, 2020 was $1.8 million, an increase of $1.0 million, or 112.4%, from net income for the six months ended June 30, 2019 of $0.9 million. Interest income increased $11.3 million while interest expense increased $0.3 million, resulting in a net interest income increase of $11.0 million for the six months ended June 30, 2020 compared to the same period in the prior year. The increase in our interest income was primarily due to our growth and yield from our loan portfolio. Provision for loan losses increased by $2.2 million for the six months ended June 30, 2020 compared to the same period in the prior year. The increased provision was intended to address the elevated credit risk levels related to the COVID-19 pandemic. Noninterest income increased $0.5 million and noninterest expense increased $8.0 million for the six months ended June 30, 2020 compared to the same period in the prior year. The increase in noninterest expense for the six months ended June 30, 2020 compared to the same period in the prior year was primarily a result of increased employee headcount and acquisition expenses.
Net Interest Income and Net Interest Margin Analysis
We analyze our ability to maximize income generated from interest earning assets and control the interest expenses associated with our liabilities, measured as net interest income, through our net interest margin and net interest spread. Net interest income is the difference between the interest and fees earned on interest earning assets, such as loans and securities, and the interest expense paid on interest bearing liabilities, such as deposits and borrowings, which are used to fund those assets. Net interest margin is a ratio calculated as annualized net interest income divided by average interest earning assets for the same period. Net interest spread is the difference between average interest rates earned on interest earning assets and average interest rates paid on interest-bearing liabilities.
Changes in market interest rates and the interest rates we earn on interest earning assets or pay on interest-bearing liabilities, as well as in the volume and types of interest earning assets, interest bearing and noninterest-bearing liabilities and shareholders’ equity, are usually the largest drivers of periodic changes in net interest income, net interest margin and net interest spread. Fluctuations in market interest rates are driven by many factors, including governmental monetary policies, inflation, deflation, macroeconomic developments, changes in unemployment rates, the money supply, political and international conditions and conditions in domestic and foreign financial markets. Periodic changes in the volume and types of loans in our loan portfolio are affected by, among other factors, the economic and competitive conditions in the Miami-Dade MSA, as well as developments affecting the real estate, technology, government services, hospitality and tourism and financial services sectors within the Miami-Dade MSA. Our ability to respond to changes in these factors by using effective asset-liability management techniques is critical to maintaining the stability of our net interest income and net interest margin as our primary sources of earnings.
The following table shows the average outstanding balance of each principal category of our assets, liabilities and shareholders’ equity, together with the average yields on our assets and the average costs of our liabilities for the periods indicated. Such yields and costs
33
are calculated by dividing the annualized income or expense by the average daily balances of the corresponding assets or liabilities for the same period.
| | | | | | | | | | | | | | | | | |
| | For the Six Months Ended June 30, | |||||||||||||||
| | 2020 | | 2019 | | ||||||||||||
|
| Average |
| Interest |
| |
| Average |
| Interest |
| |
| ||||
| | Outstanding | | Income/ | | Average | | Outstanding | | Income/ | | Average | | ||||
(Dollars in thousands) | | Balance | | Expense(4) | | Yield/Rate | | Balance | | Expense(4) | | Yield/Rate | | ||||
Assets |
| |
|
| |
|
|
|
| |
|
| |
|
|
|
|
Interest earning assets |
| |
|
| |
|
|
|
| |
|
| |
|
|
|
|
Interest-bearing deposits | | $ | 173,907 | | $ | 629 |
| 0.73 | % | $ | 45,412 | | $ | 546 |
| 2.42 | % |
Federal funds sold | |
| 33,954 | |
| 131 |
| 0.78 | % |
| — | |
| — |
| — | % |
Federal Reserve Bank stock, FHLB stock and other corporate stock | |
| 6,550 | |
| 210 |
| 6.45 | % |
| 2,230 | |
| — |
| — | % |
Investment securities | |
| 79,207 | |
| 660 |
| 1.68 | % |
| 32,741 | |
| 430 |
| 2.67 | % |
Loans(1) | |
| 1,157,337 | |
| 27,912 |
| 4.85 | % |
| 554,064 | |
| 15,165 |
| 5.52 | % |
Total interest earning assets | |
| 1,450,955 | |
| 29,542 |
| 4.09 | % |
| 634,448 | |
| 16,141 |
| 5.13 | % |
Noninterest earning assets | |
| 80,730 | |
|
|
| | |
| 19,130 | |
|
|
|
| |
Total assets | |
| 1,531,685 | |
|
|
| | |
| 653,578 | |
|
|
|
| |
Liabilities and shareholders’ equity | |
|
| |
|
|
| | |
|
| |
|
|
|
| |
Interest-bearing liabilities | |
|
| |
|
|
| | |
|
| |
|
|
|
| |
Interest-bearing deposits | |
| 879,749 | |
| 4,243 |
| 0.97 | % |
| 422,325 | |
| 4,168 |
| 1.99 | % |
Borrowed funds | |
| 146,828 | |
| 947 |
| 1.30 | % |
| 49,335 | |
| 910 |
| 3.73 | % |
Total interest-bearing liabilities | |
| 1,026,577 | |
| 5,190 |
| 1.02 | % |
| 471,659 | |
| 5,078 |
| 2.17 | % |
Noninterest-bearing liabilities | |
|
| |
|
|
| | |
|
| |
|
|
|
| |
Noninterest-bearing deposits | |
| 332,474 | |
|
|
| | |
| 126,143 | |
|
|
|
| |
Other noninterest-bearing liabilities | |
| 15,801 | |
|
|
| | |
| 2,330 | |
|
|
|
| |
Shareholders’ equity | |
| 156,833 | |
|
|
| | |
| 53,116 | |
|
|
|
| |
Total liabilities and shareholders’ equity | | $ | 1,531,685 | |
|
|
| | | $ | 653,578 | |
|
|
|
| |
Net interest spread(2) | |
|
| |
|
|
| 3.08 | % |
|
| |
|
|
| 2.96 | % |
Net interest income | |
|
| | $ | 24,352 |
| | |
|
| | $ | 11,063 |
|
| |
Net interest margin(3) | |
|
| |
|
|
| 3.38 | % |
|
| |
|
|
| 3.52 | % |
| (1) | Includes nonaccrual loans. |
| (2) | Net interest spread is the difference between interest rates earned on interest earning assets and interest rates paid on interest-bearing liabilities. |
| (3) | Net interest margin is a ratio of net interest income to average interest earning assets for the same period. |
| (4) | Interest income on loans includes loan fees of $1.1 million and $393 thousand for the six months ended June 30, 2020 and 2019, respectively. |
The following table presents information regarding the dollar amount of changes in interest income and interest expense for the periods indicated for each major component of interest earning assets and interest-bearing liabilities and distinguishes between the changes attributable to changes in volume and changes attributable to changes in interest rates. For purposes of this table, changes attributable to both rate and volume that cannot be segregated have been proportionately allocated to both volume and rate.
| | | | | | | | | |
| | For the Six Months Ended June 30, 2020 | |||||||
| | Compared to 2019 | |||||||
| | Change Due To | | | | ||||
(Dollars in thousands) |
| Volume |
| Rate |
| Total | |||
Interest income |
| |
|
| |
|
| |
|
Interest-bearing deposits | | $ | 1,545 | | $ | (1,462) | | $ | 83 |
Federal funds sold | |
| — | |
| 131 | |
| 131 |
Federal Reserve Bank stock, Federal Home Loan Bank stock and other corporate stock | |
| — | |
| 210 | |
| 210 |
Investment securities | |
| 610 | |
| (380) | |
| 230 |
Loans | |
| 16,514 | |
| (3,767) | |
| 12,747 |
Total | | $ | 18,669 | | $ | (5,268) | | $ | 13,401 |
Interest expense | |
|
| |
|
| |
|
|
Interest-bearing deposits | |
| 4,515 | |
| (4,440) | |
| 75 |
Borrowed funds | |
| 1,798 | |
| (1,761) | |
| 37 |
Total | | $ | 6,313 | | $ | (6,201) | | $ | 112 |
Net interest income increased by $13.3 million to $24.4 million for the six months ended June 30, 2020 compared to the six months ended June 30, 2019. Our total interest income was impacted by an increase in interest earning assets, primarily due to growth in our loan
34
portfolio. Average total interest earning assets were $1.5 billion for the six months ended June 30, 2020 compared with $0.6 billion for the six months ended June 30, 2019. The annualized yield on those interest earning assets decreased 104 basis points from 5.13% for the six months ended June 30, 2019 to 4.09% for the six months ended June 30, 2020 due to the recent reductions in the federal funds target interest rates by the Federal Reserve. Our yield on interest earning assets declined during the six months ended June 30, 2020, which was partially offset by lower interest expense on our interest-bearing deposits. The increase in the average balance of interest earning assets was driven almost entirely by growth in our loan portfolio of $844.1 million, representing an increase of 117.9%, to $1.6 billion for the six months ended June 30, 2020 compared to $715.8 million for the six months ended June 30, 2020.
Average interest-bearing liabilities increased by $554.9 million, or 117.7%, from $471.7 million for the six months ended June 30, 2019 to $1.0 billion for the six months ended June 30, 2020. The increase was primarily due to a $457.4 million increase in the average balance of interest-bearing deposits, or 108.3%. The increase in the average balance of interest-bearing deposits was primarily due to increases in certificates of deposit and money market accounts for the six months ended June 30, 2020 compared to the six months ended June 30, 2019, and, to a lesser extent, negotiable order of withdrawal accounts, or NOW accounts. The annualized average interest rate paid on average interest-bearing liabilities decreased to 1.02% for the six months ended June 30, 2020 compared to 2.17% for the six months ended June 30, 2019, annualized average interest rate paid on interest-bearing deposits decreased 102 basis points to 0.97% and the annualized average interest rate paid on borrowed funds decreased by 243 basis points to 1.30%. The decreases in annualized average interest rates primarily reflected a decrease in market interest rates due to decreases in the federal funds target interest rate during the six months ended June 30, 2020. For the six months ended June 30, 2020, our average other noninterest-bearing liabilities increased $13.5 million, or 578.2%, to $15.8 million from $2.3 million during the six months ended June 30, 2019. Average noninterest-bearing deposits also increased $206.3 million, or 163.6%, from $126.1 million to $332.5 million for the same periods. For the six months ended June 30, 2020, our annual net interest margin was 3.38% and net interest spread was 3.08%. For the six months ended June 30, 2019, annual net interest margin was 3.52% and net interest spread was 2.96%. Our net interest margin was adversely affected by 0.14% during the six months ended June 30, 2020, compared to the same period in 2019 because rates paid on our interest-bearing deposits, our primary funding source, decreased greater than loan yields, which were also adversely impacted due to falling yields on 10-year treasury notes. As a result of the recent reductions in the federal funds target interest rates as well as continued declines in the 10-year treasury yield, average rates earned on interest earning assets and average rates paid on our interest-bearing deposits generally declined during the six months ended June 30, 2020. Correspondingly new loans were priced at lower yields in comparison to previously held loans which led to numerous loan payoffs at the beginning of 2020 compared to 2019.
Provision for Loan Losses
The provision for loan losses is a charge to income in order to bring our allowance for loan losses to a level deemed appropriate by management. For a description of the factors taken into account by our management in determining the allowance for loan losses see “Management’s Discussion and Analysis of Financial Condition and Results of Operations - Allowance for Loan Losses.”
Our provision for loan losses amounted to $2.6 million for the six months ended June 30, 2020 and $0.4 million for the six months ended June 30, 2019. The increase from 2019 to 2020 was due to reserving additional provisions to address the elevated credit risk levels related to the COVID-19 pandemic. Our allowance for loan losses as a percentage of total loans (excluding PPP loans) was 0.67% at June 30, 2020 compared to 0.83% at December 31, 2019. The decrease was primarily the result of extraordinary loan growth from the acquisition. The acquired loans were recorded at fair value at the acquisition date without carryover of MBI’s previously established allowance for loan losses. The fair value marks on acquired loans include credit losses. We recorded one net charge-off for $0.1 million for the six months ended June 30, 2020. We did not record any net charge-offs for the six months ended June 30, 2019.
Noninterest Income
Our primary sources of recurring noninterest income are service charges on deposit accounts, mortgage banking revenue, interest rate swap referral fees, origination fees for SBA loans, and other fees and charges. Noninterest income does not include loan origination fees to
35
the extent they exceed the direct loan origination costs, which are generally recognized over the life of the related loan as an adjustment to yield using the interest method. The following table presents the major categories of noninterest income for the periods indicated.
| | Six Months Ended June 30, | | ||||||
(Dollars in thousands) |
| 2020 |
| 2019 |
| Increase (Decrease) |
| ||
Noninterest income |
| |
|
| |
|
|
|
|
Deposit account service charges | | $ | 529 | | $ | 357 | | 48.2 | % |
Mortgage banking revenue | |
| 369 | |
| 103 | | 258.3 | % |
Gain on sale of securities | |
| 15 | |
| 3 | | 400.0 | % |
Swap referral fees | |
| 473 | |
| 465 | | 1.7 | % |
SBA origination fees | |
| 114 | |
| 79 | | 44.3 | % |
Other fees and charges | | | 324 | | | 276 | | 17.4 | % |
Total noninterest income | | $ | 1,824 | | $ | 1,283 | | 42.2 | % |
Noninterest income for the six months ended June 30, 2020 was $1.8 million, a $0.5 million or 42.2% increase compared to noninterest income of $1.3 million for the six months ended June 30, 2019. The increase was primarily due to an increase in mortgage banking revenues, of $0.3 million, or 258.3%, during the six months ended June 30, 2020 compared to the six months ended June 30, 2019 due to selling fixed long-term mortgages to third party providers. We also experienced an increase in deposit account service charges of $0.2 million, or 48.2%, during the six months ended June 30, 2020 compared to the six months ended June 30, 2019 due to deposit activity increases from the acquisition.
Noninterest Expense
Generally, noninterest expense is composed of all employee expenses and costs associated with operating our facilities, obtaining and retaining client relationships and providing banking services. The largest component of noninterest expense is salaries and employee benefits. Noninterest expense also includes operational expenses, such as occupancy and equipment expenses, professional fees, data processing expenses, advertising expenses, loan processing expenses and other general and administrative expenses, including FDIC assessments, communications, travel, meals, training, supplies and postage. The following table presents the major categories of noninterest expense for the periods indicated.
| | | | | | | | | |
| | Six Months Ended June 30, | | ||||||
| | | | | | | | Increase | |
(Dollars in thousands) |
| 2020 |
| 2019 |
| (Decrease) |
| ||
Noninterest expense |
| |
|
| |
|
|
|
|
Salaries and employee benefits | | $ | 12,175 | | $ | 8,872 | | 37.2 | % |
Occupancy and equipment | |
| 1,855 | |
| 1,123 | | 65.2 | % |
Data processing | |
| 597 | |
| 324 | | 84.3 | % |
Marketing | |
| 288 | |
| 272 | | 5.9 | % |
Professional fees | |
| 1,161 | |
| 582 | | 99.5 | % |
Acquisition expenses | | | 2,223 | | | — | | 100.0 | % |
Regulatory assessments | | | 514 | | | 307 | | 67.4 | % |
Other | | | 2,221 | | | 1,567 | | 41.7 | % |
Total noninterest expense | | $ | 21,034 | | $ | 13,047 | | 61.2 | % |
Noninterest expense amounted to $21.0 million for the six months ended June 30, 2020, an increase of $8.0 million, or 61.2%, compared to $13.0 million for the six months ended June 30, 2019. The increase was primarily due to the acquisition expenses and to a lesser extent, an increase in salaries and benefits, from increased employee headcount, increases in occupancy and equipment expense due to the opening of two new branches and the digital innovation center, and professional services expense due to costs related to building the organizational infrastructure of a publicly traded company.
Income Tax Expense
The amount of income tax expense we incur is influenced by the amounts of our pre-tax income, and other nondeductible expenses. Deferred tax assets and liabilities are reflected at current income tax rates in effect for the period in which the deferred tax assets and liabilities are expected to be realized or settled. As changes in tax laws or rates are enacted, such as the Tax Act, deferred tax assets and
36
liabilities are adjusted through the provision for income taxes. Valuation allowances are established when necessary to reduce deferred tax assets to the amount expected to be realized.
Income tax provision was $0.7 million for the six months ended June 30, 2020 compared to $0.4 million for the six months ended June 30, 2019. Our effective tax rates for those periods were 28.8% and 29.2%, respectively. The decrease in the effective tax rate was primarily due to the increase in tax-exempt interest income and the retroactive reduction of the 2018 Florida income tax rate, offset by the increase of non-deductible expenses.
Financial Condition
For the six months ended June 30, 2020, our total assets increased by $978.6 million, or 92.9%, to approximately $2.0 billion. Net loans increased to $1.6 billion, an increase of $774.7 million, or 98.7%, compared to December 31, 2019 as a result of the acquisition, the SBA Paycheck Protection Program (PPP) and new organic origination. Interest-bearing deposits at other financial institutions increased due to our desire to maintain our excess liquidity in more liquid assets due to our significant loan growth and a continued robust demand for loans. Shareholders’ equity increased $123.1 million, or 155.3%, to $202.4 million at June 30, 2020 compared to December 31, 2019, primarily due to our acquisition of MBI and initial public offering.
Interest-Bearing Deposits at Other Financial Institutions
Cash that is not immediately needed to fund loans by the Bank is invested in liquid assets that also earn interest, including deposits with other financial institutions. For the six months ended June 30, 2020, interest-bearing deposits at other financial institutions increased $64.4 million, or 42.8%, to $215.0 million from $150.6 million at December 31, 2019. The increase was primarily due to our desire to maintain excess liquidity in more liquid assets to fund our loan growth. As we continue to grow, so do our liquidity needs.
Investment Securities
We use our securities portfolio to provide a secondary source of liquidity, achieve additional interest income through higher yields on funds invested (compared to other options, such as interest-bearing deposits at other banks or fed funds sold), manage interest rate risk, and meet both collateral and regulatory capital requirements.
Securities may be classified as either trading, held-to-maturity, available-for-sale or equity. Trading securities (if any) are held principally for resale and recorded at their fair value with changes in fair value included in income. Held-to-maturity securities are those which the Company has the positive intent and ability to hold to maturity and are reported at amortized cost. Equity securities are carried at fair value, with changes in fair value reported in net income. Equity securities without readily determinable fair values are carried at cost, minus impairment, if any, plus or minus changes resulting from observable price changes in orderly transactions for the identical or a similar investment. Available-for-sale securities consist of securities not classified as trading securities nor as held-to maturity securities. Unrealized holding gains and losses on available-for-sale securities are excluded from income and reported in comprehensive income or loss. Gains and losses on the sale of available-for-sale securities are recorded on the trade date and are determined using the specific-identification method. Premiums and discounts on securities available for sale are recognized in interest income using the interest method over the period to maturity.
Our investment portfolio increased by $78.2 million, or 264.0%, from $29.6 million at December 31, 2019, to $107.8 million at June 30, 2020, primarily due to the acquisition of the Marquis Bank securities portfolio and the investment of a portion of the proceeds from our 2020 initial public offering into securities available for sale, although substantially more of these proceeds were invested in more liquid assets to provide more liquidity to fund our loan growth and securities available for sale. To supplement interest income earned on our loan portfolio, we invest in high quality mortgage-backed securities, government agency bonds, community development district bonds, corporate bonds and equity securities (including mutual funds).
37
The following tables summarize the contractual maturities and weighted-average yields of investment securities as of June 30, 2020 and December 31, 2019.
| | | ||||||||||
| | June 30, 2020 | | December 31, 2019 | ||||||||
(Dollars in thousands) |
| Book Value |
| Fair Value |
| Book Value |
| Fair Value | ||||
Securities Available for Sale |
| |
|
| |
|
| |
|
| |
|
Small Business Administration loan pools | | $ | 33,340 | | $ | 33,098 | | $ | 17,303 | | $ | 17,183 |
Mortgage-backed securities | |
| 36,201 | |
| 36,756 | |
| 5,237 | |
| 5,185 |
U.S. agency obligations | |
| 8,015 | |
| 8,163 | |
| 4,000 | |
| 4,070 |
Community Development District bonds | |
| 22,616 | |
| 23,097 | |
| — | |
| — |
Municipals | | | 1,070 | | | 1,095 | | | — | | | — |
Corporate bonds | |
| 3,002 | |
| 3,004 | |
| 2,000 | |
| 2,003 |
Total | | $ | 104,244 | | $ | 105,213 | | $ | 28,540 | | $ | 28,441 |
Securities Held to Maturity | |
|
| |
|
| |
|
| |
|
|
Mortgage-backed securities | | | 430 | | | 449 | | | — | | | — |
US Treasury | | | 204 | | | 204 | | | — | | | — |
Foreign Bonds | |
| 1,001 | | | 999 | |
| 214 | |
| 224 |
Total | | $ | 1,635 | | $ | 1,652 | | $ | 214 | | $ | 224 |
Equity Securities | |
|
| |
|
| |
|
| |
|
|
Mutual Funds | |
| 995 | |
| 995 | |
| 971 | |
| 971 |
Total | | $ | 995 | | $ | 995 | | $ | 971 | | $ | 971 |
|
| |
| |
| More than One Year |
| More than Five Years |
| |
| |
| |
| |
| |
| ||||||||||
| | One Year or Less | | Through Five Years | | Through 10 Years | | More than 10 Years | | Total | | ||||||||||||||||||
| | | | | Weighted | | | | | Weighted | | | | | Weighted | | | | | Weighted | | | | | | | | Weighted | |
At June 30, 2020 | | | | Average | | | | Average | | | | Average | | | | Average | | | | | | | Average | | |||||
(Dollars in thousands) |
| Book Value |
| Yield |
| Book Value |
| Yield |
| Book Value |
| Yield |
| Book Value |
| Yield |
| Book Value |
| Fair Value |
| Yield | | ||||||
Securities Available for Sale |
| |
|
|
|
| |
|
|
|
| |
|
|
|
| | |
| | | |
|
| |
|
|
|
|
Small Business Administration loan pools |
| $ | 46 |
| 0.29 | % | $ | 43 |
| 1.35 | % | $ | 23,016 |
| 1.27 | % | $ | 10,235 |
| 1.39 | % | $ | 33,340 |
| $ | 33,098 |
| 1.31 | % |
Mortgage-backed securities | |
| — |
| — | % |
| — |
| — | % |
| 5,417 |
| 0.78 | % |
| 30,784 |
| 1.11 | % |
| 36,201 |
|
| 36,756 |
| 1.06 | % |
U.S. agency obligations | |
| 3,010 |
| 0.39 | % |
| 5,005 |
| 1.58 | % |
| — |
| — | % |
| — |
| — | % |
| 8,015 |
|
| 8,163 |
| 1.14 | % |
Community Development District bonds | | | — | | — | % | | 19,340 | | 3.90 | % | | 2,961 | | 3.88 | % | | 315 | | 3.00 | % | | 22,616 | | | 23,097 | | 3.89 | % |
Municipals | | | — | | — | % | | 535 | | 1.64 | % | | 535 | | 1.86 | % | | — | | — | % | | 1,070 | | | 1,095 | | 1.75 | % |
Corporate bonds | |
| 1,002 |
| 2.24 | % |
| 2,000 |
| 1.26 | % |
| — |
| — | % |
| — |
| — | % |
| 3,002 |
|
| 3,004 |
| 1.59 | % |
Total | | $ | 4,058 |
| 0.85 | % | $ | 26,923 |
| 3.22 | % | $ | 31,929 |
| 1.44 | % | $ | 41,334 |
| 1.19 | % | $ | 104,244 |
| $ | 105,213 |
| 1.78 | % |
Securities Held to Maturity | |
| |
| | | | |
| | | | | | | | | |
| | | | | | | | | | |
Mortgage-backed securities | | | 1 | | (0.47) | % | | — | | — | % | | — | | — | % | | 429 | | 2.38 | % | | 430 | | | 449 | | 2.37 | % |
U.S. Treasury | | | 204 | | 0.18 | % | | — | | — | % | | — | | — | % | | — | | — | % | | 204 | | | 204 | | 0.18 | % |
Foreign Bonds | | | — | | — | % | | 1,001 | | 2.09 | % | | — | | — | % | | — | | — | % | | 1,001 | | | 999 | | 2.09 | % |
Total | | $ | 205 |
| 0.18 | % | $ | 1,001 |
| 2.09 | % | $ | — |
| — | % | $ | 429 |
| 2.38 | % | $ | 1,635 |
| $ | 1,652 |
| 1.93 | % |
Equity Securities | |
| |
|
| |
|
|
|
| |
|
|
|
| |
|
|
|
| |
|
|
|
|
|
|
| |
Mutual Funds | |
| 995 |
| 1.23 | % |
| — |
| — | % |
| — |
| — | % |
| — |
| — | % |
| 995 |
|
| 995 |
| 1.23 | % |
Total | | $ | 995 |
| 1.23 | % | $ | — |
| — | % | $ | — |
| — | % | $ | — |
| — | % | $ | 995 |
| $ | 995 |
| 1.23 | % |
38
Loan Portfolio
Our primary source of income is derived from interest earned on loans. Our loan portfolio consists of loans secured by real estate as well as commercial business loans, construction and development and other consumer loans. Our loan clients primarily consist of small to medium sized businesses, the owners and operators of these businesses as well as other professionals, entrepreneurs and high net worth individuals. Our owner-occupied and investment commercial real estate loans, residential construction loans and commercial business loans provide us with higher risk-adjusted returns, shorter maturities and more sensitivity to interest rate fluctuations, and are complemented by our relatively lower risk residential real estate loans to individuals. Our lending activities are principally directed to our market area consisting of the Miami-Dade MSA. The following table summarizes and provides additional information about certain segments of our loan portfolio as of June 30, 2020 and December 31, 2019.
| | | |||||||||
| | June 30, 2020 | | December 31, 2019 | | ||||||
(Dollars in thousands) |
| Amount |
| Percent |
| Amount |
| Percent |
| ||
Commercial real estate | | $ | 704,947 |
| 44.8 | % | $ | 270,981 |
| 34.2 | % |
Owner Occupied | |
| 259,345 |
| — | |
| 112,618 |
| — | |
Non-Owner Occupied | |
| 445,602 |
| — | |
| 158,363 |
| — | |
Residential real estate | |
| 388,613 |
| 24.6 | % |
| 342,257 |
| 43.2 | % |
Commercial | |
| 393,020 |
| 24.9 | % |
| 129,477 |
| 16.3 | % |
Construction and development | |
| 76,684 |
| 4.9 | % |
| 41,465 |
| 5.2 | % |
Consumer and other loans | |
| 13,281 |
| 0.8 | % |
| 8,287 |
| 1.1 | % |
Total loans | | $ | 1,576,545 |
| 100.0 | % | $ | 792,467 |
| 100.0 | % |
Unearned loan origination (fees) costs, net | |
| (7,639) |
|
| |
| (752) |
|
| |
Allowance for loan losses | |
| (9,045) |
|
| |
| (6,548) |
|
| |
Loans, net | | $ | 1,559,861 |
|
| | $ | 785,167 |
|
| |
Commercial Real Estate Loans. We originate both owner-occupied and non-owner-occupied commercial real estate loans. These loans may be more adversely affected by conditions in the real estate markets or in the general economy. Commercial real estate loans that are secured by owner-occupied commercial real estate and primarily collateralized by operating cash flows are also included in this category of loans. As of June 30, 2020, we had $259.3 million of owner-occupied commercial real estate loans and $445.6 million of investment commercial real estate loans, representing 36.8% and 63.2%, respectively, of our commercial real estate portfolio. As of June 30, 2020, the average loan balance of loans in our commercial real estate loan portfolio was approximately $1.1 million for owner-occupied and $1.5 million for non-owner-occupied. Commercial real estate loan terms are generally extended for 10 years or less and amortize generally over 25 years or less. Terms of 15 years are permitted where the loan is fully amortized over the term of the loan. The maximum loan to value is generally, 80% of the market value or purchase price, but may be as high as 90% for SBA 504 owner-occupied loans. Our credit policy also usually requires a minimum debt service coverage ratio of 1.20x. As of June 30, 2020, our weighted-average loan-to-value ratios for owner-occupied and non-owner-occupied commercial real estate were 50.9% and 48.9%, respectively and debt service coverage ratios were 2.20x and 1.71x, respectively. The interest rates on our commercial real estate loans have initial fixed rate terms that adjust typically at five years and we routinely charge an origination fee for our services. We generally require personal guarantees from the principal owners of the business, supported by a review of the principal owners’ personal financial statements and global debt service obligations. All commercial real estate loans with an outstanding balance of $0.5 million or more are reviewed at least annually. The properties securing the portfolio are located primarily throughout our market and are generally diverse in terms of type. This diversity helps reduce the exposure to adverse economic events that affect any single industry.
39
| | As of June 30, 2020 |
| |||
(Dollars in thousands) | | Amount | | Percent |
| |
Commercial Real Estate |
| |
|
|
| |
Assignment of Mortgage | | $ | 5,800 |
| 0.8 | % |
Auto (Car Lot/Auto Repair) | |
| 16,501 |
| 2.3 | % |
Educational Facility | |
| 14,570 |
| 2.1 | % |
Gas Station | |
| 66,451 |
| 9.4 | % |
Hotel | |
| 42,458 |
| 6.0 | % |
Mixed Use | | | 30,357 | | 4.3 | % |
Multifamily | |
| 89,089 |
| 12.6 | % |
Office | |
| 99,751 |
| 14.2 | % |
Other / Special Use | |
| 41,102 |
| 5.8 | % |
Religious Facility | |
| 7,569 |
| 1.1 | % |
Retail | |
| 170,624 |
| 24.2 | % |
Vacant Land | |
| 7,553 |
| 1.1 | % |
Warehouse | |
| 113,122 |
| 16.0 | % |
Total | | $ | 704,947 |
| 100.0 | % |
| | As of June 30, 2020 |
| |||
(Dollars in thousands) |
| Amount |
| Percent |
| |
Commercial Real Estate |
| |
|
|
| |
Broward | | $ | 117,604 |
| 16.7 | % |
Miami-Dade | |
| 451,461 |
| 64.0 | % |
Palm Beach | |
| 109,639 |
| 15.6 | % |
Other FL County | |
| 25,612 |
| 3.6 | % |
Out of State | |
| 631 |
| 0.1 | % |
Total | | $ | 704,947 |
| 100.0 | % |
As of June 30, 2020, non-owner occupied commercial real estate loans of $445.6 million represented 34.7% of total risk-based capital.
Construction and Development Loans. The majority of our construction loans are offered within the Miami-Dade MSA to builders primarily for the construction of single-family homes and condominium and townhouse conversions or renovations and, to a lesser extent, to individuals. Our construction loans typically have terms of 12 to 18 months with the goal of transitioning the borrowers to permanent financing or re-underwriting and selling into the secondary market. According to our credit policy, the loan to value ratio may not exceed the lesser of 80% of the appraised value, as established by an independent appraisal, or 85% of costs for residential construction and 90% of costs for SBA 504 loans. As of June 30, 2020, our weighted average loan-to-value ratio on our construction, vacant land, and land development loans were 55.0%, 45.5% and 48.7%, respectively. All construction and development loans require an interest reserve account, which is sufficient to pay the loan through completion of the project. We conduct semi-annual stress testing of our construction loan portfolio and closely monitor underlying real estate conditions as well as our borrowers’ trends of sales valuations as compared to underwriting valuations as part of our ongoing risk management efforts. We also closely monitor our borrowers’ progress in construction buildout and strictly enforce our original underwriting guidelines for construction milestones and completion timelines.
| | As of June 30, 2020 |
| |||
(Dollars in thousands) | | Amount | | Percent |
| |
Construction & Development |
| |
|
|
| |
1 – 4 Family Construction | | $ | 36,268 |
| 47.3 | % |
Commercial Construction | |
| 28,168 |
| 36.7 | % |
Land Development | |
| 6,522 |
| 8.5 | % |
Vacant Land | |
| 5,726 |
| 7.5 | % |
Total | | $ | 76,684 |
| 100.0 | % |
40
| | As of June 30, 2020 |
| |||
(Dollars in thousands) |
| Amount |
| Percent |
| |
Construction & Development |
| |
|
|
| |
Broward | | $ | 10,851 |
| 14.2 | % |
Miami-Dade | |
| 52,790 |
| 68.8 | % |
Palm Beach | |
| 12,832 |
| 16.7 | % |
Other FL County | |
| 211 |
| 0.3 | % |
Total | | $ | 76,684 |
| 100.0 | % |
As of June 30, 2020, total construction and land development loans of $76.7 million represented 6.0% of total risk-based capital.
Residential Real Estate Loans. We offer one-to-four family mortgage loans primarily on owner-occupied primary residences and, to a lesser extent, investor-owned residences, which make up approximately 20% of our residential loan portfolio. Our residential loans also include home equity lines of credit, which totaled approximately $71.6 million, or approximately 18.4% of our residential loan portfolio as of June 30, 2020. The average loan balance of closed-end residential loans in our residential portfolio was approximately $0.7 million as of June 30, 2020. Our one-to-four family residential loans have a relatively small balance spread between many individual borrowers compared to our other loan categories. Our owner-occupied residential real estate loans usually have fixed rates for five or seven years and adjust on an annual basis after the initial term based on a typical maturity of 30 years. Upon the implementation of rules under the Dodd-Frank Wall Street Reform and Consumer Protection Act, the origination, closing and servicing of the traditional residential loan products became much more complex, which led to increased cost of compliance and training. As a result, many banks exited the business, which created an opportunity for the banks that remained in the space. While the use of technology, and other related origination strategies have allowed non-bank originators to gain significant market share over the last several years, traditional banks that made investments in personnel and technology to comply with the new requirements have typically experienced loan growth. Unlike many of our competitors, we have been able to effectively compete in the residential loan market, while simultaneously doing the same in the commercial loan market which has enabled us to establish a broader and deeper relationship with our borrowers. Additionally, by offering a full line of residential loan products, the owners of the many small to medium sized businesses that we lend to use us, instead of a competitor, for financing a personal residence. This greater bandwidth to the same market has been a significant contributor to our growth and market share in South Florida. The following chart shows our residential real estate portfolio by loan type and the weighted average loan-to-value ratio for each loan type.
| | As of June 30, 2020 |
| |||||
(Dollars in thousands) |
| Amount |
| Percent |
| LTV (%) |
| |
Residential Real Estate | |
|
|
|
|
|
| |
Owner Occupied | | $ | 223,409 |
| 57.5 | % | 59.6 | % |
Investor Owned Residences | | | 90,261 | | 23.2 | % | 51.3 | % |
HELOC | | | 71,575 | | 18.4 | % | 57.9 | % |
Loans Held for Sale and PennyMac | | | 3,368 | | 0.9 | % | 0.0 | % |
Total | | $ | 388,613 | | 100.0 | % | | |
Commercial Loans. In addition to our other loan products, we provide general commercial loans, including commercial lines of credit, working capital loans, term loans, equipment financing, letters of credit and other loan products, primarily in our market, and underwritten based on each borrower’s ability to service debt from income. These loans are primarily made based on the identified cash flows of the borrower, as determined based on a review of the client’s financial statements, and secondarily, on the underlying collateral provided by the borrower. The average loan balance of the non-PPP loans in our commercial loan portfolio was $0.4 million as of June 30, 2020. For commercial loans over $0.5 million, a global cash flow analysis is generally required, which forms the basis for the credit approval, “Global cash flow” is defined as a cash flow calculation which includes all income sources of all principals in the transaction as well as all debt payments, including the debt service associated with the proposed transaction. In general, a minimum 1.20x debt service coverage is preferred, but in no event may the debt service coverage ratio be less than 1.00x. As of June 30, 2020, the debt service coverage ratio for our Professional Bank commercial loan portfolio was approximately 2.9x, excluding approximately 5.0% of the commercial loan portfolio that is cash secured. Most commercial business loans, which include PPP loans, are secured by a lien on general business assets including, among other things, available real estate, accounts receivable, promissory notes, inventory and equipment, and we generally obtain a
41
personal guaranty from the borrower or other principal. The following chart shows our commercial loan portfolio by industry segment as of June 30, 2020.
| | As of June 30, 2020 |
| |||
(Dollars in thousands) | | Amount | | Percent |
| |
Commercial Loans |
| |
|
|
| |
Business Products | | $ | 7,790 |
| 2.0 | % |
Business Services | |
| 81,095 |
| 20.6 | % |
Communication | |
| 19,464 |
| 5.0 | % |
Construction | |
| 48,459 |
| 12.3 | % |
Finance | |
| 64,572 |
| 16.4 | % |
Healthcare | |
| 28,549 |
| 7.3 | % |
Services | |
| 62,652 |
| 15.9 | % |
Technology | |
| 2,407 |
| 0.6 | % |
Trade | |
| 69,063 |
| 17.6 | % |
Transportation | | | 4,351 | | 1.1 | |
Other | |
| 4,618 |
| 1.2 | % |
Total | | $ | 393,020 |
| 100.0 | % |
Consumer and Other Loans. We offer consumer, or retail credit, to individuals for household, family, or other personal expenditures. Generally, these are either in the form of closed-end/installment credit loans or open-end/revolving credit loans. Occasionally, we will make unsecured consumer loans to highly qualified clients in amounts up to $250,000 with up to three-year repayment terms.
The following chart illustrates our gross loans net of unearned income and weighted average loan-to-value ratio for our collateralized loan portfolio as of the end of the months indicated.
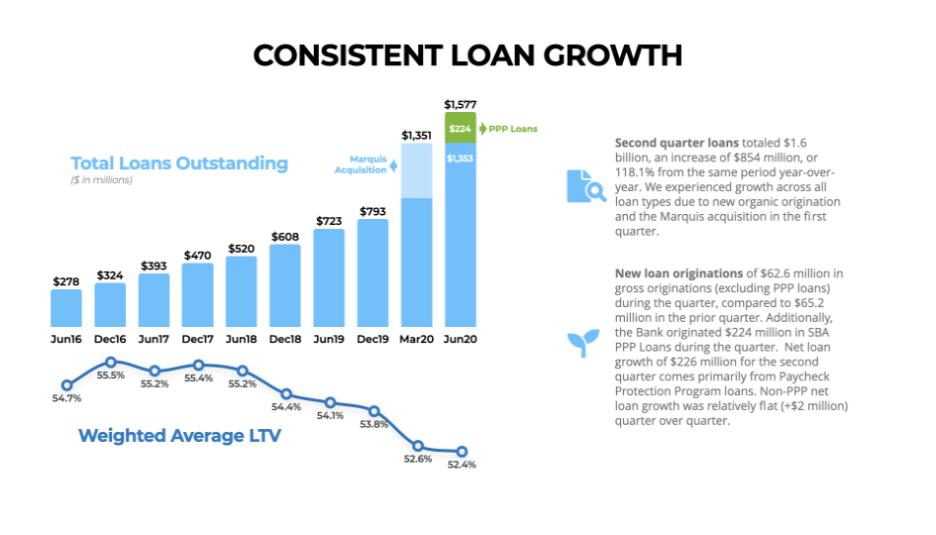
As part of our evaluation of the Coex credit, the Company classified $8.9 million as performing substandard as of June 30, 2020. Including Coex, total substandard assets are $15.6 million, total non-classified assets are $10.9 million and total criticized assets are $26.5 million as of June 30, 2020.
42
The repayment of loans is a source of additional liquidity for us. The following table details maturities and sensitivity to interest rate changes for our loan portfolio at June 30, 2020.
| | June 30, 2020 | ||||||||||
|
| Due in One |
| Due in One to |
| Due After |
| | | |||
(Dollars in thousands) | | Year or Less | | Five Years | | Five Years | | Total | ||||
Commercial Real Estate | | $ | 54,508 | | $ | 213,985 | | $ | 436,454 | | $ | 704,947 |
Residential Real Estate | |
| 19,453 | |
| 41,991 | |
| 327,169 | |
| 388,613 |
Commercial* | |
| 87,576 | |
| 264,536 | |
| 40,908 | |
| 393,020 |
Construction and Development | |
| 32,817 | |
| 18,879 | |
| 24,988 | |
| 76,684 |
Consumer and Other | |
| 7,120 | |
| 4,255 | |
| 1,906 | |
| 13,281 |
Total loans | | $ | 201,474 | | $ | 543,646 | | $ | 831,425 | | $ | 1,576,545 |
Amounts with fixed rates | | $ | 104,860 | | $ | 498,290 | | $ | 806,574 | | $ | 1,409,724 |
Amounts with floating rates | | $ | 96,614 | | $ | 45,356 | | $ | 24,851 | | $ | 166,821 |
*Includes Paycheck Protection Program (PPP) loans. | | | | | | | | | | | | |
Paycheck Protection Program (PPP)
The Company has participated in the Paycheck Protection Program (PPP) offered through the U.S. Small Business Administration (SBA) by way of the Coronavirus Aid Relief and Economic Security (CARES) Act that was passed at the end of the first quarter 2020. As a qualified SBA lender, the Company was automatically authorized to originate PPP loans. To help clients, the Company added an online PPP application form and automated the PPP loan closing documentation process. As of June 30, 2020, the Company has processed, closed and funded more than 1,400 loans representing $224.0 million in relief proceeds. The majority of these loans have been pledged to the Federal Reserve as part of the Paycheck Protection Program Liquidity Facility (PPPLF). The amount pledged as of July 10, 2020 was $223.4 million. The PPPLF pledged loans are non-recourse to the Bank. Interest income on loans include PPP loan fees. PPP loan fees recognized during the three and six months ended June 30, 2020 were $675.0 thousand.
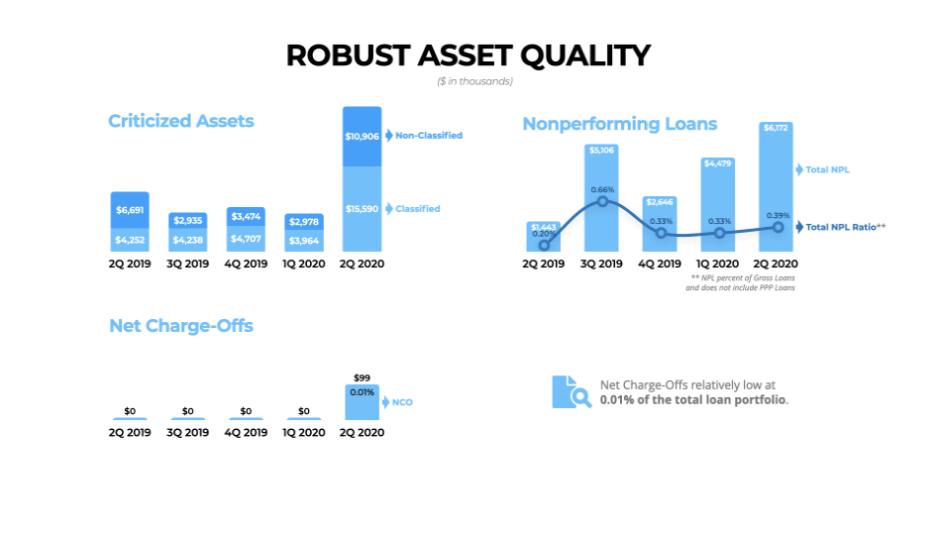
Nonperforming Assets
Loans are considered past due if the required principal and interest payments have not been received as of the date such payments were due. Loans are placed on nonaccrual status when, in management’s opinion, the borrower may be unable to meet payment obligations as they become due, as well as when required by regulatory provisions. Loans may be placed on nonaccrual status regardless of whether or not such loans are considered past due. In general, we place loans on nonaccrual status when they become 90 days past due.
43
We also place loans on nonaccrual status if they are less than 90 days past due if the collection of principal or interest is in doubt. When interest accrual is discontinued, all unpaid accrued interest is reversed from income. Interest income is subsequently recognized only to the extent cash payments are received in excess of principal due. Loans are returned to accrual status when all the principal and interest amounts contractually due are brought current and future payments are, in management’s opinion, reasonably assured. Any loan which the Bank deems to be uncollectible, in whole or in part, is charged off to the extent of the anticipated loss. Loans that are past due for 180 days or more are charged off unless the loan is well secured and in the process of collection. We currently have two loans accruing over 90 days or greater past due as of June 30, 2020 with a balance of $1.6 million.
We believe our disciplined lending approach and focused management of nonperforming assets has resulted in sound asset quality and timely resolution of problem assets. We have several procedures in place to assist us in maintaining the overall quality of our loan portfolio, such as annual reviews of the underlying financial performance of all commercial loans in excess of $0.5 million. We also engage in annual stress testing of the loan portfolio, and proactive collection and timely disposition of past due loans. Our bankers follow established underwriting guidelines, and we also monitor our delinquency levels for any negative trends. As a result, we have, in recent years, experienced a relatively low level of nonperforming assets. We had nonperforming assets of $6.2 million as of June 30, 2020, or 0.30% of total assets. We had nonperforming assets of $2.3 million as of December 31, 2019, or 0.22% of total assets. Occasionally, loans that we make will be impacted due to the occurrence of unforeseen events, which was a primary factor in the recent increase in our nonperforming assets relative to our historically low, near-zero levels. However, we believe that our low loan-to-value loan portfolio is well positioned to withstand these types of discrete events as they occur from time. There can be no assurance, however, that our loan portfolio will not become subject to increasing pressures from deteriorating borrower credit due to general economic conditions.
| | | | | | ||
(Dollars in thousands) |
| June 30, 2020 |
| December 31, 2019 |
| ||
Nonaccrual Loans | | | | | | | |
Commercial real estate | | $ | 305 | | $ | — | |
Residential real estate | |
| 3,150 | |
| 483 | |
Commercial | |
| 1,069 | |
| 1,797 | |
Construction and development | |
| — | |
| — | |
Consumer and other loans | |
| — | |
| — | |
Accruing loans 90 or more days past due | |
| 1,648 | |
| — | |
Total nonperforming loans | | $ | 6,172 | | $ | 2,280 | |
Other real estate owned | |
| — | |
| — | |
Total nonperforming assets | | $ | 6,172 | | $ | 2,280 | |
Restructured loans-nonaccrual | | $ | — | | $ | — | |
Restructured loans-accruing | | $ | 334 | | $ | 367 | |
Ratio of nonperforming loans to total loans | |
| 0.39 | % |
| 0.33 | % |
Ratio of nonperforming assets to total assets | |
| 0.30 | % |
| 0.22 | % |
Coex Coffee International Inc.
The Company learned on July 15, 2020 that one of its borrowers, Coex Coffee International Inc. (“Coex”), filed a Petition Commencing an Assignment for the Benefit of Creditors in the 11th Judicial Circuit Court in Miami-Dade County, Florida. Coex is primarily in the business of purchasing and selling green coffee beans. Coex has financed its business through various credit facilities from ten financial institutions in an amount totaling $191.9 million. The Company currently has a total of thirty-one (31) advances to Coex for the purchase of coffee from growers for periods of up to 90 days with an aggregate outstanding balance of $12.4 million. However, $4.1 million has been participated out without recourse to another financial institution leaving the Company with a current balance of $8.3 million as of July 10, 2020. The loans are required to be over-collateralized. While at the time of petition, the advances were current, through court documents and legal inquiry (by the Company’s counsel), the Company is presently investigating the status of its security and collateral. The situation remains fluid and as more information is obtained by the Company, we will evaluate the status and reserve associated with this loan. As part of our evaluation of the Coex credit, the Company classified $8.9 million as performing substandard as of June 30, 2020.
Credit Quality Indicators
We strive to manage and control credit risk in our loan portfolio by adhering to well-defined underwriting criteria and account administration standards established by our management team and approved by our Board. We employ a dedicated Chief Risk Officer and have established a Risk Committee at the Bank level which oversees, among other things, risks associated with our lending activities and
44
enterprise risk management. Our written loan policies document underwriting standards, approval levels, exposure limits and other limits or standards that our management team and Board deem appropriate for an institution of our size and character. Loan portfolio diversification at the obligor, product and geographic levels are actively managed to mitigate concentration risk, to the extent possible. In addition, credit risk management includes an independent credit review process that assesses compliance with policies, risk rating standards and other critical credit information. In addition, we adhere to sound credit principles and evaluate our clients’ borrowing needs and capacity to repay, in conjunction with their character and financial history. Our management team and Board place significant emphasis on balancing a healthy risk profile and sustainable growth. Specifically, our approach to lending seeks to balance the risks necessary to achieve our strategic goals while ensuring that our risks are appropriately managed and remain within our defined limits. We believe that our credit culture is a key factor in our relatively low levels of nonperforming loans and nonperforming assets compared to other institutions within our market.
We categorize loans into risk categories based on relevant information about the ability of borrowers to service their debt including: current financial information, historical payment experience, credit documentation, public information, and current economic trends, among other factors. Generally, all credits greater than $0.5 million, other than residential real estate loans, are reviewed no less than annually to monitor and adjust, if necessary, the credit risk profile. Loans classified as “substandard” or “special mention” are reviewed quarterly for further evaluation to determine if they are appropriately classified and whether there is any impairment. Beyond the annual review, all loans are graded at initial issuance. In addition, during the renewal process of any loan, as well as if a loan becomes past due, we will determine the appropriate loan grade. Loans excluded from the review process above are generally classified as “pass” credits until: (a) they become past due; (b) management becomes aware of deterioration in the credit worthiness of the borrower; or (c) the client contacts us for a modification. In these circumstances, the loan is specifically evaluated for potential reclassification to special mention, substandard, doubtful, or even a charged-off status. Based on the most recent analysis performed, the risk category of loans by class of loans is as follows:
| | | | | Special | | | | | | | | | | |
(Dollars in thousands) |
| Pass |
| Mention |
| Substandard |
| Doubtful |
| Total | |||||
June 30, 2020 | | | |
| | |
| | |
| | |
| | |
Commercial real estate | | $ | 700,637 | | $ | 1,606 | | $ | 2,704 | | $ | — | | $ | 704,947 |
Residential real estate | |
| 376,743 |
|
| 8,908 |
|
| 2,962 |
|
| — |
|
| 388,613 |
Commercial | |
| 382,705 |
|
| 391 |
|
| 9,924 |
|
| — |
|
| 393,020 |
Construction and land development | |
| 76,684 |
|
| — |
|
| — |
|
| — |
|
| 76,684 |
Consumer | |
| 13,281 |
|
| — |
|
| — |
|
| — |
|
| 13,281 |
Total | | $ | 1,550,050 |
| $ | 10,905 |
| $ | 15,590 |
| $ | — |
| $ | 1,576,545 |
| | | |
| | |
| | |
| | |
| | |
December 31, 2019 | | | | | | | | | | | | | | | |
Commercial real estate | | $ | 266,346 | | $ | 2,207 | | $ | 2,428 | | $ | — | | $ | 270,981 |
Residential real estate | |
| 341,819 |
|
| 438 |
|
| — |
|
| — |
|
| 342,257 |
Commercial | |
| 126,851 |
|
| 829 |
|
| 1,797 |
|
| — |
|
| 129,477 |
Construction and land development | |
| 41,465 |
|
| — |
|
| — |
|
| — |
|
| 41,465 |
Consumer | |
| 8,287 |
|
| — |
|
| — |
|
| — |
|
| 8,287 |
Total | | $ | 784,768 |
| $ | 3,474 |
| $ | 4,225 |
| $ | — |
| $ | 792,467 |
Allowance for Loan Losses
We believe that we maintain our allowance for loan losses at a level sufficient to provide for probable incurred credit losses inherent in the loan portfolio as of the balance sheet date. Credit losses arise from the borrowers’ inability or unwillingness to repay, and from other risks inherent in the lending process including collateral risk, operations risk, concentration risk, and economic risk. We consider all of these risks of lending when assessing the adequacy of our allowance. The allowance for loan losses is established through a provision charged to expense. Loans are charged-off against the allowance when losses are probable and reasonably quantifiable. Our allowance for loan losses is based on management’s judgment of overall credit quality, which is a significant estimate based on a detailed analysis of the loan portfolio. Our allowance can and will change based on revisions to our assessment of our loan portfolio’s overall credit quality and other risk factors both internal and external to us.
We evaluate the adequacy of the allowance for loan losses on a quarterly basis. The allowance consists of two components. The first component consists of those amounts reserved for impaired loans. A loan is deemed impaired when, based on current information and events, it is probable that the Bank will not be able to collect all amounts due (principal and interest), according to the contractual terms of the loan agreement. Loans are monitored for potential impairment through our ongoing loan review procedures and portfolio analysis.
45
Classified loans and past due loans over a specific dollar amount, and all troubled debt restructurings are individually evaluated for impairment.
The approach for assigning reserves for the impaired loans is determined by the dollar amount of the loan and loan type. Impairment measurement for loans over a specific dollar are determined on an individual loan basis with the amount reserved dependent on whether repayment of the loan is dependent on the liquidation of collateral or from some other source of repayment. If repayment is dependent on the sale of collateral, the reserve is equivalent to the recorded investment in the loan less the fair value of the collateral after estimated sales expenses. If repayment is not dependent on the sale of collateral, the reserve is equivalent to the recorded investment in the loan less the estimated cash flows discounted using the loan’s effective interest rate. The discounted value of the cash flows is based on the anticipated timing of the receipt of cash payments from the borrower. The reserve allocations for individually measured impaired loans are sensitive to the extent market conditions or the actual timing of cash receipts change. Impairment reserves for smaller-balance loans under a specific dollar amount are assigned on a pooled basis utilizing loss factors for impaired loans of a similar nature.
The second component is a general reserve on all loans other than those identified as impaired. General reserves are assigned to various homogenous loan pools, including commercial, commercial real estate, construction and development, residential real estate, and consumer. General reserves are assigned based on historical loan loss ratios determined by loan pool and internal risk ratings that are adjusted for various internal and external risk factors unique to each loan pool. The following table analyzes the activity in the allowance over the past two years and for the six months ended June 30, 2020 and 2019.
| | For the Six Months Ended June 30, | | Year Ended December 31, | |||||||||
(Dollars in thousands) | | 2020 |
| 2019 |
| 2019 |
| 2018 |
| ||||
Balance at beginning of period | | $ | 6,549 | | $ | 5,685 | | $ | 5,685 | | $ | 4,535 | |
Charge-offs | |
|
| |
|
| |
|
| |
|
| |
Commercial real estate | |
| — | |
| — | |
| — | |
| — | |
Residential real estate | |
| — | |
| — | |
| — | |
| — | |
Commercial | |
| (99) | |
| — | |
| — | |
| — | |
Construction and development | |
| — | |
| — | |
| — | |
| — | |
Consumer and other | |
| — | |
| — | |
| — | |
| — | |
Total Charge-offs | |
| (99) | |
| — | |
| — | |
| — | |
Recoveries | |
|
| |
|
| |
|
| |
|
| |
Commercial real estate | |
| — | |
| — | |
| — | |
| — | |
Residential real estate | |
| — | |
| — | |
| — | |
| — | |
Commercial | |
| — | |
| — | |
| — | |
| — | |
Construction and development | |
| — | |
| — | |
| — | |
| — | |
Consumer and other | |
| — | |
| 2 | |
| 1 | |
| — | |
Total recoveries | |
| — | |
| 2 | |
| 1 | |
| — | |
Net charge-offs (recoveries) | |
| — | |
| (2) | |
| — | |
| — | |
Provision for loan losses | |
| 2,595 | |
| 382 | |
| 862 | |
| 1,150 | |
Balance at end of period | | $ | 9,045 | | $ | 6,069 | | $ | 6,548 | | $ | 5,685 | |
Ratio of net charge-offs to average loans | |
| — | % |
| — | % |
| — | % |
| — | % |
ALLL as a percentage of loans (excluding PPP loans) at end of period | |
| 0.67 | % |
| 0.84 | % |
| 0.83 | % |
| 0.94 | % |
ALLL as a multiple of net charge-offs | |
| N/A | |
| N/A | |
| N/A | |
| N/A | |
ALLL as a percentage of nonperforming loans | |
| 146.5 | % |
| 568.3 | % |
| 287.2 | % |
| N/A | |
Our allowance for loan losses was $9.0 million at June 30, 2020 compared to $6.5 million at December 31, 2019, an increase of 38.5%. The increase was primarily due to the growth of our loan portfolio and the anticipated economic stress on our customers resulting from the actual and projected effects of COVID-19. At June 30, 2020, our allowance for loan losses was 0.67% of total gross loans (net of overdrafts and excluding PPP loans) and provided coverage of 146.5% of our nonperforming loans, compared to an allowance for loan losses to total gross loans (net of overdrafts) ratio of 0.83% as of December 31, 2019. Additionally, all MBI loans were marked to a fair value that accounts for any potential future losses. We believe our allowance at June 30, 2020 was adequate to absorb probable incurred
46
losses inherent in our loan portfolio. The following table provides an allocation of the allowance for loan losses to specific loan types as of June 30, 2020 and December 31, 2019.
| | June 30, 2020 | | December 31, 2019 | | ||||||
(Dollars in thousands) |
| Allowance |
| Percent |
| Allowance |
| Percent |
| ||
Commercial real estate | | $ | 2,792 |
| 30.9 | % | $ | 1,845 |
| 28.2 | % |
Residential real estate | |
| 3,509 |
| 38.8 | % |
| 3,115 |
| 47.6 | % |
Commercial | |
| 2,165 |
| 23.9 | % |
| 1,235 |
| 18.9 | % |
Construction and development | |
| 477 |
| 5.3 | % |
| 272 |
| 4.2 | % |
Consumer and other | |
| 102 |
| 1.1 | % |
| 81 |
| 1.2 | % |
Total allowance for loan losses | | $ | 9,045 |
| 100.0 | % | $ | 6,548 |
| 100.0 | % |
At June 30, 2020, the recorded investment in impaired loans (consisting of nonaccrual loans, troubled debt restructured loans, loans past due 90 days or more and still accruing interest and other loans based on management’ judgment) was $16.1 million, of which $1.1 million required a specific reserve of $0.6 million, compared to a recorded investment in impaired loans of $4.7 million, of which $1.1 million required a specific reserve of $0.6 million at December 31, 2019.
Impaired loans also include certain loans that were modified as troubled debt restructurings, or TDRs. At June 30, 2020, we had two loans amounting to $0.3 million that were considered to be TDRs, compared to two loans amounting to $0.4 million at December 31, 2019. We did not allocate any specific reserves to loans that have been modified as TDRs as of June 30, 2020 and December 31, 2019.
Deposits
Deposits are our primary source of funding. We offer a variety of deposit products including checking, NOW, savings, money market and time accounts all of which we actively market at competitive pricing. We generate deposits from our consumer and commercial clients through the efforts of our private bankers. Additionally, we supplement our deposits with wholesale funding sources such as Quickrate, brokered deposits and FHLB advances. However, we do not significantly rely on wholesale funding sources, which are generally viewed as less stable compared to core deposits due to the relatively higher price elasticity of demand for deposits from wholesale sources. As of June 30, 2020 and December 31, 2019, these wholesale deposits represented 6.4% and 4.6%, respectively, of our total deposits.
Interest-bearing deposits increased $312.7 million, or 44.1%, from December 31, 2019 to June 30, 2020 primarily due to a $150.9 million increase in money market accounts and a $148.9 million increase in certificates of deposits balances. In order to fund our loan growth, all of our bankers are actively involved with our strategic efforts and are incentivized to grow core deposits. The average rate paid on interest-bearing deposits decreased 76 basis points from 1.73% for the year ended December 31, 2019 to 0.97% for the six months ended June 30, 2020. The decrease in average rates paid on interest-bearing deposits was a result of a continued decrease in market rates of interest during the six months ended June 30, 2020. As of June 30, 2020, we had approximately $25.9 million in brokered deposits, 1.4% of total, that were classified as brokered deposits, an increase of approximately $3.3 million, or 14.6% from December 31, 2019. We did not obtain these brokered deposits through a deposit listing agency, but rather through an existing relationship with the Bank. However, these deposits meet the regulatory definition of brokered deposits and are reported accordingly.
| | For the Six Months Ended | | For the Year Ended | | ||||||
| | June 30, 2020 | | December 31, 2019 | | ||||||
| | Average | | | | Average | | | | ||
(Dollars in thousands) |
| Balance |
| Average Rate |
| Balance |
| Average Rate |
| ||
NOW accounts | | $ | 47,897 | | 0.26 | % | $ | 33,329 | | 0.42 | % |
Money market accounts | |
| 626,612 |
| 0.82 | % |
| 435,349 |
| 1.71 | % |
Savings accounts | |
| 11,495 |
| 0.59 | % |
| 8,678 |
| 1.35 | % |
Certificates of deposit | |
| 193,745 |
| 1.66 | % |
| 103,466 |
| 2.27 | % |
Total interest-bearing deposits | |
| 879,749 |
| 0.97 | % |
| 580,822 |
| 1.73 | % |
Noninterest-bearing deposits | |
| 332,474 |
| — | % |
| 164,963 |
| — | % |
Total deposits | | $ | 1,212,223 |
| 0.70 | % | $ | 745,785 |
| 1.35 | % |
47
The following table presents the ending balances and percentage of total deposits for the periods indicated.
| | For the Six Months Ended | | For the Year Ended | | ||||||
| | June 30, 2020 | | December 31, 2019 | | ||||||
| | Ending | | | | Ending | | | | ||
(Dollars in thousands) | | Balance |
| % of Total |
| Balance |
| % of Total |
| ||
NOW accounts | | $ | 42,823 | | 2.8 | % | $ | 39,826 | | 4.5 | % |
Money market accounts | |
| 699,288 |
| 46.1 | % |
| 548,366 |
| 61.4 | % |
Savings accounts | |
| 20,997 |
| 1.4 | % |
| 11,126 |
| 1.2 | % |
Certificates of deposit | |
| 258,249 |
| 17.0 | % |
| 109,344 |
| 12.2 | % |
Total interest-bearing deposits | |
| 1,021,357 |
| 67.4 | % |
| 708,662 |
| 79.4 | % |
Noninterest-bearing deposits | |
| 495,086 |
| 32.6 | % |
| 184,211 |
| 20.6 | % |
Total deposits | | $ | 1,516,443 | | 100.0 | % | $ | 892,873 | | 100.0 | % |
The following table presents the maturities of our certificates of deposit as of June 30, 2020.
|
| | |
| Over |
| Over Six |
| | |
| | | ||
| | Three | | Three | | Months | | | | | | | |||
| | Months or | | Through | | Through | | Over | | | | ||||
(Dollars in thousands) | | Less | | Six Months | | 12 Months | | 12 Months | | Total | |||||
$100,000 or more | | $ | 46,906 | | $ | 54,498 | | $ | 93,541 | | $ | 40,486 | | $ | 235,431 |
Less than $100,000 | |
| 4,792 | |
| 6,348 | |
| 8,356 | |
| 3,322 | |
| 22,818 |
Total | | $ | 51,698 | | $ | 60,846 | | $ | 101,897 | | $ | 43,808 | | $ | 258,249 |
Borrowings
We primarily use short-term and long-term borrowings to supplement deposits to fund our lending and investment activities.
FHLB Advances. The FHLB allows us to borrow up to 25% of our assets on a blanket floating lien status collateralized by certain securities and loans. As of June 30, 2020, approximately $194.3 million in loans were pledged as collateral for our FHLB borrowings. We utilize these borrowings to meet liquidity needs and to fund certain fixed rate loans in our portfolio. As of June 30, 2020, we had $65.1 million in outstanding advances and $99.1 million in additional available borrowing capacity from the FHLB based on the collateral that we have currently pledged. The following table sets forth certain information on our FHLB borrowings during the periods presented.
| | | | | | | |
| | Six Months Ended | | Year Ended | |||
(Dollars in thousands) | | June 30, 2020 |
| December 31, 2019 | |||
Amount outstanding at period-end | | $ | 65,077 | | $ | 55,000 | |
Weighted average interest rate at period-end | |
| 1.79 | % |
| 2.10 | % |
Maximum month-end balance during period | | $ | 70,000 | | $ | 55,000 | |
Average balance outstanding during period | |
| 63,564 | |
| 47,301 | |
Weighted average interest rate during period | |
| 1.87 | % |
| 2.30 | % |
PPPLF Advances. The Company has participated in the Paycheck Protection Program (PPP) offered through the U.S. Small Business Administration (SBA) by way of the Coronavirus Aid Relief and Economic Security (CARES) Act that was passed at the end of the first quarter 2020. To help clients, the Company added an online PPP application form and automated the PPP loan closing documentation process. As of June 30, 2020, the Company has processed, closed and funded approximately $224.0 million in relief proceeds. These have been pledged to the Federal Reserve as part of the Paycheck Protection Program Liquidity Facility (PPPLF). The amount pledged as of July 10, 2020 was $223.4 million and are non-recourse to the Bank. Interest income on loans include PPP loan fees. PPP loan fees recognized during the three and six months ended June 30, 2020 were $675.0 thousand.
Federal Reserve Bank of Atlanta. The Federal Reserve Bank of Atlanta has an available borrower in custody arrangement which allows us to borrow on a collateralized basis. No advances were outstanding under this facility as of June 30, 2020.
Valley National Line of Credit. On December 19, 2019, the Company entered into a new $10.0 million secured revolving line of credit with Valley National Bank, N.A. Amounts drawn under this line of credit bears interest at the Prime Rate, as announced by The Wall Street Journal from time to time as its prime rate, and its obligations under this line of credit are secured by shares of the capital stock of the Bank, which we have pledged as security. Outstanding principal and interest under the line of credit is payable at maturity on
48
December 19, 2020. As of December 31, 2019, approximately $10.0 million was drawn under this line of credit, the proceeds of which were primarily used to provide additional capital to support continued growth and also to cover expenses incurred in connection with entering into the line of credit. On February 12, 2020 the Company used a portion of the net proceeds from its IPO to repay all of the outstanding principal and accrued interest under the line of credit with Valley National Bank, N.A.
Subordinated Debt. On March 26, 2020, pursuant to terms of the acquisition, the Company assumed the subordinated notes payable of MBI at its fair value of $9.9 million. According to the terms of the subordinated note, the principal amount due is $10.0 million with a 7% fixed rate until October 30, 2021 and a variable rate thereafter at LIBOR plus 576 basis points. The note matures on October 30, 2026 and can be redeemed by the Company anytime on or after October 30, 2021. The subordinated debt was fair valued at a discount of $0.8 million and will be amortized over the expected life.
Liquidity and Capital Resources
Capital Resources
Shareholders’ equity increased $123.1 million, or 155.3%, to $202.4 million at June 30, 2020 compared to December 31, 2019, primarily due to our initial public offering and acquisition of MBI. Net income resulted in an increase to retained earnings of $1.8 million as of June 30, 2020.
We are subject to various regulatory capital requirements administered by the federal banking agencies. Failure to meet minimum capital requirements can initiate certain mandatory and possibly additional discretionary actions by regulators that, if undertaken, could have a material effect on our financial statements. Under capital adequacy guidelines and the regulatory framework for prompt corrective action, we must meet specific capital guidelines that involve quantitative measures of our assets, liabilities, and certain off-balance sheet items as calculated under regulatory accounting practices. The capital amounts and classifications are also subject to qualitative judgments by the regulators about components, risk weightings, and other factors.
Quantitative measures established by regulation to ensure capital adequacy require us to maintain minimum ratios of common equity Tier 1, Tier 2, and total capital as a percentage of assets and off-balance sheet exposures, adjusted for risk weights ranging from 0% to 150%. We are also required to maintain capital at a minimum level based on quarterly average assets, which is known as the leverage ratio.
In July 2013, federal bank regulatory agencies issued a final rule that revised their risk-based capital requirements and the method for calculating risk-weighted assets to make them consistent with certain standards that were developed by Basel III and certain provisions of the Dodd-Frank Act. The final rule applies to all depository institutions and bank holding companies and savings and loan holding companies with total consolidated assets of more than $1 billion, which we refer to below as “covered” banking organizations. We were required to implement the new Basel III capital standards as of January 1, 2015 and January 1, 2018, respectively.
As of June 30, 2020, we were in compliance with all applicable regulatory capital requirements to which we were subject, and the Bank was classified as “well capitalized” for purposes of the prompt corrective action regulations. As we deploy our capital and continue to grow our operations, our regulatory capital levels may decrease depending on our level of earnings. However, we intend to monitor and control our growth in order to remain in compliance with all regulatory capital standards applicable to us. Based on changes to the Federal Reserve’s definition of a “Small Bank Holding Company” that increased the threshold to $3 billion in assets in August 2018, the Company is not currently subject to separate minimum capital measurements. At such time as the Company reaches the $3 billion asset level, it will again be subject to capital measurements independent of the Bank. For comparison purposes, the Company’s ratios are included in following discussion as well, all of which would have exceeded the “well-capitalized” level had the Company been subject to separate capital minimums.
49
The following table presents our regulatory capital ratios as of June 30, 2020 and December 31, 2019. The amounts presented exclude the capital conservation buffer.
| | | | | | | | | | | | Minimum to be well | | |||
| | Actual | | Minimum for capital adequacy | | capitalized | | |||||||||
(Dollars in thousands) |
| Amount |
| Ratio |
| Amount |
| Ratio |
| Amount |
| Ratio |
| |||
June 30, 2020 |
| |
|
|
|
| |
|
|
|
| |
|
|
| |
Total capital ratio |
| |
|
| |
| |
|
|
|
| |
|
|
| |
Bank | | $ | 165,249 |
| 12.9 | % | $ | 102,790 |
| 8.0 | % | $ | 128,488 |
| 10.0 | % |
Company | |
| 205,147 |
| 16.0 | % |
| 102,790 |
| 8.0 | % |
| N/A |
| N/A | |
Tier 1 capital ratio | |
|
|
| | |
|
|
|
| |
|
|
|
| |
Bank | |
| 153,233 |
| 11.9 | % |
| 77,083 |
| 6.0 | % |
| 102,791 |
| 8.0 | % |
Company | |
| 183,199 |
| 14.3 | % |
| 77,083 |
| 6.0 | % |
| N/A |
| N/A | |
Tier1 leverage ratio | |
|
|
| | |
|
|
|
| |
|
|
|
| |
Bank | |
| 153,233 |
| 8.8 | % |
| 69,635 |
| 4.0 | % |
| 87,044 |
| 5.0 | % |
Company | |
| 183,199 |
| 10.5 | % |
| 69,635 |
| 4.0 | % |
| N/A |
| N/A | |
Common equity tier 1 capital ratio | |
|
|
| | |
|
|
|
| |
|
|
|
| |
Bank | |
| 153,233 |
| 11.9 | % |
| 57,820 |
| 4.5 | % |
| 83,517 |
| 6.5 | % |
Company | |
| 183,199 |
| 14.3 | % |
| 57,820 |
| 4.5 | % |
| N/A |
| N/A | |
| | | | | | | | | | | | Minimum to be well |
| |||
| | Actual | | Minimum for capital adequacy | | capitalized |
| |||||||||
(Dollars in thousands) |
| Amount |
| Ratio |
| Amount |
| Ratio |
| Amount |
| Ratio |
| |||
December 31, 2019 | |
|
|
|
| |
|
|
|
| |
|
|
|
| |
Total capital ratio | |
|
|
|
| |
|
|
|
| |
|
|
|
| |
Bank | | $ | 95,662 |
| 13.6 | % | $ | 56,091 |
| 8.0 | % | $ | 70,114 |
| 10.0 | % |
Company | |
| 86,531 |
| 12.3 | % |
| 56,091 |
| 8.0 | % |
| N/A |
| N/A | |
Tier 1 capital ratio | |
|
|
|
| |
|
|
|
| |
|
|
|
| |
Bank | |
| 88,506 |
| 12.6 | % |
| 42,069 |
| 6.0 | % |
| 56,091 |
| 8.0 | % |
Company | |
| 79,375 |
| 11.3 | % |
| 42,069 |
| 6.0 | % |
| N/A |
| N/A | |
Tier1 leverage ratio | |
|
|
|
| |
|
|
|
| |
|
|
|
| |
Bank | |
| 88,506 |
| 8.7 | % |
| 40,889 |
| 4.0 | % |
| 51,112 |
| 5.0 | % |
Company | |
| 79,375 |
| 7.8 | % |
| 40,889 |
| 4.0 | % |
| N/A |
| N/A | |
Common equity tier 1 capital ratio | |
|
|
|
| |
|
|
|
| |
|
|
|
| |
Bank | |
| 88,506 |
| 12.6 | % |
| 31,551 |
| 4.5 | % |
| 45,574 |
| 6.5 | % |
Company | |
| 79,375 |
| 11.3 | % |
| 31,551 |
| 4.5 | % |
| N/A |
| N/A | |
Liquidity
In general terms, liquidity is a measurement of our ability to meet our cash needs. Our objective in managing our liquidity is to maintain our ability to fund loan commitments, purchase securities, accommodate deposit withdrawals or repay other liabilities in accordance with their terms, without an adverse impact on our current or future earnings. Our liquidity strategy is guided by policies that are formulated and monitored by our Asset Liability Management Committee, or ALCO, and senior management, including our Liquidity Contingency Policy, and which take into account the marketability of assets, the sources and stability of funding and the level of unfunded commitments. We regularly evaluate all of our various funding sources with an emphasis on accessibility, stability, reliability and cost-effectiveness. Our principal source of funding has been our clients’ deposits, supplemented by our short-term borrowings, primarily from FHLB borrowings. We believe that the cash generated from operations, our borrowing capacity and our access to capital resources are sufficient to meet our future operating capital and funding requirements.
At June 30, 2020, we had the ability to generate approximately $194.3 million in additional liquidity through all of our available resources beyond our overnight funds sold position. In addition to the primary borrowing outlets mentioned above, we also have the ability to generate liquidity by borrowing from the Federal Reserve Discount Window and through brokered deposits. We recognize the importance of maintaining liquidity and have developed a Contingent Liquidity Plan, which addresses various liquidity stress levels and our response and action based on the level of severity. We periodically test our credit facilities for access to the funds, but also understand that as the severity of the liquidity level increases, certain credit facilities may no longer be available. We conduct quarterly liquidity stress tests and the results are reported to our Asset-Liability Management Committee and our Board. We believe the liquidity available to us is currently sufficient to meet our ongoing needs.
50
We also view our investment portfolio as a liquidity source and have the option to pledge securities in our portfolio as collateral for borrowings or deposits, and/or sell selected securities. Our portfolio primarily consists of debt issued by the federal government and governmental agencies. The weighted-average maturity of our portfolio was 2.87 years and 3.50 years at June 30, 2020 and December 31, 2019, respectively, and had a net unrealized pre-tax gain of $1.0 million and pre-tax loss of $0.1 million, respectively, in our available for sale securities portfolio as of those dates.
As we deploy our capital and continue to grow our operations, we maintain cash in our Holding Company for added liquidity. As of June 30, 2020, cash held at the Holding Company was approximately $39 million. Our average net overnight funds sold position (defined as funds sold plus interest-bearing deposits with other banks less funds purchased) was $33.9 million during six months ended months of 2020 compared to an average net overnight funds sold position of $25.3 million for the year ended December 31, 2019. As we have continued to experience high organic growth, we have preferred to maintain our excess liquidity in assets with greater liquidity, such as federal funds sold, as opposed to less liquid, but slightly higher yielding, assets, like investment securities.
We expect our capital expenditures over the next 12 months to be approximately $0.5 million, which will consist primarily of investments in consolidation of the remaining technology from the MBI acquisition, business applications, information technology security needs as well as furniture, fixtures and equipment for our new banking offices. We expect that these capital expenditures will be funded with existing resources without impairing our ability to meet our ongoing obligations.
Inflation
The impact of inflation on the banking industry differs significantly from that of other industries in which a large portion of total resources are invested in fixed assets such as property, plant and equipment. Assets and liabilities of financial institutions are primarily all monetary in nature, and therefore are principally impacted by interest rates rather than changing prices. While the general level of inflation underlies most interest rates, interest rates react more to changes in the expected rate of inflation and to changes in monetary and fiscal policy.
Contractual Obligations
We have contractual obligations to make future payments on debt and lease agreements. While our liquidity monitoring and management consider both present and future demands for and sources of liquidity, the following table of contractual commitments focuses only on future obligations and summarizes our contractual obligations as of June 30, 2020.
| | | | | | | | Due After | | | | | | | |
| | | | | Due after One | | Three | | | | | | | ||
| | Due in One | | Through Three | | Through | | Due After | | | | ||||
(Dollars in thousands) |
| Year or Less |
| Years |
| Five Years |
| Five Years |
| Total | |||||
FHLB Advances | | $ | 25,077 | | $ | — | | $ | 30,000 | | $ | 10,000 | | $ | 65,077 |
PPPLF Advances | | | — | | | 215,608 | | | 2,472 | | | — | | | 218,080 |
Certificates of deposit $100,000 or more | |
| 194,945 | |
| 39,515 | |
| 971 | |
| — | |
| 235,431 |
Certificates of deposit less than $100,000 | |
| 19,496 | |
| 3,100 | |
| 222 | |
| — | |
| 22,818 |
Operating leases | |
| 1,604 | |
| 2,427 | |
| 2,078 | |
| 1,587 | |
| 7,696 |
Subordinated debt | | | — | | | — | | | — | | | 9,932 | | | 9,932 |
Total | | $ | 241,122 | | $ | 260,650 | | $ | 35,743 | | $ | 21,519 | | $ | 559,034 |
Off-Balance Sheet Items
In the normal course of business, we enter into various transactions that, in accordance with GAAP, are not included in our consolidated balance sheets. We enter into these transactions to meet the financing needs of our clients. These transactions include commitments to extend credit and issue letters of credit, which involve, to varying degrees, elements of credit risk and interest rate risk in excess of the amounts recognized in our consolidated balance sheets. Our exposure to credit loss is represented by the contractual amounts of these commitments. The same credit policies and procedures are used in making these commitments as for on-balance sheet instruments. We are not aware of any accounting loss to be incurred by funding these commitments, however we maintain an allowance for off-balance sheet credit risk which is recorded in other liabilities on the consolidated balance sheet.
51
Our commitments associated with outstanding letters of credit and commitments to extend credit expiring by period as of the date indicated are summarized below. Since commitments associated with letters of credit and commitments to extend credit may expire unused, the amounts shown do not necessarily reflect the actual future cash funding requirements.
(Dollars in thousands) | | June 30, 2020 | | December 31, 2019 | ||
Unfunded lines of credit | | $ | 309,962 | | $ | 113,903 |
Commitments to extend credit | |
| 9,944 | |
| 23,052 |
Letters of credit | |
| 9,495 | |
| 9,168 |
Total credit extension commitments | | $ | 329,401 | | $ | 146,123 |
Unfunded lines of credit represent unused portions of credit facilities to our current borrowers that represent no change in credit risk in our portfolio. Lines of credit generally have variable interest rates. The maximum potential amount of future payments we could be required to make is represented by the contractual amount of the commitment, less the amount of any advances made.
Letters of credit are conditional commitments issued by us to guarantee the performance of a client to a third party. In the event of nonperformance by the client in accordance with the terms of the agreement with the third party, we would be required to fund the commitment. If the commitment is funded, we would be entitled to seek recovery from the client from the underlying collateral, which can include commercial real estate, physical plant and property, inventory, receivables, cash or marketable securities.
Our policies generally require that letter of credit arrangements contain security and debt covenants similar to those contained in loan agreements and our credit risk associated with issuing letters of credit is similar to the credit risk involved in extending loan facilities to our clients. The effect on our revenue, expenses, cash flows, and liquidity of the unused portions of these letters of credit commitments and letters of credit cannot be precisely predicted because there is no guarantee that the lines of credit will be used.
Commitments to extend credit are agreements to lend funds to a client, as long as there is no violation of any condition established in the contract, for a specific purpose. Commitments generally have variable interest rates, fixed expiration dates or other termination clauses and may require payment of a fee. Since many of the commitments are expected to expire without being fully drawn, the total commitment amounts disclosed above do not necessarily represent future cash requirements. We evaluate each client’s creditworthiness on a case-by-case basis. The amount of collateral obtained, if considered necessary by us, upon extension of credit is based on management’s credit evaluation of the client.
We enter into forward commitments for the delivery of mortgage loans in our current pipeline. Interest rate lock commitments are entered into in order to economically hedge the effect of changes in interest rates resulting from our commitments to fund the loans. These commitments to fund mortgage loans, to be sold into the secondary market, (interest rate lock commitments) and forward commitments for the future delivery of mortgage loans to third party investors are considered derivatives. We attempt to minimize our exposure to loss under credit commitments by subjecting them to the same credit approval and monitoring procedures as we do for on-balance sheet instruments.
Certain Performance Metrics
The following table shows the return on average assets (computed as annualized net income divided by average total assets), return on average equity (computed as annualized net income divided by average equity) and average equity to average assets ratios for the six months ended June 30, 2020 and for the year ended December 31, 2019.
|
| Six Months Ended | | Year Ended | |
|
| June 30, 2020 | | December 31, 2019 |
|
Return on Average Assets | | 0.24 | % | 0.26 | % |
Return on Average Equity | | 2.31 | % | 2.94 | % |
Average Equity to Average Assets | | 10.24 | % | 8.93 | % |
Market Risk and Interest Rate Sensitivity
Overview
Market risk arises from changes in interest rates, exchange rates, commodity prices, and equity prices. We have risk management policies designed to monitor and limit exposure to market risk and we do not participate in activities that give rise to significant market
52
risk involving exchange rates, commodity prices, or equity prices. In asset and liability management activities, our policies are designed to minimize structural interest rate risk.
Interest Rate Risk Management
Our net income is largely dependent on net interest income. Net interest income is susceptible to interest rate risk to the degree that interest-bearing liabilities mature or reprice on a different basis than interest earning assets. When interest-bearing liabilities mature or reprice more quickly than interest earning assets in a given period, a significant increase in market rates of interest could adversely affect net interest income. Similarly, when interest earning assets mature or reprice more quickly than interest-bearing liabilities, falling market interest rates could result in a decrease in net interest income. Net interest income is also affected by changes in the portion of interest earning assets that are funded by interest-bearing liabilities rather than by other sources of funds, such as noninterest-bearing deposits and shareholders’ equity.
We have established what we believe to be a comprehensive interest rate risk management policy, which is administered by ALCO. The policy establishes limits of risk, which are quantitative measures of the percentage change in net interest income (a measure of net interest income at risk) and the fair value of equity capital (a measure of economic value of equity, or EVE, at risk) resulting from a hypothetical change in interest rates for maturities from one day to 30 years. We measure the potential adverse impacts that changing interest rates may have on our short-term earnings, long-term value, and liquidity by employing simulation analysis through the use of computer modeling. The simulation model captures optionality factors such as call features and interest rate caps and floors imbedded in investment and loan portfolio contracts. As with any method of gauging interest rate risk, there are certain shortcomings inherent in the interest rate modeling methodology used by us. When interest rates change, actual movements in different categories of interest earning assets and interest-bearing liabilities, loan prepayments, and withdrawals of time and other deposits, may deviate significantly from assumptions used in the model. Finally, the methodology does not measure or reflect the impact that higher rates may have on adjustable-rate loan clients’ ability to service their debts, or the impact of rate changes on demand for loan and deposit products.
The balance sheet is subject to testing for interest rate shock possibilities to indicate the inherent interest rate risk. We prepare a current base case and several alternative interest rate simulations (-400, -300, -200, -100,+100, +200, +300 and +400 basis points (bps)), at least once per quarter, and report the analysis to ALCO and our Board. We augment our interest rate shock analysis with alternative interest rate scenarios on a quarterly basis that may include ramps, parallel shifts, and a flattening or steepening of the yield curve (non-parallel shift). In addition, more frequent forecasts may be produced when interest rates are particularly uncertain or when other business conditions so dictate.
Our goal is to structure the balance sheet so that net interest earnings at risk over a 12-month period and the economic value of equity at risk do not exceed policy guidelines at the various interest rate shock levels. We attempt to achieve this goal by balancing, within policy limits, the volume of floating-rate liabilities with a similar volume of floating-rate assets, by keeping the average maturity of fixed-rate asset and liability contracts reasonably matched, by managing the mix of our core deposits, and by adjusting our rates to market conditions on a continuing basis.
53
Analysis
The following table indicates that, for periods less than one year, rate-sensitive assets exceeded rate-sensitive liabilities, resulting in a slightly asset-sensitive position. For a bank with an asset-sensitive position, otherwise referred to as a positive gap, rising interest rates would generally be expected to have a positive effect on net interest income, and falling interest rates would generally be expected to have the opposite effect.
REPRICING GAP
| | | | | After One | | After Three | | | | | | | | | | ||
| | | | | Month | | Months | | | | | Greater than | | | | |||
June 30, 2020 | | Within One | | Through Three | | Through | | Within One | | One Year | | | ||||||
(Dollars in thousands) |
| Month |
| Months |
| 12 Months |
| Year |
| or Nonsensitive |
| Total | ||||||
Assets |
| |
|
| |
|
| |
|
| |
|
| |
|
| |
|
Interest earning assets |
| |
|
| |
|
| |
|
| |
|
| |
|
| |
|
Loans(1) | | $ | 308,794 | | $ | 35,236 | | $ | 143,499 | | $ | 487,529 | | $ | 1,071,918 | | $ | 1,559,447 |
Securities | |
| 25,446 | |
| 9,976 | |
| 3,214 | |
| 38,636 | |
| 69,207 | |
| 107,843 |
Interest-bearing deposits at other financial institutions | |
| 250,661 | |
| — | |
| 249 | |
| 250,910 | |
| — | |
| 250,910 |
Federal funds sold | | | 39,444 | | | — | | | — | | | 39,444 | | | — | | | 39,444 |
FHLB & FRB stock | |
| 9,036 | |
| — | |
| — | |
| 9,036 | |
| — | |
| 9,036 |
Total interest earning assets | | $ | 633,381 | | $ | 45,212 | | $ | 146,962 | | $ | 825,555 | | $ | 1,141,125 | | $ | 1,966,680 |
Liabilities | |
|
| |
|
| |
|
| |
|
| |
|
| |
|
|
Interest-bearing liabilities | |
|
| |
|
| |
|
| |
|
| |
|
| |
|
|
Interest-bearing deposits | | $ | 511,902 | | $ | 99,953 | | $ | 110,311 | | $ | 722,166 | | $ | 536,028 | | $ | 1,258,194 |
Time deposits | |
| 14,681 | |
| 37,017 | |
| 162,743 | |
| 214,441 | |
| 43,808 | |
| 258,249 |
Total interest-bearing deposits | |
| 526,583 | |
| 136,970 | |
| 273,054 | |
| 936,607 | |
| 579,836 | |
| 1,516,443 |
Securities sold under agreements to repurchase | |
| — | |
| — | |
| — | |
| — | |
| — | |
| — |
FHLB Advances | |
| — | |
| 15,077 | |
| 10,000 | |
| 25,077 | |
| 40,000 | |
| 65,077 |
Other Advances PPPLF | | | — | | | — | | | — | | | — | | | 218,080 | | | 218,080 |
Subordinated debt | |
| — | |
| — | |
| — | |
| — | |
| 9,932 | |
| 9,932 |
Total interest-bearing liabilities | | $ | 526,583 | | $ | 152,047 | | $ | 283,054 | | $ | 961,684 | | $ | 847,848 | | $ | 1,809,532 |
Period gap | | $ | 106,798 | | $ | (106,835) | | $ | (136,092) | | $ | (136,129) | | $ | 293,277 | |
|
|
Cumulative gap | | $ | 106,798 | | $ | (37) | | $ | (136,129) | | $ | (136,129) | | $ | 157,148 | |
|
|
Ratio of cumulative gap to total earning assets | |
| 16.86 | % |
| (0.08) | % |
| (92.63) | % |
| (16.49) | % |
| 13.77 | % |
|
|
Ratio of cumulative gap to cumulative total earning assets | |
| 5.43 | % |
| (0.00) | % |
| (6.92) | % |
| (6.92) | % |
| 7.99 | % |
|
|
| (1) | Includes loans held for resale |
54
CASH FLOW GAP
|
| | |
| After One |
| After Three |
| | |
| | |
|
| | ||
| | | | | Month | | Months | | | | | Greater than | |
| | |||
June 30, 2020 | | Within One | | Through Three | | Through | | Within One | | One Year | |
| | |||||
(Dollars in thousands) | | Month | | Months | | 12 Months | | Year | | or Nonsensitive | | Total | ||||||
Assets |
| |
|
| |
|
| |
|
| |
|
| |
|
| |
|
Interest earning assets |
| |
|
| |
|
| |
|
| |
|
| |
|
| |
|
Loans(1) | | $ | 121,268 | | $ | 210,967 | | $ | 306,512 | | $ | 638,747 | | $ | 920,700 | | $ | 1,559,447 |
Securities | |
| 4,873 | |
| 3,914 | |
| 13,430 | |
| 22,217 | |
| 85,626 | |
| 107,843 |
Interest-bearing deposits at other financial institutions | |
| 250,661 | |
| — | |
| 249 | |
| 250,910 | | | — | |
| 250,910 |
Federal funds sold | | | 39,444 | | | — | | | — | | | 39,444 | | | — | | | 39,444 |
FHLB & FRB stock | |
| — | |
| — | |
| — | |
| — | |
| 9,036 | |
| 9,036 |
Total interest earning assets | | $ | 416,246 | | $ | 214,881 | | $ | 320,191 | | $ | 951,318 | | $ | 1,015,362 | | $ | 1,966,680 |
Liabilities | |
|
| |
|
| |
|
| |
|
| |
|
| |
|
|
Interest-bearing liabilities | |
|
| |
|
| |
|
| |
|
| |
|
| |
|
|
Interest-bearing deposits | | $ | 44,646 | | $ | 89,292 | | $ | 312,216 | | $ | 446,154 | | $ | 812,040 | | $ | 1,258,194 |
Time deposits | |
| 14,681 | |
| 37,017 | |
| 162,743 | |
| 214,441 | |
| 43,808 | |
| 258,249 |
Total interest-bearing deposits | |
| 59,327 | |
| 126,309 | |
| 474,959 | |
| 660,595 | |
| 855,848 | |
| 1,516,443 |
Securities sold under agreements to repurchase | |
| — | |
| — | |
| — | |
| — | |
| — | |
| — |
FHLB Advances | |
| 3,097 | |
| 21,200 | |
| 7,974 | |
| 32,271 | |
| 32,806 | |
| 65,077 |
Other Advances PPPLF | | | 36,319 | | | 72,673 | | | 109,088 | | | 218,080 | | | — | | | 218,080 |
Subordinated debt | |
| — | |
| — | |
| — | |
| — | |
| 9,932 | |
| 9,932 |
Total interest-bearing liabilities | | $ | 98,743 | | $ | 220,182 | | $ | 592,021 | | $ | 910,946 | | $ | 898,586 | | $ | 1,809,532 |
Period gap | | $ | 317,503 | | $ | (5,301) | | $ | (271,830) | | $ | 40,372 | | $ | 116,776 | |
| |
Cumulative gap | | $ | 317,503 | | $ | 312,202 | | $ | 40,372 | | $ | 40,372 | | $ | 157,148 | |
| |
Ratio of cumulative gap to total earning assets | |
| 76.28 | % |
| 145.29 | % |
| 12.61 | % |
| 4.24 | % |
| 15.48 | % |
| |
| (1) | Includes loans held for sale |
Measures of net interest income at risk produced by simulation analysis are indicators of an institution’s short-term performance in alternative rate environments. These measures are typically based upon a relatively brief period, and do not necessarily indicate the long-term prospects or economic value of the institution.
The following table summarizes the results of our net interest income at risk analysis in simulating the change in net interest income and fair value of equity over a 12-month and 24-month horizon as of June 30, 2020 and December 31, 2019 and 2018.
Net Interest Income at Risk – 12 months |
| -400bps |
| -300bps |
| -200bps |
| -100bps |
| Flat |
| +100bps |
| +200bps |
| +300bps |
| +400bps |
|
Policy Limit |
| (20.0) | % | (15.0) | % | (10.0) | % | (5.0) | % | N/A |
| 10.0 | % | 15.0 | % | 20.0 | % | 25.0 | % |
June 30, 2020 |
| (11.6) | % | (8.8) | % | (5.6) | % | (2.5) | % | N/A |
| 2.3 | % | 4.8 | % | 7.4 | % | 9.9 | % |
December 31, 2019 |
| (9.9) | % | (6.6) | % | (4.7) | % | (1.6) | % | N/A |
| 0.6 | % | 0.8 | % | 1.0 | % | 1.2 | % |
December 31, 2018 |
| (11.8) | % | (8.2) | % | (5.6) | % | (4.3) | % | N/A |
| 3.6 | % | 7.0 | % | 10.5 | % | 13.9 | % |
| | | | | | | | | | | | | | | | | | | |
Net Interest Income at Risk – 24 months |
| -400bps |
| -300bps |
| -200bps |
| -100bps |
| Flat |
| +100bps |
| +200bps |
| +300bps |
| +400bps |
|
Policy Limit |
| (20.0) | % | (15.0) | % | (10.0) | % | (5.0) | % | N/A |
| 10.0 | % | 15.0 | % | 20.0 | % | 25.0 | % |
June 30, 2020 |
| (14.8) | % | (11.2) | % | (7.2) | % | (3.3) | % | N/A |
| 3.6 | % | 7.2 | % | 10.3 | % | 13.3 | % |
December 31, 2019 |
| (16.1) | % | (12.0) | % | (7.7) | % | (2.7) | % | N/A |
| 1.3 | % | 2.3 | % | 3.1 | % | 3.7 | % |
December 31, 2018 |
| (18.4) | % | (13.7) | % | (10.2) | % | (6.2) | % | N/A |
| 5.0 | % | 9.8 | % | 14.7 | % | 19.6 | % |
Using an EVE, we analyze the risk to capital from the effects of various interest rate scenarios through a long-term discounted cash flow model. This measures the difference between the economic value of our assets and the economic value of our liabilities, which is an estimate of liquidation value. While this provides some value as a risk measurement tool, management believes net interest income at risk is more appropriate in accordance with the going concern principle.
55
The following table illustrates the results of our EVE analysis as of June 30, 2020 and December 31, 2019 and 2018.
Economic Value of Equity as of |
| -400bps |
| -300bps |
| -200bps |
| -100bps |
| Flat |
| +100bps |
| +200bps |
| +300bps |
| +400bps |
|
Policy Limit |
| (30.0) | % | (20.0) | % | (15.0) | % | (10.0) | % | N/A |
| 17.5 | % | 22.5 | % | 27.5 | % | 37.5 | % |
June 30, 2020 |
| (2.3) | % | (1.3) | % | 0.0 | % | 1.3 | % | N/A |
| (3.4) | % | (7.0) | % | (11.0) | % | (15.2) | % |
December 31, 2019 |
| (5.3) | % | (0.4) | % | 0.7 | % | 0.6 | % | N/A |
| (3.7) | % | (8.2) | % | (13.2) | % | (19.0) | % |
December 31, 2018 |
| (4.2) | % | (0.7) | % | 1.8 | % | (0.5) | % | N/A |
| (2.6) | % | (5.0) | % | (7.2) | % | (9.7) | % |
Critical Accounting Policies and Estimates
Our consolidated financial statements are prepared in accordance with GAAP and with general practices within the financial services industry. Application of these principles requires management to make estimates and assumptions that affect the amounts reported in the consolidated financial statements and accompanying notes. We base our estimates on historical experience and on various other assumptions that we believe to be reasonable under current circumstances. These assumptions form the basis for our judgments about the carrying values of assets and liabilities that are not readily available from independent, objective sources. We evaluate our estimates on an ongoing basis. Use of alternative assumptions may have resulted in significantly different estimates. Actual results may differ from these estimates.
We have identified the following accounting policies and estimates that, due to the difficult, subjective, or complex judgments and assumptions inherent in those policies and estimates and the potential sensitivity of the financial statements to those judgments and assumptions, are critical to an understanding of our financial condition and results of operations. We believe that the judgments, estimates and assumptions used in the preparation of the consolidated financial statements are appropriate.
Allowance for Loan Losses
The allowance for loan losses provides for probable incurred losses in the loan portfolio based upon management’s best assessment of the loan portfolio at each balance sheet date. It is maintained at a level estimated to be adequate to absorb potential losses through periodic charges to the provision for loan losses.
The allowance for loan losses consists of specific and general reserves. Specific reserves relate to loans classified as impaired. Loans are considered impaired when, based on current information and events, it is probable that we will be unable to collect all amounts due in accordance with the contractual terms of the loan. Impaired loans include troubled debt restructurings, and performing and nonperforming loans. Impaired loans are reviewed individually and a specific allowance is allocated, if necessary, based on evaluation of either the fair value of the collateral underlying the loan or the present value of future cash flows calculated using the loan’s existing interest rate. General reserves relate to the remainder of the loan portfolio, including overdrawn deposit accounts, and are based on evaluation of a number of factors, such as current economic conditions, the quality and composition of the loan portfolio, loss history, and other relevant factors.
Our loans are generally secured by specific items of collateral including real property, consumer assets, and business assets. However, the ability of borrowers to honor their contractual repayment obligations is substantially dependent on changing economic conditions. Because of the uncertainties associated with economic conditions, collateral values, and future cash flows on impaired loans, it is reasonably possible that management’s estimate of loan losses in the loan portfolio and the amount of the allowance needed may change in the future. The determination of the allowance for loan losses is, in large part, based on estimates that are particularly susceptible to significant changes in the economic environment and market conditions. In situations where the repayment of a loan is dependent on the value of the underlying collateral, an independent appraisal of the collateral’s current market value is customarily obtained and used in the determination of the allowance for loan loss.
While management uses available information to recognize losses on loans, further reductions in the carrying amounts of loans may be necessary based on changes in economic conditions. Also regulatory agencies, as an integral part of their examination process, periodically review management’s assessments of the adequacy of the allowance for loan losses. Such agencies may require us to recognize additional losses based on their judgments about information available to them at the time of their examination.
Fair Value Measurements
Fair value is the price that would be received to sell an asset or paid to transfer a liability in the principal or most advantageous market for an asset or liability in an orderly transaction between market participants at the measurement date. The degree of management judgment involved in determining the fair value of a financial instrument is dependent upon the availability of quoted market prices or
56
observable market inputs. For financial instruments that are traded actively and have quoted market prices or observable market inputs, there is minimal subjectivity involved in measuring fair value. However, when quoted market prices or observable market inputs are not fully available, significant management judgment may be necessary to estimate fair value. In developing our fair value estimates, we maximize the use of observable inputs and minimize the use of unobservable inputs.
The fair value hierarchy defines Level 1 valuations as those based on quoted prices (unadjusted) for identical assets or liabilities in active markets. Level 2 valuations include inputs based on quoted prices for similar assets or liabilities in active markets, and inputs that are observable for the asset or liability, either directly or indirectly, for substantially the full term of the financial instrument. Level 3 valuations are based on at least one significant assumption not observable in the market, or significant management judgment or estimation, some of which may be internally developed.
Financial assets that are recorded at fair value on a recurring basis include investment securities available for sale, and loans held for sale.
Recent Accounting Pronouncements
The following provides a brief description of accounting standards that have been issued but are not yet adopted that could have a material effect on the our financial statements. Please also refer to the Notes to our consolidated financial statements included in this annual report for a full description of recent accounting pronouncements, including the respective expected dates of adoption and anticipated effects on our results of operations and financial condition.
ASU 2016-13, Financial Instruments — Credit Loses (Topic 326)
In June 2016, FASB issued guidance to replace the incurred loss model with an expected loss model, which is referred to as the current expected credit loss, or CECL, model. The CECL model is applicable to the measurement of credit losses on financial assets measured at amortized cost, including loan receivables and held to maturity debt securities. It also applies to off-balance sheet credit exposures not accounted for as insurance (i.e. loan commitments, standby letters of credit, financial guarantees and other similar instruments). We anticipated that this ASU would be effective for us on January 1, 2021, but the FASB announced on October 16, 2019, a delay of the effective date of ASU 2016-13 for smaller reporting companies until January 1, 2023. We are in the process of evaluating and implementing changes to credit loss estimation models and related processes. Updates to business processes and the documentation of accounting policy decisions are ongoing. We may recognize an increase in the allowance for credit losses upon adoption, recorded as a one-time cumulative adjustment to retained earnings. However, the magnitude of the impact on our consolidated financial statements has not yet been determined.
Explanation of Certain unaudited non-GAAP Financial Measures
This press release contains financial information determined by methods other than U.S. Generally Accepted Accounting Principles (“GAAP”), including adjusted net income and adjusted net income per share, which we refer to “non-GAAP financial measures.” The table below provides a reconciliation between these non-GAAP measures and net income and net income per share, which are the most comparable GAAP measures.
Management uses these non-GAAP financial measures in its analysis of the Company’s performance and believes these measures are useful supplemental information that can enhance investors’ understanding of the Company’s business and performance without considering taxes or provisions for loan losses and can be useful when comparing performance with other financial institutions. However, these non-GAAP financial measures should not be considered in isolation or as a substitute for the comparable GAAP measures.
57
Reconciliation of non-GAAP Financial Measures
| | Three Months Ended June 30, | | Six Months Ended June 30, | ||||||||
|
| 2020 |
| 2019 |
| 2020 |
| 2019 | ||||
Adjusted net income (non-GAAP) | | |
|
| |
| | |
|
| |
|
Net income (GAAP) | | $ | 3,131 | | $ | 499 | | $ | 1,814 | | $ | 854 |
Less: income tax provision (benefit) | |
| 830 | |
| 223 | |
| 733 | |
| 352 |
Less: provision loan losses | | | 1,750 | | | 495 | | | 2,595 | | | 382 |
Pre-tax pre-provision net income (non-GAAP) | | $ | 5,711 | | $ | 1,217 | | $ | 5,142 | | $ | 1,588 |
Adjusted net income per share (non-GAAP) | |
| | |
| | |
| | |
| |
Earnings per share (GAAP) | | $ | 0.23 | | $ | 0.08 | | $ | 0.16 | | $ | 0.14 |
Effect of non-GAAP adjustments | |
| 0.19 | |
| 0.12 | |
| 0.29 | |
| 0.12 |
Adjusted net income per share (non-GAAP) | | $ | 0.42 | | $ | 0.20 | | $ | 0.45 | | $ | 0.26 |
Item 3. Quantitative and Qualitative Disclosures About Market Risk.
Not Applicable.
Item 4. Controls and Procedures.
Evaluation of Disclosure Control Procedures
As of June 30, 2020, the Company’s management, with the participation of its Chief Executive Officer and Chief Accounting Officer has evaluated the effectiveness of the Company’s disclosure controls and procedures (as defined in Rule 13a-15(e) and Rule 15d-15(e) under the Exchange Act). Based on that evaluation our Chief Executive Officer and Chief Accounting Officer each concluded that as of June 30, 2020, the period covered by this Form 10-Q, we maintained effective disclosure controls and procedures.
Changes in Internal Control over Financial Reporting
There have been no changes to the Company’s internal control over financial reporting that have occurred during our most recently completed fiscal quarter that have materially affected, or are reasonably likely to materially affect, the Company’s internal control over financial reporting.
The Company is periodically party to or otherwise involved in legal proceedings arising in the normal course of business. The Company assesses, in conjunction with its legal counsel, the need to record a liability for litigation and related contingencies. In management’s opinion, there is no known pending legal proceedings, the outcome of which would, individually or in the aggregate, have a material adverse effect on our consolidated results of operations or consolidated financial position.
In addition to the other information set forth in this report, you should consider the factors discussed in “Part I, Item 1A. Risk Factors” in our Annual Report on Form 10-K for the year ended December 31, 2019, which could materially affect our business, financial condition and prospective results. The risks described in this report, in our Annual Report on Form 10-K and our other SEC filings are not the only risks facing our Company. Additional risks and uncertainties not currently known to us or that we currently deem to be immaterial also may materially adversely affect our business, financial condition or future results.
The following Supplemental risk factors related to COVID-19 should be considered along with the Risk Factors found in Part I, Item 1A of our Annual Report on Form 10-K for the year ended December 31, 2019.
58
The recent global COVID-19 pandemic has led to significant economic disruption and uncertainty and has had, and may continue to have, an adverse effect on our customers and our business, financial conditions, and results of operations.
The public health crisis caused by the COVID-19 pandemic and the measures being taken by governments, businesses including us, and the public at large to limit the spread of COVID-19’s spread have severely disrupted almost all economic activity in the U.S., including the Miami-Dade MSA. Despite the partial lifting of federal and state shelter in-place orders, some of which have been renewed, it remains unknown when there will be a return to normal economic activity due to the recent rise in cases and increased economic stress associated with the pandemic. The Company has taken steps to reduce in-branch activity and the majority of the Company’s workforce is working remotely. Commercial clients are experiencing varying levels of disruptions or restrictions on their business activity and consumer clients are experiencing interrupted income or unemployment. Certain industries have been particularly susceptible to the effects of the pandemic, such as hotels and hospitality and the Company has outstanding loans to Companies in these industries. The global finance markets have also experienced significant volatility. The impact of the pandemic has had a negative impact on our business and could continue to cause negative impacts and disruptions to our business including, without limitation the following:
| ● | Deteriorating economic and political conditions in our market, such as increased unemployment, decreases in disposable income, declines in consumer confidence, or economic slowdowns or recessions could harm our customers. |
| ● | The Federal Reserve has lowered short term interest rates and started a “quantitative easing” program which may or may not lower longer-term rates. |
| ● | The 10-year and 30-year Treasury securities may or may not remain at historically low rates. |
| ● | The negative impact on our customers and the credit quality of our loan portfolio. |
| ● | The government relief legislation designed to support businesses and the economy may or may not decrease layoffs, furloughs, insolvencies, bankruptcies, foreclosures, or otherwise support the economy. |
| ● | The Company’s participation in government programs related to the pandemic such as the PPP could expose the Company to increased risk, including litigation or regulatory actions. |
The ultimate impact on the Company’s financial condition, results of operations, and liquidity and capital positions will depend on future developments, which are highly uncertain and cannot be reasonably predicted, including the duration and severity of the COVID-19 pandemic and its impact on our principal areas of operations and nationally. Moreover, the effects of the COVID-19 pandemic will heighten the other risks described in the section entitled “Risk-Factors” in the Company’s most recent Annual Report on Form 10-K and any subsequent Quarterly Report on Form 10-Q or Current Report on Form 8-K filed by the Company.
Item 2. Unregistered Sales of Equity Securities and Use of Proceeds.
| (a) | Not applicable. |
| (b) | Not applicable. |
| (c) | Purchases of Equity Securities by the Issuer and Affiliated Purchasers. |
As previously reported, on March 2, 2020, the Company’s Board of Directors authorized the purchase from time to time of up to $10 million of the Company’s Class A Common Stock. Under this program, shares may be repurchased in privately negotiated and/or open market
59
transactions, including under plans complying with Rule 10b5-1 under the Exchange Act. As of August 14, 2020, purchases totaling $5.0 million had been made under this program. Share repurchase activity during the six months ended June 30, 2020 was as follows:
| | | | | | Total Number | | | | |
| | | | | | | of Shares | | | |
| | | | | | | Purchased as | | Approximate Dollar | |
| | | | | | | Part of | | Value of | |
| | | | Average | | Publicly | | Shares That May Yet Be | ||
| | Total Number | | Price | | Announced | | Purchased | ||
| | of Shares | | Paid Per | | Plans or | | Under the Plans or | ||
Periods |
| Purchased |
| Share |
| Programs |
| Programs | ||
April 1, 2020 to April 30, 2020: |
| | | | | | | | | |
Open market purchases |
| 126,938 | | $ | 15.93 |
| | | $ | 5,875,344 |
| | | | | | | | | | |
May 1, 2020 to May 31, 2020: |
| | | | | | | | | |
Open market purchases |
| 55,159 | | $ | 15.46 |
| | | $ | 5,022,844 |
| | | | | | | | | | |
June 1, 2020 to June 30, 2020: |
| | | | | | | | | |
Open market purchases |
| - | | $ | — |
| - | | $ | 5,022,844 |
Total |
| 182,097 | | $ | 15.79 |
| 315,294 | | $ | 5,022,844 |
Item 3. Defaults Upon Senior Securities.
None.
Item 4. Mine Safety Disclosures.
Not Applicable.
None.
EXHIBIT INDEX
Exhibit No. | | Description of Exhibit |
|---|---|---|
31.1 | | Certification of the CEO pursuant to Sec. 301 of the Sarbanes Oxley Act of 2002. |
31.2 | | Certification of the CAO pursuant to Sec. 301 of the Sarbanes Oxley Act of 2002. |
32.1 | | |
32.2 | | |
101 | | XBRL Instance Document |
101 | | XBRL Taxonomy Extension Schema Document |
101 | | XBRL Taxonomy Extension Calculation Linkbase Document |
101 | | XBRL Taxonomy Definition Linkbase Document |
101 | | XBRL Taxonomy Extension Labels Linkbase Document |
101 | | XBRL Taxonomy Extension Presentation Linkbase Document |
60
Pursuant to the requirements of the Securities Exchange Act of 1943, the registrant has duly caused this Report to be signed on its behalf by the undersigned, thereunto duly authorized on August 14, 2020.
| PROFESSIONAL HOLDING CORP. | |
| | |
By: | /s/Daniel R. Sheehan | |
| | Daniel R. Sheehan |
| | Chairman and Chief Executive Officer |
Pursuant to the requirements of the Securities Exchange Act of 1943, this Report has been signed by the following persons in the capacities set forth opposite their names and on the dates indicated.
Signature |
| Title |
| Date |
|---|---|---|---|---|
| | | | |
/s/ Daniel R. Sheehan | | Chairman and Chief Executive Officer | | August 14, 2020 |
Daniel R. Sheehan | | (Principal Executive Officer) | | |
| | | | |
/s/ Mary Usategui | | Chief Accounting Officer | | August 14, 2020 |
Mary Usategui | | (Principal Financial Officer and Principal Accounting Officer) | | |
| | | | |
/s/ Rolando DiGasbarro | | Director | | August 14, 2020 |
Rolando DiGasbarro | | | | |
| | | | |
/s/ Norman Edelcup | | Director | | August 14, 2020 |
Norman Edelcup | | | | |
| | | | |
/s/ Carlos M.Garcia | | Director | | August 14, 2020 |
Carlos M. Garcia | | | | |
| | | | |
/s/ Jon L. Gorney | | Director | | August 14, 2020 |
Jon L. Gorney | | | | |
| | | | |
/s/ Abel L. Iglesias | | Director | | August 14, 2020 |
Abel L. Iglesias | | | | |
| | | | |
/s/ Herbert Martens, Jr | | Director | | August 14, 2020 |
Herbert Martens, Jr. | | | | |
| | | | |
/s/ Lawrence Schimmel | | Director | | August 14, 2020 |
Dr. Lawrence Schimmel, M.D. | | | | |
| | | | |
/s/ Anton V. Schutz | | Director | | August 14, 2020 |
Anton V. Schutz | | | | |
61