Attached files
| file | filename |
|---|---|
| EX-32.2 - EX-32.2 - ENNIS, INC. | ebf-ex322_11.htm |
| EX-32.1 - EX-32.1 - ENNIS, INC. | ebf-ex321_9.htm |
| EX-31.2 - EX-31.2 - ENNIS, INC. | ebf-ex312_10.htm |
| EX-31.1 - EX-31.1 - ENNIS, INC. | ebf-ex311_7.htm |
| EX-23 - EX-23 - ENNIS, INC. | ebf-ex23_8.htm |
| EX-21 - EX-21 - ENNIS, INC. | ebf-ex21_6.htm |
| EX-4.1 - EX-4.1 - ENNIS, INC. | ebf-ex41_229.htm |
UNITED STATES
SECURITIES AND EXCHANGE COMMISSION
Washington, D.C. 20549
FORM 10-K
|
☒ |
Annual Report Pursuant to Section 13 or 15(d) of the Securities Exchange Act of 1934 |
For the fiscal year ended February 29, 2020
OR
|
☐ |
Transition Report Pursuant to Section 13 or 15(d) of the Securities Exchange Act of 1934 |
For the transition period from __________ to __________
Commission File Number 1-5807
ENNIS, INC.
(Exact Name of Registrant as Specified in Its Charter)
|
Texas |
|
75-0256410 |
|
(State or Other Jurisdiction of Incorporation or Organization) |
|
(I.R.S. Employer Identification No.) |
|
2441 Presidential Pkwy., Midlothian, Texas |
|
76065 |
|
(Address of Principal Executive Offices) |
|
(Zip code) |
(Registrant’s Telephone Number, Including Area Code) (972) 775-9801
Securities registered pursuant to Section 12(b) of the Act:
|
Title of each class |
|
Trading Symbol(s) |
|
Name of each exchange on which registered |
|
Common Stock, par value $2.50 per share |
|
EBF |
|
New York Stock Exchange |
Securities registered pursuant to Section 12(g) of the Act: None
Indicate by check mark if the Registrant is a well-known seasoned issuer, as defined in Rule 405 of the Securities Act. Yes ☐ No ☒
Indicate by check mark if the Registrant is not required to file reports pursuant to Section 13 or Section 15(d) of the Act. Yes ☐ No ☒
Indicate by check mark whether the Registrant (1) has filed all reports required to be filed by Section 13 or 15(d) of the Securities Exchange Act of 1934 during the preceding 12 months (or for such shorter period that the Registrant was required to file such reports), and (2) has been subject to such filing requirements for the past 90 days. Yes ☒ No ☐
Indicate by check mark whether the registrant has submitted electronically every Interactive Data File required to be submitted pursuant to Rule 405 of Regulation S-T (§232.405 of this chapter) during the preceding 12 months (or for such shorter period that the registrant was required to submit such files). Yes ☒ No ☐
Indicate by check mark whether the registrant is a large accelerated filer, an accelerated filer, a non-accelerated filer, a smaller reporting company or an emerging growth company. See the definitions of “large accelerated filer,” “accelerated filer,” “smaller reporting company” and “emerging growth company” in Rule 12b-2 of the Exchange Act.
|
Large accelerated Filer |
☐ |
|
|
Accelerated filer |
☒ |
|
Non-accelerated filer |
☐ |
|
|
Smaller reporting company |
☐ |
|
Emerging growth company. |
☐ |
|
|
|
|
If an emerging growth company, indicate by check mark if the registrant has elected not to use the extended transition period for complying with any new or revised financial accounting standards provided pursuant to Section 13(a) of the Exchange Act. ☐
Indicate by check mark whether the Registrant is a shell company (as defined in Rule 12b-2 of the Exchange Act). Yes ☐ No ☒
The aggregate market value of voting stock held by non-affiliates of the Registrant as of August 31, 2019 was approximately $507 million. Shares of voting stock held by executive officers, directors and holders of more than 10% of the outstanding voting stock have been excluded from this calculation because such persons may be deemed to be affiliates. Exclusion of such shares should not be construed to indicate that any of such persons possesses the power, direct or indirect, to control the Registrant, or that any such person is controlled by or under common control with the Registrant.
The number of shares of the Registrant’s Common Stock, par value $2.50, outstanding at April 27, 2020 was 26,099,594.
DOCUMENTS INCORPORATED BY REFERENCE
Portions of the Registrant’s Proxy Statement for the 2020 Annual Meeting of Shareholders are incorporated by reference into Part III of this Report.
FORM 10-K
FOR THE PERIOD ENDED FEBRUARY 29, 2020
TABLE OF CONTENTS
|
|
|
|
|
Item 1 |
4 |
|
|
Item 1A |
7 |
|
|
Item 1B |
12 |
|
|
Item 2 |
12 |
|
|
Item 3 |
14 |
|
|
Item 4 |
14 |
|
|
|
|
|
|
|
|
|
|
Item 5 |
14 |
|
|
Item 6 |
16 |
|
|
Item 7 |
Management’s Discussion and Analysis of Financial Condition and Results of Operations |
17 |
|
Item 7A |
27 |
|
|
Item 8 |
27 |
|
|
Item 9 |
Changes in and Disagreements with Accountants on Accounting and Financial Disclosure |
27 |
|
Item 9A |
27 |
|
|
Item 9B |
28 |
|
|
|
|
|
|
|
|
|
|
Item 10 |
29 |
|
|
Item 11 |
29 |
|
|
Item 12 |
Security Ownership of Certain Beneficial Owners and Management and Related |
29 |
|
Item 13 |
Certain Relationships and Related Transactions, and Director Independence |
29 |
|
Item 14 |
29 |
|
|
|
|
|
|
|
|
|
|
Item 15 |
30 |
|
|
|
32 |
2
Cautionary Statements Regarding Forward-Looking Statements
All of the statements in this Annual Report on Form 10-K, other than historical facts, are forward-looking statements, including, without limitation, the statements made in the “Management’s Discussion and Analysis of Financial Condition and Results of Operations,” particularly under the caption “Overview.” As a general matter, forward-looking statements are those focused upon anticipated events or trends, expectations, and beliefs relating to matters that are not historical in nature. The words “could,” “should,” “feel,” “anticipate,” “aim,” “preliminary,” “expect,” “believe,” “estimate,” “intend,” “intent,” “plan,” “will,” “foresee,” “project,” “forecast,” or the negative thereof or variations thereon, and similar expressions identify forward-looking statements.
The Private Securities Litigation Reform Act of 1995 provides a “safe harbor” for these forward-looking statements. In order to comply with the terms of the safe harbor, Ennis, Inc. notes that forward-looking statements are subject to known and unknown risks, uncertainties and other factors relating to its operations and business environment, all of which are difficult to predict and many of which are beyond the control of Ennis, Inc. These known and unknown risks, uncertainties and other factors could cause actual results to differ materially from those matters expressed in, anticipated by or implied by such forward-looking statements.
These statements reflect the current views and assumptions of management with respect to future events. Ennis, Inc. does not undertake, and hereby disclaims, any duty to update these forward-looking statements, even though its situation and circumstances may change in the future. Readers are cautioned not to place undue reliance on forward-looking statements, which speak only as of the date of this report. The inclusion of any statement in this report does not constitute an admission by Ennis, Inc. or any other person that the events or circumstances described in such statement are material.
We believe these forward-looking statements are based upon reasonable assumptions. All such statements involve risks and uncertainties, and as a result, actual results could differ materially from those projected, anticipated or implied by these statements. Such forward-looking statements involve known and unknown risks, including but not limited to, general economic, business and labor conditions and the potential impact on our operations; our ability to implement our strategic initiatives and control our operational costs; dependence on a limited number of key suppliers; our ability to recover the rising cost of raw materials and other costs (including energy, freight, labor, and benefit costs) in markets that are highly price competitive and volatile; the impact of the novel coronavirus (COVID-19) pandemic or future pandemics on the U.S. and local economies, our business operations, our workforce, our supply chain and our customer base; our ability to timely or adequately respond to technological changes in the industry; the impact of the Internet and other electronic media on the demand for forms and printed materials; the impact of foreign competition, tariffs, trade regulations and import restrictions; customer credit risk; competitors’ pricing strategies; a decline in business volume and profitability could result in an impairment in our reported goodwill negatively impacting our operational results; our ability to retain key management personnel; our ability to identify, manage or integrate acquisitions; and changes in government regulations including measures intended to minimize the impact of COVID-19.
3
Overview
Ennis, Inc. (formerly Ennis Business Forms, Inc.) (collectively with its subsidiaries, the “Company,” “Registrant,” “Ennis,” or “we,” “us,” or “our”) was organized under the laws of Texas in 1909. We and our subsidiaries print and manufacture a broad line of business forms and other business products. We distribute business products and forms throughout the United States primarily through independent distributors. This distributor channel encompasses independent print distributors, commercial printers, direct mail, fulfillment companies, payroll and accounts payable software companies, and advertising agencies, among others. We also sell products to many of our competitors to satisfy their customers’ needs.
Business Overview
Our management believes we are the largest provider of business forms, pressure-seal forms, labels, tags, envelopes, and presentation folders to independent distributors in the United States.
We are in the business of manufacturing, designing and selling business forms and other printed business products primarily to distributors located in the United States. We operate 61 manufacturing plants throughout the United States in 21 strategically located states as one reportable segment. Approximately 95% of the business products we manufacture are custom and semi-custom products, constructed in a wide variety of sizes, colors, number of parts and quantities on an individual job basis, depending upon the customers’ specifications.
The products we sell include snap sets, continuous forms, laser cut sheets, tags, labels, envelopes, integrated products, jumbo rolls and pressure sensitive products in short, medium and long runs under the following labels: Ennis®, Royal Business Forms®, Block Graphics®, Specialized Printed Forms®, 360º Custom LabelsSM, ColorWorx®, Enfusion®, Uncompromised Check Solutions®, VersaSeal®, Ad ConceptsSM, FormSource LimitedSM, Star Award Ribbon Company®, Witt Printing®, B&D Litho®, Genforms®, PrintGraphics®, Calibrated Forms®, PrintXcel®, Printegra®, Falcon Business FormsSM, Forms ManufacturersSM, Mutual Graphics®, TRI-C Business FormsSM, Major Business SystemsSM, Independent PrintingSM, Hoosier Data Forms®, Hayes Graphics®, Wright Business GraphicsSM, Wright 360SM, Integrated Print & GraphicsSM, the Flesh CompanySM, Impressions DirectSM, and Ace FormsSM. We also sell the Adams McClure® brand (which provides Point of Purchase advertising for large franchise and fast food chains as well as kitting and fulfillment); the Admore®, Folder Express® and Independent Folders® brands (which provide presentation folders and document folders); Ennis Tag & LabelSM (which provides custom printed, high performance labels and custom and stock tags); Allen-Bailey Tag & LabelSM, Atlas Tag & Label®, Kay Toledo Tag®, and Special Service Partners® (SSP) (which provides custom and stock tags and labels); Trade Envelopes®, Block Graphics®, Wisco®, and National Imprint Corporation® (which provide custom and imprinted envelopes) and Northstar® and General Financial Supply® (which provide financial and security documents).
We sell predominantly through independent distributors, as well as to many of our competitors. Northstar Computer Forms, Inc., one of our wholly-owned subsidiaries, also sells direct to a small number of customers, generally large banking organizations (where a distributor is not acceptable or available to the end-user). Adams McClure, LP, a wholly-owned subsidiary, also sells direct to a small number of customers, where sales are generally through advertising agencies.
The printing industry generally sells its products either predominantly to end users, a market dominated by a few large manufacturers, such as R.R. Donnelley and Sons, Staples, Inc., Standard Register Co. (a subsidiary of Taylor Corporation), and Cenveo, Inc., or, like the Company, through a variety of independent distributors and distributor groups. While it is not possible, because of the lack of adequate public statistical information, to determine the Company’s share of the total business products market, management believes the Company is the largest producer of business forms, pressure-seal forms, labels, tags, envelopes, and presentation folders in the United States distributing primarily through independent distributors.
4
There are a number of competitors that operate in this segment, ranging in size from single employee-owned operations to multi-plant organizations. We believe our strategic locations and buying power permit us to compete on a favorable basis within the distributor market on competitive factors, such as service, quality, and price.
Distribution of business forms and other business products throughout the United States is primarily done through independent distributors, including business forms distributors, resellers, direct mail, commercial printers, payroll and accounts payable software companies, and advertising agencies.
Raw materials principally consist of a wide variety of weights, widths, colors, sizes, and qualities of paper for business products purchased primarily from one major supplier at favorable prices based on the volume of business.
Business products usage in the printing industry is generally not seasonal. General economic conditions and contraction of the traditional business forms industry are the predominant factors in quarterly volume fluctuations.
Recent Acquisitions
We have completed a number of acquisitions in recent years. On July 15, 2019, we acquired all the outstanding stock of The Flesh Company (“Flesh”) for approximately $9.9 million (which includes potential earn-out consideration of up to $500,000) plus the assumption of trade payables, subject to final working capital and certain other adjustments. The earn-out consideration is capped at $500,000 and is payable over the four years following the closing if certain minimum operating income levels are achieved. We recorded intangible assets with definite lives of approximately $1.2 million in connection with the transaction. Flesh, together with its wholly owned subsidiary, Impressions Direct, Inc. (“Impressions Direct”), is a printing company with two locations, with the St. Louis location containing Flesh’s corporate office and the direct mail operations of Impressions Direct, and the Parsons, Kansas location containing Flesh’s main manufacturing facility and warehouse. The acquisition of Flesh, which prior to the acquisition generated approximately $31.0 million in sales for its fiscal year ended September 30, 2018, expands our operations with respect to business forms, checks, direct mail services, integrated products and labels.
On March 16, 2019, we acquired the assets of Integrated Print & Graphics (“Integrated”), which is based in South Elgin, Illinois, for $8.9 million in cash plus the assumption of trade payables, subject to certain adjustments. Goodwill of $893,000 recognized as a part of the acquisition is deductible for tax purposes. We also recorded intangible assets with definite lives of approximately $1.8 million in connection with the transaction. The acquisition of Integrated, which prior to the acquisition generated approximately $20.0 million in sales for its fiscal year ended December 31, 2018, creates additional capabilities within our high color commercial print product line.
On July 31, 2018, we acquired, by way of a merger, all of the outstanding equity interests of Wright Business Forms, Inc., d/b/a Wright Business Graphics (“Wright”), a printing company headquartered in Portland, Oregon with additional locations in Washington and California. As partial consideration for the acquisition, we issued an aggregate of 829,126 shares of our common stock to the stockholders of Wright, valued at approximately $16.2 million at the time of issuance under the merger agreement. An additional $19.7 million in cash was paid to the stockholders of Wright, subject to a final working capital adjustment, and $2.6 million was paid to extinguish outstanding debt. The goodwill recognized as a part of the transaction is not deductible for tax purposes. Wright produces forms, pressure seal, packaging, direct mail, checks, statement processing and commercial printing and sells mainly through distributors and resellers. Wright, prior to the acquisition, generated approximately $58.0 million in sales for its fiscal year ended March 31, 2018 and continues to operate under its brand names.
On April 30, 2018, we acquired the assets of Allen-Bailey Tag & Label (“ABTL”), a tag and label operation located in New York for $4.7 million in cash plus the assumption of trade payables, subject to a working capital adjustment. In addition, contingent consideration of up to $500,000 is payable to the sellers if certain sales levels are maintained over the next three years. Prior to the acquisition, ABTL generated approximately $12.0 million in sales for the twelve months ended December 31, 2017. On July 7, 2017, we acquired the assets of a separate tag operation located in Ohio for $1.4 million in cash plus the assumption of certain accrued liabilities. Management considers both of these acquisitions immaterial.
5
Patents, Licenses, Franchises and Concessions
Other than the patent for our VersaSeal® product, we do not have any significant patents, licenses, franchises, or concessions.
Intellectual Property
We market our products under a number of trademarks and trade names. The protection of our trademarks is important to our business. We believe that our registered and common law trademarks have significant value and these trademarks are important to our ability to create and sustain demand for our products. We have registered trademarks in the United States for Ennis®, EnnisOnlineSM, B&D Litho of AZ®, B&D Litho®, ACR®, Block Graphics®, Enfusion®, 360º Custom LabelsSM, Admore®, CashManagementSupply.comSM, Securestar®, Northstar®, MICRLink®, MICR ConnectionTM, Ennisstores.comTM, General Financial Supply®, Calibrated Forms®, PrintXcelSM, Printegra®, Trade Envelopes®, Witt Printing®, Genforms®, Royal Business Forms®, Crabar/GBFSM, BF&SSM, Adams McClure®, Advertising ConceptsTM, ColorWorx®, Allen-Bailey Tag & LabelSM, Atlas Tag & Label®, PrintgraphicsSM, Uncompromised Check Solutions®, VersaSeal®, VersaSeal SecureX®, Folder Express®, Wisco®, National Imprint Corporation®, Star Award Ribbon®, Kay Toledo Tag®, Falcon Business FormsSM, Forms ManufacturersSM, Mutual Graphics®, TRI-C Business FormsSM, SSP®, EOSTouchpoint®, Printersmall®, Check Guard®, Envirofolder®, Independent®, Independent Checks®, Independent Folders®, Independent Large Format Solutions®, Wright Business GraphicsSM, Wright 360SM, Integrated Print & GraphicsSM, the Flesh CompanySM, Impressions DirectSM, Ace FormsSM, MegaformSM, Safe®, and variations of these brands as well as other trademarks. We have similar trademark registrations internationally.
Customers
No single customer accounts for as much as five percent of our consolidated net sales or accounts receivable.
Backlog
At February 29, 2020, our backlog of firm orders was approximately $21.8 million, compared to approximately $22.5 million at February 28, 2019. Due to the impact of COVID-19 on all businesses, our backlog as of April 30, 2020 was $17.5 million.
Research and Development
While we seek new products to sell through our distribution channel, there have been no material amounts spent on research and development in fiscal years 2020, 2019 or 2018.
Environment
We are subject to various federal, state, and local environmental laws and regulations concerning, among other things, wastewater discharges, air emissions and solid waste disposal. Our manufacturing processes do not emit substantial foreign substances into the environment. We do not believe that our compliance with federal, state, or local statutes or regulations relating to the protection of the environment has any material effect upon capital expenditures, earnings or our competitive position. There can be no assurance, however, that future changes in federal, state, or local regulations, interpretations of existing regulations or the discovery of currently unknown problems or conditions will not require substantial additional expenditures. Similarly, the extent of our liability, if any, for past failures to comply with laws, regulations, and permits applicable to our operations cannot be determined.
Employees
At February 29, 2020, we had 2,505 employees. 242 employees are represented by labor unions under collective bargaining agreements, which are subject to periodic negotiations. We believe we have a good working relationship with all of the unions that represent our employees.
Available Information
Our annual report on Form 10-K, quarterly reports on Form 10-Q, current reports on Form 8-K, and amendments to reports filed or furnished pursuant to Section 13(a) or 15(d) of the Securities and Exchange Act of 1934 are
6
available free of charge under the Investors Relations page on our website, www.ennis.com, as soon as reasonably practicable after such reports are electronically filed with, or furnished to, the Securities and Exchange Commission (“SEC”). Information on our website is not included as a part of, or incorporated by reference into, this report. Our SEC filings are also available through the SEC’s website, www.sec.gov.
You should carefully consider the risks described below, as well as the other information included or incorporated by reference in this Annual Report on Form 10-K, before making an investment in our common stock. The risks described below are not the only ones we face in our business. Additional risks and uncertainties not presently known to us or that we currently believe to be immaterial may also impair our business operations. If any of the following risks occur, our business, financial condition or operating results could be materially harmed. In such an event, our common stock could decline in price and you may lose all or part of your investment.
Our business may be adversely affected by the ongoing COVID-19 pandemic.
In December 2019, a novel strain of coronavirus (COVID-19) was reported in Wuhan, China, and by early 2020, the virus had spread to other countries, including the United States. The COVID-19 pandemic is a significant threat to the health and economic wellbeing affecting our customers, suppliers and workforce. Federal, state and local authorities have recommended social distancing and have imposed, or are considering, quarantine and isolation measures on large portions of the population, including mandatory closures of businesses deemed “non-essential” in certain jurisdictions. As of the date of this Annual Report on Form 10-K, our plants are deemed “essential,” largely due to our business’s support of many important sectors of the economy, including healthcare, government, food and beverage and banking, and thus most of our plants are currently operating at close-to-normal utilization levels. As the virus continues to evolve, however, authorities could take new steps to control the outbreak, which could result in the determination that our plants are no longer “essential” and therefore must close, among other outcomes. Even if our plants are not forced to close by government regulation, the virus, in addition to prolonged stay-at-home orders or other related regulations, could depress consumer demand or disrupt our supply chain. Depending on these developments and others, we may deem it necessary to close plants, furlough or lay off employees or take other cost-cutting measures.
The extent of the impact of COVID-19 on our business and financial results will depend on future developments, including the duration and spread of the outbreak within the markets in which we operate, the related impact on our customers and suppliers and the possibility of an economic recession after the virus has subsided, all of which are highly uncertain and ever-changing. Any of these factors could materially increase our costs, negatively impact our sales and damage our results of operations and liquidity. The severity and duration of any such impacts, including after the virus has subsided, cannot be predicted.
Our results and financial condition are affected by global and local market conditions, and competitors’ pricing strategies, which can adversely affect our sales, margins, and net income.
Our results of operations can be affected by local, national and worldwide market conditions. The consequences of domestic and international economic uncertainty or instability, volatility in commodity markets, and domestic or international policy uncertainty, all of which we have seen in the past, can all impact economic activity. Unfavorable conditions can depress the demand for our products and thus sales in a given market and may prompt competitor’s pricing strategies that adversely affect our margins or constrain our operating flexibility. Certain macroeconomic events, such as the past crisis in the financial markets, could have a more wide-ranging and prolonged impact on the general business environment, which could also adversely affect us. In particular, the ongoing COVID-19 pandemic has negatively impacted local, national and worldwide economies, introduced extreme market volatility and, depending on severity and duration, may potentially trigger a prolonged nationwide or global recession. Whether we can manage these risks effectively depends on several factors, including (i) our ability to manage movements in commodity prices and the impact of government actions to manage national economic conditions such as consumer spending, inflation rates and unemployment levels, particularly given the past volatility in the global financial markets, (ii) the impact on our margins of labor costs given our labor-intensive business model, the trend toward higher wages in both mature and developing markets and the potential impact of union organizing efforts on day-to-day operations of our manufacturing facilities and (iii) other factors, which may be beyond our control.
7
The terms and conditions of our credit facility impose certain restrictions on our operations. We may not be able to raise additional capital, if needed, for proposed expansion projects.
The terms and conditions of our credit facility impose certain restrictions on our ability to incur additional debt, make capital expenditures, acquisitions and asset dispositions, as well as impose other customary covenants, such as requiring that our fixed charge coverage ratio not be less than 1.25:1.00 and our total leverage ratio not exceed 3.00:1:00. Our ability to comply with the covenants may be affected by events beyond our control, such as distressed and volatile financial and/or consumer markets, including due to the impact of the ongoing COVID-19 pandemic. A breach of any of these covenants could result in a default under our credit facility. In the event of a default, the bank could elect to declare the outstanding principal amount of our credit facility, all interest thereon, and all other amounts payable under our credit facility to be immediately due and payable. As of February 29, 2020, we were in compliance with all terms and conditions of our credit facility, which matures on November 11, 2021.
Challenging financial market conditions and continued decline in long-term interest rates could adversely impact the funded status of our pension plan.
We maintain a noncontributory defined benefit retirement plan (the “Pension Plan”) covering approximately 16% of our employees. Included in our financial results are Pension Plan costs that are measured using actuarial valuations. The actuarial assumptions used may differ from actual results. In addition, as our Pension Plan assets are invested in marketable securities, severe fluctuations in market values could potentially negatively impact our funded status, recorded pension liability, and future required minimum contribution levels. A decline in long-term debt interest rates puts downward pressure on the discount rate used by plan sponsors to determine their pension liabilities. Each 10 basis point change in the discount rate impacts our computed pension liability by about $930,000. Similar to fluctuations in market values, a drop in the discount rate could potentially negatively impact our funded status, recorded pension liability and future contribution levels. Also, continued changes in the mortality tables could potentially impact our funded status. As of February 29, 2020, the Pension Plan was 87.2% funded on a projected benefit obligation (PBO) basis and 95.7% on an accumulated benefit obligation (ABO) basis.
We may be unable to identify or to complete acquisitions or to successfully integrate the businesses we acquire.
We have evaluated, and may continue to evaluate, potential acquisition transactions. We attempt to address the potential risks inherent in assessing the attractiveness of acquisition candidates, as well as other challenges such as retaining the employees and integrating the operations of the businesses we acquire. Integrating acquired operations involves significant risks and uncertainties, including maintenance of uniform standards, controls, policies and procedures; diversion of management’s attention from normal business operations during the integration process; unplanned expenses associated with integration efforts; and unidentified issues not discovered in due diligence, including legal contingencies. Due to these risks and others, there can be no guarantee that the businesses we acquire will lead to the cost savings or increases in net sales that we expect or desire. Additionally, there can be no assurance that suitable acquisition opportunities will be available in the future, which could harm our strategic business plan as acquisitions are part of our strategy to offset normal print attrition.
We may be required to write down goodwill and other intangible assets, which could cause our financial condition and results of operations to be negatively affected in the future.
When we acquire a business, a portion of the purchase price may be allocated to goodwill and other identifiable intangible assets. The amount of the purchase price which is allocated to goodwill and other intangible assets is the excess of the purchase price over the net identifiable tangible assets acquired. The annual impairment test is based on several factors requiring judgment. An impairment may be caused by any number of factors outside our control, such as a decline in market conditions, including due to the COVID-19 pandemic, another pandemic or some other event, protracted recovery from poor market conditions, or other factors that may be tied to such negative economic events, including changes to a competitor’s pricing strategies. To date, we have not been required to take an impairment charge relating to our existing business, but continued sale-side pressures due to technology transference, competitor pricing pressures, and economic uncertainties could result in a determination that a portion of the recorded value of goodwill and intangible assets may be required to be written down. Although such a charge impairment charge relating to our existing business, but continued sale-side pressures due to technology would be a noncash expense, it would impact our reported operating results and financial position. The Company has mitigated some of this risk by changing from indefinite lives to definite lives accounting for all intangibles assets.
8
Under definite lives accounting, the value of intangible assets is gradually amortized over time, instead of being left on the Company’s books in full and only being written down when an impairment event is deemed to have occurred. At February 29, 2020, our consolidated goodwill and other intangible assets were approximately $82.5 million and $56.6 million, respectively.
Digital technologies will continue to erode the demand for our printed business documents.
The increasing sophistication of software, internet technologies, and digital equipment combined with our customers’ general preference, as well as governmental influences for paperless business environments will continue to reduce the number of traditional printed documents sold. Moreover, the documents that will continue to coexist with software applications will likely contain less value-added print content.
Many of our custom-printed documents help companies control their internal business processes and facilitate the flow of information. These applications will increasingly be conducted over the internet or through other electronic payment systems. The predominant method of our customers’ communication to their customers is by printed information. As their customers become more accepting of internet communications, our clients may increasingly opt for what is perceived to be less costly electronic option, which would reduce our revenue. The pace of these trends is difficult to predict. These factors will tend to reduce the industry-wide demand for printed documents and require us to gain market share to maintain or increase our current level of print-based revenue which could place pressure on our operating margins.
In response to the gradual obsolescence of our standardized forms business, we continue to develop our capability to provide custom and full-color products. If new printing capabilities and new product introductions do not continue to offset the obsolescence of our standardized business forms products, and we are unable to increase our market share, our sales and profits will be affected. Decreases in sales of our standardized business forms and products due to obsolescence could also reduce our gross margins or impact the value of our recorded goodwill and intangible assets. This reduction could in turn adversely impact our profits, unless we are able to offset the reduction through the introduction of new high margin products and services or realize cost savings in other areas.
Our distributor customers may be acquired by other manufacturers who redirect business within their plants.
Some of our customers are being absorbed by the distribution channels of some of our manufacturing competitors. However, we do not believe this will significantly impact our business model. We have continued to sell to some of these customers even after they were absorbed by our competition because of the breadth of our product line and our geographic diversity.
Our distributors face increased competition from various sources, such as office supply superstores. Increased competition may require us to reduce prices or to offer other incentives in order to enable our distributors to attract new customers and retain existing customers.
Low price, high value office supply chain stores offer standardized business forms, checks and related products. Because of their size, these superstores have the buying power to offer many of these products at competitive prices. These superstores also offer the convenience of “one-stop” shopping for a broad array of office supplies that our distributors do not offer. In addition, superstores have the financial strength to reduce prices or increase promotional discounts to expand market share. This could result in us reducing our prices or offering incentives in order to enable our distributors to attract new customers and retain existing customers, which could reduce our profits.
Technological improvements may reduce our competitive advantage over some of our competitors, which could reduce our profits.
Improvements in the cost and quality of digital print technology is enabling some of our competitors to gain access to products of complex design and functionality at competitive costs. Increased competition from these competitors could force us to reduce our prices in order to attract and retain customers, which could reduce our profits.
We could experience labor disputes that could disrupt our business in the future.
As of February 29, 2020, approximately 10% of our employees are represented by labor unions under collective bargaining agreements, which are subject to periodic negotiations. While we believe we have a good working
9
relationship with all of the unions, there can be no assurance that any future labor negotiations will prove successful, which may result in a significant increase in the cost of labor, or may break down and result in the disruption of our business or operations.
We obtain our raw materials from a limited number of suppliers, and any disruption in our relationships with these suppliers, or any substantial increase in the price of raw materials or material shortages could have a material adverse effect on us.
We currently purchase the majority of our paper products from one major supplier at favorable costs based on the volume of business, and traditionally we have purchased our paper products from a limited number of suppliers, all of which must meet stringent quality and on-time delivery standards under long-term contracts. Fluctuations in the quality of our paper, unexpected price changes or other factors that relate to our suppliers could have a material adverse effect on our operating results. In particular, the ongoing COVID-19 pandemic may make it more expensive or more difficult to source raw materials for our products, whether from our existing suppliers or new suppliers, and these challenges could negatively impact the cost or availability of our raw materials.
Paper is a commodity that is subject to frequent increases or decreases in price, and these fluctuations are sometimes significant. Domestic paper prices have increased and decreased in recent years due to global market conditions. There is no effective market of derivative instruments to insulate us against unexpected changes in price of paper in a cost-effective manner, and negotiated purchase contracts provide only limited protection against price increases. Generally, when paper prices increase, we attempt to recover the higher costs by raising the prices of our products to our customers. In the price-competitive marketplaces in which we operate, however, we may not always be able to pass through any or all of the higher costs. As such, any significant increase in the price of paper or shortage in its availability, whether due to the COVID-19 pandemic, the strength of the U.S. dollar, changes in mill ownership or other factors, could have a material adverse effect on our results of operations.
We face intense competition to gain market share, which may lead some competitors to sell substantial amounts of goods at prices against which we cannot profitably compete.
Our marketing strategy is to differentiate ourselves by providing quality service and quality products to our customers. Even if this strategy is successful, the results may be offset by reductions in demand or price declines due to competitors’ pricing strategies or other micro or macro-economic factors. We face the risk of our competition following a strategy of selling its products at or below cost in order to cover some amount of fixed costs, especially in stressed economic times.
Environmental regulations may impact our future operating results.
We are subject to extensive and changing federal, state and foreign laws and regulations establishing health and environmental quality standards, concerning, among other things, wastewater discharges, air emissions and solid waste disposal, and may be subject to liability or penalties for violations of those standards. We are also subject to laws and regulations governing remediation of contamination at facilities currently or formerly owned or operated by us or to which we have sent hazardous substances or wastes for treatment, recycling or disposal. We may be subject to future liabilities or obligations as a result of new or more stringent interpretations of existing laws and regulations. In addition, we may have liabilities or obligations in the future if we discover any environmental contamination or liability at any of our facilities, or at facilities we may acquire.
We are subject to taxation related risks.
Tax laws are dynamic and subject to change as new laws are passed and new interpretations of the law are applied. On December 22, 2017, the U.S. government enacted the Tax Cuts and Jobs Act (the "Tax Act"). The Tax Act includes significant changes to the U.S. corporate income tax system including, among other things, a federal corporate rate reduction from 35% to 21%; limitations on the deductibility of interest expense and executive compensation and the transition of U.S. international taxation from a worldwide tax system to a modified territorial tax system. In the future, we may be subject to increased taxes under the Tax Act, including due to the aforementioned limitations on deductions. Also, we may be required to make material adjustments to provisional items recorded. There can be no assurance that U.S. tax laws, including the corporate income tax rate, which the Tax Act lowered to 21%, would not undergo additional changes in the future. The final impact of the Tax Act on
10
the Company may differ from the estimates previously reported, possibly materially, due to such factors as changes in interpretations and assumptions made, additional guidance that may be issued, and actions taken by the Company as a result of the Tax Act, among other factors. All of these factors and uncertainties may adversely affect our results of operations, financial position and cash flows.
We are exposed to the risk of non-payment by our customers on a significant amount of our sales.
Our extension of credit involves considerable judgment and is based on an evaluation of each customer’s financial condition and payment history. We monitor our credit risk exposure by periodically obtaining credit reports and updated financials on our customers. We generally see a heightened amount of bankruptcies by our customers during economic downturns. In particular, the COVID-19 pandemic, and its impact on our customers, could have a negative impact on our collection efforts. While we maintain an allowance for doubtful receivables for potential credit losses based upon our historical trends and other available information, in times of economic turmoil, there is heightened risk that our historical indicators may prove to be inaccurate. The inability to collect on sales to significant customers or a group of customers could have a material adverse effect on our results of operations.
Our business incurs significant freight and transportation costs.
We incur transportation expenses to ship our products to our customers. Significant increases in the costs of freight and transportation could have a material adverse effect on our results of operations, as there can be no assurance that we could pass on these increased costs to our customers. Government regulations can and has impacted the availability of drivers, which will be a significant challenge to the industry. Costs to employ drivers have increased and transportation shortages have become more prevalent.
We depend upon the talents and contributions of a limited number of individuals, many of whom would be difficult to replace.
The loss or interruption of the services of our Chief Executive Officer, Executive Vice President or Chief Financial Officer could have a material adverse effect on our business, financial condition or results of operations. Although we maintain employment agreements with these individuals, it cannot be assured that the services of such individuals will continue.
If our internal controls are found to be ineffective, our financial results or our stock price could be adversely affected.
We believe that we currently have adequate internal control procedures in place. However, increased risk of internal control breakdowns generally exists in a business environment that is decentralized. In addition, if our internal control over financial reporting is found to be ineffective, investors may lose confidence in the reliability of our financial statements, which may adversely affect our stock price.
Our services depend on the reliability of computer systems we and our vendors maintain. If these systems fail, our operations may be adversely affected.
We depend on information technology and data processing systems to operate our business, and a significant malfunction or disruption in the operation of our systems may disrupt our business and adversely affect our ability to operate and compete in the markets we serve. These systems include systems that we own and operate, as well as systems of our vendors. Such systems are susceptible to malfunctions and interruptions. We also periodically upgrade and install new systems, which if installed or programmed incorrectly, may cause significant disruptions. The disruptions could interrupt our operations and adversely affect our results of operations, financial condition and cash flows.
11
We may suffer a data breach of sensitive information, which may result in significant costs to investigate and remediate the breach, litigation expenses and government enforcement actions and penalties, all of which could have an adverse effect on our operations and reputation.
It is critically important for us to maintain the confidentiality, integrity and availability of our systems, software and solutions. Many of our clients provide us with information they consider confidential or sensitive, and many of our client’s industries have established standards for safeguarding the confidentiality, integrity and availability of information relating to their businesses and customers. Confidential and sensitive information stored in our systems or available through web portals are susceptible to cybercrime or intentional disruption, which generally have increased across all industries in terms of sophistication and frequency. Disclosure of confidential information maintained on our systems or available through web portals due to human error, breach of our systems through cybercrime, a leak of confidential information due to employee misconduct or similar events may damage our reputation, subject us to regulatory enforcement action and cause significant reputational harm for our clients. Any of these outcomes may adversely affect our results of operations, financial condition and cash flows.
Increases in the cost of employee benefits could impact our financial results and cash flow.
Our expenses relating to employee health benefits are significant. Unfavorable changes in the cost of such benefits could impact our financial results and cash flow. Healthcare costs have risen significantly in recent years, and recent legislative and private sector initiatives regarding healthcare reform could result in significant changes to the U.S. healthcare system. Additionally, the ongoing COVID-19 pandemic may result in temporary or permanent healthcare reform measures, would could result in significant cost increases and other negative impacts to our business. While the Company has various cost controls measures in place and employs an outside oversight review on larger claims, employee health benefits have been and are expected to continue to be a significant cost to the Company. At the beginning of the 2017 calendar year, the Company made significant changes to its medical reimbursement program to address unexpected cost increases. Even with these remedial measures, which have been successful thus far, medical costs will continue to be a significant expense to the Company and may increase due to factors outside the Company’s control.
ITEM 1B. UNRESOLVED STAFF COMMENTS
There are no unresolved SEC staff comments.
Our corporate headquarters are located in Midlothian, Texas, and we operate manufacturing facilities throughout the United States. See the table below for additional information regarding our locations.
All of our properties are used for the production, warehousing and shipping of business products, including the following: business forms, flexographic printing, advertising specialties and Post-it® Notes (Wolfe City, Texas); presentation products (Macomb, Michigan; De Pere, Wisconsin and Columbus, Kansas); printed and electronic promotional media (Denver, Colorado); envelopes (Portland, Oregon; Columbus, Kansas; Tullahoma, Tennessee and Claysburg, Pennsylvania); financial forms (Minneapolis/St. Paul, Minnesota; Nevada, Iowa and Bridgewater, Virginia); and pressure seal products (Visalia, California; Chino, California and Clarksville, Tennessee).
Our plants are operated at production levels required to meet our forecasted customer demands. Production levels fluctuate with market demands and depend upon the product mix at any given point in time. Equipment is added as existing machinery becomes obsolete or not repairable, and as new equipment becomes necessary to meet market demands; however, at any given time, these additions and replacements are not considered to be material additions to property, plant and equipment, although such additions or replacements may increase a plant’s efficiency or capacity.
All of our facilities are believed to be in good condition. We do not anticipate that substantial expansion, refurbishing, or re-equipping of our facilities will be required in the near future.
All of our rented property is held under leases with original terms of one or more years, expiring at various times through February 2027. Presently, we believe we will be able to maintain or renew leases as they expire without significant difficulty.
12
|
|
|
|
Approximate Square Footage |
|
||||||
|
Location |
|
General Use |
|
Owned |
|
|
Leased |
|
||
|
Ennis, Texas |
|
Three Manufacturing Facilities * |
|
|
325,118 |
|
|
|
— |
|
|
Chatham, Virginia |
|
Two Manufacturing Facilities |
|
|
127,956 |
|
|
|
— |
|
|
Paso Robles, California |
|
Manufacturing |
|
|
94,120 |
|
|
|
— |
|
|
DeWitt, Iowa |
|
Two Manufacturing Facilities |
|
|
95,000 |
|
|
|
— |
|
|
Ft. Scott, Kansas |
|
Manufacturing |
|
|
86,660 |
|
|
|
— |
|
|
Portland, Oregon |
|
Two Manufacturing Facilities |
|
|
— |
|
|
|
261,765 |
|
|
Wolfe City, Texas |
|
Two Manufacturing Facilities |
|
|
119,259 |
|
|
|
— |
|
|
Coshocton, Ohio |
|
Manufacturing |
|
|
24,750 |
|
|
|
— |
|
|
Macomb, Michigan |
|
Manufacturing |
|
|
56,350 |
|
|
|
— |
|
|
Denver, Colorado |
|
Four Manufacturing Facilities |
|
|
60,000 |
|
|
|
117,575 |
|
|
Brooklyn Park, Minnesota |
|
Manufacturing |
|
|
94,800 |
|
|
|
— |
|
|
Coon Rapids, Minnesota |
|
Warehouse |
|
|
— |
|
|
|
4,800 |
|
|
Roseville, Minnesota |
|
Manufacturing |
|
|
— |
|
|
|
41,300 |
|
|
Nevada, Iowa |
|
Two Manufacturing Facilities |
|
|
232,000 |
|
|
|
— |
|
|
Nevada, Iowa |
|
Held for Sale |
|
|
58,752 |
|
|
|
— |
|
|
Bridgewater, Virginia |
|
Manufacturing |
|
|
— |
|
|
|
27,000 |
|
|
Columbus, Kansas |
|
Two Manufacturing Facilities and Warehouse |
|
|
174,089 |
|
|
|
— |
|
|
El Dorado Springs, Missouri |
|
Manufacturing |
|
|
70,894 |
|
|
|
— |
|
|
Princeton, Illinois |
|
Manufacturing |
|
|
— |
|
|
|
44,190 |
|
|
Arlington, Texas |
|
Two Manufacturing Facilities |
|
|
69,935 |
|
|
|
— |
|
|
Tullahoma, Tennessee |
|
Two Manufacturing Facilities |
|
|
142,061 |
|
|
|
— |
|
|
Caledonia, New York |
|
Manufacturing |
|
|
191,730 |
|
|
|
— |
|
|
Sun City, California |
|
Two Manufacturing Facilities |
|
|
52,617 |
|
|
|
— |
|
|
Livermore, California |
|
Sales Office |
|
|
— |
|
|
|
650 |
|
|
Chino, California |
|
Manufacturing |
|
|
— |
|
|
|
63,016 |
|
|
Neenah, Wisconsin |
|
Two Manufacturing Facilities & One Warehouse |
|
|
72,354 |
|
|
|
97,161 |
|
|
Claysburg, Pennsylvania |
|
Manufacturing |
|
|
— |
|
|
|
69,000 |
|
|
Vandalia, Ohio |
|
Held for Sale |
|
|
47,820 |
|
|
|
— |
|
|
Fairport, New York |
|
Two Manufacturing Facilities |
|
|
— |
|
|
|
40,800 |
|
|
Indianapolis, Indiana |
|
Two Manufacturing Facilities |
|
|
— |
|
|
|
38,000 |
|
|
Smyrna, Georgia |
|
Manufacturing |
|
|
— |
|
|
|
65,000 |
|
|
Clarksville, Tennessee |
|
Manufacturing |
|
|
51,900 |
|
|
|
— |
|
|
Fairhope, Alabama |
|
Manufacturing |
|
|
65,000 |
|
|
|
— |
|
|
Toledo, Ohio |
|
Three Manufacturing Facilities |
|
|
120,947 |
|
|
|
— |
|
|
Visalia, California |
|
Manufacturing |
|
|
— |
|
|
|
56,000 |
|
|
Corsicana, Texas |
|
Manufacturing |
|
|
39,685 |
|
|
|
— |
|
|
Girard, Kansas |
|
Manufacturing |
|
|
69,474 |
|
|
|
— |
|
|
Powell, Tennessee |
|
Manufacturing |
|
|
43,968 |
|
|
|
— |
|
|
Houston, Texas |
|
Manufacturing |
|
|
— |
|
|
|
29,668 |
|
|
DePere, Wisconsin |
|
Manufacturing & One Warehouse |
|
|
— |
|
|
|
142,347 |
|
|
Mosinee, Wisconsin |
|
Manufacturing & One Warehouse |
|
|
— |
|
|
|
5,700 |
|
|
Kent, Washington |
|
Manufacturing |
|
|
— |
|
|
|
48,789 |
|
|
South Elgin, Illinois |
|
Manufacturing |
|
|
— |
|
|
|
70,500 |
|
|
Parsons, Kansas |
|
Manufacturing & One Warehouse |
|
|
122,740 |
|
|
|
40,000 |
|
|
Fenton, Missouri |
|
Manufacturing** |
|
|
— |
|
|
|
26,847 |
|
|
|
|
|
|
|
2,709,979 |
|
|
|
1,290,108 |
|
|
Corporate Offices |
|
|
|
|
|
|
|
|
|
|
|
Ennis, Texas |
|
Administrative Offices |
|
|
9,300 |
|
|
|
— |
|
|
Midlothian, Texas |
|
Executive and Administrative Offices |
|
|
28,000 |
|
|
|
— |
|
|
|
|
|
|
|
37,300 |
|
|
|
— |
|
|
|
|
Totals |
|
|
2,747,279 |
|
|
|
1,290,108 |
|
|
* |
22,000 square feet of Ennis, Texas location leased |
|
** |
21,477 square feet of Fenton, Missouri location leased |
13
From time to time we are involved in various litigation matters arising in the ordinary course of our business. We do not believe the disposition of any current matter will have a material adverse effect on our consolidated financial position or results of operations.
ITEM 4. MINE SAFETY DISCLOSURES
Not applicable.
ITEM 5. MARKET FOR REGISTRANT’S COMMON EQUITY, RELATED STOCKHOLDER MATTERS AND ISSUER PURCHASES OF EQUITY SECURITIES
Our common stock is traded on the New York Stock Exchange (“NYSE”) under the trading symbol “EBF”. The following table sets forth the high and low sales prices, the common stock trading volume as reported by the NYSE and dividends per share paid by the Company for the periods indicated:
|
|
|
|
|
|
|
|
|
|
|
Common Stock |
|
|
Dividends |
|
||
|
|
|
|
|
|
|
|
|
|
|
Trading Volume |
|
|
per share of |
|
||
|
|
|
Common Stock Price Range |
|
|
(number of shares |
|
|
Common |
|
|||||||
|
|
|
High |
|
|
Low |
|
|
in thousands) |
|
|
Stock |
|
||||
|
Fiscal Year Ended February 29, 2020 |
|
|
|
|
|
|
|
|
|
|
|
|
|
|
|
|
|
First Quarter |
|
$ |
21.99 |
|
|
$ |
18.30 |
|
|
|
1,989 |
|
|
$ |
0.225 |
|
|
Second Quarter |
|
|
21.10 |
|
|
|
18.48 |
|
|
|
2,220 |
|
|
$ |
0.225 |
|
|
Third Quarter |
|
|
21.49 |
|
|
|
18.66 |
|
|
|
2,135 |
|
|
$ |
0.225 |
|
|
Fourth Quarter |
|
|
22.20 |
|
|
|
19.83 |
|
|
|
2,655 |
|
|
$ |
0.225 |
|
|
Fiscal Year Ended February 28, 2019 |
|
|
|
|
|
|
|
|
|
|
|
|
|
|
|
|
|
First Quarter |
|
$ |
20.70 |
|
|
$ |
17.65 |
|
|
|
1,116 |
|
|
$ |
0.200 |
|
|
Second Quarter |
|
|
22.95 |
|
|
|
18.20 |
|
|
|
1,552 |
|
|
$ |
0.225 |
|
|
Third Quarter |
|
|
21.90 |
|
|
|
18.55 |
|
|
|
2,153 |
|
|
$ |
0.225 |
|
|
Fourth Quarter |
|
|
21.36 |
|
|
|
17.36 |
|
|
|
2,422 |
|
|
$ |
0.225 |
|
On April 27, 2020, the last reported sale price of our common stock on the NYSE was $17.82, and there were approximately 718 shareholders of record.
Cash dividends may be paid, or repurchases of our common stock may be made, from time to time as our Board of Directors (“Board”) deems appropriate, after considering our growth rate, operating results, financial condition, cash requirements, restrictive lending covenants, and such other factors as the Board may deem appropriate.
A dividend of $0.225 per share of common stock was paid in each quarter of fiscal year 2020. A dividend of $0.20 per share was paid in the first quarter of fiscal year 2019, and a dividend of $0.225 per share was paid in each subsequent quarter of fiscal year 2019.
Our Board has authorized the repurchase of the Company’s outstanding common stock through a stock repurchase program, which authorized amount is currently up to $40.0 million in the aggregate. Under the repurchase program, purchases may be made from time to time in the open market or through privately-negotiated transactions, depending on market conditions, share price, trading volume and other factors. Repurchases may be commenced or suspended at any time or from time to time without prior notice, provided that any purchases must be made in accordance with applicable insider trading rules and securities laws and regulations. Since the program’s inception in October 2008, we have repurchased 1,816,354 common shares under the program at an average price of $15.91 per share. During our fiscal year 2020, we repurchased 126,330 shares of common stock at an average price of $19.56 per share. As of February 29, 2020, $11.1 million remained available to repurchase shares of common stock under the program. No additional shares of common stock were repurchased under the program in the three months ended February 29, 2020.
14
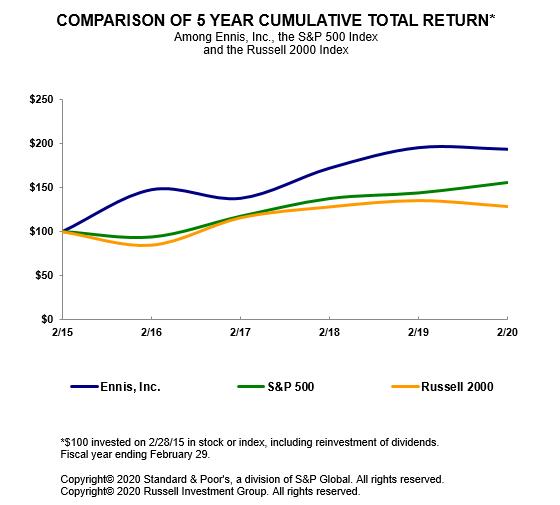
The graph below matches our cumulative 5-year total shareholder return on common stock with the cumulative total returns of the S&P 500 Index and the Russell 2000 Index. The graph tracks the performance of a $100 investment in our common stock and in each of the indexes (with the reinvestment of all dividends) from February 28, 2015 to February 29, 2020.
|
|
|
|
2015 |
|
|
|
2016 |
|
|
|
2017 |
|
|
|
2018 |
|
|
|
2019 |
|
|
|
2020 |
|
|
Ennis, Inc. |
|
$ |
100.00 |
|
|
$ |
147.47 |
|
|
$ |
137.68 |
|
|
$ |
171.90 |
|
|
$ |
195.21 |
|
|
$ |
193.42 |
|
|
S&P 500 |
|
|
100.00 |
|
|
|
93.81 |
|
|
|
117.24 |
|
|
|
137.29 |
|
|
|
143.71 |
|
|
|
155.49 |
|
|
Russell 2000 |
|
|
100.00 |
|
|
|
85.03 |
|
|
|
115.73 |
|
|
|
127.89 |
|
|
|
135.03 |
|
|
|
128.38 |
|
The stock price performance included in this graph is not necessarily indicative of future stock price performance.
15
ITEM 6. SELECTED FINANCIAL DATA
The following tables set forth key operating metrics as of and for the periods indicated and have been derived from our audited historical consolidated financial statements for the five years ended February 29, 2020. Our consolidated financial statements and notes thereto as of February 29, 2020, February 28, 2019, and for the three years in the period ended February 29, 2020, and the reports of Grant Thornton LLP are included in Item 15 of this Report. The selected financial data should be read in conjunction with Item 7 — “Management’s Discussion and Analysis of Financial Condition and Results of Operations” and the consolidated financial statements and notes thereto included in Item 15 of this Report.
|
|
|
Fiscal Years Ended |
|
|||||||||||||||||
|
|
|
2020 |
|
|
2019 |
|
|
2018 |
|
|
2017 |
|
|
2016 |
|
|||||
|
|
|
(Dollars and shares in thousands, except per share and ratio amounts) |
|
|||||||||||||||||
|
Operating results: |
|
|
|
|
|
|
|
|
|
|
|
|
|
|
|
|
|
|
|
|
|
Net sales |
|
$ |
438,412 |
|
|
$ |
400,782 |
|
|
$ |
370,171 |
|
|
$ |
356,888 |
|
|
$ |
385,946 |
|
|
Gross profit margin |
|
|
128,924 |
|
|
|
123,360 |
|
|
|
117,202 |
|
|
|
104,730 |
|
|
|
116,829 |
|
|
Selling, general and administrative expenses |
|
|
78,173 |
|
|
|
73,490 |
|
|
|
69,222 |
|
|
|
62,537 |
|
|
|
65,356 |
|
|
Earnings from continuing operations |
|
|
38,292 |
|
|
|
37,437 |
|
|
|
32,758 |
|
|
|
26,417 |
|
|
|
32,258 |
|
|
Earnings (loss) from discontinued operations, net of tax |
|
|
— |
|
|
|
— |
|
|
|
147 |
|
|
|
(24,637 |
) |
|
|
3,478 |
|
|
Net earnings (loss) |
|
$ |
38,292 |
|
|
$ |
37,437 |
|
|
$ |
32,905 |
|
|
$ |
1,780 |
|
|
$ |
35,736 |
|
|
Earnings (loss) and dividends per share: |
|
|
|
|
|
|
|
|
|
|
|
|
|
|
|
|
|
|
|
|
|
Basic and Diluted |
|
|
|
|
|
|
|
|
|
|
|
|
|
|
|
|
|
|
|
|
|
Continuing operations |
|
$ |
1.47 |
|
|
$ |
1.45 |
|
|
$ |
1.29 |
|
|
$ |
1.03 |
|
|
$ |
1.25 |
|
|
Discontinued operations |
|
|
— |
|
|
|
— |
|
|
|
0.01 |
|
|
|
(0.96 |
) |
|
|
0.14 |
|
|
Net earnings (loss) |
|
$ |
1.47 |
|
|
$ |
1.45 |
|
|
$ |
1.30 |
|
|
$ |
0.07 |
|
|
$ |
1.39 |
|
|
Dividends |
|
$ |
0.90 |
|
|
$ |
0.875 |
|
|
$ |
0.875 |
|
(1) |
$ |
2.20 |
|
(1) |
$ |
0.70 |
|
|
Weighted average shares outstanding: |
|
|
|
|
|
|
|
|
|
|
|
|
|
|
|
|
|
|
|
|
|
Basic |
|
|
26,036 |
|
|
|
25,830 |
|
|
|
25,392 |
|
|
|
25,735 |
|
|
|
25,688 |
|
|
Diluted |
|
|
26,036 |
|
|
|
25,842 |
|
|
|
25,417 |
|
|
|
25,749 |
|
|
|
25,722 |
|
|
Financial Position: |
|
|
|
|
|
|
|
|
|
|
|
|
|
|
|
|
|
|
|
|
|
Working capital |
|
$ |
111,915 |
|
|
$ |
134,542 |
|
|
$ |
133,773 |
|
|
$ |
119,282 |
|
|
$ |
135,441 |
|
|
Current assets |
|
|
149,884 |
|
|
|
166,165 |
|
|
|
163,344 |
|
|
|
149,250 |
|
|
|
175,841 |
|
|
Total assets |
|
|
365,699 |
|
|
|
363,085 |
|
|
|
329,439 |
|
|
|
324,285 |
|
|
|
390,044 |
|
|
Current liabilities |
|
|
37,969 |
|
|
|
31,623 |
|
|
|
29,571 |
|
|
|
29,968 |
|
|
|
40,400 |
|
|
Long-term debt |
|
|
— |
|
|
|
30,000 |
|
|
|
30,000 |
|
|
|
30,000 |
|
|
|
40,000 |
|
|
Total liabilities |
|
|
71,370 |
|
|
|
73,958 |
|
|
|
67,735 |
|
|
|
72,930 |
|
|
|
91,498 |
|
|
Shareholders' equity |
|
|
294,329 |
|
|
|
289,127 |
|
|
|
261,704 |
|
|
|
251,355 |
|
|
|
298,546 |
|
|
Current ratio |
|
3.95 to 1.0 |
|
|
5.25 to 1.0 |
|
|
5.52 to 1.0 |
|
|
4.98 to 1.0 |
|
|
4.35 to 1.0 |
|
|||||
|
Long-term debt to equity ratio |
|
000 to 1.0 |
|
|
0.10 to 1.0 |
|
|
0.11 to 1.0 |
|
|
0.12 to 1.0 |
|
|
0.13 to 1.0 |
|
|||||
(1) Fiscal year 2018 included a special one-time cash dividend of $0.10 per share of common stock in response to the signing of the Tax Act. Fiscal year 2017 included a special one-time cash dividend of $1.50 per share of common stock as a result of the Company’s sale of its apparel business, consisting of Alstyle Apparel, LLC and its subsidiaries, in May 2016.
16
ITEM 7. MANAGEMENT’S DISCUSSION AND ANALYSIS OF FINANCIAL CONDITION AND RESULTS OF OPERATIONS
This Management’s Discussion and Analysis provides material historical and prospective disclosures intended to enable investors and other users to assess our financial condition and results of operations. Statements that are not historical are forward-looking and involve risk and uncertainties, including those discussed under the caption “Risk Factors” in Item 1A of this Annual Report on Form 10-K and elsewhere in this Report. You should read this discussion and analysis in conjunction with our Consolidated Financial Statements and the related notes appearing elsewhere in this Report. The words “anticipate,” “preliminary,” “expect,” “believe,” “intend” and similar expressions identify forward-looking statements. We believe these forward-looking statements are based upon reasonable assumptions. All such statements involve risks and uncertainties, and as a result, actual results could differ materially from those projected, anticipated, or implied by these statements.
In view of such uncertainties, investors should not place undue reliance on our forward-looking statements since such statements may prove to be inaccurate and speak only as of the date when made. We undertake no obligation to publicly update or revise any forward-looking statements, whether as a result of new information, future events or otherwise.
This Management’s Discussion and Analysis covers the continuing operations of the Company, which are comprised of the production and sale of business forms and other business products, and excludes the discontinued operations of the Company, consisting of Alstyle Apparel, LLC and its subsidiaries (the “Apparel Segment”), which the Company sold in May 2016. This Management’s Discussion and Analysis includes the following sections:
|
|
• |
Overview – An overall discussion regarding our Company, the business challenges and opportunities we believe are key to our success, and our plans for facing these challenges relating to our continuing operations. |
|
|
• |
Critical Accounting Policies and Estimates – A discussion of the accounting policies that require our most critical judgments and estimates relating to our continuing operations. This discussion provides insight into the level of subjectivity, quality, and variability involved in these judgments and estimates. This section also provides a summary of recently adopted and recently issued accounting pronouncements that have or may materially affect our business. |
|
|
• |
Results of Operations – An analysis of our consolidated results of operations and segment results for the three years presented in our consolidated financial statements. This analysis discusses material trends within our continuing business and provides important information necessary for an understanding of our continuing operating results. |
|
|
• |
Liquidity and Capital Resources - An analysis of our cash flows and a discussion of our financial condition and contractual obligations. This section provides information necessary to evaluate our ability to generate cash and to meet existing and known future cash requirements over both the short and long term. |
References to 2020, 2019 and 2018 refer to the fiscal years ended February 29, 2020, February 28, 2019 and February 28, 2018, respectively.
Overview
The Company – Our management believes we are the largest provider of business forms, pressure-seal forms, labels, tags, envelopes, and presentation folders to independent distributors in the United States.
Our Business Challenges – Our industry is currently experiencing consolidation of traditional supply channels, product obsolescence, paper supplier capacity adjustments, and increased pricing and potential supply allocations due to demand/supply curve imbalance. Technology advances have made electronic distribution of documents, internet hosting, digital printing and print-on-demand valid, cost-effective alternatives to traditional custom-printed documents and customer communications. Improved equipment has become more accessible to our competitors due to the continued low interest rate environment. We face highly competitive conditions throughout our supply chain in an already over-supplied, price-competitive print industry. In addition to the risk factors discussed under the
17
caption “Risk Factors” in Item 1A of this Annual Report, some of the key challenges of our business include the following:
COVID-19 Pandemic – In December 2019, a novel strain of coronavirus (COVID-19) was reported in Wuhan, China, and by early 2020, the virus had spread to other countries, including the United States. This pandemic has significantly impacted health and economic conditions throughout the United States and the world, including the markets in which we operate.
In response to COVID-19, federal, state and local authorities have recommended social distancing and have imposed, or are considering, quarantine and isolation measures on large portions of the population, including mandatory closures of businesses deemed “non-essential” in certain jurisdictions. As of the date of this Annual Report on Form 10-K, our plants are deemed “essential,” largely due to our business’s support of many important sectors of the economy, including healthcare, government, food and beverage and banking, and thus most of our plants are currently operating at close-to-normal utilization levels. With respect to our plants that are underutilized, we have made reductions in staffing levels as we deem appropriate, and we will continue to monitor the situation.
To date, the COVID-19 pandemic has not impacted, and we do not expect it to materially impact, the supply chain for products we sell. Most of our products are sourced domestically from suppliers deemed “essential,” and therefore in operation, and we have been able to switch from impacted suppliers to non-impacted suppliers in several instances since the outbreak. However, if one or more of our major suppliers are negatively impacted by the COVID-19 pandemic, through plant closures, deteriorating financial condition, or otherwise, it would adversely affect our operational results and financial condition.
Currently, we do not expect the COVID-19 pandemic to have a material impact on our liquidity. As of February 29, 2020, we had over $68.0 million in cash and over $99.5 million available under our revolving credit facility, the maturity date of which was recently extended to November 11, 2021. However, the ultimate impact of COVID-19 is difficult to predict, including due to factors discussed under the caption “Risk Factors” in Item 1A of this Annual Report on Form 10-K.
Transformation of our portfolio of products – While traditional business documents are essential in order to conduct business, many are being replaced through the use of cheaper paper grades or imported paper, or devalued with advances in digital technologies, causing steady declines in demand for a portion of our current product line. Transforming our product offerings in order to continue to provide innovative, valuable solutions through lower labor and fixed charges to our customers on a proactive basis will require us to make investments in new and existing technology and to develop key strategic business relationships, such as print-on-demand services and product offerings that assist customers in their transition to digital business environments. In addition, we will continue to look for new market opportunities and niches through acquisitions, such as the addition of our envelope offerings, tag offerings, folder offerings, healthcare wristbands, specialty packaging, direct mail, pressure seal products, secure document solutions, innovative in-mold label offerings and long-run integrated products with high color web printing, which provide us with an opportunity for growth and differentiate us from our competition.
Production capacity and price competition within our industry – The weakening of the U.S. dollar during the latter portion of fiscal year 2018 and first half of fiscal year 2019 resulted in the dissipation of the pricing advantage that foreign imports had held over domestic suppliers, which in turn led to lower volumes of imported paper and an increase in domestic exports in fiscal year 2019. These factors give domestic paper producers more pricing power since they can control the supply of paper by eliminating capacity or changing the products produced on their large paper machines. Also during fiscal year 2019, significant production capacity left the market, whether planned, for example due to the adoption of alternative paper products, or unplanned, for example due to bankruptcy. Consequently, even with shrinking demand, a supply/demand imbalance resulted during the latter part of fiscal year 2019, with most mills running in excess of 90% of capacity across all grades. Given these levels, consistent with historical practice, suppliers raised prices multiple times during the latter part of fiscal year 2019 and into the early part of fiscal year 2020. These price increases occurred across all stages of the manufacturing process, from raw materials to supplies. Additionally, some paper grades during fiscal year 2019 were placed on allocation given the tight supply environment. Given our long-term relationship with our major paper supplier, our financial strength and our size, we were able to avoid material disruptions to our supply chain during fiscal year 2019.
18
For fiscal year 2020, with the strengthening of the U.S. dollar, imports began to flow back into the domestic marketplace. This development, along with continued slowing of domestic demand, resulted in renewed marketing of certain paper grades that previously had been placed on allocation. Consequently, spot pricing became very competitive. The uncoated paper market is relatively balanced currently, but overall demand remains weak, and mills have dropped back to more normal operating levels. With more capacity shuts/conversions planned, we expect operating rates to sustain in the lower 90% range. With declining demand expected to continue, combined with rising imports, falling exports and a more balanced market, prices are expected to remain relatively stable until at least the second half of fiscal year 2021, although the impact of the COVID-19 pandemic could reduce demand much faster than the paper companies can adjust supply, thus impacting pricing. Coated paper demand has dropped considerably and, even with several major capacity closures, operating rates are expected to remain low during the foreseeable future, despite a recent increase. Continued closures/conversions, while expected, are not expected to be enough to completely balance the market. Imports are expected to drop with demand, but the high dollar could push imports even higher which could lead to pressure on coated paper pricing. Foreign imports may not appear as quickly as previous years given the lack of containers in Asia and the overall disruption in shipping worldwide. Regardless of these factors, many of which are cyclical, we intend to continue to focus on effectively managing and controlling our product costs, through the use of forecasting, production and costing models, as well as working closely with our domestic suppliers to reduce our procurement costs, in order to minimize effects on our operational results. In addition, we will continue to look for ways to reduce and leverage our fixed costs.
Continued consolidation of our customers – Our customers are distributors, many of which are consolidating or are being acquired by competitors. We continue to maintain a majority of the business we have had with our customers historically, but it is possible that these consolidations and acquisitions, which we expect to continue in the future, ultimately will impact our margins and sales.
Critical Accounting Policies and Estimates
In preparing our consolidated financial statements, we are required to make estimates and assumptions that affect the disclosures and reported amounts of assets and liabilities at the date of the consolidated financial statements and the reported amounts of revenues and expenses during the reporting period. We evaluate our estimates and judgments on an ongoing basis, including those related to allowance for doubtful receivables, inventory valuations, property, plant and equipment, intangible assets, pension plan obligations, accrued liabilities and income taxes. We base our estimates and judgments on historical experience and on various other factors that we believe to be reasonable under the circumstances. Actual results may differ materially from these estimates under different assumptions or conditions. We believe the following accounting policies are the most critical due to their effect on our more significant estimates and judgments used in preparation of our consolidated financial statements.
We maintain the Pension Plan for employees. Included in our financial results are Pension Plan costs that are measured using actuarial valuations. The actuarial assumptions used may differ from actual results. As our Pension Plan assets are invested in marketable securities, fluctuations in market values could potentially impact our funding status and associated liability recorded.
Amounts allocated to intangibles and goodwill are determined based on valuation analysis for our acquisitions. Amortizable intangibles are amortized over their expected useful lives. We evaluate these amounts periodically (at least once a year) to determine whether a triggering event has occurred during the year that would indicate potential impairment.
The Company historically has performed its annual impairment test as of November 30, the last day of the third quarter and during 2020 the Company changed its date to the first day of the fourth quarter, December 1. Accordingly, the annual impairment test of goodwill was performed as of both November 30 and updated as of December 1 of fiscal year 2020 with no impact on the financial statements. This change does not accelerate, delay, avoid or cause an impairment charge, nor does this change result in adjustments to the Company’s previously issued financial statements. No impairment was recorded during fiscal year 2020. The Company’s impairment tests indicated significant cushion between its carrying value and fair market value.
For fiscal year 2019, the Company used qualitative factors to determine whether it is more likely than not (likelihood of more than 50%) that the fair value of a reporting unit exceeds its carrying amount, including goodwill. Some of the qualitative factors considered in applying this test include consideration of macroeconomic conditions,
19
industry and market conditions, cost factors affecting the business, overall financial performance of the business, and performance of the share price of the Company.
For fiscal year 2020, because qualitative factors were deemed insufficient to conclude that it is more likely than not that the fair value of a reporting unit exceeds its carrying value, and because enough time had elapsed that management believed it was prudent to perform a quantitative assessment, a one-step approach was applied to make an evaluation. This evaluation utilizes multiple valuation methodologies, including a market approach (market price multiples of comparable companies) and an income approach (discounted cash flow analysis). The computations require management to make significant estimates and assumptions, including, among other things, selection of comparable publicly traded companies, the discount rate applied to future earnings reflecting a weighted average cost of capital, and earnings growth assumptions. A discounted cash flow analysis requires management to make various assumptions about future sales, operating margins, capital expenditures, working capital, and growth rates. If the evaluation results in the fair value of the goodwill for the reporting unit being lower than the carrying value, an impairment charge is recorded. A goodwill impairment charge was not required for fiscal year 2020 or fiscal year 2019.
Subsequent to the evaluation described above, the COVID-19 outbreak occurred, causing major economic disruption and significant volatility in the stock markets. As a result, the December 1, 2019 assessment performed with respect to fiscal year 2020 was updated by management through February 29, 2020. Based on this updated qualitative assessment, no impairment to the Company’s recorded goodwill was deemed required.
We recognize revenues from product sales upon shipment to the customer if the terms of the sale are freight on board (“FOB”) shipping point (and therefore title and all risks of ownership, including risk of loss, passes to the customer upon shipping) or, to a lesser extent, upon delivery to the customer if the terms of the sale are FOB destination (and therefore title and all risks of ownership, including risk of loss, passes to the customer upon delivery). Net sales consist of gross sales invoiced to customers, less certain related charges, including discounts, returns and other allowances. Returns, discounts and other allowances have historically been insignificant. In some cases and upon customer request, we print and store custom print product for customer specified future delivery, generally within twelve months. In this case, risk of loss from obsolescence passes to the customer, the customer is invoiced under normal credit terms and revenue is recognized when manufacturing is complete. Approximately $11.0 million, $10.3 million, and $9.7 million of revenue were recognized under these agreements during fiscal years ended 2020, 2019 and 2018, respectively.
We maintain an allowance for doubtful receivables to reflect estimated losses resulting from the inability of customers to make required payments. On an on-going basis, we evaluate the collectability of accounts receivable based upon historical collection trends, current economic factors, and the assessment of the collectability of specific accounts. We evaluate the collectability of specific accounts using a combination of factors, including the age of the outstanding balances, evaluation of customers’ current and past financial condition and credit scores, recent payment history, current economic environment, discussions with our sales managers, and discussions with the customers directly.
Our inventories are valued at the lower of cost or net realizable value. We regularly review inventory values on hand, using specific aging categories, and write down inventory deemed obsolete and/or slow-moving based on historical usage and estimated future usage to its estimated net realizable value. As actual future demand or market conditions may vary from those projected by management, adjustments to inventory valuations may be required.
As part of the process of preparing our consolidated financial statements, we are required to estimate our income taxes in each jurisdiction in which we operate. This process involves estimating our actual current tax exposure together with assessing temporary differences resulting from different treatment of items for tax and financial reporting purposes. These differences result in deferred tax assets and liabilities, which are included in our consolidated balance sheets. We must then assess the likelihood that our deferred tax assets will be recovered based on our history of earnings expectations for future taxable income including taxable income in prior carry-back years, as well as future taxable income. To the extent we believe that recovery is not likely, we must establish a valuation allowance. To the extent we establish a valuation allowance, we must include an expense within the tax provision in the consolidated statements of operations. In the event that actual results differ from these estimates, our provision for income taxes could be materially impacted.
20
The outbreak of the COVID-19 pandemic presents various global risks. The full impact of the COVID-19 pandemic continues to evolve as of the date of this report. Management is actively monitoring the situation as pertains to the Company’s financial condition, liquidity, operations, suppliers, industry and workforce. Given the ongoing evolution of the pandemic and the global responses to control its spread, the Company is not able to estimate the ultimate effects of the COVID-19 pandemic on its results of operation, financial condition, or liquidity for fiscal year 2021. Currently, the Company is considering deferring payments of payroll taxes to the extent allowable under the Coronavirus Aid, Relief and Economic Security (CARES) Act. The Company is also reviewing other provisions of the CARES Act and does not expect a significant tax impact.
On December 22, 2017, the U.S. government enacted the Tax Cuts and Jobs Act (the "Tax Act"). The Tax Act includes significant changes to the U.S. corporate income tax system including, among other things, a federal corporate rate reduction from 35% to 21%; limitations on the deductibility of interest expense and executive compensation and the transition of U.S. international taxation from a worldwide tax system to a modified territorial tax system. A majority of the provisions in the Tax Act are effective January 1, 2018. As a result of the reduction of the corporate tax rate to 21%, we revalued our deferred tax assets and liabilities as of the date of enactment, with resulting tax effects accounted for in the reporting period of enactment. This change in the statutory tax rate resulted in reduction in income tax expense being recognized of $3.6 million in the fourth quarter of fiscal year 2018 due to the adjustment of deferred tax liabilities based on the expected prevailing tax rate at the expected time of their realization.
In addition to the assessments described above, we also have to make assessments as to the adequacy of our accrued liabilities, more specifically our liabilities recorded in connection with our workers compensation and health insurance, as these plans are self-funded. To help us in this evaluation process, we routinely get outside third-party assessments of our potential liabilities under each plan.
Results of Operations
The following discussion provides information which we believe is relevant to understanding our results of operations and financial condition. The discussion and analysis should be read in conjunction with the accompanying consolidated financial statements and notes thereto, which are incorporated herein by reference. Unless otherwise indicated, this financial overview is for the continuing operations of the Company, which are comprised of the production and sales of business forms and other business products, and exclude the discontinued operations of our Apparel Segment, which we sold in May 2016. The operating results of the Company for fiscal year 2020 and the comparative fiscal years 2019 and 2018 are included in the tables below.
21
|
Consolidated Statements of |
|
Fiscal years ended |
|
|||||||||||||||||||||
|
Operations - Data (in thousands, |
|
2020 |
|
|
2019 |
|
|
2018 |
|
|||||||||||||||
|
except per share amounts) |
|
|
|
|
|
|
|
|
|
|
|
|
|
|
|
|
|
|
|
|
|
|
|
|
|
Net sales |
|
$ |
438,412 |
|
|
|
100.0 |
% |
|
$ |
400,782 |
|
|
|
100.0 |
% |
|
$ |
370,171 |
|
|
|
100.0 |
% |
|
Cost of goods sold |
|
|
309,488 |
|
|
|
70.6 |
|
|
|
277,422 |
|
|
|
69.2 |
|
|
|
252,969 |
|
|
|
68.3 |
|
|
Gross profit margin |
|
|
128,924 |
|
|
|
29.4 |
|
|
|
123,360 |
|
|
|
30.8 |
|
|
|
117,202 |
|
|
|
31.7 |
|
|
Selling, general and administrative |
|
|
78,173 |
|
|
|
17.8 |
|
|
|
73,490 |
|
|
|
18.3 |
|
|
|
69,222 |
|
|
|
18.8 |
|
|
(Gain) loss from disposal of assets |
|
|
(87 |
) |
|
|
— |
|
|
|
(217 |
) |
|
|
(0.1 |
) |
|
|
162 |
|
|
|
— |
|
|
Income from operations |
|
|
50,838 |
|
|
|
11.6 |
|
|
|
50,087 |
|
|
|
12.4 |
|
|
|
47,818 |
|
|
|
12.9 |
|
|
Other income (expense), net |
|
|
413 |
|
|
|
0.1 |
|
|
|
(153 |
) |
|
|
— |
|
|
|
(909 |
) |
|
|
(0.2 |
) |
|
Earnings from continuing operations before income taxes |
|
|
51,251 |
|
|
|
11.7 |
|
|
|
49,934 |
|
|
|
12.4 |
|
|
|
46,909 |
|
|
|
12.7 |
|
|
Provision for income taxes |
|
|
12,959 |
|
|
|
3.0 |
|
|
|
12,497 |
|
|
|
3.1 |
|
|
|
14,151 |
|
|
|
3.8 |
|
|
Earnings from continuing operations |
|
|
38,292 |
|
|
|
8.7 |
|
|
|
37,437 |
|
|
|
9.3 |
|
|
|
32,758 |
|
|
|
8.9 |
|
|
Earnings from discontinued operations, net of tax |
|
|
— |
|
|
|
— |
|
|
|
— |
|
|
|
— |
|
|
|
147 |
|
|
|
- |
|
|
Net earnings |
|
$ |
38,292 |
|
|
|
8.7 |
% |
|
$ |
37,437 |
|
|
|
9.3 |
% |
|
$ |
32,905 |
|
|
|
8.9 |
% |
|
|
|
|
|
|
|
|
|
|
|
|
|
|
|
|
|
|
|
|
|
|
|
|
|
|
|
Earnings per share - diluted |
|
|
|
|
|
|
|
|
|
|
|
|
|
|
|
|
|
|
|
|
|
|
|
|
|
Continuing operations |
|
$ |
1.47 |
|
|
|
|
|
|
$ |
1.45 |
|
|
|
|
|
|
$ |
1.29 |
|
|
|
|
|
|
Discontinued operations |
|
|
— |
|
|
|
|
|
|
|
- |
|
|
|
|
|
|
|
0.01 |
|
|
|
|
|
|
Net earnings |
|
$ |
1.47 |
|
|
|
|
|
|
$ |
1.45 |
|
|
|
|
|
|
$ |
1.30 |
|
|
|
|
|
Net Sales. Our net sales increased from $400.8 million for fiscal year 2019 to $438.4 million for fiscal year 2020, an increase of 9.4%. The recent increase in supply of cheaper foreign paper imports, due to the strengthening of the U.S. dollar, unseasonal weather conditions in parts of the country and current domestic pricing levels, continues to provide the elements for a challenging marketplace. Each of these factors negatively impacted sales. In particular, our competition was able to be more price-competitive due to the availability of cheaper materials, and some of our sales were negatively impacted by weather conditions. The acquisitions of Integrated, which was completed in March 2019, and Flesh, which was completed in July 2019, were integral parts of our strategy to offset normal industry revenue declines due to print attrition and other changes. Our acquisitions during fiscal years 2020 and 2019 positively impacted our net sales by approximately $55.3 million during fiscal year 2020.
Our net sales increased from $370.2 million for fiscal year 2018 to $400.8 million for fiscal year 2019, an increase of 8.3%. The market continued to be fairly soft with competitive pricing pressures in fiscal year 2019. However, during fiscal year 2019, the value of the U.S. dollar made domestic paper production more attractive internationally. The attractiveness of domestic paper production, coupled with the shrinking domestic mill capacity, resulted in an environment conducive for paper and other material price increases domestically. Those increases, if able to be timely passed along to customers, would help offset some of the normal industry sales attrition. The acquisitions of Wright, which was completed in July 2018, and ABTL, which was completed in April 2018, contributed over $44.7 million in net sales during fiscal year 2019.
Cost of Goods Sold. Our manufacturing costs increased from $277.4 million for fiscal year 2019 to $309.5 million for fiscal year 2020, or 11.6%. Our gross profit margin (“margin”) decreased from 30.8% for fiscal year 2019 to 29.4% for fiscal year 2020. Our margin during the period continues to be impacted for the most part by the dilutive impact of the acquisitions completed in the last year and to a lesser extent to the numerous raw material price increases taken last fiscal year, some of which could not be completely passed through to the customer. During the previous fiscal year, tight supply conditions allowed for multiple price increases on raw materials which could be passed through to the customer due to apportionment of paper, as well as other items in the manufacturing process. Historically price increases have been less frequent, which allowed manufacturers the ability to pass the required pricing adjustments through to the marketplace in a timely manner. However, the size and number of increases impacted manufacturers’ abilities to timely pass these price adjustments to the end-users. We believe
22
these price increases will continue to have a negative impact on margins until the excess costs are able to be passed through to the marketplace, or until material costs decline in the marketplace. Recently, due to current pricing levels and the strengthening U.S. dollar, imports have increased and created an excess supply condition domestically. This historically has led to some normalization/stability in the marketplace which is starting to be seen as material prices have become softer. Our acquisitions completed during the past year have had a dilutive impact on our margins as we transition them into our enterprise resource planning system. Without the impact of the acquisitions completed over the past 18 months, the margins from our other plants continued to be above 30.8% during the period, comparable to historical levels. Once we have the opportunity to fully analyze the business cost structure and implement our costs systems, we believe margins at the recently acquired plants will improve to levels closer to the rest of our business.
Our manufacturing costs increased from $253.0 million for fiscal year 2018 to $277.4 million for fiscal year 2019, or 9.6%. Our margin decreased from 31.7% for fiscal year 2018 to 30.8% for fiscal year 2019. Our margin during the period was impacted primarily by the increased cost of raw materials, and to a lesser extent by the acquisition of ABTL and Wright, which had a dilutive impact on the Company’s reported margin. The industry continued to be challenged by raw material and freight cost increases. The tight supply conditions during fiscal year 2019 allowed for multiple price increases on raw materials, as well as other items in the manufacturing process. Historical price increases were less frequent, which allowed manufacturers the ability to pass the required pricing adjustments through to the marketplace in a timely manner. However, the size and number of increases impacted manufacturers’ ability to timely pass these price adjustments to the end-users. These price increases continued to have a negative impact on margins. The acquisition of Wright and ABTL had a dilutive impact on our margins. We believe once we have the opportunity to fully analyze relevant cost structures and implement our costs systems, the margins of Wright and ABTL will improve to levels closer to the rest of our business.
Selling, general, and administrative expenses. Our selling, general, and administrative (“SG&A”) expenses increased approximately 6.4%, from $73.5 million for fiscal year 2019 to $78.2 million for fiscal year 2020. As a percentage of sales, SG&A expenses declined from 18.3% in fiscal year 2019 to 17.8% for fiscal year 2020. Our acquisitions negatively impacted our SG&A expenses by approximately $6.6 million during fiscal year 2020. We continue to seek ways to more fully leverage our SG&A expenses, and to reduce SG&A expenses following acquisitions through the implementation of our systems and processes, which allows us to integrate many of our acquired companies’ back-office processes.
Our SG&A expenses increased approximately 6.2%, from $69.2 million for fiscal year 2018 to $73.5 million for fiscal year 2019. As a percentage of sales, SG&A expenses declined from 18.8% in fiscal year 2018 to 18.3% for fiscal year 2019. The acquisitions of Wright and ABTL added approximately $5.7 million and $1.7 million, respectively, in SG&A expenses during fiscal year 2019.
(Gain) loss from disposal of assets. The $0.1 million gain from disposal of assets for fiscal year 2020 is primarily attributed to the sale of a manufacturing facility. The $0.2 million gain from disposal of assets for fiscal year 2019 is primarily attributed to the sale of an unused manufacturing facility and manufacturing equipment. The $0.2 million loss from disposal of assets for fiscal year 2018 related primarily to the sale of manufacturing equipment as well as the closing and consolidation of manufacturing facilities.
Income from operations. Primarily due to factors described above, our income from continuing operations for fiscal year 2020 was $50.8 million, or 11.6% of net sales, compared to $50.1 million, or 12.5% of net sales, for fiscal year 2019. Our acquisitions contributed approximately $6.2 to our operational income during fiscal year 2020.
Our income from continuing operations for fiscal year 2019 was $50.1 million, or 12.4% of net sales, compared to $47.8 million, or 12.9% of net sales, for fiscal year 2018. Our acquisitions contributed approximately $4.5 million to our operational income during fiscal year 2020, or 8.8%.
23
Other income (expense). Other income was $0.4 million for fiscal year 2020 compared to expense of $0.2 million for fiscal year 2019. The decrease in expense related primarily to approximately $0.5 million less in interest expense due to the payoff of the Credit Facility at the end of the second quarter of fiscal year 2020. Other expense was $0.2 million for fiscal year 2019 compared to $0.9 million for fiscal year 2018. This decrease related primarily to the $0.8 million increase of interest income in fiscal year 2019.
Provision for income taxes. Our effective tax rates for fiscal years 2020, 2019 and 2018 were 25.3%, 25.0%, and 30.2%, respectively. The slightly higher effective tax rate for fiscal year 2020 was primarily due to the establishment of a reserve against our foreign tax credits. The lower effective tax rate for fiscal year 2019 compared to fiscal year 2018 was primarily due to the enactment of the Tax Act which was in effect for all of fiscal year 2019, but only in effect for a small portion of fiscal year 2018.
Net earnings (loss). Our net earnings from continuing operations were $38.3 million, or $1.47 per diluted share for fiscal year 2020, $32.8 million, or $1.29 per diluted share for fiscal year 2018, and $37.4 million, or $1.45 per diluted share, for fiscal year 2019. Net earnings from discontinued operations for fiscal year 2018 was $0.01 per diluted share, which consisted of a write-off of a $2.0 million receivable ($1.4 million, net of tax) relating to the escrowed purchase price from the sale of our Apparel Segment and a $1.6 million tax benefit related to the determination of the final tax basis on assets sold in the sale of the Apparel Segment.
Liquidity and Capital Resources
|
|
|
Fiscal Years Ended |
|
|||||||||
|
(Dollars in thousands) |
|
2020 |
|
|
2019 |
|
|
2018 |
|
|||
|
Working Capital |
|
$ |
111,915 |
|
|
$ |
134,542 |
|
|
$ |
133,773 |
|
|
Cash |
|
$ |
68,258 |
|
|
$ |
88,442 |
|
|
$ |
96,230 |
|
Working Capital. Our working capital decreased by approximately $22.6 million, or 16.8%, from $134.5 million at February 28, 2019 to $111.9 million at February 29, 2020. Our current ratio, calculated by dividing our current assets by our current liabilities, decreased from 5.3-to-1.0 for fiscal year 2019 to 4.0-to-1.0 for fiscal year 2020. Our working capital and current ratio were negatively impacted by the repayment of long-term debt of $30.0 million and the adoption of Accounting Standards Update No. 2018-11, Leases (ASC 842): Targeted Improvements, which increased our current liabilities by $5.7 million.
Our working capital increased by approximately $0.8 million, or 0.6%, from $133.8 million at February 28, 2018 to $134.5 million at February 28, 2019. The increase was primarily due to the increase in our accounts receivable and inventories by $13.6 million, offset by a decrease in cash and prepaid income taxes of $11.2 million, as well as an increase in our accounts payable of $1.6 million. Our current ratio decreased from 5.5-to-1.0 for fiscal year 2018 to 5.3-to-1.0 for fiscal year 2019.
Our operations may be affected by the ongoing COVID-19 pandemic. The ultimate disruption that may result from the virus is uncertain, but it may result in a material adverse impact on our financial position, operations and cash flows. Possible areas that may be affected include, but are not limited to, disruption to our customers and revenue, labor workforce, and an impairment in the value of our long-lived assets, including property, plant and equipment, goodwill and other intangible assets.
Cash Flow Components
|
|
|
Fiscal years ended |
|
|||||||||
|
(Dollars in thousands) |
|
2020 |
|
|
2019 |
|
|
2018 |
|
|||
|
Net cash provided by operating activities |
|
$ |
57,219 |
|
|
$ |
51,335 |
|
|
$ |
45,290 |
|
|
Net cash used in investing activities |
|
$ |
(21,446 |
) |
|
$ |
(31,770 |
) |
|
$ |
(3,953 |
) |
|
Net cash used in financing activities |
|
$ |
(55,957 |
) |
|
$ |
(27,353 |
) |
|
$ |
(25,573 |
) |
Cash flows from operating activities. Cash provided by operating activities was $57.2 million for fiscal year 2020 (an increase of $5.9 million compared to fiscal year 2019), $51.3 million for fiscal year 2019 (an increase of $6.0 million compared to fiscal year 2018) and $45.3 million for fiscal year 2018.
24
Our increased operational cash flows in fiscal year 2020 compared to fiscal year 2019 was primarily the result of three factors: (i) a $0.9 million increase in net earnings; (ii) a $0.3 million decrease in our accounts receivable; and (iii) a $6.8 million decrease in our inventories. These three positive factors were offset by an increase in our prepaid expenses and prepaid income taxes of $4.9 million.
Our increased operational cash flows in fiscal year 2019 compared to fiscal year 2018 was primarily the result of three factors: (i) a $4.5 million increase in net earnings; (ii) a $1.5 million decrease in our accounts receivable; and (iii) a $3.4 million decrease in our prepaid expenses and income taxes. These positive factors were offset by a $3.6 million increase in inventories and a $2.4 million decrease in accounts payable and accrued expenses.
Cash flows from investing activities. Cash used in investing activities was $21.4 million fiscal year 2020 compared to $31.8 million fiscal year 2019 and $0.4 million fiscal year 2018. The $10.3 million decrease in cash used in fiscal year 2020 compared to fiscal year 2019 was primarily due to a $1.4 million decrease in capital expenditures and an $8.7 million decrease in costs to acquire businesses. The $27.8 million increase in cash used in fiscal year 2019 compared to fiscal year 2018 was primarily due to a $2.2 million increase in capital expenditures and a $26.0 million increase in the cost to acquire businesses.
Cash flows from financing activities. Cash used in financing activities was $56.0 million in fiscal year 2020 compared to $27.4 million used in fiscal year 2019 and $25.6 million used in fiscal year 2018.
The increase in our cash used in fiscal year 2020 compared to fiscal year 2019 resulted from two factors: (i) the payment of $30.0 million in long-term debt in fiscal year 2020, compared to the payment of no long-term debt in fiscal year 2019; and (ii) the payment of $0.9 million more in dividends in fiscal year 2020 compared to fiscal year 2019. These increases were offset by an approximate $2.3 million reduction in cash used to purchase our common stock under our repurchase program in fiscal year 2020 compared to fiscal year 2019.
The increase in our cash used in fiscal year 2019 compared to fiscal year 2018 resulted from two factors: (i) $0.4 million more in dividends were paid in fiscal year 2019 compared to fiscal year 2018; and (ii) $1.5 million more was used to repurchase our common stock under the board-approved repurchase program.
Stock Repurchase – The Board has authorized the repurchase the Company’s outstanding common stock through a stock repurchase program, which authorized amount is currently up to $40.0 million in the aggregate. Under the repurchase program, purchases may be made from time to time in the open market or through privately-negotiated transactions, depending on market conditions, share price, trading volume and other factors. Repurchases may be commenced or suspended at any time or from time to time without prior notice, provided that any purchases must be made in accordance with applicable insider trading rules and securities laws and regulations. Since the program’s inception in October 2008, we have repurchased 1,816,354 common shares under the program at an average price of $15.91 per share. During our fiscal year 2020, we repurchased 126,330 shares of common stock at an average price of $19.56 per share. As of February 29, 2020, $11.1 million remained available to repurchase shares of common stock under the program. The Company expects to continue to repurchase its shares under the repurchase program during fiscal year 2021 provided that the Board determines such repurchases to be in the best interests of the Company and its shareholders.
Credit Facility – The Company is party to a Second Amended and Restated Credit Agreement, which has been amended from time to time, pursuant to which a credit facility has been extended to the Company until November 11, 2021 (the “Credit Facility”). The Credit Facility provides the Company and its subsidiaries with up to $100.0 million in revolving credit, as well as a $20.0 million sublimit for the issuance of letters of credit and a $15.0 million sublimit for swing-line loans. Under the Credit Facility, the Company or any of its subsidiaries can request up to three increases in the aggregate commitments in an aggregate amount not to exceed $50.0 million. The terms and conditions of the Credit Facility impose certain restrictions on our ability to incur additional debt, make capital expenditures, acquisitions and asset dispositions, as well as impose other customary covenants, such as requiring that our fixed charge coverage ratio not be less than 1.25:1.00 and our total leverage ratio not exceed 3.00:1.00. The Company may make dividends or distributions to shareholders so long as (i) no event of default has occurred and is continuing and (ii) the Company’s net leverage ratio both before and after giving effect to any such dividend or distribution is equal to or less than 2.50:1.00. All calculations are made based on U.S. Generally Accepted Accounting Principles existing at the time the Credit Facility was entered into. As of February 29, 2020, the Company was in compliance with all terms and conditions of the Credit Facility.
25
The Credit Facility bears interest at the LIBOR rate plus a spread ranging from 1.0% to 2.0%, which rate was 3.6% (3 month LIBOR + 1.0%) at February 28, 2019. As a result of the extension of maturity until November 11, 2021, the spread will range from 1.85% to 2.5% on future borrowings, depending on our fixed charge coverage ratio of total funded debt to earnings before interest, taxes, depreciation and amortization (EBITDA). The Credit Facility is secured by substantially all of our assets (other than real property), as well as all capital securities of each of our subsidiaries.
During fiscal year 2020, we paid down the remaining $30.0 million on the revolving credit line. As a result, under the Credit Facility as of February 29, 2020, the Company had no outstanding debt and $0.7 million outstanding under standby letters of credit arrangements, leaving approximately $99.3 million in available borrowing capacity. It is anticipated that, should it be required, the line of credit available under the Credit Facility will be sufficient to cover our working capital needs for the foreseeable future.
Pension Plan – We are required to make contributions to our Pension Plan. These contributions are required under the minimum funding requirements of the Employee Retirement Income Security Act of 1974 (“ERISA”). Due to the recent enactment of the Moving Ahead for Progress in the 21st Century (“MAP-21”) in July 2012, plan sponsors can calculate the discount rate used to measure the Pension Plan liability using a 25-year average of interest rates plus or minus a corridor. Prior to MAP-21, the discount rate used in measuring the pension liability was based on the 24-month average of interest rates. We made contributions of $3.0 million to our Pension Plan during each of our last three fiscal years. Given our funding status as of February 29, 2020 and absent any significant negative event, we anticipate that our future contributions will be between $1.5 million and $3.0 million per year, depending on our Pension Plan’s funding. As our Pension Plan assets are invested in marketable securities, fluctuations in market values could potentially impact our funded status, associated liabilities recorded, and future required minimum contributions. At February 29, 2020, we had an unfunded pension liability recorded on our balance sheet of $8.9 million. During fiscal year 2020 due to the decrease in long-term rates, we decreased the discount rate we used to calculate our pension liability to 2.65% from 4.1% used in fiscal year 2019, which increased our recorded pension liability by approximately $13.5 million (each 10 basis point change in the discount rate potentially impacts our computed pension liability by approximately $930,000). In addition, we adopted the new MP-2019 mortality improvement scale and the new Pri-2012 Blue Collar mortality tables, which reduced our recorded pension liability by approximately $0.5 million. The updated mortality table reflects slightly higher mortality compared to the prior tables and the mortality improvement scale reflects slightly lower projected mortality experience improvement in the future compared to the previous assumptions utilized in fiscal year 2019’s valuation of liabilities. The projected return on our Pension Plan assets was reduced during fiscal year 2019 from 7.5% to 7.0% for fiscal year 2020. Each 50 basis point increase in our projected return rate would impact our pension expense by approximately $0.3 million.
Inventories – We believe our current inventory levels are sufficient to satisfy our customer demands and we anticipate having adequate sources of raw materials to meet future business requirements. We have long-term contracts in effect with paper suppliers that govern prices, but do not require minimum purchase commitments. Certain of our rebate programs do, however, require minimum purchase volumes. Management anticipates meeting the required volumes.
Capital Expenditures – We expect our capital expenditure requirements for fiscal year 2021, exclusive of capital required for possible acquisitions, will be in line with our historical levels of between $3.0 million and $5.0 million. We expect to fund these expenditures through existing cash flows. We expect to generate sufficient cash flows from our operating activities to cover our operating and other normal capital requirements for the foreseeable future.
26
Contractual Obligations & Off-Balance Sheet Arrangements – There have been no significant changes in our contractual obligations since February 29, 2020 that have, or that are reasonably likely to have, a material impact on our results of operations or financial condition. We had no off-balance sheet arrangements in place as of February 29, 2020. The following table represents our contractual commitments as of February 29, 2020 (in thousands).
|
|
|
|
|
|
|
Due in less |
|
|
Due in |
|
|
Due in |
|
|
Due in more |
|
||||
|
|
|
Total |
|
|
than 1 year |
|
|
1-3 years |
|
|
4-5 years |
|
|
than 5 years |
|
|||||
|
Estimated pension benefit payments to Pension Plan participants |
|
|
43,000 |
|
|
|
4,600 |
|
|
|
7,900 |
|
|
|
9,900 |
|
|
|
20,600 |
|
|
Letters of credit |
|
|
652 |
|
|
|
652 |
|
|
|
— |
|
|
|
— |
|
|
|
— |
|
|
Operating leases |
|
|
21,822 |
|
|
|
5,785 |
|
|
|
9,439 |
|
|
|
5,100 |
|
|
|
1,498 |
|
|
Total |
|
$ |
65,474 |
|
|
$ |
11,037 |
|
|
$ |
17,339 |
|
|
$ |
15,000 |
|
|
$ |
22,098 |
|
ITEM 7A. QUANTITATIVE AND QUALITATIVE DISCLOSURES ABOUT MARKET RISK
Market Risk
Interest Rates
From time to time, we are exposed to interest rate risk on short-term and long-term financial instruments carrying variable interest rates. We may from time to time utilize interest rate swaps to manage overall borrowing costs and reduce exposure to adverse fluctuations in interest rates. We do not use derivative instruments for trading purposes. We had no variable rate financial instruments outstanding at February 29, 2020 due to the pay-down of our Credit Facility, but we will be exposed to interest rate risk if we borrow under the Credit Facility in the future.
ITEM 8. CONSOLIDATED FINANCIAL STATEMENTS AND SUPPLEMENTARY DATA
Our Consolidated Financial Statements and Supplementary Data required by this Item 8 are set forth following the signature page of this report and are incorporated herein by reference.
ITEM 9. CHANGES IN AND DISAGREEMENTS WITH ACCOUNTANTS ON ACCOUNTING AND FINANCIAL DISCLOSURE
None.
ITEM 9A. CONTROLS AND PROCEDURES
Disclosure Controls and Procedures
A review and evaluation was carried out under the supervision and with the participation of our management, including our Chief Executive Officer and our Chief Financial Officer, of the effectiveness of the design and operation of our “disclosure controls and procedures” (as such term is defined in Rules 13a-15(e) and 15d-15(e) of the Exchange Act of 1934, as amended (the “Exchange Act”)) as of February 29, 2020. Based upon that review and evaluation, we have concluded that our disclosure controls and procedures were effective as of February 29, 2020.
In conducting our evaluation, we excluded the assets and liabilities and results of operations of Integrated Print and Graphics and The Flesh Company, which we acquired on March 16, 2019 and July 15, 2019, respectively, in accordance with the SEC’s guidance concerning the reporting of internal controls over financial reporting in connection with a material acquisition. The assets and revenues resulting from these acquisitions constituted approximately 7 and 8 percent, respectively, of the related consolidated financial statement amounts as of and for the year ended February 29, 2020.
Management’s Report on Internal Control over Financial Reporting
The financial statements, financial analysis and all other information in this Annual Report on Form 10-K were prepared by management, who is responsible for their integrity and objectivity and for establishing and maintaining adequate internal controls over financial reporting.
27
The Company’s internal control over financial reporting is designed to provide reasonable assurance regarding the reliability of financial reporting and the preparation of financial statements for external purposes in accordance with accounting principles generally accepted in the United States of America. The Company’s internal control over financial reporting includes those policies and procedures that:
|
|
i. |
Pertain to the maintenance of records that, in reasonable detail, accurately and fairly reflect the transactions and dispositions of assets of the Company; |
|
|
ii. |
Provide reasonable assurance that transactions are recorded as necessary to permit preparation of financial statements in accordance with generally accepted accounting principles, and that receipts and expenditures of the Company are being made only in accordance with authorizations of management and directors of the Company; and |
|
|
iii. |
Provide reasonable assurance regarding prevention or timely detection of unauthorized acquisition, use, or dispositions of the Company’s assets that could have a material effect on the financial statements. |
There are inherent limitations in the effectiveness of any internal control, including the possibility of human error and the circumvention or overriding of controls. Accordingly, even effective internal controls can provide only reasonable assurances with respect to financial statement preparation. Further, because of changes in conditions, the effectiveness of internal controls may vary over time.
Management assessed the design and effectiveness of the Company’s internal control over financial reporting as of February 29, 2020. In making this assessment, management used the criteria set forth by the Committee of Sponsoring Organizations of the Treadway Commission (“COSO”) in the 2013 Internal Control—Integrated Framework (“2013 COSO framework”). Based on management’s assessment using those criteria, we believe that, as of February 29, 2020, the Company’s internal control over financial reporting is effective.
In conducting our evaluation, we excluded the assets and liabilities and results of operations of Integrated Print and Graphics and The Flesh Company, which we acquired on March 16, 2019 and July 15, 2019, respectively, in accordance with the SEC’s guidance concerning the reporting of internal controls over financial reporting in connection with a material acquisition. The assets and revenues resulting from these acquisitions constituted approximately 7 and 8 percent, respectively, of the related consolidated financial statement amounts as of and for the year ended February 29, 2020.
Changes in Internal Controls
There were no changes in our internal control over financial reporting identified in connection with the evaluation required by paragraph (d) of Exchange Act Rules 13a-15 or 15d-15 that occurred during our last fiscal quarter that have materially affected, or are reasonably likely to materially affect, our internal control over financial reporting.
Grant Thornton LLP, an independent registered public accounting firm, has audited the consolidated financial statements of the Company for the fiscal year ended February 29, 2020 and has attested to the effectiveness of the Company’s internal control over financial reporting as of February 29, 2020. Their report on the effectiveness of internal control over financial reporting is presented on page F-3 of this Annual Report on Form 10-K.
None.
28
ITEM 10. DIRECTORS, EXECUTIVE OFFICERS AND CORPORATE GOVERNANCE
Except as set forth below, the information required by Item 10 is incorporated herein by reference to the definitive Proxy Statement for our 2020 Annual Meeting of Shareholders.
The SEC and the NYSE have issued multiple regulations requiring policies and procedures in the corporate governance area. In complying with these regulations, it has been the goal of the Company’s Board and senior leadership to do so in a way which does not inhibit or constrain the Company’s unique culture, and which does not unduly impose a bureaucracy of forms and checklists. Accordingly, formal, written policies and procedures have been adopted in the simplest possible way, consistent with legal requirements, including a Code of Ethics applicable to the Company’s principal executive officer, principal financial officer, and principal accounting officer or controller. The Company’s Corporate Governance Guidelines, its charters for each of its Audit, Compensation, Nominating and Corporate Governance Committees and its Code of Ethics covering all Employees are available on the Company’s website, www.ennis.com, and a copy will be mailed upon request to Investor Relations at 2441 Presidential Parkway, Midlothian, TX 76065. If we make any substantive amendments to the Code, or grant any waivers to the Code for any of our senior officers or directors, we will disclose such amendment or waiver on our website and in a report on Form 8-K.
ITEM 11. EXECUTIVE COMPENSATION
The information required by Item 11 is hereby incorporated herein by reference to the definitive Proxy Statement for our 2020 Annual Meeting of Shareholders.
ITEM 12. SECURITY OWNERSHIP OF CERTAIN BENEFICIAL OWNERS AND MANAGEMENT AND RELATED STOCKHOLDER MATTERS
The information required by Item 12, as to certain beneficial owners and management, is hereby incorporated by reference to the definitive Proxy Statement for our 2020 Annual Meeting of Shareholders.
ITEM 13. CERTAIN RELATIONSHIPS AND RELATED TRANSACTIONS, AND DIRECTOR INDEPENDENCE
The information required by Item 13 is hereby incorporated herein by reference to the definitive Proxy Statement for our 2020 Annual Meeting of Shareholders.
ITEM 14. PRINCIPAL ACCOUNTANT FEES AND SERVICES
The information required by Item 14 is hereby incorporated herein by reference to the definitive Proxy Statement for our 2020 Annual Meeting of Shareholders.
29
ITEM 15. EXHIBITS AND FINANCIAL STATEMENT SCHEDULES
The following documents are filed as part of this report.
|
1. |
Index to Consolidated Financial Statements of the Company |
An “Index to Consolidated Financial Statements” has been filed as a part of this Report beginning on page F-1 hereof.
|
2. |
All schedules for which provision is made in the applicable accounting regulation of the SEC have been omitted because of the absence of the conditions under which they would be required or because the information required is included in the consolidated financial statements of the Registrant or the notes thereto. |
|
3. |
Exhibits |
|
Exhibit Number |
|
Description |
|
|
|
|
|
Exhibit 3.1(a) |
|
|
|
|
|
|
|
Exhibit 3.1(b) |
|
|
|
|
|
|
|
Exhibit 3.2 |
|
|
|
|
|
|
|
Exhibit 4.1 |
|
Description of Ennis, Inc. Securities Registered under Section 12 of the Exchange Act of 1934.* |
|
|
|
|
|
Exhibit 10.1 |
|
|
|
|
|
|
|
Exhibit 10.2 |
|
|
|
|
|
|
|
Exhibit 10.3 |
|
|
|
|
|
|
|
Exhibit 10.4 |
|
|
|
|
|
|
|
Exhibit 10.5 |
|
|
|
|
|
|
30
|
Exhibit Number |
|
Description |
|
|
|
|
|
|
||
|
|
|
|
|
Exhibit 10.7 |
|
|
|
|
|
|
|
Exhibit 10.8 |
|
|
|
|
|
|
|
Exhibit 10.9 |
|
|
|
|
|
|
|
Exhibit 21 |
|
|
|
|
|
|
|
Exhibit 23 |
|
|
|
|
|
|
|
Exhibit 31.1 |
|
Certification Pursuant to Rule 13a-14(a) of Chief Executive Officer.* |
|
|
|
|
|
Exhibit 31.2 |
|
Certification Pursuant to Rule 13a-14(a) of Chief Financial Officer.* |
|
|
|
|
|
Exhibit 32.1 |
|
|
|
|
|
|
|
Exhibit 32.2 |
|
|
|
|
|
|
|
Exhibit 101 |
|
The following information from Ennis, Inc.’s Annual Report on Form 10-K for the year ended February 29, 2020, filed on May 4, 2020, formatted in XBRL: (i) Consolidated Balance Sheets, (ii) Consolidated Statements of Operations, (iii) Consolidated Statements of Comprehensive Income, (iv) Consolidated Statements of Changes in Shareholders’ Equity, (v) Consolidated Statements of Cash Flows, and (vi) the Notes to Consolidated Financial Statements, tagged as blocks of text and in detail. |
|
* |
Filed herewith. |
|
** |
Furnished herewith. |
|
+ |
Represents a management contract or a compensatory plan or arrangement. |
31
Pursuant to the requirements of Section 13 or 15(d) of the Securities Exchange Act of 1934, the Registrant has duly caused this report to be signed on its behalf by the undersigned, thereunto duly authorized.
|
|
ENNIS, INC. |
|
|
|
|
|
|
Date: May 4, 2020 |
|
/s/ KEITH S. WALTERS |
|
|
|
Keith S. Walters, Chairman of the Board, |
|
|
|
Chief Executive Officer and President |
|
|
|
|
|
Date: May 4, 2020 |
|
/s/ RICHARD L. TRAVIS, JR. |
|
|
|
Richard L. Travis, Jr. |
|
|
|
Vice President — Finance and Chief Financial Officer |
Pursuant to the requirements of the Securities Exchange Act of 1934, this report has been signed below by the following persons on behalf of the Registrant and in the capacities and on the dates indicated.
|
Date: May 4, 2020 |
|
/s/ KEITH S. WALTERS |
|
|
|
Keith S. Walters, Chairman of the Board, Chief Executive Officer and President |
|
|
|
|
|
Date: May 4, 2020 |
|
/s/ JOHN R. BLIND |
|
|
|
John R. Blind, Director |
|
|
|
|
|
Date: May 4, 2020 |
|
/s/ FRANK D. BRACKEN |
|
|
|
Frank D. Bracken, Director |
|
|
|
|
|
Date: May 4, 2020 |
|
/s/ BARBARA T. CLEMENS |
|
|
|
Barbara T. Clemens, Director |
|
|
|
|
|
Date: May 4, 2020 |
|
/s/ GODFREY M. LONG, JR. |
|
|
|
Godfrey M. Long, Jr., Director |
|
|
|
|
|
Date: May 4, 2020 |
|
/s/ GARY S. MOZINA |
|
|
|
Gary S. Mozina, Director |
|
|
|
|
|
Date: May 4, 2020 |
|
/s/ TROY L. PRIDDY |
|
|
|
Troy L. Priddy, Director |
|
|
|
|
|
Date: May 4, 2020 |
|
/s/ ALEJANDRO QUIROZ |
|
|
|
Alejandro Quiroz, Director |
|
|
|
|
|
Date: May 4, 2020 |
|
/s/ MICHAEL J. SCHAEFER |
|
|
|
Michael J. Schaefer, Director |
|
|
|
|
|
Date: May 4, 2020 |
|
/s/ RICHARD L. TRAVIS, JR. |
|
|
|
Richard L. Travis, Jr., Principal Financial and Accounting Officer |
32
Index to Consolidated Financial Statements
F-1
REPORT OF INDEPENDENT REGISTERED PUBLIC ACCOUNTING FIRM
Board of Directors and Shareholders
Ennis, Inc.
Opinion on the financial statements
We have audited the accompanying consolidated balance sheets of Ennis, Inc. (a Texas corporation) and subsidiaries (the “Company”) as of February 29, 2020 and February 28, 2019, the related consolidated statements of operations, comprehensive income, changes in shareholders’ equity, and cash flows for each of the three years in the period ended February 29, 2020, and the related notes (collectively referred to as the “financial statements”). In our opinion, the financial statements present fairly, in all material respects, the financial position of the Company as of February 29, 2020 and February 28, 2019, and the results of its operations and its cash flows for each of the three years in the period ended February 29, 2020, in conformity with accounting principles generally accepted in the United States of America.
We also have audited, in accordance with the standards of the Public Company Accounting Oversight Board (United States) (“PCAOB”), the Company’s internal control over financial reporting as of February 29, 2020, based on criteria established in the 2013 Internal Control—Integrated Framework issued by the Committee of Sponsoring Organizations of the Treadway Commission (“COSO”), and our report dated May 4, 2020 expressed an unqualified opinion.
Change in accounting principle
As discussed in Note 1 to the consolidated financial statements, the Company changed its method of accounting for leases on March 1, 2019 due to the adoption of Accounting Standards Update No. 2016-02: Leases (Topic 842).
Basis for opinion
These financial statements are the responsibility of the Company’s management. Our responsibility is to express an opinion on the Company’s financial statements based on our audits. We are a public accounting firm registered with the PCAOB and are required to be independent with respect to the Company in accordance with the U.S. federal securities laws and the applicable rules and regulations of the Securities and Exchange Commission and the PCAOB.
We conducted our audits in accordance with the standards of the PCAOB. Those standards require that we plan and perform the audit to obtain reasonable assurance about whether the financial statements are free of material misstatement, whether due to error or fraud. Our audits included performing procedures to assess the risks of material misstatement of the financial statements, whether due to error or fraud, and performing procedures that respond to those risks. Such procedures included examining, on a test basis, evidence regarding the amounts and disclosures in the financial statements. Our audits also included evaluating the accounting principles used and significant estimates made by management, as well as evaluating the overall presentation of the financial statements. We believe that our audits provide a reasonable basis for our opinion.
/s/ GRANT THORNTON LLP
We have served as the Company’s auditor since 2005.
Dallas, Texas
May 4, 2020
F-2
REPORT OF INDEPENDENT REGISTERED PUBLIC ACCOUNTING FIRM
Board of Directors and Shareholders
Ennis, Inc.
Opinion on internal control over financial reporting
We have audited the internal control over financial reporting of Ennis, Inc. (a Texas corporation) and subsidiaries (the “Company”) as of February 29, 2020, based on criteria established in the 2013 Internal Control—Integrated Framework issued by the Committee of Sponsoring Organizations of the Treadway Commission (“COSO”). In our opinion, the Company maintained, in all material respects, effective internal control over financial reporting as of February 29, 2020, based on criteria established in the 2013 Internal Control—Integrated Framework issued by COSO.
We also have audited, in accordance with the standards of the Public Company Accounting Oversight Board (United States) (“PCAOB”), the consolidated financial statements of the Company as of and for the year ended February 29, 2020, and our report dated May 4, 2020 expressed an unqualified opinion on those financial statements.
Basis for opinion
The Company’s management is responsible for maintaining effective internal control over financial reporting and for its assessment of the effectiveness of internal control over financial reporting, included in the accompanying Management’s Report on Internal Control over Financial Reporting (“Management’s Report”). Our responsibility is to express an opinion on the Company’s internal control over financial reporting based on our audit. We are a public accounting firm registered with the PCAOB and are required to be independent with respect to the Company in accordance with the U.S. federal securities laws and the applicable rules and regulations of the Securities and Exchange Commission and the PCAOB.
We conducted our audit in accordance with the standards of the PCAOB. Those standards require that we plan and perform the audit to obtain reasonable assurance about whether effective internal control over financial reporting was maintained in all material respects. Our audit included obtaining an understanding of internal control over financial reporting, assessing the risk that a material weakness exists, testing and evaluating the design and operating effectiveness of internal control based on the assessed risk, and performing such other procedures as we considered necessary in the circumstances. We believe that our audit provides a reasonable basis for our opinion.
Our audit of, and opinion on, the Company’s internal control over financial reporting does not include the internal control over financial reporting of Integrated Print and Graphics and The Flesh Company, wholly-owned subsidiaries whose financial statements reflect total assets and revenues constituting 7 and 8 percent, respectively, of the related consolidated financial statement amounts as of and for the year ended February 29, 2020. As indicated in Management’s Report, Integrated Print and Graphics and The Flesh Company were acquired during the year ended 2020. Management’s assertion on the effectiveness of the Company’s internal control over financial reporting excluded internal control over financial reporting of Integrated Print and Graphics and The Flesh Company.
Definition and limitations of internal control over financial reporting
A company’s internal control over financial reporting is a process designed to provide reasonable assurance regarding the reliability of financial reporting and the preparation of financial statements for external purposes in accordance with generally accepted accounting principles. A company’s internal control over financial reporting includes those policies and procedures that (1) pertain to the maintenance of records that, in reasonable detail, accurately and fairly reflect the transactions and dispositions of the assets of the company; (2) provide reasonable assurance that transactions are recorded as necessary to permit preparation of financial statements in accordance with generally accepted accounting principles, and that receipts and expenditures of the company are being made only in accordance with authorizations of management and directors of the company; and (3) provide reasonable assurance regarding prevention or timely detection of unauthorized acquisition, use, or disposition of the company’s assets that could have a material effect on the financial statements.
F-3
Because of its inherent limitations, internal control over financial reporting may not prevent or detect misstatements. Also, projections of any evaluation of effectiveness to future periods are subject to the risk that controls may become inadequate because of changes in conditions, or that the degree of compliance with the policies or procedures may deteriorate.
/s/ GRANT THORNTON LLP
Dallas, Texas
May 4, 2020
F-4
(in thousands)
|
|
|
February 29, |
|
|
February 28, |
|
||
|
|
|
2020 |
|
|
2019 |
|
||
|
Assets |
|
|
|
|
|
|
|
|
|
Current assets |
|
|
|
|
|
|
|
|
|
Cash |
|
$ |
68,258 |
|
|
$ |
88,442 |
|
|
Accounts receivable, net of allowance for doubtful receivables of $715 at February 29, 2020 and $1,020 at February 28, 2019 |
|
|
43,086 |
|
|
|
40,357 |
|
|
Prepaid expenses |
|
|
1,541 |
|
|
|
1,760 |
|
|
Prepaid income taxes |
|
|
2,164 |
|
|
|
195 |
|
|
Inventories |
|
|
34,835 |
|
|
|
35,411 |
|
|
Total current assets |
|
|
149,884 |
|
|
|
166,165 |
|
|
Property, plant and equipment |
|
|
|
|
|
|
|
|
|
Plant, machinery and equipment |
|
|
155,744 |
|
|
|
146,001 |
|
|
Land and buildings |
|
|
57,887 |
|
|
|
56,394 |
|
|
Computer equipment and software |
|
|
19,312 |
|
|
|
19,084 |
|
|
Other |
|
|
4,873 |
|
|
|
4,754 |
|
|
Total property, plant and equipment |
|
|
237,816 |
|
|
|
226,233 |
|
|
Less accumulated depreciation |
|
|
181,414 |
|
|
|
173,099 |
|
|
Net property, plant and equipment |
|
|
56,402 |
|
|
|
53,134 |
|
|
Operating lease right-of-use assets |
|
|
20,068 |
|
|
|
— |
|
|
Goodwill |
|
|
82,527 |
|
|
|
81,634 |
|
|
Intangible assets, net |
|
|
56,557 |
|
|
|
61,272 |
|
|
Net pension asset |
|
|
— |
|
|
|
580 |
|
|
Other assets |
|
|
261 |
|
|
|
300 |
|
|
Total assets |
|
$ |
365,699 |
|
|
$ |
363,085 |
|
See accompanying notes to consolidated financial statements.
F-5
CONSOLIDATED BALANCE SHEETS-continued
(in thousands, except for par value and share amounts)
|
|
|
February 29, |
|
|
February 28, |
|
||
|
|
|
2020 |
|
|
2019 |
|
||
|
Liabilities and Shareholders’ Equity |
|
|
|
|
|
|
|
|
|
Current liabilities |
|
|
|
|
|
|
|
|
|
Accounts payable |
|
$ |
17,235 |
|
|
$ |
13,728 |
|
|
Accrued expenses |
|
|
15,069 |
|
|
|
17,895 |
|
|
Current portion of operating lease liabilities |
|
|
5,665 |
|
|
|
— |
|
|
Total current liabilities |
|
|
37,969 |
|
|
|
31,623 |
|
|
Long-term debt |
|
|
— |
|
|
|
30,000 |
|
|
Liability for pension benefits |
|
|
8,936 |
|
|
|
— |
|
|
Deferred income taxes |
|
|
8,749 |
|
|
|
10,898 |
|
|
Operating lease liabilities, net of current portion |
|
|
14,200 |
|
|
|
— |
|
|
Other liabilities |
|
|
1,516 |
|
|
|
1,437 |
|
|
Total liabilities |
|
|
71,370 |
|
|
|
73,958 |
|
|
Commitments and contingencies |
|
|
|
|
|
|
|
|
|
Shareholders’ equity |
|
|
|
|
|
|
|
|
|
Preferred stock $10 par value, authorized 1,000,000 shares; none issued |
|
|
— |
|
|
|
— |
|
|
Common stock $2.50 par value, authorized 40,000,000 shares; issued 30,053,443 shares at February 29, 2020 and February 28, 2019 |
|
|
75,134 |
|
|
|
75,134 |
|
|
Additional paid-in capital |
|
|
123,052 |
|
|
|
123,065 |
|
|
Retained earnings |
|
|
193,809 |
|
|
|
179,003 |
|
|
Accumulated other comprehensive loss: |
|
|
|
|
|
|
|
|
|
Minimum pension liability, net of taxes |
|
|
(25,206 |
) |
|
|
(16,704 |
) |
|
Treasury stock |
|
|
(72,460 |
) |
|
|
(71,371 |
) |
|
Total shareholders’ equity |
|
|
294,329 |
|
|
|
289,127 |
|
|
Total liabilities and shareholders' equity |
|
$ |
365,699 |
|
|
$ |
363,085 |
|
See accompanying notes to consolidated financial statements.
F-6
CONSOLIDATED STATEMENTS OF OPERATIONS
(in thousands, except share and per share amounts)
|
|
|
Fiscal Years Ended |
|
|||||||||
|
|
|
2020 |
|
|
2019 |
|
|
2018 |
|
|||
|
Net sales |
|
$ |
438,412 |
|
|
$ |
400,782 |
|
|
$ |
370,171 |
|
|
Cost of goods sold |
|
|
309,488 |
|
|
|
277,422 |
|
|
|
252,969 |
|
|
Gross profit margin |
|
|
128,924 |
|
|
|
123,360 |
|
|
|
117,202 |
|
|
Selling, general and administrative |
|
|
78,173 |
|
|
|
73,490 |
|
|
|
69,222 |
|
|
(Gain) loss from disposal of assets |
|
|
(87 |
) |
|
|
(217 |
) |
|
|
162 |
|
|
Income from operations |
|
|
50,838 |
|
|
|
50,087 |
|
|
|
47,818 |
|
|
Other income (expense) |
|
|
|
|
|
|
|
|
|
|
|
|
|
Interest expense |
|
|
(606 |
) |
|
|
(1,154 |
) |
|
|
(777 |
) |
|
Other, net |
|
|
1,019 |
|
|
|
1,001 |
|
|
|
(132 |
) |
|
Total other income (expense) |
|
|
413 |
|
|
|
(153 |
) |
|
|
(909 |
) |
|
Earnings from continuing operations before income taxes |
|
|
51,251 |
|
|
|
49,934 |
|
|
|
46,909 |
|
|
Income tax expense |
|
|
12,959 |
|
|
|
12,497 |
|
|
|
14,151 |
|
|
Earnings from continuing operations |
|
|
38,292 |
|
|
|
37,437 |
|
|
|
32,758 |
|
|
Earnings from discontinued operations, net of tax |
|
|
— |
|
|
|
— |
|
|
|
147 |
|
|
Net earnings |
|
$ |
38,292 |
|
|
$ |
37,437 |
|
|
$ |
32,905 |
|
|
Weighted average common shares outstanding |
|
|
|
|
|
|
|
|
|
|
|
|
|
Basic |
|
|
26,036,393 |
|
|
|
25,829,804 |
|
|
|
25,391,998 |
|
|
Diluted |
|
|
26,036,393 |
|
|
|
25,842,179 |
|
|
|
25,417,244 |
|
|
Earnings per share - basic and diluted |
|
|
|
|
|
|
|
|
|
|
|
|
|
Continuing operations |
|
$ |
1.47 |
|
|
$ |
1.45 |
|
|
$ |
1.29 |
|
|
Discontinued operations |
|
$ |
— |
|
|
$ |
— |
|
|
$ |
0.01 |
|
|
Net earnings |
|
$ |
1.47 |
|
|
$ |
1.45 |
|
|
$ |
1.30 |
|
|
Cash dividends per share |
|
$ |
0.900 |
|
|
$ |
0.875 |
|
|
$ |
0.875 |
|
See accompanying notes to consolidated financial statements.
F-7
CONSOLIDATED STATEMENTS OF COMPREHENSIVE INCOME
(in thousands)
|
|
|
Fiscal Years Ended |
|
|||||||||
|
|
|
2020 |
|
|
2019 |
|
|
2018 |
|
|||
|
Net earnings |
|
$ |
38,292 |
|
|
$ |
37,437 |
|
|
$ |
32,905 |
|
|
Adjustment to pension, net of taxes |
|
|
(8,502 |
) |
|
|
(276 |
) |
|
|
1,680 |
|
|
Comprehensive income |
|
$ |
29,790 |
|
|
$ |
37,161 |
|
|
$ |
34,585 |
|
See accompanying notes to consolidated financial statements.
F-8
CONSOLIDATED STATEMENTS OF CHANGES IN SHAREHOLDERS’ EQUITY
FOR THE FISCAL YEARS ENDED 2018, 2019, AND 2020
(in thousands, except share and per share amounts)
|
|
|
|
|
|
|
|
|
|
|
|
|
|
|
|
|
|
Accumulated |
|
|
|
|
|
|
|
|
|
|
|
|
|
|
|
|
|
|
|
|
|
|
|
|
Additional |
|
|
|
|
|
|
Other |
|
|
|
|
|
|
|
|
|
|
|
|
|
||
|
|
Common Stock |
|
|
Paid-in |
|
|
Retained |
|
|
Comprehensive |
|
|
Treasury Stock |
|
|
|
|
|
|||||||||||||
|
|
Shares |
|
|
Amount |
|
|
Capital |
|
|
Earnings |
|
|
Income (Loss) |
|
|
Shares |
|
|
Amount |
|
|
Total |
|
||||||||
|
Balance March 1, 2017 |
|
30,053,443 |
|
|
$ |
75,134 |
|
|
$ |
121,525 |
|
|
$ |
150,685 |
|
|
$ |
(15,261 |
) |
|
|
(4,686,821 |
) |
|
$ |
(80,728 |
) |
|
$ |
251,355 |
|
|
Net earnings |
|
— |
|
|
|
— |
|
|
|
— |
|
|
|
32,905 |
|
|
|
— |
|
|
|
— |
|
|
|
— |
|
|
|
32,905 |
|
|
Adjustment to pension (net of deferred tax of $1,030) and reclassification of the income tax effects of the US Tax Cuts and Jobs Act |
|
— |
|
|
|
— |
|
|
|
— |
|
|
|
2,847 |
|
|
|
(1,167 |
) |
|
|
— |
|
|
|
— |
|
|
|
1,680 |
|
|
Dividends paid ($0.875 per share) |
|
— |
|
|
|
— |
|
|
|
— |
|
|
|
(22,260 |
) |
|
|
— |
|
|
|
— |
|
|
|
— |
|
|
|
(22,260 |
) |
|
Stock based compensation |
|
— |
|
|
|
— |
|
|
|
1,337 |
|
|
|
— |
|
|
|
— |
|
|
|
— |
|
|
|
— |
|
|
|
1,337 |
|
|
Exercise of stock options and restricted stock |
|
— |
|
|
|
— |
|
|
|
(1,529 |
) |
|
|
— |
|
|
|
— |
|
|
|
88,771 |
|
|
|
1,529 |
|
|
|
— |
|
|
Common stock repurchases |
|
— |
|
|
|
— |
|
|
|
— |
|
|
|
— |
|
|
|
— |
|
|
|
(191,178 |
) |
|
|
(3,313 |
) |
|
|
(3,313 |
) |
|
Balance February 28, 2018 |
|
30,053,443 |
|
|
$ |
75,134 |
|
|
$ |
121,333 |
|
|
$ |
164,177 |
|
|
$ |
(16,428 |
) |
|
|
(4,789,228 |
) |
|
$ |
(82,512 |
) |
|
$ |
261,704 |
|
|
Net earnings |
|
— |
|
|
|
— |
|
|
|
— |
|
|
|
37,437 |
|
|
|
— |
|
|
|
— |
|
|
|
— |
|
|
|
37,437 |
|
|
Adjustment to pension, net of deferred tax of $92 |
|
— |
|
|
|
— |
|
|
|
— |
|
|
|
— |
|
|
|
(276 |
) |
|
|
— |
|
|
|
— |
|
|
|
(276 |
) |
|
Dividends paid ($0.875 per share) |
|
— |
|
|
|
— |
|
|
|
— |
|
|
|
(22,611 |
) |
|
|
— |
|
|
|
— |
|
|
|
— |
|
|
|
(22,611 |
) |
|
Stock based compensation |
|
— |
|
|
|
— |
|
|
|
1,397 |
|
|
|
— |
|
|
|
— |
|
|
|
— |
|
|
|
— |
|
|
|
1,397 |
|
|
Exercise of stock options and restricted stock |
|
— |
|
|
|
— |
|
|
|
(1,539 |
) |
|
|
— |
|
|
|
— |
|
|
|
110,806 |
|
|
|
1,608 |
|
|
|
69 |
|
|
Common stock issued for acquisition of business |
|
— |
|
|
|
— |
|
|
|
1,874 |
|
|
|
— |
|
|
|
— |
|
|
|
829,126 |
|
|
|
14,344 |
|
|
|
16,218 |
|
|
Common stock repurchases |
|
— |
|
|
|
— |
|
|
|
— |
|
|
|
— |
|
|
|
— |
|
|
|
(247,803 |
) |
|
|
(4,811 |
) |
|
|
(4,811 |
) |
|
Balance February 28, 2019 |
|
30,053,443 |
|
|
$ |
75,134 |
|
|
$ |
123,065 |
|
|
$ |
179,003 |
|
|
$ |
(16,704 |
) |
|
|
(4,097,099 |
) |
|
$ |
(71,371 |
) |
|
$ |
289,127 |
|
|
Net earnings |
|
— |
|
|
|
— |
|
|
|
— |
|
|
|
38,292 |
|
|
|
— |
|
|
|
— |
|
|
|
— |
|
|
|
38,292 |
|
|
Adjustment to pension, net of deferred tax of $2,834 |
|
— |
|
|
|
— |
|
|
|
— |
|
|
|
— |
|
|
|
(8,502 |
) |
|
|
— |
|
|
|
— |
|
|
|
(8,502 |
) |
|
Dividends paid ($0.90 per share) |
|
— |
|
|
|
— |
|
|
|
— |
|
|
|
(23,486 |
) |
|
|
— |
|
|
|
— |
|
|
|
— |
|
|
|
(23,486 |
) |
|
Stock based compensation |
|
— |
|
|
|
— |
|
|
|
1,369 |
|
|
|
— |
|
|
|
— |
|
|
|
— |
|
|
|
— |
|
|
|
1,369 |
|
|
Exercise of stock options and restricted stock |
|
— |
|
|
|
— |
|
|
|
(1,382 |
) |
|
|
— |
|
|
|
— |
|
|
|
87,143 |
|
|
|
1,382 |
|
|
|
— |
|
|
Common stock repurchases |
|
— |
|
|
|
— |
|
|
|
— |
|
|
|
— |
|
|
|
— |
|
|
|
(126,330 |
) |
|
|
(2,471 |
) |
|
|
(2,471 |
) |
|
Balance February 29, 2020 |
|
30,053,443 |
|
|
$ |
75,134 |
|
|
$ |
123,052 |
|
|
$ |
193,809 |
|
|
$ |
(25,206 |
) |
|
|
(4,136,286 |
) |
|
$ |
(72,460 |
) |
|
$ |
294,329 |
|
See accompanying notes to consolidated financial statements.
F-9
CONSOLIDATED STATEMENTS OF CASH FLOWS
(in thousands)
|
|
|
Fiscal Years Ended |
|
|||||||||
|
|
|
|
2020 |
|
|
|
2019 |
|
|
|
2018 |
|
|
Cash flows from operating activities: |
|
|
|
|
|
|
|
|
|
|
|
|
|
Net earnings |
|
$ |
38,292 |
|
|
$ |
37,437 |
|
|
$ |
32,905 |
|
|
Adjustments to reconcile net earnings to net cash provided by operating activities: |
|
|
|
|
|
|
|
|
|
|
|
|
|
Depreciation |
|
|
10,425 |
|
|
|
9,071 |
|
|
|
8,033 |
|
|
Amortization of deferred finance charges |
|
|
47 |
|
|
|
114 |
|
|
|
114 |
|
|
Amortization of intangible assets |
|
|
7,769 |
|
|
|
7,118 |
|
|
|
6,058 |
|
|
Pre-tax loss from discontinued operations |
|
|
— |
|
|
|
— |
|
|
|
2,000 |
|
|
(Gain) loss from disposal of assets |
|
|
(87 |
) |
|
|
(217 |
) |
|
|
162 |
|
|
Bad debt expense, net of recoveries |
|
|
(59 |
) |
|
|
212 |
|
|
|
(265 |
) |
|
Stock based compensation |
|
|
1,369 |
|
|
|
1,397 |
|
|
|
1,337 |
|
|
Deferred income taxes |
|
|
478 |
|
|
|
(742 |
) |
|
|
(1,794 |
) |
|
Net pension expense |
|
|
(1,819 |
) |
|
|
(1,683 |
) |
|
|
(1,400 |
) |
|
Changes in operating assets and liabilities, net of the effects of acquisitions: |
|
|
|
|
|
|
|
|
|
|
|
|
|
Accounts receivable |
|
|
1,781 |
|
|
|
1,480 |
|
|
|
(21 |
) |
|
Prepaid expenses and income taxes |
|
|
(1,538 |
) |
|
|
3,408 |
|
|
|
(2,699 |
) |
|
Inventories |
|
|
3,241 |
|
|
|
(3,580 |
) |
|
|
1,566 |
|
|
Other assets |
|
|
43 |
|
|
|
5 |
|
|
|
65 |
|
|
Accounts payable and accrued expenses |
|
|
(2,614 |
) |
|
|
(2,383 |
) |
|
|
(847 |
) |
|
Other liabilities |
|
|
(109 |
) |
|
|
(302 |
) |
|
|
76 |
|
|
Net cash provided by operating activities |
|
|
57,219 |
|
|
|
51,335 |
|
|
|
45,290 |
|
|
Cash flows from investing activities: |
|
|
|
|
|
|
|
|
|
|
|
|
|
Capital expenditures |
|
|
(3,394 |
) |
|
|
(4,824 |
) |
|
|
(2,667 |
) |
|
Purchase of businesses, net of cash acquired |
|
|
(18,733 |
) |
|
|
(27,389 |
) |
|
|
(1,350 |
) |
|
Proceeds from disposal of plant and property |
|
|
681 |
|
|
|
443 |
|
|
|
64 |
|
|
Net cash used in investing activities |
|
|
(21,446 |
) |
|
|
(31,770 |
) |
|
|
(3,953 |
) |
|
Cash flows from financing activities: |
|
|
|
|
|
|
|
|
|
|
|
|
|
Repayment of debt |
|
|
(30,000 |
) |
|
|
— |
|
|
|
— |
|
|
Dividends paid |
|
|
(23,486 |
) |
|
|
(22,611 |
) |
|
|
(22,260 |
) |
|
Common stock repurchases |
|
|
(2,471 |
) |
|
|
(4,811 |
) |
|
|
(3,313 |
) |
|
Proceeds from exercise of stock options |
|
|
— |
|
|
|
69 |
|
|
|
— |
|
|
Net cash used in financing activities |
|
|
(55,957 |
) |
|
|
(27,353 |
) |
|
|
(25,573 |
) |
|
Net change in cash |
|
|
(20,184 |
) |
|
|
(7,788 |
) |
|
|
15,764 |
|
|
Cash at beginning of period |
|
|
88,442 |
|
|
|
96,230 |
|
|
|
80,466 |
|
|
Cash at end of period |
|
$ |
68,258 |
|
|
$ |
88,442 |
|
|
$ |
96,230 |
|
See accompanying notes to consolidated financial statements.
F-10
NOTES TO CONSOLIDATED FINANCIAL STATEMENTS
(1) Significant Accounting Policies and General Matters
Nature of Operations. Ennis, Inc. and its wholly owned subsidiaries (collectively, the “Company”) are principally engaged in the production of and sale of business forms and other business products to customers primarily located in the United States.
Basis of Consolidation. The consolidated financial statements include the accounts of the Company and its wholly owned subsidiaries. All significant intercompany accounts and transactions have been eliminated. The Company’s last three fiscal years ended on the following days: February 29, 2020, February 28, 2019 and February 28, 2018 (fiscal years ended 2020, 2019 and 2018, respectively).
Accounts Receivable. Trade receivables are uncollateralized customer obligations due under normal trade terms requiring payment generally within 30 days from the invoice date. The Company’s allowance for doubtful receivables reserve is based on an analysis that estimates the amount of its total customer receivable balance that is not collectible. This analysis includes assessing a default probability to customers’ receivable balances, which is influenced by several factors including (i) current market conditions, (ii) periodic review of customer credit worthiness, and (iii) review of customer receivable aging and payment trends.
Inventories. With the exception of approximately 9.4% and 8.9% of its inventories valued at the lower of last-in, first-out (LIFO) for fiscal years 2020 and 2019, respectively, the Company values its inventories at the lower of first-in, first-out (FIFO) cost or net realizable value. The Company regularly reviews inventories on hand, using specific aging categories, and writes down the carrying value of its inventories for excess and potentially obsolete inventories based on historical usage and estimated future usage. In assessing the ultimate realization of its inventories, the Company is required to make judgments as to future demand requirements. As actual future demand or market conditions may vary from those projected by the Company, adjustments to inventories may be required. The Company provides reserves for excess and obsolete inventory when necessary based upon analysis of quantities on hand, recent sales volumes and reference to market prices. Reserves for excess and obsolete inventory at fiscal years ended 2020 and 2019 were $1.1 million and $0.9 million, respectively.
Property, Plant and Equipment. Depreciation and amortization of property, plant and equipment is calculated using the straight-line method over a period considered adequate to amortize the total cost over the useful lives of the assets, which range from 3 to 11 years for machinery and equipment and 10 to 33 years for buildings and improvements. Leasehold improvements are amortized over the shorter of the lease term or the estimated useful life of the improvements. Repairs and maintenance are expensed as incurred. Renewals and betterments are capitalized and depreciated over the remaining life of the specific property unit. The Company capitalizes all leases that are in substance acquisitions of property.
Goodwill and Other Intangible Assets. Goodwill is the excess of the purchase price paid over the value of net assets of businesses acquired and is not amortized. Intangible assets are amortized on a straight-line basis over their estimated useful lives. Goodwill is evaluated for impairment on an annual basis, or more frequently if impairment indicators arise, using a quantitative or qualitative fair-value-based test that compares the fair value of the related business unit to its carrying value.
Long-Lived Assets. Long-lived assets are reviewed for impairment whenever events or changes in circumstances indicate that the carrying amount of an asset may not be recoverable. Recoverability of assets to be held and used is measured by a comparison of the carrying amount of an asset to future undiscounted net cash flows expected to be generated by the asset. If such assets are considered to be impaired, the impairment to be recognized is based upon the fair value of assets.
F-11
ENNIS, INC. AND SUBSIDIARIES
NOTES TO CONSOLIDATED FINANCIAL STATEMENTS
Fair Value of Financial Instruments. Certain assets and liabilities are required to be recorded at fair value on a recurring basis. Fair value is determined based on the exchange price that would be received for an asset or transferred for a liability (an exit price) in the principal or most advantageous market for the asset or liability in an orderly transaction between market participants. The carrying amounts of cash, accounts receivables, and accounts payable approximate fair value because of the short maturity and/or variable rates associated with these instruments. Long-term debt as of fiscal year ended 2019 approximates its fair value as the interest rate is tied to market rates. The Company categorizes each of its fair value measurements in one of these three levels based on the lowest level input that is significant to the fair value measurement in its entirety. These levels are:
|
|
Level 1 - |
Inputs utilize quoted prices (unadjusted) in active markets for identical assets or liabilities that the Company has the ability to access. |
|
|
Level 2 - |
Inputs utilize data points that are observable such as quoted prices, interest rates and yield curves. |
|
|
Level 3 - |
Inputs are unobservable data points for the asset or liability, and include situations where there is little, if any, market activity for the asset or liability. |
Treasury Stock. The Company accounts for repurchases of common stock using the cost method with common stock in treasury classified in the Consolidated Balance Sheets as a reduction of shareholders’ equity.
Deferred Finance Charges. Deferred finance charges in connection with the Company’s revolving credit facility are amortized to interest expense over the term of the facility using the straight-line method. If the facility is extinguished before the end of the term, the remaining balance of the deferred finance charges will be amortized fully in such year.
Revenue Recognition. We recognize revenues from product sales upon shipment to the customer if the terms of the sale are freight on board (“FOB”) shipping point (and therefore title and all risks of ownership, including risk of loss, passes to the customer upon shipping) or, to a lesser extent, upon delivery to the customer if the terms of the sale are FOB destination (and therefore title and all risks of ownership, including risk of loss, passes to the customer upon delivery). Net sales represent gross sales invoiced to customers, less certain related charges, including sales tax, discounts, returns and other allowances. Returns, discounts and other allowances have historically been insignificant. In some cases and upon customer request, the Company prints and stores custom print product for customer specified future delivery, generally within twelve months. In this case, risk of loss passes to the customer, the customer is invoiced under normal credit terms, and revenue is recognized when manufacturing is complete. Approximately $11.0 million, $10.3 million and $9.7 million of revenue was recognized under these arrangements during fiscal years 2020, 2019 and 2018, respectively.
Advertising Expenses. The Company expenses advertising costs as incurred. Catalog and brochure preparation and printing costs, which are considered direct response advertising, are amortized to expense over the life of the catalog, which typically ranges from three to twelve months. Advertising expense was approximately $1.0 million, $0.8 million and $0.9 million during the fiscal years ended 2020, 2019 and 2018, respectively, and is included in selling, general and administrative expenses in the Consolidated Statements of Operations. Included in this advertising expense is amortization related to direct response advertising of approximately $0.2 million, $0.1 million, and $0.2 million for the fiscal years ended 2020, 2019 and 2018, respectively. Unamortized direct advertising costs included in prepaid expenses at fiscal years ended 2020, 2019 and 2018 were approximately $0.1 million, $0.2 million, and $0.1 million, respectively.
Income Taxes. Deferred tax assets and liabilities are recognized for the estimated future tax consequences attributable to differences between the financial statement carrying amounts of existing assets and liabilities and their respective tax bases and operating loss and tax credit carry forwards. Deferred tax assets and liabilities are measured using enacted tax rates expected to apply to taxable income in the years in which those temporary differences are expected to be recovered or settled. The effect on deferred tax assets and liabilities of a change in tax rates is recognized in income in the period that includes the enactment date. The Company established a valuation allowance related to its foreign tax credit of $0.4 million as a result of continued focus on domestic opportunities and no current plans to enter foreign markets.
Earnings Per Share. Basic earnings per share is computed by dividing net earnings by the weighted average number of common shares outstanding during the period. Diluted earnings per share is computed by dividing net
F-12
ENNIS, INC. AND SUBSIDIARIES
NOTES TO CONSOLIDATED FINANCIAL STATEMENTS
earnings by the weighted average number of common shares outstanding, and then adding the number of additional shares that would have been outstanding if potentially dilutive securities had been issued. This is calculated using the treasury stock method. For fiscal years 2019 and 2018, all options were included in the diluted earnings per share computation because the average fair market value of the Company’s stock exceeded the exercise price of the options. No options were outstanding at the end of fiscal year 2020.
Accumulated Other Comprehensive Loss. Accumulated other comprehensive loss is defined as the change in equity resulting from transactions from non-owner sources. Other comprehensive income consisted of changes in the funded status of the Company’s pension plan.
Foreign Currency Translation. Transaction gains and losses that arise from exchange rate fluctuations on transactions denominated in a currency other than the functional currency are included in the results of operations in other expense, net as incurred. Transaction losses totaled approximately $15,000, $18,000, and $7,000 for fiscal years ended 2020, 2019 and 2018, respectively.
Estimates. The preparation of financial statements in conformity with accounting principles generally accepted in the United States of America requires management to make estimates and assumptions that affect the reported amounts of assets and liabilities and disclosure of contingent assets and liabilities at the date of the financial statements and the reported amounts of revenue and expenses during the reporting period. Actual results could differ from these estimates.
Shipping and Handling Costs. The Company records amounts billed to customers for shipping and handling costs in net sales and related costs are included in cost of goods sold.
Stock Based Compensation. The Company recognizes stock based compensation expense over the requisite service period of the individual grants, which generally equals the vesting period. Actual forfeitures are recorded when they occur. The fair value of all share based awards is estimated on the date of grant.
Recent Accounting Pronouncements
In December 2019, the Financial Accounting Standards Board (“FASB”) issued Accounting Standards Update (“ASU”) No. 2019-12, Income Taxes (Topic 740): Simplifying the Accounting for Income Taxes (“ASU 2019-12”), as part of its overall simplification initiative to reduce costs and complexity of applying accounting standards while maintaining or improving the usefulness of the information provided to users of financial statements. Amendments include removal of certain exceptions to the general principles of Topic 740, Income Taxes, and simplification in several other areas. ASU 2019-12 is effective for annual reporting periods beginning after December 15, 2020, and interim periods therein. The Company is currently evaluating the impact of ASU 2019-12 on the consolidated financial statements.
In August 2018, the FASB issued ASU No. 2018-14, Compensation-Retirement Benefits-Defined Benefit Plans-General (Topic 715-20): Disclosure Framework—Changes to the Disclosure Requirements for Defined Benefit Plans (“ASU 2018-14”), which removes certain disclosures that are no longer cost beneficial and also includes additional disclosures to improve the overall usefulness of the disclosure requirements to financial statement users. ASU 2018-14 is effective for fiscal years ending after December 15, 2020, and earlier adoption is permitted. The Company is currently evaluating the impact of ASU 2018-14 on the consolidated financial statements.
In August 2018, the FASB issued ASU No. 2018-13, Fair Value Measurement (Topic 820). The standard is effective for public business entities in fiscal years beginning after December 15, 2019, and for interim periods within those fiscal years. Early adoption is permitted, including during an interim period. This new standard requires changes to disclosure requirements for fair value measurements for certain Level 3 items, and specifies that some of the changes must be applied prospectively, while others should be applied retrospectively. The Company is evaluating the standard, but does not expect it to have a significant impact on its financial statement disclosures.
In March 2017, the FASB issued ASU No. 2017-07, Compensation-Retirement Benefits (Topic 715): Improving the Presentation of Net Periodic Pension Cost and Net Periodic Postretirement Benefit Cost (“ASU 2017-07”). The update requires the service cost component of net benefit costs to be reported in the same line of the income statement as other compensation costs and the other components of net benefit costs (non-service costs) to be
F-13
ENNIS, INC. AND SUBSIDIARIES
NOTES TO CONSOLIDATED FINANCIAL STATEMENTS
presented separately from the service cost component, outside a subtotal of operating income. Additionally, only the service cost component of net benefit costs will be eligible for capitalization. The Company retrospectively adopted this guidance as of March 1, 2018. The impact of adoption was a $288,000 decrease in cost of sales, a $229,000 decrease in selling, general and administrative expenses and a $517,000 increase in other expense-net for the fiscal year ended February 28, 2018 compared to the amount previously reported. The impact of adoption was a $780,000 decrease in cost of sales, $610,000 decrease in selling, general and administrative expenses and $1,390,000 increase in other expense-net for the fiscal year ended February 28, 2017 compared to the amount previously reported.
In June 2016, the FASB issued ASU No. 2016-13, Financial Instruments-Credit Losses (Topic 326): Measurement of Credit Losses on Financial Instruments (“ASU 2016-13”), which changes the impairment model for most financial assets and certain other instruments. Under the new guidance, entities will be required to measure expected credit losses for financial instruments, including trade receivables, based on historical experience, current conditions and reasonable forecasts. ASU 2016-13 will be effective for public entities for fiscal years, and interim periods within those fiscal years, beginning after December 15, 2019. The Company does not expect the adoption of ASU 2016-13 will have a significant impact on the Company’s financial condition.
In February 2016, the FASB issued ASU No. 2016-02, Leases (Topic 842) (“ASU 2016-02”), which modifies the lease recognition requirements and requires entities to recognize the assets and liabilities arising from leases on the balance sheet and to disclose key qualitative and quantitative information about the entity’s leasing arrangements.
Based on the original guidance in ASU 2016-02, lessees and lessors would have been required to recognize and measure leases at the beginning of the earliest period presented using a modified retrospective approach, including a number of practical expedients. In July 2018, the FASB issued ASU No. 2018-11, Leases (“ASC 842”): Targeted Improvements, which provides entities with an option to apply the guidance prospectively, instead of retrospectively, and allows for other classification provisions.
The Company adopted this guidance as of March 1, 2019, using the optional transition method and elected the option to not apply ASC 842 to comparative periods, which continue to be presented under the accounting standards in effect for those periods.
The Company elected the ‘package of practical expedients’ as lessee, which permits it not to reassess under the new standard its prior conclusions about lease identification, lease classification and initial direct costs. Additionally, the Company elected to treat lease and non-lease components as a single lease component.
Adoption of the new standard resulted in the recording of operating lease right-of-use (“ROU”) assets of $18.0 million and operating lease liabilities of $18.2 million. The difference between the leased assets and lease liabilities represents the existing deferred rent liabilities balance at adoption, resulting from historical straight line recognition of operating leases, which was reclassified upon adoption to reduce the measurement of the leased assets. The adoption of the standard did not have an impact on the Company’s shareholders’ equity, statement of operations, or cash flows.
In May 2014, the FASB issued ASU No. 2014-09, Revenue from Contracts with Customers (Topic 606) (“ASU 2014-09”), which requires an entity to recognize revenue to depict the transfer of promised goods or services to customers in an amount that reflects the consideration to which it expects to be entitled in exchange for those goods or services. Our conclusion is that the timing of revenue recognition for our various revenue streams is not materially impacted by the adoption of this standard. The Company adopted this standard on March 1, 2018 using the modified retrospective approach. The adoption did not have, and is not expected to have, a significant impact on the consolidated operating results, financial position or cash flows of the Company. See Note 2, Revenue, below for further disclosures associated with the adoption of this pronouncement.
(2) Revenue
On March 1, 2018, the Company adopted ASU 2014-09 using the modified retrospective method applied to those contracts which were not completed as of March 1, 2018. Results for reporting periods beginning after March 1, 2018 are presented under ASU 2014-09, while prior period amounts are not adjusted and continue to be reported in
F-14
ENNIS, INC. AND SUBSIDIARIES
NOTES TO CONSOLIDATED FINANCIAL STATEMENTS
accordance with the Company’s historic accounting under Topic 605, and no adjustment has been recorded to beginning retained earnings due to there being no change in revenue recognition for prior periods.
The adoption did not have a significant effect on the Company’s consolidated results of operations, financial position or cash flows.
Nature of Revenues
Substantially all of the Company’s revenue from contracts with customers consist of the sale of commercial printing products in the continental United States and is primarily recognized at a point in time in an amount that reflects the consideration the Company expects to be entitled to in exchange for those goods. Revenue from the sale of commercial printing products, including shipping and handling fees billed to customers, is recognized upon the transfer of control to the customer, which is generally upon shipment to the customer when the terms of the sale are FOB shipping point, or, to a lesser extent, upon delivery to the customer if the terms of the sale are FOB destination.
In a small number of cases and upon customer request, the Company prints and stores commercial printing product for customer specified future delivery, generally within the same year as the product is manufactured. In this case, revenue is recognized upon the transfer of control when manufacturing is complete and title and risk of ownership is passed to the customer. Storage revenue for certain customers may be recognized over time rather than at a point in time. The amount of storage revenue is immaterial to the financial statements. As the output method for measure of progress is determined to be appropriate, the Company recognizes revenue in the amount for which it has the right to invoice for revenue that is recognized over time and for which it demonstrates that the invoiced amount corresponds directly with the value to the customer for the performance completed to date.
The Company does not disaggregate revenue and operates in one sales category consisting of commercial printed product revenue, which is reported as net sales on the consolidated statements of operations. The Company does not have material contract assets and contract liabilities as of February 29, 2020.
Significant Judgments
Generally, the Company’s contracts with customers are comprised of a written quote and customer purchase order or statement of work, and governed by the Company’s trade terms and conditions. In certain instances, it may be further supplemented by separate pricing agreements and customer incentive arrangements, which typically only affect the contract’s transaction price. Contracts do not contain a significant financing component as payment terms on invoiced amounts are typically between 30 to 90 days, based on the Company’s credit assessment of individual customers, as well as industry expectations. Product returns are not significant.
From time to time, the Company may offer incentives to its customers considered to be variable consideration including volume-based rebates or early payment discounts. Customer incentives considered to be variable consideration are recorded as a reduction to revenue as part of the transaction price at contract inception when there is a basis to reasonably estimate the amount of the incentive and only to the extent that it is probable that a significant reversal of any incremental revenue will not occur. Customer incentives are allocated entirely to the single performance obligation of transferring printed product to the customer.
For customers with terms of FOB shipping point, the Company accounts for shipping and handling activities performed after the control of the printed product has been transferred to the customer as a fulfillment cost. The Company accrues for the costs of shipping and handling activities if revenue is recognized before contractually agreed shipping and handling activities occur.
The Company’s contracts with customers are generally short-term in nature. Accordingly, the Company does not disclose the value of unsatisfied performance obligations nor the timing of revenue recognition.
(3) Accounts Receivable and Allowance for Doubtful Receivables
Accounts receivable are reduced by an allowance for an estimate of amounts that are uncollectible. Substantially all of the Company’s receivables are due from customers in North America. The Company extends credit to its customers based upon its evaluation of the following factors: (i) the customer’s financial condition, (ii) the amount
F-15
ENNIS, INC. AND SUBSIDIARIES
NOTES TO CONSOLIDATED FINANCIAL STATEMENTS
of credit the customer requests, and (iii) the customer’s actual payment history (which includes disputed invoice resolution). The Company does not typically require its customers to post a deposit or supply collateral. The Company’s allowance for doubtful receivables is based on an analysis that estimates the amount of its total customer receivable balance that is not collectible. This analysis includes assessing a default probability to customers’ receivable balances, which is influenced by several factors including (i) current market conditions, (ii) periodic review of customer credit worthiness, and (iii) review of customer receivable aging and payment trends.
The Company writes off accounts receivable when they become uncollectible, and payments subsequently received on such receivables are credited to the allowance in the period the payment is received. Credit losses from continuing operations have consistently been within management’s expectations.
The following table represents the activity in the Company’s allowance for doubtful receivables for the fiscal years ended (in thousands):
|
|
|
2020 |
|
|
2019 |
|
|
2018 |
|
|||
|
Balance at beginning of period |
|
$ |
1,020 |
|
|
$ |
1,194 |
|
|
$ |
1,674 |
|
|
Bad debt expense, net of recoveries |
|
|
(59 |
) |
|
|
212 |
|
|
|
(265 |
) |
|
Accounts written off |
|
|
(246 |
) |
|
|
(386 |
) |
|
|
(215 |
) |
|
Balance at end of period |
|
$ |
715 |
|
|
$ |
1,020 |
|
|
$ |
1,194 |
|
(4) Inventories
The following table summarizes the components of inventories at the different stages of production as of February 29, 2020 and February 28, 2019 (in thousands):
|
|
|
2020 |
|
|
2019 |
|
||
|
Raw material |
|
$ |
20,267 |
|
|
$ |
21,717 |
|
|
Work-in-process |
|
|
4,557 |
|
|
|
4,172 |
|
|
Finished goods |
|
|
10,011 |
|
|
|
9,522 |
|
|
|
|
$ |
34,835 |
|
|
$ |
35,411 |
|
The excess of current costs at FIFO over LIFO stated values was approximately $4.9 million and $5.0 million as of fiscal years ended 2020 and 2019, respectively. During both fiscal year 2020 and 2019, as inventory quantities were reduced, this resulted in a liquidation of LIFO inventory quantities carried at lower costs prevailing in prior years compared with the cost of fiscal year 2019 and 2018, as applicable. The effect decreased cost of sales by approximately $0.1 million, $0.1 million and $0.3 million for fiscal years 2020, 2019 and 2018, respectively. Cost includes materials, labor and overhead related to the purchase and production of inventories.
(5) Acquisitions
The Company applies the acquisition method of accounting for business combinations. Under the acquisition method, the acquiring entity in a business combination recognizes 100% of the assets acquired and liabilities assumed at their acquisition date fair values. Management utilizes valuation techniques appropriate for the asset or liability being measured in determining these fair values. Any excess of the purchase price over amounts allocated to assets acquired, including identifiable intangible assets, and liabilities assumed is recorded as goodwill. Where amounts allocated to assets acquired and liabilities assumed is greater than the purchase price, a bargain purchase gain is recognized. Acquisition-related costs are expensed as incurred.
On July 15, 2019, the Company acquired all the outstanding stock of The Flesh Company (“Flesh”) for approximately $9.9 million (which includes potential earn-out consideration of up to $500,000) plus the assumption of trade payables, subject to final working capital and certain other adjustments. The earn-out consideration is capped at $500,000 and is payable over the four years following the closing if certain minimum operating income levels are achieved. The Company recorded intangible assets with definite lives of approximately $1.2 million in connection with the transaction. Flesh, together with its wholly owned subsidiary, Impressions Direct, Inc. (“Impressions Direct”), is a printing company with two locations, with the St. Louis location containing Flesh’s corporate office and the direct mail operations of Impressions Direct, and the Parsons, Kansas location containing
F-16
ENNIS, INC. AND SUBSIDIARIES
NOTES TO CONSOLIDATED FINANCIAL STATEMENTS
Flesh’s main manufacturing facility and warehouse. The acquisition of Flesh expands the Company’s operations with respect to business forms, checks, direct mail services, integrated products and labels.
The following is a summary of the preliminary purchase price allocation for Flesh (in thousands):
|
Accounts receivable |
|
$ |
2,480 |
|
|
Inventories |
|
|
1,343 |
|
|
Other assets |
|
|
191 |
|
|
Right-of-use asset |
|
|
715 |
|
|
Property, plant & equipment |
|
|
7,065 |
|
|
Customer lists |
|
|
337 |
|
|
Trademarks |
|
|
880 |
|
|
Non-compete |
|
|
20 |
|
|
Accounts payable and accrued liabilities |
|
|
(2,251 |
) |
|
Operating lease liability |
|
|
(700 |
) |
|
Deferred income taxes |
|
|
(206 |
) |
|
|
|
$ |
9,874 |
|
On March 16, 2019, the Company acquired the assets of Integrated Print & Graphics (“Integrated”), which is based in South Elgin, Illinois, for $8.9 million in cash plus the assumption of trade payables, subject to certain adjustments. During the fiscal year ended February 29, 2020, the Company incurred approximately $29,000 of costs (including legal and accounting fees) related to the acquisition. Goodwill of $893,000 recognized as a part of the acquisition is deductible for tax purposes. The Company also recorded intangible assets with definite lives of approximately $1.8 million in connection with the transaction. The acquisition of Integrated, which prior to the acquisition generated approximately $20.0 million in sales for its fiscal year ended December 31, 2018, creates additional capabilities within our high color commercial print product line.
The following is a summary of the preliminary purchase price allocation for Integrated (in thousands):
|
Accounts receivable |
|
$ |
1,971 |
|
|
Inventories |
|
|
1,322 |
|
|
Other assets |
|
|
72 |
|
|
Property, plant & equipment |
|
|
3,828 |
|
|
Right-of-use asset |
|
|
2,041 |
|
|
Customer lists |
|
|
896 |
|
|
Trademarks |
|
|
896 |
|
|
Non-compete |
|
|
25 |
|
|
Goodwill |
|
|
893 |
|
|
Accounts payable and accrued liabilities |
|
|
(1,044 |
) |
|
Operating lease liability |
|
|
(2,041 |
) |
|
|
|
$ |
8,859 |
|
On July 31, 2018, the Company acquired, by way of a merger, all of the outstanding equity interests of Wright Business Forms, Inc., d/b/a Wright Business Graphics (“Wright”), a printing company headquartered in Portland, Oregon with additional locations in Washington and California. As partial consideration for the acquisition, the Company issued an aggregate of 829,126 shares of its common stock to the stockholders of Wright, valued at approximately $16.2 million at the time of issuance under the merger agreement. An additional $19.7 million in cash was paid to the stockholders of Wright, subject to a final working capital adjustment, and $2.6 million was paid to extinguish outstanding debt. The goodwill recognized as a part of the transaction is not deductible for tax purposes. Since the acquisition, the Company has incurred approximately $0.2 million of costs (including legal and accounting fees) related to the acquisition. These costs were recorded in selling, general and administrative expenses. Wright produces forms, pressure seal, packaging, direct mail, checks, statement processing and commercial printing and sells mainly through distributors and resellers.
F-17
ENNIS, INC. AND SUBSIDIARIES
NOTES TO CONSOLIDATED FINANCIAL STATEMENTS
The purchase price of Wright was as follows (in thousands):
|
Ennis shares of common stock |
|
$ |
16,218 |
|
|
Cash |
|
|
22,653 |
|
|
Purchase price of Wright Business Graphics |
|
$ |
38,871 |
|
The following is a summary of the preliminary purchase price allocation for Wright (in thousands):
|
Accounts receivable |
|
$ |
5,220 |
|
|
Prepaid expenses |
|
|
427 |
|
|
Inventories |
|
|
4,365 |
|
|
Other assets |
|
|
88 |
|
|
Property, plant & equipment |
|
|
10,331 |
|
|
Non-compete |
|
|
447 |
|
|
Customer lists |
|
|
12,900 |
|
|
Trade names |
|
|
3,830 |
|
|
Goodwill |
|
|
11,031 |
|
|
Accounts payable and accrued liabilities |
|
|
(4,226 |
) |
|
Deferred income taxes |
|
|
(5,542 |
) |
|
|
|
$ |
38,871 |
|
On April 30, 2018, the Company acquired the assets of Allen-Bailey Tag & Label, a tag and label operation located in New York for $4.7 million in cash plus the assumption of trade payables, subject to a working capital adjustment. In addition, contingent consideration of up to $500,000 is payable to the sellers if certain sales levels are maintained over the next three years following the closing. Prior to the acquisition, ABTL generated approximately $12.0 million in sales for the twelve months ended December 31, 2017. On July 7, 2017, the Company acquired the assets of a separate tag operation located in Ohio for $1.4 million in cash plus the assumption of certain accrued liabilities. Management considers both of these acquisitions immaterial.
The results of operations for Wright, Integrated and Flesh are included in the Company’s consolidated financial statements from the respective dates of acquisition. The following table sets forth certain operating information on a pro forma basis as though the respective acquisition had occurred as of the beginning of the comparable prior period. The following pro forma information for fiscal year 2020 includes Flesh and Integrated, fiscal year 2019 includes Flesh, Wright and Integrated, and fiscal year 2018 includes Wright. The pro forma information includes the estimated impact of adjustments such as amortization of intangible assets, depreciation expense and interest expense and related tax effects (in thousands, except per share amounts).
|
|
|
Unaudited |
|
|
Unaudited |
|
|
Unaudited |
|
|||
|
|
|
2020 |
|
|
2019 |
|
|
2018 |
|
|||
|
Pro forma net sales |
|
$ |
449,841 |
|
|
$ |
474,124 |
|
|
$ |
427,174 |
|
|
Pro forma net earnings |
|
|
37,379 |
|
|
|
38,474 |
|
|
|
35,694 |
|
|
Pro forma earnings per share - diluted |
|
|
1.44 |
|
|
|
1.49 |
|
|
|
1.40 |
|
The pro forma results are not necessarily indicative of what would have occurred if the acquisition had been in effect for the period presented.
(6) Discontinued Operations
On May 25, 2016 the Company sold its apparel segment, consisting of Alstyle Apparel, LLC and its subsidiaries (the “Apparel Segment”), to Gildan Activewear Inc. for an all-cash purchase price of $110.0 million, subject to a working capital adjustment, customary indemnification arrangements, and the other terms of the unit purchase agreement.
At the time of the sale of the Company’s former apparel operations, $2.0 million of the purchase price was placed in escrow as a source of funds to pay any liabilities that arose post-closing from an employment contract with a former
F-18
ENNIS, INC. AND SUBSIDIARIES
NOTES TO CONSOLIDATED FINANCIAL STATEMENTS
officer of the Company. The Company believed in good faith, based on consultation with its advisors, that no liability existed with respect to the employment contract, and as such, recorded a receivable for the full amount of the funds held in escrow. In January 2017, the purchaser, without notice to the Company, voluntarily paid $2.0 million to the former officer of the Company and requested that all of the escrowed funds be released to it as reimbursement. The Company denied the request, due in part because of the purchaser’s failure to provide the Company prior notice and a right to defend, as the Company believes was contractually required. In February 2018 an arbitrator ruled that the escrow funds be released to the purchaser. Although the Company has filed a complaint to vacate the arbitrator’s opinion, in the fourth quarter of fiscal year 2018, the Company wrote off the full amount of the receivable.
The Company recognized a tax benefit in the amount of $2.1 million related to discontinued operations during fiscal year 2018. This includes a $0.5 million tax benefit from the write-off of the $2.0 million receivable described in the previous paragraph as well as a $1.6 million tax benefit related to the determination of the final tax basis on assets sold in the sale of the Apparel Segment in fiscal year 2017.
The operating results of these discontinued operations only reflect revenues and expenses that are directly attributable to the Apparel Segment and that have been eliminated from ongoing operations. The following tables show the key components of the sale and discontinued operations related to the Apparel Segment that was completed on May 25, 2016 (in thousands):
|
Sales price |
|
$ |
110,000 |
|
|
Carrying value of disposed |
|
|
(130,174 |
) |
|
Expenses related to sales (1) |
|
|
(4,365 |
) |
|
Loss on sale before write-off of foreign currency translation adjustment |
|
|
(24,539 |
) |
|
Write-off of foreign currency translation adjustments |
|
|
|
|
|
recorded in other comprehensive income |
|
|
(16,109 |
) |
|
Loss on sale of sale of discontinued operations |
|
$ |
(40,648 |
) |
|
(1) |
Includes the termination fee, in the amount of $3.0 million, paid as a result of the termination of a prior purchase agreement for the sale of the Apparel Segment to Alstyle Operations, LLC. |
|
|
|
2018 |
|
|
2017 |
|
||
|
Net sales |
|
$ |
— |
|
|
$ |
41,038 |
|
|
Income from discontinued operations before income taxes |
|
|
— |
|
|
|
3,873 |
|
|
Loss on sale of discontinued operations before income taxes |
|
|
(2,000 |
) |
|
|
(40,648 |
) |
|
Income (loss) on discontinued operations before income taxes |
|
|
(2,000 |
) |
|
|
(36,775 |
) |
|
Income tax (benefit) expense |
|
|
(2,147 |
) |
|
|
(12,138 |
) |
|
Net income (loss) from discontinued operations |
|
$ |
147 |
|
|
$ |
(24,637 |
) |
(7) Leases
The Company leases certain of its facilities and equipment under operating leases, which are recorded as right-of-use assets and lease liabilities. The Company’s leases generally have terms of 1 – 5 years, with certain leases including renewal options to extend the leases for additional periods at the Company’s discretion. At lease inception, all renewal options reasonably certain to be exercised are considered when determining the lease term. The Company currently does not have leases that include options to purchase or provisions that would automatically transfer ownership of the leased property to the Company.
Operating lease expense is recognized on a straight-line basis over the lease term, and variable lease payments are expensed as incurred. The Company had no variable lease costs for the fiscal year ended February 29, 2020.
The Company determines whether a contract is or contains a lease at the inception of the contract. A contract will be deemed to be or contain a lease if the contract conveys the right to control and direct the use of identified property,
F-19
ENNIS, INC. AND SUBSIDIARIES
NOTES TO CONSOLIDATED FINANCIAL STATEMENTS
plant, or equipment for a period of time in exchange for consideration. The Company generally must also have the right to obtain substantially all of the economic benefits from the use of the property, plant, and equipment.
Operating lease assets and liabilities are recognized at the lease commencement date based on the present value of lease payments over the lease term. To determine the present value of lease payments not yet paid, the Company estimates incremental borrowing rates based on the information available at lease commencement date as rates are not implicitly stated in most leases.
Components of lease expense for the three fiscal years ended (in thousands):
|
|
|
|
|
|
|
|
|
|
|
|
|
|
|
|
|
2020 |
|
|
2019 |
|
|
2018 |
|
|||
|
Operating lease cost |
|
$ |
6,523 |
|
|
$ |
— |
|
|
$ |
— |
|
|
|
|
|
|
|
|
|
|
|
|
|
|
|
|
Supplemental cash flow information related to leases was as follows: |
|
|
|
|
|
|
|
|
|
|
|
|
|
Cash paid for amounts included in the measurement of lease liabilities |
|
|
|
|
|
|
|
|
|
|
|
|
|
Operating cash flows from operating leases |
|
$ |
6,483 |
|
|
$ |
— |
|
|
$ |
— |
|
|
|
|
|
|
|
|
|
|
|
|
|
|
|
|
Right-of-use assets obtained in exchange for lease obligations |
|
|
|
|
|
|
|
|
|
|
|
|
|
Operating leases |
|
$ |
5,009 |
|
|
$ |
— |
|
|
$ |
— |
|
Under the previous accounting standard, ASC Topic 840, Leases, which was effective though February 28, 2019, the rent expense under operating leases for the years ended February 28, 2019 and 2018, was $5.9 million and $5.3 million, respectively.
|
Weighted Average Remaining Lease Terms |
|
|
|
|
|
Operating leases |
|
4 Years |
|
|
|
|
|
|
|
|
|
Weighted Average Discount Rate |
|
|
|
|
|
Operating leases |
|
|
4.34 |
% |
Future minimum lease commitments under non-cancelable operating leases for each of the fiscal years ending are as follows (in thousands):
|
|
|
Operating |
|
|
|
|
|
Lease |
|
|
|
|
|
Commitments |
|
|
|
2021 |
|
$ |
5,785 |
|
|
2022 |
|
|
5,194 |
|
|
2023 |
|
|
4,245 |
|
|
2024 |
|
|
2,946 |
|
|
2025 |
|
|
2,154 |
|
|
Thereafter |
|
|
1,498 |
|
|
Total future minimum lease payments |
|
$ |
21,822 |
|
|
Less imputed interest |
|
|
1,957 |
|
|
Present values of lease liabilities |
|
$ |
19,865 |
|
As of February 28, 2019, future minimum payments, under operating leases applying legacy guidance prior to the adoption of ASU 2016-02, that were either non-cancelable or subject to significant penalty upon cancellation, were $5,586 for 2020, $3,783 for 2021, $2,607 for 2022, $2,108 for 2023, $1,619 for 2024 and $2,431 for thereafter.
F-20
ENNIS, INC. AND SUBSIDIARIES
NOTES TO CONSOLIDATED FINANCIAL STATEMENTS
(8) Goodwill and Intangible Assets
Goodwill represents the excess of the purchase price over the fair value of net assets of acquired businesses and is not amortized. Goodwill and other intangible assets are tested for impairment at a reporting unit level. The Company historically has performed its annual impairment test as of November 30, the last day of the third quarter and during 2020 the Company changed its date to the first day of the fourth quarter, December 1. Accordingly, the annual impairment test of goodwill was performed as of both November 30 and updated as of December 1 of fiscal year 2020 with no impact on the financial statements. This change does not accelerate, delay, avoid or cause an impairment charge, nor does this change result in adjustments to the Company’s previously issued financial statements. No impairment was recorded during fiscal year 2020. The Company’s impairment tests indicated significant cushion between its carrying value and fair market value.
The Company uses qualitative factors to determine whether it is more likely than not (likelihood of more than 50%) that the fair value of a reporting unit exceeds its carrying amount, including goodwill. Some of the qualitative factors considered in applying this test include consideration of macroeconomic conditions, industry and market conditions, cost factors affecting the business, overall financial performance of the business, and performance of the share price of the Company.
If qualitative factors are not deemed sufficient to conclude that the fair value of the reporting unit more likely than not exceeds its carrying value, then a one-step approach is applied in making an evaluation. The evaluation utilizes multiple valuation methodologies, including a market approach (market price multiples of comparable companies) and an income approach (discounted cash flow analysis). The computations require management to make significant estimates and assumptions, including, among other things, selection of comparable publicly traded companies, the discount rate applied to future earnings reflecting a weighted average cost of capital, and earnings growth assumptions. A discounted cash flow analysis requires management to make various assumptions about future sales, operating margins, capital expenditures, working capital, and growth rates. If the evaluation results in the fair value of the goodwill for the reporting unit being lower than the carrying value, an impairment charge is recorded. A goodwill impairment charge was not required for fiscal year 2020 or fiscal year 2019.
Beginning March 1, 2017, given the general declining trend line of print sales, and its expected continuance into the foreseeable future, the Company determined to treat the recorded value of trademarks/trade names as no longer being an indefinite-lived asset. As such, as of March 1, 2017, the Company began amortizing the carrying value of these assets over their estimated remaining useful life, approximately 17 - 19 years. The amortization expense increased the Company’s selling, general and administrative expense line by approximately $0.8 million during fiscal year 2018, approximately $1.2 million during fiscal year 2019 and approximately $1.9 million during fiscal year 2020.
F-21
ENNIS, INC. AND SUBSIDIARIES
NOTES TO CONSOLIDATED FINANCIAL STATEMENTS
The carrying amount and accumulated amortization of the Company’s intangible assets at each balance sheet date are as follows (in thousands):
|
|
|
Weighted |
|
|
|
|
|
|
|
|
|
|
|
|
|
|
|
|
|
Average |
|
|
|
|
|
|
|
|
|
|
|
|
|
|
|
|
|
Remaining |
|
|
Gross |
|
|
|
|
|
|
|
|
|
||
|
|
|
Life |
|
|
Carrying |
|
|
Accumulated |
|
|
|
|
|
|||
|
As of February 29, 2020 |
|
(in years) |
|
|
Amount |
|
|
Amortization |
|
|
Net |
|
||||
|
Amortized intangible assets |
|
|
|
|
|
|
|
|
|
|
|
|
|
|
|
|
|
Trademarks and trade names |
|
|
12.6 |
|
|
$ |
26,161 |
|
|
$ |
5,811 |
|
|
$ |
20,350 |
|
|
Customer lists |
|
|
7.4 |
|
|
|
73,102 |
|
|
|
37,161 |
|
|
|
35,941 |
|
|
Non-compete |
|
|
1.8 |
|
|
|
767 |
|
|
|
501 |
|
|
|
266 |
|
|
Patent |
|
|
— |
|
|
|
783 |
|
|
|
783 |
|
|
|
— |
|
|
Total |
|
|
9.2 |
|
|
$ |
100,813 |
|
|
$ |
44,256 |
|
|
$ |
56,557 |
|
|
|
|
|
|
|
|
|
|
|
|
|
|
|
|
|
|
|
|
As of February 28, 2019 |
|
|
|
|
|
|
|
|
|
|
|
|
|
|
|
|
|
Amortized intangible assets |
|
|
|
|
|
|
|
|
|
|
|
|
|
|
|
|
|
Trademarks and trade names |
|
|
13.8 |
|
|
$ |
24,385 |
|
|
$ |
3,906 |
|
|
$ |
20,479 |
|
|
Customer lists |
|
|
8.2 |
|
|
|
71,869 |
|
|
|
31,498 |
|
|
|
40,371 |
|
|
Non-compete |
|
|
2.5 |
|
|
|
722 |
|
|
|
300 |
|
|
|
422 |
|
|
Patent |
|
|
— |
|
|
|
783 |
|
|
|
783 |
|
|
|
— |
|
|
Total |
|
|
10.0 |
|
|
$ |
97,759 |
|
|
$ |
36,487 |
|
|
$ |
61,272 |
|
Aggregate amortization expense for each of the fiscal years 2020, 2019 and 2018 was approximately $7.8 million, $7.1 million and $6.1 million, respectively.
The Company’s estimated amortization expense for the next five fiscal years is as follows (in thousands):
|
2021 |
|
$ |
7,772 |
|
|
2022 |
|
|
7,596 |
|
|
2023 |
|
|
6,666 |
|
|
2024 |
|
|
6,516 |
|
|
2025 |
|
|
6,341 |
|
Changes in the net carrying amount of goodwill for fiscal years 2019 and 2020 are as follows (in thousands):
|
Balance as of March 1, 2018 |
|
$ |
70,603 |
|
|
Goodwill acquired |
|
|
11,031 |
|
|
Balance as of February 28, 2019 |
|
|
81,634 |
|
|
Goodwill acquired |
|
|
893 |
|
|
Balance as of February 29, 2020 |
|
$ |
82,527 |
|
During fiscal year 2020, $0.9 million was added to goodwill related to the acquisition of Integrated. During fiscal year 2019, $11.0 million was added to goodwill related to the acquisition of Wright.
F-22
ENNIS, INC. AND SUBSIDIARIES
NOTES TO CONSOLIDATED FINANCIAL STATEMENTS
The following table summarizes the components of other accrued expenses for the fiscal years ended (in thousands):
|
|
|
February 29, |
|
|
February 28, |
|
||
|
|
|
|
2020 |
|
|
|
2019 |
|
|
Employee compensation and benefits |
|
$ |
13,171 |
|
|
$ |
15,950 |
|
|
Taxes other than income |
|
|
464 |
|
|
|
583 |
|
|
Accrued legal and professional fees |
|
|
190 |
|
|
|
203 |
|
|
Accrued interest |
|
|
78 |
|
|
|
188 |
|
|
Accrued utilities |
|
|
90 |
|
|
|
90 |
|
|
Accrued acquisition related obligations |
|
|
240 |
|
|
|
214 |
|
|
Accrued credit card fees |
|
|
195 |
|
|
|
146 |
|
|
Other accrued expenses |
|
|
641 |
|
|
|
521 |
|
|
|
|
$ |
15,069 |
|
|
$ |
17,895 |
|
(10) Long-Term Debt
Long-term debt consisted of the following at fiscal years ended (in thousands):
|
|
|
|
|
February 29, 2020 |
|
|
February 28, 2019 |
|
||
|
Revolving credit facility |
|
|
|
$ |
— |
|
|
$ |
30,000 |
|
The Company is party to a Second Amended and Restated Credit Agreement, which has been amended from time to time, pursuant to which a credit facility has been extended to the Company until November 11, 2021 (the “Credit Facility”). The Credit Facility provides the Company and its subsidiaries with up to $100.0 million in revolving credit, as well as a $20.0 million sublimit for the issuance of letters of credit and a $15.0 million sublimit for swing-line loans. Under the Credit Facility, the Company or any of its subsidiaries can request up to three increases in the aggregate commitments in an aggregate amount not to exceed $50.0 million. Under the Credit Facility: (i) the Company’s net leverage ratio may not exceed 3.00:1.00, (ii) the Company’s fixed charge coverage ratio may not be less than 1.25:1.00, and (iii) the Company may make dividends or distributions to shareholders so long as (A) no event of default has occurred and is continuing and (B) the Company’s net leverage ratio both before and after giving effect to any such dividend or distribution is equal to or less than 2.50:1.00. As of February 29, 2020, the Company was in compliance with all terms and conditions of its Credit Facility.
The Credit Facility bears interest at the LIBOR rate plus a spread ranging from 1.0% to 2.0%, which rate was 3.6% (3 month LIBOR + 1.0%) at February 28, 2019. As a result of the extension of maturity until November 11, 2021, the spread will range from 1.85% to 2.5% on future borrowings, depending on the Company’s fixed charge coverage ratio of total funded debt to earnings before interest, taxes, depreciation and amortization (EBITDA). The Credit Facility is secured by substantially all of the Company’s assets (other than real property), as well as all capital securities of each of the Company’s subsidiaries.
During fiscal year 2020, the Company paid down the remaining $30.0 million on the revolving credit line. As a result, under the Credit Facility as of February 29, 2020, the Company had no outstanding debt and $0.7 million outstanding under standby letters of credit arrangements, leaving approximately $99.3 million in available borrowing capacity.
(11) Shareholders’ Equity
The Board has authorized the repurchase of the Company’s outstanding common stock through a stock repurchase program, which authorized amount is currently up to $40.0 million in the aggregate. Under the repurchase program, purchases may be made from time to time in the open market or through privately negotiated transactions depending on market conditions, share price, trading volume and other factors. Such purchases, if any, will be made in accordance with applicable insider trading and other securities laws and regulations. These repurchases may be commenced or suspended at any time or from time to time without prior notice.
F-23
ENNIS, INC. AND SUBSIDIARIES
NOTES TO CONSOLIDATED FINANCIAL STATEMENTS
During the fiscal year ended February 29, 2020 the Company repurchased 126,330 shares of common stock under the program at an average price of $19.56 per share. Since the program’s inception in October 2008, there have been 1,816,354 common shares repurchased at an average price of $15.91 per share. As of February 29, 2020 there was $11.1 million available to repurchase shares of the Company’s common stock under the program.
The Company’s revolving credit facility maintains certain restrictions on the amount of treasury shares that may be purchased and distributions to its shareholders.
(12) Stock Option Plan and Stock Based Compensation
The Company grants stock options and restricted stock to key executives and managerial employees and non-employee directors. At fiscal year ended 2018, the Company has one stock option plan: the 2004 Long-Term Incentive Plan of Ennis, Inc., as amended and restated as of June 30, 2011, formerly the 1998 Option and Restricted Stock Plan amended and restated as of May 14, 2008 (the “Plan”). The Company has 520,104 shares of unissued common stock reserved under the Plan for issuance. The exercise price of each stock option granted under the Plan equals a referenced price of the Company’s common stock as reported on the New York Stock Exchange (“NYSE”) on the date of grant, and an option’s maximum term is ten years. Stock options and restricted stock may be granted at different times during the year and vest ratably over various periods, from grant date up to five years. The Company uses treasury stock to satisfy option exercises and restricted stock awards.
The Company recognizes compensation expense for stock options and restricted stock grants on a straight-line basis over the requisite service period. For the years ended 2020, 2019 and 2018, the Company included in selling, general and administrative expenses, compensation expense related to share based compensation of $1.4 million, $1.4 million and $1.3 million, respectively.
Stock Options
The following occurred with respect to the Company’s stock options for each of the three years ended February 29, 2020:
|
|
|
|
|
|
|
|
|
|
|
Weighted |
|
|
|
|
|
|
|
|
|
|
|
|
|
Weighted |
|
|
Average |
|
|
Aggregate |
|
|||
|
|
|
Number |
|
|
Average |
|
|
Remaining |
|
|
Intrinsic |
|
||||
|
|
|
of Shares |
|
|
Exercise |
|
|
Contractual |
|
|
Value(a) |
|
||||
|
|
|
(exact quantity) |
|
|
Price |
|
|
Life (in years) |
|
|
(in thousands) |
|
||||
|
Outstanding at March 1, 2017 |
|
|
172,496 |
|
|
$ |
15.95 |
|
|
|
4.2 |
|
|
$ |
223 |
|
|
Granted |
|
|
— |
|
|
|
— |
|
|
|
|
|
|
|
|
|
|
Terminated |
|
|
— |
|
|
|
— |
|
|
|
|
|
|
|
|
|
|
Exercised |
|
|
— |
|
|
|
— |
|
|
|
|
|
|
|
|
|
|
Outstanding at February 28, 2018 |
|
|
172,496 |
|
|
$ |
15.95 |
|
|
|
3.2 |
|
|
$ |
612 |
|
|
Granted |
|
|
— |
|
|
|
— |
|
|
|
|
|
|
|
|
|
|
Terminated |
|
|
— |
|
|
|
— |
|
|
|
|
|
|
|
|
|
|
Exercised |
|
|
(110,906 |
) |
|
|
15.99 |
|
|
|
|
|
|
|
|
|
|
Outstanding at February 28, 2019 |
|
|
61,590 |
|
|
$ |
15.88 |
|
|
|
1.8 |
|
|
$ |
327 |
|
|
Granted |
|
|
— |
|
|
|
— |
|
|
|
|
|
|
|
|
|
|
Terminated |
|
|
— |
|
|
|
— |
|
|
|
|
|
|
|
|
|
|
Exercised |
|
|
(61,590 |
) |
|
$ |
15.88 |
|
|
|
|
|
|
|
|
|
|
Outstanding at February 29, 2020 |
|
|
— |
|
|
|
— |
|
|
|
— |
|
|
|
— |
|
|
Exercisable at February 29, 2020 |
|
|
— |
|
|
|
— |
|
|
|
— |
|
|
|
— |
|
|
(a) |
Intrinsic value is measured as the excess fair market value of the Company’s common stock as reported on the NYSE over the applicable exercise price. |
No stock options were granted during fiscal years 2020, 2019 or 2018.
F-24
ENNIS, INC. AND SUBSIDIARIES
NOTES TO CONSOLIDATED FINANCIAL STATEMENTS
A summary of the stock options exercised and tax benefits realized from stock based compensation is presented below for the three fiscal years ended (in thousands):
|
|
|
Fiscal years ended |
|
|||||||||
|
|
|
2020 |
|
|
2019 |
|
|
2018 |
|
|||
|
Total cash received |
|
$ |
— |
|
|
$ |
69 |
|
|
$ |
— |
|
|
Total grant-date fair value |
|
|
201 |
|
|
|
345 |
|
|
|
— |
|
|
Intrinsic value |
|
|
267 |
|
|
|
534 |
|
|
|
— |
|
The Company had no unvested stock options outstanding at any time during the fiscal year ended February 29, 2020.
Restricted Stock
The following occurred with respect to the Company’s restricted stock awards for each of the three fiscal years ended February 29, 2020:
|
|
|
|
|
|
Weighted |
|
|
|
|
|
|
|
|
Average |
|
|
|
|
Number of |
|
|
Grant Date |
|
||
|
|
Shares |
|
|
Fair Value |
|
||
|
Outstanding at March 1, 2017 |
|
166,546 |
|
|
$ |
16.35 |
|
|
Granted |
|
74,900 |
|
|
|
16.30 |
|
|
Terminated |
|
— |
|
|
|
— |
|
|
Vested |
|
(88,771 |
) |
|
|
15.90 |
|
|
Outstanding at February 28, 2018 |
|
152,675 |
|
|
$ |
16.59 |
|
|
Granted |
|
83,789 |
|
|
|
20.54 |
|
|
Terminated |
|
— |
|
|
|
— |
|
|
Vested |
|
(81,359 |
) |
|
|
16.01 |
|
|
Outstanding at February 28, 2019 |
|
155,105 |
|
|
$ |
19.03 |
|
|
Granted |
|
66,669 |
|
|
|
20.41 |
|
|
Terminated |
|
(3,920 |
) |
|
|
17.02 |
|
|
Vested |
|
(73,928 |
) |
|
|
18.90 |
|
|
Outstanding at February 29, 2020 |
|
143,926 |
|
|
$ |
19.79 |
|
As of February 29, 2020, the total remaining unrecognized compensation cost related to unvested restricted stock was approximately $1.7 million. The weighted average remaining requisite service period of the unvested restricted stock awards was 1.5 years. As of February 29, 2020, the Company’s outstanding restricted stock had an underlying fair value of $2.8 million at date of grant.
(13) Pension Plan
The Company and certain subsidiaries have a noncontributory defined benefit retirement plan (the “Pension Plan”), covering approximately 16% of aggregate employees. Benefits are based on years of service and the employee’s average compensation for the highest five compensation years preceding retirement or termination. The Company’s funding policy is to contribute annually an amount in accordance with the requirements of the Employee Retirement Income Security Act of 1974 (“ERISA”).
The Company’s Pension Plan asset allocation, by asset category, is as follows for the fiscal years ended:
|
|
|
2020 |
|
|
2019 |
|
||
|
Equity securities |
|
|
47 |
% |
|
|
46 |
% |
|
Debt securities |
|
|
44 |
% |
|
|
48 |
% |
|
Cash and cash equivalents |
|
|
9 |
% |
|
|
6 |
% |
|
Total |
|
|
100 |
% |
|
|
100 |
% |
F-25
ENNIS, INC. AND SUBSIDIARIES
NOTES TO CONSOLIDATED FINANCIAL STATEMENTS
The current asset allocation is being managed to meet the Company’s stated objective of asset growth and capital preservation. The factor is based upon the combined judgments of the Company’s Administrative Committee and its investment advisors to meet the Company’s investment needs, objectives, and risk tolerance. The Company’s target asset allocation percentage, by asset class, for the year ended February 29, 2020 is as follows:
|
Asset Class |
|
Target Allocation Percentage |
|
Cash |
|
1 – 5% |
|
Fixed Income |
|
35 – 55% |
|
Equity |
|
45 – 60% |
The Company estimates the long-term rate of return on Pension Plan assets will be 7.0% based upon target asset allocation. Expected returns are developed based upon the information obtained from the Company’s investment advisors. The advisors provide ten-year historical and five-year expected returns on the fund in the target asset allocation. The return information is weighted based upon the asset allocation at the end of the fiscal year. The expected rate of return at the beginning of fiscal year ended 2020 was 7.0%. The rate used in the calculation of fiscal year 2019 pension expense was 7.5%.
The following tables present the Pension Plan’s fair value hierarchy for those assets measured at fair value as of February 29, 2020 and February 28, 2019 (in thousands):
|
|
|
February 29, 2020 |
|
|||||||||||||
|
Description |
|
Total |
|
|
(Level 1) |
|
|
(Level 2) |
|
|
(Level 3) |
|
||||
|
Cash and cash equivalents |
|
$ |
5,615 |
|
|
$ |
5,615 |
|
|
$ |
— |
|
|
$ |
— |
|
|
Government bonds |
|
|
9,836 |
|
|
|
— |
|
|
|
9,836 |
|
|
|
— |
|
|
Corporate bonds |
|
|
16,879 |
|
|
|
— |
|
|
|
16,879 |
|
|
|
— |
|
|
Domestic equities |
|
|
20,567 |
|
|
|
20,567 |
|
|
|
— |
|
|
|
— |
|
|
Foreign equities |
|
|
7,703 |
|
|
|
7,703 |
|
|
|
— |
|
|
|
— |
|
|
|
|
$ |
60,600 |
|
|
$ |
33,885 |
|
|
$ |
26,715 |
|
|
$ |
— |
|
|
|
|
|
|
|
|
|
|
|
|
|
|
|
|
|
|
|
|
|
|
February 28, 2019 |
|
|||||||||||||
|
Description |
|
Total |
|
|
(Level 1) |
|
|
(Level 2) |
|
|
(Level 3) |
|
||||
|
Cash and cash equivalents |
|
$ |
3,945 |
|
|
$ |
3,945 |
|
|
$ |
— |
|
|
$ |
— |
|
|
Government bonds |
|
|
16,128 |
|
|
|
— |
|
|
|
16,128 |
|
|
|
— |
|
|
Corporate bonds |
|
|
10,722 |
|
|
|
— |
|
|
|
10,722 |
|
|
|
— |
|
|
Domestic equities |
|
|
20,903 |
|
|
|
20,903 |
|
|
|
— |
|
|
|
— |
|
|
Foreign equities |
|
|
6,023 |
|
|
|
6,023 |
|
|
|
— |
|
|
|
— |
|
|
|
|
$ |
57,721 |
|
|
$ |
30,871 |
|
|
$ |
26,850 |
|
|
$ |
— |
|
Fair value estimates are made at a specific point in time, based on available market information and judgments about the financial asset, including estimates of timing, amount of expected future cash flows, and the credit standing of the issuer. In some cases, the fair value estimates cannot be substantiated by comparison to independent markets. The disclosed fair value may not be realized in the immediate settlement of the financial asset. In addition, the disclosed fair values do not reflect any premium or discount that could result from offering for sale at one time an entire holding of a particular financial asset. Potential taxes and other expenses that would be incurred in an actual sale or settlement are not reflected in amounts disclosed.
F-26
ENNIS, INC. AND SUBSIDIARIES
NOTES TO CONSOLIDATED FINANCIAL STATEMENTS
Pension expense is composed of the following components included in cost of goods sold and selling, general and administrative expenses in the Company’s consolidated statements of operations for fiscal years ended (in thousands):
|
|
|
2020 |
|
|
2019 |
|
|
2018 |
|
|||
|
Components of net periodic benefit cost |
|
|
|
|
|
|
|
|
|
|
|
|
|
Service cost |
|
$ |
1,088 |
|
|
$ |
1,106 |
|
|
$ |
1,083 |
|
|
Interest cost |
|
|
2,254 |
|
|
|
2,274 |
|
|
|
2,270 |
|
|
Expected return on plan assets |
|
|
(4,198 |
) |
|
|
(4,109 |
) |
|
|
(3,794 |
) |
|
Amortization of: |
|
|
|
|
|
|
|
|
|
|
|
|
|
Unrecognized net loss |
|
|
2,036 |
|
|
|
2,047 |
|
|
|
2,041 |
|
|
Net periodic benefit cost |
|
|
1,180 |
|
|
|
1,318 |
|
|
|
1,600 |
|
|
|
|
|
|
|
|
|
|
|
|
|
|
|
|
Other changes in Plan Assets and Projected Benefit Obligation |
|
|
|
|
|
|
|
|
|
|
|
|
|
Recognized in Other comprehensive Income |
|
|
|
|
|
|
|
|
|
|
|
|
|
Net actuarial loss (gain) |
|
|
13,371 |
|
|
|
2,414 |
|
|
|
(669 |
) |
|
Amortization of net actuarial loss |
|
|
(2,036 |
) |
|
|
(2,047 |
) |
|
|
(2,041 |
) |
|
|
|
|
11,335 |
|
|
|
367 |
|
|
|
(2,710 |
) |
|
Total recognized in net periodic pension cost and other comprehensive income |
|
$ |
12,515 |
|
|
$ |
1,685 |
|
|
$ |
(1,110 |
) |
The estimated net actuarial loss of the Pension Plan expected to be amortized from Accumulated Other Comprehensive Loss into net periodic benefit cost over the next fiscal year is approximately $3.4 million.
The following table represents the assumptions used to determine benefit obligations and net periodic pension cost for fiscal years ended:
|
|
|
2020 |
|
|
2019 |
|
|
2018 |
|
|||
|
Weighted average discount rate (net periodic pension cost) |
|
|
4.10 |
% |
|
|
4.05 |
% |
|
|
4.10 |
% |
|
Earnings progression (net periodic pension cost) |
|
|
3.00 |
% |
|
|
3.00 |
% |
|
|
3.00 |
% |
|
Expected long-term rate of return on plan assets (net periodic pension cost) |
|
|
7.00 |
% |
|
|
7.50 |
% |
|
|
7.50 |
% |
|
Weighted average discount rate (benefit obligations) |
|
|
2.65 |
% |
|
|
4.10 |
% |
|
|
4.05 |
% |
|
Earnings progression (benefit obligations) |
|
|
3.00 |
% |
|
|
3.00 |
% |
|
|
3.00 |
% |
F-27
ENNIS, INC. AND SUBSIDIARIES
NOTES TO CONSOLIDATED FINANCIAL STATEMENTS
During fiscal year 2020, the Company adopted the new MP-2019 improvement scale and the new Pri-2012 Blue Collar mortality tables to determine their benefit obligations under the Pension Plan. The accumulated benefit obligation (“ABO”), change in projected benefit obligation (“PBO”), change in Pension Plan assets, funded status, and reconciliation to amounts recognized in the consolidated balance sheets are as follows (in thousands):
|
|
|
2020 |
|
|
2019 |
|
||
|
Change in benefit obligation |
|
|
|
|
|
|
|
|
|
Projected benefit obligation at beginning of year |
|
$ |
57,141 |
|
|
$ |
57,619 |
|
|
Service cost |
|
|
1,088 |
|
|
|
1,106 |
|
|
Interest cost |
|
|
2,254 |
|
|
|
2,274 |
|
|
Actuarial (gain) loss |
|
|
12,853 |
|
|
|
(367 |
) |
|
Other assumption change |
|
|
(549 |
) |
|
|
(120 |
) |
|
Benefits paid |
|
|
(3,251 |
) |
|
|
(3,371 |
) |
|
Projected benefit obligation at end of year |
|
$ |
69,536 |
|
|
$ |
57,141 |
|
|
Change in plan assets: |
|
|
|
|
|
|
|
|
|
Fair value of plan assets at beginning of year |
|
$ |
57,721 |
|
|
$ |
56,884 |
|
|
Company contributions |
|
|
3,000 |
|
|
|
3,000 |
|
|
Gain on plan assets |
|
|
3,130 |
|
|
|
1,208 |
|
|
Benefits paid |
|
|
(3,251 |
) |
|
|
(3,371 |
) |
|
Fair value of plan assets at end of year |
|
$ |
60,600 |
|
|
$ |
57,721 |
|
|
Funded (unfunded) status |
|
$ |
(8,936 |
) |
|
$ |
580 |
|
|
Accumulated benefit obligation at end of year |
|
$ |
63,340 |
|
|
$ |
52,747 |
|
The measurement dates used to determine pension and other postretirement benefits is the Company’s fiscal year end. The Company contributed $3.0 million to the Pension Plan during fiscal year 2020. Depending on the Pension Plan’s projected funding status, the Company expects to contribute between $1.5 and $3.0 million to the Pension Plan during fiscal year 2021.
Estimated future benefit payments which reflect expected future service, as appropriate, are expected to be paid to the Pension Plan participants in the fiscal years ended (in thousands):
|
Year |
|
Projected Payments |
|
|
|
2021 |
|
$ |
4,600 |
|
|
2022 |
|
|
4,700 |
|
|
2023 |
|
|
3,200 |
|
|
2024 |
|
|
4,900 |
|
|
2025 |
|
|
5,000 |
|
|
2026 – 2030 |
|
|
20,600 |
|
Effective February 1, 1994, the Company adopted a Defined Contribution 401(k) Plan (the “401(k) Plan”) for its United States employees. The 401(k) Plan covers substantially all full-time employees who have completed sixty days of service and attained the age of eighteen. United States employees can contribute up to 100 percent of their annual compensation, but are limited to the maximum annual dollar amount allowable under the Internal Revenue Code. The 401(k) Plan provides for employer matching contributions or discretionary employer contributions for certain employees not enrolled in the Pension Plan for employees of the Company. Eligibility for employer contributions, matching percentage, and limitations depends on the participant’s employment location and whether the employees are covered by the Pension Plan, among other factors. The Company’s matching contributions are immediately vested. The Company made matching 401(k) contributions in the amount of $2.1 million, $1.7 million and $1.2 million in fiscal years ended 2020, 2019 and 2018, respectively.
In addition, the Northstar Computer Forms, Inc. 401(k) Profit Sharing Plan was merged into the 401(k) Plan on February 1, 2001. The Company declared profit sharing contributions on behalf of the former employees of Northstar Computer Forms, Inc. in accordance with its original plan in the amounts of $194,000, $206,000, and $203,000, in fiscal years ended 2020, 2019 and 2018, respectively.
F-28
ENNIS, INC. AND SUBSIDIARIES
NOTES TO CONSOLIDATED FINANCIAL STATEMENTS
The following table represents components of the provision for income taxes for fiscal years ended (in thousands):
|
|
|
2020 |
|
|
2019 |
|
|
2018 |
|
|||
|
Current: |
|
|
|
|
|
|
|
|
|
|
|
|
|
Federal |
|
$ |
10,838 |
|
|
$ |
11,381 |
|
|
$ |
14,001 |
|
|
State and local |
|
|
1,642 |
|
|
|
1,858 |
|
|
|
1,944 |
|
|
Total current |
|
|
12,480 |
|
|
|
13,239 |
|
|
|
15,945 |
|
|
Deferred: |
|
|
|
|
|
|
|
|
|
|
|
|
|
Federal |
|
|
526 |
|
|
|
(651 |
) |
|
|
(1,811 |
) |
|
State and local |
|
|
(47 |
) |
|
|
(91 |
) |
|
|
17 |
|
|
Total deferred |
|
|
479 |
|
|
|
(742 |
) |
|
|
(1,794 |
) |
|
Total provision for income taxes |
|
$ |
12,959 |
|
|
$ |
12,497 |
|
|
$ |
14,151 |
|
The Company’s effective tax rate on earnings from operations for the year ended February 29, 2020, was 25.3%, compared to 25.0% and 30.2% in 2019 and 2018, respectively. The following summary reconciles the statutory U.S. federal income tax rate to the Company’s effective tax rate for the fiscal years ended:
|
|
|
2020 |
|
|
2019 |
|
|
2018 |
|
|
|||
|
Statutory rate |
|
|
21.0 |
|
% |
|
21.0 |
|
% |
|
32.7 |
|
% |
|
Provision for state income taxes, net of federal income tax benefit |
|
|
2.5 |
|
|
|
2.8 |
|
|
|
2.8 |
|
|
|
Domestic production activities deduction |
|
|
— |
|
|
|
— |
|
|
|
(2.8 |
) |
|
|
Change in valuation allowance |
|
|
0.8 |
|
|
|
— |
|
|
|
— |
|
|
|
Federal true-up |
|
|
0.9 |
|
|
|
0.4 |
|
|
|
4.1 |
|
|
|
Tax Cuts and Jobs Act |
|
|
— |
|
|
|
— |
|
|
|
(7.6 |
) |
|
|
Other |
|
|
0.1 |
|
|
|
0.8 |
|
|
|
1.0 |
|
|
|
|
|
|
25.3 |
|
% |
|
25.0 |
|
% |
|
30.2 |
|
% |
F-29
ENNIS, INC. AND SUBSIDIARIES
NOTES TO CONSOLIDATED FINANCIAL STATEMENTS
Deferred taxes are recorded to give recognition to temporary differences between the tax basis of assets and liabilities and their reported amounts in the financial statements. The tax effects of these temporary differences are recorded as deferred tax assets and deferred tax liabilities. Deferred tax assets generally represent items that can be used as a tax deduction or credit in future years. Deferred tax liabilities generally represent items that have been deducted for tax purposes, but have not yet been recorded in the consolidated statements of operations. To the extent there are deferred tax assets that are more likely than not to be realized, a valuation allowance would not be recorded. The components of deferred income tax assets and liabilities are summarized as follows (in thousands) for fiscal years ended:
|
Deferred tax assets |
|
2020 |
|
|
2019 |
|
||
|
Allowance for doubtful receivables |
|
$ |
164 |
|
|
$ |
204 |
|
|
Inventories |
|
|
925 |
|
|
|
924 |
|
|
Employee compensation and benefits |
|
|
883 |
|
|
|
820 |
|
|
Pension and noncurrent employee compensation benefits |
|
|
5,011 |
|
|
|
2,653 |
|
|
Operating lease liabilities |
|
|
4,868 |
|
|
|
— |
|
|
Net operating loss and foreign tax credits |
|
|
1,097 |
|
|
|
429 |
|
|
Stock options |
|
|
233 |
|
|
|
326 |
|
|
Other |
|
|
60 |
|
|
|
— |
|
|
Total deferred tax assets |
|
$ |
13,241 |
|
|
$ |
5,356 |
|
|
Less: valuation allowance |
|
|
(408 |
) |
|
|
— |
|
|
Total deferred tax assets, net |
|
$ |
12,833 |
|
|
$ |
5,356 |
|
|
Deferred tax liabilities |
|
|
|
|
|
|
|
|
|
Property, plant and equipment |
|
$ |
6,060 |
|
|
$ |
5,485 |
|
|
Goodwill and other intangible assets |
|
|
10,547 |
|
|
|
10,710 |
|
|
Right-of-use assets |
|
|
4,804 |
|
|
|
— |
|
|
Property tax |
|
|
95 |
|
|
|
59 |
|
|
Other |
|
|
76 |
|
|
|
— |
|
|
Total deferred tax liabilities |
|
$ |
21,582 |
|
|
$ |
16,254 |
|
|
Net deferred income tax liabilities |
|
$ |
8,749 |
|
|
$ |
10,898 |
|
During fiscal year 2020, the Company established a valuation allowance related to its foreign tax credit of $0.4 million as a result of continued focus on domestic opportunities and no current plans to enter foreign markets.
At fiscal year-end 2020, the Company had federal net operating loss (“NOL”) carry forwards of approximately $3.0 million. This NOL is related to the acquisitions of Flesh and Impressions Direct. The NOL is subject to a Section 382 limitation of $0.1 million per year. Based on historical earnings and expected sufficient future taxable income, management believes it will be able to fully utilize the NOL.
Accounting standards require a two-step approach to determine how to recognize tax benefits in the financial statements where recognition and measurement of a tax benefit must be evaluated separately. A tax benefit will be recognized only if it meets a “more-likely-than-not” recognition threshold. For tax positions that meet this threshold, the tax benefit recognized is based on the largest amount of tax benefit that is greater than 50 percent likely of being realized upon ultimate settlement with the taxing authority.
F-30
ENNIS, INC. AND SUBSIDIARIES
NOTES TO CONSOLIDATED FINANCIAL STATEMENTS
At fiscal year-end 2020 and 2019, unrecognized tax benefits related to uncertain tax positions, including accrued interest and penalties of $0.1 million and $0.1 million, respectively, are included in other liabilities on the consolidated balance sheets and would impact the effective rate if recognized. The interest expense associated with the unrecognized tax benefit is not material. A reconciliation of the change in the unrecognized tax benefits for fiscal years ended 2020 and 2019 is as follows (in thousands):
|
|
|
2020 |
|
|
2019 |
|
||
|
Balance at March 1, 2019 |
|
$ |
120 |
|
|
$ |
141 |
|
|
Additions based on tax positions |
|
|
— |
|
|
|
26 |
|
|
Reductions due to lapses of statues of limitations |
|
|
(20 |
) |
|
|
(47 |
) |
|
Balance at February 29, 2020 |
|
$ |
100 |
|
|
$ |
120 |
|
The Company is subject to U.S. federal income tax as well as income tax of multiple state jurisdictions. The Company has concluded all U.S. federal income tax matters for years through 2015. All material state and local income tax matters have been concluded for years through 2015 and foreign tax jurisdictions through 2015.
The Company recognizes interest expense on underpayments of income taxes and accrued penalties related to unrecognized non-current tax benefits as part of the income tax provision. Other than amounts included in the unrecognized tax benefits, the Company did not recognize any interest or penalties for the fiscal years ended 2020, 2019 and 2018.
The outbreak of the COVID-19 pandemic presents various global risks. The full impact of the COVID-19 pandemic continues to evolve as of the date of this report. Management is actively monitoring the situation as pertains to the Company’s financial condition, liquidity, operations, suppliers, industry and workforce. Given the ongoing evolution of the pandemic and the global responses to control its spread, the Company is not able to estimate the ultimate effects of the COVID-19 pandemic on its results of operation, financial condition, or liquidity for fiscal year 2021. Currently, the Company is considering deferring payments of payroll taxes to the extent allowable under the Coronavirus Aid, Relief and Economic Security (CARES) Act. The Company is also reviewing other provisions of the CARES Act and does not expect a significant tax impact.
(15) Earnings per Share
Basic earnings (loss) per share have been computed by dividing net earnings (loss) by the weighted average number of common shares outstanding during the applicable period. Diluted earnings (loss) per share reflect the potential dilution that could occur if stock options or other contracts to issue common shares were exercised or converted into common stock.
The following table sets forth the computation for basic and diluted earnings (loss) per share for the fiscal years ended:
|
|
|
2020 |
|
|
2019 |
|
|
2018 |
|
|||
|
Basic weighted average common shares outstanding |
|
|
26,036,393 |
|
|
|
25,829,804 |
|
|
|
25,391,998 |
|
|
Effect of dilutive options |
|
|
— |
|
|
|
12,375 |
|
|
|
25,246 |
|
|
Diluted weighted average common shares outstanding |
|
|
26,036,393 |
|
|
|
25,842,179 |
|
|
|
25,417,244 |
|
|
Earnings per share - basic and diluted |
|
|
|
|
|
|
|
|
|
|
|
|
|
Earnings per share on continuing operations |
|
$ |
1.47 |
|
|
$ |
1.45 |
|
|
$ |
1.29 |
|
|
Earnings per share on discontinued operations |
|
|
— |
|
|
|
— |
|
|
|
0.01 |
|
|
Net earnings |
|
$ |
1.47 |
|
|
$ |
1.45 |
|
|
$ |
1.30 |
|
|
Cash dividends |
|
$ |
0.900 |
|
|
$ |
0.875 |
|
|
$ |
0.875 |
|
The Company treats unvested share-based payment awards that contain non-forfeitable rights to dividends or dividend equivalents (whether paid or unpaid) as participating securities, which are included in the computation of earnings per share. Our unvested restricted shares participate on an equal basis with common shares; therefore, there is no difference in undistributed earnings allocated to each participating security. Accordingly, the presentation above is prepared on a combined basis. For fiscal years 2019 and 2018, all options were included in the
F-31
ENNIS, INC. AND SUBSIDIARIES
NOTES TO CONSOLIDATED FINANCIAL STATEMENTS
diluted earnings per share computation because the average fair market value of the Company’s stock exceeded the exercise price of the options. No options were outstanding at the end of fiscal year 2020.
(16) Commitments and Contingencies
In the ordinary course of business, the Company also enters into real property leases, which require the Company as lessee to indemnify the lessor from liabilities arising out of the Company’s occupancy of the properties. The Company’s indemnification obligations are generally covered under the Company’s general insurance policies.
From time to time, the Company is involved in various litigation matters arising in the ordinary course of business. The Company does not believe the disposition of any current matter will have a material adverse effect on its consolidated financial position or results of operations.
(17) Supplemental Cash Flow Information
Net cash flows from operating activities reflect cash payments for interest and income taxes, as well as the noncash reclassification of the income tax effects associated with the Tax Act, are as follows for the three fiscal years ended (in thousands):
|
|
|
|
2020 |
|
|
|
2019 |
|
|
|
2018 |
|
|
Supplemental disclosure of cash flow information |
|
|
|
|
|
|
|
|
|
|
|
|
|
Interest paid, net |
|
$ |
715 |
|
|
$ |
1,109 |
|
|
$ |
731 |
|
|
Income taxes paid, net |
|
$ |
14,470 |
|
|
$ |
9,866 |
|
|
$ |
15,468 |
|
|
|
|
|
|
|
|
|
|
|
|
|
|
|
|
Noncash investing and financing activities |
|
|
|
|
|
|
|
|
|
|
|
|
|
Reclassification of the income tax effects of the Tax Act |
|
$ |
— |
|
|
$ |
— |
|
|
$ |
2,847 |
|
(18) Quarterly Consolidated Financial Information (Unaudited)
The following table represents the unaudited quarterly financial data of the Company for fiscal years ended 2020 and 2019 (in thousands, except per share amounts and quarter over quarter comparison):
|
For the three months ended |
|
May 31 |
|
|
August 31 |
|
|
November 30 |
|
|
February 29 |
|
||||
|
Fiscal year ended 2020: |
|
|
|
|
|
|
|
|
|
|
|
|
|
|
|
|
|
Net sales |
|
$ |
108,033 |
|
|
$ |
108,816 |
|
|
$ |
114,860 |
|
|
$ |
106,703 |
|
|
Gross profit margin |
|
|
32,696 |
|
|
|
32,458 |
|
|
|
33,836 |
|
|
|
29,934 |
|
|
Net earnings |
|
|
9,632 |
|
|
|
9,533 |
|
|
|
10,553 |
|
|
|
8,574 |
|
|
Dividends paid |
|
|
5,875 |
|
|
|
5,876 |
|
|
|
5,871 |
|
|
|
5,864 |
|
|
Per share of common stock: |
|
|
|
|
|
|
|
|
|
|
|
|
|
|
|
|
|
Basic net earnings |
|
$ |
0.37 |
|
|
$ |
0.37 |
|
|
$ |
0.41 |
|
|
$ |
0.33 |
|
|
Diluted net earnings |
|
$ |
0.37 |
|
|
$ |
0.37 |
|
|
$ |
0.41 |
|
|
$ |
0.33 |
|
|
Dividends |
|
$ |
0.225 |
|
|
$ |
0.225 |
|
|
$ |
0.225 |
|
|
$ |
0.225 |
|
|
Fiscal year ended 2019: |
|
|
|
|
|
|
|
|
|
|
|
|
|
|
|
|
|
Net sales |
|
$ |
93,419 |
|
|
$ |
98,591 |
|
|
$ |
108,070 |
|
|
$ |
100,702 |
|
|
Gross profit margin |
|
|
30,191 |
|
|
|
30,323 |
|
|
|
33,755 |
|
|
|
29,091 |
|
|
Net earnings |
|
|
9,247 |
|
|
|
9,567 |
|
|
|
10,419 |
|
|
|
8,204 |
|
|
Dividends paid |
|
|
5,083 |
|
|
|
5,728 |
|
|
|
5,922 |
|
|
|
5,878 |
|
|
Per share of common stock: |
|
|
|
|
|
|
|
|
|
|
|
|
|
|
|
|
|
Basic net earnings |
|
$ |
0.37 |
|
|
$ |
0.37 |
|
|
$ |
0.40 |
|
|
$ |
0.32 |
|
|
Diluted net earnings |
|
$ |
0.36 |
|
|
$ |
0.37 |
|
|
$ |
0.40 |
|
|
$ |
0.32 |
|
|
Dividends |
|
$ |
0.200 |
|
|
$ |
0.225 |
|
|
$ |
0.225 |
|
|
$ |
0.225 |
|
F-32
ENNIS, INC. AND SUBSIDIARIES
NOTES TO CONSOLIDATED FINANCIAL STATEMENTS
(19) Related Party Transactions
The Company leases a facility and sells product to an entity controlled by a board member who was the former owner of Independent Printing Company, Inc., a business that the Company acquired. The total right-of-use asset and related lease liability as of February 29, 2020 was $1.8 million and $1.8 million, respectively. During fiscal year 2020, total lease payments made to, and sales made to, the related party were approximately $0.4 million and $1.5 million, respectively.
(20) Concentrations of Risk
Financial instruments that potentially subject the Company to a concentration of credit risk principally consist of cash and trade receivables. Cash is placed with high-credit quality financial institutions. The Company believes its credit risk with respect to trade receivables is limited due to industry and geographic diversification. As disclosed on the Consolidated Balance Sheets, the Company maintains an allowance for doubtful receivables to cover the Company’s estimate of credit losses associated with accounts receivable.
No single customer accounts for as much as five percent of the Company’s consolidated net sales or accounts receivable.
The Company, for quality and pricing reasons, purchases its paper products from a limited number of suppliers. For fiscal years 2020, 2019 and 2018, the Company purchased 41%, 45% and 47%, respectively, of its materials from one third party vendor. As of February 29, 2020 and February 28, 2019, the net amount due to the vendor was $4.7 million and $4.0 million, respectively. While other sources may be available to the Company to purchase these products, they may not be available at the cost or at the quality the Company has come to expect.
For the purposes of the Consolidated Statements of Cash Flows, the Company considers cash to include cash on hand and in bank accounts. The Federal Deposit Insurance Corporation (“FDIC”) insures accounts up to $250,000. At February 29, 2020, cash balances included $66.6 million that was not federally insured because it represented amounts in individual accounts above the federally insured limit for each such account. This at-risk amount is subject to fluctuation on a daily basis. While management does not believe there is significant risk with respect to such deposits, we cannot be assured that we will not experience losses on our deposits.
(21) Subsequent Events
In December 2019, a novel strain of coronavirus (COVID-19) was reported in Wuhan, China, and by early 2020, the virus had spread to other countries, including the United States. This pandemic has significantly impacted health and economic conditions throughout the United States and the world, including the markets in which the Company operates.
In response to COVID-19, federal, state and local authorities have recommended social distancing and have imposed, or are considering, quarantine and isolation measures on large portions of the population, including mandatory closures of businesses deemed “non-essential” in certain jurisdictions. The Company’s plants are deemed “essential,” largely due to the Company’s involvement in many important sectors of the economy, including healthcare, government, food and beverage and banking, and thus most of the Company’s plants are currently operating at close-to-normal utilization levels. With respect to plants that are underutilized, the Company has made reductions in staffing levels as deemed appropriate, and the Company may take further actions in the future.
The Company has developed and continues to hone contingency plans covering multiple scenarios with respect to COVID-19, but the ultimate impact of the pandemic on the Company’s business, results of operations and financial condition will depend on future developments that are highly uncertain and which cannot be predicted. As stabilization is starting to take place, states and local governments have recently begun to institute their phased reopening plans to restart their state and local economies. Whether this will be long lasting or lead to another round of closures is not known. As of the date of his report, no other financial statement impact has been recorded, including any impairment of goodwill or long-lived assets.
F-33