Attached files
| file | filename |
|---|---|
| EX-21 - EX-21 - ENNIS, INC. | d873581dex21.htm |
| EX-23 - EX-23 - ENNIS, INC. | d873581dex23.htm |
| EX-32.1 - EX-32.1 - ENNIS, INC. | d873581dex321.htm |
| EX-31.2 - EX-31.2 - ENNIS, INC. | d873581dex312.htm |
| EX-32.2 - EX-32.2 - ENNIS, INC. | d873581dex322.htm |
| EX-31.1 - EX-31.1 - ENNIS, INC. | d873581dex311.htm |
| EXCEL - IDEA: XBRL DOCUMENT - ENNIS, INC. | Financial_Report.xls |
Table of Contents
UNITED STATES
SECURITIES AND EXCHANGE COMMISSION
Washington, D.C. 20549
FORM 10-K
| þ | Annual Report Pursuant to Section 13 or 15(d) of the Securities Exchange Act of 1934 |
For the fiscal year ended February 28, 2015
OR
| ¨ | Transition Report Pursuant to Section 13 or 15(d) of the Securities Exchange Act of 1934 |
For the transition period from to
Commission File Number 1-5807
ENNIS, INC.
(Exact Name of Registrant as Specified in Its Charter)
| Texas | 75-0256410 | |
| (State or Other Jurisdiction of Incorporation or Organization) |
(I.R.S. Employer Identification No.) | |
| 2441 Presidential Pkwy., Midlothian, Texas | 76065 | |
| (Address of Principal Executive Offices) | (Zip code) | |
(Registrant’s Telephone Number, Including Area Code) (972) 775-9801
Securities registered pursuant to Section 12(b) of the Act:
| Title of each class |
Name of each exchange on which registered | |
| Common Stock, par value $2.50 per share | New York Stock Exchange |
Securities registered pursuant to Section 12(g) of the Act: None
Indicate by check mark if the Registrant is a well-known seasoned issuer, as defined in Rule 405 of the Securities Act. Yes ¨ No x
Indicate by check mark if the Registrant is not required to file reports pursuant to Section 13 or Section 15(d) of the Act. Yes ¨ No x
Indicate by check mark whether the Registrant (1) has filed all reports required to be filed by Section 13 or 15(d) of the Securities Exchange Act of 1934 during the preceding 12 months (or for such shorter period that the Registrant was required to file such reports), and (2) has been subject to such filing requirements for the past 90 days. Yes x No ¨
Indicate by check mark whether the registrant has submitted electronically and posted on its corporate Web site, if any, every Interactive Data File required to be submitted and posted pursuant to Rule 405 of Regulation S-T during the preceding 12 months (or for such shorter period that the registrant was required to submit and post such files). Yes x No ¨
Indicate by check mark if disclosure of delinquent filers pursuant to Item 405 of Regulation S-K is not contained herein, and will not be contained, to the best of Registrant’s knowledge, in definitive proxy or information statements incorporated by reference in Part III of this Form 10-K or any amendment to this Form 10-K. ¨
Indicate by check mark whether the Registrant is a large accelerated filer, an accelerated filer, a non-accelerated filer or a smaller reporting company. See the definitions of “large accelerated filer,” “accelerated filer” and “smaller reporting company” in Rule 12b-2 of the Exchange Act. (Check one).
| Large accelerated Filer | ¨ | Accelerated filer | x | |||
| Non-accelerated filer | ¨ (Do not check if a smaller reporting company) | Smaller reporting company | ¨ | |||
Indicate by check mark whether the Registrant is a shell company (as defined in Rule 12b-2 of the Exchange Act). Yes ¨ No x
The aggregate market value of voting stock held by non-affiliates of the Registrant as of August 31, 2014 was approximately $364 million. Shares of voting stock held by executive officers, directors and holders of more than 10% of the outstanding voting stock have been excluded from this calculation because such persons may be deemed to be affiliates. Exclusion of such shares should not be construed to indicate that any of such persons possesses the power, direct or indirect, to control the Registrant, or that any such person is controlled by or under common control with the Registrant.
The number of shares of the Registrant’s Common Stock, par value $2.50, outstanding at April 30, 2015 was 25,811,026.
DOCUMENTS INCORPORATED BY REFERENCE
Portions of the Registrant’s Proxy Statement for the 2015 Annual Meeting of Shareholders are incorporated by reference into Part III of this Report.
Table of Contents
ENNIS, INC. AND SUBSIDIARIES
FORM 10-K
FOR THE PERIOD ENDED FEBRUARY 28, 2015
Table of Contents
Cautionary Statements Regarding Forward-Looking Statements
All of the statements in this Annual Report on Form 10-K, other than historical facts, are forward-looking statements, including, without limitation, the statements made in the “Management’s Discussion and Analysis of Financial Condition and Results of Operations,” particularly under the caption “Overview.” As a general matter, forward-looking statements are those focused upon anticipated events or trends, expectations, and beliefs relating to matters that are not historical in nature. The words “could,” “should,” “feel,” “anticipate,” “aim,” “preliminary,” “expect,” “believe,” “estimate,” “intend,” “intent,” “plan,” “will,” “foresee,” “project,” “forecast,” or the negative thereof or variations thereon, and similar expressions identify forward-looking statements.
The Private Securities Litigation Reform Act of 1995 provides a “safe harbor” for these forward-looking statements. In order to comply with the terms of the safe harbor, Ennis, Inc. notes that forward-looking statements are subject to known and unknown risks, uncertainties and other factors relating to its operations and business environment, all of which are difficult to predict and many of which are beyond the control of Ennis, Inc. These known and unknown risks, uncertainties and other factors could cause actual results to differ materially from those matters expressed in, anticipated by or implied by such forward-looking statements.
These statements reflect the current views and assumptions of management with respect to future events. Ennis, Inc. does not undertake, and hereby disclaims, any duty to update these forward-looking statements, even though its situation and circumstances may change in the future. Readers are cautioned not to place undue reliance on forward-looking statements, which speak only as of the date of this report. The inclusion of any statement in this report does not constitute an admission by Ennis, Inc. or any other person that the events or circumstances described in such statement are material.
We believe these forward-looking statements are based upon reasonable assumptions. All such statements involve risks and uncertainties, and as a result, actual results could differ materially from those projected, anticipated or implied by these statements. Such forward-looking statements involve known and unknown risks, including but not limited to, general economic, business and labor conditions and the potential impact on our operations; our ability to implement our strategic initiatives and control our operational costs; dependence on a limited number of key suppliers; our ability to recover the rising cost of raw materials and other costs (i.e., energy, freight, labor, benefit costs, etc.) in markets that are highly price competitive and volatile; our ability to get our utilities to meet our projected demand; our ability to timely or adequately respond to technological changes in the industry; the impact of the Internet and other electronic media on the demand for forms and printed materials; the impact of foreign competition, tariffs, trade regulations and import restrictions; changes in economic, political and social instability relating to our foreign operations; customer credit risk; competitors’ pricing strategies; a decline in business volume and profitability could result in an impairment in our reported goodwill negatively impacting our operational results; our ability to retain key management personnel; our ability to identify, manage or integrate acquisitions; and changes in government regulations.
| ITEM 1. | BUSINESS |
Overview
Ennis, Inc. (the “Company”) (formerly Ennis Business Forms, Inc.) was organized under the laws of Texas in 1909. Ennis, Inc. and its subsidiaries print and manufacture a broad line of business forms and other business products (the “Print Segment”) and also manufacture a line of activewear (the “Apparel Segment”) for distribution throughout North America. The Print Segment distributes business products and forms throughout the United States primarily through independent dealers. This distributor channel encompasses independent print distributors, commercial printers, direct mail, fulfillment companies, payroll and accounts payable software companies, and advertising agencies, among others. The Apparel Segment produces and sells activewear, including t-shirts, fleece goods and other wearables. Distribution of our activewear throughout the United States, Canada and Mexico is primarily through sales representatives. The distributor channel encompasses activewear wholesalers and screen printers. We offer a great selection of high-quality activewear apparel with a wide variety of styles and colors in sizes ranging from toddler to 6XL. The apparel line features a wide variety of tees and fleece.
3
Table of Contents
On December 31, 2014, we completed the acquisition of the stock of Kay Toledo Tag and Special Service Partners and their related entities (collectively “Kay Toledo”) for $16.2 million cash, in a stock purchase transaction. An additional $1.0 million is available to be paid over the next 3 years under an earn-out provision if certain financial metrics are achieved. Kay Toledo has locations in Toledo, Ohio and Neenah, Wisconsin through Special Service Partners. Experts in digital printing and customer short-run printing, Kay Toledo produces tags, labels, tickets and commercial printing. Kay Toledo, which generated approximately $25.0 million in sales for the twelve month period ended December 31, 2014 and will continue to operate under its respective brand names.
On October 3, 2014, we acquired the assets of Hoosier Data Forms for $0.2 million in cash plus the assumption of certain trade payables. Management considers this acquisition immaterial and has omitted further discussion.
On June 16, 2014, we acquired the assets of Sovereign Business Forms, and its related entities, TRI-C Business Forms, Inc., Falcon Business Forms, Inc., Forms Manufacturers, Inc., Mutual Graphics, Inc., and Curtis Business Forms, Inc. (collectively “Sovereign”) for $10.6 million in cash plus the assumption of certain trade liabilities. In addition, if certain financial metrics are met, an additional $1.0 million is available to be paid over the next 4 years under an earn-out provision. The cash portion of the purchase price was funded by borrowing under our line of credit facility. Sovereign produces snap sets, continuous forms and checks, laser forms, cut sheet forms and checks, and imprinted envelopes. Sovereign generated approximately $27.1 million in sales for the twelve month period ended December 31, 2013 and will continue to operate under its respective brand names.
On September 27, 2013, we acquired the assets of the Custom Envelope Division (“CED”), part of the Custom Resale Group of Cenveo, Inc., for $47.25 million in cash plus the assumption of certain trade liabilities. The cash portion of the purchase price was funded by borrowing under our line of credit facility. The CED assets are comprised of the Wisco® brand (“Wisco”), which is produced at an owned facility in Tullahoma, TN, and the National Imprint Corporation (“NIC”) and National Imprint Corporation® brand, which is produced in a leased facility in Claysburg, PA. Wisco produces and folds various types of envelopes, and NIC is an imprinter of envelopes. Both of these products are sold through print distributors and will continue to be operated under the Wisco and NIC brand names at their respective locations. Wisco and NIC had sales in excess of $40 million for the twelve month period ended December 31, 2012.
On September 30, 2013, we acquired the assets of the businesses operating under the trade name of Folder Express® from Wright Printing Company for $14.6 million in cash plus the assumption of certain trade payables. The cash portion of the purchase price was funded by borrowing under our line of credit facility. The businesses produce folders and specialty folders for music stores and public schools. The businesses had combined sales of approximately $20 million during the twelve month period ended December 31, 2012 and operates under the Folder Express and other brand names.
Business Segment Overview
Our management believes we are the largest providers of business forms, pressure-seal forms, labels, tags, envelopes, and presentation folders to independent distributors in the United States and are also a significant provider of blank t-shirts in North America to the activewear market. We operate in two reportable segments: Print and Apparel. For additional financial information concerning segment reporting, please see Note 13 of the Notes to the Consolidated Financial Statements beginning on page F-28.
Print Segment
The Print Segment, which represented 66%, 63%, and 63% of our consolidated net sales for the fiscal years ended February 28, 2015, February 28, 2014, and February 28, 2013, respectively, is in the business of manufacturing, designing and selling business forms and other printed business products primarily to distributors located in the United States. The Print Segment operates 58 manufacturing plants throughout the United States in 22 strategically located states. Approximately 96% of the business products manufactured by the Print Segment are custom and semi-custom products, constructed in a wide variety of sizes, colors, number of parts and quantities on an individual job basis depending upon the customers’ specifications.
4
Table of Contents
The products sold include snap sets, continuous forms, laser cut sheets, tags, labels, envelopes, integrated products, jumbo rolls and pressure sensitive products in short, medium and long runs under the following labels: Ennis®, Royal Business Forms®, Block Graphics®, Specialized Printed Forms®, 360º Custom LabelsSM, ColorWorx®, Enfusion®, Uncompromised Check Solutions®, VersaSeal®, Witt Printing®, B&D Litho®, Genforms®, PrintGraphicsSM, Calibrated Forms®, PrintXcel™, and Printegra®, Curtis Business FormsSM, Falcon Business FormsSM, Forms ManufacturersSM, Mutual GraphicsSM and TRI-C Business FormsSM. The Print Segment also sells the Adams-McClure® brand (which provides Point of Purchase advertising for large franchise and fast food chains as well as kitting and fulfillment); the Admore® and Folder Express® brands (which provide presentation folders and document folders); Ennis Tag & LabelSM (which provides custom printed high performance labels and custom and stock tags); Atlas Tag & Label®, Kay Toledo TagSM, Special Service PartnersSM (SSP) (which provides custom and stock tags and labels); Trade Envelopes® and Block Graphics®, Wisco® and National Imprint Corporation® (which provide custom and imprinted envelopes) and Northstar® and General Financial Supply® (which provide financial and security documents).
The Print Segment sells predominantly through printers and independent distributors. Northstar also sells direct to a small number of customers, generally large banking organizations (where a distributor is not acceptable or available to the end-user), as does Adams-McClure, where sales are generally through advertising agencies.
The printing industry generally sells its products either through sales made predominantly to end users, a market dominated by a few large manufacturers, such as R.R. Donnelley, Staples, Standard Register, and Cenveo, or, like the Company, through a variety of independent distributors and distributor groups. While it is not possible, because of the lack of adequate public statistical information, to determine the Company’s share of the total business products market, management believes the Company is the largest producer of business forms, pressure-seal forms, labels, tags, envelopes, and presentation folders in the United States distributing primarily through independent dealers.
There are a number of competitors that operate in this segment, ranging in size from single employee-owner operations to multi-plant organizations. We believe our strategic locations and buying power permit us to compete on a favorable basis within the distributor market on competitive factors, such as service, quality, and price.
Distribution of business forms and other business products throughout the United States is primarily done through independent dealers, including business forms distributors, resellers, direct mail, commercial printers, payroll and accounts payable software companies, and advertising agencies.
Raw materials of the Print Segment principally consist of a wide variety of weights, widths, colors, sizes, and qualities of paper for business products purchased from a number of major suppliers at prevailing market prices.
Business products usage in the printing industry is generally not seasonal. General economic conditions and contraction of the traditional business forms industry are the predominant factor in quarterly volume fluctuations.
Apparel Segment
The Apparel Segment represented 34%, 37%, and 37% of our consolidated net sales for the fiscal years ended February 28, 2015, February 28, 2014, and February 28, 2013, respectively, and operates under the name of Alstyle Apparel (“Alstyle”). Alstyle markets high quality knitted activewear (including t-shirts, tank tops and fleece) across all market segments. The main products of Alstyle are standardized shirts manufactured in a variety of sizes and colors. Approximately 99% of Alstyle’s revenues are derived from t-shirt sales and approximately 90% of its sales are domestic. Alstyle’s branded product lines are sold mainly under the AAA® and Murina® brands.
Alstyle’s primary manufacturing operations are in an owned manufacturing facility located in Agua Prieta, Mexico. Alstyle has three cut and sew facilities in Mexico (Agua Prieta, Ensenada and Hermosillo). In addition to its owned cut and sew facilities, Alstyle may also use outsourced manufacturers from time to time to supplement a portion of its cut and sew needs. After sewing and packaging is completed, the product is shipped to one of Alstyle’s nine distribution centers located across the United States, Canada, and Mexico.
Alstyle utilizes a customer-focused internal sales team comprised of twenty-four sales representatives assigned to specific geographic territories in the United States, Canada, and Mexico. Sales representatives are assigned
5
Table of Contents
performance objectives for their respective territories and are provided financial incentives for achievement of their target objectives. Sales representatives are responsible for developing business with large accounts and spend a majority of their time in the field.
Alstyle employs a staff of customer service representatives that handle call-in orders from smaller customers. Sales personnel sell directly to Alstyle’s customer base, which consists primarily of screen printers, embellishers, retailers, and mass marketers.
A majority of Alstyle’s sales continue to be branded products, with the remainder being customers’ private label products. Generally, sales to screen printers and mass marketers are driven by price and the availability of products, which directly impacts our inventory level requirements. Sales in the private label business are characterized by higher customer loyalty, and as such, the Company increased its sales emphasis in this area over the past year and expects to continue this effort in fiscal 2016.
Alstyle’s most popular styles are produced based on demand management forecasts to service at-once business and to level production schedules. Alstyle offers same-day shipping and uses third-party carriers to ship products to its customers.
Alstyle’s sales are seasonal, with sales in the first and second fiscal quarters generally being the highest. The apparel industry is characterized by rapid shifts in fashion, consumer demand and competitive pressures, resulting in both price and demand volatility. However, the imprinted activewear market to which Alstyle sells is generally “event” driven. Blank t-shirts can be thought of as “walking billboards” promoting movies, concerts, sports teams, and “image” brands. Still, the demand for any particular product varies from time to time based largely upon changes in consumer preferences and general economic conditions affecting the apparel industry.
The apparel industry is comprised of numerous companies who manufacture and sell a wide range of products. Alstyle is primarily involved in the activewear market and produces t-shirts, fleece, blended and other fashion basic products and outsources some products from time-to-time from other countries like China, Pakistan, Central America and other foreign sources to sell to its customers through its sales representatives. Alstyle competes with many branded and private label manufacturers of knit apparel in the United States, Canada, and Mexico, some of which are larger in size and have greater financial resources than Alstyle. Alstyle competes on the basis of price, quality, service, and delivery. Alstyle’s strategy is to provide the best value to its customers by delivering a consistent, high-quality product at a competitive price, not necessarily the lowest price. Alstyle’s competitive disadvantage is its size in relation to its major competitors and its brand name, Alstyle Apparel, is not as well-known as the brand names of its largest competitors, such as Gildan, Hanes, and Fruit of the Loom. While it is not possible to calculate precisely, because of the lack of adequate public statistical information, management believes that Alstyle is one of the top providers of blank t-shirts in North America.
Raw materials of the Apparel Segment principally consist of cotton and polyester yarn purchased from a number of major suppliers at prevailing market prices, although we purchased 43% of our cotton and yarn during the current period from one supplier.
Patents, Licenses, Franchises and Concessions
Outside of the patent for the VersaSeal® product, we do not have any significant patents, licenses, franchises, or concessions.
Intellectual Property
We market our products under a number of trademarks and trade names. We have registered trademarks in the United States for Ennis®, EnnisOnlineSM, Alstyle®, A Alstyle Apparel®, AA Alstyle Apparel & Activewear®, AAA Alstyle Apparel & Activewear®, B&D Litho of AZ®, B&D Litho®, ACR®, Block Graphics®, Classic by Alstyle Apparel®, Enfusion®, Murina®, 360º Custom LabelsSM, Admore®, CashManagementSupply.comSM, Securestar®, Northstar®, MICRLink®, MICR ConnectionTM, Ennisstores.comTM, General Financial Supply®, Calibrated Forms®, PrintXcel™, Printegra®, Trade Envelopes®, Witt Printing®, Genforms®, Royal Business Forms®, Crabar/GBFSM, BF&SSM, Adams McClure®, Advertising ConceptsTM, ColorWorx®, Atlas Tag & Label®, PrintgraphicsSM,
6
Table of Contents
Uncompromised Check Solutions®, VersaSeal®, VersaSeal SecureX®, Folder Express®, Wisco®, National Imprint Corporation®, Star Award Ribbon®, Kay Toledo TagSM, Curtis Business FormsSM, Falcon Business FormsSM, Forms ManufacturersSM, Mutual GraphicsSM, TRI-C Business FormsSM, SSPSM, EOSTouchpoint®, and Printersmall®, and variations of these brands as well as other trademarks. We have similar trademark registrations internationally. The protection of our trademarks is important to our business. We believe that our registered and common law trademarks have significant value and these trademarks are important to our ability to create and sustain demand for our products.
Customers
No single customer accounts for as much as five percent of our consolidated net sales.
Backlog
At February 28, 2015, our backlog of orders was approximately $25.5 million as compared to approximately $21.6 million at February 28, 2014. The increase in our backlog at February 28, 2015 was a result of the increase in our Apparel backlog as well as the additional orders from our recent acquisitions.
Research and Development
While we seek new products to sell through our distribution channel, there have been no material amounts spent on research and development in the fiscal year ended February 28, 2015.
Environment
We are subject to various federal, state, and local environmental laws and regulations concerning, among other things, wastewater discharges, air emissions and solid waste disposal. Our manufacturing processes do not emit substantial foreign substances into the environment. We do not believe that our compliance with federal, state, or local statutes or regulations relating to the protection of the environment has any material effect upon capital expenditures, earnings or our competitive position. There can be no assurance, however, that future changes in federal, state, or local regulations, interpretations of existing regulations or the discovery of currently unknown problems or conditions will not require substantial additional expenditures. Similarly, the extent of our liability, if any, for past failures to comply with laws, regulations, and permits applicable to our operations cannot be determined.
Employees
At February 28, 2015, we had 6,009 employees. 3,310 of the employees are in Mexico, and 22 employees are in Canada. Of the domestic employees, 287 are represented by labor unions under collective bargaining agreements, which are subject to periodic negotiations. Two unions represent all of our hourly employees in Mexico with contracts expiring at various times (all hourly employees are full-time).
Available Information
We make our annual report on Form 10-K, quarterly reports on Form 10-Q, current reports on Form 8-K, and amendments to reports filed or furnished pursuant to Section 13(a) or 15(d) of the Securities and Exchange Act of 1934 available free of charge under the Investors Relations page on our website, www.ennis.com, as soon as reasonably practicable after such reports are electronically filed with, or furnished to, the Securities and Exchange Commission (“SEC”). Information on our website is not included as a part of, or incorporated by reference into, this report. Our SEC filings are also available through the SEC’s website, www.sec.gov. In addition, the public may read and copy any materials we file with the SEC at the SEC’s Public Reference Room at 100 F Street NE, Washington, DC 20549. Information regarding the operation of the Public Reference Room may be obtained by calling the SEC at 1-800-SEC-0330.
7
Table of Contents
| ITEM 1A. | RISK FACTORS |
You should carefully consider the risks described below, as well as the other information included or incorporated by reference in this Annual Report on Form 10-K, before making an investment in our common stock. The risks described below are not the only ones we face in our business. Additional risks and uncertainties not presently known to us or that we currently believe to be immaterial may also impair our business operations. If any of the following risks occur, our business, financial condition or operating results could be materially harmed. In such an event, our common stock could decline in price and you may lose all or part of your investment.
Our results and financial condition are affected by global and local market conditions, and competitors’ pricing strategies, which can adversely affect our sales, margins, and net income.
Our results of operations are substantially affected not only by global economic conditions, but also by local market conditions, and competitors’ pricing strategies, which can vary substantially by market. Unfavorable conditions can depress sales in a given market and may prompt promotional or other actions that adversely affect our margins, constrain our operating flexibility or result in charges. Certain macroeconomic events, such as the past crisis in the financial markets, could have a more wide-ranging and prolonged impact on the general business environment, which could also adversely affect us. Whether we can manage these risks effectively depends mainly on the following:
| • | Our ability to manage movements in commodity prices and the impact of government actions to manage national economic conditions such as consumer spending, inflation rates and unemployment levels, particularly given the current volatility in the global financial markets; and |
| • | The impact on our margins of labor costs given our labor-intensive business model, the trend toward higher wages in both mature and developing markets and the potential impact of union organizing efforts on day-to-day operations of our manufacturing facilities. |
Declining economic conditions could negatively impact our business.
Our operations are affected by local, national and worldwide economic conditions. The consequences of domestic and international economic uncertainty or instability, volatility in commodity markets, and domestic or international policy uncertainty, all of which we have seen, can all impact economic activity. This in turn can impact the demand for our products. Instability in the financial markets also may affect our cost of capital and our ability to raise capital, if needed.
The terms and conditions of our credit facility impose certain restrictions on our operations. We may not be able to raise additional capital, if needed, for proposed expansion projects.
The terms and conditions of our credit facility impose certain restrictions on our ability to incur additional debt, make capital expenditures, acquisitions and asset dispositions, as well as imposing other customary covenants, such as requiring a tangible equity level and a ratio of total funded debt to the sum of net earnings plus interest, tax, depreciation and amortization (“EBITDA”). Our ability to comply with the covenants may be affected by events beyond our control, such as distressed and volatile financial and/or consumer markets, etc. A breach of any of these covenants could result in a default under our credit facility. In the event of a default, the bank could elect to declare the outstanding principal amount of our credit facility, all interest thereon, and all other amounts payable under our credit facility to be immediately due and payable. As of February 28, 2015, we were in compliance with all terms and conditions of our credit facility, which matures on August 18, 2016.
Declining financial market conditions and continued decline in long-term interest rates could adversely impact the funded status of our pension plan.
We maintain a noncontributory defined benefit retirement plan (the “Pension Plan”) covering approximately 8% of our employees. Included in our financial results are Pension Plan costs that are measured using actuarial valuations. The actuarial assumptions used may differ from actual results. In addition, as our Pension Plan assets are invested in marketable securities, severe fluctuations in market values could potentially negatively impact our funded status, recorded pension liability, and future required minimum contribution levels. In addition, a decline in long-term debt
8
Table of Contents
interest rates puts downward pressure on the discount rate used by plan sponsors to determine their pension liabilities. Each 10 basis point change in the discount rate impacts our computed liability by about $800,000. So, similar to fluctuations in market values, a continued drop in the discount rate could potentially negatively impact our funded status, recorded pension liability and future contribution levels.
In 2015 we wrote down Apparel Segment goodwill and other intangible assets and we may have similar charges in the future, which could cause our financial condition and results of operations to be negatively affected in the future.
When we acquire a business, a portion of the purchase price of the acquisition may be allocated to goodwill and other identifiable intangible assets. The amount of the purchase price which is allocated to goodwill and other intangible assets is the excess of the purchase price over the net identifiable tangible assets acquired. The annual impairment test is based on several factors requiring judgment. An impairment may be caused by any number of factors outside the Company’s control, such as a decline in market conditions caused by a recession, or protracted recovery there-from, or other factors like competitor’s pricing strategies, which may be tied to such economic events. We have recorded impairment charges in the past and during the current fiscal year recorded an impairment of $93.3 million related to goodwill and other intangible assets relating to our Apparel segment. Continued sale-side pressure due to competitor’s pricing strategies or continued challenging market conditions could result in an impairment charge in the future. Although such a charge would be a non-cash expense, it would impact the Company’s reported operating results and its financial position. At February 28, 2015, our consolidated goodwill and other intangible assets were approximately $64.5 million and $76.2 million, respectively, of which $20.3 million of other intangibles related to our Apparel segment.
Digital technologies will continue to erode the demand for our printed business documents.
The increasing sophistication of software, internet technologies, and digital equipment combined with our customers’ general preference, as well as governmental influences for paperless business environments will continue to reduce the number of traditional printed documents sold. Moreover, the documents that will continue to coexist with software applications will likely contain less value-added print content.
Many of our custom-printed documents help companies control their internal business processes and facilitate the flow of information. These applications will increasingly be conducted over the internet or through other electronic payment systems. The predominant method of our customers’ communication to their customers is by printed information. As their customers become more accepting of internet communications, our clients may increasingly opt for the less costly electronic option, which would reduce our revenue. The pace of these trends is difficult to predict. These factors will tend to reduce the industry-wide demand for printed documents and require us to gain market share to maintain or increase our current level of print-based revenue.
In response to the gradual obsolescence of our standardized forms business, we continue to develop our capability to provide custom and full-color products. If new printing capabilities and new product introductions do not continue to offset the obsolescence of our standardized business forms products, and we aren’t able to increase our market share, our sales and profits will be affected. Decreases in sales of our standardized business forms and products due to obsolescence could also reduce our gross margins. This reduction could in turn adversely impact our profits, unless we are able to offset the reduction through the introduction of new high margin products and services or realize cost savings in other areas.
Our distributor customers may be acquired by other manufacturers who redirect business within their plants.
Some of our customers are being absorbed by the distribution channels of some of our manufacturing competitors. However, we do not believe this will significantly impact our business model. We have continued to sell to some of these customers even after they were absorbed by our competition because of the breadth of our product line and our geographic diversity.
9
Table of Contents
Our distributors face increased competition from various sources, such as office supply superstores. Increased competition may require us to reduce prices or to offer other incentives in order to enable our distributors to attract new customers and retain existing customers.
Low price, high value office supply chain stores offer standardized business forms, checks and related products. Because of their size, these superstores have the buying power to offer many of these products at competitive prices. These superstores also offer the convenience of “one-stop” shopping for a broad array of office supplies that our distributors do not offer. In addition, superstores have the financial strength to reduce prices or increase promotional discounts to expand market share. This could result in us reducing our prices or offering incentives in order to enable our distributors to attract new customers and retain existing customers, which could reduce our profits.
Technological improvements may reduce our competitive advantage over some of our competitors, which could reduce our profits.
Improvements in the cost and quality of printing technology are enabling some of our competitors to gain access to products of complex design and functionality at competitive costs. Increased competition from these competitors could force us to reduce our prices in order to attract and retain customers, which could reduce our profits.
We could experience labor disputes that could disrupt our business in the future.
As of February 28, 2015, approximately 11% of our domestic employees are represented by labor unions under collective bargaining agreements, which are subject to periodic negotiations. Two unions represent all of our hourly employees in Mexico. While we feel we have a good working relationship with all of the unions, there can be no assurance that any future labor negotiations will prove successful, which may result in a significant increase in the cost of labor, or may break down and result in the disruption of our business or operations.
We obtain our raw materials from a limited number of suppliers, and any disruption in our relationships with these suppliers, or any substantial increase in the price of raw materials or material shortages could have a material adverse effect on us.
Cotton yarn is the primary raw material used in Alstyle’s manufacturing processes and represents a significant portion of its manufacturing costs. Alstyle acquires its yarn from three major sources that meet stringent quality and on-time delivery requirements. The largest supplier provided 43% of Alstyle’s yarn requirements during fiscal year 2015 and has an entire yarn mill dedicated to Alstyle’s production. To maintain our high standard of color control associated with our apparel products, we purchase our dyeing chemicals from limited sources. If Alstyle’s relations with its suppliers are disrupted, Alstyle may not be able to enter into arrangements with substitute suppliers on terms as favorable as its current terms, and our results of operations could be materially adversely affected.
We also purchase our paper products from a limited number of sources, which meet stringent quality and on-time delivery standards under long-term contracts. However, fluctuations in the quality of our paper, unexpected price increases or other factors that relate to our paper products could have a material adverse effect on our operating results.
Both cotton and paper are commodities that are subject to periodic increases or decreases in price, which are sometimes quite significant. There is no effective market of derivative instruments to cost-effectively insulate us against unexpected changes in price of paper, and corporate negotiated purchase contracts provide only limited protection against price increases. We generally acquire our cotton yarn under short-term purchase contracts with our suppliers. While we generally do not use derivative instruments, including cotton option contracts, to manage our exposure to movements in cotton market prices, we believe we are competitive with other companies in the United States apparel industry in negotiating the price of cotton. Generally, when cotton or paper prices are increased, we attempt to recover the higher costs by raising the prices of our products to our customers. In the price-competitive marketplaces in which we operate, we may not always be able to pass through any or all of the higher costs. As such, any significant increase in the price of paper or cotton or shortages in the availability of either, could have a material adverse effect on our results of operations.
10
Table of Contents
We face intense competition to gain market share, which may lead some competitors to sell substantial amounts of goods at prices against which we cannot profitably compete.
Demand for Alstyle’s products is dependent on the general demand for shirts and the availability of alternative sources of supply. While Alstyle will compete on price, its marketing strategy is to differentiate itself by providing quality service and quality products to its customers. Even if this strategy is successful, its results may be offset by reductions in demand or price declines due to competitors’ pricing strategies or other micro or macro-economic factors. Our Print Segment also faces the risk of our competition following a strategy of selling its products at or below cost in order to cover some amount of fixed costs, especially in distressed economic times.
The apparel industry is heavily influenced by general economic cycles.
The apparel industry is cyclical and dependent upon the overall level of discretionary consumer spending, which changes as regional, domestic and international economic conditions change. These include, but are not limited to, employment levels, energy costs, interest rates, tax rates, personal debt levels, and uncertainty about the future. Any deterioration in general economic conditions that creates uncertainty or alters discretionary consumer spending habits could reduce our sales, increase our costs of goods sold or require us to significantly modify our current business practices, and consequently negatively impact our results of operations.
Our foreign-based apparel manufacturing operations could be subject to unexpected changes in regulatory requirements, tariffs and other market barriers, political and economic instability, social unrest, as well as disruption of services in the countries where it operates, which could negatively impact our operating results.
Alstyle operates manufacturing facilities in Mexico and from time to time sources product manufacturing and purchases from China, Pakistan, Central America and other foreign sources. Alstyle’s foreign operations could be subject to unexpected changes in regulatory requirements, tariffs, and other market barriers, political and economic instability, social unrest in the countries where it operates, as well as utility and other service disruption. The impact of any such events that may occur in the future could subject Alstyle to additional costs or loss of sales, which could adversely affect our operating results. In particular, Alstyle operates its facilities in Mexico pursuant to the “maquiladora” duty-free program established by the Mexican and United States governments. This program enables Alstyle to take advantage of generally lower costs in Mexico, without paying duty on inventory shipped into or out of Mexico. There can be no assurance that the governments of Mexico and the United States will continue the program currently in place or that Alstyle will continue to be able to benefit from this program. The loss of these benefits could have an adverse effect on our business.
In addition, all Alstyle’s knit and dye operations are located in one facility in Agua Prieta, Mexico. Any disruptions in utility or other services required to continue operations that are caused by any of the above factors, as well as others, could have a material adverse effect on the Company’s operational results.
Our apparel products are subject to foreign competition, which had been subject to U.S. government domestic quota restrictions or import duties in the past.
Foreign producers of apparel often have significant labor cost advantages. In the past few years, domestic quota restrictions have been eliminated for basically all foreign countries, which has significantly impacted domestic apparel producers. What remains in place today for these countries is import duties, which tends to offset some of the significant labor cost advantages these countries have over domestic and NAFTA/CAFTA producers. Import protection afforded to domestic apparel producers has been, and is likely to remain, subject to considerable political considerations. Given the number of these foreign producers, any further elimination of import protections that protect domestic apparel producers could materially adversely affect Alstyle’s business.
The North American Free Trade Agreement (NAFTA) became effective on January 1, 1994 and has created a free-trade zone among Canada, Mexico, and the United States. NAFTA contains a rule of origin requirement that products be produced in one of the three countries in order to benefit from the agreement. NAFTA has phased out all trade restrictions and tariffs among the three countries on apparel products competitive with those of Alstyle. Alstyle manufactures all of its products in the Agua Prieta manufacturing plant and performs substantially all of its cutting
11
Table of Contents
and sewing in three plants located in Mexico in order to take advantage of the NAFTA benefits. Subsequent repeal or alteration of NAFTA could adversely affect our business (see below).
The Central American Free Trade Agreement (CAFTA) became effective May 28, 2004 and retroactive to January 1, 2004 for textiles and apparel. It creates a free trade zone similar to NAFTA by and between the United States and Central American countries (El Salvador, Honduras, Costa Rica, Nicaragua, and Dominican Republic). Textiles and apparel are duty-free and quota-free immediately if they meet the agreement’s rule of origin, promoting new opportunities for U.S. and Central American fiber, yarn, fabric and apparel manufacturing. While CAFTA in the past afforded some advantages to Alstyle as they outsourced some of their U.S. produced fiber to Central America to cut/sew, with the transition of this production to Mexico this advantage went away. As such, we do not anticipate that the alteration or subsequent repeal of CAFTA would have a material effect on our operations.
The introduction of CAFTA took away most of the advantages NAFTA afforded to us domestically. However, NAFTA continues to afford us some advantage over CAFTA with respect to our sales in Canada. Currently, NAFTA produced goods can be shipped into Canada duty-free. The same protection is not currently afforded to CAFTA produced goods. However, CAFTA countries are in negotiation with the Canadian government to include Canada in CAFTA. If successful, this could potentially significantly impact our business in Canada. Recently, the governments of Canada and Honduras reached an agreement which basically affords goods produced in Honduras similar advantages to NAFTA produced goods with respect to Canadian importation. In addition to CAFTA, agreements such as Trans-Pacific Partnership (see below) and other similar agreements can further eliminate any advantages NAFTA affords to manufacturers.
The World Trade Organization (WTO), a multilateral trade organization, was formed in January 1995 and is the successor to the General Agreement on Tariffs and Trade (GATT). This multilateral trade organization has set forth mechanisms by which world trade in clothing is being progressively liberalized by phasing-out quotas and reducing duties over a period of time that began in January of 1995. As it implements the WTO mechanisms, the United States government is negotiating bilateral trade agreements with developing countries, which are generally exporters of textile and apparel products, that are members of the WTO to get them to reduce their tariffs on imports of textiles and apparel in exchange for reductions by the United States in tariffs on imports of textiles and apparel. In 2008 all import quotas for China were removed. A continued reduction of import quotas and tariffs could make Alstyle’s products less competitive against low cost imports from developing countries (see discussion below).
More recently, a proposed trade agreement (Trans-Pacific Partnership – “TPP”) between the United States, Vietnam, Australia, Brunei, Chile, Canada, Japan, Malaysia, Mexico, New Zealand, Peru and Singapore has been in discussions. Such an agreement if passed could potentially give lower labor-cost countries like Vietnam a significant advantage over Alstyle. One aspect of the agreement could potentially allow Asian countries that are part of the agreement to use China cotton, which would allow these countries to cut and sew their products in a low labor-cost country like Vietnam and then import their products into the U.S. and Canada duty-free. In addition, Canada has recently awarded a duty-free status to Bangladesh and is currently in negotiations with Pakistan. Such developments as these could materially negatively impact Alstyle’s operations domestically and in Canada.
Environmental regulations may impact our future operating results.
We are subject to extensive and changing federal, state and foreign laws and regulations establishing health and environmental quality standards, concerning, among other things, wastewater discharges, air emissions and solid waste disposal, and may be subject to liability or penalties for violations of those standards. We are also subject to laws and regulations governing remediation of contamination at facilities currently or formerly owned or operated by us or to which we have sent hazardous substances or wastes for treatment, recycling or disposal. We may be subject to future liabilities or obligations as a result of new or more stringent interpretations of existing laws and regulations. In addition, we may have liabilities or obligations in the future if we discover any environmental contamination or liability at any of our facilities, or at facilities we may acquire.
12
Table of Contents
Our manufacturing facility in Mexico is subject to certain risks regarding sales growth and cost savings as well as disruption in manufacturing risks.
Our manufacturing facility in Agua Prieta, Mexico was built to capture anticipated future growth and savings in production costs over our cost structure in Anaheim, CA. If such growth or production savings do not materialize, it may negatively impact our ability to achieve our expected returns and our production levels, operational results and financial condition. In addition, our apparel manufacturing process from spinning through cutting occurs predominantly at our manufacturing facility located in Agua Prieta, Mexico, thus, any disruption in our utility services (i.e., water, electric, gas, etc.) can have a significant impact on our production levels, which depending on length of the disruption could significantly impact our sales and operational profitability.
We are exposed to the risk of non-payment by our customers on a significant amount of our sales.
Our extension of credit involves considerable judgment and is based on an evaluation of each customer’s financial condition and payment history. We monitor our credit risk exposure by periodically obtaining credit reports and updated financials on our customers. We see a heightened amount of bankruptcies by our customers, especially retailers, during economic downturns. While we maintain an allowance for doubtful receivables for potential credit losses based upon our historical trends and other available information, in times of economic turmoil, there is heightened risk that our historical indicators may prove to be inaccurate. The inability to collect on sales to significant customers or a group of customers could have a material adverse effect on our results of operations.
Our business incurs significant freight and transportation costs.
We incur significant freight costs to transport our goods, especially as it relates to our Apparel Segment where we transport yarn from our domestic suppliers to our textile facility in Mexico. The internal freight from the textile to the sewing facilities, as well as the logistic cost of keeping our product in the distribution centers to maintain our product close to the customer and on time to market is also significant. In addition, we incur transportation expenses to ship our products to our customers. Significant increases in the costs of freight and transportation could have a material adverse effect on our results of operations, as there can be no assurance that we could pass on these increased costs to our customers.
The price of energy is prone to significant fluctuations and volatility.
Our apparel manufacturing operations require high inputs of energy, and therefore changes in energy prices directly impact our gross profit margins. We focus on manufacturing methods that will reduce the amount of energy used in the production of our apparel products to mitigate the rising costs of energy. Significant increases in energy prices could have a material adverse effect on our results of operations, as there can be no assurance that we could pass these increased costs to our customers given the competitive environment in which our Apparel segment operates.
We depend upon the talents and contributions of a limited number of individuals, many of whom would be difficult to replace.
The loss or interruption of the services of our Chief Executive Officer, Executive Vice President, Vice President of Apparel or Chief Financial Officer could have a material adverse effect on our business, financial condition or results of operations. Although we maintain employment agreements with these individuals, it cannot be assured that the services of such individuals will continue.
Increases in the cost of employee benefits could impact our financial results and cash flow.
Our expenses relating to employee health benefits are significant. Unfavorable changes in the cost of such benefits could impact our financial results and cash flow. Healthcare costs have risen significantly in recent years, and recent legislative and private sector initiatives regarding healthcare reform could result in significant changes to the U.S. healthcare system. Because of the many variables involved and the staggered implementation timeline, we cannot predict with any assurance the impact that the Healthcare Reform and interpretive legislation law and related regulations could have on the Company-sponsored medical plans.
13
Table of Contents
| ITEM 1B. | UNRESOLVED STAFF COMMENTS |
There are no unresolved SEC staff comments.
| ITEM 2. | PROPERTIES |
Our corporate headquarters are located in Midlothian, Texas. We operate manufacturing and distribution facilities throughout the United States and in Mexico and Canada. See the table below for additional information on our locations.
All of the Print Segment properties are used for the production, warehousing and shipping of the following: business forms, flexographic printing, advertising specialties and Post-it® Notes (Wolfe City, Texas); presentation products (Macomb, Michigan and Anaheim, California); printed and electronic promotional media (Denver, Colorado); envelopes (Portland, Oregon; Columbus, Kansas and Tullahoma, Tennessee); financial forms (Minneapolis/St. Paul, Minnesota; Nevada, Iowa and Bridgewater, Virginia) and other business products. The Apparel Segment properties are used for the manufacturing or distribution of t-shirts and other activewear apparel.
Our plants are operated at production levels required to meet our forecasted customer demands. Production levels fluctuate with market demands and depend upon the product mix at any given point in time. Equipment is added as existing machinery becomes obsolete or not repairable, and as new equipment becomes necessary to meet market demands; however, at any given time, these additions and replacements are not considered to be material additions to property, plant and equipment, although such additions or replacements may increase a plant’s efficiency or capacity.
All of the foregoing facilities are considered to be in good condition. We do not anticipate that substantial expansion, refurbishing, or re-equipping will be required in the near future.
All of the rented property is held under leases with original terms of one or more years, expiring at various times through May 2019. No difficulties are presently foreseen in maintaining or renewing such leases as they expire.
The accompanying list contains each of our owned and leased locations:
| Approximate Square Footage | ||||||||||
| Location |
General Use |
Owned | Leased | |||||||
| Print Segment |
||||||||||
| Ennis, Texas |
Three Manufacturing Facilities * |
325,118 | — | |||||||
| Chatham, Virginia |
Two Manufacturing Facilities |
127,956 | — | |||||||
| Paso Robles, California |
Manufacturing |
94,120 | — | |||||||
| DeWitt, Iowa |
Two Manufacturing Facilities |
95,000 | — | |||||||
| Knoxville, Tennessee |
Held for sale |
48,057 | — | |||||||
| Ft. Scott, Kansas |
Manufacturing |
86,660 | — | |||||||
| Portland, Oregon |
Manufacturing |
— | 103,402 | |||||||
| Wolfe City, Texas |
Two Manufacturing Facilities |
119,259 | — | |||||||
| Moultrie, Georgia |
Manufacturing |
25,000 | — | |||||||
| Coshocton, Ohio |
Manufacturing |
24,750 | — | |||||||
| Macomb, Michigan |
Manufacturing |
56,350 | — | |||||||
| Anaheim, California |
Two Manufacturing Facilities |
— | 49,000 | |||||||
| Bellville, Texas |
Leasing |
70,196 | — | |||||||
| Denver, Colorado |
Four Manufacturing Facilities |
60,000 | 117,575 | |||||||
| Brooklyn Park, Minnesota |
Manufacturing |
94,800 | — | |||||||
| Roseville, Minnesota |
Manufacturing |
— | 41,300 | |||||||
| Roseville, Minnesota |
Warehouse |
— | 20,119 | |||||||
| Nevada, Iowa |
Two Manufacturing Facilities |
290,752 | — | |||||||
| Bridgewater, Virginia |
Manufacturing |
— | 27,000 | |||||||
| Columbus, Kansas |
Manufacturing and Warehouse |
174,089 | — | |||||||
| Leipsic, Ohio |
Manufacturing |
83,216 | — | |||||||
14
Table of Contents
| Approximate Square Footage | ||||||||||
| Location |
General Use |
Owned | Leased | |||||||
| El Dorado Springs, Missouri |
Manufacturing |
70,894 | — | |||||||
| Princeton, Illinois |
Manufacturing |
— | 44,190 | |||||||
| Arlington, Texas |
Two Manufacturing Facilities |
69,935 | 30,700 | |||||||
| Tullahoma, Tennessee |
Two Manufacturing Facilities |
167,011 | ||||||||
| Caledonia, New York |
Manufacturing |
138,730 | — | |||||||
| Sun City, California |
Manufacturing |
52,617 | — | |||||||
| Phoenix, Arizona |
Manufacturing and Warehouse |
59,000 | ||||||||
| Neenah, Wisconsin |
Two Manufacturing Facilities |
63,000 | 57,786 | |||||||
| West Chester, Pennsylvania |
Sales Office |
1,150 | ||||||||
| Claysburg, Pennsylvania |
Manufacturing |
69,000 | ||||||||
| Vandalia, Ohio |
Manufacturing |
47,820 | ||||||||
| Fairport, New York |
Manufacturing |
40,800 | ||||||||
| Jaffrey, New Hampshire |
Sales Office |
647 | ||||||||
| Indianpolis, Indiana |
Two Manufacturing Facilities |
62,754 | ||||||||
| Livermore, California |
Manufacturing |
21,568 | ||||||||
| Smyrna, Georgia |
Manufacturing |
65,000 | ||||||||
| Clarksville, Tennessee |
Manufacturing |
51,900 | ||||||||
| Fairhope, Alabama |
Manufacturing |
65,000 | ||||||||
| Toledo, Ohio |
Three Manufacturing Facilities |
119,900 | ||||||||
| Visalia, California |
Manufacturing |
56,000 | ||||||||
| Omaha, NE |
Manufacturing |
160,000 | ||||||||
| Holyoke, MA |
Manufacturing |
29,281 | ||||||||
| Corsicana,TX |
Manufacturing |
39,685 | ||||||||
| Girard, KS |
Manufacturing |
69,474 | ||||||||
| Powell,TN |
Manufacturing |
43,968 | ||||||||
| Houston, TX |
Manufacturing |
29,668 | ||||||||
|
|
|
|
|
|||||||
| 2,775,257 | 1,085,940 | |||||||||
|
|
|
|
|
|||||||
| Apparel Segment |
||||||||||
| Anaheim, California |
Office and Distribution Center |
— | 151,000 | |||||||
| Chicago, Illinois |
Distribution Center |
— | 82,100 | |||||||
| Orlando, Florida |
Distribution Center |
— | 37,804 | |||||||
| Carrollton, Texas |
Distribution Center |
— | 26,136 | |||||||
| Bensalem, Pennsylvania |
Distribution Center |
— | 60,848 | |||||||
| Mississauga, Canada |
Distribution Center |
— | 53,982 | |||||||
| Los Angeles, California |
Distribution Center |
— | 31,600 | |||||||
| Agua Prieta, Mexico |
Manufacturing |
700,000 | — | |||||||
| Ensenada, Mexico |
Manufacturing |
87,145 | — | |||||||
| Ensenada, Mexico |
Car Parking |
— | 37,125 | |||||||
| Ensenada, Mexico |
Warehouse |
— | 16,146 | |||||||
| Hermosillo, Mexico |
Manufacturing |
— | 76,145 | |||||||
| Hermosillo, Mexico |
Yard Space |
— | 19,685 | |||||||
| Hermosillo, Mexico |
Vacant |
— | 8,432 | |||||||
|
|
|
|
|
|||||||
| 787,145 | 601,003 | |||||||||
|
|
|
|
|
|||||||
| Corporate Offices |
||||||||||
| Ennis, Texas |
Administrative Offices |
9,300 | — | |||||||
| Midlothian, Texas |
Executive and Administrative Offices |
28,000 | — | |||||||
|
|
|
|
|
|||||||
| 37,300 | — | |||||||||
|
|
|
|
|
|||||||
| Totals |
3,599,702 | 1,686,943 | ||||||||
|
|
|
|
|
|||||||
| * | 7,000 square feet of Ennis, Texas location leased |
15
Table of Contents
| ITEM 3. | LEGAL PROCEEDINGS |
From time to time we are involved in various litigation matters arising in the ordinary course of our business. We do not believe the disposition of any current matter will have a material adverse effect on our consolidated financial position or results of operations.
| ITEM 4. | MINE SAFETY DISCLOSURES |
Not applicable.
| ITEM 5. | MARKET FOR REGISTRANT’S COMMON EQUITY, RELATED STOCKHOLDER MATTERS AND ISSUER PURCHASES OF EQUITY SECURITIES |
Our common stock is traded on the New York Stock Exchange (“NYSE”) under the trading symbol “EBF”. The following table sets forth the high and low sales prices, the common stock trading volume as reported by the New York Stock Exchange and dividends per share paid by the Company for the periods indicated:
| Common Stock Price Range |
Common Stock Trading Volume (number of shares in thousands) |
Dividends per share of Common Stock |
||||||||||||||
| High | Low | |||||||||||||||
| Fiscal Year Ended February 28, 2015 |
||||||||||||||||
| First Quarter |
$ | 17.02 | $ | 14.45 | 2,277 | $ | 0.175 | |||||||||
| Second Quarter |
15.97 | 14.05 | 1,920 | $ | 0.175 | |||||||||||
| Third Quarter |
15.13 | 12.53 | 2,106 | $ | 0.175 | |||||||||||
| Fourth Quarter |
14.23 | 12.51 | 2,195 | $ | 0.175 | |||||||||||
| Fiscal Year Ended February 28, 2014 |
||||||||||||||||
| First Quarter |
$ | 17.60 | $ | 13.92 | 1,479 | $ | — | |||||||||
| Second Quarter |
19.42 | 16.31 | 1,542 | $ | 0.175 | |||||||||||
| Third Quarter |
18.77 | 17.28 | 1,587 | $ | 0.175 | |||||||||||
| Fourth Quarter |
18.54 | 13.56 | 2,634 | $ | 0.175 | |||||||||||
The last reported sale price of our common stock on NYSE on April 30, 2015 was $15.38. As of that date, there were approximately 828 shareholders of record of our common stock. Cash dividends may be paid or repurchases of our common stock may be made from time to time, as our Board of Directors deems appropriate, after considering our growth rate, operating results, financial condition, cash requirements, restrictive lending covenants, and such other factors as the Board of Directors may deem appropriate.
16
Table of Contents
On October 20, 2008, the Board of Directors authorized the repurchase of up to $5.0 million of our common stock through a stock repurchase program. Under the board-approved repurchase program, share purchases may be made from time to time in the open market or through privately negotiated transactions depending on market conditions, share price, trading volume and other factors, and such purchases, if any, will be made in accordance with applicable insider trading and other securities laws and regulations. These repurchases may be commenced or suspended at any time or from time to time without prior notice. On April 20, 2012, the Board increased the authorized amount available to repurchase our shares by an additional $5.0 million, bringing the total available to repurchase our common stock to approximately $ 9.0 million at that time. On December 19, 2014, the Board increased the authorized amount available to repurchase our shares by an additional $10.0 million, bringing the total approved to $20.0 million and leaving approximately $10.1 million available to repurchase currently. During the fiscal year ended February 28, 2015, we repurchased 502,609 shares of our common stock at an average price of $13.99 per share, bringing the total number of shares repurchased under the program since its inception to 718,511 at an average price of $13.74 per share. During the fiscal year ended February 28, 2014, we repurchased 119,902 shares of our common stock at an average price of $15.31 per share. There were no share repurchases made during fiscal year 2013. Unrelated to the stock repurchase program, the Company purchased 81, 112 and 175 shares of common stock during the fiscal years ended February 28, 2015, February 28, 2014, and February 28, 2013, respectively.
| Period |
Total Number of Shares Purchased |
Average Price Paid per Share |
Total Number of Shares Purchased as Part of Publicly Announced Programs |
Maximum Amount that May Yet Be Used to Purchase Shares Under the Program |
||||||||||||
| February 1, 2015 - February 28, 2015 |
— | $ | — | — | $ | 10,128,466 | ||||||||||
| January 1, 2015 - January 31, 2015 |
36,319 | $ | 13.27 | 36,319 | $ | 10,128,466 | ||||||||||
| December 1, 2014 - December 31, 2014 |
— | $ | — | — | $ | 10,610,497 | ||||||||||
| September 1, 2014 - November 30, 2014 |
327,820 | $ | 13.73 | 327,739 | $ | 610,497 | ||||||||||
| June 1, 2014 - August 31, 2014 |
80,500 | $ | 14.69 | 80,500 | $ | 5,109,643 | ||||||||||
| March 1, 2014 - May 31, 2014 |
58,051 | $ | 14.96 | 58,051 | $ | 6,292,433 | ||||||||||
| March 1, 2013 - February 28, 2014 |
120,014 | $ | 15.31 | 119,902 | $ | 7,160,849 | ||||||||||
| March 1, 2012 - February 28, 2013 |
— | $ | — | — | $ | 8,997,084 | ||||||||||
17
Table of Contents
Stock Performance Graph
The graph below matches our cumulative 5-year total shareholder return on common stock with the cumulative total returns of the S & P 500 index and the Russell 2000 index. The graph tracks the performance of a $100 investment in our common stock and in each of the indexes (with the reinvestment of all dividends) from February 28, 2010 to February 28, 2015.
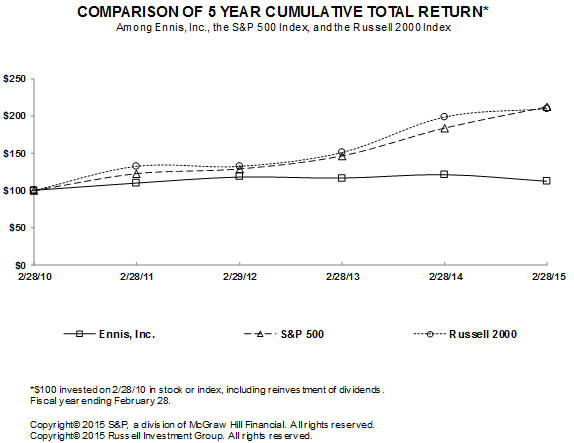
| 2010 | 2011 | 2012 | 2013 | 2014 | 2015 | |||||||||||||||||||
| Ennis, Inc. |
$ | 100.00 | $ | 109.70 | $ | 117.77 | $ | 116.41 | $ | 120.95 | $ | 112.10 | ||||||||||||
| S&P 500 |
100.00 | 122.57 | 128.86 | 146.20 | 183.29 | 211.71 | ||||||||||||||||||
| Russell 2000 |
100.00 | 132.60 | 132.39 | 150.95 | 198.59 | 209.78 | ||||||||||||||||||
The stock price performance included in this graph is not necessarily indicative of future stock price performance.
18
Table of Contents
| ITEM 6. | SELECTED FINANCIAL DATA |
The following selected financial data has been derived from our audited consolidated financial statements. Our consolidated financial statements and notes thereto as of February 28, 2015 and February 28, 2014, and for the three years in the period ended February 28, 2015, and the reports of Grant Thornton LLP are included in Item 15 of this Report. The selected financial data should be read in conjunction with Item 7 — “Management’s Discussion and Analysis of Financial Condition and Results of Operations” and the consolidated financial statements and notes thereto included in Item 15 of this Report.
| Fiscal Years Ended | ||||||||||||||||||||
| 2015 | 2014 | 2013 | 2012 | 2011 | ||||||||||||||||
| (Dollars and shares in thousands, except per share amounts) | ||||||||||||||||||||
| Operating results: |
||||||||||||||||||||
| Net sales |
$ | 580,240 | $ | 542,442 | $ | 533,506 | $ | 517,014 | $ | 549,999 | ||||||||||
| Gross profit margin |
145,476 | 143,793 | 124,152 | 130,513 | 154,498 | |||||||||||||||
| SG&A expenses |
89,926 | 86,677 | 83,757 | 78,962 | 83,678 | |||||||||||||||
| Impairment of goodwill and trademarks |
93,324 | 24,226 | — | — | — | |||||||||||||||
| Net earnings (loss) |
(44,533) | 13,189 | 24,715 | 31,358 | 44,631 | |||||||||||||||
| Net earnings - proforma* |
34,563 | 35,349 | 24,715 | 31,358 | 44,631 | |||||||||||||||
| Earnings (loss) and dividends per share: |
||||||||||||||||||||
| Basic |
$ | (1.72) | $ | 0.50 | $ | 0.95 | $ | 1.21 | $ | 1.73 | ||||||||||
| Diluted |
(1.72) | 0.50 | 0.95 | 1.21 | 1.72 | |||||||||||||||
| Diluted - proforma* |
1.34 | 1.35 | 0.95 | 1.21 | 1.72 | |||||||||||||||
| Dividends |
0.70 | 0.53 | 0.88 | 0.62 | 0.62 | |||||||||||||||
| Weighted average shares outstanding: |
||||||||||||||||||||
| Basic |
25,864 | 26,125 | 26,036 | 25,946 | 25,855 | |||||||||||||||
| Diluted |
25,864 | 26,146 | 26,053 | 25,968 | 25,888 | |||||||||||||||
| Financial Position: |
||||||||||||||||||||
| Working capital |
$ | 176,295 | $ | 172,266 | $ | 150,377 | $ | 168,969 | $ | 135,300 | ||||||||||
| Current assets |
216,542 | 214,143 | 193,416 | 219,210 | 182,398 | |||||||||||||||
| Total assets |
453,262 | 536,347 | 495,292 | 531,962 | 473,728 | |||||||||||||||
| Current liabilities |
40,247 | 41,877 | 43,039 | 50,241 | 47,098 | |||||||||||||||
| Long-term debt |
106,500 | 105,500 | 57,500 | 90,000 | 50,000 | |||||||||||||||
| Total liabilities |
168,582 | 173,412 | 134,076 | 172,087 | 126,045 | |||||||||||||||
| Shareholders’ equity |
284,680 | 362,935 | 361,216 | 359,875 | 347,683 | |||||||||||||||
| Current ratio |
5.38 to 1.0 | 5.11 to 1.0 | 4.49 to 1.0 | 4.36 to 1.0 | 3.87 to 1.0 | |||||||||||||||
| Long-term debt to equity ratio |
0.37 to 1.0 | 0.29 to 1.0 | 0.16 to 1.0 | 0.25 to 1.0 | 0.14 to 1.0 | |||||||||||||||
* Reconciliation of proforma net earnings (loss) and proforma diluted earnings (loss) per share, non-GAAP financial measures, to the most comparable GAAP measures (“As Reported”) (dollars in thousands, except per share):
| Fiscal year ended 2015 | Fiscal year ended 2014 | |||||||||||||||||||||||
| As Reported | Impairment | Proforma | As Reported | Impairment | Proforma | |||||||||||||||||||
| Earnings (loss) before income taxes |
$ | (39,133 | ) | $ | (93,324 | ) | $ | 54,191 | $ | 31,792 | $ | (24,226 | ) | $ | 56,018 | |||||||||
| Income tax expense (benefit) |
5,400 | (14,228 | ) | 19,628 | 18,603 | (2,066 | ) | 20,669 | ||||||||||||||||
|
|
|
|
|
|
|
|
|
|
|
|
|
|||||||||||||
| Net earnings (loss) |
(44,533 | ) | (79,096 | ) | 34,563 | 13,189 | (22,160 | ) | 35,349 | |||||||||||||||
|
|
|
|
|
|
|
|
|
|
|
|
|
|||||||||||||
| Diluted earnings (loss) per share |
$ | (1.72 | ) | $ | (3.06 | ) | $ | 1.34 | $ | 0.50 | $ | (0.85 | ) | $ | 1.35 | |||||||||
|
|
|
|
|
|
|
|
|
|
|
|
|
|||||||||||||
19
Table of Contents
| ITEM 7. | MANAGEMENT’S DISCUSSION AND ANALYSIS OF FINANCIAL CONDITION AND RESULTS OF OPERATIONS |
The Management’s Discussion and Analysis provides material historical and prospective disclosures intended to enable investors and other users to assess our financial condition and results of operations. Statements that are not historical are forward-looking and involve risk and uncertainties, including those discussed under the caption “Risk Factors” in Item 1A starting on page 8 of this Annual Report on Form 10-K and elsewhere in this Report. You should read this discussion and analysis in conjunction with our Consolidated Financial Statements and the related notes appearing elsewhere in this Report. The words “anticipate,” “preliminary,” “expect,” “believe,” “intend” and similar expressions identify forward-looking statements. We believe these forward-looking statements are based upon reasonable assumptions. All such statements involve risks and uncertainties, and as a result, actual results could differ materially from those projected, anticipated, or implied by these statements.
In view of such uncertainties, investors should not place undue reliance on our forward-looking statements since such statements may prove to be inaccurate and speak only as of the date when made. We undertake no obligation to publicly update or revise any forward-looking statements, whether as a result of new information, future events or otherwise.
This Management’s Discussion and Analysis includes the following sections:
| • | Overview – An overall discussion on our Company, the business challenges and opportunities we believe are key to our success, and our plans for facing these challenges. |
| • | Critical Accounting Policies and Estimates – A discussion of the accounting policies that require our most critical judgments and estimates. This discussion provides insight into the level of subjectivity, quality, and variability involved in these judgments and estimates. This section also provides a summary of recently adopted and recently issued accounting pronouncements that have or may materially affect our business. |
| • | Results of Operations – An analysis of our consolidated results of operations and segment results for the three years presented in our consolidated financial statements. This analysis discusses material trends within our business and provides important information necessary for an understanding of our operating results. |
| • | Liquidity and Capital Resources - An analysis of our cash flows and a discussion of our financial condition and contractual obligations. This section provides information necessary to evaluate our ability to generate cash and to meet existing and known future cash requirements over both the short and long term. |
References to 2015, 2014 and 2013 refer to the fiscal years ended February 28, 2015, February 28, 2014 and February 28, 2013, respectively.
Overview
The Company – Our management believes we are the largest provider of business forms, pressure-seal forms, labels, tags, envelopes, and presentation folders to independent distributors in the United States and are also one of the largest providers of blank t-shirts in North America to the activewear market. We operate in two reportable segments: Print and Apparel. For additional financial information concerning segment reporting, please see Note 13 of the Notes to the Consolidated Financial Statements beginning on page F-28.
Our Print Business Challenges – In our Print Segment, we are engaged in an industry undergoing significant changes. Technology advances have made electronic distribution of documents, internet hosting, digital printing and print-on-demand valid, cost-effective alternatives to traditional custom printed documents and customer communications. We face highly competitive conditions in an already over-supplied, price-competitive industry. Our challenges in the Print Segment of our business include the following:
Transformation of our portfolio of products – While traditional business documents are essential in order to conduct business, many are being replaced or devalued with advances in digital technologies, causing steady declines in
20
Table of Contents
demand for a portion of our current product line. Transforming our product offerings in order to continue to provide innovative, valuable solutions to our customers on a proactive basis will require us to make investments in new and existing technology and to develop key strategic business relationships, such as print-on-demand services and product offerings that assist customers in their transition to digital business environments. In addition, we will continue to look for new market opportunities and niches, such as the addition of our envelope offerings, addition of our tag offerings, addition of our Folder offerings, healthcare wristbands, secure document solutions, innovative in-mold label offerings and long-run integrated products with high color web printing that provide us with an opportunity for growth and differentiate us from our competition.
Excess production capacity and price competition within our industry – Paper mills continue to adjust production capacity through downtime and closures to attempt to keep supply in line with demand. Due to the limited number of paper mills, paper prices have been and are expected to remain fairly volatile. We have generally been able to pass through increased paper costs, although this can often take several quarters due to the custom nature of our products and/or contractual relationships with some of our customers. We will continue to focus our efforts on effectively managing and controlling our product costs to minimize these effects on our operational results, primarily through the use of forecasting, production and costing models.
Continued economic uncertainties and weather related issues – Decreased demand due to economic uncertainties and intensified price competition resulted in a decline in our revenue during fiscal year 2013 above historical averages. Unusual weather related issues during the fourth quarter of fiscal year 2014 and fiscal year 2015 caused our sales to be less than forecasted. We continue to focus on customer retention, expanding our growth targeted products and continuing to develop new market niches. In addition, we will continue to look for opportunities to expand our revenue base through justifiable acquisitions.
Our Apparel Business Challenges – In our apparel segment industry, our market niche is highly competitive and commodity driven. In the past, the domestic apparel industry was generally dominated by a limited number of companies. However, due to changes in regulations and trade agreements in the last few years, this industry has become more globalized and our core competition has now extended to other parts of the world, particularly Asia and Central America. While the domestic economic environment has improved somewhat in the last few years which has led to increased demand, demand remains overall rather lethargic and globalization has led to increased pricing pressures and direct importation by many screen-printers and big-box suppliers products that were once sourced domestically. New trade agreements like the recent agreement between Canada and Honduras, and the Trans-Pacific Partnership, which is currently being negotiated, could have significant impacts on our operations.
Our apparel products are subject to foreign competition, which had been subject to U.S. government domestic quota restrictions or import duties in the past – Foreign producers of apparel often have significant labor cost advantages. In the past few years, domestic quota restrictions were eliminated for basically all foreign countries, which significantly impacted domestic apparel producers. Today, import duties remain in place for these foreign countries, which tend to offset the significant labor cost advantages these countries have over domestic and NAFTA/CAFTA producers. Import protection afforded to domestic apparel producers has been, and is likely to remain, subject to considerable political considerations. Given the number of these foreign producers, any further elimination of import protections that protect domestic apparel producers could materially adversely affect Alstyle’s business. For further discussion on various trade agreements and their potential impact on our operations, see Item A. Risk Factors – “Our apparel products are subject to foreign competition, which had been subject to U.S. government domestic quota restrictions or import duties in the past” on page 11 of this Annual Report on Form 10-K.
In addition, many retailers have started to pre-approve many manufacturers. This has allowed screen-printers and big-box suppliers to use any supplier on a retailer’s pre-approved list without having to take full responsibility for the quality of products being shipped to the stores. As such, the overall quality of the product is a lesser concern to screen-printers and big-box suppliers. Alstyle believes its products to be some of the highest in the industry with respect to quality and color consistency. However, such quality comes at a cost which has become more difficult to recoup in today’s market. If retailers once again become concerned with the quality of the garments in their stores, as a means to differentiate themselves from the competition, it could benefit Alstyle.
In order to find their niche in a highly competitive and globalized environment, some of our customers and their customers have moved to alternative fabrics to differentiate themselves. While some smaller garments producers are
21
Table of Contents
able to change quickly as market demand changes on fabrics and colors, longer-run manufactures like Alstyle are not able to adjust as easily. However, Alstyle is currently working diligently on dealing with such changes in fabrics and fashions. However, such changes come with inherent risks.
The unusual domestic winter weather conditions at the end of last fiscal year and this fiscal year negatively impacted the already weak retail landscape, and definitely contributed to the softness in our Apparel sales during the current fiscal year. While we do believe the market improved some this fiscal year overall, the overall domestic retail environment continues to be extremely competitive and challenging from both a volume and pricing perspective. Globalization has become, and is expected to continue to be, and issue for American/NAFTA manufacturers, especially if agreements like TPP are enacted.
Cotton prices – Cotton is the single largest cost component in the cost of a t-shirt, As a result, our business may be affected significantly by dramatic movements in cotton prices. During the last 3 years plus, cotton pricing has been extremely volatile, increasing to historical highs, and falling back of late to levels closer to historical averages. The cost incurred for materials (i.e., yarn, thread, etc.) is capitalized into inventory and impacts the Company’s operating results as inventory is sold. This could take six months or longer after the materials are purchased, depending on inventory turns. Consequently, increases or decreases in cotton costs can significantly impact the Company’s operational results for many quarters. In addition, during the latter part of fiscal 2014 and into fiscal 2015, other input costs (i.e., dye and other chemicals cost, etc.) started to increase over comparable periods. This negatively impacted our reported margins, as selling prices were fairly contained given competitive pricing pressures in the marketplace. Cotton prices during the last six months or so have been declining. However, these lower costs due to inventory turns are only recently starting to have the slightest impact on our operational results. We expect to continue to realize the benefit of lower cotton pricing into fiscal 2016, and hope to also improve margins, unless competitive market pricing pressures negate the benefit of lower costs.
Agua Prieta manufacturing facility – The manufacturing facility in Agua Prieta, Mexico (“AP”) became operational in July 2011, and all production was transitioned from our Anaheim, CA (“Anaheim”) facility. Production levels at the plant are running at required levels to satisfy demand, but well below originally estimated levels. This is due to lower revenues, resulting from market softness, economic conditions and the previous non-competitive cost position of our finished goods inventory during fiscal year 2013. In addition, periodic disruptions in our labor/utility services impacted our past manufacturing through-put. While we do not foresee any obstacles to increasing production levels to coincide with increases in demand, current market conditions continue to limit our ability to do so. Without increases in production levels, we will not be able to realize the expected production efficiencies nor the cost savings originally planned for this plant, which will impact our ability to reach margins once envisioned.
Continued global economic uncertainties – The t-shirt marketplace is now much more globalized, and such globalization will continue as tariff restrictions are lifted and new trade agreements are entered into with other countries. Therefore, we are impacted by not only the volatility on our domestic economic climate, but the volatility in the international economic climate as well. While the domestic climate and economic recovery have strengthened, the recovery has not been as broad-based as recoveries in the past. Also, international markets of late have started to show increased volatility, which led to considerable strengthening of the dollar against other currencies. This tends to put more pressure on domestic manufacturers, due to lower demand, higher price of their products internationally and increased competition of foreign manufacturers. During fiscal years 2013, 2014 and 2015, the marketplace was extremely competitive. Prices continue to lower as manufacturers try to maintain certain volume levels. Due to these challenging times, we took an impairment charge to the value of our apparel assets on several occasions. We see a similar environment for fiscal 2016, as competitors, due to increased international competition and global instability, have already announced discounting programs to try to maintain their market share. We recently introduced new sales programs and entered into new sales channels; this should allow us to grow our revenue and improve our operating results. We believe to justify participation in the apparel industry we need to develop a product mix or industry position capable of sustaining adequate pricing mechanisms to generate an appropriate return to our shareholders. Although challenging given current industry dynamics, those efforts, as stated earlier, have been started. We feel we are in a better position today than in years past to deal with these challenges. However, if our new sales programs or channels are not successful or if discounting in the marketplace is deeper than expected, our operating results may be negatively impacted, requiring that we take further impairment charges in the future.
22
Table of Contents
Critical Accounting Policies and Estimates
In preparing our consolidated financial statements, we are required to make estimates and assumptions that affect the disclosures and reported amounts of assets and liabilities at the date of the consolidated financial statements and the reported amounts of revenues and expenses during the reporting period. We evaluate our estimates and judgments on an ongoing basis, including those related to allowance for doubtful receivables, inventory valuations, property, plant and equipment, intangible assets, pension plan obligations, accrued liabilities and income taxes. We base our estimates and judgments on historical experience and on various other factors that we believe to be reasonable under the circumstances. Actual results may differ materially from these estimates under different assumptions or conditions. We believe the following accounting policies are the most critical due to their effect on our more significant estimates and judgments used in preparation of our consolidated financial statements.
We maintain a defined benefit retirement plan (the “Pension Plan”) for employees. Included in our financial results are Pension Plan costs that are measured using actuarial valuations. The actuarial assumptions used may differ from actual results. As our Pension Plan assets are invested in marketable securities, fluctuations in market values could potentially impact our funding status and associated liability recorded.
Amounts allocated to intangibles (amortizable and non-amortizable) and goodwill are determined based on valuation analysis for our acquisitions. Amortizable intangibles are amortized over their expected useful lives. We evaluate these amounts periodically (at least once a year) to determine whether a triggering event has occurred during the year that would indicate potential impairment.
We exercise judgment in evaluating our indefinite and long-lived assets for impairment. We assess the impairment of indefinite-lived assets that include goodwill, trademarks and trade names at least annually or earlier if events or changes in circumstances indicate that the carrying value may not be recoverable. Such circumstances include: (1) a significant adverse change in legal factors or the business environment, or (2) other adverse changes in the assessment of future operations of the reporting unit. We test impairment at the reporting unit level, which we have determined is at the Print Segment and Apparel Segment level. In testing whether there is an impairment to goodwill we use a two-step approach. In step one, we compare the fair value of the reporting unit to which goodwill is assigned to its carrying value. If the estimated fair value of a reporting unit exceeds its carrying amount, then we conclude that no goodwill impairment has occurred and step two is not required. If the carrying amount of a reporting unit exceeds its estimated fair value, a potential impairment is indicated, and step two is performed. In step two, we compare the carrying amount of the reporting unit’s goodwill to its implied fair value. In calculating the implied fair value of reporting unit’s goodwill, the fair value of the reporting unit is allocated to all of the other assets and liabilities, including unrecognized intangible assets, of that reporting unit based on their fair values, similar to the allocation that occurs in a business combination. The excess of the fair value of a reporting unit over the amount assigned to its other assets and liabilities is the implied fair value of goodwill. If the carrying value of goodwill exceeds its implied fair value, an impairment charge is recognized in an amount equal to that excess. If the implied fair value of goodwill exceeds the carrying amount, goodwill is not impaired.
In estimating the fair value of reporting units, we make estimates and judgments about future cash flows and market valuations using a combination of income and market approaches, as appropriate. We primarily rely upon a discounted cash flow analysis, an income-based approach, which includes assumptions for, among others, discount rates, cash flow projections, growth rates and terminal value rates, all of which require various significant estimates and judgments. This type of analysis contains uncertainties because it requires management to make assumptions and apply judgment to estimate industry economic factors and the profitability of future business strategies. It is our policy to conduct impairment testing based on our current business strategy in light of present industry and economic conditions, as well as our future expectations. We have not made material changes in the accounting methodology we use to assess goodwill impairment during the past three years. Changes in the estimates, assumptions and other qualitative factors used to conduct goodwill impairment tests, including future cash flow projections, could indicate that our goodwill is impaired in future periods and result in a potentially material impairment of goodwill. During the preparation of the annual impairment analysis there were indicators that an impairment may exist with respect to the Company’s Apparel Segment. Therefore, the execution of the formal impairment analysis with respect to the Company’s Apparel Segment was accelerated. During the preparation of the impairment testing analysis on the Apparel Segment, an estimated impairment charge of $55.9 million to the Apparel Segment’s recorded goodwill, or
23
Table of Contents
100% of the recorded value of such goodwill prior to such impairment charge, reduced the carrying value to its estimated fair value.
To test impairment of acquired indefinite-lived intangible assets (i.e. trademarks and trade names), the fair values are estimated and compared to their carrying values. We recognize an impairment charge when the estimated fair value of the intangible asset is less than the carrying value. We estimate the fair value of trademarks and trade names based on an income-based approach – the relief from royalty method. This methodology assumes that, in lieu of ownership, a third party would be willing to pay a royalty in order to exploit the related benefits of these types of assets. This approach is dependent on a number of factors, including estimates of future growth and trends, royalty rates in the category of intellectual property, discount rates and other variables. For the indefinite-lived trademark/trade name impairment analysis conducted with respect to our Apparel Segment for fiscal year 2015, we concluded that we needed to take an estimated non-cash impairment charge of $37.4 million to trademarks related to our Apparel Segment, or approximately 74% of the recorded value of such trademarks prior to such impairment charge.
At February 28, 2015, our goodwill and other intangible assets were approximately $64.5 million and $76.2 million, respectively. The carrying value of invested capital for each reporting unit, before the aforementioned impairment charge, as compared to their fair value at November 30, 2014, the date of our annual impairment tests, was as follows:
Goodwill
| Reporting Unit |
Carrying Value of Invested Capital (before impairment charge) |
Fair Value of Invested Capital |
||||||
| Apparel |
$ | 243.1 million | $ | 116.0 million | ||||
| |
$ | 224.7 million | $ | 395.0 million | ||||
Trademarks/Trade names
| Reporting Unit |
Carrying Value of Invested Capital (before impairment charge) |
Fair Value of Invested Capital |
||||||
| Apparel |
$ | 50.5 million | $ | 13.1 million | ||||
| |
$ | 13.2 million | $ | 21.5 million | ||||
We believe our businesses will generate sufficient undiscounted cash flow to more than recover the investments we have made in property, plant and equipment, as well as other intangibles and long-lived assets recorded as a result of our acquisitions, absent some unforeseen occurrences or triggering events.
Revenue is generally recognized upon shipment of products. Net sales consist of gross sales invoiced to customers, less certain related charges, including discounts, returns and other allowances. Returns, discounts and other allowances have historically been insignificant. In some cases and upon customer request, we print and store custom print product for customer specified future delivery, generally within twelve months. In this case, risk of loss from obsolescence passes to the customer, the customer is invoiced under normal credit terms and revenue is recognized when manufacturing is complete. Approximately $13.7 million, $13.7 million, and $12.3 million of revenue were recognized under these agreements during fiscal years ended February 28, 2015 February 28, 2014, and February 28, 2013, respectively.
We maintain an allowance for doubtful receivables to reflect estimated losses resulting from the inability of customers to make required payments. On an on-going basis, we evaluate the collectability of accounts receivable based upon historical collection trends, current economic factors, and the assessment of the collectability of specific accounts. We evaluate the collectability of specific accounts using a combination of factors, including the age of the outstanding balances, evaluation of customers’ current and past financial condition and credit scores, recent payment history, current economic environment, discussions with our sales managers, and discussions with the customers directly.
24
Table of Contents
Our inventories are valued at the lower of cost or market. We regularly review inventory values on hand, using specific aging categories, and write down inventory deemed obsolete and/or slow-moving based on historical usage and estimated future usage to its estimated market value. As actual future demand or market conditions may vary from those projected by management, adjustments to inventory valuations may be required.
As part of the process of preparing our consolidated financial statements, we are required to estimate our income taxes in each jurisdiction in which we operate. This process involves estimating our actual current tax exposure together with assessing temporary differences resulting from different treatment of items for tax and accounting purposes. These differences result in deferred tax assets and liabilities, which are included in our consolidated balance sheets. We must then assess the likelihood that our deferred tax assets will be recovered based on our history of earnings expectations for future taxable income including taxable income in prior carry-back years, as well as future taxable income. To the extent we believe that recovery is not likely, we must establish a valuation allowance. To the extent we establish a valuation allowance, we must include an expense within the tax provision in the consolidated statements of earnings. In the event that actual results differ from these estimates, our provision for income taxes could be materially impacted.
In addition to the above, we also have to make assessments as to the adequacy of our accrued liabilities, more specifically our liabilities recorded in connection with our workers compensation and health insurance, as these plans are self-funded. To help us in this evaluation process, we routinely get outside third-party assessments of our potential liabilities under each plan.
In view of such uncertainties, investors should not place undue reliance on our forward-looking statements since such statements speak only as of the date when made. We undertake no obligation to publicly update or revise any forward-looking statements, whether as a result of new information, future events or otherwise.
Recent Accounting Pronouncements
In May 2014, the Financial Accounting Standards Board issued Accounting Standards Update No. 2014-09, “Revenue from Contracts with Customers (Topic 606)” (“ASU No. 2014-09”), which requires an entity to recognize revenue to depict the transfer of promised goods or services to customers in an amount that reflects the consideration to which it expects to be entitled in exchange for those goods or services. ASU No. 2014-09 supersedes most existing revenue recognition guidance in U.S. GAAP. This guidance is effective for annual reporting periods beginning after December 15, 2016, including interim periods within that reporting period, and early application is not permitted. The guidance permits the use of either the retrospective or cumulative effect transition method. The Company is evaluating the effect that ASU No. 2014-09 will have on its consolidated financial statements and related disclosures.
Results of Operations
The discussion that follows provides information which we believe is relevant to an understanding of our results of operations and financial condition. The discussion and analysis should be read in conjunction with the accompanying consolidated financial statements and notes thereto, which are incorporated herein by reference. This analysis is presented in the following sections:
| • | Consolidated Summary – This section provides an overview of our consolidated results of operations for fiscal years 2015, 2014 and 2013. |
| • | Segment Operating Results – This section provides an analysis of our net sales, gross profit margin and operating income by segment. |
25
Table of Contents
Consolidated Summary
| Consolidated Statements of Earnings - Data (Dollars in thousands) |
Fiscal Years Ended | |||||||||||||||||||||||
| 2015 | 2014 | 2013 | ||||||||||||||||||||||
| Net sales |
$ | 580,240 | 100.0 | % | $ | 542,442 | 100.0 | % | $ | 533,506 | 100.0 | % | ||||||||||||
| Cost of goods sold |
434,764 | 74.9 | 398,649 | 73.5 | 409,354 | 76.7 | ||||||||||||||||||
|
|
|
|
|
|
|
|
|
|
|
|
|
|||||||||||||
| Gross profit margin |
145,476 | 25.1 | 143,793 | 26.5 | 124,152 | 23.3 | ||||||||||||||||||
| Selling, general and administrative |
89,926 | 15.5 | 86,677 | 16.0 | 83,757 | 15.7 | ||||||||||||||||||
| Impairment of goodwill and trademarks |
93,324 | 16.1 | 24,226 | 4.5 | — | — | ||||||||||||||||||
| (Gain) loss from disposal of assets |
(58 | ) | — | (274 | ) | (0.1 | ) | 2 | — | |||||||||||||||
|
|
|
|
|
|
|
|
|
|
|
|
|
|||||||||||||
| Income (loss) from operations |
(37,716 | ) | (6.5 | ) | 33,164 | 6.1 | 40,393 | 7.6 | ||||||||||||||||
| Other expense, net |
(1,417 | ) | (0.2 | ) | (1,372 | ) | (0.3 | ) | (1,775 | ) | (0.4 | ) | ||||||||||||
|
|
|
|
|
|
|
|
|
|
|
|
|
|||||||||||||
| Earnings (loss) before income taxes |
(39,133 | ) | (6.7 | ) | 31,792 | 5.8 | 38,618 | 7.2 | ||||||||||||||||
| Provision for income taxes |
5,400 | 1.0 | 18,603 | 3.4 | 13,903 | 2.6 | ||||||||||||||||||
|
|
|
|
|
|
|
|
|
|
|
|
|
|||||||||||||
| Net earnings (loss) |
$ | (44,533 | ) | -7.7 | % | $ | 13,189 | 2.4 | % | $ | 24,715 | 4.6 | % | |||||||||||
|
|
|
|
|
|
|
|
|
|
|
|
|
|||||||||||||
| Proforma Earnings (Dollars in thousands) |
||||||||||||||||||||||||
| Income (loss) from operations - GAAP |
$ | (37,716 | ) | -6.5 | % | $ | 33,164 | 6.1 | % | $ | 40,393 | 7.6 | % | |||||||||||
| Impairment charge |
(93,324 | ) | (16.1 | ) | (24,226 | ) | (4.5 | ) | — | — | ||||||||||||||
|
|
|
|
|
|
|
|
|
|
|
|
|
|||||||||||||
| Income from operations, pre-impairment |
55,608 | 9.6 | 57,390 | 10.6 | 40,393 | 7.6 | ||||||||||||||||||
| Other expense, net |
(1,417 | ) | (0.2 | ) | (1,372 | ) | (0.3 | ) | (1,775 | ) | (0.4 | ) | ||||||||||||
|
|
|
|
|
|
|
|
|
|
|
|
|
|||||||||||||
| Earnings before income taxes |
54,191 | 9.4 | 56,018 | 10.3 | 38,618 | 7.2 | ||||||||||||||||||
| Provision for income taxes |
19,628 | 3.4 | 20,669 | 3.8 | 13,903 | 2.6 | ||||||||||||||||||
|
|
|
|
|
|
|
|
|
|
|
|
|
|||||||||||||
| Net earnings, pre-impairment |
$ | 34,563 | 6.0 | % | $ | 35,349 | 6.5 | % | $ | 24,715 | 4.6 | % | ||||||||||||
|
|
|
|
|
|
|
|
|
|
|
|
|
|||||||||||||
Net Sales. Our consolidated net sales increased from $542.4 million for the fiscal year ended February 28, 2014 to $580.2 million for the fiscal year ended February 28, 2015, an increase of 7.0%. During the year our Print sales increased $40.5 million, or 11.9%, while our Apparel sales decreased by $2.6 million or 1.3%. The increase in our Print sales related to the impact of our acquisitions, which added $58.3 million to our reported sales during the current year. Our apparel volume increased 0.5% for the year, but this increase was offset by a 1.3% decrease in our average selling price. While we were able to slightly increase our units sold this year over last, the apparel market continued to be extremely challenging both from a volume and pricing perspective. Competitor discounting and other market protection strategies, prevalent in the past, continued into this fiscal year as well. Increased international competition and international economic uncertainties put further strains on an already stressed domestic retail environment.
Our consolidated net sales increased from $533.5 million for the fiscal year ended February 29, 2013 to $542.4 million for the fiscal year ended February 28, 2014, or an increase of 1.7%. The increase in our sales for the year related primarily to the additional sales associated with the September 2013 acquisition of the Custom Envelope Division and Folder Express, which added $23.2 million in Print sales for the period. This increase was offset by a decline in our other print plant sales of $18.0 million.
Cost of Goods Sold. Our manufacturing costs increased by $36.2 million from $398.6 million for fiscal year 2014 to $434.8 million for fiscal year 2015, or 9.1%. Our gross profit margin (net sales less cost of goods sold) decreased from 26.5% for fiscal year 2014 to 25.1% for fiscal year 2015. Our print gross profit margin increased during the period due to lower input costs and improved operational efficiencies, but this was offset by higher input and higher manufacturing costs due to lower production volumes and lower selling prices in the apparel segment.
26
Table of Contents
Our manufacturing costs decreased by $10.8 million from $409.4 million for fiscal year 2013 to $398.6 million for fiscal year 2014, or 2.6.%. Our gross profit margin increased from 23.3% for fiscal year 2013 to 26.5% for fiscal year 2014 due to lower input costs and improved operational efficiencies in the print segment and lower raw material costs and improving production levels in our apparel segment during the period.
Selling, general, and administrative expenses. For fiscal year 2015, our selling, general and administrative (“SG&A”) expenses increased approximately $3.2 million, or 3.7% from $86.7 million, or 16.0% of sales for fiscal year 2014 to $89.9 million, or 15.5% of sales for fiscal year 2015. While on a percentage of sales basis our SG&A costs have declined from 16.0% for fiscal year 2014 to 15.5% for fiscal year 2015, on a dollar basis, as noted above, these expenses increased $3.2 million year over year. The increase in these expenses is primarily attributable to the print acquisitions completed during this fiscal year which added approximately $3.0 million in expenses. This was offset by a reduction in our bad debt provision this year due to improving trends of approximately $1.7 million. We expect to have these acquisitions fully integrated into our ERP system during fiscal year 2016. Once integrated, we expect to eliminate redundant legacy costs and expect that SG&A costs at these locations will be more in line with our historical norms.
For fiscal year 2014, our selling, general and administrative expenses increased approximately $2.9 million, or 3.5% from $83.8 million, or 15.7% of sales for fiscal year 2013 to $86.7 million, or 16.0% of sales for fiscal year 2014. The increase in our selling, general and administrative expenses on a dollar and percentage of sales basis is mainly due to the increase in our bad debt expense during fiscal 2014. Our provision during fiscal year 2014 was increased $2.3 million to cover the bankruptcy of several large apparel accounts.
Gain from disposal of assets. The gain from disposal of assets of $58,000 for fiscal year 2015 related primarily to the sale of manufacturing equipment. The gain from disposal of assets of $274,000 for fiscal year 2014 related primarily to the sale of our print facility located in San Antonio, Texas as well as the sale of miscellaneous manufacturing equipment.
Impairment of goodwill and trademarks. The goodwill impairment charge was primarily driven by continued marketplace pricing pressures and the challenging retail environment, which further negatively impacted our forecasted cash flows for our Apparel Segment. During the preparation of the annual impairment analysis there were indicators that an impairment may exist with respect to our Apparel Segment. As a result, after conducting our annual impairment testing and step two analysis relating to our Apparel Segment, we determined that an estimated impairment charge of $93.3 million, or approximately 88% (comprised of a $55.9 million, or 100% charge to goodwill and a $37.4 million, or approximately 74% charge to trademarks) was required to reduce the carrying values of the reporting unit assets to their fair values. After the completion of the final impairment analysis during the fourth quarter, no further impairment charge was deemed necessary.
The impact of higher cotton costs during fiscal 2012 and 2013 on the cost of our apparel finished goods inventory, coupled with an extremely challenging economic landscape during fiscal years 2012, 2013 and 2014, negatively impacted the forecasted cash flows of our Apparel segment. As a result, after conducting our annual impairment testing for fiscal year 2014, it was determined that an impairment charge of $24.2 million ($18.6 million to goodwill and $5.6 million to trademarks) was required to reduce the carrying value of our Apparel reporting unit assets to their fair value at that time.
Income (loss) from operations. Our income (loss) from operations for fiscal year 2015 was $(37.7) million or (6.5)% of sales, as compared to $33.2 million, or 6.1% of sales for fiscal year 2014. The decrease in our income (loss) from operations during fiscal year 2015 resulted primarily from the non-cash impairment charge of $93.3 million to goodwill and trademarks. Excluding the impairment charges in both fiscal years 2015 and 2014, our Non-GAAP income from operations would have been $55.6 million, or 9.6% of sales for fiscal year 2015 and $57.4 million, or 10.6% of sales for fiscal year 2014.
Our income from operations for fiscal year 2014 decreased $7.2 million, from income from operations of $40.4 million, or 7.6% of sales for fiscal year 2013, to $33.2 million, or 6.1% of sales for fiscal year 2014. The decrease in our income from operations during fiscal year 2014 resulted primarily from the non-cash impairment charge of $24.2
27
Table of Contents
million to goodwill and trademarks. Excluding the impairment charge, our income from operations would have been $57.4 million, or 10.6% of sales, an increase over the comparable period last year of $17.0 million, or 42.1%.
Other income and expense. Our interest expense was $2.0 million, $1.3 million and $1.5 million for fiscal years 2015, 2014 and 2013, respectively. The increase in our interest expense in fiscal year 2015 over fiscal year 2014 is attributable to having more debt outstanding on average due to acquisitions completed at the end of last fiscal year and at the beginning of this fiscal year. The decrease in our interest expense in fiscal year 2014 over fiscal year 2013 was attributable to a lower effective borrowing rate.
Provision for income taxes. Our effective tax rates for fiscal years 2015, 2014 and 2013 were (13.8)%, 58.5% and 36.0%, respectively. The fluctuations in our effective tax rate for the indicated fiscal years was due to the impact of non-deductible goodwill impairment charges of $55.9 million and $18.6 million in fiscal years 2015 and 2014 and a trademarks impairment charge of $37.4 million in fiscal year 2015.
Net earnings. Due to the above factors, our net earnings (loss) decreased from $13.2 million, or 2.4% of sales for fiscal year 2014, to a loss of $(44.5) million, or (7.7)% of sales for fiscal year 2015. Basic and diluted earnings (loss) per share decreased from earnings of $0.50 per share for fiscal year 2014 to a loss of $(1.72) per share for fiscal year 2015. Excluding the impairment charges in both fiscal year 2015 and 2014 relating to our Apparel segment, our earnings would have been approximately $34.6 million, or $1.34 per diluted share for fiscal 2015 as compared to $35.3 million or $1.35 per diluted share for fiscal 2014.
Our net earnings decreased from $24.7 million, or 4.6% of sales for fiscal year 2013 to earnings of $13.2 million, or 2.4% of sales for fiscal year 2014. Basic and diluted earnings per share decreased from earnings of $0.95 per share for fiscal year 2013 to earnings of $0.50 per share for fiscal year 2014. Excluding the impairment charge relating to our Apparel segment, our earnings for the year would have been approximately $35.3 million, or $1.35 per diluted share, or an increase of 42.1%.
Segment Operating Results
| Fiscal Years Ended | ||||||||||||
| Net Sales by Segment (in thousands) |
2015 | 2014 | 2013 | |||||||||
| |
$ | 380,379 | $ | 339,947 | $ | 334,701 | ||||||
| Apparel |
199,861 | 202,495 | 198,805 | |||||||||
|
|
|
|
|
|
|
|||||||
| Total |
$ | 580,240 | $ | 542,442 | $ | 533,506 | ||||||
|
|
|
|
|
|
|
|||||||
Print Segment. The print segment net sales represented 66%, 63%, and 63% of our consolidated net sales for fiscal years 2015, 2014 and 2013, respectively.
Our net print sales increased by $40.5 million, or 11.9% during fiscal year 2015, from $339.9 million in fiscal year 2014 to $380.4 million in fiscal year 2015. The increase in our print sales for the year was as a result of our recent acquisitions which added approximately $58.3 million in sales. This increase was offset by a net decline of $17.8 million in sales at our other print locations due to normal print attrition, this years’ winter weather dynamics and overall an anemic broad-based economic environment.
Our net print sales increased by $5.2 million, or 1.6% during fiscal year 2014, from $334.7 million in fiscal year 2013 to $339.9 million in fiscal year 2014. The increase in our print sales for the year was as a result of the acquisitions of Custom Envelope Division and Folder Express which added approximately $23.2 million in sales. This increase was offset by a net decline in sales at our other print locations, which related primarily to the following: (i) the severe winter weather which impacted the economy across the country (ii) a continued decline in traditional long-run business due to a combined transition away from continuous forms and increased competition from major competitors (i.e. R.R. Donnelley, Standard Register, etc.); and (iii) normal transition of business loss associated with acquired businesses, either due to pricing (see following), concentration of business, or other factors. In connection with acquisitions, as we implement our ERP system at plants, we often-times experience some sales decline merely due to the fact that we are better able to align pricing to market and the value offered to the end use customer. The offset to this is that we, for the most part, see operational margin improvements.
28
Table of Contents
Apparel Segment. The apparel segment net sales represented 34%, 37%, and 37% of our consolidated net sales for fiscal years 2015, 2014 and 2013, respectively.
Our fiscal year 2015 net apparel sales decreased by $2.6 million, or 1.3% over fiscal year 2014. Our apparel unit volume was up 0.5% for fiscal 2015, which was offset by a decline in our average selling price of 1.3% for the year. Apparel Segment sales continue to be impacted by a rather anemic non-broad based domestic economic recovery, which impacts the lower domestic retail environment. In addition, increased international competition due to relaxed import restrictions and favorable trade agreements has increased the competitive landscape of an already competitive domestic retail marketplace. This environment has made it extremely difficult for us to grow sales at reasonable costs and to raise prices for any increases in our input costs. To offset this, this fiscal year we introduced new sales programs and entered into new sales channels that should allow us to grow our revenue, or at least improve our operating results. This will require moving some of our current capacity from producing commodity-type, low margin products, formally our bread and butter, to custom, high quality products and customer-branded products. However, whether we will be successful in these endeavors is unknown at this point.
Our fiscal year 2014 net apparel sales increased by $3.7 million, or 1.9% over fiscal year 2013. Our apparel unit volume was up 7.5% for fiscal 2014, which was partially offset by a decline in our average selling price of 5.6% for the year. Even with the decline in our selling price, our apparel results continued to show improvement on a comparable basis throughout fiscal year 2014, due to increased volumes and lower input costs. However, the positive impact of lower raw material costs over last fiscal year had all but abated. While our finished good pricing allowed us to be more competitive in fiscal year 2014 and while we continued to make cost-side improvements, the apparel market continued to be extremely challenging, both from a volume and pricing perspective. Apparel volumes during the latter half of last fiscal year continued to be softer than expected, especially on the East Coast and in the Mid-West. We attributed this weakness to the extreme winter weather conditions experienced across the country in fiscal year 2014. This market softness and the continued rather anemic and non-broad based economic recovery, led to a continued market softness and the prevalence of pricing pressures in the marketplace.
| Fiscal Years Ended | ||||||||||||
| Gross Profit by Segment (in thousands) |
2015 | 2014 | 2013 | |||||||||
| |
$ | 115,071 | $ | 101,040 | $ | 97,830 | ||||||
| Apparel |
30,405 | 42,753 | 26,322 | |||||||||
|
|
|
|
|
|
|
|||||||
| Total |
$ | 145,476 | $ | 143,793 | $ | 124,152 | ||||||
|
|
|
|
|
|
|
|||||||
Print Segment. Our print gross profit margin (“margin”), as a percent of sales, was 30.3%, 29.7% and 29.2% for fiscal years 2015, 2014 and 2013, respectively. Our print margins increased $14.1 million, from $101.0 million in fiscal year 2014, or 29.7% of net sales, to $115.1 million in fiscal year 2015, or 30.3% of net sales. Our Print margins increased $3.2 million, from $97.8 million in fiscal year 2013, or 29.2% of net sales, to $101.0 million in fiscal year 2014, or 29.7% of net sales. The improvement in our Print margins during the periods relates primarily to our continued ability to drive out operational costs at our acquisition plants after we have converted them to our ERP systems and into our planning processes. While many times we are able to bring significant costs savings initially, additional costs savings are generally realized for years to come as our systems are integrated and personnel at the acquired plants become more and more adept at using the operational information provided.
Apparel Segment. Our apparel gross profit margin, as a percent of sales, was 15.2%, 21.1% and 13.2%, for fiscal years 2015, 2014 and 2013, respectively.
Our apparel margin decreased $12.5 million, from $42.8 million in fiscal year 2014, or 21.1% of net sales, to $30.4 million in fiscal year 2015, or 15.2% of net sales. Our apparel margin was negatively impacted by higher input costs associated with dyes and chemicals throughout most of the year, lower selling prices due to continued marketplace selling pressures, lower manufacturing efficiencies due to lower production volumes and most recently the introduction of new manufactured products relating to new sales initiatives with lower production efficiencies than those of mature products. As mentioned above, our strategic plan is to augment some of our high volume, low margin commodity-type production capacity with custom, high quality production. Hopefully this will translate over time to improved operating margins, but with any new process, there will be initial manufacturing inefficiencies due to increased manufacturing complexities. However, we feel in the long run this will provide us with added avenues for
29
Table of Contents
revenue expansion and will hopefully help insulate our operational results from the sometime illogical actions of the pure commodity players.
Our apparel margin increased $16.4 million, from $26.3 million in fiscal year 2013, or 13.2% of net sales, to $42.7 million in fiscal year 2014, or 21.1% of net sales. Our margins during fiscal year 2014 benefited from lower input costs and reduced operational costs due to higher production levels. The positive impact of lower raw material costs on our operations all but abated by the end of fiscal year 2014.
| Fiscal Years Ended | ||||||||||||
| Profit by Segment (in thousands) |
2015 | 2014 | 2013 | |||||||||
| |
$ | 66,374 | $ | 57,390 | $ | 54,224 | ||||||
| Apparel |
(89,632 | ) | (9,467 | ) | 247 | |||||||
|
|
|
|
|
|
|
|||||||
| Total |
(23,258 | ) | 47,923 | 54,471 | ||||||||
| Less corporate expenses |
15,875 | 16,131 | 15,853 | |||||||||
|
|
|
|
|
|
|
|||||||
| Earnings before income taxes |
$ | (39,133 | ) | $ | 31,792 | $ | 38,618 | |||||
|
|
|
|
|
|
|
|||||||
Print Segment. As a percent of sales, our print profits were 17.4%, 16.9%, and 16.2% for fiscal years 2015, 2014 and 2013, respectively. Our print profit increased for fiscal year 2015 from $57.4 million in fiscal year 2014 to $66.4 million in fiscal year 2015. This related primarily to the addition of our fiscal year 2015 acquisitions. Our print profit increased for fiscal year 2014 from $54.2 million in fiscal year 2013 to $57.4 million in fiscal year 2014. This related primarily to the addition of our fiscal year 2014 acquisitions.
Apparel Segment. During the third quarter of fiscal year ended 2015 we recorded a non-cash impairment charge of $93.3 million (comprised of a $55.9 million, or 100% charge to goodwill and a $37.4 million, or approximately 74% charge to trademarks). During the fourth quarter of fiscal year ended 2014 we recorded a non-cash impairment charge of $24.2 million ($18.6 million to goodwill and $5.6 million to trademarks). Our Apparel profits absent these charges for the last 3 fiscal years would have been as follows: $3.7 million – 2015, $14.7 million – 2014, and $0.2 million – 2013. As a percent of sales, our Apparel pre-impairment profits were 1.8%, 7.3%, and 0.1% for fiscal years 2015, 2014 and 2013, respectively. Our Apparel Segment continues to be impacted by the rather weak domestic retail environment, marketplace pricing pressures and increased international competition due to relaxed import restrictions. The movement in our Apparel profits, excluding the impairment charge, for fiscal years 2015, 2014 and 2013 all relates to movements in our realized gross profit margins which have been directly impacted by competitive pricing pressures, increased international competition, either increases or decreases in input costs, and manufacturing efficiencies or inefficiencies during each of the respective years.
Liquidity and Capital Resources
| Fiscal Years Ended | ||||||||
| (Dollars in thousands) |
2015 | 2014 | ||||||
| Working Capital |
$ | 176,295 | $ | 172,266 | ||||
| Cash |
$ | 15,346 | $ | 5,316 | ||||
Working Capital. Our working capital increased by approximately $4.0 million, or 2.3%, from $172.3 million at February 28, 2014 to $176.3 million at February 28, 2015. Our current ratio, calculated by dividing our current assets by our current liabilities, increased from 5.1-to-1.0 for fiscal year 2014 to 5.4-to-1.0 for fiscal year 2015. The increase in our working capital related primarily to an increase in our cash of $10.0 million, an increase of our prepaid income taxes of $2.6 million and a decrease in our accounts payable and employee compensation and benefits of $1.3 million. These increases were offset by a decrease in our inventory of $10.3 million (decrease of $15.4 million in our apparel inventory offset by an increase in our Print inventory due to recent acquisitions).
30
Table of Contents
Cash Flow Components
| Fiscal Years Ended | ||||||||
| (Dollars in thousands) |
2015 | 2014 | ||||||
| Net Cash provided by operating activities |
$ | 65,269 | $ | 32,755 | ||||
| Net Cash used in investing activities |
$ | (29,410 | ) | $ | (65,511 | ) | ||
| Net Cash provided by (used in) financing activities |
$ | (24,277 | ) | $ | 32,508 | |||
Cash flows from operating activities. Net cash provided by operating activities was $65.3 million for fiscal 2015 compared to $32.8 million for fiscal year 2014 and $50.0 million for fiscal year 2013, or an increase of $32.5 million in 2015 and a decrease of $17.2 million in 2014 over the previous period. The increase in cash provided during fiscal year 2015 related primarily from: (i) $5.7 million more in cash provided through the collection of accounts receivable and (ii) $29.3 million in less cash used through the reduction of our inventories. Cash provided was offset by an increase of our prepaid expenses of $6.4 million. The decrease in cash provided during fiscal year 2014 related primarily from: (i) $34.7 million more in cash used for inventory and (ii) $3.6 million in cash used to reduce our pension liability. These uses were offset in part by: (i) an additional $15.0 million in pre-impairment/pre-bad debt earnings during the year; (ii) $2.4 million less cash used on accounts payable and accrued expenses; and (iii) $2.6 million in cash provided by a reduction in our prepaid expenses.
Cash flows from investing activities. Net cash used in investing activities was $29.4 million in fiscal year 2015, primarily resulting from: (i) $27.1 million of cash consideration paid for the acquisitions of Sovereign Business Forms and Kay Toledo; and (ii) capital expenditures of $2.5 million. These uses were offset in part by the proceeds received from the sale of property, plant and equipment during the period. Net cash used in investing activities was $65.5 million in fiscal year 2014, primarily resulting from: (i) $61.9 million of cash consideration paid for the acquisitions of NIC, Wisco and Folder Express; and (ii) capital expenditures of $4.6 million. These uses were offset in part by the proceeds received from the sale of property, plant and equipment during the period.
Cash flows from financing activities. Net cash used by financing activities was $24.3 million in fiscal year 2015 compared to cash provided of $32.5 million in fiscal year 2014, or a net change of $56.8 million. During fiscal year 2015, we borrowed net cash of $1.0 from our revolving credit facility (borrowed an additional $26.0 million and paid down $25.0 million). We used $18.2 million in cash for dividends. In addition, we repurchased $7.0 million of our common stock under the board-approved repurchase program as compared to $1.8 million repurchased in fiscal year 2014. Net cash provided by financing activities was $32.5 million in fiscal year 2014 compared to a use of cash of $55.2 million in fiscal year 2013, or a net change of $87.7 million. During fiscal year 2014, we borrowed net cash of $48.0 from our revolving credit facility to finance our acquisition activity and we used $13.8 million in cash for dividends. In addition, we received $.1 million in cash from the exercise of stock options during the year.
Stock Repurchase – On October 20, 2008, our Board of Directors authorized the repurchase of up to $5.0 million of our common stock through a stock repurchase program. Under the board-approved repurchase program, share purchases may be made from time to time in the open market or through privately negotiated transactions depending on market conditions, share price, trading volume and other factors, and such purchases, if any, will be made in accordance with applicable insider trading and other securities laws and regulations. These repurchases may be commenced or suspended at any time or from time to time without prior notice. On April 20, 2012, the Board increased the authorized amount available to repurchase our shares by an additional $5.0 million, bringing the total available to repurchase our common stock at that time to approximately $9.0 million. On December 19, 2014, the Board increased the authorized amount available to repurchase our shares by an additional $10.0 million, bringing the total approved to $20.0 million and leaving approximately $10.1 million available to repurchase currently. During fiscal year 2015, we repurchased 502,609 shares of our common stock at an average price per share of $13.99. We have repurchased a total of 718,511 shares of our common stock since the inception of the program at an average price of $13.74 per share. Unrelated to the stock repurchase program, we purchased 81, 112 and 175 shares of common stock during the fiscal years ended February 28, 2015, February 28, 2014 and February 28, 2013, respectively.
Credit Facility – On September 19, 2013, we entered into the Third Amendment and Consent to Second Amended and Restated Credit Agreement (the “Agreement”) with a syndicate of lenders led by Bank of America, N.A. (the “Facility”). The Amendment amends and restates the financial covenant relating to Minimum Tangible Net Worth. The amended covenant requires a Minimum Tangible Net Worth of $100 million, with step-ups equal to 25% of consolidated net income. The Facility provides us access to $150.0 million in revolving credit, which we may increase
31
Table of Contents
to $200.0 million in certain circumstances, and matures on August 18, 2016. The Facility bears interest at the London Interbank Offered Rate (“LIBOR”) plus a spread ranging from 1.0% to 2.25% (LIBOR + 1.5% or 1.75% at February 28, 2015 and 1.7% at February 28, 2014), depending on our ratio of total funded debt to the sum of net earnings plus interest, tax, depreciation and amortization (“EBITDA”). As of February 28, 2015, we had $106.5 million of borrowings under the revolving credit line and $2.8 million outstanding under standby letters of credit arrangements, leaving us availability of approximately $40.7 million. The Facility contains financial covenants, restrictions on capital expenditures, acquisitions, asset dispositions, and additional debt, as well as other customary covenants, such as our minimum tangible equity level and total funded debt to EBITDA ratio. We were in compliance with all these covenants as of February 28, 2015. The Facility is secured by substantially all of our domestic assets as well as all capital securities of each of the Company’s U.S. subsidiaries and 65% of all capital securities of each of the Company’s direct foreign subsidiaries.
During fiscal year 2015, we borrowed $26.0 million, and we paid down an additional $25.0 million on the revolving credit line. It is anticipated that the available line of credit is sufficient to cover, should it be required, our working capital needs for the foreseeable future.
Pension Plan – We are required to make contributions to our Pension Plan. These contributions are required under the minimum funding requirements of the Employee Retirement Income Security Act of 1974 (“ERISA”). Due to the recent enactment of the Moving Ahead for Progress in the 21st Century (MAP-21) in July 2012, plan sponsors can calculate the discount rate used to measure the Pension Plan liability using a 25-year average of interest rates plus or minus a corridor. Prior to MAP-21, the discount rate used in measuring the pension liability was based on the 24-month average of interest rates. We anticipate that we will contribute from $2.0 million to $3.0 million during fiscal year 2016. We made contributions of $3.0 million to our Pension Plan during each of our last 3 fiscal years. As our Pension Plan assets are invested in marketable securities, fluctuations in market values could potentially impact our funded status, associated liabilities recorded and future required minimum contributions. At February 28, 2015, we had an unfunded pension liability recorded on our balance sheet of $9.9 million. During the current fiscal year we reduced the discount rate we used to calculate our pension liability to 4.0%, which added approximately $7.3 million to our recorded pension liability (each 10 basis point change in the discount rate potentially impacts our computed pension liability by approximately $800,000). In addition, we adopted the new RP-2014 mortality tables, issued by the Society of Actuaries in October 2014, which added approximately $3.7 million to our recorded pension liability. The updated mortality assumptions, based upon our mix of blue collar and white collar participants, reflects longer life expectations compared to previous mortality assumptions.
Inventories – We believe our current inventory levels are sufficient to satisfy our customer demands and we anticipate having adequate sources of raw materials to meet future business requirements. We have long-term contracts in effect with paper and yarn suppliers that govern prices, but do not require minimum purchase commitments. Certain of our rebate programs do, however, require minimum purchase volumes. Management anticipates meeting the required volumes.
Capital Expenditures – We expect our capital expenditure requirements for fiscal year 2016, exclusive of capital required for possible acquisitions, will be in line with our historical levels of between $4.0 million and $5.0 million. We expect to fund these expenditures through existing cash flows. We expect to generate sufficient cash flows from our operating activities to cover our operating and other normal capital requirements for the foreseeable future.
32
Table of Contents
Contractual Obligations & Off-Balance Sheet Arrangements – There have been no significant changes in our contractual obligations since February 28, 2014 that have, or are reasonably likely to have, a material impact on our results of operations or financial condition. We had no off-balance sheet arrangements in place as of February 28, 2015. The following table represents our contractual commitments as of February 28, 2015 (in thousands).
| Total | 2016 | 2017 | 2018 | 2019 | 2020 to 2025 |
|||||||||||||||||||
| Debt: |
||||||||||||||||||||||||
| Revolving credit facility |
$ | 106,500 | $ | — | $ | 106,500 | $ | — | $ | — | $ | — | ||||||||||||
| Other contractual commitments: |
||||||||||||||||||||||||
| Estimated pension benefit payments |
34,900 | 3,500 | 3,600 | 3,700 | 3,800 | 20,300 | ||||||||||||||||||
| Letters of credit |
2,792 | 2,792 | — | — | — | — | ||||||||||||||||||
| Operating leases |
11,624 | 5,943 | 3,623 | 1,759 | 265 | 34 | ||||||||||||||||||
|
|
|
|
|
|
|
|
|
|
|
|
|
|||||||||||||
| Total other contractual commitments |
49,316 | 12,235 | 7,223 | 5,459 | 4,065 | 20,334 | ||||||||||||||||||
|
|
|
|
|
|
|
|
|
|
|
|
|
|||||||||||||
| Total |
$ | 155,816 | $ | 12,235 | $ | 113,723 | $ | 5,459 | $ | 4,065 | $ | 20,334 | ||||||||||||
|
|
|
|
|
|
|
|
|
|
|
|
|
|||||||||||||
Subsequent to February 28, 2015 and through May 8, 2015, we paid down an additional $10.0 million on our revolving credit facility. We expect future interest payments of $1.7 million for next fiscal year through February 29, 2016, and $0.8 million for fiscal year ending February 28, 2017, assuming interest rates and debt levels remain the same throughout the remaining term of the facility.
| ITEM 7A. | QUANTITATIVE AND QUALITATIVE DISCLOSURES ABOUT MARKET RISK |
Market Risk
Interest Rates
We are exposed to interest rate risk on short-term and long-term financial instruments carrying variable interest rates. We may from time to time utilize interest rate swaps to manage overall borrowing costs and reduce exposure to adverse fluctuations in interest rates. We do not use derivative instruments for trading purposes. Our variable rate financial instruments totaled $106.5 million at February 28, 2015 and is subject to fluctuations in the LIBOR rate. The impact on our results of operations of a one-point interest rate change on the outstanding balance of the variable rate financial instruments as of February 28, 2015 would be approximately $1.1 million.
Foreign Exchange
We have global operations and thus make investments and enter into transactions in various foreign currencies. The value of our consolidated assets and liabilities located outside the United States (translated at period end exchange rates) and income and expenses (translated using average rates prevailing during the period), generally denominated in Pesos and Canadian Dollars, are affected by the translation into our reporting currency (the U.S. Dollar). Such translation adjustments are reported as a separate component of consolidated statements of comprehensive income. In future periods, foreign exchange rate fluctuations could have an increased impact on our reported results of operations. A sensitivity analysis to changes in the value of U.S. dollar on foreign currency denominated investments and monetary assets and liabilities indicated that if the U.S. dollar uniformly strengthened by 10% against all currency exposures of the Company at February 28, 2015, the decrease in fair value and results of operations would be approximately $0.3 million.
This market risk discussion contains forward-looking statements. Actual results may differ materially from this discussion based upon general market conditions and changes in domestic and global financial markets.
| ITEM 8. | CONSOLIDATED FINANCIAL STATEMENTS AND SUPPLEMENTARY DATA |
Our Consolidated Financial Statements and Supplementary Data required by this Item 8 are set forth following the signature page of this report and are incorporated herein by reference.
33
Table of Contents
| ITEM 9. | CHANGES IN AND DISAGREEMENTS WITH ACCOUNTANTS ON ACCOUNTING AND FINANCIAL DISCLOSURE |
No matter requires disclosure.
| ITEM 9A. | CONTROLS AND PROCEDURES |
Disclosure Controls and Procedures
A review and evaluation was carried out under the supervision and with the participation of our management, including our Chief Executive Officer and our Chief Financial Officer, of the effectiveness of the design and operation of our “disclosure controls and procedures” (as such term is defined in Rules 13a-15(e) and 15d-15(e) of the Exchange Act of 1934, as amended (the “Exchange Act”)) as of February 28, 2015. In conducting our evaluation of the effectiveness of internal control over financial reporting, we have excluded the assets and liabilities and results of operations of Kay Toledo, which we acquired on December 31, 2014, in accordance with the Securities and Exchange Commission’s guidance concerning the reporting of internal controls over financial reporting in connection with a material acquisition. The assets and revenues resulting from this acquisition constituted approximately 5 and 1 percent, respectively, of the related consolidated financial statement amounts as of and for the year ended February 28, 2015. Based upon that review and evaluation, we have concluded that our disclosure controls and procedures were effective as of February 28, 2015.
Management’s Report on Internal Control over Financial Reporting
The financial statements, financial analysis and all other information in this Annual Report on Form 10-K were prepared by management, who is responsible for their integrity and objectivity and for establishing and maintaining adequate internal controls over financial reporting.
The Company’s internal control over financial reporting is designed to provide reasonable assurance regarding the reliability of financial reporting and the preparation of financial statements for external purposes in accordance with accounting principles generally accepted in the United States of America. The Company’s internal control over financial reporting includes those policies and procedures that:
| i. | Pertain to the maintenance of records that, in reasonable detail, accurately and fairly reflect the transactions and dispositions of assets of the Company; |
| ii. | Provide reasonable assurance that transactions are recorded as necessary to permit preparation of financial statements in accordance with generally accepted accounting principles, and that receipts and expenditures of the Company are being made only in accordance with authorizations of management and directors of the Company; and |
| iii. | Provide reasonable assurance regarding prevention or timely detection of unauthorized acquisition, use, or dispositions of the Company’s assets that could have a material effect on the financial statements. |
There are inherent limitations in the effectiveness of any internal control, including the possibility of human error and the circumvention or overriding of controls. Accordingly, even effective internal controls can provide only reasonable assurances with respect to financial statement preparation. Further, because of changes in conditions, the effectiveness of internal controls may vary over time.
Management assessed the design and effectiveness of the Company’s internal control over financial reporting as of February 28, 2015. In making this assessment, management used the criteria set forth by the Committee of Sponsoring Organizations of the Treadway Commission (“COSO”) in the 2013 Internal Control—Integrated Framework (“2013 COSO framework”). In conducting our evaluation of the effectiveness of internal control over financial reporting, we have excluded the assets and liabilities and results of operations of Kay Toledo, which we acquired on December 31, 2014, in accordance with the Securities and Exchange Commission’s guidance concerning the reporting of internal controls over financial reporting in connection with a material acquisition. The assets and revenues resulting from this acquisition constituted approximately 5 and 1 percent, respectively, of the related consolidated financial statement amounts as of and for the year ended February 28, 2015. Based on management’s assessment using those criteria, we believe that, as of February 28, 2015, the Company’s internal control over financial reporting is effective.
34
Table of Contents
Changes in Internal Controls
The Company has completed a transition to the new 2013 COSO framework by performing an assessment of our Internal Control over financial reporting and reviewing compliance with the 17 principles outlined by the 2013 COSO framework. Compliance with the 2013 COSO framework was obtained through enhancing our control documentation, because all of the procedures that were added to our controls documentation were procedures already in place at the Company and have been and continue to be part of our day-to-day operations.
There were no changes in our internal control over financial reporting identified in connection with the evaluation required by paragraph (d) of Exchange Act Rules 13a-15 or 15d-15 that occurred during our last fiscal quarter that have materially affected, or are reasonably likely to materially affect, our internal control over financial reporting.
Grant Thornton LLP, an independent registered public accounting firm, has audited the consolidated financial statements of the Company for the fiscal year ended February 28, 2015 and has attested to the effectiveness of the Company’s internal control over financial reporting as of February 28, 2015. Their report on the effectiveness of internal control over financial reporting is presented on page F-3 of this Annual Report on Form 10-K.
| ITEM 9B. | OTHER INFORMATION |
No matter requires disclosure.
| ITEM 10. | DIRECTORS, EXECUTIVE OFFICERS AND CORPORATE GOVERNANCE |
Except as set forth below, the information required by Item 10 is incorporated herein by reference to the definitive Proxy Statement for our 2015 Annual Meeting of Shareholders.
The Securities and Exchange Commission and the New York Stock Exchange have issued multiple regulations requiring policies and procedures in the corporate governance area. In complying with these regulations, it has been the goal of the Company’s Board of Directors and senior leadership to do so in a way which does not inhibit or constrain Ennis’ unique culture, and which does not unduly impose a bureaucracy of forms and checklists. Accordingly, formal, written policies and procedures have been adopted in the simplest possible way, consistent with legal requirements, including a Code of Ethics applicable to the Company’s principal executive officer, principal financial officer, and principal accounting officer or controller. The Company’s Corporate Governance Guidelines, its charters for each of its Audit, Compensation, Nominating and Corporate Governance Committees and its Code of Ethics covering all Employees are available on the Company’s website, www.ennis.com, and a copy will be mailed upon request to Investor Relations at 2441 Presidential Parkway, Midlothian, TX 76065. If we make any substantive amendments to the Code, or grant any waivers to the Code for any of our senior officers or directors, we will disclose such amendment or waiver on our website and in a report on Form 8-K.
| ITEM 11. | EXECUTIVE COMPENSATION |
The information required by Item 11 is hereby incorporated herein by reference to the definitive Proxy Statement for our 2015 Annual Meeting of Shareholders.
| ITEM 12. | SECURITY OWNERSHIP OF CERTAIN BENEFICIAL OWNERS AND MANAGEMENT AND RELATED STOCKHOLDER MATTERS |
The information required by Item 12, as to certain beneficial owners and management, is hereby incorporated by reference to the definitive Proxy Statement for our 2015 Annual Meeting of Shareholders.
35
Table of Contents
| ITEM 13. | CERTAIN RELATIONSHIPS AND RELATED TRANSACTIONS, AND DIRECTOR INDEPENDENCE |
The information required by Item 13 is hereby incorporated herein by reference to the definitive Proxy Statement for our 2015 Annual Meeting of Shareholders.
| ITEM 14. | PRINCIPAL ACCOUNTANT FEES AND SERVICES |
The information required by Item 14 is hereby incorporated herein by reference to the definitive Proxy Statement for our 2015 Annual Meeting of Shareholders.
| ITEM 15. | EXHIBITS AND FINANCIAL STATEMENT SCHEDULES |
| (a) | Documents filed as a part of the report: |
| (1) | Index to Consolidated Financial Statements of the Company |
| An “Index to Consolidated Financial Statements” has been filed as a part of this Report beginning on page F-1 hereof. |
| (2) | All schedules for which provision is made in the applicable accounting regulation of the SEC have been omitted because of the absence of the conditions under which they would be required or because the information required is included in the consolidated financial statements of the Registrant or the notes thereto. |
| (3) | Exhibits |
| An “Index to Exhibits” has been filed as a part of this Report beginning on page E-1 and is herein incorporated by reference. |
36
Table of Contents
Pursuant to the requirements of Section 13 or 15(d) of the Securities Exchange Act of 1934, the Registrant has duly caused this report to be signed on its behalf by the undersigned, thereunto duly authorized.
| ENNIS, INC. | ||||||
| Date: May 8, 2015 | /s/ KEITH S. WALTERS | |||||
| Keith S. Walters, Chairman of the Board, | ||||||
| Chief Executive Officer and President | ||||||
| Date: May 8, 2015 | /s/ RICHARD L. TRAVIS, JR. | |||||
| Richard L. Travis, Jr. | ||||||
| Senior Vice President — Finance and Chief Financial Officer | ||||||
Pursuant to the requirements of the Securities Exchange Act of 1934, this report has been signed below by the following persons on behalf of the Registrant and in the capacities and on the dates indicated.
| Date: May 8, 2015 | /s/ KEITH S. WALTERS | |||||
| Keith S. Walters, Chairman of the Board, Chief Executive Officer and President | ||||||
| Date: May 8, 2015 | /s/ IRSHAD AHMAD | |||||
| Irshad Ahmad, Vice President – Apparel Division and Chief Technology Officer and Director | ||||||
| Date: May 8, 2015 | /s/ FRANK D. BRACKEN | |||||
| Frank D. Bracken, Director | ||||||
| Date: May 8, 2015 | /s/ GODFREY M. LONG, JR. | |||||
| Godfrey M. Long, Jr., Director | ||||||
| Date: May 8, 2015 | /s/ THOMAS R. PRICE | |||||
| Thomas R. Price, Director | ||||||
| Date: May 8, 2015 | /s/ KENNETH G. PRITCHETT | |||||
| Kenneth G. Pritchett, Director | ||||||
| Date: May 8, 2015 | /s/ ALEJANDRO QUIROZ | |||||
| Alejandro Quiroz, Director | ||||||
| Date: May 8, 2015 | /s/ MICHAEL J. SCHAEFER | |||||
| Michael J. Schaefer, Director | ||||||
| Date: May 8, 2015 | /s/ JAMES C. TAYLOR | |||||
| James C. Taylor, Director | ||||||
| Date: May 8, 2015 | /s/ RICHARD L. TRAVIS, JR. | |||||
| Richard L. Travis, Jr., Principal Financial and Accounting Officer | ||||||
37
Table of Contents
ENNIS, INC. AND SUBSIDIARIES
Index to Consolidated Financial Statements
F-1
Table of Contents
Report of Independent Registered Public Accounting Firm
Board of Directors and Shareholders
Ennis, Inc.
We have audited the accompanying consolidated balance sheets of Ennis, Inc. (a Texas corporation) and subsidiaries (the “Company”) as of February 28, 2015 and 2014, and the related consolidated statements of operations, comprehensive income (loss), changes in shareholders’ equity, and cash flows for each of the three years in the period ended February 28, 2015. These financial statements are the responsibility of the Company’s management. Our responsibility is to express an opinion on these financial statements based on our audits.
We conducted our audits in accordance with the standards of the Public Company Accounting Oversight Board (United States). Those standards require that we plan and perform the audit to obtain reasonable assurance about whether the financial statements are free of material misstatement. An audit includes examining, on a test basis, evidence supporting the amounts and disclosures in the financial statements. An audit also includes assessing the accounting principles used and significant estimates made by management, as well as evaluating the overall financial statement presentation. We believe that our audits provide a reasonable basis for our opinion.
In our opinion, the consolidated financial statements referred to above present fairly, in all material respects, the financial position of Ennis, Inc. and subsidiaries as of February 28, 2015 and 2014, and the results of their operations and their cash flows for each of the three years in the period ended February 28, 2015 in conformity with accounting principles generally accepted in the United States of America.
We also have audited, in accordance with the standards of the Public Company Accounting Oversight Board (United States), the Company’s internal control over financial reporting as of February 28, 2015, based on criteria established in 2013 Internal Control—Integrated Framework issued by the Committee of Sponsoring Organizations of the Treadway Commission (COSO), and our report dated May 8, 2015 expressed an unqualified opinion on the effectiveness of Ennis, Inc. and subsidiaries’ internal control over financial reporting.
| /s/ Grant Thornton LLP |
| Dallas, Texas |
| May 8, 2015 |
F-2
Table of Contents
Report of Independent Registered Public Accounting Firm
Board of Directors and Shareholders
Ennis, Inc.
We have audited the internal control over financial reporting of Ennis Inc. (a Texas corporation) and subsidiaries (the “Company”) as of February 28, 2015, based on criteria established in 2013 Internal Control—Integrated Framework issued by the Committee of Sponsoring Organizations of the Treadway Commission (COSO). The Company’s management is responsible for maintaining effective internal control over financial reporting and for its assessment of the effectiveness of internal control over financial reporting, included in the accompanying Management’s Report on Internal Control over Financial Reporting (“Management’s Report”). Our responsibility is to express an opinion on the Company’s internal control over financial reporting based on our audit. Our audit of, and opinion on, the Company’s internal control over financial reporting does not include the internal control over financial reporting of Kay Toledo Tag, Specialized Service Partners, and American Paper Converting LLC (collectively, “Kay Toledo”), wholly-owned subsidiaries, whose financial statements reflect total assets and revenues constituting 5 and 1 percent, respectively, of the related consolidated financial statement amounts as of and for the year ended February 28, 2015. As indicated in Management’s Report, Kay Toledo was acquired on December 31, 2014. Management’s assertion on the effectiveness of the Company’s internal control over financial reporting excluded internal control over financial reporting of Kay Toledo.
We conducted our audit in accordance with the standards of the Public Company Accounting Oversight Board (United States). Those standards require that we plan and perform the audit to obtain reasonable assurance about whether effective internal control over financial reporting was maintained in all material respects. Our audit included obtaining an understanding of internal control over financial reporting, assessing the risk that a material weakness exists, testing and evaluating the design and operating effectiveness of internal control based on the assessed risk, and performing such other procedures as we considered necessary in the circumstances. We believe that our audit provides a reasonable basis for our opinion.
A company’s internal control over financial reporting is a process designed to provide reasonable assurance regarding the reliability of financial reporting and the preparation of financial statements for external purposes in accordance with generally accepted accounting principles. A company’s internal control over financial reporting includes those policies and procedures that (1) pertain to the maintenance of records that, in reasonable detail, accurately and fairly reflect the transactions and dispositions of the assets of the company; (2) provide reasonable assurance that transactions are recorded as necessary to permit preparation of financial statements in accordance with generally accepted accounting principles, and that receipts and expenditures of the company are being made only in accordance with authorizations of management and directors of the company; and (3) provide reasonable assurance regarding prevention or timely detection of unauthorized acquisition, use, or disposition of the company’s assets that could have a material effect on the financial statements.
Because of its inherent limitations, internal control over financial reporting may not prevent or detect misstatements. Also, projections of any evaluation of effectiveness to future periods are subject to the risk that controls may become inadequate because of changes in conditions, or that the degree of compliance with the policies or procedures may deteriorate.
In our opinion, the Company maintained, in all material respects, effective internal control over financial reporting as of February 28, 2015, based on criteria established in 2013 Internal Control—Integrated Framework issued by COSO.
We also have audited, in accordance with the standards of the Public Company Accounting Oversight Board (United States), the consolidated financial statements of the Company as of and for the year ended February 28, 2015, and our report dated May 8, 2015 expressed an unqualified opinion on those financial statements.
| /s/ Grant Thornton LLP |
| Dallas, Texas |
| May 8, 2015 |
F-3
Table of Contents
CONSOLIDATED BALANCE SHEETS
(Dollars in thousands)
| Fiscal Years Ended | ||||||||
| 2015 | 2014 | |||||||
| Assets | ||||||||
| Current assets |
||||||||
| Cash |
$ | 15,346 | $ | 5,316 | ||||
| Accounts receivable, net of allowance for doubtful receivables of $3,559 at February 28, 2015 and $3,672 at February 28, 2014 |
62,865 | 63,695 | ||||||
| Prepaid expenses |
8,853 | 8,152 | ||||||
| Prepaid income taxes |
3,198 | 623 | ||||||
| Inventories |
119,814 | 130,095 | ||||||
| Deferred income taxes |
6,272 | 6,262 | ||||||
| Assets held for sale |
194 | — | ||||||
|
|
|
|
|
|||||
| Total current assets |
216,542 | 214,143 | ||||||
| Property, plant and equipment, at cost |
||||||||
| Plant, machinery and equipment |
166,890 | 160,229 | ||||||
| Land and buildings |
83,283 | 81,555 | ||||||
| Other |
23,574 | 23,403 | ||||||
|
|
|
|
|
|||||
| Total property, plant and equipment |
273,747 | 265,187 | ||||||
| Less accumulated depreciation |
180,872 | 173,622 | ||||||
|
|
|
|
|
|||||
| Net property, plant and equipment |
92,875 | 91,565 | ||||||
|
|
|
|
|
|||||
| Goodwill |
64,489 | 115,207 | ||||||
| Trademarks and trade names |
28,591 | 62,898 | ||||||
| Other intangible assets, net |
47,636 | 48,877 | ||||||
| Deferred finance charges, net |
224 | 373 | ||||||
| Other assets |
2,905 | 3,284 | ||||||
|
|
|
|
|
|||||
| Total assets |
$ | 453,262 | $ | 536,347 | ||||
|
|
|
|
|
|||||
See accompanying notes to consolidated financial statements.
F-4
Table of Contents
ENNIS, INC. AND SUBSIDIARIES
CONSOLIDATED BALANCE SHEETS-continued
(Dollars in thousands, except for par value and share amounts)
| Fiscal Years Ended | ||||||||
| 2015 | 2014 | |||||||
| Liabilities and Shareholders’ Equity | ||||||||
| Current liabilities |
||||||||
| Accounts payable |
$ | 21,275 | $ | 22,062 | ||||
| Accrued expenses |
||||||||
| Employee compensation and benefits |
15,964 | 16,520 | ||||||
| Taxes other than income |
656 | 445 | ||||||
| Income taxes payable |
— | 338 | ||||||
| Other |
2,352 | 2,512 | ||||||
|
|
|
|
|
|||||
| Total current liabilities |
40,247 | 41,877 | ||||||
|
|
|
|
|
|||||
| Long-term debt |
106,500 | 105,500 | ||||||
| Liability for pension benefits |
9,852 | 1,915 | ||||||
| Deferred income taxes |
10,248 | 22,904 | ||||||
| Other liabilities |
1,735 | 1,216 | ||||||
|
|
|
|
|
|||||
| Total liabilities |
168,582 | 173,412 | ||||||
|
|
|
|
|
|||||
| Commitments and contingencies |
||||||||
| Shareholders’ equity |
||||||||
| Preferred stock $10 par value, authorized 1,000,000 shares; none issued |
— | — | ||||||
| Common stock $2.50 par value, authorized 40,000,000 shares; issued 30,053,443 shares in 2015 and 2014 |
75,134 | 75,134 | ||||||
| Additional paid-in capital |
121,687 | 122,517 | ||||||
| Retained earnings |
188,413 | 251,137 | ||||||
| Accumulated other comprehensive loss: |
||||||||
| Foreign currency translation, net of taxes |
(4,627 | ) | (915 | ) | ||||
| Minimum pension liability, net of taxes |
(17,570 | ) | (11,498 | ) | ||||
|
|
|
|
|
|||||
| Total accumulated other comprehensive loss |
(22,197 | ) | (12,413 | ) | ||||
|
|
|
|
|
|||||
| Treasury stock |
(78,357 | ) | (73,440 | ) | ||||
|
|
|
|
|
|||||
| Total shareholders’ equity |
284,680 | 362,935 | ||||||
|
|
|
|
|
|||||
| Total liabilities and shareholders’ equity |
$ | 453,262 | $ | 536,347 | ||||
|
|
|
|
|
|||||
See accompanying notes to consolidated financial statements.
F-5
Table of Contents
CONSOLIDATED STATEMENTS OF OPERATIONS
(Dollars in thousands, except share and per share amounts)
| Fiscal Years Ended | ||||||||||||
| 2015 | 2014 | 2013 | ||||||||||
| Net sales |
$ | 580,240 | $ | 542,442 | $ | 533,506 | ||||||
| Cost of goods sold |
434,764 | 398,649 | 409,354 | |||||||||
|
|
|
|
|
|
|
|||||||
| Gross profit margin |
145,476 | 143,793 | 124,152 | |||||||||
| Selling, general and administrative |
89,926 | 86,677 | 83,757 | |||||||||
| Impairment of goodwill and trademarks |
93,324 | 24,226 | — | |||||||||
| (Gain) loss from disposal of assets |
(58 | ) | (274 | ) | 2 | |||||||
|
|
|
|
|
|
|
|||||||
| Income (loss) from operations |
(37,716 | ) | 33,164 | 40,393 | ||||||||
| Other income (expense) |
||||||||||||
| Interest expense |
(2,025 | ) | (1,268 | ) | (1,528 | ) | ||||||
| Other, net |
608 | (104 | ) | (247 | ) | |||||||
|
|
|
|
|
|
|
|||||||
| (1,417 | ) | (1,372 | ) | (1,775 | ) | |||||||
|
|
|
|
|
|
|
|||||||
| Earnings (loss) before income taxes |
(39,133 | ) | 31,792 | 38,618 | ||||||||
| Provision for income taxes |
5,400 | 18,603 | 13,903 | |||||||||
|
|
|
|
|
|
|
|||||||
| Net earnings (loss) |
$ | (44,533 | ) | $ | 13,189 | $ | 24,715 | |||||
|
|
|
|
|
|
|
|||||||
| Weighted average common shares outstanding |
||||||||||||
| Basic |
25,864,352 | 26,125,348 | 26,035,571 | |||||||||
|
|
|
|
|
|
|
|||||||
| Diluted |
25,864,352 | 26,146,325 | 26,053,452 | |||||||||
|
|
|
|
|
|
|
|||||||
| Per share amounts |
||||||||||||
| Net earnings (loss) - basic |
$ | (1.72 | ) | $ | 0.50 | $ | 0.95 | |||||
|
|
|
|
|
|
|
|||||||
| Net earnings (loss) - diluted |
$ | (1.72 | ) | $ | 0.50 | $ | 0.95 | |||||
|
|
|
|
|
|
|
|||||||
| Cash dividends per share |
$ | 0.70 | $ | 0.53 | $ | 0.88 | ||||||
|
|
|
|
|
|
|
|||||||
See accompanying notes to consolidated financial statements.
F-6
Table of Contents
CONSOLIDATED STATEMENTS OF COMPREHENSIVE INCOME (LOSS)
(Dollars in thousands)
| Fiscal Years Ended | ||||||||||||
| 2015 | 2014 | 2013 | ||||||||||
| Net earnings (loss) |
$ | (44,533 | ) | $ | 13,189 | $ | 24,715 | |||||
| Foreign currency translation adjustment, net of deferred taxes |
(3,712 | ) | (1,486 | ) | (451 | ) | ||||||
| Adjustment to pension, net of deferred taxes |
(6,072 | ) | 3,976 | (1,667 | ) | |||||||
|
|
|
|
|
|
|
|||||||
| Comprehensive income (loss) |
$ | (54,317 | ) | $ | 15,679 | $ | 22,597 | |||||
|
|
|
|
|
|
|
|||||||
See accompanying notes to consolidated financial statements.
F-7
Table of Contents
CONSOLIDATED STATEMENTS OF CHANGES IN SHAREHOLDERS’ EQUITY
FOR THE FISCAL YEARS ENDED 2013, 2014, AND 2015
(Dollars in thousands, except share and per share amounts)
|
Common Stock |
Additional Paid-in Capital |
Retained Earnings |
Accumulated Other Comprehensive Income (Loss) |
Treasury Stock |
Total | |||||||||||||||||||||||||||
| Shares | Amount | Shares | Amount | |||||||||||||||||||||||||||||
| Balance March 1, 2012 |
30,053,443 | $ | 75,134 | $ | 121,390 | $ | 249,862 | $ | (12,785 | ) | (4,129,668 | ) | $ | (73,726 | ) | $ | 359,875 | |||||||||||||||
| Net earnings |
— | — | — | 24,715 | — | — | — | 24,715 | ||||||||||||||||||||||||
| Foreign currency translation, net of deferred tax of $279 |
— | — | — | — | (451 | ) | — | — | (451 | ) | ||||||||||||||||||||||
| Adjustment to pension, net of deferred tax of $1,031 |
— | — | — | — | (1,667 | ) | — | — | (1,667 | ) | ||||||||||||||||||||||
| Dividends declared ($.88 per share) |
— | — | — | (22,864 | ) | — | — | — | (22,864 | ) | ||||||||||||||||||||||
| Excess tax benefit of stock option exercises and restricted stock grants |
— | — | 66 | — | — | — | — | 66 | ||||||||||||||||||||||||
| Stock based compensation |
— | — | 1,459 | — | — | — | — | 1,459 | ||||||||||||||||||||||||
| Exercise of stock options and restricted stock grants |
— | — | (729 | ) | — | — | 45,078 | 814 | 85 | |||||||||||||||||||||||
| Stock repurchases |
— | — | — | — | — | (175 | ) | (2 | ) | (2 | ) | |||||||||||||||||||||
|
|
|
|
|
|
|
|
|
|
|
|
|
|
|
|
|
|||||||||||||||||
| Balance February 28, 2013 |
30,053,443 | $ | 75,134 | $ | 122,186 | $ | 251,713 | $ | (14,903 | ) | (4,084,765 | ) | $ | (72,914 | ) | $ | 361,216 | |||||||||||||||
| Net earnings |
— | — | — | 13,189 | — | — | — | 13,189 | ||||||||||||||||||||||||
| Foreign currency translation, net of deferred tax of $910 |
— | — | — | — | (1,486 | ) | — | — | (1,486 | ) | ||||||||||||||||||||||
| Adjustment to pension, net of deferred tax of $2,435 |
— | — | — | — | 3,976 | — | — | 3,976 | ||||||||||||||||||||||||
| Dividends declared ($.525 per share) |
— | — | — | (13,765 | ) | — | — | — | (13,765 | ) | ||||||||||||||||||||||
| Excess tax benefit of stock option exercises and restricted stock grants |
— | — | 17 | — | — | — | — | 17 | ||||||||||||||||||||||||
| Stock based compensation |
— | — | 1,532 | — | — | — | — | 1,532 | ||||||||||||||||||||||||
| Exercise of stock options and restricted stock grants |
— | — | (1,218 | ) | — | — | 73,503 | 1,312 | 94 | |||||||||||||||||||||||
| Stock repurchases |
— | — | — | — | — | (120,014 | ) | (1,838 | ) | (1,838 | ) | |||||||||||||||||||||
|
|
|
|
|
|
|
|
|
|
|
|
|
|
|
|
|
|||||||||||||||||
| Balance February 28, 2014 |
30,053,443 | $ | 75,134 | $ | 122,517 | $ | 251,137 | $ | (12,413 | ) | (4,131,276 | ) | $ | (73,440 | ) | $ | 362,935 | |||||||||||||||
| Net loss |
— | — | — | (44,533 | ) | — | — | — | (44,533 | ) | ||||||||||||||||||||||
| Foreign currency translation, net of deferred tax of $2,273 |
— | — | — | — | (3,712 | ) | — | — | (3,712 | ) | ||||||||||||||||||||||
| Adjustment to pension, net of deferred tax of $3,718 |
— | — | — | — | (6,072 | ) | — | — | (6,072 | ) | ||||||||||||||||||||||
| Dividends declared ($.70 per share) |
— | — | — | (18,191 | ) | — | — | — | (18,191 | ) | ||||||||||||||||||||||
| Excess tax benefit of stock option exercises and restricted stock grants |
— | — | (106 | ) | — | — | — | — | (106 | ) | ||||||||||||||||||||||
| Stock based compensation |
— | — | 1,339 | — | — | — | — | 1,339 | ||||||||||||||||||||||||
| Exercise of stock options and restricted stock grants |
— | — | (2,063 | ) | — | — | 119,061 | 2,117 | 54 | |||||||||||||||||||||||
| Stock repurchases |
— | — | — | — | — | (502,690 | ) | (7,034 | ) | (7,034 | ) | |||||||||||||||||||||
|
|
|
|
|
|
|
|
|
|
|
|
|
|
|
|
|
|||||||||||||||||
| Balance February 28, 2015 |
30,053,443 | $ | 75,134 | $ | 121,687 | $ | 188,413 | $ | (22,197 | ) | (4,514,905 | ) | $ | (78,357 | ) | $ | 284,680 | |||||||||||||||
|
|
|
|
|
|
|
|
|
|
|
|
|
|
|
|
|
|||||||||||||||||
See accompanying notes to consolidated financial statements.
F-8
Table of Contents
CONSOLIDATED STATEMENTS OF CASH FLOWS
(Dollars in thousands)
| Fiscal Years Ended | ||||||||||||
| 2015 | 2014 | 2013 | ||||||||||
| Cash flows from operating activities: |
||||||||||||
| Net earnings (loss) |
$ | (44,533 | ) | $ | 13,189 | $ | 24,715 | |||||
| Adjustments to reconcile net earnings (loss) to net cash provided by operating activities: |
||||||||||||
| Depreciation |
10,505 | 9,854 | 9,957 | |||||||||
| Amortization of deferred finance charges |
149 | 149 | 149 | |||||||||
| Amortization of trade names, customer lists, and patent |
5,779 | 4,216 | 3,278 | |||||||||
| Impairment of goodwill and trademarks |
93,324 | 24,226 | — | |||||||||
| (Gain) loss from disposal of assets |
(58 | ) | (274 | ) | 2 | |||||||
| Bad debt expense |
1,326 | 3,024 | 743 | |||||||||
| Stock based compensation |
1,339 | 1,532 | 1,459 | |||||||||
| Excess tax benefit of stock based compensation |
106 | (17 | ) | (66 | ) | |||||||
| Deferred income taxes |
(11,379 | ) | (1,900 | ) | 1,263 | |||||||
| Changes in operating assets and liabilities, net of the effects of acquisitions: |
||||||||||||
| Accounts receivable |
3,750 | (1,909 | ) | (1,400 | ) | |||||||
| Prepaid expenses |
(3,435 | ) | 2,953 | 347 | ||||||||
| Inventories |
12,928 | (16,415 | ) | 18,293 | ||||||||
| Other current assets |
(10 | ) | (442 | ) | (327 | ) | ||||||
| Other assets |
304 | 197 | (49 | ) | ||||||||
| Accounts payable and accrued expenses |
(3,492 | ) | (4,913 | ) | (7,251 | ) | ||||||
| Other liabilities |
519 | 204 | (311 | ) | ||||||||
| Liability for pension benefits |
(1,853 | ) | (919 | ) | (845 | ) | ||||||
|
|
|
|
|
|
|
|||||||
| Net cash provided by operating activities |
65,269 | 32,755 | 49,957 | |||||||||
|
|
|
|
|
|
|
|||||||
| Cash flows from investing activities: |
||||||||||||
| Capital expenditures |
(2,479 | ) | (4,646 | ) | (2,560 | ) | ||||||
| Purchase price of businesses, net of cash acquired |
(27,082 | ) | (61,857 | ) | — | |||||||
| Adjustment to purchase price of businesses acquired |
— | — | 3,737 | |||||||||
| Proceeds from disposal of property, plant and equipment |
151 | 992 | 18 | |||||||||
|
|
|
|
|
|
|
|||||||
| Net cash provided by (used in) investing activities |
(29,410 | ) | (65,511 | ) | 1,195 | |||||||
|
|
|
|
|
|
|
|||||||
| Cash flows from financing activities: |
||||||||||||
| Borrowings on debt |
26,000 | 73,000 | 5,000 | |||||||||
| Repayment of debt |
(25,000 | ) | (25,000 | ) | (37,500 | ) | ||||||
| Dividends |
(18,191 | ) | (13,765 | ) | (22,864 | ) | ||||||
| Purchase of treasury stock |
(7,034 | ) | (1,838 | ) | (2 | ) | ||||||
| Proceeds from exercise of stock options |
54 | 94 | 85 | |||||||||
| Excess tax benefit of stock based compensation |
(106 | ) | 17 | 66 | ||||||||
|
|
|
|
|
|
|
|||||||
| Net cash provided by (used in) financing activities |
(24,277 | ) | 32,508 | (55,215 | ) | |||||||
|
|
|
|
|
|
|
|||||||
| Effect of exchange rate changes on cash |
(1,552 | ) | (668 | ) | (115 | ) | ||||||
| Net change in cash |
10,030 | (916 | ) | (4,178 | ) | |||||||
| Cash at beginning of period |
5,316 | 6,232 | 10,410 | |||||||||
|
|
|
|
|
|
|
|||||||
| Cash at end of period |
$ | 15,346 | $ | 5,316 | $ | 6,232 | ||||||
|
|
|
|
|
|
|
|||||||
See accompanying notes to consolidated financial statements.
F-9
Table of Contents
NOTES TO CONSOLIDATED FINANCIAL STATEMENTS
(1) Significant Accounting Policies and General Matters
Nature of Operations. Ennis, Inc. and its wholly owned subsidiaries (collectively, the “Company”) are principally engaged in the production of and sale of business forms, other business products and apparel to customers primarily located in the United States.
Basis of Consolidation. The consolidated financial statements include the accounts of the Company and its wholly owned subsidiaries. All significant intercompany accounts and transactions have been eliminated. The Company’s fiscal years ended on the following days: February 28, 2015, February 28, 2014 and February 28, 2013 (fiscal years ended 2015, 2014, and 2013, respectively).
Accounts Receivable. Trade receivables are uncollateralized customer obligations due under normal trade terms requiring payment generally within 30 days from the invoice date. The Company’s allowance for doubtful receivables reserve is based on an analysis that estimates the amount of its total customer receivable balance that is not collectible. This analysis includes assessing a default probability to customers’ receivable balances, which is influenced by several factors including (i) current market conditions, (ii) periodic review of customer credit worthiness, and (iii) review of customer receivable aging and payment trends.
Inventories. With the exception of approximately 10% of its print segment inventories, which are valued at the lower of last-in, first-out (LIFO) cost or market, the Company values its inventories at the lower of first-in, first-out (FIFO) cost or market. At fiscal years ended 2015 and 2014, approximately 2.0% and 1.9% of inventories, respectively, are valued at LIFO with the remainder of inventories valued at FIFO. The Company regularly reviews inventories on hand, using specific aging categories, and writes down the carrying value of its inventories for excess and potentially obsolete inventories based on historical usage and estimated future usage. In assessing the ultimate realization of its inventories, the Company is required to make judgments as to future demand requirements. As actual future demand or market conditions may vary from those projected by the Company, adjustments to inventories may be required. The Company provides reserves for excess and obsolete inventory when necessary based upon analysis of quantities on hand, recent sales volumes and reference to market prices. Reserves for excess and obsolete inventory at fiscal years ended 2015 and 2014 were $3.1 million and $2.9 million, respectively.
Property, Plant and Equipment. Depreciation of property, plant and equipment is calculated using the straight-line method over a period considered adequate to amortize the total cost over the useful lives of the assets, which range from 3 to 11 years for machinery and equipment and 10 to 33 years for buildings and improvements. Leasehold improvements are amortized over the shorter of the lease term or the estimated useful life of the improvements. Repairs and maintenance are expensed as incurred. Renewals and betterments are capitalized and depreciated over the remaining life of the specific property unit. The Company capitalizes all leases that are in substance acquisitions of property.
Goodwill and Other Intangible Assets. Goodwill is the excess of the purchase price paid over the value of net assets of businesses acquired and is not amortized. Intangible assets with determinable lives are amortized on a straight-line basis over their estimated useful lives. Intangible assets with indefinite lives are not amortized. Goodwill and indefinite-lived intangible assets are evaluated for impairment on an annual basis, or more frequently if impairment indicators arise, using a fair-value-based test that compares the fair value of the related business unit to its carrying value.
Long-Lived Assets. Long-lived assets are reviewed for impairment whenever events or changes in circumstances indicate that the carrying amount of an asset may not be recoverable. Recoverability of assets to be held and used is measured by a comparison of the carrying amount of an asset to future undiscounted net cash flows expected to be generated by the asset. If such assets are considered to be impaired, the impairment to be recognized is based upon future discounted net cash flows.
F-10
Table of Contents
ENNIS, INC. AND SUBSIDIARIES
NOTES TO CONSOLIDATED FINANCIAL STATEMENTS
(1) Significant Accounting Policies and General Matters-continued
Fair Value of Financial Instruments. The carrying amounts of cash, accounts receivables, and accounts payable approximate fair value because of the short maturity and/or variable rates associated with these instruments. Long-term debt as of fiscal years ended 2015 and 2014 approximates its fair value as the interest rate is tied to market rates.
Treasury Stock. The Company accounts for repurchases of common stock using the cost method with common stock in treasury classified in the Consolidated Balance Sheets as a reduction of shareholders’ equity.
Deferred Finance Charges. Deferred finance charges in connection with the Company’s revolving credit facility are amortized to interest expense over the term of the facility using the straight-line method. If the facility is extinguished before the end of the term, the remaining balance of the deferred finance charges will be amortized fully in such year.
Revenue Recognition. Revenue is generally recognized upon shipment of products. Net sales represent gross sales invoiced to customers, less certain related charges, including sales tax, discounts, returns and other allowances. Returns, discounts and other allowances have historically been insignificant. In some cases and upon customer request, the Company prints and stores custom print product for customer specified future delivery, generally within twelve months. In this case, risk of loss passes to the customer, the customer is invoiced under normal credit terms, and revenue is recognized when manufacturing is complete. Approximately $13.7 million, $13.7 million and $12.3 million of revenue was recognized under these arrangements during fiscal years 2015, 2014 and 2013, respectively.
Advertising Expenses. The Company expenses advertising costs as incurred. Catalog and brochure preparation and printing costs, which are considered direct response advertising, are amortized to expense over the life of the catalog, which typically ranges from three to twelve months. Advertising expense was approximately $0.8 million, $1.0 million and $1.0 million during the fiscal years ended 2015, 2014 and 2013, respectively, and is included in selling, general and administrative expenses in the Consolidated Statements of Earnings. Included in this advertising expense is amortization related to direct response advertising of approximately $215,000, $464,000, and $392,000 for the fiscal years ended 2015, 2014 and 2013, respectively. Unamortized direct advertising costs included in prepaid expenses at fiscal years ended 2015, 2014 and 2013 were approximately $368,000, $145,000, and $304,000, respectively.
Income Taxes. Deferred tax assets and liabilities are recognized for the estimated future tax consequences attributable to differences between the financial statement carrying amounts of existing assets and liabilities and their respective tax bases and operating loss and tax credit carry forwards. Deferred tax assets and liabilities are measured using enacted tax rates expected to apply to taxable income in the years in which those temporary differences are expected to be recovered or settled. The effect on deferred tax assets and liabilities of a change in tax rates is recognized in income in the period that includes the enactment date.
Earnings Per Share. Basic earnings per share is computed by dividing net earnings by the weighted average number of common shares outstanding during the period. Diluted earnings per share is computed by dividing net earnings by the weighted average number of common shares outstanding, and then adding the number of additional shares that would have been outstanding if potentially dilutive securities had been issued. This is calculated using the treasury stock method. No options were included for fiscal year 2015 due to the operating loss. At year-end 2014 and 2013, there were 172,543 and 297,250 options, respectively, not included in the diluted earnings per share computation because their effect was anti-dilutive.
Accumulated Other Comprehensive Income (Loss). Accumulated other comprehensive income (loss) is defined as the change in equity resulting from transactions from non-owner sources. Other comprehensive income (loss) consisted of the following: adjustments resulting from the foreign currency translation of the Company’s Mexican and Canadian operations, changes in the fair value of derivative instruments and changes in the funded status of the Company’s pension plan.
F-11
Table of Contents
ENNIS, INC. AND SUBSIDIARIES
NOTES TO CONSOLIDATED FINANCIAL STATEMENTS
(1) Significant Accounting Policies and General Matters-continued
Derivative Instruments and Hedging Activities. The Company uses derivative financial instruments to manage its exposures to interest rate fluctuations on its floating rate debt agreements when the Company deems it prudent to do so. The Company recognizes all derivatives as either assets or liabilities in the balance sheet, measures those instruments at fair value and recognizes changes in the fair value of derivatives in earnings in the period of change, unless the derivative qualifies as an effective hedge that offsets certain exposures. No derivatives were used by the Company in any of the periods presented.
Foreign Currency Translation. The functional currency for the Company’s foreign subsidiaries is the applicable local currency. Assets and liabilities of the foreign subsidiaries are translated to U.S. dollars at year-end exchange rates. Income and expense items are translated at the rates of exchange prevailing during the year. The adjustments resulting from translating the financial statements of the foreign subsidiary are reflected in shareholders’ equity as accumulated other comprehensive income or loss.
Transaction gains and losses that arise from exchange rate fluctuations on transactions denominated in a currency other than the functional currency are included in the results of operations in other expense, net as incurred. Transaction (gains) and losses totaled approximately ($667,000), $35,000, and $189,000 for fiscal years ended 2015, 2014 and 2013, respectively.
Estimates. The preparation of financial statements in conformity with accounting principles generally accepted in the United States of America requires management to make estimates and assumptions that affect the reported amounts of assets and liabilities and disclosure of contingent assets and liabilities at the date of the financial statements and the reported amounts of revenue and expenses during the reporting period. Actual results could differ from these estimates.
Shipping and Handling Costs. The Company records amounts billed to customers for shipping and handling costs in net sales and related costs are included in cost of goods sold.
Stock Based Compensation. The Company recognizes stock-based compensation expense net of estimated forfeitures (estimated at 1%) over the requisite service period of the individual grants, which generally equals the vesting period. The fair value of all share based awards is estimated on the date of grant.
(2) Accounts Receivable and Allowance for Doubtful Receivables
Accounts receivable are reduced by an allowance for an estimate of amounts that are uncollectible. Substantially all of the Company’s receivables are due from customers in North America. The Company extends credit to its customers based upon its evaluation of the following factors: (i) the customer’s financial condition, (ii) the amount of credit the customer requests, and (iii) the customer’s actual payment history (which includes disputed invoice resolution). The Company does not typically require its customers to post a deposit or supply collateral. The Company’s allowance for doubtful receivables is based on an analysis that estimates the amount of its total customer receivable balance that is not collectible. This analysis includes assessing a default probability to customers’ receivable balances, which is influenced by several factors including (i) current market conditions, (ii) periodic review of customer credit worthiness, and (iii) review of customer receivable aging and payment trends.
The Company writes off accounts receivable when they become uncollectible, and payments subsequently received on such receivables are credited to the allowance in the period the payment is received. Credit losses from continuing operations have consistently been within management’s expectations.
F-12
Table of Contents
ENNIS, INC. AND SUBSIDIARIES
NOTES TO CONSOLIDATED FINANCIAL STATEMENTS
(2) Accounts Receivable and Allowance for Doubtful Receivables-continued
The following table represents the activity in the Company’s allowance for doubtful receivables for the fiscal years ended (in thousands):
| 2015 | 2014 | 2013 | ||||||||||
| Balance at beginning of period |
$ | 3,672 | $ | 3,952 | $ | 4,403 | ||||||
| Bad debt expense |
1,326 | 3,024 | 743 | |||||||||
| Recoveries |
60 | 42 | 45 | |||||||||
| Accounts written off |
(1,499 | ) | (3,346 | ) | (1,239 | ) | ||||||
|
|
|
|
|
|
|
|||||||
| Balance at end of period |
$ | 3,559 | $ | 3,672 | $ | 3,952 | ||||||
|
|
|
|
|
|
|
|||||||
(3) Inventories
The following table summarizes the components of inventories at the different stages of production as of February 28, 2015 and 2014 (in thousands):
| 2015 | 2014 | |||||||
| Raw material |
$ | 18,153 | $ | 16,400 | ||||
| Work-in-process |
7,195 | 14,386 | ||||||
| Finished goods |
94,466 | 99,309 | ||||||
|
|
|
|
|
|||||
| $ | 119,814 | $ | 130,095 | |||||
|
|
|
|
|
|||||
The excess of current costs at FIFO over LIFO stated values was approximately $5.0 million as of fiscal years ended 2015 and 2014. During both fiscal year 2015 and 2014, as inventory quantities were reduced, this resulted in a liquidation of LIFO inventory quantities carried at lower costs prevailing in prior years as compared with the cost of fiscal year 2014 and 2013. The effect decreased cost of sales by approximately $87,000 and $25,000 and increased net earnings by approximately $55,000 and $16,000 for fiscal years 2015 and 2014, respectively. Cost includes materials, labor and overhead related to the purchase and production of inventories.
(4) Acquisitions
On December 31, 2014, the Company completed the acquisition of Kay Toledo Tag and Special Service Partners and their related entities (collectively “Kay Toledo”) for $16.2 million, in a stock purchase transaction. An additional $1.0 million is available to be paid to the sellers over the next 3 years under an earn-out provision if certain financial metrics are achieved. The goodwill recognized as a part of this acquisition is not deductible for tax purposes. Kay Toledo has locations in Toledo, Ohio and Neenah, Wisconsin through Special Service Partners. Experts in digital printing and customer short-run printing, Kay Toledo Tag produces tags, labels, tickets and commercial printing. Kay Toledo, which generated approximately $25.0 million in unaudited sales during calendar year 2014, will continue to operate under its respective brand names. For the fiscal year ended February 28, 2015, the businesses added $3.9 million in sales and $0.4 million in earnings (pre-tax). The acquisition expands and strengthens the Tag and Label operations of the Company.
F-13
Table of Contents
ENNIS, INC. AND SUBSIDIARIES
NOTES TO CONSOLIDATED FINANCIAL STATEMENTS
(4) Acquisitions-continued
The following is a summary of the purchase price allocations for Kay Toledo Tag (in thousands):
| Accounts receivable |
$ | 1,872 | ||
| Inventories |
2,168 | |||
| Property, plant & equipment |
9,218 | |||
| Customer lists |
2,813 | |||
| Trade names |
1,690 | |||
| Goodwill |
4,249 | |||
| Accounts payable and accrued liabilities |
(1,120 | ) | ||
| Deferred taxes |
(4,652 | ) | ||
|
|
|
|||
| $ | 16,238 | |||
|
|
|
On October 3, 2014, the Company acquired the assets of Hoosier Data Forms for $0.2 million in cash plus the assumption of certain trade payables. Management considers this acquisition immaterial and has therefore omitted further discussion.
On June 16, 2014, the Company acquired the assets of Sovereign Business Forms, and its related entities, TRI-C Business Forms, Inc., Falcon Business Forms, Inc., Forms Manufacturers, Inc., Mutual Graphics, Inc., and Curtis Business Forms, Inc. (collectively “Sovereign”) for $10.6 million in cash plus the assumption of certain trade liabilities. In addition, if certain financial metrics are met, up to an additional $1.0 million is available to be paid to the sellers over the next 4 years under an earn-out provision. The goodwill generated in this acquisition is deductible for tax purposes. The cash portion of the purchase price was funded by borrowing under the Company’s line of credit facility. Sovereign, which generated approximately $27.1 million in unaudited sales during the 2013 calendar year, will continue to operate under its respective brand names. For the fiscal year ended February 28, 2015, Sovereign added $19.8 million in sales and $2.9 million in earnings (pre-tax). The acquisition expanded the geographic locations of producing business forms for the Company.
The following is a summary of the purchase price allocations for Sovereign (in thousands):
| Accounts receivable |
$ | 2,477 | ||
| Inventories |
1,305 | |||
| Other assets |
653 | |||
| Property, plant & equipment |
3,300 | |||
| Customer lists |
1,550 | |||
| Trade names |
1,403 | |||
| Goodwill |
945 | |||
| Accounts payable |
(1,000 | ) | ||
|
|
|
|||
| $ | 10,633 | |||
|
|
|
On September 27, 2013, the Company acquired the assets of the Custom Envelope Division (“CED”), part of the Custom Resale Group of Cenveo, Inc., for $47.25 million in cash plus the assumption of certain trade liabilities. The goodwill generated in this acquisition is deductible for tax purposes. The cash portion of the purchase price was funded by borrowing under the Company’s line of credit facility. The CED assets are comprised of the Wisco® (“Wisco”) brand, which is produced at an owned facility in Tullahoma, TN, and the National Imprint Corporation® (“National Imprint®”, “NIC”) brand, which is produced in a leased facility in Claysburg, PA. Wisco produces and folds various types of envelopes, and NIC is an imprinter of envelopes. Both of these products are sold through print distributors and will continue to be operated under the Wisco and NIC brand names at their respective locations. Wisco and NIC had unaudited sales in excess of $40 million for the twelve month period ended December 31, 2012. For the fiscal year ended February 28, 2015, the businesses added $40.0 million in
F-14
Table of Contents
ENNIS, INC. AND SUBSIDIARIES
NOTES TO CONSOLIDATED FINANCIAL STATEMENTS
(4) Acquisitions-continued
sales and $6.5 million in earnings (pre-tax). The acquisition expanded and strengthened the envelope product line for the Company.
The following is a summary of the purchase price allocations for Wisco and NIC (in thousands):
| Accounts receivable |
$ | 3,331 | ||
| Inventories |
2,391 | |||
| Other assets |
581 | |||
| Property, plant & equipment |
4,889 | |||
| Customer lists |
26,400 | |||
| Trade names |
3,600 | |||
| Goodwill |
9,462 | |||
| Accounts payable and accrued liabilities |
(3,404 | ) | ||
|
|
|
|||
| $ | 47,250 | |||
|
|
|
On September 30, 2013, the Company acquired the assets of the businesses operating under the trade name of Folder Express® from Wright Printing Company for $14.6 million in cash plus the assumption of certain trade payables. The cash portion of the purchase price was funded by borrowing under the Company’s line of credit facility. The goodwill generated in this acquisition is deductible for tax purposes. The businesses produce folders and specialty folders for music stores and public schools. The businesses had combined unaudited sales of approximately $20 million during the twelve month period ended December 31, 2012 and will continue to operate under the Folder Express and related brand names. For the fiscal year ended February 28, 2015, the businesses added $16.5 million in sales and $1.4 million in earnings (pre-tax). The acquisition expands the Company’s geographic presence in folder products.
The following is a summary of the purchase price allocation for Folder Express (in thousands):
| Accounts receivable |
$ | 1,171 | ||
| Inventories |
2,102 | |||
| Other assets |
196 | |||
| Property, plant & equipment |
1,617 | |||
| Customer lists |
5,920 | |||
| Trade name |
1,520 | |||
| Goodwill |
2,574 | |||
| Accounts payable and accrued liabilities |
(493 | ) | ||
|
|
|
|||
| $ | 14,607 | |||
|
|
|
The results of operations for Wisco, NIC, Folder Express, Sovereign Business Forms, Hoosier Data Forms and Kay Toledo are included in the Company’s consolidated financial statements from the dates of acquisition. The following table represents certain operating information on a pro forma basis as though all operations had been acquired as of March 1, 2013, after the estimated impact of adjustments such as amortization of intangible assets, interest expense, interest income, and related tax effects (in thousands, except per share amounts):
| Unaudited | ||||||||
| 2015 | 2014 | |||||||
| Pro forma net sales |
$ | 608,195 | $ | 630,692 | ||||
| Pro forma net earnings |
(43,791 | ) | 18,403 | |||||
| Pro forma earnings per share - diluted |
(1.69 | ) | 0.70 | |||||
The pro forma results are not necessarily indicative of what would have occurred if the acquisitions had been in effect for the periods presented.
F-15
Table of Contents
ENNIS, INC. AND SUBSIDIARIES
NOTES TO CONSOLIDATED FINANCIAL STATEMENTS
(5) Goodwill and Other Intangible Assets
Goodwill represents the excess of the purchase price over the fair value of net assets of acquired businesses and is not amortized. Goodwill and indefinite-lived intangibles are evaluated for impairment on an annual basis as of November 30 of each year, or more frequently if impairment indicators arise, using a fair-value-based test that compares the fair value of the asset to its carrying value. Goodwill and other intangible assets are tested for impairment at a reporting unit level, which the Company has determined is at the Print Segment and Apparel Segment level. The impairment test for goodwill uses a two-step approach. Step one compares the fair value of the reporting unit to which goodwill is assigned to its carrying amount. If the carrying amount exceeds its estimated value, a potential impairment is indicated and step two is performed. Step two compares the carrying amount of the reporting unit’s goodwill to its implied fair value. In calculating the implied fair value of reporting unit goodwill, the fair value of the reporting unit is allocated to all of the assets and liabilities, including unrecognized intangible assets of that reporting unit based on their fair values, similar to the allocation that occurs in a business combination. The excess of the fair value of a reporting unit over the amount assigned to its assets and liabilities is the implied fair value of goodwill. If the carrying value of goodwill exceeds its implied fair value, an impairment charge is recognized in an amount equal to that excess. If the implied fair value of goodwill exceeds the carrying amount, goodwill is not impaired. During the initial preparation of the annual first step impairment analysis, there were indicators that an impairment may exist with respect to the Company’s Apparel Segment. Therefore, the execution of the formal impairment analysis with respect to the Company’s Apparel Segment was accelerated. During the preparation of the impairment analysis on the Apparel Segment it was determined that an estimated impairment charge of $93.3 million ($55.9 million goodwill and $37.4 million trademarks) was required to the Apparel Segment’s recorded goodwill and trademarks, or approximately 88% of their carrying value prior to such impairment charge, to reduce the carrying values of those assets to their estimated fair values. Upon completion of the impairment analysis during the fourth quarter it was determined that it was not necessary to record any further impairment expense to the initial estimate. During the fourth quarter of fiscal year 2014, we recorded an impairment charge of $24.2 million ($18.6 million to goodwill and $5.6 million to trademarks). The impairment charges were primarily driven by the depressed market environment and the resulting impact on the Apparel Segment’s expected future cash flows. The Company also determined there was no impairment in the Print Segment. The Company must make assumptions regarding estimated future cash flows and other factors to determine the fair value of the respective assets in assessing the recoverability of its goodwill and other intangibles. If these estimates or the related assumptions change, the Company may be required to record additional impairment charges relating to these assets in the future.
The cost of intangible assets is based on fair values at the date of acquisition. Intangible assets with determinable lives are amortized on a straight-line basis over their estimated useful life (between 1 and 15 years). Trademarks and trade names with indefinite lives are evaluated for impairment on an annual basis, or more frequently if impairment indicators arise. The Company assesses the recoverability of its definite-lived intangible assets primarily based on its current and anticipated future undiscounted cash flows.
F-16
Table of Contents
ENNIS, INC. AND SUBSIDIARIES
NOTES TO CONSOLIDATED FINANCIAL STATEMENTS
(5) Goodwill and Other Intangible Assets-continued
The carrying amount and accumulated amortization of the Company’s intangible assets at each balance sheet date are as follows (in thousands):
| As of February 28, 2015 |
Weighted Average Remaining Life (in years) |
Gross Carrying Amount |
Accumulated Amortization |
Net | ||||||||||||
| Amortized intangible assets |
||||||||||||||||
| Trade names |
— | $ | 1,234 | $ | 1,234 | $ | — | |||||||||
| Customer lists |
9.6 | 74,670 | 27,486 | 47,184 | ||||||||||||
| Noncompete |
2.8 | 75 | 4 | 71 | ||||||||||||
| Patent |
3.0 | 773 | 392 | 381 | ||||||||||||
|
|
|
|
|
|
|
|||||||||||
| Total |
9.5 | $ | 76,752 | $ | 29,116 | $ | 47,636 | |||||||||
|
|
|
|
|
|
|
|||||||||||
| As of February 28, 2014 |
||||||||||||||||
| Amortized intangible assets |
||||||||||||||||
| Trade names |
— | $ | 1,234 | $ | 1,234 | $ | — | |||||||||
| Customer lists |
7.1 | 70,207 | 21,840 | 48,367 | ||||||||||||
| Patent |
4.0 | 773 | 263 | 510 | ||||||||||||
|
|
|
|
|
|
|
|||||||||||
| Total |
7.1 | $ | 72,214 | $ | 23,337 | $ | 48,877 | |||||||||
|
|
|
|
|
|
|
|||||||||||
| Fiscal years ended | ||||||||
| 2015 | 2014 | |||||||
| Non-amortizing intangible assets |
||||||||
| Trademarks and trade names |
$ | 28,591 | $ | 62,898 | ||||
|
|
|
|
|
|||||
Aggregate amortization expense for each of the fiscal years 2015, 2014 and 2013 was approximately $5.8 million, $4.2 million and $3.3 million, respectively.
The Company’s estimated amortization expense for the next five fiscal years is as follows (in thousands):
| 2016 |
5,965 | |||
| 2017 |
5,965 | |||
| 2018 |
5,752 | |||
| 2019 |
5,268 | |||
| 2020 |
4,852 |
F-17
Table of Contents
ENNIS, INC. AND SUBSIDIARIES
NOTES TO CONSOLIDATED FINANCIAL STATEMENTS
(5) Goodwill and Other Intangible Assets-continued
Changes in the net carrying amount of goodwill for fiscal years 2014 and 2015 are as follows (in thousands):
| Print Segment |
Apparel Segment |
Total | ||||||||||
| Balance as of March 1, 2013 |
$ | 47,260 | $ | 74,549 | $ | 121,809 | ||||||
| Goodwill acquired |
12,024 | — | 12,024 | |||||||||
| Goodwill impairment |
— | (18,626 | ) | (18,626 | ) | |||||||
|
|
|
|
|
|
|
|||||||
| Balance as of February 28, 2014 |
59,284 | 55,923 | 115,207 | |||||||||
| Goodwill acquired |
5,205 | — | 5,205 | |||||||||
| Goodwill impairment |
— | (55,923 | ) | (55,923 | ) | |||||||
|
|
|
|
|
|
|
|||||||
| Balance as of February 28, 2015 |
$ | 64,489 | $ | — | $ | 64,489 | ||||||
|
|
|
|
|
|
|
|||||||
During the fiscal year ended February 28, 2014, $12.0 million was added to goodwill related to the acquisition of the Wisco, NIC and Folder Express assets. The adjustment of ($18.6) million reflects an impairment charge related to goodwill recorded in the Apparel segment. During the fiscal year ended February 28, 2015, $12,000 was added to goodwill related to the adjustment of the fair values of certain Wisco assets, $945,000 was added to goodwill related to the acquisition of Sovereign, $4.2 million was added to goodwill related to the acquisition of Kay Toledo, and an adjustment of ($55.9) million reflects an impairment charge related to goodwill recorded in the Apparel segment.
(6) Other Accrued Expenses
The following table summarizes the components of other accrued expenses for the fiscal years ended (in thousands):
| February 28, 2015 |
February 28, 2014 |
|||||||
| Accrued taxes |
$ | 380 | $ | 362 | ||||
| Accrued legal and professional fees |
558 | 964 | ||||||
| Accrued interest |
425 | 193 | ||||||
| Accrued utilities |
131 | 130 | ||||||
| Accrued acquisition related obligations |
127 | 146 | ||||||
| Accrued credit card fees |
277 | 248 | ||||||
| Other accrued expenses |
454 | 469 | ||||||
|
|
|
|
|
|||||
| $ | 2,352 | $ | 2,512 | |||||
|
|
|
|
|
|||||
(7) Long-Term Debt
Long-term debt consisted of the following at fiscal years ended (in thousands):
| February 28, 2015 |
February 28, 2014 |
|||||||
| Revolving credit facility |
$ | 106,500 | $ | 105,500 | ||||
On September 19, 2013, the Company entered into the Third Amendment and Consent to Second Amended and Restated Credit Agreement (the “Agreement”) with a syndicate of lenders led by Bank of America, N.A. (the “Facility”). The Amendment amends and restates the financial covenant relating to Minimum Tangible Net Worth. The amended covenant requires a Minimum Tangible Net Worth of $100 million, with step-ups equal to 25% of consolidated net income. The Facility provides the Company access to $150.0 million in revolving credit, which the Company may increase to $200.0 million in certain circumstances, and matures on August 18, 2016. The Facility
F-18
Table of Contents
ENNIS, INC. AND SUBSIDIARIES
NOTES TO CONSOLIDATED FINANCIAL STATEMENTS
(7) Long-Term Debt-continued
bears interest at the London Interbank Offered Rate (“LIBOR”) plus a spread ranging from 1.0% to 2.25% (LIBOR + 1.5% or 1.75% at February 28, 2015 and 1.7% at February 28, 2014), depending on the Company’s ratio of total funded debt to the sum of net earnings plus interest, tax, depreciation and amortization (“EBITDA”). As of February 28, 2015, the Company had $106.5 million of borrowings under the revolving credit line and $2.8 million outstanding under standby letters of credit arrangements, leaving the Company availability of approximately $40.7 million. The Facility contains financial covenants, restrictions on capital expenditures, acquisitions, asset dispositions, and additional debt, as well as other customary covenants, such as a minimum tangible equity level and the total funded debt to EBITDA ratio. The Company was in compliance with these covenants as of February 28, 2015. The Facility is secured by substantially all of the Company’s domestic assets as well as all capital securities of each of the Company’s U.S. subsidiaries and 65% of all capital securities of each of the Company’s direct foreign subsidiaries.
(8) Shareholders’ Equity
On October 20, 2008, the Board of Directors authorized the repurchase of up to $5.0 million of the common stock through a stock repurchase program. Under the board-approved repurchase program, share purchases may be made from time to time in the open market or through privately negotiated transactions depending on market conditions, share price, trading volume and other factors, and such purchases, if any, will be made in accordance with applicable insider trading and other securities laws and regulations. These repurchases may be commenced or suspended at any time or from time to time without prior notice. On April 20, 2012, the Board increased the authorized amount available to repurchase the Company’s shares by an additional $5.0 million, bringing the total available to repurchase the Company’s common stock at that time to approximately $9.0 million as of that date. On December 19, 2014, the Board increased the authorized amount available to repurchase the Company’s shares by an additional $10.0 million, bringing the total available to repurchase the Company’s common stock at that time to approximately $10.6 million. During fiscal year 2015 the Company repurchased 502,609 shares of common stock at an average price of $13.99 per share. There have been a total of 718,511 common shares repurchased under the program since its inception at an average price of $13.74 per share. Unrelated to the stock repurchase program, the Company purchased 81, 112 and 175 shares of common stock during the fiscal years ended February 28, 2015, February 28, 2014 and February 28, 2013, respectively.
The Company’s revolving credit facility maintains certain restrictions on the amount of treasury shares that may be purchased and distributions to its shareholders.
(9) Stock Option Plan and Stock Based Compensation
The Company grants stock options and restricted stock to key executives and managerial employees and non-employee directors. At fiscal year ended 2015, the Company has one stock option plan: the 2004 Long-Term Incentive Plan of Ennis, Inc., as amended and restated as of June 30, 2011, formerly the 1998 Option and Restricted Stock Plan amended and restated as of May 14, 2008 (the “Plan”). The Company has 775,767 shares of unissued common stock reserved under the plan for issuance. The exercise price of each stock option granted under the Plan equals a referenced price of the Company’s common stock as reported on the New York Stock Exchange on the date of grant, and an option’s maximum term is ten years. Stock options and restricted stock may be granted at different times during the year and vest ratably over various periods, from grant date up to five years. The Company uses treasury stock to satisfy option exercises and restricted stock awards.
The Company recognizes compensation expense for stock options and restricted stock grants on a straight-line basis over the requisite service period. For the years ended 2015, 2014 and 2013, the Company included in selling, general and administrative expenses, compensation expense related to share based compensation of $1.3 million ($0.8 million net of tax), $1.5 million ($1.0 million net of tax) and $1.5 million ($0.9 million net of tax), respectively.
F-19
Table of Contents
ENNIS, INC. AND SUBSIDIARIES
NOTES TO CONSOLIDATED FINANCIAL STATEMENTS
(9) Stock Option Plan and Stock Based Compensation-continued
Stock Options
The Company had the following stock option activity for the three years ended February 28, 2015:
| Number of Shares (exact quantity) |
Weighted Average Exercise Price |
Weighted Average Remaining Contractual Life (in years) |
Aggregate Intrinsic Value(a) (in thousands) |
|||||||||||||
| Outstanding at March 1, 2012 |
310,193 | $ | 15.60 | 6.6 | $ | 626 | ||||||||||
| Granted |
72,707 | 15.48 | ||||||||||||||
| Terminated |
(11,400 | ) | 13.57 | |||||||||||||
| Exercised |
(8,500 | ) | 8.94 | |||||||||||||
|
|
|
|||||||||||||||
| Outstanding at February 28, 2013 |
363,000 | $ | 15.79 | 6.4 | $ | 421 | ||||||||||
| Granted |
36,155 | 14.05 | ||||||||||||||
| Terminated |
(7,750 | ) | 13.30 | |||||||||||||
| Exercised |
(22,000 | ) | 12.59 | |||||||||||||
|
|
|
|||||||||||||||
| Outstanding at February 28, 2014 |
369,405 | $ | 15.86 | 6.0 | $ | 416 | ||||||||||
| Granted |
31,418 | 15.78 | ||||||||||||||
| Terminated |
(20,000 | ) | 16.21 | |||||||||||||
| Exercised |
(6,000 | ) | 8.94 | |||||||||||||
|
|
|
|||||||||||||||
| Outstanding at February 28, 2015 |
374,823 | $ | 15.95 | 5.7 | $ | 210 | ||||||||||
|
|
|
|||||||||||||||
| Exercisable at February 28, 2015 |
295,063 | $ | 16.16 | 5.0 | $ | 210 | ||||||||||
|
|
|
|||||||||||||||
| (a) | Intrinsic value is measured as the excess fair market value of the Company’s Common Stock as reported on the New York Stock Exchange over the applicable exercise price. |
The following is a summary of the assumptions used and the weighted average grant-date fair value of the stock options granted during fiscal years ended 2015, 2014 and 2013:
| 2015 | 2014 | 2013 | ||||||||||
| Expected volatility |
29.25 | % | 30.41 | % | 37.02 | % | ||||||
| Expected term (years) |
3 | 3 | 3 | |||||||||
| Risk free interest rate |
0.91 | % | 0.35 | % | 0.43 | % | ||||||
| Dividend yield |
4.11 | % | 4.63 | % | 4.42 | % | ||||||
| Weighted average grant-date fair value |
$ | 2.70 | $ | 1.96 | $ | 2.83 | ||||||
F-20
Table of Contents
ENNIS, INC. AND SUBSIDIARIES
NOTES TO CONSOLIDATED FINANCIAL STATEMENTS
(9) Stock Option Plan and Stock Based Compensation-continued
A summary of the stock options exercised and tax benefits realized from stock based compensation is presented below for the three fiscal years ended (in thousands):
| Fiscal years ended | ||||||||||||
| 2015 | 2014 | 2013 | ||||||||||
| Total cash received |
$ | 54 | $ | 94 | $ | 85 | ||||||
| Income tax (expense) benefit |
(106 | ) | 17 | 66 | ||||||||
| Total grant-date fair value |
9 | 50 | 13 | |||||||||
| Intrinsic value |
36 | 117 | 54 | |||||||||
A summary of the status of the Company’s unvested stock options at February 28, 2015, and changes during the fiscal year ended February 28, 2015 is presented below:
| Number of Options |
Weighted Average Grant Date Fair Value |
|||||||
| Unvested at February 28, 2014 |
112,211 | $ | 2.89 | |||||
| New grants |
31,418 | 2.70 | ||||||
| Vested |
(63,869 | ) | 3.27 | |||||
| Forfeited |
— | — | ||||||
|
|
|
|||||||
| Unvested at February 28, 2015 |
79,760 | $ | 2.51 | |||||
|
|
|
|||||||
As of February 28, 2015, there was $96,000 of unrecognized compensation cost related to unvested stock options granted under the Plan. The weighted average remaining requisite service period of the unvested stock options was 1.2 years. The total fair value of shares underlying the options vested during the fiscal year ended February 28, 2015 was $0.9 million.
The following table summarizes information about stock options outstanding at the end of fiscal year 2015:
| Options Outstanding | Options Exercisable | |||||||||||||||||||
| Exercise Prices |
Number Outstanding |
Weighted Average Remaining Contractual Life (in Years) |
Weighted Average Exercise Price |
Number Exercisable |
Weighted Average Exercise Price |
|||||||||||||||
| $8.94 to $8.94 |
42,000 | 4.2 | $ | 8.94 | 42,000 | $ | 8.94 | |||||||||||||
| 14.05 to 16.42 |
160,280 | 6.9 | 15.33 | 80,520 | 15.50 | |||||||||||||||
| 17.57 to 19.69 |
172,543 | 5.0 | 18.23 | 172,543 | 18.23 | |||||||||||||||
|
|
|
|
|
|||||||||||||||||
| 374,823 | 5.7 | 15.95 | 295,063 | 16.16 | ||||||||||||||||
|
|
|
|
|
|||||||||||||||||
F-21
Table of Contents
ENNIS, INC. AND SUBSIDIARIES
NOTES TO CONSOLIDATED FINANCIAL STATEMENTS
(9) Stock Option Plan and Stock Based Compensation-continued
Restricted Stock
The Company had the following restricted stock grants activity for each of the three fiscal years ended February 28, 2015:
| Number of Shares |
Weighted Average Grant Date Fair Value |
|||||||
| Outstanding at March 1, 2012 |
131,333 | $ | 17.09 | |||||
| Granted |
92,293 | 15.46 | ||||||
| Terminated |
— | — | ||||||
| Vested |
(36,578 | ) | 16.05 | |||||
|
|
|
|||||||
| Outstanding at February 28, 2013 |
187,048 | $ | 16.49 | |||||
| Granted |
55,607 | 14.05 | ||||||
| Terminated |
— | — | ||||||
| Vested |
(61,753 | ) | 16.40 | |||||
|
|
|
|||||||
| Outstanding at February 28, 2014 |
180,902 | $ | 15.77 | |||||
| Granted |
85,807 | 15.78 | ||||||
| Terminated |
— | — | ||||||
| Vested |
(113,061 | ) | 16.42 | |||||
|
|
|
|||||||
| Outstanding at February 28, 2015 |
153,648 | $ | 15.30 | |||||
|
|
|
|||||||
As of February 28, 2015, the total remaining unrecognized compensation cost related to unvested restricted stock was approximately $1.3 million. The weighted average remaining requisite service period of the unvested restricted stock awards was 1.5 years. As of February 28, 2015, the Company’s outstanding restricted stock had an underlying fair value of $2.4 million at date of grant.
(10) Pension Plan
The Company and certain subsidiaries have a noncontributory defined benefit retirement plan (the “Pension Plan”), covering approximately 8% of aggregate employees. Benefits are based on years of service and the employee’s average compensation for the highest five compensation years preceding retirement or termination. The Company’s funding policy is to contribute annually an amount in accordance with the requirements of the Employee Retirement Income Security Act of 1974 (“ERISA”).
The Company’s pension plan asset allocation, by asset category, is as follows for the fiscal years ended:
| 2015 | 2014 | |||||||
| Equity securities |
55 | % | 56 | % | ||||
| Debt securities |
37 | % | 37 | % | ||||
| Cash and cash equivalents |
8 | % | 7 | % | ||||
|
|
|
|
|
|||||
| Total |
100 | % | 100 | % | ||||
|
|
|
|
|
|||||
The current asset allocation is being managed to meet the Company’s stated objective of asset growth and capital preservation. The factor is based upon the combined judgments of the Company’s Administrative Committee and its investment advisors to meet the Company’s investment needs, objectives, and risk tolerance. The Company’s target asset allocation percentage, by asset class, for the year ended February 28, 2015 is as follows:
F-22
Table of Contents
ENNIS, INC. AND SUBSIDIARIES
NOTES TO CONSOLIDATED FINANCIAL STATEMENTS
(10) Pension Plan-continued
| Asset Class |
Target Allocation Percentage | |
| Cash |
1 - 5% | |
| Fixed Income |
35 - 55% | |
| Equity |
45 - 60% |
The Company estimates the long-term rate of return on plan assets will be 8.0% based upon target asset allocation. Expected returns are developed based upon the information obtained from the Company’s investment advisors. The advisors provide ten-year historical and five-year expected returns on the fund in the target asset allocation. The return information is weighted based upon the asset allocation at the end of the fiscal year. The expected rate of return at the beginning of the fiscal year ended 2015 was 8.0%, the rate used in the calculation of the current year pension expense.
Fair value is the price that would be received to sell an asset or paid to transfer a liability in an orderly transaction between market participants. The hierarchy below lists three levels of fair value based on the extent to which inputs used in measuring fair value are observable in the market. The Company categorizes each of its fair value measurements in one of these three levels based on the lowest level input that is significant to the fair value measurement in its entirety. These levels are:
| Level 1 - | Inputs utilize quoted prices (unadjusted) in active markets for identical assets or liabilities that the Company has the ability to access. |
| Level 2 - | Inputs utilize data points that are observable such as quoted prices, interest rates and yield curves. |
| Level 3 - | Inputs are unobservable data points for the asset or liability, and include situations where there is little, if any, market activity for the asset or liability. |
The following tables present the Plan’s fair value hierarchy for those assets measured at fair value as of February 28, 2015 and 2014 (in thousands):
| Description |
Assets Measured at Fair Value at 2/28/15 |
Fair Value Measurements | ||||||||||||||
| (Level 1) | (Level 2) | (Level 3) | ||||||||||||||
| Cash and cash equivalents |
$ | 4,262 | $ | 4,262 | $ | — | $ | — | ||||||||
| Government bonds |
10,642 | — | 10,642 | — | ||||||||||||
| Corporate bonds |
8,154 | — | 8,154 | — | ||||||||||||
| Domestic equities |
21,974 | 21,974 | — | — | ||||||||||||
| Foreign equities |
5,961 | 5,961 | — | — | ||||||||||||
|
|
|
|
|
|
|
|
|
|||||||||
| $ | 50,993 | $ | 32,197 | $ | 18,796 | $ | — | |||||||||
|
|
|
|
|
|
|
|
|
|||||||||
| Description |
Assets Measured at Fair Value at 2/28/14 |
Fair Value Measurements | ||||||||||||||
| (Level 1) | (Level 2) | (Level 3) | ||||||||||||||
| Cash and cash equivalents |
$ | 3,247 | $ | 3,247 | $ | — | $ | — | ||||||||
| Government bonds |
10,713 | — | 10,713 | — | ||||||||||||
| Corporate bonds |
7,695 | — | 7,695 | — | ||||||||||||
| Domestic equities |
21,928 | 21,928 | — | — | ||||||||||||
| Foreign equities |
5,841 | 5,841 | — | — | ||||||||||||
|
|
|
|
|
|
|
|
|
|||||||||
| $ | 49,424 | $ | 31,016 | $ | 18,408 | $ | — | |||||||||
|
|
|
|
|
|
|
|
|
|||||||||
F-23
Table of Contents
ENNIS, INC. AND SUBSIDIARIES
NOTES TO CONSOLIDATED FINANCIAL STATEMENTS
(10) Pension Plan-continued
Fair value estimates are made at a specific point in time, based on available market information and judgments about the financial asset, including estimates of timing, amount of expected future cash flows, and the credit standing of the issuer. In some cases, the fair value estimates cannot be substantiated by comparison to independent markets. The disclosed fair value may not be realized in the immediate settlement of the financial asset. In addition, the disclosed fair values do not reflect any premium or discount that could result from offering for sale at one time an entire holding of a particular financial asset. Potential taxes and other expenses that would be incurred in an actual sale or settlement are not reflected in amounts disclosed.
Pension expense is composed of the following components included in cost of goods sold and selling, general and administrative expenses in the Company’s consolidated statements of earnings for fiscal years ended (in thousands):
| 2015 | 2014 | 2013 | ||||||||||
| Components of net periodic benefit cost |
||||||||||||
| Service cost |
$ | 1,122 | $ | 1,262 | $ | 1,283 | ||||||
| Interest cost |
2,447 | 2,402 | 2,402 | |||||||||
| Expected return on plan assets |
(3,856 | ) | (3,490 | ) | (3,208 | ) | ||||||
| Amortization of: |
||||||||||||
| Prior service cost |
(145 | ) | (145 | ) | (145 | ) | ||||||
| Unrecognized net loss |
1,524 | 2,052 | 1,823 | |||||||||
|
|
|
|
|
|
|
|||||||
| Net periodic benefit cost |
1,092 | 2,081 | 2,155 | |||||||||
|
|
|
|
|
|
|
|||||||
| Other changes in Plan Assets and Projected Benefit Obligation |
||||||||||||
| Recognized in Other comprehensive Income |
||||||||||||
| Net actuarial loss (gain) |
11,224 | (4,600 | ) | 4,370 | ||||||||
| Amortization of net actuarial loss |
(1,524 | ) | (2,052 | ) | (1,823 | ) | ||||||
| Amortization of prior service credit |
145 | 145 | 145 | |||||||||
|
|
|
|
|
|
|
|||||||
| 9,845 | (6,507 | ) | 2,692 | |||||||||
|
|
|
|
|
|
|
|||||||
| Total recognized in net periodic pension cost and other comprehensive income |
$ | 10,937 | ($ | 4,426 | ) | $ | 4,847 | |||||
|
|
|
|
|
|
|
|||||||
The following table represents the assumptions used to determine benefit obligations and net periodic pension cost for fiscal years ended:
| 2015 | 2014 | 2013 | ||||||||||
| Weighted average discount rate (net periodic pension cost) |
4.90 | % | 4.60 | % | 5.05 | % | ||||||
| Earnings progression (net periodic pension cost) |
3.00 | % | 3.00 | % | 3.00 | % | ||||||
| Expected long-term rate of return on plan assets |
8.00 | % | 8.00 | % | 8.00 | % | ||||||
| Weighted average discount rate (benefit obligations) |
4.00 | % | 4.90 | % | 4.60 | % | ||||||
| Earnings progression (benefit obligations) |
3.00 | % | 3.00 | % | 3.00 | % | ||||||
During the current fiscal year, the Company adopted the new 2014 actuarial mortality tables to determine their benefit obligations under the plan. The accumulated benefit obligation (“ABO”), change in projected benefit obligation (“PBO”), change in plan assets, funded status, and reconciliation to amounts recognized in the consolidated balance sheets are as follows (in thousands):
F-24
Table of Contents
ENNIS, INC. AND SUBSIDIARIES
NOTES TO CONSOLIDATED FINANCIAL STATEMENTS
(10) Pension Plan-continued
| 2015 | 2014 | |||||||
| Change in benefit obligation |
||||||||
| Projected benefit obligation at beginning of year |
$ | 51,339 | $ | 54,315 | ||||
| Service cost |
1,122 | 1,262 | ||||||
| Interest cost |
2,447 | 2,402 | ||||||
| Actuarial (gain)/loss |
6,637 | (3,095 | ) | |||||
| Other assumption change |
3,695 | — | ||||||
| Benefits paid |
(4,395 | ) | (3,545 | ) | ||||
|
|
|
|
|
|||||
| Projected benefit obligation at end of year |
$ | 60,845 | $ | 51,339 | ||||
|
|
|
|
|
|||||
| Change in plan assets: |
||||||||
| Fair value of plan assets at beginning of year |
$ | 49,423 | $ | 44,974 | ||||
| Company contributions |
3,000 | 3,000 | ||||||
| Gains on plan assets |
2,965 | 4,995 | ||||||
| Benefits paid |
(4,395 | ) | (3,545 | ) | ||||
|
|
|
|
|
|||||
| Fair value of plan assets at end of year |
$ | 50,993 | $ | 49,424 | ||||
|
|
|
|
|
|||||
| Funded status (benefit obligation less plan assets) |
($ | 9,852 | ) | ($ | 1,915 | ) | ||
|
|
|
|
|
|||||
| Accumulated benefit obligation at end of year |
$ | 56,170 | $ | 46,815 | ||||
|
|
|
|
|
|||||
The measurement dates used to determine pension and other postretirement benefits is the Company’s fiscal year end. The Company expects to contribute between $2.0 million and $3.0 million during fiscal year 2016.
Estimated future benefit payments which reflect expected future service, as appropriate, are expected to be paid in the fiscal years ended (in thousands):
| Year |
Projected Payments |
|||
| 2016 |
$ | 3,500 | ||
| 2017 |
3,600 | |||
| 2018 |
3,700 | |||
| 2019 |
3,800 | |||
| 2020 |
4,000 | |||
| 2021 - 2025 |
16,300 | |||
Effective February 1, 1994, the Company adopted a Defined Contribution 401(k) Plan (the “401(k) Plan”) for its United States employees. The 401(k) Plan covers substantially all full-time employees who have completed sixty days of service and attained the age of eighteen. United States employees can contribute up to 100 percent of their annual compensation, but are limited to the maximum annual dollar amount allowable under the Internal Revenue Code. The 401(k) Plan provides for employer matching contributions or discretionary employer contributions for certain employees not enrolled in the Pension Plan for employees of the Company. Eligibility for employer contributions, matching percentage, and limitations depends on the participant’s employment location and whether the employees are covered by the Company’s pension plan, etc. The Company’s matching contributions are immediately vested. The Company made matching 401(k) contributions in the amount of $1.2 million, $0.9 million and $0.8 million in fiscal years ended 2015, 2014 and 2013, respectively.
In addition, the Northstar Computer Forms, Inc. 401(k) Profit Sharing Plan was merged into the 401(k) Plan on February 1, 2001. The Company declared profit sharing contributions on behalf of the former employees of Northstar Computer Forms, Inc. in accordance with its original plan in the amounts of $227,000, $254,000, and $258,000, in fiscal years ended 2015, 2014 and 2013, respectively.
F-25
Table of Contents
ENNIS, INC. AND SUBSIDIARIES
NOTES TO CONSOLIDATED FINANCIAL STATEMENTS
(11) Income Taxes
The following table represents components of the provision for income taxes for fiscal years ended (in thousands):
| 2015 | 2014 | 2013 | ||||||||||
| Current: |
||||||||||||
| Federal |
$ | 14,006 | $ | 17,755 | $ | 10,316 | ||||||
| State and local |
2,451 | 2,946 | 2,205 | |||||||||
| Foreign |
322 | 183 | 168 | |||||||||
|
|
|
|
|
|
|
|||||||
| Total current |
16,779 | 20,884 | 12,689 | |||||||||
| Deferred: |
||||||||||||
| Federal |
(9,920 | ) | (1,550 | ) | 803 | |||||||
| State and local |
(1,459 | ) | (731 | ) | 411 | |||||||
|
|
|
|
|
|
|
|||||||
| Total deferred |
(11,379 | ) | (2,281 | ) | 1,214 | |||||||
|
|
|
|
|
|
|
|||||||
| Total provision for income taxes |
$ | 5,400 | $ | 18,603 | $ | 13,903 | ||||||
|
|
|
|
|
|
|
|||||||
The Company’s effective tax rate on earnings from operations for the year ended February 28, 2015, was (13.8)%, as compared with a 58.5% and 36.0% in 2014 and 2013, respectively. The following summary reconciles the statutory U.S. Federal income tax rate to the Company’s effective tax rate for the fiscal years ended:
| 2015 | 2014 | 2013 | ||||||||||
| Statutory rate |
35.0 | % | 35.0 | % | 35.0 | % | ||||||
| Provision for state income taxes, net of Federal income tax benefit |
(1.9 | ) | 3.9 | 3.7 | ||||||||
| Domestic production activities deduction |
3.5 | (4.8 | ) | (2.9 | ) | |||||||
| Impairment of goodwill |
(50.0 | ) | 20.5 | — | ||||||||
| Other |
(0.4 | ) | 3.9 | 0.2 | ||||||||
|
|
|
|
|
|
|
|||||||
| (13.8 | )% | 58.5 | % | 36.0 | % | |||||||
|
|
|
|
|
|
|
|||||||
Included in other assets on the consolidated balance sheets is approximately $2.3 million of refund receivable related to amended Canadian tax returns for fiscal years 2006-2008.
Deferred taxes are recorded to give recognition to temporary differences between the tax basis of assets and liabilities and their reported amounts in the financial statements. The tax effects of these temporary differences are recorded as deferred tax assets and deferred tax liabilities. Deferred tax assets generally represent items that can be used as a tax deduction or credit in future years. Deferred tax liabilities generally represent items that have been deducted for tax purposes, but have not yet been recorded in the consolidated statements of earnings. To the extent there are deferred tax assets that are more likely than not to be realized, a valuation allowance would not be recorded. The components of deferred income tax assets and liabilities are summarized as follows (in thousands) for fiscal years ended:
F-26
Table of Contents
ENNIS, INC. AND SUBSIDIARIES
NOTES TO CONSOLIDATED FINANCIAL STATEMENTS
(11) Income Taxes-continued
| 2015 | 2014 | |||||||
| Current deferred tax assets related to: |
||||||||
| Allowance for doubtful receivables |
$ | 1,356 | $ | 1,395 | ||||
| Inventories |
2,745 | 2,661 | ||||||
| Employee compensation and benefits |
2,305 | 2,275 | ||||||
| Other |
(134 | ) | (69 | ) | ||||
|
|
|
|
|
|||||
| $ | 6,272 | $ | 6,262 | |||||
|
|
|
|
|
|||||
| Non-current deferred tax (liabilities) assets related to: |
||||||||
| Property, plant and equipment |
$ | (9,087 | ) | $ | (4,682 | ) | ||
| Goodwill and other intangible assets |
(10,556 | ) | (21,913 | ) | ||||
| Pension and noncurrent employee compensation benefits |
6,064 | 2,384 | ||||||
| Net operating loss and foreign tax credits |
113 | 381 | ||||||
| Property tax |
(367 | ) | (634 | ) | ||||
| Currency exchange |
2,842 | 560 | ||||||
| Stock options exercised |
747 | 1,003 | ||||||
| Other |
(4 | ) | (3 | ) | ||||
|
|
|
|
|
|||||
| $ | (10,248 | ) | $ | (22,904 | ) | |||
|
|
|
|
|
|||||
Included in other non-current deferred tax (liabilities) assets are currency exchange, stock options exercised, and the valuation allowance. As of the fiscal year ended 2015, the Company has federal net operating loss carry forwards of approximately $323,000 expiring in fiscal years 2023 through 2025. Based on historical earnings and expected sufficient future taxable income, management believes it will be able to fully utilize the net operating loss carry forwards.
Accounting standards require a two-step approach to determine how to recognize tax benefits in the financial statements where recognition and measurement of a tax benefit must be evaluated separately. A tax benefit will be recognized only if it meets a “more-likely-than-not” recognition threshold. For tax positions that meet this threshold, the tax benefit recognized is based on the largest amount of tax benefit that is greater than 50 percent likely of being realized upon ultimate settlement with the taxing authority.
At fiscal year-end 2015 and 2014, unrecognized tax benefits related to uncertain tax positions, including accrued interest and penalties of $329,481 and $246,000, respectively, are included in other liabilities on the consolidated balance sheets and would impact the effective rate if recognized. For fiscal year 2015, the unrecognized tax benefit includes an aggregate of $17,000 of interest expense. Approximately $17,000 of unrecognized tax benefits relate to items that are affected by expiring statutes of limitations within the next 12 months. A reconciliation of the change in the unrecognized tax benefits for fiscal years ended 2015 and 2014 is as follows (in thousands):
| 2015 | 2014 | |||||||
| Balance at beginning of year |
$ | 246 | $ | 96 | ||||
| Additions (reductions) based on tax positions related to the current year |
166 | 182 | ||||||
| Reductions due to lapses of statutes of limitations |
(82 | ) | (32 | ) | ||||
|
|
|
|
|
|||||
| Balance at end of year |
$ | 330 | $ | 246 | ||||
|
|
|
|
|
|||||
The Company is subject to U.S. federal income tax as well as income tax of multiple state jurisdictions and foreign tax jurisdictions. The Company has concluded all U.S. Federal income tax matters for years through 2009. All material state and local income tax matters have been concluded for years through 2009 and foreign tax jurisdictions through 2009.
F-27
Table of Contents
ENNIS, INC. AND SUBSIDIARIES
NOTES TO CONSOLIDATED FINANCIAL STATEMENTS
(11) Income Taxes-continued
The Company recognizes interest expense on underpayments of income taxes and accrued penalties related to unrecognized non-current tax benefits as part of the income tax provision. Other than amounts included in the unrecognized tax benefits, the Company did not recognize any interest or penalties for the fiscal years ended 2015, 2014 and 2013.
(12) Earnings (loss) per Share
Basic earnings (loss) per share have been computed by dividing net earnings (loss) by the weighted average number of common shares outstanding during the applicable period. Diluted earnings (loss) per share reflect the potential dilution that could occur if stock options or other contracts to issue common shares were exercised or converted into common stock. The following table sets forth the computation for basic and diluted earnings (loss) per share for the fiscal years ended:
| 2015 | 2014 | 2013 | ||||||||||
| Basic weighted average common shares outstanding |
25,864,352 | 26,125,348 | 26,035,571 | |||||||||
| Effect of dilutive options |
— | 20,977 | 17,881 | |||||||||
|
|
|
|
|
|
|
|||||||
| Diluted weighted average common shares outstanding |
25,864,352 | 26,146,325 | 26,053,452 | |||||||||
|
|
|
|
|
|
|
|||||||
| Per share amounts: |
||||||||||||
| Net earnings (loss) – basic |
$ | (1.72 | ) | $ | 0.50 | $ | 0.95 | |||||
|
|
|
|
|
|
|
|||||||
| Net earnings (loss) – diluted |
$ | (1.72 | ) | $ | 0.50 | $ | 0.95 | |||||
|
|
|
|
|
|
|
|||||||
| Cash dividends |
$ | 0.70 | $ | 0.53 | $ | 0.88 | ||||||
|
|
|
|
|
|
|
|||||||
The Company treats unvested share-based payment awards that contain non-forfeitable rights to dividends or dividend equivalents (whether paid or unpaid) as participating securities, which are included in the computation of earnings (loss) per share pursuant to the two-class method. The Company’s participating securities are comprised of unvested restricted stock.
(13) Segment Information and Geographic Information
The Company operates in two segments – the Print Segment and the Apparel Segment.
The Print Segment, which represented 66% of the Company’s consolidated net sales for fiscal year 2015, is in the business of manufacturing, designing, and selling business forms and other printed business products primarily to distributors located in the United States. The Print Segment operates 58 manufacturing plants throughout the United States in 22 strategically located states. Approximately 96% of the business products manufactured by the Print Segment are custom and semi-custom products, constructed in a wide variety of sizes, colors, number of parts and quantities on an individual job basis depending upon the customers’ specifications.
The products sold include snap sets, continuous forms, laser cut sheets, tags, labels, envelopes, integrated products, jumbo rolls and pressure sensitive products in short, medium and long runs under the following labels: Ennis®, Royal Business Forms®, Block Graphics®, Specialized Printed Forms®, 360º Custom LabelsSM, ColorWorx®, Enfusion®, Uncompromised Check Solutions®, VersaSeal®, Witt Printing®, B&D Litho®, Genforms®, PrintGraphicsSM, Calibrated Forms®, PrintXcel™, Printegra®, Curtis Business FormsSM, Falcon Business FormsSM, Forms ManufacturersSM, Mutual GraphicsSM and TRI-C Business FormsSM. The Print Segment also sells the Adams-McClure® brand (which provides Point of Purchase advertising for large franchise and fast food chains as well as kitting and fulfillment); the Admore® and Folder Express® brands (which provide presentation folders and document folders); Ennis Tag & LabelSM (which provides tags and labels, promotional products and advertising concept products); Atlas Tag & Label®, Kay Toledo TagSM, Special Service PartnersSM (SSP) (which provides tags and labels); Trade Envelopes® and Block Graphics®, Wisco® and National Imprint Corporation® (which provide custom and
F-28
Table of Contents
ENNIS, INC. AND SUBSIDIARIES
NOTES TO CONSOLIDATED FINANCIAL STATEMENTS
(13) Segment Information and Geographic Information-continued
imprinted envelopes) and Northstar® and General Financial Supply® (which provide financial and security documents).
The Print Segment sells predominantly through private printers and independent distributors. Northstar also sells direct to a small number of customers. Northstar has continued its focus with large banking organizations on a direct basis (where a distributor is not acceptable or available to the end-user) and has acquired several of the top 25 banks in the United States as customers and is actively working on other large banks within the top 25 tier of banks in the United States. Adams-McClure sales are generally provided through advertising agencies. Assets in this segment increased in 2015 primarily as a result of the Company’s acquisition of Sovereign Business Forms and Kay Toledo.
The Apparel Segment, which accounted for 34% of the Company’s fiscal year 2015 consolidated net sales, consists of Alstyle Apparel. This group is primarily engaged in the production and sale of activewear including t-shirts, fleece goods, and other wearables. Alstyle sales are seasonal, with sales in the first and second quarters generally being the highest. Substantially all of the Apparel Segment sales are to customers in the United States.
Corporate information is included to reconcile segment data to the consolidated financial statements and includes assets and expenses related to the Company’s corporate headquarters and other administrative costs.
Segment data for the fiscal years ended 2015, 2014 and 2013 were as follows (in thousands):
| Print Segment |
Apparel Segment |
Corporate | Consolidated Totals |
|||||||||||||
| Fiscal year ended February 28, 2015: |
||||||||||||||||
| Net sales |
$ | 380,379 | $ | 199,861 | $ | — | $ | 580,240 | ||||||||
| Depreciation |
6,510 | 3,727 | 268 | 10,505 | ||||||||||||
| Amortization of identifiable intangibles |
4,312 | 1,467 | — | 5,779 | ||||||||||||
| Impairment of goodwill and trademarks |
— | 93,324 | — | 93,324 | ||||||||||||
| Segment earnings (loss) before income tax |
66,374 | (89,632 | ) | (15,875 | ) | (39,133 | ) | |||||||||
| Segment assets |
248,916 | 183,778 | 20,568 | 453,262 | ||||||||||||
| Capital expenditures |
1,977 | 460 | 42 | 2,479 | ||||||||||||
| Fiscal year ended February 28, 2014: |
||||||||||||||||
| Net sales |
$ | 339,947 | $ | 202,495 | $ | — | $ | 542,442 | ||||||||
| Depreciation |
5,804 | 3,845 | 205 | 9,854 | ||||||||||||
| Amortization of identifiable intangibles |
2,749 | 1,467 | — | 4,216 | ||||||||||||
| Impairment of goodwill and trademarks |
— | 24,226 | — | 24,226 | ||||||||||||
| Segment earnings (loss) before income tax |
57,390 | (9,467 | ) | (16,131 | ) | 31,792 | ||||||||||
| Segment assets |
221,937 | 302,020 | 12,390 | 536,347 | ||||||||||||
| Capital expenditures |
2,746 | 1,228 | 672 | 4,646 | ||||||||||||
| Fiscal year ended February 28, 2013: |
||||||||||||||||
| Net sales |
$ | 334,701 | $ | 198,805 | $ | — | $ | 533,506 | ||||||||
| Depreciation |
5,895 | 3,815 | 247 | 9,957 | ||||||||||||
| Amortization of identifiable intangibles |
1,811 | 1,467 | — | 3,278 | ||||||||||||
| Segment earnings (loss) before income tax |
54,224 | 247 | (15,853 | ) | 38,618 | |||||||||||
| Segment assets |
167,329 | 313,790 | 14,173 | 495,292 | ||||||||||||
| Capital expenditures |
2,513 | 12 | 35 | 2,560 | ||||||||||||
F-29
Table of Contents
ENNIS, INC. AND SUBSIDIARIES
NOTES TO CONSOLIDATED FINANCIAL STATEMENTS
(13) Segment Information and Geographic Information-continued
Identifiable long-lived assets by country include property, plant, and equipment, net of accumulated depreciation. The Company attributes revenues from external customers to individual geographic areas based on the country where the sale originated. Information about the Company’s operations in different geographic areas as of and for the fiscal years ended is as follows (in thousands):
| United States | Canada | Mexico | Total | |||||||||||||
| 2015 |
||||||||||||||||
| Net sales to unaffiliated customers |
||||||||||||||||
| Print Segment |
$ | 380,379 | $ | — | $ | — | $ | 380,379 | ||||||||
| Apparel Segment |
180,988 | 17,503 | 1,370 | 199,861 | ||||||||||||
|
|
|
|
|
|
|
|
|
|||||||||
| $ | 561,367 | $ | 17,503 | $ | 1,370 | $ | 580,240 | |||||||||
|
|
|
|
|
|
|
|
|
|||||||||
| Identifiable long-lived assets |
||||||||||||||||
| Print Segment |
$ | 51,625 | $ | — | $ | — | $ | 51,625 | ||||||||
| Apparel Segment |
93 | 54 | 37,556 | 37,703 | ||||||||||||
| Corporate |
3,547 | — | — | 3,547 | ||||||||||||
|
|
|
|
|
|
|
|
|
|||||||||
| $ | 55,265 | $ | 54 | $ | 37,556 | $ | 92,875 | |||||||||
|
|
|
|
|
|
|
|
|
|||||||||
| 2014 |
||||||||||||||||
| Net sales to unaffiliated customers |
||||||||||||||||
| Print Segment |
$ | 339,947 | $ | — | $ | — | $ | 339,947 | ||||||||
| Apparel Segment |
183,335 | 18,694 | 466 | 202,495 | ||||||||||||
|
|
|
|
|
|
|
|
|
|||||||||
| $ | 523,282 | $ | 18,694 | $ | 466 | $ | 542,442 | |||||||||
|
|
|
|
|
|
|
|
|
|||||||||
| Identifiable long-lived assets |
||||||||||||||||
| Print Segment |
$ | 43,849 | $ | — | $ | — | $ | 43,849 | ||||||||
| Apparel Segment |
147 | 40 | 43,757 | 43,944 | ||||||||||||
| Corporate |
3,772 | — | — | 3,772 | ||||||||||||
|
|
|
|
|
|
|
|
|
|||||||||
| $ | 47,768 | $ | 40 | $ | 43,757 | $ | 91,565 | |||||||||
|
|
|
|
|
|
|
|
|
|||||||||
| 2013 |
||||||||||||||||
| Net sales to unaffiliated customers |
||||||||||||||||
| Print Segment |
$ | 334,701 | $ | — | $ | — | $ | 334,701 | ||||||||
| Apparel Segment |
180,215 | 17,806 | 784 | 198,805 | ||||||||||||
|
|
|
|
|
|
|
|
|
|||||||||
| $ | 514,916 | $ | 17,806 | $ | 784 | $ | 533,506 | |||||||||
|
|
|
|
|
|
|
|
|
|||||||||
| Identifiable long-lived assets |
||||||||||||||||
| Print Segment |
$ | 41,106 | $ | — | $ | — | $ | 41,106 | ||||||||
| Apparel Segment |
240 | 26 | 47,237 | 47,503 | ||||||||||||
| Corporate |
3,304 | — | — | 3,304 | ||||||||||||
|
|
|
|
|
|
|
|
|
|||||||||
| $ | 44,650 | $ | 26 | $ | 47,237 | $ | 91,913 | |||||||||
|
|
|
|
|
|
|
|
|
|||||||||
F-30
Table of Contents
ENNIS, INC. AND SUBSIDIARIES
NOTES TO CONSOLIDATED FINANCIAL STATEMENTS
(14) Commitments and Contingencies
The Company leases certain of its facilities under operating leases that expire on various dates through fiscal year ended 2020. Future minimum lease commitments under non-cancelable operating leases for each of the fiscal years ending are as follows (in thousands):
| Operating Lease Commitments |
||||
| 2016 |
$ | 5,943 | ||
| 2017 |
3,623 | |||
| 2018 |
1,759 | |||
| 2019 |
265 | |||
| 2020 |
34 | |||
| Thereafter |
— | |||
|
|
|
|||
| $ | 11,624 | |||
|
|
|
|||
Rent expense attributable to such leases totaled $7.7 million, $7.0 million, and $6.8 million for the fiscal years ended 2015, 2014 and 2013, respectively.
In the ordinary course of business, the Company also enters into real property leases, which require the Company as lessee to indemnify the lessor from liabilities arising out of the Company’s occupancy of the properties. The Company’s indemnification obligations are generally covered under the Company’s general insurance policies.
From time to time, the Company is involved in various litigation matters arising in the ordinary course of business. The Company does not believe the disposition of any current matter will have a material adverse effect on its consolidated financial position or results of operations.
(15) Supplemental Cash Flow Information
Net cash flows from operating activities reflect cash payments for interest and income taxes as follows for the three fiscal years ended (in thousands):
| 2015 | 2014 | 2013 | ||||||||||
| Interest paid |
$ | 1,793 | $ | 1,195 | $ | 1,456 | ||||||
| Income taxes paid |
$ | 19,523 | $ | 17,799 | $ | 13,694 | ||||||
F-31
Table of Contents
ENNIS, INC. AND SUBSIDIARIES
NOTES TO CONSOLIDATED FINANCIAL STATEMENTS
(16) Quarterly Consolidated Financial Information (Unaudited)
The following table represents the unaudited quarterly financial data of the Company for fiscal years ended 2015 and 2014 (in thousands, except per share amounts and quarter over quarter comparison):
| For the Three Months Ended |
May 31 | August 31 | November 30 | February 28 | ||||||||||||
| Fiscal year ended 2015: |
||||||||||||||||
| Net sales |
$ | 141,186 | $ | 151,841 | $ | 146,971 | $ | 140,242 | ||||||||
| Gross profit margin |
35,388 | 38,188 | 36,516 | 35,384 | ||||||||||||
| Net earnings (loss) |
8,032 | 10,016 | (71,179 | ) | 8,598 | |||||||||||
| Dividends paid |
4,567 | 4,574 | 4,548 | 4,502 | ||||||||||||
| Per share of common stock: |
||||||||||||||||
| Basic net earnings (loss) |
$ | 0.31 | $ | 0.39 | $ | (2.76 | ) | $ | 0.34 | |||||||
| Diluted net earnings (loss) |
$ | 0.31 | $ | 0.39 | $ | (2.76 | ) | $ | 0.34 | |||||||
| Dividends |
$ | 0.175 | $ | 0.175 | $ | 0.175 | $ | 0.175 | ||||||||
| For the Three Months Ended |
May 31 | August 31 | November 30 | February 28 | ||||||||||||
| Fiscal year ended 2014: |
||||||||||||||||
| Net sales |
$ | 138,466 | $ | 135,288 | $ | 136,550 | $ | 132,138 | ||||||||
| Gross profit margin |
35,795 | 36,659 | 37,759 | 33,580 | ||||||||||||
| Net earnings (loss) |
8,506 | 9,801 | 9,349 | (14,467 | ) | |||||||||||
| Dividends paid |
— | 4,587 | 4,588 | 4,590 | ||||||||||||
| Per share of common stock: |
||||||||||||||||
| Basic net earnings (loss) |
$ | 0.33 | $ | 0.38 | $ | 0.36 | $ | (0.55 | ) | |||||||
| Diluted net earnings (loss) |
$ | 0.33 | $ | 0.38 | $ | 0.36 | $ | (0.55 | ) | |||||||
| Dividends |
$ | — | $ | 0.175 | $ | 0.175 | $ | 0.175 | ||||||||
Current Quarter Compared to Same Quarter Last Year
For the third quarter ended November 30, 2014, a non-cash impairment charge of $93.3 million ($55.9 million to goodwill and $37.4 million to trademarks) related to the apparel segment was recorded. In each quarter for fiscal year ended February 28, 2015, the Company’s net sales increased in comparison to each of the quarters of the previous fiscal year. The primary reason for the increase was the Company’s Print Segment acquisitions of the Custom Envelope Division, Folder Express, Sovereign and Kay Toledo.
| (1) | During the first quarter of fiscal year 2014, no dividend payment was made because of the Board’s decision to accelerate the normal first quarter payment for fiscal year 2014 into fiscal year 2013. |
F-32
Table of Contents
ENNIS, INC. AND SUBSIDIARIES
NOTES TO CONSOLIDATED FINANCIAL STATEMENTS
(17) Concentrations of Risk
Financial instruments that potentially subject the Company to a concentration of credit risk principally consist of cash and trade receivables. Cash is placed with high-credit quality financial institutions. The Company believes its credit risk with respect to trade receivables is limited due to industry and geographic diversification. As disclosed on the Consolidated Balance Sheets, the Company maintains an allowance for doubtful receivables to cover the Company’s estimate of credit losses associated with accounts receivable.
The Company, for quality and pricing reasons, purchases its paper, cotton and yarn products from a limited number of suppliers. To maintain its high standard of color control associated with its apparel products, the Company purchases its dyeing chemicals from limited sources. While other sources may be available to the Company to purchase these products, they may not be available at the cost or at the quality the Company has come to expect.
For the purposes of the Consolidated Statements of Cash Flows, the Company considers cash to include cash on hand and in bank accounts. The Federal Deposit Insurance Corporation (“FDIC”) insures accounts up to $250,000. At February 28, 2015, cash balances included $12.3 million that was not federally insured because it represented amounts in individual accounts above the federally insured limit for each such account. This at-risk amount is subject to fluctuation on a daily basis. While management does not believe there is significant risk with respect to such deposits, we cannot be assured that we will not experience losses on our deposits. At February 28, 2015, the Company had $0.8 million in Canadian and $1.1 million in Mexican bank accounts.
F-33
Table of Contents
INDEX TO EXHIBITS
| Exhibit Number |
Description of Document | |
| Exhibit 3.1(a) |
Restated Articles of Incorporation, as amended through June 23, 1983 with attached amendments dated June 20, 1985, July 31, 1985 and June 16, 1988, incorporated herein by reference to Exhibit 5 to the Registrant’s Annual Report on Form 10-K for the fiscal year ended February 28, 1993 (File No. 001-05807). | |
| Exhibit 3.1(b) |
Amendment to Articles of Incorporation, dated June 17, 2004, incorporated herein by reference to Exhibit 3.1(b) to the Registrant’s Annual Report on Form 10-K for the fiscal year ended February 28, 2007 (File No. 001-05807). | |
| Exhibit 3.2 |
Third Amended and Restated Bylaws of Ennis, Inc., dated April 17, 2014, incorporated herein by reference to Exhibit 3.1 to the Registrant’s Current Report on Form 8-K filed on April 21, 2014 (File No. 001-05807). | |
| Exhibit 10.1 |
Third Amendment and Consent to Second Amended and Restated Credit Agreement between Ennis, Inc., each of the other co-borrowers who are parties, Bank of America, N.A. as Administrative Agent, Swing Line Lender and L/C Issuer, Regions Bank, as Syndication Agent, Comerica Bank, as Documentation Agent and the other lenders who are parties, dated as of September 20, 2013 herein incorporated by reference to Exhibit 10.1 to the Registrant’s Form 8-K filed on September 20, 2013 (File No. 001-05807). | |
| Exhibit 10.2 |
2004 Long-Term Incentive Plan, as amended and restated effective June 30, 2011, incorporated herein by reference to Appendix A of the Registrant’s Form DEF 14A filed on May 26, 2011. | |
| Exhibit 10.3 |
Amended and Restated Chief Executive Officer Employment Agreement between Ennis, Inc. and Keith S. Walters, effective as of December 19, 2008, herein incorporated by reference to Exhibit 10.1 to the Registrant’s Form 8-K file on January 20, 2009 (File No. 001-05807). | |
| Exhibit 10.4 |
Amended and Restated Executive Employment Agreement between Ennis, Inc. and Michael D. Magill, effective as of December 19, 2008, herein incorporated by reference to Exhibit 10.2 to the Registrant’s Form 8-K filed on January 20, 2009 (File No. 001-05807). | |
| Exhibit 10.5 |
Amended and Restated Executive Employment Agreement between Ennis, Inc. and Ronald M. Graham, effective as of December 19, 2008, herein incorporated by reference to Exhibit 10.3 to the Registrant’s Form 8-K filed on January 20, 2009 (File No. 001-05807). | |
| Exhibit 10.6 |
Amended and Restated Executive Employment Agreement between Ennis, Inc. and Richard L. Travis, Jr., effective as of December 19, 2008, herein incorporated by reference to Exhibit 10.4 to the Registrant’s Form 8-K filed on January 20, 2009 (File No. 001-05807). | |
| Exhibit 10.7 |
Amended and Restated Executive Employment Agreement between Ennis, Inc. and Irshad Ahmad, effective as of December 19, 2008, herein incorporated by reference to Exhibit 10.5 to the Registrant’s Form 8-K filed on January 20, 2009 (File No. 001-05807). | |
| Exhibit 21 |
Subsidiaries of Registrant | |
| Exhibit 23 |
Consent of Independent Registered Public Accounting Firm | |
| Exhibit 31.1 |
Certification Pursuant to Rule 13a-14(a)/15d-14(a) (Chief Executive Officer) | |
| Exhibit 31.2 |
Certification Pursuant to Rule 13a-14(a)/15d-14(a) (Chief Financial Officer) | |
| Exhibit 32.1 |
Certification pursuant to 18 U.S.C. Section 1350, as adopted pursuant to Section 906 of the Sarbanes-Oxley Act of 2002 | |
| Exhibit 32.2 |
Certification pursuant to 18 U.S.C. Section 1350, as adopted pursuant to Section 906 of the Sarbanes-Oxley Act of 2002 | |
| Exhibit 101 |
The following information from Ennis, Inc.’s Annual Report on Form 10-K for the year ended February 28, 2015, filed on May 8, 2015, formatted in XBRL: (i) Consolidated Balance Sheets, (ii) Consolidated Statements of Earnings, (iii) Consolidated Statements of Cash Flows, and (iv) the Notes to Consolidated Financial Statements, tagged as blocks of text and in detail. | |
E-1