Attached files
| file | filename |
|---|---|
| EX-32.1 - EXHIBIT 32.1 - EAGLE FINANCIAL SERVICES INC | efsi-20191231exhibit321.htm |
| EX-31.2 - EXHIBIT 31.2 - EAGLE FINANCIAL SERVICES INC | efsi-20191231exhibit312.htm |
| EX-31.1 - EXHIBIT 31.1 - EAGLE FINANCIAL SERVICES INC | efsi-20191231exhibit311.htm |
| EX-23.1 - EXHIBIT 23.1 - EAGLE FINANCIAL SERVICES INC | efsi-20191231exhibit231.htm |
| EX-21.1 - EXHIBIT 21.1 - EAGLE FINANCIAL SERVICES INC | efsi-20191231exhibit211.htm |
| EX-10.10 - EXHIBIT 10.10 - EAGLE FINANCIAL SERVICES INC | efsi-20191231exhibit1010.htm |
| EX-10.9 - EXHIBIT 10.9 - EAGLE FINANCIAL SERVICES INC | efsi-20191231exhibit109.htm |
| EX-10.6 - EXHIBIT 10.6 - EAGLE FINANCIAL SERVICES INC | efsi-20191231exhibit106.htm |
| EX-10.5 - EXHIBIT 10.5 - EAGLE FINANCIAL SERVICES INC | efsi-20191231exhibit105.htm |
| EX-10.2 - EXHIBIT 10.2 - EAGLE FINANCIAL SERVICES INC | efsi-20191231exhibit102.htm |
| EX-4.1 - EXHIBIT 4.1 - EAGLE FINANCIAL SERVICES INC | efsi-20191231exhibit41.htm |
UNITED STATES
SECURITIES AND EXCHANGE COMMISSION
WASHINGTON, D.C. 20549
FORM 10-K
(Mark One)
ý | ANNUAL REPORT PURSUANT TO SECTION 13 OR 15(d) OF THE SECURITIES EXCHANGE ACT OF 1934 |
For the fiscal year ended December 31, 2019
Commission File Number: 0-20146
EAGLE FINANCIAL SERVICES, INC.
(Exact name of registrant as specified in its charter)
Virginia | 54-1601306 | |
(State or other jurisdiction of incorporation or organization) | (I.R.S. Employer Identification No.) | |
2 East Main Street P.O. Box 391 Berryville, Virginia | 22611 | |
(Address of principal executive offices) | (Zip Code) | |
(540) 955-2510
(Registrant’s telephone number, including area code)
Securities registered pursuant to Section 12(b) of the Act:
Title of each class | Trading Symbol(s) | Name of each exchange on which registered |
None | ||
Securities registered pursuant to Section 12(g) of the Act:
Common Stock, Par Value $2.50
(Title of class)
Indicate by check mark if the registrant is a well-known seasoned issuer, as defined in Rule 405 of the Securities Act. Yes ¨ No ý
Indicate by check mark if the registrant is not required to file reports pursuant to Section 13 or Section 15(d) of the Act. Yes ¨ No ý
Indicate by check mark whether the registrant (1) has filed all reports required to be filed by Section 13 or 15(d) of the Securities Exchange Act of 1934 during the preceding 12 months (or for such shorter period that the registrant was required to file such reports), and (2) has been subject to such filing requirements for the past 90 days. Yes ý No ¨
Indicate by check mark whether the registrant has submitted electronically every Interactive Data File required to be submitted pursuant to Rule 405 of Regulation S-T (232.405 of this Chapter) during the preceding 12 months (or for such shorter period that the registrant was required to submit and post such files). Yes ý No ¨
Indicate by check mark whether the registrant is a large accelerated filer, an accelerated filer, a non-accelerated filer, smaller reporting company, or an emerging growth company. See the definitions of “large accelerated filer,” “accelerated filer,” “smaller reporting company,” and "emerging growth company" in Rule 12b-2 of the Exchange Act.
Large accelerated filer | ¨ | Accelerated filer | ý | |||
Non-accelerated filer | ¨ | Smaller reporting company | ý | |||
Emerging growth company | ¨ | |||||
If an emerging growth company, indicate by check mark if the registrant has elected not to use the extended transition period for complying with any new or revised financial accounting standards provided pursuant to Section 13(a) of the Exchange Act. | ¨ | |||||
Indicate by check mark whether the registrant is a shell company (as defined in Rule 12b-2 of the Exchange Act). Yes ¨ No ý
The aggregate market value of the voting common equity held by non-affiliates of the registrant at June 30, 2019 was $81,841,488.
The number of shares of the registrant’s Common Stock ($2.50 par value) outstanding as of March 2, 2020 was 3,442,334.
DOCUMENTS INCORPORATED BY REFERENCE
Portions of the registrant’s Proxy Statement for the 2020 Annual Meeting of Shareholders are incorporated by reference into Part III.
EAGLE FINANCIAL SERVICES, INC.
INDEX TO FORM 10-K
PART I | ||
Item 1. | Business | |
Item 1A. | Risk Factors | |
Item 1B. | Unresolved Staff Comments | |
Item 2. | Properties | |
Item 3. | Legal Proceedings | |
Item 4. | Mine Safety Disclosures | |
PART II | ||
Item 5. | Market for Registrant’s Common Equity, Related Stockholder Matters and Issuer Purchases of Equity Securities | |
Item 6. | Selected Financial Data | |
Item 7. | Management’s Discussion and Analysis of Financial Condition and Results of Operations | |
Item 7A. | Quantitative and Qualitative Disclosures about Market Risk | |
Item 8. | Financial Statements and Supplementary Data | |
Item 9. | Changes in and Disagreements with Accountants on Accounting and Financial Disclosure | |
Item 9A. | Controls and Procedures | |
Item 9B. | Other Information | |
PART III | ||
Item 10. | Directors, Executive Officers and Corporate Governance | |
Item 11. | Executive Compensation | |
Item 12. | Security Ownership of Certain Beneficial Owners and Management and Related Stockholder Matters | |
Item 13. | Certain Relationships and Related Transactions, and Director Independence | |
Item 14. | Principal Accounting Fees and Services | |
PART IV | ||
Item 15. | Exhibits, Financial Statement Schedules | |
Item 16. | Form 10-K Summary | |
3
PART I
Item 1. Business
General
Eagle Financial Services, Inc. (the “Company”) is a bank holding company that was incorporated in 1991. The company is headquartered in Berryville, Virginia and conducts its operations through its subsidiary, Bank of Clarke County (the “Bank”). The Bank is chartered under Virginia law.
The Bank has twelve full-service branches and one drive-through only facility. The Bank’s main office is located at 2 East Main Street in Berryville, Virginia. The Bank opened for business on April 1, 1881. The Bank has offices located in Clarke County, Frederick County, and Loudoun County, as well as the Towns of Leesburg and Purcellville and the City of Winchester. This market area is located in the Shenandoah Valley and Northern Virginia.
The Bank offers a wide range of retail and commercial banking services, including demand, savings and time deposits and consumer, mortgage and commercial loans. The Bank has thirteen ATM locations in its trade area and issues both ATM cards and Debit cards to deposit customers. These cards can be used to withdraw cash at most ATM’s through the Bank’s membership in both regional and national networks. These cards can also be used to make purchases at retailers who accept transactions through the same regional and national networks. The Bank offers telephone banking, internet banking, and mobile banking to its customers. Internet banking also offers online bill payment to consumer and commercial customers. The Bank offers other commercial deposit account services such as ACH origination and remote deposit capture.
Eagle Investment Group (“EIG”), a division of the Bank, offers both a trust department and investment services. The trust services division of EIG offers a full range of personal and retirement plan services, which include serving as agent for bill paying and custody of assets, as investment manager with full authority or advisor, as trustee or co-trustee for trusts under will or under agreement, as trustee of life insurance trusts, as guardian or committee, as agent under a power of attorney, as executor or co-executor for estates, as custodian or investment advisor for individual retirement plans, and as trustee or trust advisor for corporate retirement plans such as profit sharing and 401(k) plans. The brokerage division of EIG offers a full range of investment services, which include tax-deferred annuities, IRAs and rollovers, mutual funds, retirement plans, 529 college savings plans, life insurance, long term care insurance, fixed income investing, brokerage CDs, and full service or discount brokerage services. Non-deposit investment products are offered through a third party provider.
The Bank of Clarke County, is a partner in Bankers Title Shenandoah, LLC, which sells title insurance and is an investor in Virginia Bankers Insurance Center, LLC, which serves as the broker for insurance sales through its member banks. Bank of Clarke County is also an investor in building rehabilitation projects in surrounding states. These investments generate tax credits for the Bank.
Employees
The Company, including the Bank, had 56 officers, 113 other full-time and 22 part-time employees (or 175 full-time equivalent employees) at December 31, 2019. None of the Company’s employees are represented by a union or covered under a collective bargaining agreement. The Company considers relations with its employees to be excellent.
Securities and Exchange Commission Filings
The Company maintains an internet website at www.bankofclarke.bank. Shareholders of the Company and the public may access, free of charge, the Company’s periodic and current reports (including annual reports on Form 10-K, quarterly reports on Form 10-Q and current reports on Form 8-K, and any amendments to those reports) filed with or furnished to the Securities and Exchange Commission (the "SEC"), through the “Investor Relations” section of the Company’s website. The reports are made available on this website as soon as practicable following the filing of the reports with the SEC. In addition, certain committee charters and the Company's Code of Ethics are available on the Company's website. The information is free of charge and may be reviewed, downloaded and printed from the website at any time. The information on the Company's website is not a part of, and is not incorporated into, this Annual Report on Form 10-K.
4
Competition
There is significant competition for both loans and deposits within the Company’s trade area. Competition for loans comes from other commercial banks, savings banks, credit unions, mortgage brokers, finance companies, financial technology firms, insurance companies, and other institutional lenders. Competition for deposits comes from other commercial banks, savings banks, credit unions, brokerage firms, and other financial institutions. Based on total deposits at June 30, 2019 as reported to the FDIC, the Company has 7.58% of the total deposits in its market area. The Company’s market area includes Clarke County, Frederick County, Loudoun County and the City of Winchester.
Supervision and Regulation
General. As a bank holding company, the Company is subject to regulation under the Bank Holding Company Act of 1956, as amended, and the examination and reporting requirements of the Board of Governors of the Federal Reserve System (the "Federal Reserve"). As a state-chartered commercial bank, the Bank is subject to regulation, supervision and examination by the Virginia State Corporation Commission’s Bureau of Financial Institutions. It is also subject to regulation, supervision and examination by the Federal Reserve. Other federal and state laws, including various consumer and compliance laws, govern the activities of the Bank, the investments that it makes and the aggregate amount of loans that it may grant to one borrower.
The following sections summarize the significant federal and state laws applicable to the Company and its subsidiary. To the extent that statutory or regulatory provisions are described, the description is qualified in its entirety by reference to that particular statutory or regulatory provision.
The Bank Holding Company Act. Under the Bank Holding Company Act, the Company is subject to periodic examination by the Federal Reserve and is required to file periodic reports regarding its operations and any additional information that the Federal Reserve may require. Activities at the bank holding company level are limited to the following:
• | banking, managing or controlling banks; |
• | furnishing services to or performing services for its subsidiaries; and |
• | engaging in other activities that the Federal Reserve has determined by regulation or order to be so closely related to banking as to be a proper incident to these activities. |
Some of the activities that the Federal Reserve has determined by regulation to be closely related to the business of a banking include making or servicing loans and specific types of leases, performing specific data processing services and acting in some circumstances as a fiduciary or investment or financial adviser.
With some limited exceptions, the Bank Holding Company Act requires every bank holding company to obtain the prior approval of the Federal Reserve before:
• | acquiring substantially all the assets of any bank; |
• | acquiring direct or indirect ownership or control of any voting shares of any bank if after such acquisition it would own or control more than 5% of the voting shares of such bank (unless it already owns or controls the majority of such shares); or |
• | merging or consolidating with another bank holding company. |
In addition, and subject to some exceptions, the Bank Holding Company Act and the Change in Bank Control Act, together with their regulations, require Federal Reserve approval prior to any person or company acquiring 25% or more of any class of voting securities of the bank holding company. Prior notice to the Federal Reserve is required if a person acquires 10% or more, but less than 25%, of any class of voting securities of a bank or bank holding company and either the institution has registered securities under Section 12 of the Securities Exchange Act of 1934 or no other person owns a greater percentage of that class of voting securities immediately after the transaction.
In November 1999, Congress enacted the Gramm-Leach-Bliley Act (“GLBA”), which made substantial revisions to the statutory restrictions separating banking activities from other financial activities. Under the GLBA, bank holding companies that are well-capitalized and well-managed and meet other conditions can elect to become “financial holding companies.” As financial holding companies, they and their subsidiaries are permitted to acquire or engage in previously impermissible activities such as insurance underwriting, securities underwriting and distribution, travel agency activities, insurance agency activities, merchant banking and other activities that the Federal Reserve determines to be financial in nature or complementary to these activities. Financial holding companies continue to be subject to the overall oversight and supervision of the Federal Reserve, but the GLBA applies the concept of functional regulation to the activities conducted by subsidiaries. For example, insurance activities would be subject to supervision and regulation by state insurance authorities. Although the Company has not elected to become a financial holding company in order to exercise the broader activity powers provided by the GLBA, the Company may elect do so in the future.
5
Payment of Dividends. The Company is organized under the Virginia Stock Corporation Act, which prohibits the payment of a dividend if, after giving it effect, the corporation would not be able to pay its debts as they become due in the usual course of business or if the corporation’s total assets would be less than the sum of its total liabilities plus the amount that would be needed, if the corporation were to be dissolved, to satisfy the preferential rights upon dissolution of any preferred shareholders.
The Company is a legal entity separate and distinct from its subsidiary. Its ability to distribute cash dividends will depend primarily on the ability of the Bank to pay dividends to it, and the Bank is subject to laws and regulations that limit the amount of dividends that it can pay. As a state member bank, the Bank is subject to certain restrictions imposed by the reserve and capital requirements of federal and Virginia banking statutes and regulations. Under Virginia law, a bank may not declare a dividend in excess of its undivided profits. Additionally, the Bank may not declare a dividend if the total amount of all dividends, including the proposed dividend, declared by it in any calendar year exceeds the total of its retained net income of that year to date, combined with its retained net income of the two preceding years, unless the dividend is approved by the Federal Reserve.
The Federal Reserve and the state of Virginia have the general authority to limit the dividends paid by insured banks if the payment is deemed an unsafe and unsound practice. Both the state of Virginia and the Federal Reserve have indicated that paying dividends that deplete a bank’s capital base to an inadequate level would be an unsound and unsafe banking practice. The Bank may also not declare or pay a dividend without the approval of its board and two-thirds of its shareholders if the dividend would exceed its undivided profits, as reported to the Federal Reserve.
In addition, the Company is subject to certain regulatory requirements to maintain capital at or above regulatory minimums. These regulatory requirements regarding capital affect its dividend policies. The Federal Reserve has indicated that a bank holding company should generally pay dividends only if its current earnings are sufficient to fully fund the dividends, and the prospective rate of earnings retention appears consistent with the organization’s capital needs, asset quality and overall financial condition.
The FDIC has the general authority to limit the dividends paid by insured banks if the payment is deemed an unsafe and unsound practice. The FDIC has indicated that paying dividends that deplete a bank’s capital base to an inadequate level would be an unsound and unsafe banking practice.
The Company does not expect that any of these laws, regulations or policies will materially affect the Bank's ability to pay dividends to the Company. Refer to Item 5 for additional information on dividend restrictions. During the year ended December 31, 2019, the Bank paid $5.0 million in dividends to the Company. The Company paid cash dividends of $3.0 million to shareholders during 2019.
Insurance of Accounts, Assessments and Regulation by the FDIC. The Bank’s deposits are insured up to applicable limits by the FDIC. In July 2010, the Dodd-Frank Wall Street Reform and Consumer Protection Act (the "Dodd-Frank Act") permanently raised the standard maximum deposit insurance amount to $250,000. The FDIC has implemented a risk-based assessment system in which assessment rates for insured institutions with under $10 billion in assets are calculated based on supervisory evaluations and certain other financial measures. The assessment base is an institution’s average consolidated total assets less average tangible equity, and the initial base assessment rates are currently between 3 and 30 basis points depending on the institution's composite rating, and subject to potential adjustment based on certain long-term unsecured debt. Once the reserve ratio reaches 2.0% or greater, initial base assessment rates will range from 2 to 28 basis points and, once the reserve ratio reaches 2.5% or greater, the initial base assessment rate will range from 1 to 25 basis points.
Capital Requirements. The Federal Reserve and the other federal banking agencies have issued risk-based and leverage capital guidelines applicable to U.S. banking organizations. Those regulatory agencies may from time to time require that a banking organization maintain capital above the minimum levels because of its financial condition or actual or anticipated growth. Pursuant to the Federal Reserve’s Small Bank Holding Company and Savings and Loan Holding Company Policy Statement, qualifying bank holding companies with total consolidated assets of less than $3 billion, such as the Company, are not subject to consolidated regulatory capital requirements.
Effective January 1, 2015, the Federal Reserve adopted new capital rules intended to revise and strengthen its risk-based and leverage capital requirements and its method for calculating risk-weighted assets. The rules implemented the Basel III regulatory capital reforms from the Basel Committee on Banking Supervision and certain provisions of the Dodd-Frank Act.
6
Under these risk-based capital requirements of the Federal Reserve, the Bank is required to maintain a minimum ratio of total capital (which is defined as core capital and supplementary capital less certain specified deductions from total capital such as reciprocal holdings of depository institution capital instruments and equity investments) to risk-weighted assets of at least 8.0% . At least 6% of risk-weighted assets is required to be “Tier 1 capital,” which consists principally of common and certain qualifying preferred shareholders’ equity (including grandfathered trust preferred securities) as well as retained earnings, less certain intangibles and other adjustments. The “Tier 2 capital” consists of cumulative preferred stock, long-term perpetual preferred stock, a limited amount of subordinated and other qualifying debt (including certain hybrid capital instruments), and a limited amount of the general loan loss allowance. A common equity Tier 1 capital ratio of 4.5% of risk-weighted assets also was added with the new rules effective January 1, 2015.
Each of the federal bank regulatory agencies also has established a minimum leverage capital ratio of Tier 1 capital to average adjusted assets (“Tier 1 leverage ratio”). The guidelines require a minimum Tier 1 leverage ratio of 3.0% for financial holding companies and banking organizations with the highest supervisory rating. All other banking organizations are required to maintain a minimum Tier 1 leverage ratio of 4.0% unless a different minimum was specified by an appropriate regulatory authority. In addition, for a depository institution to be considered “well capitalized” under the regulatory framework for prompt corrective action, its Tier 1 leverage ratio must be at least 5.0%. Banking organizations that have experienced internal growth or made acquisitions are expected to maintain strong capital positions substantially above the minimum supervisory levels without significant reliance on intangible assets. The Federal Reserve has not advised the Company or the Bank of any specific minimum leverage ratio applicable to either entity.
The capital requirements that became effective January 1, 2015 have been phased in over a four-year period. As fully phased in effective January 1, 2019, the rules require the Bank to maintain (i) a minimum ratio of common equity Tier 1 to risk-weighted assets of at least 4.5%, plus a 2.5% “capital conservation buffer” (which is added to the 4.5% common equity Tier 1 ratio, effectively resulting in a minimum ratio of common equity Tier 1 to risk-weighted assets of at least 7.0%); (ii) a minimum ratio of Tier 1 capital to risk-weighted assets of at least 6.0%, plus the 2.5% capital conservation buffer (which is added to the 6.0% Tier 1 capital ratio, effectively resulting in a minimum Tier 1 capital ratio of 8.5%); (iii) a minimum ratio of total capital to risk-weighted assets of at least 8.0%, plus the 2.5% capital conservation buffer (which is added to the 8.0% total capital ratio, effectively resulting in a minimum total capital ratio of 10.5%); and (iv) a minimum leverage ratio of 4.0%, calculated as the ratio of Tier 1 capital to average assets.
The capital conservation buffer requirement has been phased in beginning January 1, 2016, at 0.625% of risk-weighted assets, increasing by the same amount each year until fully implemented at 2.5% effective January 1, 2019. The capital conservation buffer is designed to absorb losses during periods of economic stress. Banking institutions with a ratio of common equity Tier 1 to risk-weighted assets above the minimum but below the conservation buffer will face constraints on dividends, equity repurchases, and compensation based on the amount of the shortfall.
The Federal Reserve’s final rules also revised the “prompt corrective action” regulations pursuant to Section 38 of the FDIA by (i) introducing a common equity Tier 1 capital ratio requirement at each level (other than critically undercapitalized), with the required ratio being 6.5% for well-capitalized status; (ii) increasing the minimum Tier 1 capital ratio requirement for each category, with the minimum ratio for well-capitalized status being 8.0%; and (iii) eliminating the provision that provided that a bank with a composite supervisory rating of 1 may have a 3.0% Tier 1 leverage ratio and still be well-capitalized. These new thresholds were effective for the Bank as of January 1, 2015. The minimum total capital to risk-weighted assets ratio (10.0%) and minimum leverage ratio (5.0%) for well-capitalized status were unchanged by the final rules.
In December 2017, the Basel Committee published standards that it described as the finalization of the Basel III post-crisis regulatory reforms (the standards are commonly referred to as “Basel IV”). Among other things, these standards revise the Basel Committee’s standardized approach for credit risk (including by recalibrating risk weights and introducing new capital requirements for certain “unconditionally cancellable commitments,” such as unused credit card lines of credit) and provide a new standardized approach for operational risk capital. Under the proposed framework, these standards will generally be effective on January 1, 2022, with an aggregate output floor phasing-in through January 1, 2027. Under the current capital rules, operational risk capital requirements and a capital floor apply only to advanced approaches institutions, and not to the Company. The impact of Basel IV on the Company and the Bank will depend on the manner in which it is implemented by the federal bank regulatory agencies.
As directed by the Economic Growth, Regulatory Relief and Consumer Protection Act (the “Economic Growth Act”), the federal banking regulators jointly issued a final rule in 2019 that permits qualifying banks that have less than $10 billion in total consolidated assets to elect to be subject to a 9% “community bank leverage ratio.” A qualifying bank that has chosen the proposed framework is not be required to calculate the existing risk-based and leverage capital requirements and would be considered to have met the capital ratio requirements to be “well capitalized” under prompt corrective action rules, provided it has a community bank leverage ratio greater than 9%.
7
Other Safety and Soundness Regulations. There are a number of obligations and restrictions imposed on bank holding companies and their depository institution subsidiaries by federal law and regulatory policy that are designed to reduce potential loss exposure to the depositors of such depository institutions and to the FDIC insurance funds in the event that the depository institution is insolvent or is in danger of becoming insolvent. For example, under the requirements of the Federal Reserve with respect to bank holding company operations, a bank holding company is required to serve as a source of financial strength to its subsidiary depository institutions and to commit resources to support such institutions in circumstances where it might not do so otherwise. In addition, the “cross-guarantee” provisions of federal law require insured depository institutions under common control to reimburse the FDIC for any loss suffered or reasonably anticipated by the FDIC as a result of the insolvency of commonly controlled insured depository institutions or for any assistance provided by the FDIC to commonly controlled insured depository institutions in danger of failure. The FDIC may decline to enforce the cross-guarantee provision if it determines that a waiver is in the best interests of the deposit insurance funds. The FDIC’s claim for reimbursement under the cross guarantee provisions is superior to claims of shareholders of the insured depository institution or its holding company but is subordinate to claims of depositors, secured creditors and nonaffiliated holders of subordinated debt of the commonly controlled insured depository institutions.
Interstate Banking and Branching. Current federal law authorizes interstate acquisitions of banks and bank holding companies without geographic limitation. Effective June 1, 1997, a bank headquartered in one state is authorized to merge with a bank headquartered in another state, as long as neither of the states had opted out of such interstate merger authority prior to such date. After a bank has established branches in a state through an interstate merger transaction, the bank may establish and acquire additional branches at any location in the state where a bank headquartered in that state could have established or acquired branches under applicable federal or state law.
Monetary Policy. The commercial banking business is affected not only by general economic conditions but also by the monetary policies of the Federal Reserve. The instruments of monetary policy employed by the Federal Reserve include open market transactions in United States government securities, changes in the discount rate on member bank borrowing and changes in reserve requirements against deposits held by all federally insured banks. The Federal Reserve monetary policies have had a significant effect on the operating results of commercial banks in the past and are expected to continue to do so in the future. In view of changing conditions in the national and international economy and in the money markets, as well as the effect of actions by monetary fiscal authorities, including the Federal Reserve, no prediction can be made as to possible future changes in interest rates, deposit levels, loan demand or the business and earnings of the Bank.
Federal Reserve System. In 1980, Congress enacted legislation that imposed reserve requirements on all depository institutions that maintain transaction accounts or nonpersonal time deposits. NOW accounts, money market deposit accounts and other types of accounts that permit payments or transfers to third parties fall within the definition of transaction accounts and are subject to these reserve requirements, as are any nonpersonal time deposits at an institution.
The reserve percentages are subject to adjustment by the Federal Reserve. Because required reserves must be maintained in the form of vault cash or in a non-interest-bearing account at, or on behalf of, a Federal Reserve Bank, the effect of the reserve requirement is to reduce the amount of the institution’s interest-earning assets.
Transactions with Affiliates. Transactions between banks and their affiliates are governed by Sections 23A and 23B of the Federal Reserve Act. An affiliate of a bank is any bank or entity that controls, is controlled by or is under common control with such bank. Generally, Sections 23A and 23B (i) limit the extent to which the Bank or its subsidiaries may engage in “covered transactions” with any one affiliate to an amount equal to 10% of such institution’s capital stock and surplus, and maintain an aggregate limit on all such transactions with affiliates to an amount equal to 20% of such capital stock and surplus, and (ii) require that all such transactions be on terms substantially the same, or at least as favorable, to the association or subsidiary as those provided to a nonaffiliate. The term “covered transaction” includes the making of loans, purchase of assets, issuance of a guarantee and similar other types of transactions.
8
Transactions with Insiders. The Federal Reserve Act and related regulations impose specific restrictions on loans to directors, executive officers and principal shareholders of banks. Under Section 22(h) of the Federal Reserve Act, loans to a director, an executive officer and to a principal shareholder of a bank, and some affiliated entities of any of the foregoing, may not exceed, together with all other outstanding loans to such person and affiliated entities, the bank’s loan-to-one borrower limit. Loans in the aggregate to insiders and their related interests as a class may not exceed two times the bank’s unimpaired capital and unimpaired surplus until the bank’s total assets equal or exceed $100,000,000, at which time the aggregate is limited to the bank’s unimpaired capital and unimpaired surplus. Section 22(h) also prohibits loans, above amounts prescribed by the appropriate federal banking agency, to directors, executive officers and principal shareholders of a bank or bank holding company, and their respective affiliates, unless such loan is approved in advance by a majority of the board of directors of the bank with any “interested” director not participating in the voting. The FDIC has prescribed the loan amount, which includes all other outstanding loans to such person, as to which such prior board of director approval is required, as being the greater of $25,000 or 5% of capital and surplus (up to $500,000). Section 22(h) requires that loans to directors, executive officers and principal shareholders be made on terms and underwriting standards substantially the same as offered in comparable transactions to other persons.
The Dodd-Frank Act also provides that banks may not “purchase an asset from, or sell an asset to” a bank insider (or their related interests) unless (i) the transaction is conducted on market terms between the parties, and (ii) if the proposed transaction represents more than 10 percent of the capital stock and surplus of the bank, it has been approved in advance by a majority of the bank’s non-interested directors.
Community Reinvestment Act. Under the Community Reinvestment Act and related regulations, depository institutions have an affirmative obligation to assist in meeting the credit needs of their market areas, including low and moderate-income areas, consistent with safe and sound banking practice. The Community Reinvestment Act directs each bank to maintain a public file containing specific information, including all written comments received from the public for the current year and each of the previous two calendar years that specifically relate to the bank’s performance in helping to meet community credit needs. Depository institutions are periodically examined for compliance with the Community Reinvestment Act and are periodically assigned ratings in this regard. Banking regulators consider a depository institution’s Community Reinvestment Act rating when reviewing applications to establish new branches, undertake new lines of business, and/or acquire part or all of another depository institution. An unsatisfactory rating can significantly delay or even prohibit regulatory approval of a proposed transaction by a bank holding company or its depository institution subsidiaries.
Fair Lending; Consumer Laws. In addition to the Community Reinvestment Act, other federal and state laws regulate various lending and consumer aspects of the banking business. Governmental agencies, including the Department of Housing and Urban Development, the Federal Trade Commission and the Department of Justice, have become concerned that prospective borrowers experience discrimination in their efforts to obtain loans from depository and other lending institutions. These agencies have brought litigation against depository institutions alleging discrimination against borrowers. Many of these suits have been settled, in some cases for material sums, short of a full trial.
These governmental agencies have clarified what they consider to be lending discrimination and have specified various factors that they will use to determine the existence of lending discrimination under the Equal Credit Opportunity Act and the Fair Housing Act, including evidence that a lender discriminated on a prohibited basis, evidence that a lender treated applicants differently based on prohibited factors in the absence of evidence that the treatment was the result of prejudice or a conscious intention to discriminate, and evidence that a lender applied an otherwise neutral non-discriminatory policy uniformly to all applicants, but the practice had a discriminatory effect, unless the practice could be justified as a business necessity.
Banks and other depository institutions are also subject to numerous consumer-oriented laws and regulations. These laws, which include the Truth in Lending Act, the Truth in Savings Act, the Real Estate Settlement Procedures Act, the Electronic Funds Transfer Act, the Funds Availability Act, the Equal Credit Opportunity Act, and the Fair Housing Act, require compliance by depository institutions with various disclosure requirements and requirements regulating the availability of funds after deposit or the making of some loans to customers.
On September 20, 2017, the Bureau of Consumer Financial Protection (the "CFPB") issued a final rule that amends Regulation B to permit creditors additional flexibility in complying with Regulation B in order to facilitate compliance with Regulation C, adds certain model forms and removes others from Regulation B, and makes various other amendments to Regulation B and its commentary to facilitate the collection and retention of information about the ethnicity, sex, and race of certain mortgage applicants. The rule was effective on January 1, 2018, except that the amendment to Appendix B removing the existing “Uniform Residential Loan Application” form in amendatory instruction 6 is effective January 1, 2022.
9
Privacy Regulations. The GLBA contains extensive customer privacy protection provisions. Under these provisions, a financial institution must provide to its customers, both at the inception of the customer relationship and on an annual basis, the institution’s policies and procedures regarding the handling of customers’ nonpublic personal financial information. The law provides that, except for specific limited exceptions, an institution may not provide such personal information to unaffiliated third parties unless the institution discloses to the customer that such information may be so provided and the customer is given the opportunity to opt out of such disclosure. An institution may not disclose to a non-affiliated third party, other than to a consumer reporting agency, customer account numbers or other similar account identifiers for marketing purposes. The GLBA also provides that the states may adopt customer privacy protections that are more strict than those contained in the act.
Amendment to the Annual Privacy Notice Requirement Under the Gramm-Leach-Bliley Act (Regulation P). In July 2016 the CFPB proposed to update Regulation P to implement a December 2015 statutory amendment to the Gramm-Leach-Bliley Act. The August 10, 2018 rule finalized that proposal. The rule provides an exception under which financial institutions that meet certain conditions are not required to provide annual privacy notices to customers. To qualify for this exception, a financial institution must not share nonpublic personal information about customers except as described in certain statutory exceptions. In addition, the rule requires that the financial institution must not have changed its policies and practices with regard to disclosing nonpublic personal information from those that the institution disclosed in the most recent privacy notice it sent. As part of its implementation, the CFPB also amended Regulation P to provide timing requirements for delivery of annual privacy notices in the event that a financial institution that qualified for this annual notice exception later changes its policies or practices in such a way that it no longer qualifies for the exception. The CFPB further removed the Regulation P provision that allowed for use of the alternative delivery method for annual privacy notices because the CFPB believes the alternative delivery method will no longer be used in light of the annual notice exception.
Bank Secrecy Act. Under the Bank Secrecy Act (“BSA”), a financial institution is required to have systems in place to detect certain transactions, based on the size and nature of the transaction. Financial institutions are generally required to report cash transactions involving more than $10,000 to the United States Treasury. In addition, financial institutions are required to file suspicious activity reports for transactions that involve more than $5,000 and which the financial institution knows, suspects or has reason to suspect, involves illegal funds, is designed to evade the requirements of the BSA or has no lawful purpose. The USA PATRIOT Act, enacted in response to the September 11, 2001 terrorist attacks, requires bank regulators to consider a financial institution’s compliance with the BSA when reviewing applications from a financial institution. As part of its BSA program, the USA PATRIOT Act also requires a financial institution to follow recently implemented customer identification procedures when opening accounts for new customers and to review lists of individuals and entities who are prohibited from opening accounts at financial institutions.
On May 11, 2016, FinCEN issued final rules under the Bank Secrecy Act to clarify and strengthen customer due diligence requirements for: banks; brokers or dealers in securities; mutual funds; and futures commission merchants and introducing brokers in commodities. The rules contain explicit customer due diligence requirements and include a new requirement to identify and verify the identity of beneficial owners of legal entity customers, subject to certain exclusions and exemptions.
Sarbanes-Oxley Act of 2002. The Sarbanes-Oxley Act implemented a number of laws affecting corporate governance, accounting obligations and corporate reporting. The Sarbanes-Oxley Act is applicable to all companies with equity securities registered or that file reports under the Securities Exchange Act of 1934. In particular, the Sarbanes-Oxley Act established: (i) requirements for audit committees, including independence, expertise, and responsibilities; (ii) responsibilities regarding financial statements for the Chief Executive Officer and Chief Financial Officer of the reporting company; (iii) standards for auditors and regulation of audits; (iv) disclosure and reporting obligations for reporting companies and their directors and executive officers; and (v) civil and criminal penalties for violations of the securities laws. Because the Company’s common stock is registered with the SEC, it is currently subject to these requirements.
Incentive Compensation. In June 2010, the Federal Reserve issued a final rule on incentive compensation policies intended to ensure that the incentive compensation policies of banking organizations do not undermine the safety and soundness of such organizations by encouraging excessive risk-taking. Banking organizations are instructed to review their incentive compensation policies to ensure that they do not encourage excessive risk-taking and implement corrective programs as needed. The Federal Reserve will review, as part of the regular, risk-focused examination process, the incentive compensation arrangements of banking organizations, such as the Bank, that are not “large, complex banking organizations.” These reviews will be tailored to each organization based on the scope and complexity of the organization’s activities and the prevalence of incentive compensation arrangements. The findings of the supervisory initiatives will be included in reports of examination. Deficiencies will be incorporated into the organization’s supervisory ratings, which can affect the organization’s ability to make acquisitions and take other actions.
10
Dodd-Frank Act. In July 2010, the Dodd-Frank Act was signed into law, incorporating numerous financial institution regulatory reforms. The Dodd-Frank Act implements far-reaching reforms of major elements of the financial landscape, particularly for larger financial institutions. Many of its provisions do not directly impact community-based institutions like the Bank. For instance, provisions that regulate derivative transactions and limit derivatives trading activity of federally-insured institutions, enhance supervision of “systemically significant” institutions, impose new regulatory authority over hedge funds, limit proprietary trading by banks, and phase-out the eligibility of trust preferred securities for Tier 1 capital are among the provisions that do not directly impact the Bank either because of exemptions for institutions below a certain asset size or because of the nature of the Bank’s operations. Certain aspects of the Dodd-Frank Act remain subject to rulemaking and interpretation and will take effect over several years, and their impact on the Company or the financial industry is difficult to predict before such regulations or interpretations are adopted.
In May 2018, the Economic Growth Act was enacted to modify or remove certain regulatory financial reform rules and regulations, including some of those implemented under the Dodd-Frank Act. While the Economic Growth Act maintains most of the regulatory structure established by the Dodd-Frank Act, it amends certain aspects of the regulatory framework for small depository institutions with assets of less than $10 billion, such as the Bank, and for large banks with assets of more than $50 billion.
Among other matters, the Economic Growth, Regulatory Relief, and Consumer Protection Act (the "Economic Growth Act") expands the definition of qualified mortgages which may be held by a financial institution with total consolidated assets of less than $10 billion, exempts community banks from the Volcker Rule, and includes additional regulatory relief regarding regulatory examination cycles, call reports, mortgage disclosures and risk weights for certain high-risk commercial real estate loans.
Integrated Mortgage Disclosures under the Real Estate Settlement Procedures Act (Regulation X) and the Truth In Lending Act (Regulation Z). Pursuant to the Dodd-Frank Act, the CFPB issued a final rule on November 20, 2013 (effective on October 3, 2015), combining certain disclosures that consumers receive in connection with applying for and closing on a mortgage loan under the Truth in Lending Act and the Real Estate Settlement Procedures Act. The Bureau amended Regulation X (Real Estate Settlement Procedures Act) and Regulation Z (Truth in Lending) to establish new disclosure requirements and forms in Regulation Z for most closed-end consumer credit transactions secured by real property. In addition to combining the existing disclosure requirements and implementing new requirements imposed by the Dodd-Frank Act, the final rule provides extensive guidance regarding compliance with those requirements. The final rule applies to most closed-end consumer mortgages. It does not apply to home equity lines of credit, reverse mortgages, or mortgages secured by a mobile home or by a dwelling that is not attached to real property (in other words, land). The final rule also does not apply to loans made by a creditor who makes five or fewer mortgages in a year.
On July 7, 2017, the CFPB modified the Federal mortgage disclosure requirements under the Real Estate Settlement Procedures Act and the Truth in Lending Act that are implemented in Regulation Z. This rule memorializes the CFPB’s informal guidance on various issues and makes additional clarifications and technical amendments. This rule also creates tolerances for the total of payments, adjusts a partial exemption mainly affecting housing finance agencies and nonprofits, extends coverage of the TILA-RESPA integrated disclosure (integrated disclosure) requirements to all cooperative units, and provides guidance on sharing the integrated disclosures with various parties involved in the mortgage origination process.
On October 4, 2017, the CFPB issued an interim final rule amending a provision of the Regulation X mortgage servicing rules issued in 2016 relating to the timing for servicers to provide modified written early intervention notices to borrowers who have invoked their cease communication rights under the Fair Debt Collection Practices Act.
On March 8, 2018, the Bureau of Consumer Financial Protection (Bureau) issued a rule amending certain aspects of the mortgage servicing rule issued in 2016 relating to periodic statements. These amendments revise the timing requirements for servicers transitioning between modified or unmodified periodic statements and coupon books when consumers enter or exit bankruptcy.
On April 26, 2018, the Bureau of Consumer Financial Protection (Bureau) amended federal mortgage disclosure requirements under the Real Estate Settlement Procedures Act (RESPA) and the Truth in Lending Act (TILA) that are implemented in Regulation Z. The amendments relate to when a creditor may compare charges paid by or imposed on the consumer to amounts disclosed on a Closing Disclosure, instead of a Loan Estimate, to determine if an estimated closing cost was disclosed in good faith.
11
Flood Insurance Rule. On July 21, 2015, five federal regulatory agencies announced the approval of a joint final rule that modifies regulations that apply to loans secured by properties located in special flood hazard areas. The final rule implements provisions of the Homeowner Flood Insurance Affordability Act of 2014 relating to the escrowing of flood insurance payments and the exemption of certain detached structures from the mandatory flood insurance purchase requirement. The final rule also implements provisions in the Biggert-Waters Flood Insurance Reform Act of 2012 (Biggert-Waters Act) relating to the force placement of flood insurance.
On February 20, 2019, an Interagency Final Rule was issued amending regulations regarding loans in areas having special flood hazards to implement the private flood insurance provisions of the Biggert-WatersAct of 2012. Specifically, the final rule requires regulated lending institutions to accept policies that meet the statutory definition of "private flood insurance" in the Biggert-Waters Act and permits regulated lending institutions to exercise their discretion to accept flood insurance policies issued by private insurers and plans providing flood coverage issued by mutual aid societies that do not meet the statutory definition of "private flood insurance," subject to certain restrictions.
Home Mortgage Disclosure Act (HMDA) Final Rule. On October 15, 2015, the CFPB issued the final rule aimed at increasing the “quality and type” of HMDA data collected and reported by financial institutions. The HMDA Rule changes: (1) the types of financial institutions that are subject to Regulation C; (2) the types of transactions that are subject to Regulation C; (3) the data that financial institutions are required to collect, record, and report; and (4) the processes for reporting and disclosing HMDA data. On August 24, 2017, the CFPB issued a final rule (2017 HMDA Rule) further amending Regulation C to make technical corrections and to clarify and amend certain requirements adopted by the 2015 HMDA Final Rule. The most significant changes were not effective until January 1, 2018. On or before March 1, 2019, lenders will report the new data they collect in 2018. On October 10, 2019, the CFPB issued a final rule amending Regulation C to adjust the threshold for reporting data about open-end lines of credit by extending to January 1, 2022 the current temporary threshold of 500 open-end lines of credit. The CFPB also incorporated into Regulation C the interpretations and procedures from the interpretive and procedural rule that was issued on August 31, 2018, implementing provisions of the Economic Growth Act.
Payday, Vehicle Title, and Certain High-Cost Installment Loans. On October 5, 2017, the CFPB has issued this final rule (effective date: January 16, 2018) to create consumer protections for certain consumer credit products. The rule has two primary parts. First, for short-term and longer-term loans with balloon payments, the CFPB is identifying it as an unfair and abusive practice for a lender to make such loans without reasonably determining that consumers have the ability to repay the loans according to their terms. The rule generally requires that, before making such a loan, a lender must reasonably determine that the consumer has the ability to repay the loan. The CFPB has exempted certain short-term loans from the ability-to-repay determination prescribed in the rule if they are made with certain consumer protections. Second, for the same set of loans and for longer-term loans with an annual percentage rate greater than 36 percent that are repaid directly from the consumer’s account, the rule identifies it as an unfair and abusive practice to attempt to withdraw payment from a consumer’s account after two consecutive payment attempts have failed, unless the lender obtains the consumer’s new and specific authorization to make further withdrawals from the account. The rule also requires lenders to provide certain notices to the consumer before attempting to withdraw payment for a covered loan from the consumer’s account.
Regulation CC. On September 17, 2018, the Federal Reserve Board adopted final amendments to Regulation CC (Expedited Funds Availability Act) to address situations where there is a dispute as to whether a check has been altered or was issued with an unauthorized signature, and the original paper check is not available for inspection. The rule adopts a presumption of alteration for disputes between banks over whether a substitute check or electronic check contains an alteration or is derived from an original check that was issued with an unauthorized signature of the drawer.
On June 26, 2019, the agencies finalized changes to Regulation CC to adopt a method for making inflationary adjustments to the dollar amounts in Regulation CC every five years pursuant to the Dodd-Frank Act. The first adjustments are effective July 1, 2020. In addition, the final rule implements a provision of the Economic Growth Act to extend coverage of Regulation CC to American Samoa, the Northern Mariana Islands, and Guam.
Summaries of Rights Under the Fair Credit Reporting Act (Regulation V). The CFPB issued an interim final rule on September 12, 2018 to update the CFPB’s model forms for the Summary of Consumer Identity Theft Rights and the Summary of Consumer Rights in Appendices I and K to Regulation V to incorporate a notice required by new Fair Credit Reporting Act section 605A(i)(5), added by the Economic Growth Act.
12
Home Mortgage Disclosure Act. The CFPB issued an interpretive and procedural rule on August 31, 2018 to implement and clarify the requirements of section 104(a) of the Economic Growth Act, which amended certain provisions of the Home Mortgage Disclosure Act (HMDA). The rule clarifies that insured depository institutions and insured credit unions covered by a partial exemption under the Economic Growth Act have the option of reporting exempt data fields as long as they report all data fields within any exempt data point for which they report data; clarifies that only loans and lines of credit that are otherwise HMDA reportable count toward the thresholds for the partial exemptions; clarifies which of the data points in Regulation C are covered by the partial exemptions; designates a non-universal loan identifier for partially exempt transactions for institutions that choose not to report a universal loan identifier; and clarifies the Economic Growth Act’s exception to the partial exemptions for negative Community Reinvestment Act examination history.
Real Estate Appraisal Thresholds. On September 27, 2019, the agencies issued a final rule increasing the appraisal threshold for residential real estate transactions from $250,000 to $400,000. The final rule defines residential real estate transactions as a real estate related financial transaction that is secured by a single 1-to-4 family residential property. For residential real estate transactions exempted from the appraisal requirement as a result of the revised threshold, regulated institutions must obtain an evaluation of the real property collateral that is consistent with safe and sound banking practices. The final rule includes exempted transactions with residential properties in rural areas under the Economic Growth Act and requires evaluations for these transactions. The final rule also amends appraisal regulations requiring regulated institutions to subject appraisals for federally related transactions to appropriate review for compliance with the Uniform Standards of Professional Appraisal Practice.
Future Legislation and Regulation. Congress may enact legislation from time to time that affects the regulation of the financial services industry, and state legislatures may enact legislation from time to time affecting the regulation of financial institutions chartered by or operating in those states. Federal and state regulatory agencies also periodically propose and adopt changes to their regulations or change the manner in which existing regulations are applied. The substance or impact of pending or future legislation or regulation, or the application thereof, cannot be predicted, although enactment of the proposed legislation could impact the regulatory structure under which the Company and the Bank operate and may significantly increase costs, impede the efficiency of internal business processes, require an increase in regulatory capital, require modifications to business strategy, and limit the ability to pursue business opportunities in an efficient manner. A change in statutes, regulations or regulatory policies applicable to the Company or the Bank could have a material, adverse effect on the business, financial condition and results of operations of the Company and the Bank. Future legislation, regulation, and government policy could affect the banking industry as a whole, including the business and results of operations of the Company and the Bank, in ways that are difficult to predict. The Company fully expects that the financial institution industry will remain heavily regulated in the near future and that additional laws or regulations may be adopted further regulating specific banking practices.
Employment Transition of Loan Originators. Section 106 of the Economic Growth Act allows certain state-licensed mortgage loan originators (MLOs) who are licensed in one state to temporarily work in another state while waiting for licensing approval in the new state. It also grants MLOs who move from a depository institution (where loan officers do not need to be state licensed) to a nondepository institution (where they do need to be state licensed) a grace period to complete the necessary licensing.
Wage and Hour Division, Department of Labor. On December 16, 2019, the Department of Labor issued a final rule, the rule updates a number of regulations on the calculation of overtime compensation both to provide clarity and to better reflect the 21st-century workplace. These changes will promote compliance with the FLSA, provide appropriate and updated guidance in an area of evolving law and practice, and encourage employers to provide additional and innovative benefits to workers without fear of costly litigation. This final rule was effective on January 15, 2020.
13
Item 1A. Risk Factors
The Company is subject to many risks that could adversely affect its future financial condition and performance and, therefore, the market value of its securities. The risk factors applicable to the Company include, but are not limited to the following:
The Company’s success depends upon its ability to manage interest rate risk.
The profitability of the Company depends significantly on its net interest income, which is the difference between the interest earned on loans, securities and other interest-earning assets, and the interest paid on deposits and borrowings. Changes in interest rates will affect the rates earned on securities and loans and rates paid on deposits and other borrowings. While the Company believes that its current interest rate exposure does not present any significant negative exposure to interest rate changes, it cannot eliminate its exposure to interest rate risk because the factors which cause interest rate risk are beyond the Company’s control. These factors include competition, federal economic, monetary and fiscal policies, and general economic conditions.
The Company’s success depends upon its ability to compete effectively in the banking industry.
The Company’s banking subsidiary faces competition from banks and other financial institutions, including savings and loan associations, savings banks, finance companies and credit unions for deposits, loans and other financial services in our market area. Certain divisions within the banking subsidiary face competition from wealth management and investment brokerage firms. A number of these banks and other financial institutions are significantly larger and have substantially greater access to capital and other resources, as well as larger lending limits and branch systems, and offer a wider array of banking services. In addition, the Company faces competition from market place lenders and other financial technology firms, which may provide competitive services quickly and in innovative ways and may have fewer regulatory constraints and lower cost structures. This competition may reduce or limit our margins and our market share and may adversely affect our results of operations and financial condition.
The Company could be adversely affected by economic conditions in its market area.
The Company’s branches are located in the counties of Clarke, Frederick and Loudoun, the towns of Purcellville, Leesburg and Ashburn, and the City of Winchester. Because our lending is concentrated in this market, we will be affected by the general economic conditions in these areas. Changes in the economy may influence the growth rate of our loans and deposits, the quality of the loan portfolio and loan and deposit pricing. A decline in general economic conditions caused by inflation, recession, unemployment or other factors beyond our control would impact the demand for banking products and services generally, which could negatively affect our financial condition and performance.
The Company’s operations may be adversely affected by cyber security risks.
In the ordinary course of business, the Company collects and stores sensitive data, including proprietary business information and personally identifiable information of its customers and employees in systems and on networks. The secure processing, maintenance, and use of this information is critical to the Company's operations and business strategy. In addition, the Company relies heavily on communications and information systems to conduct its business. Any failure, interruption, or breach in security or operational integrity of these systems could result in failures or disruptions in the Company's customer relationship management, general ledger, deposit, loan, and other systems. The Company has invested in accepted technologies, and continually reviews processes and practices that are designed to protect its networks, computers, and data from damage or unauthorized access. Despite these security measures, the Company’s computer systems and infrastructure may be vulnerable to attacks by hackers or breached due to employee error, malfeasance, or other disruptions. A breach of any kind could compromise systems and the information stored there could be accessed, damaged, or disclosed. A breach in security or other failure could result in legal claims, regulatory penalties, disruption in operations, increased expenses, loss of customers and business partners, and damage to the Company’s reputation, which could adversely affect its business and financial condition. Furthermore, as cyber threats continue to evolve and increase, the Company may be required to expend significant additional financial and operational resources to modify or enhance its protective measures, or to investigate and remediate any identified information security vulnerabilities.
14
Government measures to regulate the financial industry, including the Dodd-Frank Act, subject us to increased regulation and could adversely affect us.
As a financial institution, we are heavily regulated at the state and federal levels. These laws and regulations are generally intended to benefit consumers, borrowers and depositors, but not investors. Our success depends on our ability to maintain compliance with existing and new laws and regulations. As a result of the financial crisis and related global economic downturn that began in 2007, we have faced, and expect to continue to face, increased public and legislative scrutiny as well as stricter and more comprehensive regulation of our financial services practices. The Dodd-Frank Act includes significant changes in the financial regulatory landscape and will impact all financial institutions, including the Company and the Bank. The Dodd-Frank Act has increased our operations and compliance costs in the short-term. Future legislation, regulation and government policy, which are beyond our control, may change rapidly and unpredictably and could affect the banking industry as a whole, including our business and results of operations, in ways that are difficult to predict. As a result of the provisions in the Dodd-Frank Act and other laws and regulations applicable to the Bank, we could experience additional costs, as well as limitations on the products and services we offer and on our ability to efficiently pursue business opportunities, which may adversely affect our businesses, financial condition or results of operations.
The Company is subject to more stringent capital and liquidity requirements as a result of the Basel III regulatory capital reforms and the Dodd-Frank Act.
The Bank is subject to capital adequacy guidelines and other regulatory requirements specifying minimum amounts and types of capital which it must maintain. From time to time, regulators implement changes to these regulatory capital adequacy guidelines. Under the Dodd-Frank Act, the federal banking agencies have established stricter capital requirements and leverage limits for banks and bank holding companies that are based on the Basel III regulatory capital reforms. The Basel III Capital Rules require banking organizations to maintain significantly more capital and adopted more demanding regulatory capital risk weightings and calculations. While the recently passed Economic Growth Act requires that federal banking regulators establish a simplified leverage capital framework for smaller banks, these more stringent capital requirements could, among other things, limit banking operations and activities, and growth of loan portfolios, in order to focus on retention of earnings to improve capital levels. The Bank believes that it maintains sufficient levels of Tier 1 and Common Equity Tier 1 capital to comply with the Basel III Final rules. However, if the Bank fails to meet these minimum capital guidelines and/or other regulatory requirements, the Bank could be subject to regulatory restrictions, including limitations on paying dividends to the holding company for shareholder dividends and share repurchases and paying discretionary bonuses, or experience other adverse consequences that could cause its financial condition to be materially and adversely affected.
The Company’s concentration in loans secured by real estate may increase its credit losses, which would negatively affect our financial results.
At December 31, 2019, loans secured by real estate totaled $577.1 million and represented 89.50% of the Company’s loan portfolio, net of deferred loan fees. If we experience adverse changes in the local real estate market or in the local or national economy, borrowers’ ability to pay these loans may be impaired, which could impact the Company’s financial performance. The Company attempts to limit its exposure to this risk by applying good underwriting practices at origination, evaluating the appraisals used to establish property values, and routinely monitoring the financial condition of borrowers. If the value of real estate serving as collateral for the loan portfolio were to continue to decline materially, a significant part of the loan portfolio could become under-collateralized. If the loans that are secured by real estate become troubled when real estate market conditions are declining or have declined, in the event of foreclosure, the Company may not be able to realize the amount of collateral that was anticipated at the time of originating the loan. In that event, the Company might have to increase the provision for loan losses, which could have a material adverse effect on its operating results and financial condition.
15
An inadequate allowance for loan losses would reduce our earnings.
Our earnings are significantly affected by our ability to properly originate, underwrite and service loans. We maintain an allowance for loan losses based upon many factors, including the following:
• | actual loan loss history; |
• | volume, growth, and composition of the loan portfolio; |
• | the amount of non-performing loans and the value of their related collateral; |
• | the effect of changes in the local real estate market on collateral values; |
• | the effect of current economic conditions on a borrower’s ability to pay; and |
• | other factors deemed relevant by management. |
These determinations are based upon estimates that are inherently subjective, and their accuracy depends on the outcome of future events; therefore, realized losses may differ from current estimates. Changes in economic, operating, and other conditions, including changes in interest rates, which are generally beyond our control, could increase actual loan losses significantly. As a result, actual losses could exceed our current allowance estimate. We cannot provide assurance that our allowance for loan losses is sufficient to cover actual loan losses should such losses differ significantly from the current estimates.
In addition, there can be no assurance that our methodology for assessing our asset quality will succeed in properly identifying impaired loans or calculating an appropriate loan loss allowance. We could sustain losses if we incorrectly assess the creditworthiness of our borrowers or fail to detect or respond to deterioration in asset quality in a timely manner. If our assumptions and judgments prove to be incorrect and the allowance for loan losses is inadequate to absorb losses, or if bank regulatory authorities require us to increase the allowance for loan losses as a part of their examination process, our earnings and capital could be significantly and adversely affected.
Changes in accounting standards could impact reported earnings and capital.
The authorities that promulgate accounting standards, including the Financial Accounting Standards Board (the “FASB”), the SEC, and other regulatory authorities, periodically change the financial accounting and reporting standards that govern the preparation of the Company’s consolidated financial statements. These changes are difficult to predict and can materially impact how the Company records and reports its financial condition and results of operations. In some cases, the Company could be required to apply a new or revised standard retroactively, resulting in the restatement of financial statements for prior periods. Such changes could also impact the capital levels of the Bank, or require the Company to incur additional personnel or technology costs. Most notably, new guidance on the calculation of credit reserves using current expected credit losses, referred to as CECL, was finalized in June 2016. The standard has been delayed for the Company and will now be effective for the Company beginning January 1, 2023. To implement the new standard, the Company has and will incur costs related to data collection and documentation, technology and training. Although the Company is currently unable to reasonably estimate the impact of the new standard on its financial statements, adoption of the new standard could necessitate, among other things, higher loan loss reserve levels, and the Company expects to recognize a one-time cumulative effect adjustment to the allowance for loan losses and opening retained earnings as of the beginning of the quarter in which the standard is effective. If the Company is required to materially increase the level of the allowance for loan losses or incurs additional expenses to determine the appropriate level of the allowance for loan losses, such changes could adversely affect the Company’s capital levels, financial condition and results of operations.
Our exposure to operational risk may adversely affect our business.
We are exposed to many types of operational risk, including reputational risk, legal and compliance risk, the risk of fraud or theft by employees or outsiders, unauthorized transactions by employees or operational errors, including clerical or record-keeping errors or those resulting from faulty or disabled computer or telecommunications systems.
Reputational risk, or the risk to our earnings and capital from negative public opinion, could result from our actual alleged conduct in any number of activities, including lending practices, corporate governance, regulatory compliance or the occurrence of any of the events or instances mentioned below, or from actions taken by government regulators or community organizations in response to that conduct. Negative public opinion could also result from adverse news or publicity that impairs the reputation of the financial services industry generally.
16
Further, if any of our financial, accounting, or other data processing systems fail or have other significant shortcomings, we could be adversely affected. We depend on internal systems and outsourced technology to support these data storage and processing operations. Our inability to use or access these information systems at critical points in time could unfavorably impact the timeliness and efficiency of our business operations. We could be adversely affected if one of our employees causes a significant operational break-down or failure, either as a result of human error or where an individual purposefully sabotages or fraudulently manipulates our operations or systems. We are also at risk of the impact of natural disasters, terrorism and international hostilities on our systems or for the effects of outages or other failures involving power or communications systems operated by others.
If any of the foregoing risks materialize, it could have a material adverse affect on our business, financial condition and results of operations.
The soundness of other financial institutions could adversely affect us.
Our ability to engage in routine funding transactions could be adversely affected by the actions and commercial soundness of other financial institutions. Financial services institutions are interrelated as a result of trading, clearing, counterparty or other relationships. We have exposure to many different industries and counterparties, and we routinely execute transactions with counterparties in the financial industry. As a result, defaults by, or even rumors or questions about, one or more financial services institutions, or the financial services industry generally, have led to market-wide liquidity problems and could lead to losses or defaults by us or by other institutions. Many of these transactions expose us to credit risk in the event of default of our counterparty or client. In addition, our credit risk may be exacerbated when the collateral held by us cannot be realized upon or is liquidated at prices not sufficient to recover the full amount of the financial instrument exposure due us. There is no assurance that any such losses would not materially and adversely affect our results of operations.
The Company may not be able to successfully manage its growth or implement its growth strategy, which may adversely affect results of operations and financial condition.
A key component of the Company’s business strategy is to continue to grow and expand. The Company’s ability to grow and expand depends upon its ability to open new branch locations, attract new deposits to the existing and new branch locations, and identify attractive loan and investment opportunities. The Company may not be able to implement its growth strategy if it is unable to identify attractive markets or branch locations. Once identified, successfully managing growth will depend on integrating the new branch locations while maintaining adequate capital, cost controls and asset quality. As this growth strategy is implemented, the Company will incur construction costs and increased personnel, occupancy and other operating expenses. Because these costs are incurred before new deposits and loans are generated, adding new branch locations will initially decrease earnings, despite efficient execution of this strategy.
The Company relies heavily on its senior management team and the unexpected loss of key officers could adversely affect operations.
The Company believes that its growth and success depends heavily upon the skills of its senior management team. The Company also depends on the experience of its subsidiary’s officers and on their relationships with the customers they serve. The loss of one or more of these officers could disrupt the Company’s operations and impair its ability to implement its business strategy, which could adversely affect the Company’s financial condition and performance.
Failure to keep pace with technological change could adversely affect our business.
The financial services industry is continually undergoing rapid technological change with frequent introductions of new technology-driven products and services. The effective use of technology increases efficiency and enables financial institutions and other firms to better serve customers and to reduce costs. The pace of these technological changes has increased in the “Fintech” environment, in which industry changing products and services are often introduced and adopted, including innovative ways that customers can make payments, access products, and manage accounts. Our future success depends, in part, upon our ability to address the needs of our customers by using technology to provide products and services that will satisfy customer demands, as well as to create additional efficiencies in our operations. Many of our competitors have substantially greater resources to invest in technological improvements. We may not be able to effectively implement new technology-driven products and services, which could entail significant time, resources and additional risk to develop or adopt, or be successful in marketing these products and services to our customers. Failure to successfully keep pace with technological change affecting the financial services industry could have a material adverse impact on our business and, in turn, our financial condition and results of operations.
Item 1B. Unresolved Staff Comments
None.
17
Item 2. Properties
The Company owns or leases buildings which are used in normal business operations. The Company’s corporate headquarters, and that of Bank of Clarke County, is located at 2 East Main Street, Berryville, Virginia, 22611. At December 31, 2019, Bank of Clarke County operated twelve full-service branches and one drive-through only facility in the Virginia communities of Berryville, Winchester, Boyce, Stephens City, Purcellville, Leesburg and Ashburn. See Note 1 “Nature of Banking Activities and Significant Accounting Policies” and Note 6 “Bank Premises and Equipment, Net” and Note 13 "Leases" in the “Notes to the Consolidated Financial Statements” of this Form 10-K for information with respect to the amounts at which bank premises and equipment are carried and commitments under long-term leases.
All of the Company’s properties are well maintained, are in good operating condition and are adequate for the Company’s present and anticipated future needs.
Item 3. Legal Proceedings
There are no material pending legal proceedings to which the Company is a party or of which the property of the Company is subject.
Item 4. Mine Safety Disclosures
None.
PART II
Item 5. Market for Registrant’s Common Equity, Related Stockholder Matters and Issuer Purchases of Equity Securities
The Company’s common stock is quoted on the OTC Markets Group's OTCQX Market under the symbol “EFSI.” The OTC Markets Group provides information about the common stock to professional market makers who match sellers with buyers. Securities brokers can obtain information from the OTC Markets Group when working with clients. When a client decides to initiate a transaction, the broker will contact one of the stock’s market makers. Any over-the-counter market quotations in the Company’s common stock reflect inter-dealer prices, without retail mark-up, mark-down or commission and may not necessarily represent actual transactions.
As of March 2, 2020, the Company had approximately 955 shareholders of record.
The Company has historically paid dividends on a quarterly basis. The final determination of the timing, amount and payment of dividends on the Common Stock is at the discretion of the Company’s Board of Directors. Some of the factors affecting the payment of dividends on the Company’s common stock are operating results, financial condition, capital adequacy, regulatory requirements and shareholders returns.
18
Issuer Purchases of Equity Securities for the Quarter Ended December 31, 2019
On June 20, 2019, the Corporation renewed the stock repurchase program to repurchase up to 150,000 shares of its common stock prior to June 30, 2020. During 2019, the Company purchased 53,988 shares of its Common Stock under its stock repurchase program at an average price of $32.79.
The following table details the Company's purchases of its common stock during the fourth quarter pursuant to the Stock Repurchase program renewed on June 20, 2019. The Company authorized 150,000 shares for repurchase under the Stock Repurchase program. The program has an expiration date of June 30, 2020.
Total Number of Shares Purchased | Average Price Paid Per Share | Total Number of Shares Purchased as Part of Publicly Announced Plan | Maximum Number of Shares that may Yet Be Purchased Under the Plan | ||||||||||
October 1 - October 31, 2019 | 6,700 | $ | 30.25 | 6,700 | 143,300 | ||||||||
November 1 - November 30, 2019 | — | — | 6,700 | 143,300 | |||||||||
December 1 - December 31, 2019 | 2,233 | 31.47 | 8,933 | 141,067 | |||||||||
8,933 | $ | 30.55 | 8,933 | 141,067 | |||||||||
Stock Performance
The following line graph compares the cumulative total return to the shareholders of the Company to the returns of the NASDAQ Bank Index and the NASDAQ Composite Index for the last five years. The amounts in the table represent the value of the investment on December 31st of the year indicated, assuming $100 was initially invested on December 31, 2014 and the reinvestment of dividends. See Management Discussion and Analysis sections Liquidity and Capital Resources and Note 16, “Restrictions on Dividends, Loans and Advances” to the Consolidated Financial Statements for information on Eagle Financial Services, Inc. ability and intent to pay dividends.
2014 | 2015 | 2016 | 2017 | 2018 | 2019 | |||||||||||||||||||
Eagle Financial Services, Inc. | $ | 100 | $ | 102 | $ | 119 | $ | 152 | $ | 152 | $ | 157 | ||||||||||||
NASDAQ Bank Index | 100 | 107 | 144 | 149 | 122 | 148 | ||||||||||||||||||
NASDAQ Composite Index | 100 | 106 | 114 | 146 | 140 | 189 | ||||||||||||||||||
19
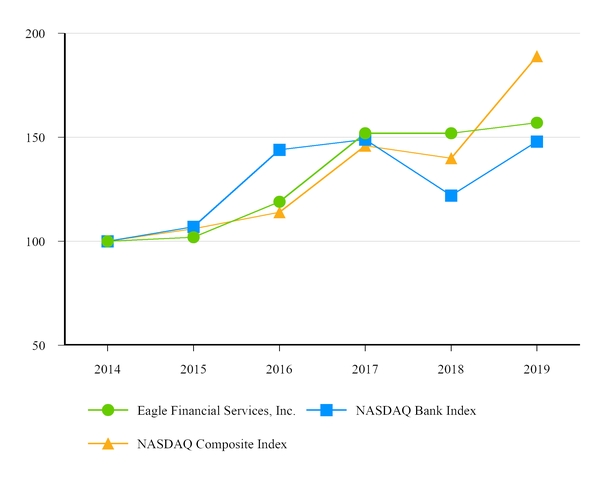
20
Item 6. Selected Financial Data
The following table presents selected financial data, which was derived from the Company’s audited financial statements for the periods indicated.
December 31, | ||||||||||||||||||||
2019 | 2018 | 2017 | 2016 | 2015 | ||||||||||||||||
(dollars in thousands, except per share amounts) | ||||||||||||||||||||
Income Statement Data: | ||||||||||||||||||||
Interest and dividend income | $ | 35,454 | $ | 31,923 | $ | 28,351 | $ | 25,785 | $ | 24,493 | ||||||||||
Interest expense | 4,239 | 2,515 | 1,154 | 1,067 | 1,347 | |||||||||||||||
Net interest income | $ | 31,215 | $ | 29,408 | $ | 27,197 | $ | 24,718 | $ | 23,146 | ||||||||||
Provision for (recovery of) loan losses | 629 | 777 | (625 | ) | (188 | ) | (227 | ) | ||||||||||||
Net interest income after provision for (recovery of) loan losses | $ | 30,586 | $ | 28,631 | $ | 27,822 | $ | 24,906 | $ | 23,373 | ||||||||||
Noninterest income | 7,759 | 3,879 | 6,780 | 6,669 | 8,438 | |||||||||||||||
Net revenue | $ | 38,345 | $ | 35,510 | $ | 34,602 | $ | 31,575 | $ | 31,811 | ||||||||||
Noninterest expenses | 26,776 | 25,195 | 23,190 | 22,652 | 22,481 | |||||||||||||||
Income before income taxes | $ | 11,569 | $ | 10,315 | $ | 11,412 | $ | 8,923 | $ | 9,330 | ||||||||||
Income tax expense | 1,810 | 1,314 | 3,626 | 2,553 | 2,433 | |||||||||||||||
Net Income | $ | 9,759 | $ | 9,001 | $ | 7,786 | $ | 6,370 | $ | 6,897 | ||||||||||
Performance Ratios: | ||||||||||||||||||||
Return on average assets | 1.18 | % | 1.16 | % | 1.08 | % | 0.96 | % | 1.10 | % | ||||||||||
Return on average equity | 10.60 | % | 10.67 | % | 9.50 | % | 7.98 | % | 9.17 | % | ||||||||||
Shareholders’ equity to assets | 10.98 | % | 10.96 | % | 10.95 | % | 11.34 | % | 11.97 | % | ||||||||||
Dividend payout ratio | 35.21 | % | 36.15 | % | 39.29 | % | 45.30 | % | 40.61 | % | ||||||||||
Non-performing loans to total loans | 0.34 | % | 0.35 | % | 1.11 | % | 1.35 | % | 1.07 | % | ||||||||||
Non-performing assets to total assets | 0.27 | % | 0.28 | % | 0.84 | % | 1.05 | % | 0.90 | % | ||||||||||
Per Common Share Data: | ||||||||||||||||||||
Net income, basic | $ | 2.84 | $ | 2.60 | $ | 2.24 | $ | 1.81 | $ | 1.97 | ||||||||||
Net income, diluted | 2.84 | 2.60 | 2.24 | 1.81 | 1.97 | |||||||||||||||
Cash dividends declared | 1.00 | 0.94 | 0.88 | 0.82 | 0.80 | |||||||||||||||
Book value | 28.08 | 25.42 | 24.30 | 22.90 | 22.24 | |||||||||||||||
Market price | 31.05 | 30.99 | 32.00 | 25.75 | 23.00 | |||||||||||||||
Average shares outstanding, basic | 3,438,410 | 3,467,667 | 3,468,275 | 3,518,848 | 3,495,334 | |||||||||||||||
Average shares outstanding, diluted | 3,438,410 | 3,467,667 | 3,468,275 | 3,518,848 | 3,495,334 | |||||||||||||||
Balance Sheet Data: | ||||||||||||||||||||
Total securities | $ | 166,200 | $ | 145,468 | $ | 133,673 | $ | 120,330 | $ | 107,719 | ||||||||||
Total loans | 644,760 | 606,827 | 568,817 | 516,942 | 495,573 | |||||||||||||||
Total assets | 877,320 | 799,617 | 765,751 | 700,149 | 653,272 | |||||||||||||||
Total deposits | 771,544 | 703,104 | 663,414 | 603,877 | 550,718 | |||||||||||||||
Shareholders’ equity | 96,326 | 87,599 | 83,817 | 79,416 | 78,221 | |||||||||||||||
21
Item 7. Management’s Discussion and Analysis of Financial Condition and Results of Operation
The purpose of this discussion is to focus on the important factors affecting the financial condition, results of operations, liquidity and capital resources of Eagle Financial Services, Inc. (the “Company”). This discussion should be read in conjunction with the Company’s Consolidated Financial Statements and the Notes to the Consolidated Financial Statements presented in Item 8, Financial Statements and Supplementary Data, of this Form 10-K.
GENERAL
The Company is a bank holding company which owns 100% of the stock of Bank of Clarke County (the “Bank”). Accordingly, the results of operations for the Company are dependent upon the operations of the Bank. The Bank conducts a commercial banking business which consists of attracting deposits from the general public and investing those funds in commercial, consumer and real estate loans and corporate, municipal and U.S. government agency securities. The Bank’s deposits are insured by the Federal Deposit Insurance Corporation to the extent permitted by law. At December 31, 2019, the Company had total assets of $877.3 million, net loans of $639.8 million, total deposits of $771.5 million and shareholders’ equity of $96.3 million. The Company’s net income was $9.8 million for the year ended December 31, 2019.
MANAGEMENT’S STRATEGY
The Company strives to be an outstanding financial institution in its market by building solid sustainable relationships with: (1) its customers, by providing highly personalized customer service, a network of conveniently placed branches and ATMs, a competitive variety of products/services and courteous, professional employees, (2) its employees, by providing generous benefits, a positive work environment, advancement opportunities and incentives to exceed expectations, (3) its communities, by participating in local concerns, providing monetary support, supporting employee volunteerism and providing employment opportunities, and (4) its shareholders, by providing sound profits and returns, sustainable growth, regular dividends and committing to our local, independent status.
OPERATING STRATEGY
The Bank is a locally owned and managed financial institution. This allows the Bank to be flexible and responsive in the products and services it offers. The Bank grows primarily by lending funds to local residents and businesses at a competitive price that reflects the inherent risk of lending. The Bank attempts to fund these loans through deposits gathered from local residents and businesses. The Bank prices its deposits by comparing alternative sources of funds and selecting the lowest cost available. When deposits are not adequate to fund asset growth, the Bank relies on borrowings, both short and long term. The Bank’s primary source of borrowed funds is the Federal Home Loan Bank of Atlanta which offers numerous terms and rate structures to the Bank.
As interest rates change, the Bank attempts to maintain its net interest margin. This is accomplished by changing the price, terms, and mix of its financial assets and liabilities. The Bank also earns fees on services provided through Eagle Investment Group, which is the Bank’s investment management division that offers both trust services and investment sales, mortgage originations and deposit operations. The Bank also incurs noninterest expenses associated with compensating employees, maintaining and acquiring fixed assets, and purchasing goods and services necessary to support its daily operations.
The Bank has a marketing department which seeks to develop new business. This is accomplished through an ongoing calling program whereby account officers visit with existing and potential customers to discuss the products and services offered. The Bank also utilizes traditional advertising such as television commercials, radio ads, newspaper ads, and billboards.
LENDING POLICIES
Administration and supervision over the lending process is provided by the Bank’s Credit Administration Department. The principal risk associated with the Bank’s loan portfolio is the creditworthiness of its borrowers. In an effort to manage this risk, the Bank’s policy gives loan amount approval limits to individual loan officers based on their position and level of experience. Credit risk is increased or decreased, depending on the type of loan and prevailing economic conditions. In consideration of the different types of loans in the portfolio, the risk associated with real estate mortgage loans, commercial loans and consumer loans varies based on employment levels, consumer confidence, fluctuations in the value of real estate and other conditions that affect the ability of borrowers to repay debt.
The Company has written policies and procedures to help manage credit risk. The Company utilizes a loan review process that includes formulation of portfolio management strategy, guidelines for underwriting standards and risk assessment, procedures for ongoing identification and management of credit deterioration, and regular portfolio reviews to establish loss exposure and to ascertain compliance with the Company’s policies.
22
The Bank uses a tiered approach to approve credit requests consisting of individual lending authorities, joint approval of Category I officers, and a director loan committee. Lending limits for individuals are set by the Board of Directors and are determined by loan purpose, collateral type, and internal risk rating of the borrower. The highest individual authority (Category I) is assigned to the Bank’s President / Chief Executive Officer, Chief Revenue Officer and Chief Credit Officer (approval authority only). Two officers in Category I may combine their authority to approve loan requests to borrowers with credit exposure up to $5.0 million on a secured basis and $2.0 million unsecured. Officers in Category II, III, IV, V, VI and VII have lesser authorities and with approval of a Category I officer may extend loans to borrowers with exposure of $2.5 million on a secured basis and $1.0 million unsecured. Loans exceeding $5.0 million and up to the Bank’s legal lending limit can be approved by the Director Loan Committee consisting of four directors (three directors constituting a quorum). The Director’s Loan Committee also reviews and approves changes to the Bank’s Loan Policy as presented by management.
The following sections discuss the major loan categories within the total loan portfolio:
One-to-Four-Family Residential Real Estate Lending
Residential lending activity may be generated by the Bank’s loan officer solicitations, referrals by real estate professionals, and existing or new bank customers. Loan applications are taken by a Bank loan officer. As part of the application process, information is gathered concerning income, employment and credit history of the applicant. The valuation of residential collateral is provided by independent fee appraisers who have been approved by the Bank’s Directors Loan Committee. In connection with residential real estate loans, the Bank requires title insurance, hazard insurance and, if applicable, flood insurance. In addition to traditional residential mortgage loans secured by a first or junior lien on the property, the Bank offers home equity lines of credit.
Commercial Real Estate Lending
Commercial real estate loans are secured by various types of commercial real estate in the Bank’s market area, including multi-family residential buildings, commercial buildings and offices, small shopping centers and churches. Commercial real estate loan originations are obtained through broker referrals, direct solicitation of developers and continued business from customers. In its underwriting of commercial real estate, the Bank’s loan to original appraised value ratio is generally 80% or less. Commercial real estate lending entails significant additional risk as compared with residential mortgage lending. Commercial real estate loans typically involve larger loan balances concentrated with single borrowers or groups of related borrowers. Additionally, the repayment of loans secured by income producing properties is typically dependent on the successful operation of a business or a real estate project and thus may be subject, to a greater extent, to adverse conditions in the real estate market or the economy, in general. The Bank’s commercial real estate loan underwriting criteria require an examination of debt service coverage ratios, the borrower’s creditworthiness, prior credit history and reputation, and the Bank typically requires personal guarantees or endorsements of the borrowers’ principal owners.
Construction and Land Development Lending
The Bank makes local construction loans, primarily residential, and land acquisition and development loans. The construction loans are secured by residential houses under construction and the underlying land for which the loan was obtained. The average life of most construction loans is less than one year and the Bank offers both fixed and variable rate interest structures. The interest rate structure offered to customers depends on the total amount of these loans outstanding and the impact of the interest rate structure on the Bank’s overall interest rate risk. There are two characteristics of construction lending which impact its overall risk as compared to residential mortgage lending. First, there is more concentration risk due to the extension of a large loan balance through several lines of credit to a single developer or contractor. Second, there is more collateral risk due to the fact that loan funds are provided to the borrower based upon the estimated value of the collateral after completion. This could cause an inaccurate estimate of the amount needed to complete construction or an excessive loan-to-value ratio. To mitigate the risks associated with construction lending, the Bank generally limits loan amounts to 80% of the estimated appraised value of the finished home. The Bank also obtains a first lien on the property as security for its construction loans and typically requires personal guarantees from the borrower’s principal owners. Finally, the Bank performs inspections of the construction projects to ensure that the percentage of construction completed correlates with the amount of draws on the construction line of credit.
23
Commercial and Industrial Lending
Commercial business loans generally have more risk than residential mortgage loans, but have higher yields. To manage these risks, the Bank generally obtains appropriate collateral and personal guarantees from the borrower’s principal owners and monitors the financial condition of its business borrowers. Residential mortgage loans generally are made on the basis of the borrower’s ability to make repayment from employment and other income and are secured by real estate whose value tends to be readily ascertainable. In contrast, commercial business loans typically are made on the basis of the borrower’s ability to make repayment from cash flow from its business and are secured by business assets, such as commercial real estate, accounts receivable, equipment and inventory. As a result, the availability of funds for the repayment of commercial business loans is substantially dependent on the success of the business itself. Furthermore, the collateral for commercial business loans may depreciate over time and generally cannot be appraised with as much precision as residential real estate.
Consumer Lending
The Bank offers various secured and unsecured consumer loans, which include personal installment loans, personal lines of credit, automobile loans, and credit card loans. The Bank originates its consumer loans within its geographic market area and these loans are generally made to customers with whom the Bank has an existing relationship. Consumer loans generally entail greater risk than residential mortgage loans, particularly in the case of consumer loans which are unsecured or secured by rapidly depreciable assets such as automobiles. In such cases, any repossessed collateral on a defaulted consumer loan may not provide an adequate source of repayment of the outstanding loan balance as a result of the greater likelihood of damage, loss or depreciation. Consumer loan collections are dependent on the borrower’s continuing financial stability, and thus are more likely to be adversely affected by job loss, divorce, illness or personal bankruptcy. Furthermore, the application of various federal and state laws, including federal and state bankruptcy and insolvency laws, may limit the amount which can be recovered on such loans.
The underwriting standards employed by the Bank for consumer loans include a determination of the applicant’s payment history on other debts and an assessment of ability to meet existing obligations and payments on the proposed loan. The stability of the applicant’s monthly income may be determined by verification of gross monthly income from primary employment, and from any verifiable secondary income. Although creditworthiness of the applicant is the primary consideration, the underwriting process also includes an analysis of the value of the security in relation to the proposed loan amount.
CRITICAL ACCOUNTING POLICIES
The financial statements of the Company are prepared in accordance with accounting principles generally accepted in the United States of America (GAAP). The financial information contained within these statements is, to a significant extent, based on measurements of the financial effects of transactions and events that have already occurred. A variety of factors could affect the ultimate value that is obtained when earning income, recognizing an expense, recovering an asset or relieving a liability. In addition, GAAP itself may change from one previously acceptable method to another method. Although the economics of the transactions would be the same, the timing of events that would impact the transactions could change.
Allowance for Loan Losses
The allowance for loan losses is an estimate of the probable losses inherent in the Company’s loan portfolio. As required by GAAP, the allowance for loan losses is accrued when the occurrence of losses is probable and losses can be estimated. Impairment losses are accrued based on the differences between the loan balance and the value of its collateral, the present value of future cash flows, or the price established in the secondary market. The Company’s allowance for loan losses has three basic components: the general allowance, the specific allowance and the unallocated allowance. Each of these components is determined based upon estimates that can and do change when actual events occur. The general allowance uses historical experience and other qualitative factors to estimate future losses and, as a result, the estimated amount of losses can differ significantly from the actual amount of losses which would be incurred in the future. However, the potential for significant differences is mitigated by continuously updating the loss history and qualitative factor analyses of the Company. The specific allowance is based upon the evaluation of specific impaired loans on which a loss may be realized. Factors such as past due history, ability to pay, and collateral value are used to identify those loans on which a loss may be realized. Each of these loans is then evaluated to determine how much loss is estimated to be realized on its disposition. The sum of the losses on the individual loans becomes the Company’s specific allowance. This process is inherently subjective and actual losses may be greater than or less than the estimated specific allowance. The unallocated allowance captures losses that are attributable to various economic events which may affect a certain loan type within the loan portfolio or a certain industrial or geographic sector within the Company’s market. As the loans, which are affected by these events, are identified or losses are experienced on the loans which are affected by these events, they will be reflected within the specific or general allowances. Note 1 to the Consolidated Financial Statements presented in Item 8, Financial Statements and Supplementary Data, of the 2019 Form 10-K, provides additional information related to the allowance for loan losses.
24
FORWARD LOOKING STATEMENTS
The Company makes forward looking statements in this report that are subject to risks and uncertainties. These forward looking statements include statements regarding our profitability, liquidity, allowance for loan losses, interest rate sensitivity, market risk, growth strategy, and financial and other goals. The words “believes,” “expects,” “may,” “will,” “should,” “projects,” “contemplates,” “anticipates,” “forecasts,” “intends,” or other similar words or terms are intended to identify forward looking statements. These forward looking statements are subject to significant uncertainties because they are based upon or are affected by factors including:
• | difficult market conditions in our industry; |
• | effects of soundness of other financial institutions; |
• | potential impact on us of existing and future legislation and regulations; |
• | the ability to successfully manage growth or implement growth strategies if the Bank is unable to identify attractive markets, locations or opportunities to expand in the future; |
• | competition with other banks and financial institutions, and companies outside of the banking industry, including those companies that have substantially greater access to capital and other resources; |
• | the successful management of interest rate risk; |
• | risks inherent in making loans such as repayment risks and fluctuating collateral values; |
• | changes in general economic and business conditions in the market area; |
• | reliance on the management team, including the ability to attract and retain key personnel; |
• | changes in interest rates and interest rate policies; |
• | maintaining capital levels adequate to support growth; |
• | maintaining cost controls and asset qualities as new branches are opened or acquired; |
• | demand, development and acceptance of new products and services; |
• | problems with technology utilized by the Bank; |
• | changing trends in customer profiles and behavior; |
• | changes in accounting policies and banking and other laws and regulations; and |
• | other factors described in Item 1A., “Risk Factors,” above. |
Because of these uncertainties, actual future results may be materially different from the results indicated by these forward looking statements. In addition, past results of operations do not necessarily indicate future results.
25
RESULTS OF OPERATIONS
Net Income
Net income for 2019 was $9.8 million, an increase of $758 thousand or 8.42% from 2018’s net income of $9.0 million. Net income for 2018 increased $1.2 million or 15.60% from 2017’s net income of $7.8 million. Basic and diluted earnings per share were $2.84, $2.60, and $2.24 for 2019, 2018, and 2017, respectively.
Return on average assets (ROA) measures how efficiently the Company uses its assets to produce net income. Some issues reflected within this efficiency include the Company’s asset mix, funding sources, pricing, fee generation, and cost control. The ROA of the Company, on an annualized basis, was 1.18%, 1.16%, and 1.08% for 2019, 2018, and 2017, respectively.
Return on average equity (ROE) measures the utilization of shareholders’ equity in generating net income. This measurement is affected by the same factors as ROA with consideration to how much of the Company’s assets are funded by the shareholders. The ROE for the Company was 10.60%, 10.67%, and 9.50% for 2019, 2018, and 2017, respectively.
Net Interest Income
Net interest income, the difference between total interest income and total interest expense, is the Company’s primary source of earnings. Net interest income was $31.2 million for 2019, $29.4 million for 2018, and $27.2 million for 2017, which represents an increase of $1.8 million or 6.14% and $2.2 million or 8.13% for 2019 and 2018, respectively. Net interest income is derived from the volume of earning assets and the rates earned on those assets as compared to the cost of funds. Total interest income was $35.5 million for 2019, $31.9 million for 2018, and $28.4 million for 2017, which represents an increase of $3.5 million or 11.06% and an increase of $3.6 million or 12.60% for 2019 and 2018, respectively. Total interest expense was $4.2 million for 2019, $2.5 million for 2018, and $1.2 million for 2017, which represents an increase of $1.7 million or 68.55% and an increase of $1.4 million or 117.94% in 2019 and 2018, respectively. The increase in total interest income and interest expense during 2019 was driven by the growth in interest-earning assets and interest-bearing liabilities as well as increases in rates paid on deposit accounts driven by market rate increases. Refer to the table titled “Volume and Rate Analysis” for further detail.
The table titled “Average Balances, Income and Expenses, Yields and Rates” displays the composition of interest earnings assets and interest bearing liabilities and their respective yields and rates for the years ended December 31, 2019, 2018, and 2017.
The net interest margin was 4.02% for 2019, 4.07% for 2018, and 4.10% for 2017. The net interest margin is calculated by dividing tax-equivalent net interest income by total average earnings assets. Tax-equivalent net interest income is calculated by adding the tax benefit on certain securities and loans, whose interest is tax-exempt, to total interest income then subtracting total interest expense. The tax rate used to calculate the tax benefit was 21% for 2019 and 2018 and 34% for 2017. The table titled “Tax-Equivalent Net Interest Income” reconciles net interest income to tax-equivalent net interest income, which is not a measurement under GAAP, for the years ended December 31, 2019, 2018, and 2017.
Net interest income and net interest margin may experience some decline as interest bearing assets are repriced or replaced more rapidly than interest earning liabilities.
26
Average Balances, Income and Expenses, Yields and Rates
(dollars in thousands)
December 31, 2019 | December 31, 2018 | December 31, 2017 | |||||||||||||||||||||||||||||||
Average Balances | Interest Income/ Expense | Average Yield/ Rate | Average Balances | Interest Income/ Expense | Average Yield/ Rate | Average Balances | Interest Income/ Expense | Average Yield/ Rate | |||||||||||||||||||||||||
Assets: | |||||||||||||||||||||||||||||||||
Securities: | |||||||||||||||||||||||||||||||||
Taxable | $ | 113,625 | $ | 3,159 | 2.78 | % | $ | 98,628 | $ | 2,803 | 2.84 | % | $ | 90,881 | $ | 2,339 | 2.57 | % | |||||||||||||||
Tax-Exempt (1) | 31,009 | 1,084 | 3.50 | % | 38,656 | 1,331 | 3.44 | % | 38,432 | 1,567 | 4.08 | % | |||||||||||||||||||||
Total Securities | $ | 144,634 | $ | 4,243 | 2.93 | % | $ | 137,284 | $ | 4,134 | 3.01 | % | $ | 129,313 | $ | 3,906 | 3.02 | % | |||||||||||||||
Loans: | |||||||||||||||||||||||||||||||||
Taxable | 613,884 | 30,722 | 5.00 | % | 573,040 | 27,482 | 4.80 | % | 530,109 | 24,616 | 4.64 | % | |||||||||||||||||||||
Non-accrual | 2,723 | — | — | % | 1,916 | — | — | % | 5,701 | — | — | % | |||||||||||||||||||||
Tax-Exempt (1) | 11,722 | 526 | 4.49 | % | 11,591 | 516 | 4.45 | % | 5,927 | 311 | 5.25 | % | |||||||||||||||||||||
Total Loans | $ | 628,329 | $ | 31,248 | 4.97 | % | $ | 586,547 | $ | 27,998 | 4.77 | % | $ | 541,737 | $ | 24,927 | 4.60 | % | |||||||||||||||
Federal funds sold | 194 | 4 | 2.06 | % | 134 | 3 | 2.24 | % | 171 | 1 | 0.58 | % | |||||||||||||||||||||
Interest-bearing deposits in other banks | 15,202 | 297 | 1.95 | % | 9,712 | 176 | 1.81 | % | 13,870 | 156 | 1.12 | % | |||||||||||||||||||||
Total earning assets (2) | $ | 785,636 | $ | 35,792 | 4.56 | % | $ | 731,761 | $ | 32,311 | 4.42 | % | $ | 679,390 | $ | 28,990 | 4.27 | % | |||||||||||||||
Allowance for loan losses | (5,333 | ) | (4,661 | ) | (4,548 | ) | |||||||||||||||||||||||||||
Total non-earning assets | 49,780 | 48,601 | 48,590 | ||||||||||||||||||||||||||||||
Total assets | $ | 830,083 | $ | 775,701 | $ | 723,432 | |||||||||||||||||||||||||||
Liabilities and Shareholders’ Equity: | |||||||||||||||||||||||||||||||||
Interest-bearing deposits: | |||||||||||||||||||||||||||||||||
NOW accounts | $ | 89,536 | $ | 450 | 0.50 | % | $ | 91,353 | $ | 320 | 0.35 | % | $ | 85,154 | $ | 161 | 0.19 | % | |||||||||||||||
Money market accounts | 150,291 | 1,463 | 0.97 | % | 132,136 | 815 | 0.62 | % | 128,068 | 290 | 0.23 | % | |||||||||||||||||||||
Savings accounts | 105,176 | 207 | 0.20 | % | 104,473 | 159 | 0.15 | % | 100,838 | 66 | 0.07 | % | |||||||||||||||||||||
Time deposits: | |||||||||||||||||||||||||||||||||
$250,000 and more | 59,550 | 1,221 | 2.05 | % | 70,778 | 687 | 0.97 | % | 57,010 | 340 | 0.60 | % | |||||||||||||||||||||
Less than $250,000 | 61,775 | 852 | 1.38 | % | 36,808 | 509 | 1.38 | % | 39,319 | 227 | 0.58 | % | |||||||||||||||||||||
Total interest-bearing deposits | $ | 466,328 | $ | 4,193 | 0.90 | % | $ | 435,548 | $ | 2,490 | 0.57 | % | $ | 410,389 | $ | 1,084 | 0.26 | % | |||||||||||||||
Federal funds purchased | 1,074 | 31 | 2.89 | % | 964 | 25 | 2.59 | % | 823 | 13 | 1.58 | % | |||||||||||||||||||||
Federal Home Loan Bank advances | 2,547 | 15 | 0.59 | % | — | — | — | % | 5,096 | 57 | 1.12 | % | |||||||||||||||||||||
Total interest-bearing liabilities | $ | 469,949 | $ | 4,239 | 0.90 | % | $ | 436,512 | $ | 2,515 | 0.58 | % | $ | 416,308 | $ | 1,154 | 0.28 | % | |||||||||||||||
Noninterest-bearing liabilities: | |||||||||||||||||||||||||||||||||
Demand deposits | 258,176 | 246,056 | 216,044 | ||||||||||||||||||||||||||||||
Other Liabilities | 9,900 | 8,811 | 9,129 | ||||||||||||||||||||||||||||||
Total liabilities | $ | 738,025 | $ | 691,379 | $ | 641,481 | |||||||||||||||||||||||||||
Shareholders’ equity | 92,058 | 84,322 | 81,951 | ||||||||||||||||||||||||||||||
Total liabilities and shareholders’ equity | $ | 830,083 | $ | 775,701 | $ | 723,432 | |||||||||||||||||||||||||||
Net interest income | $ | 31,553 | $ | 29,796 | $ | 27,836 | |||||||||||||||||||||||||||
Net interest spread | 3.66 | % | 3.84 | % | 3.99 | % | |||||||||||||||||||||||||||
Interest expense as a percent of average earning assets | 0.54 | % | 0.34 | % | 0.17 | % | |||||||||||||||||||||||||||
Net interest margin | 4.02 | % | 4.07 | % | 4.10 | % | |||||||||||||||||||||||||||
(1) | Income and yields are reported on a tax-equivalent basis using a federal tax rate of 21%, 21% and 34% for 2019, 2018 and 2017, respectively. |
(2) | Non-accrual loans are not included in this total since they are not considered earning assets. |
27
Tax-Equivalent Net Interest Income
(dollars in thousands)
December 31, | ||||||||||||
2019 | 2018 | 2017 | ||||||||||
GAAP Financial Measurements: | ||||||||||||
Interest Income - Loans | $ | 31,138 | $ | 27,890 | $ | 24,821 | ||||||
Interest Income - Securities and Other Interest-Earnings Assets | 4,316 | 4,033 | 3,530 | |||||||||
Interest Expense - Deposits | 4,193 | 2,490 | 1,084 | |||||||||
Interest Expense - Other Borrowings | 46 | 25 | 70 | |||||||||
Total Net Interest Income | $ | 31,215 | $ | 29,408 | $ | 27,197 | ||||||
Non-GAAP Financial Measurements: | ||||||||||||
Add: Tax Benefit on Tax-Exempt Interest Income - Loans (1) | $ | 110 | $ | 108 | $ | 106 | ||||||
Add: Tax Benefit on Tax-Exempt Interest Income - Securities (1) | 228 | 280 | 533 | |||||||||
Total Tax Benefit on Tax-Exempt Interest Income | $ | 338 | $ | 388 | $ | 639 | ||||||
Tax-Equivalent Net Interest Income | $ | 31,553 | $ | 29,796 | $ | 27,836 | ||||||
(1) | Tax benefit was calculated using the federal statutory tax rate of 21%, 21% and 34% for 2019, 2018 and 2017, respectively. |
The tax-equivalent yield on earning assets increased 14 basis points from 2018 to 2019 and increased 15 basis points from 2017 to 2018. The tax-equivalent yield on securities decreased eight basis points from 2018 to 2019 and decreased one basis point from 2017 to 2018. The tax-equivalent yield on loans increased 20 basis points from 2018 to 2019 and increased 17 basis points from 2017 to 2018. The slight increase in the yield on earning assets and the loan portfolio was a result of changes in the portfolio mix during 2019 and 2018 and increases in interest rates by the Federal Reserve during 2018.
The average rate on interest-bearing liabilities increased 32 basis points from 2018 to 2019 and increased 30 basis points from 2017 to 2018. The average rate on total interest-bearing deposits increased 33 basis points from 2018 to 2019 and increased 31 basis points from 2017 to 2018. The average rate on interest bearing deposits increased due to the increases
in rates paid on deposit accounts driven by market rate increases. In general, deposit pricing is done in response to monetary policy actions and yield curve changes. Local competition for funds affects the cost of time deposits, which are primarily comprised of certificates of deposit. The Company prefers to rely most heavily on non-maturity deposits, which include NOW accounts, money market accounts, and savings accounts. The average balance of non-maturity interest-bearing deposits increased $17.0 million or 5.20% from $328.0 million during 2018 to $345.0 million in 2019 and $13.9 million or 4.43% from $314.1 million at December 31, 2017 during 2018. Changes in the average rate on interest-bearing liabilities can also be affected by the pricing on other sources of funds, namely borrowings. The Company from time to time will utilize overnight borrowings in the form of federal funds purchased. The average rate on these borrowings increased 30 basis points from 2018 to 2019 and 101 basis points from 2017 to 2018. The cost of federal funds purchased is affected by the Federal Reserve’s changes in the federal funds target rate, which decreased to 1.75% during December 2019, from 2.50% in December 2018. As another funding option, the Company borrows from the Federal Home Loan Bank through short and long term advances. The average rate on FHLB advances was 0.59% during 2019 and 1.12% during 2017. There were no FHLB advances outstanding during 2018.
The table titled “Volume and Rate Analysis” provides information about the effect of changes in financial assets and liabilities and changes in rates on net interest income. Non-accruing loans are excluded from the average outstanding loans.
Tax-equivalent net interest income increased $1.8 million during 2019. The increase in tax-equivalent net interest income during 2019 is comprised of an increase due to volume of $1.9 million and a decrease due to rate of $149 thousand. The increase in tax-equivalent net interest income during 2019 was affected by the increased volume of taxable loans and taxable securities, offset in part by an increase in the rate paid on interest-bearing liabilities.
Tax-equivalent net interest income increased $2.0 million during 2018. The increase in tax-equivalent net interest income during 2018 is comprised of an increase due to volume of $2.4 million and a decrease due to rate of $436 thousand. The increase in tax-equivalent net interest income during 2018 was primarily affected by the increased volume of taxable loans and taxable securities combined with the rising interest rate environment, offset in part by an increase in the rate paid on interest-bearing liabilities.
28
Volume and Rate Analysis (Tax-Equivalent Basis)
(dollars in thousands)
2019 vs 2018 Increase (Decrease) Due to Changes in: | 2018 vs 2017 Increase (Decrease) Due to Changes in: | |||||||||||||||||||||||
Volume | Rate | Total | Volume | Rate | Total | |||||||||||||||||||
Earning Assets: | ||||||||||||||||||||||||
Securities: | ||||||||||||||||||||||||
Taxable | $ | 413 | $ | (57 | ) | $ | 356 | $ | 208 | $ | 256 | $ | 464 | |||||||||||
Tax-exempt | (271 | ) | 24 | (247 | ) | 9 | (245 | ) | (236 | ) | ||||||||||||||
Loans: | ||||||||||||||||||||||||
Taxable | 2,045 | 1,195 | 3,240 | 2,010 | 856 | 2,866 | ||||||||||||||||||
Tax-exempt | 6 | 4 | 10 | 244 | (39 | ) | 205 | |||||||||||||||||
Federal funds sold | 1 | — | 1 | — | 2 | 2 | ||||||||||||||||||
Interest-bearing deposits in other banks | 106 | 15 | 121 | (19 | ) | 39 | 20 | |||||||||||||||||
Total earning assets | $ | 2,300 | $ | 1,181 | $ | 3,481 | $ | 2,452 | $ | 869 | $ | 3,321 | ||||||||||||
Interest-Bearing Liabilities: | ||||||||||||||||||||||||
NOW accounts | $ | (6 | ) | $ | 136 | $ | 130 | $ | 13 | $ | 146 | $ | 159 | |||||||||||
Money market accounts | 127 | 521 | 648 | 10 | 515 | 525 | ||||||||||||||||||
Savings accounts | 1 | 47 | 48 | 3 | 90 | 93 | ||||||||||||||||||
Time deposits: | ||||||||||||||||||||||||
$100,000 and more | (89 | ) | 623 | 534 | 98 | 249 | 347 | |||||||||||||||||
Less than $100,000 | 343 | — | 343 | (14 | ) | 296 | 282 | |||||||||||||||||
Total interest-bearing deposits | $ | 376 | $ | 1,327 | $ | 1,703 | $ | 110 | $ | 1,296 | $ | 1,406 | ||||||||||||
Federal funds purchased | $ | 3 | $ | 3 | $ | 6 | $ | 3 | $ | 9 | $ | 12 | ||||||||||||
Federal Home Loan Bank advances | 15 | — | 15 | (57 | ) | — | (57 | ) | ||||||||||||||||
Total interest-bearing liabilities | $ | 394 | $ | 1,330 | $ | 1,724 | $ | 56 | $ | 1,305 | $ | 1,361 | ||||||||||||
Change in net interest income | $ | 1,906 | $ | (149 | ) | $ | 1,757 | $ | 2,396 | $ | (436 | ) | $ | 1,960 | ||||||||||
Provision for Loan Losses
The provision for loan losses is based upon management’s estimate of the amount required to maintain an adequate allowance for loan losses as discussed within the Critical Accounting Policies section above. The provision for (recovery of) loan losses was $629 thousand for 2019, $777 thousand for 2018, and $(625) thousand for 2017. Changes in the amount of provision for (recovery of) loan losses during each period reflect the results of the Company’s analysis used to determine the adequacy of the allowance for loan losses. The provision for loan losses in 2019 reflects loan growth in the portfolio during the year as well as one large charge-off in the amount of $850 thousand. The provision for loan losses in 2018 reflects higher specific reserves on remaining impaired loans as well as loan growth in the portfolio during the year. The recovery of loan losses in 2017 is due mainly to a decline in the historical loss experience utilized in our allowance model. The Company is committed to maintaining an allowance that adequately reflects the risk inherent in the loan portfolio. This commitment is more fully discussed in the “Asset Quality” section.
29
Noninterest Income
Total noninterest income was $7.8 million, $6.9 million, and $6.8 million during 2019, 2018, and 2017, respectively. This represents an increase of $880 thousand or 12.79% for 2019 and an increase of $99 thousand or 1.46% for 2018. Management reviews the activities which generate noninterest income on an ongoing basis.
The following table provides the components of noninterest income for the twelve months ended December 31, 2019, 2018, and 2017, which are included within the respective Consolidated Statements of Income headings. The following paragraphs provide information about activities which are included within the respective Consolidated Statements of Income headings. Variances that the Company believes require explanation are discussed below the table.
December 31, | ||||||||||||||||||||||
(dollars in thousands) | 2019 | 2018 | $ Change | % Change | 2018 | 2017 | $ Change | % Change | ||||||||||||||
Income from fiduciary activities | $ | 1,380 | $ | 1,360 | $ | 20 | 1.47 | % | $ | 1,360 | $ | 1,238 | $ | 122 | 9.85 | % | ||||||
Service charges on deposit accounts | 1,187 | 1,218 | (31 | ) | (2.55 | )% | 1,218 | 1,223 | (5 | ) | (0.41 | )% | ||||||||||
Other service charges and fees | 4,893 | 4,173 | 720 | 17.25 | % | 4,173 | 3,878 | 295 | 7.61 | % | ||||||||||||
Gain (loss) on the sale and disposal of premises and equipment | 137 | (3 | ) | 140 | NM | (3 | ) | (12 | ) | 9 | NM | |||||||||||
(Loss) gain on sale of securities | (7 | ) | 17 | (24 | ) | NM | 17 | (10 | ) | 27 | NM | |||||||||||
Other operating income | 169 | 114 | 55 | 48.25 | % | 114 | 463 | (349 | ) | (75.38 | )% | |||||||||||
Total noninterest income | $ | 7,759 | $ | 6,879 | $ | 880 | 12.79 | % | $ | 6,879 | $ | 6,780 | $ | 99 | 1.46 | % | ||||||
NM - Not Meaningful
Income from fiduciary activities increased from 2017 to 2018. The majority of the increase is due to a one-time fee, collected during the first quarter of 2018, related to the settlement of a real estate transaction. The amount of income from fiduciary activities is determined by the number of active accounts and total assets under management. Also, income can fluctuate due to the number of estates settled within any period. These fluctuations do not necessarily indicate future results.
The amount of other services charges and fees is comprised primarily of commissions from the sale of non-deposit investment products, fees received from the Bank’s credit card program, fees generated from the Bank’s ATM/debit card programs, and fees generated from procuring applications for secondary market loans. Other service charges and fees increased by $720 thousand or 17.25% for 2019 and increased by $295 thousand or 7.61% for 2018. This increase can be primarily attributed to an increase of ATM fee income of $191 thousand for 2019 and an increase of $194 thousand for 2018. ATM fee income fluctuates mainly due to usage. Commissions for the sale of non-deposit investment products increased $319 thousand for 2019 due to increased activity in the market Fees generated from procuring applications for secondary market loans increased $180 thousand for 2019. This increase can be attributed to increased activity in the secondary market due to the interest rate environment.
Other operating income decreased during 2018. The fluctuation in this year is mostly attributed to the receipt of a $270 thousand bank owned life insurance (BOLI) benefit during 2017.
30
Noninterest Expenses
Total noninterest expenses were $26.8 million, $25.2 million, and $23.2 million during 2019, 2018, and 2017, respectively. This represents an increase of $1.6 million or 6.28% during 2019 and an increase of $2.0 million or 8.65% during 2018.
The following table provides the components of noninterest expense for the twelve months ended December 31, 2019, 2018, and 2017, which are included within the respective Consolidated Statements of Income headings. The following paragraphs provide information about activities which are included within the respective Consolidated Statements of Income headings. Variances that the Company believes require explanation are discussed below the table.
December 31, | ||||||||||||||||||||||
(dollars in thousands) | 2019 | 2018 | $ Change | % Change | 2018 | 2017 | $ Change | % Change | ||||||||||||||
Salaries and employee benefits | $ | 15,025 | $ | 14,083 | $ | 942 | 6.69 | % | $ | 14,083 | $ | 13,643 | $ | 440 | 3.23 | % | ||||||
Occupancy expenses | 1,611 | 1,476 | 135 | 9.15 | % | 1,476 | 1,473 | 3 | 0.20 | % | ||||||||||||
Equipment expenses | 857 | 915 | (58 | ) | (6.34 | )% | 915 | 955 | (40 | ) | (4.19 | )% | ||||||||||
Advertising and marketing expenses | 868 | 761 | 107 | 14.06 | % | 761 | 731 | 30 | 4.10 | % | ||||||||||||
Stationery and supplies | 172 | 195 | (23 | ) | (11.79 | )% | 195 | 173 | 22 | 12.72 | % | |||||||||||
ATM network fees | 1,141 | 912 | 229 | 25.11 | % | 912 | 816 | 96 | 11.76 | % | ||||||||||||
Other real estate owned expense | 76 | 183 | (107 | ) | (58.47 | )% | 183 | 11 | 172 | 1,563.64 | % | |||||||||||
Loss (gain) on other real estate owned | 443 | 866 | (423 | ) | NM | 866 | (1 | ) | 867 | NM | ||||||||||||
FDIC assessment | 105 | 225 | (120 | ) | (53.33 | )% | 225 | 222 | 3 | 1.35 | % | |||||||||||
Computer software expense | 459 | 474 | (15 | ) | (3.16 | )% | 474 | 647 | (173 | ) | (26.74 | )% | ||||||||||
Bank franchise tax | 656 | 583 | 73 | 12.52 | % | 583 | 534 | 49 | 9.18 | % | ||||||||||||
Professional fees | 1,057 | 1,036 | 21 | 2.03 | % | 1,036 | 1,007 | 29 | 2.88 | % | ||||||||||||
Data processing fees | 1,275 | 794 | 481 | 60.58 | % | 794 | 564 | 230 | 40.78 | % | ||||||||||||
Other operating expenses | 3,031 | 2,692 | 339 | 12.59 | % | 2,692 | 2,415 | 277 | 11.47 | % | ||||||||||||
Total noninterest expenses | $ | 26,776 | $ | 25,195 | $ | 1,581 | 6.28 | % | $ | 25,195 | $ | 23,190 | $ | 2,005 | 8.65 | % | ||||||
NM - Not Meaningful
Salaries and employee benefits expense increased during 2019 and 2018. Most of the increase during 2019 related to increases in salaries expense. In addition to annual pay increases, several one-time expenses approximating $370 thousand were incurred for the hiring and relocation of the Company’s new CEO as well as the hiring of other vital employees. In July 2019, the Company appointed Brandon C. Lorey to succeed John R. Milleson as President and CEO. The majority of the increase during 2018 was related to merit and cost of living increases. In addition to pay increases, the number of full-time equivalent employees increased from 173 to 179 during the year.
Advertising and marketing expenses increased during 2019. Digital marketing expenses increased approximately $108 thousand as the Company strategically began placing more resources into that area during 2019.
ATM network fees increased 25.11% during 2019 and 11.76% during 2018. ATM network fees fluctuate based on the usage of ATM and debit cards.
Other real estate owned expenses and loss (gain) on other real estate owned decreased significantly during 2019. These differences are attributable to one large property that was foreclosed on and subsequently sold in 2018. The balances for 2018 were also not comparable to 2017 due to this single large property that was foreclosed on and sold in 2018.
FDIC assessments decreased $120 thousand during 2019. The Company received notification of a Small Bank Credit Assessment for approximately $178 thousand during the second quarter of 2019. This credit was received because the Deposit Insurance Fund reserve ratio exceeded the established level as of June 30, 2019. Credits were applied to the successive invoices in 2019.
31
Computer software expense decreased during 2018. Fees paid to our core software provider have decreased due to a conscious effort to reduce unused services and renegotiate contract amounts.
Bank franchise tax has increased during 2019 and 2018. This expense increases as capital levels increase.
Data processing fees increased during 2019 and 2018. Much of this increase is related to the Company moving its in-house core banking software to a service bureau environment. The Company migrated to a service bureau environment in late June 2018. This increase can also be attributed to an increase in both the number of customers and the number of transactions being performed.
Other operating expenses increased during 2019 and 2018. During the third and fourth quarters of 2019, $150 thousand was accrued and subsequently paid in connection with the Separation Agreement and Release with James W. McCarty, Jr.'s resignation as Executive Vice President, Chief Administrative Officer and Secretary of the Company. The increase in 2018 is primarily due to increases in loan related expenses driven by loan volume.
The efficiency ratio of the Company was 67.21%, 66.36%, and 67.47% for 2019, 2018, and 2017, respectively. The efficiency ratio is calculated by dividing total noninterest expenses by the sum of tax-equivalent net interest income and total noninterest income, excluding gains and losses on the investment portfolio and other gains/losses from OREO, repossessed vehicles, disposals of bank premises and equipment, etc. The tax rate utilized is 21% for 2019 and 2018 and 34% for 2017. The Company calculates and reviews this ratio as a means of evaluating operational efficiency. A reconciliation of tax-equivalent net interest income, which is not a measurement under GAAP, to net interest income is presented within the Net Interest Income section above.
The calculation of the efficiency ratio for the twelve months ended December 31, 2019, 2018, and 2017 are as follows:
December 31, | |||||||||
2019 | 2018 | 2017 | |||||||
(in thousands) | |||||||||
Summary of Operating Results: | |||||||||
Noninterest expenses | $ | 26,776 | $ | 25,195 | $ | 23,190 | |||
Less: Loss (gain) on other real estate owned | 443 | 866 | (1 | ) | |||||
Adjusted noninterest expenses | $ | 26,333 | $ | 24,329 | $ | 23,191 | |||
Net interest income | $ | 31,215 | $ | 29,408 | $ | 27,197 | |||
Noninterest income | $ | 7,759 | $ | 6,879 | $ | 6,780 | |||
Less: (Loss) gain on sales of securities | (7 | ) | 17 | (10 | ) | ||||
Less: Gain (loss) on the sale and disposal of premises and equipment | 137 | (3 | ) | (12 | ) | ||||
Less: (Loss) on sale of of repossessed assets | — | — | (6 | ) | |||||
Less: Life insurance proceeds | — | — | 270 | ||||||
Adjusted noninterest income | $ | 7,629 | $ | 6,865 | $ | 6,538 | |||
Tax equivalent adjustment (1) | 338 | 388 | 639 | ||||||
Total net interest income and noninterest income, adjusted | $ | 39,182 | $ | 36,661 | $ | 34,374 | |||
Efficiency ratio | 67.21 | % | 66.36 | % | 67.47 | % | |||
(1) Includes tax-equivalent adjustments on loans and securities using the federal statutory tax rate of 21% for 2019 and 2018 and 34% for 2017.
32
Income Taxes
Income tax expense was $1.8 million, $1.3 million, and $3.6 million for the years ended December 31, 2019, 2018, and 2017, respectively. These amounts correspond to an effective tax rate of 15.65%, 12.74%, and 31.77% for 2019, 2018, and 2017, respectively. The Tax Cuts and Jobs Act was signed into law on December 22, 2017, which reduced the Company's corporate tax rate from 34% to 21%. The Tax Cuts and Jobs Act required for the Company's deferred tax assets and liabilities to be adjusted at that date, for the effect of the change in the corporate tax rate. This adjustment resulted in a net increase to federal income tax expense of $397 thousand during 2017. The effective tax rate is below the statutory rate of 21% for 2019 and 2018 and 34% for 2017, due primarily to tax credits on qualified affordable housing project investments as discussed in Note 25 to the Consolidated Financial Statements as well as qualified rehabilitation credits. During the third quarter of 2018, one of the Company’s rehabilitation tax credit investments was finalized and the total amount of credits to be received was determined and certified. The effective tax rate is also impacted by tax-exempt income on investment securities and loans. Note 9 to the Consolidated Financial Statements provides a reconciliation between income tax expense computed using the federal statutory income tax rate and the Company’s actual income tax expense during 2019, 2018, and 2017.
FINANCIAL CONDITION
Assets, Liabilities and Shareholders’ Equity
The Company’s total assets were $877.3 million at December 31, 2019, an increase of $77.7 million or 9.72% from $799.6 million at December 31, 2018. Securities increased $20.7 million or 14.35% from 2018 to 2019. Loans, net of allowance for loan losses, increased by $38.4 million or 6.39% from 2018 to 2019. Total liabilities were $781.0 million at December 31, 2019, compared to $712.0 million at December 31, 2018. Total shareholders’ equity at year end 2019 and 2018 was $96.3 million and $87.6 million, respectively.
Securities
Total securities, excluding restricted stock, at December 31, 2019 were $165.0 million as compared to $144.3 million as of December 31, 2018, which represents an increase of $20.7 million or 14.35% during 2019. The table titled “Securities Portfolio” shows the carrying value of securities at December 31, 2019, 2018, and 2017. The Company purchased $54.3 million in securities during 2019. This amount includes $7.1 million or 13.06% in obligations of U.S. government corporations and agencies, $46.2 million or 85.12% in mortgage-backed securities and $1.0 million or 1.82% in obligations of states and political subdivisions. The Company had $24.6 million in maturities, calls, and principal repayments on securities during 2019. This amount includes $5.8 million or 23.69% in obligations of U.S. government corporations and agencies, $13.3 million or 54.18% in mortgage-backed securities and $5.4 million or 22.13% in obligations of states and political subdivisions. The Company did not have any securities from a single issuer, other than U.S. government agencies, whose amount exceeded 10% of shareholders’ equity as of December 31, 2019. Note 2 to the Consolidated Financial Statements provides additional details about the Company’s securities portfolio as of December 31, 2019 and 2018.
Securities Portfolio
(dollars in thousands)
December 31, | ||||||||||||
2019 | 2018 | 2017 | ||||||||||
Securities available for sale: | ||||||||||||
Obligations of U.S. government corporations and agencies | $ | 22,186 | $ | 21,731 | $ | 21,520 | ||||||
Mortgage-backed securities | 108,161 | 76,483 | 61,244 | |||||||||
Obligations of states and political subdivisions | 34,656 | 46,084 | 49,802 | |||||||||
$ | 165,003 | $ | 144,298 | $ | 132,566 | |||||||
The ability to dispose of available for sale securities prior to maturity provides management more options to react to future rate changes and provides more liquidity, when needed, to meet short-term obligations. The Company had a net unrealized gain on available for sale securities of $1.8 million and a net unrealized loss of $2.0 million at December 31, 2019 and 2018, respectively. Unrealized gains or losses on available for sale securities are reported within shareholders’ equity, net of the related deferred tax effect, as accumulated other comprehensive income (loss).
33
The table titled “Maturity Distribution and Yields of Securities” shows the maturity period and average yield for the different types of securities in the portfolio at December 31, 2019. Although mortgage-backed securities have definitive maturities, they provide monthly principal curtailments which can be reinvested at a prevailing rate and for a different term.
Maturity Distribution and Yields of Securities
(dollars in thousands)
December 31, 2019 | |||||||||||||||||||||||||||||||||||
Due in one year or less | Due after 1 through 5 years | Due after 5 through 10 years | Due after 10 years and Equity Securities | Total | |||||||||||||||||||||||||||||||
Amount | Yield | Amount | Yield | Amount | Yield | Amount | Yield | Amount | Yield | ||||||||||||||||||||||||||
Securities available for sale: | |||||||||||||||||||||||||||||||||||
Obligations of U.S. government corporations and agencies | $ | — | — | % | $ | 5,045 | 2.19 | % | $ | 16,061 | 2.75 | % | $ | 1,080 | 2.46 | % | $ | 22,186 | 2.61 | % | |||||||||||||||
Mortgage-backed securities | — | — | % | — | — | % | — | — | % | 108,161 | 2.71 | % | 108,161 | 2.71 | % | ||||||||||||||||||||
Obligations of states and political subdivisions, taxable | 660 | 4.15 | % | 2,563 | 3.35 | % | 4,858 | 2.80 | % | 1,366 | 2.79 | % | 9,447 | 3.04 | % | ||||||||||||||||||||
Total taxable | $ | 660 | 4.15 | % | $ | 7,608 | 2.58 | % | $ | 20,919 | 2.76 | % | $ | 110,607 | 2.71 | % | $ | 139,794 | 2.72 | % | |||||||||||||||
Obligations of states and political subdivisions, tax-exempt (1) | 806 | 3.72 | % | 5,099 | 3.26 | % | 17,924 | 2.55 | % | 1,380 | 3.25 | % | 25,209 | 2.77 | % | ||||||||||||||||||||
Total | $ | 1,466 | 3.92 | % | $ | 12,707 | 2.85 | % | $ | 38,843 | 2.66 | % | $ | 111,987 | 2.72 | % | $ | 165,003 | 2.73 | % | |||||||||||||||
(1) | Yields on tax-exempt securities have been computed on a tax-equivalent basis using a federal tax rate of 21%. |
Loan Portfolio
The Company’s primary use of funds is supporting lending activities from which it derives the greatest amount of interest income. Gross loans net of deferred fees were $644.8 million and $606.8 million at December 31, 2019 and 2018, respectively. This represents an increase of $37.9 million or 6.25% for 2019. The ratio of net loans to deposits decreased during the year from 85.53% to 82.92% at December 31, 2018 and December 31, 2019, respectively. This decrease was due to strong deposit growth during the year. The table titled “Loan Portfolio” shows the composition of the loan portfolio over the last five years. Loan balances in the table are shown before net deferred fees.
Loan Portfolio
(dollars in thousands)
December 31, | ||||||||||||||||||||
2019 | 2018 | 2017 | 2016 | 2015 | ||||||||||||||||
Loans secured by real estate: | ||||||||||||||||||||
Construction and land development | $ | 42,561 | $ | 54,675 | $ | 43,786 | $ | 23,266 | $ | 35,019 | ||||||||||
Secured by farmland | 13,917 | 7,251 | 8,568 | 8,525 | 6,550 | |||||||||||||||
Secured by 1-4 family residential properties | 219,580 | 221,861 | 223,210 | 227,966 | 229,651 | |||||||||||||||
Multifamily | 14,415 | 7,923 | 4,095 | 3,566 | 3,975 | |||||||||||||||
Commercial | 286,600 | 265,595 | 239,915 | 208,525 | 175,172 | |||||||||||||||
Commercial and industrial loans | 46,543 | 33,086 | 37,427 | 30,341 | 29,366 | |||||||||||||||
Consumer installment loans | 9,541 | 8,470 | 10,187 | 12,677 | 13,530 | |||||||||||||||
All other loans | 12,050 | 8,454 | 2,050 | 2,259 | 2,413 | |||||||||||||||
Total loans | $ | 645,207 | $ | 607,315 | $ | 569,238 | $ | 517,125 | $ | 495,676 | ||||||||||
Loans secured by real estate were $577.1 million or 89.50% and $557.3 million or 91.84% of total loans at December 31, 2019 and 2018, respectively. This represents an increase of $19.8 million or 3.55% for 2019. Consumer installment loans were $9.5 million or 1.48% and $8.5 million or 1.40% of total loans at December 31, 2019 and 2018, respectively. This represents an increase of $1.1 million or 12.64% for 2019. Commercial and industrial loans were $46.5 million or 7.22% and $33.1 million or 5.45% of total loans at December 31, 2019 and 2018. This represents an increase of $13.5 million or 40.67% for 2019. All other loans were $12.1 million and $8.5 million at December 31, 2019 and 2018. This represents an increase of $3.6 million or 42.53%.
34
The table titled “Maturity Schedule of Selected Loans” shows the different loan categories and the period during which they mature. For loans maturing in more than one year, the table also shows a breakdown between fixed rate loans and floating rate loans. The table indicates that $283.4 million or 43.92% of the loan portfolio matures within five years. The floating rate loans maturing after five years are primarily comprised of loan secured by 1-4 family residential properties.
Maturity Schedule of Selected Loans
(dollars in thousands)
December 31, 2019 | ||||||||||||||||
Within 1 Year | After 1 Year Within 5 Years | After 5 Years | Total | |||||||||||||
Loans secured by real estate: | ||||||||||||||||
Construction and land development | $ | 21,759 | $ | 10,306 | $ | 10,496 | $ | 42,561 | ||||||||
Secured by farmland | 2,996 | 3,420 | 7,501 | 13,917 | ||||||||||||
Secured by 1-4 family residential properties | 19,279 | 67,161 | 133,140 | 219,580 | ||||||||||||
Multifamily | 752 | 7,867 | 5,796 | 14,415 | ||||||||||||
Commercial | 35,047 | 80,013 | 171,540 | 286,600 | ||||||||||||
Commercial and industrial loans | 10,349 | 16,337 | 19,857 | 46,543 | ||||||||||||
Consumer installment loans | 733 | 6,111 | 2,697 | 9,541 | ||||||||||||
All other loans | 713 | 557 | 10,780 | 12,050 | ||||||||||||
$ | 91,628 | $ | 191,772 | $ | 361,807 | $ | 645,207 | |||||||||
For maturities over one year: | ||||||||||||||||
Floating rate loans | $ | 25,124 | $ | 78,264 | $ | 103,388 | ||||||||||
Fixed rate loans | 166,648 | 283,543 | 450,191 | |||||||||||||
$ | 191,772 | $ | 361,807 | $ | 553,579 | |||||||||||
Asset Quality
The Company has policies and procedures designed to control credit risk and to maintain the quality of its loan portfolio. These include underwriting standards for new originations and ongoing monitoring and reporting of asset quality and adequacy of the allowance for loan losses. There were $2.4 million in total non-performing assets, which consist of nonaccrual loans, loans 90 days or more past due and still accruing, other real estate owned, and repossessed assets at December 31, 2019. This is a decrease of $551 thousand when compared to the December 31, 2018 balance of $2.9 million. This decrease resulted mostly from the decrease in loans 90 days or more past due and still accruing, which consisted of three loans to two borrowers at December 31, 2018 and no loans at December 31, 2019.
Nonaccrual loans were $2.2 million at December 31, 2019 and $2.1 million at 2018. The gross amount of interest income that would have been recognized on nonaccrual loans was $52 thousand for 2019 and $32 thousand for 2018. None of this interest income was included in net income for 2019 or 2018. A total of 25 loans totaling $4.5 million were placed in nonaccrual during 2019. The balance of these loans added to nonaccrual status during 2019 ranged from $4 thousand to $1.3 million with the average outstanding balance being $181 thousand. In addition, seven loans totaling $3.1 million were removed from nonaccrual status during 2019. Of the $3.1 million in loans removed from nonaccrual status between December 31, 2018 and December 31, 2019, two loans totaling $1.5 million were paid off and five loans totaling $1.6 million were foreclosed on. Of the $1.6 million in loans foreclosed on, only $1.2 million was placed into OREO. The real estate securing one of the loans foreclosed on was purchased by someone other than he Bank during the foreclosure sale. Management evaluates the financial condition of these borrowers and the value of any collateral on these loans. The results of these evaluations are used to estimate the amount of losses which may be realized on the disposition of these nonaccrual loans. Nonaccrual loans that were evaluated for impairment at December 31, 2019 totaled $2.2 million and had $100 thousand in specific allocations.
Other real estate owned increased slightly from $106 thousand at December 31, 2018 to $183 thousand at December 31, 2019. Four properties were foreclosed on during 2019. The property held at December 31, 2018 and three of the properties foreclosed on during 2019 subsequently sold during the year. When the property is sold, the difference between the amount of other real estate owned and the settlement proceeds is recognized as a gain or loss on the sale of other real estate owned. Net losses of $443 thousand and $866 thousand were recognized on other real estate owned during 2019 and 2018, respectively. A net gain of $1 thousand was recognized on the sale of other real estate owned during 2017.
35
There were no loans past due 90 days or more and still accruing interest as of December 31, 2019. At December 31, 2018, there were $695 thousand or 0.11% of total loans past due 90 days or more and still accruing. The loans past due 90 days or more and still accruing interest are well secured and in the process of collection; therefore, they were not classified as nonaccrual.
Nonperforming and Other Assets
Nonperforming assets consist of nonaccrual loans, loans past due 90 days and accruing interest, other real estate owned (foreclosed properties), and repossessed assets. The table titled “Nonperforming Assets” shows the amount of nonperforming assets and loans past due 90 days and accruing interest outstanding during the last five years. The table also shows the ratios for the allowance for loan losses as a percentage of nonperforming assets and nonperforming assets as a percentage of loans outstanding and other real estate owned.
Loans are placed on non-accrual status when collection of principal and interest is doubtful, generally when a loan becomes 90 days past due. There are three negative implications for earnings when a loan is placed on non-accrual status. First, all interest accrued but unpaid at the date that the loan is placed on non-accrual status is either deducted from interest income or written off as a loss. Second, accruals of interest are discontinued until it becomes certain that both principal and interest can be repaid. Finally, there may be actual losses that require additional provisions for loan losses to be charged against earnings.
For real estate loans, upon foreclosure, the properties are recorded at the fair value of the property based on current appraisals and other current market trends, less selling costs. If a write down of the OREO property is necessary at the time of foreclosure, the amount is charged-off against the allowance for loan losses. A review of the recorded property value is performed in conjunction with normal loan reviews, and if market conditions indicate that the recorded value exceeds the fair value, additional write downs of the property value are charged directly to operations. Gains on properties acquired through foreclosure where the fair value less costs to sell exceeds the related loan balance and there have been no prior charge-offs are recorded to current earnings.
In addition, the Company may, under certain circumstances, restructure loans in troubled debt restructurings as a concession to a borrower when the borrower is experiencing financial distress. Formal, standardized loan restructuring programs are not utilized by the Company. Each loan considered for restructuring is evaluated based on customer circumstances and may include modifications to one or more loan provisions. Such restructured loans are included in impaired loans. At December 31, 2019, 2018, 2017, 2016, and 2015, the Company had $3.0 million, $3.8 million, $4.4 million, $7.3 million and $7.5 million in restructured loans, respectively.
Nonperforming Assets
(dollars in thousands)
December 31, | ||||||||||||||||||||
2019 | 2018 | 2017 | 2016 | 2015 | ||||||||||||||||
Nonaccrual loans | $ | 2,185 | $ | 2,118 | $ | 6,339 | $ | 6,991 | $ | 5,285 | ||||||||||
Loans past due 90 days and accruing interest | — | 695 | — | 8 | 307 | |||||||||||||||
Other real estate owned and repossessed assets | 183 | 106 | 106 | 375 | 571 | |||||||||||||||
Total nonperforming assets | $ | 2,368 | $ | 2,919 | $ | 6,445 | $ | 7,374 | $ | 6,163 | ||||||||||
Allowance for loan losses to nonperforming assets | 210 | % | 187 | % | 68 | % | 61 | % | 80 | % | ||||||||||
Non-performing assets to period end loans and other real estate owned | 0.37 | % | 0.48 | % | 1.13 | % | 1.43 | % | 1.24 | % | ||||||||||
Other potential problem loans are defined as performing loans that possess certain risks that management has identified that could result in the loans not being repaid in accordance with their terms. Accordingly, these loans are risk rated at a level of substandard or lower. At December 31, 2019, other potential problem loans totaled $3.4 million. Of the total other potential problem loans, $3.4 million or 100.00% are currently considered impaired and are disclosed in Note 4 to the Consolidated Financial Statements.
36
Allowance for Loan Losses
The purpose and the methods for measuring the allowance for loans are discussed in the Critical Accounting Policies section above. The table titled “Analysis of Allowance for Loan Losses” shows the activity within the allowance during the last five years, including a breakdown of the loan types which were charged-off and recovered.
Charged-off loans were $1.3 million, $236 thousand, and $370 thousand for 2019, 2018, and 2017, respectively. Recoveries were $201 thousand, $504 thousand, and $901 thousand for 2019, 2018, and 2017, respectively. Net charge-offs were $1.1 million for 2019. Net recoveries were $268 thousand and $531 thousand for 2018 and 2017, respectively. This represents an increase in net charge-offs of $1.4 million or 514.93% for 2019 and an increase of $263 thousand or 49.53% for 2018. The allowance for loan losses as a percentage of loans was 0.77%, 0.90%, and 0.78% at the end of 2019, 2018, and 2017, respectively. The decrease in allowance for loan losses as a percentage of total loans from December 31, 2018 to December 31, 2019 is primarily due to decreases in specific reserves. The decrease in allowance for loan losses as a percentage of total loans from December 31, 2018 to December 31, 2019 is due decreases in specific reserves and loss history. The allowance for loan losses at year-end covered net charge-offs during the year by 4.47 times for 2019. This ratio for 2018 and 2017 is not considered meaningful due to net recoveries being recognized during those years. The ratio of net charge-offs (recoveries) to average loans was 0.18% for 2019, (0.05)% for 2018 and (0.10)% for 2017.
The provision for (recovery of) loan losses for the year ended December 31, 2019 was $629 thousand, compared to $777 thousand and $(625) thousand for the years ended December 31, 2018 and 2017, respectively. The provision for loan losses in 2019 resulted from the growth of the loan portfolio as well as one large charge-off in the amount of $850 thousand. The provision for loan losses in 2018 resulted from the growth of the loan portfolio, the expanded loss history, as well as increases in specific reserves.
The table titled “Allocation of Allowance for Loan Losses” shows the amount of the allowance for loan losses which is allocated to the indicated loan categories, along with that category’s percentage of total loans, at December 31, 2019, 2018, 2017, 2016, and 2015. The amount of allowance for loan losses allocated to each loan category is based on the amount of delinquent loans in that loan category, the status of nonperforming assets in that loan category, the historical losses for that loan category, and the financial condition of certain borrowers whose financial conditional is monitored on a periodic basis. Management believes that the allowance for loan losses is adequate based on the loan portfolio’s current risk characteristics.
37
Analysis of Allowance for Loan Losses
(dollars in thousands)
December 31, | ||||||||||||||||||||
2019 | 2018 | 2017 | 2016 | 2015 | ||||||||||||||||
Balance, beginning of period | $ | 5,456 | $ | 4,411 | $ | 4,505 | $ | 4,959 | $ | 5,080 | ||||||||||
Loans charged-off: | ||||||||||||||||||||
Commercial, financial and agricultural | 850 | 139 | 187 | — | — | |||||||||||||||
Real estate-construction and land development | — | — | 19 | — | 166 | |||||||||||||||
Real estate-mortgage | 406 | 24 | 56 | 535 | 199 | |||||||||||||||
Consumer and other | 57 | 73 | 108 | 72 | 91 | |||||||||||||||
Total loans charged off | $ | 1,313 | $ | 236 | $ | 370 | $ | 607 | $ | 456 | ||||||||||
Recoveries: | ||||||||||||||||||||
Commercial, financial and agricultural | $ | 52 | $ | 100 | $ | 44 | $ | 11 | $ | 181 | ||||||||||
Real estate-construction and land development | 8 | 266 | 535 | 144 | 75 | |||||||||||||||
Real estate-mortgage | 92 | 106 | 277 | 132 | 257 | |||||||||||||||
Consumer and other | 49 | 32 | 45 | 54 | 49 | |||||||||||||||
Total recoveries | $ | 201 | $ | 504 | $ | 901 | $ | 341 | $ | 562 | ||||||||||
Net charge-offs (recoveries) | 1,112 | (268 | ) | (531 | ) | 266 | (106 | ) | ||||||||||||
Provision for (recovery of) loan losses | 629 | 777 | (625 | ) | (188 | ) | (227 | ) | ||||||||||||
Balance, end of period | $ | 4,973 | $ | 5,456 | $ | 4,411 | $ | 4,505 | $ | 4,959 | ||||||||||
Ratio of allowance for loan losses to loans outstanding at period end | 0.77 | % | 0.90 | % | 0.78 | % | 0.87 | % | 1.00 | % | ||||||||||
Ratio of net charge offs (recoveries) to average loans outstanding during the period | 0.18 | % | (0.05 | )% | (0.1 | )% | 0.05 | % | (0.02 | )% | ||||||||||
Allocation of Allowance for Loan Losses
(dollars in thousands)
Commercial, Financial, and Agricultural | Real Estate Construction and Land Development | Real Estate Mortgage | Consumer and Other Loans | |||||||||||||||||||||||||
Allowance for Loan Losses | Percent of Loans in Category to Total Loans | Allowance for Loan Losses | Percent of Loans in Category to Total Loans | Allowance for Loan Losses | Percent of Loans in Category to Total Loans | Allowance for Loan Losses | Percent of Loans in Category to Total Loans | |||||||||||||||||||||
December 31, 2019 | $ | 565 | 7.2 | % | $ | 446 | 8.8 | % | $ | 3,592 | 80.7 | % | $ | 174 | 3.3 | % | ||||||||||||
December 31, 2018 | 919 | 5.4 | % | 583 | 10.2 | % | 3,776 | 81.6 | % | 150 | 2.8 | % | ||||||||||||||||
December 31, 2017 | 570 | 6.6 | % | 332 | 9.2 | % | 3,381 | 82.1 | % | 98 | 2.1 | % | ||||||||||||||||
December 31, 2016 | 235 | 5.9 | % | 450 | 6.1 | % | 3,514 | 85.1 | % | 91 | 2.9 | % | ||||||||||||||||
December 31, 2015 | 211 | 5.9 | % | 775 | 8.4 | % | 3,590 | 82.5 | % | 162 | 3.2 | % | ||||||||||||||||
38
Deposits
Total deposits were $771.5 million and $703.1 million at December 31, 2019 and 2018, respectively, which represents an increase of $68.4 million or 9.73% during 2019. The table titled “Average Deposits and Rates Paid” shows the average deposit balances and average rates paid for 2019, 2018 and 2017.
Average Deposits and Rates Paid
(dollars in thousands)
December 31, | |||||||||||||||||||||
2019 | 2018 | 2017 | |||||||||||||||||||
Amount | Rate | Amount | Rate | Amount | Rate | ||||||||||||||||
Noninterest-bearing | $ | 258,176 | $ | 246,056 | $ | 216,044 | |||||||||||||||
Interest-bearing: | |||||||||||||||||||||
NOW accounts | 89,536 | 0.5 | % | 91,353 | 0.35 | % | 85,154 | 0.19 | % | ||||||||||||
Money market accounts | 150,291 | 0.97 | % | 132,136 | 0.62 | % | 128,068 | 0.23 | % | ||||||||||||
Regular savings accounts | 105,176 | 0.2 | % | 104,473 | 0.15 | % | 100,838 | 0.07 | % | ||||||||||||
Time deposits: | |||||||||||||||||||||
$250,000 and more | 59,550 | 2.05 | % | 70,778 | 0.97 | % | 57,010 | 0.6 | % | ||||||||||||
Less than $250,000 | 61,775 | 1.38 | % | 36,808 | 1.38 | % | 39,319 | 0.58 | % | ||||||||||||
Total interest-bearing | $ | 466,328 | 0.9 | % | $ | 435,548 | 0.57 | % | $ | 410,389 | 0.26 | % | |||||||||
Total deposits | $ | 724,504 | $ | 681,604 | $ | 626,433 | |||||||||||||||
Noninterest-bearing demand deposits, which are comprised of checking accounts, increased $18.0 million or 7.16% from $251.2 million at December 31, 2018 to $269.2 million at December 31, 2019. Interest-bearing deposits, which include NOW accounts, money market accounts, regular savings accounts and time deposits, increased $50.5 million or 11.16% from $451.9 million at December 31, 2018 to $502.4 million at December 31, 2019. Total money market account balances increased $13.6 million or 9.64% from $140.6 million at December 31, 2018 to $154.1 million at December 31, 2019. Reciprocal money market accounts balances (included in total money market account balances) increased from $18.4 million and $27.0 million at December 31, 2018 and December 31, 2019, respectively. The reciprocal money market balance at December 31, 2019 and December 31, 2018 consists of money market accounts obtained through the ICS network. Total regular savings account balances increased $3.1 million or 2.92% from $104.6 million at December 31, 2018 to $107.7 million at December 31, 2019. Time deposits increased $23.1 million or 20.02% from $115.1 million at December 31, 2018 to $138.2 million at December 31, 2019.
The Company attempts to fund asset growth with deposit accounts and focus upon core deposit growth as its primary source of funding. Core deposits consist of checking accounts, NOW accounts, money market accounts, regular savings accounts, and time deposits of less than $250,000. Core deposits totaled $692.4 million or 89.75% and $649.8 million or 92.42% of total deposits at December 31, 2019 and 2018, respectively.
The table titled “Maturities of Certificates of Deposit and Other Time Deposits of $100,000 and Greater” shows the amount of certificates of deposit of $100,000 and more maturing within the time period indicated at December 31, 2019. The total amount maturing within one year is $94.7 million or 91.96% of the total amount outstanding.
39
Maturities of Certificates of Deposit and Other Time Deposits of $100,000 and Greater
(dollars in thousands)
Within Three Months | Three to Six Months | Six to Twelve Months | Over One Year | Total | Percent of Total Deposits | ||||||||||||||||||
December 31, 2019 | $ | 21,276 | $ | 38,614 | $ | 34,813 | $ | 8,282 | $ | 102,985 | 13.35 | % | |||||||||||
CAPITAL RESOURCES
Total shareholders’ equity on December 31, 2019 was $96.3 million, reflecting a percentage of total assets of 10.98% as compared to $87.6 million and 10.96% at December 31, 2018. The common stock’s book value per share increased $2.66 or 10.46% to $28.08 per share at December 31, 2019 from $25.42 per share at December 31, 2018. During 2019, the Company paid $1.00 per share in dividends as compared to $0.94 per share for 2018 and $0.88 per share for 2017. The Company has a Dividend Investment Plan that allows participating shareholders to reinvest the dividends in Company stock. During 2019, the Company purchased 53,988 shares of its Common Stock under its stock repurchase program at an average price of $32.79. During 2018, the Company purchased 39,333 shares of its Common Stock under its stock repurchase program at an average price of $32.06. During 2017, the Company purchased 52,936 shares of its Common Stock under its stock repurchase program at an average price of $29.54. All of these shares were retired. As evidenced below, the Bank continues to be a well capitalized financial institution.
Analysis of Bank Capital
(dollars in thousands)
December 31, 2019 | December 31, 2018 | |||||||
Tier 1 Capital: | ||||||||
Common stock | $ | 1,682 | $ | 1,682 | ||||
Capital surplus | 9,773 | 9,773 | ||||||
Retained earnings | 79,320 | 74,308 | ||||||
Total Tier 1 capital | $ | 90,775 | $ | 85,763 | ||||
Common equity Tier 1 capital | $ | 90,775 | $ | 85,763 | ||||
Tier 2 Capital: | ||||||||
Allowance for loan losses, including reserve for unfunded commitments | $ | 4,997 | $ | 5,474 | ||||
Total Tier 2 capital | $ | 4,997 | $ | 5,474 | ||||
Total risk-based capital | $ | 95,772 | $ | 91,237 | ||||
Risk weighted assets | $ | 665,141 | $ | 613,247 | ||||
Risk Based Capital Ratios: | ||||||||
Common equity Tier 1 capital ratio | 13.65 | % | 13.99 | % | ||||
Tier 1 risk-based capital ratio | 13.65 | % | 13.99 | % | ||||
Total risk-based capital ratio | 14.40 | % | 14.88 | % | ||||
Tier 1 leverage ratio | 10.61 | % | 10.92 | % | ||||
40
Federal regulatory risk-based capital guidelines require percentages to be applied to various assets, including off-balance sheet assets, based on their perceived risk in order to calculate risk-weighted assets. Tier 1 capital consists of total shareholders’ equity plus qualifying trust preferred securities outstanding less net unrealized gains and losses on available for sale securities, goodwill and other intangible assets. Total capital is comprised of Tier 1 capital plus the allowable portion of the allowance for loan losses and any excess trust preferred securities that do not qualify as Tier 1 capital.
Effective January 1, 2015, the Federal Reserve issued final risk-based capital rules to align with the Basel III regulatory capital framework and meet certain requirements of the Dodd-Frank Act. The final rules require the Bank to comply with the following minimum capital ratios: (i) a common equity Tier 1 capital ratio of 4.5% of risk-weighted assets; (ii) a Tier 1 capital ratio of 6.0% of risk-weighted assets; (iii) a total capital ratio of 8.0% of risk-weighted assets; and (iv) a leverage ratio of 4.0% of total assets. In addition, a capital conservation buffer requirement was phased in beginning January 1, 2016, at 0.625% of risk-weighted assets, increased by the same amount each year until it was fully implemented at 2.5% effective January 1, 2019. The capital conservation buffer is designed to absorb losses during periods of economic stress. Banking institutions with any ratio (excluding the leverage ratio) above the minimum but below the conservation buffer will face constraints on dividends, equity repurchases, and compensation based on the amount of the shortfall. As fully phased in effective January 1, 2019, the rules require the Bank to maintain (i) a minimum ratio of common equity Tier 1 to risk-weighted assets of at least 4.5%, plus a 2.5% “capital conservation buffer” (which is added to the 4.5% common equity Tier 1 ratio, effectively resulting in a minimum ratio of common equity Tier 1 to risk-weighted assets of at least 7.0% upon full implementation), (ii) a minimum ratio of Tier 1 capital to risk-weighted assets of at least 6.0%, plus the 2.5% capital conservation buffer (which is added to the 6.0% Tier 1 capital ratio, effectively resulting in a minimum Tier 1 capital ratio of 8.5% upon full implementation), (iii) a minimum ratio of total capital to risk-weighted assets of at least 8.0%, plus the 2.5% capital conservation buffer (which is added to the 8.0% total capital ratio, effectively resulting in a minimum total capital ratio of 10.5% upon full implementation), and (iv) a minimum leverage ratio of 4.0%, calculated as the ratio of Tier 1 capital to average assets.
Pursuant to the Federal Reserve’s Small Bank Holding Company and Savings and Loan Holding Company Policy Statement, qualifying bank holding companies with total consolidated assets of less than $3 billion, such as the Company, are not subject to consolidated regulatory capital requirements.
The table titled “Analysis of Capital” shows the components of Tier 1 capital, Tier 2 capital, the amount of total risk-based capital and risk-weighted assets, and the risk based capital ratios for the Bank at December 31, 2019 and 2018.
Note 15 to the Consolidated Financial Statements provides additional discussion and analysis of regulatory capital requirements.
LIQUIDITY
Liquidity management involves meeting the present and future financial obligations of the Company with the sale or maturity of assets or with the occurrence of additional liabilities. Liquidity needs are met with cash on hand, deposits in banks, federal funds sold, securities classified as available for sale and loans maturing within one year. At December 31, 2019 liquid assets totaled $290.3 million as compared to $242.3 million at December 31, 2018. These amounts represent 37.17% and 35.50% of total liabilities at December 31, 2019 and 2018, respectively. Securities provide a constant source of liquidity through paydowns and maturities. Also, the Company maintains short-term borrowing arrangements, namely federal funds lines of credit, with larger financial institutions as an additional source of liquidity. The Bank’s membership with the Federal Home Loan Bank of Atlanta also provides a source of borrowings with numerous rate and term structures. The Company’s senior management monitors the liquidity position regularly and attempts to maintain a position which utilizes available funds most efficiently. As a result of the Company’s management of liquid assets and the ability to generate liquidity through liability funding, management believes that the Company maintains overall liquidity sufficient to satisfy its depositors’ requirements and meet its customers’ credit needs.
41
OFF-BALANCE SHEET ARRANGEMENTS AND CONTRACTUAL OBLIGATIONS
Note 18 to the Consolidated Financial Statements provides information about the off-balance sheet arrangements which arise through the lending activities of the Company. These arrangements increase the degree of both credit and interest rate risk beyond that which is recognized through the financial assets and liabilities on the consolidated balance sheets.
The table titled “Contractual Obligations and Scheduled Payments” presents the Company’s contractual obligations and scheduled payment amounts due within the period indicated at December 31, 2019.
Contractual Obligations and Scheduled Payments
(dollars in thousands)
December 31, 2019 | ||||||||||||||||||||
Less than One Year | One Year through Three Years | Three Years through Five Years | More than Five Years | Total | ||||||||||||||||
Operating leases | $ | 215 | $ | 440 | $ | 440 | $ | 4,257 | $ | 5,352 | ||||||||||
$ | 215 | $ | 440 | $ | 440 | $ | 4,257 | $ | 5,352 | |||||||||||
The payments due on operating leases are discussed in Note 13 to the Consolidated Financial Statements.
42
Item 7A. Quantitative and Qualitative Disclosures about Market Risk
As the holding company of the Bank, the Company’s primary component of market risk is interest rate volatility. Interest rate fluctuations will impact the amount of interest income and expense the Bank receives or pays on almost all of its assets and liabilities and the market value of its interest-earning assets and interest-bearing liabilities, excluding those which have a very short term until maturity. Interest rate risk exposure of the Company is, therefore, experienced at the Bank level. Asset / liability management attempts to maximize the net interest income of the Company by adjusting the volume and price of rate sensitive assets and liabilities. The Company does not subject itself to foreign currency exchange or commodity price risk due to prohibition through policy and the current nature of operations. Derivative instruments and hedging activities of the Company have historically been minimal and there have been no derivative instruments since a single interest rate swap agreement expired on December 1, 2016.
The Bank’s interest rate management strategy is designed to maximize net interest income and preserve the capital of the Company. The Bank’s financial instruments are periodically subjected to various simulations whose results are discussed in the following paragraphs. These models are based on actual data from the Bank’s financial statements and assumptions about the performance of certain financial instruments. Prepayment assumptions are applied to all mortgage related assets, which includes real estate loans and mortgage-backed securities. Prepayment assumptions are based on a median rate at which principal payments are received on these assets over their contractual term. The rate of principal payback is assumed to increase when rates fall and decrease when rates rise. Term assumptions are applied to non-maturity deposits, which includes demand deposits, NOW accounts, savings accounts, and money market accounts. Demand deposits and NOW accounts are generally assumed to have a term greater than one year since the total amount outstanding does not fluctuate with changes in interest rates. Savings accounts and money market accounts are assumed to be more interest rate sensitive, therefore, a majority of the amount outstanding is assumed to have a term of less than one year.
The simulation analysis evaluates the potential effect of upward and downward changes in market interest rates on future net interest income. The Bank views the immediate shock of rates as a more effective measure of interest rate risk exposure. The analysis assesses the impact on net interest income over a 12 month period after an immediate increase or “shock” in rates, of 100 basis points up to 400 basis points. The shock down 200 to 400 basis points analysis is not meaningful as interest rates are at historic lows and cannot decrease another 200 to 400 basis points and therefore only an immediate decrease or “shock” of 100 basis points is disclosed. The simulation analysis results are presented in the table below:
Year 1 Net Interest Income Simulation
(dollars in thousands)
Change in Net Interest Income | ||||||
Assumed Market Interest Rate Shock | Dollars | Percent Change | ||||
-100 BP | (796 | ) | (2.59 | )% | ||
+100 BP | (82 | ) | (0.27 | )% | ||
+200 BP | (387 | ) | (1.26 | )% | ||
+300 BP | (635 | ) | (2.07 | )% | ||
+400 BP | (887 | ) | (2.89 | )% | ||
The Bank uses simulation analysis to assess earnings at risk and economic value of equity (EVE) analysis to assess economic value at risk. This analysis method allows management to regularly monitor the direction and magnitude of the Bank’s interest rate risk exposure. The modeling techniques cannot be measured with complete precision. Maturity and repricing characteristics of assets and liabilities, prepayments on amortizing assets, non-maturity deposit sensitivity and loan and deposit pricing are key assumptions used in acquiring this analysis. There is a realm of uncertainty in using these assumptions but the analysis does provide the Bank with the ability to estimate interest rate risk position over time.
43
The table below examines the Economic Value of Equity (EVE). The EVE of the balance sheet is defined as the discounted present value of expected asset cash flows minus the discounted present value of the expected liability cash flows. The analysis involves changing the interest rates used in determining the expected cash flows and in discounting the cash flows. The model indicates an exposure to falling interest rates. These results are driven primarily by the relative change in value of the Bank’s core deposit base as rates rise.
Static EVE Change
(dollars in thousands)
Change in EVE | ||||||
Assumed Market Interest Rate Shift | Dollars | Percent Change | ||||
-100 BP Shock | (18,540 | ) | (19.20 | )% | ||
+100 BP Shock | 8,833 | 9.10 | % | |||
+200 BP Shock | 12,423 | 12.90 | % | |||
+300 BP Shock | 14,345 | 14.90 | % | |||
+400 BP Shock | 15,071 | 15.60 | % | |||
44
Item 8. Financial Statements and Supplementary Data

REPORT OF INDEPENDENT REGISTERED PUBLIC ACCOUNTING FIRM
To the Board of Directors and Shareholders
Eagle Financial Services, Inc.
Berryville, Virginia
Opinion on the Financial Statements
We have audited the accompanying consolidated balance sheets of Eagle Financial Services, Inc. and its subsidiary (the Company) as of December 31, 2019 and 2018, the related consolidated statements of income, comprehensive income, changes in shareholders’ equity and cash flows for each of the three years in the period ended December 31, 2019, and the related notes to the consolidated financial statements (collectively, the financial statements). In our opinion, the financial statements present fairly, in all material respects, the financial position of the Company as of December 31, 2019 and 2018, and the results of its operations and its cash flows for each of the three years in the period ended December 31, 2019, in conformity with accounting principles generally accepted in the United States of America.
We have also audited, in accordance with the standards of the Public Company Accounting Oversight Board (United States) (PCAOB), the Company's internal control over financial reporting as of December 31, 2019, based on criteria established in Internal Control - Integrated Framework issued by the Committee of Sponsoring Organizations of the Treadway Commission in 2013, and our report dated March 13, 2020 expressed an unqualified opinion on the effectiveness of the Company's internal control over financial reporting.
Basis for Opinion
These financial statements are the responsibility of the Company’s management. Our responsibility is to express an opinion on the Company’s financial statements based on our audits. We are a public accounting firm registered with the PCAOB and are required to be independent with respect to the Company in accordance with U.S. federal securities laws and the applicable rules and regulations of the Securities and Exchange Commission and the PCAOB.
We conducted our audits in accordance with the standards of the PCAOB. Those standards require that we plan and perform the audits to obtain reasonable assurance about whether the financial statements are free of material misstatement, whether due to error or fraud. Our audits included performing procedures to assess the risks of material misstatement of the financial statements, whether due to error or fraud, and performing procedures that respond to those risks. Such procedures included examining, on a test basis, evidence regarding the amounts and disclosures in the financial statements. Our audits also included evaluating the accounting principles used and significant estimates made by management, as well as evaluating the overall presentation of the financial statements. We believe that our audits provide a reasonable basis for our opinion.
/s/ Yount, Hyde & Barbour, P.C.
We have served as the Company's auditor since 2015.
Winchester, Virginia
March 13, 2020
45
REPORT OF INDEPENDENT REGISTERED PUBLIC ACCOUNTING FIRM
To the Board of Directors and Shareholders
Eagle Financial Services, Inc.
Berryville, Virginia
Opinion on the Internal Control Over Financial Reporting
We have audited Eagle Financial Services, Inc. and subsidiary’s (the Company) internal control over financial reporting as of December 31, 2019, based on criteria established in Internal Control - Integrated Framework issued by the Committee of Sponsoring Organizations of the Treadway Commission in 2013. In our opinion, the Company maintained, in all material respects, effective internal control over financial reporting as of December 31, 2019, based on criteria established in Internal Control - Integrated Framework issued by the Committee of Sponsoring Organizations of the Treadway Commission in 2013.
We have also audited, in accordance with the standards of the Public Company Accounting Oversight Board (United States) (PCAOB), the consolidated balance sheets as of December 31, 2019 and 2018, and the related consolidated statements of income, comprehensive income, changes in shareholders’ equity and cash flows for each of the three years in the period ended December 31, 2019, and the related notes to the consolidated financial statements of the Company, and our report dated March 13, 2020 expressed an unqualified opinion.
Basis for Opinion
The Company’s management is responsible for maintaining effective internal control over financial reporting and for its assessment of the effectiveness of internal control over financial reporting in the accompanying Internal Control over Financial Reporting. Our responsibility is to express an opinion on the Company’s internal control over financial reporting based on our audit. We are a public accounting firm registered with the PCAOB and are required to be independent with respect to the Company in accordance with U.S. federal securities laws and the applicable rules and regulations of the Securities and Exchange Commission and the PCAOB.
We conducted our audit in accordance with the standards of the PCAOB. Those standards require that we plan and perform the audit to obtain reasonable assurance about whether effective internal control over financial reporting was maintained in all material respects. Our audit included obtaining an understanding of internal control over financial reporting, assessing the risk that a material weakness exists, and testing and evaluating the design and operating effectiveness of internal control based on the assessed risk. Our audit also included performing such other procedures as we considered necessary in the circumstances. We believe that our audit provides a reasonable basis for our opinion.
Definition and Limitations of Internal Control Over Financial Reporting
A company's internal control over financial reporting is a process designed to provide reasonable assurance regarding the reliability of financial reporting and the preparation of financial statements for external purposes in accordance with generally accepted accounting principles. A company's internal control over financial reporting includes those policies and procedures that (1) pertain to the maintenance of records that, in reasonable detail, accurately and fairly reflect the transactions and dispositions of the assets of the company; (2) provide reasonable assurance that transactions are recorded as necessary to permit preparation of financial statements in accordance with generally accepted accounting principles, and that receipts and expenditures of the company are being made only in accordance with authorizations of management and directors of the company; and (3) provide reasonable assurance regarding prevention or timely detection of unauthorized acquisition, use or disposition of the company's assets that could have a material effect on the financial statements.
46
Because of its inherent limitations, internal control over financial reporting may not prevent or detect misstatements. Also, projections of any evaluation of effectiveness to future periods are subject to the risk that controls may become inadequate because of changes in conditions, or that the degree of compliance with the policies or procedures may deteriorate.
/s/ Yount, Hyde & Barbour, P.C.
Winchester, Virginia
March 13, 2020
47
EAGLE FINANCIAL SERVICES, INC. AND SUBSIDIARY
Consolidated Balance Sheets
December 31, 2019 and 2018
(dollars in thousands, except per share amounts)
2019 | 2018 | ||||||
Assets | |||||||
Cash and due from banks | $ | 10,920 | $ | 12,358 | |||
Interest-bearing deposits with other institutions | 22,487 | 5,995 | |||||
Federal funds sold | 252 | — | |||||
Total cash and cash equivalents | 33,659 | 18,353 | |||||
Securities available for sale, at fair value | 165,003 | 144,298 | |||||
Restricted investments | 1,197 | 1,170 | |||||
Loans | 644,760 | 606,827 | |||||
Allowance for loan losses | (4,973 | ) | (5,456 | ) | |||
Net loans | 639,787 | 601,371 | |||||
Bank premises and equipment, net | 19,297 | 19,083 | |||||
Other real estate owned, net of allowance | 183 | 106 | |||||
Other assets | 18,194 | 15,236 | |||||
Total assets | $ | 877,320 | $ | 799,617 | |||
Liabilities and Shareholders’ Equity | |||||||
Liabilities | |||||||
Deposits: | |||||||
Noninterest bearing demand deposits | $ | 269,171 | $ | 251,184 | |||
Savings and interest bearing demand deposits | 364,175 | 336,778 | |||||
Time deposits | 138,198 | 115,142 | |||||
Total deposits | $ | 771,544 | $ | 703,104 | |||
Federal funds purchased | — | 1,871 | |||||
Other liabilities | 9,450 | 7,043 | |||||
Total liabilities | $ | 780,994 | $ | 712,018 | |||
Commitments and contingencies | |||||||
Shareholders’ Equity | |||||||
Preferred stock, $10 par value; 500,000 shares authorized and unissued | $ | — | $ | — | |||
Common stock, $2.50 par value; authorized 10,000,000 shares; issued and outstanding 2019, 3,430,103 including 18,488 unvested restricted stock; issued and outstanding 2018, 3,445,914 including 16,701 unvested restricted stock | 8,529 | 8,573 | |||||
Surplus | 11,406 | 11,992 | |||||
Retained earnings | 74,909 | 68,587 | |||||
Accumulated other comprehensive income (loss) | 1,482 | (1,553 | ) | ||||
Total shareholders’ equity | $ | 96,326 | $ | 87,599 | |||
Total liabilities and shareholders’ equity | $ | 877,320 | $ | 799,617 | |||
See Notes to Consolidated Financial Statements
48
EAGLE FINANCIAL SERVICES, INC. AND SUBSIDIARY
Consolidated Statements of Income
Years Ended December 31, 2019, 2018, and 2017
(dollars in thousands, except per share amounts)
2019 | 2018 | 2017 | |||||||||
Interest and Dividend Income | |||||||||||
Interest and fees on loans | $ | 31,138 | $ | 27,890 | $ | 24,821 | |||||
Interest and dividends on securities available for sale: | |||||||||||
Taxable interest income | 3,089 | 2,744 | 2,278 | ||||||||
Interest income exempt from federal income taxes | 856 | 1,051 | 1,034 | ||||||||
Dividends | 70 | 59 | 61 | ||||||||
Interest on deposits in banks | 297 | 176 | 156 | ||||||||
Interest on federal funds sold | 4 | 3 | 1 | ||||||||
Total interest and dividend income | $ | 35,454 | $ | 31,923 | $ | 28,351 | |||||
Interest Expense | |||||||||||
Interest on deposits | 4,193 | 2,490 | 1,084 | ||||||||
Interest on federal funds purchased | 31 | 25 | 13 | ||||||||
Interest on Federal Home Loan Bank advances | 15 | — | 57 | ||||||||
Total interest expense | $ | 4,239 | $ | 2,515 | $ | 1,154 | |||||
Net interest income | $ | 31,215 | $ | 29,408 | $ | 27,197 | |||||
Provision For (Recovery Of) Loan Losses | 629 | 777 | (625 | ) | |||||||
Net interest income after provision for (recovery of) loan losses | $ | 30,586 | $ | 28,631 | $ | 27,822 | |||||
Noninterest Income | |||||||||||
Income from fiduciary activities | $ | 1,380 | $ | 1,360 | $ | 1,238 | |||||
Service charges on deposit accounts | 1,187 | 1,218 | 1,223 | ||||||||
Other service charges and fees | 4,893 | 4,173 | 3,878 | ||||||||
Gain (loss) on the sale and disposal of bank premises and equipment | 137 | (3 | ) | (12 | ) | ||||||
(Loss) gain on sale of securities | (7 | ) | 17 | (10 | ) | ||||||
Other operating income | 169 | 114 | 463 | ||||||||
Total noninterest income | $ | 7,759 | $ | 6,879 | $ | 6,780 | |||||
Noninterest Expenses | |||||||||||
Salaries and employee benefits | $ | 15,025 | $ | 14,083 | $ | 13,643 | |||||
Occupancy expenses | 1,611 | 1,476 | 1,473 | ||||||||
Equipment expenses | 857 | 915 | 955 | ||||||||
Advertising and marketing expenses | 868 | 761 | 731 | ||||||||
Stationery and supplies | 172 | 195 | 173 | ||||||||
ATM network fees | 1,141 | 912 | 816 | ||||||||
Other real estate owned expense | 76 | 183 | 11 | ||||||||
Loss (gain) on other real estate owned | 443 | 866 | (1 | ) | |||||||
FDIC assessment | 105 | 225 | 222 | ||||||||
Computer software expense | 459 | 474 | 647 | ||||||||
Bank franchise tax | 656 | 583 | 534 | ||||||||
Professional fees | 1,057 | 1,036 | 1,007 | ||||||||
Data processing fees | 1,275 | 794 | 564 | ||||||||
Other operating expenses | 3,031 | 2,692 | 2,415 | ||||||||
Total noninterest expenses | $ | 26,776 | $ | 25,195 | $ | 23,190 | |||||
Income before income taxes | $ | 11,569 | $ | 10,315 | $ | 11,412 | |||||
Income Tax Expense | 1,810 | 1,314 | 3,626 | ||||||||
Net income | $ | 9,759 | $ | 9,001 | $ | 7,786 | |||||
Earnings Per Share | |||||||||||
Net income per common share, basic | $ | 2.84 | $ | 2.60 | $ | 2.24 | |||||
Net income per common share, diluted | $ | 2.84 | $ | 2.60 | $ | 2.24 | |||||
See Notes to Consolidated Financial Statements
49
EAGLE FINANCIAL SERVICES, INC. AND SUBSIDIARY
Consolidated Statements of Comprehensive Income
Years Ended December 31, 2019, 2018, and 2017
(dollars in thousands)
2019 | 2018 | 2017 | |||||||||
Net income | $ | 9,759 | $ | 9,001 | $ | 7,786 | |||||
Other comprehensive income (loss): | |||||||||||
Changes in benefit obligations and plan assets for post retirement benefit plans, net of reclassification adjustments, net of deferred income tax of $0, $0 and ($1) for the years ended December 31, 2019, 2018, and 2017, respectively | — | — | (2 | ) | |||||||
Unrealized gain (loss) on available for sale securities, net of reclassification adjustments, net of deferred income tax of $807, ($495), and $147 for the years ended December 31, 2019, 2018 and 2017, respectively | 3,035 | (1,863 | ) | 285 | |||||||
Total other comprehensive income (loss) | 3,035 | (1,863 | ) | 283 | |||||||
Total comprehensive income | $ | 12,794 | $ | 7,138 | $ | 8,069 | |||||
See Notes to Consolidated Financial Statements
50
EAGLE FINANCIAL SERVICES, INC. AND SUBSIDIARY
Consolidated Statements of Changes in Shareholders’ Equity
Years Ended December 31, 2019, 2018, and 2017
(dollars in thousands, except per share amounts)
Common Stock | Surplus | Retained Earnings | Accumulated Other Comprehensive Income (Loss) | Total | |||||||||||||||
Balance, December 31, 2016 | $ | 8,633 | $ | 12,642 | $ | 58,165 | $ | (24 | ) | $ | 79,416 | ||||||||
Net income | 7,786 | 7,786 | |||||||||||||||||
Other comprehensive income | 283 | 283 | |||||||||||||||||
Reclassification of stranded tax effects from change in tax rate | (51 | ) | 51 | — | |||||||||||||||
Restricted stock awards, stock incentive plan (14,493 shares) | 36 | (36 | ) | — | |||||||||||||||
Stock based compensation expense | 382 | 382 | |||||||||||||||||
Issuance of common stock, dividend investment plan (13,769 shares) | 35 | 368 | 403 | ||||||||||||||||
Issuance of common stock, employee benefit plan (5,958 shares) | 15 | 151 | 166 | ||||||||||||||||
Retirement of common stock (52,936 shares) | (132 | ) | (1,432 | ) | (1,564 | ) | |||||||||||||
Dividends declared ($0.88 per share) | (3,055 | ) | (3,055 | ) | |||||||||||||||
Balance, December 31, 2017 | $ | 8,587 | $ | 12,075 | $ | 62,845 | $ | 310 | $ | 83,817 | |||||||||
Net income | 9,001 | 9,001 | |||||||||||||||||
Other comprehensive (loss) | (1,863 | ) | (1,863 | ) | |||||||||||||||
Restricted stock awards, stock incentive plan (14,609 shares) | 36 | (36 | ) | — | |||||||||||||||
Stock-based compensation expense | 518 | 518 | |||||||||||||||||
Issuance of common stock, dividend investment plan (14,731 shares) | 37 | 446 | 483 | ||||||||||||||||
Issuance of common stock, employee benefit plan (4,580 shares) | 11 | 152 | 163 | ||||||||||||||||
Retirement of common stock (39,333 shares) | (98 | ) | (1,163 | ) | (1,261 | ) | |||||||||||||
Dividends declared ($0.94 per share) | (3,259 | ) | (3,259 | ) | |||||||||||||||
Balance, December 31, 2018 | $ | 8,573 | $ | 11,992 | $ | 68,587 | $ | (1,553 | ) | $ | 87,599 | ||||||||
Net income | 9,759 | 9,759 | |||||||||||||||||
Other comprehensive income | 3,035 | 3,035 | |||||||||||||||||
Restricted stock awards, stock incentive plan (18,150 shares) | 46 | (46 | ) | — | |||||||||||||||
Stock-based compensation expense | 562 | 562 | |||||||||||||||||
Issuance of common stock, dividend investment plan (14,176 shares) | 35 | 406 | 441 | ||||||||||||||||
Issuance of common stock, employee benefit plan (4,064 shares) | 10 | 128 | 138 | ||||||||||||||||
Retirement of common stock (53,988 shares) | (135 | ) | (1,636 | ) | (1,771 | ) | |||||||||||||
Dividends declared ($1.00 per share) | (3,437 | ) | (3,437 | ) | |||||||||||||||
Balance, December 31, 2019 | $ | 8,529 | $ | 11,406 | $ | 74,909 | $ | 1,482 | $ | 96,326 | |||||||||
51
EAGLE FINANCIAL SERVICES, INC. AND SUBSIDIARY
Consolidated Statements of Cash Flows
Years Ended December 31, 2019, 2018, and 2017
(dollars in thousands)
2019 | 2018 | 2017 | |||||||||
Cash Flows from Operating Activities | |||||||||||
Net income | $ | 9,759 | $ | 9,001 | 7,786 | ||||||
Adjustments to reconcile net income to net cash provided by (used in) operating activities: | |||||||||||
Depreciation | 957 | 925 | 946 | ||||||||
Amortization of other assets | 358 | 201 | 200 | ||||||||
Provision for (recovery of) loan losses | 629 | 777 | (625 | ) | |||||||
Loss (gain) on other real estate owned | 443 | 866 | (1 | ) | |||||||
(Gain) loss on the sale and disposal of premises and equipment | (137 | ) | 3 | 12 | |||||||
Loss on the sale of repossessed assets | — | — | 6 | ||||||||
Loss (gain) on the sale of securities | 7 | (17 | ) | 10 | |||||||
Stock-based compensation expense | 562 | 518 | 382 | ||||||||
Premium amortization on securities, net | 487 | 483 | 443 | ||||||||
Deferred tax expense (benefit) | 516 | (399 | ) | 532 | |||||||
Changes in assets and liabilities: | |||||||||||
(Increase) in other assets | (894 | ) | (2,404 | ) | (1,465 | ) | |||||
(Decrease) increase in other liabilities | (1,339 | ) | (11,477 | ) | 1,141 | ||||||
Net cash provided by (used in) operating activities | $ | 11,348 | $ | (1,523 | ) | $ | 9,367 | ||||
Cash Flows from Investing Activities | |||||||||||
Proceeds from maturities, calls, and principal payments of securities available for sale | $ | 24,604 | $ | 16,604 | $ | 10,714 | |||||
Proceeds from the sale of securities available for sale | 12,350 | 5,374 | 20,283 | ||||||||
Purchases of securities available for sale | (54,310 | ) | (36,534 | ) | (43,797 | ) | |||||
Proceeds from the sale of restricted securities | 425 | — | 850 | ||||||||
Purchases of restricted securities | (452 | ) | (63 | ) | (889 | ) | |||||
Proceeds from the sale of bank premises and equipment | 279 | — | — | ||||||||
Purchases of bank premises and equipment | (1,314 | ) | (432 | ) | (368 | ) | |||||
Proceeds from the sale of other real estate owned | 631 | 1,933 | 318 | ||||||||
Proceeds from the sale of repossessed assets | 16 | 4 | 3 | ||||||||
Net (increase) in loans | (40,211 | ) | (40,545 | ) | (51,401 | ) | |||||
Net cash (used in) investing activities | $ | (57,982 | ) | $ | (53,659 | ) | $ | (64,287 | ) | ||
Cash Flows from Financing Activities | |||||||||||
Net increase in demand deposits, money market and savings accounts | $ | 45,384 | $ | 30,024 | $ | 42,143 | |||||
Net increase in certificates of deposit | 23,056 | 9,666 | 17,394 | ||||||||
Net (decrease) increase in federal funds purchased | (1,871 | ) | 1,871 | — | |||||||
Issuance of common stock, employee benefit plan | 138 | 163 | 166 | ||||||||
Retirement of common stock | (1,771 | ) | (1,261 | ) | (1,564 | ) | |||||
Cash dividends paid | (2,996 | ) | (2,776 | ) | (2,652 | ) | |||||
Net cash provided by financing activities | $ | 61,940 | $ | 37,687 | $ | 55,487 | |||||
52
EAGLE FINANCIAL SERVICES, INC. AND SUBSIDIARY
Consolidated Statements of Cash Flows (continued)
Years Ended December 31, 2019, 2018, and 2017
(dollars in thousands)
2019 | 2018 | 2017 | |||||||||
Increase (decrease) in cash and cash equivalents | $ | 15,306 | $ | (17,495 | ) | $ | 567 | ||||
Cash and Cash Equivalents | |||||||||||
Beginning | 18,353 | 35,848 | 35,281 | ||||||||
Ending | $ | 33,659 | $ | 18,353 | $ | 35,848 | |||||
Supplemental Disclosures of Cash Flow Information | |||||||||||
Cash payments for: | |||||||||||
Interest | $ | 4,198 | $ | 2,458 | $ | 1,144 | |||||
Income taxes | $ | — | $ | 2,161 | $ | 2,744 | |||||
Supplemental Schedule of Noncash Investing and Financing Activities: | |||||||||||
Unrealized gain(loss) on securities available for sale | $ | 3,842 | $ | (2,358 | ) | $ | 432 | ||||
Minimum postretirement liability adjustment | $ | — | $ | — | $ | 3 | |||||
Other real estate and repossessed assets acquired in settlement of loans | $ | 1,167 | $ | 2,803 | $ | 57 | |||||
Issuance of common stock, dividend investment plan | $ | 441 | $ | 483 | $ | 403 | |||||
Purchases of securities available for sale settled subsequent to year end | $ | — | $ | — | $ | 10,346 | |||||
Lease liabilities arising from right-of-use assets | $ | 3,745 | $ | — | $ | — | |||||
See Notes to Consolidated Financial Statements
53
54
NOTE 1. Nature of Banking Activities and Significant Accounting Policies
Eagle Financial Services, Inc. (the “Company” or “Corporation”) and the Bank grant commercial, financial, agricultural, residential and consumer loans to customers in Virginia and the Eastern Panhandle of West Virginia. The loan portfolio is well diversified and generally is collateralized by assets of the customers. The loans are expected to be repaid from cash flows or proceeds from the sale of selected assets of the borrowers.
The accounting and reporting policies of the Company conform to accounting principles generally accepted in the United States of America and to accepted practices within the banking industry.
Principles of Consolidation
The Company owns 100% of Bank of Clarke County (the “Bank”). The consolidated financial statements include the accounts of the Company and its wholly-owned subsidiary. All significant intercompany accounts and transactions between the Company and the Bank have been eliminated.
Trust Assets
Eagle Investment Group (“EIG”), as a division of the Bank offers both a trust department and investment services. The trust services division of EIG offers a full range of personal and retirement plan services, which include serving as agent for bill paying and custody of assets, as investment manager with full authority or advisor, as trustee or co-trustee for trusts under will or under agreement, as trustee of life insurance trusts, as guardian or committee, as agent under a power of attorney, as executor or co-executor for estates, as custodian or investment advisor for individual retirement plans, and as trustee or trust advisor for corporate retirement plans such as profit sharing and 401(k) plans. The brokerage division of EIG offers a full range of investment services, which include tax-deferred annuities, IRAs and rollovers, mutual funds, retirement plans, 529 college savings plans, life insurance, long term care insurance, fixed income investing, brokerage CDs, and full service or discount brokerage services. Securities and other property held by the Eagle Investment Group in a fiduciary or agency capacity are not assets of the Company and are not included in the accompanying consolidated financial statements.
Cash and Cash Equivalents
For purposes of reporting cash flows, cash and cash equivalents include cash on hand, amounts due from banks, federal funds sold, and interest bearing deposits. Generally, federal funds are purchased and sold for one-day periods.
Securities
Debt securities that management has the positive intent and ability to hold to maturity are classified as “held to maturity” and recorded at amortized cost. Debt securities not classified as held to maturity are classified as “available for sale” and recorded at fair value, with unrealized gains and losses excluded from earnings and reported in other comprehensive income. Equity securities with readily determinable fair values are carried at fair value, with changes in fair value reported in income. Equity securities without readily determinable fair values are carried at cost, minus impairment, if any, plus or minus changes resulting from observable price changes in orderly transactions for the identical or a similar investment.
Purchase premiums and discounts are recognized in interest income using the interest method over the terms of the securities. Declines in the fair value of held to maturity and available for sale securities below their cost that are deemed to be “other than temporary” are reflected in earnings as realized losses. In estimating “other than temporary” impairment losses, management considers (1) the length of time and the extent to which the fair value has been less than cost, (2) the financial condition and near-term prospects of the issuer, and (3) the intent and ability of the Company to retain its investment in the issuer for a period of time sufficient to allow for any anticipated recovery of fair value. Gains and losses on the sale of securities are recorded on the trade date and are determined using the specific identification method.
The Bank is required to maintain an investment in the capital stock of certain correspondent banks. No readily available market exists for this stock and it has no quoted market value. The investment in these securities is recorded at cost and they are reported on the Company’s consolidated balance sheet as restricted investments.
Loans
The Company grants mortgage, commercial and consumer loans to customers. A substantial portion of the loan portfolio is represented by mortgage loans throughout the Counties of Clarke, Frederick, and Loudoun, Virginia and the City of Winchester, Virginia. The ability of the Company’s debtors to honor their contracts is dependent upon the real estate and general economic conditions in this area.
55
Loans that management has the intent and ability to hold for the foreseeable future or until maturity or pay-off generally are reported at their outstanding unpaid principal balances adjusted for the allowance for loan losses. Interest income is accrued on the unpaid principal balance. Loan fees collected and certain costs incurred related to loan originations are deferred and amortized as an adjustment to interest income over the life of the related loans. Deferred fees and costs are recorded as an adjustment to interest income using a method that approximates a constant yield.
The accrual of interest on mortgage and commercial loans is discontinued at the time the loan is 120 and 90 days delinquent, respectively, unless the credit is well-secured and in process of collection. Credit card loans and other personal loans are typically charged off no later than 180 days past due. Past due status is based on the contractual terms of the loan. In all cases, loans are placed on nonaccrual or charged-off at an earlier date if collection of principal and interest is considered doubtful.
All interest accrued but not collected for loans that are placed on nonaccrual or charged off is reversed against interest income. The interest on these loans is accounted for on the cash-basis or cost-recovery method, until qualifying for return to accrual. Loans are returned to accrual status when all the principal and interest amounts contractually due are brought current and future payments are reasonably assured.
Troubled Debt Restructurings (TDR)
In situations where, for economic or legal reasons related to a borrower’s financial condition, management may grant a concession to the borrower that it would not otherwise consider, the related loan is classified as a TDR. TDRs are considered impaired loans. Upon designation as a TDR, the Company evaluates the borrower’s payment history, past due status and ability to make payments based on the revised terms of the loan. If a loan was accruing prior to being modified as a TDR and if the Company concludes that the borrower is able to make such payments, and there are no other factors or circumstances that would cause it to conclude otherwise, the loan will remain on an accruing status. If a loan was on non-accrual status at the time of the TDR, the loan will remain on non-accrual status following the modification and may be returned to accrual status based on the policy for returning loans to accrual status as noted above.
Risks by Loan Portfolio Segments
One-to-Four-Family Residential Real Estate Lending
Residential mortgage loans generally are made on the basis of the borrower’s ability to make repayment from employment and other income and are secured by real estate whose value tends to be readily ascertainable. As part of the application process, information is gathered concerning income, employment and credit history of the applicant. The valuation of residential collateral is provided by independent fee appraisers who have been approved by the Bank’s Directors Loan Committee.
Commercial Real Estate Lending
Commercial real estate lending entails significant additional risk as compared with residential mortgage lending. Commercial real estate loans typically involve larger loan balances concentrated with single borrowers or groups of related borrowers. Additionally, the repayment of loans secured by income producing properties is typically dependent on the successful operation of a business or a real estate project and thus may be subject, to a greater extent, to adverse conditions in the real estate market or the economy, in general.
Construction and Land Development Lending
There are two characteristics of construction lending which impact its overall risk as compared to residential mortgage lending. First, there is more concentration risk due to the extension of a large loan balance through several lines of credit to a single developer or contractor. Second, there is more collateral risk due to the fact that loan funds are provided to the borrower based upon the estimated value of the collateral after completion. This could cause an inaccurate estimate of the amount needed to complete construction or an excessive loan-to-value ratio. To mitigate the risks associated with construction lending, the Bank generally limits loan amounts to 80% of the estimated appraised value of the finished home.
Commercial and Industrial Lending
Commercial business loans generally have more risk than residential mortgage loans, but have higher yields. To manage these risks, the Bank generally obtains appropriate collateral and personal guarantees from the borrower’s principal owners and monitors the financial condition of the borrower. Commercial business loans typically are made on the basis of the borrower’s ability to make repayment from cash flow from its business and are secured by business assets, such as commercial real estate, accounts receivable, equipment and inventory. As a result, the availability of funds for the repayment of commercial business loans is substantially dependent on the success of the business itself. Furthermore, the collateral for commercial business loans may depreciate over time and generally cannot be appraised with as much precision as residential real estate.
56
Consumer Lending
Consumer loans generally entail greater risk than residential mortgage loans, particularly in the case of consumer loans which are unsecured or secured by rapidly depreciable assets such as automobiles. In such cases, any repossessed collateral on a defaulted consumer loan may not provide an adequate source of repayment of the outstanding loan balance as a result of the greater likelihood of damage, loss or depreciation.
Allowance for Loan Losses
The allowance for loan losses is established as losses are estimated to have occurred through a provision for (recovery of) loan losses charged to earnings. Loan losses are charged against the allowance when management believes the uncollectability of a loan balance is confirmed. Subsequent recoveries, if any, are credited to the allowance. The allowance for loan losses is evaluated on a regular basis by management and is based upon management’s periodic review of the collectability of the loans in light of historical experience, the nature and volume of the loan portfolio, adverse situations that may affect the borrower’s ability to repay, estimated value of any underlying collateral and prevailing economic conditions. This evaluation is inherently subjective as it requires estimates that are susceptible to significant revision as more information becomes available.
The allowance consists of specific, general and unallocated components. The specific component relates to loans that are impaired. An allowance is established when the discounted cash flows (or collateral value or observable market price) of the impaired loan is lower than the carrying value of that loan. The general component covers non-impaired loans and is based on historical loss experience and other qualitative factors. Other qualitative factors considered in the general component include the levels and trends in delinquencies and nonperforming loans, trends in volume and terms of loans, the effects of any changes in lending policies, the experience, ability, and depth of management, national and local economic trends and conditions, concentrations of credit, the quality of the Company’s loan review system, competition and regulatory requirements. An unallocated component is maintained to cover uncertainties that could affect management’s estimate of probable losses. The unallocated component of the allowance reflects the margin of imprecision inherent in the underlying assumptions used in the methodologies for estimating specific and general losses in the portfolio.
A loan is considered impaired when, based on current information and events, it is probable that the Company will be unable to collect the scheduled payments of principal or interest when due according to the contractual terms of the loan agreement. Factors considered by management in determining impairment include payment status, collateral value, and the probability of collecting scheduled principal and interest payments when due. Loans that experience insignificant payment delays and payment shortfalls generally are not classified as impaired. Management determines the significance of payment delays and payment shortfalls on a case-by-case basis, taking into consideration all of the circumstances surrounding the loan and the borrower, including the length of the delay, the reasons for the delay, the borrower’s prior payment record, and the amount of the shortfall in relation to the principal and interest owed. Impairment is measured on a loan-by-loan basis for commercial and construction loans by either the present value of expected future cash flows discounted at the loan’s effective interest rate, the loan’s obtainable market price, or the fair market value less estimated liquidation costs of the collateral if the loan is collateral dependent. Large groups of smaller balance homogeneous loans are collectively evaluated for impairment. Accordingly, the Company does not separately identify individual consumer loans for impairment disclosures, unless such loans are the subject of a restructuring agreement or are in a nonaccrual status.
Bank Premises and Equipment
Land is carried at cost. Buildings and equipment are carried at cost, less accumulated depreciation computed on the straight-line method over the estimated useful lives of the assets. Estimated useful lives range from 10 to 39 years for buildings and 3 to 10 years for furniture and equipment.
Other Real Estate Owned
Assets acquired through, or in lieu of, loan foreclosure are held for sale and are initially recorded at the fair value of the property, less estimated selling costs at the date of foreclosure. Any write-downs based on the asset’s fair value at the date of acquisition are charged to the allowance for loan losses. After foreclosure, valuations are periodically performed by management and property held for sale is carried at the lower of the new cost basis or fair value less estimated cost to sell. Impairment losses on property to be held and used are measured as the amount by which the carrying amount of a property exceeds its fair value. Costs of significant property improvements are capitalized, whereas costs relating to holding property are expensed. The portion of interest costs relating to development of real estate is capitalized. Valuations are periodically performed by management, and any subsequent write-downs are recorded as a charge to operations, if necessary, to reduce the carrying value of a property to the lower of its cost or fair value less cost to sell. Revenue and expenses from operations and changes in the valuation allowance are included in the other real estate owned expense line item in the consolidated statements of income.
57
Retirement Plans
The Company sponsors a 401(k) savings plan under which eligible employees may defer a portion of their compensation on a pretax basis. The Company also provides a match to participants in this plan, as described more fully in Note 11.
Stock-Based Compensation Plan
During 2014, the Company’s shareholders approved a stock incentive plan which allows key employees and directors to increase their personal financial interest in the Company. This plan permits the issuance of incentive stock options and non-qualified stock options and the award of stock appreciation rights, common stock, restricted stock, and phantom stock. The plan, as adopted, authorized the issuance of up to 500,000 shares of common stock. This plan is discussed more fully in Note 10.
Income Taxes
Deferred income tax assets and liabilities are determined using the liability (or balance sheet) method. Under this method, the net deferred tax asset or liability is determined based on the tax effects of the temporary differences between the book and tax bases of the various assets and liabilities and gives current recognition to changes in tax rates and laws.
When tax returns are filed, it is likely that some positions taken would be sustained upon examination by the applicable taxing authority, while others are subject to uncertainty about the merits of the position taken or the amount of the position that would be ultimately sustained. The benefit of a tax position is recognized in the financial statements in the period during which, based on all available evidence, the Company believes it is “more likely than not” that the position will be sustained upon examination, including the resolution of appeals or litigation processes, if any. Tax positions taken are not offset or aggregated with other positions. Tax positions that meet the “more likely than not” recognition threshold are measured as the largest amount of tax benefit that is more than fifty percent (50%) likely of being realized upon settlement with the applicable taxing authority. The portion of the benefits associated with tax positions taken that exceeds the amount measured as described above is reflected as a liability for unrecognized tax benefits in the balance sheet along with any associated interest and penalties that would be payable to the applicable taxing authority upon examination. Interest and penalties associated with unrecognized tax benefits are classified as additional income taxes in the statement of income. The Company has no uncertain tax positions.
Advertising
The Company follows the policy of charging the costs of advertising to expense as incurred.
Reclassifications
Certain reclassifications have been made to the 2018 financial statements to conform to reporting for 2019. The results of the reclassifications are not considered material and had no effect on prior years' net income or shareholders' equity.
Earnings Per Common Share
Basic earnings per share represents income available to common shareholders divided by the weighted average number of common shares outstanding during the period. Nonvested restricted shares are included in the weighted average number of common shares used to compute basic earnings per share because of dividend participation and voting rights. Diluted earnings per share reflects additional common shares that would have been outstanding if dilutive potential common shares had been issued, as well as any adjustment to income that would result from the assumed issuance. The number of potential common shares is determined using the treasury method.
The following table shows the weighted average number of shares used in computing earnings per share and the effect on the weighted average number of shares of dilutive potential common stock.
2019 | 2018 | 2017 | ||||||
Weighted average number of common shares outstanding used to calculate basic earnings per share | 3,438,410 | 3,467,667 | 3,468,275 | |||||
Effect of dilutive common stock | — | — | — | |||||
Weighted average number of common shares outstanding used to calculate diluted earnings per share | 3,438,410 | 3,467,667 | 3,468,275 | |||||
There were no potentially dilutive securities outstanding in 2019, 2018 or 2017.
58
Comprehensive Income
Accounting principles generally accepted in the United States of America require that recognized revenue, expenses, gains and losses be included in net income. Certain changes in assets and liabilities, net of income taxes, are reported within the balance sheet as a separate component of shareholders’ equity. These changes, along with net income, are components of comprehensive income and are reported in the statement of comprehensive income. In addition to net income, the Company’s comprehensive income includes changes in the benefit obligations and plan assets for postretirement benefit plans and unrealized gains or losses on available for sale securities.
Use of Estimates
The preparation of financial statements in conformity with accounting principles generally accepted in the United States of America requires management to make estimates and assumptions that affect the reported amounts of assets and liabilities and disclosure of contingent assets and liabilities at the date of the financial statements and the reported amounts of revenues and expenses during the reporting period. Actual results could differ from those estimates. The material estimate that is particularly susceptible to significant change in the near term relates to the determination of the allowance for loan losses.
Stock Repurchase Program
On June 20, 2019, the Corporation renewed the stock repurchase program to repurchase up to 150,000 shares of its common stock prior to June 30, 2020. During 2019, the Company purchased 53,988 shares of its Common Stock under its stock repurchase program at an average price of $32.79. During 2018, the Company purchased 39,333 shares of its Common Stock under its stock repurchase program at an average price of $32.06. During 2017, the Company purchased 52,936 shares of its Common Stock under its stock repurchase program at an average price of $29.54. The maximum number of shares that may yet be purchased under the plan as of December 31, 2019 are 141,067.
Recent Accounting Pronouncements
In June 2016, the Financial Accounting Standards Board (FASB) issued Accounting Standards Update (ASU) No. 2016-13, “Financial Instruments - Credit Losses (Topic 326): Measurement of Credit Losses on Financial Instruments.” The amendments in this ASU, among other things, require the measurement of all expected credit losses for financial assets held at the reporting date based on historical experience, current conditions, and reasonable and supportable forecasts. Financial institutions and other organizations will now use forward-looking information to better inform their credit loss estimates. Many of the loss estimation techniques applied today will still be permitted, although the inputs to those techniques will change to reflect the full amount of expected credit losses. In addition, the ASU amends the accounting for credit losses on available-for-sale debt securities and purchased financial assets with credit deterioration. For public business entities that meet the definition of a U.S. Securities and Exchange Commission (SEC) filer, excluding smaller reporting companies, the standard is effective for fiscal years beginning after December 15, 2019, including interim periods in those fiscal years. All other entities will be required to apply the guidance for fiscal years, and interim periods within those years, beginning after December 15, 2022. The Company is currently assessing the impact that ASU 2016-13 will have on its consolidated financial statements. The Company formed a CECL committee during 2016 which continues to meet weekly to address the compliance requirements. Historic loan data has been gathered and reviewed for completeness and accuracy. In addition, the committee has selected a third-party that is assisting in calculating the financial impact of ASU 2016-13 and anticipates running parallel allowance models under the current and new standard in advance of the required implementation date.
In August 2018, the FASB issued ASU 2018-13, “Fair Value Measurement (Topic 820): Disclosure Framework-Changes to the Disclosure Requirements for Fair Value Measurement.” The amendments modify the disclosure requirements in Topic 820 to add disclosures regarding changes in unrealized gains and losses, the range and weighted average of significant unobservable inputs used to develop Level 3 fair value measurements and the narrative description of measurement uncertainty. Certain disclosure requirements in Topic 820 are also removed or modified. The amendments are effective for fiscal years beginning after December 15, 2019, and interim periods within those fiscal years. Certain of the amendments are to be applied prospectively while others are to be applied retrospectively. Early adoption is permitted. The Company does not expect the adoption of ASU 2018-13 to have a material impact on its consolidated financial statements.
59
In August 2018, the FASB issued ASU 2018-14, “Compensation-Retirement Benefits-Defined Benefit Plans-General (Subtopic 715-20): Disclosure Framework-Changes to the Disclosure Requirements for Defined Benefit Plans.” These amendments modify the disclosure requirements for employers that sponsor defined benefit pension or other postretirement plans. Certain disclosure requirements have been deleted while the following disclosure requirements have been added: the weighted-average interest crediting rates for cash balance plans and other plans with promised interest crediting rates and an explanation of the reasons for significant gains and losses related to changes in the benefit obligation for the period. The amendments also clarify the disclosure requirements in paragraph 715-20-50-3, which state that the following information for defined benefit pension plans should be disclosed: The projected benefit obligation (PBO) and fair value of plan assets for plans with PBOs in excess of plan assets and the accumulated benefit obligation (ABO) and fair value of plan assets for plans with ABOs in excess of plan assets. The amendments are effective for fiscal years ending after December 15, 2020. Early adoption is permitted. The Company does not expect the adoption of ASU 2018-14 to have a material impact on its consolidated financial statements.
In April 2019, the FASB issued ASU 2019-04, “Codification Improvements to Topic 326, Financial Instruments-Credit Losses, Topic 815, Derivatives and Hedging, and Topic 825, Financial Instruments.” This ASU clarifies and improves areas of guidance related to the recently issued standards on credit losses, hedging, and recognition and measurement including improvements resulting from various Transition Resource Group (TRG) Meetings. The effective date of each of the amendments depends on the adoption date of ASU 2016-1, ASU 2016-13, and ASU 2017-12. The Company is currently assessing the impact that ASU 2019-04 will have on its consolidated financial statements.
In May 2019, the FASB issued ASU 2019-05, “Financial Instruments-Credit Losses (Topic 326): Targeted Transition Relief.” The amendments in this ASU provide entities that have certain instruments within the scope of Subtopic 326-20 with an option to irrevocably elect the fair value option in Subtopic 825-10, applied on an instrument-by-instrument basis for eligible instruments, upon the adoption of Topic 326. The fair value option election does not apply to held-to-maturity debt securities. An entity that elects the fair value option should subsequently measure those instruments at fair value with changes in fair value flowing through earnings. The effective date and transition methodology for the amendments in ASU 2019-05 are the same as in ASU 2016-13. The Company is currently assessing the impact that ASU 2019-05 will have on its consolidated financial statements.
In November 2019, the FASB issued ASU 2019-11, “Codification Improvements to Topic 326, Financial Instruments - Credit Losses.” This ASU addresses issues raised by stakeholders during the implementation of ASU No. 2016-13, “Financial Instruments-Credit Losses (Topic 326): Measurement of Credit Losses on Financial Instruments.” Among other narrow-scope improvements, the new ASU clarifies guidance around how to report expected recoveries. “Expected recoveries” describes a situation in which an organization recognizes a full or partial write-off of the amortized cost basis of a financial asset, but then later determines that the amount written off, or a portion of that amount, will in fact be recovered. While applying the credit losses standard, stakeholders questioned whether expected recoveries were permitted on assets that had already shown credit deterioration at the time of purchase (also known as PCD assets). In response to this question, the ASU permits organizations to record expected recoveries on PCD assets. In addition to other narrow technical improvements, the ASU also reinforces existing guidance that prohibits organizations from recording negative allowances for available-for-sale debt securities. The ASU includes effective dates and transition requirements that vary depending on whether or not an entity has already adopted ASU 2016-13. The Company is currently assessing the impact that ASU 2019-11 will have on its consolidated financial statements.
In December 2019, the FASB issued ASU 2019-12, “Income Taxes (Topic 740) - Simplifying the Accounting for Income Taxes.” The ASU is expected to reduce cost and complexity related to the accounting for income taxes by removing specific exceptions to general principles in Topic 740 (eliminating the need for an organization to analyze whether certain exceptions apply in a given period) and improving financial statement preparers’ application of certain income tax-related guidance. This ASU is part of the FASB’s simplification initiative to make narrow-scope simplifications and improvements to accounting standards through a series of short-term projects. For public business entities, the amendments are effective for fiscal years beginning after December 15, 2020, and interim periods within those fiscal years. Early adoption is permitted. The Company is currently assessing the impact that ASU 2019-12 will have on its consolidated financial statements.
60
In January 2020, the FASB issued ASU 2020-01, “Investments - Equity Securities (Topic 321), Investments - Equity Method and Joint Ventures (Topic 323), and Derivatives and Hedging (Topic 815) - Clarifying the Interactions between Topic 321, Topic 323, and Topic 815.” The ASU is based on a consensus of the Emerging Issues Task Force and is expected to increase comparability in accounting for these transactions. ASU 2016-01 made targeted improvements to accounting for financial instruments, including providing an entity the ability to measure certain equity securities without a readily determinable fair value at cost, less any impairment, plus or minus changes resulting from observable price changes in orderly transactions for the identical or a similar investment of the same issuer. Among other topics, the amendments clarify that an entity should consider observable transactions that require it to either apply or discontinue the equity method of accounting. For public business entities, the amendments in the ASU are effective for fiscal years beginning after December 15, 2020, and interim periods within those fiscal years. Early adoption is permitted. The Company does not expect the adoption of ASU 2020-01 to have a material impact on its consolidated financial statements.
Effective November 25, 2019, the SEC adopted Staff Accounting Bulletin (SAB) 119. SAB 119 updated portions of SEC interpretative guidance to align with FASB ASC 326, “Financial Instruments - Credit Losses.” It covers topics including (1) measuring current expected credit losses; (2) development, governance, and documentation of a systematic methodology; (3) documenting the results of a systematic methodology; and (4) validating a systematic methodology.
NOTE 2. Securities
Amortized costs and fair values of securities available for sale at December 31, 2019 and 2018 were as follows:
Amortized Cost | Gross Unrealized Gains | Gross Unrealized (Losses) | Fair Value | ||||||||||||
December 31, 2019 | |||||||||||||||
(in thousands) | |||||||||||||||
Obligations of U.S. government corporations and agencies | $ | 21,917 | $ | 363 | $ | (94 | ) | $ | 22,186 | ||||||
Mortgage-backed securities | 107,410 | 966 | (215 | ) | 108,161 | ||||||||||
Obligations of states and political subdivisions | 33,854 | 858 | (56 | ) | 34,656 | ||||||||||
$ | 163,181 | $ | 2,187 | $ | (365 | ) | $ | 165,003 | |||||||
December 31, 2018 | |||||||||||||||
(in thousands) | |||||||||||||||
Obligations of U.S. government corporations and agencies | $ | 22,183 | $ | 29 | $ | (481 | ) | $ | 21,731 | ||||||
Mortgage-backed securities | 77,976 | 145 | (1,638 | ) | 76,483 | ||||||||||
Obligations of states and political subdivisions | 46,159 | 394 | (469 | ) | 46,084 | ||||||||||
$ | 146,318 | $ | 568 | $ | (2,588 | ) | $ | 144,298 | |||||||
Carrying amounts of restricted securities at December 31, 2019 and 2018 were as follows:
December 31, 2019 | December 31, 2018 | ||||||
(in thousands) | |||||||
Federal Reserve Bank Stock | $ | 344 | $ | 344 | |||
Federal Home Loan Bank Stock | 713 | 686 | |||||
Community Bankers’ Bank Stock | 140 | 140 | |||||
$ | 1,197 | $ | 1,170 | ||||
The amortized cost and fair value of securities available for sale at December 31, 2019, by contractual maturity, are shown below. Maturities may differ from contractual maturities primarily (others could be called) in mortgage-backed securities because the mortgages underlying the securities may be called or repaid without any penalties.
61
Amortized Cost | Fair Value | |||||||
(in thousands) | ||||||||
Due in one year or less | $ | 1,460 | $ | 1,466 | ||||
Due after one year through five years | 12,516 | 12,707 | ||||||
Due after five years through ten years | 37,979 | 38,843 | ||||||
Due after ten years | 111,226 | 111,987 | ||||||
$ | 163,181 | $ | 165,003 | |||||
During the twelve months ended December 31, 2019, the Company sold $12.4 million in available for sale securities with gross gains of $37 thousand and gross losses of $44 thousand. During the twelve months ended December 31, 2018, the Company sold $5.4 million in available for sale securities with gross gains of $62 thousand and gross losses of $45 thousand. During the twelve months ended December 31, 2017, the Company sold $20.3 million in available for sale securities with gross gains of $94 thousand and gross losses of $104 thousand.
The fair value and gross unrealized losses for securities available for sale, totaled by the length of time that individual securities have been in a continuous unrealized loss position, at December 31, 2019 and 2018 were as follows:
Less than 12 months | 12 months or more | Total | |||||||||||||||||||||
Fair Value | Gross Unrealized Losses | Fair Value | Gross Unrealized Losses | Fair Value | Gross Unrealized Losses | ||||||||||||||||||
December 31, 2019 | |||||||||||||||||||||||
(in thousands) | |||||||||||||||||||||||
Obligations of U.S. government corporations and agencies | $ | 5,466 | $ | 91 | $ | 1,997 | $ | 3 | $ | 7,463 | $ | 94 | |||||||||||
Mortgage-backed securities | 19,509 | 176 | 5,271 | 39 | 24,780 | 215 | |||||||||||||||||
Obligations of states and political subdivisions | 3,127 | 49 | 923 | 7 | 4,050 | 56 | |||||||||||||||||
$ | 28,102 | $ | 316 | $ | 8,191 | $ | 49 | $ | 36,293 | $ | 365 | ||||||||||||
December 31, 2018 | |||||||||||||||||||||||
(in thousands) | |||||||||||||||||||||||
Obligations of U.S. government corporations and agencies | $ | 1,973 | $ | 6 | $ | 13,710 | $ | 475 | $ | 15,683 | $ | 481 | |||||||||||
Mortgage-backed securities | 16,659 | 332 | 42,966 | 1,306 | 59,625 | 1,638 | |||||||||||||||||
Obligations of states and political subdivisions | 3,594 | 52 | 12,864 | 417 | 16,458 | 469 | |||||||||||||||||
$ | 22,226 | $ | 390 | $ | 69,540 | $ | 2,198 | $ | 91,766 | $ | 2,588 | ||||||||||||
Gross unrealized losses on available for sale securities included twenty-eight (28) and ninety-five (95) debt securities at December 31, 2019 and December 31, 2018, respectively. The Company evaluates securities for other-than-temporary impairment on at least a quarterly basis, and more frequently when economic or market concerns warrant such evaluation. The Company’s mortgage-backed securities are issued by U.S. government agencies, which guarantee payments to investors regardless of the status of the underlying mortgages. Consideration is given to the length of time and the amount of an unrealized loss, the financial condition of the issuer, and the intent and ability of the Company to retain its investment in the issuer long enough to allow for an anticipated recovery in fair value. The fair value of a security reflects its liquidity as compared to similar instruments, current market rates on similar instruments, and the creditworthiness of the issuer. Absent any change in the liquidity of a security or the creditworthiness of the issuer, prices will decline as market rates rise and vice-versa. The primary cause of the unrealized losses at December 31, 2019 and December 31, 2018 was changes in market interest rates. Since the losses can be primarily attributed to changes in market interest rates and not expected cash flows or an issuer’s financial condition, the unrealized losses are deemed to be temporary and management does not intend to sell and it is unlikely that management will be required to sell the securities prior to their anticipated recovery. The Company monitors the financial condition of these issuers continuously and will record other-than-temporary impairment if the recovery of value is unlikely.
Securities having a carrying value of $2.9 million at December 31, 2019 were pledged as security for public deposits.
62
NOTE 3. Loans
The composition of loans at December 31, 2019 and 2018 was as follows:
December 31, | ||||||||
2019 | 2018 | |||||||
(in thousands) | ||||||||
Mortgage loans on real estate: | ||||||||
Construction and land development | $ | 42,561 | $ | 54,675 | ||||
Secured by farmland | 13,917 | 7,251 | ||||||
Secured by 1-4 family residential properties | 219,580 | 221,861 | ||||||
Multifamily | 14,415 | 7,923 | ||||||
Commercial | 286,600 | 265,595 | ||||||
Commercial and industrial loans | 46,543 | 33,086 | ||||||
Consumer installment loans | 9,541 | 8,470 | ||||||
All other loans | 12,050 | 8,454 | ||||||
Total loans | $ | 645,207 | $ | 607,315 | ||||
Net deferred loan fees | (447 | ) | (488 | ) | ||||
Allowance for loan losses | (4,973 | ) | (5,456 | ) | ||||
Net Loans | $ | 639,787 | $ | 601,371 | ||||
NOTE 4. Allowance for Loan Losses
Changes in the allowance for loan losses for the years December 31, 2019, 2018 and 2017 were as follows:
December 31, | |||||||||||
2019 | 2018 | 2017 | |||||||||
(in thousands) | |||||||||||
Balance, beginning | $ | 5,456 | $ | 4,411 | $ | 4,505 | |||||
Provision for (recovery of) loan losses | 629 | 777 | (625 | ) | |||||||
Recoveries added to the allowance | 201 | 504 | 901 | ||||||||
Loan losses charged to the allowance | (1,313 | ) | (236 | ) | (370 | ) | |||||
Balance, ending | $ | 4,973 | $ | 5,456 | $ | 4,411 | |||||
63
Nonaccrual and past due loans by class at December 31, 2019 and December 31, 2018 were as follows:
December 31, 2019 | |||||||||||||||||||||||||||||||
(in thousands) | |||||||||||||||||||||||||||||||
30 - 59 Days Past Due | 60 - 89 Days Past Due | 90 or More Days Past Due | Total Past Due | Current | Total Loans | 90 or More Days Past Due Still Accruing | Nonaccrual Loans | ||||||||||||||||||||||||
Commercial - Non Real Estate: | |||||||||||||||||||||||||||||||
Commercial & Industrial | $ | 47 | $ | — | $ | 32 | $ | 79 | $ | 46,464 | $ | 46,543 | $ | — | $ | 32 | |||||||||||||||
Commercial Real Estate: | |||||||||||||||||||||||||||||||
Owner Occupied | 1,078 | — | — | 1,078 | 147,879 | 148,957 | — | 320 | |||||||||||||||||||||||
Non-owner occupied | — | — | — | — | 137,643 | 137,643 | — | 329 | |||||||||||||||||||||||
Construction and Farmland: | |||||||||||||||||||||||||||||||
Residential | — | — | — | — | 7,867 | 7,867 | — | — | |||||||||||||||||||||||
Commercial | — | — | 187 | 187 | 48,424 | 48,611 | — | 187 | |||||||||||||||||||||||
Consumer: | |||||||||||||||||||||||||||||||
Installment | 55 | 6 | — | 61 | 9,480 | 9,541 | — | 8 | |||||||||||||||||||||||
Residential: | |||||||||||||||||||||||||||||||
Equity Lines | 121 | — | — | 121 | 33,127 | 33,248 | — | 65 | |||||||||||||||||||||||
Single family | 471 | 541 | 1,251 | 2,263 | 184,069 | 186,332 | — | 1,244 | |||||||||||||||||||||||
Multifamily | — | — | — | — | 14,415 | 14,415 | — | — | |||||||||||||||||||||||
All Other Loans | — | — | — | — | 12,050 | 12,050 | — | — | |||||||||||||||||||||||
Total | $ | 1,772 | $ | 547 | $ | 1,470 | $ | 3,789 | $ | 641,418 | $ | 645,207 | $ | — | $ | 2,185 | |||||||||||||||
December 31, 2018 | |||||||||||||||||||||||||||||||
(in thousands) | |||||||||||||||||||||||||||||||
30 - 59 Days Past Due | 60 - 89 Days Past Due | 90 or More Days Past Due | Total Past Due | Current | Total Loans | 90 or More Past Due Still Accruing | Nonaccrual Loans | ||||||||||||||||||||||||
Commercial - Non Real Estate: | |||||||||||||||||||||||||||||||
Commercial & Industrial | $ | 127 | $ | — | $ | — | $ | 127 | $ | 32,959 | $ | 33,086 | $ | — | $ | 1,081 | |||||||||||||||
Commercial Real Estate: | |||||||||||||||||||||||||||||||
Owner Occupied | — | — | — | — | 136,309 | 136,309 | — | — | |||||||||||||||||||||||
Non-owner occupied | — | — | — | — | 129,286 | 129,286 | — | 364 | |||||||||||||||||||||||
Construction and Farmland: | |||||||||||||||||||||||||||||||
Residential | — | — | — | — | 6,706 | 6,706 | — | — | |||||||||||||||||||||||
Commercial | — | — | — | — | 55,220 | 55,220 | — | — | |||||||||||||||||||||||
Consumer: | |||||||||||||||||||||||||||||||
Installment | 4 | — | — | 4 | 8,466 | 8,470 | — | — | |||||||||||||||||||||||
Residential: | |||||||||||||||||||||||||||||||
Equity Lines | — | — | — | — | 32,815 | 32,815 | — | 92 | |||||||||||||||||||||||
Single family | 960 | 196 | 900 | 2,056 | 186,990 | 189,046 | 695 | 581 | |||||||||||||||||||||||
Multifamily | — | — | — | — | 7,923 | 7,923 | — | — | |||||||||||||||||||||||
All Other Loans | — | — | — | — | 8,454 | 8,454 | — | — | |||||||||||||||||||||||
Total | $ | 1,091 | $ | 196 | $ | 900 | $ | 2,187 | $ | 605,128 | $ | 607,315 | $ | 695 | $ | 2,118 | |||||||||||||||
64
Allowance for loan losses by segment at December 31, 2019, December 31, 2018 and December 31, 2017 were as follows:
As of and for the Twelve Months Ended | |||||||||||||||||||||||||||||||
December 31, 2019 | |||||||||||||||||||||||||||||||
(in thousands) | |||||||||||||||||||||||||||||||
Construction and Farmland | Residential Real Estate | Commercial Real Estate | Commercial | Consumer | All Other Loans | Unallocated | Total | ||||||||||||||||||||||||
Allowance for credit losses: | |||||||||||||||||||||||||||||||
Beginning Balance | $ | 583 | $ | 1,788 | $ | 1,988 | $ | 919 | $ | 53 | $ | 97 | $ | 28 | $ | 5,456 | |||||||||||||||
Charge-Offs | — | (406 | ) | — | (850 | ) | (5 | ) | (52 | ) | — | (1,313 | ) | ||||||||||||||||||
Recoveries | 8 | 72 | 20 | 52 | 26 | 23 | — | 201 | |||||||||||||||||||||||
Provision (recovery) | (145 | ) | 147 | (17 | ) | 444 | (20 | ) | 52 | 168 | 629 | ||||||||||||||||||||
Ending balance | $ | 446 | $ | 1,601 | $ | 1,991 | $ | 565 | $ | 54 | $ | 120 | $ | 196 | $ | 4,973 | |||||||||||||||
Ending balance: Individually evaluated for impairment | $ | 100 | $ | 51 | $ | 149 | $ | — | $ | — | $ | — | $ | — | $ | 300 | |||||||||||||||
Ending balance: collectively evaluated for impairment | $ | 346 | $ | 1,550 | $ | 1,842 | $ | 565 | $ | 54 | $ | 120 | $ | 196 | $ | 4,673 | |||||||||||||||
Loans: | |||||||||||||||||||||||||||||||
Ending balance | $ | 56,478 | $ | 233,995 | $ | 286,600 | $ | 46,543 | $ | 9,541 | $ | 12,050 | $ | — | $ | 645,207 | |||||||||||||||
Ending balance individually evaluated for impairment | $ | 433 | $ | 3,681 | $ | 3,053 | $ | 228 | $ | 8 | $ | — | $ | — | $ | 7,403 | |||||||||||||||
Ending balance collectively evaluated for impairment | $ | 56,045 | $ | 230,314 | $ | 283,547 | $ | 46,315 | $ | 9,533 | $ | 12,050 | $ | — | $ | 637,804 | |||||||||||||||
As of and for the Twelve Months Ended | |||||||||||||||||||||||||||||||
December 31, 2018 | |||||||||||||||||||||||||||||||
(in thousands) | |||||||||||||||||||||||||||||||
Construction and Farmland | Residential Real Estate | Commercial Real Estate | Commercial | Consumer | All Other Loans | Unallocated | Total | ||||||||||||||||||||||||
Allowance for credit losses: | |||||||||||||||||||||||||||||||
Beginning Balance | $ | 332 | $ | 1,754 | $ | 1,627 | $ | 570 | $ | 69 | $ | 29 | $ | 30 | $ | 4,411 | |||||||||||||||
Charge-Offs | — | (24 | ) | — | (139 | ) | (33 | ) | (40 | ) | — | (236 | ) | ||||||||||||||||||
Recoveries | 266 | 28 | 78 | 100 | 19 | 13 | — | 504 | |||||||||||||||||||||||
Provision (recovery) | (15 | ) | 30 | 283 | 388 | (2 | ) | 95 | (2 | ) | 777 | ||||||||||||||||||||
Ending balance | $ | 583 | $ | 1,788 | $ | 1,988 | $ | 919 | $ | 53 | $ | 97 | $ | 28 | $ | 5,456 | |||||||||||||||
Ending balance: Individually evaluated for impairment | $ | — | $ | 119 | $ | 193 | $ | 650 | $ | — | $ | — | $ | 962 | |||||||||||||||||
Ending balance: collectively evaluated for impairment | $ | 583 | $ | 1,669 | $ | 1,795 | $ | 269 | $ | 53 | $ | 97 | $ | 28 | $ | 4,494 | |||||||||||||||
Loans: | |||||||||||||||||||||||||||||||
Ending balance | $ | 61,926 | $ | 229,784 | $ | 265,595 | $ | 33,086 | $ | 8,470 | $ | 8,454 | $ | — | $ | 607,315 | |||||||||||||||
Ending balance individually evaluated for impairment | $ | 280 | $ | 4,044 | $ | 2,919 | $ | 1,316 | $ | — | $ | — | $ | 8,559 | |||||||||||||||||
Ending balance collectively evaluated for impairment | $ | 61,646 | $ | 225,740 | $ | 262,676 | $ | 31,770 | $ | 8,470 | $ | 8,454 | $ | — | $ | 598,756 | |||||||||||||||
65
As of and for the Twelve Months Ended | |||||||||||||||||||||||||||||||
December 31, 2017 | |||||||||||||||||||||||||||||||
(in thousands) | |||||||||||||||||||||||||||||||
Construction and Farmland | Residential Real Estate | Commercial Real Estate | Commercial | Consumer | All Other Loans | Unallocated | Total | ||||||||||||||||||||||||
Allowance for credit losses: | |||||||||||||||||||||||||||||||
Beginning Balance | $ | 450 | $ | 1,992 | $ | 1,522 | $ | 235 | $ | 69 | $ | 22 | $ | 215 | $ | 4,505 | |||||||||||||||
Charge-Offs | (19 | ) | (55 | ) | (1 | ) | (187 | ) | (59 | ) | (49 | ) | — | (370 | ) | ||||||||||||||||
Recoveries | 535 | 212 | 65 | 44 | 40 | 5 | — | 901 | |||||||||||||||||||||||
Provision (recovery) | (634 | ) | (395 | ) | 41 | 478 | 19 | 51 | (185 | ) | (625 | ) | |||||||||||||||||||
Ending balance | $ | 332 | $ | 1,754 | $ | 1,627 | $ | 570 | $ | 69 | $ | 29 | $ | 30 | $ | 4,411 | |||||||||||||||
Ending balance: Individually evaluated for impairment | $ | — | $ | 195 | $ | 59 | $ | 195 | $ | 9 | $ | — | $ | — | $ | 458 | |||||||||||||||
Ending balance: collectively evaluated for impairment | $ | 332 | $ | 1,559 | $ | 1,568 | $ | 375 | $ | 60 | $ | 29 | $ | 30 | $ | 3,953 | |||||||||||||||
Loans: | |||||||||||||||||||||||||||||||
Ending balance | $ | 52,354 | $ | 227,305 | $ | 239,915 | $ | 37,427 | $ | 10,187 | $ | 2,050 | $ | — | $ | 569,238 | |||||||||||||||
Ending balance individually evaluated for impairment | $ | 315 | $ | 8,315 | $ | 1,904 | $ | 858 | $ | 34 | $ | — | $ | — | $ | 11,426 | |||||||||||||||
Ending balance collectively evaluated for impairment | $ | 52,039 | $ | 218,990 | $ | 238,011 | $ | 36,569 | $ | 10,153 | $ | 2,050 | $ | — | $ | 557,812 | |||||||||||||||
66
Impaired loans by class at December 31, 2019 and December 31, 2018 were as follows:
As of and for the Year Ended | |||||||||||||||||||
December 31, 2019 | |||||||||||||||||||
(in thousands) | |||||||||||||||||||
Unpaid Principal Balance | Recorded Investment (1) | Related Allowance | Average Recorded Investment | Interest Income Recognized | |||||||||||||||
With no related allowance: | |||||||||||||||||||
Commercial - Non Real Estate: | |||||||||||||||||||
Commercial & Industrial | $ | 364 | $ | 228 | $ | — | $ | 269 | $ | 21 | |||||||||
Commercial Real Estate: | |||||||||||||||||||
Owner Occupied | 369 | 356 | — | 358 | 4 | ||||||||||||||
Non-owner occupied | 407 | 329 | — | 335 | — | ||||||||||||||
Construction and Farmland: | |||||||||||||||||||
Residential | — | — | — | — | — | ||||||||||||||
Commercial | 301 | 246 | — | 263 | 25 | ||||||||||||||
Consumer: | |||||||||||||||||||
Installment | 9 | 8 | — | 9 | — | ||||||||||||||
Residential: | |||||||||||||||||||
Equity lines | 276 | 65 | — | 68 | 1 | ||||||||||||||
Single family | 2,854 | 2,435 | — | 2,583 | 80 | ||||||||||||||
Multifamily | 366 | 367 | — | 375 | 21 | ||||||||||||||
Other Loans | — | — | — | — | — | ||||||||||||||
$ | 4,946 | $ | 4,034 | $ | — | $ | 4,260 | $ | 152 | ||||||||||
With an allowance recorded: | |||||||||||||||||||
Commercial - Non Real Estate: | |||||||||||||||||||
Commercial & Industrial | $ | — | $ | — | $ | — | $ | — | $ | — | |||||||||
Commercial Real Estate: | |||||||||||||||||||
Owner Occupied | — | — | — | — | — | ||||||||||||||
Non-owner occupied | 2,369 | 2,377 | 149 | 2,405 | 103 | ||||||||||||||
Construction and Farmland: | |||||||||||||||||||
Residential | — | — | — | — | — | ||||||||||||||
Commercial | 187 | 187 | 100 | 187 | 8 | ||||||||||||||
Consumer: | |||||||||||||||||||
Installment | — | — | — | — | — | ||||||||||||||
Residential: | |||||||||||||||||||
Equity lines | — | — | — | — | — | ||||||||||||||
Single family | 879 | 822 | 51 | 833 | 38 | ||||||||||||||
Multifamily | — | — | — | — | — | ||||||||||||||
Other Loans | — | — | — | — | — | ||||||||||||||
$ | 3,435 | $ | 3,386 | $ | 300 | $ | 3,425 | $ | 149 | ||||||||||
Total: | |||||||||||||||||||
Commercial | $ | 364 | $ | 228 | $ | — | $ | 269 | $ | 21 | |||||||||
Commercial Real Estate | 3,145 | 3,062 | 149 | 3,098 | 107 | ||||||||||||||
Construction and Farmland | 488 | 433 | 100 | 450 | 33 | ||||||||||||||
Consumer | 9 | 8 | — | 9 | — | ||||||||||||||
Residential | 4,375 | 3,689 | 51 | 3,859 | 140 | ||||||||||||||
Other | — | — | — | — | — | ||||||||||||||
Total | $ | 8,381 | $ | 7,420 | $ | 300 | $ | 7,685 | $ | 301 | |||||||||
67
As of and for the Year Ended | |||||||||||||||||||
December 31, 2018 | |||||||||||||||||||
(in thousands) | |||||||||||||||||||
Unpaid Principal Balance | Recorded Investment (1) | Related Allowance | Average Recorded Investment | Interest Income Recognized | |||||||||||||||
With no related allowance: | |||||||||||||||||||
Commercial - Non Real Estate: | |||||||||||||||||||
Commercial & Industrial | $ | 564 | $ | 356 | $ | — | $ | 422 | $ | 25 | |||||||||
Commercial Real Estate: | |||||||||||||||||||
Owner Occupied | — | — | — | — | — | ||||||||||||||
Non-owner occupied | 558 | 501 | — | 511 | 4 | ||||||||||||||
Construction and Farmland: | |||||||||||||||||||
Residential | — | — | — | — | — | ||||||||||||||
Commercial | 332 | 281 | — | 297 | 27 | ||||||||||||||
Consumer: | |||||||||||||||||||
Installment | — | — | — | — | — | ||||||||||||||
Residential: | |||||||||||||||||||
Equity lines | 468 | 92 | — | 93 | — | ||||||||||||||
Single family | 2,616 | 2,499 | — | 2,565 | 101 | ||||||||||||||
Multifamily | 284 | 286 | — | 289 | 14 | ||||||||||||||
Other Loans | — | — | — | — | — | ||||||||||||||
$ | 4,822 | $ | 4,015 | $ | — | $ | 4,177 | $ | 171 | ||||||||||
With an allowance recorded: | |||||||||||||||||||
Commercial - Non Real Estate: | |||||||||||||||||||
Commercial & Industrial | $ | 971 | $ | 960 | $ | 650 | $ | 1,063 | $ | 60 | |||||||||
Commercial Real Estate: | |||||||||||||||||||
Owner Occupied | — | — | — | — | — | ||||||||||||||
Non-owner occupied | 2,418 | 2,425 | 193 | 2,454 | 101 | ||||||||||||||
Construction and Farmland: | |||||||||||||||||||
Residential | — | — | — | — | — | ||||||||||||||
Commercial | — | — | — | — | — | ||||||||||||||
Consumer: | |||||||||||||||||||
Installment | — | — | — | — | — | ||||||||||||||
Residential: | |||||||||||||||||||
Equity lines | — | — | — | — | — | ||||||||||||||
Single family | 1,242 | 1,190 | 119 | 1,204 | 51 | ||||||||||||||
Multifamily | — | — | — | — | — | ||||||||||||||
Other Loans | — | — | — | — | — | ||||||||||||||
$ | 4,631 | $ | 4,575 | $ | 962 | $ | 4,721 | $ | 212 | ||||||||||
Total: | |||||||||||||||||||
Commercial | $ | 1,535 | $ | 1,316 | $ | 650 | $ | 1,485 | $ | 85 | |||||||||
Commercial Real Estate | 2,976 | 2,926 | 193 | 2,965 | 105 | ||||||||||||||
Construction and Farmland | 332 | 281 | — | 297 | 27 | ||||||||||||||
Consumer | — | — | — | — | — | ||||||||||||||
Residential | 4,610 | 4,067 | 119 | 4,151 | 166 | ||||||||||||||
Other | — | — | — | — | — | ||||||||||||||
Total | $ | 9,453 | $ | 8,590 | $ | 962 | $ | 8,898 | $ | 383 | |||||||||
(1) Recorded investment is defined as the summation of the outstanding principal balance, accrued interest, and any partial charge-offs.
68
For the year ended December 31, 2017, the average recorded investment of impaired loans was $11.6 million. The interest income recognized on impaired loans was $322 thousand in 2017.
When the ultimate collectability of the total principal of an impaired loan is in doubt and the loan is in nonaccrual status, all payments are applied to principal under the cost-recovery method. For financial statement purposes, the recorded investment in nonaccrual loans is the actual principal balance reduced by payments that would otherwise have been applied to interest. When reporting information on these loans to the applicable customers, the unpaid principal balance is reported as if payments were applied to principal and interest under the original terms of the loan agreements. Therefore, the unpaid principal balance reported to the customer would be higher than the recorded investment in the loan for financial statement purposes. When the ultimate collectability of the total principal of the impaired loan is not in doubt and the loan is in nonaccrual status, contractual interest is credited to interest income when received under the cash-basis method.
The Company uses a rating system for evaluating the risks associated with non-consumer loans. Consumer loans are not evaluated for risk unless the characteristics of the loan fall within classified categories. Descriptions of these ratings are as follows:
Pass | Pass loans exhibit acceptable history of profits, cash flow ability and liquidity. Sufficient cash flow exists to service the loan. All obligations have been paid by the borrower in an as agreed manner. | |
Pass Monitored | Pass monitored loans may be experiencing income and cash volatility, inconsistent operating trends, nominal liquidity and/or a leveraged balance sheet. A higher level of supervision is required for these loans as the potential for a negative event could impact the borrower’s ability to repay the loan. | |
Special mention | Special mention loans exhibit negative trends and potential weakness that, if left uncorrected, may negatively affect the borrower’s ability to repay its obligations. The risk of default is not imminent and the borrower still demonstrates sufficient financial strength to service debt. | |
Substandard | Substandard loans exhibit well defined weaknesses resulting in a higher probability of default. The borrowers exhibit adverse financial trends and a diminishing ability or willingness to service debt. | |
Doubtful | Doubtful loans exhibit all of the characteristics inherent in substandard loans; however given the severity of weaknesses, the collection of 100% of the principal is unlikely under current conditions. | |
Loss | Loss loans are considered uncollectible over a reasonable period of time and of such little value that its continuance as a bankable asset is not warranted. | |
69
Credit quality information by class at December 31, 2019 and December 31, 2018 was as follows:
As of | |||||||||||||||||||||||||||
December 31, 2019 | |||||||||||||||||||||||||||
(in thousands) | |||||||||||||||||||||||||||
INTERNAL RISK RATING GRADES | Pass | Pass Monitored | Special Mention | Substandard | Doubtful | Loss | Total | ||||||||||||||||||||
Commercial - Non Real Estate: | |||||||||||||||||||||||||||
Commercial & Industrial | $ | 42,578 | $ | 3,815 | $ | 105 | $ | 45 | $ | — | $ | — | $ | 46,543 | |||||||||||||
Commercial Real Estate: | |||||||||||||||||||||||||||
Owner Occupied | 103,958 | 38,989 | 5,654 | 356 | — | — | 148,957 | ||||||||||||||||||||
Non-owner occupied | 103,909 | 25,939 | 5,866 | 1,929 | — | — | 137,643 | ||||||||||||||||||||
Construction and Farmland: | |||||||||||||||||||||||||||
Residential | 5,094 | 2,773 | — | — | — | — | 7,867 | ||||||||||||||||||||
Commercial | 17,018 | 30,661 | 437 | 495 | — | — | 48,611 | ||||||||||||||||||||
Residential: | |||||||||||||||||||||||||||
Equity Lines | 32,295 | 889 | — | 42 | 22 | — | 33,248 | ||||||||||||||||||||
Single family | 162,195 | 19,427 | 2,347 | 2,225 | 138 | — | 186,332 | ||||||||||||||||||||
Multifamily | 11,714 | 1,337 | 998 | 366 | — | — | 14,415 | ||||||||||||||||||||
All other loans | 11,963 | 40 | 47 | — | — | — | 12,050 | ||||||||||||||||||||
Total | $ | 490,724 | $ | 123,870 | $ | 15,454 | $ | 5,458 | $ | 160 | $ | — | $ | 635,666 | |||||||||||||
Performing | Nonperforming | ||||||
Consumer Credit Exposure by Payment Activity | $ | 9,480 | $ | 61 | |||
As of | |||||||||||||||||||||||||||
December 31, 2018 | |||||||||||||||||||||||||||
(in thousands) | |||||||||||||||||||||||||||
INTERNAL RISK RATING GRADES | Pass | Pass Monitored | Special Mention | Substandard | Doubtful | Loss | Total | ||||||||||||||||||||
Commercial - Non Real Estate: | |||||||||||||||||||||||||||
Commercial & Industrial | $ | 28,699 | $ | 2,292 | $ | 995 | $ | 1,100 | $ | — | $ | — | $ | 33,086 | |||||||||||||
Commercial Real Estate: | |||||||||||||||||||||||||||
Owner Occupied | 110,418 | 16,665 | 9,187 | 39 | — | — | 136,309 | ||||||||||||||||||||
Non-owner occupied | 106,658 | 17,139 | 3,397 | 2,092 | — | — | 129,286 | ||||||||||||||||||||
Construction and Farmland: | |||||||||||||||||||||||||||
Residential | 2,295 | 1,120 | 3,291 | — | — | — | 6,706 | ||||||||||||||||||||
Commercial | 16,682 | 22,533 | 15,658 | 347 | — | — | 55,220 | ||||||||||||||||||||
Residential: | |||||||||||||||||||||||||||
Equity Lines | 31,813 | 910 | — | 16 | 76 | — | 32,815 | ||||||||||||||||||||
Single family | 172,360 | 11,567 | 2,704 | 2,270 | 145 | — | 189,046 | ||||||||||||||||||||
Multifamily | 7,160 | 479 | — | 284 | — | — | 7,923 | ||||||||||||||||||||
All other loans | 8,435 | 19 | — | — | — | — | 8,454 | ||||||||||||||||||||
Total | $ | 484,520 | $ | 72,724 | $ | 35,232 | $ | 6,148 | $ | 221 | $ | — | $ | 598,845 | |||||||||||||
Performing | Nonperforming | ||||||
Consumer Credit Exposure by Payment Activity | $ | 8,466 | $ | 4 | |||
70
NOTE 5. Troubled Debt Restructurings
All loans deemed a troubled debt restructuring, or “TDR”, are considered impaired, and are evaluated for collateral and cash-flow sufficiency. A loan is considered a TDR when the Company, for economic or legal reasons related to a borrower’s financial difficulties, grants a concession to the borrower that the Company would not otherwise consider. All of the following factors are indicators that the Bank has granted a concession (one or multiple items may be present):
• | The borrower receives a reduction of the stated interest rate to a rate less than the institution is willing to accept at the time of the restructure for a new loan with comparable risk. |
• | The borrower receives an extension of the maturity date or dates at a stated interest rate lower than the current market interest rate for new debt with similar risk characteristics. |
• | The borrower receives a reduction of the face amount or maturity amount of the debt as stated in the instrument or other agreement. |
• | The borrower receives a deferral of required payments (principal and/or interest). |
• | The borrower receives a reduction of the accrued interest. |
There were eighteen (18) troubled debt restructured loans totaling $3.0 million at December 31, 2019. At December 31, 2018, there were nineteen (19) troubled debt restructured loans totaling $3.8 million. Four loans, totaling $401 thousand, were in nonaccrual status at December 31, 2019. Two loans, totaling $118 thousand, were in nonaccrual status at December 31, 2018. There were no outstanding commitments to lend additional amounts to troubled debt restructured borrowers at December 31, 2019 or December 31, 2018.
The following tables set forth information on the Company’s troubled debt restructurings by class of financing receivable occurring during the years ended December 31, 2019, 2018 and 2017:
For the Year Ended | ||||||||||
December 31, 2019 | ||||||||||
(in thousands) | ||||||||||
Number of Contracts | Pre-Modification Outstanding Recorded Investment | Post-Modification Outstanding Recorded Investment | ||||||||
Total | — | $ | — | $ | — | |||||
For the Year Ended | ||||||||||
December 31, 2018 | ||||||||||
(in thousands) | ||||||||||
Number of Contracts | Pre-Modification Outstanding Recorded Investment | Post-Modification Outstanding Recorded Investment | ||||||||
Residential: | ||||||||||
Single family | 1 | $ | 86 | $ | 86 | |||||
Total | 1 | $ | 86 | $ | 86 | |||||
For the Year Ended | ||||||||||
December 31, 2017 | ||||||||||
(in thousands) | ||||||||||
Number of Contracts | Pre-Modification Outstanding Recorded Investment | Post-Modification Outstanding Recorded Investment | ||||||||
Consumer: | ||||||||||
Installment | 1 | $ | 22 | $ | 22 | |||||
Total | 1 | $ | 22 | $ | 22 | |||||
During the twelve months ended December 31, 2018, the Company restructured one single family residential loan by granting a concession to the borrower experiencing financial difficulty by extending the maturity date.
During the twelve months ended December 31, 2017, the Company restructured one consumer installment loan by consolidating debt and reducing the interest rate.
71
Loans by class of financing receivable modified as TDRs within the previous 12 months and for which there was a payment default during the stated periods were:
For the Year Ended | ||||||
December 31, 2019 | ||||||
(in thousands) | ||||||
Number of Contracts | Recorded Investment | |||||
Residential: | ||||||
Single family | 1 | $ | 72 | |||
Total | 1 | $ | 72 | |||
For the Year Ended | ||||||
December 31, 2018 | ||||||
(in thousands) | ||||||
Number of Contracts | Recorded Investment | |||||
Total | — | $ | — | |||
For the Year Ended | ||||||
December 31, 2017 | ||||||
(in thousands) | ||||||
Number of Contracts | Recorded Investment | |||||
Total | — | $ | — | |||
Management defines default as over 30 days contractually past due under the modified terms, the foreclosure and/or repossession of the collateral, or the charge-off of the loan.
NOTE 6. Bank Premises and Equipment, Net
The major classes of bank premises and equipment and the total accumulated depreciation at December 31, 2019 and 2018 were as follows:
December 31, | ||||||||
2019 | 2018 | |||||||
(in thousands) | ||||||||
Land | $ | 6,644 | $ | 6,729 | ||||
Buildings and improvements | 18,472 | 18,100 | ||||||
Furniture and equipment | 7,972 | 7,312 | ||||||
$ | 33,088 | $ | 32,141 | |||||
Less accumulated depreciation | 13,791 | 13,058 | ||||||
Bank premises and equipment, net | $ | 19,297 | $ | 19,083 | ||||
Depreciation expense on buildings and improvements was $494 thousand, $483 thousand, and $484 thousand for the years ended 2019, 2018, and 2017, respectively. Depreciation expense on furniture and equipment was $463 thousand, $442 thousand, and $462 thousand for the years ended 2019, 2018, and 2017, respectively.
72
NOTE 7. Deposits
The composition of deposits at December 31, 2019 and December 31, 2018 was as follows:
December 31, | |||||||
2019 | 2018 | ||||||
(in thousands) | |||||||
Noninterest bearing demand deposits | $ | 269,171 | $ | 251,184 | |||
Savings and interest bearing demand deposits: | |||||||
NOW accounts | $ | 102,337 | $ | 91,549 | |||
Money market accounts | 154,133 | 140,581 | |||||
Regular savings accounts | 107,705 | 104,648 | |||||
$ | 364,175 | $ | 336,778 | ||||
Time deposits: | |||||||
Balances of less than $250,000 | $ | 59,094 | $ | 62,063 | |||
Balances of $250,000 and more | 79,104 | 53,079 | |||||
$ | 138,198 | $ | 115,142 | ||||
$ | 771,544 | $ | 703,104 | ||||
Money market accounts include $27.0 million and $18.4 million in reciprocal deposits at December 31, 2019 and 2018, respectively. Time deposits with balances of less than $250,000 include zero and $212 thousand in reciprocal certificates of deposit at December 31, 2019 and 2018, respectively. There were no time deposits with balances of $250,000 or more in reciprocal certificates of deposit at December 31, 2019 and 2018, respectively.
The outstanding balance of time deposits at December 31, 2019 was due as follows:
December 31, 2019 | |||
(in thousands) | |||
2020 | $ | 122,338 | |
2021 | 10,698 | ||
2022 | 2,846 | ||
2023 | 1,180 | ||
2024 | 969 | ||
Thereafter | 167 | ||
$ | 138,198 | ||
Deposit overdrafts reclassified as loans totaled $135 thousand and $183 thousand at December 31, 2019 and 2018, respectively.
73
NOTE 8. Borrowings
The Company, through its subsidiary bank, borrows funds in the form of federal funds purchased and Federal Home Loan Bank advances.
Federal fund lines of credit are extended to the Bank by nonaffiliated banks with which a correspondent banking relationship exists. The line of credit amount is determined by the creditworthiness of the Bank and, in particular, its regulatory capital ratios, which are discussed in Note 15. Federal funds purchased generally mature each business day. The following table summarizes information related to federal funds purchased for the years ended December 31, 2019 and 2018:
December 31, | ||||||||
2019 | 2018 | |||||||
(dollars in thousands) | ||||||||
Balance at year-end | $ | — | $ | 1,871 | ||||
Average balance during the year | $ | 1,074 | $ | 964 | ||||
Average interest rate during the year | 2.91 | % | 2.63 | % | ||||
Maximum month-end balance during the year | $ | 10,780 | $ | 7,820 | ||||
Gross lines of credit at year-end | $ | 28,000 | $ | 28,000 | ||||
Unused lines of credit at year-end | $ | 28,000 | $ | 26,129 | ||||
As of December 31, 2019, the Company also had a $5.0 million unused line of credit, in addition to the $28.0 million in federal funds lines of credit listed in the table above.
As of December 31, 2019, Company had remaining credit availability in the amount of $231.8 million with the Federal Home Loan Bank of Atlanta. This line may be utilized for short and/or long-term borrowing. Advances on the line are secured by all of the Company’s eligible first lien residential real estate loans on one-to-four-unit, single-family dwellings; multi-family dwellings; home equity lines of credit; and commercial real estate loans. The amount of the available credit is limited to a percentage of the estimated market value of the loans as determined periodically by the FHLB of Atlanta. The amount of the available credit is also limited to 20% of total Bank assets.
The Company had no borrowings with the FHLB at December 31, 2019 or December 31, 2018. The Company had a $45.0 million irrevocable letter of credit at December 31, 2019 with the FHLB to secure public deposits.
74
NOTE 9. Income Taxes
The Company files income tax returns with the United States of America,the Commonwealth of Virginia and West Virginia. With few exceptions, the Company is no longer subject to federal, state, or local income tax examinations for years prior to 2016.
The net deferred tax asset at December 31, 2019 and 2018 consisted of the following components:
December 31, | ||||||||
2019 | 2018 | |||||||
(in thousands) | ||||||||
Deferred tax assets: | ||||||||
Allowance for loan losses | $ | 1,044 | $ | 1,141 | ||||
Deferred compensation | 91 | 92 | ||||||
Accrued postretirement benefits | 23 | 23 | ||||||
Home equity origination costs | 52 | 51 | ||||||
Nonaccrual interest | 51 | 41 | ||||||
Securities available for sale | — | 424 | ||||||
Credit carryforward | — | 216 | ||||||
Other | 37 | 54 | ||||||
$ | 1,298 | $ | 2,042 | |||||
Deferred tax liabilities: | ||||||||
Property and equipment | $ | 705 | $ | 508 | ||||
Securities available for sale | 383 | — | ||||||
$ | 1,088 | $ | 508 | |||||
Net deferred tax asset | $ | 210 | $ | 1,534 | ||||
The Company has not recorded a valuation allowance for deferred tax assets because management believes that it is more likely than not that they will be ultimately realized.
Income tax expense for the years ended December 31, 2019, 2018 and 2017 consisted of the following components:
December 31, | ||||||||||||
2019 | 2018 | 2017 | ||||||||||
(in thousands) | ||||||||||||
Current tax expense | $ | 1,294 | $ | 1,713 | $ | 3,094 | ||||||
Deferred tax expense (benefit) | 516 | (399 | ) | 135 | ||||||||
Deferred tax adjustment for enacted rate change | — | — | 397 | |||||||||
$ | 1,810 | $ | 1,314 | $ | 3,626 | |||||||
The following table reconciles income tax expense to the statutory federal corporate income tax amount, which was calculated by applying the federal corporate income tax rate to pre-tax income for the years ended December 31, 2019, 2018 and 2017.
December 31, | ||||||||||||
2019 | 2018 | 2017 | ||||||||||
(in thousands) | ||||||||||||
Statutory federal corporate tax amount | $ | 2,429 | $ | 2,166 | $ | 3,880 | ||||||
Tax-exempt interest (income) | (260 | ) | (301 | ) | (417 | ) | ||||||
Officer insurance loss (income) | 15 | 13 | (92 | ) | ||||||||
Net tax credits | (379 | ) | (605 | ) | (165 | ) | ||||||
Corporate tax rate change | — | — | 397 | |||||||||
Other, net | 5 | 41 | 23 | |||||||||
$ | 1,810 | $ | 1,314 | $ | 3,626 | |||||||
75
The effective tax rates were 15.65%, 12.74%, and 31.77%, for years ended December 31, 2019, 2018, and 2017, respectively. The decrease in the 2018 effective tax rate resulted from three factors. First, the corporate income tax rate was reduced from 34% to 21%, effective January 1, 2018 as a result of the Tax Cuts and Jobs Act. The effective tax rate is also impacted by tax credits on qualified affordable housing project investments as discussed in Note 25 to the Consolidated Financial Statements as well as qualified rehabilitation credits. During the third quarter of 2018, one of the Company’s rehabilitation tax credit investments was finalized and the total amount of credits to be received was determined and certified. The higher 2017 effective tax rate resulted mostly from the Tax Cuts and Jobs Act that was signed into law on December 22, 2017. The Company's deferred tax assets and liabilities were adjusted at December 31, 2017, for the reduction of our applicable corporate income tax rate from 34% to 21%, effective January 1, 2018. This adjustment resulted in a write-down of our net deferred tax assets and an increase in our federal income tax expense of $397 thousand.
NOTE 10. Stock-Based Compensation
Restricted Stock provides grantees with rights to shares of common stock upon completion of a service period or achievement of Company performance measures. During the restriction period, all shares are considered outstanding and dividends are paid to the grantee. Outside directors are periodically granted restricted shares which vest over a period of less than nine months. During 2019, executive officers were granted restricted shares which vest over a three year service period and restricted shares which vest based on meeting performance measures over a one year period. Beginning in 2018, certain non-executive officers also were granted restricted shares which vest over a 3 year service period. Vesting schedules were unchanged from the two prior years. The following table presents the activity for Restricted Stock for the years ended December 31, 2019, 2018 and 2017:
Twelve Months Ended | ||||||||||||||||||||
December 31, | ||||||||||||||||||||
2019 | 2018 | 2017 | ||||||||||||||||||
Shares | Weighted Average Grant Date Fair Value | Shares | Weighted Average Grant Date Fair Value | Shares | Weighted Average Grant Date Fair Value | |||||||||||||||
Nonvested, beginning of period | 16,701 | $ | 29.72 | 14,401 | $ | 24.68 | 14,901 | $ | 23.05 | |||||||||||
Granted | 22,488 | 30.69 | 16,950 | 32.84 | 14,650 | 27.46 | ||||||||||||||
Vested | (18,150 | ) | 30.16 | (14,609 | ) | 28.38 | (14,493 | ) | 25.90 | |||||||||||
Forfeited | (2,551 | ) | 30.28 | (41 | ) | 25.50 | (657 | ) | 23.00 | |||||||||||
Nonvested, end of period | 18,488 | $ | 30.39 | 16,701 | $ | 29.72 | 14,401 | $ | 24.68 | |||||||||||
The Company recognizes compensation expense over the vesting period based on the fair value of the Company's stock on the grant date. Compensation expense was $562 thousand, $518 thousand, and $382 thousand during December 31, 2019, 2018, and 2017, respectively. The total grant date fair value of Restricted Stock which vested was $547 thousand, $415 thousand and $375 thousand for the years ended December 31, 2019, 2018 and 2017, respectively. The total vest date fair value of Restricted Stock which vested was $556 thousand, $473 thousand and $398 thousand for the years ended December 31, 2019, 2018 and 2017, respectively. Unrecognized compensation cost related to unvested Restricted Stock was $162 thousand at December 31, 2019. This amount is expected to be recognized over a weighted average period of one year. The Company's policy is to recognize forfeitures as they occur.
76
NOTE 11. Employee Benefits
The Company has an Employee Stock Ownership Plan (ESOP) to provide additional retirement benefits to substantially all employees. Contributions can be made to the Bank of Clarke County Employee Retirement Trust to be used to purchase the Company’s common stock. There were no contributions in 2019, 2018, and 2017.
The Company sponsors a 401(k) savings plan under which eligible employees may defer a portion of salary on a pretax basis, subject to certain IRS limits. The Company matches 50 percent of employee contributions, on a maximum of six percent of salary deferred, with Company common stock or cash, as elected by each employee. The shares for this purpose are provided principally by newly issued shares. The 401(k) plan includes a non-elective safe-harbor employer contribution and an age-weighted employer contribution. Each year, qualifying employees will receive a non-elective safe-harbor contribution equal to three percent of their salary for that year. Qualifying employees will receive an additional contribution based on their age and years of service. The percentage of salary for the age-weighted contribution increases on both factors, age and years of service, with a minimum of one percent of salary and a maximum of ten percent of salary. Contributions under the plan amounted to $1.1 million in 2019, $1.0 million in 2018, and $1.0 million in 2017.
The Company has established an Executive Supplemental Income Plan for certain key employees. Benefits are to be paid in monthly installments following retirement or death. The agreement provides that if employment is terminated for reasons other than death or disability prior to age 65, the amount of benefits could be reduced or forfeited. The executive supplemental income benefit liability was $30 thousand and $49 thousand at December 31, 2019 and 2018, respectively. The executive supplemental income benefit expense, based on the present value of the retirement benefits, was $21 thousand in 2019, $29 thousand in 2018, and $29 thousand in 2017. The plan is unfunded; however, life insurance has been acquired on the lives of these employees in amounts sufficient to discharge the plan’s obligations.
NOTE 12. Commitments and Contingencies
In the normal course of business, the Company makes various commitments and incurs certain contingent liabilities, which are not reflected in the accompanying financial statements. These commitments and contingent liabilities include various guarantees, commitments to extend credit and standby letters of credit. The Company does not anticipate any material losses as a result of these commitments.
During the normal course of business, various legal claims arise from time to time which, in the opinion of management, will have no material effect on the Company’s consolidated financial statements.
As a member of the Federal Reserve System, the Bank is required to maintain certain average reserve balances. These reserve balances include usable vault cash and amounts on deposit with the Federal Reserve Bank. For the final weekly reporting period in the years ended December 31, 2019 and 2018, the amount of daily average required balances were approximately $1.7 million and $1.6 million, respectively. For both periods, these required amounts were met by vault cash and no additional amount was required to be on deposit with the Federal Reserve Bank. In addition, the Bank was required to maintain a total compensating balance on deposit with two correspondent banks in the amount of $250 thousand at December 31, 2019 and 2018.
See Note 18 with respect to financial instruments with off-balance-sheet risk.
NOTE 13. Leases
On January 1, 2019, the Company adopted ASU No. 2016-02 “Leases (Topic 842)” and all subsequent ASUs that modified Topic 842. The Company elected the prospective application approach provided by ASU 2018-11 and did not adjust prior periods for ASC 842. The Company also elected certain practical expedients within the standard and consistent with such elections did not reassess whether any expired or existing contracts are or contain leases, did not reassess the lease classification for any expired or existing leases, and did not reassess any initial direct costs for existing leases. The implementation of the new standard resulted in recognition of a right-of-use asset and lease liability of $3.8 million at the date of adoption, which is related to the Company’s lease of premises used in operations. The right-of-use asset and lease liability are included in other assets and other liabilities, respectively, in the Consolidated Balance Sheets.
77
Lease liabilities represent the Company’s obligation to make lease payments and are presented at each reporting date as the net present value of the remaining contractual cash flows. Cash flows are discounted at the Company’s incremental borrowing rate in effect at the commencement date of the lease. Right-of-use assets represent the Company’s right to use the underlying asset for the lease term and are calculated as the sum of the lease liability and if applicable, prepaid rent, initial direct costs and any incentives received from the lessor.
The Company’s only long-term lease agreement is classified as an operating lease. This lease offers the option to extend the lease term and the Company has included such extensions in its calculation of the lease liability to the extent the options are reasonably certain of being exercised. The lease agreement does not provide for a residual value guarantee and has no restrictions or covenants that would impact dividends or require incurring additional financial obligations.
The following tables present information about the Company’s leases:
(dollars in thousands) | As of | |||
December 31, 2019 | ||||
Lease liability | $ | 3,680 | ||
Right-of-use asset | $ | 3,618 | ||
Weighted average remaining lease term | 20 years | |||
Weighted average discount rate | 3.62 | % | ||
Twelve Months Ended | ||||
Lease Cost | December 31, 2019 | |||
Operating lease cost | $ | 261 | ||
Short-term lease cost | 16 | |||
Total lease cost | $ | 277 | ||
Cash paid for amounts included in the measurement of lease liabilities | $ | 200 | ||
A maturity analysis of operating lease liability and reconciliation of the undiscounted cash flows to the total operating lease liability is as follows:
As of | ||||
Lease payments due | December 31, 2019 | |||
Twelve months ending December 31, 2020 | $ | 215 | ||
Twelve months ending December 31, 2021 | 220 | |||
Twelve months ending December 31, 2022 | 220 | |||
Twelve months ending December 31, 2023 | 220 | |||
Twelve months ending December 31, 2024 | 220 | |||
Thereafter | 4,257 | |||
Total undiscounted cash flows | $ | 5,352 | ||
Discount | (1,672 | ) | ||
Lease liability | $ | 3,680 | ||
78
NOTE 14. Transactions with Directors and Officers
The Bank grants loans to and accepts deposits from its directors, principal officers and related parties of such persons during the ordinary course of business. The aggregate balance of loans to directors, principal officers and their related parties was $6.2 million and $5.9 million at December 31, 2019 and 2018, respectively. These balances reflect total principal additions of $4.7 million and total principal payments of $4.4 million, during 2019. The aggregate balance of deposits from directors, principal officers and their related parties was $24.3 million and $21.2 million at December 31, 2019 and 2018, respectively. Adjustments were made to prior year amounts for directors and officers that are now considered to be related parties.
NOTE 15. Capital Requirements
The Bank is subject to various regulatory capital requirements administered by the federal banking agencies. Failure to meet minimum capital requirements can initiate certain mandatory and possibly additional discretionary actions by regulators that, if undertaken, could have a direct material effect on the financial statements. Under capital adequacy guidelines and the regulatory framework for prompt corrective action, the Bank must meet specific capital guidelines that involve quantitative measures of their assets, liabilities, and certain off-balance-sheet items as calculated under regulatory accounting practices. The capital amounts and classification are also subject to qualitative judgments by the regulators about components, risk weightings, and other factors.
Effective January 1, 2015, the Federal Reserve issued a final rule that made technical changes to its market risk capital rules to align them with the BASEL III regulatory capital framework and meet certain requirements of the Dodd-Frank Act. The phase-in period for the final rules began January 1, 2015 with full compliance with the final rules phased in by January 1, 2019. As a part of this final rule, the Bank was required to begin calculating and disclosing Common Equity Tier 1 Capital to risk weighted assets in 2015. In addition to the minimum regulatory capital required for capital adequacy purposes, the Bank is required to maintain a minimum Capital Conservation Buffer, in the form of common equity, in order to avoid restrictions on capital distributions and discretionary bonuses. The required amount of the Capital Conservation Buffer was 0.625% on January 1, 2016 and has increased by 0.625% each year until it reached 2.5% on January 1, 2019. The Capital Conservation Buffer is applicable to all ratios except the leverage ratio, which is noted below as Tier 1 Capital to Average Assets. The Bank's institution specific capital conservation buffer at December 31, 2019 was 6.40%.
Quantitative measures established by regulation to ensure capital adequacy require the Company and the Bank to maintain minimum amounts and ratios (set forth in the table below) of total capital, Tier 1 capital, and common equity Tier 1 capital (as defined in the regulations) to risk-weighted assets (as defined), and of Tier 1 capital to average assets (as defined). Management believes the Bank met all capital adequacy requirements to which it was subject at December 31, 2019 and 2018.
At December 31, 2019, the most recent notification from the Federal Reserve categorized the Bank as well capitalized under the regulatory framework for prompt corrective action. To be categorized as well capitalized, an institution must maintain minimum total risk-based, Tier 1 risk-based, Tier 1 leverage, and common equity Tier 1 ratios as set forth in the following tables. There are no conditions or events since the notification that management believes have changed the Bank’s category.
79
The following table presents the Bank’s actual capital amounts and ratios at December 31, 2019 and 2018:
Minimum To Be Well | |||||||||||||||||||||
Minimum Capital | Capitalized Under Prompt Corrective | ||||||||||||||||||||
Actual | Requirement | Action Provisions | |||||||||||||||||||
Amount | Ratio | Amount | Ratio | Amount | Ratio | ||||||||||||||||
(dollars in thousands) | |||||||||||||||||||||
December 31, 2019: | |||||||||||||||||||||
Common Equity Tier 1 Capital to Risk | |||||||||||||||||||||
Weighted Assets | |||||||||||||||||||||
Bank of Clarke County | $ | 90,775 | 13.65 | % | $ | 29,931 | 4.50 | % | $ | 43,234 | 6.50 | % | |||||||||
Total Capital to Risk Weighted Assets | |||||||||||||||||||||
Bank of Clarke County | $ | 95,772 | 14.40 | % | $ | 53,211 | 8.00 | % | $ | 66,514 | 10.00 | % | |||||||||
Tier 1 Capital to Risk Weighted Assets | |||||||||||||||||||||
Bank of Clarke County | $ | 90,775 | 13.65 | % | $ | 39,908 | 6.00 | % | $ | 53,211 | 8.00 | % | |||||||||
Tier 1 Capital to Average Assets | |||||||||||||||||||||
Bank of Clarke County | $ | 90,775 | 10.61 | % | $ | 34,216 | 4.00 | % | $ | 42,770 | 5.00 | % | |||||||||
December 31, 2018: | |||||||||||||||||||||
Common Equity Tier 1 Capital to Risk | |||||||||||||||||||||
Weighted Assets | |||||||||||||||||||||
Bank of Clarke County | $ | 85,763 | 13.99 | % | $ | 27,596 | 4.50 | % | $ | 39,861 | 6.50 | % | |||||||||
Total Capital to Risk Weighted Assets | |||||||||||||||||||||
Bank of Clarke County | $ | 91,237 | 14.88 | % | $ | 49,060 | 8.00 | % | $ | 61,325 | 10.00 | % | |||||||||
Tier 1 Capital to Risk Weighted Assets | |||||||||||||||||||||
Bank of Clarke County | $ | 85,763 | 13.99 | % | $ | 36,795 | 6.00 | % | $ | 49,060 | 8.00 | % | |||||||||
Tier 1 Capital to Average Assets | |||||||||||||||||||||
Bank of Clarke County | $ | 85,763 | 10.92 | % | $ | 31,424 | 4.00 | % | $ | 39,280 | 5.00 | % | |||||||||
NOTE 16. Restrictions On Dividends, Loans and Advances
Federal and state banking regulations place certain restrictions on dividends paid and loans or advances made by the Bank to the Company. The total amount of dividends which may be paid at any date is generally limited to the lesser of the Bank’s retained earnings or the three preceding years’ undistributed net income of the Bank. Loans or advances are limited to 10% of the Bank’s capital stock and surplus on a secured basis. Capital stock and surplus is defined as tier 1 and tier 2 capital under the risk-based capital guidelines. In addition, dividends paid by the Bank to the Company would be prohibited if the effect thereof would cause the Bank’s capital to be reduced below applicable minimum capital requirements.
At December 31, 2019, the Bank’s retained earnings available for the payment of dividends to the Company was $14.7 million. Accordingly, $77.6 million of the Company’s equity in the net assets of the Bank was restricted at December 31, 2019. Funds available for loans or advances by the Bank to the Company amounted to $9.6 million at December 31, 2019.
80
NOTE 17. Dividend Investment Plan
The Company has a Dividend Investment Plan, which allows participants’ dividends to purchase additional shares of common stock at its fair market value on each dividend record date. During 2016, the Company amended the Plan to provide that shares of common stock purchased through the Plan would be purchased at a price equal to the market price of the shares. Prior to this date, the Plan allowed participants' dividends to purchase additional shares of common stock at 95% of its fair market value. Our board of directors determined to eliminate the discount for purchases of shares in order to reflect current best practices and market standards for dividend reinvestment plans generally and among our peers. No other changes have been made to the operation of the dividend reinvestment features of the Plan, and current participants will remain enrolled in the Plan under their current methods of participation unless they choose to alter their enrollment.
NOTE 18. Financial Instruments with Off-Balance-Sheet Risk
The Company, through its subsidiary bank, is a party to credit related financial instruments with off-balance-sheet risk in the normal course of business to meet the financing needs of its customers. These financial instruments include commitments to extend credit, unfunded commitments under lines of credit, and commercial and standby letters of credit. Such commitments involve, to varying degrees, elements of credit and interest rate risk in excess of the amount recognized in the consolidated balance sheets.
The Company’s exposure to credit loss is represented by the contractual amount of these instruments. The Company uses the same credit policies in making commitments as it does for on-balance-sheet instruments.
At December 31, 2019 and 2018, the following financial instruments were outstanding whose contract amounts represent credit risk:
2019 | 2018 | |||||||
(dollar in thousands) | ||||||||
Commitments to extend credit | $ | 19,939 | $ | 21,616 | ||||
Unfunded commitments under lines of credit | 121,609 | 105,902 | ||||||
Commercial and standby letters of credit | 6,132 | 6,380 | ||||||
Commitments to extend credit are agreements to lend to a customer as long as the terms offered are acceptable and certain other conditions are met. Commitments generally have fixed expiration dates or other termination clauses. Since these commitments may expire or terminate, the total commitment amounts do not necessarily represent future cash requirements. The amount of collateral obtained, with regards to these commitments, is based on management’s credit evaluation of the customer.
Unfunded commitments under lines of credit are contracts for possible future extensions of credit to existing customers. Unfunded commitments under lines of credit include, but are not limited to, home equity lines of credit, overdraft protection lines of credit, credit cards, and unsecured and secured commercial lines of credit. The terms and conditions of these commitments vary depending on the line of credit’s purpose, collateral, and maturity. The amount disclosed above represents total unused lines of credit for which a contract with the Bank has been established.
Commercial and standby letters of credit are conditional commitments issued by the Bank to guarantee the performance of a customer to a third party. These letters of credit are primarily issued to support public and private borrowing arrangements. Essentially all letters of credit issued have expiration dates within one year. The credit risk involved in issuing letters of credit is essentially the same as that involved in granting loans to customers. The Bank holds collateral supporting these commitments if it is deemed necessary. At December 31, 2019, $5.4 million of the outstanding letters of credit were collateralized.
The Bank has cash accounts in other commercial banks. The amount on deposit in these banks at December 31, 2019 exceeded the insurance limits of the Federal Deposit Insurance Corporation by $746 thousand.
81
NOTE 19. Revenue Recognition
On January 1, 2018, the Company adopted ASU No. 2014-09, “Revenue from Contracts with Customers: Topic 606”, and all subsequent amendments to the ASU No. 2014-09. Using Topic 606 guidelines, the Company concluded that Topic 606 applies to noninterest income excluding certain out-of-scope revenue streams (e.g. gains on securities transactions, bank owned life insurance income, etc.).
Income from Fiduciary Activities
Trust asset management fee income is primarily comprised of fees earned from the management and administration of trusts and other customer assets. The Company’s performance obligation is generally satisfied over time and the resulting fees are recognized monthly, based upon the month-end market value of the assets under management and the applicable fee rate. Payment is generally received a few days after month end through a direct charge to customers’ accounts. The Company does not earn performance-based incentives. Optional services such as real estate sales and tax return preparation services are also available to existing trust and asset management customers. The Company’s performance obligation for these transactional-based services is generally satisfied, and related revenue recognized, at a point in time (i.e., as incurred). Payment is received shortly after services are rendered.
Service Charges on Deposit Accounts
Service charges on deposit accounts are principally comprised of overdrawn account fees and account maintenance charges. The Company’s performance obligations on revenue generated from deposit accounts are generally satisfied immediately, when the transaction occurs, or by month-end. Typically, the duration of a contract does not extend beyond the services performed. Due to the short duration of most customer contracts which generate these sources of noninterest income, no significant judgments must be made in the determination of the amount and timing of revenue recognized.
Other Service Charges and Fees
The majority of the Company’s noninterest income is derived from short term contracts associated with services provided for other ancillary services such as ATM fees, brokerage commissions, secondary market fees and wire transfer fees. The Company’s performance obligations on revenue generated from these ancillary services are generally satisfied immediately, when the transaction occurs, or by month-end. Typically, the duration of a contract does not extend beyond the services performed. Due to the short duration of most customer contracts which generate these sources of noninterest income, no significant judgments must be made in the determination of the amount and timing of revenue recognized.
The Company earns interchange fees from credit cardholder transactions conducted through the Visa payment network. Interchange fees from cardholder transactions represent a percentage of the underlying transaction value and are recognized no less than monthly.
82
Noninterest income disaggregated by major source, for the years ended December 31, 2019, 2018 and 2017, consisted of the following:
December 31, | |||||||||||
2019 | 2018 | 2017 | |||||||||
(dollar in thousands) | |||||||||||
Noninterest income: | |||||||||||
Income from fiduciary activities(1): | |||||||||||
Trust asset management fees | $ | 1,380 | $ | 1,360 | $ | 1,238 | |||||
Service charges on deposit accounts(1): | |||||||||||
Overdrawn account fees | 961 | 995 | 999 | ||||||||
Monthly and other service charges | 226 | 223 | 224 | ||||||||
Other service charges and fees: | |||||||||||
Interchange fees (1) | 380 | 361 | 331 | ||||||||
ATM fees (1) | 2,431 | 2,240 | 2,046 | ||||||||
Brokerage commissions (1) | 1,150 | 831 | 865 | ||||||||
Secondary market fees (1) | 486 | 306 | 241 | ||||||||
Other charges and fees (2) | 446 | 435 | 395 | ||||||||
Gain (loss) on the sale and disposal of bank premises and equipment (1) | 137 | (3 | ) | (12 | ) | ||||||
(Loss) gain on sale of securities | (7 | ) | 17 | (10 | ) | ||||||
Other operating income (3) | 169 | 114 | 463 | ||||||||
Total noninterest income | $ | 7,759 | $ | 6,879 | $ | 6,780 | |||||
(1) Income within the scope of Topic 606.
(2) Includes income within the scope of Topic 606 of $412 thousand, $365 thousand, and $342 thousand for the years ended December 31, 2019, 2018, and 2017, respectively. The remaining balance is outside the scope of Topic 606.
(3) Includes income within the scope of Topic 606 of $212 thousand, $153 thousand, and $190 thousand for the years ended December 31, 2019 2018, and 2017, respectively. The remaining balance is outside the scope of Topic 606.
Contract Balances
A contract asset balance occurs when an entity performs a service for a customer before the customer pays consideration (resulting in a contract receivable) or before payment is due (resulting in a contract asset). A contract liability balance is an entity’s obligation to transfer a service to a customer for which the entity has already received payment (or payment is due) from the customer. The Company’s noninterest revenue streams are largely based on transactional activity, or standard month-end revenue accruals such as asset management fees based on month-end market values. Consideration is often received immediately or shortly after the Company satisfies its performance obligation and revenue is recognized. The Company does not typically enter into long-term revenue contracts with customers, and therefore, does not experience significant contract balances. As of December 31, 2019 and December 31, 2018, the Company did not have any significant contract balances.
83
NOTE 20. Quarterly Condensed Statements of Income - Unaudited
The Company’s quarterly net income, net income per common share and dividends per common share during 2019, 2018 and 2017 are summarized as follows:
2019 Quarter Ended | ||||||||||||||||
March 31 | June 30 | September 30 | December 31 | |||||||||||||
(in thousands, except per share amounts) | ||||||||||||||||
Total interest and dividend income | $ | 8,593 | $ | 8,750 | $ | 9,084 | $ | 9,027 | ||||||||
Net interest income after provision for loan losses | 7,430 | 7,433 | 7,835 | 7,888 | ||||||||||||
Noninterest income | 1,844 | 1,878 | 2,219 | 1,818 | ||||||||||||
Noninterest expenses | 6,231 | 6,824 | 7,411 | 6,310 | ||||||||||||
Income before income taxes | 3,043 | 2,487 | 2,643 | 3,396 | ||||||||||||
Net income | 2,571 | 2,126 | 2,231 | 2,831 | ||||||||||||
Net income per common share, basic | 0.74 | 0.62 | 0.65 | 0.83 | ||||||||||||
Net income per common share, diluted | 0.74 | 0.62 | 0.65 | 0.83 | ||||||||||||
Dividends per common share | 0.24 | 0.25 | 0.25 | 0.26 | ||||||||||||
2018 Quarter Ended | ||||||||||||||||
March 31 | June 30 | September 30 | December 31 | |||||||||||||
(in thousands, except per share amounts) | ||||||||||||||||
Total interest and dividend income | $ | 7,475 | $ | 7,994 | $ | 8,131 | $ | 8,323 | ||||||||
Net interest income after (recovery of) loan losses | 6,844 | 7,518 | 7,286 | 6,983 | ||||||||||||
Noninterest income | 1,801 | 1,665 | 1,804 | 1,609 | ||||||||||||
Noninterest expenses | 5,630 | 6,166 | 7,310 | 6,089 | ||||||||||||
Income before income taxes | 3,015 | 3,017 | 1,780 | 2,503 | ||||||||||||
Net income | 2,539 | 2,521 | 1,860 | 2,081 | ||||||||||||
Net income per common share, basic | 0.73 | 0.73 | 0.54 | 0.60 | ||||||||||||
Net income per common share, diluted | 0.73 | 0.73 | 0.54 | 0.60 | ||||||||||||
Dividends per common share | 0.23 | 0.23 | 0.24 | 0.24 | ||||||||||||
2017 Quarter Ended | ||||||||||||||||
March 31 | June 30 | September 30 | December 31 | |||||||||||||
(in thousands, except per share amounts) | ||||||||||||||||
Total interest and dividend income | $ | 6,566 | $ | 7,004 | $ | 7,458 | $ | 7,323 | ||||||||
Net interest income after (recovery of) loan losses | 6,890 | 6,985 | 7,109 | 6,838 | ||||||||||||
Noninterest income | 1,673 | 1,598 | 1,617 | 1,892 | ||||||||||||
Noninterest expenses | 5,711 | 5,747 | 5,909 | 5,823 | ||||||||||||
Income before income taxes | 2,852 | 2,836 | 2,817 | 2,907 | ||||||||||||
Net income | 2,042 | 2,027 | 2,007 | 1,710 | ||||||||||||
Net income per common share, basic | 0.59 | 0.58 | 0.58 | 0.49 | ||||||||||||
Net income per common share, diluted | 0.59 | 0.58 | 0.58 | 0.49 | ||||||||||||
Dividends per common share | 0.22 | 0.22 | 0.22 | 0.22 | ||||||||||||
84
NOTE 21. Fair Value Measurements
GAAP requires the Company to record fair value adjustments to certain assets and liabilities and to determine fair value disclosures. The fair value of certain assets and liabilities is an exit price, representing the amount that would be received to sell an asset or paid to transfer a liability in the principal or most advantageous market in an orderly transaction between market participants as of the measurement date.
“Fair Value Measurements” defines fair value, establishes a framework for measuring fair value, establishes a three-level valuation hierarchy for disclosure of fair value measurement and enhances disclosure requirements for fair value measurements. The valuation hierarchy is based upon the transparency of inputs to the valuation of an asset or liability as of the measurement date. The three levels are defined as follows:
• | Level 1 | Inputs to the valuation methodology are quoted prices (unadjusted) for identical assets or liabilities in active markets. | |
• | Level 2 | Inputs to the valuation methodology include quoted prices for similar assets and liabilities in active markets, and inputs that are observable for the asset or liability, either directly or indirectly, for substantially the full term of the financial instrument. | |
• | Level 3 | Inputs to the valuation methodology are unobservable and significant to the fair value measurement. | |
The following sections provide a description of the valuation methodologies used for instruments measured at fair value, as well as the general classification of such instruments pursuant to the valuation hierarchy:
Securities Available for Sale: Where quoted prices are available in an active market, securities are classified within Level 1 of the valuation hierarchy. Level 1 securities would include highly liquid government bonds, mortgage products and exchange traded equities. If quoted market prices are not available, then fair values are estimated by using pricing models, quoted prices of securities with similar characteristics, or discounted cash flow. Level 2 securities would include U.S. agency securities, mortgage-backed agency securities, obligations of states and political subdivisions and certain corporate, asset backed and other securities. In certain cases where there is limited activity or less transparency around inputs to the valuation, securities are classified within Level 3 of the valuation hierarchy.
85
The following table presents balances of financial assets and liabilities measured at fair value on a recurring basis at December 31, 2019 and December 31, 2018:
Fair Value Measurements at | |||||||||||||||
December 31, 2019 | |||||||||||||||
Using | |||||||||||||||
Balance as of | Quoted Prices in Active Markets for Identical Assets | Significant Other Observable Inputs | Significant Unobservable Inputs | ||||||||||||
December 31, 2019 | (Level 1) | (Level 2) | (Level 3) | ||||||||||||
(in thousands) | |||||||||||||||
Assets: | |||||||||||||||
Securities available for sale | |||||||||||||||
Obligations of U.S. government corporations and agencies | $ | 22,186 | $ | — | $ | 22,186 | $ | — | |||||||
Mortgage-backed securities | 108,161 | — | 108,161 | — | |||||||||||
Obligations of states and political subdivisions | 34,656 | — | 34,656 | — | |||||||||||
Total assets at fair value | $ | 165,003 | $ | — | $ | 165,003 | $ | — | |||||||
Liabilities: | |||||||||||||||
Total liabilities at fair value | $ | — | $ | — | $ | — | $ | — | |||||||
Fair Value Measurements at | |||||||||||||||
December 31, 2018 | |||||||||||||||
Using | |||||||||||||||
Balance as of | Quoted Prices in Active Markets for Identical Assets | Significant Other Observable Inputs | Significant Unobservable Inputs | ||||||||||||
December 31, 2018 | (Level 1) | (Level 2) | (Level 3) | ||||||||||||
(in thousands) | |||||||||||||||
Assets: | |||||||||||||||
Securities available for sale | |||||||||||||||
Obligations of U.S. government corporations and agencies | $ | 21,731 | $ | — | $ | 21,731 | $ | — | |||||||
Mortgage-backed securities | 76,483 | — | 76,483 | — | |||||||||||
Obligations of states and political subdivisions | 46,084 | — | 46,084 | — | |||||||||||
Total assets at fair value | $ | 144,298 | $ | — | $ | 144,298 | $ | — | |||||||
Liabilities: | |||||||||||||||
Total liabilities at fair value | $ | — | $ | — | $ | — | $ | — | |||||||
86
The table below presents a reconciliation for all assets measured and recognized at fair value on a recurring basis using significant unobservable inputs (Level 3) for the twelve months ended December 31, 2019 and 2018.
Level 3 Recurring Fair Value Measurements | ||||||
As of and for the Year Ended | ||||||
December 31, 2019 | December 31, 2018 | |||||
(in thousands) | ||||||
Beginning balance | $ | — | $ | 543 | ||
Purchases | — | — | ||||
Sales | — | — | ||||
Issuances | — | — | ||||
Settlements | — | (543 | ) | |||
Total assets at fair value | $ | — | $ | — | ||
Certain financial assets are measured at fair value on a nonrecurring basis in accordance with GAAP. Adjustments to the fair value of these assets usually result from the application of lower of cost or market accounting or write downs of individual assets.
The following describes the valuation techniques used by the Company to measure certain financial and nonfinancial assets recorded at fair value on a nonrecurring basis in the financial statements:
Impaired Loans: Loans are designated as impaired when, in the judgment of management based on current information and events, it is probable that all amounts due according to the contractual terms of the loan agreement will not be collected when due. The measurement of loss associated with impaired loans can be based on the present value of its expected future cash flows discounted at the loan's coupon rate, or at the loans' observable market price or the fair value of the collateral securing the loans, if they are collateral dependent. Collateral may be in the form of real estate or business assets including equipment, inventory, and accounts receivable. The vast majority of the collateral is real estate. The value of real estate collateral is determined utilizing a market valuation approach based on an appraisal conducted by an independent, licensed appraiser using observable market data within the last twelve months (Level 2). However, if the collateral is a house or building in the process of construction or if an appraisal of the property is more than one year old and not solely based on observable market comparables or management determines the fair value of the collateral is further impaired below the appraised value, then a Level 3 valuation is considered to measure the fair value. The value of business equipment is based upon an outside appraisal, of one year or less, if deemed significant, or the net book value on the applicable business’s financial statements if not considered significant using observable market data. Likewise,
values for inventory and accounts receivables collateral are based on financial statement balances or aging reports (Level 3). Impaired loans allocated to the allowance for loan losses are measured at fair value on a nonrecurring basis. Any fair value adjustments are recorded in the period incurred as provision for loan losses on the Consolidated Statements of Income.
Other Real Estate Owned: Assets acquired through, or in lieu of, loan foreclosure are held for sale and are initially recorded at the fair value of the property, less estimated selling costs, establishing a new costs basis. Any write-downs based on the asset’s fair value at the date of acquisition are charged to the allowance for loan losses. Costs of significant property improvements are capitalized, whereas costs relating to holding property are expensed. The portion of interest costs relating to development of real estate is capitalized. Valuations are periodically obtained by management, and any subsequent write-downs are recorded as a charge to operations, if necessary, to reduce the carrying value of a property to the lower of its cost or fair value less cost to sell. The fair value measurement of real estate held in other real estate owned is assessed in the same manner as impaired loans described above. We believe that the fair value component in its valuation follows the provisions of GAAP.
87
The following table displays quantitative information about Level 3 Fair Value Measurements for certain financial assets measured at fair value on a nonrecurring basis for December 31, 2019 and December 31, 2018:
Quantitative information about Level 3 Fair Value Measurements for | |||||||
December 31, 2019 | |||||||
Valuation Technique(s) | Unobservable Input | Range | Weighted Average | ||||
Assets: | |||||||
Impaired loans | Discounted appraised value | Selling cost | 12% | 12% | |||
Impaired loans | Present value of cash flows | Discount rate | 4% - 6% | 5% | |||
Other real estate owned | Discounted appraised value | Discount for current market conditions and selling costs | 6% | 6% | |||
Quantitative information about Level 3 Fair Value Measurements for | |||||||
December 31, 2018 | |||||||
Valuation Technique(s) | Unobservable Input | Range | Weighted Average | ||||
Assets: | |||||||
Impaired loans | Discounted appraised value | Selling cost | 0% - 12% | 8% | |||
Impaired loans | Present value of cash flows | Discount rate | 4% - 6% | 5% | |||
Other real estate owned | Discounted appraised value | Discount for current market conditions and selling costs | 6% | 6% | |||
The following table summarizes the Company’s financial and nonfinancial assets that were measured at fair value on a nonrecurring basis at December 31, 2019 and December 31, 2018:
Carrying value at | |||||||||||||||
December 31, 2019 | |||||||||||||||
Balance as of | Identical Assets | Observable Inputs | Unobservable Inputs | ||||||||||||
December 31, 2019 | (Level 1) | (Level 2) | (Level 3) | ||||||||||||
(in thousands) | |||||||||||||||
Financial Assets: | |||||||||||||||
Impaired loans | $ | 3,075 | $ | — | $ | — | $ | 3,075 | |||||||
Nonfinancial Assets: | |||||||||||||||
Other real estate owned | 183 | — | — | 183 | |||||||||||
Carrying value at | |||||||||||||||
December 31, 2018 | |||||||||||||||
Balance as of | Quoted Prices in Active Markets for Identical Assets | Significant Other Observable Inputs | Significant Unobservable Inputs | ||||||||||||
December 31, 2018 | (Level 1) | (Level 2) | (Level 3) | ||||||||||||
(in thousands) | |||||||||||||||
Financial Assets: | |||||||||||||||
Impaired loans | $ | 3,598 | $ | — | $ | — | $ | 3,598 | |||||||
Nonfinancial Assets: | |||||||||||||||
Other real estate owned | 106 | — | — | 106 | |||||||||||
88
The carrying amount and fair value of the Company’s financial instruments at December 31, 2019 and 2018 were as follows:
Fair Value Measurements at | |||||||||||||||||||
December 31, 2019 | |||||||||||||||||||
Using | |||||||||||||||||||
Carrying Value as of | Quoted Prices in Active Markets for Identical Assets | Significant Other Observable Inputs | Significant Unobservable Inputs | Fair Value as of | |||||||||||||||
December 31, 2019 | (Level 1) | (Level 2) | (Level 3) | December 31, 2019 | |||||||||||||||
(in thousands) | |||||||||||||||||||
Financial Assets: | |||||||||||||||||||
Cash and short-term investments | $ | 33,659 | $ | 33,659 | $ | — | $ | — | $ | 33,659 | |||||||||
Securities | 165,003 | — | 165,003 | — | 165,003 | ||||||||||||||
Restricted investments | 1,197 | — | 1,197 | — | 1,197 | ||||||||||||||
Loans, net | 639,787 | — | — | 633,476 | 633,476 | ||||||||||||||
Bank owned life insurance | 398 | — | 398 | — | 398 | ||||||||||||||
Accrued interest receivable | 2,237 | — | 2,237 | — | 2,237 | ||||||||||||||
Financial Liabilities: | |||||||||||||||||||
Deposits | $ | 771,544 | $ | — | $ | 772,111 | $ | — | $ | 772,111 | |||||||||
Accrued interest payable | 142 | — | 142 | — | 142 | ||||||||||||||
Fair Value Measurements at | |||||||||||||||||||
December 31, 2018 | |||||||||||||||||||
Using | |||||||||||||||||||
Carrying Value as of | Quoted Prices in Active Markets for Identical Assets | Significant Other Observable Inputs | Significant Unobservable Inputs | Fair Value as of | |||||||||||||||
December 31, 2018 | (Level 1) | (Level 2) | (Level 3) | December 31, 2018 | |||||||||||||||
(in thousands) | |||||||||||||||||||
Financial assets: | |||||||||||||||||||
Cash and short-term investments | $ | 18,353 | $ | 18,353 | $ | — | $ | — | $ | 18,353 | |||||||||
Securities | 144,298 | — | 144,298 | — | 144,298 | ||||||||||||||
Restricted investments | 1,170 | — | 1,170 | — | 1,170 | ||||||||||||||
Loans, net | 601,371 | — | — | 592,566 | 592,566 | ||||||||||||||
Bank owned life insurance | 447 | — | 447 | — | 447 | ||||||||||||||
Accrued interest receivable | 2,222 | — | 2,222 | — | 2,222 | ||||||||||||||
Financial liabilities: | |||||||||||||||||||
Deposits | $ | 703,104 | $ | — | $ | 703,323 | $ | — | $ | 703,323 | |||||||||
Federal funds purchased | 1,871 | — | 1,871 | — | 1,871 | ||||||||||||||
Accrued interest payable | 101 | — | 101 | — | 101 | ||||||||||||||
89
The Company assumes interest rate risk (the risk that general interest rate levels will change) during its normal operations. As a result, the fair value of the Company’s financial instruments will change when interest rate levels change and that change may be either favorable or unfavorable to the Company. Management attempts to match maturities of assets and liabilities in order to minimize interest rate risk. However, borrowers with fixed rate obligations are less likely to prepay their principal balance in a rising rate environment and more likely to do so in a falling rate environment. Conversely, depositors who are receiving fixed rate interest payments are more likely to withdraw funds before maturity in a rising rate environment and less likely to do so in a falling rate environment. Management monitors rates and maturities of assets and liabilities and attempts to minimize interest rate risk by adjusting the terms of new loans and deposits and by investing in securities with terms that mitigate the Company’s overall interest rate risk.
NOTE 22. Change in Accumulated Other Comprehensive Income (Loss)
Accumulated other comprehensive income (loss) includes unrealized gains and losses on available for sale securities and changes in benefit obligations and plan assets for the post retirement benefit plan. Changes to accumulated other comprehensive income (loss) are presented net of tax effect as a component of equity. Reclassifications out of accumulated other comprehensive income (loss) are recorded in the Consolidated Statements of Income either as a gain or loss.
Changes to accumulated other comprehensive income (loss) by components are shown in the following tables for the years ended December 31, 2019, 2018, and 2017:
Twelve Months Ended | |||||||||||||||||||||||||||
December 31, | |||||||||||||||||||||||||||
2019 | 2018 | 2017 | |||||||||||||||||||||||||
Unrealized Gains and Losses on Available for Sale Securities | Change in Benefit Obligations and Plan Assets for the Post Retirement Benefit Plan | Total | Unrealized Gains and Losses on Available for Sale Securities | Change in Benefit Obligations and Plan Assets for the Post Retirement Benefit Plan | Total | Unrealized Gains and Losses on Available for Sale Securities | Change in Benefit Obligations and Plan Assets for the Post Retirement Benefit Plan | Total | |||||||||||||||||||
(dollars in thousands) | |||||||||||||||||||||||||||
January 1 | $ | (1,597 | ) | $ | 44 | $ | (1,553 | ) | $ | 266 | $ | 44 | $ | 310 | $ | (63 | ) | $ | 39 | $ | (24 | ) | |||||
Other comprehensive income (loss) before reclassifications | 3,835 | — | 3,835 | (2,341 | ) | — | (2,341 | ) | 422 | 4 | 426 | ||||||||||||||||
Reclassifications from other comprehensive income (loss) | 7 | — | 7 | (17 | ) | — | (17 | ) | 10 | (7 | ) | 3 | |||||||||||||||
Reclassification of stranded tax effects from change in tax rate | — | — | — | — | — | — | 44 | 7 | 51 | ||||||||||||||||||
Tax effect of current period changes | (807 | ) | — | (807 | ) | 495 | — | 495 | (147 | ) | 1 | (146 | ) | ||||||||||||||
Current period changes net of taxes | 3,035 | — | 3,035 | (1,863 | ) | — | (1,863 | ) | 329 | 5 | 334 | ||||||||||||||||
December 31 | $ | 1,438 | $ | 44 | $ | 1,482 | $ | (1,597 | ) | $ | 44 | $ | (1,553 | ) | $ | 266 | $ | 44 | $ | 310 | |||||||
For the years ended December 31, 2019, 2018, and 2017, $(7) thousand, $17 thousand, and $(10) thousand, respectively, was reclassified out of accumulated other comprehensive income and appeared as (Loss) gain on sale of securities in the Consolidated Statement of Income. The tax (benefit) expense related to these reclassifications was $(1) thousand, $4 thousand, and $(4) thousand for the years ended December 31, 2019, 2018, and 2017, respectively. The tax is included in Income Tax Expense in the Consolidated Statements of Income.
For the twelve months ended December 31, 2017, $7 thousand was reclassified out of accumulated other comprehensive income related to the Company's postretirement benefit plan. This reclassification is a component of net periodic benefit cost and was reflected in Salaries and employee benefits in the Consolidated Statements of Income. Tax related to this reclassification was $2 thousand and was included in Income Tax Expense in the Consolidated Statements of Income.
90
NOTE 23. Condensed Financial Information – Parent Company Only
EAGLE FINANCIAL SERVICES , INC.
(Parent Company Only)
Balance Sheets
December 31, 2019 and 2018
(dollars in thousands)
2019 | 2018 | |||||||
Assets | ||||||||
Cash held in subsidiary bank | $ | 989 | $ | 402 | ||||
Loans, net of allowance | 2,939 | 2,896 | ||||||
Investment in subsidiaries, at cost, plus undistributed net income | 92,257 | 84,210 | ||||||
Other assets | 141 | 91 | ||||||
Total assets | $ | 96,326 | $ | 87,599 | ||||
Liabilities and Shareholders’ Equity | ||||||||
Total liabilities | $ | — | $ | — | ||||
Shareholders’ Equity | ||||||||
Preferred stock | $ | — | $ | — | ||||
Common stock | 8,529 | 8,573 | ||||||
Surplus | 11,406 | 11,992 | ||||||
Retained earnings | 74,909 | 68,587 | ||||||
Accumulated other comprehensive income (loss) | 1,482 | (1,553 | ) | |||||
Total shareholders’ equity | $ | 96,326 | $ | 87,599 | ||||
Total liabilities and shareholders’ equity | $ | 96,326 | $ | 87,599 | ||||
91
EAGLE FINANCIAL SERVICES , INC.
(Parent Company Only)
Statements of Income
Years Ended December 31, 2019, 2018, and 2017
(dollars in thousands)
2019 | 2018 | 2017 | ||||||||||
Income | ||||||||||||
Dividends from subsidiary bank | $ | 5,000 | $ | 3,500 | $ | 3,800 | ||||||
Interest and fees on loans | 134 | 115 | 106 | |||||||||
Total income | $ | 5,134 | $ | 3,615 | $ | 3,906 | ||||||
Expenses | ||||||||||||
Other operating expenses | $ | 457 | $ | 272 | $ | 255 | ||||||
Total expenses | $ | 457 | $ | 272 | $ | 255 | ||||||
Income before income tax (benefit) and equity in undistributed earnings of subsidiary bank | $ | 4,677 | $ | 3,343 | $ | 3,651 | ||||||
Income Tax (Benefit) | (70 | ) | (45 | ) | (58 | ) | ||||||
Income before equity in undistributed earnings of subsidiary bank | $ | 4,747 | $ | 3,388 | $ | 3,709 | ||||||
Equity in Undistributed Net Income of Subsidiary Bank | 5,012 | 5,613 | 4,077 | |||||||||
Net income | $ | 9,759 | $ | 9,001 | $ | 7,786 | ||||||
Comprehensive income | $ | 12,794 | $ | 7,138 | $ | 8,069 | ||||||
92
EAGLE FINANCIAL SERVICES , INC.
(Parent Company Only)
Statements of Cash Flows
Years Ended December 31, 2019, 2018, and 2017
(dollars in thousands)
2019 | 2018 | 2017 | ||||||||||
Cash Flows from Operating Activities | ||||||||||||
Net Income | $ | 9,759 | $ | 9,001 | $ | 7,786 | ||||||
Adjustments to reconcile net income to net cash provided by operating activities | ||||||||||||
Provision for (Recovery of) loan losses | — | 2 | (2 | ) | ||||||||
Stock-based compensation expense | 562 | 518 | 382 | |||||||||
Undistributed earnings of subsidiary bank | (5,012 | ) | (5,613 | ) | (4,077 | ) | ||||||
Changes in assets and liabilities: | ||||||||||||
(Increase) decrease in other assets | (50 | ) | 15 | (62 | ) | |||||||
Net cash provided by operating activities | $ | 5,259 | $ | 3,923 | $ | 4,027 | ||||||
Cash Flows from Investing Activities | ||||||||||||
Net (increase) decrease in loans | $ | (43 | ) | $ | (73 | ) | $ | 58 | ||||
Net cash (used in) provided by investing activities | $ | (43 | ) | $ | (73 | ) | $ | 58 | ||||
Cash Flows from Financing Activities | ||||||||||||
Cash dividends paid | $ | (2,996 | ) | $ | (2,776 | ) | $ | (2,652 | ) | |||
Issuance of common stock, employee benefit plan | 138 | 163 | 166 | |||||||||
Retirement of common stock | (1,771 | ) | (1,261 | ) | (1,564 | ) | ||||||
Net cash (used in) financing activities | $ | (4,629 | ) | $ | (3,874 | ) | $ | (4,050 | ) | |||
Increase (decrease) in cash | $ | 587 | $ | (24 | ) | $ | 35 | |||||
Cash | ||||||||||||
Beginning | $ | 402 | $ | 426 | $ | 391 | ||||||
Ending | $ | 989 | $ | 402 | $ | 426 | ||||||
93
NOTE 24. Other Real Estate Owned
The following table is a summary of other real estate owned (OREO) activity for the twelve months ended December 31, 2019 and 2018:
Year Ended | Year Ended | ||||||
December 31, | December 31, | ||||||
2019 | 2018 | ||||||
Balance, beginning | $ | 106 | $ | 106 | |||
Net loans transferred to OREO | 1,151 | 2,799 | |||||
Gain on foreclosure | 192 | — | |||||
Sales | (1,266 | ) | (2,799 | ) | |||
Valuation adjustments | — | — | |||||
Balance, ending | $ | 183 | $ | 106 | |||
The major classifications of other real estate owned in the consolidated balance sheets at December 31, 2019 and 2018 were as follows:
As of | |||||||
December 31, 2019 | December 31, 2018 | ||||||
(in thousands) | |||||||
Construction and Farmland | $ | — | $ | 106 | |||
Residential Real Estate | 183 | — | |||||
Commercial Real Estate | — | — | |||||
Subtotal | $ | 183 | $ | 106 | |||
Less valuation allowance | — | — | |||||
Total | $ | 183 | $ | 106 | |||
There were two consumer mortgage loans totaling $334 thousand collateralized by residential real estate in the process of foreclosure at December 31, 2019. There was one consumer mortgage loan totaling $71 thousand collateralized by residential real estate in the process of foreclosure at December 31, 2018.
NOTE 25. Qualified Affordable Housing Project Investments
The Company invests in qualified affordable housing projects. The general purpose of these investments is to encourage and assist participants in investing in low-income residential rental properties located in the Commonwealth of Virginia, develop and implement strategies to maintain projects as low-income housing, provide tax credits and other tax benefits to investors, and to preserve and protect project assets.
At December 31, 2019 and 2018, the balance of the investment for qualified affordable housing projects was $3.0 million and $3.3 million, respectively. These balances are reflected in Other assets on the Consolidated Balance Sheets. Total unfunded commitments related to the investments in qualified affordable housing projects totaled $798 thousand and $1.9 million at December 31, 2019 and 2018. These balances are reflected in Other liabilities on the Consolidated Balance Sheets. The Company expects to fulfill these commitments by December 31, 2023, in accordance with the terms of the individual agreements.
During the twelve months ended December 31, 2019 and 2018, the Company recognized amortization expense of $229 thousand and $196 thousand, respectively. The amortization expense was included in Other operating expenses on the Consolidated Statements of Income.
Total estimated credits to be received during 2019 are $379 thousand based on the most recent quarterly estimates received from the funds. Total tax credits and other tax benefits recognized during 2019 and 2018 were $415 thousand and $324 thousand, respectively.
94
Item 9. Changes in and Disagreements with Accountants on Accounting and Financial Disclosure
None.
Item 9A. Controls and Procedures
Disclosure Controls and Procedures
The Company, under the supervision and with the participation of management, including the Company’s Chief Executive Officer and Chief Financial Officer, has evaluated the effectiveness of the design and operation of its disclosure controls and procedures as of the end of the period covered by this Annual Report on Form 10-K. Based on that evaluation, the Chief Executive Officer and Chief Financial Officer have concluded that the Company’s disclosure controls and procedures were effective as of December 31, 2019 to ensure that information required to be disclosed by the Company in reports that it files or submits under the Securities Exchange Act of 1934 is recorded, processed, summarized and reported within the time periods specified in Securities and Exchange Commission rules and forms and that such information is accumulated and communicated to the Company's management, including the Chief Executive Officer and Chief Financial Officer, as appropriate to allow timely decisions regarding required disclosure.
Internal Control over Financial Reporting
Management is also responsible for establishing and maintaining adequate internal control over the Company’s financial reporting (as defined in Rule 13a-15(f) promulgated under the Securities Exchange Act of 1934, as amended). Pursuant to Section 404 of the Sarbanes-Oxley Act of 2002, management has conducted an assessment of the design and effectiveness of its internal controls over financial reporting based on criteria established in Internal Control – Integrated Framework issued by the Committee of Sponsoring Organizations of the Treadway Commission (“COSO”) in 2013.
Management maintains a comprehensive system of internal control to provide reasonable assurance regarding the reliability of financial reporting and the preparation of financial statements for external purposes in accordance with generally accepted accounting principles. The system of internal control provides for appropriate division of responsibility and is documented by written policies and procedures that are communicated to employees. Those policies and procedures: 1) pertain to the maintenance of records that in reasonable detail accurately and fairly reflect the transactions and disposition of the assets of the Company, 2) provide reasonable assurance that receipts and expenditures of the Company are being made only in accordance with authorizations of management and directors, 3) provide reasonable assurance regarding prevention or timely detection of unauthorized acquisition, use or disposition of the Company’s assets that could have a material effect on the financial statements. Management recognizes that there are inherent limitations in the effectiveness of any internal control system, including the possibility of human error and the circumvention or overriding of internal controls. Accordingly, even effective internal control over financial reporting can provide only reasonable assurance with respect to financial statement preparation. Changes in conditions will also impact the internal control effectiveness over time. Eagle Financial Services, Inc. and subsidiaries maintains an internal auditing program, under the supervision of the Audit Committee of the Board of Directors, which independently assesses the effectiveness of the system of internal control and recommends possible improvements.
Under the supervision and with the participation of the Company’s management, including its Chief Executive Officer and Chief Financial Officer, the Company has evaluated the effectiveness of its internal control over financial reporting as of December 31, 2019, using the 2013 Internal Control – Integrated Framework issued by the Committee of Sponsoring Organizations of the Treadway Commission. Based upon this evaluation, the Chief Executive Officer and the Chief Financial Officer have concluded as of December 31, 2019, the Company’s internal control over financial reporting is adequate and effective and meets the criteria of the Internal Control – Integrated Framework.
Management’s assessment did not determine any material weaknesses within the Company’s internal control structure. There were no changes in the Company’s internal control over financial reporting during the Company’s quarter ended December 31, 2019 that have materially affected, or are reasonably likely to materially affect, the Company’s internal control over financial reporting.
The effectiveness of the Company's internal control over financial reporting as of December 31, 2019 has been audited by Yount, Hyde& Barbour, P.C., the independent registered public accounting firm which also audited the Company's consolidated financial statements included in this Annual Report on Form 10-K. Yount, Hyde & Barbour's attestation report on the Company's internal control over financial reporting is included in Item 8 "Financial Statements and Supplementary Data" of this Form 10-K.
95
Item 9B. Other Information
None.
PART III
Item 10. Directors, Executives Officers and Corporate Governance
The information required by Part III, Item 10. is incorporated herein by reference to the Proxy Statement for the 2020 Annual Meeting of Shareholders to be held May 19, 2020.
Item 11. Executive Compensation
The information required by Part III, Item 11. is incorporated herein by reference to the Proxy Statement for the 2020 Annual Meeting of Shareholders to be held May 19, 2020.
Item 12. Security Ownership of Certain Beneficial Owners and Management and Related Stockholder Matters
The information required by Part III, Item 12. is incorporated herein by reference to the Proxy Statement for the 2020 Annual Meeting of Shareholders to be held May 19, 2020.
Item 13. Certain Relationships and Related Transactions, and Director Independence
The information required by Part III, Item 13. is incorporated herein by reference to the Proxy Statement for the 2020 Annual Meeting of Shareholders to be held May 19, 2020.
Item 14. Principal Accounting Fees and Services
The information required by Part III, Item 14. is incorporated herein by reference to the Proxy Statement for the 2020 Annual Meeting of Shareholders to be held May 19, 2020.
PART IV
Item 15. Exhibits, Financial Statement Schedules
(a)(1) Financial Statements
The financial statements are filed as part of this Annual Report on Form 10-K within Item 8.
(a)(2) Financial Statement Schedules
All financial statement schedules are omitted since they are not required, or are not applicable, or the required information is given in the financial statements or notes thereto.
(a)(3) Exhibits
The following exhibits, as applicable, are filed with this Form 10-K or incorporated by reference to previous filings.
96
Exhibit No. | Description | ||
Articles of Incorporation of the Company, restated in electronic format only as of March 1, 2006 (incorporated herein by reference to Exhibit 3.1 of the Company’s Current Report on Form 8-K dated March 1, 2006). | |||
3.2 | Bylaws of the Company (incorporated herein by reference to Exhibit 3.2 of the Company’s Registration Statement on Form S-4, Registration No. 33-43681). | ||
Description of Securities | |||
10.1 | Description of Executive Supplemental Income Plan (incorporated by reference to Exhibit 10.1 of the Company’s Annual Report on Form 10-K for the year ended December 31, 1996).* | ||
Amended and Restated Employment Agreement of Brandon C. Lorey.* | |||
Eagle Financial Services, Inc. Stock Incentive Plan (incorporated herein by reference to Exhibit 4.3 of the Company’s Registration Statement on Form S-8, Registration No. 333-118319).* | |||
Eagle Financial Services, Inc. 2014 Stock Incentive Plan (incorporated by reference to Exhibit A of the Proxy Statement for the Annual Meeting of Shareholders held on May 21, 2014, filed on April 21, 2014). | |||
Amended and Restated Employment Agreement of John E. Hudson. * | |||
Amended and Restated Employment Agreement of Kaley P. Crosen.* | |||
Amended and Restated Employment Agreement of Kathleen J. Chappell (incorporated herein by reference to Exhibit 10.1 of the Company’s Current Report on Form 8-K filed on January 16, 2020).* | |||
Eagle Financial Services, Inc. Dividend Investment Plan (incorporated herein by reference to to the Company’s Registration Statement on Form S-3, File No. 333-209460, filed on February 10, 2016).* | |||
Amended and Restated Employment Agreement of Carl A. Esterhay.* | |||
Amended and Restated Employment Agreement of Joseph T. Zmitrovich.* | |||
Separation Agreement and Release, dated October 29, 2019, of James W. McCarty, Jr. (incorporated herein by reference to Exhibit 10.2 of the Company's Quarterly Report on Form 10-Q for the period ended September 30, 2019). | |||
Subsidiary of the Company. | |||
Consent of Yount, Hyde & Barbour, P.C. | |||
Certification by Chief Executive Officer pursuant to Rule 13a-14(a) under the Securities Exchange Act of 1934, as adopted pursuant to Section 302 of the Sarbanes-Oxley Act of 2002. | |||
Certification by Chief Financial Officer pursuant to Rule 13a-14(a) under the Securities Exchange Act of 1934, as adopted pursuant to Section 302 of the Sarbanes-Oxley Act of 2002. | |||
97
Certification by Chief Executive Officer and Chief Financial Officer pursuant to 18 U.S.C. Section 1350, as adopted pursuant to Section 906 of the Sarbanes-Oxley Act of 2002. | |||
101 | The following materials from the Eagle Financial Service, Inc. Annual Report on Form 10-K for the year ended December 31, 2019 formatted in Extensible Business Reporting Language (XBRL): (i) Consolidated Balance Sheets, (ii) Consolidated Statements of Income, (iii) Consolidated Statements of Comprehensive Income, (iv) Consolidated Statements of Changes in Shareholders” Equity, (v) Consolidated Statements of Cash Flows and (vi) notes to Consolidated Financial Statements. | ||
* | Management contracts and compensatory plans and arrangements. |
(b) | See Item 15(a)(3) above. |
(c) | See Item 15(a)(2) above. |
Item 16. Form 10-K Summary
Not applicable.
98
SIGNATURES
Pursuant to the requirements of Section 13 or 15(d) of the Securities Exchange Act of 1934, the registrant has duly caused this report to be signed on its behalf by the undersigned, thereunto duly authorized.
Eagle Financial Services, Inc. | ||
By: | /s/ BRANDON C. LOREY | |
Brandon C. Lorey | ||
President and Chief Executive Officer | ||
Date: March 13, 2020
Pursuant to the requirements of the Securities Exchange Act of 1934, this report has been signed below by the following persons on behalf of the registrant and in the capacities indicated on March 13, 2020.
99
Signature | Title | |
/s/ BRANDON C. LOREY | President, Chief Executive Officer, and Director (principal executive officer) | |
Brandon C. Lorey | ||
/s/ KATHLEEN J. CHAPPELL | Executive Vice President and Chief Financial Officer (principal financial and accounting officer) | |
Kathleen J. Chappell | ||
/s/ THOMAS T. GILPIN | Chairman of the Board and Director | |
Thomas T. Gilpin | ||
/s/ ROBERT W. SMALLEY, JR. | Vice Chairman of the Board and Director | |
Robert W. Smalley, Jr. | ||
/s/ DEBORAH E. ADDO | Director | |
Deborah E. Addo | ||
/s/ THOMAS T. BYRD | Director | |
Thomas T. Byrd | ||
/s/ CARY R. CLAYTOR | Director | |
Cary R. Claytor | ||
/s/ MARY BRUCE GLAIZE | Director | |
Mary Bruce Glaize | ||
/s/ SCOTT HAMBERGER | Director | |
Scott Hamberger | ||
/s/ JOHN R. MILLESON | Director | |
John R. Milleson | ||
/s/ DOUGLAS C. RINKER | Director | |
Douglas C. Rinker | ||
/s/ ROBERT E. SEVILA | Director | |
Robert E. Sevila | ||
/s/ JOHN D. STOKELY, JR. | Director | |
John D. Stokely, Jr. | ||
/s/ RANDALL G. VINSON | Director | |
Randall G. Vinson | ||
/s/ JAMES R. WILKINS, JR | Director | |
James R. Wilkins, Jr. | ||
100