Attached files
| file | filename |
|---|---|
| EX-23.1 - EXHIBIT 23.1 - EAGLE FINANCIAL SERVICES INC | dex231.htm |
| EX-31.2 - EXHIBIT 31.2 - EAGLE FINANCIAL SERVICES INC | dex312.htm |
| EX-21.1 - EXHIBIT 21.1 - EAGLE FINANCIAL SERVICES INC | dex211.htm |
| EX-31.1 - EXHIBIT 31.1 - EAGLE FINANCIAL SERVICES INC | dex311.htm |
| EX-32.1 - EXHIBIT 32.1 - EAGLE FINANCIAL SERVICES INC | dex321.htm |
Table of Contents
UNITED STATES
SECURITIES AND EXCHANGE COMMISSION
WASHINGTON, D.C. 20549
FORM 10-K
| ANNUAL REPORT PURSUANT TO SECTION 13 OR 15(d) OF THE SECURITIES EXCHANGE ACT OF 1934 |
For the fiscal year ended December 31, 2010
Commission file number: 0-20146
EAGLE FINANCIAL SERVICES, INC.
(Exact name of registrant as specified in its charter)
| Virginia | 54-1601306 | |
| (State or other jurisdiction of incorporation or organization) |
(I.R.S. Employer Identification No.) |
| 2 East Main Street P.O. Box 391 Berryville, Virginia |
22611 | |||
| (Address of principal executive offices) | (Zip Code) | |||
(540) 955-2510
(Registrant’s telephone number, including area code)
Securities registered pursuant to Section 12(b) of the Act: None
Securities registered pursuant to Section 12(g) of the Act:
Common Stock, Par Value $2.50
(Title of class)
Indicate by check mark if the registrant is a well-known seasoned issuer, as defined in Rule 405 of the Securities Act. Yes ¨ No x
Indicate by check mark if the registrant is not required to file reports pursuant to Section 13 or Section 15(d) of the Act. Yes ¨ No x
Indicate by check mark whether the registrant (1) has filed all reports required to be filed by Section 13 or 15(d) of the Securities Exchange Act of 1934 during the preceding 12 months (or for such shorter period that the registrant was required to file such reports), and (2) has been subject to such filing requirements for the past 90 days. Yes x No ¨
Indicate by check mark whether the registrant has submitted electronically and posted on its corporate Web site, if any, every Interactive Data File required to be submitted and posted pursuant to Rule 405 of Regulation S-T during the preceding 12 months (or for such shorter period that the registrant was required to submit and post such files). Yes ¨ No ¨
Indicate by check mark if disclosure of delinquent filers pursuant to Item 405 of Regulation S-K is not contained herein, and will not be contained, to the best of the registrant’s knowledge, in definitive proxy or information statements incorporated by reference in Part III of this Form 10-K or any amendment to this Form 10-K. ¨
Indicate by check mark whether the registrant is a large accelerated filer, an accelerated filer, a non-accelerated filer or a smaller reporting company. See definitions of “large accelerated filer,” “accelerated filer” and “smaller reporting company” in Rule 12b-2 of the Exchange Act.
| Large accelerated filer | ¨ | Accelerated filer | ¨ | |||
| Non-accelerated filer | ¨ (Do not check if a smaller reporting company) | Smaller reporting company | x | |||
Indicate by check mark whether the registrant is a shell company (as defined in Rule 12b-2 of the Act). Yes ¨ No x
The aggregate market value of the voting common equity held by non-affiliates of the registrant at June 30, 2010 was $43,212,592.
The number of shares of the registrant’s Common Stock outstanding at March 1, 2011 was 3,279,940.
DOCUMENTS INCORPORATED BY REFERENCE
Portions of the registrant’s Proxy Statement for the 2011 Annual Meeting of Shareholders are incorporated by reference into Part III.
Table of Contents
EAGLE FINANCIAL SERVICES, INC.
| PART I |
||||||
| Item 1. |
3 | |||||
| Item 1A. |
9 | |||||
| Item 1B. |
11 | |||||
| Item 2. |
11 | |||||
| Item 3. |
12 | |||||
| Item 4. |
12 | |||||
| PART II |
||||||
| Item 5. |
13 | |||||
| Item 6. |
15 | |||||
| Item 7. |
Management’s Discussion and Analysis of Financial Condition and Results of Operations |
16 | ||||
| Item 7A. |
31 | |||||
| Item 8. |
32 | |||||
| Item 9. |
Changes in and Disagreements with Accountants on Accounting and Financial Disclosure |
69 | ||||
| Item 9A. |
69 | |||||
| Item 9B. |
69 | |||||
| PART III |
||||||
| Item 10. |
70 | |||||
| Item 11. |
70 | |||||
| Item 12. |
Security Ownership of Certain Beneficial Owners and Management and Related Stockholder Matters |
70 | ||||
| Item 13. |
Certain Relationships and Related Transactions, and Director Independence |
70 | ||||
| Item 14. |
70 | |||||
| PART IV |
||||||
| Item 15. |
71 | |||||
2
Table of Contents
PART I
| Item 1. | Business |
General
Eagle Financial Services, Inc. (the “Company”) is a bank holding company that was incorporated in 1991. The company is headquartered in Berryville, Virginia and conducts its operations through its subsidiary, Bank of Clarke County (the “Bank”). The Bank is chartered under Virginia law.
The Bank has ten full-service branches and one drive-through only facility. The Bank’s main office is located at 2 East Main Street in Berryville, Virginia. The Bank opened for business on April 1, 1881. The Bank has offices located in Clarke County, Frederick County, and the City of Winchester. This market area is located in northwestern Virginia. In 2011, the Bank will open its eleventh branch servicing Loudoun County. With the addition of this branch, the Bank’s market area will increase to approximately 430,000 based on the 2010 Census.
The Bank offers a wide range of retail and commercial banking services, including demand, savings and time deposits and consumer, mortgage and commercial loans. Branded credit cards are offered through a larger financial institution and the Bank also has a merchant services program which allows its commercial customers to accept credit card payments. The Bank has fourteen ATM locations in its trade area and issues both ATM cards and Debit cards to deposit customers. These cards can be used to withdraw cash at most ATM’s through the Bank’s membership in both regional and national networks. These cards can also be used to make purchases at retailers who accept transactions through the same regional and national networks. The Bank offers telephone banking, internet banking, and mobile banking to its customers. Internet banking also offers online bill payment to consumer and commercial customers. The Bank offers other commercial deposit account services such as ACH origination and remote deposit capture.
Eagle Investment Group (“EIG”) offers both a trust department and investment services. The trust services division of EIG offers a full range of personal and retirement plan services, which include serving as agent for bill paying and custody of assets, as investment manager with full authority or advisor, as trustee or co-trustee for trusts under will or under agreement, as trustee of life insurance trusts, as guardian or committee, as agent under a power of attorney, as executor or co-executor for estates, as custodian or investment advisor for individual retirement plans, and as trustee or trust advisor for corporate retirement plans such as profit sharing and 401(k) plans. The brokerage division of EIG offers a full range of investment services, which include tax-deferred annuities, IRAs and rollovers, mutual funds, retirement plans, 529 college savings plans, life insurance, long term care insurance, fixed income investing, brokerage CDs, and full service or discount brokerage services. Non-deposit investment products are offered through a third party provider.
In addition to the Bank, the Company has a wholly owned subsidiary, Eagle Financial Statutory Trust II, which was formed in connection with the issuance of $7,000,000 in trust preferred securities in 2007. During the second quarter of 2007, the outstanding capital securities issued through Eagle Financial Statutory Trust I were redeemed and this subsidiary was subsequently dissolved. The Company is also a general partner in a low income housing project. The Company’s subsidiary, Bank of Clarke County, is a partner in Bankers Title Shenandoah, LLC, which sells title insurance, and is an investor in Virginia Bankers Insurance Center, LLC, which serves as the broker for insurance sales through its member banks.
Employees
The Company, including the Bank, had 48 officers, 98 other full-time and 22 part-time employees (or 155 full-time equivalent employees) at December 31, 2010. None of the Company’s employees are represented by a union or covered under a collective bargaining agreement. The Company considers relations with its employees to be excellent.
Securities and Exchange Commission Filings
The Company maintains an internet website at www.bankofclarke.com. Shareholders of the Company and the public may access, free of charge, the Company’s periodic and current reports (including annual reports on Form 10-K, quarterly reports on Form 10-Q and current reports on Form 8-K, and any amendments to those reports) filed with or furnished to the Securities and Exchange Commission, through the “Investor Relations” section of the Company’s website. The reports are made available on this website as soon as practicable following the filing of the reports with the SEC. The information is free of charge and may be reviewed, downloaded and printed from the website at any time.
Competition
There is significant competition for both loans and deposits within the Company’s trade area. Competition for loans comes from other commercial banks, savings banks, credit unions, mortgage brokers, finance companies, insurance companies, and other institutional lenders. Competition for deposits comes from other commercial banks, savings banks, credit unions, brokerage firms, and other financial institutions. Based on total deposits at June 30, 2010 as reported to the FDIC, the Company has 19.7% of the total deposits in its market area, which is the second largest share behind BB&T.
3
Table of Contents
Supervision and Regulation
General. As a bank holding company, the Company is subject to regulation under the Bank Holding Company Act of 1956, as amended, and the examination and reporting requirements of the Board of Governors of the Federal Reserve System. As a state-chartered commercial bank, the Bank is subject to regulation, supervision and examination by the Virginia State Corporation Commission’s Bureau of Financial Institutions. It is also subject to regulation, supervision and examination by the Federal Reserve Board. Other federal and state laws, including various consumer and compliance laws, govern the activities of the Bank, the investments that it makes and the aggregate amount of loans that it may grant to one borrower.
The following sections summarize the significant federal and state laws applicable to the Company and its subsidiaries. To the extent that statutory or regulatory provisions are described, the description is qualified in its entirety by reference to that particular statutory or regulatory provision.
The Bank Holding Company Act. Under the Bank Holding Company Act, the Company is subject to periodic examination by the Federal Reserve and is required to file periodic reports regarding its operations and any additional information that the Federal Reserve may require. Activities at the bank holding company level are limited to the following:
| • | banking, managing or controlling banks; |
| • | furnishing services to or performing services for its subsidiaries; and |
| • | engaging in other activities that the Federal Reserve has determined by regulation or order to be so closely related to banking as to be a proper incident to these activities. |
Some of the activities that the Federal Reserve Board has determined by regulation to be closely related to the business of a bank holding company include making or servicing loans and specific types of leases, performing specific data processing services and acting in some circumstances as a fiduciary or investment or financial adviser.
With some limited exceptions, the Bank Holding Company Act requires every bank holding company to obtain the prior approval of the Federal Reserve before:
| • | acquiring substantially all the assets of any bank; |
| • | acquiring direct or indirect ownership or control of any voting shares of any bank if after such acquisition it would own or control more than 5% of the voting shares of such bank (unless it already owns or controls the majority of such shares); or |
| • | merging or consolidating with another bank holding company. |
In addition, and subject to some exceptions, the Bank Holding Company Act and the Change in Bank Control Act, together with their regulations, require Federal Reserve approval prior to any person or company acquiring “control” of a bank holding company. Control is conclusively presumed to exist if an individual or company acquires 25% or more of any class of voting securities of the bank holding company. Control is rebuttably presumed to exist if a person acquires 10% or more, but less than 25%, of any class of voting securities and either has registered securities under Section 12 of the Securities Exchange Act of 1934 or no other person owns a greater percentage of that class of voting securities immediately after the transaction. The regulations provide a procedure for challenging this rebuttable control presumption.
In November 1999, Congress enacted the Gramm-Leach-Bliley Act (“GLBA”), which made substantial revisions to the statutory restrictions separating banking activities from other financial activities. Under the GLBA, bank holding companies that are well-capitalized and well-managed and meet other conditions can elect to become “financial holding companies.” As financial holding companies, they and their subsidiaries are permitted to acquire or engage in previously impermissible activities such as insurance underwriting, securities underwriting and distribution, travel agency activities, insurance agency activities, merchant banking and other activities that the Federal Reserve determines to be financial in nature or complementary to these activities. Financial holding companies continue to be subject to the overall oversight and supervision of the Federal Reserve, but the GLBA applies the concept of functional regulation to the activities conducted by subsidiaries. For example, insurance activities would be subject to supervision and regulation by state insurance authorities. Although the Company has not elected to become a financial holding company in order to exercise the broader activity powers provided by the GLBA, the Company may elect do so in the future.
Payment of Dividends. The Company is a legal entity separate and distinct from the Bank. The majority of the Company’s revenues are from dividends paid to the Company by the Bank. The Bank is subject to laws and regulations that limit the amount of dividends it can pay. In addition, both the Company and the Bank are subject to various regulatory restrictions relating to the payment of dividends, including requirements to maintain capital at or above regulatory minimums. Banking regulators have indicated that banking organizations should generally pay dividends only if the organization’s current earnings are sufficient to fully fund the dividends and the prospective rate of earnings retention appears consistent with the organization’s capital needs, asset quality and overall financial condition. The Company does not expect that any of these laws, regulations or policies will materially affect the ability of the Bank to pay dividends. During the year ended December 31, 2010, the Bank paid $1,500,000 in dividends payable to the Company.
The FDIC has the general authority to limit the dividends paid by insured banks if the payment is deemed an unsafe and unsound practice. The FDIC has indicated that paying dividends that deplete a bank’s capital base to an inadequate level would be an unsound and unsafe banking practice.
Insurance of Accounts, Assessments and Regulation by the FDIC. The Bank’s deposits are insured up to applicable limits by the DIF of the FDIC. The FDIC amended its risk-based assessment system in 2007 to implement authority granted by the Federal Deposit Insurance Reform Act of 2005 (FDIRA). Under the revised system, insured institutions are assigned to one of four risk categories based on supervisory evaluations, regulatory capital levels and certain other factors. Effective April 1, 2011, the assessment base is an institution’s average consolidated total assets less average
4
Table of Contents
tangible equity, and the initial base assessment rates will be between 5 and 35 basis points depending on the institutions risk category, and subject to potential adjustment based on certain long-term unsecured debt and brokered deposits held by the institution.
In July 2010, the Dodd-Frank Wall Street Reform and Consumer Protection Act permanently raised the standard maximum deposit insurance amount to $250,000. The legislation did not change coverage for retirement accounts, which continues to be $250,000. Beginning December 31, 2010 through December 31, 2012, all deposits held in non-interest bearing transaction accounts at FDIC insured institutions will be fully insured regardless of the amount in the account. This was not charged a special assessment by the FDIC.
Capital Requirements. The Federal Reserve Board has issued risk-based and leverage capital guidelines applicable to banking organizations that it supervises. Under the risk-based capital requirements, the Company and the Bank are each generally required to maintain a minimum ratio of total capital to risk-weighted assets of 8%. At least half of the total capital must be composed of “Tier 1 Capital”, which is defined as common equity, retained earnings and qualifying perpetual preferred stock, less certain intangibles. The remainder may consist of “Tier 2 Capital”, which is defined as specific subordinated debt, some hybrid capital instruments and other qualifying preferred stock and a limited amount of the loan loss allowance. In addition, each of the federal banking regulatory agencies has established minimum leverage capital requirements for banking organizations. Under these requirements, banking organizations must maintain a minimum ratio of Tier 1 capital to adjusted average quarterly assets equal to 3% to 5%, subject to federal bank regulatory evaluation of an organization’s overall safety and soundness. In sum, the capital measures used by the federal banking regulators are as follows:
| • | the Total Capital ratio, which is the total of Tier 1 Capital and Tier 2 Capital; |
| • | the Tier 1 Capital ratio; and |
| • | the leverage ratio. |
Under these regulations, a bank will be classified as follows:
| • | “well capitalized” if it has a Total Capital ratio of 10% or greater, a Tier 1 Capital ratio of 6% or greater, and is not subject to any written agreement, order, capital directive, or prompt corrective action directive by a federal bank regulatory agency to meet and maintain a specific capital level for any capital measure; |
| • | “adequately capitalized” if it has a Total Capital ratio of 8% or greater, a Tier 1 Capital ratio of 4% or greater, and a leverage ratio of 4% or greater – or 3% in certain circumstances – and is not well capitalized; |
| • | “undercapitalized” if it has a Total Capital ratio of less than 8%, a Tier 1 Capital ratio of less than 4% - or 3% in certain circumstances; |
| • | “significantly undercapitalized” if it has a Total Capital ratio of less than 6%, a Tier 1 Capital ratio of less than 3%, or a leverage ratio of less than 3%; or |
| • | “critically undercapitalized” if its tangible equity is equal to or less than 2% of average quarterly tangible assets. |
The risk-based capital standards of the Federal Reserve Board explicitly identify concentrations of credit risk and the risk arising from non-traditional activities, as well as an institution’s ability to manage these risks, as important factors to be taken into account by the agency in assessing an institution’s overall capital adequacy. The capital guidelines also provide that an institution’s exposure to a decline in the economic value of its capital due to changes in interest rates be considered by the agency as a factor in evaluating a banking organization’s capital adequacy.
The Dodd-Frank Act contains a number of provisions dealing with capital adequacy of insured depository institutions and their holding companies, which may result in more stringent capital requirements. Under the Collins Amendment to the Dodd-Frank Act, federal regulators have been directed to establish minimum leverage and risk-based capital requirements for, among other entities, banks and bank holding companies on a consolidated basis. These minimum requirements can’t be less than the generally applicable leverage and risk-based capital requirements established for insured depository institutions nor quantitatively lower than the leverage and risk-based capital requirements established for insured depository institutions that were in effect as of July 21, 2010. These requirements in effect create capital level floors for bank holding companies similar to those in place currently for insured depository institutions. The Collins Amendment also excludes trust preferred securities issued after May 19, 2010 from being included in Tier 1 capital unless the issuing company is a bank holding company with less than $500 million in total assets. Trust preferred securities issued prior to that date will continue to count as Tier 1 capital for bank holding companies with less than $15 billion in total assets, and such securities will be phased out of Tier 1 capital treatment for bank holding companies with over $15 billion in total assets over a three-year period beginning in 2013. Accordingly, the Company’s trust preferred securities will continue to qualify as Tier 1 capital.
The FDIC may take various corrective actions against any undercapitalized bank and any bank that fails to submit an acceptable capital restoration plan or fails to implement a plan acceptable to the FDIC. These powers include, but are not limited to, requiring the institution to be recapitalized, prohibiting asset growth, restricting interest rates paid, requiring prior approval of capital distributions by any bank holding company that controls the institution, requiring divestiture by the institution of its subsidiaries or by the holding company of the institution itself, requiring new election of directors, and requiring the dismissal of directors and officers. The Bank presently maintains sufficient capital to remain well capitalized under these guidelines.
Other Safety and Soundness Regulations. There are a number of obligations and restrictions imposed on bank holding companies and their depository institution subsidiaries by federal law and regulatory policy that are designed to reduce potential loss exposure to the depositors of such depository institutions and to the FDIC insurance funds in the event that the depository institution is insolvent or is in danger of becoming insolvent. For example, under the requirements of the Federal Reserve Board with respect to bank holding company operations, a bank holding company is required to serve as a source of financial strength to its subsidiary depository institutions and to commit resources to support such institutions in circumstances where it might not do so otherwise. In addition, the “cross-guarantee” provisions of federal law require insured depository institutions under common control to reimburse the FDIC for any loss suffered or reasonably anticipated by the FDIC as a result of the insolvency of commonly controlled insured depository institutions or for any assistance provided by the FDIC to commonly controlled insured depository institutions in danger of failure. The FDIC may decline to enforce the cross-guarantee provision if it determines that a waiver is in the best interests of the deposit insurance funds. The FDIC’s claim for reimbursement under the cross guarantee provisions is superior to claims of shareholders of the insured
5
Table of Contents
depository institution or its holding company but is subordinate to claims of depositors, secured creditors and nonaffiliated holders of subordinated debt of the commonly controlled insured depository institutions.
Interstate Banking and Branching. Current federal law authorizes interstate acquisitions of banks and bank holding companies without geographic limitation. Effective June 1, 1997, a bank headquartered in one state is authorized to merge with a bank headquartered in another state, as long as neither of the states had opted out of such interstate merger authority prior to such date. After a bank has established branches in a state through an interstate merger transaction, the bank may establish and acquire additional branches at any location in the state where a bank headquartered in that state could have established or acquired branches under applicable federal or state law.
Monetary Policy. The commercial banking business is affected not only by general economic conditions but also by the monetary policies of the Federal Reserve Board. The instruments of monetary policy employed by the Federal Reserve Board include open market operations in United States government securities, changes in the discount rate on member bank borrowing and changes in reserve requirements against deposits held by all federally insured banks. The Federal Reserve Board’s monetary policies have had a significant effect on the operating results of commercial banks in the past and are expected to continue to do so in the future. In view of changing conditions in the national and international economy and in the money markets, as well as the effect of actions by monetary fiscal authorities, including the Federal Reserve Board, no prediction can be made as to possible future changes in interest rates, deposit levels, loan demand or the business and earnings of the Bank.
Federal Reserve System. In 1980, Congress enacted legislation that imposed reserve requirements on all depository institutions that maintain transaction accounts or nonpersonal time deposits. NOW accounts, money market deposit accounts and other types of accounts that permit payments or transfers to third parties fall within the definition of transaction accounts and are subject to these reserve requirements, as are any nonpersonal time deposits at an institution.
The reserve percentages are subject to adjustment by the Federal Reserve Board. Because required reserves must be maintained in the form of vault cash or in a non-interest-bearing account at, or on behalf of, a Federal Reserve Bank, the effect of the reserve requirement is to reduce the amount of the institution’s interest-earning assets.
Transactions with Affiliates. Transactions between banks and their affiliates are governed by Sections 23A and 23B of the Federal Reserve Act. An affiliate of a bank is any bank or entity that controls, is controlled by or is under common control with such bank. Generally, Sections 23A and 23B (i) limit the extent to which the Bank or its subsidiaries may engage in “covered transactions” with any one affiliate to an amount equal to 10% of such institution’s capital stock and surplus, and maintain an aggregate limit on all such transactions with affiliates to an amount equal to 20% of such capital stock and surplus, and (ii) require that all such transactions be on terms substantially the same, or at least as favorable, to the association or subsidiary as those provided to a nonaffiliate. The term “covered transaction” includes the making of loans, purchase of assets, issuance of a guarantee and similar other types of transactions.
Transactions with Insiders. The Federal Reserve Act and related regulations impose specific restrictions on loans to directors, executive officers and principal shareholders of banks. Under Section 22(h) of the Federal Reserve Act, loans to a director, an executive officer and to a principal shareholder of a bank, and some affiliated entities of any of the foregoing, may not exceed, together with all other outstanding loans to such person and affiliated entities, the bank’s loan-to-one borrower limit. Loans in the aggregate to insiders and their related interests as a class may not exceed two times the bank’s unimpaired capital and unimpaired surplus until the bank’s total assets equal or exceed $100,000,000, at which time the aggregate is limited to the bank’s unimpaired capital and unimpaired surplus. Section 22(h) also prohibits loans, above amounts prescribed by the appropriate federal banking agency, to directors, executive officers and principal shareholders of a bank or bank holding company, and their respective affiliates, unless such loan is approved in advance by a majority of the board of directors of the bank with any “interested” director not participating in the voting. The FDIC has prescribed the loan amount, which includes all other outstanding loans to such person, as to which such prior board of director approval is required, as being the greater of $25,000 or 5% of capital and surplus (up to $500,000). Section 22(h) requires that loans to directors, executive officers and principal shareholders be made on terms and underwriting standards substantially the same as offered in comparable transactions to other persons.
The Dodd-Frank Act also provides that banks may not “purchase an asset from, or sell an asset to” a bank insider (or their related interests) unless (i) the transaction is conducted on market terms between the parties, and (ii) if the proposed transaction represents more than 10 percent of the capital stock and surplus of the bank, it has been approved in advance by a majority of the bank’s non-interested directors.
Community Reinvestment Act. Under the Community Reinvestment Act and related regulations, depository institutions have an affirmative obligation to assist in meeting the credit needs of their market areas, including low and moderate-income areas, consistent with safe and sound banking practice. The Community Reinvestment Act requires the adoption by each institution of a Community Reinvestment Act statement for each of its market areas describing the depository institution’s efforts to assist in its community’s credit needs. Depository institutions are periodically examined for compliance with the Community Reinvestment Act and are periodically assigned ratings in this regard. Banking regulators consider a depository institution’s Community Reinvestment Act rating when reviewing applications to establish new branches, undertake new lines of business, and/or acquire part or all of another depository institution. An unsatisfactory rating can significantly delay or even prohibit regulatory approval of a proposed transaction by a bank holding company or its depository institution subsidiaries.
The Gramm-Leach-Bliley Act and federal bank regulators have made various changes to the Community Reinvestment Act. Among other changes, Community Reinvestment Act agreements with private parties must be disclosed and annual reports must be made to a bank’s primary federal regulator. A bank holding company will not be permitted to become a financial holding company and no new activities authorized under the GLBA may be commenced by a holding company or by a bank financial subsidiary if any of its bank subsidiaries received less than a “satisfactory” rating in its latest Community Reinvestment Act examination.
Fair Lending; Consumer Laws. In addition to the Community Reinvestment Act, other federal and state laws regulate various lending and consumer aspects of the banking business. Governmental agencies, including the Department of Housing and Urban Development, the Federal Trade
6
Table of Contents
Commission and the Department of Justice, have become concerned that prospective borrowers experience discrimination in their efforts to obtain loans from depository and other lending institutions. These agencies have brought litigation against depository institutions alleging discrimination against borrowers. Many of these suits have been settled, in some cases for material sums, short of a full trial.
These governmental agencies have clarified what they consider to be lending discrimination and have specified various factors that they will use to determine the existence of lending discrimination under the Equal Credit Opportunity Act and the Fair Housing Act, including evidence that a lender discriminated on a prohibited basis, evidence that a lender treated applicants differently based on prohibited factors in the absence of evidence that the treatment was the result of prejudice or a conscious intention to discriminate, and evidence that a lender applied an otherwise neutral non-discriminatory policy uniformly to all applicants, but the practice had a discriminatory effect, unless the practice could be justified as a business necessity.
Banks and other depository institutions are also subject to numerous consumer-oriented laws and regulations. These laws, which include the Truth in Lending Act, the Truth in Savings Act, the Real Estate Settlement Procedures Act, the Electronic Funds Transfer Act, the Equal Credit Opportunity Act, and the Fair Housing Act, require compliance by depository institutions with various disclosure requirements and requirements regulating the availability of funds after deposit or the making of some loans to customers.
Gramm-Leach-Bliley Act of 1999. The Gramm-Leach-Bliley Act of 1999 was signed into law on November 12, 1999. The GLBA covers a broad range of issues, including a repeal of most of the restrictions on affiliations among depository institutions, securities firms and insurance companies. The following description summarizes some of its significant provisions.
The GLBA repeals sections 20 and 32 of the Glass-Steagall Act, thus permitting unrestricted affiliations between banks and securities firms. It also permits bank holding companies to elect to become financial holding companies. A financial holding company may engage in or acquire companies that engage in a broad range of financial services, including securities activities such as underwriting, dealing, investment, merchant banking, insurance underwriting, sales and brokerage activities. In order to become a financial holding company, the bank holding company and all of its affiliated depository institutions must be well-capitalized, well-managed and have at least a satisfactory Community Reinvestment Act rating.
The GLBA provides that the states continue to have the authority to regulate insurance activities, but prohibits the states in most instances from preventing or significantly interfering with the ability of a bank, directly or through an affiliate, to engage in insurance sales, solicitations or cross-marketing activities. Although the states generally must regulate bank insurance activities in a nondiscriminatory manner, the states may continue to adopt and enforce rules that specifically regulate bank insurance activities in specific areas identified under the law. Under the new law, the federal bank regulatory agencies adopted insurance consumer protection regulations that apply to sales practices, solicitations, advertising and disclosures.
The GLBA adopts a system of functional regulation under which the Federal Reserve Board is designated as the umbrella regulator for financial holding companies, but financial holding company affiliates are principally regulated by functional regulators such as the FDIC for state nonmember bank affiliates, the Securities and Exchange Commission for securities affiliates, and state insurance regulators for insurance affiliates. It repeals the broad exemption of banks from the definitions of “broker” and “dealer” for purposes of the Securities Exchange Act of 1934, as amended. It also identifies a set of specific activities, including traditional bank trust and fiduciary activities, in which a bank may engage without being deemed a “broker,” and a set of activities in which a bank may engage without being deemed a “dealer.” Additionally, the new law makes conforming changes in the definitions of “broker” and “dealer” for purposes of the Investment Company Act of 1940, as amended, and the Investment Advisers Act of 1940, as amended.
The GLBA contains extensive customer privacy protection provisions. Under these provisions, a financial institution must provide to its customers, both at the inception of the customer relationship and on an annual basis, the institution’s policies and procedures regarding the handling of customers’ nonpublic personal financial information. The new law provides that, except for specific limited exceptions, an institution may not provide such personal information to unaffiliated third parties unless the institution discloses to the customer that such information may be so provided and the customer is given the opportunity to opt out of such disclosure. An institution may not disclose to a non-affiliated third party, other than to a consumer reporting agency, customer account numbers or other similar account identifiers for marketing purposes. The GLBA also provides that the states may adopt customer privacy protections that are more strict than those contained in the act.
Bank Secrecy Act. Under the Bank Secrecy Act (“BSA”), a financial institution is required to have systems in place to detect certain transactions, based on the size and nature of the transaction. Financial institutions are generally required to report cash transactions involving more than $10,000 to the United States Treasury. In addition, financial institutions are required to file suspicious activity reports for transactions that involve more than $5,000 and which the financial institution knows, suspects or has reason to suspect, involves illegal funds, is designed to evade the requirements of the BSA or has no lawful purpose. The USA PATRIOT Act, enacted in response to the September 11, 2001 terrorist attacks, requires bank regulators to consider a financial institution’s compliance with the BSA when reviewing applications from a financial institution. As part of its BSA program, the USA PATRIOT Act also requires a financial institution to follow recently implemented customer identification procedures when opening accounts for new customers and to review lists of individuals and entities who are prohibited from opening accounts at financial institutions.
Sarbanes-Oxley Act of 2002. The Sarbanes-Oxley Act represents a comprehensive revision of laws affecting corporate governance, accounting obligations and corporate reporting. The Sarbanes-Oxley Act is applicable to all companies with equity securities registered or that file reports under the Securities Exchange Act of 1934. In particular, the Sarbanes-Oxley Act establishes: (i) new requirements for audit committees, including independence, expertise, and responsibilities; (ii) additional responsibilities regarding financial statements for the Chief Executive Officer and Chief Financial Officer of the reporting company; (iii) new standards for auditors and regulation of audits; (iv) increased disclosure and reporting obligations for the reporting company and its directors and executive officers; and (v) new and increased civil and criminal penalties for violations of
7
Table of Contents
the securities laws. Many of the provisions were effective immediately while other provisions become effective over a period of time and are subject to rulemaking by the SEC. Because the Company’s common stock is registered with the SEC, it is currently subject to this Act.
Future Regulatory Uncertainty Because federal and state regulation of financial institutions changes regularly and is the subject of constant legislative debate, the Company cannot forecast how federal and state regulation of financial institutions may change in the future and, as a result, impact our operations. Although Congress and the state legislature in recent years have sought to reduce the regulatory burden on financial institutions with respect to the approval of specific transactions, the Company fully expects that the financial institution industry will remain heavily regulated in the near future and that additional laws or regulations may be adopted further regulating specific banking practices.
Incentive Compensation. In June 2010, the Federal Reserve issued a final rule on incentive compensation policies intended to ensure that the incentive compensation policies of banking organizations do not undermine the safety and soundness of such organizations by encouraging excessive risk-taking. Banking organizations are instructed to review their incentive compensation policies to ensure that they do not encourage excessive risk-taking and implement corrective programs as needed. The Federal Reserve Board will review, as part of the regular, risk-focused examination process, the incentive compensation arrangements of banking organizations, such as the Bank, that are not “large, complex banking organizations.” These reviews will be tailored to each organization based on the scope and complexity of the organization’s activities and the prevalence of incentive compensation arrangements. The findings of the supervisory initiatives will be included in reports of examination. Deficiencies will be incorporated into the organization’s supervisory ratings, which can affect the organization’s ability to make acquisitions and take other actions.
Dodd-Frank Act. In July 2010, the Dodd-Frank Act was signed into law, incorporating numerous financial institution regulatory reforms. Many of these reforms will be implemented over the course of 2011 and beyond through regulations to be adopted by various federal banking and securities regulatory agencies. The Dodd-Frank Act implements far-reaching reforms of major elements of the financial landscape, particularly for larger financial institutions. Many of its provisions do not directly impact community-based institutions like the Bank. For instance, provisions that regulate derivative transactions and limit derivatives trading activity of federally-insured institutions, enhance supervision of “systemically significant” institutions, impose new regulatory authority over hedge funds, limit proprietary trading by banks, and phase-out the eligibility of trust preferred securities for Tier 1 capital are among the provisions that do not directly impact the Bank either because of exemptions for institutions below a certain asset size or because of the nature of the Bank’s operations. Provisions that could impact the Bank include the following:
| • | FDIC Assessments. The Dodd-Frank Act changes the assessment base for federal deposit insurance from the amount of insured deposits to average consolidated total assets less its average tangible equity. In addition, it increases the minimum size of the Deposit Insurance Fund (“DIF”) and eliminates its ceiling, with the burden of the increase in the minimum size on institutions with more than $10 billion in assets. |
| • | Deposit Insurance. The Dodd-Frank Act makes permanent the $250,000 limit for federal deposit insurance and provides unlimited federal deposit insurance until December 31, 2012 for non-interest-bearing demand transaction accounts at all insured depository institutions. |
| • | Interest on Demand Deposits. The Dodd- Frank Act also provides that, effective one year after the date of enactment, depository institutions may pay interest on demand deposits, including business transaction and other accounts. |
| • | Interchange Fees. The Dodd-Frank Act requires the Federal Reserve to set a cap on debit card interchange fees charged to retailers. While banks with less than $10 billion in assets, such as the Bank, are exempted from this measure, it is likely that, if this measure is implemented, all banks could be forced by market pressures to lower their interchange fees or face potential rejection of their cards by retailers. |
| • | Consumer Financial Protection Bureau. The Dodd-Frank Act centralizes responsibility for consumer financial protection by creating a new agency, the Consumer Financial Protection Bureau, responsible for implementing federal consumer protection laws, although banks below $10 billion in assets will continue to be examined and supervised for compliance with these laws by their federal bank regulator. |
| • | Mortgage Lending. New requirements are imposed on mortgage lending, including new minimum underwriting standards, prohibitions on certain yield-spread compensation to mortgage originators, special consumer protections for mortgage loans that do not meet certain provision qualifications, prohibitions and limitations on certain mortgage terms and various new mandated disclosures to mortgage borrowers. |
| • | Holding Company Capital Levels. Bank regulators are required to establish minimum capital levels for holding companies that are at least as stringent as those currently applicable to banks. In addition, all trust preferred securities issued after May 19, 2010 will be counted as Tier 2 capital, but the Company’s currently outstanding trust preferred securities will continue to qualify as Tier 1 capital. |
| • | De Novo Interstate Branching. National and state banks are permitted to establish de novo interstate branches outside of their home state, and bank holding companies and banks must be well-capitalized and well managed in order to acquire banks located outside their home state. |
| • | Transactions with Affiliates. The Dodd-Frank Act enhances the requirements for certain transactions with affiliates under Section 23A and 23B of the Federal Reserve Act, including an expansion of the definition of “covered transactions” and increasing the amount of time for which collateral requirements regarding covered transactions must be maintained. |
| • | Transactions with Insiders. Insider transaction limitations are expanded through the strengthening of loan restrictions to insiders and the expansion of the types of transactions subject to the various limits, including derivative transactions, repurchase agreements, reverse repurchase agreements and securities lending or borrowing transactions. Restrictions are also placed on certain asset sales to and from an insider to an institution, including requirements that such sales be on market terms and, in certain circumstances, approved by the institution’s board of directors. |
| • | Corporate Governance. The Dodd-Frank Act includes corporate governance revisions that apply to all public companies, not just financial institutions, including with regard to executive compensation and proxy access to shareholders. |
Many aspects of the Dodd-Frank Act are subject to rulemaking and will take effect over several years, and their impact on the Company or the financial industry is difficult to predict before such regulations are adopted.
8
Table of Contents
| Item 1A. | Risk Factors |
The Company is subject to many risks that could adversely affect its future financial condition and performance and, therefore, the market value of its securities. The risk factors applicable to the Company include, but are not limited to the following:
Difficult market conditions have adversely affected our industry.
Dramatic declines in the housing market, falling home prices and increasing foreclosures, and unemployment and under-employment have negatively impacted the credit performance of real estate related loans and resulted in significant write-downs of asset values by financial institutions. These write-downs, initially of asset-backed securities but spreading to other securities and loans, have caused many financial institutions to seek additional capital, to reduce or eliminate dividends, to merge with larger and stronger institutions and, in some cases, to fail. Reflecting concern about the stability of the financial markets generally and the strength of counterparties, many lenders and institutional investors have reduced or ceased providing funding to borrowers, including to other financial institutions. This market turmoil and tightening of credit have led to an increased level of commercial and consumer delinquencies, lack of consumer confidence, increased market volatility and widespread reduction of business activity generally. The resulting economic pressure on consumers and lack of confidence in the financial markets has adversely affected our business and results of operations. Market developments may affect consumer confidence levels and may cause adverse changes in payment patterns, causing increases in delinquencies and default rates, which may impact our charge-offs and provision for credit losses. A worsening of these conditions would likely exacerbate the adverse effects of these difficult market conditions on us and others in the financial institutions industry.
The Company’s concentration in loans secured by real estate may increase its credit losses, which would negatively affect our financial results.
At December 31, 2010, loans secured by real estate totaled $364,852,000 and represented 89.3% of the Company’s loan portfolio. If adverse changes in the local real estate market or in the local or national economy continue, borrowers’ ability to pay these loans may be further impaired, which could impact the Company’s financial performance. The Company attempts to limit its exposure to this risk by applying good underwriting practices at origination, evaluating the appraisals used to establish property values, and routinely monitoring the financial condition of borrowers. If the value of real estate serving as collateral for the loan portfolio were to continue to decline materially, a significant part of the loan portfolio could become under-collateralized. If the loans that are secured by real estate become troubled when real estate market conditions are declining or have declined, in the event of foreclosure, the Company may not be able to realize the amount of collateral that was anticipated at the time of originating the loan. In that event, the Company might have to increase the provision for loan losses, which could have a material adverse effect on its operating results and financial condition.
An inadequate allowance for loan losses would reduce our earnings.
Our earnings are significantly affected by our ability to properly originate, underwrite and service loans. We maintain an allowance for loan losses based upon many factors, including the following:
| • | actual loan loss history; |
| • | volume, growth, and composition of the loan portfolio; |
| • | the amount of non-performing loans and the value of their related collateral; |
| • | the effect of changes in the local real estate market on collateral values; |
| • | the effect of current economic conditions on a borrower’s ability to pay; and |
| • | other factors deemed relevant by management. |
These determinations are based upon estimates that are inherently subjective, and their accuracy depends on the outcome of future events; therefore, realized losses may differ from current estimates. Changes in economic, operating, and other conditions, including changes in interest rates, which are generally beyond our control, could increase actual loan losses significantly. As a result, actual losses could exceed our current allowance estimate. We cannot provide assurance that our allowance for loan losses is sufficient to cover actual loan losses should such losses differ significantly from the current estimates.
In addition, there can be no assurance that our methodology for assessing our asset quality will succeed in properly identifying impaired loans or calculating an appropriate loan loss allowance. We could sustain losses if we incorrectly assess the creditworthiness of our borrowers or fail to detect or respond to deterioration in asset quality in a timely manner. If our assumptions and judgments prove to be incorrect and the allowance for loan losses is inadequate to absorb losses, or if bank regulatory authorities require us to increase the allowance for loan losses as a part of their examination process, our earnings and capital could be significantly and adversely affected.
The Company’s success depends upon its ability to manage interest rate risk.
The profitability of the Company depends significantly on its net interest income, which is the difference between the interest earned on loans, securities and other interest-earning assets, and the interest paid on deposits and borrowings. Changes in interest rates will affect the rates earned on securities and loans and rates paid on deposits and other borrowings. While the Company believes that its current interest rate exposure does not present any significant negative exposure to interest rate changes, it cannot eliminate its exposure to interest rate risk because the factors which cause interest rate risk are beyond the Company’s control. These factors include competition, federal economic, monetary and fiscal policies, and general economic conditions.
9
Table of Contents
The Company may not be able to successfully manage its growth or implement its growth strategy, which may adversely affect results of operations and financial condition.
A key component of the Company’s business strategy is to continue to grow and expand. The Company’s ability to grow and expand depends upon its ability to open new branch locations, attract new deposits to the existing and new branch locations, and identify attractive loan and investment opportunities. The Company may not be able to implement its growth strategy if it is unable to identify attractive markets or branch locations. Once identified, successfully managing growth will depend on integrating the new branch locations while maintaining adequate capital, cost controls and asset quality. As this growth strategy is implemented, the Company will incur construction costs and increased personnel, occupancy and other operating expenses. Because these costs are incurred before new deposits and loans are generated, adding new branch locations will initially decrease earnings, despite efficient execution of this strategy.
The Company’s success depends upon its ability to compete effectively in the banking industry.
The Company’s banking subsidiary faces competition from banks and other financial institutions, including savings and loan associations, savings banks, finance companies and credit unions for deposits, loans and other financial services in our market area. Certain divisions within the banking subsidiary face competition from wealth management and investment brokerage firms. A number of these banks and other financial institutions are significantly larger and have substantially greater access to capital and other resources, as well as larger lending limits and branch systems, and offer a wider array of banking services. This competition may reduce or limit our margins and our market share and may adversely affect our results of operations and financial condition.
The Company could be adversely affected by economic conditions in its market area.
The Company’s branches are located in the counties of Clarke and Frederick and the City of Winchester. The current recession presents numerous challenges to the way we do business. Poor economic conditions, which are beyond our control, negatively impact the Company’s financial condition and performance. These conditions influence the volume of loans and deposits, the asset quality of the loan portfolio, and pricing of loans and deposits.
The soundness of other financial institutions could adversely affect us.
Our ability to engage in routine funding transactions could be adversely affected by the actions and commercial soundness of other financial institutions. Financial services institutions are interrelated as a result of trading, clearing, counterparty or other relationships. We have exposure to many different industries and counterparties, and we routinely execute transactions with counterparties in the financial industry. As a result, defaults by, or even rumors or questions about, one or more financial services institutions, or the financial services industry generally, have led to market-wide liquidity problems and could lead to losses or defaults by us or by other institutions. Many of these transactions expose us to credit risk in the event of default of our counterparty or client. In addition, our credit risk may be exacerbated when the collateral held by us cannot be realized upon or is liquidated at prices not sufficient to recover the full amount of the financial instrument exposure due us. There is no assurance that any such losses would not materially and adversely affect our results of operations.
Government measures to regulate the financial industry, including the recently enacted Dodd-Frank Act, subject us to increased regulation and could aversely affect us.
As a financial institution, we are heavily regulated at the state and federal levels. As a result of the financial crisis and related global economic downturn that began in 2007, we have faced, and expect to continue to face, increased public and legislative scrutiny as well as stricter and more comprehensive regulation of our financial services practices. In July 2010, the Dodd-Frank Act was signed into law. The Dodd-Frank Act includes significant changes in the financial regulatory landscape and will impact all financial institutions, including the Company and the Bank. Many of the provisions of the Dodd-Frank Act have begun to be or will be implemented over the next several months and years and will be subject both to further rulemaking and the discretion of applicable regulatory bodies. Because the ultimate impact of the Dodd-Frank Act will depend on future regulatory rulemaking and interpretation, we cannot predict the full effect of this legislation on our businesses, financial condition or results of operations. Among other things, the Dodd-Frank Act and the regulations implemented thereunder could limit debit card interchange fees, increase FDIC assessments, impose new requirements on mortgage lending, and establish more stringent capital requirements on bank holding companies. As a result of these and other provisions in the Dodd-Frank Act, we could experience additional costs, as well as limitations on the products and services we offer and on our ability to efficiently pursue business opportunities, which may adversely affect our businesses, financial condition or results of operations.
The Company relies heavily on its senior management team and the unexpected loss of key officers could adversely affect operations.
The Company believes that its growth and success depends heavily upon the skills of its senior management team. The Company also depends on the experience of its subsidiary’s officers and on their relationships with the customers they serve. The loss of one or more of these officers could disrupt the Company’s operations and impair its ability to implement its business strategy, which could adversely affect the Company’s financial condition and performance.
10
Table of Contents
| Item 1B. | Unresolved Staff Comments |
None.
| Item 2. | Properties |
The Company owns or leases buildings which are used in normal business operations. The following list contains information about the business locations of the Company. Information about the functional purpose of the location and whether the location is owned or leased is included in the list. The Company believes that its properties are maintained in good operating condition and are suitable and adequate for its purposes.
| Corporate Headquarters: |
||
| 2 East Main Street Berryville, Virginia 22611 County of Clarke |
The main office, owned by the Bank, is a two-story building of brick construction. It houses a full-service branch location, including lending services. In addition, it houses the Bank’s Operations, Information Technology, Finance, Human Resources, and Marketing Departments. This location has an ATM, but no drive-up banking. | |
| Banking Locations: |
||
| 108 West Main Street Boyce, Virginia 22620 |
This location, owned by the Bank, has a full-service lobby, including lending services. It also has drive-up banking, and a drive-up ATM. | |
| 202 North Loudoun Street Winchester, Virginia 22601 |
This location, owned by the Bank, is a three-story brick building. The first floor houses the branch services, including drive-up banking and a drive-up ATM. The Bank’s loan department is located on the second floor, which includes loan officers, loan operations and collections. Eagle Investment Group is located on the third floor along with a few businesses who lease office space that the Bank does not currently need. The basement of this location serves as a training facility for the Bank. | |
| 400 McNeil Drive Berryville, Virginia 22611 |
This location, owned by the Bank, offers drive-up banking only. It also has a drive-up ATM. | |
| 1508 Senseny Road Winchester, Virginia 22602 |
This location, owned by the Bank, has a full-service lobby, including lending services. It also has drive-up banking and a drive-up ATM. | |
| 1460 North Frederick Pike Winchester, Virginia 22602 |
This location, owned by the Bank, has a full-service lobby, including lending services. It also has drive-up banking and a drive-up ATM. | |
| 3360 Valley Pike Winchester, Virginia 22602 |
This location, owned by the Bank, has a full-service lobby, including lending services. It also has drive-up banking and a drive-up ATM. | |
| 1879 Berryville Pike Winchester, Virginia 22602 |
The Bank leases the land on which this branch was constructed. This location has a full-service lobby, including lending services. It also has drive-up banking and a drive-up ATM. | |
| 382 Fairfax Pike Stephens City, Virginia 22655 |
This location, owned by the Bank, has a full-service lobby, including lending services. It also has drive-up banking and a drive-up ATM. | |
| 2555 Pleasant Valley Road Winchester, Virginia 22601 |
This location, owned by the Bank, opened in July 2010 and replaced the branch located on Jubal Early Drive. The branch has a full-service lobby, including lending services. It also has drive-up banking and a drive-up ATM. | |
| 110 Crock Wells Mill Drive Winchester, Virginia 22603 |
This location, owned by the Bank, has a full-service lobby, including lending services. It also has drive-up banking and a drive-up ATM. | |
| Other Properties: |
||
| 21 Main Street Round Hill, VA 20141 |
This location, leased by the Bank, is scheduled to open in early 2011 and will be the bank’s first branch located in Loudoun County. It will have a full-service lobby, including lending services. It will also have drive-up banking and a drive-up ATM. | |
| 18 North Church Street Berryville, Virginia |
This building is currently vacant and up for sale. | |
11
Table of Contents
| Item 3. | Legal Proceedings |
There are no material pending legal proceedings to which the Company is a party or of which the property of the Company is subject.
| Item 4. | Removed and Reserved |
12
Table of Contents
PART II
| Item 5. | Market for Registrant’s Common Equity, Related Stockholder Matters and Issuer Purchases of Equity Securities |
The Company’s common stock is not listed for trading on a registered exchange. Shares of the common stock of the Company are traded on the over-the-counter (OTC) market and quoted on the OTC Bulletin Board under the symbol “EFSI.” The OTC Bulletin Board provides information about the common stock to professional market makers who match sellers with buyers. Securities brokers can obtain information from the OTC Bulletin Board when working with clients. When a client decides to initiate a transaction, the broker will contact one of the stock’s market makers.
The Company has a limited record of trades involving its common stock in the sense of “bid” and “ask” prices or in highs and lows. The effort to accurately disclose trading prices is made more difficult due to the fact that price per share information is not required to be disclosed to the Company when shares of its stock have been sold by holders and purchased by others. The table titled “Common Stock Market Price and Dividend Data” summarizes the high and low sales prices of shares of the Company’s common stock on the basis of trades known to the Company (including trades through the OTC Bulletin Board) and dividends declared during 2010 and 2009. The Company may not be aware of the per share price of all trades made.
Common Stock Market Price and Dividend Data
| 2010 | 2009 | Dividends Per Share | ||||||||||||||||||||||
| High | Low | High | Low | 2010 | 2009 | |||||||||||||||||||
| 1st Quarter |
$ | 18.25 | $ | 15.75 | $ | 20.25 | $ | 11.00 | $ | 0.17 | $ | 0.17 | ||||||||||||
| 2nd Quarter |
18.25 | 16.00 | 17.60 | 14.60 | 0.17 | 0.17 | ||||||||||||||||||
| 3rd Quarter |
18.01 | 15.82 | 16.25 | 15.00 | 0.17 | 0.17 | ||||||||||||||||||
| 4th Quarter |
17.75 | 16.30 | 16.00 | 15.10 | 0.18 | 0.17 | ||||||||||||||||||
As of March 1, 2011, the Company had approximately 1,207 shareholders of record.
The Company has historically paid dividends on a quarterly basis. The final determination of the timing, amount and payment of dividends on the Common Stock is at the discretion of the Company’s Board of Directors. Some of the factors affecting the payment of dividends on the Company’s common stock are operating results, financial condition, capital adequacy, regulatory requirements and shareholders returns.
The Company is organized under the Virginia Stock Corporation Act, which prohibits the payment of a dividend if, after giving it effect, the corporation would not be able to pay its debts as they become due in the usual course of business or if the corporation’s total assets would be less than the sum of its total liabilities plus the amount that would be needed, if the corporation were to be dissolved, to satisfy the preferential rights upon dissolution of any preferred shareholders.
The Company is a legal entity separate and distinct from its subsidiaries. Its ability to distribute cash dividends will depend primarily on the ability of the Bank to pay dividends to it, and the Bank is subject to laws and regulations that limit the amount of dividends that it can pay. As a state member bank, the Bank is subject to certain restrictions imposed by the reserve and capital requirements of federal and Virginia banking statutes and regulations. Under Virginia law, a bank may not declare a dividend in excess of its undivided profits. Additionally, the Bank may not declare a dividend if the total amount of all dividends, including the proposed dividend, declared by it in any calendar year exceeds the total of its retained net income of that year to date, combined with its retained net income of the two preceding years, unless the dividend is approved by the Federal Reserve.
The Federal Reserve and the state of Virginia have the general authority to limit the dividends paid by insured banks if the payment is deemed an unsafe and unsound practice. Both the state of Virginia and the Federal Reserve have indicated that paying dividends that deplete a bank’s capital base to an inadequate level would be an unsound and unsafe banking practice. Under the Federal Reserve’s regulations, the Bank may not declare or pay any dividend in excess of its net income for the current year plus any retained net income from the prior two calendar years. The Bank may also not declare or pay a dividend without the approval of its board and two-thirds of its shareholders if the dividend would exceed its undivided profits, as reported to the Federal Reserve.
In addition, the Company is subject to certain regulatory requirements to maintain capital at or above regulatory minimums. These regulatory requirements regarding capital affect its dividend policies. The Federal Reserve has indicated that a bank holding company should generally pay dividends only if its current earnings are sufficient to fully fund the dividends, and the prospective rate of earnings retention appears consistent with the organization’s capital needs, asset quality and overall financial condition.
The following line graph compares the cumulative total return to the shareholders of the Company to the returns of the NASDAQ Bank Index and the NASDAQ Composite Index for the last five years. The amounts in the table represent the value of the investment on December 31st of the year indicated, assuming $100 was initially invested on December 31, 2005 and the reinvestment of dividends. See Management Discussion and Analysis sections Liquidity and Capital Resources and Note 16, “Restrictions on Dividends, Loans and Advances” to the Consolidated Financial Statements for information on Eagle Financial Services, Inc. ability and intent to pay dividends.
13
Table of Contents
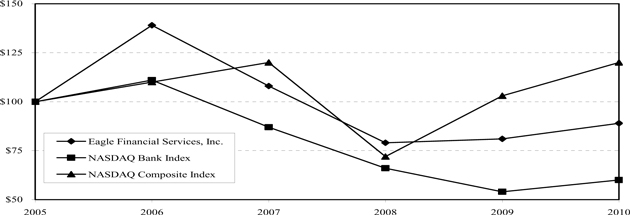
| 2005 | 2006 | 2007 | 2008 | 2009 | 2010 | |||||||||||||||||||
| Eagle Financial Services, Inc. |
$ | 100 | $ | 139 | $ | 108 | $ | 79 | $ | 81 | $ | 89 | ||||||||||||
| NASDAQ Bank Index |
100 | 111 | 87 | 66 | 54 | 60 | ||||||||||||||||||
| NASDAQ Composite Index |
100 | 110 | 120 | 72 | 103 | 120 | ||||||||||||||||||
14
Table of Contents
| Item 6. | Selected Financial Data |
The following table presents selected financial data, which was derived from the Company’s audited financial statements for the periods indicated.
| December 31, | ||||||||||||||||||||
| 2010 | 2009 | 2008 | 2007 | 2006 | ||||||||||||||||
| (dollars in thousands, except per share amounts) | ||||||||||||||||||||
| Income Statement Data: |
||||||||||||||||||||
| Interest and dividend income |
$ | 27,789 | $ | 27,453 | $ | 29,439 | $ | 31,162 | $ | 29,209 | ||||||||||
| Interest expense |
5,530 | 6,793 | 10,512 | 13,892 | 11,705 | |||||||||||||||
| Net interest income |
$ | 22,259 | $ | 20,660 | $ | 18,927 | $ | 17,270 | $ | 17,504 | ||||||||||
| Provision for loan losses |
6,325 | 4,350 | 2,310 | 550 | 300 | |||||||||||||||
| Net interest income after provision for loan losses |
$ | 15,934 | $ | 16,310 | $ | 16,617 | $ | 16,720 | $ | 17,204 | ||||||||||
| Noninterest income |
5,499 | 4,626 | 4,609 | 6,192 | 5,447 | |||||||||||||||
| Net revenue |
$ | 21,433 | $ | 20,936 | $ | 21,226 | $ | 22,912 | $ | 22,651 | ||||||||||
| Noninterest expenses |
16,809 | 16,480 | 15,814 | 15,551 | 14,301 | |||||||||||||||
| Income before income taxes |
$ | 4,624 | $ | 4,456 | $ | 5,412 | $ | 7,361 | $ | 8,350 | ||||||||||
| Applicable income taxes |
1,019 | 1,015 | 1,357 | 2,100 | 2,492 | |||||||||||||||
| Net Income |
$ | 3,605 | $ | 3,441 | $ | 4,055 | $ | 5,261 | $ | 5,858 | ||||||||||
| Performance Ratios: |
||||||||||||||||||||
| Return on average assets |
0.65 | % | 0.65 | % | 0.79 | % | 1.04 | % | 1.20 | % | ||||||||||
| Return on average equity |
6.71 | % | 7.06 | % | 8.81 | % | 12.25 | % | 15.27 | % | ||||||||||
| Shareholders’ equity to assets |
9.63 | % | 9.65 | % | 8.87 | % | 8.90 | % | 7.98 | % | ||||||||||
| Dividend payout ratio |
61.98 | % | 63.02 | % | 52.01 | % | 37.87 | % | 31.56 | % | ||||||||||
| Non-performing loans to total loans |
2.05 | % | 1.26 | % | 0.87 | % | 0.00 | % | 0.00 | % | ||||||||||
| Non-performing assets to total assets |
1.82 | % | 1.47 | % | 0.78 | % | 0.04 | % | 0.00 | % | ||||||||||
| Per Share Data (1): |
||||||||||||||||||||
| Net income, basic |
$ | 1.11 | $ | 1.09 | $ | 1.29 | $ | 1.70 | $ | 1.91 | ||||||||||
| Net income, diluted |
1.11 | 1.08 | 1.29 | 1.69 | 1.90 | |||||||||||||||
| Cash dividends declared |
0.69 | 0.68 | 0.67 | 0.64 | 0.60 | |||||||||||||||
| Book value |
16.50 | 16.05 | 14.79 | 14.57 | 13.23 | |||||||||||||||
| Market price |
16.50 | 15.75 | 16.10 | 22.75 | 30.00 | |||||||||||||||
| Average shares outstanding, basic |
3,243,292 | 3,177,244 | 3,136,535 | 3,101,276 | 3,071,930 | |||||||||||||||
| Average shares outstanding, diluted |
3,250,868 | 3,184,534 | 3,143,907 | 3,113,792 | 3,087,053 | |||||||||||||||
| Balance Sheet Data: |
||||||||||||||||||||
| Total securities |
$ | 113,776 | $ | 101,210 | $ | 98,919 | $ | 84,237 | $ | 91,624 | ||||||||||
| Total loans |
408,449 | 404,066 | 390,086 | 389,661 | 386,046 | |||||||||||||||
| Total assets |
558,840 | 535,385 | 528,142 | 507,551 | 512,996 | |||||||||||||||
| Total deposits |
429,296 | 398,107 | 386,527 | 379,585 | 397,450 | |||||||||||||||
| Shareholders’ equity |
53,829 | 51,643 | 46,829 | 45,178 | 40,937 | |||||||||||||||
| (1) | Per share amounts have been adjusted to reflect a two-for-one stock split of the Company’s common stock on March 15, 2006. |
15
Table of Contents
| Item 7. | Management’s Discussion and Analysis of Financial Condition and Results of Operation |
The purpose of this discussion is to focus on the important factors affecting the financial condition, results of operations, liquidity and capital resources of Eagle Financial Services, Inc. (the “Company”). This discussion should be read in conjunction with the Company’s Consolidated Financial Statements and the Notes to the Consolidated Financial Statements presented in Item 8, Financial Statements and Supplementary Data, of this Form 10-K.
GENERAL
The Company is a bank holding company which owns 100% of the stock of Bank of Clarke County (the “Bank”). Accordingly, the results of operations for the Company are dependent upon the operations of the Bank. The Bank conducts commercial banking business which consists of attracting deposits from the general public and investing those funds in commercial, consumer and real estate loans and corporate, municipal and U.S. government agency securities. The Bank’s deposits are insured by the Federal Deposit Insurance Corporation to the extent permitted by law. At December 31, 2010, the Company had total assets of $558,840,000, net loans of $401,338,000, total deposits of $429,296,000 and shareholders’ equity of $53,829,000. The Company’s net income was $3,605,000 for the year ended December 31, 2010.
MANAGEMENT’S STRATEGY
The Company strives to be an outstanding financial institution in its market by building solid sustainable relationships with: (1) its customers, by providing highly personalized customer service, a network of conveniently placed branches and ATMs, a competitive variety of products/services and courteous, professional employees, (2) its employees, by providing generous benefits, a positive work environment, advancement opportunities and incentives to exceed expectations, (3) its communities, by participating in local concerns, providing monetary support, supporting employee volunteerism and providing employment opportunities, and (4) its shareholders, by providing sound profits and returns, sustainable growth, regular dividends and committing to our local, independent status.
OPERATING STRATEGY
The Bank is a locally owned and managed financial institution. This allows the Bank to be flexible and responsive in the products and services it offers. The Bank grows primarily by lending funds to local residents and businesses at a competitive price that reflects the inherent risk of lending. The Bank attempts to fund these loans through deposits gathered from local residents and businesses. The Bank prices its deposits by comparing alternative sources of funds and selecting the lowest cost available. When deposits are not adequate to fund asset growth, the Bank relies on borrowings, both short and long term. The Bank’s primary source of borrowed funds is the Federal Home Loan Bank of Atlanta which offers numerous terms and rate structures to the Bank.
As interest rates change, the Bank attempts to maintain its net interest margin. This is accomplished by changing the price, terms, and mix of its financial assets and liabilities. The Bank also earns fees on services provided through Eagle Investment Group, which is the Bank’s investment management division that offers both trust services and investment sales, mortgage originations and deposit operations. The Bank also incurs noninterest expenses associated with compensating employees, maintaining and acquiring fixed assets, and purchasing goods and services necessary to support its daily operations.
The Bank has a marketing department which seeks to develop new business. This is accomplished through an ongoing calling program whereby account officers visit with existing and potential customers to discuss the products and services offered. The Bank also utilizes traditional advertising such as television commercials, radio ads, newspaper ads, and billboards.
LENDING POLICIES
Administration and supervision over the lending process is provided by the Bank’s Credit Administration Department. The principal risk associated with the Bank’s loan portfolio is the creditworthiness of its borrowers. In an effort to manage this risk, the Bank’s policy gives loan amount approval limits to individual loan officers based on their position and level of experience. Credit risk is increased or decreased, depending on the type of loan and prevailing economic conditions. In consideration of the different types of loans in the portfolio, the risk associated with real estate mortgage loans, commercial loans and consumer loans varies based on employment levels, consumer confidence, fluctuations in the value of real estate and other conditions that affect the ability of borrowers to repay debt.
The Company has written policies and procedures to help manage credit risk. The Company utilizes a loan review process that includes formulation of portfolio management strategy, guidelines for underwriting standards and risk assessment, procedures for ongoing identification and management of credit deterioration, and regular portfolio reviews to establish loss exposure and to ascertain compliance with the Company’s policies.
The Bank uses a Directors Loan Committee and lending limits approved by the Directors Loan Committee to approve loan requests. The loan officers are categorized based on the amount of secured and unsecured lending authority they possess. The highest authority (Category I) is comprised of the Bank’s Chief Executive Officer, the Senior Loan Officer, and the Associate Senior Loan Officer. There are six additional categories (Categories II, III, IV, V, VI, and VII) with different amounts of secured and unsecured authority. Two officers in Category I may combine their authority to approve a loan request of up to $2,000,000 secured or $1,000,000 unsecured. An officer in Category II, III, IV, V, VI, or VII may combine his or her authority with one officer in a higher category to approve a loan request. Any loan request which exceeds the combined authority of the categories must be presented to the Directors Loan Committee. The Directors Loan Committee, which currently consists of four directors (three directors constitute a quorum, of whom any two may act), approves loan requests which exceed the combined authority of two loan officers as described above. The minimum amount which requires Director Loan Committee approval, which is derived by combining the authorities
16
Table of Contents
of a Category I and Category VII officer, is $1,025,000 secured and $505,000 unsecured. The Directors Loan Committee also reviews and approves changes to the Bank’s Loan Policy as presented by management.
The following sections discuss the major loan categories within the total loan portfolio:
One-to-Four-Family Residential Real Estate Lending
Residential lending activity may be generated by the Bank’s loan officer solicitations, referrals by real estate professionals, and existing or new bank customers. Loan applications are taken by a Bank loan officer. As part of the application process, information is gathered concerning income, employment and credit history of the applicant. The valuation of residential collateral is provided by independent fee appraisers who have been approved by the Bank’s Directors Loan Committee. In connection with residential real estate loans, the Bank requires title insurance, hazard insurance and, if applicable, flood insurance. In addition to traditional residential mortgage loans secured by a first or junior lien on the property, the Bank offers home equity lines of credit.
Commercial Real Estate Lending
Commercial real estate loans are secured by various types of commercial real estate in the Bank’s market area, including multi-family residential buildings, commercial buildings and offices, small shopping centers and churches. Commercial real estate loan originations are obtained through broker referrals, direct solicitation of developers and continued business from customers. In its underwriting of commercial real estate, the Bank’s loan to original appraised value ratio is generally 80% or less. Commercial real estate lending entails significant additional risk as compared with residential mortgage lending. Commercial real estate loans typically involve larger loan balances concentrated with single borrowers or groups of related borrowers. Additionally, the repayment of loans secured by income producing properties is typically dependent on the successful operation of a business or a real estate project and thus may be subject, to a greater extent, to adverse conditions in the real estate market or the economy, in general. The Bank’s commercial real estate loan underwriting criteria require an examination of debt service coverage ratios, the borrower’s creditworthiness, prior credit history and reputation, and the Bank typically requires personal guarantees or endorsements of the borrower’s principal owners.
Construction and Land Development Lending
The Bank makes local construction loans, primarily residential, and land acquisition and development loans. Most of the construction loans are secured by residential houses under construction and the underlying land for which the loan was obtained. The average life of most construction loans is less than one year and the Bank offers both fixed and variable rate interest structures. The interest rate structure offered to customers depends on the total amount of these loans outstanding and the impact of the interest rate structure on the Bank’s overall interest rate risk. There are two characteristics of construction lending which impact its overall risk as compared to residential mortgage lending. First, there is more concentration risk due to the extension of a large loan balance through several lines of credit to a single developer or contractor. Second, there is more collateral risk due to the fact that loan funds are provided to the borrower based upon the estimated value of the collateral after completion. This could cause an inaccurate estimate of the amount needed to complete construction or an excessive loan-to-value ratio. To mitigate the risks associated with construction lending, the Bank generally limits loan amounts to 80% of the estimated appraised value of the finished home. The Bank also obtains a first lien on the property as security for its construction loans and typically requires personal guarantees from the borrower’s principal owners. Finally, the Bank performs inspections of the construction projects to ensure that the percentage of construction completed correlates with the amount of draws on the construction line of credit.
Commercial and Industrial Lending
Commercial business loans generally have more risk than residential mortgage loans, but have higher yields. To manage these risks, the Bank generally obtains appropriate collateral and personal guarantees from the borrower’s principal owners and monitors the financial condition of the borrower. Residential mortgage loans generally are made on the basis of the borrower’s ability to make repayment from employment and other income and are secured by real estate whose value tends to be readily ascertainable. In contrast, commercial business loans typically are made on the basis of the borrower’s ability to make repayment from cash flow from its business and are secured by business assets, such as commercial real estate, accounts receivable, equipment and inventory. As a result, the availability of funds for the repayment of commercial business loans is substantially dependent on the success of the business itself. Furthermore, the collateral for commercial business loans may depreciate over time and generally cannot be appraised with as much precision as residential real estate.
Consumer Lending
The Bank offers various secured and unsecured consumer loans, which include personal installment loans, personal lines of credit, automobile loans, and credit card loans. The Bank originates its consumer loans within its geographic market area and these loans are generally made to customers with whom the Bank has an existing relationship. Consumer loans generally entail greater risk than residential mortgage loans, particularly in the case of consumer loans which are unsecured or secured by rapidly depreciable assets such as automobiles. In such cases, any repossessed collateral on a defaulted consumer loan may not provide an adequate source of repayment of the outstanding loan balance as a result of the greater likelihood of damage, loss or depreciation. Consumer loan collections are dependent on the borrower’s continuing financial stability, and thus are more likely to be adversely affected by job loss, divorce, illness or personal bankruptcy. Furthermore, the application of various federal and state laws, including federal and state bankruptcy and insolvency laws, may limit the amount which can be recovered on such loans.
The underwriting standards employed by the Bank for consumer loans include a determination of the applicant’s payment history on other debts and an assessment of ability to meet existing obligations and payments on the proposed loan. The stability of the applicant’s monthly income may be determined by verification of gross monthly income from primary employment, and from any verifiable secondary income. Although
17
Table of Contents
creditworthiness of the applicant is the primary consideration, the underwriting process also includes an analysis of the value of the security in relation to the proposed loan amount.
CRITICAL ACCOUNTING POLICIES
The financial statements of the Company are prepared in accordance with accounting principles generally accepted in the United States of America (GAAP). The financial information contained within these statements is, to a significant extent, based on measurements of the financial effects of transactions and events that have already occurred. A variety of factors could affect the ultimate value that is obtained when earning income, recognizing an expense, recovering an asset or relieving a liability. The Company uses historical loss factors as one element in determining the inherent loss that may be present in the loan portfolio. Actual losses could differ significantly from the historical factors that are used. In addition, GAAP itself may change from one previously acceptable method to another method. Although the economics of the transactions would be the same, the timing of events that would impact the transactions could change.
The allowance for loan losses is an estimate of the losses that may be sustained in the Company’s loan portfolio. As required by GAAP, the allowance for loan losses is accrued when their occurrence is probable and they can be estimated and that the losses be accrued based on the differences between the loan balance and the value of its collateral, the present value of future cash flows, or the price established in the secondary market. The Company’s allowance for loan losses has three basic components: the formula allowance, the specific allowance and the unallocated allowance. Each of these components is determined based upon estimates that can and do change when actual events occur. The formula allowance uses historical experience factors to estimate future losses and, as a result, the estimated amount of losses can differ significantly from the actual amount of losses which would be incurred in the future. However, the potential for significant differences is mitigated by continuously updating the loss history of the Company. The specific allowance is based upon the evaluation of specific loans on which a loss may be realized. Factors such as past due history, ability to pay, and collateral value are used to identify those loans on which a loss may be realized. Each of these loans is then classified as to how much loss would be realized on its disposition. The sum of the losses on the individual loans becomes the Company’s specific allowance. This process is inherently subjective and actual losses may be greater than or less than the estimated specific allowance. The unallocated allowance captures losses that are attributable to various economic events which may affect a certain loan type within the loan portfolio or a certain industrial or geographic sector within the Company’s market. As the loans, which are affected by these events, are identified or losses are experienced on the loans which are affected by these events, they will be reflected within the specific or formula allowances. Note 1 to the Consolidated Financial Statements presented in Item 8, Financial Statements and Supplementary Data, of the 2010 Form 10-K, provides additional information related to the allowance for loan losses.
FORWARD LOOKING STATEMENTS
The Company makes forward looking statements in this report that are subject to risks and uncertainties. These forward looking statements include statements regarding our profitability, liquidity, allowance for loan losses, interest rate sensitivity, market risk, growth strategy, and financial and other goals. The words “believes,” “expects,” “may,” “will,” “should,” “projects,” “contemplates,” “anticipates,” “forecasts,” “intends,” or other similar words or terms are intended to identify forward looking statements. These forward looking statements are subject to significant uncertainties because they are based upon or are affected by factors including:
| • | difficult market conditions in our industry; |
| • | unprecedented levels of market volatility; |
| • | effects of soundness of other financial institutions; |
| • | uncertain outcome of recently enacted legislation to stabilize the U.S. financial system; |
| • | potential impact on us of recently enacted legislation; |
| • | the ability to successfully manage growth or implement growth strategies if the Bank is unable to identify attractive markets, locations or opportunities to expand in the future; |
| • | competition with other banks and financial institutions, and companies outside of the banking industry, including those companies that have substantially greater access to capital and other resources; |
| • | the successful management of interest rate risk; |
| • | risks inherent in making loans such as repayment risks and fluctuating collateral values; |
| • | changes in general economic and business conditions in the market area; |
| • | reliance on the management team, including the ability to attract and retain key personnel; |
| • | changes in interest rates and interest rate policies; |
| • | maintaining capital levels adequate to support growth; |
| • | maintaining cost controls and asset qualities as new branches are opened or acquired; |
| • | demand, development and acceptance of new products and services; |
| • | problems with technology utilized by the Bank; |
| • | changing trends in customer profiles and behavior; |
| • | changes in banking and other laws and regulations; and |
| • | other factors described in Item 1A., “Risk Factors,” above. |
Because of these uncertainties, actual future results may be materially different from the results indicated by these forward looking statements. In addition, past results of operations do not necessarily indicate future results.
18
Table of Contents
RESULTS OF OPERATIONS
Net Income
Net income for 2010 was $3,605,000, an increase of $164,000 or 4.8% over 2009’s net income of $3,441,000. Net income for 2009 decreased $614,000 or 15.1% from 2008’s net income of $4,055,000. Diluted earnings per share were $1.11, $1.08, and $1.29 for 2010, 2009, and 2009, respectively.
Return on average assets (ROA) measures how efficiently the Company uses its assets to produce net income. Some issues reflected within this efficiency include the Company’s asset mix, funding sources, pricing, fee generation, and cost control. The ROA of the Company, on an annualized basis, was 0.65%, 0.65%, and 0.79% for 2010, 2009, and 2008, respectively.
Return on average equity (ROE) measures the utilization of shareholders’ equity in generating net income. This measurement is affected by the same factors as ROA with consideration to how much of the Company’s assets are funded by the shareholders. The ROE for the Company was 6.71%, 7.06%, and 8.81% for 2010, 2009, and 2008, respectively.
Net Interest Income
Net interest income, the difference between total interest income and total interest expense, is the Company’s primary source of earnings. Net interest income was $22,259,000 for 2010, $20,660,000 for 2009, and $18,927,000 for 2008, which represents an increase of $1,599,000 or 7.7% and $1,733,000 or 9.2% for 2010 and 2009, respectively. Net interest income is derived from the volume of earning assets and the rates earned on those assets as compared to the cost of funds. Total interest income was $27,789,000 for 2010, $27,453,000 for 2009, and $29,439,000 for 2008, which represents an increase of $336,000 or 1.2% and a decrease of $1,986,000 or 6.8% for 2010 and 2009, respectively. Total interest expense was $5,530,000 for 2010, $6,793,000 for 2009, and $10,512,000 for 2008, which represents a decrease of $1,263,000 or 18.6% and $3,719,000 or 35.4% in 2010 and 2009, respectively.
The table titled “Average Balances, Income and Expenses, Yields and Rates” displays the composition of interest earnings assets and interest bearing liabilities and their respective yields and rates for the years ended December 31, 2010, 2009, and 2008.
The net interest margin was 4.38% for 2010, 4.31% for 2009, and 4.02% for 2008. The net interest margin is calculated by dividing tax-equivalent net interest income by total average earnings assets. Tax-equivalent net interest income is calculated by adding the tax benefit on certain securities and loans, whose interest is tax-exempt, to total interest income then subtracting total interest expense. The tax rate used to calculate the tax benefit was 34% for 2010, 2009, and 2008. The table titled “Tax-Equivalent Net Interest Income” reconciles net interest income to tax-equivalent net interest income, which is not a measurement under GAAP, for the years ended December 31, 2010, 2009, and 2008.
The tax-equivalent yield on earning assets decreased 25 points from 2009 to 2010 and 50 points from 2008 to 2009. The tax-equivalent yield on securities decreased 46 points from 2009 to 2010 and 36 points from 2008 to 2009. The tax-equivalent yield on loans decreased 11 basis points from 2009 to 2010 and 48 basis points from 2008 to 2009.
19
Table of Contents
Average Balances, Income and Expenses, Yields and Rates
(dollars in thousands)
| 2010 | 2009 | 2008 | ||||||||||||||||||||||||||||||||||
| Average Balances |
Interest Income/ Expense |
Average Yield/ Rate |
Average Balances |
Interest Income/ Expense |
Average Yield/ Rate |
Average Balances |
Interest Income/ Expense |
Average Yield/ Rate |
||||||||||||||||||||||||||||
| Assets: |
||||||||||||||||||||||||||||||||||||
| Securities: |
||||||||||||||||||||||||||||||||||||
| Taxable |
$ | 72,029 | $ | 2,935 | 4.07 | % | $ | 66,132 | $ | 3,245 | 4.91 | % | $ | 65,099 | $ | 3,457 | 5.31 | % | ||||||||||||||||||
| Tax-Exempt (1) |
34,612 | 1,973 | 5.70 | % | 33,670 | 1,809 | 5.37 | % | 30,566 | 1,731 | 5.66 | % | ||||||||||||||||||||||||
| Total Securities |
$ | 106,641 | $ | 4,908 | 4.60 | % | $ | 99,802 | $ | 5,054 | 5.06 | % | $ | 95,665 | $ | 5,188 | 5.42 | % | ||||||||||||||||||
| Loans: (2) |
||||||||||||||||||||||||||||||||||||
| Taxable |
402,143 | 23,269 | 5.79 | % | 385,423 | 22,728 | 5.90 | % | 385,214 | 24,575 | 6.38 | % | ||||||||||||||||||||||||
| Tax-Exempt (1) |
5,600 | 394 | 7.04 | % | 5,974 | 413 | 6.91 | % | 4,651 | 325 | 6.99 | % | ||||||||||||||||||||||||
| Total Loans |
$ | 407,743 | $ | 23,663 | 5.80 | % | $ | 391,397 | $ | 23,141 | 5.91 | % | $ | 389,865 | $ | 24,900 | 6.39 | % | ||||||||||||||||||
| Federal funds sold |
1,326 | 2 | 0.15 | % | 4,937 | 10 | 0.20 | % | 2,195 | 45 | 2.05 | % | ||||||||||||||||||||||||
| Interest-bearing deposits in other banks |
11,054 | 21 | 0.19 | % | 221 | 3 | 1.36 | % | 198 | 5 | 2.53 | % | ||||||||||||||||||||||||
| Total earning assets |
$ | 526,764 | $ | 28,594 | 5.43 | % | $ | 496,357 | $ | 28,208 | 5.68 | % | $ | 487,923 | $ | 30,138 | 6.18 | % | ||||||||||||||||||
| Allowance for loan losses |
(6,638 | ) | (4,673 | ) | (3,466 | ) | ||||||||||||||||||||||||||||||
| Total non-earning assets |
33,673 | 34,473 | 31,714 | |||||||||||||||||||||||||||||||||
| Total assets |
$ | 553,799 | $ | 526,157 | $ | 516,171 | ||||||||||||||||||||||||||||||
| Liabilities and Shareholders’ Equity: |
||||||||||||||||||||||||||||||||||||
| Interest-bearing deposits: |
||||||||||||||||||||||||||||||||||||
| NOW accounts |
$ | 69,154 | $ | 274 | 0.40 | % | $ | 60,338 | $ | 306 | 0.51 | % | $ | 60,774 | $ | 680 | 1.12 | % | ||||||||||||||||||
| Money market accounts |
66,819 | 407 | 0.61 | % | 60,001 | 543 | 0.90 | % | 52,464 | 975 | 1.86 | % | ||||||||||||||||||||||||
| Savings accounts |
40,570 | 69 | 0.17 | % | 36,160 | 108 | 0.30 | % | 33,748 | 214 | 0.63 | % | ||||||||||||||||||||||||
| Time deposits: |
||||||||||||||||||||||||||||||||||||
| $100,000 and more |
59,944 | 710 | 1.18 | % | 51,455 | 1,941 | 3.77 | % | 68,732 | 2,451 | 3.57 | % | ||||||||||||||||||||||||
| Less than $100,000 |
87,940 | 1,523 | 1.73 | % | 94,523 | 1,142 | 1.21 | % | 74,445 | 2,658 | 3.57 | % | ||||||||||||||||||||||||
| Total interest-bearing deposits |
$ | 324,427 | $ | 2,983 | 0.92 | % | $ | 302,477 | $ | 4,040 | 1.34 | % | $ | 290,163 | $ | 6,978 | 2.40 | % | ||||||||||||||||||
| Federal funds purchased and securities sold under agreements to repurchase |
15,473 | 387 | 2.50 | % | 15,736 | 392 | 2.49 | % | 17,119 | 482 | 2.82 | % | ||||||||||||||||||||||||
| Federal Home Loan Bank advances |
56,277 | 1,844 | 3.28 | % | 63,709 | 2,042 | 3.21 | % | 71,762 | 2,706 | 3.77 | % | ||||||||||||||||||||||||
| Trust preferred capital notes |
7,217 | 316 | 4.38 | % | 7,217 | 319 | 4.42 | % | 7,217 | 346 | 4.79 | % | ||||||||||||||||||||||||
| Total interest-bearing liabilities |
$ | 403,394 | $ | 5,530 | 1.37 | % | $ | 389,139 | $ | 6,793 | 1.75 | % | $ | 386,261 | $ | 10,512 | 2.72 | % | ||||||||||||||||||
| Noninterest-bearing liabilities: |
||||||||||||||||||||||||||||||||||||
| Demand deposits |
93,583 | 84,876 | 81,033 | |||||||||||||||||||||||||||||||||
| Other Liabilities |
3,114 | 3,423 | 2,823 | |||||||||||||||||||||||||||||||||
| Total liabilities |
$ | 500,091 | $ | 477,438 | $ | 470,117 | ||||||||||||||||||||||||||||||
| Shareholders’ equity |
53,708 | 48,719 | 46,054 | |||||||||||||||||||||||||||||||||
| Total liabilities and shareholders’ equity |
$ | 553,799 | $ | 526,157 | $ | 516,171 | ||||||||||||||||||||||||||||||
| Net interest income |
$ | 23,064 | $ | 21,415 | $ | 19,626 | ||||||||||||||||||||||||||||||
| Net interest spread |
4.06 | % | 3.93 | % | 3.46 | % | ||||||||||||||||||||||||||||||
| Interest expense as a percent of average earning assets |
|
1.05 | % | 1.37 | % | 2.15 | % | |||||||||||||||||||||||||||||
| Net interest margin |
4.38 | % | 4.31 | % | 4.02 | % | ||||||||||||||||||||||||||||||
| (1) | Income and yields are reported on a tax-equivalent basis using a federal tax rate of 34%. |
| (2) | Nonaccrual loans are included in the average loan balance. |
20
Table of Contents
Tax-Equivalent Net Interest Income
(dollars in thousands)
| December 31, | ||||||||||||
| 2010 | 2009 | 2008 | ||||||||||
| GAAP Financial Measurements: |
||||||||||||
| Interest Income - Loans |
$ | 23,529 | $ | 23,001 | $ | 24,790 | ||||||
| Interest Income - Securities and Other Interest-Earnings Assets |
4,260 | 4,452 | 4,649 | |||||||||
| Interest Expense - Deposits |
2,983 | 4,040 | 6,978 | |||||||||
| Interest Expense - Other Borrowings |
2,547 | 2,753 | 3,534 | |||||||||
| Total Net Interest Income |
$ | 22,259 | $ | 20,660 | $ | 18,927 | ||||||
| Non-GAAP Financial Measurements: |
||||||||||||
| Add: Tax Benefit on Tax-Exempt Interest Income - Loans |
$ | 134 | $ | 140 | $ | 111 | ||||||
| Add: Tax Benefit on Tax-Exempt Interest Income - Securities and Other Interest-Earnings Assets |
671 | 615 | 588 | |||||||||
| Total Tax Benefit on Tax-Exempt Interest Income |
$ | 805 | $ | 755 | $ | 699 | ||||||
| Tax-Equivalent Net Interest Income |
$ | 23,064 | $ | 21,415 | $ | 19,626 | ||||||
The average rate on interest-bearing liabilities decreased 38 points from 2009 to 2010 and 97 points from 2008 to 2009. These changes were caused primarily by deposit pricing and product mix. The average rate on total interest-bearing deposits decreased 42 basis points from 2009 to 2010 and 106 basis points from 2008 to 2009. In general, deposit pricing is done in response to monetary policy actions and yield curve changes. Local competition for funds affects the cost of time deposits, which are primarily comprised of certificates of deposit. The Company issues brokered certificates of deposit as a substitute for offering promotional certificates of deposit when their rates are lower. The rates on brokered certificates of deposit are usually comparable with other wholesale funding sources and these funds can be gathered more efficiently without causing existing deposits to reprice. The Company prefers to rely most heavily on non-maturity deposits, which include NOW accounts, money market accounts, and savings accounts. The average balance of non-maturity interest-bearing deposits increased $20,044,000 or 12.8% from $156,499,000 during 2009 to $176,543,000 in 2010 and increased $9,513,000 or 6.5% from $146,986,000 during 2008 to $156,499,000 during 2009. Changes in the average rate on interest-bearing liabilities can also be affected by the pricing on other sources of funds, namely borrowings. The Company utilizes overnight borrowings in the form of federal funds purchased and retail repurchase agreements. The Company also borrows funds for a longer term through wholesale repurchase agreements, which require marketable securities as collateral. The average rate on these borrowings decreased 1 point from 2009 to 2010 and decreased 33 points from 2008 to 2009. The cost of federal funds purchased is affected by the Federal Reserve’s changes in the federal funds target rate, which remained at 0.25% during 2010. The rate on retail repurchase agreements is variable and changes monthly. Finally, the Company borrows from the Federal Home Loan Bank through short and long term advances. The average rate on FHLB advances increased 7 basis points from 2009 to 2010 and decreased 56 basis points from 2008 to 2009. The average balance on FHLB advances decreased $7,432,000 in 2010.
The table titled “Volume and Rate Analysis” provides information about the effect of changes in financial assets and liabilities and changes in rates on net interest income. Tax-equivalent net interest income increased $1,649,000 during 2010. The increase in tax-equivalent net interest income during 2010 is comprised of an increase due to volume of $1,102,000 and an increase due to rate of $547,000. The change in tax-equivalent net interest income during 2010 was primarily affected by low rates on deposits, Federal Home Loan Bank advances, and taxable loans.
21
Table of Contents
Volume and Rate Analysis (Tax-Equivalent Basis)
(dollars in thousands)
| 2010 vs 2009 | 2009 vs 2008 | |||||||||||||||||||||||
| Increase (Decrease) | Increase (Decrease) | |||||||||||||||||||||||
| Due to Changes in: | Due to Changes in: | |||||||||||||||||||||||
| Volume | Rate | Total | Volume | Rate | Total | |||||||||||||||||||
| Earning Assets: |
||||||||||||||||||||||||
| Securities: |
||||||||||||||||||||||||
| Taxable |
$ | 337 | $ | (647 | ) | $ | (310 | ) | $ | 57 | $ | (269 | ) | $ | (212 | ) | ||||||||
| Tax-exempt |
51 | 113 | 164 | 157 | (79 | ) | 78 | |||||||||||||||||
| Loans: |
||||||||||||||||||||||||
| Taxable |
949 | (408 | ) | 541 | 13 | (1,860 | ) | (1,847 | ) | |||||||||||||||
| Tax-exempt |
(27 | ) | 8 | (19 | ) | 92 | (4 | ) | 88 | |||||||||||||||
| Federal funds sold |
(6 | ) | (2 | ) | (8 | ) | (126 | ) | 91 | (35 | ) | |||||||||||||
| Interest-bearing deposits in other banks |
18 | — | 18 | 1 | (3 | ) | (2 | ) | ||||||||||||||||
| Total earning assets |
$ | 1,322 | $ | (936 | ) | $ | 386 | $ | 194 | $ | (2,124 | ) | $ | (1,930 | ) | |||||||||
| Interest-Bearing Liabilities: |
||||||||||||||||||||||||
| NOW accounts |
$ | 67 | $ | (99 | ) | $ | (32 | ) | $ | (5 | ) | $ | (369 | ) | $ | (374 | ) | |||||||
| Money market accounts |
74 | (210 | ) | (136 | ) | 167 | (599 | ) | (432 | ) | ||||||||||||||
| Savings accounts |
15 | (54 | ) | (39 | ) | 17 | (123 | ) | (106 | ) | ||||||||||||||
| Time deposits: |
||||||||||||||||||||||||
| $100,000 and more |
389 | (1,620 | ) | (1,231 | ) | (656 | ) | 146 | (510 | ) | ||||||||||||||
| Less than $100,000 |
(74 | ) | 455 | 381 | 1,045 | (2,561 | ) | (1,516 | ) | |||||||||||||||
| Total interest-bearing deposits |
$ | 471 | $ | (1,528 | ) | $ | (1,057 | ) | $ | 568 | $ | (3,506 | ) | $ | (2,938 | ) | ||||||||
| Federal funds purchased and securities sold under agreements to repurchase |
$ | (7 | ) | $ | 2 | $ | (5 | ) | $ | (37 | ) | $ | (53 | ) | $ | (90 | ) | |||||||
| Federal Home Loan Bank advances |
(244 | ) | 46 | (198 | ) | (286 | ) | (378 | ) | (664 | ) | |||||||||||||
| Trust preferred capital notes |
— | (3 | ) | (3 | ) | — | (27 | ) | (27 | ) | ||||||||||||||
| Total interest-bearing liabilities |
$ | 220 | $ | (1,483 | ) | $ | (1,263 | ) | $ | 245 | $ | (3,964 | ) | $ | (3,719 | ) | ||||||||
| Change in net interest income |
$ | 1,102 | $ | 547 | $ | 1,649 | $ | (51 | ) | $ | 1,840 | $ | 1,789 | |||||||||||
Provision for Loan Losses
The provision for loan losses is based upon management’s estimate of the amount required to maintain an adequate allowance for loan losses as discussed within the Critical Accounting Policies section above. The provision for loan losses was $6,325,000 for 2010, $4,350,000 for 2009, and $2,310,000 for 2008. Changes in the amount of provision for loan losses during each period reflect the results of the Bank’s analysis used to determine the adequacy of the allowance for loan losses. The Company is committed to maintaining an allowance that adequately reflects the risk inherent in the loan portfolio. This commitment is more fully discussed in the “Asset Quality” section.
Noninterest Income
Total noninterest income was $5,449,000, $4,626,000, and $4,609,000 during 2010, 2009, and 2008, respectively. This represents an increase of $873,000 or 18.9% for 2010 and $17,000 or 0.4% for 2009. Management reviews the activities which generate noninterest income on an ongoing basis. The following paragraphs provide information about activities which are included within the respective Consolidated Statements of Income headings.
In 2010, the Company sold $2,853,000 in available for sale securities for a gain of $98,000. In 2009, the Company sold $1,959,000 in available for sale securities for a net loss of $419,000 and a gain of $7,000 was recognized in calls of securities. There were no sales or calls of securities which resulted in a gain or loss during 2008.
Income from fiduciary activities, generated by trust services offered through Eagle Investment Group, was $917,000, $818,000, and $911,000 during 2010, 2009, and 2008, respectively. This represents an increase of $99,000 or 12.1% during 2010 and a decrease of $93,000 or 10.2% during 2009. In 2010, the increase in fiduciary income was based on the higher market value of assets under management.
Service charges on deposit accounts were $1,784,000, $2,053,000, and $2,333,000 during 2010, 2009, and 2008, respectively. This represents a decrease of $269,000 or 13.1% for 2010 and $280,000 or 12.0% for 2009. The primary component of service charges on deposit accounts is overdraft fee income. The decline in income is primarily the result of lower overdraft fee volume. However more recently, regulatory changes on the charges of these type fees have also negatively impacted this item.
Other service charges and fees were $2,993,000, $2,148,000, and $2,565,000 during 2010, 2009, and 2008, respectively. This represents an increase of $845,000 or 39.4% for 2010 and a decrease of $417,000 or 16.3% for 2009. The amount of other services charges and fees is comprised primarily of commissions from the sale of non-deposit investment products, fees received from the Bank’s credit card program, and fees generated from the Bank’s ATM/debit card programs. Commissions from the sale of non-deposit investment products through Eagle Investment
22
Table of Contents
Group were $509,000, $549,000, and $810,000 during 2010, 2009, and 2008, respectively. This represents a decrease of $40,000 or 7.3% during 2010 and $261,000 or 32.2% during 2009. Fees received from the Bank’s credit card program were $577,000, $472,000 and $522,000 during 2010, 2009, and 2008, respectively. This represents an increase of $105,000 or 22.3% during 2010 and a decrease of $50,000 or 9.6% during 2009. Fees generated from the Bank’s ATM/debit card programs were $1,166,000, $719,000, and $844,000 during 2010, 2009, and 2008, respectively. This represents an increase of $447,000 in 2010 and a decrease of $125,000 during 2009. Prior to 2010, ATM income was netted against expenses. This accounting change can be attributed to the increase in 2010. The Dodd-Frank Act amended the Electronic Funds Transfer Act to give the Federal Reserve the authority to establish rules regarding interchange fees charged for electronic debit transactions by payment card issuers. This could potentially lower the Bank’s debit card income significantly in the future.
Other operating income was $128,000, $52,000, and $212,000 for 2010, 2009, and 2008, respectively. This represents an increase of $76,000 or 146.2% during 2010 and a decrease of $160,000 or 75.5% during 2009. The increase in 2010 is from an increase in officer insurance income.
Noninterest Expenses
Total noninterest expenses were $16,809,000, 16,480,000, and $15,814,000 during 2010, 2009, and 2008, respectively. This represents an increase of $329,000 or 2.0% during 2010 and $666,000 or 4.2% during 2009. The efficiency ratio of the Company was 58.23%, 62.28%, and 59.39% for 2010, 2009, and 2008, respectively. The efficiency ratio is calculated by dividing total noninterest expenses by the sum of tax-equivalent net interest income and total noninterest income, excluding certain non-recurring gains and losses. A reconciliation of tax-equivalent net interest income, which is not a measurement under GAAP, to net interest income is presented within the Net Interest Income section above. The following paragraphs provide information about expenses which are included within the respective Consolidated Statements of Income headings.
Salaries and employee benefits were $9,263,000, $9,262,000, and $9,069,000 during 2010, 2009, and 2008, respectively. This represents an increase of $1,000 or 0.0% for 2010 and $193,000 or 2.1% for 2009. Occupancy expenses were $1,142,000, $1,069,000, and $1,189,000 during 2010, 2009, and 2008, respectively. This represents an increase of $73,000 or 6.8% during 2010 and a decrease of $120,000 or 10.1% during 2009. Equipment expenses were $625,000, $665,000, and $700,000 during 2010, 2009, and 2008, respectively. This represents a decrease of $40,000 or 6.0% during 2010 and $35,000 or 5.0% during 2009.
Advertising and marketing expenses were $435,000, $409,000, and $406,000 during 2010, 2009, and 2008, respectively. This represents an increase of $26,000 or 6.4% during 2010 and $3,000 or 0.7% during 2009. This category contains numerous expense types such as advertising, public relations, business development, and charitable contributions. The annual budgeted amount of advertising and marketing expenses is directly related to the Company’s growth in assets. The total amount of advertising and marketing expenses varies based on planned events and advertising campaigns. Expenses are allocated in a manner which focuses on effectively reaching existing and potential customers within the market and contributing to the community.
Other operating expenses were $3,785,000, $3,493,000, and $3,547,000 during 2010, 2009, and 2008. Other operating expenses increased $292,000 or 8.4% during 2010 and decreased $54,000 or 1.5% during 2009. This category is primarily comprised of the cost for services required during normal operations of the Company. Expenses which are directly affected by the number of branch locations and volume of accounts at the Bank include postage, insurance, ATM network fees, and credit card processing fees. Other expenses within this category are auditing fees and computer software expenses.
Income Taxes
Income tax expense was $1,019,000, $1,015,000, and $1,357,000 for the years ended December 31, 2010, 2009, and 2008, respectively. The change in income tax expense can be attributed to changes in taxable earnings at the federal statutory income tax rate of 34%. These amounts correspond to an effective tax rate of 22.04%, 22.78%, and 25.07% for 2010, 2009, and 2008, respectively. Note 8 to the Consolidated Financial Statements provides a reconciliation between income tax expense computed using the federal statutory income tax rate and the Company’s actual income tax expense during 2010, 2009, and 2008.
FINANCIAL CONDITION
Assets, Liabilities and Shareholders Equity
The Company’s total assets were $558,840,000 at December 31, 2010, up $23,455,000 or 4.4% from $535,385,000 at December 31, 2009. Securities increased $12,983,000 or 13.4% from 2009 to 2010. Loans, net of allowance for loan losses, increased by $3,242,000 or 0.8% from 2009 to 2010. Total liabilities were $505,011,000 at December 31, 2010, compared to $483,742,000 at December 31, 2009. Total shareholders’ equity at year end 2010 and 2009 was $53,829,000 and $51,643,000, respectively.
Securities
Total securities at December 31, 2010 were $109,794,000 as compared to $96,811,000 at of December 31, 2009, which represents an increase of $12,983,000 or 13.4% during 2010. The table titled “Securities Portfolio” shows the carrying value of securities at December 31, 2010, 2009, and 2008. The Company purchased $50,180,000 in securities during 2010. This amount includes $29,160,000 or 58.1% in obligations of U.S. government corporations and agencies, $7,583,000 or 15.1% in mortgage-backed securities, and $13,437,000 or 26.8% in obligations of states and political subdivisions. The Company had $34,592,000 in maturities and principal repayments on securities during 2010. This amount includes $23,063,000 or 66.7% in obligations of U.S. government corporations and agencies, $4,030,000 or 11.7% in mortgage-backed securities, $7,309,000 or 21.1% in obligations of states and political subdivisions, and $190,000 or 0.5% in corporate securities. The Company did not have any securities
23
Table of Contents
from a single issuer, other than U.S. government agencies, whose amount exceeded 10% of shareholders’ equity as of December 31, 2010. Note 2 to the Consolidated Financial Statements provides additional details about the Company’s securities portfolio as of December 31, 2010 and 2009.
Securities Portfolio
(dollars in thousands)
| December 31, | ||||||||||||
| 2010 | 2009 | 2008 | ||||||||||
| Securities available for sale: |
||||||||||||
| Obligations of U.S. government corporations and agencies |
$ | 33,150 | $ | 27,045 | $ | 26,286 | ||||||
| Mortgage-backed securities |
16,157 | 15,620 | 20,502 | |||||||||
| Obligations of states and political subdivisions |
42,908 | 37,057 | 31,545 | |||||||||
| Corporate securities |
15,401 | 14,944 | 13,950 | |||||||||
| Equity securities |
2,178 | 2,145 | 2,187 | |||||||||
| $ | 109,794 | $ | 96,811 | $ | 94,470 | |||||||
The ability to dispose of available for sale securities prior to maturity provides management more options to react to future rate changes and provides more liquidity, when needed, to meet short-term obligations. The Company had a net unrealized gain on available for sale securities of $2,343,000 and $2,167,000 at December 31, 2010 and 2009, respectively. Unrealized gains or losses on available for sale securities are reported within shareholders’ equity, net of the related deferred tax effect, as accumulated other comprehensive income.
The table titled “Maturity Distribution and Yields of Securities” shows the maturity period and average yield for the different types of securities in the portfolio at December 31, 2010. The table indicates that $82,060,000 or 72.1% of the portfolio will mature within five years. Although mortgage-backed securities have definitive maturities, they provide monthly principal curtailments which can be reinvested at a prevailing rate and for a different term.
Maturity Distribution and Yields of Securities
(dollars in thousands)
| December 31, 2010 | ||||||||||||||||||||||||||||||||||||||||
| Due after 10 years | ||||||||||||||||||||||||||||||||||||||||
| Due in one year | Due after 1 | Due after 5 | and | |||||||||||||||||||||||||||||||||||||
| or less | through 5 years | through 10 years | Equity Securities | Total | ||||||||||||||||||||||||||||||||||||
| Amount | Yield | Amount | Yield | Amount | Yield | Amount | Yield | Amount | Yield | |||||||||||||||||||||||||||||||
| Securities available for sale: |
||||||||||||||||||||||||||||||||||||||||
| Obligations of U.S. government corporations and agencies |
$ | — | — | $ | 18,738 | 2.45 | % | $ | 13,384 | 3.23 | % | $ | 1,028 | 2.50 | % | $ | 33,150 | 2.77 | % | |||||||||||||||||||||
| Mortgage-backed securities |
— | 1,240 | 5.21 | % | 4,812 | 3.51 | % | 10,105 | 3.78 | % | 16,157 | 3.80 | % | |||||||||||||||||||||||||||
| Corporate securities |
1,533 | 6.56 | % | 5,351 | 6.65 | % | 5,281 | 6.11 | % | 3,236 | 1.62 | % | 15,401 | 6.08 | % | |||||||||||||||||||||||||
| Obligations of states and political subdivisions, taxable |
— | — | 260 | 3.98 | % | 4,713 | 2.51 | % | 3,070 | 5.51 | % | 8,043 | 3.72 | % | ||||||||||||||||||||||||||
| Equity securities |
— | — | — | 2,178 | 11.15 | % | 2,178 | 11.15 | % | |||||||||||||||||||||||||||||||
| Total taxable |
$ | 1,533 | $ | 25,589 | $ | 28,190 | $ | 19,617 | $ | 74,929 | ||||||||||||||||||||||||||||||
| Obligations of states and political subdivisions, tax-exempt (1) |
— | — | 15,612 | 5.60 | % | 11,136 | 5.60 | % | 8,117 | 4.85 | % | 34,865 | 5.42 | % | ||||||||||||||||||||||||||
| Total |
$ | 1,533 | $ | 41,201 | $ | 39,326 | $ | 27,734 | $ | 109,794 | ||||||||||||||||||||||||||||||
| (1) | Yields on tax-exempt securities have been computed on a tax-equivalent basis using a federal tax rate of 34%. |
Loan Portfolio
The Company’s primary use of funds is supporting lending activities from which it derives the greatest amount of interest income. Gross loans were $408,449,000 and $404,066,000 at December 31, 2010 and 2009, respectively. This represents an increase of $4,383,000 or 1.1% for 2010. The ratio of loans to deposits decreased during the year from 101.5% to 95.1% at December 31, 2009 and 2010, respectively. The table titled “Loan Portfolio” shows the composition of the loan portfolio over the last five years.
24
Table of Contents
Loan Portfolio
(dollars in thousands)
| December 31, | ||||||||||||||||||||
| 2010 | 2009 | 2008 | 2007 | 2006 | ||||||||||||||||
| Loans secured by real estate: |
||||||||||||||||||||
| Construction and land development |
$ | 31,560 | $ | 34,531 | $ | 36,990 | $ | 33,268 | $ | 46,477 | ||||||||||
| Secured by farmland |
4,332 | 5,636 | 5,305 | 7,468 | 6,859 | |||||||||||||||
| Secured by 1-4 family residential properties |
207,671 | 205,579 | 189,874 | 182,343 | 173,839 | |||||||||||||||
| Multifamily |
4,908 | 3,112 | 2,973 | 2,685 | 3,156 | |||||||||||||||
| Commercial |
116,381 | 109,516 | 107,749 | 108,880 | 98,369 | |||||||||||||||
| Loans to farmers |
1,293 | 1,284 | 1,065 | 1,039 | 1,406 | |||||||||||||||
| Commercial and industrial loans |
24,449 | 24,268 | 23,629 | 27,027 | 26,938 | |||||||||||||||
| Consumer installment loans |
14,518 | 16,115 | 18,835 | 25,368 | 28,382 | |||||||||||||||
| All other loans |
3,337 | 4,025 | 3,666 | 1,583 | 620 | |||||||||||||||
| Total loans |
$ | 408,449 | $ | 404,066 | $ | 390,086 | $ | 389,661 | $ | 386,046 | ||||||||||
Loans secured by real estate were $364,852,000 or 89.3% and $358,374,000 or 88.7% of total loans at December 31, 2010 and 2009, respectively. This represents an increase of $6,478,000 or 1.8% for 2010. Consumer installment loans were $14,518,000 or 3.6% and $16,115,000 or 4.0% of total loans at December 31, 2010 and 2009, respectively. This represents a decrease of $1,597,000 or 9.9% for 2010. Commercial and industrial loans were $24,449,000 or 6.0% and $24,268,000 of 6.0% of total loans at December 31, 2010 and 2009. This represents an increase of $181,000 or 0.8% for 2010.
The table titled “Maturity Schedule of Selected Loans” shows the different loan categories and the period during which they mature. For loans maturing in more than one year, the table also shows a breakdown between fixed rate loans and floating rate loans. The table indicates that $348,999,000 or 85.4% of the loan portfolio matures within five years. The floating rate loans maturing after five years are primarily comprised of home equity lines of credit.
Maturity Schedule of Selected Loans
(dollars in thousands)
| December 31, 2010 | ||||||||||||||||
| Within 1 Year |
After 1 Year Within 5 Years |
After 5 Years |
Total | |||||||||||||
| Loans secured by real estate: |
||||||||||||||||
| Construction and land development |
$ | 24,345 | $ | 7,062 | $ | 153 | $ | 31,560 | ||||||||
| Secured by farmland |
1,569 | 2,324 | 439 | 4,332 | ||||||||||||
| Secured by 1-4 family residential properties |
35,203 | 122,329 | 50,139 | 207,671 | ||||||||||||
| Multifamily |
1,068 | 3,840 | — | 4,908 | ||||||||||||
| Commercial |
19,276 | 90,205 | 6,900 | 116,381 | ||||||||||||
| Loans to farmers |
839 | 454 | — | 1,293 | ||||||||||||
| Commercial and industrial loans |
15,211 | 7,628 | 1,610 | 24,449 | ||||||||||||
| Consumer installment loans |
1,837 | 12,472 | 209 | 14,518 | ||||||||||||
| All other loans |
300 | 3,037 | — | 3,337 | ||||||||||||
| $ | 99,648 | $ | 249,351 | $ | 59,450 | $ | 408,449 | |||||||||
| For maturities over one year: |
||||||||||||||||
| Floating rate loans |
$ | 20,916 | $ | 14,223 | $ | 35,139 | ||||||||||
| Fixed rate loans |
228,435 | 45,227 | 273,662 | |||||||||||||
| $ | 249,351 | $ | 59,450 | $ | 308,801 | |||||||||||
Asset Quality
The Company has policies and procedures designed to control credit risk and to maintain the quality of its loan portfolio. These include underwriting standards for new originations and ongoing monitoring and reporting of asset quality and adequacy of the allowance for loan losses. There was $10,182,000 in total non-performing assets, which consist of non-accrual loans, foreclosed property, and repossessed assets at December 31, 2010. This is an increase of $2,284,000 when compared to the December 31, 2009 balance of $7,898,000.
Nonaccrual loans were $8,377,000 and $5,099,000 at December 31, 2010 and 2009, respectively. The gross amount of interest income that would have been recognized on nonaccrual loans was $341,000 for 2010 and $403,000 for 2009. None of this interest income was included in net
25
Table of Contents
income for 2010 or 2009. Management evaluates the financial condition of these borrowers and the value of any collateral on these loans. The results of these evaluations are used to estimate the amount of losses which may be realized on the disposition of these nonaccrual loans. Nonaccrual loans that were evaluated for impairment at December 31, 2010 totaled $6,439,000 and had $1,150,000 in specific allocations.
Foreclosed property decreased to $1,783,000 at December 31, 2010, compared to $2,776,000 at December 31, 2009. When the property is sold, the difference between the amount of other real estate owned and the settlement proceeds is recognized as a gain or loss on the sale of other real estate owned. A loss of $338,000 was recognized on the sale of other real estate owned during 2010.
Total loans past due 90 days or more and still accruing interest were $10,000 or less than 0.01%, $13,000 or less than 0.01%, and $509,000 or 0.13% of total loans at December 31, 2010, 2009, and 2008, respectively. The loans past due 90 days or more and still accruing interest are secured and in the process of collection; therefore, they are not classified as nonaccrual.
Nonperforming and Other Assets
Nonperforming assets consist of nonaccrual loans, other real estate owned (foreclosed properties), and repossessed assets. The table titled “Nonperforming Assets” shows the amount of nonperforming assets and loans past due 90 days and accruing interest outstanding during the last five years. The table also shows the ratios for the allowance for loan losses as a percentage of nonperforming assets and nonperforming assets as a percentage of loans outstanding and other real estate owned.
Loans are placed on non-accrual status when collection of principal and interest is doubtful, generally when a loan becomes 90 days past due. There are three negative implications for earnings when a loan is placed on non-accrual status. First, all interest accrued but unpaid at the date that the loan is placed on non-accrual status is either deducted from interest income or written off as a loss. Second, accruals of interest are discontinued until it becomes certain that both principal and interest can be repaid. Finally, there may be actual losses that require additional provisions for loan losses to be charged against earnings.
For real estate loans, upon foreclosure, the balance of the loan is transferred to “Other Real Estate Owned” (“OREO”) and carried at the lower of the outstanding loan balance or the fair market value of the property based on current appraisals and other current market trends, less selling costs. If a write down of the OREO property is necessary at the time of foreclosure, the amount is charged-off against the allowance for loan losses. A review of the recorded property value is performed in conjunction with normal loan reviews, and if market conditions indicate that the recorded value exceeds the fair market value, additional write downs of the property value are charged directly to operations.
In addition, the Company may, under certain circumstances, restructure loans in troubled debt restructurings as a concession to a borrower when the borrower is experiencing financial distress. Formal, standardized loan restructuring programs are not utilized by the Company. Each loan considered for restructuring is evaluated based on customer circumstances and may include modifications to one or more loan provision. Such restructured loans are included in impaired loans. At December 31, 2010, the Company had $8,469,000 in restructured loans. There were no restructured loans at December 31, 2009 and 2008.
Nonperforming Assets
(dollars in thousands)
| December 31, | ||||||||||||||||||||
| 2010 | 2009 | 2008 | 2007 | 2006 | ||||||||||||||||
| Nonaccrual loans |
$ | 8,377 | $ | 5,099 | $ | 3,385 | $ | — | $ | — | ||||||||||
| Other real estate owned and repossessed assets |
1,805 | 2,776 | 734 | 215 | 215 | |||||||||||||||
| Total nonperforming assets |
$ | 10,182 | $ | 7,875 | $ | 4,119 | $ | 215 | $ | 215 | ||||||||||
| Loans past due 90 days and accruing interest |
$ | 10 | $ | 13 | $ | 509 | $ | 813 | $ | 484 | ||||||||||
| Allowance for loan losses to nonperforming assets |
70 | % | 76 | % | 110 | % | 1484 | % | 1539 | % | ||||||||||
| Non-performing assets to period end loans and other real estate owned |
2.48 | % | 1.94 | % | 1.05 | % | 0.06 | % | 0.06 | % | ||||||||||
Allowance for Loan Losses
The purpose and the methods for measuring the allowance for loans are discussed in the Critical Accounting Policies section above. The table titled “Analysis of Allowance for Loan Losses” shows the activity within the allowance during the last five years, including a breakdown of the loan types which were charged-off and recovered.
Charged-off loans were $5,475,000, $3,153,000, and $1,077,000 for 2010, 2009, and 2008, respectively. Recoveries were $291,000, $252,000, and $97,000 for 2010, 2009, and 2008, respectively. Net charge-offs were $5,184,000, $2,901,000, and $980,000 for 2010, 2009, and 2008, respectively. This represents an increase in net charge-offs of $2,283,000 or 78.7% for 2010 and $1,921,000 or 196.0% for 2009. The allowance for loan losses as a percentage of loans was 1.74%, 1.48%, and 1.16% at the end of 2010, 2009, and 2008, respectively. The allowance for
26
Table of Contents
loan losses at year-end covered net charge-offs during the year by 1.37 times for 2010, 2.06 times for 2009, and 4.61 times for 2008. The ratio of net charge-offs to average loans was 1.27% for 2010, 0.74% for 2009, and 0.25% for 2008.
The table titled “Allocation of Allowance for Loan Losses” shows the amount of the allowance for loan losses which is allocated to the indicated loan categories, along with that category’s percentage of total loans, at December 31, 2010, 2009, 2008, 2007, and 2006. The amount of allowance for loan losses allocated to each loan category is based on the amount delinquent loans in that loan category, the status of nonperforming assets in that loan category, the historical losses for that loan category, and the financial condition of certain borrowers whose financial conditional is monitored on a periodic basis. Management believes that the allowance for loan losses is adequate based on the loan portfolio’s current risk characteristics.
Analysis of Allowance for Loan Losses
(dollars in thousands)
| December 31, | ||||||||||||||||||||
| 2010 | 2009 | 2008 | 2007 | 2006 | ||||||||||||||||
| Balance, beginning of period |
$ | 5,970 | $ | 4,521 | $ | 3,191 | $ | 3,308 | $ | 3,582 | ||||||||||
| Loans Charged-Off: |
||||||||||||||||||||
| Commercial, financial and agricultural |
1,077 | 466 | 261 | 131 | 375 | |||||||||||||||
| Real estate-construction and land development |
2,917 | 1,090 | 256 | 141 | — | |||||||||||||||
| Real estate-mortgage |
1,239 | 1,141 | 306 | 96 | 128 | |||||||||||||||
| Consumer |
242 | 456 | 254 | 437 | 231 | |||||||||||||||
| Total loans charged off |
$ | 5,475 | $ | 3,153 | $ | 1,077 | $ | 805 | $ | 734 | ||||||||||
| Recoveries: |
||||||||||||||||||||
| Commercial, financial and agricultural |
$ | 72 | $ | 98 | $ | — | $ | 40 | $ | 1 | ||||||||||
| Real estate-construction and land development |
— | — | 14 | — | — | |||||||||||||||
| Real estate-mortgage |
102 | — | 2 | 2 | — | |||||||||||||||
| Consumer |
117 | 154 | 81 | 96 | 159 | |||||||||||||||
| Total recoveries |
$ | 291 | $ | 252 | $ | 97 | $ | 138 | $ | 160 | ||||||||||
| Net charge-offs |
5,184 | 2,901 | 980 | 667 | 574 | |||||||||||||||
| Provision for loan losses |
6,325 | 4,350 | 2,310 | 550 | 300 | |||||||||||||||
| Balance, end of period |
$ | 7,111 | $ | 5,970 | $ | 4,521 | $ | 3,191 | $ | 3,308 | ||||||||||
| Ratio of allowance for loan losses to loans outstanding at period end |
1.74 | % | 1.48 | % | 1.16 | % | 0.82 | % | 0.86 | % | ||||||||||
| Ratio of net charge offs to average loans outstanding during the period |
1.27 | % | 0.74 | % | 0.25 | % | 0.17 | % | 0.16 | % | ||||||||||
Allocation of Allowance for Loan Losses
(dollars in thousands)
| Commerical, Financial, | Real Estate | Real Estate | Consumer and | |||||||||||||||||||||||||||||
| and Agricultural | Construction | Mortgage | Other Loans | |||||||||||||||||||||||||||||
| Allowance for Loan Losses |
Percent of Loans in Category to Total Loans |
Allowance for Loan Losses |
Percent of Loans in Category to Total Loans |
Allowance for Loan Losses |
Percent of Loans in Category to Total Loans |
Allowance for Loan Losses |
Percent of Loans in Category to Total Loans |
|||||||||||||||||||||||||
| December 31, 2010 |
$ | 819 | 6.0 | % | $ | 1,386 | 8.8 | % | $ | 4,688 | 80.5 | % | $ | 218 | 4.7 | % | ||||||||||||||||
| December 31, 2009 |
$ | 1,417 | 7.3 | % | $ | 1,735 | 8.5 | % | $ | 2,464 | 80.1 | % | $ | 354 | 4.1 | % | ||||||||||||||||
| December 31, 2008 |
$ | 567 | 7.3 | % | $ | 1,580 | 9.5 | % | $ | 2,130 | 78.4 | % | $ | 244 | 4.8 | % | ||||||||||||||||
| December 31, 2007 |
$ | 795 | 7.6 | % | $ | 343 | 8.5 | % | $ | 1,830 | 77.4 | % | $ | 223 | 6.5 | % | ||||||||||||||||
| December 31, 2006 |
$ | 705 | 7.5 | % | $ | 509 | 12.0 | % | $ | 1,886 | 71.4 | % | $ | 208 | 9.1 | % | ||||||||||||||||
27
Table of Contents
Deposits
Total deposits were $429,296,000 and $398,107,000 at December 31, 2010 and 2009, respectively, which represents an increase of $31,189,000 or 7.8% during 2010. The table titled “Average Deposits and Rates Paid” shows the average deposit balances and average rates paid for 2010, 2009 and 2008.
Average Deposits and Rates Paid
(dollars in thousands)
| December 31, | ||||||||||||||||||||||||
| 2010 | 2009 | 2008 | ||||||||||||||||||||||
| Amount | Rate | Amount | Rate | Amount | Rate | |||||||||||||||||||
| Noninterest-bearing |
$ | 93,583 | $ | 84,876 | $ | 81,033 | ||||||||||||||||||
| Interest-bearing: |
||||||||||||||||||||||||
| NOW accounts |
69,154 | 0.40 | % | 60,338 | 0.51 | % | 60,774 | 1.12 | % | |||||||||||||||
| Money market accounts |
66,819 | 0.61 | % | 60,001 | 0.90 | % | 52,464 | 1.86 | % | |||||||||||||||
| Regular savings accounts |
40,570 | 0.17 | % | 36,160 | 0.30 | % | 33,748 | 0.63 | % | |||||||||||||||
| Time deposits: |
||||||||||||||||||||||||
| $100,000 and more |
59,944 | 1.18 | % | 51,455 | 3.77 | % | 68,732 | 3.57 | % | |||||||||||||||
| Less than $100,000 |
87,940 | 1.73 | % | 94,523 | 1.21 | % | 74,445 | 3.57 | % | |||||||||||||||
| Total interest-bearing |
$ | 324,427 | 0.92 | % | $ | 302,477 | 1.34 | % | $ | 290,163 | 2.40 | % | ||||||||||||
| Total deposits |
$ | 418,010 | $ | 387,353 | $ | 371,196 | ||||||||||||||||||
Noninterest-bearing demand deposits, which are comprised of checking accounts, increased $7,681,000 or 8.5% from $90,575,000 at December 31, 2009 to $98,256,000 at December 31, 2010. Interest-bearing deposits, which include NOW accounts, money market accounts, regular savings accounts and time deposits, increased $23,508,000 or 7.6% from $307,532,000 at December 31, 2009 to $331,040,000 at December 31, 2010. Total NOW account balances increased $1,000,000 or 1.4% from $71,413,000 at December 31, 2009 to $72,413,000 at December 31, 2010. Total money market account balances increased $7,832,000 or 12.6% from $61,934,000 at December 31, 2009 to $69,766,000 at December 31, 2010. Total regular savings account balances increased $5,231,000 or 14.1% from $37,138,000 at December 31, 2009 to $42,369,000 at December 31, 2010. Time deposits increased $9,445,000 or 6.9% from $137,047,000 at December 31, 2009 to $146,492,000 at December 31, 2010. This is comprised of an increase in certificates of deposit of $100,000 and more of $4,245,000 or 9.4% from $45,252,000 at December 31, 2009 to $49,497,000 at December 31, 2010 and a decrease in certificates of deposit of less than $100,000 of $7,785,000 or 10.7% from $72,882,000 at December 31, 2009 to $65,097,000 at December 31, 2010. Brokered certificates of deposits less than $100,000 increased $9,150,000 or 83.0% from $11,022,000 at December 31, 2009 to $20,172,000 at December 31, 2010. This included $19,905,000 of traditional brokered certificates of deposit and $267,000 of certificates obtained through the CDARS network. Brokered certificates of deposits, greater than $100,000, increased $3,835,000 or 0.5% from $7,891,000 at December 31, 2009 to $11,726,000 at December 31, 2010. These certificates were obtained through the CDARS network. The Bank joined the CDARS network in 2008, which allows it to offer over $50 million in FDIC insurance on a certificate of deposit.
The Company attempts to fund asset growth with deposit accounts and focus upon core deposit growth as its primary source of funding. Core deposits consist of checking accounts, NOW accounts, money market accounts, regular savings accounts, and time deposits of less than $100,000, excluding brokered certificates of deposit. Core deposits totaled $347,901,000 or 4.2% and $333,942,000 or 10.6% of total deposits at December 31, 2010 and 2009, respectively.
The table titled “Maturities of Certificates of Deposit and Other Time Deposits of $100,000 and Greater” shows the amount of certificates of deposit of $100,000 and more maturing within the time period indicated at December 31, 2010. The Company’s policy is to issue these certificates for terms of twelve months or less, however, exceptions have been made as indicated by the $5,305,000 which matures over one year. The total amount maturing within one year is $55,918,000 or 91.3% of the total amount outstanding.
Maturities of Certificates of Deposit and Other Time Deposits of $100,000 and Greater
(dollars in thousands)
| Within Three Months |
Three to Six Months |
Six to Twelve Months |
Over One Year |
Total | Percent of Total Deposits |
|||||||||||||||||||
| At December 31, 2010 |
$ | 25,144 | $ | 15,369 | $ | 15,405 | $ | 5,305 | $ | 61,223 | 14.26 | % | ||||||||||||
28
Table of Contents
CAPITAL RESOURCES
The Company continues to be a well capitalized financial institution. Total shareholders’ equity on December 31, 2010 was $53,829,000, reflecting a percentage of total assets of 9.63% as compared to $51,643,000 and 9.65% at December 31 2009. The common stock’s book value per share increased $0.45 or 2.8% to $16.50 per share at December 31, 2010 from 16.05 per share at December 31, 2009. During 2010, the Company paid $0.69 per share in dividends as compared to $0.68 per share for 2009 and $0.67 per share for 2008. The Company has a Dividend Investment Plan that reinvests the dividends of the shareholder in Company stock.
Analysis of Capital
(dollars in thousands)
| December 31, 2010 |
December 31, 2009 |
|||||||
| Tier 1 Capital: |
||||||||
| Common stock |
$ | 8,124 | $ | 7,999 | ||||
| Capital surplus |
9,076 | 8,504 | ||||||
| Retained earnings |
35,419 | 34,048 | ||||||
| Trust preferred capital notes |
7,000 | 7,000 | ||||||
| Core deposit intangible |
— | (45 | ) | |||||
| Net unrealized loss on available for sale equity securities |
— | — | ||||||
| Total Tier 1 capital |
$ | 59,619 | $ | 57,506 | ||||
| Tier 2 Capital: |
||||||||
| Allowance for loan losses |
$ | 5,072 | $ | 5,000 | ||||
| Total Tier 2 capital |
$ | 5,072 | $ | 5,000 | ||||
| Total risk-based capital |
$ | 64,691 | $ | 62,506 | ||||
| Risk weighted assets |
$ | 403,738 | $ | 399,047 | ||||
| Risk Based Capital Ratios: |
||||||||
| Tier 1 risk-based capital ratio |
14.77 | % | 14.41 | % | ||||
| Total risk-based capital ratio |
16.02 | % | 15.66 | % | ||||
| Tier 1 leverage ratio |
10.62 | % | 10.84 | % | ||||
Federal regulatory risk-based capital guidelines require percentages to be applied to various assets, including off-balance sheet assets, based on their perceived risk in order to calculate risk-weighted assets. Tier 1 capital consists of total shareholders’ equity plus qualifying trust preferred securities outstanding less net unrealized gains and losses on available for sale securities, goodwill and other intangible assets. Total capital is comprised of Tier 1 capital plus the allowable portion of the allowance for loan losses and any excess trust preferred securities that do not qualify as Tier 1 capital. The $7,000,000 in trust preferred securities, issued by the Company during 2007, qualifies as Tier 1 capital because this amount does not exceed 25% of total capital, including the trust preferred securities. Financial institutions must maintain a Tier 1 risk-based capital ratio of at least 4%, a total risk-based capital ratio of at least 8% and a minimum Tier 1 leverage ratio of 4%. The Company’s policy requires a Tier 1 risk-based capital ratio of at least 8%, a total risk-based capital ratio of at least 10% and a minimum Tier 1 leverage ratio of 5%. The Company monitors these ratios on a quarterly basis and has several strategies, including without limitation the issuance of common stock or trust preferred securities, to ensure that these ratios remain above regulatory minimums. The table titled “Analysis of Capital” shows the components of Tier 1 capital, Tier 2 capital, the amount of total risk-based capital and risk-weighted assets, and the risk based capital ratios for the Company at December 31, 2010 and 2009.
Note 15 to the Consolidated Financial Statements provides additional discussion and analysis of regulatory capital requirements.
LIQUIDITY
Liquidity management involves meeting the present and future financial obligations of the Company with the sale or maturity of assets or with the occurrence of additional liabilities. Liquidity needs are met with cash on hand, deposits in banks, federal funds sold, securities classified as available for sale and loans maturing within one year. At December 31, 2010 liquid assets totaled $227,394,000 as compared to $205,709,000 at December 31, 2009. These amounts represent 45.0% and 42.5% of total liabilities at December 31, 2010 and 2009, respectively. Securities provide a constant source of liquidity through paydowns and maturities. Also, the Company maintains short-term borrowing arrangements, namely federal funds lines of credit, with larger financial institutions as an additional source of liquidity. The Bank’s membership with the Federal Home Loan Bank of Atlanta also provides a source of borrowings with numerous rate and term structures. The Company’s senior management monitors the liquidity position regularly and attempts to maintain a position which utilizes available funds most efficiently. As a result of the Company’s management of liquid assets and the ability to generate liquidity through liability funding, management believes that the Company maintains overall liquidity sufficient to satisfy its depositors’ requirements and meet its customers’ credit needs.
29
Table of Contents
OFF-BALANCE SHEET ARRANGEMENTS AND CONTRACTUAL OBLIGATIONS
Note 18 to the Consolidated Financial Statements provides information about the off-balance sheet arrangements which arise through the lending activities of the Company. These arrangements increase the degree of both credit and interest rate risk beyond that which is recognized through the financial assets and liabilities on the consolidated balance sheets.
The table titled “Contractual Obligations and Scheduled Payments” presents the Company’s contractual obligations and scheduled payment amounts due within the period indicated at December 31, 2010.
Contractual Obligations and Scheduled Payments
(dollars in thousands)
| December 31, 2010 | ||||||||||||||||||||
| Less than One Year |
One Year through Three Years |
Three Years through Five Years |
More than Five Years |
Total | ||||||||||||||||
| FHLB advances |
$ | 20,000 | $ | 20,000 | $ | 12,250 | $ | — | $ | 52,250 | ||||||||||
| Trust preferred capital notes |
— | — | — | 7,217 | 7,217 | |||||||||||||||
| Securities sold under agreements to repurchase |
4,395 | 10,000 | — | — | 14,395 | |||||||||||||||
| Operating leases |
103 | 184 | 98 | 839 | 1,224 | |||||||||||||||
| $ | 24,498 | $ | 30,184 | $ | 12,348 | $ | 8,056 | $ | 75,086 | |||||||||||
The $52,250,000 in outstanding FHLB advances is comprised of six advances. Note 7 to the Consolidated Financial Statements discusses the rates, terms, and conversion features on these advances. The trust preferred capital notes are discussed in Note 19 to the Consolidated Financial Statements. The payments due on operating leases are discussed in Note 5 to the Consolidated Financial Statements.
30
Table of Contents
| Item 7A. | Quantitative and Qualitative Disclosures about Market Risk |
As the holding company of the Bank, the Company’s primary component of market risk is interest rate volatility. Interest rate fluctuations will impact the amount of interest income and expense the Bank receives or pays on almost all of its assets and liabilities and the market value of its interest-earning assets and interest-bearing liabilities, excluding those which have a very short term until maturity. Interest rate risk exposure of the Company is, therefore, experienced at the Bank level. Asset / liability management attempts to maximize the net interest income of the Company by adjusting the volume and price of rate sensitive assets and liabilities. The Company does not subject itself to foreign currency exchange or commodity price risk due to prohibition through policy and the current nature of operations. Note 13 to the Consolidated Financial Statements discusses derivative instruments and hedging activities of the Company. The Company entered into an interest rate swap agreement related to the outstanding trust preferred capital notes during 2008.
The Bank’s interest rate management strategy is designed to maximize net interest income and preserve the capital of the Company. The Bank’s financial instruments are periodically subjected to various simulations whose results are discussed in the following paragraphs. These models are based on actual data from the Bank’s financial statements and assumptions about the performance of certain financial instruments. Prepayment assumptions are applied to all mortgage related assets, which includes real estate loans and mortgage-backed securities. Prepayment assumptions are based on a median rate at which principal payments are received on these assets over their contractual term. The rate of principal payback is assumed to increase when rates fall and decrease when rates rise. Term assumptions are applied to non-maturity deposits, which includes demand deposits, NOW accounts, savings accounts, and money market accounts. Demand deposits and NOW accounts are generally assumed to have a term greater than one year since the total amount outstanding does not fluctuate with changes in interest rates. Savings accounts and money market accounts are assumed to be more interest rate sensitive, therefore, a majority of the amount outstanding is assumed to have a term of less than one year.
The simulation analysis evaluates the potential effect of upward and downward changes in market interest rates on future net interest income. The analysis involves change in the interest rates used in determining net interest income over the next twelve months. The model utilizes the static approach for the down 100 basis point and up 200 basis point rate shifts which assume changes in interest rates without any management response to change the composition of the balance sheet. The model considered a 24 month period when simulating a 400 basis point rate increase. The simulation analysis results are presented in the table below:
Year 1 Net Interest Income Simulation
(dollars in thousands)
| Change in Net Interest Income |
||||||||
| Assumed Market Interest Rate Shift |
Dollars | Percent Change | ||||||
| –100 BP Shock |
$ | (75 | ) | –0.34 | % | |||
| +200 BP Shock |
$ | (202 | ) | –0.91 | % | |||
| +400 BP Shock |
$ | (202 | ) | –0.91 | % | |||
The Bank uses simulation analysis to assess earnings at risk and economic value of equity (EVE) analysis to assess economic value at risk. This analysis method allows management to regularly monitor the direction and magnitude of the Bank’s interest rate risk exposure. The modeling techniques cannot be measured with complete precision. Maturity and repricing characteristics of assets and liabilities, prepayments on amortizing assets, non-maturity deposit sensitivity and loan and deposit pricing are key assumptions used in acquiring this analysis. There is a realm of uncertainty in using these assumptions but the analysis does provide the Bank with the ability to estimate interest rate risk position over time.
The table below examines the Economic Value of Equity (EVE). The EVE of the balance sheet is defined as the discounted present value of expected asset cash flows minus the discounted present value of the expected liability cash flows. The analysis involves changing the interest rates used in determining the expected cash flows and in discounting the cash flows. The model indicates an exposure to falling interest rates, while showing an increase in EVE when rates rise. These results are driven primarily by the relative increase in value of the Bank’s core deposit base as rates rise.
Static EVE Change
(dollars in thousands)
| Change in EVE | ||||||||
| Assumed Market Interest Rate Shift |
Dollars | Percent Change | ||||||
| –100 BP Shock |
$ | (985 | ) | –1.14 | % | |||
| +100 BP Shock |
$ | (1,262 | ) | –1.46 | % | |||
| +200 BP Shock |
$ | (3,968 | ) | –4.60 | % | |||
| +300 BP Shock |
$ | (7,301 | ) | –8.46 | % | |||
31
Table of Contents
| Item 8. | Financial Statements and Supplementary Data |

REPORT OF INDEPENDENT REGISTERED PUBLIC ACCOUNTING FIRM
To the Board of Directors and Shareholders of
Eagle Financial Services, Inc.
Berryville, Virginia
We have audited the accompanying consolidated balance sheets of Eagle Financial Services, Inc. and its subsidiaries as of December 31, 2010 and 2009, and the related consolidated statements of income, changes in shareholders’ equity, and cash flows for each of the years in the three-year period ended December 31, 2010. The management of Eagle Financial Services, Inc. and its subsidiaries (the Company) is responsible for these consolidated financial statements. Our responsibility is to express an opinion on these consolidated financial statements based on our audits.
We conducted our audits in accordance with the standards of the Public Company Accounting Oversight Board (United States). Those standards require that we plan and perform the audit to obtain reasonable assurance about whether the consolidated financial statements are free of material misstatement. The Company is not required to have, nor were we engaged to perform, an audit of its internal control over financial reporting. Our audits included consideration of internal control over financial reporting as a basis for designing audit procedures that are appropriate in the circumstances, but not for the purpose of expressing an opinion on the effectiveness of the Company’s internal control over financial reporting. Accordingly, we express no such opinion. An audit also includes examining, on a test basis, evidence supporting the amounts and disclosures in the financial statements, assessing the accounting principles used and significant estimates made by management, as well as evaluating the overall financial statement presentation. We believe that our audits provide a reasonable basis for our opinion.
In our opinion, the consolidated financial statements referred to above present fairly, in all material respects, the financial position of Eagle Financial Services, Inc. and its subsidiaries as of December 31, 2010 and 2009, and the results of their operations and their cash flows for each of the years in the three-year period ended December 31, 2010 in conformity with accounting principles generally accepted in the United State of America.
/s/ SMITH ELLIOTT KEARNS & COMPANY, LLC
SMITH ELLIOTT KEARNS & COMPANY, LLC
Chambersburg, Pennsylvania
March 30, 2011
32
Table of Contents
EAGLE FINANCIAL SERVICES, INC. AND SUBSIDIARIES
Consolidated Balance Sheets
December 31, 2010 and 2009
(dollars in thousands, except share amounts)
| 2010 | 2009 | |||||||
| Assets |
||||||||
| Cash and due from banks |
$ | 6,884 | $ | 7,271 | ||||
| Interest-bearing deposits with other institutions |
7,086 | 83 | ||||||
| Federal funds sold |
— | 179 | ||||||
| Total cash and cash equivalents |
13,970 | 7,533 | ||||||
| Securites available for sale, at fair value |
109,794 | 96,811 | ||||||
| Restricted investments |
3,982 | 4,399 | ||||||
| Loans, net of allowance for loan losses of $7,111 in 2010 and $5,970 in 2009 |
401,338 | 398,096 | ||||||
| Bank premises and equipment, net |
15,712 | 14,778 | ||||||
| Other real estate owned |
1,783 | 2,776 | ||||||
| Other assets |
12,261 | 10,992 | ||||||
| Total assets |
$ | 558,840 | $ | 535,385 | ||||
| Liabilities and Shareholders’ Equity |
||||||||
| Liabilities |
||||||||
| Deposits: |
||||||||
| Noninterest bearing demand deposits |
$ | 98,256 | $ | 90,575 | ||||
| Savings and interest bearing demand deposits |
184,548 | 170,485 | ||||||
| Time deposits |
146,492 | 137,047 | ||||||
| Total deposits |
$ | 429,296 | $ | 398,107 | ||||
| Federal funds purchased and securities sold under agreements to repurchase |
14,395 | 14,016 | ||||||
| Federal Home Loan Bank advances |
52,250 | 62,250 | ||||||
| Trust preferred capital notes |
7,217 | 7,217 | ||||||
| Other liabilities |
1,853 | 2,152 | ||||||
| Total liabilities |
$ | 505,011 | $ | 483,742 | ||||
| Shareholders’ Equity |
||||||||
| Preferred stock, $10 par value; 500,000 shares authorized and unissued |
$ | — | $ | — | ||||
| Common stock, $2.50 par value; authorized 10,000,000 shares; issued 2010, 3,249,477; issued 2009, 3,199,636 |
8,124 | 7,999 | ||||||
| Surplus |
9,076 | 8,504 | ||||||
| Retained earnings |
35,419 | 34,048 | ||||||
| Accumulated other comprehensive income |
1,210 | 1,092 | ||||||
| Total shareholders’ equity |
$ | 53,829 | $ | 51,643 | ||||
| Total liabilities and shareholders’ equity |
$ | 558,840 | $ | 535,385 | ||||
See Notes to Consolidated Financial Statements
33
Table of Contents
EAGLE FINANCIAL SERVICES, INC. AND SUBSIDIARIES
Consolidated Statements of Income
Years Ended December 31, 2010, 2009, and 2008
(dollars in thousands, except per share amounts)
| 2010 | 2009 | 2008 | ||||||||||
| Interest and Dividend Income |
||||||||||||
| Interest and fees on loans |
$ | 23,529 | $ | 23,001 | $ | 24,790 | ||||||
| Interest on federal funds sold |
2 | 10 | 45 | |||||||||
| Interest and dividends on securities available for sale: |
||||||||||||
| Taxable interest income |
2,489 | 2,784 | 2,766 | |||||||||
| Interest income exempt from federal income taxes |
1,302 | 1,194 | 1,142 | |||||||||
| Dividends |
446 | 461 | 691 | |||||||||
| Interest on deposits in banks |
21 | 3 | 5 | |||||||||
| Total interest and dividend income |
$ | 27,789 | $ | 27,453 | $ | 29,439 | ||||||
| Interest Expense |
||||||||||||
| Interest on deposits |
$ | 2,983 | $ | 4,040 | $ | 6,978 | ||||||
| Interest on federal funds purchased and securities sold under agreements to repurchase |
387 | 392 | 482 | |||||||||
| Interest on Federal Home Loan Bank advances |
1,844 | 2,042 | 2,706 | |||||||||
| Interest on trust preferred capital notes |
138 | 184 | 342 | |||||||||
| Interest on interest rate swap |
178 | 135 | 4 | |||||||||
| Total interest expense |
$ | 5,530 | $ | 6,793 | $ | 10,512 | ||||||
| Net interest income |
$ | 22,259 | $ | 20,660 | $ | 18,927 | ||||||
| Provision For Loan Losses |
6,325 | 4,350 | 2,310 | |||||||||
| Net interest income after provision for loan losses |
$ | 15,934 | $ | 16,310 | $ | 16,617 | ||||||
| Noninterest Income |
||||||||||||
| Income from fiduciary activities |
$ | 917 | $ | 818 | $ | 911 | ||||||
| Service charges on deposit accounts |
1,784 | 2,053 | 2,333 | |||||||||
| Other service charges and fees |
2,993 | 2,148 | 2,565 | |||||||||
| Gain on the sale of loans |
— | — | 376 | |||||||||
| Gain (loss) on the sale of bank premises and equipment |
(83 | ) | — | 742 | ||||||||
| Loss on the sale of other real estate owned |
(338 | ) | (26 | ) | (42 | ) | ||||||
| Gain (loss) on securities |
98 | (419 | ) | (2,488 | ) | |||||||
| Other operating income |
128 | 52 | 212 | |||||||||
| Total noninterest income |
$ | 5,499 | $ | 4,626 | $ | 4,609 | ||||||
| Noninterest Expenses |
||||||||||||
| Salaries and employee benefits |
$ | 9,263 | $ | 9,262 | $ | 9,069 | ||||||
| Occupancy expenses |
1,142 | 1,069 | 1,189 | |||||||||
| Equipment expenses |
625 | 665 | 700 | |||||||||
| Advertising and marketing expenses |
435 | 409 | 406 | |||||||||
| Stationery and supplies |
246 | 311 | 326 | |||||||||
| ATM network fees |
442 | 104 | 323 | |||||||||
| Other real estate owned expenses |
19 | 366 | 57 | |||||||||
| FDIC assessment |
852 | 801 | 197 | |||||||||
| Computer software expense |
419 | 317 | 304 | |||||||||
| Outside service fees |
423 | 313 | 284 | |||||||||
| Other operating expenses |
2,943 | 2,863 | 2,959 | |||||||||
| Total noninterest expenses |
$ | 16,809 | $ | 16,480 | $ | 15,814 | ||||||
| Income before income taxes |
$ | 4,624 | $ | 4,456 | $ | 5,412 | ||||||
| Income Tax Expense |
1,019 | 1,015 | 1,357 | |||||||||
| Net Income |
$ | 3,605 | $ | 3,441 | $ | 4,055 | ||||||
| Earnings Per Share |
||||||||||||
| Net income per common share, basic |
$ | 1.11 | $ | 1.09 | $ | 1.29 | ||||||
| Net income per common share, diluted |
$ | 1.11 | $ | 1.08 | $ | 1.29 | ||||||
See Notes to Consolidated Financial Statements
34
Table of Contents
EAGLE FINANCIAL SERVICES, INC. AND SUBSIDIARIES
Consolidated Statements of Changes in Shareholders’ Equity
Years Ended December 31, 2010, 2009, and 2008
(dollars in thousands, except per share amounts)
| Common Stock |
Surplus | Retained Earnings |
Accumulated Other Comprehensive Income (Loss) |
Comprehensive Income |
Total | |||||||||||||||||||
| Balance, December 31, 2007 |
$ | 7,798 | $ | 7,153 | $ | 30,832 | $ | (605 | ) | $ | 45,178 | |||||||||||||
| Comprehensive income: |
||||||||||||||||||||||||
| Net income |
4,055 | $ | 4,055 | 4,055 | ||||||||||||||||||||
| Other comprehensive income: |
||||||||||||||||||||||||
| Changes in benefit obligations and plan assets for defined benefit and post retirement benefit plans, net of deferred income taxes of $138 |
(268 | ) | (268 | ) | (268 | ) | ||||||||||||||||||
| Change in market value of interest rate swap, net of deferred income taxes of $77 |
(150 | ) | (150 | ) | (150 | ) | ||||||||||||||||||
| Unrealized loss on available for sale securities, net of deferred income taxes of $314 |
(611 | ) | (611 | ) | (611 | ) | ||||||||||||||||||
| Total comprehensive income |
$ | 3,026 | ||||||||||||||||||||||
| Issuance of restricted stock, stock incentive plan (7,075 shares) |
18 | (18 | ) | — | ||||||||||||||||||||
| Income tax expense on vesting of restricted stock |
(11 | ) | (11 | ) | ||||||||||||||||||||
| Stock-based compensation expense |
175 | 175 | ||||||||||||||||||||||
| Issuance of common stock, dividend investment plan (28,932 shares) |
72 | 497 | 569 | |||||||||||||||||||||
| Dividends declared ($0.67 per share) |
(2,108 | ) | (2,108 | ) | ||||||||||||||||||||
| Balance, December 31, 2008 |
$ | 7,888 | $ | 7,796 | $ | 32,779 | $ | (1,634 | ) | $ | 46,829 | |||||||||||||
| Comprehensive income: |
||||||||||||||||||||||||
| Net income |
3,441 | $ | 3,441 | 3,441 | ||||||||||||||||||||
| Other comprehensive income: |
||||||||||||||||||||||||
| Changes in benefit obligations and plan assets for defined benefit and post retirement benefit plans, net of deferred income taxes of $253 |
491 | 491 | 491 | |||||||||||||||||||||
| Change in market value of interest rate swap, net of deferred income taxes of $160 |
312 | 312 | 312 | |||||||||||||||||||||
| Unrealized gain on available for sale securities, net of deferred income taxes of $991 |
1,923 | 1,923 | 1,923 | |||||||||||||||||||||
| Total comprehensive income |
$ | 6,167 | ||||||||||||||||||||||
| Issuance of restricted stock, stock incentive plan (3,509 shares) |
9 | (9 | ) | — | ||||||||||||||||||||
| Income tax expense on vesting of restricted stock |
(6 | ) | (6 | ) | ||||||||||||||||||||
| Stock-based compensation expense |
166 | 166 | ||||||||||||||||||||||
| Issuance of common stock, dividend investment plan (36,559 shares) |
91 | 492 | 583 | |||||||||||||||||||||
| Issuance of common stock, employee benefit plan (4,530 shares) |
11 | 65 | 76 | |||||||||||||||||||||
| Dividends declared ($0.68 per share) |
(2,172 | ) | (2,172 | ) | ||||||||||||||||||||
| Balance, December 31, 2009 |
$ | 7,999 | $ | 8,504 | $ | 34,048 | $ | 1,092 | $ | 51,643 | ||||||||||||||
| Comprehensive income: |
||||||||||||||||||||||||
| Net income |
3,605 | $ | 3,605 | 3,605 | ||||||||||||||||||||
| Other comprehensive income: |
||||||||||||||||||||||||
| Changes in benefit obligations and plan assets for defined benefit and post retirement benefit plans, net of deferred income taxes of ($141) |
275 | 275 | 275 | |||||||||||||||||||||
| Change in market value of interest rate swap, net of deferred income taxes of $140 |
(273 | ) | (273 | ) | (273 | ) | ||||||||||||||||||
| Unrealized gain on available for sale securities, net of deferred income taxes of $60 |
116 | 116 | 116 | |||||||||||||||||||||
| Total comprehensive income |
$ | 3,723 | ||||||||||||||||||||||
| Issuance of restricted stock, stock incentive plan (11,936 shares) |
30 | (30 | ) | — | ||||||||||||||||||||
| Income tax benefit on vesting of restricted stock |
(9 | ) | (9 | ) | ||||||||||||||||||||
| Stock-based compensation expense |
116 | 116 | ||||||||||||||||||||||
| Issuance of common stock, dividend investment plan (37,905 shares) |
95 | 495 | 590 | |||||||||||||||||||||
| Dividends declared ($0.69 per share) |
(2,234 | ) | (2,234 | ) | ||||||||||||||||||||
| Balance, December 31, 2010 |
$ | 8,124 | $ | 9,076 | $ | 35,419 | $ | 1,210 | $ | 53,829 | ||||||||||||||
See Notes to Consolidated Financial Statements
35
Table of Contents
EAGLE FINANCIAL SERVICES, INC. AND SUBSIDIARIES
Consolidated Statements of Cash Flows
Years Ended December 31, 2010, 2009, and 2008
| 2010 | 2009 | 2008 | ||||||||||
| Cash Flows from Operating Activities |
||||||||||||
| Net income |
$ | 3,605 | $ | 3,441 | $ | 4,055 | ||||||
| Adjustments to reconcile net income to net cash provided by operating activities: |
||||||||||||
| Depreciation |
779 | 778 | 811 | |||||||||
| Amortization of intangible and other assets |
136 | 165 | 151 | |||||||||
| (Gain) loss on the sale of securities |
(98 | ) | 419 | 2,488 | ||||||||
| Provision for loan losses |
6,325 | 4,350 | 2,310 | |||||||||
| (Gain) on the sale of loans |
— | — | (376 | ) | ||||||||
| Gain (loss) on the sale of bank premises and equipment |
83 | — | (742 | ) | ||||||||
| Loss on the sale of other real estate owned |
338 | 26 | 42 | |||||||||
| Stock-based compensation expense |
116 | 165 | 175 | |||||||||
| Premium amortization (discount accretion) on securities, net |
26 | (26 | ) | (20 | ) | |||||||
| Deferred tax benefit |
(362 | ) | (652 | ) | (1,463 | ) | ||||||
| Changes in assets and liabilities: |
||||||||||||
| Increase in other assets |
(1,676 | ) | (2,118 | ) | (1,044 | ) | ||||||
| Increase (decrease) in other liabilities |
127 | 128 | (107 | ) | ||||||||
| Net cash provided by operating activities |
$ | 9,399 | $ | 6,676 | $ | 6,280 | ||||||
| Cash Flows from Investing Activities |
||||||||||||
| Proceeds from maturities and principal payments of securities available for sale and restricted investments |
35,009 | 27,704 | 24,918 | |||||||||
| Proceeds from sales of securities available for sale |
2,853 | 1,959 | — | |||||||||
| Purchases of securities available for sale |
(50,180 | ) | (29,426 | ) | (42,993 | ) | ||||||
| Proceeds from the sale of equipment |
43 | 93 | 1,395 | |||||||||
| Purchases of bank premises and equipment |
(1,843 | ) | (310 | ) | (333 | ) | ||||||
| Proceeds from the sale of loans |
— | — | 2,783 | |||||||||
| Proceeds from the sale of other real estate owned |
2,035 | 1,281 | 952 | |||||||||
| Net (increase) in loans |
(10,802 | ) | (20,426 | ) | (5,342 | ) | ||||||
| Net cash provided by (used in) investing activities |
$ | (22,885 | ) | $ | (19,125 | ) | $ | (18,620 | ) | |||
| Cash Flows from Financing Activities |
||||||||||||
| Net increase in demand deposit, money market and savings accounts |
$ | 21,743 | $ | 25,098 | $ | 7,433 | ||||||
| Net increase (decrease) in certificates of deposit |
9,445 | (13,517 | ) | (491 | ) | |||||||
| Net increase (decrease) in federal funds purchased and securities sold under agreements to repurchase |
380 | (677 | ) | 1,710 | ||||||||
| Net increase (decrease) in Federal Home Loan Bank advances |
(10,000 | ) | (7,750 | ) | 10,000 | |||||||
| Issuance of common stock, employee benefit plan |
— | 76 | — | |||||||||
| Cash dividends paid |
(1,645 | ) | (1,587 | ) | (1,541 | ) | ||||||
| Net cash provided by (used in) financing activities |
$ | 19,923 | $ | 1,643 | $ | 17,111 | ||||||
See Notes to Consolidated Financial Statements
36
Table of Contents
EAGLE FINANCIAL SERVICES, INC. AND SUBSIDIARIES
Consolidated Statements of Cash Flows
Years Ended December 31, 2010, 2009, and 2008
| 2010 | 2009 | 2008 | ||||||||||
| Increase (decrease) in cash and cash equivalents |
$ | 6,437 | $ | (10,806 | ) | $ | 4,771 | |||||
| Cash and Cash Equivalents |
||||||||||||
| Beginning |
7,533 | 18,339 | 13,568 | |||||||||
| Ending |
$ | 13,970 | $ | 7,533 | $ | 18,339 | ||||||
| Supplemental Disclosures of Cash Flow Information |
||||||||||||
| Cash payments for: |
||||||||||||
| Interest |
$ | 5,618 | $ | 6,896 | $ | 10,420 | ||||||
| Income taxes |
$ | 3,550 | $ | 1,295 | $ | 2,880 | ||||||
| Supplemental Schedule of Noncash Investing and Financing Activities: |
||||||||||||
| Unrealized gain (loss) on securities available for sale |
$ | 176 | $ | 2,914 | $ | (925 | ) | |||||
| Change in fair value of interest rate swap |
$ | (413 | ) | $ | 472 | $ | (227 | ) | ||||
| Other real estate acquired in settlement of loans |
$ | 1,235 | $ | 3,546 | $ | 1,528 | ||||||
| Issuance of common stock, dividend investment plan |
$ | 590 | $ | 583 | $ | 569 | ||||||
See Notes to Consolidated Financial Statements
37
Table of Contents
NOTE 1. Nature of Banking Activities and Significant Accounting Policies
Eagle Financial Services, Inc. and Subsidiaries (the “Company” or “Corporation”) grant commercial, financial, agricultural, residential and consumer loans to customers in Virginia and the Eastern Panhandle of West Virginia. The loan portfolio is well diversified and generally is collateralized by assets of the customers. The loans are expected to be repaid from cash flows or proceeds from the sale of selected assets of the borrowers.
The accounting and reporting policies of the Company conform to accounting principles generally accepted in the United States of America and to accepted practices within the banking industry.
Principles of Consolidation
The Company owns 100% of Bank of Clarke County (the “Bank”) and Eagle Financial Statutory Trust II. The consolidated financial statements include the accounts of the Company and its wholly-owned subsidiaries. All significant intercompany accounts and transactions between the Company and the Bank have been eliminated. Eagle Financial Statutory Trust II is accounted for under the provisions of GAAP. The subordinated debt of Eagle Financial Statutory Trust II is reflected as a liability of the Company.
Trust Assets
Securities and other property held by the Eagle Investment Group in a fiduciary or agency capacity are not assets of the Company and are not included in the accompanying consolidated financial statements.
Cash and Cash Equivalents
For purposes of reporting cash flows, cash and cash equivalents include cash on hand, amounts due from banks, federal funds sold, and interest bearing deposits. Generally, federal funds are purchased and sold for one-day periods.
Securities
Debt securities that management has the positive intent and ability to hold to maturity are classified as “held to maturity” and recorded at amortized cost. Securities not classified as held to maturity, including equity securities with readily determinable fair values, are classified as “available for sale” and recorded at fair value, with unrealized gains and losses excluded from earnings and reported in other comprehensive income.
Purchase premiums and discounts are recognized in interest income using the interest method over the terms of the securities. Declines in the fair value of held to maturity and available for sale securities below their cost that are deemed to be “other than temporary” are reflected in earnings as realized losses. In estimating “other than temporary” impairment losses, management considers (1) the length of time and the extent to which the fair value has been less than cost, (2) the financial condition and near-term prospects of the issuer, and (3) the intent and ability of the Company to retain its investment in the issuer for a period of time sufficient to allow for any anticipated recovery of fair value. Gains and losses on the sale of securities are recorded on the trade date and are determined using the specific identification method.
Loans
The Company grants mortgage, commercial and consumer loans to customers. A substantial portion of the loan portfolio is represented by mortgage loans throughout the Counties of Clarke and Frederick, Virginia and the City of Winchester, Virginia. The ability of the Company’s debtors to honor their contracts is dependent upon the real estate and general economic conditions in this area.
Loans that management has the intent and ability to hold for the foreseeable future or until maturity or pay-off generally are reported at their outstanding unpaid principal balances adjusted for the allowance for loan losses. Interest income is accrued on the unpaid principal balance. Loan origination and commitment fees and direct loan costs are being recognized as collected and incurred. The use of this method of recognition does not produce results that are materially different from results which would have been produced if such costs and fees were deferred and amortized as an adjustment of the loan yield over the life of the related loan.
The accrual of interest on mortgage and commercial loans is discontinued at the time the loan is 90 days delinquent unless the credit is well-secured and in process of collection. Credit card loans and other personal loans are typically charged off no later than 180 days past due. Past due status is based on the contractual terms of the loan. In all cases, loans are placed on nonaccrual or charged-off at an earlier date if collection of principal and interest is considered doubtful.
All interest accrued but not collected for loans that are placed on nonaccrual or charged off is reversed against interest income. The interest on these loans is accounted for on the cash-basis or cost-recovery method, until qualifying for return to accrual. Loans are returned to accrual status when all the principal and interest amounts contractually due are brought current and future payments are reasonably assured.
38
Table of Contents
Risks by Loan Portfolio Segments
One-to-Four-Family Residential Real Estate Lending
Residential mortgage loans generally are made on the basis of the borrower’s ability to make repayment from employment and other income and are secured by real estate whose value tends to be readily ascertainable. As part of the application process, information is gathered concerning income, employment and credit history of the applicant. The valuation of residential collateral is provided by independent fee appraisers who have been approved by the Bank’s Directors Loan Committee.
Commercial Real Estate Lending
Commercial real estate lending entails significant additional risk as compared with residential mortgage lending. Commercial real estate loans typically involve larger loan balances concentrated with single borrowers or groups of related borrowers. Additionally, the repayment of loans secured by income producing properties is typically dependent on the successful operation of a business or a real estate project and thus may be subject, to a greater extent, to adverse conditions in the real estate market or the economy, in general.
Construction and Land Development Lending
There are two characteristics of construction lending which impact its overall risk as compared to residential mortgage lending. First, there is more concentration risk due to the extension of a large loan balance through several lines of credit to a single developer or contractor. Second, there is more collateral risk due to the fact that loan funds are provided to the borrower based upon the estimated value of the collateral after completion. This could cause an inaccurate estimate of the amount needed to complete construction or an excessive loan-to-value ratio. To mitigate the risks associated with construction lending, the Bank generally limits loan amounts to 80% of the estimated appraised value of the finished home.
Commercial and Industrial Lending
Commercial business loans generally have more risk than residential mortgage loans, but have higher yields. To manage these risks, the Bank generally obtains appropriate collateral and personal guarantees from the borrower’s principal owners and monitors the financial condition of the borrower. Commercial business loans typically are made on the basis of the borrower’s ability to make repayment from cash flow from its business and are secured by business assets, such as commercial real estate, accounts receivable, equipment and inventory. As a result, the availability of funds for the repayment of commercial business loans is substantially dependent on the success of the business itself. Furthermore, the collateral for commercial business loans may depreciate over time and generally cannot be appraised with as much precision as residential real estate.
Consumer Lending
Consumer loans generally entail greater risk than residential mortgage loans, particularly in the case of consumer loans which are unsecured or secured by rapidly depreciable assets such as automobiles. In such cases, any repossessed collateral on a defaulted consumer loan may not provide an adequate source of repayment of the outstanding loan balance as a result of the greater likelihood of damage, loss or depreciation.
Allowance for Loan Losses
The allowance for loan losses is established as losses are estimated to have occurred through a provision for loan losses charged to earnings. Loan losses are charged against the allowance when management believes the uncollectibility of a loan balance is confirmed. Subsequent recoveries, if any, are credited to the allowance. The allowance for loan losses is evaluated on a regular basis by management and is based upon management’s periodic review of the collectibility of the loans in light of historical experience, the nature and volume of the loan portfolio, adverse situations that may affect the borrower’s ability to repay, estimated value of any underlying collateral and prevailing economic conditions. This evaluation is inherently subjective as it requires estimates that are susceptible to significant revision as more information becomes available.
The allowance consists of specific, general and unallocated components. The specific component relates to loans that are classified using an internal loan grading system. For loans that are also classified as impaired, an allowance is established when the discounted cash flows (or collateral value or observable market price) of the impaired loan is lower than the carrying value of that loan. The general component covers non-classified loans and is based on historical loss experience and other qualitative factors. An unallocated component is maintained to cover uncertainties that could affect management’s estimate of probable losses. The unallocated component of the allowance reflects the margin of imprecision inherent in the underlying assumptions used in the methodologies for estimating specific and general losses in the portfolio.
A loan is considered impaired when, based on current information and events, it is probable that the Company will be unable to collect the scheduled payments of principal or interest when due according to the contractual terms of the loan agreement. Factors considered by management in determining impairment include payment status, collateral value, and the probability of collecting scheduled principal and interest payments when due. Loans that experience insignificant payment delays and payment shortfalls generally are not classified as impaired. Management determines the significance of payment delays and payment shortfalls on a case-by-case basis, taking into consideration all of the circumstances surrounding the loan and the borrower, including the length of the delay, the reasons for the delay, the borrower’s prior payment record, and the amount of the shortfall in relation to the principal and interest owed. Impairment is measured on a loan-by-loan basis for commercial and construction loans by either the present value of expected future cash flows discounted at the loan’s effective interest rate, the loan’s obtainable market price, or the fair market value less estimated liquidation costs of the collateral if the loan is collateral dependent. Large groups of smaller balance homogeneous loans are collectively evaluated for impairment. Accordingly, the Company does not separately identify individual consumer and residential loans for impairment disclosures, unless such loans are the subject of a restructuring agreement.
39
Table of Contents
Bank Premises and Equipment
Land is carried at cost. Buildings and equipment are carried at cost, less accumulated depreciation computed on the straight-line method over the estimated useful lives of the assets. Estimated useful lives range from 10 to 39 years for buildings and 3 to 10 years for furniture and equipment.
Other Real Estate Owned
Assets acquired through, or in lieu of, loan foreclosure are held for sale and are initially recorded at the lesser of the fair value of the property, less selling costs or the loan balance outstanding at the date of foreclosure. Any write-downs based on the asset’s fair value at the date of acquisition are charged to the allowance for loan losses. After foreclosure, valuations are periodically performed by management and property held for sale is carried at the lower of the new cost basis or fair value less cost to sell. Impairment losses on property to be held and used are measured as the amount by which the carrying amount of a property exceeds its fair value. Costs of significant property improvements are capitalized, whereas costs relating to holding property are expensed. The portion of interest costs relating to development of real estate is capitalized. Valuations are periodically performed by management, and any subsequent write-downs are recorded as a charge to operations, if necessary, to reduce the carrying value of a property to the lower of its cost or fair value less cost to sell. Revenue and expenses from operations and changes in the valuation allowance are included in net expenses from foreclosed assets.
Core Deposit Intangible Assets
Acquired intangible assets, such as the value of purchased core deposits, are amortized over the periods benefited, not exceeding fifteen years. The book value of the Company’s core deposit intangible asset, resulting from a branch acquisition, was fully amortized at December 31, 2010.
Retirement Plans
The Company has a non-contributory defined benefit pension plan that covers eligible employees. Effective December 31, 2006, the pension plan was amended so that no further benefits will accrue under the plan and no additional employees may become participants. The Company makes annual contributions to the pension plan as determined by actuarial valuations and recommendations. The Company also sponsors a 401(k) savings plan under which eligible employees may defer a portion of their compensation on a pretax basis. The Company also provides a match to participants in this plan, as described more fully in Note 11.
Stock-Based Compensation Plan
During 2003, the Company’s shareholders approved a stock incentive plan which allows key employees and directors to increase their personal financial interest in the Company. This plan permits the issuance of incentive stock options and non-qualified stock options and the award of stock appreciation rights, common stock, restricted stock, and phantom stock. The plan, as adopted, authorized the issuance of up to 300,000 shares of common stock. This plan is discussed more fully in Note 10.
Income Taxes
Deferred income tax assets and liabilities are determined using the liability (or balance sheet) method. Under this method, the net deferred tax asset or liability is determined based on the tax effects of the temporary differences between the book and tax bases of the various assets and liabilities and gives current recognition to changes in tax rates and laws.
When tax returns are filed, it is likely that some positions taken would be sustained upon examination by the applicable taxing authority, while others are subject to uncertainty about the merits of the position taken or the amount of the position that would be ultimately sustained. The benefit of a tax position is recognized in the financial statements in the period during which, based on all available evidence, the Company believes it is “more likely than not” that the position will be sustained upon examination, including the resolution of appeals or litigation processes, if any. Tax positions taken are not offset or aggregated with other positions. Tax positions that meet the “more likely than not” recognition threshold are measured as the largest amount of tax benefit that is more than fifty percent (50%) likely of being realized upon settlement with the applicable taxing authority. The portion of the benefits associated with tax positions taken that exceeds the amount measured as described above is reflected as a liability for unrecognized tax benefits in the balance sheet along with any associated interest and penalties that would be payable to the applicable taxing authority upon examination. Interest and penalties associated with unrecognized tax benefits are classified as additional income taxes in the statement of income. The Company has no uncertain tax positions.
Advertising
The Company follows the policy of charging the costs of advertising to expense as incurred.
Reclassifications
Certain reclassifications have been made to the 2010 financial statements to conform to reporting for 2009.
Earnings Per Common Share
Basic earnings per share represents income available to common shareholders divided by the weighted average number of common shares outstanding during the period. Diluted earnings per share reflects additional common shares that would have been outstanding if dilutive potential
40
Table of Contents
common shares had been issued, as well as any adjustment to income that would result from the assumed issuance. The number of potential common shares is determined using the treasury method and relates to outstanding stock options and nonvested restricted stock grants.
The following table shows the weighted average number of shares used in computing earnings per share and the effect on the weighted average number of shares of dilutive potential common stock. Potential dilutive common stock had no effect on income available to common shareholders.
| 2010 | 2009 | 2008 | ||||||||||
| Average number of common shares outstanding |
3,243,292 | 3,177,244 | 3,136,535 | |||||||||
| Effect of dilutive common stock |
7,576 | 7,290 | 7,372 | |||||||||
| Average number of common shares outstanding used to calculate diluted earnings per share |
3,250,868 | 3,184,534 | 3,143,907 | |||||||||
Comprehensive Income
Accounting principles generally accepted in the United States of America require that recognized revenue, expenses, gains and losses be included in net income. Certain changes in assets and liabilities, net of income taxes, are reported within the balance sheet as a separate component of shareholders’ equity. These changes, along with net income, are components of comprehensive income and are reported in the statement of shareholders’ equity. In addition to net income, the Company’s other comprehensive income includes changes in the benefit obligations and plan assets for defined benefit and post retirement benefit plans, unrealized gains or losses on interest rate swaps, and unrealized gains or losses on available for sale securities.
The components of the change in unrealized gains (losses) on securities during 2010 and 2009 were as follows:
| 2010 | 2009 | |||||||
| Gross unrealized gain |
$ | 274 | $ | 2,495 | ||||
| Reclassification adjustment for realized (gain) loss |
(98 | ) | 419 | |||||
| Net unrealized gain (loss) before taxes |
176 | 2,914 | ||||||
| Tax effect |
(60 | ) | (991 | ) | ||||
| $ | 116 | $ | 1,923 | |||||
The components of accumulated other comprehensive income, net of deferred taxes, during 2010, 2009, and 2008 were as follows:
| Unrealized Gain (Loss) on Securities |
Change
in Market Value of Interest Rate Swap |
Defined Benefit Pension Plan |
Post Retirement Benefit Plan |
Total | ||||||||||||||||
| Balance, December 31, 2008 |
$ | (494 | ) | $ | (150 | ) | $ | (978 | ) | $ | (12 | ) | $ | (1,634 | ) | |||||
| 2009 Change |
1,923 | 312 | 419 | 72 | 2,726 | |||||||||||||||
| Balance, December 31, 2009 |
1,429 | 162 | (559 | ) | 60 | 1,092 | ||||||||||||||
| 2010 Change |
116 | (273 | ) | 272 | 3 | 118 | ||||||||||||||
| Balance, December 31, 2010 |
$ | 1,545 | $ | (111 | ) | $ | (287 | ) | $ | 63 | $ | 1,210 | ||||||||
Derivative Financial Instruments
The Company follows GAAP to account for derivative and hedging activities. In accordance, a derivative is recognized in the balance sheet at its fair value. The fair value of a derivative is determined by quoted market prices and mathematical models using current and historical data. If certain hedging criteria are met, including testing for hedge effectiveness, special hedge accounting may be applied. The Company assesses each hedge, both at inception and on an ongoing basis, to determine whether the derivative used in a hedging transaction is effective in offsetting changes in the fair value or cash flows of the hedged item and whether the derivative is expected to remain effective during subsequent periods. The Company discontinues hedge accounting when (a) it determines that a derivative is no longer effective in offsetting changes in fair value or cash flows of a hedged item; (b) the derivative expires or is sold, terminated or exercised; (c) probability exists that the forecasted transaction will no longer occur or (d) management determines that designating the derivative as a hedging instrument is no longer appropriate. When hedge accounting is discontinued and a derivative remains outstanding, the Company recognizes the derivative in the balance sheet at its fair value and changes in the fair value are recognized in net income.
At inception, the Company designates a derivative as (a) a fair value hedge of recognized assets or liabilities or of unrecognized firm commitments (fair-value hedge) or (b) a hedge of forecasted transactions or variable cash flows to be received or paid in conjunction with recognized assets or liabilities (cash-flow hedge). For a derivative treated as a fair-value hedge, a change in fair value is recorded as an adjustment to the hedged item and recognized in net income. For a derivative treated as a cash flow hedge, the effective portion of a change in fair value is recorded as an adjustment to the hedged item and recognized as a component of accumulated other comprehensive income (loss) within shareholders’ equity. For a derivative treated as a cash flow hedge, the ineffective portion of a change in fair value is recorded as an adjustment to the hedged item and recognized in net income. For more information on derivative financial instruments see Note 13 to the Consolidated Financial Statements.
41
Table of Contents
Use of Estimates
The preparation of financial statements in conformity with accounting principles generally accepted in the United States of America requires management to make estimates and assumptions that affect the reported amounts of assets and liabilities and disclosure of contingent assets and liabilities at the date of the financial statements and the reported amounts of revenues and expenses during the reporting period. Actual results could differ from those estimates. Material estimates that are particularly susceptible to significant change in the near term relate to the determination of the allowance for loan losses and the valuation of deferred tax assets.
Recent Accounting Pronouncements
In June 2009, the Financial Accounting Standards Board (FASB) issued new guidance relating to the accounting for transfers of financial assets. The new guidance, which was issued as SFAS No. 166, “Accounting for Transfers of Financial Assets, an amendment to SFAS No. 140,” was adopted into the Accounting Standards Codification (Codification) in December 2009 through the issuance of Accounting Standards Update (ASU) 2009-16. The new standard provides guidance to improve the relevance, representational faithfulness, and comparability of the information that an entity provides in its financial statements about a transfer of financial assets; the effects of a transfer on its financial position, financial performance, and cash flows; and a transferor’s continuing involvement, if any, in transferred financial assets. ASU 2009-16 was effective for transfers on or after January 1, 2010. The adoption of the new guidance did not have a material impact on theCompany’s (consolidated) financial statements.
In June 2009, the FASB issued new guidance relating to variable interest entities. The new guidance, which was issued as SFAS No. 167, “Amendments to FASB Interpretation No. 46(R),” was adopted into the Codification in December 2009. The objective of the guidance is to improve financial reporting by enterprises involved with variable interest entities and to provide more relevant and reliable information to users of financial statements. SFAS No. 167 was effective as of January 1, 2010. The adoption of the new guidance did not have a material impact on the Company’s (consolidated) financial statements.
In October 2009, the FASB issued ASU 2009-15, “Accounting for Own-Share Lending Arrangements in Contemplation of Convertible Debt Issuance or Other Financing.” ASU 2009-15 amends Subtopic 470-20 to expand accounting and reporting guidance for own-share lending arrangements issued in contemplation of convertible debt issuance. ASU 2009-15 is effective for fiscal years beginning on or after December 15, 2009 and interim periods within those fiscal years for arrangements outstanding as of the beginning of those fiscal years. The adoption of the new guidance did not have a material impact on the Company’s (consolidated) financial statements.
In January 2010, the FASB issued ASU 2010-04, Accounting for Various Topics – Technical Corrections to SEC Paragraphs. ASU 2010-04 makes technical corrections to existing Securities and Exchange Commission (SEC) guidance including the following topics: accounting for subsequent investments, termination of an interest rate swap, issuance of financial statements - subsequent events, use of residual method to value acquired assets other than goodwill, adjustments in assets and liabilities for holding gains and losses, and selections of discount rate used for measuring defined benefit obligation. The adoption of the new guidance did not have a material impact on the Company’s (consolidated) financial statements.
In January 2010, the FASB issued ASU 2010-06, “Fair Value Measurements and Disclosures (Topic 820): Improving Disclosures about Fair Value Measurements.” ASU 2010-06 amends Subtopic 820-10 to clarify existing disclosures, require new disclosures, and includes conforming amendments to guidance on employers’ disclosures about postretirement benefit plan assets. ASU 2010-06 is effective for interim and annual periods beginning after December 15, 2009, except for disclosures about purchases, sales, issuances, and settlements in the roll forward of activity in Level 3 fair value measurements. Those disclosures are effective for fiscal years beginning after December 15, 2010 and for interim periods within those fiscal years. The adoption of the new guidance did not have a material impact on the Company’s (consolidated) financial statements.
In February 2010, the FASB issued ASU 2010-09, “Subsequent Events (Topic 855): Amendments to Certain Recognition and Disclosure Requirements.” ASU 2010-09 addresses both the interaction of the requirements of Topic 855 with the SEC’s reporting requirements and the intended breadth of the reissuance disclosures provisions related to subsequent events. An entity that is an SEC filer is not required to disclose the date through which subsequent events have been evaluated. ASU 2010-09 was effective immediately. The adoption of the new guidance did not have a material impact on the Company’s (consolidated) financial statements.
In July 2010, the FASB issued ASU 2010-20, “Disclosures about the Credit Quality of Financing Receivables and the Allowance for Credit Losses.” The new disclosure guidance significantly expands the existing requirements and will lead to greater transparency into a company’s exposure to credit losses from lending arrangements. The extensive new disclosures of information as of the end of a reporting period will become effective for both interim and annual reporting periods ending on or after December 15, 2010. Specific disclosures regarding activity that occurred before the issuance of the ASU, such as the allowance roll forward and modification disclosures, will be required for periods beginning on or after December 15, 2010. The Company has included the required disclosures in its (consolidated) financial statements.
On September 15, 2010, the SEC issued Release No. 33-9142, “Internal Control Over Financial Reporting In Exchange Act Periodic Reports of Non-Accelerated Filers.” This release issued a final rule adopting amendments to its rules and forms to conform them to Section 404(c) of the Sarbanes-Oxley Act of 2002 (SOX), as added by Section 989G of the Dodd-Frank Wall Street Reform and Consumer Protection Act. SOX Section 404(c) provides that Section 404(b) shall not apply with respect to any audit report prepared for an issuer that is neither an accelerated filer nor a large accelerated filer as defined in Rule 12b-2 under the Securities Exchange Act of 1934. Release No. 33-9142 was effective September 21, 2010.
On September 17, 2010, the SEC issued Release No. 33-9144, “Commission Guidance on Presentation of Liquidity and Capital Resources Disclosures in Management’s Discussion and Analysis.” This interpretive release is intended to improve discussion of liquidity and capital resources in Management’s Discussion and Analysis of Financial Condition and Results of Operations in order to facilitate understanding by investors of the liquidity and funding risks facing the registrant. This release was issued in conjunction with a proposed rule, “Short-Term Borrowings Disclosures,” that would require public companies to disclose additional information to investors about their short-term borrowing arrangements. Release No. 33-9144 was effective on September 28, 2010.
42
Table of Contents
In January 2011, the FASB issued ASU 2011-01, “Deferral of the Effective Date of Disclosures about Troubled Debt Restructurings in Update No. 2010-20.” The amendments in this ASU temporarily delay the effective date of the disclosures about troubled debt restructurings in ASU 2010-20 for public entities. The delay is intended to allow the FASB time to complete its deliberations on what constitutes a troubled debt restructuring. The effective date of the new disclosures about troubled debt restructurings for public entities and the guidance for determining what constitutes a troubled debt restructuring will then be coordinated. Currently, that guidance is anticipated to be effective for interim and annual periods ending after June 15, 2011.
In December 2010, the FASB issued ASU 2010-29, “Disclosure of Supplementary Pro Forma Information for Business Combinations.” The guidance requires pro forma disclosure for business combinations that occurred in the current reporting period as though the acquisition date for all business combinations that occurred during the year had been as of the beginning of the annual reporting period. If comparative financial statements are presented, the pro forma information should be reported as though the acquisition date for all business combinations that occurred during the current year had been as of the beginning of the comparable prior annual reporting period. ASU 2010-29 is effective for business combinations for which the acquisition date is on or after the beginning of the first annual reporting period beginning on or after December 15, 2010. Early adoption is permitted. The adoption of the new guidance is not expected to have a material impact on the Company’s (consolidated) financial statements.
In December 2010, the FASB issued ASU 2010-28, “When to Perform Step 2 of the Goodwill Impairment Test for Reporting Units with Zero or Negative Carrying Amounts.” The amendments in this ASU modify Step 1 of the goodwill impairment test for reporting units with zero or negative carrying amounts. For those reporting units, an entity is required to perform Step 2 of the goodwill impairment test if it is more likely than not that a goodwill impairment exists. For public entities, the amendments in this Update are effective for fiscal years, and interim periods within those years, beginning after December 15, 2010. Early adoption is not permitted. The adoption of the new guidance is not expected to have a material impact on the Company’s (consolidated) financial statements.
The SEC has issued Final Rule No. 33-9002, Interactive Data to Improve Financial Reporting, which requires companies to submit financial statements in XBRL (extensible business reporting language) format with their SEC filings on a phased-in schedule. Large accelerated filers and foreign large accelerated filers using U.S. GAAP were required to provide interactive data reports starting with their first quarterly report for fiscal periods ending on or after June 15, 2010. All remaining filers are required to provide interactive data reports starting with their first quarterly report for fiscal periods ending on or after June 15, 2011.
NOTE 2. Securities
Amortized costs and fair values of securities available for sale at December 31, 2010 and 2009 were as follows:
| Amortized Cost |
Gross Unrealized Gains |
Gross Unrealized (Losses) |
Fair Value |
|||||||||||||
| December 31, 2010 | ||||||||||||||||
| (in thousands) | ||||||||||||||||
| Obligations of U.S. government corporations and agencies |
$ | 32,716 | $ | 531 | $ | (97 | ) | $ | 33,150 | |||||||
| Mortgage-backed securities |
15,706 | 524 | (73 | ) | 16,157 | |||||||||||
| Obligations of states and political subdivisions |
42,511 | 928 | (531 | ) | 42,908 | |||||||||||
| Corporate securities |
14,464 | 994 | (57 | ) | 15,401 | |||||||||||
| Equity securities |
2,054 | 124 | — | 2,178 | ||||||||||||
| $ | 107,451 | $ | 3,101 | $ | (758 | ) | $ | 109,794 | ||||||||
| December 31, 2009 | ||||||||||||||||
| (in thousands) | ||||||||||||||||
| Obligations of U.S. government corporations and agencies |
$ | 26,671 | $ | 426 | $ | (52 | ) | $ | 27,045 | |||||||
| Mortgage-backed securities |
14,951 | 669 | — | 15,620 | ||||||||||||
| Obligations of states and political subdivisions |
36,371 | 927 | (241 | ) | 37,057 | |||||||||||
| Corporate securities |
14,597 | 709 | (362 | ) | 14,944 | |||||||||||
| Equity securities |
2,054 | 117 | (26 | ) | 2,145 | |||||||||||
| $ | 94,644 | $ | 2,848 | $ | (681 | ) | $ | 96,811 | ||||||||
Amortized costs and fair values of restricted securities at December 31, 2010 and 2009 were as follows:
43
Table of Contents
| December 31, 2010 |
December 31, 2009 |
|||||||
| (in thousands) | ||||||||
| Federal Reserve Bank Stock |
$ | 344 | $ | 344 | ||||
| Federal Home Loan Bank Stock |
3,498 | 3,915 | ||||||
| Community Bankers’ Bank Stock |
140 | 140 | ||||||
| $ | 3,982 | $ | 4,399 | |||||
The amortized cost and fair value of securities available for sale at December 31, 2010, by contractual maturity, are shown below. Maturities may differ from contractual maturities in mortgage-backed securities because the mortgages underlying the securities may be called or repaid without any penalties.
| Amortized Cost |
Fair Value |
|||||||
| (in thousands) | ||||||||
| Due in one year or less |
$ | 1,488 | $ | 1,533 | ||||
| Due after one year through five years |
39,904 | 41,201 | ||||||
| Due after five years through ten years |
38,464 | 39,326 | ||||||
| Due after ten years |
25,541 | 25,556 | ||||||
| Equity securities |
2,054 | 2,178 | ||||||
| $ | 107,451 | $ | 109,794 | |||||
During 2010, the Company sold $2,853,000 in available for sale securities for a net gain of $98,000. In 2009, the Company sold $1,959,000 in available for sale securities for a net loss of $419,000.
The fair value and gross unrealized losses for securities available for sale, totaled by the length of time that individual securities have been in a continuous gross unrealized loss position, at December 31, 2010 and 2009 were as follows:
| Less than 12 months | 12 months or more | Total | ||||||||||||||||||||||
| Fair Value | Gross Unrealized Losses |
Fair Value | Gross Unrealized Losses |
Fair Value | Gross Unrealized Losses |
|||||||||||||||||||
| December 31, 2010 | ||||||||||||||||||||||||
| (in thousands) | ||||||||||||||||||||||||
| Obligations of U.S. government corporations and agencies |
$ | 6,916 | $ | 97 | $ | — | $ | — | $ | 6,916 | $ | 97 | ||||||||||||
| Mortgage-backed securities |
4,355 | 73 | — | — | 4,355 | 73 | ||||||||||||||||||
| Obligations of states and political subdivisions |
11,464 | 481 | 320 | 50 | 11,784 | 531 | ||||||||||||||||||
| Corporate securities |
1,047 | 57 | — | — | 1,047 | 57 | ||||||||||||||||||
| Equity securities |
— | — | — | — | — | — | ||||||||||||||||||
| $ | 23,782 | $ | 708 | $ | 320 | $ | 50 | $ | 24,102 | $ | 758 | |||||||||||||
| December 31, 2009 | ||||||||||||||||||||||||
| (in thousands) | ||||||||||||||||||||||||
| Obligations of U.S. government corporations and agencies |
$ | 7,025 | $ | 52 | $ | — | $ | — | $ | 7,025 | $ | 52 | ||||||||||||
| Mortgage-backed securities |
— | — | — | — | — | — | ||||||||||||||||||
| Obligations of states and political subdivisions |
3,544 | 236 | 264 | 5 | 3,808 | 241 | ||||||||||||||||||
| Corporate securities |
110 | 15 | 4,635 | 347 | 4,745 | 362 | ||||||||||||||||||
| Equity securities |
— | — | 1,018 | 26 | 1,018 | 26 | ||||||||||||||||||
| $ | 10,679 | $ | 303 | $ | 5,917 | $ | 378 | $ | 16,596 | $ | 681 | |||||||||||||
Gross unrealized losses on available for sale securities included thirty-five (35) and twenty-five (25) securities at December 31, 2010 and December 31, 2009, respectively. The Company evaluates securities for other-than-temporary impairment on at least a quarterly basis, and more frequently when economic or market concerns warrant such evaluation. The Company’s mortgage-backed securities are issued by U.S. government agencies, which guarantee payments to investors regardless of the status of the underlying mortgages. Consideration is given to the length of time and the amount of an unrealized loss, the financial condition of the issuer, and the intent and ability of the Company to retain its investment in the issuer long enough to allow for an anticipated recovery in fair value. The fair value of a security reflects its liquidity as compared to similar instruments, current
44
Table of Contents
market rates on similar instruments, and the creditworthiness of the issuer. Absent any change in the liquidity of a security or the creditworthiness of the issuer, prices will decline as market rates rise and vice-versa. The primary cause of the unrealized losses on obligations of U.S. government corporations and agencies, mortgage-backed securities, and obligations of states and political subdivisions at December 31, 2010 and December 31, 2009 was changes in market interest rates. Since these losses can be attributed to changes in market interest rates and not expected cash flows or an issuer’s financial condition, the unrealized losses are deemed to be temporary. The Company’s holdings of corporate securities and equity securities represent investments in larger financial institutions. The current economic crisis involving housing, liquidity and credit were the primary causes of the unrealized losses on these securities at December 31, 2010. The Company monitors the financial condition of these issuers continuously and will record other-than-temporary impairment if the recovery of value is unlikely.
The Company’s securities are exposed to various risks, such as interest rate, market, currency and credit risks. Due to the level of risk associated with certain securities and the level of uncertainty related to changes in the value of securities, it is at least reasonably possible that changes in risks in the near term would materially affect securities reported in the financial statements. In addition, recent economic uncertainty and market events have led to unprecedented volatility in currency, commodity, credit and equity markets culminating in failures of some banking and financial services firms and Government intervention to solidify others. These recent events underscore the level of investment risk associated with the current economic environment, and accordingly the level of risk in the Company’s securities.
Securities having a carrying value of $44,804,000 at December 31, 2010 were pledged to secure public deposits, securities sold under agreements to repurchase, and for other purposes required by law.
NOTE 3. Loans
The composition of loans at December 31, 2010 and 2009 was as follows:
| December 31, | ||||||||
| 2010 | 2009 | |||||||
| (in thousands) | ||||||||
| Mortgage loans on real estate: |
||||||||
| Construction and land development |
$ | 31,560 | $ | 34,531 | ||||
| Secured by farmland |
4,332 | 5,636 | ||||||
| Secured by 1-4 family residential properties |
207,671 | 205,579 | ||||||
| Multifamily |
4,908 | 3,112 | ||||||
| Commercial |
116,381 | 109,516 | ||||||
| Loans to farmers |
1,293 | 1,284 | ||||||
| Commercial and industrial loans |
24,449 | 24,268 | ||||||
| Consumer installment loans |
14,518 | 16,115 | ||||||
| All other loans |
3,337 | 4,025 | ||||||
| $ | 408,449 | $ | 404,066 | |||||
| Less: Allowance for loan losses |
7,111 | 5,970 | ||||||
| $ | 401,338 | $ | 398,096 | |||||
NOTE 4. Allowance for Loan Losses
Changes in the allowance for loan losses for the years ended December 31, 2010, 2009 and 2008 were as follows:
| December 31, | ||||||||||||
| 2010 | 2009 | 2008 | ||||||||||
| (in thousands) | ||||||||||||
| Balance, beginning |
$ | 5,970 | $ | 4,521 | $ | 3,191 | ||||||
| Provision charged to operating expense |
6,325 | 4,350 | 2,310 | |||||||||
| Recoveries added to the allowance |
291 | 252 | 97 | |||||||||
| Loan losses charged to the allowance |
(5,475 | ) | (3,153 | ) | (1,077 | ) | ||||||
| Balance, ending |
$ | 7,111 | $ | 5,970 | $ | 4,521 | ||||||
45
Table of Contents
Nonaccrual and past due loans by class at December 31, 2010 were as follows:
| As of December 31, 2010 (in thousands) |
||||||||||||||||||||||||||||
| 30 - 59 Past Due |
60 - 89 Past Due |
Greater than 90 Days |
Total Past Due |
Nonaccrual Loans |
Current | Total Loans | ||||||||||||||||||||||
| Commercial - Non Real Estate: |
||||||||||||||||||||||||||||
| Commercial & Industrial |
$ | 91 | $ | 700 | $ | 7 | $ | 798 | $ | 267 | $ | 23,384 | $ | 24,449 | ||||||||||||||
| Commercial Real Estate: |
||||||||||||||||||||||||||||
| Owner Occupied |
178 | 645 | — | 823 | 1,071 | 81,497 | 83,391 | |||||||||||||||||||||
| Non-owner occupied |
863 | — | — | 863 | — | 32,127 | 32,990 | |||||||||||||||||||||
| Construction: |
||||||||||||||||||||||||||||
| Residential |
— | — | 3,808 | 5,623 | 9,431 | |||||||||||||||||||||||
| Commercial |
608 | 70 | 678 | — | 25,783 | 26,461 | ||||||||||||||||||||||
| Consumer - Non Real Estate |
||||||||||||||||||||||||||||
| Automobile |
138 | 8 | — | 146 | 9,970 | 10,116 | ||||||||||||||||||||||
| Other |
35 | 64 | 3 | 102 | 4,300 | 4,402 | ||||||||||||||||||||||
| Residential: |
||||||||||||||||||||||||||||
| Equity Lines |
782 | 60 | 842 | 190 | 41,657 | 42,689 | ||||||||||||||||||||||
| Single family |
1,537 | 174 | — | 1,711 | 3,041 | 160,230 | 164,982 | |||||||||||||||||||||
| Multifamily |
— | — | — | — | — | 4,908 | 4,908 | |||||||||||||||||||||
| All Other Loans |
8 | — | — | 8 | — | 4,622 | 4,630 | |||||||||||||||||||||
| Total |
$ | 4,240 | $ | 1,721 | $ | 10 | $ | 5,971 | $ | 8,377 | $ | 394,101 | $ | 408,449 | ||||||||||||||
Total loans past due ninety days or greater still accruing interest were $10,000 and $13,000 at December 31, 2010 and 2009, respectively. Nonaccrual loans at December 31, 2009 were $5,099,000.
46
Table of Contents
Allowance for loan losses by segment for the year ended December 31, 2010 were as follows:
| For the Year Ended December 31, 2010 (in thousands) |
||||||||||||||||||||||||||||||||||||
| Construction and Farmland |
1-4 Residential |
Multifamily | Commercial Real Estate |
Commercial | Consumer | All Other Loans |
Unallocated | Total | ||||||||||||||||||||||||||||
| Allowance for credit losses: |
||||||||||||||||||||||||||||||||||||
| Ending balance |
$ | 1,386 | $ | 3,454 | $ | 3 | $ | 1,231 | $ | 819 | $ | 182 | $ | 36 | $ | — | $ | 7,111 | ||||||||||||||||||
| Ending balance: Individually evaluated for impairment |
622 | 1,623 | — | 273 | 139 | — | — | — | 2,657 | |||||||||||||||||||||||||||
| Ending balance: collectively evaluated for impairment |
$ | 764 | $ | 1,831 | $ | 3 | $ | 958 | $ | 680 | $ | 182 | $ | 36 | $ | — | $ | 4,454 | ||||||||||||||||||
| Ending balance: loans acquired with with deteriorated credit quality |
— | — | — | — | — | — | — | — | — | |||||||||||||||||||||||||||
| Financing receivables: |
||||||||||||||||||||||||||||||||||||
| Ending balance |
$ | 35,892 | $ | 207,671 | $ | 4,908 | $ | 116,381 | $ | 24,449 | $ | 14,518 | $ | 4,630 | $ | — | $ | 408,449 | ||||||||||||||||||
| Ending balance individually evaluated for impairment |
3,549 | 11,172 | — | 5,141 | 319 | — | — | — | 20,181 | |||||||||||||||||||||||||||
| Ending balance collectively evaluated for impairment |
32,343 | 196,499 | 4,908 | 111,240 | 24,130 | 14,518 | 4,630 | — | 388,268 | |||||||||||||||||||||||||||
| Ending balance loans acquired with deteriorated credit quality |
— | — | — | — | — | — | — | — | — | |||||||||||||||||||||||||||
47
Table of Contents
Impaired loans by class at December 31, 2010 were as follows:
| For the Year Ended December 31,
2010 (in thousands) |
||||||||||||||||||||
| Recorded Investment |
Unpaid Principal Balance |
Related Allowance |
Average Recorded Investment |
Interest Income Recognized |
||||||||||||||||
| With no related allowance: |
||||||||||||||||||||
| Commercial - Non Real Estate: |
||||||||||||||||||||
| Commercial & Industrial |
$ | — | $ | — | $ | — | $ | — | $ | — | ||||||||||
| Commercial Real Estate: |
||||||||||||||||||||
| Owner Occupied |
2,151 | 2,143 | — | 2,164 | 131 | |||||||||||||||
| Non-owner occupied |
2,153 | 2,144 | — | 2,153 | 34 | |||||||||||||||
| Construction: |
||||||||||||||||||||
| Residential |
— | — | — | — | — | |||||||||||||||
| Commercial |
2,447 | 2,447 | — | 2,451 | 70 | |||||||||||||||
| Residential |
||||||||||||||||||||
| Equity lines |
689 | 685 | — | 690 | 33 | |||||||||||||||
| Single family |
4,450 | 4,432 | — | 4,736 | 90 | |||||||||||||||
| Multifamily |
— | — | — | — | — | |||||||||||||||
| With an allowance recorded: |
||||||||||||||||||||
| Commercial - Non Real Estate: |
||||||||||||||||||||
| Commercial & Industrial |
$ | 319 | $ | 319 | $ | 139 | $ | 695 | $ | 29 | ||||||||||
| Commercial Real Estate: |
||||||||||||||||||||
| Owner Occupied |
306 | 306 | 122 | 406 | — | |||||||||||||||
| Non-owner occupied |
549 | 548 | 151 | 202 | 23 | |||||||||||||||
| Construction: |
||||||||||||||||||||
| Residential |
— | — | — | — | — | |||||||||||||||
| Commercial |
1,102 | 1,102 | 622 | 1,259 | 68 | |||||||||||||||
| Residential |
||||||||||||||||||||
| Equity lines |
— | — | — | — | — | |||||||||||||||
| Single family |
6,093 | 6,055 | 1,623 | 3,653 | 319 | |||||||||||||||
| Multifamily |
— | — | — | — | — | |||||||||||||||
| Total: |
||||||||||||||||||||
| Commercial |
$ | 319 | $ | 319 | $ | 139 | $ | 695 | $ | 29 | ||||||||||
| Commercial Real Estate |
5,159 | 5,141 | 273 | 4,925 | 188 | |||||||||||||||
| Construction |
3,549 | 3,549 | 622 | 3,710 | 138 | |||||||||||||||
| Residential |
11,232 | 11,172 | 1,623 | 9,079 | 442 | |||||||||||||||
| $ | 20,259 | $ | 20,181 | $ | 2,657 | $ | 18,409 | $ | 797 | |||||||||||
Recorded investment is defined as the summation of the principal balance, accrued interest, and net deferred loan fees or costs.
Impaired loans at December 31, 2009 and 2008 were as follows:
48
Table of Contents
| December 31, | ||||||||
| 2009 | 2008 | |||||||
| (in thousands) | ||||||||
| Impaired loans for which, |
||||||||
| an allowance has been provided |
$ | 7,496 | $ | 2,310 | ||||
| no allowance has been provided |
147 | 97 | ||||||
| Total impaired loans |
$ | 7,643 | $ | 2,407 | ||||
| Allowance provided for impaired loans included in ALLL |
$ | 2,253 | $ | 1,635 | ||||
| Average balance of impaired loans |
$ | 3,893 | $ | 1,080 | ||||
| Interest income recognized |
$ | 309 | $ | 4 | ||||
There were thirty-one troubled debt restructured loans at December 31, 2010 amounting to $8,469,000. There were no troubled debt restructured loans at December 31, 2009 and 2008. There were no outstanding commitments to lend additional amounts to troubled debt restructured borrowers at December 31, 2010.
The Company uses a rating system for evaluating the risks associated with non-consumer loans. Consumer loans are not evaluated for risk unless the characteristics of the loan fall within classified categories. Descriptions of these ratings are as follows:
| Pass |
Pass loans exhibit acceptable operating trends, balance sheet trends, and liquidity. Sufficient cash flow exists to service the loan. All obligations have been paid by the borrower in an as agreed manner. | |
| Watch |
Watch loans exhibit income volatility, negative operating trends, and a highly leveraged balance sheet. A higher level of supervision is required for these loans as the potential for a negative event could impact the borrower’s ability to repay the loan. | |
| Special mention |
Special mention loans exhibit a potential weakness, if left uncorrected, may negatively affect the borrower’s ability to repay its debt obligation. The risk of default is not imminent and the borrower still demonstrates sufficient cash flow to support the loan. | |
| Substandard |
Substandard loans exhibit well defined weaknesses and have a high probability of default. The borrowers exhibit adverse financial trends but still have the ability to service debt obligations. | |
| Doubtful |
Doubtful loans exhibit all of the characteristics inherent in substandard loans but the weaknesses make collection or full liquidation highly questionable. | |
| Loss |
Loss loans are considered uncollectible and of such little value that its continuance of a bankable asset is not warranted. | |
Credit quality information by class at December 31, 2010 was as follows:
49
Table of Contents
| As of December 31, 2010 (in thousands) |
||||||||||||||||||||||||||||
| INTERNAL RISK RATING GRADES |
Pass | Watch | Special Mention |
Substandard | Doubtful | Loss | Total | |||||||||||||||||||||
| Commercial - Non Real Estate: |
||||||||||||||||||||||||||||
| Commercial & Industrial |
$ | 19,990 | $ | 845 | $ | 1,535 | $ | 1,812 | $ | 267 | $ | — | $ | 24,449 | ||||||||||||||
| Commercial Real Estate: |
— | |||||||||||||||||||||||||||
| Owner Occupied |
65,983 | 5,686 | 8,823 | 2,899 | — | — | 83,391 | |||||||||||||||||||||
| Non-owner occupied |
25,569 | 3,322 | 3,113 | 986 | — | — | 32,990 | |||||||||||||||||||||
| Construction: |
— | |||||||||||||||||||||||||||
| Residential |
7,875 | 1,556 | — | — | — | — | 9,431 | |||||||||||||||||||||
| Commercial |
17,492 | 790 | 2,378 | 2,672 | 3,129 | — | 26,461 | |||||||||||||||||||||
| Residential: |
— | |||||||||||||||||||||||||||
| Equity Lines |
41,430 | 182 | 67 | 860 | 150 | — | 42,689 | |||||||||||||||||||||
| Single family |
147,445 | 3,674 | 2,229 | 9,132 | 2,502 | — | 164,982 | |||||||||||||||||||||
| Multifamily |
3,272 | 1,636 | — | — | — | — | 4,908 | |||||||||||||||||||||
| All other loans |
4,581 | 49 | — | — | — | — | 4,630 | |||||||||||||||||||||
| Total |
$ | 333,637 | $ | 17,740 | $ | 18,145 | $ | 18,361 | $ | 6,048 | $ | — | $ | 393,931 | ||||||||||||||
| Performing | Nonperforming | |||||||
| Consumer Credit Exposure by Payment Activity |
$ | 14,270 | $ | 248 | ||||
One consumer loan was rated as watch for $23,000 and two consumer loans were rated as substandard for $10,000 at December 31, 2010.
NOTE 5. Bank Premises and Equipment, Net
The major classes of bank premises and equipment and the total accumulated depreciation at December 31, 2010 and 2009 were as follows:
| December 31, | ||||||||
| 2010 | 2009 | |||||||
| (in thousands) | ||||||||
| Land |
$ | 4,004 | $ | 4,004 | ||||
| Buildings and improvements |
14,799 | 13,572 | ||||||
| Furniture and equipment |
6,749 | 6,350 | ||||||
| $ | 25,552 | $ | 23,926 | |||||
| Less accumulated depreciation |
9,840 | 9,148 | ||||||
| Bank premises and equipment, net |
$ | 15,712 | $ | 14,778 | ||||
Depreciation expense on buildings and improvements was $404,000, $388,000, and $398,000 for the years ended December 31, 2010, 2009, and 2008, respectively. Depreciation expense on furniture and equipment was $375,000, $390,000, and $413,000 for the years ended December 31, 2010, 2009, and 2008, respectively.
The Bank leases certain facilities under operating leases, which expire at various dates through 2032. These leases require payment of certain operating expenses and contain renewal options. In 2010, the bank signed a three year lease for the branch that is opening in Round Hill, VA. The leases for the Jubal Early branch and the Medical Office branch were not renewed in 2010. The total minimum rental commitment at December 31, 2010 under these leases was due as follows:
50
Table of Contents
| December 31, 2010 | ||||
| (in thousands) | ||||
| 2011 |
$ | 103 | ||
| 2012 |
103 | |||
| 2013 |
81 | |||
| 2014 |
49 | |||
| 2015 |
49 | |||
| Thereafter |
839 | |||
| $ | 1,224 | |||
The total building and equipment rental expense was $176,000, $174,000, and $180,000 in 2010, 2009, and 2008, respectively.
NOTE 6. Deposits
The composition of deposits at December 31, 2010 and 2009 was as follows:
| December 31, | ||||||||
| 2010 | 2009 | |||||||
| (in thousands) | ||||||||
| Noninterest bearing demand deposits |
$ | 98,256 | $ | 90,575 | ||||
| Savings and interest bearing demand deposits: |
||||||||
| NOW accounts |
$ | 72,413 | $ | 71,413 | ||||
| Money market accounts |
69,766 | 61,934 | ||||||
| Regular savings accounts |
42,369 | 37,138 | ||||||
| $ | 184,548 | $ | 170,485 | |||||
| Time deposits: |
||||||||
| Balances of less than $100,000 |
$ | 85,269 | $ | 83,904 | ||||
| Balances of $100,000 and more |
61,223 | 53,143 | ||||||
| $ | 146,492 | $ | 137,047 | |||||
| $ | 429,296 | $ | 398,107 | |||||
Time deposits with balances of less than $100,000 include $20,172,000 and $11,022,000 in brokered certificates of deposit at December 31, 2010 and 2009, respectively. Time deposits with balances of $100,000 and more include $11,726,000 and $7,891,000 in brokered certificates of deposit at December 31, 2010 and 2009, respectively.
The outstanding balance of time deposits at December 31, 2010 was due as follows:
| December 31, 2010 | ||||
| (in thousands) | ||||
| 2011 |
$ | 110,592 | ||
| 2012 |
7,714 | |||
| 2013 |
2,984 | |||
| 2014 |
12,835 | |||
| 2015 |
12,308 | |||
| Thereafter |
59 | |||
| $ | 146,492 | |||
Deposit overdrafts reclassified as loans totaled $107,000 and $117,000 at December 31, 2010 and 2009, respectively.
NOTE 7. Borrowings
The Company, through its subsidiary bank, borrows funds in the form of federal funds purchased, securities sold under agreements to repurchase and Federal Home Loan Bank advances.
Federal fund lines of credit are extended to the Bank by nonaffiliated banks with which a correspondent banking relationship exists. The line of credit amount is determined by the creditworthiness of the Bank and, in particular, its regulatory capital ratios, which are discussed in Note 15.
51
Table of Contents
Federal funds purchased generally mature each business day. The following table summarizes information related to federal funds purchased for the years ended December 31, 2010 and 2009:
| December 31, | ||||||||
| 2010 | 2009 | |||||||
| (dollars in thousands) | ||||||||
| Balance at year-end |
$ | — | $ | — | ||||
| Average balance during the year |
503 | 1,115 | ||||||
| Average interest rate during the year |
0.70 | % | 0.83 | % | ||||
| Maximum month-end balance during the year |
$ | 4,680 | $ | 7,363 | ||||
| Gross lines of credit at year-end |
36,000 | 36,000 | ||||||
| Unused lines of credit at year-end |
36,000 | 36,000 | ||||||
Securities sold under agreements to repurchase are borrowings in which the Bank obtains funds by selling securities and simultaneously agreeing to repurchase the securities for an agreed upon term at a given price which includes interest. The Company had $4,395,000 in funds from certain customers through retail repurchase agreements at December 31, 2010. Generally, the term for retail repurchase agreements is the next business day. The Company had $10,000,000 in funds from a larger financial institution through a wholesale repurchase agreement at December 31, 2010. The original term of this wholesale repurchase agreement, which was executed during 2008, was five years and the counterparty has the option to call the debt after three years. The amount of borrowings through securities sold under agreements to repurchase is restricted by the amount of securities which are designated for these transactions. The following table summarizes information related to securities sold under agreement to repurchase for the years ended December 31, 2010 and 2009:
| December 31, | ||||||||
| 2010 | 2009 | |||||||
| (dollars in thousands) | ||||||||
| Balance at year-end |
$ | 14,395 | $ | 14,016 | ||||
| Average balance during the year |
14,971 | 14,621 | ||||||
| Average interest rate during the year |
2.56 | % | 2.62 | % | ||||
| Maximum month-end balance during the year |
$ | 15,552 | $ | 15,210 | ||||
| Securities underlying the agreements at year-end: |
||||||||
| Carrying value |
19,198 | 17,658 | ||||||
| Fair value |
19,667 | 18,046 | ||||||
The Bank had a $110,600,000 line of credit with the Federal Home Loan Bank of Atlanta which was secured by a blanket lien on the loan portfolio at December 31, 2010. The Company had $52,250,000 in advances outstanding at December 31, 2010 (see details below); therefore, the unused line of credit totaled $58,350,000. Advances bear interest at a fixed or floating rate depending on the terms and maturity of each advance and numerous renewal options are available to the Company.
The Company had $20,000,000 in short-term borrowings with the FHLB at December 31, 2010. The weighted average interest rate on outstanding short-term advances at December 31, 2010 was 3.08%.
The Company had $32,250,000 in long-term borrowings with the FHLB at December 31, 2010, which matures as follows: $10,000,000 in 2012, $2,250,000 in 2014, and $20,000,000 in 2015. The interest rates on the outstanding long-term advances at December 31, 2010 ranged from 3.03% to 4.08%. The weighted average interest rate on outstanding long-term advances at December 31, 2010 was 3.68%.
NOTE 8. Income Taxes
The Company files income tax returns with the United States of America and the Commonwealth of Virginia. With few exceptions, the Company is no longer subject to federal, state, or local income tax examinations for years prior to 2007.
The net deferred tax asset at December 31, 2010 and 2009 consisted of the following components:
52
Table of Contents
| December 31, | ||||||||
| 2010 | 2009 | |||||||
| (in thousands) | ||||||||
| Deferred tax assets: |
||||||||
| Allowance for loan losses |
$ | 2,418 | $ | 2,030 | ||||
| Deferred compensation |
116 | 137 | ||||||
| Accrued postretirement benefits |
49 | 53 | ||||||
| Accrued pension benefits |
147 | 288 | ||||||
| Home equity origination costs |
45 | 59 | ||||||
| Securities available for sale |
— | — | ||||||
| Other than temporary impairment |
846 | 846 | ||||||
| Interest rate swap |
57 | — | ||||||
| Other real estate owned expenses |
39 | 108 | ||||||
| Other |
243 | 171 | ||||||
| $ | 3,960 | $ | 3,692 | |||||
| Deferred tax liabilities: |
||||||||
| Property and equipment |
$ | 458 | $ | 464 | ||||
| Securities available for sale |
796 | 737 | ||||||
| Interest rate swap |
— | 83 | ||||||
| $ | 1,254 | $ | 1,284 | |||||
| Net deferred tax asset |
$ | 2,706 | $ | 2,408 | ||||
The Company has not recorded a valuation allowance for deferred tax assets because management believes that it is more likely than not that they will be ultimately realized.
Income tax expense for the years ended December 31, 2010, 2009 and 2008 consisted of the following components:
| December 31, | ||||||||||||
| 2010 | 2009 | 2008 | ||||||||||
| (in thousands) | ||||||||||||
| Current tax expense |
$ | 1,381 | $ | 1,667 | $ | 2,820 | ||||||
| Deferred tax provision (benefit) |
(362 | ) | (652 | ) | (1,463 | ) | ||||||
| $ | 1,019 | $ | 1,015 | $ | 1,357 | |||||||
The following table reconciles income tax expense to the statutory federal corporate income tax amount, which was calculated by applying the federal corporate income tax rate to pre-tax income for the years ended December 31, 2010, 2009 and 2008.
| December 31, | ||||||||||||
| 2010 | 2009 | 2008 | ||||||||||
| (in thousands) | ||||||||||||
| Statutory federal corporate tax amount |
$ | 1,572 | $ | 1,515 | $ | 1,840 | ||||||
| Tax-exempt interest income |
(544 | ) | (505 | ) | (486 | ) | ||||||
| Other |
(9 | ) | 5 | 3 | ||||||||
| $ | 1,019 | $ | 1,015 | $ | 1,357 | |||||||
NOTE 9. Pension and Postretirement Benefit Plans
The Company has a funded noncontributory defined benefit pension plan that covers substantially all of its employees. The plan provides defined benefits based on years of service and final average salary. Effective December 31, 2006, the pension plan was amended so that no further benefits will accrue under the plan and no additional employees may become participants.
The Company provides certain health care and life insurance benefits for six retired employees who have met certain eligibility requirements. All other employees retiring after reaching age 65 and having at least 15 years of service with the Company will be allowed to stay on the Company’s group life and health insurance policies, but will be required to pay premiums. The Company’s share of the estimated costs that will be paid after retirement is generally being accrued by charges to expense over the employees’ active service periods to the dates they are fully eligible for benefits, except that the Company’s unfunded cost that existed at January 1, 1993 is being accrued primarily in a straight-line manner that will result in its full accrual by December 31, 2013.
53
Table of Contents
The following amounts that have not been recognized in the net periodic benefit cost of the pension plan for the year ended December 31, 2010 and are included in other comprehensive income: unrecognized net actuarial loss of $286,000.
The following amounts that have not been recognized in the net periodic benefit cost of the postretirement benefit plan for the year ended December 31, 2009 and are included in other comprehensive income: unrecognized net actuarial gain of $62,000. The transition obligation included in other comprehensive income and expected to be recognized in the net periodic benefit cost of the postretirement benefit plan during 2011 is $0.
The following tables provide a reconciliation of the changes in the benefit obligations and fair value of assets for 2010, 2009, and 2008 and a statement of the funded status at December 31, 2010, 2009 and 2008 for the pension and postretirement benefit plans of the Company. The Company uses a December 31st measurement date for its plans.
| Pension Plan | Postretirement Benefits Plan | |||||||||||||||||||||||
| 2010 | 2009 | 2008 | 2010 | 2009 | 2008 | |||||||||||||||||||
| (in thousands) | ||||||||||||||||||||||||
| Change in Benefit Obligation: |
||||||||||||||||||||||||
| Benefit obligation, beginning |
$ | 3,801 | $ | 3,859 | $ | 3,962 | $ | 154 | $ | 254 | $ | 263 | ||||||||||||
| Service cost |
— | — | — | — | — | — | ||||||||||||||||||
| Interest cost |
189 | 191 | 178 | 7 | 14 | 15 | ||||||||||||||||||
| Actuarial (gain) loss |
(246 | ) | 95 | (226 | ) | (11 | ) | (105 | ) | (14 | ) | |||||||||||||
| Benefits paid |
(60 | ) | (344 | ) | (55 | ) | (6 | ) | (9 | ) | (10 | ) | ||||||||||||
| Curtailment gain |
— | — | — | — | — | — | ||||||||||||||||||
| Benefit obligation, ending |
$ | 3,684 | $ | 3,801 | $ | 3,859 | $ | 144 | $ | 154 | $ | 254 | ||||||||||||
| Change in Plan Assets: |
||||||||||||||||||||||||
| Fair value of plan assets, beginning |
$ | 2,955 | $ | 2,691 | $ | 3,392 | $ | — | $ | — | $ | — | ||||||||||||
| Actual return on plan assets |
78 | 498 | (646 | ) | — | — | — | |||||||||||||||||
| Employer contributions |
279 | 110 | — | 6 | 9 | 10 | ||||||||||||||||||
| Benefits paid |
(60 | ) | (344 | ) | (55 | ) | (6 | ) | (9 | ) | (10 | ) | ||||||||||||
| Fair value of plan assets, ending |
$ | 3,252 | $ | 2,955 | $ | 2,691 | $ | — | $ | — | $ | — | ||||||||||||
| Pension Plan | Postretirement Benefits Plan | |||||||||||||||||||||||
| 2010 | 2009 | 2008 | 2010 | 2009 | 2008 | |||||||||||||||||||
| (in thousands) | ||||||||||||||||||||||||
| Funded Status: |
||||||||||||||||||||||||
| Funded status |
$ | (432 | ) | $ | (846 | ) | $ | (1,168 | ) | $ | (144 | ) | $ | (154 | ) | $ | (254 | ) | ||||||
| Unrecognized net actuarial loss |
— | — | — | — | — | — | ||||||||||||||||||
| Unrecognized net transition obligation |
— | — | — | — | — | — | ||||||||||||||||||
| Unrecognized prior service cost |
— | — | — | — | — | — | ||||||||||||||||||
| Prepaid (accrued) benefits |
$ | (432 | ) | $ | (846 | ) | $ | (1,168 | ) | $ | (144 | ) | $ | (154 | ) | $ | (254 | ) | ||||||
| Amounts Recognized in Consolidated Balance Sheets: |
||||||||||||||||||||||||
| Prepaid benefit cost |
$ | — | $ | — | $ | — | $ | — | $ | — | $ | — | ||||||||||||
| Accrued benefit (liability) |
(432 | ) | (846 | ) | (1,168 | ) | (144 | ) | (154 | ) | (254 | ) | ||||||||||||
| $ | (432 | ) | $ | (846 | ) | $ | (1,168 | ) | $ | (144 | ) | $ | (154 | ) | $ | (254 | ) | |||||||
| Amounts Recognized in Accumulated Other Comprehensive Income: |
||||||||||||||||||||||||
| Net actuarial loss (gain) |
$ | 434 | $ | 846 | $ | 1,482 | $ | (93 | ) | $ | (92 | ) | $ | 14 | ||||||||||
| Net transition obligation |
— | — | — | — | 2 | 5 | ||||||||||||||||||
| Deferred tax (benefit)/liability |
(147 | ) | (288 | ) | (504 | ) | 30 | 31 | (6 | ) | ||||||||||||||
| $ | 287 | $ | 558 | $ | 978 | $ | (63 | ) | $ | (59 | ) | $ | 13 | |||||||||||
The accumulated benefit obligation for the pension plan was $3,684,000, $3,801,000, and $3,859,000 at December 31, 2010, 2009, and 2008, respectively. Due to the amendment of the pension plan, the accumulated benefit obligation and projected benefit obligation are equivalent at December 31, 2010, 2009 and 2008.
The following tables provide the components of net periodic benefit cost of the pension plan and postretirement benefit plan for the years ended December 31, 2010, 2009, and 2008:
54
Table of Contents
| Pension Plan | Postretirement Benefits Plan | |||||||||||||||||||||||
| 2010 | 2009 | 2008 | 2010 | 2009 | 2008 | |||||||||||||||||||
| (in thousands) | ||||||||||||||||||||||||
| Components of Net Periodic Benefit Cost: |
||||||||||||||||||||||||
| Service cost |
$ | — | $ | — | $ | — | $ | — | $ | — | $ | — | ||||||||||||
| Interest cost |
189 | 191 | 178 | 7 | 14 | 15 | ||||||||||||||||||
| Expected return on plan assets |
(146 | ) | (132 | ) | (168 | ) | — | — | — | |||||||||||||||
| Amortization of prior service costs |
— | — | — | — | — | — | ||||||||||||||||||
| Amortization of transition obligation |
— | — | — | 2 | 3 | 3 | ||||||||||||||||||
| Amortization of net actuarial loss |
235 | 365 | 166 | (9 | ) | — | 0 | |||||||||||||||||
| Net periodic benefit cost |
$ | 278 | $ | 424 | $ | 176 | $ | — | $ | 17 | $ | 18 | ||||||||||||
The total recognized net periodic benefit cost and other comprehensive income for the pension plan was $(5,042), $4,000, and $455,000 during 2010, 2009, and 2008, respectively. The total recognized net periodic benefit cost and other comprehensive income for the postretirement benefits plan was $2,000, $(54,000), and $7,000 during 2010, 2009, and 2008, respectively.
The benefit obligation for the pension plan was calculated using the following assumptions; weighted average discount rate of 6.10% for 2010 and 5.00% 2009 and 2008. Due to the amendment of the pension plan, no rate of compensation increase was assumed for or 2010, 2009, and 2008.
The net periodic benefit cost for the pension plan was calculated using the following assumptions; weighted average discount rate of 5.00% for 2010, 5.00% for 2009, and 4.53% for 2008, expected long-term return on plan assets of 5.00% for 2010, 2009, and 2008. Due to the amendment of the pension plan, no rate of compensation increase was assumed for 2010, 2009, and 2008.
The benefit obligation for the postretirement benefit plan was calculated using a weighted average discount rate of 5.00% for 2010, 6.00% for 2009, and 6.00% for 2008. For measurement purposes, a 10.00% annual rate of increase in the per capita cost of covered health care benefits was assumed for 2010 and 2011, 8.00% for 2012 and 2013, and 6.00% for 2014 and thereafter. If these rates were increased by 1.00% in each year, the benefit obligation at December 31, 2010 would have increased by $6,000 and the net periodic benefit cost for 2010 would have increased by less than $500. If these rates were decreased by 1.00% in each year, the benefit obligation at December 31, 2010 would have decreased by $5,000 and the net periodic benefit cost for 2010 would have decreased by less than $300.
The following table provides the pension plan’s asset allocation as of December 31, 2009 and 2008:
| December 31, | ||||||||
| 2010 | 2009 | |||||||
| Equity securities |
— | 43 | % | |||||
| Debt securities |
57 | % | 51 | % | ||||
| Other |
43 | % | 6 | % | ||||
| Total |
100 | % | 100 | % | ||||
The investment policy of the pension plan prescribes certain target allocations for the different types of securities within the portfolio. The assets are periodically reallocated to meet these targets and the policy is reviewed periodically, under the advisement of a certified investment advisor, to determine if it should be modified. The policy’s objective is to maximize returns without undue exposure to risk. The total return of the portfolio over a three year time period should exceed the greater of 7% annually or the increase in the Consumer Price Index plus 3% annually. The pension plan’s allowable investments are: (1) cash and cash equivalents, (2) fixed income securities, which include preferred stocks, corporate debt securities, obligations of the U.S. Government and its agencies, tax-exempt and taxable securities of municipal and state governments and securities convertible to equities, and (3) readily marketable equity securities of U.S. corporations. Investment in the securities of a single issuer (excluding the U.S. Government and its agencies) must not exceed 10% of the total portfolio’s market value.
The Company made $279,000 in contributions to the pension plan during 2010 and anticipates that all plan assets will be distributed to plan beneficiaries during 2011. Defined benefit pension plan expenses are projected to be approximately $515,000 in 2011 and nothing going forward.
Estimated future benefit payments at December 31, 2010, which reflect expected future service, as appropriate, were as follows:
| Pension | Postretirement | |||||||
| Benefits | Benefits | |||||||
| (in thousands) | ||||||||
| 2011 |
$ | 3,684 | $ | 14 | ||||
| 2012 |
— | 14 | ||||||
| 2013 |
— | 14 | ||||||
| 2014 |
— | 14 | ||||||
| 2015 |
— | 14 | ||||||
| 2016 - 2020 |
— | 61 | ||||||
55
Table of Contents
The pension financial instruments measured and reported at fair value are classified and disclosed in one of the following categories:
| • Level 1 | Inputs to the valuation methodology are quoted prices (unadjusted) for identical assets or liabilities in active markets. | |
| • Level 2 | Inputs to the valuation methodology include quoted prices for similar assets and liabilities in active markets, and inputs that are observable for the asset or liability, either directly or indirectly, for substantially the full term of the financial instrument. | |
| • Level 3 | Inputs to the valuation methodology are unobservable and significant to the fair value measurement. | |
The following table presents balances of pension assets measured at fair value on December 31, 2010 and December 31, 2009:
| Fair Value Measurements at December 31, 2010 Using | ||||||||||||||||
| Balance as of December 30, 2010 |
Quoted Prices in Active Markets for Identical Assets |
Significant Other Observable Inputs |
Significant Unobservable Inputs |
|||||||||||||
| (Level 1) | (Level 2) | (Level 3) | ||||||||||||||
| (in thousands) | ||||||||||||||||
| Cash |
$ | 1 | $ | 1 | $ | — | $ | — | ||||||||
| Cash Equivalents |
1,406 | 1,406 | ||||||||||||||
| AA corporate bonds |
131 | — | 131 | — | ||||||||||||
| Mutual funds (a) |
1,714 | 1,714 | — | — | ||||||||||||
| Total assets at fair value |
$ | 3,252 | $ | 3,121 | $ | 131 | $ | — | ||||||||
| Fair Value Measurements at December 31, 2009 Using | ||||||||||||||||
| Balance as of December 31, 2009 |
Quoted Prices in Active Markets for Identical Assets |
Significant Other Observable Inputs |
Significant Unobservable Inputs |
|||||||||||||
| (Level 1) | (Level 2) | (Level 3) | ||||||||||||||
| (in thousands) | ||||||||||||||||
| Cash |
$ | 3 | $ | 3 | $ | — | $ | — | ||||||||
| Cash Equivalents |
190 | 190 | ||||||||||||||
| U.S. Treasury Bonds & Notes |
174 | 174 | — | — | ||||||||||||
| Corporate Bonds & Notes |
403 | — | 403 | — | ||||||||||||
| Mutual Funds (a) |
687 | 687 | — | — | ||||||||||||
| Mutual Funds - Equity (b) |
1,498 | 1,498 | — | — | ||||||||||||
| Total assets at fair value |
$ | 2,955 | $ | 2,552 | $ | 403 | $ | — | ||||||||
| (a) | 100% of mutual funds are invested in fixed income corporate bond securities. |
| (b) | 70% of mutual funds invest in common stock of large-cap companies. 30% of mutual funds invest in common stock of mid-cap companies. 10% of mutual funds invest in common stock of small-cap companies. |
NOTE 10. Stock-Based Compensation
The exercise price of stock options granted under this plan, both incentive and non-qualified, cannot be less than the fair market value of the common stock on the date that the option is granted. The maximum term for an option granted under this plan is ten years and options granted may be subject to a vesting schedule. All of the non-qualified stock options granted under the plan had a ten year term and were subject to a vesting period. The following table summarizes options outstanding at December 31, 2010, 2009, and 2008:
56
Table of Contents
| 2010 | 2009 | 2008 | ||||||||||||||||||||||||||
| Shares | Weighted Average Exercise Price |
Aggregate Intrinsic Value |
Shares | Weighted Average Exercise Price |
Shares | Weighted Average Exercise Price |
||||||||||||||||||||||
| Outstanding, beginning of year |
22,000 | $ | 21.59 | 22,000 | $ | 21.59 | 26,000 | $ | 21.59 | |||||||||||||||||||
| Granted |
— | — | — | — | — | — | ||||||||||||||||||||||
| Exercised |
— | — | — | — | — | — | ||||||||||||||||||||||
| Forfeited |
— | — | — | — | 4,000 | $ | 21.59 | |||||||||||||||||||||
| Outstanding, end of year |
22,000 | $ | 21.59 | $ | (111,980 | ) | 22,000 | $ | 21.59 | 22,000 | $ | 21.59 | ||||||||||||||||
| Exercisable, end of year |
22,000 | $ | 21.59 | $ | (111,980 | ) | 22,000 | $ | 21.59 | 22,000 | $ | 21.59 | ||||||||||||||||
| Weighted average fair value of options granted during the year |
$ | — | $ | — | $ | — | ||||||||||||||||||||||
The aggregate intrinsic value in the table is equal to the amount that would have been received by the option holders had all options been exercised on December 31, 2010. It is derived from the amount by which the current market value of the underlying stock exceeds the exercise price of the option. This amount fluctuates in relation to the market value of the Company’s stock.
The following table summarizes options outstanding and exercisable at December 31, 2010:
| Options Outstanding | Options Exercisable | |||||||||||||||||||||
| Range of |
Number Outstanding |
Weighted Average Remaining Contractual Life (in years) |
Weighted Average Exercise Price |
Number Exercisable |
Weighted Average Exercise Price |
|||||||||||||||||
| $ | 21.63 | 11,000 | 2.75 | $ | 21.63 | 11,000 | $ | 21.63 | ||||||||||||||
| 21.55 | 11,000 | 3.75 | 21.55 | 11,000 | 21.55 | |||||||||||||||||
| $ | 21.55 - 21.63 | 22,000 | 3.25 | $ | 21.59 | 22,000 | $ | 21.59 | ||||||||||||||
Restricted Stock provides grantees with rights to shares of common stock upon completion of a service period or achievement of Company performance measures. During the restriction period, all shares are considered outstanding and dividends are paid to the grantee. Outside directors are periodically granted restricted shares which vest over a period of less than six months. During 2007, executive officers were granted restricted shares which vest over a three year service period and restricted shares which vest based on meeting performance measures over a three year period. The following table presents the activity for Restricted Stock for the years ended December 31, 2010, 2009 and 2008:
| 2010 | 2009 | 2008 | ||||||||||||||||||||||
| Shares | Weighted Average Grant Date Fair Value |
Shares | Weighted Average Grant Date Fair Value |
Shares | Weighted Average Grant Date Fair Value |
|||||||||||||||||||
| Nonvested, beginning of year |
13,335 | $ | 20.00 | 11,492 | $ | 26.16 | 11,770 | $ | 29.06 | |||||||||||||||
| Granted |
12,900 | 16.14 | 11,700 | 16.06 | 10,830 | 22.14 | ||||||||||||||||||
| Vested |
(7,936 | ) | 19.51 | (7,509 | ) | 21.12 | (7,075 | ) | 24.27 | |||||||||||||||
| Forfeited |
(5,527 | ) | 18.86 | (2,348 | ) | 26.94 | (4,033 | ) | 27.13 | |||||||||||||||
| Nonvested, end of year |
12,772 | $ | 16.89 | 13,335 | $ | 20.00 | 11,492 | $ | 26.16 | |||||||||||||||
The Company recognizes compensation expense over the restricted period. Compensation expense was $116,000, $166,000, and $175,000 during 2010, 2009, and 2008, respectively. The total grant date fair value of Restricted Stock which vested was $155,000 and $159,000 for the years ended December 31, 2010 and 2009, respectively. Unrecognized compensation cost related to unvested Restricted Stock was $68,000 at December 31, 2010. This amount is expected to be recognized over a weighted average period of 1.0 years.
57
Table of Contents
NOTE 11. Employee Benefits
The Company has established an Employee Stock Ownership Plan (ESOP) to provide additional retirement benefits to substantially all employees. Contributions can be made to the Bank of Clarke County Employee Retirement Trust to be used to purchase the Company’s common stock. There were no contributions in 2010, 2009, and 2008.
The Company sponsors a 401(k) savings plan under which eligible employees may defer a portion of salary on a pretax basis, subject to certain IRS limits. Prior to January 1, 2007, the Company matched 50 percent of employee contributions, on a maximum of six percent of salary deferred, with Company common stock or cash, as elected by each employee. The shares for this purpose are provided principally by the Company’s employee stock ownership plan (ESOP), supplemented, as needed, by newly issued shares. Contributions under the plan amounted to $668,000 in 2010, $675,000 in 2009, and $736,000 in 2008. In conjunction with amending the pension plan, the 401(k) plan was amended, effective January 1, 2007, to include a non-elective safe-harbor employer contribution and an age-weighted employer contribution. Each December 31st, qualifying employees will receive a non-elective safe-harbor contribution equal to three percent of their salary for that year. Also, each December 31st, qualifying employees will receive an additional contribution based on their age and years of service. The percentage of salary for the age-weighted contribution increases on both factors, age and years of service, with a minimum of one percent of salary and a maximum of ten percent of salary.
The Company has established an Executive Supplemental Income Plan for certain key employees. Benefits are to be paid in monthly installments following retirement or death. The agreement provides that if employment is terminated for reasons other than death or disability prior to age 65, the amount of benefits could be reduced or forfeited. The executive supplemental income benefit expense, based on the present value of the retirement benefits, was $13,000 in 2010, $14,000 in 2009, and $37,000 in 2008. The plan is unfunded; however, life insurance has been acquired on the lives of these employees in amounts sufficient to discharge the plan’s obligations.
NOTE 12. Commitments and Contingencies
In the normal course of business, the Company makes various commitments and incurs certain contingent liabilities, which are not reflected in the accompanying financial statements. These commitments and contingent liabilities include various guarantees, commitments to extend credit and standby letters of credit. The Company does not anticipate any material losses as a result of these commitments.
During the normal course of business, various legal claims arise from time to time which, in the opinion of management, will have no material effect on the Company’s consolidated financial statements.
As a member of the Federal Reserve System, the Bank is required to maintain certain average reserve balances. These reserve balances include usable vault cash and amounts on deposit with the Federal Reserve Bank. For the final weekly reporting period in the years ended December 31, 2010 and 2009, the amount of daily average required balances were approximately $824,000 and $748,000, respectively. In addition, the Bank was required to maintain a compensating balance on deposit with a correspondent bank in the amount of $250,000 at December 31, 2010 and 2009.
See Note 18 with respect to financial instruments with off-balance-sheet risk.
NOTE 13. Derivative Instruments and Hedging Activities
Interest Rate Swaps
The Company uses interest rate swaps to reduce interest rate risks and to manage interest expense. By entering into these agreements, the Company converts floating rate debt into fixed rate debt, or alternatively, converts fixed rate debt into floating rate debt. Interest differentials paid or received under the swap agreements are reflected as adjustments to interest expense. These interest rate swap agreements are derivative instruments that qualify for hedge accounting as discussed in Note 1. The notional amounts of the interest rate swaps are not exchanged and do not represent exposure to credit loss. In the event of default by a counterparty, the risk in these transactions is the cost of replacing the agreements at current market rates.
On December 4, 2008, the Company entered into an interest rate swap agreement related to the outstanding trust preferred capital notes. The swap agreement became effective on December 1, 2008. The notional amount of the interest rate swap was $7,000,000 and has an expiration date of December 1, 2016. The estimated fair value was $(169,000) at December 31, 2010 and $244,000 at December 31, 2009. Under the terms of the agreement, the Company pays interest quarterly at a fixed rate of 2.85% and receives interest quarterly at a variable rate of three month LIBOR. The variable rate resets on each interest payment date. The Company recognized interest expense of $135,000 in 2009 and $178,000 in 2010 related to this interest rate swap.
The following table summarizes the fair value of derivative instruments at December 31, 2010 and 2009:
| 2010 | 2009 | |||||||||||||||
| Balance Sheet Location |
Fair Value |
Balance Sheet Location |
Fair Value |
|||||||||||||
| (dollars in thousands) | ||||||||||||||||
| Derivatives designated as hedging instruments under GAAP |
||||||||||||||||
| Interest rate swap contracts |
Other Liabilities | $ | 169 | Other Assets | $ | 244 | ||||||||||
58
Table of Contents
The following tables present the effect of the derivative instrument on the Consolidated Balance Sheet at December 31, 2010 and 2009 and the Consolidated Statements of Income for December 31, 2010 and 2009:
| Year Ended December 31, | ||||||||||||||||||||||
| Derivatives in GAAP Cash Flow Hedging Relationships |
Amount of Loss Recognized in OCI on Derivative (Effective Portion) |
Location of Loss Reclassified from Accumulated OCI into Income (Realized Portion) |
Amount of Loss Reclassified from Accumulated OCI into Income (Realized Portion) |
|||||||||||||||||||
| 2010 | 2009 | 2010 | 2009 | 2008 | ||||||||||||||||||
| (dollars in thousands) | (dollars in thousands) | |||||||||||||||||||||
| Interest rate swap contracts, net of tax |
$ | (273 | ) | $ | 312 | Interest expense | $ | 178 | $ | 135 | $ | 4 | ||||||||||
NOTE 14. Transactions with Directors and Officers
The Bank grants loans to and accepts deposits from its directors, principal officers and related parties of such persons during the ordinary course of business. The aggregate balance of loans to directors, principal officers and their related parties was $10,281,000 and $10,119,000 at December 31, 2010 and 2009, respectively. These balances reflect total principal additions of $10,443,000 and total principal payments of $10,278,000 during 2010. The aggregate balance of deposits from directors, principal officers and their related parties was $7,436,000 and $6,729,000 at December 31, 2010 and 2009, respectively.
NOTE 15. Capital Requirements
The Company (on a consolidated basis) and the Bank are subject to various regulatory capital requirements administered by the federal banking agencies. Failure to meet minimum capital requirements can initiate certain mandatory and possibly additional discretionary actions by regulators that, if undertaken, could have a direct material effect on the Company’s and Bank’s financial statements. Under capital adequacy guidelines and the regulatory framework for prompt corrective action, the Company and the Bank must meet specific capital guidelines that involve quantitative measures of their assets, liabilities, and certain off-balance-sheet items as calculated under regulatory accounting practices. The capital amounts and classification are also subject to qualitative judgments by the regulators about components, risk weightings, and other factors. Prompt corrective action provisions are not applicable to bank holding companies.
Quantitative measures established by regulation to ensure capital adequacy require the Company and the Bank to maintain minimum amounts and ratios (set forth in the table below) of total and Tier 1 capital (as defined in the regulations) to risk-weighted assets (as defined), and of Tier 1 capital to average assets (as defined). Management believes that the Company and the Bank met all capital adequacy requirements to which they are subject at December 31, 2010 and 2009.
At December 31, 2010, the most recent notification from the Federal Reserve Bank categorized the Bank as well capitalized under the regulatory framework for prompt corrective action. To be categorized as well capitalized, an institution must maintain minimum total risk-based, Tier 1 risk-based, and Tier 1 leverage ratios as set forth in the tables. There are no conditions or events since the notification that management believes have changed the Bank’s category. The following table presents the Company’s and the Bank’s actual capital amounts and ratios at December 31, 2010 and 2009:
59
Table of Contents
| Actual | Minimum Capital Requirement |
Minimum To Be Well Capitalized Under Prompt Corrective Action Provisions |
||||||||||||||||||||||
| Amount | Ratio | Amount | Ratio | Amount | Ratio | |||||||||||||||||||
| (dollars in thousands) | ||||||||||||||||||||||||
| December 31, 2010: |
||||||||||||||||||||||||
| Total Capital to Risk Weighted Assets |
||||||||||||||||||||||||
| Consolidated |
$ | 64,692 | 16.02 | % | $ | 32,299 | 8.00 | % | N/A | |||||||||||||||
| Bank of Clarke County |
$ | 58,111 | 14.56 | % | $ | 31,935 | 8.00 | % | $ | 39,919 | 10.00 | % | ||||||||||||
| Tier 1 Capital to Risk Weighted Assets |
||||||||||||||||||||||||
| Consolidated |
$ | 59,619 | 14.77 | % | $ | 16,150 | 4.00 | % | N/A | |||||||||||||||
| Bank of Clarke County |
$ | 53,095 | 13.30 | % | $ | 15,967 | 4.00 | % | $ | 23,951 | 6.00 | % | ||||||||||||
| Tier 1 Capital to Average Assets |
||||||||||||||||||||||||
| Consolidated |
$ | 59,619 | 10.62 | % | $ | 22,462 | 4.00 | % | N/A | |||||||||||||||
| Bank of Clarke County |
$ | 53,095 | 9.56 | % | $ | 22,226 | 4.00 | % | $ | 27,783 | 5.00 | % | ||||||||||||
| December 31, 2009: |
||||||||||||||||||||||||
| Total Capital to Risk Weighted Assets |
||||||||||||||||||||||||
| Consolidated |
$ | 62,506 | 15.66 | % | $ | 31,924 | 8.00 | % | N/A | |||||||||||||||
| Bank of Clarke County |
$ | 55,882 | 14.18 | % | $ | 31,536 | 8.00 | % | $ | 39,420 | 10.00 | % | ||||||||||||
| Tier 1 Capital to Risk Weighted Assets |
||||||||||||||||||||||||
| Consolidated |
$ | 57,506 | 14.41 | % | $ | 15,962 | 4.00 | % | N/A | |||||||||||||||
| Bank of Clarke County |
$ | 50,942 | 12.92 | % | $ | 15,768 | 4.00 | % | $ | 23,652 | 6.00 | % | ||||||||||||
| Tier 1 Capital to Average Assets |
||||||||||||||||||||||||
| Consolidated |
$ | 57,506 | 10.84 | % | $ | 21,227 | 4.00 | % | N/A | |||||||||||||||
| Bank of Clarke County |
$ | 50,942 | 9.72 | % | $ | 20,974 | 4.00 | % | $ | 26,218 | 5.00 | % | ||||||||||||
NOTE 16. Restrictions On Dividends, Loans and Advances
Federal and state banking regulations place certain restrictions on dividends paid and loans or advances made by the Bank to the Company. The total amount of dividends which may be paid at any date is generally limited to the lesser of the Bank’s retained earnings or the three preceding years’ undistributed net income of the Bank. Loans or advances are limited to 10% of the Bank’s capital stock and surplus on a secured basis. In addition, dividends paid by the Bank to the Company would be prohibited if the effect thereof would cause the Bank’s capital to be reduced below applicable minimum capital requirements.
At December 31, 2010, the Bank’s retained earnings available for the payment of dividends to the Company was $4,957,000. Accordingly, $49,294,000 of the Company’s equity in the net assets of the Bank was restricted at December 31, 2010. Funds available for loans or advances by the Bank to the Company amounted to $1,146,000 at December 31, 2010.
NOTE 17. Dividend Investment Plan
The Company has a Dividend Investment Plan, which allows participants’ dividends to purchase additional shares of common stock at 95% of its fair market value on each dividend record date.
NOTE 18. Financial Instruments with Off-Balance-Sheet Risk
The Company, through its subsidiary bank, is a party to credit related financial instruments with off-balance-sheet risk in the normal course of business to meet the financing needs of its customers. These financial instruments include commitments to extend credit, unfunded commitments under lines of credit, and commercial and standby letters of credit. Such commitments involve, to varying degrees, elements of credit and interest rate risk in excess of the amount recognized in the consolidated balance sheets.
The Company’s exposure to credit loss is represented by the contractual amount of these instruments. The Company uses the same credit policies in making commitments as it does for on-balance-sheet instruments.
At December 31, 2010 and 2009, the following financial instruments were outstanding whose contract amounts represent credit risk:
60
Table of Contents
| 2010 | 2009 | |||||||
| Commitments to extend credit |
$ | 6,111,000 | $ | 6,189,000 | ||||
| Unfunded commitments under lines of credit |
64,195,000 | 68,996,000 | ||||||
| Commercial and standby letters of credit |
4,953,000 | 5,455,000 | ||||||
Commitments to extend credit are agreements to lend to a customer as long as the terms offered are acceptable and certain other conditions are met. Commitments generally have fixed expiration dates or other termination clauses. Since these commitments may expire or terminate, the total commitment amounts do not necessarily represent future cash requirements. The amount of collateral obtained, with regards to these commitments, is based on management’s credit evaluation of the customer.
Unfunded commitments under lines of credit are contracts for possible future extensions of credit to existing customers. Unfunded commitments under lines of credit include, but are not limited to, home equity lines of credit, overdraft protection lines of credit, credit cards, and unsecured and secured commercial lines of credit. The terms and conditions of these commitments vary depending on the line of credit’s purpose, collateral, and maturity. The amount disclosed above represents total unused lines of credit for which a contract with the Bank has been established.
Commercial and standby letters of credit are conditional commitments issued by the Bank to guarantee the performance of a customer to a third party. These letters of credit are primarily issued to support public and private borrowing arrangements. Essentially all letters of credit issued have expiration dates within one year. The credit risk involved in issuing letters of credit is essentially the same as that involved in granting loans to customers. The Bank holds collateral supporting these commitments if it is deemed necessary. At December 31, 2010, none of the outstanding letters of credit were collateralized.
The Bank has cash accounts in other commercial banks. The amount on deposit in these banks at December 31, 2010 exceeded the insurance limits of the Federal Deposit Insurance Corporation by $172,000.
NOTE 19. Trust Preferred Capital Notes
In June 2007, Eagle Financial Statutory Trust II (the “Trust II”), a wholly-owned subsidiary of the Company, was formed for the purpose of issuing redeemable capital securities. On June 20, 2007, Trust II issued $7,000,000 of trust preferred securities and $217,000 in common equity. The principal asset of Trust II is $7,217,000 of the Company’s junior subordinated debt securities with the same maturity and interest rate structures as the capital securities. The securities have a LIBOR-indexed floating rate of interest and the interest rate was 1.92% and 1.88% at December 31, 2010 and 2009, respectively. The securities have a mandatory redemption date of September 1, 2037, and are subject to varying call provisions beginning September 1, 2012.
The trust preferred securities are included in Tier 1 capital for regulatory capital adequacy purposes as long as their amount does not exceed 25% of Tier 1 capital, including total trust preferred securities. The portion of the trust preferred securities not considered as Tier 1 capital, if any, may be included in Tier 2 capital. At December 31, 2010, the total amount ($7,000,000) of trust preferred securities issued by Trust II are included in the Company’s Tier 1 capital.
The obligations of the Company with respect to the issuance of the capital securities constitute a full and unconditional guarantee by the Company of the Trust’s obligations with respect to the capital securities.
Subject to certain exceptions and limitations, the Company may elect from time to time to defer interest payments on the junior subordinated debt securities, which would result in a deferral of distribution payments on the related capital securities.
NOTE 20. Quarterly Condensed Statements of Income - Unaudited
The Company’s quarterly net income, net income per common share and dividends per common share during 2010 and 2009 are summarized as follows:
61
Table of Contents
| 2010 Quarter Ended | ||||||||||||||||
| March 31 | June 30 | September 30 | December 31 | |||||||||||||
| (in thousands, except per share amounts) | ||||||||||||||||
| Total interest and dividend income |
$ | 6,844 | $ | 6,934 | $ | 6,950 | $ | 7,061 | ||||||||
| Net interest income after provision for loan losses |
4,879 | 4,785 | 2,721 | 3,549 | ||||||||||||
| Noninterest income |
1,364 | 1,383 | 1,475 | 1,277 | ||||||||||||
| Noninterest expenses |
4,058 | 4,105 | 4,290 | 4,356 | ||||||||||||
| Income before income taxes |
2,185 | 2,063 | (94 | ) | 470 | |||||||||||
| Net income |
1,578 | 1,485 | 81 | 461 | ||||||||||||
| Net income per common share, basic |
0.49 | 0.46 | 0.02 | 0.14 | ||||||||||||
| Net income per common share, diluted |
0.49 | 0.46 | 0.02 | 0.14 | ||||||||||||
| Dividends per common share |
0.17 | 0.17 | 0.17 | 0.18 | ||||||||||||
| 2009 Quarter Ended | ||||||||||||||||
| March 31 | June 30 | September 30 | December 31 | |||||||||||||
| (in thousands, except per share amounts) | ||||||||||||||||
| Total interest and dividend income |
$ | 6,759 | $ | 6,868 | $ | 6,857 | $ | 6,969 | ||||||||
| Net interest income after provision for loan losses |
3,892 | 4,034 | 4,313 | 4,071 | ||||||||||||
| Noninterest income |
1,205 | 1,254 | 878 | 1,289 | ||||||||||||
| Noninterest expenses |
3,832 | 4,103 | 4,181 | 4,364 | ||||||||||||
| Income before income taxes |
1,265 | 1,185 | 1,010 | 996 | ||||||||||||
| Net income |
955 | 904 | 790 | 792 | ||||||||||||
| Net income per common share, basic |
0.30 | 0.29 | 0.25 | 0.25 | ||||||||||||
| Net income per common share, diluted |
0.30 | 0.28 | 0.25 | 0.25 | ||||||||||||
| Dividends per common share |
0.17 | 0.17 | 0.17 | 0.17 | ||||||||||||
NOTE 21. Fair Value Measurements
GAAP requires the Company to record fair value adjustments to certain assets and liabilities and to determine fair value disclosures. The fair value of certain assets and liabilities is an exit price, representing the amount that would be received to sell an asset or paid to transfer a liability in an orderly transaction between market participants.
“Fair Value Measurements” defines fair value, establishes a framework for measuring fair value, establishes a three-level valuation hierarchy for disclosure of fair value measurement and enhances disclosure requirements for fair value measurements. The valuation hierarchy is based upon the transparency of inputs to the valuation of an asset or liability as of the measurement date. The three levels are defined as follows:
| • Level 1 |
Inputs to the valuation methodology are quoted prices (unadjusted) for identical assets or liabilities in active markets. | |
| • Level 2 |
Inputs to the valuation methodology include quoted prices for similar assets and liabilities in active markets, and inputs that are observable for the asset or liability, either directly or indirectly, for substantially the full term of the financial instrument. | |
| • Level 3 |
Inputs to the valuation methodology are unobservable and significant to the fair value measurement. | |
The following sections provide a description of the valuation methodologies used for instruments measured at fair value, as well as the general classification of such instruments pursuant to the valuation hierarchy:
Securities Available for Sale: Where quoted prices are available in an active market, securities are classified within Level 1 of the valuation hierarchy. Level 1 securities would include highly liquid government bonds, mortgage products and exchange traded equities. If quoted market prices are not available, then fair values are estimated by using pricing models, quoted prices of securities with similar characteristics, or discounted cash flow. Level 2 securities would include U.S. agency securities, mortgage-backed agency securities, obligations of states and political subdivisions and certain corporate, asset backed and other securities. In certain cases where there is limited activity or less transparency around inputs to the valuation, securities are classified within Level 3 of the valuation hierarchy.
Interest Rate Swap: The fair value is estimated by a third party using inputs that are observable or that can be corroborated by observable market data, and therefore, are classified within Level 2 of the valuation hierarchy.
The following table presents balances of financial assets and liabilities measured at fair value on a recurring basis at December 31, 2010 and December 31, 2009:
62
Table of Contents
| Fair Value Measurements at December 31, 2010 Using | ||||||||||||||||
| Balance as of December 31, 2010 |
Quoted Prices in Active Markets for Identical Assets |
Significant Other Observable Inputs |
Significant Unobservable Inputs |
|||||||||||||
| (Level 1) | (Level 2) | (Level 3) | ||||||||||||||
| (in thousands) | ||||||||||||||||
| Assets: |
||||||||||||||||
| Securities available for sale |
||||||||||||||||
| Obligations of U.S. government corporations and agencies |
$ | 33,150 | $ | — | $ | 33,150 | $ | — | ||||||||
| Mortgage-backed securities |
16,157 | — | 16,157 | — | ||||||||||||
| Obligations of states and political subdivisions |
42,908 | — | 42,908 | — | ||||||||||||
| Corporate securities |
15,401 | 15,401 | ||||||||||||||
| Equity securities: |
||||||||||||||||
| Bank preferred stock |
2,178 | 2,178 | — | — | ||||||||||||
| Total assets at fair value |
$ | 109,794 | $ | 2,178 | $ | 107,616 | $ | — | ||||||||
| Liabilities: |
||||||||||||||||
| Interest rate swap |
169 | — | 169 | — | ||||||||||||
| Total liabilities at fair value |
$ | 169 | $ | — | $ | 169 | $ | — | ||||||||
| Fair Value Measurements at December 31, 2009 Using | ||||||||||||||||
| Balance as of December 31, 2009 |
Quoted Prices in Active Markets for Identical Assets |
Significant Other Observable Inputs |
Significant Unobservable Inputs |
|||||||||||||
| (Level 1) | (Level 2) | (Level 3) | ||||||||||||||
| (in thousands) | ||||||||||||||||
| Assets: |
||||||||||||||||
| Securities available for sale |
||||||||||||||||
| Obligations of U.S. government corporations and agencies |
$ | 27,045 | $ | — | $ | 27,045 | $ | — | ||||||||
| Mortgage-backed securities |
15,620 | — | 15,620 | — | ||||||||||||
| Obligations of states and political subdivisions |
37,057 | — | 37,057 | — | ||||||||||||
| Corporate securities |
14,944 | — | 14,944 | — | ||||||||||||
| Equity securities: |
||||||||||||||||
| Bank preferred stock |
2,145 | 2,145 | — | — | ||||||||||||
| Interest rate swap |
244 | — | 244 | — | ||||||||||||
| Total assets at fair value |
$ | 97,055 | $ | 2,145 | $ | 94,910 | $ | — | ||||||||
Certain financial assets are measured at fair value on a nonrecurring basis in accordance with GAAP. Adjustments to the fair value of these assets usually result from the application of lower of cost or market accounting or write downs of individual assets.
The following describes the valuation techniques used by the Company to measure certain financial and nonfinancial assets recorded at fair value on a nonrecurring basis in the financial statements:
Impaired Loans: Loans are designated as impaired when, in the judgment of management based on current information and events, it is probable that all amounts due according to the contractual terms of the loan agreement will not be collected. The measurement of loss associated with impaired loans can be based on either the observable market price of the loan or the fair value of the collateral. Fair value is measured based on the value of the collateral securing the loans. Collateral may be in the form of real estate or business assets including equipment, inventory, and accounts receivable. The vast majority of the collateral is real estate. Level 2 impaired loan value is determined by utilizing an income or market valuation approach based on an appraisal conducted by an independent, licensed appraiser outside of the Company using observable market data. If the collateral is a house or building in the process of construction or if an appraisal of the real estate property is over two years old, then the fair value is considered Level 3. The value of business equipment is based upon an outside appraisal if deemed significant, or the net book value on the applicable business’ financial statements if not considered significant using observable market data. Level 3 impaired loan values are determined
63
Table of Contents
using inventory and accounts receivables collateral and are based on financial statement balances or aging reports. Impaired loans for which an allocation is made to the Allowance for Loan Losses are measured at fair value on a nonrecurring basis. Any fair value adjustments are recorded in the period incurred as provision for loan losses on the Consolidated Statements of Income.
Other Real Estate Owned: Assets acquired through, or in lieu of, loan foreclosure are held for sale and are initially recorded at the lesser of the fair value of the property, less selling costs or the loan balance outstanding at the date of foreclosure. Any write-downs based on the asset’s fair value at the date of acquisition are charged to the allowance for loan losses. After foreclosure, valuations are periodically performed by management and property held for sale is carried at the lower of the new cost basis or fair value less cost to sell. Impairment losses on property to be held and used are measured as the amount by which the carrying amount of a property exceeds its fair value. Costs of significant property improvements are capitalized, whereas costs relating to holding property are expensed. The portion of interest costs relating to development of real estate is capitalized. Valuations are periodically performed by management, and any subsequent write-downs are recorded as a charge to operations, if necessary, to reduce the carrying value of a property to the lower of its cost or fair value less cost to sell. We believe that the fair value component in its valuation follows the provisions of GAAP.
Core deposit intangible: The fair value is determined by amortizing the intangible assets obtained during the acquisition of a branch in 1996. This was fully amortized in December 2010.
The following table summarizes the Company’s financial and nonfinancial assets that were measured at fair value on a nonrecurring basis during the period:
| Carrying value at December 31, 2010 | ||||||||||||||||
| Balance as of December 31, 2010 |
Quoted Prices in Active Markets for Identical Assets |
Significant Other Observable Inputs |
Significant Unobservable Inputs |
|||||||||||||
| (Level 1) | (Level 2) | (Level 3) | ||||||||||||||
| (in thousands) | ||||||||||||||||
| Financial Assets: |
||||||||||||||||
| Impaired loans |
$ | 17,524 | $ | — | $ | — | $ | 17,524 | ||||||||
| Nonfinancial Assets: |
||||||||||||||||
| Other real estate owned |
1,783 | — | — | 1,783 | ||||||||||||
| Carrying value at December 31, 2009 | ||||||||||||||||
| Balance as of December 31, 2009 |
Quoted Prices in Active Markets for Identical Assets |
Significant Other Observable Inputs |
Significant Unobservable Inputs |
|||||||||||||
| (Level 1) | (Level 2) | (Level 3) | ||||||||||||||
| (in thousands) | ||||||||||||||||
| Financial Assets: |
||||||||||||||||
| Impaired loans |
$ | 5,390 | $ | — | $ | — | $ | 5,390 | ||||||||
| Nonfinancial Assets: |
||||||||||||||||
| Other real estate owned |
2,776 | — | — | 2,776 | ||||||||||||
| Core deposit intangible |
45 | — | — | 45 | ||||||||||||
The fair value of a financial instrument is the current amount that would be exchanged between willing parties, other than in a forced liquidation. Fair value is best determined based upon quoted market prices. However, in many instances, there are no quoted market prices for the Company’s various financial instruments. In cases where quoted market prices are not available, fair values are based on estimates using present value or other valuation techniques. Those techniques are significantly affected by the assumptions used, including the discount rate and estimates of future cash flows. Accordingly, the fair value estimates may not be realized in an immediate settlement of the instrument. The aggregate fair value amounts presented may not necessarily represent the underlying fair value of the Company. The following methods and assumptions were used to estimate the fair value of the Company’s financial instruments:
Cash and short-term investments/accrued interest: The fair value was equal to the carrying amount.
Securities: The fair value, excluding restricted securities, was based on quoted market prices. The fair value of restricted securities approximated the carrying amount based on the redemption provisions of the issuers.
Loans: The fair value of variable rate loans, which reprice frequently and with no significant change in credit risk, was equal to the carrying amount. The fair value of all other loans was determined using discounted cash flow analysis. The discount rate was equal to the current interest rate on similar products.
64
Table of Contents
Deposits and borrowings: The fair value of demand deposits, savings accounts, and certain money market deposits was equal to the carrying amount. The fair value of all other deposits and borrowings was determined using discounted cash flow analysis. The discount rate was equal to the current interest rate on similar products.
Off-balance-sheet financial instruments: The fair value of commitments to extend credit was estimated using the fees currently charged to enter similar agreements, taking into account the remaining terms of the agreements and the credit worthiness of the counterparties. The fair value of fixed rate loan commitments also considered the difference between current interest rates and the committed interest rates. The fair value of standby letters of credit was estimated using the fees currently charged for similar agreements or on the estimated cost to terminate or otherwise settle the obligations with the counterparties.
The carrying amount and fair value of the Company’s financial instruments at December 31, 2010 and 2009 were as follows:
| December 31, 2010 | December 31, 2009 | |||||||||||||||
| Carrying Amount |
Fair Value |
Carrying Amount |
Fair Value |
|||||||||||||
| (in thousands) | (in thousands) | |||||||||||||||
| Financial assets: |
||||||||||||||||
| Cash and short-term investments |
$ | 13,970 | $ | 13,970 | $ | 7,354 | $ | 7,354 | ||||||||
| Securities |
109,794 | 109,794 | 101,210 | 101,210 | ||||||||||||
| Loans, net |
401,338 | 416,669 | 398,096 | 409,004 | ||||||||||||
| Accrued interest receivable |
2,179 | 2,179 | 2,181 | 2,181 | ||||||||||||
| Interest rate swap contract |
— | — | 244 | 244 | ||||||||||||
| Financial liabilities: |
||||||||||||||||
| Deposits |
$ | 429,296 | $ | 430,627 | $ | 398,107 | $ | 398,903 | ||||||||
| Federal funds purchased and securities sold under agreements to repurchase |
14,395 | 14,950 | 14,016 | 14,423 | ||||||||||||
| Federal Home Loan Bank advances |
52,250 | 54,853 | 62,250 | 64,800 | ||||||||||||
| Trust preferred capital notes |
7,217 | 7,217 | 7,217 | 7,217 | ||||||||||||
| Accrued interest payable |
417 | 417 | 401 | 401 | ||||||||||||
| Interest rate swap contract |
169 | 169 | — | — | ||||||||||||
The Company assumes interest rate risk (the risk that general interest rate levels will change) during its normal operations. As a result, the fair value of the Company’s financial instruments will change when interest rate levels change and that change may be either favorable or unfavorable to the Company. Management attempts to match maturities of assets and liabilities in order to minimize interest rate risk. However, borrowers with fixed rate obligations are less likely to prepay their principal balance in a rising rate environment and more likely to do so in a falling rate environment. Conversely, depositors who are receiving fixed rate interest payments are more likely to withdraw funds before maturity in a rising rate environment and less likely to do so in a falling rate environment. Management monitors rates and maturities of assets and liabilities and attempts to minimize interest rate risk by adjusting the terms of new loans and deposits and by investing in securities with terms that mitigate the Company’s overall interest rate risk.
NOTE 22. Subsequent Events
The Company has evaluated events and transactions subsequent to December 31, 2010 but before the financial statements are issued. Based on definitions and requirements of Generally Accepted Accounting Principles for “Subsequent Events”, the Company has not identified any subsequent events that require adjustment to, or disclosure in, the financial statements.
65
Table of Contents
NOTE 23. Condensed Financial Information – Parent Company Only
EAGLE FINANCIAL SERVICES, INC.
(Parent Company Only)
Balance Sheets
December 31, 2010 and 2009
(dollars in thousands)
| 2010 | 2009 | |||||||
| Assets |
||||||||
| Cash held in subsidiary bank |
$ | 164 | $ | 314 | ||||
| Due from Banks |
502 | — | ||||||
| Securities available for sale |
5,793 | 5,995 | ||||||
| Investment in subsidiaries, at cost, plus undistributed net income |
54,251 | 51,887 | ||||||
| Investment in limited partnership |
— | — | ||||||
| Other assets |
536 | 692 | ||||||
| Total assets |
$ | 61,246 | $ | 58,888 | ||||
| Liabilities and Shareholders’ Equity |
||||||||
| Trust preferred capital notes |
$ | 7,217 | $ | 7,217 | ||||
| Other liabilities |
200 | 28 | ||||||
| Total liabilities |
$ | 7,417 | $ | 7,245 | ||||
| Shareholders’ Equity |
||||||||
| Preferred stock |
$ | — | $ | — | ||||
| Common stock |
8,124 | 7,999 | ||||||
| Surplus |
9,076 | 8,504 | ||||||
| Retained earnings |
35,419 | 34,048 | ||||||
| Accumulated other comprehensive income |
1,210 | 1,092 | ||||||
| Total shareholders’ equity |
$ | 53,829 | $ | 51,643 | ||||
| Total liabilities and shareholders’ equity |
$ | 61,246 | $ | 58,888 | ||||
66
Table of Contents
EAGLE FINANCIAL SERVICES, INC.
(Parent Company Only)
Statements of Income
Years Ended December 31, 2010, 2009, and 2008
(dollars in thousands)
| 2010 | 2009 | 2008 | ||||||||||
| Income |
||||||||||||
| Dividends from subsidiary bank |
$ | 1,500 | $ | 1,200 | $ | 3,550 | ||||||
| Interest on loans |
— | — | — | |||||||||
| Interest and dividends on securities available for sale |
368 | 384 | 350 | |||||||||
| (Loss) on equity investments |
— | — | — | |||||||||
| Other income |
16 | (40 | ) | (65 | ) | |||||||
| Total income |
$ | 1,884 | $ | 1,544 | $ | 3,835 | ||||||
| Expenses |
||||||||||||
| Interest expense on borrowings |
$ | 316 | $ | 319 | $ | 342 | ||||||
| Other operating expenses |
112 | 115 | 92 | |||||||||
| Total expenses |
$ | 428 | $ | 434 | $ | 434 | ||||||
| Income before income tax (benefit) and equity in undistributed net income of subsidiary bank |
$ | 1,456 | $ | 1,110 | $ | 3,401 | ||||||
| Income Tax (Benefit) |
(41 | ) | (52 | ) | (84 | ) | ||||||
| Income before equity in undistributed net income of subsidiary bank |
$ | 1,497 | $ | 1,162 | $ | 3,485 | ||||||
| Equity in Undistributed Net Income of Subsidiary Bank |
2,108 | 2,279 | 570 | |||||||||
| Net income |
$ | 3,605 | $ | 3,441 | $ | 4,055 | ||||||
67
Table of Contents
EAGLE FINANCIAL SERVICES, INC.
(Parent Company Only)
Statements of Cash Flows
Years Ended December 31, 2010, 2009, and 2008
(dollars in thousands)
| 2010 | 2009 | 2008 | ||||||||||
| Cash Flows from Operating Activities |
||||||||||||
| Net Income |
$ | 3,605 | $ | 3,441 | $ | 4,055 | ||||||
| Adjustments to reconcile net income to net cash provided by operating activities |
||||||||||||
| Amortization |
— | — | — | |||||||||
| Loss on equity investment |
— | — | — | |||||||||
| Premium amortization (discount accretion) on securities |
(1 | ) | 1 | (1 | ) | |||||||
| Undistributed earnings of subsidiary bank |
(2,108 | ) | (2,279 | ) | (570 | ) | ||||||
| Changes in assets and liabilities: |
||||||||||||
| (Increase) decrease in other assets |
(24 | ) | (8 | ) | 50 | |||||||
| (Decrease) increase in other liabilities |
3 | 1 | (11 | ) | ||||||||
| Net cash provided by operating activities |
$ | 1,475 | $ | 1,156 | $ | 3,523 | ||||||
| Cash Flows from Investing Activities |
||||||||||||
| Purchase of securities available for sale |
$ | — | $ | — | $ | (3,018 | ) | |||||
| Proceeds from maturities of securities available for sale |
406 | — | 815 | |||||||||
| Net decrease in loans |
— | — | — | |||||||||
| Net cash (used in) investing activities |
$ | 406 | $ | — | $ | (2,203 | ) | |||||
| Cash Flows from Financing Activities |
||||||||||||
| Cash dividends paid |
$ | (1,645 | ) | $ | (1,587 | ) | $ | (1,541 | ) | |||
| Proceeds from issuance of common stock, employee benefit plan |
— | 76 | — | |||||||||
| Stock-based compensation expense |
116 | 166 | 176 | |||||||||
| Net cash (used in) financing activities |
$ | (1,529 | ) | $ | (1,345 | ) | $ | (1,365 | ) | |||
| Increase (decrease) in cash |
$ | 352 | $ | (189 | ) | $ | (45 | ) | ||||
| Cash |
||||||||||||
| Beginning |
$ | 314 | $ | 503 | $ | 548 | ||||||
| Ending |
$ | 666 | $ | 314 | $ | 503 | ||||||
68
Table of Contents
| Item 9. | Changes in and Disagreements with Accountants on Accounting and Financial Disclosure |
None.
| Item 9A. | Controls and Procedures |
Disclosure Controls and Procedures
The Company, under the supervision and with the participation of management, including the Company’s Chief Executive Officer and Chief Financial Officer, has evaluated the effectiveness of the design and operation of its disclosure controls and procedures as of the end of the period covered by this Annual Report on Form 10-K. Based on that evaluation, the Chief Executive Officer and Chief Financial Officer have concluded that the Company’s disclosure controls and procedures were effective as of December 31, 2010 to ensure that information required to be disclosed by the Company in reports that it files or submits under the Securities Exchange Act of 1934 is recorded, processed, summarized and reported within the time periods specified in Securities and Exchange Commission rules and forms.
Internal Control over Financial Reporting
Management is also responsible for establishing and maintaining adequate internal control over the Company’s financial reporting (as defined in Rule 13a-15(f) promulgated under the Securities Exchange Act of 1934, as amended). Pursuant to Section 404 of the Sarbanes-Oxley Act of 2002, management has conducted an assessment of the design and effectiveness of its internal controls over financial reporting based on criteria established in Internal Control – Integrated Framework issued by the Committee of Sponsoring Organizations of the Treadway Commission (“COSO”).
Management maintains a comprehensive system of internal control to provide reasonable assurance regarding the reliability of financial reporting and the preparation of financial statements for external purposes in accordance with generally accepted accounting principles. The system of internal control provides for appropriate division of responsibility and is documented by written policies and procedures that are communicated to employees. Those policies and procedures: 1) pertain to the maintenance of records that in reasonable detail accurately and fairly reflect the transactions and disposition of the assets of the Company, 2) provide reasonable assurance that receipts and expenditures of the Company are being made only in accordance with authorizations of management and directors, 3) provide reasonable assurance regarding prevention or timely detection of unauthorized acquisition, use or disposition of the Company’s assets that could have a material effect on the financial statements. Management recognizes that that there are inherent limitations over internal controls and financial reporting may not prevent or detect misstatements. Changes in conditions will also impact the internal control effectiveness over time. Eagle Financial Services, Inc. and subsidiaries maintains an internal auditing program, under the supervision of the Audit Committee of the Board of Directors, which independently assesses the effectiveness of the system of internal control and recommends possible improvements.
Under the supervision and with the participation of the Company’s management, including its Chief Executive Officer and Chief Financial Officer, the Company has evaluated the effectiveness of its internal control over financial reporting as of December 31, 2010, using the Internal Control – Integrated Framework issued by the Committee of Sponsoring Organizations of the Treadway Commission. Based upon this evaluation, the Chief Executive Officer and the Chief Financial Officer have concluded as of December 31, 2010, the Company’s internal control over financial reporting is adequate and effective and meets the criteria of the Internal Control – Integrated Framework.
Management’s assessment did not determine any material weaknesses within the Company’s internal control structure. There were no changes in the Company’s internal control over financial reporting during the Company’s quarter ended December 31, 2010 that have materially affected, or are reasonably likely to materially affect, the Company’s internal control over financial reporting.
This annual report does not include an attestation report of the company’s registered public accounting firm, regarding internal control over financial reporting. Management’s report was not subject to attestation by the Company’s registered public accounting firm pursuant to rules of the Securities and Exchange Commission that permit the Company to provide only management’s report in this annual report.
| Item 9B. | Other Information |
None.
69
Table of Contents
PART III
| Item 10. | Directors, Executive Officers and Corporate Governance |
The information required by Part III, Item 10. is incorporated herein by reference to the Proxy Statement for the 2010 Annual Meeting of Shareholders to be held May 18, 2011.
| Item 11. | Executive Compensation |
The information required by Part III, Item 11. is incorporated herein by reference to the Proxy Statement for the 2010 Annual Meeting of Shareholders to be held May 18, 2011.
| Item 12. | Security Ownership of Certain Beneficial Owners and Management and Related Stockholder Matters |
The information required by Part III, Item 12. is incorporated herein by reference to the Proxy Statement for the 2010 Annual Meeting of Shareholders to be held May 18, 2011.
| Item 13. | Certain Relationships and Related Transactions, and Director Independence |
The information required by Part III, Item 13. is incorporated herein by reference to the Proxy Statement for the 2010 Annual Meeting of Shareholders to be held May 18, 2011.
| Item 14. | Principal Accounting Fees and Services |
The information required by Part III, Item 14. is incorporated herein by reference to the Proxy Statement for the 2010 Annual Meeting of Shareholders to be held May 18, 2011.
70
Table of Contents
PART IV
| Item 15. | Exhibits, Financial Statement Schedules |
(a)(1) Financial Statements
The financial statements are filed as part of this Annual Report on Form 10-K within Item 8.
(a)(2) Financial Statement Schedules
All financial statement schedules are omitted since they are not required, or are not applicable, or the required information is given in the financial statements or notes thereto.
(a)(3) Exhibits
The following exhibits, as applicable, are filed with this Form 10-K or incorporated by reference to previous filings.
| Exhibit No. |
Description | |
| 3.1 | Articles of Incorporation of the Company, restated in electronic format only as of March 1, 2006 (incorporated herein by reference to Exhibit 3.1 of the Company’s Current Report on Form 8-K dated March 1, 2006). | |
| 3.2 | Bylaws of the Company (incorporated herein by reference to Exhibit 3.2 of the Company’s Registration Statement on Form S-4, Registration No. 33-43681). | |
| 10.1 | Description of Executive Supplemental Income Plan (incorporated by reference to Exhibit 10.1 of the Company’s Annual Report on Form 10-K for the year ended December 31, 1996).* | |
| 10.2 | Amended and Restated Employment Agreement of John R. Milleson (incorporated herein by reference to Exhibit 10.2 of the Company’s Annual Report on Form 10-K for the year ended December 31, 2008).* | |
| 10.3 | Amended and Restated Employment Agreement of James W. McCarty, Jr. (incorporated herein by reference to Exhibit 10.3 of the Company’s Annual Report on Form 10-K for the year ended December 31, 2008).* | |
| 10.4 | Amended and Restated Employment Agreement of Elizabeth M. Pendleton (incorporated herein by reference to Exhibit 10.4 of the Company’s Annual Report on Form 10-K for the year ended December 31, 2008).* | |
| 10.5 | Eagle Financial Services, Inc. Stock Incentive Plan (incorporated herein by reference to Exhibit 4.3 of the Company’s Registration Statement on Form S-8, Registration No. 333-118319).* | |
| 10.6 | Amended and Restated Employment Agreement of John E. Hudson (incorporated herein by reference to Exhibit 10.6 of the Company’s Annual Report on Form 10-K for the year ended December 31, 2008).* | |
| 10.7 | Amended and Restated Employment Agreement of Kaley P. Crosen (incorporated herein by reference to Exhibit 10.7 of the Company’s Annual Report on Form 10-K for the year ended December 31, 2008).* | |
| 10.8 | Employment Agreement of Dale L. Fritts (incorporated herein by reference to Exhibit 10.8 of the Company’s Annual Report on Form 10-K for the year ended December 31, 2008).* | |
| 10.9 | Offer Letter of Kathleen J. Chappell (incorporated herein by reference to Exhibit 10.8 of the Company’s Annual Report on Form 10-K for the year ended December 31, 2008).* | |
| 21.1 | Subsidiaries of the Company. | |
| 23.1 | Consent of Smith Elliott Kearns & Company, LLC. | |
| 31.1 | Certification by Chief Executive Officer pursuant to Rule 13a-14(a) under the Securities Exchange Act of 1934, as adopted pursuant to Section 302 of the Sarbanes-Oxley Act of 2002. | |
| 31.2 | Certification by Chief Financial Officer pursuant to Rule 13a-14(a) under the Securities Exchange Act of 1934, as adopted pursuant to Section 302 of the Sarbanes-Oxley Act of 2002. | |
| 32.1 | Certification by Chief Executive Officer and Chief Financial Officer pursuant to 18 U.S.C. Section 1350, as adopted pursuant to Section 906 of the Sarbanes-Oxley Act of 2002. | |
| * | Management contracts and compensatory plans and arrangements. |
| (b) | See Item 15(a)(3) above. |
| (c) | See Item 15(a)(2) above. |
71
Table of Contents
SIGNATURES
Pursuant to the requirements of Section 13 or 15(d) of the Securities Exchange Act of 1934, the registrant has duly caused this report to be signed on its behalf by the undersigned, thereunto duly authorized.
| Eagle Financial Services, Inc. | ||
| By: | /s/ JOHN R. MILLESON | |
| John R. Milleson President and Chief Executive Officer | ||
Pursuant to the requirements of the Securities Exchange Act of 1934, this report has been signed below by the following persons on behalf of the registrant and in the capacities indicated on March 30, 2011.
| Signature |
Title |
|||
| /s/ JOHN R. MILLESON John R. Milleson |
President, Chief Executive Officer, and Director (principal executive officer) |
|||
| /s/ KATHLEEN J. CHAPPELL Kathleen J. Chappell |
Vice President and Chief Financial Officer (principal financial and accounting officer) |
|||
| /s/ THOMAS T. GILPIN Thomas T. Gilpin |
Chairman of the Board and Director |
|||
| /s/ ROBERT W. SMALLEY, JR. Robert W. Smalley, Jr. |
Vice Chairman of the Board and Director |
|||
| /s/ THOMAS T. BYRD Thomas T. Byrd |
Director |
|||
| /s/ MARY BRUCE GLAIZE Mary Bruce Glaize |
Director |
|||
| /s/ DOUGLAS C. RINKER Douglas C. Rinker |
Director |
|||
| /s/ JOHN D. STOKELY, JR. John D. Stokely, Jr. |
Director |
|||
| /s/ JAMES T. VICKERS James T. Vickers |
Director |
|||
| /s/ RANDALL G. VINSON Randall G. Vinson |
Director |
|||
| /s/ JAMES R. WILKINS, JR James R. Wilkins, Jr. |
Director |
|||
72
Table of Contents
EXHIBIT INDEX
| Exhibit No. |
Description | |
| 3.1 | Articles of Incorporation of the Company, restated in electronic format only as of March 1, 2006 (incorporated herein by reference to Exhibit 3.1 of the Company’s Current Report on Form 8-K dated March 1, 2006). | |
| 3.2 | Bylaws of the Company (incorporated herein by reference to Exhibit 3.2 of the Company’s Registration Statement on Form S-4, Registration No. 33-43681). | |
| 10.1 | Description of Executive Supplemental Income Plan (incorporated by reference to Exhibit 10.1 of the Company’s Annual Report on Form 10-K for the year ended December 31, 1996).* | |
| 10.2 | Amended and Restated Employment Agreement of John R. Milleson (incorporated herein by reference to Exhibit 10.2 of the Company’s Annual Report on Form 10-K for the year ended December 31, 2008).* | |
| 10.3 | Amended and Restated Employment Agreement of James W. McCarty, Jr. (incorporated herein by reference to Exhibit 10.3 of the Company’s Annual Report on Form 10-K for the year ended December 31, 2008).* | |
| 10.4 | Amended and Restated Employment Agreement of Elizabeth M. Pendleton (incorporated herein by reference to Exhibit 10.4 of the Company’s Annual Report on Form 10-K for the year ended December 31, 2008).* | |
| 10.5 | Eagle Financial Services, Inc. Stock Incentive Plan (incorporated herein by reference to Exhibit 4.3 of the Company’s Registration Statement on Form S-8, Registration No. 333-118319).* | |
| 10.6 | Amended and Restated Employment Agreement of John E. Hudson (incorporated herein by reference to Exhibit 10.6 of the Company’s Annual Report on Form 10-K for the year ended December 31, 2008).* | |
| 10.7 | Amended and Restated Employment Agreement of Kaley P. Crosen (incorporated herein by reference to Exhibit 10.7 of the Company’s Annual Report on Form 10-K for the year ended December 31, 2008).* | |
| 10.8 | Employment Agreement of Dale L. Fritts (incorporated herein by reference to Exhibit 10.8 of the Company’s Annual Report on Form 10-K for the year ended December 31, 2008).* | |
| 10.9 | Offer Letter of Kathleen J. Chappell (incorporated herein by reference to Exhibit 10.9 of the Company’s Annual Report on Form 10-K for the year ended December 31, 2008).* | |
| 21.1 | Subsidiaries of the Company. | |
| 23.1 | Consent of Smith Elliott Kearns & Company, LLC. | |
| 31.1 | Certification by Chief Executive Officer pursuant to Rule 13a-14(a) under the Securities Exchange Act of 1934, as adopted pursuant to Section 302 of the Sarbanes-Oxley Act of 2002. | |
| 31.2 | Certification by Chief Financial Officer pursuant to Rule 13a-14(a) under the Securities Exchange Act of 1934, as adopted pursuant to Section 302 of the Sarbanes-Oxley Act of 2002. | |
| 32.1 | Certification by Chief Executive Officer and Chief Financial Officer pursuant to 18 U.S.C. Section 1350, as adopted pursuant to Section 906 of the Sarbanes-Oxley Act of 2002. | |
| * | Management contracts and compensatory plans and arrangements. |