Attached files
| file | filename |
|---|---|
| EX-32.2 - EX-32.2 - PC CONNECTION INC | cnxn-20191231ex3228ee4fc.htm |
| EX-32.1 - EX-32.1 - PC CONNECTION INC | cnxn-20191231ex3216db51d.htm |
| EX-31.2 - EX-31.2 - PC CONNECTION INC | cnxn-20191231ex312afb05f.htm |
| EX-31.1 - EX-31.1 - PC CONNECTION INC | cnxn-20191231ex31144bb2d.htm |
| EX-23.1 - EX-23.1 - PC CONNECTION INC | cnxn-20191231ex23159d43a.htm |
| EX-21.1 - EX-21.1 - PC CONNECTION INC | cnxn-20191231ex211f1d984.htm |
| EX-4.2 - EX-4.2 - PC CONNECTION INC | cnxn-20191231ex424b78d1b.htm |
UNITED STATES
SECURITIES AND EXCHANGE COMMISSION
Washington, D. C. 20549
FORM 10-K
(Mark One)
☑ANNUAL REPORT PURSUANT TO SECTION 13 OR 15(d) OF THE SECURITIES EXCHANGE ACT OF 1934
For the fiscal year ended December 31, 2019
OR
◻TRANSITION REPORT PURSUANT TO SECTION 13 OR 15(d) OF THE SECURITIES EXCHANGE ACT OF 1934
For the transition period from ___________ to ___________.
Commission File Number 000-23827
PC CONNECTION, INC.
(Exact name of registrant as specified in its charter)
|
Delaware |
02-0513618 |
|
(State or other jurisdiction of incorporation or organization) |
(I.R.S. Employer Identification No.) |
|
730 Milford Road Merrimack, New Hampshire |
03054 (Zip Code) |
|
(Address of principal executive offices) |
|
|
|
Registrant’s telephone number, including area code |
(603) 683-2000 |
|
Securities registered pursuant to Section 12(b) of the Act:
|
Title of each class |
Trading symbol(s) |
Name of each exchange on which registered |
|
Common Stock |
CNXN |
Nasdaq Global Select Market |
Securities registered pursuant to Section 12(g) of the Act:
|
|
None |
|
|
|
(Title of Class) |
|
Indicate by check mark if the registrant is a well-known seasoned issuer, as defined in Rule 405 of the Securities Act.
Yes ☐ No ☑
Indicate by check mark if the registrant is not required to file reports pursuant to Section 13 or Section 15(d) of the Act.
Yes ☐ No ☑
Indicate by check mark whether the registrant: (1) has filed all reports required to be filed by Section 13 or 15(d) of the Securities Exchange Act of 1934 during the preceding 12 months (or for such shorter period that the registrant was required to file such reports), and (2) has been subject to such filing requirements for the past 90 days.
Yes ☑ No ☐
Indicate by check mark whether the registrant has submitted electronically every Interactive Data File required to be submitted pursuant to Rule 405 of Regulation S-T (§232.405 of this chapter) during the preceding 12 months (or for such shorter period that the registrant was required to submit such files).
Yes ☑ No ☐
Indicate by check mark whether the registrant is a large accelerated filer, an accelerated filer, a non-accelerated filer, a smaller reporting company, or an emerging growth company. See definitions of “large accelerated filer,” “accelerated filer,” “smaller reporting company,” and “emerging growth company” in Rule 12b-2 of the Exchange Act. (Check one):
Large Accelerated Filer ___ Accelerated Filer Non-accelerated Filer ___ Smaller Reporting Company ___ Emerging Growth Company ___
If an emerging growth company, indicate by check mark if the registrant has elected not to use the extended transition period for complying with any new or revised financial accounting standards provided pursuant to Section 13(a) of the Exchange Act. ☐
Indicate by check mark whether the registrant is a shell company (as defined in Rule 12b-2 of the Act).
Yes ☐ No ☑
The aggregate market value of the registrant’s voting shares of common stock held by non-affiliates of the registrant on June 28, 2019, based on $34.98 per share, the last reported sale price on the Nasdaq Global Select Market on that date, was $388,435,865.
The number of shares outstanding of each of the registrant’s classes of common stock, as of February 4, 2020:
|
Class |
|
Number of Shares |
|
Common Stock, $.01 par value |
|
26,344,841 |
The following documents are incorporated by reference into the Annual Report on Form 10-K: Portions of the registrant’s definitive Proxy Statement for its 2020 Annual Meeting of Stockholders are incorporated by reference into Part III of this Report.
FORWARD-LOOKING STATEMENTS
Statements contained or incorporated by reference in this Annual Report on Form 10‑K that are not based on historical fact are “forward-looking statements” within the meaning of the Private Securities Litigation Reform Act of 1995, Section 27A of the Securities Act of 1933, as amended, and Section 21E of the Exchange Act. These forward-looking statements regarding future events and our future results are based on current expectations, estimates, forecasts, and projections and the beliefs and assumptions of management including, without limitation, our expectations with regard to the industry’s rapid technological change and exposure to inventory obsolescence, availability and allocations of goods, reliance on vendor support and relationships, competitive risks, pricing risks, and the overall level of economic activity and the level of business investment in information technology products. Forward-looking statements may be identified by the use of forward-looking terminology such as “may,” “could,” “expect,” “believe,” “estimate,” “anticipate,” “continue,” “seek,” “plan,” “intend,” or similar terms, variations of such terms, or the negative of those terms.
We cannot assure investors that our assumptions and expectations will prove to have been correct. Because forward-looking statements relate to the future, they are subject to inherent uncertainties, risks, and changes in circumstances that are difficult to predict. These statements involve known and unknown risks, uncertainties, and other factors that may cause our actual results, performance, or achievements to be materially different from any future results, performance, or achievements expressed or implied by the forward-looking statements. We therefore caution you against undue reliance on any of these forward-looking statements. Important factors that could cause our actual results to differ materially from those indicated or implied by forward-looking statements include those discussed in Item 1A., “Risk Factors” of this Annual Report on Form 10-K. Any forward-looking statement made by us in this Annual Report on Form 10-K speaks only as of the date on which this Annual Report on Form 10-K was first filed. We undertake no intention or obligation to update or revise any forward-looking statements, whether as a result of new information, future events, or otherwise, except as may be required by law.
GENERAL
We are a national provider of a wide range of information technology, or IT, solutions. We help our customers design, enable, manage, and service their IT environments. We provide IT products, including computer systems, data center solutions, software and peripheral equipment, networking communications, and other products and accessories that we purchase from manufacturers, distributors, and other suppliers. We also offer services involving design, configuration, and implementation of IT solutions. These services are performed by our personnel and by third-party providers. We have three operating segments, which serve primarily: (a) small- to medium-sized businesses, or SMBs, in our Business Solutions segment, through our PC Connection Sales subsidiary, (b) large enterprise customers, in our Enterprise Solutions segment, through our MoreDirect subsidiary, and (c) federal, state, and local government and educational institutions, in our Public Sector Solutions segment, through our GovConnection subsidiary. Financial results for each of our segments are included in the financial statements attached hereto. We generate sales through (i) outbound telemarketing and field sales contacts by sales representatives focused on the business, educational, healthcare, and government markets, (ii) our websites, and (iii) direct responses from customers responding to our advertising media. We offer a broad selection of over 425,000 products at competitive prices, including products from vendors like Apple, Cisco Systems, Dell, Dell-EMC, Hewlett-Packard Inc., Hewlett-Packard Enterprise, Lenovo, Microsoft, and VMWare, and we partner with more than 1,600 suppliers. We typically leverage our state-of-the art logistic capabilities to ship product to customers the same day the order is received.
Since our founding in 1982, we have consistently served our customers’ needs by providing innovative, reliable, and timely service and technical support, and by offering an extensive assortment of industry-leading products through knowledgeable, well-trained sales and support teams. Our strategy’s effectiveness is reflected in the recognition we have received, including being named to the Fortune 1000 and the CRN Solution Provider 500 for nineteen straight years. Over the past few years, we have received numerous awards, including the Microsoft Excellence in Operations—Double Gold Level Award for delivering market-leading operational excellence, as well as being recently named to the CRN Tech Elite 250 for the fourth year. We believe that our ability to understand our customers’ needs and provide comprehensive and effective IT solutions has resulted in strong brand name recognition and a broad and loyal customer base. We also believe that through our strong vendor relationships we can provide an efficient supply chain and be an effective IT solution provider for our multiple customer segments.
We strive to identify the unique needs of our corporate, government, healthcare, educational, and small business customers, and have designed our business processes to enable our customers to effectively manage their IT systems. We provide value by offering our customers efficient design, integration, deployment, and support of their IT environments. As of December 31, 2019, we employed 841 sales representatives, whose average tenure exceeded seven years. Sales representatives are responsible for managing enterprise, commercial, and public sector accounts, as specialization and a deep understanding of unique customer environments are more important than ever. These sales representatives focus on current and prospective customers and are supported by an increasing number of engineering, technical, and administrative staff. We believe that increasing our salesforce productivity is important to our future success, and we have increased our headcount and investments in this area accordingly.
In September 2016, we launched “Connection®”, uniting all of our subsidiaries into one cohesive brand, reflecting the promise of our trademark blue arc and our mission to connect people with technology that enhances growth, elevates productivity, and empowers innovation. MoreDirect, our enterprise team, became Connection® Enterprise Solutions; PC Connection Sales Corp, our SMB-focused team, became Connection® Business Solutions; and GovConnection, our public sector team, became Connection® Public Sector Solutions.
We market our products and services through our websites: www.connection.com, www.connection.com/enterprise, www.connection.com/publicsector, and www.macconnection.com. Our websites provide extensive product information, customized pricing, rich content, and a digital platform for online orders.
1
We are subject to the informational requirements of the Securities Exchange Act of 1934, as amended, or the Exchange Act, and accordingly, we file reports, proxy and information statements, and other information with the Securities and Exchange Commission, or the SEC. The SEC maintains a website (http://www.sec.gov) that contains such reports, proxy and information statements, and other information regarding issuers that file electronically with the SEC. We maintain a corporate website with the address www.connection.com. We are not including the information contained in our website as part of, or incorporating by reference into, this Annual Report on Form 10-K. We make available free of charge through our website our Annual Reports on Form 10-K, quarterly reports on Form 10-Q, and current reports on Form 8-K, and amendments to these reports filed or furnished pursuant to Section 13(a) or 15(d) of the Exchange Act, as soon as reasonably practical after we electronically file these materials with, or otherwise furnish them to, the SEC.
MARKET AND COMPETITION
In the fiscal year ended December 31, 2019, we generated approximately 37.6% of our sales from small- to medium-sized customer accounts, 42.3% from medium-to-large corporate accounts (Fortune 1000), and 20.1% from government and educational institutions. The overall IT market that we serve is estimated to be approximately $200 billion.
The largest segment of this market is served by local and regional “value added resellers”, or VARs, many of whom we believe are transitioning from the hardware and software products business to higher-margin IT services. We have transitioned from an end-user or desktop-centric computing supplier to a network or enterprise-wide IT solutions supplier. We have also partnered with third-party technology and telecommunications service providers. We now offer our customers access to the same services and technical expertise as local and regional VARs, but with a more extensive product selection at generally lower prices.
Intense competition for customers has led manufacturers of our IT products to use all available channels, including solutions providers, to distribute their products. Certain of these manufacturers who have traditionally used resellers to distribute their products have, from time to time, established their own direct marketing operations, including sales through the Internet. Nonetheless, we believe that these manufacturers will continue to provide us and other third-party solutions providers favorable product allocations and marketing support.
We believe new entrants to the IT Solutions channel must overcome a number of obstacles, including:
|
· |
the substantial time and resources required to build a customer base of meaningful size and profitability for cost-effective operation; |
|
· |
the high costs of developing the information systems and operating infrastructure required to successfully compete as a national solutions provider; |
|
· |
the advantages enjoyed by larger and more established competitors in terms of purchasing and operating efficiencies; |
|
· |
the difficulty of building relationships with vendors to achieve favorable product allocations and attractive pricing terms; and |
|
· |
the difficulty of identifying and recruiting management personnel with significant direct marketing experience in the industry. |
BUSINESS STRATEGIES
We believe we become our customers’ IT provider of choice by providing innovative IT solutions which meet their needs of increased productivity, mobility, virtualization, and security in a continually evolving IT environment. We
2
provide enhanced value by assisting them in cost-effectively maximizing business opportunities provided by new technologies and advanced service solutions. The key elements of our business strategies include:
|
· |
Providing consistent customer service before, during, and after the sale. We believe that we have earned a reputation for providing superior customer service by consistently focusing on our customers’ needs. We have dedicated our resources to developing strong, long-term relationships with our customers by accurately assessing their IT needs, and providing scalable, high-quality solutions and services through our knowledgeable, well-trained personnel. Through operational excellence, we have efficient delivery programs that provide a quality buying experience for our customers. |
|
· |
Offering a broad product selection at competitive prices. We offer a broad range of IT products and solutions, including personal computers and related peripheral products, servers, storage, managed services, cloud solutions, and networking infrastructure, at costs that allow our customers to be more productive while maximizing their IT budgets. Our advanced solution offerings include network, server, storage, and mission-critical onsite installation and support using proprietary cloud-based service management software. We offer products and enhanced service capabilities with aggressive price and performance standards, all with the convenience of one-stop shopping for technology solutions. |
|
· |
Simplifying technology product procurement for corporate customers. We offer Internet-based procurement options to eliminate complexity and enhance customer value, as well as lower the cost of procurement for our customers. We specialize in Internet-based solutions and provide electronic integration between our customers and suppliers. |
|
· |
Offering targeted IT solutions. Our customers seek solutions to increasingly complex IT infrastructure demands. To better address their business needs, we have focused our solution service capabilities on seven practice areas—Converged Data Center, Networking, Mobility, Security, Cloud Solutions, Lifecycle, and Software. These IT practice groups are responsible for understanding the infrastructure needs of our customers, and for designing cost-effective technology solutions to address them. We have also partnered with third-party providers to make available a range of IT support services, including asset assessment, implementation, maintenance, and disposal services. We believe we can leverage these seven practice groups to transform our company into a recognized IT solution provider, which will enable us to capture a greater share of the IT expenditures of our customers. |
|
· |
Maintaining a strong brand name and customer awareness. Since our founding in 1982, we have built a strong brand name and customer awareness. We have been named to the Fortune 1000 and the CRN Solution Provider 500 for each of the last nineteen years. We actively work with our existing customers to become their IT provider of choice for products and enhanced solution services, while seeking to ensure our reputation of high-quality customer service, tailored marketing programs, and competitive pricing lead the way to expanding our share of the overall IT market. |
|
· |
Maintaining long-standing vendor relationships. We have a history of strong relationships with vendors, and were among the first national solutions providers qualified by manufacturers to market computer systems to end users. By working closely with our vendors to provide an efficient channel for the advertising and distribution of their products and solutions, we expect to expand market share and generate opportunities for optimizing partner incentive programs. |
GROWTH STRATEGIES
Our growth strategies are designed to increase revenues by maximizing operational efficiencies while offering innovative products and value added service offerings, increasing penetration of our existing customers, and expanding our customer base. Our six key elements of growth are:
|
· |
Expanding hardware and software offerings. We offer our customers an extensive range of IT hardware and software products, and in response to customer demand, we continually evaluate and add new products as they |
3
become available. We work closely with vendors to identify and source first-to-market product offerings at aggressive prices. |
|
· |
Expanding IT solution services offerings. We strive to accelerate solution and service growth by providing creative solutions to the increasingly complex hardware and software needs of our customers. Our Converged Data Center, Networking, Mobility, Security, Cloud Solutions, Lifecycle, and Software services practice groups consist of industry-certified and product-certified engineers, as well as highly specialized third-party providers. Our investment in these seven practice areas is expected to increase our share of our customers’ annual IT expenditures by broadening the range of products and services they purchase from us. |
|
· |
Targeting customer segments. Through increased targeted marketing, we seek to expand the number of our active customers and generate additional sales to existing customers by providing more value-added services and solutions. We have developed specialty catalogs featuring product offerings designed to address the needs of specific customer populations, including new product inserts targeted to purchasers of graphics, server, and networking products. We also utilize Internet marketing campaigns that focus on select markets, such as healthcare, retail, financial, and manufacturing. |
|
· |
Increasing productivity of our sales representatives. We believe that higher sales productivity is the key to leveraging our expense structure and driving future profitability improvements. We invest significant resources in training new sales representatives and providing ongoing training to experienced personnel. Our training and evaluation programs are focused towards assisting our sales personnel in understanding and anticipating clients’ IT needs, with the goal of fostering loyal customer relationships. We also provide our sales representatives with technical support on more complex sales opportunities through our expanding group of technical solution specialists. |
|
· |
Migrating to cloud-based solutions for our customers. Cloud computing is a key driver of new IT spending as our customers seek scalable, cost-effective solutions. We plan to expand our cloud-based solution sales and assist our customers in navigating the complex and growing field of cloud-solution offerings. |
|
· |
Pursuing strategic acquisitions and alliances. We seek acquisitions and alliances that add new customers, strengthen our product and solution offerings, add management talent, and produce operating results which are accretive to our core business earnings. |
SERVICE AND SUPPORT
Since our founding in 1982, our primary objective has been to provide products and services that meet the demands and needs of customers and to supplement those products with up-to-date product information and excellent customer service and support. We believe that offering our customers superior value, through a combination of product knowledge, consistent and reliable service and support, and leading products at competitive prices, differentiates us from other national solutions providers and provides the foundation for developing a broad and loyal customer base.
We invest in training programs for our service and support personnel, with an emphasis on putting customer needs and service first. Product support technicians assist customers with questions concerning compatibility, installation, and more difficult questions relating to product use. The product support technicians authorize customers to return defective or incompatible products to either the manufacturer or to us for warranty service. In-house technicians perform both warranty and non-warranty repair on most major systems and hardware products.
Using our customized information system, we transmit our customer orders either to our distribution center or to our drop‑ship suppliers, depending on product availability, for processing immediately after a customer receives credit approval. At our distribution center, we also perform custom configuration services, which typically includes custom imaging, the installation and integration of additional components, and other technology enhancements. Our customers may select the method of delivery that best meets their needs and is most cost effective, ranging from expedited overnight delivery for urgently needed items to ground freight.
4
Our inventory stocking strategy is based on economics and the general availability of the product. We will stock product where there is an economic advantage to do so, or the product is in constrained supply. We also will stock product to support customer rollouts, including product that is running through our configuration and integration services prior to shipment.
MARKETING AND SALES
We sell our products through our direct marketing channels to (i) SMBs including small office/home office customers, (ii) government and educational institutions, and (iii) medium-to-large corporate accounts. We strive to be the primary supplier of IT products and solutions to our existing and prospective customers by providing exemplary customer service. We use multiple marketing approaches to reach existing and prospective customers, including:
|
· |
outbound telemarketing and field sales; |
|
· |
digital, web, and print media advertising; and |
|
· |
targeted marketing programs to specific customer populations. |
All of our marketing approaches emphasize our broad product and service offerings, fast delivery, customer support, competitive pricing, and our wide range of service solutions.
Sales Channels. We believe that our ability to establish and maintain long-term customer relationships and to encourage repeat purchases is largely dependent on the strength of our sales personnel and programs. Because our customers’ primary contact with us is through our sales representatives, we are committed to maintaining a qualified, knowledgeable, and motivated sales staff with its principal focus on customer service.
Outbound Telemarketing and Field Sales. We seek to build loyal relationships with potential high-volume customers by assigning them to individual account managers. We believe that customers respond favorably to one-on-one relationships with personalized, well-trained account managers. Once established, these one-on-one relationships are maintained and enhanced through frequent telecommunications and targeted electronic communications, as well as other marketing materials designed to meet each customer’s specific IT needs. We pay most of our account managers a base annual salary plus incentive compensation. Incentive compensation is tied generally to gross profit dollars produced by the individual account manager. Account managers historically have significantly increased productivity after approximately twelve months of training and experience.
E-commerce Sales. (www.connection.com, www.connection.com/enterprise, www.connection.com/publicsector, and www.macconnection.com) We provide product descriptions and prices for generally all products online. Our Connection website also provides updated information for more than 425,000 items. We offer, and continuously update, selected product offerings and other special buys. We believe our websites are important sales sources and communication tools for improving customer service.
Our MoreDirect subsidiary’s business process and operations are primarily Web-based. Most of its corporate customers utilize a customized Web page to quickly search, source, and track IT products. MoreDirect’s website (www.connection.com/enterprise) aggregates the current available inventories of its largest IT suppliers into a single online source for its corporate customers. Its custom designed Internet-based system, TRAXX®, provides corporate buyers with comparative pricing from several suppliers as well as special pricing arranged through the manufacturer.
The Internet supports three key business initiatives for us:
|
· |
Customer choice — We have built our business on the premise that our customers should be able to choose how they interact with us--be it by telephone, or by means of their desktop or mobile device via email or the Internet. |
|
· |
Lowering transactions costs — Our website tools include robust product search features and Internet Business Accounts (customized Web pages), which allow customers to quickly and easily find information about |
5
products of interest to them. If customers still have questions, they may call our account managers. Such phone calls are typically shorter and have higher close rates than calls from customers who have not first visited our websites. |
|
· |
Leveraging the time of experienced sales representatives — Our investments in technology-based sales and service programs allow our sales representatives more time to build and maintain relationships with our customers and help them to solve their business problems. |
Business Segments. We conduct our business operations through three business segments: Business Solutions, Enterprise Solutions, and Public Sector Solutions.
Business Solutions Segment. Our principal target markets in this segment are small-to-medium-sized business customers. We use a combination of outbound telemarketing, including some on-site sales solicitation by business development managers, and Internet sales through customized Internet Business Accounts, to reach these customers.
Enterprise Solutions Segment. Through our custom designed Web-based system, we are able to offer our larger corporate customers an efficient and effective method of sourcing, evaluating, purchasing, and tracking a wide variety of IT products and services. Our strategy is to be the primary single source procurement portal for our large corporate customers.
Public Sector Solutions Segment. We use a combination of outbound telemarketing, including some on-site sales solicitation by business development managers, and Internet sales through customized Internet Business Accounts, to reach these customers. We target each of the four distinct market sectors within this segment—federal government, higher educational institutions, school grades K-12, and state and local governments.
The following table sets forth the relative distribution of net sales by business segment:
|
|
|
Years Ended December 31, |
|
||||
|
|
|
2019 |
|
2018 |
|
2017 |
|
|
Sales Segment |
|
|
|
|
|
|
|
|
Enterprise Solutions |
|
42 |
% |
43 |
% |
39 |
% |
|
Business Solutions |
|
38 |
|
38 |
|
40 |
|
|
Public Sector Solutions |
|
20 |
|
19 |
|
21 |
|
|
Total |
|
100 |
% |
100 |
% |
100 |
% |
Our brand, and each of Connection’s business segments, is supported by targeted marketing campaigns across a variety of media:
Digital. We utilize a series of digital programs, in conjunction with advanced data analytics, to identify prospective customers and generate new leads within our existing customer base. These programs include website, email, blog, social media, electronic catalogs, webinars, and video/multimedia promotions.
Print. Connection produces a variety of print media, including direct mail pieces and Connected, a quarterly publication that provides informative articles on the latest technologies and industry trends. We distribute specialty catalogs to education, healthcare, and government customers and prospective customers on a periodic basis. The Company’s MacConnection® brand publishes an eponymous catalog for the Apple market. These publications showcase the depth of our in-house expertise in the marketplace and extend Connection’s brand to a wide audience of IT decision makers.
Specialty Marketing. In addition to our digital and print marketing efforts, Connection maintains a strong presence at industry tradeshows and conventions across the country, including a number of healthcare and education IT conferences. Connection also hosts a series of Technology Summits each year, with a focus on building stronger relationships with our customers and reinforcing our reputation as a trusted source of expertise.
6
Customers. We maintain an extensive database of customers and prospects. However, no single customer accounted for more than 4% of our consolidated revenue in 2019. While no single agency of the federal government comprised more than 3% of total sales, aggregate sales to the federal government were 6.9%, 5.4%, and 7.8% in 2019, 2018, and 2017, respectively. The loss of any single customer would not have a material adverse effect on any of our business segments. In addition, we do not have individual orders in our backlog that are material to our business, and as a result, we do not believe that backlog as of any particular dates is an indication of future results.
PRODUCTS AND MERCHANDISING
We continuously focus on expanding the breadth of our product and service offerings. We currently offer our customers over 425,000 information technology products designed for business applications from more than 1,600 vendors, including hardware and peripherals, accessories, networking products, and software. We select the products we sell based upon their technology and effectiveness, market demand, product features, quality, price, margins, and warranties. The following table sets forth our percentage of net sales (in dollars) for major product categories:
|
|
|
PERCENTAGE OF |
|
||||
|
|
|
NET SALES |
|
||||
|
|
|
Years Ended December 31, |
|
||||
|
|
|
2019 (1) |
|
2018 (1) |
|
2017 (2) |
|
|
Notebooks/Mobility |
|
29 |
% |
26 |
% |
22 |
% |
|
Desktops |
|
12 |
|
11 |
|
11 |
|
|
Software |
|
12 |
|
12 |
|
23 |
|
|
Servers/Storage |
|
8 |
|
11 |
|
9 |
|
|
Net/Com Product |
|
8 |
|
8 |
|
7 |
|
|
Displays and sound |
|
9 |
|
9 |
|
8 |
|
|
Accessories |
|
13 |
|
13 |
|
10 |
|
|
Other Hardware/Services |
|
9 |
|
10 |
|
10 |
|
|
Total |
|
100 |
% |
100 |
% |
100 |
% |
|
(1) |
The Company adopted ASC 606 in 2018 using the modified retrospective approach, which primarily resulted in certain software sales being reported on a net basis where they would have otherwise been reported on a gross basis under the previous revenue recognition guidance. As a result, certain revenue figures reported in the years ended December 31, 2019 and 2018 may not be comparable with amounts for the year-ended December 31, 2017. |
|
(2) |
Product categories were separated into additional categories in 2018. Certain year-ended December 31, 2017 balances have been reclassified to conform to current year presentation. |
We offer a 30-day right of return generally limited to defective merchandise. Returns of non-defective products are subject to restocking fees. Substantially all of the products marketed by us are warranted by the manufacturer. We generally accept returns directly from the customer and then either credit the customer’s account or ship the customer a replacement or similar product from our inventory.
PURCHASING AND VENDOR RELATIONS
Product purchases from Ingram Micro, Inc., our largest supplier, and Synnex accounted for approximately 21% and 14%, respectively, of our total product purchases in 2019. No other singular vendor supplied more than 10% of our total product purchases in the year. In addition to these vendors, product purchases, whether purchased directly or from a wholesale distributor, from Dell, HP Inc., and Tech Data comprised a total of 59% of our product purchases in 2019. We believe that, while we may experience some short-term disruption if products from Ingram, Synnex, or any of these vendors become unavailable to us, alternative sources for these products are available.
Products manufactured by HP collectively represented approximately 19% of our net sales in 2019, 18% in 2018, and 20% in 2017. We believe that in the event we experience either a short-term or permanent disruption of supply of HP products, such disruption would likely have a material adverse effect on our results of operations and cash flows.
7
Many product suppliers reimburse us for advertisements or other cooperative marketing programs through various marketing vehicles. Reimbursements may be in the form of discounts, advertising allowances, and/or rebates. We also receive allowances from certain vendors based upon the volume of our purchases or sales of the vendors’ products by us. Some of our vendors offer limited price protection in the form of rebates or credits against future purchases. We may also participate in end-of-life product and other special purchases which may not be eligible for price protection.
We believe that we have excellent relationships with our vendors. We generally pay vendors within stated terms, or earlier when favorable cash discounts are offered. We believe our high volume of purchases enables us to obtain product pricing and terms that are competitive with those available to other national IT solutions providers. Although brand names and individual product offerings are important to our business, we believe that competitive products are available in substantially all of the merchandise categories offered by us.
DISTRIBUTION
We fulfill orders from customers both from products we hold in inventory and through drop shipping arrangements with manufacturers and distributors. At our 283,000 square foot technology integration and distribution complex in Wilmington, Ohio, we receive and ship inventory, configure and integrate technology solutions, provide depot maintenance and services, and process returned products.
We also place product orders directly with manufacturers and/or distribution companies for drop shipment directly to our customers. Order status with distributors is tracked online, and in all circumstances, a confirmation of shipment from manufacturers and/or distribution companies is received prior to initial recording of the transaction. At the end of each financial reporting period, revenue is adjusted to reflect the anticipated receipt of products by the customers in the period. Products drop shipped by suppliers were 80%, 80%, and 77%, of net sales in 2019, 2018, and 2017, respectively. In future years, we expect that products drop shipped from suppliers may increase, both in dollars and as a percentage of net sales, as we seek to lower our overall inventory and distribution costs while maintaining excellent customer service.
MANAGEMENT INFORMATION SYSTEMS
Our subsidiaries utilize management information systems which have been significantly customized for our use. These systems permit centralized management of key functions, including order taking and processing, inventory and accounts receivable management, purchasing, sales, and distribution, and the preparation of daily operating control reports on key aspects of the business. We also operate advanced telecommunications equipment to support our sales and customer service operations. Key elements of the telecommunications systems are integrated with our computer systems to provide timely customer information to sales and service representatives, and to facilitate the preparation of operating and performance data.
Our success is dependent in large part on the accuracy and proper use of our information systems to manage our inventory and accounts receivable collections, to purchase, sell, and ship our products efficiently and on a timely basis, and to maintain cost-efficient operations. We expect to continue upgrading our information systems in the future to more effectively manage our operations and customer database.
Our investments in IT systems and infrastructure are designed to enable us to operate more efficiently and to provide our customers enhanced functionality.
COMPETITION
The direct marketing and sale of IT-related products is highly competitive. We compete with other national solutions providers of IT products, including CDW Corporation and Insight Enterprises, Inc., who are the current leaders in the space. We also compete with:
|
· |
certain product manufacturers that sell directly to customers as well as some of our own suppliers, such as Apple, Dell, HP, and Lenovo; |
8
|
· |
software publishers, such as Microsoft, VMware, Adobe, and Symantec; |
|
· |
distributors that sell directly to certain customers; |
|
· |
local and regional VARs; |
|
· |
various franchisers, office supply superstores, and national computer retailers; and |
|
· |
e-tailers, such as Amazon Web Services, with more extensive commercial online networks. |
Additional competition may arise if other new methods of distribution emerge in the future. We compete not only for customers, but also for favorable product allocations and cooperative advertising support from product manufacturers. Several of our competitors are larger than we are and have substantially greater financial resources. These and other factors related to our competitive position are discussed more fully in the “Overview” of Item 7, “Management’s Discussion and Analysis of Financial Condition and Results of Operations” of this Annual Report on Form 10-K.
We believe that price, product selection and availability, solutions capabilities, and service and support are the most important competitive factors in our industry.
INTELLECTUAL PROPERTY RIGHTS
Our trademarks include, among others, Connection®, PC Connection®, GovConnection®, MacConnection®, we solve IT®, Everything Overnight®, The Connection™, HealthConnectionTM, Mobile Connection®, Cloud Connection®, ServiceConnectionTM, ProConnection™, Education Connection®, MoreDirect A PC Connection Company®, TRAXX®, WebSPOC®, Softmart®, GlobalServeTM, Raccoon CharacterTM, and their related logos and all iterations thereof. We intend to use and protect these and our other marks, as we deem necessary. We believe our trademarks have significant value and are an important factor in the marketing of our products. We do not maintain a traditional research and development group, but we work closely with computer product manufacturers and other technology developers to stay abreast of the latest developments in computer technology, with respect to the products we both sell and use.
WORK FORCE
As of December 31, 2019, we employed 2,609 persons (full-time equivalent), of whom 1,181 (including 340 management and support personnel) were engaged in sales-related activities, 520 were engaged in providing IT services and customer service and support, 620 were engaged in purchasing, marketing, and distribution-related activities, 85 were engaged in the operation and development of management information systems, and 203 were engaged in administrative and finance functions. We consider our employee relations to be good. Our employees are not represented by a labor union, and we have never experienced a labor related work stoppage.
We cannot assure investors that our assumptions and expectations will prove to have been correct. Important factors could cause our actual results to differ materially from those indicated or implied by forward-looking statements. Such factors that could cause or contribute to such differences include those factors discussed below. We undertake no intention or obligation to update or revise any forward-looking statements, whether as a result of new information, future events, or otherwise. If any of the following risks actually occur, our business, financial condition, or results of operations would likely suffer.
9
Instability in economic conditions and government spending may adversely affect our business and reduce our operating results.
Our business has been affected by changes in economic conditions that are outside of our control, including reductions in business investment, loss of consumer confidence, and fiscal uncertainty at both federal and state government levels. Reductions in federal government spending may result in significant reductions in program funding. Uncertainty also exists regarding expected economic conditions both globally and in the United States, and future delays or reductions in IT spending could have a material adverse effect on demand for our products and consequently on our financial results.
Despite the recent increase in general economic optimism, there is always a risk that heightened economic expectations may not be realized. Economic instability may arise, and it is difficult to predict to what extent our business may be adversely affected. However, if IT spending should again decline, we are likely to experience an adverse impact, which may be material on our business and our results of operations.
We have experienced variability in sales and may not be able to maintain profitable operations.
Several factors have caused our results of operations to fluctuate and we expect some of these fluctuations to continue. Causes of these fluctuations include:
|
· |
shifts in customer demand that affect our distribution models, including demand for total solutions; |
|
· |
loss of customers to competitors; |
|
· |
industry shipments of new products or upgrades; |
|
· |
changes in overall demand and timing of product shipments related to economic markets and to government spending; |
|
· |
changes in vendor distribution of products; |
|
· |
changes in our product offerings and in merchandise returns; |
|
· |
changes in distribution models as a result of cloud and software-as-a-service, or SaaS; |
|
· |
adverse weather conditions that affect response, distribution, or shipping; and |
|
· |
supply constraints. |
Our results also may vary based on our ability to manage personnel levels in response to fluctuations in revenue. We base personnel levels and other operating expenditures on sales forecasts. If our revenues do not meet anticipated levels in the future, we may not be able to reduce our staffing levels and operating expenses in a timely manner to avoid significant losses from operations.
Substantial competition could reduce our market share and may negatively affect our business.
The direct marketing industry and the computer products retail business, in particular, are highly competitive. We compete with other national solutions providers of hardware and software and computer related products, including CDW Corporation and Insight Enterprises, Inc., who are the current leaders in the space. Certain hardware and software vendors, such as Apple, Dell, Lenovo, and HP, who provide products to us, also sell their products directly to end users through their own direct salesforce, catalogs, stores, and via the Internet. We also compete with computer retail stores and websites, who are increasingly selling to business customers and may become a significant competitor. We compete not only for customers, but also for advertising support from IT product manufacturers. Some of our competitors have larger customer bases and greater financial, marketing, and other resources than we do. In addition, some of our
10
competitors offer a wider range of products and services than we do and may be able to respond more quickly to new or changing opportunities, technologies, and customer requirements. Many current and potential competitors also have greater name recognition, engage in more extensive promotional activities, and adopt pricing policies that are more aggressive than ours. We expect competition to increase as retailers and solution providers who have not traditionally sold computers and related products enter the industry.
In addition, product resellers and national solutions providers are combining operations or acquiring or merging with other resellers and national solutions providers to increase efficiency. Moreover, current and potential competitors have established or may establish cooperative relationships among themselves or with third parties to enhance their products and services. Accordingly, it is possible that new competitors or alliances among competitors may emerge and acquire significant market share. We may not be able to continue to compete effectively against our current or future competitors. If we encounter new competition or fail to compete effectively against our competitors, our business may be harmed.
We face and will continue to face significant price competition.
Generally, pricing is very aggressive in our industry, and we expect pricing pressures to escalate should economic conditions deteriorate. An increase in price competition could result in a reduction of our profit margins. We may not be able to offset the effects of price reductions with an increase in the number of customers, higher sales, cost reductions, or otherwise. Such pricing pressures could result in an erosion of our market share, reduced sales, and reduced operating margins, any of which could have a material adverse effect on our business.
Virtualization of IT resources and applications, including networks, servers, applications, and data storage may disrupt or alter our traditional distribution models.
Our customers can access, through a cloud-based platform, business-critical solutions without the significant initial capital investment required for dedicated infrastructure. Growing demand for the development of cloud-based solutions may reduce demand for some of our existing hardware products. If the transition to an environment characterized by cloud-based computing and software being delivered as a service progresses, we will likely increase investments in this area before knowing whether our sales forecasts will accurately reflect customer demand for these products, services, and solutions. We may not be able to effectively compete using these virtual distribution models. Our inability to compete effectively with current or future virtual distribution model competitors, or adapt to a cloud-based environment, could have a material adverse effect on our business.
We may experience a reduction in the incentive programs offered to us by our vendors.
Some product manufacturers and distributors provide us with incentives such as supplier reimbursements, payment discounts, price protection, rebates, and other similar arrangements. The increasingly competitive technology reseller market has already resulted in the following:
|
· |
reduction or elimination of some of these incentive programs; |
|
· |
more restrictive price protection and other terms; and |
|
· |
reduced advertising allowances and incentives. |
Many product suppliers provide us with advertising allowances, and in exchange, we feature their products on our website and in other marketing vehicles. These vendor allowances, to the extent that they represent specific reimbursements of incremental and identifiable costs, are offset against SG&A expenses. Advertising allowances that cannot be associated with a specific program funded by an individual vendor or that exceed the fair value of advertising expense associated with that program are classified as offsets to cost of sales or inventory. In the past, we have experienced a decrease in the level of vendor consideration available to us from certain manufacturers. The level of such consideration we receive from some manufacturers may decline in the future. Such a decline could decrease our gross profit and have a material adverse effect on our earnings and cash flows.
11
Our business could be materially adversely affected by system failures, interruption, integration issues, or security lapses of our information technology systems or those of our third-party providers.
Our ability to effectively manage our business depends significantly on our information systems and infrastructure as well as, in certain instances those of our business partners and third-party providers. The failure of our current systems to operate effectively or to integrate with other systems, including integration of upgrades to better meet the changing needs of our customers, could result in transaction errors, processing inefficiencies, and the loss of sales and customers. In addition, cybersecurity threats are evolving and include, but are not limited to, malicious software, attempts to gain unauthorized access to company or customer data, denial of service attacks, the processing of fraudulent transactions, and other electronic security breaches that could lead to disruptions in critical systems, unauthorized release of confidential or otherwise protected information, and corruption of data. In our case, these attacks and attempted attacks have generally been in the form of active intrusion attempts from the internet, passive vulnerability mapping from the internet, and internal malware and or phishing attempts delivered through user actions. Although we have in place various processes, procedures, and controls to monitor and mitigate these threats, these measures may not be sufficient to prevent a material security threat or mitigate these risks for our customers. If any of these events were to materialize, they could lead to disruption of our operations or loss of sensitive information as well as subject us to regulatory actions, litigation, or damage to our reputation, and could have a material adverse effect on our financial position, results of operations, and cash flows. Similar risks exist with respect to our business partners and third-party providers. As a result, we are subject to the risk that the activities of our business partners and third-party providers may adversely affect our business even if an attack or breach does not directly impact our systems.
We could experience Internet and other system failures which would interfere with our ability to process orders.
We depend on the accuracy and proper use of our management information systems, including our telephone system. Many of our key functions depend on the quality and effective utilization of the information generated by our management information systems, including:
|
· |
our ability to purchase, sell, and ship products efficiently and on a timely basis; |
|
· |
our ability to manage inventory and accounts receivable collection; and |
|
· |
our ability to maintain operations. |
Our management information systems require continual upgrades to most effectively manage our operations and customer database. Although we maintain some redundant systems, with full data backup, a significant component of our computer and telecommunications hardware is located in a single facility in New Hampshire, and a substantial interruption in our management information systems or in our telephone communication systems, including those resulting from extreme weather and natural disasters, as well as power loss, telecommunications failure, or similar events, would substantially hinder our ability to process customer orders and thus could have a material adverse effect on our business.
Should our financial performance not meet expectations, we may be required to record a significant charge to earnings for impairment of goodwill and other intangibles.
We test goodwill for impairment each year and more frequently if potential impairment indicators arise. Although we did not identify any circumstances during our annual impairment test that indicated the fair value of our Business Solutions and Enterprise Solutions reporting units substantially exceeded their carrying value, should the financial performance of a reporting unit not meet expectations due to the economy or otherwise, we would likely adjust downward expected future operating results and cash flows. Such adjustment may result in a determination that the carrying value of goodwill and other intangibles for a reporting unit exceeds its fair value. This determination may in turn require that we record a significant non-cash charge to earnings to reduce the $73.6 million aggregate carrying amount of goodwill held by our Business Solutions and Enterprise Solutions reporting units, resulting in a negative effect on our results of operations.
12
The failure to comply with our public sector contracts could result in, among other things, fines or liabilities.
Revenues from the Public Sector Solutions segment are derived from sales to federal, state, and local government departments and agencies, as well as to educational institutions, through various contracts and open market sales. Government contracting is a highly regulated area. Noncompliance with government procurement regulations or contract provisions could result in civil, criminal, and administrative liability, including substantial monetary fines or damages, termination of government contracts, and suspension, debarment, or ineligibility from doing business with the government. Our current arrangements with these government agencies allow them to cancel orders with little or no notice and do not require them to purchase products from us in the future. The effect of any of these possible actions by any government department or agency could adversely affect our financial position, results of operations, and cash flows.
We acquire a majority of our products for resale from a limited number of vendors. The loss of any one of these vendors could have a material adverse effect on our business.
We acquire products for resale both directly from manufacturers and increasingly indirectly through distributors and other sources. Although we purchase from a diverse vendor base, product purchases from Ingram Micro, Inc., our largest supplier, and Synnex accounted for approximately 21% and 14%, respectively, of our total product purchases in 2019. No other singular vendor supplied more than 10% of our total product purchases in the year. In addition to these vendors, product purchases, whether purchased directly or from a wholesale distributor, from Dell, HP Inc., and Tech Data comprised a total of 59% of our product purchases in 2019. If we are unable to acquire products, or if we experienced a change in business relationship with any of these vendors, we could experience a short-term disruption in the availability of products, and such disruption could have a material adverse effect on our results of operations and cash flows.
Products manufactured by Hewlett Packard Enterprise and HP Inc. collectively represented approximately 19% of our net sales in 2019. We believe that in the event we experience either a short-term or permanent disruption of supply of HP products, such disruption would likely have a material adverse effect on our results of operations and cash flows.
Substantially all of our contracts and arrangements with our vendors that supply significant quantities of products are terminable by such vendors or us without notice or upon short notice. Most of our product vendors provide us with trade credit, of which the net amount outstanding at December 31, 2019 was $235.6 million. Termination, interruption, or contraction of relationships with our vendors, including a reduction in the level of trade credit provided to us, could have a material adverse effect on our financial position.
Some product manufacturers either do not permit us to sell the full line of their products or limit the number of product units available to national solutions providers such as us. An element of our business strategy is to continue increasing our participation in first-to-market purchase opportunities. The availability of certain desired products, especially in the direct marketing channel, has been constrained in the past. We could experience a material adverse effect to our business if we are unable to source first-to-market purchases or similar opportunities, or if significant availability constraints reoccur.
We are exposed to inventory obsolescence due to the rapid technological changes occurring in the IT industry.
The market for IT products is characterized by rapid technological change and the frequent introduction of new products and product enhancements. Our success depends in large part on our ability to identify and market products that meet the needs of customers in that marketplace. In order to satisfy customer demand and to obtain favorable purchasing discounts, we have and may continue to carry increased inventory levels of certain products. By so doing, we are subject to the increased risk of inventory obsolescence. Also, in order to implement our business strategy, we intend to continue, among other things, placing larger than typical inventory stocking orders of selected products and increasing our participation in first-to-market purchase opportunities. We may also, from time to time, make large inventory purchases of certain end‑of‑life products, which would increase the risk of inventory obsolescence. In addition, we sometimes acquire special purchase products without return privileges. For these and other reasons, we may not be able to avoid losses related to obsolete inventory. Manufacturers have limited return rights and have taken steps to reduce their inventory exposure by supporting “configure‑to-order” programs authorizing distributors and resellers to assemble
13
computer hardware under the manufacturers’ brands. These actions reduce the costs to manufacturers and shift the burden of inventory risk to resellers like us, which could negatively impact our business.
We are dependent on key personnel.
Our future performance will depend to a significant extent upon the efforts and abilities of our senior executives and other key management personnel. The current environment for qualified management personnel in the computer products industry is very competitive, and the loss of service of one or more of these persons could have an adverse effect on our business. Our success and plans for future growth will also depend on our ability to hire, train, and retain skilled personnel in all areas of our business, especially sales representatives and technical support personnel. We may not be able to attract, train, and retain sufficient qualified personnel to achieve our business objectives.
Cyberattacks or the failure to safeguard personal information and our information technology systems could result in liability and harm our reputation, which could adversely affect our business.
Our business is heavily dependent upon information technology networks and systems. Internal or external attacks on those networks and systems could disrupt our normal operations centers and impede our ability to provide critical products and services to our customers and clients, subjecting us to liability under our contracts and damaging our reputation.
Our business also involves the use, storage and transmission of proprietary information and sensitive or confidential data, including personal information about our employees, our clients and customers of our clients. While we take measures to protect the security of, and prevent unauthorized access to, our systems and personal and proprietary information, the security controls for our systems, as well as other security practices we follow, may not prevent improper access to, or disclosure of, personally identifiable or proprietary information. Furthermore, the evolving nature of threats to data security, in light of new and sophisticated methods used by criminals and cyberterrorists, including computer viruses, malware, phishing, misrepresentation, social engineering, and forgery make it increasingly challenging to anticipate and adequately mitigate these risks. We have experienced attacks and attempted attacks that have generally been in the form of active intrusion attempts from the internet, passive vulnerability mapping from the internet, and internal malware and or phishing attempts delivered through user actions.
Breaches in security could expose us, our supply chain, our customers or other individuals to significant disruptions, a risk of public disclosure, loss or misuse of this information. Security breaches could result in legal claims or proceedings, liability or regulatory penalties under laws protecting the privacy of personal information, as well as the loss of existing or potential customers and damage to our brand and reputation. Moreover, media or other reports of perceived vulnerabilities in our network security or perceived lack of security within our environment, even if inaccurate, could adversely impact our reputation and materially impact our business. The cost and operational consequences of implementing further data protection measures could be significant. Such breaches, costs and consequences could adversely affect our business, results of operations, or cash flows.
The methods of distributing IT products are changing, and such changes may negatively impact us and our business.
The manner in which IT hardware and software is distributed and sold is changing, and new methods of distribution and sale have emerged, including distribution through cloud-based and SaaS solutions. In addition, hardware and software manufacturers have sold, and may intensify their efforts to sell, their products directly to end users. From time to time, certain manufacturers have instituted programs for the direct sales of large order quantities of hardware and software to certain major corporate accounts. These types of programs may continue to be developed and used by various manufacturers. Some of our vendors, including Apple, Dell, HP, and Lenovo, currently sell some of their products directly to end users and have stated their intentions to increase the level of such direct sales. In addition, manufacturers may attempt to increase the volume of software products distributed electronically to end users. An increase in the volume of products sold through or used by consumers of any of these competitive programs, or our
14
inability to effectively adapt our business to increased electronic distribution of products and services to end users could have a material adverse effect on our results of operations.
We depend heavily on third-party shippers to deliver our products to customers.
Many of our customers elect to have their purchases shipped by an interstate common carrier, such as UPS or FedEx Corporation. A strike or other interruption in service by these shippers could adversely affect our ability to market or deliver products to customers on a timely basis.
Natural disasters, terrorism, and other circumstances could materially adversely affect our business.
Natural disasters, terrorism, and other business interruptions have caused and could cause damage or disruption to international commerce and the global economy, and thus could have a negative effect on the Company, its suppliers, logistics providers, manufacturing vendors, and customers. Our business operations are subject to interruption by natural disasters, fire, power shortages, nuclear power plant accidents, terrorist attacks, and other hostile acts, and other events beyond our control. Such events could decrease demand for our products, make it difficult or impossible for us to deliver services or products to our customers, or to receive products from our suppliers, and create delays and inefficiencies in our supply chain. In the event of a natural disaster or other business interruption, significant recovery time and substantial expenditures could be required to resume operations and our financial condition, results of operations, and cash flows could be materially adversely affected.
We may experience increases in shipping and postage costs, which may adversely affect our business if we are not able to pass such increases on to our customers.
Shipping costs are a significant expense in the operation of our business. Increases in postal or shipping rates could significantly impact the cost of shipping customer orders and mailing our catalogs. Postage prices and shipping rates increase periodically, and we have no control over future increases. We have a long-term contract with UPS, and believe that we have negotiated favorable shipping rates with our carriers. While we generally invoice customers for shipping and handling charges, we may not be able to pass on to our customers the full cost, including any future increases in the cost, of commercial delivery services, which would adversely affect our business.
We rely on the continued development of electronic commerce and Internet infrastructure development.
We continue to have increasing levels of sales made through our e-commerce sites. The on-line experience for our clients continues to improve, but the competitive nature of the e-commerce channel also continues to increase. Growth of our overall sales is dependent on customers continuing to expand their on-line purchases in addition to traditional channels to purchase products and services. We cannot accurately predict the rate at which on-line purchases will expand.
Our success in growing our Internet business will depend in large part upon our development of an increasingly sophisticated e-commerce experience and infrastructure. Increasing customer sophistication requires that we provide additional website features and functionality in order to be competitive in the marketplace and maintain market share. We will continue to iterate our website features, but we cannot predict future trends and required functionality or our adoption rate for customer preferences. As the number of on-line users continues to grow, such growth may impact the performance of our existing Internet infrastructure.
We face uncertainties relating to unclaimed property and the collection of state sales and use tax.
We collect and remit sales and use taxes in states in which we have either voluntarily registered or have a physical presence. Various states have sought to impose on direct marketers the burden of collecting state sales and use taxes on the sales of products shipped to their residents. Many states have adopted rules that require companies and their affiliates to register in those states as a condition of doing business with those state agencies. Our three sales companies are registered in substantially all states, however, if a state were to determine that our earlier contacts with that state
15
exceeded the constitutionally permitted contacts, the state could assess a tax liability relating to our prior year sales. Various states have from time to time initiated unclaimed property audits of our company escheatment practices.
Privacy concerns with respect to list development and maintenance may materially adversely affect our business.
We mail catalogs and other promotional materials to names in our customer database and to potential customers whose names we obtain from rented or exchanged mailing lists. Public concern regarding the protection of personal information has subjected the rental and use of customer mailing lists and other customer information to increased scrutiny. Legislation enacted limiting or prohibiting the use of rented or exchanged mailing lists could negatively affect our business.
We are controlled by two principal stockholders.
Patricia Gallup and David Hall, our two principal stockholders, beneficially own or control, in the aggregate, approximately 56% of the outstanding shares of our common stock as of December 31, 2019. Because of their beneficial stock ownership, these stockholders can continue to elect the members of the Board of Directors and decide all matters requiring stockholder approval at a meeting or by a written consent in lieu of a meeting. Similarly, such stockholders can control decisions to adopt, amend, or repeal our charter and our bylaws, or take other actions requiring the vote or consent of our stockholders and prevent a takeover of us by one or more third parties, or sell or otherwise transfer their stock to a third party, which could deprive our stockholders of a control premium that might otherwise be realized by them in connection with an acquisition of our Company. Such control may result in decisions that are not in the best interest of our public stockholders. In connection with our initial public offering, the principal stockholders placed substantially all shares of common stock beneficially owned by them into a voting trust, pursuant to which they are required to agree as to the manner of voting such shares in order for the shares to be voted. Such provisions could discourage bids for our common stock at a premium as well as have a negative impact on the market price of our common stock.
Item 1B. Unresolved Staff Comments
None.
We lease our corporate headquarters located at 730 Milford Road, Merrimack, New Hampshire 03054-4631, from an affiliated company, G&H Post, which is related to us through common ownership. The lease term ended in November 2018, and the Company is currently in the process of negotiating an amendment to extend the lease term. We expect that an extension to the lease will be available at market terms. In addition to the rent payable under the facility lease, we are required to pay real estate taxes, insurance, and common area maintenance charges. The lease has been recorded as a right-of-use asset in the financial statements.
We also lease an office facility adjacent to our corporate headquarters from the same affiliated company, G&H Post. This facility is used by our Public Sector Segment. The lease term ended in July 2018, but the Company is currently in the process of negotiating an amendment to extend the lease term. We expect that an extension to the lease will be available at market terms. The lease requires us to pay our proportionate share of real estate taxes and common area maintenance charges as either additional rent or directly to third parties and also to pay insurance premiums for the leased property. The lease has been recorded as a right-of-use asset in the financial statements.
We lease a facility in Wilmington, Ohio, which houses our distribution and order fulfillment operations and services all three of our business segments. We also operate sales and support offices throughout the United States and lease facilities at these locations. Leasehold improvements associated with these properties are amortized over the terms of the leases or their useful lives, whichever is shorter. We believe that our physical properties will be sufficient to support our anticipated needs through the next twelve months and beyond.
16
We are subject to various legal proceedings and claims, including patent infringement claims, which have arisen during the ordinary course of business. In the opinion of management, the outcome of such matters is not expected to have a material effect on our business, financial position, results of operations, or cash flows.
Item 4. Mine Safety Disclosures
Not applicable.
Information about our Executive Officers
Our executive officers and their ages as of February 6, 2020 are as follows:
|
Name |
|
Age |
|
Position |
|
Patricia Gallup |
|
65 |
|
Chair and Chief Administrative Officer |
|
Timothy McGrath |
|
61 |
|
President and Chief Executive Officer |
|
Thomas Baker |
|
55 |
|
Senior Vice President, Chief Financial Officer and Treasurer |
Patricia Gallup is our co-founder and has served as Chair of our Board of Directors since September 1994, and as Chief Administrative Officer since August 2011. Ms. Gallup has served as a member of our executive management team since 1982.
Timothy McGrath has served as our Chief Executive Officer since August 2011, and as President since May 2010. Mr. McGrath has served as a member of our executive management team since he joined the Company in 2005.
Thomas Baker has served as our Chief Financial Officer and as a member of our executive management team since he joined the Company in the spring of 2019. Prior to joining Connection, Mr. Baker had served as Corporate Vice President and Chief Financial Officer for the New Markets and Service Group at Applied Materials, Inc., a semiconductor company, since 2013.
17
Item 5. Market for the Registrant’s Common Equity, Related Stockholder Matters, and Issuer Purchases of Equity Securities
Market Information
Our common stock commenced trading on March 3, 1998, on the Nasdaq Global Select Market and trades today under the symbol “CNXN”. As of February 4, 2020, there were 26,344,841 shares of our common stock outstanding, held by approximately 46 stockholders of record. This figure does not include an estimate of the number of beneficial holders whose shares are held of record by brokerage firms.
In 2019, we declared a special cash dividend of $0.32 per share. The total cash payment of $8.4 million was made on January 10, 2020 to stockholders of record at the close of business on December 27, 2019. In 2018, we declared a special cash dividend of $0.32 per share. The total cash payment of $8.5 million was made on January 11, 2019 to stockholders of record at the close of business on December 28, 2018. We have no current plans to pay additional cash dividends on our common stock in the foreseeable future, and declaration of any future cash dividends will depend upon our financial position, strategic plans, and general business conditions.
Share Repurchase Authorization
In 2001, our Board of Directors authorized the spending of up to $15.0 million to repurchase shares of our common stock. In 2014, our Board approved a new share repurchase program authorizing up to an additional $15.0 million in share repurchases, for a total authorized repurchase amount of $30.0 million. We consider block repurchases directly from larger stockholders, as well as open market purchases, in carrying out our ongoing stock repurchase program.
In 2018, our Board approved a new share repurchase program authorizing up to $25.0 million in additional share repurchases. There is no fixed termination date for this repurchase program. Purchases may be made in open-market transactions, block transactions on or off an exchange, or in privately negotiated transactions. The timing and amount of any share repurchases will be based on market conditions and other factors.
In 2019, we repurchased 0.1 million shares for $4.5 million under the Board-approved repurchase programs. As of December 31, 2019, we have repurchased an aggregate of 2.4 million shares for $32.1 million under our Board-approved repurchase programs. At December 31, 2019, the maximum approximate dollar value of shares that may yet be purchased under Board-authorized programs was $22.9 million.
The following table sets forth certain information with respect to repurchases of our common stock during the quarter ended December 31, 2019.
|
ISSUER PURCHASES OF EQUITY SECURITIES |
|
||||||||||
|
|
|
|
|
|
|
|
Total Number of |
|
Approximate Dollar Value |
|
|
|
|
|
|
|
|
|
Shares Purchased as |
|
of Shares that May Yet Be |
|
||
|
|
|
Total Number |
|
|
|
Part of Publicly |
|
Purchased Under the Plans |
|
||
|
|
|
of Shares |
|
Average Price Paid |
|
Announced Plans or |
|
or Programs |
|
||
|
Period |
|
Purchased |
|
Per Share |
|
Programs |
|
(in thousands) |
|
||
|
10/01/19-10/31/19 |
|
— |
|
$ |
— |
|
— |
|
$ |
23,029 |
|
|
11/01/19-11/30/19 |
|
— |
|
|
— |
|
— |
|
$ |
23,029 |
|
|
12/01/19-12/31/19 |
|
2,333 |
|
|
49.18 |
|
2,333 |
|
$ |
22,914 |
|
|
|
|
2,333 |
|
$ |
49.18 |
|
2,333 |
|
|
|
|
18
Stock Performance Graph
The following performance graph and related information shall not be deemed “soliciting material” or to be “filed” with the SEC, nor shall such information be incorporated by reference into any future filing under the Securities Act of 1933 or the Exchange Act, each as amended, except to the extent that we specifically incorporate it by reference into such filing.
The following stock performance graph compares cumulative total stockholder return on our common stock for the period from December 31, 2014 through December 31, 2019 with the cumulative total return for (i) the Nasdaq Stock Market Composite and (ii) the Nasdaq Retail Trade Stocks (Peer Group) for the period starting December 31, 2014 and ending December 31, 2019. This graph assumes the investment of $100 on December 31, 2014 in our common stock and in each of the two Nasdaq indices, and that dividends are reinvested.
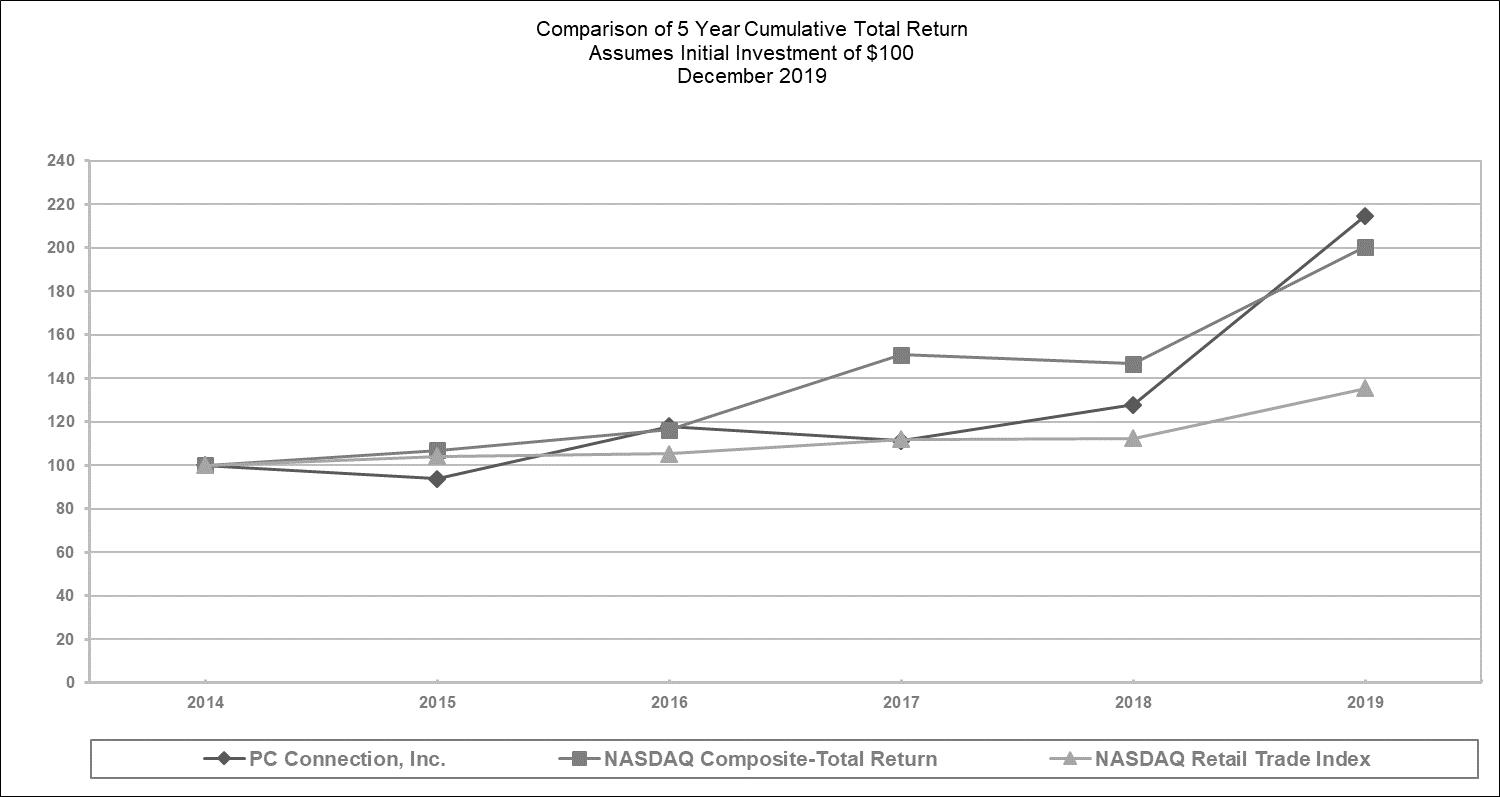
|
|
|
|
|
|
|
||||||||
|
|
|
Base Period |
|
Years Ended |
|
||||||||
|
Company Name / Index |
|
Dec-14 |
|
Dec-15 |
|
Dec-16 |
|
Dec-17 |
|
Dec-18 |
|
Dec-19 |
|
|
PC Connection, Inc. |
|
100.00 |
|
93.88 |
|
117.90 |
|
111.43 |
|
127.80 |
|
214.79 |
|
|
Nasdaq Stock Market-Composite |
|
100.00 |
|
106.96 |
|
116.45 |
|
150.96 |
|
146.67 |
|
200.49 |
|
|
Nasdaq Retail Trade (Peer Index) |
|
100.00 |
|
104.13 |
|
105.33 |
|
112.05 |
|
112.56 |
|
135.43 |
|
19
Item 6. Selected Financial Data
The following selected financial data should be read in conjunction with our Consolidated Financial Statements and the Notes thereto, and “Management’s Discussion and Analysis of Financial Condition and Results of Operations” and other financial information included elsewhere in this Annual Report on Form 10-K.
|
|
|
Years Ended December 31, |
|
|||||||||||||
|
|
|
2019 (1) |
|
2018 (1) |
|
2017 |
|
2016 |
|
2015 |
|
|||||
|
|
|
(dollars in thousands, except per share) |
|
|||||||||||||
|
Consolidated Statement of Operations Data: |
|
|
|
|
|
|
|
|
|
|
|
|
|
|
|
|
|
Net sales |
|
$ |
2,820,034 |
|
$ |
2,699,489 |
|
$ |
2,911,883 |
|
$ |
2,692,592 |
|
$ |
2,573,973 |
|
|
Cost of sales |
|
|
2,368,724 |
|
|
2,288,403 |
|
|
2,529,807 |
|
|
2,321,435 |
|
|
2,232,954 |
|
|
Gross profit |
|
|
451,310 |
|
|
411,086 |
|
|
382,076 |
|
|
371,157 |
|
|
341,019 |
|
|
Selling, general and administrative expenses |
|
|
338,635 |
|
|
324,433 |
|
|
300,913 |
|
|
287,231 |
|
|
262,465 |
|
|
Restructuring and other charges |
|
|
703 |
|
|
967 |
|
|
3,636 |
|
|
3,406 |
|
|
— |
|
|
Income from operations |
|
|
111,972 |
|
|
85,686 |
|
|
77,527 |
|
|
80,520 |
|
|
78,554 |
|
|
Other income, net |
|
|
707 |
|
|
2,978 |
|
|
98 |
|
|
(67) |
|
|
(87) |
|
|
Income before taxes |
|
|
112,679 |
|
|
88,664 |
|
|
77,625 |
|
|
80,453 |
|
|
78,467 |
|
|
Income tax provision |
|
|
(30,568) |
|
|
(24,072) |
|
|
(22,768) |
|
|
(32,342) |
|
|
(31,640) |
|
|
Net income |
|
$ |
82,111 |
|
$ |
64,592 |
|
$ |
54,857 |
|
$ |
48,111 |
|
$ |
46,827 |
|
|
|
|
|
|
|
|
|
|
|
|
|
|
|
|
|
|
|
|
|
|
|
|
|
|
|
|
|
|
|
|
|
|
|
|
|
|
Basic earnings per share |
|
$ |
3.12 |
|
$ |
2.42 |
|
$ |
2.05 |
|
$ |
1.81 |
|
$ |
1.77 |
|
|
Diluted earnings per share |
|
$ |
3.10 |
|
$ |
2.41 |
|
$ |
2.04 |
|
$ |
1.80 |
|
$ |
1.76 |
|
|
(1) |
The Company adopted ASC 606—Revenue from Contracts with Customers in 2018 using the modified retrospective approach, which primarily resulted in certain software sales being reported on a net basis where they would have otherwise been reported on a gross basis under the previous revenue recognition guidance. As a result, net sales for 2019 and 2018 are not comparable to prior periods. |
|
|
|
As of December 31, |
|
|||||||||||||
|
|
|
2019 |
|
2018 |
|
2017 |
|
2016 |
|
2015 |
|
|||||
|
|
|
(dollars in thousands) |
|
|||||||||||||
|
Consolidated Balance Sheet Data: |
|
|
|
|
|
|
|
|
|
|
|
|
|
|
|
|
|
Working capital |
|
$ |
467,488 |
|
$ |
409,380 |
|
$ |
368,080 |
|
$ |
328,917 |
|
$ |
330,848 |
|
|
Total assets(1) |
|
|
937,335 |
|
|
805,355 |
|
|
747,851 |
|
|
686,134 |
|
|
639,074 |
|
|
Total stockholders’ equity |
|
|
597,312 |
|
|
525,903 |
|
|
482,252 |
|
|
433,442 |
|
|
392,451 |
|
|
Cash dividends declared per share |
|
$ |
0.32 |
|
$ |
0.32 |
|
$ |
0.34 |
|
$ |
0.34 |
|
$ |
0.40 |
|
|
(1) |
The Company adopted ASC 842—Leases in 2019, which primarily resulted in the establishment of a right-of-use asset and corresponding lease liability for certain of our operating leases. As a result, total assets for 2019 are not comparable to prior periods. |
20
Item 7. Management’s Discussion and Analysis of Financial Condition and Results of Operations
Our management’s discussion and analysis of our financial condition and results of operations include the identification of certain trends and other statements that may predict or anticipate future business or financial results that are subject to important factors that could cause our actual results to differ materially from those indicated. See “Item 1A. Risk Factors.”
OVERVIEW
We are a national provider of a wide range of information technology, or IT, solutions. We help our customers design, enable, manage, and service their IT environments. We provide IT products, including computer systems, data center solutions, software and peripheral equipment, networking communications, and other products and accessories that we purchase from manufacturers, distributors, and other suppliers. We also offer services involving design, configuration, and implementation of IT solutions. These services are performed by our personnel and by third-party providers. We operate through three sales segments, which serve primarily: (a) small- to medium-sized businesses, or in our Business Solutions segment, through our PC Connection Sales subsidiary, (b) large enterprise customers, in our Enterprise Solutions segment, through our MoreDirect subsidiary, and (c) federal, state, and local government and educational institutions, in our Public Sector Solutions segment, through our GovConnection subsidiary.
We generate sales primarily through outbound telemarketing and field sales contacts by account managers focused on the business, education, and government markets, our websites, and direct responses from customers responding to our advertising media. We seek to recruit, retain, and increase the productivity of our sales personnel through training, mentoring, financial incentives based on performance, and updating and streamlining our information systems to make our operations more efficient.
As a value added reseller in the IT supply chain, we do not manufacture IT hardware or software. We are dependent on our suppliers—manufacturers and distributors that historically have sold only to resellers rather than directly to end users. However, certain manufacturers have, on multiple occasions, attempted to sell directly to our customers, and in some cases, have restricted our ability to sell their products directly to certain customers, thereby attempting to eliminate our role. We believe that the success of these direct sales efforts by suppliers will depend on their ability to meet our customers’ ongoing demands and provide objective, unbiased solutions to meet their needs. We believe more of our customers are seeking comprehensive IT solutions, rather than simply the acquisition of specific IT products. Our advantage is our ability to be product-neutral and provide a broader combination of products, services, and advice tailored to customer needs. By providing customers with customized solutions from a variety of manufacturers, we believe we can mitigate the negative impact of continued direct sales initiatives from individual manufacturers. Through the formation of our Technical Solutions Group, we are able to provide customers complete IT solutions, from identifying their needs, to designing, developing, and managing the integration of products and services to implement their IT projects. Such service offerings carry higher margins than traditional product sales. Additionally, the technical certifications of our service engineers permit us to offer higher-end, more complex products that generally carry higher gross margins. We expect these service offerings and technical certifications to continue to play a role in sales generation and improve gross margins in this competitive environment.
The primary challenges we continue to face in effectively managing our business are (1) increasing our revenues while at the same time improving our gross margin in all three segments, (2) recruiting, retaining, and improving the productivity of our sales and technical support personnel, and (3) effectively controlling our selling, general, and administrative, or SG&A, expenses while making major investments in our IT systems and solution selling personnel, especially in relation to changing revenue levels.
To support future growth, we are expanding our IT solutions business, which requires the addition of highly-skilled service engineers. Although we expect to realize the ultimate benefit of higher-margin service revenues under this multi-year initiative, we believe that our cost of services will increase as we add service engineers. If our service revenues do not grow enough to offset the cost of these headcount additions, our operating results may decline.
21
Market conditions and technology advances significantly affect the demand for our products and services. Virtual delivery of software products and advanced Internet technology providing customers enhanced functionality have substantially increased customer expectations, requiring us to invest on an ongoing basis in our own IT development to meet these new demands.
Our investments in IT infrastructure are designed to enable us to operate more efficiently and provide our customers enhanced functionality.
RESULTS OF OPERATIONS
The following table sets forth information derived from our statements of income expressed as a percentage of net sales for the periods indicated:
|
|
|
Years Ended December 31, |
|
|||||||
|
|
|
|
2019 |
|
|
2018 |
|
|
2017 |
|
|
Net sales (in millions) |
|
$ |
2,820.0 |
|
$ |
2,699.5 |
|
$ |
2,911.9 |
|
|
Gross margin |
|
|
16.0 |
% |
|
15.2 |
% |
|
13.1 |
% |
|
Selling, general and administrative expenses |
|
|
12.0 |
|
|
12.0 |
|
|
10.3 |
|
|
Income from operations |
|
|
4.0 |
|
|
3.2 |
|
|
2.7 |
|
Net sales of $2,820.0 million in 2019 reflected an increase of $120.5 million compared to 2018, primarily as a result of increased sales across all three of our sales segments. Our investments in advance solutions sales and a strategic focus by customers across all three segments led to an increase in net sales of notebooks/mobility and desktop products. We also saw an increase in net sales of software products, despite being negatively impacted by a higher percentage of our software sales recognized on a net basis in the current period in transactions where we are considered to be the agent. Gross profit dollars increased year-over-year by $40.2 million due to increased sales and higher invoice selling margins. SG&A expenses increased by $14.2 million, mostly due to higher personnel costs and increased advertising expense, but remained flat as a percentage of net sales. Operating income in 2019 increased year-over-year, both in dollars and as a percentage of net sales, by $26.3 million and 80 basis points, respectively, primarily as a result of gross profit increasing at a higher rate than SG&A expenses.
22
Sales Distribution
The following table sets forth our percentage of net sales by sales segment and product mix:
|
|
|
Years Ended December 31, |
|
||||
|
|
|
2019 (1) |
|
2018 (1) |
|
2017 |
|
|
Sales Segment |
|
|
|
|
|
|
|
|
Enterprise Solutions |
|
42 |
% |
43 |
% |
39 |
% |
|
Business Solutions |
|
38 |
|
38 |
|
40 |
|
|
Public Sector Solutions |
|
20 |
|
19 |
|
21 |
|
|
Total |
|
100 |
% |
100 |
% |
100 |
% |
|
|
|
|
|
|
|
|
|
|
Product Mix |
|
|
|
|
|
|
|
|
Notebooks/Mobility |
|
29 |
% |
26 |
% |
22 |
% |
|
Desktops |
|
12 |
|
11 |
|
11 |
|
|
Software |
|
12 |
|
12 |
|
23 |
|
|
Servers/Storage |
|
8 |
|
11 |
|
9 |
|
|
Net/Com Product |
|
8 |
|
8 |
|
7 |
|
|
Displays and sound |
|
9 |
|
9 |
|
8 |
|
|
Accessories |
|
13 |
|
13 |
|
10 |
|
|
Other Hardware/Services |
|
9 |
|
10 |
|
10 |
|
|
Total |
|
100 |
% |
100 |
% |
100 |
% |
|
(1) |
The Company adopted ASC 606—Revenue from Contracts with Customers in 2018 using the modified retrospective approach, which primarily resulted in certain software sales being reported on a net basis where they would have otherwise been reported on a gross basis under the previous revenue recognition guidance. As a result, net sales for 2019 and 2018 are not comparable to 2017 amounts. |
Gross Profit Margins
The following table summarizes our overall gross profit margins, as a percentage of net sales, for the last three years:
|
|
|
Years Ended December 31, |
|
||||
|
|
|
2019 |
|
2018 |
|
2017 |
|
|
Sales Segment |
|
|
|
|
|
|
|
|
Enterprise Solutions |
|
14.4 |
% |
13.9 |
% |
12.3 |
% |
|
Business Solutions |
|
19.1 |
|
18.0 |
|
15.3 |
|
|
Public Sector Solutions |
|
13.6 |
|
12.7 |
|
10.5 |
|
|
Total Company |
|
16.0 |
% |
15.2 |
% |
13.1 |
% |
Cost of Sales
Cost of sales includes the invoice cost of the product, direct employee and third party cost of services, direct costs of packaging, inbound and outbound freight, and provisions for inventory obsolescence, adjusted for discounts, rebates, and other vendor allowances.
23
Operating Expenses
The following table reflects our most significant operating expenses for the last three years (in millions of dollars):
|
|
|
Years Ended December 31, |
|
|||||||
|
|
|
2019 |
|
2018 |
|
2017 (1) |
|
|||
|
Personnel costs |
|
$ |
257.8 |
|
$ |
249.2 |
|
$ |
232.0 |
|
|
Advertising |
|
|
19.4 |
|
|
16.2 |
|
|
14.4 |
|
|
Facilities operations |
|
|
19.0 |
|
|
16.9 |
|
|
15.0 |
|
|
Professional fees |
|
|
10.6 |
|
|
8.6 |
|
|
8.8 |
|
|
Credit card fees |
|
|
6.6 |
|
|
6.9 |
|
|
7.2 |
|
|
Depreciation and amortization |
|
|
13.3 |
|
|
14.1 |
|
|
11.8 |
|
|
Other |
|
|
11.9 |
|
|
12.5 |
|
|
11.7 |
|
|
Total SG&A expense |
|
$ |
338.6 |
|
$ |
324.4 |
|
$ |
300.9 |
|
|
As a percentage of net sales |
|
|
12.0 |
% |
|
12.0 |
% |
|
10.3 |
% |
|
(1) |
The year-ended December 31, 2017 SG&A amounts are shown net of restructuring and other charges of $3,636, which were included in SG&A expenses in prior-year disclosures. |
Personnel costs increased in 2019 compared to 2018 primarily due to increased variable compensation associated with higher gross profit, combined with increases in other employee-related expenses. Depreciation and amortization decreased in 2019 compared to 2018 primarily due to lower levels of IT infrastructure in service in 2019 compared to 2018.
Personnel costs increased in 2018 compared to 2017 primarily due to increased variable compensation associated with higher gross profit and changes in the stock price, which increased stock-based compensation, and increases in other employee-related expenses. Depreciation and amortization increased in 2018 and 2017 due to investments in our IT infrastructure and the amortization of intangible assets added in 2016 with our two acquisitions.
Restructuring and other charges
In the years ended December 31 2019, 2018, and 2017, we undertook a wide range of actions across the Company to lower our cost structure and align our business in an effort to improve our ability to execute our strategy. In connection with these restructuring initiatives, we incurred restructuring and related costs of $0.7 million, $1.0 million, and $3.6 million for the years ended December 31, 2019, 2018 and 2017, respectively.
24
YEAR-OVER-YEAR COMPARISONS
Year Ended December 31, 2019 Compared to Year Ended December 31, 2018
Net sales increased by 4.5% to $2,820.0 million in 2019 from $2,699.5 million in 2018. Changes in net sales and gross profit by operating segment are shown in the following table (dollars in millions):
|
|
|
Years Ended December 31, |
|
|
|
||||||||
|
|
|
2019 |
|
2018 |
|
|
|
||||||
|
|
|
|
|
|
% of |
|
|
|
|
% of |
|
% |
|
|
|
|
Amount |
|
Net Sales |
|
Amount |
|
Net Sales |
|
Change |
|
||
|
Sales: |
|
|
|
|
|
|
|
|
|
|
|
|
|
|
Enterprise Solutions |
|
$ |
1,193.8 |
|
42.3 |
% |
$ |
1,165.1 |
|
43.2 |
% |
2.5 |
% |
|
Business Solutions |
|
|
1,060.0 |
|
37.6 |
|
|
1,027.9 |
|
38.1 |
|
3.1 |
|
|
Public Sector Solutions |
|
|
566.2 |
|
20.1 |
|
|
506.5 |
|
18.8 |
|
11.8 |
|
|
Total |
|
$ |
2,820.0 |
|
100.0 |
% |
$ |
2,699.5 |
|
100.0 |
% |
4.5 |
% |
|
Gross Profit: |
|
|
|
|
|
|
|
|
|
|
|
|
|
|
Enterprise Solutions |
|
$ |
171.7 |
|
14.4 |
% |
$ |
161.6 |
|
13.9 |
% |
6.3 |
% |
|
Business Solutions |
|
|
202.7 |
|
19.1 |
|
|
184.9 |
|
18.0 |
|
9.6 |
|
|
Public Sector Solutions |
|
|
76.9 |
|
13.6 |
|
|
64.6 |
|
12.7 |
|
19.0 |
|
|
Total |
|
$ |
451.3 |
|
16.0 |
% |
$ |
411.1 |
|
15.2 |
% |
9.8 |
% |
|
· |
Net sales of $1,193.8 million for the Enterprise Solutions segment reflect an increase of $28.7 million, or 2.5% compared to the prior year, primarily due to increases in net sales of notebooks/mobility and desktop products, which grew by $49.9 million and $28.0 million, respectively. The Enterprise Solutions segment also benefitted from the personal computer refresh driven by the anticipated end-of-life support for Windows 7 and technological advances in hardware that enables modern workplace solutions. These increases in net sales were partially offset by decreases in sales of server/storage and other hardware products of $29.8 million and $21.1 million, respectively, which were primarily attributable to the timing of large product rollouts. |
|
· |
Net sales of $1,060.0 million for the Business Solutions segment reflect an increase of $32.1 million, or 3.1%. The increase in net sales year-over-year was primarily driven by growth in desktops and notebooks/mobility products of $19.3 million and $18.0 million, respectively, as the Company benefitted from the personal computer refresh driven by the anticipated end-of-life support for Windows 7 and other technological advances in hardware that enables modern workplace solutions. Net sales of software products also grew by $12.2 million year-over-year despite being negatively impacted by a higher percentage of our software sales recognized on a net basis in the current period in transactions where we are considered to be the agent. Net sales growth was partially offset by a decrease in net/com products of $15.4 million, primarily driven by the timing of large product rollouts. |
|
· |
Net sales of $566.2 million for the Public Sector Solutions segment reflect an increase of $59.7 million, or 11.8%. We experienced growth year-over-year in each of our product categories, highlighted by increases in net sales of notebooks/mobility, desktop, and software products of $27.3 million, $10.4 million, and $9.6 million, respectively. |
Gross profit for 2019 increased year-over-year both in dollars and as a percentage of net sales (gross margin), as explained below:
|
· |
Gross profit for the Enterprise Solutions segment increased primarily due to higher invoice selling margins of 54 basis points, driven primarily by an increase in software sales reported on a net basis. |
|
· |
Gross profit for the Business Solutions segment increased year-over-year largely due to higher invoice selling margins of 97 basis points, primarily driven by an increase in software sales reported on a net basis. Also contributing to the growth were increased agency fees from enterprise software agreements, which grew by approximately 15.5% year-over-year. We receive agency fees from vendors for certain software and hardware sales, |
25
which are recorded as revenue with no corresponding cost of goods sold, resulting in a positive impact on gross margin. |
|
· |
Gross profit for the Public Sector Solutions segment increased as a result of changes in customer mix and higher invoice selling margins of 85 basis points, driven primarily by improved hardware margins and an increase in software sales reported on a net basis. |
Selling, general and administrative expenses in 2019 increased in dollars, but remained flat and as a percentage of net sales compared to the prior year. SG&A expenses attributable to our three operating segments and the remaining unallocated Headquarters/Other group expenses are summarized below (dollars in millions):
|
|
|
Years Ended December 31, |
|
|
|
||||||||
|
|
|
2019 |
|
2018 |
|
|
|
||||||
|
|
|
|
|
|
% of Net |
|
|
|
|
% of Net |
|
% |
|
|
|
|
Amount |
|
Sales |
|
Amount |
|
Sales |
|
Change |
|
||
|
Enterprise Solutions |
|
$ |
103.9 |
|
8.7 |
% |
$ |
99.9 |
|
8.6 |
% |
4.0 |
% |
|
Business Solutions |
|
|
150.1 |
|
14.2 |
|
|
144.7 |
|
14.1 |
|
3.7 |
|
|
Public Sector Solutions |
|
|
69.6 |
|
12.3 |
|
|
66.7 |
|
13.2 |
|
4.3 |
|
|
Headquarters/Other, unallocated |
|
|
15.0 |
|
|
|
|
13.1 |
|
|
|
14.5 |
|
|
Total |
|
$ |
338.6 |
|
12.0 |
% |
$ |
324.4 |
|
12.0 |
% |
4.4 |
% |
|
· |
SG&A expenses for the Enterprise Solutions segment increased in dollars and as a percentage of net sales. The year-over-year increase in SG&A dollars was primarily driven by a $1.9 million increase in personnel expenses, including merit increases and variable compensation associated with higher gross profit, a $1.4 million increase in the usage of Headquarters services, and increases in advertising expenses of $0.6 million. SG&A expenses as a percentage of net sales was 8.7% for the Enterprise Solutions segment, which reflects an increase of 12 basis points compared to the prior period. |
|
· |
SG&A expenses for the Business Solutions segment increased in dollars and as a percentage of net sales. The year-over-year increase in SG&A dollars was primarily driven by a $3.4 million increase in the usage of Headquarter services and a $2.3 million increase in advertising expenses driven by increased marketing, advertising, and training campaigns directed towards driving sales. These increases were partially offset by a $0.3 million decrease in credit card fees. SG&A expenses as a percentage of net sales was 14.2% for the Business Solutions segment, which reflects an increase of 9 basis points compared to the prior period. |
|
· |
SG&A expenses for the Public Sector Solutions segment increased in dollars, but decreased as a percentage of net sales. The year-over-year increase in SG&A dollars was mostly due to a $2.0 million increase in personnel expenses, including variable compensation associated with higher gross profit, and an increase in the usage of Headquarters services of $1.4 million. Both professional fees and advertising costs also increased by $0.2 million year-over-year. These increases were partially offset by a decrease in bad debt expense due to the timing of certain write-offs. SG&A expenses as a percentage of net sales was 12.3% for the Public Sector segment, which reflects a decrease of 88 basis points compared to the prior period, resulting from net sales growth that outpaced spending compared with the same period a year ago. |
|
· |
SG&A expenses for the Headquarters/Other group increased year-over-year, which was driven primarily by a $4.1 million increase in personnel-related costs driven primarily by a higher headcount, increased payroll expense, and increased variable compensation associated with higher gross profits. Facilities costs and professional fees also increased by $2.0 million and $1.8 million, respectively. These increases were partially offset by a decrease in unallocated executive oversight costs of $6.2 million. The Headquarters/Other group provides services to the three segments in areas such as finance, human resources, IT, marketing, and product management. Most of the operating costs associated with such corporate Headquarters services are charged to the segments based on their estimated usage of the underlying services. The amounts shown in the table above represent the remaining unallocated costs. |
26
Restructuring and other charges incurred in 2019, 2018, and 2017 were as follows:
|
|
|
Years Ended December 31, |
|||||||
|
|
|
2019 |
|
2018 |
|
2017 |
|||
|
Employee separations |
|
$ |
0.5 |
|
$ |
1.0 |
|
$ |
0.6 |
|
Lease termination costs |
|
|
0.2 |
|
|
— |
|
|
— |
|
Relocation expenses |
|
|
— |
|
|
— |
|
|
0.1 |
|
Employee compensation |
|
|
— |
|
|
— |
|
|
2.8 |
|
Other |
|
|
— |
|
|
— |
|
|
0.1 |
|
Total restructuring and other charges |
|
$ |
0.7 |
|
$ |
1.0 |
|
$ |
3.6 |
The restructuring and other charges recorded in 2019 were related to a reduction in workforce in our Headquarters/Other group and included cash severance payments and other related benefits. These costs will be paid within a year of termination and any unpaid amounts are included in accrued expenses at December 31, 2019. Also included in net restructuring charges were exit costs incurred associated with the closing of one of our office facilities.
The restructuring and other charges recorded in 2018 were related to a reduction in workforce at our Business Solutions, Public Sector Solutions, and Headquarter segments and included cash severance payments and other related benefits.
The restructuring and other charges recorded in 2017 were primarily driven by a reduction in workforce at our Headquarters segment, along with costs related to the Softmart business, which was acquired in 2016, including expenses to retain certain key personnel brought over in the acquisition. Also in 2017, we incurred additional expense of $2.7 million related to a one-time cash bonus paid to all non-executive employees at the end of the year.
Income from operations increased by $26.3 million, or 30.7%, to $112.0 million in 2019 compared to 2018. Income from operations as a percentage of net sales was 4.0% in 2019 compared to 3.2% in 2018. The increase in operating income resulted primarily from gross profits increasing at a higher rate than SG&A costs. The increase in operating income as a percentage of net sales resulted primarily from the increase in gross margin.
Income taxes. Our effective tax rate was 27.1% for the year-ended December 31, 2019 and 2018. We expect our corporate income tax rate for 2020 to range from 27% to 29%.
Net income increased by $17.5 million to $82.1 million in 2019, from $64.6 million in 2018, which resulted from the increase in operating income in the current year.
27
Year Ended December 31, 2018 Compared to Year Ended December 31, 2017
Net sales decreased by 7.3% to $2,699.5 million in 2018 from $2,911.8 million in 2017. Changes in net sales and gross profit by operating segment are shown in the following table (dollars in millions):
|
|
|
Years Ended December 31, |
|
|
|
||||||||
|
|
|
2018 |
|
2017 |
|
|
|
||||||
|
|
|
|
|
|
% of |
|
|
|
|
% of |
|
% |
|
|
|
|
Amount |
|
Net Sales |
|
Amount |
|
Net Sales |
|
Change |
|
||
|
Sales: |
|
|
|
|
|
|
|
|
|
|
|
|
|
|
Enterprise Solutions |
|
$ |
1,165.1 |
|
43.2 |
% |
$ |
1,131.8 |
|
38.9 |
% |
2.9 |
% |
|
Business Solutions |
|
|
1,027.9 |
|
38.1 |
|
|
1,158.6 |
|
39.8 |
|
(11.3) |
|
|
Public Sector Solutions |
|
|
506.5 |
|
18.8 |
|
|
621.4 |
|
21.3 |
|
(18.5) |
|
|
Total |
|
$ |
2,699.5 |
|
100.0 |
% |
$ |
2,911.8 |
|
100.0 |
% |
(7.3) |
% |
|
Gross Profit: |
|
|
|
|
|
|
|
|
|
|
|
|
|
|
Enterprise Solutions |
|
$ |
161.6 |
|
13.9 |
% |
$ |
139.0 |
|
12.3 |
% |
16.3 |
% |
|
Business Solutions |
|
|
184.9 |
|
18.0 |
|
|
177.8 |
|
15.3 |
|
4.0 |
|
|
Public Sector Solutions |
|
|
64.6 |
|
12.7 |
|
|
65.3 |
|
10.5 |
|
(1.1) |
|
|
Total |
|
$ |
411.1 |
|
15.2 |
% |
$ |
382.1 |
|
13.1 |
% |
7.6 |
% |
|
· |
Net sales of $1,165.1 for the Enterprise Solutions segment increased by $33.3 million compared to the prior year. This year-over-year increase was driven by increased sales of notebooks and mobility products of $59.2 million, and increased sales of desktop products of $19.9 million. Sales of servers and storage equipment also increased by $17.6 million as large enterprises looked to upgrade their IT workplace with these product solutions. Increased sales of other hardware products accounted for $86.9 million of the increase, which was driven primarily by large orders of handheld devices used by our retail customers. These increases were partially offset by lower net sales of software products of $148.6 million, which resulted primarily from the adoption of ASC 606 where the Company is considered to be the agent on the transaction. Had the year been reported under the previous revenue recognition guidance, net sales for the Enterprise Solutions segment would have increased by $202.5 million, or 17.9%. |
|
· |
Net sales of $1,027.9 for the Business Solutions segment reflect a decrease of $130.7 million due to lower net sales of software products of $137.7 million, primarily as a result of the adoption of ASC 606 where the Company is considered to be the agent on the transaction, and desktops of $8.8 million. These decreases were partially offset by increased net sales of net/com products of $14.7 million as small- to medium-sized businesses increased their IT investments to transform their workplace. Had the year been reported under the previous revenue recognition guidance, net sales for the Business Solutions segment would have increased by $42.8 million, or 3.7%. |
|
· |
Net sales of $506.5 million for the Public Sector Solutions segment reflect a decrease of $114.9 million, primarily driven by lower net sales of software products of $58.3 million, which resulted primarily from the adoption of ASC 606 where the Company is considered to be the agent on the transaction, lower net sales of desktops of $44.6 million and lower net sales of other hardware/services of $23.3 million. Net sales to the federal government reflected a decrease of $79.8 million in 2018, which resulted primarily from a decrease in net sales of software products due to the adoption of ASC 606, and from a large sale of desktops to a federal agency in the first half of 2017 that did not repeat in 2018. Net sales to state and local government and educational institutions reflect a decrease of $35.1 million, primarily driven by a decrease in net sales of software product due to the adoption of ASC 606, and to lower net sales to higher education customers. |
Gross profit for 2018 increased year-over-year both in dollars and as a percentage of net sales (gross margin), as explained below:
|
· |
Gross profit for the Enterprise Solutions segment increased primarily due to higher invoice selling margins, which increased by 120 basis points and was driven by the increase in revenues reported on a net basis as a result of the adoption of ASC 606. Agency fees from enterprise software agreements represented a 28 basis-point increase due to the reduction in net sales year-over-year and cash discounts increased by 7 basis points year-over-year. |
28
|
· |
Gross profit for the Business Solutions segment increased due to higher invoice selling margins. Invoice selling margins increased by 224 basis points primarily due to the increase in revenues reported on a net basis as a result of the adoption of ASC 606. We also receive agency fees and early pay discounts from vendors for certain software and hardware sales. Agency fees are recorded as revenue with no corresponding cost of goods sold, and accordingly such fees have a positive impact on gross margin. Agency fees from enterprise software agreements represented a 20 basis-point increase due to the reduction in net sales year-over-year. Cash discounts increased by 13 basis points year-over-year. |
|
· |
Gross profit for the Public Sector Solutions segment increased due to higher invoice selling margins. Invoice selling margins increased by 221 basis points primarily due to the increase in revenues reported on a net basis as a result of the adoption of ASC 606. Agency fees from enterprise software agreements represented a 5 basis-point increase due to the reduction in net sales year-over-year and cash discounts increased by 2 basis points year-over-year. |
Selling, general and administrative expenses in 2018 increased both in dollars and as a percentage of net sales compared to the prior year. SG&A expenses attributable to our three operating segments and the remaining unallocated Headquarters/Other group expenses are summarized below (dollars in millions):
|
|
|
Years Ended December 31, |
|
|
|
||||||||
|
|
|
2018 |
|
2017 |
|
|
|
||||||
|
|
|
|
|
|
% of Net |
|
|
|
|
% of Net |
|
% |
|
|
|
|
Amount |
|
Sales |
|
Amount |
|
Sales |
|
Change |
|
||
|
Enterprise Solutions |
|
$ |
99.9 |
|
8.6 |
% |
$ |
88.2 |
|
7.8 |
% |
13.3 |
% |
|
Business Solutions |
|
|
144.7 |
|
14.1 |
|
|
136.7 |
|
11.8 |
|
5.9 |
|
|
Public Sector Solutions |
|
|
66.7 |
|
13.2 |
|
|
64.0 |
|
10.3 |
|
4.2 |
|
|
Headquarters/Other, unallocated |
|
|
13.1 |
|
|
|
|
12.0 |
|
|
|
9.2 |
|
|
Total |
|
$ |
324.4 |
|
12.0 |
% |
$ |
300.9 |
|
10.3 |
% |
7.8 |
% |
|
· |
SG&A expenses for the Enterprise Solutions segment increased in dollars and as a percentage of net sales. The increase in SG&A dollars was primarily due to increased personnel-related expenses of $7.9 million, resulting from investments in solutions sales personnel and incremental variable compensation associated with higher gross profits, a $3.3 million increase in usage of Headquarter services, and a $0.3 million increase in credit card fees. SG&A expenses as a percentage of net sales was 8.6% for the Enterprise Solutions segment, which reflects a decrease of 30 basis points resulting from the factors described above, but offset by an increase of 109 basis points related to the adoption of ASC 606. |
|
· |
SG&A expenses for the Business Solutions segment increased in dollars and as a percentage of net sales. The year-over-year increase in SG&A dollars was primarily driven by a $7.7 million increase in usage of Headquarter services related to our investments in technical and engineering support provided to this segment, and a $1.6 million increase in advertising expenses driven by increased vendor funding for marketing, advertising, and training campaigns directed towards driving sales. These increases were partially offset by a net $1.1 million decrease in personnel-related expenses, which was driven by a decrease of approximately $3.8 million related to the reallocation of certain personnel-related expenses in 2018 to the Headquarters/Other group and partially offset by increases in variable compensation associated with higher gross profits. SG&A expenses as a percentage of net sales was 14.1% for the Business Solutions segment, which reflects an increase of 26 basis points resulting from the factors described above and an increase of 201 basis points related to the adoption of ASC 606. |
|
· |
SG&A expenses for the Public Sector Solutions segment increased in dollars and as a percentage of net sales. The dollar increase resulted primarily from greater usage of Headquarter services of $3.0 million, which was partially offset by decreases in personnel-related expenses of $0.3 million primarily due to the reallocation of certain personnel-related expenses in 2018 to the Headquarters/Other group and lower credit card fee expenses of $0.1 million. SG&A expenses as a percentage of net sales was 13.2% for the Public Sector Solutions segment, which reflects an increase of 143 basis points resulting from the factors described above and an increase of 145 basis points related to the adoption of ASC 606. |
29
|
· |
SG&A expenses for the Headquarters/Other group increased year-over-year, which was driven primarily by the reallocation of certain personnel-related expenses to the Headquarters/Other group from the Business Solutions and Public Sector Solutions segments. The Headquarters/Other group provides services to the three segments in areas such as finance, human resources, IT, marketing, and product management. Most of the operating costs associated with such corporate headquarters services are charged to the operating segments based on their estimated usage of the underlying services. The amounts shown in the table above represent the remaining unallocated costs. |
Income from operations increased by $8.2 million to $85.7 million in 2018 compared to 2017. Income from operations as a percentage of net sales was 3.2% in 2018 compared to 2.7% in 2017. The increase in operating income resulted primarily from gross profits increasing at a higher rate than SG&A costs. The increase in operating income as a percentage of net sales resulted primarily from the increase in gross margin.
Income taxes. Our effective tax rate was 27.1% for the year-ended December 31, 2018, compared to 29.3% for the year-ended December 31, 2017. In December 2017, the U.S. Tax Cuts and Jobs Act was enacted, which among other changes, reduced the federal corporate income tax rate. This rate reduction, which took effect on January 1, 2018, required the revaluation of our net deferred tax liability. The revaluation resulted in the recording of an income tax benefit of $7.7 million for the fourth quarter of 2017.
Net income increased by $9.7 million to $64.6 million in 2018, from $54.9 million in 2017, which resulted from the increase in operating income combined with a lower effective tax rate in 2018.
LIQUIDITY AND CAPITAL RESOURCES
Liquidity Overview
Our primary sources of liquidity have historically been internally generated funds from operations and borrowings under our bank line of credit. We have used those funds to meet our capital requirements, which consist primarily of working capital for operational needs, capital expenditures for computer equipment and software used in our business, repurchases of common stock for treasury, dividend payments, and as opportunities arise, possible acquisitions of new businesses.
We believe that funds generated from operations, together with available credit under our bank line of credit, will be sufficient to finance our working capital, capital expenditures, and other requirements for at least the next twelve calendar months. Our investments in IT systems and infrastructure are designed to enable us to operate more efficiently and to provide our customers enhanced functionality.
We expect to meet our cash requirements for 2020 through a combination of cash on hand, cash generated from operations, and borrowings on our bank line of credit, as follows:
|
· |
Cash on Hand. At December 31, 2019, we had $90.1 million in cash and cash equivalents. |
|
· |
Cash Generated from Operations. We expect to generate cash flows from operations in excess of operating cash needs by generating earnings and managing net changes in inventories and receivables with changes in payables to generate a positive cash flow. |
|
· |
Credit Facilities. As of December 31, 2019, no borrowings were outstanding against our $50.0 million bank line of credit, which is available until February 10, 2022. Accordingly, our entire line of credit was available for borrowing at December 31, 2019. This line of credit can be increased, at our option, to $80.0 million for approved acquisitions or other uses authorized by the bank. Borrowings are, however, limited by certain minimum collateral and earnings requirements, as described more fully below. |
Our ability to continue funding our planned growth, both internally and externally, is dependent upon our ability to generate sufficient cash flow from operations or to obtain additional funds through equity or debt financing, or from other sources of financing, as may be required. While we do not anticipate needing any additional sources of financing to
30
fund our operations at this time, if demand for IT products declines, our cash flows from operations may be substantially affected. See also related risks listed under “Item 1A. Risk Factors.”
Summary Sources and Uses of Cash
The following table summarizes our sources and uses of cash over the last three years (in millions of dollars):
|
|
|
Years Ended December 31, |
|
|||||||
|
|
|
2019 |
|
2018 |
|
2017 |
|
|||
|
|
|
|
|
|
|
|
|
|
|
|
|
Net cash provided by operating activities |
|
$ |
36.6 |
|
$ |
86.8 |
|
$ |
19.3 |
|
|
Net cash used in investing activities |
|
|
(25.7) |
|
|
(21.2) |
|
|
(11.8) |
|
|
Net cash used in financing activities |
|
|
(12.5) |
|
|
(23.9) |
|
|
(6.7) |
|
|
(Decrease) increase in cash and cash equivalents |
|
$ |
(1.6) |
|
$ |
41.7 |
|
$ |
0.8 |
|
Cash provided by operating activities decreased $50.2 million in 2019. Cash flow provided by operations in the year resulted primarily from net income before depreciation and amortization and an increase to accounts payable, partially offset by increases in accounts receivable and inventory. Accounts payable increased by $34.0 million year-over-year. Accounts receivable increased by $101.9 million year-over-year, primarily as a result of increased sales and the timing of product shipments. Days sales outstanding increased to 63 days at December 31, 2019, compared to 52 days at December 31, 2018. Inventory increased from the prior year by $5.5 million, which was the result of higher levels of inventory on-hand related to future backlog and an increase in shipments in transit but not received by our customers as of December 31, 2019 compared to December 31, 2018. Inventory turns, which measures the number of times inventory was sold and replaced during the year, decreased to 18 in 2019 compared to 21 in 2018. Operating cash flow in 2018 resulted primarily from net income before depreciation and amortization, a decrease in accounts receivable and an increase in accounts payable, partially offset by an increase in inventory. Operating cash flow in 2017 resulted primarily from net income before depreciation and amortization and an increase in accounts payable, offset partially by an increase in accounts receivable and inventory.
At December 31, 2019, we had $235.6 million in accounts payable. Such accounts are generally paid within 30 days of incurrence, or earlier when favorable cash discounts are offered. This balance will be financed by cash flows from operations or short-term borrowings under the line of credit.
Cash used in investing activities increased $4.4 million in 2019 compared to 2018. Cash used in investing activities represented $25.7 million in 2019, primarily for computer equipment and capitalized internally-developed software in connection with investments in our IT infrastructure. Cash used to purchase property and equipment, less proceeds from the sale of equipment, amounted to $21.2 million 2018, compared to $11.8 million in 2017.
Cash used in financing activities decreased $11.3 million in 2019 compared to 2018. Financing uses of cash in 2019 included a $8.5 million payment of a special $0.32 per share dividend declared in December 2018 and paid in January 2019, and $4.5 million for the purchase of treasure shares. These outflows were partially offset by $1.3 million for the issuance of stock under the employee stock purchase plan. Financing uses of cash in 2018 included a $9.1 million payment of a special $0.34 per share dividend declared in December 2017 and paid in January 2018, and $15.4 million for the purchase of treasure shares. These outflows were partially offset by $1.2 million for the issuance of stock under the employee stock purchase plan. Financing uses of cash in 2017 included dividends of $9.0 million declared in December 2016 and paid in January 2017, and were partially offset by $1.2 million for the issuance of stock under the employee stock purchase plan and $1.8 million for the exercise of stock options.
Debt Instruments, Contractual Agreements, and Related Covenants
Below is a summary of certain provisions of our credit facilities and other contractual obligations. For more information about the restrictive covenants in our debt instruments and inventory financing agreements, see “Factors Affecting Sources of Liquidity” below. For more information about our obligations, commitments, and contingencies, see our consolidated financial statements and the accompanying notes included in this annual report.
31
Bank Line of Credit. Our bank line of credit extends until February 2022 and is collateralized by our accounts receivable. Our borrowing capacity is up to $50.0 million at the one-month London Interbank Offered Rate, or LIBOR, plus a spread based on our funded debt ratio, or in the absence of LIBOR, the prime rate (4.75% at December 31, 2019). The one-month LIBOR rate at December 31, 2019 was 1.76%. In addition, we have the option to increase the facility by an additional $30.0 million to meet additional borrowing requirements. Our credit facility is subject to certain covenant requirements which are described below under “Factors Affecting Sources of Liquidity.” We did not have any borrowings under the credit facility at December 31, 2019.
In February of 2017, we renewed our credit facility, extending the expiration date to February 10, 2022, at which time any amounts outstanding become due. The credit facility was renewed with substantially the same terms and conditions as with the preceding agreement.
Cash receipts are automatically applied against any outstanding borrowings. Any excess cash on account may either remain on account to generate earned credits to offset up to 100% of cash management fees, or may be invested in short-term qualified investments. Borrowings under the line of credit are classified as current. At December 31, 2019, the entire $50.0 million facility was available for borrowing.
Contractual Obligations. The following table sets forth information with respect to our long-term obligations payable in cash as of December 31, 2019 (in thousands):
|
|
|
Payments Due By Period |
|
||||||||||
|
|
|
|
|
|
Less Than |
|
1 – 3 |
|
3 – 5 |
|
More Than |
|
|
|
|
|
Total |
|
1 Year |
|
Years |
|
Years |
|
5 Years |
|
||
|
Contractual Obligations: |
|
|
|
|
|
|
|
|
|
|
|
|
|
|
Operating lease obligations (1) |
|
$ |
15,925 |
|
4,767 |
|
8,655 |
|
1,919 |
|
584 |
|
|
|
(1) |
Excluding taxes, insurance, and common area maintenance charges. |
Operating Leases. We lease facilities from our principal stockholders and facilities from third parties under non-cancelable operating leases. Certain leases require us to pay real estate taxes, insurance, and common area maintenance charges.
Off-Balance Sheet Arrangements. We do not have any other off-balance sheet arrangements that have or are reasonably likely to have, a current or future material effect on our financial condition, changes in financial condition, results of operations, liquidity, capital expenditures, or capital resources that is material to investors.
Factors Affecting Sources of Liquidity
Internally Generated Funds. The key factors affecting our internally generated funds are our ability to manage costs and fully achieve our operating efficiencies, timely collection of our customer receivables, and management of our inventory levels.
Bank Line of Credit. Our bank line of credit extends until February 2022 and is collateralized by our accounts receivable. As of December 31, 2019, the entire $50.0 million facility was available for borrowing. Our credit facility contains certain financial ratios and operational covenants and other restrictions (including restrictions on additional debt, guarantees, and other distributions, investments, and liens) with which we and all of our subsidiaries must comply. Any failure to comply with these covenants would constitute a default and could prevent us from borrowing additional funds under this line of credit. This credit facility contains two financial tests:
|
· |
The funded debt ratio (defined as the average outstanding advances under the line for the quarter, divided by the consolidated Adjusted EBITDA for the trailing four quarters) must not be more than 2.0 to 1.0. Our outstanding borrowings under the credit facility during the fourth quarter of 2019 were immaterial, and accordingly, the funded |
32
debt ratio did not limit potential borrowings as of December 31, 2019. Future decreases in our consolidated Adjusted EBITDA, however, could limit our potential borrowings under the credit facility. |
|
· |
Minimum Consolidated Net Worth must be at least $346.7 million, plus 50% of consolidated net income for each quarter, beginning with the quarter ended December 31, 2016. Such amount was calculated at December 31, 2019, as $454.0 million, whereas our actual consolidated stockholders’ equity at this date was $597.3 million. |
Capital Markets. Our ability to raise additional funds in the capital market depends upon, among other things, general economic conditions, the condition of the information technology industry, our financial performance and stock price, and the state of the capital markets.
APPLICATION OF CRITICAL ACCOUNTING POLICIES AND ESTIMATES
A “critical accounting policy” has been defined as one that is both important to the portrayal of the registrant’s financial condition and results and requires management’s most difficult, subjective or complex judgments, often as a result of the need to make estimates about the effect of matters that are inherently uncertain. Further, “critical accounting policies” are those that are reflective of significant judgments and uncertainties, and potentially result in materially different results under different assumptions and conditions.
We believe that our accounting policies described below meet the definition of “critical accounting policies.”
Revenue Recognition
Revenue is recognized upon transfer of control of promised products or services to customers in an amount that reflects the consideration we expect to receive in exchange for those products or services. We enter into contracts that can include various combinations of products and services, which are generally capable of being distinct and accounted for as separate performance obligations. In most instances, when several performance obligations are aggregated into one single transaction, these performance obligations are fulfilled at the same point in time. We account for an arrangement when it has approval and commitment from both parties, the rights are identified, the contract has commercial substance, and collectability of consideration is probable. We generally obtain oral or written purchase authorizations from our customers for a specified amount of product at a specified price, which constitutes an arrangement. Revenue is recognized at the amount expected to be collected, net of any taxes collected from customers, which are subsequently remitted to governmental authorities. We generally invoice for our products at the time of shipping, and accordingly there is not a significant financing component included in our arrangements.
Nature of Products and Services
Information technology (“IT”) products typically represent a distinct performance obligation, and revenue is recognized at the point in time when control is transferred to the customer which is generally upon delivery to the customer. We recognize revenue as the principal in the transaction with the customer (i.e., on a gross basis), as we control the product prior to delivery to the customer and derive the economic benefits from the sales transaction given our control over customer pricing.
We do not recognize revenue for goods that remain in our physical possession before the customer has the ability to direct the use of, and obtain substantially all of the remaining benefits from the products, the goods are ready for physical transfer to and identified as belonging to the customer, and when we have no ability to use the product or to direct it to another customer.
Licenses for on-premise software provide the customer with a right to take possession of the software. Customers may purchase perpetual licenses or enter into subscriptions to the licensed software. We are the principal in these transactions and recognize revenue for the on-premise license at the point in time when the software is made available to the customer and the commencement of the term of the software license or when the renewal term begins, as applicable.
33
For certain on-premise licenses for security software, the customer derives substantially all of the benefit from these arrangements through the third-party delivered software maintenance, which provides software updates and other support services. We do not have control over the delivery of these performance obligations, and accordingly we are the agent in these transactions. We recognize revenue for security software net of the related cost of sales at the point in time when our vendor and customer accept the terms and conditions in the sales arrangement. Cloud products allow customers to use hosted software over the contractual period without taking possession of the software and are provided on a subscription basis. We do not exercise control over these products or services and therefore are an agent in these transactions. We recognize revenue for cloud products net of the related costs of sales at the point in time when our vendor and customer accept the terms and conditions in the sales arrangements. Amounts recognized on a net basis included in net sales for such software sales transactions were $521.7 million and $396.7 million for the years ended December 31, 2019 and 2018, respectively. Prior to the adoption of ASC 606, a substantial portion of our software sales were recognized on a gross basis.
We use our own engineering personnel to assist in projects involving the design and installation of systems and networks, and we also engage third-party service providers to perform warranty maintenance, implementations, asset disposal, and other services. Service revenue is recognized in general over time as we perform the underlying services and satisfy our performance obligations. We evaluate such engagements to determine whether we are the principal or the agent in each transaction. For those transactions in which we do not control the service, we act as an agent and recognize the transaction revenue on a net basis at a point in time when the vendor and customer accept the terms and conditions in the sales arrangement.
Similarly, we recognize revenue from agency sales transactions on a net sales basis. In agency sales transactions, we facilitate product sales by equipment and software manufacturers directly to our customers and receive agency, or referral, fees for such transactions. We do not take title to the products or assume any maintenance or return obligations in these transactions; title is passed directly from the supplier to our customer. Amounts recognized on a net basis included in net sales for such third-party services and agency sales transactions were $51.0 million, $46.8 million, and $38.3 million for the years ended December 31, 2019, 2018, and 2017, respectively.
Certain software sales include on-premise licenses that are combined with software maintenance. Software maintenance conveys rights to updates, bug fixes and help desk support, and other support services transferred over the underlying contract period. On-premise licenses are considered distinct performance obligations when sold with the software maintenance, as we sell these items separately. We recognize revenue related to the software maintenance as the agent in these transactions because we do not have control over the on-going software maintenance service. Revenue allocated to software maintenance is recognized at the point in time when our vendor and customer accept the terms and conditions in the sales arrangements.
Certain of our larger customers are offered the opportunity by vendors to purchase software licenses and maintenance under enterprise agreements (“EAs”). Under EAs, customers are considered to be compliant with applicable license requirements for the ensuing year, regardless of changes to their employee base. Customers are charged an annual true-up fee for changes in the number of users over the year. With most EAs, our vendors will transfer the license and bill the customer directly, paying resellers, such as us, an agency fee or commission on these sales. We record these agency fees as a component of net sales as earned and there is no corresponding cost of sales amount. In certain instances, we invoice the customer directly under an EA and account for the individual items sold based on the nature of each item. Our vendors typically dictate how the EA will be sold to the customer.
We also offer extended service plans (“ESP”) on IT products, both as part of the initial arrangement and separately from the IT products. We recognize revenue related to ESP as the agent in the transaction because we do not have control over the on-going ESP service and do not provide any service after the sale. Revenue allocated to ESP is recognized at the point in time when our vendor and customer accept the terms and conditions in the sales arrangement.
All amounts billed to a customer in a sales transaction related to shipping and handling, if any, represent revenues earned for the goods provided, and these amounts have been included in net sales. Costs related to shipping and handling billing are classified as cost of sales. Sales are reported net of sales, use, or other transaction taxes that are collected from customers and remitted to taxing authorities.
34
Significant Judgments
Our contracts with customers often include promises to transfer multiple products or services to a customer. Determining whether we are the agent or the principal and whether products and services are considered distinct performance obligations that should be accounted for separately versus together may require significant judgment.
We estimate the standalone selling price (“SSP”) for each distinct performance obligation when a single arrangement contains multiple performance obligations and the fulfillment occurs at different points of times. We maximize the use of observable inputs in the determination of the estimate for SSP for the items that we do not sell separately, including on-premise licenses sold with software maintenance, and IT products sold with ESP. In instances where SSP is not directly observable, such as when we do not sell the product or service separately, we determine the SSP using information that may include market conditions and other observable inputs.
We provide our customers with a limited thirty-day right of return, which is generally limited to defective merchandise, and gives rise to variable consideration. Revenue is recognized based on the most likely amount to which we are expected to be entitled. The estimated variable consideration is included in the transaction price to the extent it is probable that a significant reversal of cumulative revenue recognized will not occur once the uncertainty is resolved. We make estimates of product returns based on significant historical experience. We record our sales return reserve as a reduction of revenues and either as reduction of accounts receivable or, for customers who have already paid, as accrued expenses and as a reduction of cost of sales and an associated right of return asset. At December 31, 2019, we recorded sales reserves of $3.5 million and $0.1 million as components of accounts receivable and accrued expenses, respectively. At December 31, 2018, we recorded sales reserves of $3.4 million and $0.2 million as components of accounts receivable and accrued expenses, respectively.
Accounts Receivable
We perform ongoing credit evaluations of our customers and adjust credit limits based upon payment history and customers’ current creditworthiness. Our allowance is generally computed by (1) applying specific percentage reserves on accounts that are past due, and (2) specifically reserving for customers known to be in financial difficulty. Therefore, if the financial condition of certain of our customers were to deteriorate, or if we noted there was a lengthening of the timing of the settlement of receivables that was symptomatic of a general deterioration in the ability of our customers to pay, we would have to increase our allowance for doubtful accounts. This would negatively impact our earnings. Our cash flows would be impacted to the extent that receivables could not be collected.
In addition to accounts receivable from customers, we record receivables from our vendors/suppliers for cooperative advertising, price protection, supplier reimbursements, rebates, and other similar arrangements. A portion of such receivables is estimated based on information available from our vendors at discrete points in time. While such estimates have historically approximated actual cash received, a change in estimates could give rise to a reduction in the receivable. This could negatively impact our earnings and our cash flows.
Considerable judgment is used in assessing the ultimate realization of customer receivables and vendor/supplier receivables, including reviewing the financial stability of a customer, vendor information, and gauging current market conditions. If our evaluations are incorrect, we may incur additional charges in the future on our consolidated statements of income. Our trade receivables are charged off in the period in which they are deemed uncollectible. Recoveries of trade receivables previously charged are recorded when received. Write offs of customer and vendor receivables totaled $0.9 million in 2019 and $1.3 million in 2018.
Vendor Consideration
We receive allowances from merchandise vendors for price protections, discounts, product rebates, and other programs. These allowances are treated as a reduction of the vendor’s prices and are recorded as adjustments to cost of sales. We also receive vendor co-op advertising funding for our marketing activities and other programs. Vendors have the ability to place advertisements in the catalogs or fund other advertising activities for which we receive advertising allowances. These vendor allowances, to the extent that they represent specific reimbursements of incremental and
35
identifiable costs, are offset against SG&A expense on the consolidated statements of income. Vendor consideration that cannot be associated with a specific program funded by an individual vendor or that exceeds the fair value of advertising expense associated with that program is classified as an offset to cost of sales. Our vendor partners generally consolidate their funding of advertising and other marketing programs, and as a result, we classify substantially all vendor allowances as a reduction of cost of inventory purchases rather than a reduction of advertising expense.
Inventories
Inventories (all finished goods) consisting of software packages, computer systems, and peripheral equipment are stated at cost (determined under a weighted-average cost method which approximates the first-in, first-out method) or net realizable value, whichever is lower. Inventory quantities on hand are reviewed regularly, and provisions are made for obsolete, slow moving, and non-saleable inventory, based primarily on management’s forecast of customer demand for those products in inventory. The IT industry is characterized by rapid technological change and new product development that could result in increased obsolescence of inventory on hand. Increased obsolescence or decreased customer demand beyond management’s expectations could require additional provisions, which could negatively impact our earnings. Our obsolescence charges have ranged between $3.4 million and $7.0 million per annum. Historically, there have been no unusual charges precipitated by specific technological or forecast issues.
Value of Goodwill and Long-Lived Assets, Including Intangibles
We carry a variety of long-lived assets on our consolidated balance sheet, which are all currently classified as held for use. These include property and equipment, identifiable intangibles, an internet domain name, which is an indefinite-lived intangible asset not subject to amortization, and goodwill. An impairment review is undertaken on (1) an annual basis for goodwill and an indefinite-lived intangible; and (2) on an event-driven basis for all long-lived assets when facts and circumstances suggest that cash flows from such assets may be diminished. We have historically reviewed the carrying value of all these assets based partly on our projections of anticipated cash flows. These projections are, in part, dependent upon anticipated market conditions, operational performance, and legal status. Any impairment charge that is recorded negatively impacts our earnings. Cash flows are generally not impacted by an impairment charge.
For 2018 and 2017, using both income and market valuation approaches, we performed a two-step quantitative test to compare the fair value of our reporting units with their respective carrying values, including goodwill. If the fair values were determined to be less than the carrying values, the second step would be performed to measure the amounts, if any, of the impairment. In 2019, rather than perform the two-step quantitative analysis, the Company performed a qualitative “Step 0” analysis, which allows us to consider qualitative factors that might impact the carrying amount of our goodwill to determine whether a more detailed quantitative analysis would be necessary. Factors considered when performing the “Step 0” impairment assessment included our performance relative to historical and projected future operating results, macroeconomic conditions, industry and market trends, cost factors that may have a negative impact on earnings and cash flows, changes in our stock price and market capitalization, and other relevant entity-specific events.
Our Enterprise Solutions and Business Solutions segments hold $66.2 million and $7.4 million of goodwill, respectively. We concluded that there were no indications that the carrying values of the two reporting units and the domain name exceeded their respective fair values, and accordingly, an impairment was not identified in the annual test. While we believe that our conclusions are reasonable, different assumptions could materially affect our valuations and result in impairment charges against the carrying values of those remaining assets in our Enterprise Solutions and Business Solutions segments. Please see Note 3, “Goodwill and Other Intangible Assets” to the Consolidated Financial Statements included in Item 8 of Part II of this report for a discussion of the significant assumptions used in our annual impairment test analysis.
RECENTLY ISSUED FINANCIAL ACCOUNTING STANDARDS
Recently issued financial accounting standards are detailed in Note 1, “Summary of Significant Accounting Policies,” in the Notes to Consolidated Financial Statements included in Item 8 of this Annual Report on Form 10-K.
36
INFLATION
We have historically offset any inflation in operating costs by a combination of increased productivity and price increases, where appropriate. We do not expect inflation to have a significant impact on our business in the foreseeable future.
Item 7A. Quantitative and Qualitative Disclosure About Market Risk
We invest cash balances in excess of operating requirements in short-term securities, generally with maturities of 90 days or less. In addition, our unsecured credit agreement provides for borrowings which bear interest at variable rates based on LIBOR plus a spread or the prime rate. We believe the effect, if any, of reasonably possible near-term changes in interest rates on our financial position, results of operations, and cash flows should not be material. Our credit agreement exposes earnings to changes in short-term interest rates since interest rates on the underlying obligations are variable. Our average outstanding borrowings during 2019 was minimal. Accordingly, the change in earnings resulting from a hypothetical 10% increase or decrease in interest rates is not material.
Item 8. Consolidated Financial Statements and Supplementary Data
The information required by this Item is included in this Report beginning at page F-1.
Item 9. Changes in and Disagreements with Accountants on Accounting and Financial Disclosure
Not applicable.
Item 9A. Controls and Procedures
Management’s Evaluation of Disclosure Controls and Procedures
The Company’s management, with the participation of the Chief Executive Officer and Chief Financial Officer, evaluated the effectiveness of the Company’s disclosure controls and procedures as of December 31, 2019. The term “disclosure controls and procedures,” as defined in Rules 13a-15(e) and 15d-15(e) promulgated under the Exchange Act, means controls and other procedures of a company that are designed to ensure that information required to be disclosed by a company in the reports that it files or submits under the Exchange Act is recorded, processed, summarized, and reported, within the time periods specified in the SEC's rules and forms. Disclosure controls and procedures include, without limitation, controls and procedures designed to ensure that information required to be disclosed by a company in the reports that it files or submits under the Exchange Act is accumulated and communicated to the company’s management, including its principal executive and principal financial officers, as appropriate to allow timely decisions regarding required disclosure. Management recognizes that any controls and procedures, no matter how well designed and operated, can provide only reasonable assurance of achieving their objectives and management necessarily applies its judgment in evaluating the cost-benefit relationship of possible controls and procedures. The Company’s disclosure controls and procedures are designed to provide reasonable assurance of achieving their objectives as described above. Based on this evaluation, the Chief Executive Officer and Chief Financial Officer concluded that, as of the end of the period covered by this report, the Company’s disclosure controls and procedures were effective at the reasonable assurance level.
Management’s Annual Report on Internal Control over Financial Reporting
The Company’s management is responsible for establishing and maintaining adequate internal control over financial reporting for the Company. Internal control over financial reporting is defined in Rule 13a-15(f) or 15d-15(f) promulgated under the Exchange Act as a process designed by, or under the supervision of, the Company’s principal executive and principal financial officers and effected by the Company’s board of directors, management, and other personnel to provide reasonable assurance regarding the reliability of financial reporting and the preparation of financial statements for external purposes in accordance with U.S. generally accepted accounting principles and includes those policies and procedures that: (1) pertain to the maintenance of records that, in reasonable detail, accurately and fairly
37
reflect the transactions and dispositions of the assets of the Company; (2) provide reasonable assurance that transactions are recorded as necessary to permit preparation of financial statements in accordance with U.S. generally accepted accounting principles and that receipts and expenditures of the Company are being made only in accordance with authorizations of management and directors of the Company; and (3) provide reasonable assurance regarding prevention or timely detection of unauthorized acquisition, use, or disposition of the Company’s assets that could have a material effect on the financial statements.
Because of its inherent limitations, internal control over financial reporting may not prevent or detect misstatements. Projections of any evaluation of effectiveness to future periods are subject to the risk that controls may become inadequate because of changes in conditions, or that the degree of compliance with the policies or procedures may deteriorate.
The Company’s management assessed the effectiveness of the Company’s internal control over financial reporting as of December 31, 2019. In making this assessment, the Company’s management used the criteria set forth by the Committee of Sponsoring Organizations of the Treadway Commission in Internal Control-Integrated Framework (2013).
Based on its assessment, management concluded that, as of December 31, 2019, the Company’s internal control over financial reporting was effective based on those criteria.
The Company’s independent registered public accounting firm has issued an audit report on the Company’s internal control over financial reporting as of December 31, 2019. This report appears below.
38
REPORT OF INDEPENDENT REGISTERED PUBLIC ACCOUNTING FIRM
To the stockholders and the Board of Directors of PC Connection, Inc.
Opinion on Internal Control over Financial Reporting
We have audited the internal control over financial reporting of PC Connection, Inc. and subsidiaries (the “Company”) as of December 31, 2019, based on criteria established in Internal Control — Integrated Framework (2013) issued by the Committee of Sponsoring Organizations of the Treadway Commission (COSO). In our opinion, the Company maintained, in all material respects, effective internal control over financial reporting as of December 31, 2019, based on criteria established in Internal Control — Integrated Framework (2013) issued by COSO.
We have also audited, in accordance with the standards of the Public Company Accounting Oversight Board (United States) (PCAOB), the consolidated financial statements as of and for the year ended December 31, 2019, of the Company and our report dated February 6, 2020, expressed an unqualified opinion on those financial statements and included an explanatory paragraph related to the adoption of a new accounting standard.
Basis for Opinion
The Company’s management is responsible for maintaining effective internal control over financial reporting and for its assessment of the effectiveness of internal control over financial reporting, included in the accompanying Management’s Annual Report on Internal Control over Financial Reporting. Our responsibility is to express an opinion on the Company’s internal control over financial reporting based on our audit. We are a public accounting firm registered with the PCAOB and are required to be independent with respect to the Company in accordance with the U.S. federal securities laws and the applicable rules and regulations of the Securities and Exchange Commission and the PCAOB.
We conducted our audit in accordance with the standards of the PCAOB. Those standards require that we plan and perform the audit to obtain reasonable assurance about whether effective internal control over financial reporting was maintained in all material respects. Our audit included obtaining an understanding of internal control over financial reporting, assessing the risk that a material weakness exists, testing and evaluating the design and operating effectiveness of internal control based on the assessed risk, and performing such other procedures as we considered necessary in the circumstances. We believe that our audit provides a reasonable basis for our opinion.
Definition and Limitations of Internal Control over Financial Reporting
A company’s internal control over financial reporting is a process designed to provide reasonable assurance regarding the reliability of financial reporting and the preparation of financial statements for external purposes in accordance with generally accepted accounting principles. A company’s internal control over financial reporting includes those policies and procedures that (1) pertain to the maintenance of records that, in reasonable detail, accurately and fairly reflect the transactions and dispositions of the assets of the company; (2) provide reasonable assurance that transactions are recorded as necessary to permit preparation of financial statements in accordance with generally accepted accounting principles, and that receipts and expenditures of the company are being made only in accordance with authorizations of management and directors of the company; and (3) provide reasonable assurance regarding prevention or timely detection of unauthorized acquisition, use, or disposition of the company’s assets that could have a material effect on the financial statements.
Because of its inherent limitations, internal control over financial reporting may not prevent or detect misstatements. Also, projections of any evaluation of effectiveness to future periods are subject to the risk that controls may become inadequate because of changes in conditions, or that the degree of compliance with the policies or procedures may deteriorate.
/s/ Deloitte & Touche LLP
Boston, Massachusetts
February 6, 2020
39
Changes in Internal Control over Financial Reporting
No change in the Company’s internal control over financial reporting (as defined in Rule 13a – 15(f) and 15d – 15(f) under the Exchange Act) occurred during the quarter ended December 31, 2019, which has materially affected, or is reasonably likely to materially affect, the Company’s internal control over financial reporting.
None.
40
Item 10. Directors, Executive Officers, and Corporate Governance
The information included under the headings, “Information about our Executive Officers” in Part I hereof and “Election of Directors,” “Information Concerning Directors, Nominees, and Executive Officers,” “Section 16(a) Beneficial Ownership Reporting Compliance,” “Code of Business Conduct and Ethics Policy,” and “Board Committees – Audit Committee” in our definitive Proxy Statement for our 2020 Annual Meeting of Stockholders to be filed with the SEC within 120 days of December 31, 2019 (the “Proxy Statement”) is incorporated herein by reference. With the exception of the foregoing information and other information specifically incorporated by reference into this Form 10-K, the Proxy Statement is not being filed as a part hereof.
We have adopted a Code of Business Conduct and Ethics that applies to our officers, including our principal executive, financial and accounting officers, and our directors and employees. We have posted the text of our Code of Business Conduct and Ethics under the “Investor Relations” section of our website, www.connection.com. We intend to disclose on our website any amendments to, or waivers from, the Code of Business Conduct and Ethics that are required to be disclosed pursuant to the disclosure requirements of Item 5.05 of Form 8-K.
Item 11. Executive Compensation
The information included under the headings “Executive Compensation” and “Director Compensation” in the Proxy Statement is incorporated herein by reference.
Item 12. Security Ownership of Certain Beneficial Owners and Management and Related Stockholder Matters
The information included under the headings “Security Ownership of Certain Beneficial Owners and Management” and “Equity Compensation Plan Information” in the Proxy Statement is incorporated herein by reference.
Item 13. Certain Relationships and Related Transactions, and Director Independence
The information included under the headings “Certain Relationships and Related Transactions” and “Director Independence” in the Proxy Statement is incorporated herein by reference.
Item 14. Principal Accounting Fees and Services
The information included under the heading “Principal Accounting Fees and Services” in the Proxy Statement is incorporated herein by reference.
41
Item 15. Exhibits and Financial Statement Schedules
(a)List of Documents Filed as Part of this Report:
|
(1) |
Consolidated Financial Statements |
The consolidated financial statements listed below are included in this document.
|
Consolidated Financial Statements |
Page |
|
F-2 |
|
|
F-3 |
|
|
F-4 |
|
|
F-5 |
|
|
F-6 |
|
|
F-7 |
|
(2) |
Consolidated Financial Statement Schedule: |
The following Consolidated Financial Statement Schedule, as set forth below, is filed with this report:
|
Schedule |
Page |
|
S-1 |
All other schedules have been omitted because they are either not applicable or the relevant information has already been disclosed in the financial statements.
|
(3) |
The exhibits listed in the Exhibit Index in Item 15(b) below are filed as part of this Annual Report on Form 10-K. |
(b)Exhibits
The exhibits listed below are filed herewith or are incorporated herein by reference to other filings.
42
EXHIBIT INDEX
43
|
10.24(25) |
|
|
|
10.25(25) |
|
|
|
10.26(16) |
|
|
|
10.27(25) |
|
|
|
10.28(24) |
|
|
|
10.29(1) |
|
|
|
10.30(2) |
|
|
|
10.31(14) |
|
|
|
10.32(20) |
|
|
|
10.33(12) |
|
|
|
10.34(22) |
|
|
|
10.35(3) |
|
|
|
10.36(3) |
|
|
|
10.37(3) |
|
|
|
10.38(3) |
|
|
|
10.39(6) |
|
|
|
10.40(8) |
|
|
|
10.41(13) |
|
|
44
|
10.42(17) |
|
|
|
10.43(26)* |
|
Employment Agreement, dated March 1, 2019, between the Registrant and Thomas Baker |
|
10.44(26)* |
|
Letter Agreement, dated February 28, 2019, between the Registrant and Stephen Sarno. |
|
10.45(27) |
|
|
|
10.46(27) |
|
|
|
21.1 |
|
|
|
23.1 |
|
|
|
31.1 |
|
|
|
31.2 |
|
|
|
32.1 |
|
|
|
32.2 |
|
|
|
101.INS ** |
|
XBRL Instance Document. |
|
101.SCH ** |
|
XBRL Taxonomy Extension Schema Document. |
|
101.CAL ** |
|
XBRL Taxonomy Calculation Linkbase Document. |
|
101.LAB ** |
|
XBRL Taxonomy Label Linkbase Document. |
|
101.PRE ** |
|
XBRL Taxonomy Presentation Linkbase Document. |
|
101.DEF ** |
|
XBRL Taxonomy Extension Definition Linkbase Document. |
|
(1) |
Incorporated by reference from the exhibits filed with the Company’s registration statement (333-41171) on Form S-1 filed under the Securities Act of 1933. |
|
(2) |
Incorporated by reference from exhibits filed with the Company’s annual report on Form 10-K, File Number 0-23827, filed on March 31, 1999. |
|
(3) |
Incorporated by reference from exhibits filed with the Company’s annual report on Form 10-K, File Number 0-23827, filed on March 30, 2001. |
|
(4) |
Incorporated by reference from exhibits filed with the Company’s proxy statement pursuant to Section 14(a), File Number 0-23827, filed on April 17, 2001. |
|
(5) |
Incorporated by reference from the exhibits filed with the Company’s registration statement (333-63272) on Form S-4 filed under the Securities Act of 1933. |
|
(6) |
Incorporated by reference from exhibits filed with the Company’s annual report on Form 10-K, File Number 0-23827, filed on March 31, 2003. |
|
(7) |
Incorporated by reference from exhibits filed with the Company’s annual report on Form 10-K, File Number 0-23827, filed on March 30, 2004. |
|
(8) |
Incorporated by reference from exhibits filed with the Company’s annual report on Form 10-K, File Number 0‑23827, filed on March 30, 2006. |
|
(9) |
Incorporated by reference from exhibits filed with the Company's quarterly report on Form 10-Q, filed on August 10, 2007. |
|
(10) |
Incorporated by reference from exhibits filed with the Company’s current report on Form 8-K, filed on January 9, 2008. |
|
(11) |
Incorporated by reference from exhibits filed with the Company's quarterly report on Form 10-Q, filed on May 12, 2008. |
|
(12) |
Incorporated by reference from exhibits filed with the Company's quarterly report on Form 10-Q, filed on August 11, 2008. |
|
(13) |
Incorporated by reference from exhibits filed with the Company's quarterly report on Form 10-Q, filed on November 10, 2008. |
|
(14) |
Incorporated by reference from exhibits filed with the Company’s annual report on Form 10-K, File Number 0‑23827, filed on March 16, 2009. |
45
|
(15) |
Incorporated by reference from exhibits filed with the Company's quarterly report on Form 10-Q, filed on November 10, 2010. |
|
(16) |
Incorporated by reference from exhibits filed with the Company’s annual report on Form 10-K, File Number 0‑23827, filed on February 28, 2012. |
|
(17) |
Incorporated by reference from exhibits filed with the Company's quarterly report on Form 10-Q, filed on August 8, 2012. |
|
(18) |
Incorporated by reference from exhibits filed with the Company's annual report on Form 10-K, File Number 0-23827, filed on March 4, 2013. |
|
(19) |
Incorporated by reference from exhibits filed with the Company’s current report on Form 8-K, filed on May 29, 2013. |
|
(20) |
Incorporated by reference from exhibits filed with the Company's quarterly report on Form 10-Q, filed on May 9, 2014. |
|
(21) |
Incorporated by reference from Appendix A filed with the Company’s proxy statement pursuant to Section 14(a), File Number 0-23827, filed on April 9, 2019. |
|
(22) |
Incorporated by reference from exhibits filed with the Company's quarterly report on Form 10-Q, filed on October 31, 2014. |
|
(23) |
Incorporated by reference from Appendix B filed with the Company’s proxy statement pursuant to Section 14(a), File Number 0-23827, filed on April 9, 2019. |
|
(24) |
Incorporated by reference from exhibits filed with the Company’s current report on Form 8-K, filed on February 16, 2017. |
|
(25) |
Incorporated by reference from exhibits filed with the Company's annual report on Form 10-K, File Number 0-23827, filed on March 3, 2017. |
|
(26) |
Incorporated by reference from exhibits filed with the Company's quarterly report on Form 10-Q, filed on May 2, 2019. |
|
(27) |
Incorporated by reference from exhibits filed with the Company's quarterly report on Form 10-Q, filed on October 30, 2019. |
* Management contract or compensatory plan or arrangement.
** Submitted electronically herewith.
Attached as Exhibit 101 to this report are the following formatted in XBRL (Extensible Business Reporting Language): (i) Consolidated Balance Sheets at December 31, 2019 and December 31, 2018, (ii) Consolidated Statements of Income for the years ended December 31, 2019, 2018, and 2017, (iii) Consolidated Statements of Changes in Stockholders’ Equity for the years ended December 31, 2019, 2018, and 2017, (iv) Consolidated Statements of Cash Flows for the years ended December 31, 2019, 2018, and 2017, and (v) Notes to Consolidated Financial Statements.
46
Pursuant to the requirements of Section 13 or 15 (d) of the Securities Exchange Act of 1934, the registrant has duly caused this report to be signed on its behalf by the undersigned, thereunto duly authorized.
|
|
PC CONNECTION, INC. |
|
|
Date: February 6, 2020 |
|
|
|
|
By: |
/s/ TIMOTHY J. MCGRATH |
|
|
|
Timothy J. McGrath |
|
|
|
President and Chief Executive Officer |
Pursuant to the requirements of the Securities Exchange Act of 1934, this report has been signed below by the following persons on behalf of the registrant and in the capacities and on the dates indicated.
|
Name |
|
Title |
|
Date |
|
|
|
|
|
|
|
|
|
|
|
|
|
/s/ TIMOTHY J. MCGRATH |
|
|
|
|
|
Timothy J. McGrath |
|
President and Chief Executive Officer (Principal Executive Officer) |
|
February 6, 2020 |
|
|
|
|
|
|
|
|
|
|
|
|
|
/s/ THOMAS C. BAKER |
|
|
|
|
|
Thomas C. Baker |
|
Senior Vice President, Chief Financial Officer and Treasurer (Principal Financial and Accounting Officer) |
|
February 6, 2020 |
|
|
|
|
|
|
|
|
|
|
|
|
|
/s/ PATRICIA GALLUP |
|
|
|
|
|
Patricia Gallup |
|
Chairman of the Board |
|
February 6, 2020 |
|
|
|
|
|
|
|
|
|
|
|
|
|
/s/ DAVID BEFFA-NEGRINI |
||||
|
David Beffa-Negrini |
|
Director |
|
February 6, 2020 |
|
|
|
|
|
|
|
|
|
|
|
|
|
/s/ BARBARA DUCKETT |
|
|
|
|
|
Barbara Duckett |
|
Director |
|
February 6, 2020 |
|
|
|
|
|
|
|
|
|
|
|
|
|
/s/ JACK FERGUSON |
|
|
|
|
|
Jack Ferguson |
|
Director |
|
February 6, 2020 |
|
|
|
|
|
|
|
|
|
|
|
|
|
/s/ DAVID HALL |
||||
|
David Hall |
|
Director |
|
February 6, 2020 |
47
PC CONNECTION, INC. AND SUBSIDIARIES
INDEX TO CONSOLIDATED FINANCIAL STATEMENTS
F-1
REPORT OF INDEPENDENT REGISTERED PUBLIC ACCOUNTING FIRM
To the stockholders and the Board of Directors of PC Connection, Inc.
Opinion on the Financial Statements
We have audited the accompanying consolidated balance sheets of PC Connection, Inc. and subsidiaries (the "Company") as of December 31, 2019 and 2018, the related consolidated statements of income, changes in stockholders' equity, and cash flows, for each of the three years in the period ended December 31, 2019, and the related notes and the schedule listed in the Index at Item 15 (collectively referred to as the "financial statements"). In our opinion, the financial statements present fairly, in all material respects, the financial position of the Company as of December 31, 2019 and 2018, and the results of its operations and its cash flows for each of the three years in the period ended December 31, 2019, in conformity with accounting principles generally accepted in the United States of America.
We have also audited, in accordance with the standards of the Public Company Accounting Oversight Board (United States) (PCAOB), the Company's internal control over financial reporting as of December 31, 2019, based on criteria established in Internal Control — Integrated Framework (2013) issued by the Committee of Sponsoring Organizations of the Treadway Commission and our report dated February 6, 2020, expressed an unqualified opinion on the Company's internal control over financial reporting.
Change in Accounting Principle
As discussed in Note 1 to the financial statements, the Company has changed its method of accounting for revenue contracts effective January 1, 2018 due to the adoption of Accounting Standards Update 2014-09, Revenue from Contracts with Customers, using the modified retrospective method.
Basis for Opinion
These financial statements are the responsibility of the Company's management. Our responsibility is to express an opinion on the Company's financial statements based on our audits. We are a public accounting firm registered with the PCAOB and are required to be independent with respect to the Company in accordance with the U.S. federal securities laws and the applicable rules and regulations of the Securities and Exchange Commission and the PCAOB.
We conducted our audits in accordance with the standards of the PCAOB. Those standards require that we plan and perform the audit to obtain reasonable assurance about whether the financial statements are free of material misstatement, whether due to error or fraud. Our audits included performing procedures to assess the risks of material misstatement of the financial statements, whether due to error or fraud, and performing procedures that respond to those risks. Such procedures included examining, on a test basis, evidence regarding the amounts and disclosures in the financial statements. Our audits also included evaluating the accounting principles used and significant estimates made by management, as well as evaluating the overall presentation of the financial statements. We believe that our audits provide a reasonable basis for our opinion.
/s/ Deloitte & Touche LLP
Boston, Massachusetts
February 6, 2020
We have served as the Company's auditor since 1984.
F-2
PC CONNECTION, INC. AND SUBSIDIARIES
(amounts in thousands, except per share data)
|
|
|
December 31, |
|
||||
|
|
|
2019 |
|
2018 |
|
||
|
ASSETS |
|
|
|
|
|
|
|
|
Current Assets: |
|
|
|
|
|
|
|
|
Cash and cash equivalents |
|
$ |
90,060 |
|
$ |
91,703 |
|
|
Accounts receivable, net |
|
|
549,626 |
|
|
447,698 |
|
|
Inventories, net |
|
|
124,666 |
|
|
119,195 |
|
|
Income taxes receivable |
|
|
1,388 |
|
|
922 |
|
|
Prepaid expenses and other current assets |
|
|
10,671 |
|
|
9,661 |
|
|
Total current assets |
|
|
776,411 |
|
|
669,179 |
|
|
Property and equipment, net |
|
|
64,226 |
|
|
51,799 |
|
|
Right-of-use assets |
|
|
13,842 |
|
|
— |
|
|
Goodwill |
|
|
73,602 |
|
|
73,602 |
|
|
Intangibles assets, net |
|
|
8,307 |
|
|
9,564 |
|
|
Other assets |
|
|
947 |
|
|
1,211 |
|
|
Total Assets |
|
$ |
937,335 |
|
$ |
805,355 |
|
|
LIABILITIES AND STOCKHOLDERS’ EQUITY |
|
|
|
|
|
|
|
|
Current Liabilities: |
|
|
|
|
|
|
|
|
Accounts payable |
|
$ |
235,641 |
|
$ |
201,640 |
|
|
Accrued payroll |
|
|
28,050 |
|
|
24,319 |
|
|
Accrued expenses and other liabilities |
|
|
45,232 |
|
|
33,840 |
|
|
Total current liabilities |
|
|
308,923 |
|
|
259,799 |
|
|
Deferred income taxes |
|
|
20,170 |
|
|
17,184 |
|
|
Noncurrent operating lease liabilities |
|
|
10,330 |
|
|
— |
|
|
Other liabilities |
|
|
600 |
|
|
2,469 |
|
|
Total Liabilities |
|
|
340,023 |
|
|
279,452 |
|
|
Stockholders’ Equity: |
|
|
|
|
|
|
|
|
Common Stock, $.01 par value, 100,000 shares authorized, 28,870 and 28,787 issued, 26,345 and 26,396 outstanding at December 31, 2019 and 2018, respectively |
|
|
288 |
|
|
288 |
|
|
Additional paid-in capital |
|
|
118,045 |
|
|
115,842 |
|
|
Retained earnings |
|
|
514,694 |
|
|
441,010 |
|
|
Treasury stock at cost, 2,526 and 2,391 shares at December 31, 2019 and 2018, respectively |
|
|
(35,715) |
|
|
(31,237) |
|
|
Total Stockholders’ Equity |
|
|
597,312 |
|
|
525,903 |
|
|
Total Liabilities and Stockholders’ Equity |
|
$ |
937,335 |
|
$ |
805,355 |
|
See notes to consolidated financial statements.
F-3
PC CONNECTION, INC. AND SUBSIDIARIES
CONSOLIDATED STATEMENTS OF INCOME
(amounts in thousands, except per share data)
|
|
|
Years Ended December 31, |
|
|||||||
|
|
|
2019 |
|
2018 |
|
2017 |
|
|||
|
Net sales |
|
$ |
2,820,034 |
|
$ |
2,699,489 |
|
$ |
2,911,883 |
|
|
Cost of sales |
|
|
2,368,724 |
|
|
2,288,403 |
|
|
2,529,807 |
|
|
Gross profit |
|
|
451,310 |
|
|
411,086 |
|
|
382,076 |
|
|
Selling, general and administrative expenses |
|
|
338,635 |
|
|
324,433 |
|
|
300,913 |
|
|
Restructuring and other charges |
|
|
703 |
|
|
967 |
|
|
3,636 |
|
|
Income from operations |
|
|
111,972 |
|
|
85,686 |
|
|
77,527 |
|
|
Other income, net |
|
|
707 |
|
|
2,978 |
|
|
98 |
|
|
Income before taxes |
|
|
112,679 |
|
|
88,664 |
|
|
77,625 |
|
|
Income tax provision |
|
|
(30,568) |
|
|
(24,072) |
|
|
(22,768) |
|
|
Net income |
|
$ |
82,111 |
|
$ |
64,592 |
|
$ |
54,857 |
|
|
|
|
|
|
|
|
|
|
|
|
|
|
Earnings per common share: |
|
|
|
|
|
|
|
|
|
|
|
Basic |
|
$ |
3.12 |
|
$ |
2.42 |
|
$ |
2.05 |
|
|
Diluted |
|
$ |
3.10 |
|
$ |
2.41 |
|
$ |
2.04 |
|
|
|
|
|
|
|
|
|
|
|
|
|
|
Shares used in computation of earnings per common share: |
|
|
|
|
|
|
|
|
|
|
|
Basic |
|
|
26,335 |
|
|
26,717 |
|
|
26,771 |
|
|
Diluted |
|
|
26,505 |
|
|
26,854 |
|
|
26,891 |
|
See notes to consolidated financial statements.
F-4
PC CONNECTION, INC. AND SUBSIDIARIES
CONSOLIDATED STATEMENT OF CHANGES IN STOCKHOLDERS’ EQUITY
(amounts in thousands)
|
|
|
Common Stock |
|
Additional |
|
Retained |
|
Treasury Shares |
|
|
|
|
||||||||
|
|
|
Shares |
|
Amount |
|
Paid-In Capital |
|
Earnings |
|
Shares |
|
Amount |
|
Total |
|
|||||
|
Balance - December 31, 2016 |
|
28,465 |
|
$ |
285 |
|
$ |
111,081 |
|
$ |
337,938 |
|
(1,856) |
|
$ |
(15,862) |
|
$ |
433,442 |
|
|
Stock options exercised |
|
157 |
|
|
2 |
|
|
1,748 |
|
|
— |
|
— |
|
|
— |
|
|
1,750 |
|
|
Issuance of common stock under Employee Stock Purchase Plan |
|
47 |
|
|
— |
|
|
1,197 |
|
|
— |
|
— |
|
|
— |
|
|
1,197 |
|
|
Stock-based compensation expense |
|
— |
|
|
— |
|
|
741 |
|
|
— |
|
— |
|
|
— |
|
|
741 |
|
|
Restricted stock units vested |
|
40 |
|
|
— |
|
|
— |
|
|
— |
|
— |
|
|
— |
|
|
— |
|
|
Shares withheld for taxes paid on stock awards |
|
— |
|
|
— |
|
|
(613) |
|
|
— |
|
— |
|
|
— |
|
|
(613) |
|
|
Dividend declaration |
|
— |
|
|
— |
|
|
— |
|
|
(9,122) |
|
— |
|
|
— |
|
|
(9,122) |
|
|
Net income |
|
— |
|
|
— |
|
|
— |
|
|
54,857 |
|
— |
|
|
— |
|
|
54,857 |
|
|
Balance - December 31, 2017 |
|
28,709 |
|
$ |
287 |
|
$ |
114,154 |
|
$ |
383,673 |
|
(1,856) |
|
$ |
(15,862) |
|
$ |
482,252 |
|
|
Cumulative effect of adoption of ASC 606 |
|
— |
|
|
— |
|
|
— |
|
|
1,197 |
|
— |
|
|
— |
|
|
1,197 |
|
|
Issuance of common stock under Employee Stock Purchase Plan |
|
41 |
|
|
1 |
|
|
1,246 |
|
|
— |
|
— |
|
|
— |
|
|
1,247 |
|
|
Stock-based compensation expense |
|
— |
|
|
— |
|
|
1,080 |
|
|
— |
|
— |
|
|
— |
|
|
1,080 |
|
|
Restricted stock units vested |
|
37 |
|
|
— |
|
|
— |
|
|
— |
|
— |
|
|
— |
|
|
— |
|
|
Shares withheld for taxes paid on stock awards |
|
— |
|
|
— |
|
|
(638) |
|
|
— |
|
— |
|
|
— |
|
|
(638) |
|
|
Repurchase of common stock for treasury |
|
— |
|
|
— |
|
|
— |
|
|
— |
|
(535) |
|
|
(15,375) |
|
|
(15,375) |
|
|
Dividend declaration |
|
— |
|
|
— |
|
|
— |
|
|
(8,452) |
|
— |
|
|
— |
|
|
(8,452) |
|
|
Net income |
|
— |
|
|
— |
|
|
— |
|
|
64,592 |
|
— |
|
|
— |
|
|
64,592 |
|
|
Balance - December 31, 2018 |
|
28,787 |
|
$ |
288 |
|
$ |
115,842 |
|
$ |
441,010 |
|
(2,391) |
|
$ |
(31,237) |
|
$ |
525,903 |
|
|
Issuance of common stock under Employee Stock Purchase Plan |
|
32 |
|
|
— |
|
|
1,253 |
|
|
— |
|
— |
|
|
— |
|
|
1,253 |
|
|
Stock-based compensation expense |
|
— |
|
|
— |
|
|
1,863 |
|
|
— |
|
— |
|
|
— |
|
|
1,863 |
|
|
Restricted stock units vested |
|
51 |
|
|
— |
|
|
— |
|
|
— |
|
— |
|
|
— |
|
|
— |
|
|
Shares withheld for taxes paid on stock awards |
|
— |
|
|
— |
|
|
(913) |
|
|
— |
|
— |
|
|
— |
|
|
(913) |
|
|
Repurchase of common stock for treasury |
|
— |
|
|
— |
|
|
— |
|
|
— |
|
(135) |
|
|
(4,478) |
|
|
(4,478) |
|
|
Dividend declaration |
|
— |
|
|
— |
|
|
— |
|
|
(8,427) |
|
— |
|
|
— |
|
|
(8,427) |
|
|
Net income |
|
— |
|
|
— |
|
|
— |
|
|
82,111 |
|
— |
|
|
— |
|
|
82,111 |
|
|
Balance - December 31, 2019 |
|
28,870 |
|
$ |
288 |
|
$ |
118,045 |
|
$ |
514,694 |
|
(2,526) |
|
$ |
(35,715) |
|
$ |
597,312 |
|
See notes to consolidated financial statements.
F-5
PC CONNECTION, INC. AND SUBSIDIARIES
CONSOLIDATED STATEMENTS OF CASH FLOWS
(amounts in thousands)
|
|
|
|
|
|
|
|
|
|
|
|
|
|
|
|
|
Years Ended December 31, |
|
|||||||
|
|
|
|
2019 |
|
2018 |
|
2017 |
|
|||
|
Cash Flows provided by Operating Activities: |
|
|
|
|
|
|
|
|
|
|
|
|
Net income |
|
|
$ |
82,111 |
|
$ |
64,592 |
|
$ |
54,857 |
|
|
Adjustments to reconcile net income to net cash provided by (used in) operating activities: |
|
|
|
|
|
|
|
|
|
|
|
|
Depreciation and amortization |
|
|
|
13,314 |
|
|
14,063 |
|
|
11,839 |
|
|
Provision for doubtful accounts |
|
|
|
25 |
|
|
1,680 |
|
|
1,658 |
|
|
Stock-based compensation expense |
|
|
|
1,863 |
|
|
1,080 |
|
|
741 |
|
|
Deferred income taxes |
|
|
|
2,986 |
|
|
1,488 |
|
|
(3,906) |
|
|
Loss on disposal of fixed assets |
|
|
|
213 |
|
|
51 |
|
|
24 |
|
|
Changes in assets and liabilities: |
|
|
|
|
|
|
|
|
|
|
|
|
Accounts receivable |
|
|
|
(101,953) |
|
|
14,872 |
|
|
(39,457) |
|
|
Inventories |
|
|
|
(5,471) |
|
|
(23,311) |
|
|
(16,218) |
|
|
Prepaid expenses, income tax receivables and other current assets |
|
|
|
(1,476) |
|
|
(1,045) |
|
|
(2,097) |
|
|
Other non-current assets |
|
|
|
264 |
|
|
2,403 |
|
|
(4,265) |
|
|
Accounts payable |
|
|
|
34,960 |
|
|
5,722 |
|
|
15,807 |
|
|
Accrued expenses and other liabilities |
|
|
|
9,767 |
|
|
5,244 |
|
|
337 |
|
|
Net cash provided by operating activities |
|
|
|
36,603 |
|
|
86,839 |
|
|
19,320 |
|
|
Cash Flows used in Investing Activities: |
|
|
|
|
|
|
|
|
|
|
|
|
Purchases of equipment and capitalized software |
|
|
|
(25,656) |
|
|
(21,238) |
|
|
(11,803) |
|
|
Net cash used in investing activities |
|
|
|
(25,656) |
|
|
(21,238) |
|
|
(11,803) |
|
|
Cash Flows (used in) provided by Financing Activities: |
|
|
|
|
|
|
|
|
|
|
|
|
Proceeds from short-term borrowings |
|
|
|
— |
|
|
859 |
|
|
— |
|
|
Repayment of short-term borrowings |
|
|
|
— |
|
|
(859) |
|
|
— |
|
|
Purchase of treasury shares |
|
|
|
(4,478) |
|
|
(15,375) |
|
|
— |
|
|
Dividend payment |
|
|
|
(8,452) |
|
|
(9,122) |
|
|
(9,041) |
|
|
Proceeds from exercise of stock options |
|
|
|
— |
|
|
— |
|
|
1,750 |
|
|
Issuance of stock under Employee Stock Purchase Plan |
|
|
|
1,253 |
|
|
1,247 |
|
|
1,197 |
|
|
Payment of payroll taxes on stock-based compensation through shares withheld |
|
|
|
(913) |
|
|
(638) |
|
|
(613) |
|
|
Net cash used in financing activities |
|
|
|
(12,590) |
|
|
(23,888) |
|
|
(6,707) |
|
|
Increase (decrease) in cash and cash equivalents |
|
|
|
(1,643) |
|
|
41,713 |
|
|
810 |
|
|
Cash and cash equivalents, beginning of year |
|
|
|
91,703 |
|
|
49,990 |
|
|
49,180 |
|
|
Cash and cash equivalents, end of year |
|
|
$ |
90,060 |
|
$ |
91,703 |
|
$ |
49,990 |
|
|
|
|
|
|
|
|
|
|
|
|
|
|
|
Non-cash Investing and Financing Activities: |
|
|
|
|
|
|
|
|
|
|
|
|
Accrued capital expenditures |
|
|
$ |
1,463 |
|
$ |
2,422 |
|
$ |
699 |
|
|
Dividend declaration |
|
|
|
8,427 |
|
|
8,452 |
|
|
9,122 |
|
|
Supplemental Cash Flow Information: |
|
|
|
|
|
|
|
|
|
|
|
|
Income taxes paid |
|
|
$ |
28,460 |
|
$ |
19,945 |
|
$ |
28,927 |
|
See notes to consolidated financial statements.
F-6
PC CONNECTION, INC. AND SUBSIDIARIES
NOTES TO CONSOLIDATED FINANCIAL STATEMENTS
(amounts in thousands, except per share data)
1. SUMMARY OF SIGNIFICANT ACCOUNTING POLICIES
PC Connection, Inc. is a leading solutions provider of a wide range of information technology, or IT, solutions. The Company help its customers design, enable, manage, and service their IT environments. The Company provides IT products, including computer systems, software and peripheral equipment, networking communications, and other products and accessories that it purchases from manufacturers, distributors, and other suppliers. The Company also offers services involving design, configuration, and implementation of IT solutions. These services are performed by the Company’s personnel and by first-party service providers. The Company operates through three sales segments: (a) the Business Solutions segment, which serves small- to medium-sized businesses, through its PC Connection Sales subsidiary, (b) the Enterprise Solutions segment, which serves large enterprise customers, through its MoreDirect subsidiary, and (c) the Public Sector Solutions segment, which serves federal, state, and local governmental and educational institutions, through its GovConnection subsidiary.
The following is a summary of the Company’s significant accounting policies:
Principles of Consolidation
The consolidated financial statements include the accounts of PC Connection, Inc. and its subsidiaries, all of which are wholly-owned. Intercompany transactions and balances are eliminated in consolidation.
Use of Estimates in the Preparation of Financial Statements
The preparation of financial statements in conformity with accounting principles generally accepted in the United States of America requires management to make estimates and assumptions. These estimates and assumptions affect the reported amounts and disclosures of assets and liabilities and the reported amounts and disclosures of revenue and expenses during the period. By nature, estimates are subject to an inherent degree of uncertainty. Actual results could differ from those estimates and assumptions.
Reclassification of Prior Year Presentation
Certain 2017 amounts have been reclassified for consistency with current year presentation. Restructuring and other charges have been separated from selling, general, and administrative expenses on the Consolidated Statements of Income. These charges amount to $703, $967, and $3,636 for the years ending December 31, 2019, 2018, and 2017, respectively. This change in classification does not affect previously reported net income or earnings per share figures in the Consolidated Statements of Income.
Revenue Recognition
On January 1, 2018, the Company adopted ASC 606—Revenue from Contracts with Customers (“ASC 606”), which replaced existing revenue recognition rules with a comprehensive revenue measurement and recognition standard and expanded disclosure requirements.
Revenue is recognized upon transfer of control of promised products or services to customers in an amount that reflects the consideration the Company expects to receive in exchange for those products or services. The Company enters into contracts that can include various combinations of products and services, which are generally capable of being distinct and accounted for as separate performance obligations. In most instances, when several performance obligations are aggregated into one single transaction, these performance obligations are fulfilled at the same point in time. The Company accounts for an arrangement when it has approval and commitment from both parties, the rights are identified, the contract has commercial substance, and collectability of consideration is probable. The Company
F-7
generally obtains oral or written purchase authorizations from its customers for a specified amount of product at a specified price, which constitutes an arrangement. Revenue is recognized at the amount expected to be collected, net of any taxes collected from customers, which are subsequently remitted to governmental authorities. The Company generally invoices for its products at the time of shipping, and accordingly there is not a significant financing component included in our arrangements.
Prior to the adoption of ASC 606, revenue on product sales was recognized at the point in time when persuasive evidence of an arrangement existed, the price was fixed or determinable, delivery had occurred, and there was a reasonable assurance of collection of the sales proceeds. Service revenue was recognized over time as the services were performed. The Company evaluated such engagements to determine whether it or the third party assumed the general risk and reward of ownership in these transactions. This evaluation was the basis by which we determined that revenue from these transactions would be recognized on a gross or a net basis.
In multiple-element revenue arrangements, each service performed and product delivered was considered a separate deliverable and qualified as a separate unit of accounting. For material multiple element arrangements, the Company allocated revenue based on vendor-specific objective evidence of fair value of the underlying services and products. In the absence of vendor-specific objective evidence, the Company would utilize third-party evidence to allocate the selling price. If neither vendor-specific objective evidence nor third-party evidence was available, the Company would estimate the selling price based on market price and company-specific factors.
Cost of Sales and Certain Other Costs
Cost of sales includes the invoice cost of the product, direct employee and third party cost of services, direct costs of packaging, inbound and outbound freight, and provisions for inventory obsolescence, adjusted for discounts, rebates, and other vendor allowances.
Cash and Cash Equivalents
The Company considers all highly liquid short-term investments with original maturities of 90 days or less to be cash equivalents. The carrying value of our cash equivalents approximates fair value. The majority of payments due from credit card processors and banks for third-party credit card and debit card transactions process within one to five business days. All credit card and debit card transactions that process in less than seven days are classified as cash and cash equivalents. Amounts due from banks for credit card transactions classified as cash equivalents totaled $5,553 and $2,651 at December 31, 2019 and 2018, respectively.
Accounts Receivable
The Company performs ongoing credit evaluations of its customers and adjusts credit limits based on payment history and customer creditworthiness. The Company maintains an allowance for estimated doubtful accounts based on its historical experience and the customer credit issues identified. The Company’s customers do not post collateral for open accounts receivable. The Company monitors collections regularly and adjusts the allowance for doubtful accounts as necessary to recognize any changes in credit exposure. Trade receivables are written off in the period in which they are deemed uncollectible. Recoveries of trade receivables previously charged are recorded when received.
Inventories
Inventories (all finished goods) consisting of software packages, computer systems, and peripheral equipment, are stated at cost (determined under a weighted-average cost method which approximates the first-in, first-out method) or net realizable value, whichever is lower. Inventory quantities on hand are reviewed regularly, and allowances are maintained for obsolete, slow moving, and nonsalable inventory.
F-8
Vendor Consideration
The Company receives funding from merchandise vendors for price protections, discounts, product rebates, and other programs. These allowances are treated as a reduction of the vendor’s prices and are recorded as adjustments to cost of sales. Allowances for product rebates that require certain volumes of product sales or purchases are recorded as the related milestones are probable of being met.
Advertising Costs and Vendor Consideration
Vendors have the ability to fund advertising activities for which the Company receives advertising consideration. This vendor consideration, to the extent that it represents specific reimbursements of incremental and identifiable costs, is offset against SG&A expenses. Advertising consideration that cannot be associated with a specific program or that exceeds the fair value of advertising expense associated with that program is classified as an offset to cost of sales. The Company’s vendor partners generally consolidate their funding of advertising and other marketing programs, and accordingly, the Company classifies substantially all vendor consideration as a reduction of cost of sales rather than a reduction of advertising expense. Other advertising costs are expensed as incurred. Advertising expense, which is classified as a component of SG&A expenses, totaled $19,407, $16,244, and $14,437, for the years ended December 31, 2019, 2018, and 2017, respectively.
Property and Equipment
Property and equipment are stated at cost, net of accumulated depreciation and amortization. Depreciation and amortization is provided for financial reporting purposes over the estimated useful lives of the assets ranging from three to seven years. Computer software, including licenses and internally developed software, is capitalized and amortized over lives generally ranging from three to seven years. Depreciation is recorded using the straight-line method. Leasehold improvements and facilities under capital leases are amortized over the terms of the related leases or their useful lives, whichever is shorter, whereas for income tax reporting purposes, they are amortized over the applicable tax lives.
Costs incurred to develop internal-use software during the application development stage are recorded in property and equipment at cost. External direct costs of materials and services consumed in developing or obtaining internal-use computer software and payroll-related costs for employees developing internal-use computer software projects, to the extent of their time spent directly on the project and specific to application development, are capitalized.
When events or circumstances indicate a potential impairment, the Company evaluates the carrying value of property and equipment based upon current and anticipated undiscounted cash flows. The Company recognizes impairment when it is probable that such estimated future cash flows will be less than the asset carrying value.
Goodwill and Other Intangible Assets
The Company’s intangible assets consist of (1) goodwill, which is not subject to amortization; (2) an internet domain name, which is an indefinite-lived intangible not subject to amortization; and (3) amortizing intangibles, which consist of customer lists, trade names, and customer relationships, which are being amortized over their useful lives.
Note 3 describes the annual impairment methodology that the Company uses each year in calculating the recoverability of goodwill and non-amortizing intangibles. This same impairment test is performed at other times during the course of a year should an event occur or circumstance change that would more likely than not reduce the fair value of a reporting unit below its carrying amount.
Recoverability of amortizing intangible assets is assessed only when events have occurred that may give rise to impairment. When a potential impairment has been identified, forecasted undiscounted net cash flows of the operations to which the asset relates are compared to the current carrying value of the long-lived assets present in that operation. If such cash flows are less than such carrying amounts, long-lived assets including such intangibles, are written down to their respective fair values.
F-9
Concentrations
Concentrations of credit risk with respect to trade account receivables are limited due to the large number of customers comprising the Company’s customer base. No single customer accounted for more than 4% of total net sales in 2019, 2018, and 2017. While no single agency of the federal government comprised more than 3% of total sales, aggregate sales to the federal government as a percentage of total net sales were 6.9%, 5.4%, and 7.8% in 2019, 2018, and 2017, respectively.
Product purchases from Ingram Micro, Inc. (“Ingram”), the Company’s largest supplier, and Synnex accounted for approximately 21% and 14%, respectively, of the Company’s total product purchases in 2019. No other vendor supplied more than 10% of the Company’s total product purchases in the year. In addition to these vendors, product purchases from other distributors, such as Dell, HP Inc. and Tech Data comprised a total of 59% of our product purchases in 2019. The Company believes that, while it may experience some short-term disruption if products from Ingram, Synnex, or any of its other large suppliers become unavailable to us, alternative sources for these products are available.
Products manufactured by Hewlett Packard Enterprise and HP Inc. collectively represented approximately 19% of the Company’s net sales in 2019, 18% in 2018 and 20% in 2017. We believe that in the event we experience either a short-term or permanent disruption of supply of HP products, such disruption would likely have a material adverse effect on the Company’s results of operations and cash flows.
Restructuring and other charges
Restructuring and other charges are presented separately from SG&A expenses. Costs incurred were as follows:
|
|
|
Year Ended December 31, |
|||||||
|
|
|
2019 |
|
2018 |
|
2017 |
|||
|
Employee separations |
|
$ |
553 |
|
$ |
967 |
|
$ |
640 |
|
Lease termination costs |
|
|
150 |
|
|
— |
|
|
— |
|
Relocation expenses |
|
|
— |
|
|
— |
|
|
84 |
|
Employee compensation |
|
|
— |
|
|
— |
|
|
2,800 |
|
Other |
|
|
— |
|
|
— |
|
|
112 |
|
Total restructuring and other charges |
|
$ |
703 |
|
$ |
967 |
|
$ |
3,636 |
The restructuring and other charges recorded in 2019 were related to a reduction in workforce in our Headquarters/Other group and included cash severance payments and other related benefits. These costs will be paid within a year of termination and any unpaid amounts are included in accrued expenses at December 31, 2019. Also included in net restructuring charges were exit costs incurred associated with the closing of one of our office facilities.
The restructuring and other charges recorded in 2018 were related to a reduction in workforce at our Business Solutions, Public Sector Solutions, and Headquarter segments and included cash severance payments and other related benefits.
The restructuring and other charges recorded in 2017 were primarily driven by a reduction in workforce at our Headquarters segment, along with costs related to the Softmart business, which was acquired in 2016, including expenses to retain certain key personnel brought over in the acquisition. Also in 2017, we incurred additional expense of $2,700 related to a one-time cash bonus paid to all non-executive employees at the end of the year.
F-10
Overall, restructuring and other charges consist primarily of employee termination benefits, which are accrued in the period incurred and paid within a year of termination. Included in accrued expenses at December 31, 2019, 2018, and 2017 were $110, $784, and $2, respectively, related to unpaid employee termination benefits. The amount accrued as of December 31, 2019 is expected to be paid in 2020.
Other restructuring-related charges such as acquisition costs, relocation expenses and significant marketing campaigns are expensed and paid as incurred.
All planned restructuring and other charges were incurred as of December 31, 2019 and we have no ongoing restructuring plans.
Earnings Per Share
Basic earnings per common share is computed using the weighted average number of shares outstanding. Diluted earnings per share is computed using the weighted average number of shares outstanding adjusted for the incremental shares attributable to nonvested stock units and stock options outstanding, if dilutive.
The following table sets forth the computation of basic and diluted earnings per share:
|
|
|
|
|
|
|
|
|
|
|
|
|
|
|
2019 |
|
2018 |
|
2017 |
|
|||
|
Numerator: |
|
|
|
|
|
|
|
|
|
|
|
Net income |
|
$ |
82,111 |
|
$ |
64,592 |
|
$ |
54,857 |
|
|
Denominator: |
|
|
|
|
|
|
|
|
|
|
|
Denominator for basic earnings per share |
26,335 |
26,717 |
26,771 |
|||||||
|
Dilutive effect of employee stock awards |
|
|
170 |
|
|
137 |
|
|
120 |
|
|
Denominator for diluted earnings per share |
|
|
26,505 |
|
|
26,854 |
|
|
26,891 |
|
|
Earnings per share: |
|
|
|
|
|
|
|
|
|
|
|
Basic |
|
$ |
3.12 |
|
$ |
2.42 |
|
$ |
2.05 |
|
|
Diluted |
|
$ |
3.10 |
|
$ |
2.41 |
|
$ |
2.04 |
|
For the years ended December 31, 2019, 2018, and 2017, the Company did not exclude any outstanding nonvested stock units or stock options from the computation of diluted earnings per share because including them would have had an anti-dilutive effect.
Other Income, Net
Other income, net for the year ended December 31, 2019 consisted of interest income of $810, which was partially offset by interest expense of $103.
Other income, net for the year ended December 31, 2018 consisted of $2,255 related to a gain, net of costs incurred of $745, that was realized upon execution of a favorable $3,000 cash resolution of a contract dispute that arose in 2017.
F-11
The Company included the $3,000 it was owed in other assets as of December 31, 2018. Also included in other income, net for the year ended December 31, 2018 was interest income of $868, offset partially by interest expense of $145.
Other income, net for the year ended December 31, 2017 consisted of interest income of $224, which was partially offset by interest expense of $126.
Comprehensive Income
The Company had no items of comprehensive income, other than its net income for each of the periods presented.
Adoption of Recently Issued Financial Accounting Standards
ASC 842
In February 2016, the Financial Accounting Standards Board, or the FASB, issued ASC 842 - Leases, which amended the accounting standards for leases. The core principle of the guidance is that an entity should establish a right-of-use (ROU) model that requires a lessee to record a ROU asset and a lease liability on the balance sheet for all leases with terms longer than twelve months.
The Company adopted ASC 842 effective January 1, 2019 using a modified retrospective transition approach to each lease that existed as of the adoption date and any leases entered into after that date. The Company elected the package of practical expedients which permits it to not reassess (1) whether any expired or existing contracts are or contain leases, (2) the lease classification of any expired or existing leases, and (3) any initial direct costs for any existing leases as of the effective date. The Company also elected the hindsight practical expedient, which allows it to use hindsight in determining the lease term. The adoption did not result in a cumulative adjustment to opening equity. The comparative information has not been restated and continues to be reported under the accounting standards in effect for those periods.
In assessing the impact of the adoption, the Company elected to apply the short-team lease exception to any leases with contractual obligations of one year or less. In accordance with the new accounting standard, these leases will not have a ROU asset and associated lease liability on the balance sheet. Instead, rent will be recognized on a straight-line basis over the term of the lease. Consequently, the adoption resulted in the capitalization of a number of the Company’s office leases as of January 1, 2019, for which it recognized a lease liability of $18,835, which was based on the present value of the future payments for these leases. The Company recorded a corresponding right-of-use asset of $18,723, which was adjusted for $114 of remaining unamortized lease incentives as of December 31, 2018. Only those components that were considered integral to the right to use an underlying asset were considered lease components when determining the amounts to capitalize. None of the nonlease components identified were capitalized and are instead expensed as incurred. In accordance with ASC 842, the discount rates used in the present value calculations for each lease should be the rates implicit in the lease, if readily available. Since none of the lease agreements contain an implicit rate that is readily available, the Company utilized estimated rates that it would have incurred to borrow, over a similar term, the funds necessary to purchase the respective leased asset with cash. The remaining contractual term for these leases as of January 1, 2019 ranged from 20 to 197 months. Options to renew were considered in determining the present value of the future lease payments in the event the Company believed it was reasonably certain it will assert its respective options to renew.
ASC 606
On May 28, 2014, the FASB issued ASC 606 – Revenue from Contracts with Customers, which amended the accounting standards for revenue recognition and expanded our disclosure requirements. The core principle of the guidance is that an entity should recognize revenue to depict the transfer of promised goods or services to customers in an amount that reflects the consideration to which the entity expects to be entitled in exchange for those goods or services.
F-12
On January 1, 2018 the Company adopted ASC 606 using the modified retrospective transition method, which resulted in an adjustment at January 1, 2018 to retained earnings for the cumulative effect of applying the standard to all contracts not completed as of the adoption date. Upon adoption we recorded $1,197 as an increase to retained earnings. The comparative information has not been restated and continues to be reported under the accounting standards in effect for those periods.
The adoption resulted in an acceleration of the timing of revenue recognized for certain transactions where product that remained in the Company’s possession has been recognized as of the transaction date when all revenue recognition criteria have been met.
The following table presents the effect of the adoption of ASC 606 on the Company’s consolidated balance sheets as of January 1, 2018:
|
|
|
|
|
Adjustments |
|
|
|
|
|
Balance at |
|
due to |
|
Balance at |
|
|
|
December 31, 2017 |
|
ASC 606 |
|
January 1, 2018 |
|
Balance Sheet |
|
|
|
|
|
|
|
Assets |
|
|
|
|
|
|
|
Accounts receivable, net |
$ |
449,682 |
$ |
14,568 |
$ |
464,250 |
|
Inventories |
|
106,753 |
|
(10,869) |
|
95,884 |
|
Prepaid expenses and other current assets |
|
5,737 |
|
(132) |
|
5,605 |
|
Long-term accounts receivable |
|
— |
|
1,890 |
|
1,890 |
|
Other assets |
|
5,638 |
|
(3,914) |
|
1,724 |
|
|
|
|
|
|
|
|
|
Liabilities |
|
|
|
|
|
|
|
Accounts payable |
|
194,257 |
|
(62) |
|
194,195 |
|
Accrued expenses and other liabilities |
|
31,096 |
|
(312) |
|
30,784 |
|
Accrued payroll |
|
22,662 |
|
291 |
|
22,953 |
|
Deferred income taxes |
|
15,696 |
|
429 |
|
16,125 |
|
|
|
|
|
|
|
|
|
Stockholders' Equity |
|
|
|
|
|
|
|
Retained earnings |
$ |
383,673 |
$ |
1,197 |
$ |
384,870 |
In addition to the timing of revenue recognition impacted by the above-described transactions, upon adoption of ASC 606, the amount of revenue to be recognized prospectively was affected by the presentation of revenue transactions as an agent instead of principal in certain transactions. Specifically, revenue related to the sale of cloud products, as well as certain security software, is now being recognized net of costs as the Company determined that it acts as an agent in these transactions. These sales are recorded on a net basis at a point in time when the Company’s vendor and the customer accept the terms and conditions in the sales arrangement. In addition, the Company sells third-party software maintenance that is delivered over time either separately or bundled with the software license. The Company has determined that software maintenance is a distinct performance obligation that it does not control, and accordingly, the Company acts as an agent in these transactions and recognizes the related revenue on a net basis under ASC 606. The Company previously recognized revenue for cloud products, security software, and software maintenance on a gross basis (i.e., acting as a principal). This change reduced both net sales and cost of sales with no impact on reported gross profit as compared to the Company’s prior accounting policies.
F-13
The following tables present the effect of the adoption of ASC 606 on the Company’s consolidated income statement and balance sheet for the year ended December 31, 2018 and as of December 31, 2018, respectively:
|
|
|
Year Ended December 31, 2018 |
||||
|
|
|
|
|
|
|
Balances without |
|
|
|
As |
|
|
|
Adoption of |
|
|
|
Reported |
|
Adjustments |
|
ASC 606 |
|
Income statement |
|
|
|
|
|
|
|
Revenues |
|
|
|
|
|
|
|
Net sales |
|
$ 2,699,489 |
|
$ 404,690 |
|
$ 3,104,179 |
|
|
|
|
|
|
|
|
|
Costs and expenses |
|
|
|
|
|
|
|
Cost of sales |
|
2,288,403 |
|
403,737 |
|
2,692,140 |
|
|
|
|
|
|
|
|
|
Income from operations |
|
85,686 |
|
750 |
|
86,436 |
|
Income before taxes |
|
88,664 |
|
750 |
|
89,414 |
|
Net income |
|
64,592 |
|
526 |
|
65,118 |
|
|
|
December 31, 2018 |
||||
|
|
|
|
|
|
|
Balances without |
|
|
|
As |
|
|
|
Adoption of |
|
|
|
Reported |
|
Adjustments |
|
ASC 606 |
|
Balance Sheet |
|
|
|
|
|
|
|
Assets |
|
|
|
|
|
|
|
Accounts receivable, net |
|
$ 447,698 |
|
$ (6,949) |
|
$ 440,749 |
|
Inventories |
|
119,195 |
|
4,798 |
|
123,993 |
|
Prepaid expenses and other current assets |
|
9,661 |
|
148 |
|
9,809 |
|
Other assets |
|
1,211 |
|
3,914 |
|
5,125 |
|
|
|
|
|
|
|
|
|
Liabilities |
|
|
|
|
|
|
|
Accrued expenses and other liabilities |
|
$ 33,840 |
|
$ 2,904 |
|
$ 36,744 |
|
Accrued payroll |
|
24,319 |
|
(116) |
|
24,203 |
|
Deferred income taxes |
|
17,184 |
|
(219) |
|
16,965 |
|
|
|
|
|
|
|
|
|
Stockholders' Equity |
|
|
|
|
|
|
|
Retained earnings |
|
$ 441,010 |
|
$ (657) |
|
$ 440,353 |
The Company has elected the use of certain practical expedients in its adoption of the new standard, which includes continuing to record revenue reported net of applicable taxes imposed on the related transaction and the application of the new standard to all arrangements not completed as of the adoption date. The Company has also elected to use the practical expedient to not account for the shipping and handling as separate performance obligations. Adoptions of the standard related to revenue recognition had no net impact on our consolidated statement of cash flows.
ASU 2016-09
In March 2016, the FASB issued ASU 2016-09, Improvements to Employee Share-Based Payment Accounting. The Company adopted this standard on January 1, 2017. The new standard simplifies several aspects of the accounting for employee share-based payment transactions, including the accounting for income taxes, forfeitures, and statutory tax withholding requirements, as well as classification in the statement of cash flows. Under this guidance, a company recognizes all excess tax benefits and tax deficiencies as income tax expense or benefit in the income statement. This change eliminates the notion of the additional paid-in capital pool and reduces the complexity in accounting for excess tax benefits and tax deficiencies. The primary impact of the adoption was the recognition of excess tax benefits related to equity compensation in the Company’s provision for income taxes rather than paid-in capital, which is a change required to be applied on a prospective basis in accordance with the new guidance. There were no unrecognized excess tax benefits at implementation. Accordingly, the Company recorded discrete income tax benefits in the consolidated
F-14
statements of income of $1,054 in the year ended December 31, 2017, for excess tax benefits related to equity compensation. The corresponding cash flows were reflected in cash provided by operating activities instead of financing activities, as was previously required. The Company adopted the cash flow presentation that requires presentation of excess tax benefits within operating activities on a prospective basis. Additionally, under ASU 2016-09, the Company has elected to continue to estimate equity award forfeitures expected to occur to determine the amount of compensation cost to be recognized in each period. Additional amendments to the accounting for income taxes and minimum statutory withholding tax requirements had no impact on the Company’s results of operations. The presentation requirements for cash flows related to employee taxes paid for withheld shares also had no impact to any of the periods presented in the Company’s consolidated statements of cash flows since such cash flows have historically been presented as a financing activity.
Recently Issued Financial Accounting Standards
In January 2017, the FASB issued ASU 2017-04, Simplifying the Test for Goodwill Impairment, which simplifies the accounting for goodwill impairments by eliminating step two from the goodwill impairment test. Instead, if the carrying amount of a reporting unit exceeds its fair value, an impairment loss shall be recognized in an amount equal to that excess, limited to the total amount of goodwill allocated to that reporting unit. ASU 2017-04 also clarifies the requirements for excluding and allocating foreign currency translation adjustments to reporting units related to an entity's testing of reporting units for goodwill impairment and clarifies that an entity should consider income tax effects from any tax-deductible goodwill on the carrying amount of the reporting unit when measuring the goodwill impairment loss, if applicable. The new standard is effective for fiscal years beginning January 1, 2020 for both interim and annual reporting periods. The Company expects to adopt this standard in the first quarter of 2020 and it does not expect the adoption to have a material impact on its consolidated financial statements.
In June 2016, the FASB issued ASU 2016-13, Financial Instruments—Credit Losses, which adds an impairment model for financial instruments, including trade receivables, that is based on expected losses rather than incurred losses. Under the new guidance, an entity recognizes as an allowance its estimate of lifetime expected losses, which is expected to result in more timely recognition of such losses. The new standard is effective for fiscal years beginning after December 15, 2019 for both interim and annual reporting periods. The Company has evaluated the requirements of this ASU and determined that the potential exposure is limited to the impact this standard may have on its trade receivables. The Company does not currently have any other financial instruments that would be affected by this standard. Customers are evaluated for their credit worthiness at the time of contract inception. Based on the results of the assessment, the Company will extend credit under its standard payment terms or may request alternative early payment actions. In addition, the Company analyzes its aged receivables for collectability at least quarterly, and if necessary, records a reserve against those receivable it determines may not be collectable. As such, the Company does not expect the adoption of this ASU to have a material impact on its consolidated financial statements.
2. REVENUE
Nature of Products and Services
Information technology (“IT”) products typically represent a distinct performance obligation, and revenue is recognized at the point in time when control is transferred to the customer which is generally upon delivery to the customer. The Company recognizes revenue as the principal in the transaction with the customer (i.e., on a gross basis), as it controls the product prior to delivery to the customer and derive the economic benefits from the sales transaction given the Company’s control over customer pricing.
The Company does not recognize revenue for goods that remain in its physical possession before the customer has the ability to direct the use of, and obtain substantially all of the remaining benefits from the products, the goods are ready for physical transfer to and identified as belonging to the customer, and when the Company has no ability to use the product or to direct it to another customer.
F-15
Licenses for on-premise software provide the customer with a right to take possession of the software. Customers may purchase perpetual licenses or enter into subscriptions to the licensed software. The Company is the principal in these transactions and recognizes revenue for the on-premise license at the point in time when the software is made available to the customer and the commencement of the term of the software license or when the renewal term begins, as applicable.
For certain on-premise licenses for security software, the customer derives substantially all of the benefit from these arrangements through the third-party delivered software maintenance, which provides software updates and other support services. The Company does not have control over the delivery of these performance obligations, and accordingly the Company is the agent in these transactions. The Company recognizes revenue for security software net of the related costs of sales at the point in time when its vendor and customer accept the terms and conditions in the sales arrangement. Cloud products allow customers to use hosted software over the contractual period without taking possession of the software and are provided on a subscription basis. The Company does not exercise control over these products or services and therefore is an agent in these transactions. The Company recognizes revenue for cloud products net of the related costs of sales at the point in time when its vendor and customer accept the terms and conditions in the sales arrangements.
Certain software sales include on-premise licenses that are combined with software maintenance. Software maintenance conveys rights to updates, bug fixes and help desk support, and other support services transferred over the underlying contract period. On-premise licenses are considered distinct performance obligations when sold with the software maintenance, as the Company sells these items separately. The Company recognizes revenue related to the software maintenance as the agent in these transactions because it do not have control over the on-going software maintenance service. Revenue allocated to software maintenance is recognized at the point in time when the Company’s vendor and customer accept the terms and conditions in the sales arrangements.
Certain of the Company’s larger customers are offered the opportunity by vendors to purchase software licenses and maintenance under enterprise agreements (“EAs”). Under EAs, customers are considered to be compliant with applicable license requirements for the ensuing year, regardless of changes to their employee base. Customers are charged an annual true-up fee for changes in the number of users over the year. With most EAs, the Company’s vendors will transfer the license and bill the customer directly, paying resellers, such as the Company, an agency fee or commission on these sales. The Company records these agency fees as a component of net sales as earned and there is no corresponding cost of sales amount. In certain instances, the Company invoices the customer directly under an EA and account for the individual items sold based on the nature of each item. The Company’s vendors typically dictate how the EA will be sold to the customer.
The Company also offers extended service plans (“ESP”) on IT products, both as part of the initial arrangement and separately from the IT products. The Company recognizes revenue related to ESP as the agent in the transaction because it does not have control over the on-going ESP service and does not provide any service after the sale. Revenue allocated to ESP is recognized at the point in time when the Company’s vendor and customer accept the terms and conditions in the sales arrangement.
The Company uses its own engineering personnel to assist in projects involving the design and installation of systems and networks, and also engages third-party service providers to perform warranty maintenance, implementations, asset disposal, and other services. Service revenue is recognized in general over time as the Company performs the underlying services and satisfies its performance obligations. The Company evaluates such engagements to determine whether it is the principal or the agent in each transaction. For those transactions in which we do not control the service, the Company acts as an agent and recognizes the transaction revenue on a net basis at a point in time when the vendor and customer accept the terms and conditions in the sales arrangement.
All amounts billed to a customer in a sales transaction related to shipping and handling, if any, represent revenues earned for the goods provided, and these amounts have been included in net sales. Costs related to shipping and handling billing are classified as cost of sales. Sales are reported net of sales, use, or other transaction taxes that are collected from customers and remitted to taxing authorities.
F-16
Significant Judgments
The Company’s contracts with customers often include promises to transfer multiple products or services to a customer. Determining whether the Company is the agent or the principal and whether products and services are considered distinct performance obligations that should be accounted for separately versus together may require significant judgment.
The Company estimates the standalone selling price (“SSP”) for each distinct performance obligation when a single arrangement contains multiple performance obligations and the fulfillment occurs at different points of times. The Company maximizes the use of observable inputs in the determination of the estimate for SSP for the items that it does not sell separately, including on-premise licenses sold with software maintenance, and IT products sold with ESP. In instances where SSP is not directly observable, such as when the Company does not sell the product or service separately, the Company determines the SSP using information that may include market conditions and other observable inputs.
The Company provides its customers with a limited thirty-day right of return, which is generally limited to defective merchandise, and gives rise to variable consideration. Revenue is recognized based on the most likely amount to which it is expected to be entitled. The estimated variable consideration is included in the transaction price to the extent it is probable that a significant reversal of cumulative revenue recognized will not occur once the uncertainty is resolved. The Company makes estimates of product returns based on significant historical experience. The Company records its sales return reserve as a reduction of revenues and either as reduction of accounts receivable or, for customers who have already paid, as accrued expenses and as a reduction of cost of sales and an associated right of return asset.
Description of Revenue
The Company disaggregates revenue from its arrangements with customers by type of products and services, as it believes this method best depicts how the nature, amount, timing, and uncertainty of revenue and cash flows are affected by economic factors.
The following tables represent a disaggregation of revenue from arrangements with customers for the twelve months ended December 31, 2019 and 2018, along with the reportable segment for each category.
|
|
|
Twelve Months Ended December 31, 2019 |
||||||||||
|
|
|
Business |
|
Enterprise |
|
Public Sector |
|
Total |
||||
|
Notebooks/Mobility |
|
$ |
317,282 |
|
$ |
322,530 |
|
|
166,132 |
|
$ |
805,944 |
|
Desktops |
|
|
127,373 |
|
|
154,602 |
|
|
63,949 |
|
|
345,924 |
|
Software |
|
|
146,287 |
|
|
133,584 |
|
|
54,956 |
|
|
334,827 |
|
Servers/Storage |
|
|
105,617 |
|
|
72,445 |
|
|
60,334 |
|
|
238,396 |
|
Net/Com Products |
|
|
94,340 |
|
|
72,185 |
|
|
52,776 |
|
|
219,301 |
|
Displays and Sound |
|
|
88,667 |
|
|
105,172 |
|
|
56,183 |
|
|
250,022 |
|
Accessories |
|
|
98,890 |
|
|
211,772 |
|
|
46,647 |
|
|
357,309 |
|
Other Hardware/Services |
|
|
81,593 |
|
|
121,530 |
|
|
65,188 |
|
|
268,311 |
|
Total net sales |
|
$ |
1,060,049 |
|
$ |
1,193,820 |
|
$ |
566,165 |
|
$ |
2,820,034 |
F-17
|
|
|
Twelve Months Ended December 31, 2018 |
||||||||||
|
|
|
Business |
|
Enterprise |
|
Public Sector |
|
Total |
||||
|
Notebooks/Mobility |
|
$ |
299,247 |
|
$ |
272,589 |
|
|
138,818 |
|
$ |
710,654 |
|
Desktops |
|
|
108,096 |
|
|
126,643 |
|
|
53,569 |
|
|
288,308 |
|
Software |
|
|
134,071 |
|
|
135,420 |
|
|
45,365 |
|
|
314,856 |
|
Servers/Storage |
|
|
111,559 |
|
|
102,209 |
|
|
59,653 |
|
|
273,421 |
|
Net/Com Products |
|
|
109,702 |
|
|
62,060 |
|
|
52,287 |
|
|
224,049 |
|
Displays and Sound |
|
|
89,779 |
|
|
109,497 |
|
|
52,760 |
|
|
252,036 |
|
Accessories |
|
|
95,342 |
|
|
214,102 |
|
|
43,696 |
|
|
353,140 |
|
Other Hardware/Services |
|
|
80,122 |
|
|
142,622 |
|
|
60,281 |
|
|
283,025 |
|
Total net sales |
|
$ |
1,027,918 |
|
$ |
1,165,142 |
|
$ |
506,429 |
|
$ |
2,699,489 |
Contract Balances
The following table provides information about contract liabilities from arrangements with customers as of December 31, 2019 and December 31, 2018:
|
|
|
December 31, 2019 |
|
December 31, 2018 |
||
|
Contract liabilities, which are included in "Accrued expenses and other liabilities" |
|
$ |
5,942 |
|
$ |
2,679 |
Significant changes in the contract liability balances during the years ended December 31, 2019 and 2018 are as follows (in thousands):
|
|
|
2018 |
|
|
Balances at December 31, 2017 |
|
$ |
2,914 |
|
Cash received in advance and not recognized as revenue |
|
|
16,279 |
|
Amounts recognized as revenue as performance obligations satisfied |
|
|
(16,514) |
|
Balances at December 31, 2018 |
|
$ |
2,679 |
|
|
|
|
|
|
|
|
2019 |
|
|
Balances at December 31, 2018 |
|
$ |
2,679 |
|
Cash received in advance and not recognized as revenue |
|
|
15,835 |
|
Amounts recognized as revenue as performance obligations satisfied |
|
|
(12,572) |
|
Balances at December 31, 2019 |
|
$ |
5,942 |
k
3. GOODWILL AND OTHER INTANGIBLE ASSETS
Goodwill
Goodwill and intangible assets with indefinite lives are subject to an annual impairment test as of November 30 and tested more frequently if events or circumstances occur that would indicate a potential decline in fair value. For 2018 and 2017, using both income and market valuation approaches, the Company has performed a two-step quantitative test to compare the fair value of its reporting units with their respective carrying values, including goodwill. If the fair values were determined to be less than the carrying values, the second step would be performed to measure the amounts, if any, of the impairment.
For 2019, the Company performed a qualitative “Step 0” analysis. ASC 350—Intangible – Goodwill and Other states that an entity may assess qualitative factors to determine whether it is more likely than not that the fair value of a reporting unit is less than its carrying amount, including goodwill. This analysis allows the Company to consider qualitative factors that might impact the carrying amount of its goodwill to determine whether a more detailed
F-18
quantitative analysis would be necessary. Factors considered when performing the “Step 0” impairment assessment included the Company’s performance relative to historical and projected future operating results, macroeconomic conditions, industry and market trends, cost factors that may have a negative impact on earnings and cash flows, changes in the Company’s stock price and market capitalization, and other relevant entity-specific events. Based on the analysis, there were no indications that an impairment was more than likely to exist.
Goodwill is held by the Company’s Large Account and SMB segments. The Company concluded that the fair values of the domain name and the two reporting units each exceeded the respective carrying values, and accordingly, an impairment was not identified in the annual test. The Company also did not identify any events or circumstances that would indicate that it is more likely than not that the carrying values of the reporting units or the domain name were in excess of the respective fair values during the year ended December 31, 2019.
The carrying amount of goodwill for the periods presented is detailed below:
|
Balance at December 31, 2018 |
|
SMB |
|
Large Account |
|
Public Sector |
|
Total |
|
||||
|
Goodwill, gross |
|
$ |
8,539 |
|
$ |
66,236 |
|
$ |
7,634 |
|
$ |
82,409 |
|
|
Accumulated impairment losses |
|
|
(1,173) |
|
|
─ |
|
|
(7,634) |
|
|
(8,807) |
|
|
Net balance |
|
$ |
7,366 |
|
$ |
66,236 |
|
$ |
— |
|
$ |
73,602 |
|
|
|
|
|
|
|
|
|
|
|
|
|
|
|
|
|
Balance at December 31, 2019 |
|
SMB |
|
Large Account |
|
Public Sector |
|
Total |
|
||||
|
Goodwill, gross |
|
$ |
8,539 |
|
$ |
66,236 |
|
$ |
7,634 |
|
$ |
82,409 |
|
|
Accumulated impairment losses |
|
|
(1,173) |
|
|
─ |
|
|
(7,634) |
|
|
(8,807) |
|
|
Net balance |
$ |
7,366 |
$ |
66,236 |
$ |
— |
$ |
73,602 |
|||||
Intangible Assets
At December 31, 2019, the Company’s intangible assets included a domain name for $450, which has an indefinite life and is not subject to amortization. In addition, in 2016 the Company acquired customer relationships from its Softmart and GlobalServe acquisitions, which will be amortized on a straight-line basis over their estimated useful lives of 10 years. The Company’s remaining intangible assets are amortized in proportion to the estimates of the future cash flows underlying the valuation of the assets. Intangible assets and related accumulated amortization are detailed below:
|
|
|
|
|
December 31, 2019 |
|
December 31, 2018 |
|
||||||||||||||
|
|
|
Estimated |
|
Gross |
|
Accumulated |
|
Net |
|
Gross |
|
Accumulated |
|
Net |
|
||||||
|
|
|
Useful Lives |
|
Amount |
|
Amortization |
|
Amount |
|
Amount |
|
Amortization |
|
Amount |
|
||||||
|
Customer list |
|
8 |
|
$ |
3,400 |
|
$ |
3,400 |
|
$ |
— |
|
$ |
3,400 |
|
$ |
3,364 |
|
$ |
36 |
|
|
Tradename |
|
5 |
|
|
1,190 |
|
|
1,190 |
|
|
— |
|
|
1,190 |
|
|
1,190 |
|
|
— |
|
|
Customer relationships |
|
10 |
|
|
12,200 |
|
|
4,343 |
|
|
7,857 |
|
|
12,200 |
|
|
3,122 |
|
|
9,078 |
|
|
Total intangible assets |
|
|
|
$ |
16,790 |
|
$ |
8,933 |
|
$ |
7,857 |
|
$ |
16,790 |
|
$ |
7,676 |
|
$ |
9,114 |
|
In 2019, 2018, and 2017, the Company recorded amortization expense of $1,257, $1,461, and $1,561, respectively. The estimated amortization expense relating to intangible assets in each of the five succeeding years and thereafter is as follows:
|
For the Years Ended December 31, |
|
|
|
|
|
2020 |
|
$ |
1,220 |
|
|
2021 |
|
|
1,220 |
|
|
2022 |
|
|
1,220 |
|
|
2023 |
|
|
1,220 |
|
|
2024 |
|
|
1,220 |
|
|
2025 and thereafter |
|
|
1,757 |
|
|
|
|
$ |
7,857 |
|
F-19
4. ACCOUNTS RECEIVABLE
Accounts receivable consisted of the following:
|
|
|
December 31, |
|
||||
|
|
|
2019 |
|
2018 |
|
||
|
Trade |
|
$ |
498,721 |
|
$ |
401,530 |
|
|
Vendor consideration, returns and other |
|
|
56,459 |
|
|
52,560 |
|
|
Due from employees |
|
|
114 |
|
|
107 |
|
|
Total gross accounts receivable |
|
|
555,294 |
|
|
454,197 |
|
|
Allowances for: |
|
|
|
|
|
|
|
|
Sales returns |
|
|
(3,466) |
|
|
(3,397) |
|
|
Doubtful accounts |
|
|
(2,202) |
|
|
(3,102) |
|
|
Accounts receivable, net |
|
$ |
549,626 |
|
$ |
447,698 |
|
5. PROPERTY AND EQUIPMENT
Property and equipment consisted of the following:
|
|
|
December 31, |
|
||||
|
|
|
2019 |
|
2018 |
|
||
|
Computer software, including licenses and internally-developed software |
|
$ |
95,214 |
|
$ |
75,528 |
|
|
Furniture and equipment |
|
|
36,098 |
|
|
36,147 |
|
|
Leasehold improvements |
|
|
8,516 |
|
|
8,102 |
|
|
Total |
|
|
139,828 |
|
|
119,777 |
|
|
Accumulated depreciation and amortization |
|
|
(75,602) |
|
|
(67,978) |
|
|
Property and equipment, net |
|
$ |
64,226 |
|
$ |
51,799 |
|
We recorded depreciation and amortization expense for property and equipment of $12,057, $12,602, and $10,278 in 2019, 2018, and 2017, respectively.
6. LEASES
The Company leases certain facilities from a related party, which is affiliated with the Company through common ownership. Included in the right-of-use asset as of December 31, 2019 was $4,689 and a corresponding lease liability of
F-20
$4,689 associated with related party leases. As of December 31, 2019, the Company had no leases that were classified as financing leases and there were no additional operating or financing leases that have not yet commenced.
|
|
Twelve months ended December 31, 2019 |
|||||||
|
|
Related Parties |
|
Others |
|
Total |
|||
|
Lease Cost |
|
|
|
|
|
|
|
|
|
Capitalized operating lease cost |
$ |
1,516 |
|
$ |
3,173 |
|
$ |
4,689 |
|
Short-term lease cost |
|
163 |
|
|
7 |
|
|
170 |
|
Total lease cost |
$ |
1,679 |
|
$ |
3,180 |
|
$ |
4,859 |
|
|
|
|
|
|
|
|
|
|
|
Other Information |
|
|
|
|
|
|
|
|
|
Cash paid for amounts included in the measurement of lease liabilities and capitalized operating leases: |
|
|
|
|
|
|
|
|
|
Operating cash flows |
$ |
1,516 |
|
$ |
3,420 |
|
$ |
4,936 |
|
|
|
|
|
|
|
|
|
|
|
Weighted-average remaining lease term (in years): |
|
|
|
|
|
|
|
|
|
Capitalized operating leases |
|
3.88 |
|
|
6.54 |
|
|
5.69 |
|
|
|
|
|
|
|
|
|
|
|
Weighted-average discount rate: |
|
|
|
|
|
|
|
|
|
Capitalized operating leases |
|
3.92% |
|
|
3.92% |
|
|
3.92% |
As of December 31, 2019, future lease payments over the remaining term of capitalized operating leases were as follows:
|
For the Years Ended December 31, |
|
|
Related Parties |
|
|
Others |
|
|
Total |
|
2020 |
|
$ |
1,385 |
|
$ |
3,382 |
|
$ |
4,767 |
|
2021 |
|
|
1,253 |
|
|
2,482 |
|
|
3,735 |
|
2022 |
|
|
1,253 |
|
|
1,484 |
|
|
2,737 |
|
2023 |
|
|
1,149 |
|
|
1,034 |
|
|
2,183 |
|
2024 |
|
|
— |
|
|
1,043 |
|
|
1,043 |
|
2025 |
|
|
— |
|
|
876 |
|
|
876 |
|
Thereafter |
|
|
— |
|
|
584 |
|
|
584 |
|
|
|
$ |
5,040 |
|
$ |
10,885 |
|
$ |
15,925 |
|
|
|
|
|
|
|
|
|
|
|
|
Imputed interest |
|
|
|
|
|
|
|
|
(1,279) |
|
Lease liability balance at December 31, 2019 |
|
|
|
|
|
|
|
$ |
14,646 |
As of December 31, 2019, the ROU asset had a balance of $13,842. The long-term lease liability was $10,330 and the short-term lease liability, which is included in accrued expenses and other liabilities in the consolidated balance sheets, was $4,316.
Future aggregate minimum annual lease payments as of December 31, 2018 reported in our 2018 Form 10-K under the previous lease accounting standard were as follows:
|
For the Years Ended December 31, |
|
|
Related Parties |
|
|
Others |
|
|
Total |
|
2020 |
|
$ |
1,407 |
|
$ |
3,386 |
|
$ |
4,793 |
|
2021 |
|
|
1,253 |
|
|
2,466 |
|
|
3,719 |
|
2022 |
|
|
1,253 |
|
|
1,490 |
|
|
2,743 |
|
2023 |
|
|
1,149 |
|
|
820 |
|
|
1,969 |
|
2024 and thereafter |
|
|
— |
|
|
1,395 |
|
|
1,395 |
|
|
|
$ |
5,062 |
|
$ |
9,557 |
|
$ |
14,619 |
F-21
7. ACCRUED EXPENSES AND OTHER LIABILITIES
Accrued expenses and other liabilities consisted of the following:
|
|
|
December 31, |
||||
|
|
|
2019 |
|
2018 |
||
|
Customer and vendor deposits |
|
$ |
13,871 |
|
$ |
8,880 |
|
Dividends payable |
|
|
8,427 |
|
|
8,453 |
|
Sales taxes |
|
|
9,374 |
|
|
7,632 |
|
Short-term lease liability |
|
|
4,316 |
|
|
— |
|
Other |
|
|
9,244 |
|
|
8,875 |
|
Accrued expenses and other liabilities |
|
$ |
45,232 |
|
$ |
33,840 |
8. BANK BORROWINGS
The Company has a $50,000 credit facility collateralized by its account receivables that expires February 10, 2022. This facility can be increased, at the Company’s option, to $80,000 for permitted acquisitions or other uses authorized by the lender on substantially the same terms. Amounts outstanding under this facility bear interest at the one-month London Interbank Offered Rate (“LIBOR”) (1.76% at December 31, 2019) , plus a spread based on our funded debt ratio, or in the absence of LIBOR, the prime rate (4.75% at December 31, 2019). The credit facility includes various customary financial ratios and operating covenants, including minimum net worth and maximum funded debt ratio requirements, and default acceleration provisions. The credit facility does not include restrictions on future dividend payments. Funded debt ratio is the ratio of average outstanding advances under the credit facility to Adjusted EBITDA (Earnings Before Interest Expense, Taxes, Depreciation, Amortization, and Special Charges). The maximum allowable funded debt ratio under the agreement is 2.0 to 1.0. Decreases in the Company’s consolidated Adjusted EBITDA could limit its potential borrowing capacity under the credit facility. The Company had no outstanding bank borrowings at December 31, 2019 or 2018, and accordingly, the entire $50,000 facility was available for borrowings under the credit facility.
9. STOCKHOLDERS’ EQUITY AND SHARE-BASED COMPENSATION
Preferred Stock
The Company’s Amended and Restated Certificate of Incorporation (the “Restated Certificate”) authorizes the issuance of up to 10,000 shares of preferred stock, $.01 par value per share (the “Preferred Stock”). Under the terms of the Restated Certificate, the Board is authorized, subject to any limitations prescribed by law, without stockholder approval, to issue by a unanimous vote such shares of Preferred Stock in one or more series. Each such series of Preferred Stock shall have such rights, preferences, privileges, and restrictions, including voting rights, dividend rights, redemption privileges, and liquidation preferences, as shall be determined by the Board. There were no preferred shares outstanding at December 31, 2019 or 2018.
Share Repurchase Authorization
On December 17, 2018, the Company’s Board approved a new share repurchase program authorizing up to $25,000 in additional share repurchases. There is no fixed termination date for this repurchase program. Purchases may be made in open-market transactions, block transactions on or off an exchange, or in privately negotiated transactions. The timing and amount of any share repurchases will be based on market conditions and other factors.
In 2019, the Company repurchased 135 shares for $4,478 under Board-authorized repurchase programs. As of December 31, 2019, the Company has repurchased an aggregate of 2,351 shares for $32,086 under Board-authorized repurchase programs, and the maximum approximate dollar value of shares that may yet be purchased under the Company’s existing Board-authorized program is $22,914.
F-22
Dividend Payments
The following table summarizes the Company’s special cash dividends declared in the three years ended December 31, 2019:
|
|
|
2019 |
|
2018 |
|
2017 |
|
|||
|
Dividend per share |
|
$ |
0.32 |
|
$ |
0.32 |
|
$ |
0.34 |
|
|
Stockholder record date |
|
|
12/27/2019 |
|
|
12/28/2018 |
|
|
12/29/2017 |
|
|
Total dividend |
|
$ |
8,427 |
|
$ |
8,452 |
|
$ |
9,122 |
|
|
Payment date |
|
|
1/10/2020 |
|
|
1/11/2019 |
|
|
1/12/2018 |
|
The dividends paid in January 2020, 2019 and 2018 were included in accrued expenses and other liabilities at December 31, 2019, 2018 and 2017, respectively. The Company has no current plans to pay additional cash dividends on its common stock in the foreseeable future, and declaration of any future cash dividends will depend upon the Company’s financial position, strategic plans, and general business conditions.
Equity Compensation Plan Descriptions
In 2007, the Board adopted and the Company’s stockholders approved the 2007 Stock Incentive Plan. In 2010, the Board adopted and the stockholders approved the Amended and Restated 2007 Stock Incentive Plan (the “2007 Plan”), which, among other things, extended the term of the 2007 Plan to 2020. In May 2019, the Company’s stockholders approved an amendment to the 2007 Plan, which authorized the issuance of 1,900 shares of common stock. Under the terms of the 2007 Plan, the Company is authorized, for a ten-year period, to grant options, stock appreciation rights, nonvested stock, nonvested stock units, and other stock-based awards to employees, officers, directors, and consultants. As of December 31, 2019, there were 85 shares eligible for future grants under the 2007 Plan.
1997 Employee Stock Purchase Plan
In November 1997, the Board adopted and the Company’s stockholders approved the 1997 Employee Stock Purchase Plan (the “Purchase Plan”). The Purchase Plan authorizes the issuance of common stock to participating employees. Under the Purchase Plan, as amended, employees are eligible to purchase company stock at 95% of the purchase price as of the last business day of each six-month offering period. An aggregate of 1,203 shares of common stock has been reserved for issuance under the Purchase Plan, of which 1,188 shares have been purchased.
Accounting for Share-Based Compensation
The Company measures the grant date fair value of equity awards given to employees and recognize that cost, adjusted for forfeitures, over the period that services are performed. The Company values grants with multiple vesting periods as a single award, estimate expected forfeitures based upon historical patterns of employee turnover, and record share-based compensation as a component of SG&A expenses. In 2018 and in 2019, the Company granted nonvested stock units. No equity awards were granted in 2017.
The following table summarizes the components of share-based compensation recorded as expense for the three years ended December 31, 2019:
|
|
|
2019 |
|
2018 |
|
2017 |
|
|||
|
Pre-tax expense for nonvested units |
|
$ |
1,863 |
|
$ |
1,080 |
|
$ |
741 |
|
|
Tax benefit |
|
|
(505) |
|
|
(293) |
|
|
(297) |
|
|
Net effect on net income |
|
$ |
1,358 |
|
$ |
787 |
|
$ |
444 |
|
In 2018 and in 2019, the Company issued nonvested stock units that settle in stock and vest over periods up to ten years. No awards were issued in 2017. Recipients of nonvested stock units do not possess stockholder rights. The fair
F-23
value of nonvested stock units is based on the end of day market value of our common stock on the grant date. The following table summarizes our nonvested stock unit activity in 2019:
|
|
|
Nonvested Stock Units |
|
|||
|
|
|
|
|
Weighted-Average |
|
|
|
|
|
|
|
Grant Date |
|
|
|
|
|
Shares |
Fair Value |
|
||
|
Nonvested at January 1, 2019 |
|
423 |
|
$ |
23.16 |
|
|
Granted |
|
153 |
|
|
42.06 |
|
|
Vested |
|
(73) |
|
|
21.73 |
|
|
Canceled |
|
(30) |
|
|
27.71 |
|
|
Nonvested at December 31, 2019 |
|
473 |
|
|
29.20 |
|
The weighted-average grant-date fair value of nonvested stock units granted in 2019 and 2018 was $42.06 and $24.90, respectively. No awards were granted in 2017. The total fair value of nonvested stock units that vested in 2019, 2018, and 2017 was $3,476, $1,635, and $1,638, respectively. Unearned compensation cost related to the nonvested portion of outstanding nonvested stock units was $12,379 as of December 31, 2019, and is expected to be recognized over a weighted-average period of approximately 5.6 years. The aggregate intrinsic value of the nonvested stock units at December 31, 2019, which is calculated based on the positive difference between the fair value of the Company’s stock on December 31, 2019 and the grant price of the underlying awards, was $23,489.
Stock Equivalent Units
The Company has also issued stock equivalent units, (“SEUs”), which settle in cash and vest ratably over four years, to non-executive employees. The fair value of these liability awards is based on the closing market price of the Company’s common stock, and is remeasured at the end of each reporting period until the SEUs vest. The Company reports the compensation as a component of SG&A expense and the related liability as accrued payroll on the consolidated balance sheets.
|
|
|
2019 |
|
2018 |
|
2017 |
|
|||
|
Units issued |
|
|
— |
|
|
— |
|
|
100 |
|
|
Compensation expense |
|
$ |
1,802 |
|
$ |
1,871 |
|
$ |
1,429 |
|
10. INCOME TAXES
The provision for income taxes consisted of the following:
|
|
|
Years Ended December 31, |
|
|||||||
|
|
|
2019 |
|
2018 |
|
2017 |
|
|||
|
Current: |
|
|
|
|
|
|
|
|
|
|
|
Federal |
|
$ |
20,481 |
|
$ |
16,643 |
|
$ |
21,813 |
|
|
State |
|
|
7,101 |
|
|
6,370 |
|
|
4,861 |
|
|
Total current |
|
|
27,582 |
|
|
23,013 |
|
|
26,674 |
|
|
Deferred: |
|
|
|
|
|
|
|
|
|
|
|
Federal |
|
|
2,186 |
|
|
1,087 |
|
|
(5,132) |
|
|
State |
|
|
800 |
|
|
(28) |
|
|
1,226 |
|
|
Total deferred |
2,986 |
1,059 |
(3,906) |
|||||||
|
Net provision |
|
$ |
30,568 |
|
$ |
24,072 |
|
$ |
22,768 |
|
F-24
The components of the deferred taxes at December 31, 2019 and 2018 are as follows:
|
|
|
2019 |
|
2018 |
|
||
|
Deferred tax assets: |
|
|
|
|
|
|
|
|
Provisions for doubtful accounts |
|
$ |
581 |
|
$ |
825 |
|
|
Inventory costs capitalized for tax purposes |
|
|
134 |
|
|
112 |
|
|
Inventory valuation reserves |
|
|
253 |
|
|
280 |
|
|
Sales return reserves |
|
|
134 |
|
|
132 |
|
|
Deductible expenses, primarily employee-benefit related |
|
|
177 |
|
|
319 |
|
|
Accrued compensation |
|
|
2,448 |
|
|
2,014 |
|
|
Operating lease liability |
|
|
3,858 |
|
|
— |
|
|
Other |
|
|
1,503 |
|
|
1,254 |
|
|
Compensation under non-statutory stock option agreements |
|
|
143 |
|
|
82 |
|
|
State tax loss carryforwards |
|
|
1,091 |
|
|
958 |
|
|
Federal benefit for uncertain state tax positions |
|
|
— |
|
|
177 |
|
|
Total gross deferred tax assets |
|
|
10,322 |
|
|
6,153 |
|
|
Less: Valuation allowance |
|
|
(992) |
|
|
(839) |
|
|
Net deferred tax assets |
|
|
9,330 |
|
|
5,314 |
|
|
|
|
|
|
|
|
|
|
|
Deferred tax liabilities: |
|
|
|
|
|
|
|
|
Goodwill and other intangibles |
|
|
(13,287) |
|
|
(12,850) |
|
|
Property and equipment |
|
|
(12,482) |
|
|
(9,548) |
|
|
Right-of-use assets |
|
|
(3,647) |
|
|
— |
|
|
Prepaid expenses |
|
|
(84) |
|
|
(100) |
|
|
Total gross deferred tax liabilities |
|
|
(29,500) |
|
|
(22,498) |
|
|
Net deferred tax liability |
|
$ |
(20,170) |
|
$ |
(17,184) |
|
|
|
|
|
|
|
|
|
|
|
|
|
|
|
|
|
|
|
|
Current deferred tax assets |
|
$ |
— |
|
$ |
— |
|
|
Noncurrent deferred tax liability |
|
|
(20,170) |
|
|
(17,184) |
|
|
Net deferred tax liability |
|
$ |
(20,170) |
|
$ |
(17,184) |
|
The Company has deferred tax assets from state net operating loss carryforwards aggregating $1,381 at December 31, 2019 representing state tax benefits, net of federal taxes, of approximately $1,091. These loss carryforwards are subject to between five, fifteen, and twenty-year carryforward periods, with $4 expiring after 2020, $3 expiring after 2021, $3 expiring after 2022, $3 expiring after 2023, $3 expiring after 2024, $1,292 expiring beyond 2024, and $73 with no expiration. The Company has provided valuation allowances of $992 and $839 at December 31, 2019 and 2018, respectively, against the state tax loss carryforwards, representing the portion of carryforward losses that the Company believes are not likely to be realized. The net change in the total valuation allowance reflects a $153, $94, and $260 increase in 2019, 2018, and 2017, respectively. The valuation allowance was increased in 2019, 2018, and 2017 to offset the corresponding increase to the deferred tax asset associated with state net operating loss carryforwards.
A reconciliation of the Company’s 2019, 2018, and 2017 income tax provision to total income taxes at the statutory federal tax rate is as follows:
|
|
|
2019 |
|
2018 |
|
2017 |
|
|||
|
Federal income taxes, at statutory tax rate |
|
$ |
23,663 |
|
$ |
18,619 |
|
$ |
27,169 |
|
|
State income taxes, net of federal benefit |
|
|
6,977 |
|
|
5,157 |
|
|
3,843 |
|
|
Nondeductible expenses |
|
|
651 |
|
|
454 |
|
|
(113) |
|
|
Remeasurement of net deferred tax balances |
|
|
— |
|
|
— |
|
|
(7,815) |
|
|
Other, net |
|
|
(723) |
|
|
(158) |
|
|
(316) |
|
|
Income tax provision |
|
$ |
30,568 |
|
$ |
24,072 |
|
$ |
22,768 |
|
F-25
On December 22, 2017, the U.S. government enacted comprehensive tax legislation (the “Tax Act”), which significantly revises the ongoing U.S. corporate income tax law by lowering the U.S. federal corporate income tax rate from 35.0% to 21.0%, and setting limitations on deductibility of certain costs. This rate reduction, which took effect on January 1, 2018, required the revaluation of the Company’s net deferred tax liability. The revaluation resulted in the recording of an income tax benefit of $7.7 million for the fourth quarter of 2017.
The Company files one consolidated U.S. Federal income tax return that includes all of its subsidiaries as well as several consolidated, combined, and separate company returns in many U.S. state tax jurisdictions. The tax years 2015-2018 remain open to examination by the major state taxing jurisdictions in which the Company files. The tax years 2016-2018 remain open to examination by the Internal Revenue Service.
A reconciliation of unrecognized tax benefits for 2019, 2018, and 2017, is as follows:
|
|
|
2019 |
|
2018 |
|
2017 |
|
|||
|
Balance at January 1, |
|
$ |
368 |
|
$ |
368 |
|
$ |
684 |
|
|
Additions on tax positions of prior years |
|
|
— |
|
|
— |
|
|
— |
|
|
Lapses of applicable statute of limitations |
|
|
(368) |
|
|
— |
|
|
(159) |
|
|
Settlements |
|
|
— |
|
|
— |
|
|
(157) |
|
|
Balance at December 31, |
|
$ |
— |
|
$ |
368 |
|
$ |
368 |
|
The unrecognized tax benefits decreased by $368 related to the expiration of various state statute of limitation periods.
Previously, the Company recognized interest and penalties related to unrecognized income tax benefits as a component of income tax expense, and the corresponding accrual was included as a component of our liability for unrecognized income tax benefits. At December 31, 2018 and 2017, accrued interest aggregated $481 and accrued penalties aggregated $93. The Company did not recognize any interest and penalties during the years ended December 31, 2019, 2018 or 2017.
11. EMPLOYEE BENEFIT PLAN
The Company has a contributory profit-sharing and employee savings plan covering all qualified employees. No contributions to the profit-sharing element of the plan were made by the Company in 2019, 2018, or 2017. The Company made matching contributions to the employee savings element of such plan of $2,778, $2,538, and $2,396 in 2019, 2018, and 2017, respectively.
12. COMMITMENTS AND CONTINGENCIES
Contingencies
The Company is subject to various legal proceedings and claims, including patent infringement claims, which have arisen during the ordinary course of business. In the opinion of management, the outcome of such matters is not expected to have a material effect on our business, financial position, results of operations, or cash flows.
The Company records a liability when its believes that a loss is both probable and reasonably estimable. On a quarterly basis, the Company reviews each of these legal proceedings to determine whether it is probable, reasonably possible, or remote that a liability has been incurred and, if it is at least reasonably possible, whether a range of loss can be reasonably estimated. Significant judgment is required to determine both the likelihood of there being a loss and the estimated amount of such loss. Until the final resolution of such matters, there may be an exposure to loss in excess of the amount recorded, and such amounts could be material. The Company expenses legal fees in the period in which they are incurred.
F-26
The Company is subject to audits by states on sales and income taxes, employment matters, and other assessments. Additional liabilities for these and other audits could be assessed, and such outcomes could have a material negative impact on our financial position, results of operations, and cash flows.
13. SEGMENT AND RELATED DISCLOSURES
The internal reporting structure used by the Company’s chief operating decision maker (“CODM”) to assess performance and allocate resources determines the basis for our reportable operating segments. The Company’s CODM is its Chief Executive Officer, and he evaluates operations and allocates resources based on a measure of operating income.
The Company’s operations are organized under three reporting segments—the Business Solutions segment, which serves primarily small- and medium-sized businesses; the Enterprise Solutions segment, which serves primarily medium-to-large corporations; and the Public Sector Solutions segment, which serves primarily federal, state, and local government and educational institutions. In addition, the Headquarters/Other group provides services in areas such as finance, human resources, information technology, marketing, and product management. Most of the operating costs associated with the Headquarters/Other group functions are charged to the operating segments based on their estimated usage of the underlying functions. The Company reports these charges to the operating segments as “Allocations.” Certain headquarters costs relating to executive oversight and other fiduciary functions that are not allocated to the operating segments are included under the heading of Headquarters/Other in the tables below.
F-27
Net sales presented below exclude inter-segment product revenues. Segment information applicable to the Company’s reportable operating segments for the years ended December 31, 2019, 2018, and 2017 is shown below:
|
|
|
Years Ended December 31, |
|
|||||||
|
|
|
|
|
|
|
|
|
|
|
|
|
|
|
2019 |
|
2018 |
|
2017 |
|
|||
|
Net sales: |
|
|
|
|
|
|
|
|
|
|
|
Business Solutions |
|
$ |
1,060,049 |
|
$ |
1,027,918 |
|
$ |
1,158,639 |
|
|
Enterprise Solutions |
|
|
1,193,820 |
|
|
1,165,142 |
|
|
1,131,823 |
|
|
Public Sector Solutions |
|
|
566,165 |
|
|
506,429 |
|
|
621,421 |
|
|
Total net sales |
|
$ |
2,820,034 |
|
$ |
2,699,489 |
|
$ |
2,911,883 |
|
|
Operating income (loss): |
|
|
|
|
|
|
|
|
|
|
|
Business Solutions |
|
$ |
52,557 |
|
$ |
40,188 |
|
$ |
40,425 |
|
|
Enterprise Solutions |
|
|
67,837 |
|
|
61,663 |
|
|
50,163 |
|
|
Public Sector Solutions |
|
|
7,319 |
|
|
(2,260) |
|
|
953 |
|
|
Headquarters/Other |
|
|
(15,741) |
|
|
(13,905) |
|
|
(14,014) |
|
|
Total operating income |
|
|
111,972 |
|
|
85,686 |
|
|
77,527 |
|
|
Other income, net |
|
|
707 |
|
|
2,978 |
|
|
98 |
|
|
Income before taxes |
|
$ |
112,679 |
|
$ |
88,664 |
|
$ |
77,625 |
|
|
Selected operating expense: |
|
|
|
|
|
|
|
|
|
|
|
Depreciation and amortization: |
|
|
|
|
|
|
|
|
|
|
|
Business Solutions |
|
$ |
596 |
|
$ |
632 |
|
$ |
592 |
|
|
Enterprise Solutions |
|
|
2,474 |
|
|
2,318 |
|
|
2,163 |
|
|
Public Sector Solutions |
|
|
89 |
|
|
112 |
|
|
159 |
|
|
Headquarters/Other |
|
|
10,155 |
|
|
11,001 |
|
|
8,925 |
|
|
Total depreciation and amortization |
|
$ |
13,314 |
|
$ |
14,063 |
|
$ |
11,839 |
|
|
Total assets: |
|
|
|
|
|
|
|
|
|
|
|
Business Solutions |
|
$ |
308,522 |
|
$ |
274,202 |
|
|
|
|
|
Enterprise Solutions |
|
|
548,666 |
|
|
477,296 |
|
|
|
|
|
Public Sector Solutions |
|
|
91,826 |
|
|
66,000 |
|
|
|
|
|
Headquarters/Other |
|
|
(11,679) |
|
|
(12,143) |
|
|
|
|
|
Total assets |
|
$ |
937,335 |
|
$ |
805,355 |
|
|
|
|
The assets of the Company’s operating segments presented above consist primarily of accounts receivable, net intercompany receivable, goodwill, and other intangibles. Goodwill of $66,236 and $7,366 is held by the Enterprise Solutions and Business Solutions segments, respectively, as of December 31, 2019. Assets reported under the Headquarters/Other group are managed by corporate headquarters, including cash, inventory, property and equipment and intercompany balance, net. Total assets for the Headquarters/Other group are presented net of intercompany balances eliminations of $39,813 and $19,019 for the years ended December 31, 2019 and 2018, respectively. The Company’s capital expenditures consist largely of IT hardware and software purchased to maintain or upgrade its management information systems. These systems serve all of the Company’s subsidiaries, to varying degrees, and as a result, the CODM does not evaluate capital expenditures on a segment basis.
Substantially, all of the Company’s sales in 2019, 2018, and 2017 were made to customers located in the United States. Shipments to customers located in foreign countries were not more than 2% of total net sales in 2019, 2018, and 2017. All of the Company’s assets at December 31, 2019 and 2018 were located in the United States. The Company’s primary target customers are SMBs, medium-to-large corporate accounts, and federal, state, and local government agencies, educational institutions, and medium-to-large corporate accounts. No single customer accounted for more than 4% of total net sales in 2019, 2018, or 2017. While no single agency of the federal government comprised more than 3% of total sales, aggregate sales to the federal government were 6.9%, 5.4%, and 7.8% in 2019, 2018, and 2017, respectively.
F-28
14. QUARTERLY FINANCIAL RESULTS (UNAUDITED)
The following table sets forth certain unaudited quarterly data of the Company for each of the calendar quarters in 2019 and 2018. This information has been prepared on the same basis as the annual financial statements, and all necessary adjustments, consisting only of normal recurring adjustments, have been included in the amounts stated below to present fairly the selected quarterly information when read in conjunction with the annual financial statements and the notes thereto included elsewhere in this document. The quarterly operating results are not necessarily indicative of future results of operations.
|
|
|
Quarters Ended |
|
||||||||||
|
|
|
March 31, |
|
June 30, |
|
September 30, |
|
December 31, |
|
||||
|
|
|
2019 |
|
2019 |
|
2019 |
|
2019 |
|
||||
|
Net sales |
|
$ |
632,921 |
|
$ |
741,076 |
|
$ |
729,410 |
|
$ |
716,627 |
|
|
Cost of sales |
|
|
533,574 |
|
|
624,089 |
|
|
610,547 |
|
|
600,514 |
|
|
Gross profit |
|
|
99,347 |
|
|
116,987 |
|
|
118,863 |
|
|
116,113 |
|
|
Selling, general and administrative expenses |
|
|
81,235 |
|
|
84,664 |
|
|
86,226 |
|
|
86,510 |
|
|
Restructuring and other charges |
|
|
703 |
|
|
— |
|
|
— |
|
|
— |
|
|
Income from operations |
|
|
17,409 |
|
|
32,323 |
|
|
32,637 |
|
|
29,603 |
|
|
Other income, net |
|
|
198 |
|
|
184 |
|
|
62 |
|
|
263 |
|
|
Income before taxes |
|
|
17,607 |
|
|
32,507 |
|
|
32,699 |
|
|
29,866 |
|
|
Income tax provision |
|
|
(4,880) |
|
|
(8,839) |
|
|
(8,949) |
|
|
(7,900) |
|
|
Net income |
|
$ |
12,727 |
|
$ |
23,668 |
|
$ |
23,750 |
|
$ |
21,966 |
|
|
Earnings per common share: |
|
|
|
|
|
|
|
|
|
|
|
|
|
|
Basic |
|
$ |
0.48 |
|
$ |
0.90 |
|
$ |
0.90 |
|
$ |
0.84 |
|
|
Diluted |
|
$ |
0.48 |
|
$ |
0.89 |
|
$ |
0.90 |
|
$ |
0.83 |
|
|
Weighted average common shares outstanding: |
|
|
|
|
|
|
|
|
|
|
|
|
|
|
Basic |
|
|
26,359 |
|
|
26,337 |
|
|
26,323 |
|
|
26,322 |
|
|
Diluted |
|
|
26,525 |
|
|
26,494 |
|
|
26,479 |
|
|
26,523 |
|
|
|
|
Quarters Ended |
|
||||||||||
|
|
|
March 31, |
|
June 30, |
|
September 30, |
|
December 31, |
|
||||
|
|
|
2018 |
|
2018 |
|
2018 |
|
2018 |
|
||||
|
Net sales |
|
$ |
624,895 |
|
$ |
706,570 |
|
$ |
658,504 |
|
$ |
709,520 |
|
|
Cost of sales |
|
|
528,523 |
|
|
599,102 |
|
|
558,060 |
|
|
602,718 |
|
|
Gross profit |
|
|
96,372 |
|
|
107,468 |
|
|
100,444 |
|
|
106,802 |
|
|
Selling, general and administrative expenses |
|
|
80,900 |
|
|
82,521 |
|
|
81,494 |
|
|
79,518 |
|
|
Restructuring and other charges |
|
|
— |
|
|
— |
|
|
— |
|
|
967 |
|
|
Income from operations |
|
|
15,472 |
|
|
24,947 |
|
|
18,950 |
|
|
26,317 |
|
|
Interest income, net |
|
|
116 |
|
|
182 |
|
|
114 |
|
|
2,566 |
|
|
Income before taxes |
|
|
15,588 |
|
|
25,129 |
|
|
19,064 |
|
|
28,883 |
|
|
Income tax provision |
|
|
(4,288) |
|
|
(6,903) |
|
|
(5,298) |
|
|
(7,583) |
|
|
Net income |
|
$ |
11,300 |
|
$ |
18,226 |
|
$ |
13,766 |
|
$ |
21,300 |
|
|
Earnings per common share: |
|
|
|
|
|
|
|
|
|
|
|
|
|
|
Basic |
|
$ |
0.42 |
|
$ |
0.68 |
|
$ |
0.52 |
|
$ |
0.80 |
|
|
Diluted |
|
$ |
0.42 |
|
$ |
0.68 |
|
$ |
0.51 |
|
$ |
0.80 |
|
|
Weighted average common shares outstanding: |
|
|
|
|
|
|
|
|
|
|
|
|
|
|
Basic |
|
|
26,835 |
|
|
26,685 |
|
|
26,716 |
|
|
26,632 |
|
|
Diluted |
|
|
26,916 |
|
|
26,820 |
|
|
26,902 |
|
|
26,766 |
|
F-29
PC CONNECTION, INC. AND SUBSIDIARIES
SCHEDULE II—VALUATION AND QUALIFYING ACCOUNTS
(amounts in thousands)
|
|
|
Balance at |
|
Charged to |
|
|
|
Balance at |
|
|
|
|
Beginning |
|
Costs and |
|
Deductions/ |
|
End of |
|
|
|
|
of Period |
|
Expenses |
|
Write-Offs |
|
Period |
|
|
Description |
|
|
|
|
|
|
|
|
|
|
Allowance for Sales Returns |
|
|
|
|
|
|
|
|
|
|
Year Ended December 31, 2017 |
$ |
3,709 |
|
32,399 |
|
(32,800) |
$ |
3,308 |
|
|
Year Ended December 31, 2018 |
$ |
3,308 |
|
28,504 |
|
(28,415) |
$ |
3,397 |
|
|
Year Ended December 31, 2019 |
$ |
3,397 |
|
27,943 |
|
(27,874) |
$ |
3,466 |
|
|
|
|
|
|
|
|
|
|
|
|
|
Allowance for Doubtful Accounts |
|
|
|
|
|
|
|
|
|
|
Year Ended December 31, 2017 |
$ |
2,310 |
|
1,658 |
|
(1,242) |
$ |
2,726 |
|
|
Year Ended December 31, 2018 |
$ |
2,726 |
|
1,680 |
|
(1,304) |
$ |
3,102 |
|
|
Year Ended December 31, 2019 |
$ |
3,102 |
|
25 |
|
(925) |
$ |
2,202 |
|
S-1