Attached files
| file | filename |
|---|---|
| 8-K - 8-K - Yellow Corp | d859336d8k.htm |
| EX-99.1 - EX-99.1 - Yellow Corp | d859336dex991.htm |

YRC WORLDWIDE FOURTH QUARTER 2019 EARNINGS CONFERENCE CALL Exhibit 99.2
Statements & disclaimers The information in this presentation is summary in nature and may not contain all information that is important to you. The Recipient acknowledges and agrees that (i) no representation or warranty regarding the material contained in this presentation is made by YRC Worldwide Inc. (the “Company” or “we”) or any of its affiliates and (ii) that the Company and its affiliates have no obligation to update or supplement this presentation or otherwise provide additional information. This presentation is for discussion and reference purposes only and does not constitute an offer to sell or the solicitation of an offer to buy any securities or other property. This presentation contains “forward-looking statements” within the meaning of Section 27A of the Securities Act of 1933 and Section 21E of the Securities Exchange Act of 1934. Forward-looking statements relate to future events or future performance of the Company and include statements about the Company’s expectations or forecasts for future periods and events. Specific forward-looking statements can be identified by the fact that they do not relate strictly to historical or current facts and include, without limitation, words such as “may,” “will,” “should,” “expect,” “plan,” “anticipate,” “believe,” “estimate,” “predict,” “potential” or “continue,” the negative of such terms or other comparable terminology. We disclaim any obligation to update those statements, except as applicable law may require us to do so, and we caution you not to rely unduly on them. We have based those forward-looking statements on our current expectations and assumptions about future events, and while our management considers those expectations and assumptions to be reasonable, they are inherently subject to significant business, economic, competitive, regulatory and other risks, contingencies and uncertainties, most of which are difficult to predict and many of which are beyond our control. Therefore, actual results may differ materially and adversely from those expressed in any forward-looking statements. Factors that might cause or contribute to such differences include, but are not limited to, those we discuss in the “Risk Factors” section of our Annual Report on Form 10-K and in other reports we file with the Securities and Exchange Commission. This presentation includes the presentation of Adjusted EBITDA, a non-GAAP financial measure. Adjusted EBITDA is not a measure of financial performance in accordance with generally accepted accounting principles and may exclude items that are significant in understanding and assessing our financial results. Therefore, this measure should not be considered in isolation or as an alternative to net income from operations, cash flows from operations, earnings per fully-diluted share or other measures of profitability, liquidity or performance under generally accepted accounting principles. We believe our presentation of Adjusted EBITDA is useful to investors and other users as these measures represent key supplemental information our management uses to compare and evaluate our core underlying business results both on a consolidated basis and across our business segments, particularly in light of our leverage position and the capital-intensive nature of our business. Additionally, Adjusted EBITDA helps investors to understand how the company is tracking against our financial covenants in our term loan credit agreement as this measure is calculated as prescribed therein and serves as a driving component of our key financial covenants. You should be aware that this presentation of Adjusted EBITDA may not be comparable to similarly-titled measures used by other companies. Further, the way we define Adjusted EBITDA has recently changed. Adjusted EBITDA as used herein is defined as Consolidated EBITDA in our new term loan facility entered into September 11, 2019. Please refer to our most recent Form 10-Q for additional information and a copy of the new term loan. A reconciliation of this measure to the most comparable measures presented in accordance with generally accepted accounting principles has been included in this presentation.
2019 COMPLETED FOUNDATIONAL COMPONENTS Ratified new 5-year labor contract Refinanced our term loan with improved and more flexible terms Reorganized our leadership team Reorganized our enterprise-wide sales force 2020 NEXT PHASE IS FOCUSED ON TRANSFORMATION Operational Optimization: Structurally improve the network to increase asset utilization, expand service offerings and leverage the flexibilities gained with our new labor contract. Technology Migration: Improve our customer experience, operational flexibility and ability to execute our strategic objectives by consolidating disparate company systems into a single platform. Facility Evaluation: Rationalize the number of physical locations in the network while maintaining geographic coverage and service levels. MULTI-YEAR STRATEGY
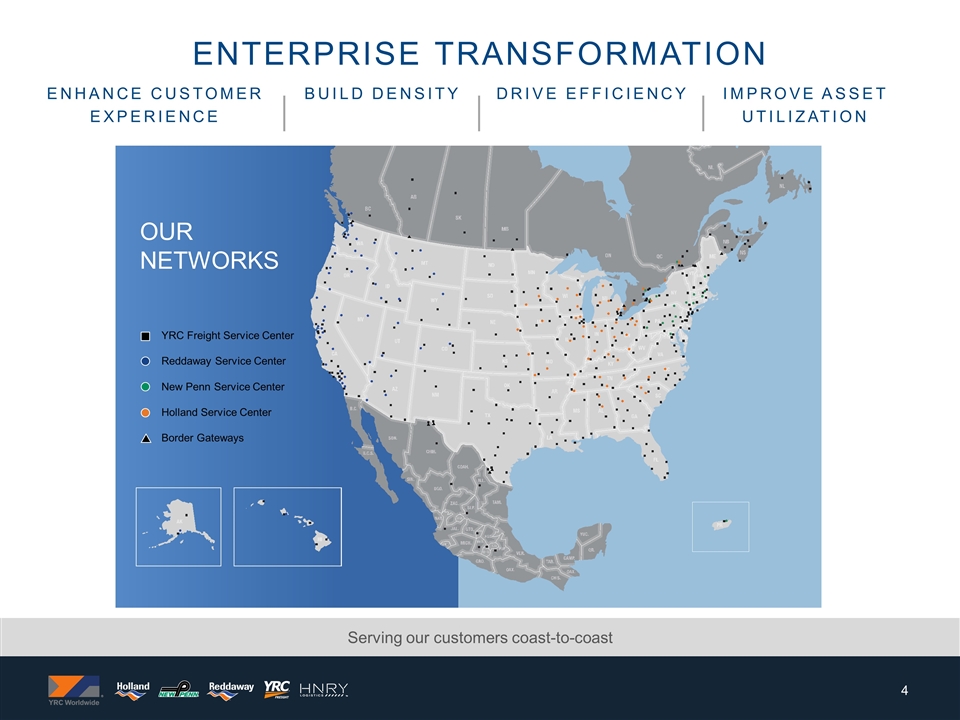
ENTERPRISE TRANSFORMATION Serving our customers coast-to-coast Enhance customer experience build Density drive efficiency improve asset utilization YRC Freight Service Center Reddaway Service Center New Penn Service Center Holland Service Center Border Gateways OUR NETWORKS
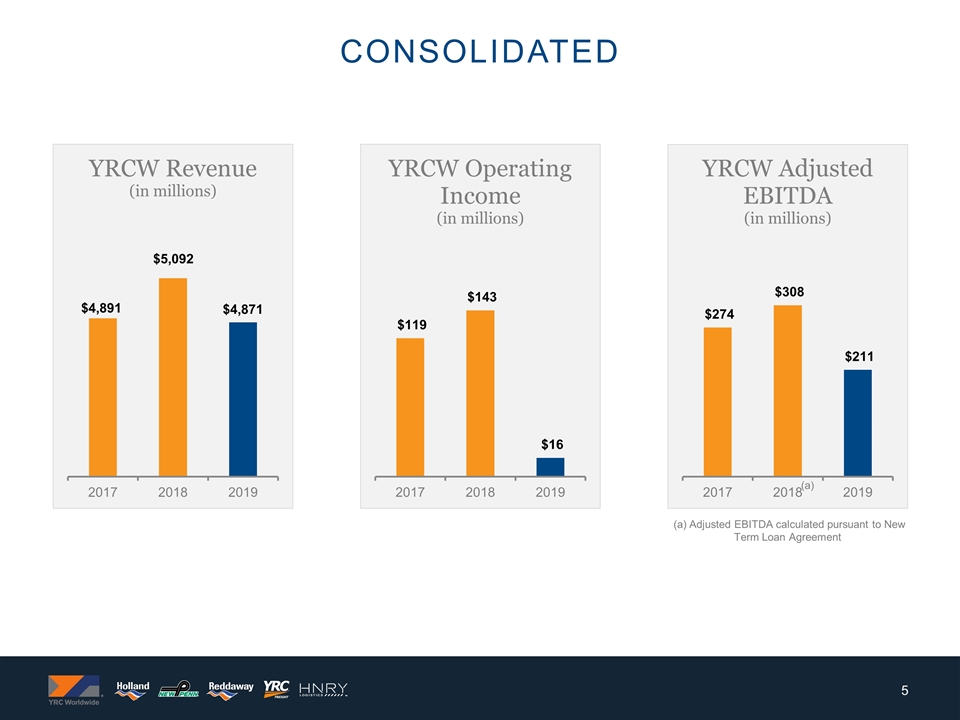
Consolidated (a) Adjusted EBITDA calculated pursuant to New Term Loan Agreement (a)
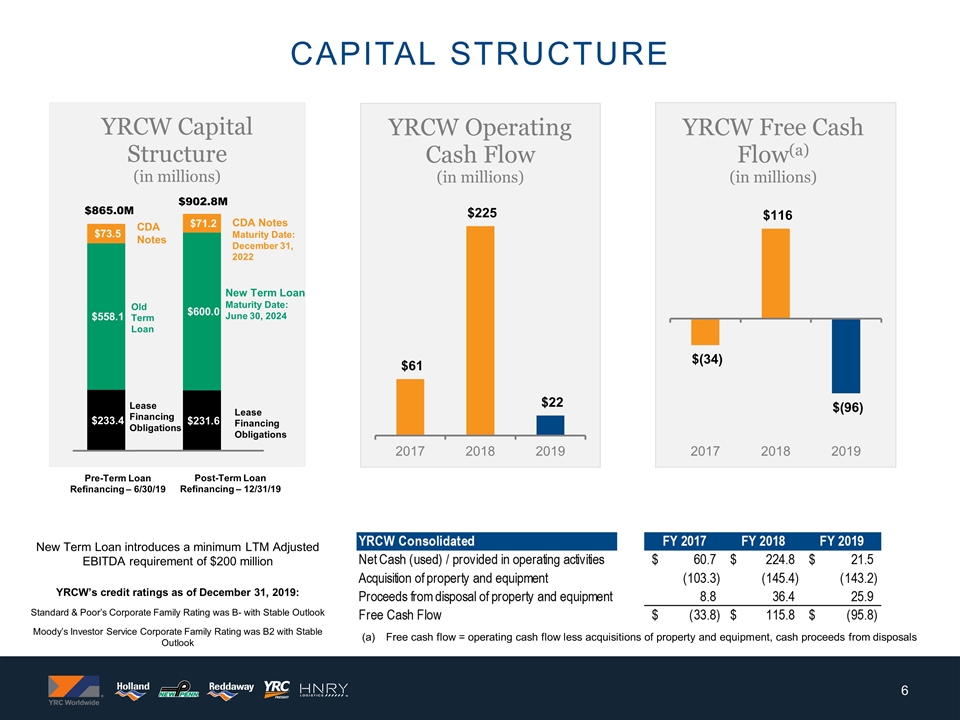
Lease Financing Obligations CDA Notes $902.8M Post-Term Loan Refinancing – 12/31/19 Pre-Term Loan Refinancing – 6/30/19 Lease Financing Obligations New Term Loan Maturity Date: June 30, 2024 CDA Notes Maturity Date: December 31, 2022 $865.0M Capital structure Old Term Loan New Term Loan introduces a minimum LTM Adjusted EBITDA requirement of $200 million YRCW’s credit ratings as of December 31, 2019: Standard & Poor’s Corporate Family Rating was B- with Stable Outlook Moody’s Investor Service Corporate Family Rating was B2 with Stable Outlook Free cash flow = operating cash flow less acquisitions of property and equipment, cash proceeds from disposals
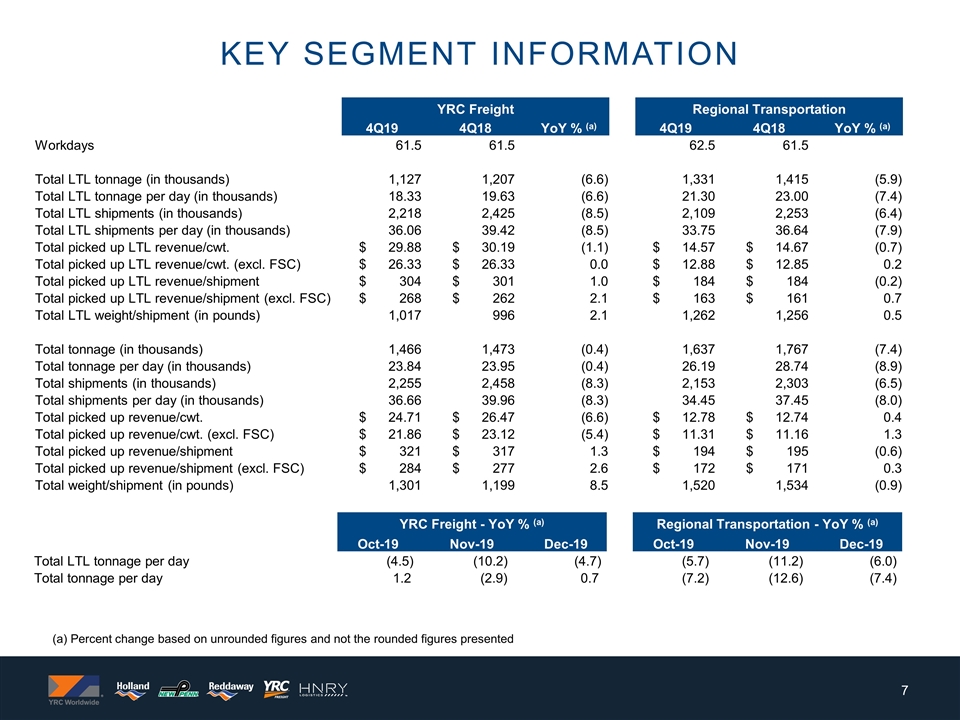
KEY SEGMENT INFORMATION (a) Percent change based on unrounded figures and not the rounded figures presented YRC Freight Regional Transportation 4Q19 4Q18 YoY % (a) 4Q19 4Q18 YoY % (a) Workdays 61.5 61.5 62.5 61.5 Total LTL tonnage (in thousands) 1,127 1,207 (6.6) 1,331 1,415 (5.9) Total LTL tonnage per day (in thousands) 18.33 19.63 (6.6) 21.30 23.00 (7.4) Total LTL shipments (in thousands) 2,218 2,425 (8.5) 2,109 2,253 (6.4) Total LTL shipments per day (in thousands) 36.06 39.42 (8.5) 33.75 36.64 (7.9) Total picked up LTL revenue/cwt. $ 29.88 $ 30.19 (1.1) $ 14.57 $ 14.67 (0.7) Total picked up LTL revenue/cwt. (excl. FSC) $ 26.33 $ 26.33 0.0 $ 12.88 $ 12.85 0.2 Total picked up LTL revenue/shipment $ 304 $ 301 1.0 $ 184 $ 184 (0.2) Total picked up LTL revenue/shipment (excl. FSC) $ 268 $ 262 2.1 $ 163 $ 161 0.7 Total LTL weight/shipment (in pounds) 1,017 996 2.1 1,262 1,256 0.5 Total tonnage (in thousands) 1,466 1,473 (0.4) 1,637 1,767 (7.4) Total tonnage per day (in thousands) 23.84 23.95 (0.4) 26.19 28.74 (8.9) Total shipments (in thousands) 2,255 2,458 (8.3) 2,153 2,303 (6.5) Total shipments per day (in thousands) 36.66 39.96 (8.3) 34.45 37.45 (8.0) Total picked up revenue/cwt. $ 24.71 $ 26.47 (6.6) $ 12.78 $ 12.74 0.4 Total picked up revenue/cwt. (excl. FSC) $ 21.86 $ 23.12 (5.4) $ 11.31 $ 11.16 1.3 Total picked up revenue/shipment $ 321 $ 317 1.3 $ 194 $ 195 (0.6) Total picked up revenue/shipment (excl. FSC) $ 284 $ 277 2.6 $ 172 $ 171 0.3 Total weight/shipment (in pounds) 1,301 1,199 8.5 1,520 1,534 (0.9) YRC Freight - YoY % (a) Regional Transportation - YoY % (a) Oct-19 Nov-19 Dec-19 Oct-19 Nov-19 Dec-19 Total LTL tonnage per day (4.5) (10.2) (4.7) (5.7) (11.2) (6.0) Total tonnage per day 1.2 (2.9) 0.7 (7.2) (12.6) (7.4)
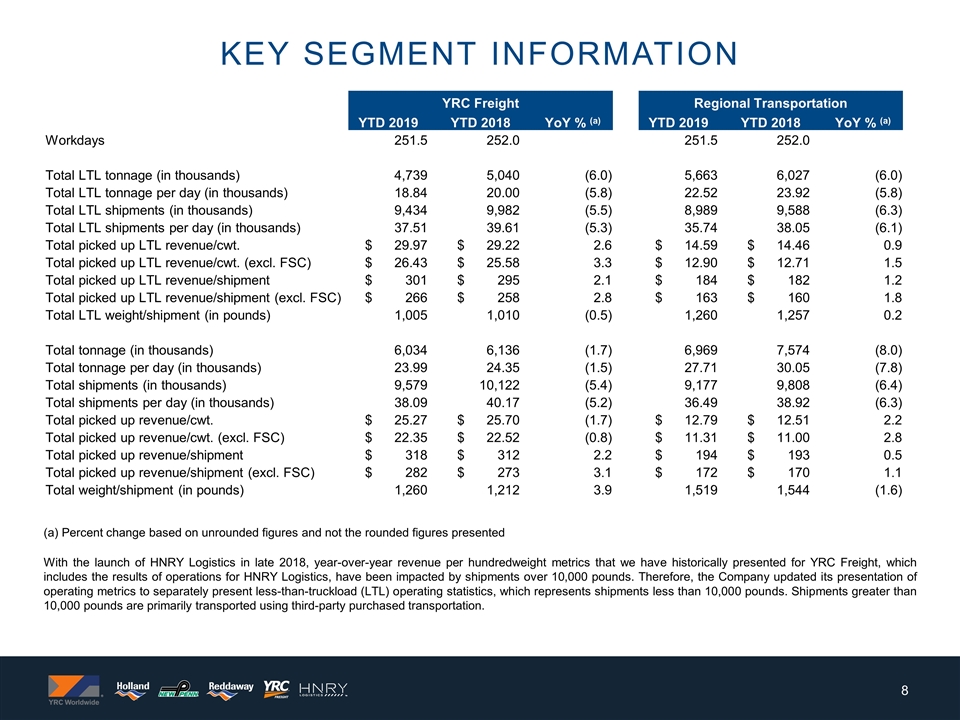
KEY SEGMENT INFORMATION (a) Percent change based on unrounded figures and not the rounded figures presented With the launch of HNRY Logistics in late 2018, year-over-year revenue per hundredweight metrics that we have historically presented for YRC Freight, which includes the results of operations for HNRY Logistics, have been impacted by shipments over 10,000 pounds. Therefore, the Company updated its presentation of operating metrics to separately present less-than-truckload (LTL) operating statistics, which represents shipments less than 10,000 pounds. Shipments greater than 10,000 pounds are primarily transported using third-party purchased transportation. YRC Freight Regional Transportation YTD 2019 YTD 2018 YoY % (a) YTD 2019 YTD 2018 YoY % (a) Workdays 251.5 252.0 251.5 252.0 Total LTL tonnage (in thousands) 4,739 5,040 (6.0) 5,663 6,027 (6.0) Total LTL tonnage per day (in thousands) 18.84 20.00 (5.8) 22.52 23.92 (5.8) Total LTL shipments (in thousands) 9,434 9,982 (5.5) 8,989 9,588 (6.3) Total LTL shipments per day (in thousands) 37.51 39.61 (5.3) 35.74 38.05 (6.1) Total picked up LTL revenue/cwt. $ 29.97 $ 29.22 2.6 $ 14.59 $ 14.46 0.9 Total picked up LTL revenue/cwt. (excl. FSC) $ 26.43 $ 25.58 3.3 $ 12.90 $ 12.71 1.5 Total picked up LTL revenue/shipment $ 301 $ 295 2.1 $ 184 $ 182 1.2 Total picked up LTL revenue/shipment (excl. FSC) $ 266 $ 258 2.8 $ 163 $ 160 1.8 Total LTL weight/shipment (in pounds) 1,005 1,010 (0.5) 1,260 1,257 0.2 Total tonnage (in thousands) 6,034 6,136 (1.7) 6,969 7,574 (8.0) Total tonnage per day (in thousands) 23.99 24.35 (1.5) 27.71 30.05 (7.8) Total shipments (in thousands) 9,579 10,122 (5.4) 9,177 9,808 (6.4) Total shipments per day (in thousands) 38.09 40.17 (5.2) 36.49 38.92 (6.3) Total picked up revenue/cwt. $ 25.27 $ 25.70 (1.7) $ 12.79 $ 12.51 2.2 Total picked up revenue/cwt. (excl. FSC) $ 22.35 $ 22.52 (0.8) $ 11.31 $ 11.00 2.8 Total picked up revenue/shipment $ 318 $ 312 2.2 $ 194 $ 193 0.5 Total picked up revenue/shipment (excl. FSC) $ 282 $ 273 3.1 $ 172 $ 170 1.1 Total weight/shipment (in pounds) 1,260 1,212 3.9 1,519 1,544 (1.6)
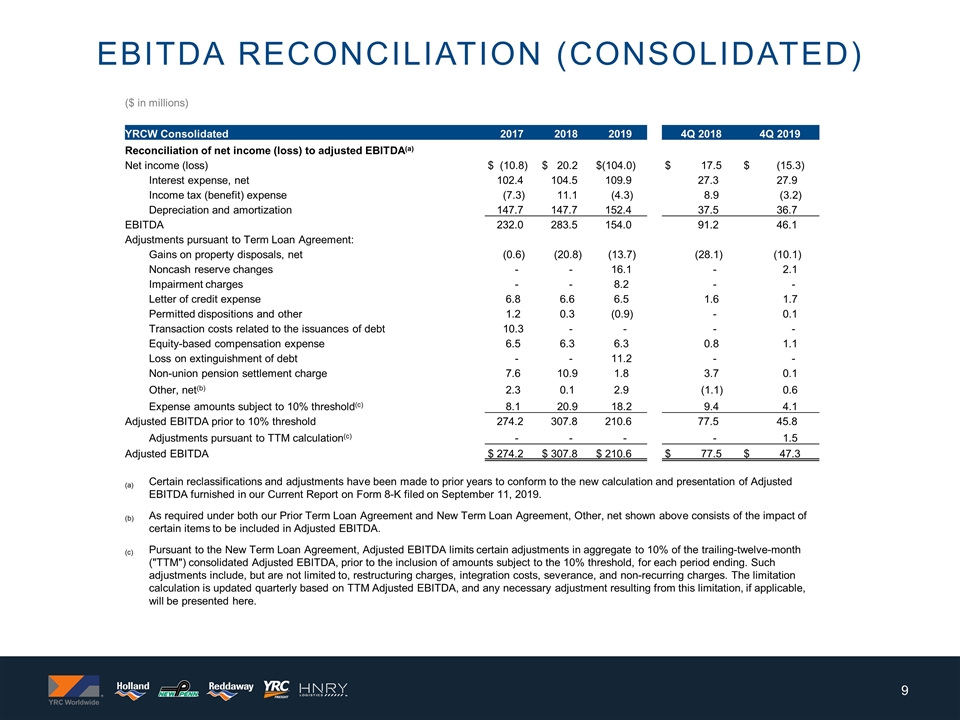
Ebitda reconciliation (consolidated) ($ in millions) YRCW Consolidated 2017 2018 2019 4Q 2018 4Q 2019 Reconciliation of net income (loss) to adjusted EBITDA(a) Net income (loss) $ (10.8) $ 20.2 $(104.0) $ 17.5 $ (15.3) Interest expense, net 102.4 104.5 109.9 27.3 27.9 Income tax (benefit) expense (7.3) 11.1 (4.3) 8.9 (3.2) Depreciation and amortization 147.7 147.7 152.4 37.5 36.7 EBITDA 232.0 283.5 154.0 91.2 46.1 Adjustments pursuant to Term Loan Agreement: Gains on property disposals, net (0.6) (20.8) (13.7) (28.1) (10.1) Noncash reserve changes - - 16.1 - 2.1 Impairment charges - - 8.2 - - Letter of credit expense 6.8 6.6 6.5 1.6 1.7 Permitted dispositions and other 1.2 0.3 (0.9) - 0.1 Transaction costs related to the issuances of debt 10.3 - - - - Equity-based compensation expense 6.5 6.3 6.3 0.8 1.1 Loss on extinguishment of debt - - 11.2 - - Non-union pension settlement charge 7.6 10.9 1.8 3.7 0.1 Other, net(b) 2.3 0.1 2.9 (1.1) 0.6 Expense amounts subject to 10% threshold(c) 8.1 20.9 18.2 9.4 4.1 Adjusted EBITDA prior to 10% threshold 274.2 307.8 210.6 77.5 45.8 Adjustments pursuant to TTM calculation(c) - - - - 1.5 Adjusted EBITDA $ 274.2 $ 307.8 $ 210.6 $ 77.5 $ 47.3 (a) Certain reclassifications and adjustments have been made to prior years to conform to the new calculation and presentation of Adjusted EBITDA furnished in our Current Report on Form 8-K filed on September 11, 2019. (b) As required under both our Prior Term Loan Agreement and New Term Loan Agreement, Other, net shown above consists of the impact of certain items to be included in Adjusted EBITDA. (c) Pursuant to the New Term Loan Agreement, Adjusted EBITDA limits certain adjustments in aggregate to 10% of the trailing-twelve-month ("TTM") consolidated Adjusted EBITDA, prior to the inclusion of amounts subject to the 10% threshold, for each period ending. Such adjustments include, but are not limited to, restructuring charges, integration costs, severance, and non-recurring charges. The limitation calculation is updated quarterly based on TTM Adjusted EBITDA, and any necessary adjustment resulting from this limitation, if applicable, will be presented here.
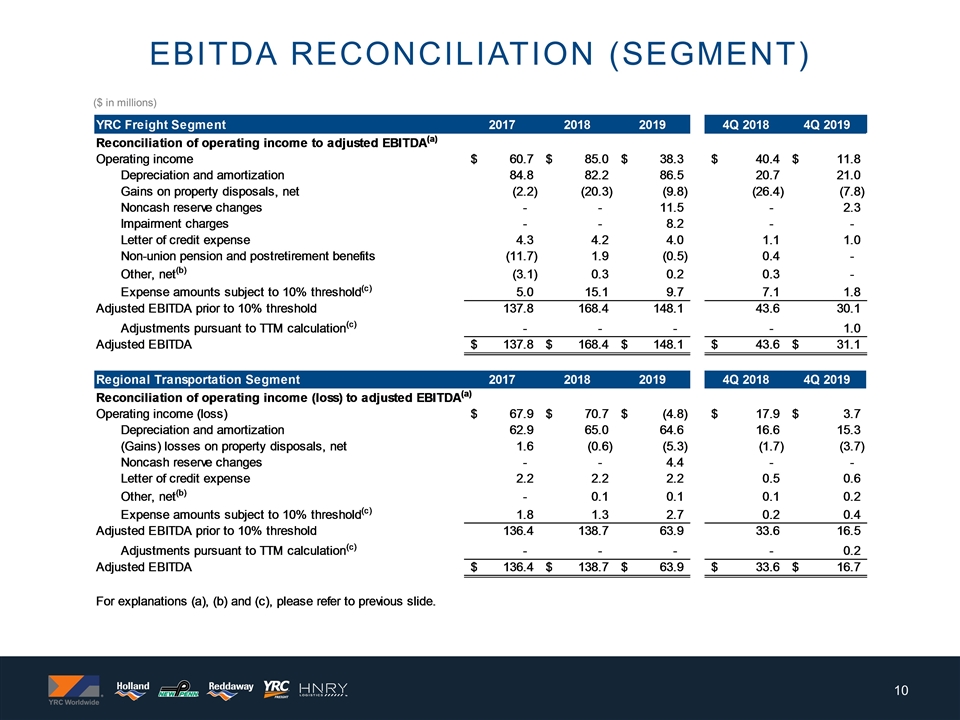
($ in millions) EBitda reconciliation (segment) Reconciliation of Operating income (Loss) Income to Adjusted EBITDA - Segment YRC Freight Segment 2015 2016 2017 2018 2019 1Q 2018 2Q 2018 3Q 2018 4Q 2018 2Q 2019 3Q 2019 4Q 2019 First Three Quarters 2019 LTM 2Q 2019 Reconciliation of operating income to adjusted EBITDA(a) Operating income $63.3 $71.8 $60.7 $85 $38.299999999999997 $-6.9 $26.8 $24.7 $40.4 $16 $31.6 $11.799999999999997 $26.5 Depreciation and amortization 93.1 90.3 84.8 82.2 86.5 21.6 21.5 18.399999999999999 20.7 21.6 21 21 65.5 Gains on property disposals, net 1.9 -15.7 -2.2000000000000002 -20.3 -9.8000000000000007 2.8 1.7 1.6 -26.4 -3.2 0.1 -7.8000000000000007 -2 Noncash reserve changes 0 0 0 0 11.5 0 0 0 0 10.3 -1.1000000000000001 2.3000000000000007 9.2000000000000011 Impairment charges 0 0 0 0 8.1999999999999993 0 0 0 0 0 0 0 8.1999999999999993 Letter of credit expense 6.1 5 4.3 4.2 4 1 1.1000000000000001 1 1.1000000000000001 1 1 1 3 Non-union pension and postretirement benefits -16.100000000000001 -18.600000000000001 -11.7 1.9 -0.5 0.6 0.5 0.4 0.4 -0.30000000000000004 -0.1 0 -0.5 Other, net(b) #REF! #REF! -3.1 0.3 0.2 #REF! #REF! #REF! 0.3 #REF! 0.4 0 #REF! Expense amounts subject to 10% threshold(c) 0 0 5 15.1 9.6999999999999993 #REF! #REF! 0 7.1 #REF! 0 1.8 #REF! Adjusted EBITDA prior to 10% threshold #REF! #REF! 137.80000000000004 168.39999999999998 148.09999999999997 #REF! #REF! #REF! 43.599999999999994 #REF! 52.9 30.099999999999998 #REF! $0 Adjustments pursuant to TTM calculation(c) 0 0 0 0 0 0 0 0 0 -1.5 0.5 1 -1 Adjusted EBITDA #REF! #REF! $137.80000000000004 $168.39999999999998 $148.09999999999997 #REF! #REF! #REF! $43.599999999999994 #REF! $53.4 $31.099999999999998 #REF! $0 Regional Transportation Segment 2015 2016 2017 2018 2019 1Q 2018 2Q 2018 3Q 2018 4Q 2018 2Q 2019 3Q 2019 4Q 2019 First Three Quarters 2019 LTM 2Q 2019 Reconciliation of operating income (loss) to adjusted EBITDA(a) Operating income (loss) $85.5 $81.400000000000006 $67.900000000000006 $70.7 $-4.8 $5.2 $29.2 $18.399999999999999 $17.900000000000006 $2.5999999999999996 $-4.0999999999999996 $3.7 $-8.5 Depreciation and amortization 70.7 69.5 62.9 65 64.599999999999994 16.100000000000001 16.100000000000001 16.2 16.600000000000001 16.7 15.8 15.299999999999997 49.3 (Gains) losses on property disposals, net 0.2 1.1000000000000001 1.6 -0.6 -5.3 0.4 0.4 0.3 -1.7 -3 0.9 -3.6999999999999997 -1.6 Noncash reserve changes 0 0 0 0 4.4000000000000004 0 0 0 0 5.5 -1.1000000000000001 0 4.4000000000000004 Letter of credit expense 2.1 2.5 2.2000000000000002 2.2000000000000002 2.2000000000000002 0.6 0.5 0.6 0.5 0.60000000000000009 0.5 0.60000000000000009 1.6 Other, net(b) #REF! #REF! 0 0.1 0.1 #REF! #REF! #REF! 0.1 #REF! 0.4 0.2 #REF! Expense amounts subject to 10% threshold(c) 0 0 1.8 1.3 2.7 #REF! #REF! 0 0.2 #REF! 0 0.4 #REF! Adjusted EBITDA prior to 10% threshold #REF! #REF! 136.4 138.69999999999999 63.900000000000006 #REF! #REF! #REF! 33.600000000000009 #REF! 12.400000000000002 16.499999999999996 #REF! $0 Adjustments pursuant to TTM calculation(c) 0 0 0 0 0 0 0 0 0 -1.5 0.5 0.2 -1 Adjusted EBITDA #REF! #REF! $136.4 $138.69999999999999 $63.900000000000006 #REF! #REF! #REF! $33.600000000000009 #REF! $12.900000000000002 $16.699999999999996 #REF! $0 For explanations (a), (b) and (c), please refer to previous slide.
