Attached files
| file | filename |
|---|---|
| EX-99.2 - EX-99.2 - Ruths Hospitality Group, Inc. | ruth-ex992_6.htm |
| 8-K - 8-K - Ruths Hospitality Group, Inc. | ruth-8k_20200113.htm |

RUTH’S HOSPITALITY GROUP ICR 2020 NASDAQ: RUTH Exhibit 99.1
This presentation contains “forward-looking statements” that reflect, when made, the Company’s expectations or beliefs concerning future events that involve risks and uncertainties. Forward-looking statements frequently are identified by the words “believe,” “anticipate,” “expect,” “estimate,” “intend,” “project,” “targeting,” “will be,” “will continue,” “will likely result,” or other similar words and phrases. Similarly, statements herein that describe the Company’s objectives, plans or goals, including with respect to new restaurant openings, capital expenditures, impact of healthcare inflation, and recent accounting pronouncements, also are forward-looking statements. Actual results could differ materially from those projected, implied or anticipated by the Company’s forward-looking statements. Some of the factors that could cause actual results to differ include: reductions in the availability of, or increases in the cost of, USDA Prime grade beef, fish and other food items; changes in economic conditions and general trends; the loss of key management personnel; the effect of market volatility on the Company’s stock price; health concerns about beef or other food products; the effect of competition in the restaurant industry; changes in consumer preferences or discretionary spending; labor shortages or increases in labor costs; the impact of federal, state or local government regulations relating to income taxes, unclaimed property, Company employees, the sale or preparation of food, the sale of alcoholic beverages and the opening of new restaurants; harmful actions taken by the Company’s franchisees; the inability to successfully integrate franchisee acquisitions into the Company’s business operations; a material failure, interruption or security breach of the Company’s information technology network; the Company’s indemnification obligations in connection with its sale of the Mitchell’s Restaurants; the Company’s ability to protect its name and logo and other proprietary information; an impairment in the financial statement carrying value of our goodwill, other intangible assets or property; the impact of litigation; the restrictions imposed by the Company’s Credit Agreement; and changes in, or the discontinuation of, the Company’s quarterly cash dividend payments or share repurchase program. For a discussion of these and other risks and uncertainties that could cause actual results to differ from those contained in the forward-looking statements, see “Risk Factors” in the Company’s Annual Report on Form 10-K for the fiscal year ended December 30, 2018, which is available on the SEC’s website at www.sec.gov. All forward-looking statements are qualified in their entirety by this cautionary statement, and the Company undertakes no obligation to revise or update this presentation to reflect events or circumstances after the date hereof. You should not assume that material events subsequent to the date of this presentation have not occurred. Unless the context otherwise indicates, all references in this presentation to the “Company,” “Ruth’s,” “we,” “us”, “our” or similar words are to Ruth’s Hospitality Group, Inc. and its subsidiaries. Ruth’s Hospitality Group, Inc. is a Delaware corporation formerly known as Ruth’s Chris Steak House, Inc., and was founded in 1965. Non-GAAP Financial Measures We prepare our financial statements in accordance with U.S. generally accepted accounting principles (GAAP). Within these investor presentation materials, we make reference to “Adjusted EBITDA,” a non-GAAP financial measure, calculated on the basis of net income, excluding interest, taxes, depreciation, amortization, gain/loss on assets, losses on impairment, restructuring benefits/expenses, loss/income on discontinued operations and additional items. We believe that this measurement represents a useful internal measure of performance. Accordingly, where we provide a non-GAAP measure like Adjusted EBITDA, it is done so that investors have the same financial data that management uses in evaluating performance with the belief that it will assist the investment community in assessing our underlying performance. However, because Adjusted EBITDA is not determined in accordance with GAAP, it is susceptible to varying calculations and not all companies calculate the measure in the same manner. As a result, Adjusted EBITDA as presented may not be directly comparable to a similarly titled measure presented by other companies. Adjusted EBITDA is presented as supplemental information and not as an alternative to any GAAP measurements. For a reconciliation of Adjusted EBITDA to net income, see the reconciliation table furnished as Exhibit 99.2 to our Current Report on Form 8-K. DISCLAIMER: THIS PRESENTATION CONTAINS FORWARD-LOOKING STATEMENTS WITHIN THE MEANING OF THE PRIVATE SECURITIES LITIGATION REFORM ACT OF 1995.

RUTH’S HOSPITALITY GROUP ICR 2020 NASDAQ: RUTH
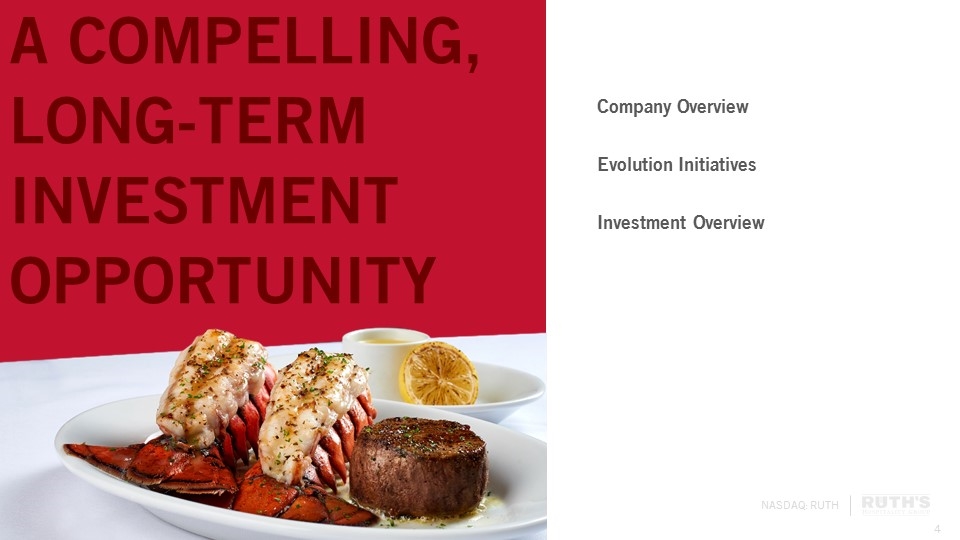
A COMPELLING, LONG-TERM INVESTMENT OPPORTUNITY Company Overview Evolution Initiatives Investment Overview
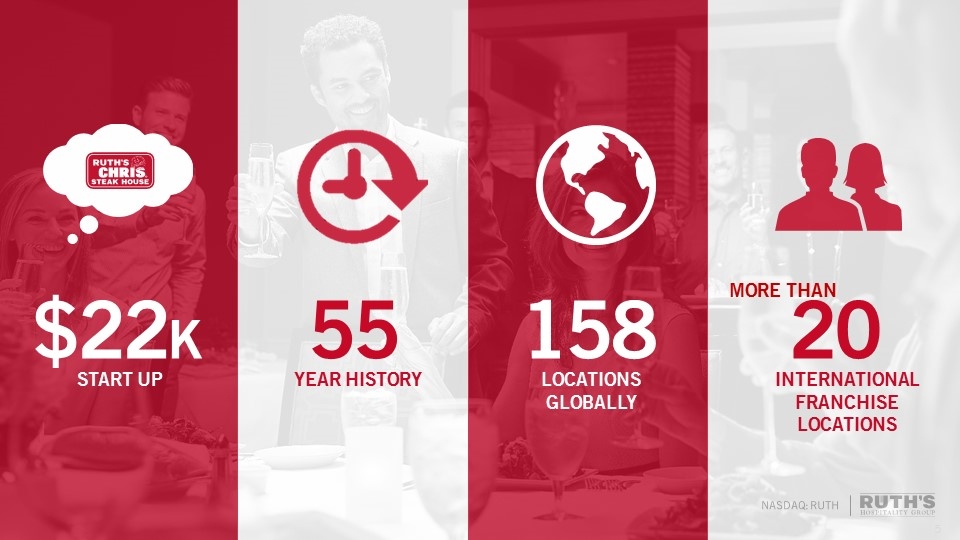
NASDAQ: RUTH YEAR HISTORY INTERNATIONAL FRANCHISE LOCATIONS START UP LOCATIONS GLOBALLY 55 20 $22K 158 MORE THAN
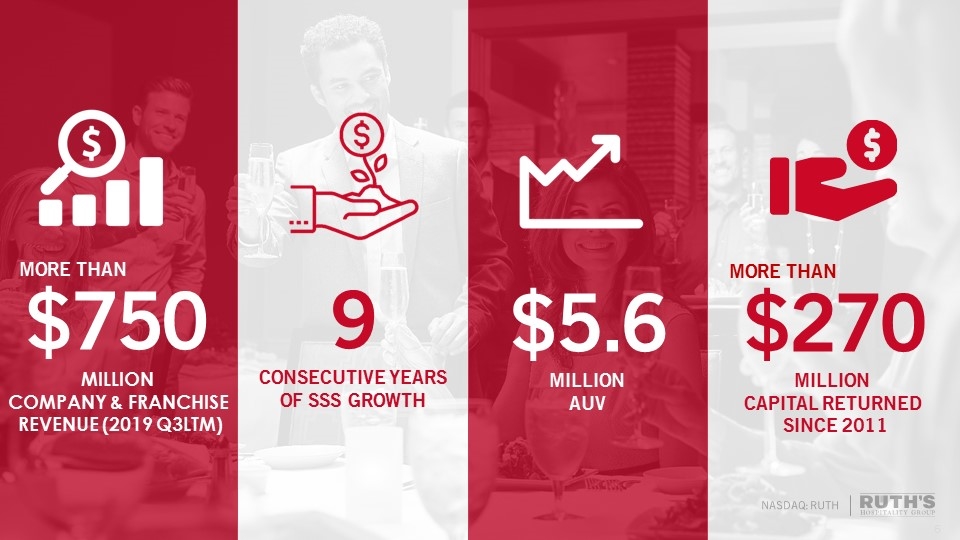
CONSECUTIVE YEARS OF SSS GROWTH 9 MILLION CAPITAL RETURNED SINCE 2011 $270 NASDAQ: RUTH MILLION COMPANY & FRANCHISE REVENUE (2019 Q3LTM) $750 MILLION AUV $5.6 MORE THAN MORE THAN
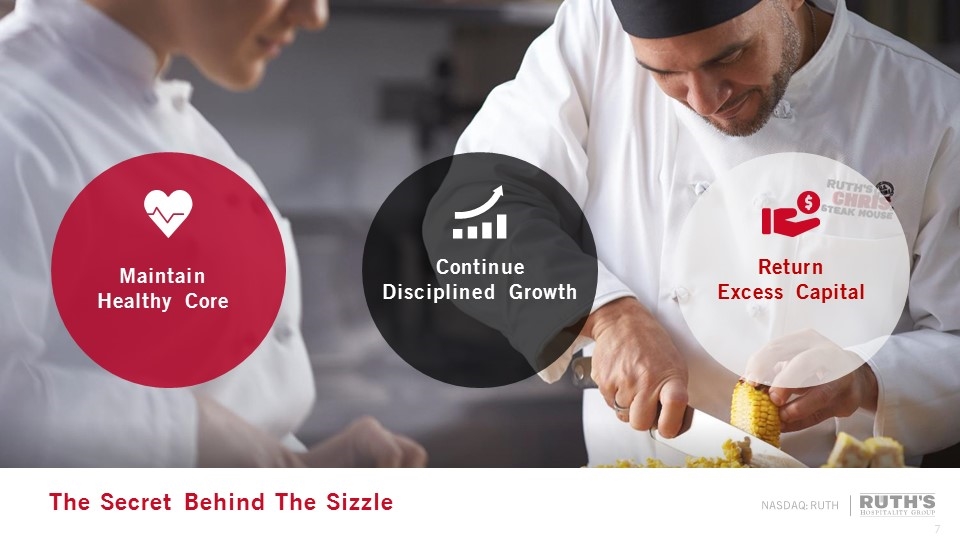
Maintain Healthy Core Continue Disciplined Growth Return Excess Capital NASDAQ: RUTH NASDAQ: RUTH NASDAQ: RUTH The Secret Behind The Sizzle
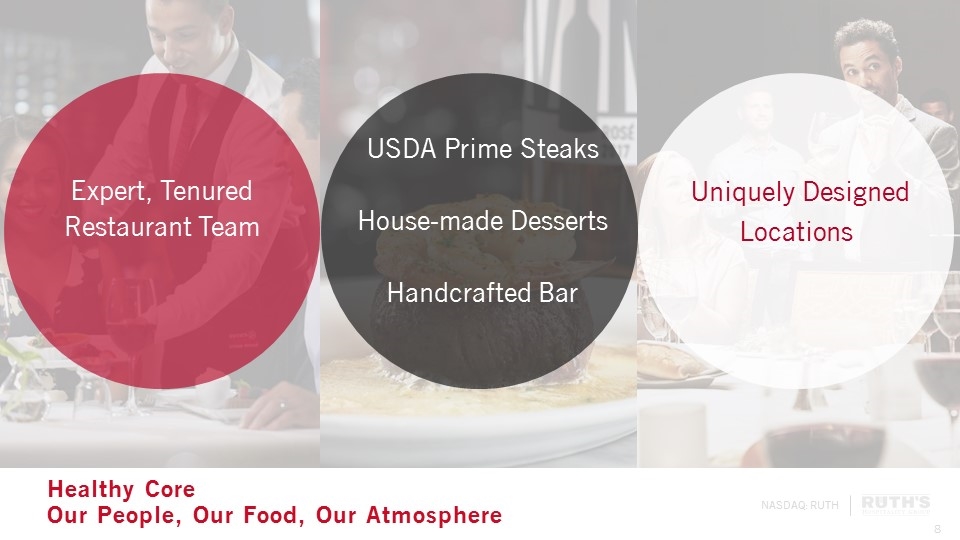
Expert, Tenured Restaurant Team USDA Prime Steaks House-made Desserts Handcrafted Bar Uniquely Designed Locations Healthy Core Our People, Our Food, Our Atmosphere
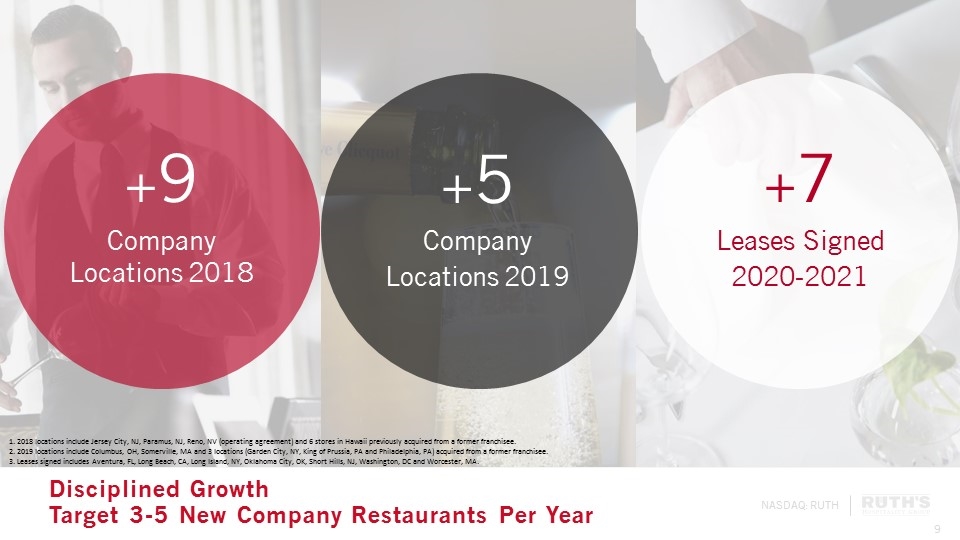
+9 Company Locations 2018 +5 Company Locations 2019 +7 Leases Signed 2020-2021 Disciplined Growth Target 3-5 New Company Restaurants Per Year 1. 2018 locations include Jersey City, NJ, Paramus, NJ, Reno, NV (operating agreement) and 6 stores in Hawaii previously acquired from a former franchisee. 2. 2019 locations include Columbus, OH, Somerville, MA and 3 locations (Garden City, NY, King of Prussia, PA and Philadelphia, PA) acquired from a former franchisee. 3. Leases signed includes Aventura, FL, Long Beach, CA, Long Island, NY, Oklahoma City, OK, Short Hills, NJ, Washington, DC and Worcester, MA.
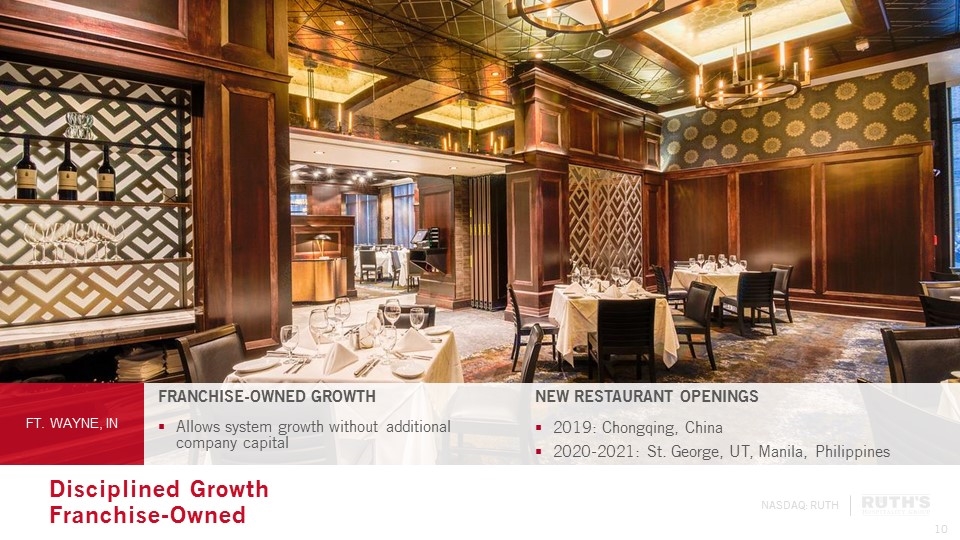
FRANCHISE-OWNED GROWTH Allows system growth without additional company capital FT. WAYNE, IN NEW RESTAURANT OPENINGS 2019: Chongqing, China 2020-2021: St. George, UT, Manila, Philippines Disciplined Growth Franchise-Owned

WE ARE AN EVOLVING ICONIC BRAND NASDAQ: RUTH

[VIDEO]
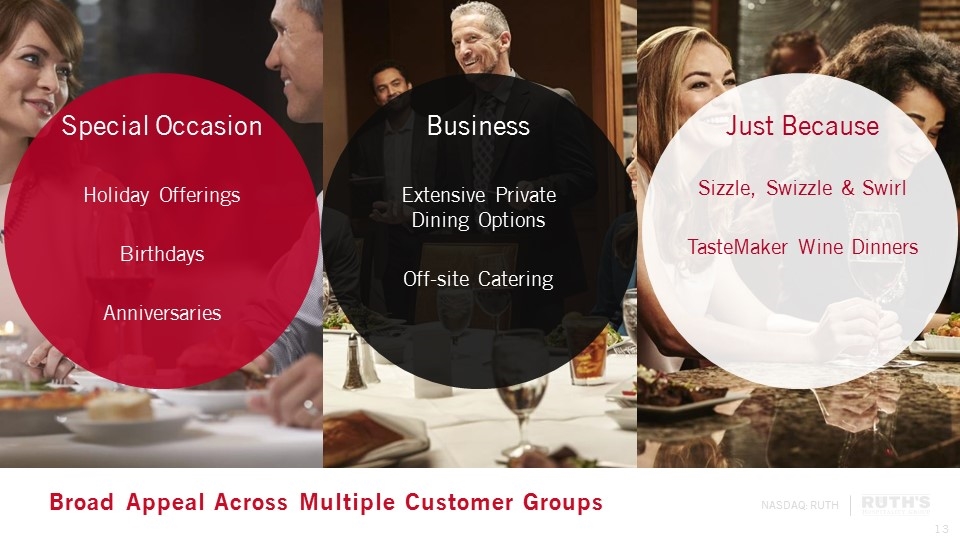
Broad Appeal Across Multiple Customer Groups Special Occasion Holiday Offerings Birthdays Anniversaries Business Extensive Private Dining Options Off-site Catering Just Because Sizzle, Swizzle & Swirl TasteMaker Wine Dinners
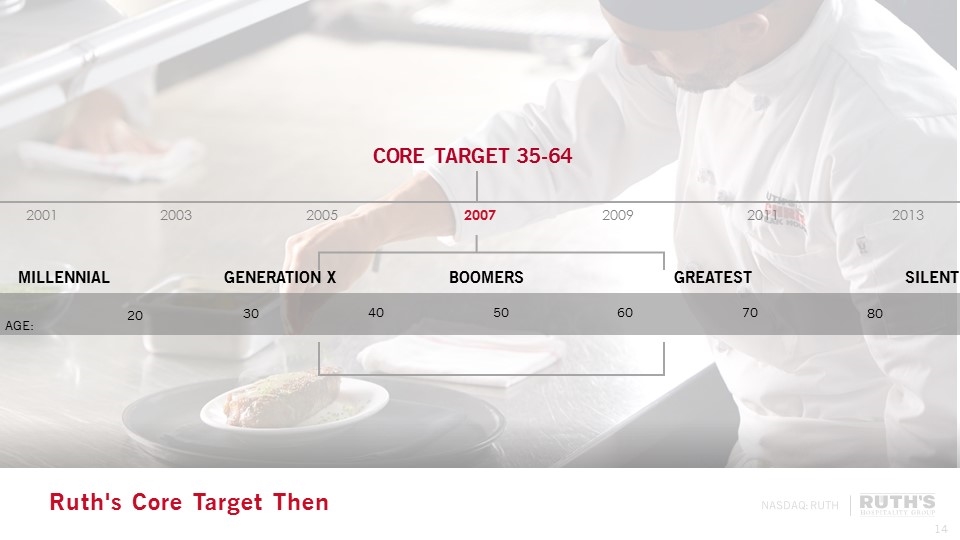
2007 2009 2011 2013 2003 2005 CORE TARGET 35-64 2001 NASDAQ: RUTH NASDAQ: RUTH GREATEST BOOMERS GENERATION X SILENT MILLENNIAL AGE: 40 50 60 70 80 90 30 20 Ruth's Core Target Then
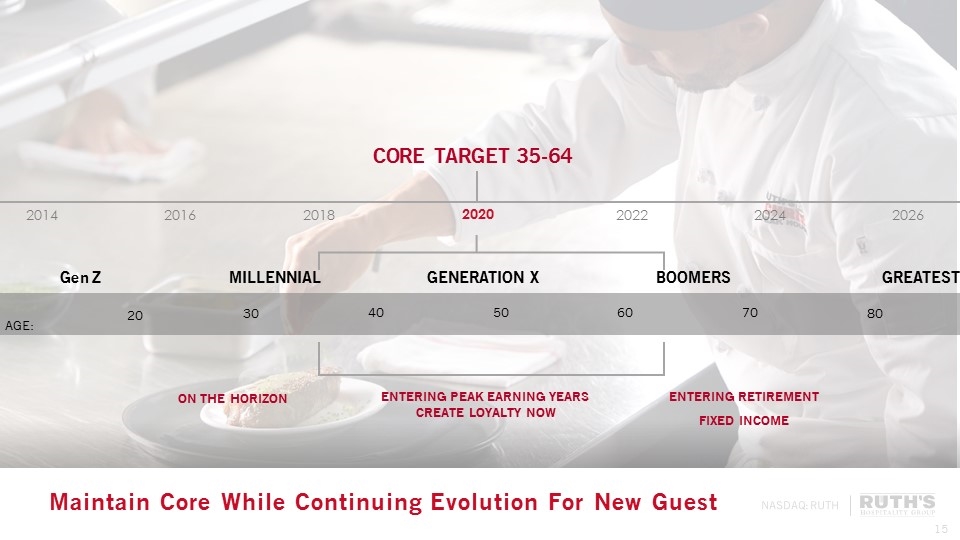
2020 2022 2024 2026 2016 2018 CORE TARGET 35-64 2014 NASDAQ: RUTH NASDAQ: RUTH GREATEST BOOMERS GENERATION X MILLENNIAL AGE: 40 50 60 70 80 90 30 20 Gen Z ON THE HORIZON ENTERING PEAK EARNING YEARS CREATE LOYALTY NOW Maintain Core While Continuing Evolution For New Guest ENTERING RETIREMENT FIXED INCOME

Experience Variety Leveraging Guest Research To Inform Evolution

Amplify Experiences ELEVATE TRADITIONAL STEAK HOUSE EXPERIENCE INCREASE Share Of Life THROUGH VARIETY CREATE NEW WAYS TO EXPERIENCE RUTH’S NASDAQ: RUTH NASDAQ: RUTH Ruth's Reimagined Summary
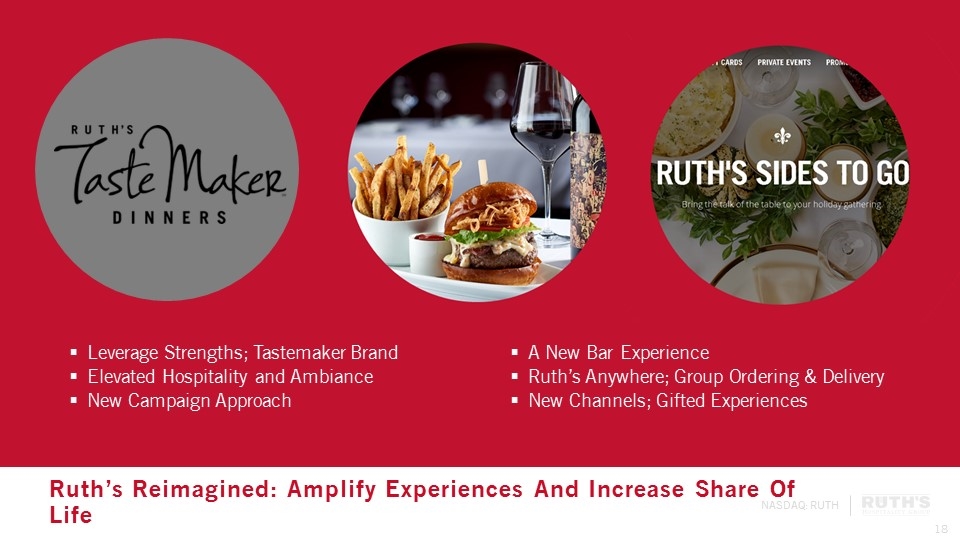
Ruth’s Reimagined: Amplify Experiences And Increase Share Of Life Leverage Strengths; Tastemaker Brand Elevated Hospitality and Ambiance New Campaign Approach A New Bar Experience Ruth’s Anywhere; Group Ordering & Delivery New Channels; Gifted Experiences
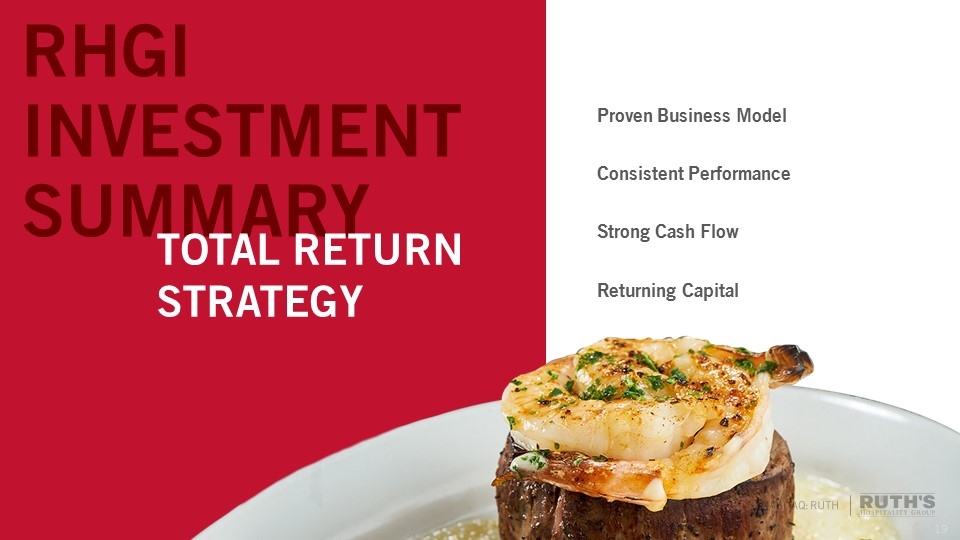
RHGI INVESTMENT SUMMARY TOTAL RETURN STRATEGY NASDAQ: RUTH Proven Business Model Consistent Performance Strong Cash Flow Returning Capital
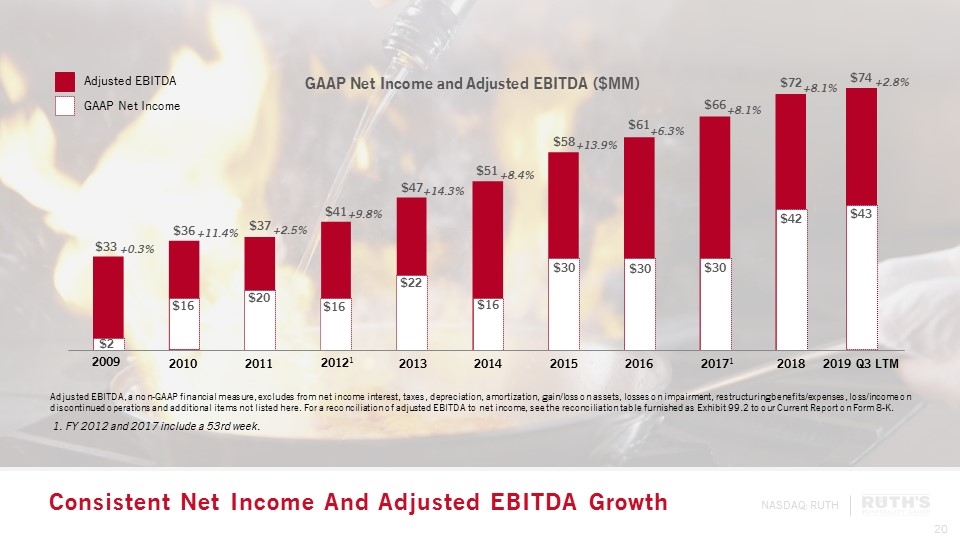
Consistent Net Income And Adjusted EBITDA Growth +0.3% +11.4% +2.5% +9.8% +14.3% +8.4% +13.9% +6.3% +8.1% 1. FY 2012 and 2017 include a 53rd week. +8.1% 2009 2010 2011 20121 2013 2014 2015 2016 20171 2018 GAAP Net Income and Adjusted EBITDA ($MM) $33 $36 $37 $41 $47 $51 $58 $61 $66 $72 $2 $16 $20 $16 $22 $16 $30 $30 $30 $42 Adjusted EBITDA GAAP Net Income Adjusted EBITDA, a non-GAAP financial measure, excludes from net income interest, taxes, depreciation, amortization, gain/loss on assets, losses on impairment, restructuring benefits/expenses, loss/income on discontinued operations and additional items not listed here. For a reconciliation of adjusted EBITDA to net income, see the reconciliation table furnished as Exhibit 99.2 to our Current Report on Form 8-K. 2019 Q3 LTM $74 +2.8% $43
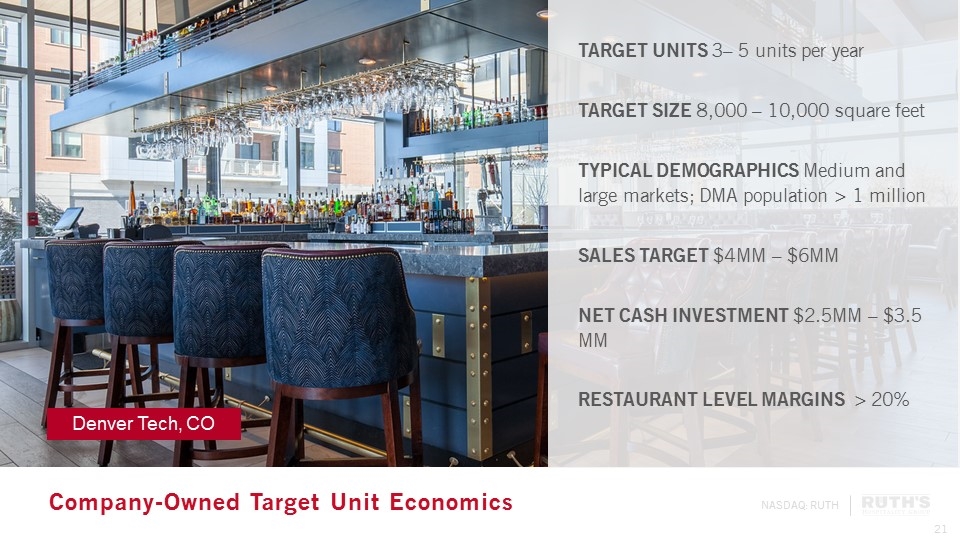
Company-Owned Target Unit Economics TARGET UNITS 3– 5 units per year TARGET SIZE 8,000 – 10,000 square feet TYPICAL DEMOGRAPHICS Medium and large markets; DMA population > 1 million SALES TARGET $4MM – $6MM NET CASH INVESTMENT $2.5MM – $3.5 MM RESTAURANT LEVEL MARGINS > 20% Denver Tech, CO
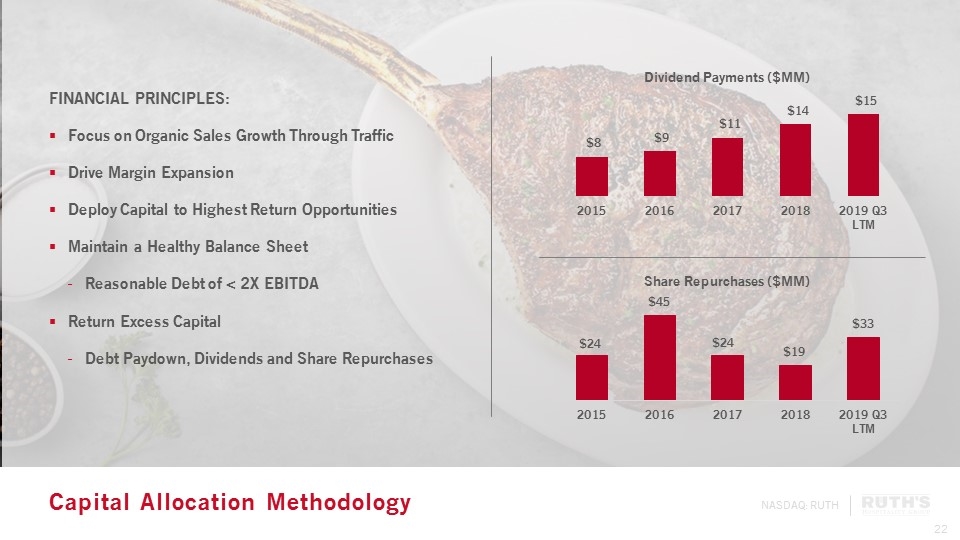
Capital Allocation Methodology FINANCIAL PRINCIPLES: Focus on Organic Sales Growth Through Traffic Drive Margin Expansion Deploy Capital to Highest Return Opportunities Maintain a Healthy Balance Sheet Reasonable Debt of < 2X EBITDA Return Excess Capital Debt Paydown, Dividends and Share Repurchases

THANK YOU BREAKOUT 11:00 – 11:50 AM – Mediterranean Salon 8 BREAKOUT 1:30 – 2:20 PM – Mediterranean Salon 8
PROVEN BUSINESS MODEL WITH A LONG HISTORY OF SUCCESS High-end fine-dining steak experience remains timeless after more than 50 years RECORD OF CONSISTENT PERFORMANCE DRIVEN BY OPERATIONAL EXCELLENCE Consistent Revenue, Net Income, EBITDA and EPS Growth STRONG CASH FLOW SUPPORTS MULTIPLE LEVERS TO DRIVE SHAREHOLDER RETURN Focused on disciplined deployment of capital and augmenting returns to shareholders through dividends, share repurchases and debt repayment RHGI INVESTMENT SUMMARY Returned over $270MM to shareholders since 2011 through dividends and share repurchases NASDAQ: RUTH
