Attached files
Table of Contents
SECURITIES AND EXCHANGE COMMISSION
Washington, D.C. 20549
FORM 10-K
(Mark One)
| x | ANNUAL REPORT PURSUANT TO SECTION 13 OR 15(d) OF THE SECURITIES EXCHANGE ACT OF 1934 |
FOR THE FISCAL YEAR ENDED DECEMBER 27, 2009
OR
| ¨ | TRANSITION REPORT PURSUANT TO SECTION 13 OR 15(d) OF THE SECURITIES EXCHANGE ACT OF 1934 |
For the transition period from to .
Commission File Number 000-51485
RUTH’S HOSPITALITY GROUP, INC.
(Exact Name of Registrant as Specified in its Charter)
| Delaware | 72-1060618 | |
| (State or Other Jurisdiction of Incorporation or Organization) |
(I.R.S. Employer Identification No.) |
| 400 International Parkway, Suite 325 Heathrow, Florida |
32746 | |
| (Address of Principal Executive Offices) | (Zip Code) |
Registrant’s Telephone Number, Including Area Code: (407) 333-7440
| Securities Registered Pursuant to Section 12(b) of the Act: Common stock, par value $0.01 per share |
The NASDAQ Stock Market LLC (Name of exchange on which registered) | |
| (Title of class) |
Securities Registered Pursuant to Section 12(g) of the Act:
None
Indicate by check mark if the registrant is a well-known seasoned issuer, as defined in Rule 405 of the Securities Act. Yes ¨ No x
Indicate by check mark if the registrant is not required to file reports pursuant to Section 13 or Section 15(d) of the Act. Yes ¨ No x
Indicate by check mark whether the registrant (1) has filed all reports required to be filed by Section 13 or 15(d) of the Securities Exchange Act of 1934 during the preceding 12 months (or for such shorter period that the registrant was required to file such reports), and (2) has been subject to such filing requirements for the past 90 days. Yes x No ¨
Indicate by check mark whether the registrant has submitted electronically and posted on its corporate Web site, if any, every Interactive Data File required to be submitted and posted pursuant to Rule 405 of Regulation S-T during the preceding 12 months (or for such shorter period that the registrant was required to submit and post such files). Yes ¨ No ¨
Indicate by check mark if disclosure of delinquent filers pursuant to Item 405 of Regulation S-K is not contained herein, and will not be contained, to the best of registrant’s knowledge, in definitive proxy or information statements incorporated by reference in Part III of this Form 10-K or any amendment to this Form 10-K. ¨
Indicate by check mark whether the registrant is a large accelerated filer, an accelerated filer, a non-accelerated filer or a smaller reporting company. See the definitions of “large accelerated filer,” “accelerated filer” and “smaller reporting company” in Rule 12b-2 of the Exchange Act (check one):
| Large accelerated filer ¨ | Accelerated filer x | |
| Non-accelerated filer ¨ (Do not check if smaller reporting company) | Smaller reporting company ¨ |
Indicate by check mark whether the registrant is a shell company (as defined in Rule 12b-2 of the Exchange Act). Yes ¨ No x
As of June 28, 2009, the last day of the registrant’s most recently completed second fiscal quarter, the aggregate market value of the registrant’s common stock, par value $0.01 per share, held by non-affiliates of the registrant was approximately $90,384,787.
The number of shares outstanding of the registrant’s common stock as of March 5, 2010, was 34,352,455.
DOCUMENTS INCORPORATED BY REFERENCE
The information required by Part III of Form 10-K, to the extent not set forth herein, is incorporated herein by reference to the registrant’s Proxy Statement for the 2010 Annual Meeting of Shareholders to be held on or around May 26, 2010, to be filed with the Securities and Exchange Commission pursuant to Regulation 14A not later than 120 days after the close of the registrant’s fiscal year.
Table of Contents
1
Table of Contents
FORWARD LOOKING STATEMENTS
This Annual Report on Form 10-K and the materials incorporated by reference herein contain “forward-looking statements” that reflect, when made, the Company’s expectations or beliefs concerning future events that involve risks and uncertainties. Forward-looking statements frequently are identified by the words “believe,” “anticipate,” “expect,” “estimate,” “intend,” “project,” “will be,” “will continue,” “will likely result,” or other similar words and phrases. Similarly, statements herein that describe the Company’s objectives, plans or goals also are forward-looking statements. Actual results could differ materially from those projected, implied or anticipated by the Company’s forward-looking statements. Some of the factors that could cause actual results to differ include: changes in economic conditions and general trends; the loss of key management personnel; the effect of market volatility on the Company’s stock price; health concerns about beef or other food products; the effect of competition in the restaurant industry; changes in consumer preferences or discretionary spending; reductions in the availability of, or increases in the cost of, USDA Prime grade beef, fish and other food items; labor shortages or increases in labor costs; the impact of federal, state or local government regulations relating to Company employees, the sale or preparation of food, the sale of alcoholic beverages and the opening of new restaurants; harmful actions taken by the Company’s franchisees; the Company’s ability to protect its name and logo and other proprietary information; the impact of litigation; the restrictions imposed by the Company’s credit agreement; and failure of internal controls over financial reporting. For a discussion of these and other risks and uncertainties that could cause actual results to differ from those contained in the forward-looking statements, please see Item 1A. “Risk Factors” in this Annual Report on Form 10-K as well as the Company’s other filings with the Securities and Exchange Commission (the “SEC”), all of which are available on the SEC’s website at www.sec.gov. All forward-looking statements are qualified in their entirety by this cautionary statement, and the Company undertakes no obligation to revise or update this Annual Report on Form 10-K to reflect events or circumstances after the date hereof. Stockholders and other security holders or buyers of the Company’s securities or its other creditors should not assume that material events subsequent to the date of this report have not occurred.
Unless the context otherwise indicates, all references in this report to the “Company,” “Ruth’s Chris,” “we,” “us” or “our” or similar words are to Ruth’s Hospitality Group, Inc., and its wholly owned subsidiaries.
2
Table of Contents
PART I
| Item 1. | BUSINESS |
Introduction
Ruth’s Hospitality Group, Inc. is a leading restaurant company focused on the upscale dining segment. The Company owns the Ruth’s Chris Steak House, Mitchell’s Fish Market, Columbus Fish Market, Mitchell’s Steakhouse and Cameron’s Steakhouse concepts. As of December 27, 2009, there were 130 Ruth’s Chris Steak House restaurants, of which 64 were company-owned and 66 were franchisee-owned, including fourteen international franchisee-owned restaurants in Aruba, Canada, China (Hong Kong), Mexico, Japan, Taiwan, and the United Arab Emirates. The Company also operates 19 Mitchell’s Fish Markets and three Cameron’s Steakhouse restaurants, located primarily in the mid-west and Florida.
We have a 52/53 week fiscal year ending the last Sunday in December. Our 2009 fiscal year ended December 27, 2009, our 2008 fiscal year ended December 28, 2008, and our 2007 fiscal year ended December 30, 2007. Fiscal years 2009, 2008 and 2007 each had 52 weeks.
The following description of our business should be read in conjunction with the information in our Management’s Discussion and Analysis of Results of Operations of Financial Condition incorporated by reference in Item 7 of this Form 10-K and our consolidated financial statements located elsewhere in this Form 10-K.
Background
The Company was founded in 1965 when Ruth Fertel mortgaged her home for $22,000 to purchase the “Chris Steak House,” a 60-seat restaurant located near the New Orleans Fair Grounds racetrack. After a fire destroyed the original restaurant, Ruth relocated her restaurant to a new 160-seat facility nearby. As the terms of the original purchase prevented the use of the “Chris Steak House” name at a new location, Ruth added her name to that of the original restaurant—thus creating the “Ruth’s Chris Steak House” brand.
The Company’s expansion began in 1972, when Ruth opened a second restaurant in Metairie, a suburb of New Orleans. In 1976, the first franchisee-owned Ruth’s Chris Steak House opened in Baton Rouge, Louisiana. In July 1999, affiliates of Madison Dearborn Partners LLC (“Madison Dearborn”) and certain unaffiliated investors acquired all of the Company’s outstanding capital stock. On May 19, 2005, the Company reincorporated in Delaware by merging Ruth’s Chris Steak House, Inc., a Louisiana corporation, into a newly formed Delaware subsidiary. In August 2005, the Company and certain selling shareholders completed an initial public offering of the Company’s common stock, which is currently listed on the Nasdaq Global Select Market.
On February 19, 2008, the Company acquired all of the operating assets and intellectual property of Columbus, Ohio based Mitchell’s Fish Market, which operates 19 restaurants operating under the names Mitchell’s Fish Market and Columbus Fish Market, and Cameron’s Steakhouse, which operates three restaurants operating under the names Cameron’s Steakhouse and Mitchell’s Steakhouse, from Cameron Mitchell Restaurants, LLC (CMR).
In connection with the acquisition, the Company changed its name from Ruth’s Chris Steak House, Inc. to Ruth’s Hospitality Group, Inc. The name change was made in order for the Company to have a name that would better represent the business after the acquisition, as the Company began operating some restaurants that are not considered steak houses. The name change was approved by our stockholders at our 2008 annual meeting and became effective on May 23, 2008.
1
Table of Contents
2009 Developments
| • | On February 26, 2009, the Company announced that it had signed a First Amendment to its First Amended and Restated Credit Agreement to provide the Company with requested covenant relief and to make other changes to the existing agreement. The Amendment decreased the Company’s Fixed Charge Coverage Ratio and increased its maximum Leverage Ratio, in each case beginning with the fourth quarter of 2008 continuing through the second quarter of 2010, after which these two covenants reset to their original levels. The Amendment also added two new covenants, a minimum EBITDA test as well as restrictions on capital expenditures. |
| • | On February 28, 2009 the Company closed its San Juan, Puerto Rico Ruth’s Chris Steak House location after choosing not to renew an expiring lease. This restaurant reopened as a franchise in the fourth quarter of 2009. |
| • | On May 23, 2009 the Company closed an underperforming Ruth’s Chris Steak House restaurant in Naples, Florida. |
| • | On June 25, 2009, the company filed a shelf registration statement on Form S-3 with the SEC to allow the company to raise capital through the sale of securities. |
| • | On December 22, 2009 the Company announced a plan to raise $25 million via a subscription rights offering to existing shareholders, and a sale of $25 million of preferred stock to Bruckmann, Rosser, Sherrill & Co. III, L.P. and BRS Coinvestor III, L.P. The transaction closed on February 12, 2010 resulting in a $44.3 million paydown on the Company’s revolving credit facility. As a result of this repayment and satisfaction of other agreed-upon conditions, the Second Amendment to the Credit Agreement also became effective on this date. The Second Amendment to the Credit Agreement extended the maturity of the facility by two years and provided the Company with a less restrictive set of covenants. |
Restaurant Concepts
Ruth’s Chris Steak House
With 130 locations, Ruth’s Chris Steak House is the largest upscale steakhouse company in the world. The menu features a broad selection of high-quality USDA Prime grade steaks and other premium offerings served in Ruth’s Chris’ signature fashion—“sizzling” and topped with seasoned butter—complemented by other traditional menu items inspired by its New Orleans heritage. Ruth’s Chris complements its distinctive food offerings with an award-winning wine list, featuring bottles priced between $24 and $2,000 and many selections offered by the glass.
The Ruth’s Chris brand reflects its more than 40-year commitment to the core values instilled by its founder, Ruth Fertel, of caring for guests by delivering the highest quality food, beverages and genuine hospitality in a warm and inviting atmosphere.
Mitchell’s Fish Market
Acquired by the Company in 2008, Mitchell’s Fish Market is a 19 location upscale seafood concept whose success has been built on a reputation for excellent guest service and a superior menu featuring the freshest seafood flown in daily from around the world. Mitchell’s Fish Market is open for both lunch and dinner, offering a menu of more than 80 seafood choices that changes frequently based on availability and season. Popular menu items include the Mitchell’s Fish Market 12 Species of Fresh Catch, top quality fish selections that are hand filleted in a temperature controlled seafood cutting room.
Mitchell’s/Cameron’s Steakhouse
Mitchell’s/Cameron’s Steakhouse is a modern American steakhouse concept offering hand selected prime steaks aged to perfection, along with a selection of true Japanese Kobe beef. Complementing its selection of
2
Table of Contents
prime steaks and the freshest seafood are house-made side dishes and a wine list featuring 200 of the world’s finest labels. Mitchell’s Steakhouse has two locations in the Columbus, Ohio area. Cameron’s Steakhouse is located in Birmingham, MI.
Our Strengths
The Company believes that the key strengths of its business model are the following:
Premier Upscale Steakhouse Brand
The Company believes that Ruth’s Chris is one of the strongest brands in the upscale steakhouse segment of the restaurant industry. The Company’s Ruth’s Chris restaurants continue to receive numerous awards at the local and national level. Many continue to be ranked best steakhouse by local publications in the areas in which they operate. In addition, the Company has been recognized for its award-winning core wine list, for which a majority of its company-owned restaurants received “Awards of Excellence” from Wine Spectator magazine in 2009.
Premier Upscale Casual Seafood Concept
Mitchell’s Fish Market is an award-winning, upscale, yet comfortable, seafood restaurant and bar recognized for its high-quality food, contemporary dining atmosphere, and excellent service. Mitchell’s Fish Market is committed to fresh seafood with all of its seafood flown in daily. Year after year, Mitchell’s Fish Market continues to earn “best seafood restaurant” awards from guests and publications as well as recognition for its high-quality food, warm and inviting atmosphere and excellent service.
Appealing Dining Experience
At our Ruth’s Chris restaurants, the Company seeks to exceed guests’ expectations by offering high-quality food with courteous, friendly service in the finest tradition of Southern hospitality. The Company’s entire restaurant staff is dedicated to ensuring that guests enjoy a superior dining experience. The Company’s team-based approach to table service is designed to enhance the frequency of guest contact and speed of service without intruding on the guest experience.
Mitchell’s Fish Market upscale casual restaurants, with their sophisticated yet comfortable atmosphere and emphasis on fresh seafood, complement our Ruth’s Chris restaurants. The Company believes that Mitchell’s Fish Market shares many characteristics of the Ruth’s Chris model, including solid unit economics and broad guest appeal.
Solid Unit Economics
The Company believes that it has successfully operated restaurants in a wide range of markets and achieved attractive rates of return on invested capital. The Company’s five newest company-owned Ruth’s Chris Steak House restaurants that opened in 2008 generated average unit volumes of approximately $4.6 million in fiscal 2009, compared to average unit volumes of approximately $3.9 million in fiscal 2009 for the other company-owned Ruth’s Chris Steak House restaurants opened at least 15 months.
3
Table of Contents
Our Strategy
The Company believes there continues to be opportunities to grow its business, strengthen its competitive position and enhance its brand through the continued implementation of the following strategies:
Improve Sales/Profitability
The Company intends to improve profitability by continuing to implement key operating initiatives. These operating initiatives include:
| • | ensuring consistency of food quality through more streamlined preparation and presentation; |
| • | increasing emphasis on wine sales by providing wine education for managers; |
| • | increasing brand awareness through enhanced media plans at the national and local levels; |
| • | enhancing and/or developing innovative marketing programs, such as its websites, www.ruthschris.com, www.mitchellsfishmarket.com, www.mitchellssteakhouse.com, and www.camerons-steakhouse.com, social media, and email communication; and |
| • | creating and/or enhancing revenue opportunities via Ruth’s Catering, Private Dining, HD Satellite Programs and Gift Cards. |
Expand Relationships with New and Existing Franchisees
The Company intends to grow its franchising business by developing relationships with a limited number of new franchisees and by expanding the rights of existing franchisees to open new restaurants. The Company believes that building relationships with quality franchisees is a cost-effective way to strengthen the Ruth’s Chris brand and generate additional revenues. Franchisees opened 42 Ruth’s Chris restaurants from 1999 to the end of 2009. In fiscal 2009, existing and new franchisees opened four and two restaurants, respectively. During fiscal 2009, the Company also entered into four development agreements with new franchisees. Overall, there are 17 outstanding franchise locations to be built as of December 27, 2009. The Company intends to continue to focus on providing operational guidance to its franchisees, including the sharing of “best practices” from company-owned Ruth’s Chris restaurants.
The Company currently is evaluating plans to franchise Mitchell’s Fish Market.
Menu
Ruth’s Chris Steak House
The Ruth’s Chris menu features a broad selection of high-quality USDA Prime grade steaks and other premium offerings served in Ruth’s Chris signature fashion—“sizzling” and topped with seasoned butter—complemented by other traditional menu items inspired by its New Orleans heritage. USDA Prime is a meat grade label, which refers to the evenly distributed marbling that enhances the flavor of the steak. The Ruth’s Chris menu also includes premium quality lamb chops, veal chops, fish, chicken and lobster. Dinner entrees are generally priced from $18.00 to $47.00. While Ruth’s Chris is predominantly open dinner hours only, seven select locations open for lunch five days a week and an additional ten locations open for lunch one day per week. The lunch menu offers entrees generally ranging in price from $13.00 to $29.00. The blended guest check average at Ruth’s Chris is approximately $69.00. The Ruth’s Chris core menu is similar at all of its restaurants. The Company occasionally introduces new items such as specials and prix-fixe offerings that allow it to give its guests additional choices while taking advantage of fresh sourcing and advantageous cost opportunities. In 2009, Ruth’s Chris introduced Ruth’s Classics, a three course prix fixe meal designed to offer great value and a certainty of price point.
The Company’s Ruth’s Chris restaurants offer ten to thirteen standard appetizer items, including New Orleans-style barbequed shrimp, mushrooms stuffed with crabmeat, shrimp remoulade, Louisiana seafood gumbo, lobster bisque, crabtini, as well as seven different salads. They also offer seven to nine types of potatoes
4
Table of Contents
and eight to ten types of vegetables as side dishes ranging in price from $7.00 to $10.00. For dessert, crème brulee, bread pudding with whiskey sauce, chocolate sin cake, fresh seasonal berries with sweet cream sauce and other selections are available for $6.00 to $9.00 each.
The Company’s wine list features bottles typically ranging in price from $24 to $2,000. Individual restaurants supplement their 200-bottle core wine list with a minimum of 50 additional selections that reflect local market tastes. Most of the Company’s Ruth’s Chris restaurants also offer approximately 30 to 40 wines-by-the-glass and numerous beers, liquors and alcoholic dessert drinks. Wine sales account for approximately 65% of the total beverage sales.
Mitchell’s Fish Market
Although the menu changes frequently based on availability and season, it includes more than 80 seafood choices, including fish from all over the world. Popular menu items include the Mitchell’s Fish Market 12 Species of Fresh Catch, top quality fish selections that are hand filleted on-site in a temperature controlled seafood cutting room. The Mitchell’s Fish Market menu offers traditional seafood favorites such as Chesapeake Bay Crab Cakes and Fish and Chips, as well as more innovative offerings such as Cedar Planked Salmon and Pumpkin Seed crusted Tilapia. Menu offerings also include non-seafood items such as steak and chicken. Mitchell’s Fish Market also offers an award winning dessert menu that features desserts such as Seven-Layer Carrot Cake, Sharkfin Pie and other selections.
Mitchell’s Fish Markets are open for lunch and dinner daily. Lunch entrees are priced from $8.50 to $18.95, while dinner entrees are priced from $15.50 to $29.95. The Mitchell’s Fish Market blended check average is approximately $34.00. The Mitchell’s Fish Market core menu is similar at all 19 company-owned restaurants. Mitchell’s Fish Markets introduced a three course prix-fixe meal in 2009 to offer guests great value.
The Mitchell’s Fish Market core wine list features bottles typically ranging in price from $26 to $195. Individual restaurants supplement their approximately 60 bottle core wine list with a minimum of 15 to 20 additional selections that reflect local market tastes. Restaurants also offer approximately 24 types of wine-by-the-glass. Wine sales account for approximately 51% of the total beverage sales.
Purchasing
The Company’s ability to maintain consistent quality throughout its restaurants depends in part upon its ability to acquire food and other supplies from reliable sources in accordance with its specifications. Purchasing at the restaurant level is directed primarily by the executive chef, who is trained in the Company’s purchasing philosophy and specifications, and who works with its regional and corporate managers to ensure consistent sourcing of meat, fish, produce and other supplies.
During fiscal 2009 the Company purchased more than 60% of the beef it used in its company-owned Ruth’s Chris restaurants from one vendor, New City Packing Company, Inc. In addition, the Company has a long-term distribution arrangement with a national food and restaurant supply distributor, Distribution Market Advantage, Inc. (DMA), which purchases products for the Company from various suppliers and through which currently all 64 of its company-owned Ruth’s Chris Steak House restaurants receive a significant portion of their food supplies. The Company purchased more than 80% of the fresh seafood served in its Mitchell’s Fish Market from two vendors, Michael’s Finer Meats and Seafood and Save On Seafood Company.
Restaurant Operations and Management
Ruth’s Chris Steak House
The Ruth’s Chris Chief Operating Officer has primary responsibility for managing its company-owned restaurants and participates in analyzing restaurant-level performance and strategic planning. The Company has six regional vice presidents that oversee restaurant operations at nine to fourteen company-owned restaurants and one regional vice president that has oversight responsibility for franchise-owned restaurants.
5
Table of Contents
The Company’s typical company-owned restaurant employs five managers, including a general manager, two front-of-the-house managers, an executive chef and a sous chef. The Company’s company-owned restaurants also typically have approximately 70 hourly employees. The general manager of each restaurant has primary accountability for ensuring compliance with the Company’s operating standards. The front-of-the-house managers assist the general manager in the day-to-day operations of the restaurant and are directly responsible for the supervision of the bar, host, server, runner and service assistant personnel. The executive chef supervises and coordinates all back-of-the-house operations, including ensuring that its quality standards are being met while maintaining a safe, efficient and productive work environment.
Mitchell’s Fish Market
The Mitchell’s Fish Market Chief Operating Officer has primary responsibility for managing its restaurants and participates in analyzing restaurant-level performance and strategic planning. The Company has a Vice President of Operations and three regional directors that oversee restaurant operations at five to six company-owned restaurants.
The typical Mitchell’s Fish Market restaurant employs five to six managers based on sales volume, including a general manager, two dining room managers, an executive chef and one or two sous chefs. The restaurants also typically have approximately 70 hourly employees. The general manager of each restaurant has primary accountability for ensuring compliance with the Company’s operating standards. The front-of- the-house managers assist the general manager in the day-to-day operations of the restaurant and are directly responsible for the supervision of the bar, host, server, runner and service assistant personnel. The executive chef supervises and coordinates all back-of-the-house operations, including ensuring that its quality standards are being met while maintaining a safe, efficient and productive work environment.
Quality Control
The Company strives to maintain quality and consistency in its company-owned Ruth’s Chris and Mitchell’s Fish Market restaurants through careful training and supervision of personnel and standards established for food and beverage preparation, maintenance of facilities and conduct of personnel. The primary goal of the Company’s training and supervision programs is to ensure that its employees display the characteristics of its brand and values that distinguish it from its competitors. Restaurant managers in its Ruth’s Chris company-owned restaurants must complete a training program that is typically seven weeks long, during which they are instructed in multiple areas of restaurant management, including food quality and preparation, guest service, alcoholic beverage service, liquor regulation compliance and employee relations. Restaurant managers also receive operations manuals relating to food and beverage preparation and restaurant operations. The Ruth’s Chris Steak House restaurants employ Steritech, a third-party food safety firm to ensure proper training, routine inspections and achieving the highest standards for cleanliness throughout the restaurant. The Company instructs chefs and assistants on safety, sanitation, housekeeping, repair and maintenance, product and service specifications, ordering and receiving food products and quality assurance.
Restaurant managers in its Mitchell’s Fish Markets are certified by the National Restaurant Association Educational Foundation (NRAEF) for food safety. The Company also employs CNS FoodSafe, a third-party food safety firm which developed a program exclusively for Mitchell’s Fish Markets to ensure proper training, routine inspections and achieving the highest standards for cleanliness throughout the restaurant. General managers and certified coaches provide all other employee training at the restaurants. The Company requires that all restaurant-level employees be able to demonstrate knowledge of its systems, standards and operating philosophy.
On a daily basis at our Ruth’s Chris restaurants, the executive chef, together with the restaurant managers, oversees a line check system of quality control and must complete a quality assurance checklist verifying the flavor, presentation and proper temperature of the food and beverages. At our Mitchell’s Fish Markets, quality
6
Table of Contents
checks are performed twice daily by the chef and management team to verify stringent specifications for flavor, presentation and that proper temperature of food and beverages are met. In addition, the Company’s regional vice presidents and directors perform system-wide quality assessments of all aspects of restaurant operations, with a focus on back-of-the-house functions, on a regular basis.
Marketing and Promotions
The goals of the Company’s marketing efforts are to increase comparable restaurant sales by attracting new guests, increase the frequency of visits by current guests, improve brand recognition in new markets or markets where it intends to open a restaurant and to communicate the overall uniqueness, value and quality exemplified by our restaurants. The Company uses multiple media channels to accomplish these goals and complements its national advertising with targeted local media such as print, radio and outdoor.
Advertising
In fiscal 2009, the Company spent $11.7 million, or 3.5% of its revenues, in total advertising expenditures. Of its total advertising expenditures, $8.0 million, or 68%, was spent on local media and local events. This local media spending was split between local, entertainment and business magazines and newspapers, outdoor billboards and airport dioramas, local radio, internet media and local community events such as golf tournaments, art gatherings and charitable events. In fiscal 2009, the Company spent approximately $3.7 million, or 32% of total advertising expenditures, on national media for the Ruth’s Chris Steak House brand, consisting primarily of national radio and national magazines, and also including in-flight magazines, sponsorships, online initiatives and consumer research.
In fiscal 2009, the Company optimized its online marketing efforts for all brands. Online advertisements appeared on highly visited sites. The Company also utilized paid search at the main internet search sites. The Company used local online advertising for sites catering to company and franchise geographic locations. Ruth’s Chris website was upgraded with additional functionality to allow restaurants to promote local events in their community. A Catering micro-site was launched in conjunction with the national launch of Ruth’s Chris catering. Additionally, we created Wireless Application Protocol enabled mobile sites for Blackberry and iPhone devices. The Company’s online strategy also included an increased emphasis on targeted emails with special offers and announcements. Communication included seasonal specials, holiday offers, and personalized birthday and anniversary invitations.
Ruth’s Chris Steak House’s current food-focused advertising campaign is integrated into all marketing communications including television, radio, print and outdoor advertisement. In addition, the Company uses its websites, www.ruthschris.com, www.mitchellsfishmarket.com, www.mitchellssteakhouse.com and www.camerons-steakhouse.com to help increase brand identity and facilitate online reservations and gift card sales. In fiscal 2009, Ruth’s Chris Steak House participated in co-branded campaigns with American Express Membership Rewards program and participated in direct marketing initiatives. Many of the Company’s locations also schedule events to strengthen community ties and increase local market presence. The Company’s franchisees also conduct their own local media and advertising plans.
At Mitchell’s and Columbus Fish Markets “Fish any Fresher would still be in the Ocean” advertising campaign and branding message is integrated into all marketing communications. Local-radio DJ endorsements and local print media placements are used to keep the concept top of mind with consumers and several sweepstakes throughout the year provide a valuable means of extending reach and gathering consumer data.
Mitchell’s and Cameron’s Steakhouses receive marketing support with print media, as well as targeted sponsorship opportunities in their communities.
7
Table of Contents
Gift Cards
The Company sells Ruth’s Chris gift cards at its Ruth’s Chris Steak House restaurants (with the exception of its Aruba, Hong Kong, Japan and Taiwan locations), through its toll-free reservation system and on its website. In 2009, the online ordering site was updated and streamlined to include new functionality such as the ability to ship multiple cards to multiple addresses within one order. Ruth’s Chris patrons frequently purchase gift cards for holidays, including Christmas, Hanukkah, Valentine’s Day, Mothers’ Day and Fathers’ Day, and other special occasions such as birthdays, graduations and anniversaries. These gift cards are popular as holiday gifts and among business professionals celebrating promotions. In fiscal 2009, system-wide gift card sales were approximately $40.8 million. Ruth’s Chris gift cards are redeemable at both company- and franchise-owned Ruth’s Chris restaurants.
The Company sells Mitchell’s gift cards at its Mitchell’s Steak House and Mitchell’s Fish Market restaurants and on its website. In fiscal 2009, system-wide gift card sales were approximately $2.5 million. Mitchells’ gift cards are redeemable at Mitchell’s Fish Market, Mitchell’s Steakhouse, Columbus Fish Market and Cameron’s Steakhouse restaurants.
Franchise Program and Relationship
The Company’s 66 franchise-owned Ruth’s Chris restaurants are owned by 27 franchisees with the three largest franchisees owning nine, eight, and six restaurants, respectively. Currently, the Company has open agreements with franchisees for an aggregate of 17 additional Ruth’s Chris restaurants. Prior to 2004, each franchisee entered into a ten-year franchise agreement with three ten-year renewal options for each restaurant. Each agreement grants the franchisee territorial protection, with the option to develop a certain number of restaurants in their territory. The Company’s franchise agreements generally include termination clauses in the event of nonperformance by the franchisee and non-compete clauses if the agreement is terminated. To date, only five franchisees have had the Company’s franchise agreement terminated or a restaurant closed as a result of nonperformance.
Under the Company’s franchise program, the Company offers certain services and licensing rights to the franchisee to help maintain consistency in system-wide operations. The Company’s services include training of personnel, site selection and construction assistance, providing the new franchisee with standardized operating procedures and manuals, business and financial forms, consulting with the new franchisee on purchasing and supplies and performing supervisory quality control services. The Company conducts reviews of its franchisee-owned restaurants on an ongoing basis, in order to ensure compliance with its standards.
Under the Company’s franchise program, each franchise arrangement consists of a development agreement, if multiple restaurants are to be developed, with a separate franchise agreement executed for each restaurant. The Company’s new form of development agreement grants exclusive rights to a franchisee to develop a minimum number of restaurants in a defined area, typically during a five-year period. Individual franchise agreements govern the operation of each restaurant opened and have a 20-year term with two renewal options each for additional 10-year terms if certain conditions are met. The Company’s new form of franchise agreement requires franchisees to pay a 5% royalty on gross revenues plus up to a 1% advertising fee applied to national advertising expenditures. Under the Company’s prior form of franchise agreement, franchisees pay a 5% royalty on gross revenues, of which the Company has applied 1% to national advertising.
Under the Company’s form of development agreement, and unless agreed otherwise, the Company collects a $50,000 development fee, which is credited toward the $150,000 franchise fee, for each restaurant the franchisee has rights to develop. Under the Company’s new form of the franchise agreement, it collects up to $150,000 of the franchise fee at the time of executing the franchise agreement for each restaurant. If one restaurant is to be developed, a single unit franchise agreement is executed and the $150,000 franchise fee is collected at signing. To date, the Company has used its new form of agreement with fourteen new franchisees (four of which are located outside of the United States) and five existing franchisees.
8
Table of Contents
The Company’s existing franchise agreements signed before 2004 generally limit the number of restaurants each franchisee can develop to two. The Company expanded its domestic franchise base in 2004 by first offering existing franchisees the opportunity to open additional restaurants in its existing territories. In order to obtain these new rights, existing franchisees were required to sign the Company’s new form of development and franchise agreement which commits the franchisee to a store development schedule. These new franchise rights and obligations enable the Company to better manage the growth of its franchise system. The Company anticipates opening one to three franchise restaurants in 2010.
The Company currently is evaluating plans to franchise Mitchell’s Fish Market.
Information Systems and Restaurant Reporting
All of the Company’s restaurants use computerized point-of-sale systems, which are designed to improve operating efficiency, provide corporate management timely access to financial and marketing data and reduce restaurant and corporate administrative time and expense. These systems record each order and print the food requests in the kitchen for the cooks to prepare. The data captured for use by operations and corporate management includes gross sales amounts, cash and credit card receipts and quantities of each menu item sold. Sales and receipts information is generally transmitted to the corporate office daily, where it is reviewed and reconciled by the accounting department before being recorded in the accounting system.
The Company’s corporate systems provide management with operating reports that show company-owned restaurant performance comparisons with budget and prior year results. These systems allow the Company to monitor company-owned restaurant sales, food and beverage costs, labor expense and other restaurant trends on a regular basis.
Service Marks
The Company has registered the main service marks “Ruth’s Chris” and its “Ruth’s Chris Steak House, U.S. Prime & Design” logo, as well as other service marks used by its restaurants, including “Mitchell’s Fish Market” and the common law service marks “Mitchell’s Steakhouse,” “Columbus Fish Market” and “Cameron’s Steakhouse,” with the United States Patent and Trademark Office and in the foreign countries in which its restaurants operate. The Company has also registered in other foreign countries in anticipation of new store openings within those countries. The Company is not aware of any infringing uses that could materially affect its business. The Company believes that its service marks are valuable to the operation of its restaurants and are important to its marketing strategy.
Seasonality
The Company’s business is subject to seasonal fluctuations. Historically, the percentage of its annual revenues earned during the first and fourth fiscal quarters have been higher due, in part, to increased restaurant sales during the year-end holiday season.
9
Table of Contents
Employees
As of December 27, 2009, the Company employed 5,603 persons, of whom 475 were salaried and 5,128 were hourly personnel, who were employed in the positions set forth in the table below. None of the Company’s employees are covered by a collective bargaining agreement.
| Functional Area |
Number of Employees | |
| Senior Officers / Corporate VPs / Operations VPs |
25 | |
| General Managers |
82 | |
| Managers |
149 | |
| Regional Corporate Chefs / Executive Chefs |
94 | |
| Sous Chefs |
72 | |
| Non-salaried restaurant staff |
5,125 | |
| Corporate salaried |
53 | |
| Corporate non-salaried |
3 | |
| Total number of employees |
5,603 | |
Executive Officers of the Registrant
Certain information regarding our executive officers is provided below:
| Name |
Age | Position | ||
| Michael P. O’Donnell |
53 | President and Chief Executive Officer | ||
| Robert M. Vincent |
57 | Executive Vice President and Chief Financial Officer | ||
| Kevin W. Toomy |
55 | President, Chief Operating Officer of Ruth’s Chris Steak House | ||
| Samuel A. Tancredi |
57 | President, Chief Operating Officer of Mitchell’s Fish Market |
Michael P. O’Donnell has served as the Company’s President and Chief Executive Officer since August 2008. Prior to that, Mr. O’Donnell served as the Chief Executive Officer, President and Chairman of the Board of Champps Entertainment, Inc., an experience that culminated in the successful sale of the company to Fox and Hound Restaurant Group in late 2007. Prior to that, Mr. O’Donnell held the position of President, Chief Executive Officer and Director of Sbarro, Inc., where he was responsible for all operational and strategic aspects of managing more than 1,000 restaurants including Sbarro, Boulder Creek Steak & Saloon, Rothmann’s Steakhouse and Carmela’s of Brooklyn brands. Additionally, Mr. O’Donnell held the position of President and Chief Executive Officer of New Business at Outback Steakhouse, Inc., where he was responsible for all non-Outback Steakhouse brands. Prior to that, he served as President of the Roy’s brand at Outback Steakhouse, Inc. Mr. O’Donnell serves on the Board of Directors for Ruth’s Hospitality Group, Inc., Cosi, Inc., Sbarro, Inc., and Logan’s Roadhouse, Inc.
Robert M. Vincent has served as the Company’s Executive Vice President and Chief Financial Officer of Ruth’s Hospitality Group, Inc., since March 2008. From 2000 to 2008, Mr. Vincent served as Executive Vice President—Finance, Chief Financial Officer and Treasurer of Uno Restaurant Holdings Corporation, where he was responsible for the management of all accounting and financial activity for the system of more than 200 company-owned and franchised casual full-service restaurants. From 1992 to 2000, Mr. Vincent served as the Senior Vice President—Finance, Chief Financial Officer and Treasurer, and Vice President—Finance and Controller of Uno Restaurant Holdings Corporation. Additionally, Mr. Vincent served as the Chief Financial Officer for Omega Corporation from 1988 to 1992 and as the Vice President—Finance for Boston Restaurant Associates, Inc. from 1985 to 1988, where he was responsible for the management of financial activity for a chain of retail restaurants.
Kevin W. Toomy has served as President and Chief Operating Officer of Ruth’s Chris Steak House since March 2010. Prior to his promotion, Mr. Toomy served as the Company’s Senior Vice President since October 2008 and Vice President of Special Projects from September 2008 to October 2008. Prior to that, from August
10
Table of Contents
2007 to September 2008, he served as an independent restaurant consultant. Prior to that, from October 2002 to August 2007, he served as Owner and President of Goldcoast Seafood Grill in South Florida. He started his career serving as a General Manager for Steak & Ale, Corporation, and shortly thereafter, joined two former Steak & Ale executives to grow the now nationwide Houston’s restaurant brand. Kevin has also been a joint venture partner for the Roy’s and Outback Steakhouse brands.
Samuel A. Tancredi has served as the Company’s President and Chief Operating Officer of Mitchell’s Fish Market since March 2010. Prior to his promotion, Mr. Tancredi served as our Senior Vice President since December 2008. From May 2006 until his appointment as an officer of the Company, Mr. Tancredi was a Franchisee and Chief Operating Officer of six Paradise Bakery & Cafes in Indianapolis, Indiana. From February 2001 to October 2006, Mr. Tancredi served as President, Franchisee and Development Partner of nine Bonefish Grills for Indianapolis, Indiana based Fishbuds Inc. Prior to that, Mr. Tancredi served in leadership roles with Outback Steakhouse, Inc., Chi Chi’s and The Magic Pan.
Government Regulation
The Company is subject to extensive federal, state and local government regulation, including regulations relating to public health and safety, zoning and fire codes and the sale of alcoholic beverages and food. The Company maintains the necessary restaurant, alcoholic beverage and retail licenses, permits and approvals. Federal and state laws govern the Company’s relationship with its employees, including laws relating to minimum wage requirements, overtime, tips, tip credits and working conditions. A significant number of the Company’s hourly employees are paid at rates related to the federal or state minimum wage.
The offer and sale of franchises are subject to regulation by the U.S. Federal Trade Commission (“FTC”) and many states. The FTC requires that the Company furnish to prospective franchisees a franchise disclosure document containing prescribed information. A number of states also regulate the sale of franchises and require state registration of franchise offerings and the delivery of a franchise disclosure document to prospective franchisees. The Company’s noncompliance could result in governmental enforcement actions seeking a civil or criminal penalty, rescission of a franchise, and loss of its ability to offer and sell franchises in a state, or a private lawsuit seeking rescission, damages and legal fees.
Competition
The restaurant business is highly competitive and highly fragmented, and the number, size and strength of the Company’s competitors vary widely by region. The Company believes that restaurant competition is based on, among other things, quality of food products, customer service, reputation, restaurant location, name recognition and price. The Company’s restaurants compete with a number of upscale steakhouses and upscale casual seafood restaurants within their markets, both locally owned restaurants and restaurants within regional or national chains. The principal upscale steakhouses with which the Company competes are Fleming’s, The Capital Grille, Smith & Wollensky, The Palm, Del Frisco’s and Morton’s of Chicago. The principal seafood restaurants with which the Company competes are McCormick & Schmick’s, Legal Seafood, Bonefish Grill and The Oceanaire Seafood Room. Many of the Company’s competitors are better established in certain of its existing markets and/or markets into which it intends to expand.
Available Information
The Company maintains a website on the Internet at www.rhgi.com. The Company makes available free of charge, through the investor relations section of its website, its Annual Reports on Form 10-K, quarterly reports on Form 10-Q, current reports on Form 8-K and amendments to those reports electronically filed or furnished pursuant to Section 13(a) or 15(d) of the Exchange Act of 1934. Such information is available as soon as reasonably practicable after it files such reports with the SEC. Additionally, our Code of Ethics may be accessed within the Investor Relations section of our website. Information found on our website is not part of this Annual Report on Form 10-K or any other report filed with the SEC.
11
Table of Contents
| Item 1A. | RISK FACTORS |
In addition to the other information in this Annual Report on Form 10-K, the following risk factors should be considered carefully in evaluating the Company and its business. The risks and uncertainties described below are not the only ones the Company faces. Additional risks and uncertainties not presently known to us or that the Company currently deems immaterial may also impair its business operations. If any of these certain risks and uncertainties were to actually occur, the Company’s business, financial condition or results of operations could be materially adversely affected. In such case, the trading price of the Company’s common stock could decline and its investors may lose all or part of their investment. These risks and uncertainties include, but are not limited to, the following:
Current levels of market volatility and the contraction of the capital and real estate markets are unprecedented and are unlikely to improve in the near future, which could adversely affect our business and results of operations and increase the volatility of our common stock.
Dramatic declines in the housing market, with falling home prices and increasing foreclosures and unemployment, have resulted in significant market turmoil and tightening of credit. In turn, this has led to an increased level of commercial and consumer delinquencies, lack of consumer confidence, increased market volatility and widespread reduction of business activity generally. The Company currently anticipates that the difficult conditions in the financial markets are not likely to improve in the near future. The significant deterioration in economic conditions in any of the Company’s markets has and will continue to reduce guest traffic and required certain of the Company’s affected restaurants to lower their prices, which reduce the Company’s total revenues and operating income. For the fourth fiscal quarter of 2009, the Company’s Ruth’s Chris company-owned restaurants experienced an 11.2% decrease in comparable restaurants sales compared with the fourth fiscal quarter of 2008. Ruth’s Chris company-owned restaurants generated reduced average unit volumes of approximately $4.0 million in fiscal 2009, compared to average unit volumes of approximately $4.9 million in fiscal 2008. The Company believes these economic conditions and market volatility have and may continue to adversely affect the price of its common stock. Any changes in economic conditions, or a continuation or increase in the severity of the current economic downturn would affect the Company’s ability to attract guests or price its menu items at favorable levels, which would result in significant reductions in revenue and/or operating income and, in turn, the market price for its common stock.
Market volatility could adversely affect our stock price.
Many factors affect the trading price of our stock, including factors over which we have no control, such as reports on the economy or the price of commodities, as well as negative or positive announcements by competitors, regardless of whether the report relates directly to our business. In addition to investor expectations, trading activity in our stock can reflect the portfolio strategies and investment allocation changes of institutional holders and non-operating initiatives such as a share repurchase program. Any failure to meet market expectations whether for sales growth rates, earnings per share or other metrics could adversely affect our share price.
Turmoil in the financial services industry, volatility in securities trading markets and general economic downturns may adversely affect our ability to access the credit and capital markets to finance a portion of our working capital requirements and support our liquidity needs.
The Company has exposure to many different financial institutions and counterparties including under its existing senior credit facility and other credit and financing arrangements, including interest rate swaps. Many of these transactions expose the Company to credit risk in the event that any of its lenders or counterparties are unable to honor its commitments or otherwise defaults under a financing agreement. Credit and capital markets have recently experienced a great deal of turmoil, and certain leading financial institutions have either declared bankruptcy or have shown significant deterioration in their financial stability. If any of these counterparties
12
Table of Contents
declares bankruptcy and/or becomes insolvent, they may not be able to perform under their contracts with the Company, which could leave the Company with reduced or no senior credit facility or unhedged against changes in interest rates. The constriction of the credit markets, if not alleviated, could increase the Company’s cost of borrowing or limit its ability to obtain additional financing on terms it finds acceptable. Any significant limitations on its ability to access the financing provided under our existing credit facility or under any of the Company’s other credit or financing arrangements could materially and adversely affect the Company’s business and results of operations.
Negative publicity surrounding the Company’s restaurants or the consumption of beef generally, or shifts in consumer tastes, could reduce sales in one or more of our restaurants and make our brand less valuable.
The Company’s success depends, in large part, upon the popularity of its menu offerings. Negative publicity resulting from poor food quality, illness, injury or other health concerns (including e-coli, Bovine Spongiform Encephalopathy (mad cow disease), Hepatitis A and foot and mouth disease), whether related to one of the Company’s restaurants or to the beef or seafood industries in general, or operating problems related to one or more restaurants, could make the Company’s menu offerings less appealing to consumers and reduce demand in its restaurants. In addition, any other shifts in consumer preferences away from the kinds of food the Company offers, particularly beef and seafood, whether because of dietary or other health concerns or otherwise, would make its restaurants less appealing and adversely affect revenues.
In addition, some types of seafood have been subject to adverse publicity due to certain levels of contamination at their source, which can adversely affect both supply and market demand. The Company’s Mitchell’s restaurants maintain an in-house inspection program for seafood purchases and, in the past, have not experienced any detriment from contaminated seafood. However, future seafood contamination or inadequate supplies of seafood could have a significant and materially adverse effect on the Company’s operating results and profitability.
The Company may not be able to compete successfully with other restaurants, which could reduce its revenues.
The restaurant industry is intensely competitive with respect to price, service, location, food quality, atmosphere and overall dining experience. The Company’s competitors include a large and diverse group of well-recognized upscale steakhouse and upscale casual restaurant chains, including steakhouse and seafood chains as well as restaurants owned by independent local operators. Some of the Company’s competitors may have substantially greater financial, marketing and other resources, and may be better established in the markets where its restaurants are or may be located. If the Company cannot compete effectively in one or more of its markets, the Company may be unable to maintain recent levels of comparable restaurant sales growth and/or may be required to close existing restaurants.
Health concerns arising from outbreaks of flu viruses or other diseases may have an adverse effect on our business.
The United States and other countries have experienced, or may experience in the future, outbreaks of viruses, such as norovirus, Avian Flu or “SARS”, and H1N1 or “swine flu”, or other diseases. If a virus is transmitted by human contact, our employees or guests could become infected, or could choose, or be advised, to avoid gathering in public places, any of which could adversely affect our restaurant guest traffic, and our ability to adequately staff our restaurants, receive deliveries on a timely basis or perform functions at the corporate level. We also could be adversely affected if jurisdictions in which we have restaurants impose mandatory closures, seek voluntary closures or impose restrictions on operations. Even if such measures are not implemented and a virus or other disease does not spread significantly, the perceived risk of infection or significant health risk may adversely affect our business.
13
Table of Contents
If the Company’s vendors or distributors do not deliver food and beverages in a timely fashion it may experience short-term supply shortages and/or increased food and beverage costs.
The Company’s ability to maintain consistent quality throughout company-owned restaurants depends in part upon its ability to purchase USDA Prime and Choice grade beef, seafood and other food products in accordance with its rigid specifications. During fiscal 2009, the Company purchased more than 60% of the beef it used in company-owned restaurants from one vendor, New City Packing Company, Inc. In addition, the Company currently has a long-term distribution arrangement with a national food and restaurant supply distributor, Distribution Market Advantage, Inc. (DMA), which purchases products for the Company from various suppliers, and through which all 64 of its company-owned Ruth’s Chris Steak House restaurants receive a significant portion of their food supplies. The Company also purchased more than 80% of the fresh seafood served in its Mitchell’s Fish Market from two vendors, Michael’s Finer Meats and Seafood and Save On Seafood Company. If these or other vendors or distributors cease doing business with the Company, it could experience short-term supply shortages in certain company-owned restaurants and could be required to purchase supplies at higher prices until the Company is able to secure an alternative supply source. Any delay the Company experiences in replacing vendors or distributors on acceptable terms could increase food costs or, in extreme cases, require it to temporarily remove items from the menu of one or more restaurants.
Increases in the prices of, or reductions in the availability of, any of our core food products could reduce the Company’s operating margins and revenues.
The Company purchases large quantities of beef, particularly USDA Prime grade beef, which is subject to extreme price fluctuations due to seasonal shifts, climate conditions, industry demand and other factors. The Company’s beef costs represented approximately 34.0% of its food and beverage costs during fiscal 2009. During fiscal 2009, the Company entered into contracts with beef suppliers to establish set pricing on a portion of its anticipated beef purchases. In fiscal 2010, the Company has negotiated set pricing for approximately 50% of its prime beef requirements, which represents 25% of its beef purchases. The market for USDA Prime grade beef is particularly volatile.
In the recent past, certain types of seafood have experienced fluctuations in availability. Seafood is also subject to fluctuations in price based on availability, which is often seasonal. If certain types of seafood are unavailable, or if our costs increase, our results of operations could be adversely affected.
Labor shortages or increases in labor costs could slow the Company’s growth or harm its business.
The Company’s success depends in part upon its ability to continue to attract, motivate and retain employees with the qualifications to succeed in its industry and the motivation to apply the Company’s core service philosophy, including regional operational managers, restaurant general managers and chefs. If the Company is unable to continue to recruit and retain sufficiently qualified individuals, its business and growth could be adversely affected. Competition for these employees could require the Company to pay higher wages, which could result in higher labor costs. In addition, the Company has a substantial number of hourly employees who are paid wage rates at or based on the federal or state minimum wage and who rely on tips as a large portion of their income. Increases in the minimum wage or decreases in allowable tip credits would increase the Company’s labor costs. The Company may be unable to increase its prices in order to pass these increased labor costs on to its guests, in which case its margins would be negatively affected.
Regulations affecting the operation of the Company’s restaurants could increase operating costs and restrict growth.
Each of the Company’s restaurants must obtain licenses from regulatory authorities allowing it to sell liquor, beer and wine, and each restaurant must obtain a food service license from local health authorities. Each restaurant’s liquor license must be renewed annually and may be revoked at any time for cause, including
14
Table of Contents
violation by the Company or its employees of any laws and regulations relating to the minimum drinking age, advertising, wholesale purchasing and inventory control. In certain states, including states where the Company has a large number of restaurants or where it plans to open restaurants in the near term, the number of liquor licenses available is limited and licenses are traded at market prices. If the Company is unable to maintain existing licenses, or if it chooses to open a restaurant in those states, the cost of a new license could be significant. Obtaining and maintaining licenses is an important component of each of the Company’s restaurant’s operations, and the failure to obtain or maintain food and liquor licenses and other required licenses, permits and approvals would materially adversely impact existing restaurants or the Company’s growth strategy.
The Company is also subject to a variety of federal and state labor laws, such as minimum wage and overtime pay requirements, unemployment tax rates, workers’ compensation rates and citizenship requirements. Government-mandated increases in minimum wages, overtime pay, paid leaves of absence and mandated health benefits, or increased tax reporting and tax payment requirements for employees who receive gratuities, or a reduction in the number of states that allow tips to be credited toward minimum wage requirements could increase the Company’s labor costs and reduce its operating margins. In addition, the Federal Americans with Disabilities Act prohibits discrimination on the basis of disability in public accommodations and employment. Although the Company’s restaurants are designed to be accessible to the disabled, it could be required to make modifications to its restaurants to provide service to, or make reasonable accommodations for, disabled persons.
The Company’s strategy to open franchisee-owned restaurants subjects it to extensive government regulation, compliance with which might increase its investment costs and restrict its growth.
The Company is subject to the rules and regulations of the FTC and various state laws regulating the offer and sale of franchises. The FTC requires that the Company furnish to prospective franchisees a franchise disclosure document containing prescribed information and can restrict its ability to sell franchises. A number of states also regulate the sale of franchises and require the obtaining of a permit and/or registration of the franchise disclosure document with state authorities and the delivery of the franchise disclosure document to prospective franchisees. Non-compliance with those laws could result in governmental enforcement actions seeking a civil or criminal penalty, rescission of a franchise, and loss of the Company’s ability to offer and sell franchises in a state, or a private lawsuit seeking rescission, damages and legal fees, which could have a material adverse effect on its business.
The Company’s franchisees could take actions that harm its reputation and reduce its royalty revenues.
The Company does not exercise control over the day-to-day operations of its franchisee-owned restaurants. While the Company attempts to ensure that franchisee-owned restaurants maintain the same high operating standards that it demands of company-owned restaurants, one or more of these restaurants may fail to maintain these standards. Any operational shortcomings of the Company’s franchisee-owned restaurants are likely to be attributed to its system-wide operations and could adversely affect its reputation and damage its brand as well as have a direct negative impact on the royalty income it receives from those restaurants.
The Company’s failure to enforce its service marks or other proprietary rights could adversely affect its competitive position or the value of its brands.
The Company owns certain common law service mark rights and a number of federal and international service mark registrations, most importantly the Ruth’s Chris Steak House, Mitchell’s and Cameron’s names and logos, copyrights relating to text and print uses, and other proprietary intellectual property rights. The Company believes that its service marks, copyrights and other proprietary rights are important to its success and competitive position. Protective actions the Company takes with respect to these rights may fail to prevent unauthorized usage or imitation by others, which could harm the Company’s reputation, brand or competitive position and, if the Company commences litigation to enforce its rights, cause us to incur significant legal expenses.
15
Table of Contents
Litigation concerning food quality, health and other issues could require the Company to incur additional liabilities and/or cause guests to avoid its restaurants.
Occasionally, the Company’s guests file complaints or lawsuits against it alleging that the Company is responsible for some illness or injury they suffered at or after a visit to its restaurants. The Company is also subject to a variety of other claims arising in the ordinary course of its business, including personal injury claims, contract claims, claims from franchisees, claims alleging violations of federal and state law regarding workplace and employment matters and discrimination and similar matters. In addition, the Company could become subject to class action lawsuits related to these matters in the future. For example, in fiscal 2005 the Company settled a class-action claim based on violation of wage and hour laws in California. The restaurant industry has also been subject to a growing number of claims that the menus and actions of restaurant chains have led to the obesity of certain of their guests. In addition, the Company is subject to “dram shop” statutes. These statutes generally allow a person injured by an intoxicated person to recover damages from an establishment that wrongfully served alcoholic beverages to the intoxicated person. Recent litigation against restaurant chains has resulted in significant judgments, including punitive damages, under dram shop statutes. Regardless of whether any claims against the Company are valid or whether it is liable, claims may be expensive to defend and may divert time and money away from the Company’s operations and hurt its performance. A judgment significantly in excess of the Company’s insurance coverage for any claims would materially adversely affect its financial condition and results of operations. Adverse publicity resulting from these claims may negatively impact revenues at one or more of the Company’s restaurants.
The terms of the Company’s senior credit agreement may restrict its ability to operate its business and to pursue its business strategies.
The Company’s First Amended and Restated Credit Agreement contains, and any agreements governing future indebtedness would likely contain, a number of restrictive covenants that impose significant operating and financial restrictions on it. The Company’s First Amended and Restated Credit Agreement limits its ability, among other things, to:
| • | pay dividends or purchase stock in excess of the $1.0 million permitted under the senior credit agreement; |
| • | borrow money or issue guarantees; |
| • | make investments; |
| • | use assets as security in other transactions; |
| • | sell assets or merge with or into other companies; |
| • | enter into transactions with affiliates; |
| • | sell stock in its subsidiaries; and |
| • | create or permit restrictions on its subsidiaries’ ability to make payments to it. |
The Company’s ability to engage in these types of transactions is limited even if it believes that a specific transaction would contribute to its future growth or improve its operating results. The Company’s senior credit agreement also requires it to achieve specified financial and operating results and maintain compliance with certain financial ratios. The Company’s ability to comply with these ratios may be affected by events outside of its control. Any non-compliance would result in a default under its senior credit agreement and could result in its lenders declaring the Company’s senior debt immediately due and payable, which would have a material adverse effect on its ability to operate as a going concern.
An impairment in the carrying value of our goodwill or other intangible assets could adversely affect our financial condition and consolidated results of operations.
Goodwill represents the difference between the purchase price of acquired companies and the related fair values of net assets acquired. We test goodwill for impairment annually and whenever events or changes in
16
Table of Contents
circumstances indicate that impairment may have occurred. We compare the carrying value of a reporting unit, including goodwill, to the fair value of the unit. Carrying value is based on the assets and liabilities associated with the operations of that reporting unit. If the carrying value is less than the fair value, no impairment exists. If the carrying value is higher than the fair value, there is an indication of impairment. A significant amount of judgment is involved in determining if an indication of impairment exists. Factors may include, among others: a significant decline in our expected future cash flows; a sustained, significant decline in our stock price and market capitalization; a significant adverse change in legal factors or in the business climate; unanticipated competition; the testing for recoverability of a significant asset group within a reporting unit; and slower growth rates. Any adverse change in these factors would have a significant impact on the recoverability of these assets and negatively affect our financial condition and consolidated results of operations. We compute the amount of impairment by comparing the implied fair value of reporting unit goodwill with the carrying amount of that goodwill. We are required to record a non-cash impairment charge if the testing performed indicates that goodwill has been impaired.
We evaluate the useful lives of our other intangible assets, primarily our trademarks, to determine if they are definite or indefinite-lived. Reaching a determination on useful life requires significant judgments and assumptions regarding the future effects of obsolescence, demand, competition, other economic factors (such as the stability of the industry, legislative action that results in an uncertain or changing regulatory environment, and expected changes in distribution channels), the level of required maintenance expenditures, and the expected lives of other related groups of assets.
As with goodwill, we test our indefinite-lived intangible assets (primarily trade names) for impairment annually and whenever events or changes in circumstances indicate that their carrying value may not be recoverable. We estimate the fair value of the trademarks based on an income valuation model using the relief from royalty method, which requires assumptions related to projected revenues from our annual long-range plan, assumed royalty rates that could be payable if we did not own the trademarks and a discount rate.
We cannot accurately predict the amount and timing of any impairment of assets. Should the value of goodwill or other intangible assets become impaired, there could be an adverse effect on our financial condition and consolidated results of operations.
Failure of our internal controls over financial reporting could harm our business and financial results.
Our management is responsible for establishing and maintaining effective internal control over financial reporting. Internal control over financial reporting is a process to provide reasonable assurance regarding the reliability of financial reporting for external purposes in accordance with accounting principles generally accepted in the United States. Because of its inherent limitations, internal control over financial reporting is not intended to provide absolute assurance that we would prevent or detect a misstatement of our financial statements or fraud. Our growth and acquisition of other restaurant companies with procedures not identical to our own could place significant additional pressure on our system of internal control over financial reporting. Any failure to maintain an effective system of internal control over financial reporting could limit our ability to report our financial results accurately and timely or to detect and prevent fraud. A significant financial reporting failure or material weakness in internal control over financial reporting could cause a loss of investor confidence and decline in the market price of our common stock.
| Item 1B. | UNRESOLVED STAFF COMMENTS |
None.
| Item 2. | PROPERTIES |
Company-owned restaurants are generally located in spaces leased by wholly-owned direct or indirect subsidiaries of Ruth’s Hospitality Group, Inc. Restaurant lease expirations, including renewal options, range
17
Table of Contents
from approximately two years to 30 years. Sixty-seven of the Company’s Ruth’s Chris restaurants, including those not yet commenced, operate in leased space, of which fifty-eight provide for an option to renew for terms ranging from approximately five years to 15 years. Twenty-five of the Company’s Mitchell’s leases, including those not yet commenced, provide for at least one option to renew. Historically, the Company has not had difficulty in renewing its leases in a timely manner. Restaurant leases provide for a specified annual rent, and some leases call for additional or contingent rent based on sales volumes over specified levels.
On September 17, 2008, the Company completed the sale of five restaurant properties to Sovereign Investment Company for $17.6 million in proceeds. Concurrent with the sales transaction, the Company entered into agreements to lease the properties back for initial terms of between 12 and 20 years, along with two five-year options. This sale-leaseback transaction involving real estate does not provide for any continuing involvement other than a normal lease whereby the Company intends to actively use the property during the term. The properties are located in Metairie, Louisiana; Palm Beach and Sarasota, Florida; Columbus, Ohio (Columbus Fish Market); and Palm Desert, California.
On June 28, 2009, the Company completed the sale of its former home office land and building of approximately 22,000 square feet in Metairie, Louisiana. The Company received $0.8 million in net proceeds, and recorded a loss of $0.9 million related to the sale.
On December 15, 2009, the Company completed the sale of its home office building of approximately 75,860 square feet in Heathrow, Florida, which houses its corporate headquarters. The transaction generated net proceeds of approximately $9.7 million, which were used to reduce borrowings under the credit facility. The Company recorded a loss of $0.8 million related to the sale. The Company’s corporate headquarters now resides in leased space (17,380 square feet) in Heathrow, Florida, with a term set to expire in August 2011.
The Company currently owns the real estate for three Ruth’s Chris operating restaurants: Ft. Lauderdale (7,800 square feet); Houston, Texas (7,200 square feet); and Columbus, Ohio (8,100 square feet).
The following table sets forth information about the Company’s existing company-owned and franchisee-owned restaurants as of December 27, 2009. As of December 27, 2009, the Company operated 64 Ruth’s Chris company-owned restaurants and 22 Mitchell’s restaurants. In addition, its franchisees operated 66 restaurants. Company-owned Ruth’s Chris restaurants range in size from approximately 6,000 to approximately 13,000 square feet. The Company expects that future restaurants will range in size from 8,000 to 10,000 square feet with approximately 230 to 250 seats. Company-owned Mitchell’s restaurants range in size from approximately 6,000 to 11,000 square feet with approximately 225 to 250 seats.
| Company-Owned Ruth’s Chris Restaurants |
Franchisee-Owned Ruth’s Chris Restaurants | |||||||||||
| Year |
Locations |
Property Leased or Owned |
Year Opened |
Locations | ||||||||
| 1972 |
Metairie, LA** | Leased | 1976 | Baton Rouge, LA | ||||||||
| 1977 |
Lafayette, LA | Leased | 1985 | Austin, TX | ||||||||
| 1977 |
Houston, TX | Owned | 1985 | Mobile, AL | ||||||||
| 1983 |
Washington, D.C. | Leased | 1986 | Atlanta (Buckhead), GA | ||||||||
| 1984 |
Beverly Hills, CA | Leased | 1987 | Pittsburgh, PA | ||||||||
| 1985 |
Ft. Lauderdale, FL | Owned | 1987 | Hartford, CT | ||||||||
| 1986 |
Phoenix, AZ | Leased | 1988 | Philadelphia, PA | ||||||||
| 1986 |
Nashville, TN | Leased | 1989 | Honolulu, HI | ||||||||
| 1987 |
San Francisco, CA | Leased | 1989 | Las Vegas, NV | ||||||||
| 1987 |
N. Palm Beach, FL** | Leased | 1991 | Richmond, VA | ||||||||
| 1988 |
Seattle, WA | Leased | 1992 | Baltimore, MD | ||||||||
| 1989 |
Memphis, TN | Leased | 1993 | Birmingham, AL | ||||||||
18
Table of Contents
| Company-Owned Ruth’s Chris Restaurants |
Franchisee-Owned Ruth’s Chris Restaurants | |||||||||||
| Year |
Locations |
Property Leased or Owned |
Year Opened |
Locations | ||||||||
| 1990 |
Weehawken, NJ | Leased | 1993 | San Antonio, TX | ||||||||
| 1990 |
Scottsdale, AZ | Leased | 1993 | Taipei, Taiwan | ||||||||
| 1992 |
Palm Desert, CA** | Leased | 1993 | Cancun, Mexico | ||||||||
| 1992 |
Minneapolis, MN | Leased | 1993 | Sandy Springs, GA | ||||||||
| 1992 |
Chicago, IL | Leased | 1994 | Indianapolis, IN | ||||||||
| 1993 |
Arlington, VA | Leased | 1995 | Long Island, NY | ||||||||
| 1993 |
Manhattan, NY | Leased | 1995 | Toronto, CA | ||||||||
| 1994 |
San Diego, CA | Leased | 1996 | Taichung, Taiwan | ||||||||
| 1995 |
Westchester, NY | Leased | 1996 | Indianapolis, IN | ||||||||
| 1996 |
Dallas, TX | Leased | 1997 | Hong Kong | ||||||||
| 1996 |
Troy, MI | Leased | 1997 | Raleigh (Cary), NC | ||||||||
| 1996 |
Tampa, FL | Leased | 1998 | Annapolis, MD | ||||||||
| 1996 |
Bethesda, MD | Leased | 1998 | Maui, HI | ||||||||
| 1997 |
Kansas City, MO | Leased | 1999 | Atlanta (Centennial Park), GA | ||||||||
| 1997 |
Irvine, CA | Leased | 2000 | Pikesville, MD | ||||||||
| 1997 |
Portland, OR | Leased | 2000 | San Antonio (Sunset), TX | ||||||||
| 1997 |
Jacksonville, FL | Leased | 2000 | Wailea, HI | ||||||||
| 1998 |
Louisville, KY | Leased | 2001 | Kaohsiung, Taiwan | ||||||||
| 1998 |
Parsippany, NJ | Leased | 2001 | King of Prussia, PA | ||||||||
| 1998 |
Northbrook, IL | Leased | 2001 | Queensway, Hong Kong | ||||||||
| 1999 |
Columbus, OH | Owned | 2001 | Cabo San Lucas, Mexico | ||||||||
| 1999 |
Coral Gables, FL | Leased | 2003 | Mississauga, Canada | ||||||||
| 1999 |
Ponte Vedra, FL | Leased | 2005 | Virginia Beach, VA | ||||||||
| 1999 |
Winter Park, FL | Leased | 2005 | Baltimore, MD | ||||||||
| 2000 |
Sarasota, FL** | Leased | 2005 | Atlantic City, NJ | ||||||||
| 2000 |
Del Mar, CA | Leased | 2005 | Chartlotte (South Park), NC | ||||||||
| 2000 |
Boca Raton, FL | Leased | 2006 | St. Louis, MO | ||||||||
| 2001 |
Orlando, FL | Leased | 2006 | Ocean City, MD | ||||||||
| 2001 |
Greensboro, NC | Leased | 2006 | Destin, FL | ||||||||
| 2002 |
Woodland Hills, CA | Leased | 2006 | Mauna Lani, HI | ||||||||
| 2002 |
Fairfax, VA | Leased | 2006 | Huntsville, AL | ||||||||
| 2002 |
Bellevue, WA | Leased | 2006 | Edmonton, Canada | ||||||||
| 2002 |
Washington, D.C. (Conv.) | Leased | 2007 | Charlotte (Uptown), NC | ||||||||
| 2003 |
Walnut Creek, CA | Leased | 2007 | Waikiki, HI | ||||||||
| 2005 |
Roseville, CA | Leased | 2007 | Columbia, SC | ||||||||
| 2005 |
Boston, MA | Leased | 2007 | Mishawaka, IN | ||||||||
| 2005 |
Sacramento, CA | Leased | 2007 | Tokyo, Japan | ||||||||
| 2006 |
Pasadena, CA | Leased | 2007 | Madison, WI | ||||||||
| 2006 |
Bonita Springs, FL | Leased | 2007 | Calgary, Canada | ||||||||
| 2006 |
Providence, RI | Leased | 2007 | Rogers, AR | ||||||||
| 2007 |
Lake Mary, FL* | Land Leased | 2007 | Park City, UT | ||||||||
| 2007 |
Anaheim, CA* | Land Leased | 2008 | Aruba | ||||||||
| 2007 |
Biloxi, MS | Leased | 2008 | Myrtle Beach, SC | ||||||||
| 2007 |
Knoxville, TN | Leased | 2008 | Wilminton, SC | ||||||||
| 2007 |
Tyson’s Corner, VA | Leased | 2008 | Ridgeland, MS | ||||||||
| 2007 |
Santa Barbara, CA | Leased | 2008 | Wilkes-Barre, PA | ||||||||
19
Table of Contents
| Company-Owned Ruth’s Chris Restaurants |
Franchisee-Owned Ruth’s Chris Restaurants | |||||||||||
| Year |
Locations |
Property Leased or Owned |
Year Opened |
Locations | ||||||||
| 2007 |
West Palm Beach, FL | Leased | 2008 | Raleigh, NC | ||||||||
| 2008 |
Ft. Worth, TX | Leased | 2008 | Savannah, GA | ||||||||
| 2008 |
New Orleans, LA | Leased | 2009 | Dubai | ||||||||
| 2008 |
Princeton, NJ* | Land Leased | 2009 | Greenville, SC | ||||||||
| 2008 |
Fresno, CA | Leased | 2009 | St. Louis, MO | ||||||||
| 2008 |
South Barrington, IL* | Land Leased | 2009 | Durham, NC | ||||||||
| 2009 | Kennesaw, GA | |||||||||||
| 2009 | Carolina, Puerto Rico | |||||||||||
| Company-Owned Mitchell’s Fish Market Restaurants |
Company-Owned Mitchell’s Steakhouse Restaurants | |||||||||||
| Year |
Locations |
Property Leased or Owned |
Year Opened |
Locations | ||||||||
| 2008 |
Grandview, OH** |
Leased | 2008 | Columbus (Downtown), OH |
Leased | |||||||
| 2008 |
Crosswoods, OH |
Leased | 2008 | Birmingham, MI |
Leased | |||||||
| 2008 |
Pittsburgh - Waterfront, PA |
Leased | 2008 | Polaris, OH |
Leased | |||||||
| 2008 |
Newport, KY |
Leased | ||||||||||
| 2008 |
Louisville, KY |
Leased | ||||||||||
| 2008 |
Lansing, MI |
Leased | ||||||||||
| 2008 |
Birmingham, MI |
Leased | ||||||||||
| 2008 |
Cleveland, OH |
Leased | ||||||||||
| 2008 |
West Chester, OH |
Leased | ||||||||||
| 2008 |
Glenview, IL |
Leased | ||||||||||
| 2008 |
Carmel, IN |
Leased | ||||||||||
| 2008 |
Livonia, MI |
Leased | ||||||||||
| 2008 |
Pittsburgh (South Hills Galleria), PA |
Leased | ||||||||||
| 2008 |
Tampa, FL |
Leased | ||||||||||
| 2008 |
Rochester Hills, MI |
Leased | ||||||||||
| 2008 |
Brookfield, WI |
Leased | ||||||||||
| 2008 |
Sandestin, FL |
Leased | ||||||||||
| 2008 |
Jacksonville, FL |
Leased | ||||||||||
| 2008 |
Stamford, CT |
Leased | ||||||||||
| * | The Company owns the building and leases the land pursuant to a long-term ground lease. |
| ** | These restaurants were previously owned, but were sold and leased back in fiscal 2008. |
The Company has also entered into lease commitments to develop two additional company-owned Ruth’s Chris restaurants in Reno, Nevada, and Phoenix, Arizona. In addition, the Company has entered into lease commitments to develop two Mitchell’s Fish Market restaurants located in Scottsdale, Arizona, and Orlando, Florida, and one Cameron’s Steakhouse, located in Scottsdale, Arizona. The Company intends to develop the Mitchell’s Fish Market located in Orlando, Florida, in 2010. The Company does not intend to develop the remaining restaurants in 2010 and is negotiating with the various landlords for a release of its obligations. During fiscal 2009, the Company negotiated for release of its lease obligation for two company-owned Ruth’s Chris restaurants in Thousand Oaks, California, and Dedham, Massachusetts.
20
Table of Contents
| Item 3. | LEGAL PROCEEDINGS |
In Re: Katherine Bush; In Re: Melia Stop; In Re: Shelly Goorevich.
In November 2007, the Company was named as the respondent in two Equal Employment Opportunity Commission (EEOC) charges filed by two former employees wherein each charging party filed a claim of discrimination against the Company on the basis of their sex. Separately, the Company received written demand for both monetary and non-monetary relief from counsel for the two charging parties accompanied by threatened litigation seeking putative, class-wide relief for similarly situated individuals. Subsequently, the company was named as the respondent in a third similar EEOC charge filed by a current employee. The Company has responded to the charges, denied liability, considers the claims without merit and will vigorously defend them. The Company is not currently able to determine the outcome of the pending EEOC charges, whether class-wide certification will occur, any possible exposures or whether such exposures would be material.
Nikko Rose and Brandon Rose v. Ruth’s Chris Steak House Boston, LLC.
In November 2007, one current and one former employee filed a complaint in the United States District Court for the District of Massachusetts alleging that one of the Company’s affiliates violated the Fair Labor Standards Act (“FLSA”) by inappropriately taking the “tip credit” set forth in section 203 (m) of the FLSA. Plaintiffs filed the action seeking putative, class-wide relief though no judicial certification has been made. In October 2009, the parties agreed to settle plaintiff’s claims and the action was dismissed with prejudice.
Kierland Crossing, LLC v. Ruth’s Chris Steak House, Inc., et al.
This is an Ohio state court action filed in December 2009 for breach of lease for not building and opening a restaurant location in Scottsdale, Arizona. This claim is not insured. A response was filed on March 1, 2010.
Coastland Center, LLC, as successor in interest to Coastland Center, L.P., as successor in interest to Coastland Center Joint Venture, v. RCSH Operations, LLC.
This is a Florida circuit court action filed in September 2009 for breach of lease for failing to pay rent for a restaurant location in Naples, Florida. This claim is not insured. A response has been filed.
From time to time, the Company has been named as a defendant in other litigation arising in the normal course of business. Claims typically pertain to “slip and fall” accidents at its restaurants, employment claims and claims from guests alleging illness, injury or other food quality, health or operational concerns. Other claims and disputes have arisen in connection with supply contracts, the site development and construction of system restaurants, and with respect to franchise matters. Certain of these claims are not covered by existing insurance policies; however, many are referred to and are covered by insurance, except for deductible amounts, and have not had a material effect on us. As of the date of hereof, we believe that the ultimate resolution of any such claims in the ordinary course of business will not materially affect our financial condition or earnings.
| Item 4. | Reserved |
21
Table of Contents
PART II
| Item 5. | MARKET FOR THE REGISTRANT’S COMMON STOCK, RELATED STOCKHOLDER MATTERS AND ISSUER PURCHASES OF EQUITY SECURITIES |
The Company’s common stock is listed on the Nasdaq Global Select Market under the trading symbol “RUTH.” As of March 1, 2010, there were 37 holders of record of its common stock. The transfer agent and registrar for its common stock is American Stock Transfer & Trust Company, 59 Maiden Lane, New York, NY 10038, telephone (800) 937-5449.
There were no repurchases of the Company’s equity securities by or on behalf of it during the fourth quarter of fiscal 2009 and the Company does not have a formal or publicly announced stock repurchase program.
The following table sets forth, for the period indicated, the highest and lowest sale price for its common stock for fiscal 2008 and fiscal 2009, as reported by the Nasdaq Global Select Market:
| High | Low | |||||
| Fiscal Year ended December 28, 2008 |
||||||
| First Quarter |
$ | 8.94 | $ | 6.27 | ||
| Second Quarter |
$ | 8.27 | $ | 5.30 | ||
| Third Quarter |
$ | 5.35 | $ | 3.56 | ||
| Fourth Quarter |
$ | 4.15 | $ | .92 | ||
| Fiscal Year ended December 27, 2009 |
||||||
| First Quarter |
$ | 2.24 | $ | 0.70 | ||
| Second Quarter |
$ | 4.37 | $ | 1.08 | ||
| Third Quarter |
$ | 4.74 | $ | 2.77 | ||
| Fourth Quarter |
$ | 4.54 | $ | 2.09 | ||
The closing sale price for its common stock on March 1, 2010 was $3.88.
Dividend Policy
The Company currently expects to retain all future earnings to finance the growth of its business. Since its acquisition by affiliates of Madison Dearborn in 1999, the Company has not paid, and has no current plans to pay in the future, cash dividends to holders of its common stock. The payment of dividends is within the discretion of the Company’s board of directors and will depend on its earnings, capital requirements and operating and financial condition, among other factors. In addition, the Company’s senior credit facilities limit its ability to pay dividends. The Company may not pay a dividend if there is a default (or if a default would result from such dividend payment) under its senior credit facilities, and may not pay dividends in excess of an aggregate of $1.0 million in any fiscal year. With respect to the Company’s Preferred Stock, dividends will accrue at an annual rate of 10% of the then applicable liquidation preference of such Preferred Stock and will be payable on a quarterly basis when, as, and if declared by the Company’s board of directors. The Company may elect to satisfy its obligation to pay quarterly dividends in cash, or, by increasing the liquidation preference on the shares of Preferred Stock. In the event a dividend is declared with respect to the shares of the Company’s common stock, the holders of the Preferred Stock shall be entitled to receive such dividend in the amount that they would have received had they converted their shares of Preferred Stock into common stock immediately prior to the record date for such dividend.
Unregistered Recent Sales of Securities
None.
22
Table of Contents
Securities Authorized for Issuance Under Equity Compensation Plans
See Item 12, Security Ownership of Certain Beneficial Owners and Management and Related Stockholder Matters, of this Annual Report on Form 10-K for information regarding securities authorized for issuance under the Company’s equity compensation plans.
Performance Graph
The following table and graph shows the cumulative total stockholder return on the Company’s Common Stock with the S&P 500 Stock Index, the S&P Small Cap 600 Index and the Dow Jones U.S. Restaurants & Bars Index, in each case assuming an initial investment of $100 on December 23, 2005 and full dividend reinvestment.
CUMULATIVE TOTAL RETURN
Assuming an investment of $100 and reinvestment of dividends
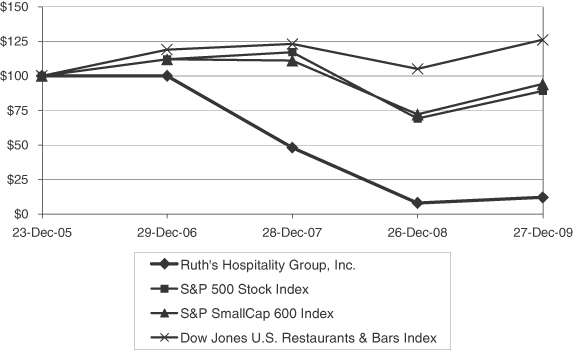
| 12/23/05 | 12/29/06 | 12/28/07 | 12/26/08 | 12/27/09 | |||||||||||
| Ruth’s Hospitality Group, Inc. |
$ | 100 | $ | 100 | $ | 48 | $ | 8 | $ | 12 | |||||
| S&P 500 Stock Index |
100 | 112 | 117 | 69 | 89 | ||||||||||
| S&P SmallCap 600 Index |
100 | 112 | 111 | 72 | 94 | ||||||||||
| Dow Jones U.S. Restaurants & Bars Index |
100 | 119 | 123 | 105 | 126 | ||||||||||
All amounts rounded to the nearest dollar.
**********
The stock performance graph should not be deemed filed or incorporated by reference into any other filing made by us under the Securities Act of 1933 or the Securities Exchange Act of 1934, except to the extent that we specifically incorporate the stock performance graph by reference in another filing.
23
Table of Contents
| Item 6. | SELECTED FINANCIAL DATA |
The following table sets forth the Company’s selected financial data for the year indicated and should be read in conjunction with the disclosures in Item 7, Management’s Discussion and Analysis of Results of Operations and Financial Condition and Item 8, Financial Statements and Supplementary Data, of this report.
| Fiscal Year | ||||||||||||||||||||
| 2005 | 2006 | 2007 | 2008 | 2009 | ||||||||||||||||
| ($ in thousands) | ||||||||||||||||||||
| Income Statement Data: |
||||||||||||||||||||
| Revenues: |
||||||||||||||||||||
| Restaurant sales |
$ | 194,898 | $ | 248,322 | $ | 292,916 | $ | 377,424 | $ | 330,533 | ||||||||||
| Franchise income |
11,432 | 12,399 | 12,896 | 12,703 | 10,533 | |||||||||||||||
| Other operating income |
885 | 4,648 | 3,201 | 3,520 | 3,564 | |||||||||||||||
| Total revenues |
207,215 | 265,369 | 309,013 | 393,647 | 344,630 | |||||||||||||||
| Costs and expenses: |
||||||||||||||||||||
| Food and beverage costs |
61,804 | 82,016 | 96,660 | 122,292 | 96,934 | |||||||||||||||
| Restaurant operating expenses |
86,876 | 108,102 | 132,615 | 188,608 | 176,995 | |||||||||||||||
| Marketing and advertising |
6,696 | 8,328 | 8,383 | 13,939 | 11,697 | |||||||||||||||
| General and administrative costs |
14,872 | 22,497 | 24,507 | 28,994 | 23,777 | |||||||||||||||
| Depreciation and amortization expenses |
6,489 | 8,690 | 11,768 | 16,706 | 16,499 | |||||||||||||||
| Pre-opening costs |
1,623 | 1,891 | 4,421 | 2,869 | 16 | |||||||||||||||
| Hurricane and relocation costs, net of insurance proceeds |
2,660 | (3,949 | ) | (3,478 | ) | — | — | |||||||||||||
| Loss on impairment |
— | 970 | — | 77,051 | 8,634 | |||||||||||||||
| Restructuring |
— | — | — | 8,926 | 40 | |||||||||||||||
| Loss on the disposal of property and equipment, net |
— | 13 | 1,229 | 508 | 1,963 | |||||||||||||||
| Operating income (loss) |
26,195 | 36,811 | 32,908 | (66,246 | ) | 8,075 | ||||||||||||||
| Other income (expense): |
||||||||||||||||||||
| Interest expense |
(8,453 | ) | (2,856 | ) | (5,956 | ) | (10,334 | ) | (7,754 | ) | ||||||||||
| Accrued dividends and accretion on mandatorily redeemable senior preferred stock |
(1,891 | ) | — | — | — | — | ||||||||||||||
| Other |
(39 | ) | 33 | 726 | 868 | 532 | ||||||||||||||
| Income (loss) from continuing operations before income tax expense (benefit) |
15,812 | 33,988 | 27,678 | (75,712 | ) | 853 | ||||||||||||||
| Income tax expense (benefit) |
5,043 | 10,534 | 8,889 | (27,203 | ) | (1,668 | ) | |||||||||||||
| Income (loss) from continuing operations |
10,769 | 23,454 | 18,789 | (48,509 | ) | 2,521 | ||||||||||||||
| Discontinued operations, net of income tax benefit |
(164 | ) | (336 | ) | 643 | 5,374 | 102 | |||||||||||||
| Net income (loss) |
$ | 10,933 | $ | 23,790 | $ | 18,146 | $ | (53,883 | ) | $ | 2,419 | |||||||||
24
Table of Contents
| Fiscal Year | ||||||||||||||||||
| 2005 | 2006 | 2007 | 2008 | 2009 | ||||||||||||||
| ($ in thousands, except per share data) | ||||||||||||||||||
| Less dividends earned on junior preferred stock and warrant expense |
3,753 | — | — | — | — | |||||||||||||
| Net income (loss) available to common shareholders |
$ | 7,180 | $ | 23,790 | $ | 18,146 | $ | (53,883 | ) | $ | 2,419 | |||||||
| Basic earnings (loss) per share: |
||||||||||||||||||
| Continuing operations |
$ | 0.39 | $ | 1.01 | $ | 0.81 | $ | (2.08 | ) | $ | 0.11 | |||||||
| Discontinued operations |
0.01 | 0.02 | (0.03 | ) | (0.23 | ) | (0.01 | ) | ||||||||||
| Basic earnings (loss) per share |
$ | 0.40 | $ | 1.03 | $ | 0.78 | $ | (2.31 | ) | $ | 0.10 | |||||||
| Diluted earnings (loss) per share: |
||||||||||||||||||
| Continuing operations |
$ | 0.38 | $ | 1.00 | $ | 0.81 | $ | (2.08 | ) | $ | 0.11 | |||||||
| Discontinued operations |
0.01 | 0.02 | (0.03 | ) | (0.23 | ) | (0.01 | ) | ||||||||||
| Diluted earnings (loss) per share |
$ | 0.39 | $ | 1.02 | $ | 0.78 | $ | (2.31 | ) | $ | 0.10 | |||||||
| Shares used in computing net income (loss) per common share: |
||||||||||||||||||
| Basic |
17,961,198 | 23,175,323 | 23,206,864 | 23,307,198 | 23,566,358 | |||||||||||||
| Diluted |
18,710,141 | 23,429,185 | 23,399,446 | 23,307,198 | 23,733,260 | |||||||||||||
| Balance Sheet Data (at end of fiscal year): |
||||||||||||||||||
| Cash and cash equivalents |
$ | 8,985 | $ | 4,690 | $ | 12,311 | $ | 3,876 | $ | 1,681 | ||||||||
| Total assets |
134,196 | 209,720 | 260,278 | 293,519 | 254,415 | |||||||||||||
| Total long-term debt including current portion |
38,500 | 68,000 | 96,750 | 160,250 | 125,500 | |||||||||||||
| Total shareholders’ equity |
40,265 | 67,978 | 88,067 | 37,142 | 41,765 | |||||||||||||
Certain prior year amounts in the above selected financial data have been reclassified to conform to the current year presentation of discontinued operations. In addition, certain corrections have been made for the reporting of the Company’s classification of sales discounts within the consolidated statements of income (loss). The consolidated statements of income (loss) for fiscal years 2005, 2006, 2007 and 2008 have been revised to correct an immaterial error in the accounting for sales discounts, which should have been recorded as a reduction of sales instead of as operating expenses. When reviewing the previously reported annual consolidated statements of income (loss) in comparison to those reported in this Form 10-K, restaurant sales decreased by $4.7 million, $6.4 million, $8.5 million and $10.9 million, other operating income increased by $0.1 million, $0.3 million, $0.6 million and $0.7 million, restaurant operating expenses decreased by $4.3 million, $5.6 million, $7.3 million and $9.8 million, and general and administrative expenses decreased by $0.3 million, $0.5 million, $0.6 million and $0.4 million for the fiscal years ended December 25, 2005, December 31, 2006, December 30, 2007, and December 28, 2008, respectively. For all periods above, reclassifications had no impact on previously reported operating income (loss), net income (loss) or earnings (loss) per share amounts.
In the Company’s 8-K filed on February 19, 2010, the company furnished exhibits along with its fiscal fourth quarter earnings press release presenting unaudited consolidated statements of income (loss) for the 13-week and 52-week periods ended December 27, 2009. Reflected in the 52-week period ended December 27, 2009 presented in the selected financial data above, income tax benefit and income from continuing operations increased by $1.5 million to $1.7 million and $2.5 million, respectively, from $0.1 million and $1.0 million, respectively, as presented in the unaudited exhibit. Discontinued operations, net of income tax benefit decreased by the same $1.5 million change to a loss of $0.1 million compared to a benefit of $1.4 million as presented in the unaudited exhibit. There is no difference when comparing operating income (loss), net income (loss) or earnings (loss) per share.
25
Table of Contents
| Item 7. | MANAGEMENT’S DISCUSSION AND ANALYSIS AND RESULTS OF OPERATIONS AND FINANCIAL CONDITION |
Overview
Ruth’s Hospitality Group, Inc. is a leading restaurant company focused on the upscale dining segment. The Ruth’s Chris menu features a broad selection of high-quality USDA Prime and Choice grade steaks and other premium offerings served in Ruth’s Chris’ signature fashion—“sizzling” and topped with seasoned butter—complemented by other traditional menu items inspired by our New Orleans heritage. The Ruth’s Chris restaurants reflect the more than 40-year commitment to the core values instilled by our founder, Ruth Fertel, of caring for our guests by delivering the highest quality food, beverages and service in a warm and inviting atmosphere. We believe that Ruth’s Chris is one of the strongest brands in the upscale steakhouse category.
Our restaurants cater to families and special occasion diners, in addition to the business clientele traditionally served by upscale steakhouses, by providing a dining experience designed to appeal to a wide range of guests. We believe our focus on creating this broad appeal provides us with opportunities to expand into a wide range of markets, including many markets not traditionally served by upscale steakhouses.
We offer USDA Prime and Choice grade steaks that are aged and prepared to exact company standards and cooked in 1,800-degree broilers. We also offer veal, lamb, poultry and seafood dishes, and a broad selection of appetizers, including New Orleans-style barbequed shrimp, mushrooms stuffed with crabmeat, shrimp remoulade, Louisiana seafood gumbo, onion soup au gratin, crabtini and seven salad variations. We complement our distinctive food offerings with an award-winning wine list, typically featuring bottles priced at between $24 and $2,000 and many selections offered by the glass. The current average check is $69.
As of December 27, 2009, there were 130 Ruth’s Chris restaurants, of which 64 were company-owned and 66 were franchisee-owned, including 14 international franchisee-owned restaurants in Aruba, Canada, China (Hong Kong), Japan, Mexico, Taiwan, and the United Arab Emirates.
On February 19, 2008, we completed the acquisition of the operating assets and intellectual property of Mitchell’s Fish Market, operating under the names Mitchell’s Fish Market and Columbus Fish Market, and Cameron’s Steakhouse, operating under the names Cameron’s Steakhouse and Mitchell’s Steakhouse from Cameron Mitchell Restaurants, LLC (CMR) for approximately $93.0 million, including capitalized acquisition costs. There are currently 19 Mitchell’s Fish Markets and three Cameron’s Steakhouse’s with locations in the Midwest, Northeast, and Florida. Mitchell’s Fish Market is an award-winning, upscale, yet comfortable, seafood restaurant and bar recognized for its high-quality food, contemporary dining atmosphere, and excellent service. We believe that Mitchells’ focus on upscale casual dining is a wonderful complement to our own brand.
Mitchell’s Fish Market is committed to fresh seafood and all of its seafood is flown in daily. Although the menu changes frequently based on availability and season, it includes more than 80 seafood choices, including fish from all over the world. The current average check is $34.
Key Financial Terms and Metrics
We evaluate our business using a variety of key financial measures:
Restaurant Sales. Restaurant sales consist of food and beverage sales by company-owned restaurants. Restaurant sales are primarily influenced by total operating weeks in the relevant period and comparable restaurant sales growth. Total operating weeks is the total number of company-owned restaurants multiplied by the number of weeks each is in operation during the relevant period. Total operating weeks are impacted by restaurant openings and closings, as well as changes in the number of weeks included in the relevant period. Comparable restaurant sales growth reflects the change in year-over-year or quarter-over-quarter, as applicable, sales for the comparable restaurant base. We define the comparable restaurant base to be those company-owned
26
Table of Contents
restaurants in operation for not less than fifteen months prior to the beginning of the fiscal quarter including the period being measured. Comparable restaurant sales growth is primarily influenced by the number of entrées sold and the average guest check. The number of entrees sold is influenced by the popularity of our menu items, our guest mix, our ability to deliver a high-quality dining experience and overall economic conditions. Average guest check, a measure of total restaurant sales divided by the number of entrées, is driven by menu mix and pricing.
Franchise Income. Franchise income includes (1) franchise and development option fees charged to franchisees and (2) royalty income. Franchise royalties consist of 5.0% of adjusted gross sales from each franchisee-owned restaurant. In addition, our new franchise agreements require up to a 1% advertising fee to be paid by the franchisee which is applied to national advertising expenditures. Under our prior franchise agreements, the Company would pay 1% out of the 5% royalty toward national advertising. We evaluate the performance of our franchisees by measuring franchisee-owned restaurant operating weeks, which is impacted by franchisee-owned restaurant openings and closings, and comparable franchisee-owned restaurant sales growth, which together with operating weeks, drives royalty income.
Other Operating Income. Other operating income includes banquet related guarantee and services revenue and other incidental guest fees as well as other licensing fees and income associated with the sale of gift cards. While we always honor gift cards, even beyond any stated expiration dates on the card and as required in several jurisdictions, our historical experience has shown that very few cards are redeemed after 18 months following the date of last activity. As such, we record in other operating income the full remaining value (original issue less any partial redemption) of any gift cards unredeemed after 18 months from the date of last activity, subject to limitations in some jurisdictions in which we operate.
Food and Beverage Costs. Food and beverage costs include all restaurant-level food and beverage costs of company-owned restaurants. We measure food and beverage costs by tracking cost of sales as a percentage of restaurant sales and cost per entrée. Food and beverage costs are generally influenced by the cost of food and beverage items, distribution costs and menu mix.
Restaurant Operating Expenses. We measure restaurant-operating expenses for company-owned restaurants as a percentage of restaurant sales. Restaurant operating expenses include the following:
| • | Labor costs, consisting of restaurant management salaries, hourly staff payroll and other payroll-related items, including taxes and fringe benefits. We measure our labor cost efficiency by tracking hourly and total labor costs as a percentage of restaurant sales; |
| • | Operating costs, consisting of maintenance, utilities, bank and credit card charges, and any other restaurant-level expenses; and |
| • | Occupancy costs, consisting of both fixed and variable portions of rent, common area maintenance charges, insurance premiums and real property taxes. |
Marketing and Advertising. Marketing and advertising includes all media, production and related costs for both local restaurant advertising and national marketing. We measure the efficiency of our marketing and advertising expenditures by tracking these costs as a percentage of total revenues. We have historically spent approximately 2.5% to 4.0% of total revenues on marketing and advertising and expect to maintain this level in the near term. All franchise agreements executed based on our new form of franchise agreement include up to a 1.0% advertising fee in addition to the 5.0% royalty fee. We spend this designated advertising fee on national advertising and record these fees as liabilities against which specified advertising and marketing costs will be charged.
General and Administrative. General and administrative costs include costs relating to all corporate and administrative functions that support development and restaurant operations and provide an infrastructure to support future company and franchisee growth. General and administrative costs are comprised of management,
27
Table of Contents
supervisory and staff salaries and employee benefits, travel, information systems, training, corporate rent, professional and consulting fees, technology and market research. We measure our general and administrative expense efficiency by tracking these costs as a percentage of total revenues.
Depreciation and Amortization. Depreciation and amortization includes depreciation of fixed assets and certain definite life intangible assets. We depreciate capitalized leasehold improvements over the shorter of the total expected lease term or their estimated useful life.
Pre-Opening Costs. Pre-opening costs consist of costs incurred prior to opening a company-owned restaurant, which are comprised principally of manager salaries and relocation costs, employee payroll and related training costs for new employees, including practice and rehearsal of service activities as well as lease costs incurred prior to opening.
Results of Operations
The table below sets forth certain operating data expressed as a percentage of restaurant sales and total revenues for the periods indicated. Our historical results are not necessarily indicative of the operating results that may be expected in the future. Certain prior year amounts have been reclassified to conform to the current year presentation of discontinued operations and sales discounts. See Note 19 of the notes to our audited financial statements located in this Form 10-K for reclassifications due to corrections to previously reported amounts. These reclassifications had no effect on previously reported net income.
| Fiscal Year | |||||||||
| 2007 | 2008 | 2009 | |||||||
| Revenues: |
|||||||||
| Restaurant sales |
94.8 | % | 95.9 | % | 95.9 | % | |||
| Franchise income |
4.2 | % | 3.2 | % | 3.1 | % | |||
| Other operating income |
1.0 | % | 0.9 | % | 1.0 | % | |||
| Total revenues |
100.0 | % | 100.0 | % | 100.0 | % | |||
| Costs and expenses: |
|||||||||
| Food and beverage costs (percentage of restaurant sales) |
33.0 | % | 32.4 | % | 29.3 | % | |||
| Restaurant operating expenses (percentage of restaurant sales) |
45.3 | % | 50.0 | % | 53.5 | % | |||
| Marketing and advertising |
2.7 | % | 3.5 | % | 3.4 | % | |||
| General and administrative costs |
7.9 | % | 7.4 | % | 6.9 | % | |||
| Depreciation and amortization expenses |
3.8 | % | 4.2 | % | 4.8 | % | |||
| Pre-opening costs |
1.4 | % | 0.7 | % | — | ||||
| Hurricane and relocation costs, net of insurance proceeds |
(1.1 | )% | — | — | |||||
| Loss on impairment |
— | 19.6 | % | 2.5 | % | ||||
| Restructuring |
— | 2.3 | % | — | |||||
| Loss on the disposal of property and equipment, net |
0.4 | % | 0.1 | % | 0.6 | % | |||
| Operating income (loss) |
10.6 | % | (16.8 | )% | 2.3 | % | |||
| Other income (expense): |
|||||||||
| Interest expense |
(1.9 | )% | (2.6 | )% | (2.2 | )% | |||
| Other |
0.2 | % | 0.2 | % | 0.2 | % | |||
| Income (loss) from continuing operations before income tax expense (benefit) |
9.0 | % | (19.2 | )% | 0.2 | % | |||
| Income tax expense (benefit) |
2.9 | % | (6.9 | )% | (0.5 | )% | |||
| Income (loss) from continuing operations |
6.1 | % | (12.3 | )% | 0.7 | % | |||
| Discontinued operations, net of income tax benefit |
0.2 | % | 1.4 | % | — | ||||
| Net income (loss) |
5.9 | % | (13.7 | )% | 0.7 | % | |||
28
Table of Contents
Fiscal Year 2009 Compared to Fiscal Year 2008
Restaurant sales. Restaurant sales decreased $46.9 million, or 12.4%, to $330.5 million in fiscal 2009 from $377.4 million in fiscal 2008. Ruth’s Chris comparable restaurants experienced a sales decrease of 19.5%, consisting of a 15.8% decrease in entrée growth (traffic) and a per entrée check average decrease of 4.2%, offset by sales mix shifts. This was offset by a $3.5 million or 4.8% increase in 2009 sales from the 22 Mitchell’s restaurants acquired in February 2008. Full year 2009 Mitchell’s sales were $75.5 million compared to partial year 2008 sales of $72.0 million.
Franchise Income. Franchise income decreased $2.2 million, or 17.3%, to $10.5 million in fiscal 2009 from $12.7 million in fiscal 2008. The decrease was driven primarily by a 13.8% decrease in franchise-owned restaurant sales.
Other Operating Income. Other operating income increased $0.1 million, to $3.6 million in fiscal 2009 from $3.5 million in fiscal 2008.
Food and Beverage Costs. Food and beverage costs decreased $25.4 million, or 20.8%, to $96.9 million in fiscal 2009 from $122.3 million in fiscal 2008. As a percentage of restaurant sales, food and beverage costs decreased to 29.3% in fiscal 2009 from 32.4% in fiscal 2008. This decrease in food and beverage costs as a percentage of restaurant sales was primarily due to favorable beef costs.
Restaurant Operating Expenses. Restaurant operating expenses decreased $11.6 million, or 6.2%, to $177.0 million in fiscal 2009 from $188.6 million in fiscal 2008 due to reduction in variable expenses consistent with restaurant sales decrease. Restaurant operating expenses, as a percentage of restaurant sales, increased to 53.5% in fiscal 2009 from 50.0% in fiscal 2008 due to reduced fixed expense leverage experienced from lower comparable store sales.
Marketing and Advertising. Marketing and advertising expenses decreased $2.2 million, or 15.8%, to $11.7 million in fiscal 2009 from $13.9 million in fiscal 2008. Marketing and advertising expenses, as a percentage of total revenues, increased to 3.5% in fiscal 2009 from 3.4% in fiscal 2008.
General and Administrative Costs. General and administrative costs decreased $5.2 million, or 17.9%, to $23.8 million in fiscal 2009 from $29.0 million in fiscal 2008. General and administrative costs, as a percentage of total revenues, decreased to 6.9% in fiscal 2009 from 7.4% in fiscal 2008. This decrease was primarily due to our corporate reorganization completed during the fourth quarter of 2008.
Depreciation and Amortization Expenses. Depreciation and amortization expense decreased $0.2 million, or 1.2%, to $16.5 million in fiscal 2009 from $16.7 million in fiscal 2008 due to a decrease in investments at our existing company-owned restaurants.
Pre-Opening Costs. There were minimal pre-opening costs in fiscal 2009 as there were no company-owned restaurant openings. There were pre-opening costs of $2.9 million in fiscal 2008. There were no new company-owned restaurant openings in fiscal 2009. We opened five new company-owned restaurants in fiscal 2008.
Loss on Impairment. We recognized a loss on the impairment of long-lived and intangible assets of $8.6 million in fiscal 2009 compared to a loss on the impairment of long-lived and intangible assets of $81.3 million in fiscal 2008. Of the total loss on impairment recognized in 2009, $0.8 million was related to the impairment of long-lived assets, $0.2 million was related to the impairment of the Mitchell’s Fish Market and Mitchell’s Steakhouse trademarks, $5.1 million was related to the impairment of franchise rights for seven company-owned restaurants acquired in 2006 and three company-owned restaurants acquired in 2007, and $2.2 million was related to the impairment of goodwill. The remaining $0.3 million loss was due to impairment charges related to the closure of the Ruth’s Chris Steak House location in San Juan, Puerto Rico, on February 28, 2009, due to an expired lease term in February 2009.
29
Table of Contents
Restructuring Expenses. In 2009, we recognized $40 of restructuring expenses which consisted of a $417 charge related to the settlement of lease obligations of undeveloped restaurant properties in Thousand Oaks, California, and Dedham, Massachusetts, offset by a $377 recovery on the lease obligation for our corporate headquarters.
Loss on the disposal of property and equipment, net. Loss on the disposal of property and equipment was $2.0 million in fiscal 2009 compared to loss on disposal of property and equipment of $0.5 million in fiscal 2008. Loss on disposal in fiscal 2009 was primarily due to the sale of our former home office land and building in Metairie, Louisiana, and the sale of the home office land and building in Heathrow, Florida.
Interest Expense. Interest expense, net of interest income, decreased $2.5 million, or 24.3%, to $7.8 million in fiscal 2009 from $10.3 million in fiscal 2008. During fiscal 2009, we recorded a gain of $1.4 million for a mark-to-market non-cash adjustment relating to interest rate swap agreements. During fiscal 2008, we recorded a non-cash charge of $1.0 million for a mark-to-market adjustment relating to interest rate swap agreements.
Income Tax Benefit. Income tax benefit decreased $25.5 million, or 93.8%, to a net benefit of $1.7 million in fiscal 2009 from a net benefit of $27.2 million fiscal 2008. The decrease was due to a net loss before income tax of $75.7 million in fiscal 2008 compared to net income of $0.9 million before tax in fiscal 2009.
Income (Loss) from Continuing Operations. Income from continuing operations increased $51.0 million, or 105.2%, to $2.5 million in fiscal 2009 from a net loss of $48.5 million in fiscal 2008.
Discontinued Operations, net of Income Tax Benefit. Discontinued operations resulted in a $0.1 million loss in fiscal 2009 compared to $5.4 million of loss in fiscal 2008. Discontinued operations income and loss relates to former operations in New York, New York, and Naples, Florida. The change was caused primarily by a $4.2 million loss from impairment in the Naples restaurant in 2008.
During the third quarter of fiscal 2007, we were notified that the replacement tenant in the Manhattan-UN, New York, location was placed in default by the landlord and as a result, we resumed lease payments with respect to this property during the third quarter of fiscal 2008. Payments will equal $0.6 million in the aggregate per fiscal year through September 2016. We will attempt to sublease the property in order to recover some or all of the amounts paid with respect to the lease. As of December 27, 2009, we maintain a contingent lease liability of $0.8 million related to this property. We accounted for our exit costs in accordance with the provisions of “Exit or Disposal Cost Obligations,” FASB Accounting Standards Codification Topic 420 (Topic 420), which requires that such costs be expensed in the periods whereby such costs are incurred. All of the losses incurred are included in discontinued operations in the accompanying condensed consolidated income statements.
During the second quarter of fiscal 2009, we made the decision to close the company-owned Ruth’s Chris restaurant in Naples, Florida. At December 27, 2009, we maintained a liability for lease exit costs in accordance with the provisions of Topic 420. All of the losses incurred with respect to this location are included in discontinued operations in the accompanying consolidated income statements.
Fiscal Year 2008 Compared to Fiscal Year 2007
Restaurant sales. Restaurant sales increased $84.5 million, or 28.8%, to $377.4 million in fiscal 2008 from $292.9 million in fiscal 2007. This increase was due primarily to an additional $72.0 million contributed from 22 Mitchell’s restaurants acquired during fiscal 2008, and $39.7 million from Ruth’s Chris Steak Houses opened during fiscal 2007 and 2008. This increase was offset by a decrease in comparable restaurant sales. Ruth’s Chris comparable restaurants experienced a sales decrease of 10.2%, consisting of a 10.2% decrease in entrée growth (traffic). The per entrée check average remained unchanged from 2007.
30
Table of Contents
Franchise Income. Franchise income decreased $0.2 million, or 1.6%, to $12.7 million in fiscal 2008 from $12.9 million in fiscal 2007. The decrease was driven primarily by a $0.3 million reduction in franchise opening fees. Operational weeks increased 19.2% while blended comparable franchise-owned restaurant sales decreased 9.9%.
Other Operating Income. Other operating income increased $0.3 million, or 9.4%, to $3.5 million in fiscal 2008 from $3.2 million in fiscal 2007. This increase was due primarily to increased gift card breakage.
Food and Beverage Costs. Food and beverage costs increased $25.6 million, or 26.5%, to $122.3 million in fiscal 2008 from $96.7 million in fiscal 2007. The increase was due to higher restaurant sales and partially offset by lower meat costs. As a percentage of restaurant sales, food and beverage costs decreased to 32.4% in fiscal 2008 from 33.0% in fiscal 2007.
Restaurant Operating Expenses. Restaurant operating expenses increased $56.0 million, or 42.2%, to $188.6 million in fiscal 2008 from $132.6 million in fiscal 2007. The increase was due to higher restaurant sales in fiscal 2008, increased hourly labor costs, staffing related to new restaurant openings and increased occupancy costs. Restaurant operating expenses, as a percentage of restaurant sales, increased to 50.0% in fiscal 2008 from 45.3% in fiscal 2007. This increase in restaurant operating expenses as a percentage of restaurant sales was due to increased labor, operating, and occupancy expenses of newly opened restaurants as well as reduced fixed expense leverage experienced from lower comparable restaurant sales.
Marketing and Advertising. Marketing and advertising expenses increased $5.5 million, or 65.5%, to $13.9 million in fiscal 2008 from $8.4 million in fiscal 2007. Marketing and advertising expenses, as a percentage of total revenues, increased to 3.5% in fiscal 2008 from 2.7% in fiscal 2007. This increase was primarily due to value promotions introduced during the second half of 2008 aimed at improving guest traffic.
General and Administrative Costs. General and administrative costs increased $4.5 million, or 18.4%, to $29.0 million in fiscal 2008 from $24.5 million in fiscal 2007. General and administrative costs, as a percentage of total revenues, decreased to 7.4% in fiscal 2008 from 7.9% in fiscal 2007. This decrease was primarily due to our corporate reorganization completed during the fourth quarter of 2008.
Depreciation and Amortization Expenses. Depreciation and amortization expense increased $4.9 million, or 41.5%, to $16.7 million in fiscal 2008 from $11.8 million in fiscal 2007. The increase was due primarily to the addition of new Ruth’s Chris company-owned restaurants and acquired restaurants during 2007 and 2008 as well as investments at our existing company-owned restaurants and corporate headquarters.
Pre-Opening Costs. Pre-opening costs decreased $1.5 million, or 34.1%, to $2.9 million in fiscal 2008 from $4.4 million in fiscal 2007. This decrease was due to the opening of five new Ruth’s Chris company-owned restaurants in fiscal 2008 versus eight locations during fiscal 2007.
Hurricane and Relocation costs net of insurance proceeds. We recognized income, net of relocation costs, of $0.0 million in fiscal 2008 compared to $3.5 million in fiscal 2007. These net insurance proceeds recognized in 2007 related to our business interruption losses and property losses in New Orleans and Metairie, Louisiana and Biloxi, Mississippi as a result of Hurricane Katrina. We finalized the claim in fiscal 2007 and do not expect further proceeds related to Hurricane Katrina.
Loss on Impairment. We recognized a loss on the impairment of long-lived and intangible assets of $81.3 million in fiscal 2008 compared with no impairments in fiscal 2007. Of the total loss on impairment recognized, $32.1 million was related to the impairment of long-lived assets, $12.1 million was related the impairment of the Mitchell’s Fish Market and Mitchell’s Steakhouse trademarks and $5.9 million was related to the impairment of franchise rights for three company-owned restaurants acquired in 2007. The remaining $31.2 million was related to the impairment of goodwill.
31
Table of Contents
Restructuring Expenses. We recognized restructuring expenses of $8.9 million in fiscal 2008 compared with no expense in fiscal 2007. Of the $8.9 million, $2.2 million was severance related costs, $6.0 million was related to contingent lease liability charges and write-offs of capitalized development costs on company-owned restaurant development scheduled for 2009. The remaining $0.7 million was related to a contingent lease liability for vacated leased office space.
Interest Expense. Interest expense, net of interest income, increased $4.3 million, or 71.7%, to $10.3 million in fiscal 2008 from $6.0 million in fiscal 2007. This increase was primarily due to the additional borrowings related to the 2007 and 2008 acquired restaurants as well as higher interest rates on those borrowings. Interest expense during the year included a $1.0 million “mark to market” non-cash charge related to an interest rate swap.
Income Tax Expense (Benefit). Income tax expense decreased $36.1 million, or 405.6%, to a net benefit of $27.2 million in fiscal 2008 from an $8.9 million expense in fiscal 2007. The decrease was due to a net loss before income tax that was partially offset by an increase in the annual effective tax rate from 32.1% in fiscal 2007 to 34.0% in fiscal 2008.
Income (Loss) from Continuing Operations. Income from continuing operations decreased $67.3 million, or 358.0%, to a loss of $48.5 million in fiscal 2008 from income of $18.8 million in fiscal 2007.
Discontinued Operations, net of Income Tax Benefit. Discontinued operations resulted in $5.4 million of loss in fiscal 2008 compared to $0.6 million of loss in fiscal 2007. Discontinued operations income and loss relates to former operations in New York, New York, and Naples, Florida. Discontinued operations in fiscal 2008 included a $4.2 million charge for impairment of long-lived assets.
During the third quarter of fiscal 2007, we were notified that the replacement tenant in the Manhattan-UN, New York, location was placed in default by the landlord and as a result, we resumed lease payments with respect to this property during the third quarter of fiscal 2008. Payments will equal $0.6 million in the aggregate per fiscal year through September 2016. We will attempt to sublease the property in order to recover some or all of the amounts paid with respect to the lease. As of December 28, 2008, we maintained a contingent lease liability of $1.1 million related to this property. We accounted for our exit costs in accordance with the provisions of Topic 420, which requires that such costs be expensed in the periods whereby such costs are incurred. All of the losses incurred are included in discontinued operations in the accompanying consolidated income statements.
32
Table of Contents
Potential Fluctuations in Quarterly Results and Seasonality
Our quarterly operating results may fluctuate significantly as a result of a variety of factors. See “Risk Factors,” which discloses certain material risks that could affect its quarterly operating results.
Our business is also subject to seasonal fluctuations. Historically, the percentages of our annual total revenues during the first and fourth fiscal quarters have been higher due, in part, to the year-end holiday season. Accordingly, results for any one quarter are not necessarily indicative of results to be expected for any other quarter or for any year, and comparable restaurant sales for any particular period may decrease. In the future, operating results may fall below the expectations of securities analysts and investors. If this occurs, the price of our common stock would likely decrease. The following table presents summary quarterly results of operations for fiscal 2008 and fiscal 2009.
| Quarter Ended | Quarter Ended | |||||||||||||||||||||||||||||||
| March 30, 2008 |
June 29, 2008 |
September 28, 2008 |
December 28, 2008 |
March 29, 2009 |
June 28, 2009 |
September 27, 2009 |
December 27, 2009 |
|||||||||||||||||||||||||
| ($ in millions, except per share data) | ||||||||||||||||||||||||||||||||
| Total revenues |
$ | 95.2 | $ | 105.5 | $ | 96.0 | $ | 96.9 | $ | 94.7 | $ | 86.4 | $ | 76.1 | $ | 87.4 | ||||||||||||||||
| Cost and expenses |
(86.0 | ) | (100.5 | ) | (94.4 | ) | (179.0 | ) | (87.8 | ) | (81.9 | ) | (75.2 | ) | (91.7 | ) | ||||||||||||||||
| Operating income (loss) |
$ | 9.2 | $ | 4.9 | $ | 1.7 | (82.1 | ) | $ | 6.9 | $ | 4.5 | $ | 1.0 | (4.3 | ) | ||||||||||||||||
| Interest expense, net |
(3.2 | ) | (1.2 | ) | (2.5 | ) | (3.4 | ) | (2.3 | ) | (1.8 | ) | (1.9 | ) | (1.7 | ) | ||||||||||||||||
| Other |
0.3 | 0.2 | 0.2 | 0.1 | 0.2 | 0.3 | (0.1 | ) | 0.2 | |||||||||||||||||||||||
| Income (loss) from continuing operations before income tax expense (benefit) |
6.4 | 3.9 | (0.6 | ) | (85.4 | ) | 4.8 | 3.0 | (1.0 | ) | (5.8 | ) | ||||||||||||||||||||
| Income tax expense (benefit) |
1.9 | 1.0 | (0.3 | ) | (29.8 | ) | 1.0 | 0.4 | (0.1 | ) | (2.9 | ) | ||||||||||||||||||||
| Income (loss) from continuing operations |
4.5 | 2.9 | (0.3 | ) | (55.6 | ) | 3.8 | 2.6 | (0.9 | ) | (3.0 | ) | ||||||||||||||||||||
| Discontinued operations, net of income tax benefit |
(0.0 | ) | 0.1 | 0.3 | 5.0 | 0.1 | 0.3 | 0.0 | (0.3 | ) | ||||||||||||||||||||||
| Net income (loss) |
4.5 | 2.8 | (0.5 | ) | (60.7 | ) | 3.7 | 2.3 | (1.0 | ) | (2.7 | ) | ||||||||||||||||||||
| Basic earnings (loss) per share: |
||||||||||||||||||||||||||||||||
| Continuing operations |
$ | 0.20 | $ | 0.13 | $ | (0.01 | ) | $ | (2.38 | ) | $ | 0.16 | $ | 0.11 | $ | (0.04 | ) | $ | (0.12 | ) | ||||||||||||
| Discontinued operations |
0.00 | (0.01 | ) | (0.01 | ) | (0.21 | ) | $ | (0.00 | ) | $ | (0.01 | ) | $ | (0.00 | ) | $ | 0.01 | ||||||||||||||
| Basic earnings (loss) per share |
$ | 0.20 | $ | 0.12 | $ | (0.02 | ) | $ | (2.59 | ) | $ | 0.16 | $ | 0.10 | $ | (0.04 | ) | $ | (0.11 | ) | ||||||||||||
| Diluted earnings (loss) per share: |
||||||||||||||||||||||||||||||||
| Continuing operations |
$ | 0.19 | $ | 0.13 | $ | (0.01 | ) | $ | (2.38 | ) | $ | 0.16 | $ | 0.11 | $ | (0.04 | ) | $ | (0.12 | ) | ||||||||||||
| Discontinued operations |
0.00 | (0.01 | ) | (0.01 | ) | (0.21 | ) | $ | (0.00 | ) | $ | (0.01 | ) | $ | (0.00 | ) | $ | (0.01 | ) | |||||||||||||
| Diluted earnings (loss) per share |
$ | 0.19 | $ | 0.12 | $ | (0.02 | ) | $ | (2.59 | ) | $ | 0.16 | $ | 0.10 | $ | (0.04 | ) | $ | (0.11 | ) | ||||||||||||
| Shares (in millions) used in computing net income (loss) per common share: |
||||||||||||||||||||||||||||||||
| Basic |
23.2 | 23.3 | 23.3 | 23.4 | 23.5 | 23.6 | 23.6 | 23.6 | ||||||||||||||||||||||||
| Diluted |
23.4 | 23.4 | 23.3 | 23.4 | 23.6 | 23.8 | 23.6 | 23.6 | ||||||||||||||||||||||||
| Quarterly percentage of annual revenues |
24.2 | % | 26.8 | % | 24.4 | % | 24.6 | % | 27.5 | % | 25.1 | % | 22.1 | % | 25.4 | % | ||||||||||||||||
| Operating margin |
9.7 | % | 4.7 | % | 1.7 | % | -84.7 | % | 7.3 | % | 5.2 | % | 1.3 | % | -4.9 | % | ||||||||||||||||
33
Table of Contents
Liquidity and Capital Resources
Our principal sources of cash during fiscal 2009 were net cash provided by operating activities and proceeds from the sale of property and equipment. Our principal use of cash during fiscal 2009 was debt paydowns. We expect that our principal uses of cash in 2010 will be for capital expenditures on existing restaurants and to pay down debt.
During the fourth quarter of fiscal 2009, the Company negotiated an amendment to its First Amended and Restated Credit Agreement. The Second Amendment to First Amended and Restated Credit Agreement became effective on February 12, 2010. The amendment to the credit agreement reduces the revolving loan commitment to $129.6 million, extends the scheduled maturity of the credit agreement by two years, to February 2015, and provides the Company with a less restrictive set of covenants, which the Company believes will enhance its financial and operating flexibility. Specifically, the amendment provides for no financial covenant testing until the end of fiscal year 2010, provides less restrictive leverage and coverage covenants thereafter, and permanently eliminates the minimum EBITDA covenant. The amendment provides for higher interest rates under the credit facility, with interest rates based on the Company’s actual leverage ratio, ranging from 3.25% to 5.00% above the applicable LIBOR rate or, at the Company’s option, from 2.00% to 3.75% above the applicable base rate.
Cash Flows
The following table summarizes our primary sources of cash in the periods presented:
| Fiscal Year | ||||||||||||
| 2007 | 2008 | 2009 | ||||||||||
| Net cash provided by (used in): |
||||||||||||
| Operating activities |
$ | 34,772 | $ | 37,073 | $ | 28,436 | ||||||
| Investing activities |
(56,082 | ) | (107,949 | ) | 6,412 | |||||||
| Financing activities |
28,931 | 62,441 | (37,043 | ) | ||||||||
| Net increase (decrease) in cash and cash equivalents |
$ | 7,621 | $ | (8,435 | ) | $ | (2,195 | ) | ||||
Our operations have not required significant working capital and, like many restaurant companies, we have been able to operate with negative working capital. Restaurant sales are primarily by cash or by credit card, and restaurant operations do not require significant inventories or receivables. In addition, we receive trade credit for the purchase of food, beverage and supplies, thereby reducing the need for incremental working capital to sustain operations.
Operating Activities. Net cash provided by operating activities was $34.8 million and $37.1 million in fiscal 2007 and fiscal 2008, respectively, compared to $28.4 million in fiscal 2009. The decrease in net cash from operating activities from fiscal 2008 was primarily due to changes in working capital.
Investing Activities. Net cash used in investing activities was $56.1 million and $108.0 million in fiscal 2007 and fiscal 2008, respectively, compared to net cash provided by investing activities of $6.4 million in fiscal 2009. The change in 2009 was primarily due to $10.7 million in proceeds from the sale of the former and current corporate headquarters, as well as a decrease in capital expenditures.
Financing Activities. Net cash provided by financing activities totaled $28.9 million in fiscal 2007 and $62.4 million in fiscal 2008 compared to net cash used in financing activities of $37.0 million in fiscal 2009. The decrease was the result of debt paydowns.
Capital Expenditures
Capital expenditures and other acquisitions totaled $4.3 million in fiscal 2009, $125.0 million in fiscal 2008 and $56.2 million in fiscal 2007. Capital expenditures in fiscal 2009 resulted from approximately $2.3 million for remodels and $2.0 million of maintenance capital. We anticipate capital expenditures in fiscal 2010 will be
34
Table of Contents
approximately $7.0 to $8.0 million. We expect to open one new company-owned Mitchell’s Fish Market restaurant in Winter Park, Florida in 2010. We do not expect to open any Ruth’s Chris Steak House company-owned restaurants in fiscal 2010.
Senior Credit Facility
On February 19, 2008, we amended and restated our existing credit facility to increase the revolving loan commitment to $250.0 million. The amended and restated credit extended the maturity date of the outstanding principal from March 11, 2010 to February 19, 2013, and changed the maximum Consolidated Leverage Ratio in the financial covenants to 3.50:1.00.
On February 26, 2009, we signed an amendment reducing the revolving loan commitment from $250.0 million to $175.0 million, with additional reductions scheduled beginning December 31, 2009 through the final maturity date of February 19, 2013. The amendment decreased our Fixed Charge Coverage Ratio and increased our maximum Consolidated Leverage Ratio, in each case beginning with the fourth quarter of 2008 and continuing through the second quarter of 2010, after which these two covenants reset to their original levels. The amendment increased the interest rates applicable to borrowings based on our actual leverage ratio, ranging from 2.50% to 4.25% above the applicable LIBOR rate or, at our option, from 1.25% to 3.00% above the applicable base rate.
During the fourth quarter of fiscal 2009, the Company negotiated an amendment to its First Amended and Restated Credit Agreement. The Second Amendment to First Amended and Restated Credit Agreement became effective on February 12, 2010. The amendment to the credit agreement reduces the revolving loan commitment to $129.6 million, extends the scheduled maturity of the credit agreement by two years, to February 2015, and provides the Company with a less restrictive set of covenants, which the Company believes will enhance its financial and operating flexibility. Specifically, the amendment provides for no financial covenant testing until the end of fiscal year 2010, provides less restrictive leverage and coverage covenants thereafter, and permanently eliminates the minimum EBITDA covenant. The amendment provides for higher interest rates under the credit facility, with interest rates based on the Company’s actual leverage ratio, ranging from 3.25% to 5.00% above the applicable LIBOR rate or, at the Company’s option, from 2.00% to 3.75% above the applicable base rate.
As of December 27, 2009, we had an aggregate of $125.5 million of outstanding indebtedness under our senior credit facility at a weighted average interest rate of 4.22%. We had approximately $41.0 million of borrowings available under our revolving credit facility, net of outstanding letters of credit of approximately $3.5 million. As of the February 12, 2010 amendment date, the outstanding indebtedness under our senior credit facility was $78.8 million, at a weighted average interest rate of 4.48%. Under the amended revolving loan commitment as of this date, we had approximately $47.3 million of borrowings available under our revolving credit facility, net of outstanding letters of credit of approximately $3.5 million. We are required to maintain certain financial covenants and are also subject to several restrictive covenants under our borrowings. The restrictive covenants include, but are not limited to, covenants that, subject to exceptions: (1) prohibit the Company and its subsidiaries from incurring additional indebtedness and from guaranteeing obligations of others; (2) prohibit the Company and its subsidiaries from creating, incurring, assuming or permitting to exist any lien on or with respect to any property or asset; (3) limit the Company’s ability and its subsidiaries’ ability to enter into joint ventures, acquisitions, and other investments; (4) prohibit the Company and its subsidiaries from directly or indirectly creating or becoming liable with respect to any contingent liabilities; and (5) restrict the Company and its subsidiaries from directly or indirectly declaring, ordering, paying, or making any restricted junior payments in excess of the $1.0 in annual dividends permitted under the credit agreement.
Our obligations under the senior credit facility are guaranteed by each of our existing and future subsidiaries and are secured by substantially all of our assets and a pledge of the capital stock of our subsidiaries.
35
Table of Contents
Contractual Obligations
The following table summarizes our contractual obligations as of December 27, 2009:
| Payments due by period | |||||||||||||||
| Total | Less than 1 year |
1-2 years |
3-5 years |
More than 5 years | |||||||||||
| (in millions) | |||||||||||||||
| Long-term debt obligations |
$ | 125.5 | $ | — | $ | — | $ | 125.5 | $ | — | |||||
| Operating lease obligations |
319.6 | 24.1 | 23.9 | 65.0 | 206.6 | ||||||||||
| Total |
$ | 445.1 | $ | 24.1 | $ | 23.9 | $ | 190.5 | $ | 206.6 | |||||
Off-Balance Sheet Arrangements
As of December 27, 2009, we do not have any off-balance sheet arrangements.
Critical Accounting Policies and Estimates
Our discussion and analysis of results of operations and financial condition are based upon our audited consolidated financial statements, which have been prepared in accordance with accounting principles generally accepted in the United States of America. The preparation of these financial statements is based, in part, on our critical accounting policies that require us to make estimates and judgments that affect the amounts reported in those financial statements. Our significant accounting policies, which may be affected by our estimates and assumptions, are more fully described in Note 2 to our consolidated financial statements that appear elsewhere in Item 8. Critical accounting policies are those that we believe are most important to portraying our financial condition and results of operations and also require the greatest amount of subjective or complex judgments by management. Judgments or uncertainties regarding the application of these policies may result in materially different amounts being reported under different conditions or using different assumptions. We consider the following policies to be the most critical in understanding the judgments that are involved in preparing the combined financial statements.
Impairment of Long-Lived Assets
We review property and equipment (which includes leasehold improvements) for impairment when events or circumstances indicate these assets might be impaired. We test impairment using historical cash flow and other relevant facts and circumstances as the primary basis for our estimates of future cash flows. The analysis is performed at the restaurant level for indicators of permanent impairment. In determining future cash flows, we make significant estimates with respect to future operating results of each restaurant over its remaining lease term. If assets are determined to be impaired, the impairment charge is measured by calculating the amount by which the asset-carrying amount exceeds its fair value. This process requires the use of estimates and assumptions, which are subject to a high degree of judgment. If these assumptions change in the future, we may be required to record additional impairment charges for these assets.
The judgments we make related to the expected useful lives of long-lived assets and our ability to realize undiscounted cash flows in excess of the carrying amounts of these assets are affected by factors such as the ongoing maintenance and improvements of the assets, changes of economic conditions, changes in usage or operating performance and desirability of the restaurant sites. As we assess the ongoing expected cash flows and carrying amounts of our long-lived assets, significant adverse changes in these factors could cause us to realize a material impairment charge.
We account for exit or disposal activities, including restaurant closures, in accordance with Topic 360-10. Such costs include the cost of disposing of the assets as well as other facility-related expenses from previously
36
Table of Contents
closed restaurants. These costs are generally expensed as incurred. Additionally, at the date we cease using a property under an operating lease, we record a liability for the net present value of any remaining lease obligations, net of estimated sublease income. Any subsequent adjustments to that liability as a result of lease termination or changes in estimates of sublease income are recorded in the period incurred. Upon disposal of the assets associated with a closed restaurant, any gain or loss is recorded in the same line within our consolidated statements of income (loss) as the original impairment.
Goodwill, Franchise Rights and Trademarks
Goodwill and other indefinite lived assets arose primarily from our acquisition of franchisee-owned restaurants and Mitchell’s Fish Markets. The most significant acquisitions were completed in 1996, 1999, 2006, 2007 and 2008. Goodwill and other indefinite lived assets acquired prior to 2008 are not subject to amortization. Such assets must be tested for impairment whenever events or changes in circumstances indicate that the carrying amount may not be recoverable and at least annually. We completed the most recent impairment test in December 2009 and determined that impairment losses related to goodwill and other indefinite lived assets in the amount of $7.5 million should be recorded. In assessing the recoverability of goodwill and other indefinite lived assets, market values and projections regarding estimated future cash flows and other factors are used to determine the fair value of the respective assets.
A significant amount of judgment is involved in determining if an indicator of impairment has occurred. Such indicators may include, among others: future revenues and expenses, potential unit growth, as well as market multiples. Any adverse change in these factors could have a significant impact on the recoverability of these assets and could have a material impact on our consolidated financial statements. If these estimates or related projections change in the future, we may be required to record additional impairment charges for these assets.
The goodwill impairment test involves a two-step process. The first step is a comparison of the carrying value of the long-lived assets to the fair value of the reporting unit, which is considered to be the individual restaurant acquired. Consistent with the valuation of restaurant operations, the Company utilized a multiple of EBITDA to approximate the fair value of the reporting units for purposes of completing Step 1 of the evaluation. The Company considered EBITDA multiples of publicly held companies, including its own, as well as other private reporting unit acquisitions. For reporting units whose estimated fair value exceeded its carrying value, no impairment was recorded. For reporting units whose fair value did not exceed the carrying value as the balance sheet date, the Company completed Step 2 of the evaluation by comparing the implied fair value of goodwill with the carrying amount at the reporting unit level. The Company calculated the implied fair value by allocating the fair value of a reporting unit to all of its assets and liabilities as if the reporting unit had been acquired in a business combination and the fair value of the reporting unit was the price paid to acquire the unit. For reporting units whose implied fair value did not exceed the carrying amount of the reporting unit net asset value as of the balance sheet date, the Company recorded an impairment charge for the difference, not to exceed the goodwill carrying value. The fair values of the reporting units with goodwill on the balance sheet as of December 27, 2009 significantly exceed their carrying values.
Insurance Liability
We maintain various insurance policies for workers’ compensation, employee health, general liability, and property damage. Pursuant to those policies, we are responsible for losses up to certain limits and are required to estimate a liability that represents our ultimate exposure for aggregate losses below those limits. This liability is based on management’s estimates of the ultimate costs to be incurred to settle known claims and claims not reported as of the balance sheet date. Our estimated liability is not discounted and is based on a number of assumptions and factors, including historical trends, actuarial assumptions, and economic conditions. If actual trends differ from our estimates, our financial results could be impacted.
37
Table of Contents
Income Taxes
We account for income taxes in accordance with “Income Taxes,” FASB Accounting Standards Codification Topic 740 (Topic 740). This Statement establishes financial accounting and reporting standards for the effects of income taxes that result from an enterprise’s activities during the current and preceding years. It requires an asset and liability approach for financial accounting and reporting of income taxes. We recognize deferred tax liabilities and assets for the future consequences of events that have been recognized in our consolidated financial statements or tax returns. In the event the future consequences of differences between financial reporting bases and tax bases of our assets and liabilities resulted in a net deferred tax asset, an evaluation is made of the probability of our ability to realize the future benefits indicated by such asset. A valuation allowance related to a deferred tax asset is recorded when it is more likely than not that some portion or the entire deferred tax asset will not be realized. The realization of such net deferred tax will generally depend on whether we will have sufficient taxable income of an appropriate character within the carry-forward period permitted by the tax law. Without sufficient taxable income to offset the deductible amounts and carry forwards, the related tax benefits will expire unused. We have evaluated both positive and negative evidence in making a determination as to whether it is more likely than not that all or some portion of the deferred tax asset will not be realized. Measurement of deferred items is based on enacted tax laws.
Share-Based Compensation
“Accounting for Stock-Based Compensation,” FASB Accounting Standards Codification Topic 718 (Topic 718) requires the recognition of compensation expense in the consolidated statements of income related to the fair value of employee share-based options. Determining the fair value of share-based awards at the grant date requires judgment, including estimating the expected term that stock options will be outstanding prior to exercise and the expected dividends. Judgment is also required in estimating the amount of share-based awards expected to be forfeited prior to vesting. If actual forfeitures differ significantly from these estimates, share-based compensation expense could be materially impacted. Prior to adopting Topic 718, we applied APB Opinion No. 25, and related Interpretations, in accounting for our stock-based compensation plans. All employee stock options were granted at or above the grant date market price.
Prior to the adoption of Topic 718, we presented the tax savings resulting from tax deductions resulting from the exercise of stock options as an operating cash flow, in accordance with Emerging Issues Task Force (“EITF”) Issue No. 00-15, “Classification in the Statement of Cash Flows of the Income Tax Benefit Received by a Company upon Exercise of a Nonqualified Employee Stock Option.” Topic 718 requires us to reflect the tax savings resulting from tax deductions in excess of expense reflected in its financial statements as a financing cash flow related to certain stock option transactions.
Recent Accounting Pronouncements For Future Application
Accounting standards that have been issued by the FASB or other standards-setting bodies that do not require adoption until a future date are not expected to have a material impact on the consolidated financial statements upon adoption.
| Item 7A. | QUANTITATIVE AND QUALITATIVE DISCLOSURES ABOUT MARKET RISK |
Interest Rate Risk
The Company is exposed to market risk from fluctuations in interest rates. For fixed rate debt, interest rate changes affect the fair market value of such debt but do not impact earnings or cash flows. Conversely for variable rate debt, including borrowings under the Company’s senior credit facility, interest rate changes generally do not affect the fair market value of such debt, but do impact future earnings and cash flows, assuming other factors are held constant. At December 27, 2009, the Company had $125.5 million of variable rate debt of
38
Table of Contents
which $25.0 million has been converted to fixed rates through the use of interest rate swaps. Holding other variables constant (such as foreign exchange rates and debt levels), a hypothetical immediate one percentage point change in interest rates would be expected to have an impact on pre-tax earnings and cash flows for fiscal 2009 of approximately $1 million.
The Company has an interest rate swap to manage its exposure on its debt facility. By using the interest rate swap to hedge exposures to changes in interest rates, the Company exposes itself to credit risk and market risk. Credit risk is the failure of the counterparty to perform under the terms of the derivative contract. When the fair value of a derivative contract is positive, the counterparty owes the Company, which creates credit risk for the Company. When the fair value of a derivative contract is negative, the Company owes the counterparty and, therefore, it does not possess credit risk.
Market risk is the adverse effect on the value of a financial instrument that results from a change in interest rates. The market risk associated with interest-rate contracts is managed by establishing and monitoring parameters that limit the types and degree of market risk that may be undertaken.
During fiscal 2009, interest expense included a $1.4 million “mark to market” non-cash gain related to an interest rate swap.
Foreign Currency Risk
In accordance with the Company’s franchise agreements relating to the Company’s international locations, the Company receives royalties from those franchisees in U.S. dollars, and therefore the Company believes that fluctuations in foreign exchange rates do not present a material risk to its operations.
Commodity Price Risk
The Company is exposed to market price fluctuations in beef and other food product prices. Given the historical volatility of beef and other food product prices, this exposure can impact the Company’s food and beverage costs. As the Company typically sets its menu prices in advance of its beef and other food product purchases, the Company cannot quickly take into account changing costs of beef and other food items. To the extent that the Company is unable to pass the increased costs on to its guests through price increases, the Company’s results of operations would be adversely affected. In fiscal 2010, the Company has negotiated set pricing for approximately 50% of its prime beef requirements. The Company currently does not use financial instruments to hedge its risk to market price fluctuations in other food product prices.
Effects of Inflation
Components of the Company’s operations subject to inflation include food, beverage, lease and labor costs. The Company’s leases require it to pay taxes, maintenance, repairs, insurance and utilities, all of which are subject to inflationary increases. The Company believes inflation has not had a material impact on its results of operations in recent years.
| Item 8. | FINANCIAL STATEMENTS AND SUPPLEMENTARY DATA |
The Company’s consolidated financial statements, together with the related notes and report of independent registered accounting firm, are set forth in the pages indicated in Item 15 of this Annual Report on Form 10-K.
| Item 9. | CHANGES IN AND DISAGREEMENTS WITH ACCOUNTANTS ON ACCOUNTING AND FINANCIAL DISCLOSURE |
None.
39
Table of Contents
| Item 9A. | CONTROLS AND PROCEDURES |
Evaluation of disclosure controls and procedures
The Company maintains disclosure controls and procedures that are designed to ensure that information required to be disclosed in reports filed or submitted by the Company under the Securities Exchange Act of 1934, as amended (the “Exchange Act”), is recorded, processed, summarized and reported within the time periods specified in the SEC’s rules and forms and that information required to be disclosed by the Company is accumulated and communicated to the Company’s management to allow timely decisions regarding the required disclosure.
Under the supervision and with the participation of the Company’s management, including the Chief Executive Officer and the Chief Financial Officer, the Company conducted an evaluation of the effectiveness of the design and operation of its disclosure controls and procedures (as defined in Rule 13a-15(e) under the Exchange Act), as of December 27, 2009. In conducting the aforementioned evaluation, the Company identified a material weakness in internal control over financial reporting relative to the Company’s accounting for income tax expenses, as described below in Management’s Report on Internal Control Over Financial Reporting. Accordingly, management concluded that the Company’s disclosure controls and procedures were not effective as of December 27, 2009.
Management’s Report on Internal Control Over Financial Reporting
Management is responsible for establishing and maintaining adequate internal control over financial reporting (as defined in Rule 13a-15(f) under the Exchange Act).
Management, including the Chief Executive Officer and Chief Financial Officer, assessed the effectiveness of the Company’s internal control over financial reporting as of December 27, 2009. In making this assessment, management applied the criteria based on the “Internal Control—Integrated Framework” set forth by the Committee of Sponsoring Organizations of the Treadway Commission (COSO). The Company’s assessment included documenting, evaluating, and testing the design and operating effectiveness of the Company’s internal control over financial reporting.
During this evaluation, the Company identified a material weakness in its internal control over financial reporting. A material weakness is a deficiency, or combination of deficiencies, in internal control over financial reporting such that there is a reasonable possibility that a material misstatement of the Company’s annual or interim financial statements will not be prevented or detected on a timely basis. The identified material weakness consists of, as of the end of the period covered by this report, a failure to detect an overstatement of income tax expense during the review of the income tax provision. This material weakness resulted in an overstatement of income tax expense and understatement of net income in the Company’s consolidated statements of income (loss). The Company corrected this error prior to the issuance of its 2009 financial statements.
Based on the Company’s evaluation and the criteria discussed above, the Company has concluded that, as of December 27, 2009, the Company’s internal control over financial reporting was not effective as a result of the aforementioned material weakness.
Notwithstanding the material weakness in the Company’s internal control over financial reporting discussed above, management believes that the consolidated financial statements included in this Annual Report on Form 10-K present fairly, in all material respects, the Company’s financial position, results of operations and cash flows for the periods presented in accordance with the U.S. generally accepted accounting principles.
KPMG, LLP, the Company’s independent registered public accounting firm, has audited the financial statements included herein and issued an audit report, included herein, on the Company’s internal control over financial reporting as of December 27, 2009.
40
Table of Contents
Change in internal controls over financial reporting
In response to the material weakness described above, the Company has taken, and intends to take further, remedial measures to strengthen our controls. To date, control enhancements include: (i) providing increased training for existing accounting professionals involved with the preparation and review of the income tax provision; (ii) enhancing the current internal review process in an effort to detect and correct errors earlier in the quarter and year end reporting process; and (iii) adding an independent third party review by an expert with significant income tax provision expertise to ensure that items are properly accounted for within the provision.
Other than as described above, there was no change in the Company’s internal control over financial reporting (as defined in Rule 13a-15(f) under the Exchange Act) during the fiscal quarter ending December 27, 2009 that in the Company’s judgment has materially affected, or is reasonably likely to materially affect, the Company’s internal control over financial reporting.
41
Table of Contents
REPORT OF INDEPENDENT REGISTERED PUBLIC ACCOUNTING FIRM
The Board of Directors and Stockholders
Ruth’s Hospitality Group, Inc.:
We have audited Ruth’s Hospitality Group, Inc.’s internal control over financial reporting as of December 27, 2009, based on criteria established in Internal Control—Integrated Framework issued by the Committee of Sponsoring Organizations of the Treadway Commission (COSO). Ruth’s Hospitality Group, Inc.’s management is responsible for maintaining effective internal control over financial reporting and for its assessment of the effectiveness of internal control over financial reporting, included in Management’s Report on Internal Control Over Financial Reporting, appearing under Item 9a. Our responsibility is to express an opinion on the Company’s internal control over financial reporting based on our audit.
We conducted our audit in accordance with the standards of the Public Company Accounting Oversight Board (United States). Those standards require that we plan and perform the audit to obtain reasonable assurance about whether effective internal control over financial reporting was maintained in all material respects. Our audit included obtaining an understanding of internal control over financial reporting, assessing the risk that a material weakness exists, and testing and evaluating the design and operating effectiveness of internal control based on the assessed risk. Our audit also included performing such other procedures as we considered necessary in the circumstances. We believe that our audit provides a reasonable basis for our opinion.
A company’s internal control over financial reporting is a process designed to provide reasonable assurance regarding the reliability of financial reporting and the preparation of financial statements for external purposes in accordance with generally accepted accounting principles. A company’s internal control over financial reporting includes those policies and procedures that (1) pertain to the maintenance of records that, in reasonable detail, accurately and fairly reflect the transactions and dispositions of the assets of the company; (2) provide reasonable assurance that transactions are recorded as necessary to permit preparation of financial statements in accordance with generally accepted accounting principles, and that receipts and expenditures of the company are being made only in accordance with authorizations of management and directors of the company; and (3) provide reasonable assurance regarding prevention or timely detection of unauthorized acquisition, use, or disposition of the company’s assets that could have a material effect on the financial statements.
Because of its inherent limitations, internal control over financial reporting may not prevent or detect misstatements. Also, projections of any evaluation of effectiveness to future periods are subject to the risk that controls may become inadequate because of changes in conditions, or that the degree of compliance with the policies or procedures may deteriorate.
A material weakness is a deficiency, or a combination of deficiencies, in internal control over financial reporting, such that there is a reasonable possibility that a material misstatement of the company’s annual or interim financial statements will not be prevented or detected on a timely basis. A material weakness related to the Company’s income tax provision policies and practices has been identified and included in management’s assessment. We also have audited, in accordance with the standards of the Public Company Accounting Oversight Board (United States), the consolidated balance sheets of Ruth’s Hospitality Group, Inc. and subsidiaries as of December 28, 2008 and December 27, 2009, and the related consolidated statements of income (loss), shareholders’ equity and cash flows for the fifty-two weeks ended December 30, 2007, December 28, 2008, and December 27, 2009. This material weakness was considered in determining the nature, timing, and extent of audit tests applied in our audit of the 2009 consolidated financial statements, and this report does not affect our report dated March 5, 2010, which expressed an unqualified opinion on those consolidated financial statements.
In our opinion, because of the effect of the aforementioned material weakness on the achievement of the objectives of the control criteria, Ruth’s Hospitality Group, Inc. has not maintained effective internal control over financial reporting as of December 27, 2009, based on criteria established in Internal Control—Integrated Framework issued by the Committee of Sponsoring Organizations of the Treadway Commission.
42
Table of Contents
We do not express an opinion or any other form of assurance on management’s statements referring to corrective actions taken after December 27, 2009, relative to the aforementioned material weakness in internal control over financial reporting.
/s/ KPMG LLP
Orlando, Florida
March 5, 2010
Certified Public Accountants
43
Table of Contents
| Item 9B. | OTHER INFORMATION |
None.
PART III
| Item 10. | DIRECTORS, EXECUTIVE OFFICERS AND CORPORATE GOVERNANCE |
Information required by this Item for executive officers is set forth under “Executive Officers of the Registrant” in Part I, Item 1 of this report. The other information required by this Item is incorporated by reference to the Company’s Proxy Statement for the 2010 Annual Meeting of Stockholders to be filed with the Securities and Exchange Commission within 120 days after the end of the fiscal year covered by this Form 10-K.
We have adopted a Code of Conduct and Ethics Policy that applies to our principal executive officer, principal financial officer and principal accounting officer. The text of our Code of Conduct and Ethics Policy is posted on our website: www.rhgi.com. Our Company intends to disclose future amendments to, or waivers from, certain provisions of the Code of Conduct and Ethics Policy on the Company’s website within four business days following the date of such amendment or waiver. Stockholders may request a free copy of the Code of Conduct and Ethics Policy from: Ruth’s Hospitality Group, Inc., Attention: Corporate Secretary, 400 International Parkway, Suite 325, Heathrow, Florida 32746.
| Item 11. | EXECUTIVE COMPENSATION |
The information required by this Item is incorporated by reference to the Company’s Proxy Statement for the 2010 Annual Meeting of Stockholders to be filed with the Securities and Exchange Commission within 120 days after the end of the fiscal year covered by this Form 10-K.
| Item 12. | SECURITY OWNERSHIP OF CERTAIN BENEFICIAL OWNERS AND MANAGEMENT AND RELATED STOCKHOLDER MATTERS |
Information about security ownership is incorporated by reference to the Company’s Proxy Statement for the 2010 Annual Meeting of Stockholders to be filed with the Securities and Exchange Commission within 120 days after the end of the fiscal year covered by this Form 10-K.
The following table summarizes the number of stock options issued and shares of restricted stock granted, net of forfeitures and sales, the weighted-average exercise price of such stock options and the number of securities remaining to be issued under all outstanding equity compensation plans as of December 27, 2009:
| Plan Category |
Number of Securities to be Issued Upon Exercise of Outstanding Options, Warrants and Rights |
Weighted-Average Exercise Price of Outstanding Options, Warrants and Rights |
Number of Securities Remaining Available for Future Issuance Under an (Excluding Securities Reflected in Column (a)) | ||||
| (a) | (b) | (c) | |||||
| Equity compensation plans approved by stockholders: |
|||||||
| 2000 Stock Option Plan |
155,741 | $ | 0.48 | 647,231 | |||
| 2005 Long-Term Equity Incentive Plan |
2,489,207 | $ | 6.85 | 1,069,798 | |||
| Total |
2,644,948 | $ | 6.48 | 1,717,029 | |||
44
Table of Contents
| Item 13. | CERTAIN RELATIONSHIPS AND RELATED TRANSACTIONS, AND DIRECTOR INDEPENDENCE |
The information required by this Item is incorporated by reference to the Company’s Proxy Statement for the 2010 Annual Meeting of Stockholders to be filed with the Securities and Exchange Commission within 120 days after the end of the fiscal year covered by this Form 10-K.
| Item 14. | PRINCIPAL ACCOUNTANT FEES AND SERVICES |
The information required by this Item is incorporated by reference to the Company’s Proxy Statement for the 2010 Annual Meeting of Stockholders to be filed with the Securities and Exchange Commission within 120 days after the end of the fiscal year covered by this report.
PART IV
| Item 15. | EXHIBITS AND FINANCIAL STATEMENT SCHEDULES |
(a) Financial Statements and Financial Statement Schedules.
See Index to Consolidated Financial Statements appearing on page F-1. All schedules have been omitted because they are not required or applicable or the information is included in the consolidated financial statements or notes thereto.
(b) Exhibits.
See Exhibit Index appearing on page E-1 for a list of exhibits filed with or incorporated by reference as part of this Annual Report on Form 10-K.
45
Table of Contents
Pursuant to the requirements of Section 13 or 15(d) of the Securities Exchange Act of 1934, the Registrant has duly caused this report to be signed on its behalf by the undersigned, thereunto duly authorized.
March 5, 2010
| RUTH’S HOSPITALITY GROUP, INC. | ||
| By: |
/s/ MICHAEL P. O’DONNELL | |
| Michael P. O’Donnell Director, President, Chief Executive Officer | ||
Pursuant to the requirements of the Securities Exchange Act of 1934, this report has been signed by the following persons on behalf of Ruth’s Hospitality Group, Inc. and in the capacities and on the dates indicated.
| Signatures |
Title |
Dates | ||
| /s/ MICHAEL P. O’DONNELL Michael P. O’Donnell |
Director, President, Chief |
March 5, 2010 | ||
| /s/ ROBERT M. VINCENT Robert M. Vincent |
Executive Vice President and Chief |
March 5, 2010 | ||
| /s/ ROBIN P. SELATI Robin P. Selati |
Chairman of the Board, Director |
March 5, 2010 | ||
| /s/ CARLA R. COOPER Carla R. Cooper |
Director |
March 5, 2010 | ||
| /s/ BANNUS B. HUDSON Bannus B. Hudson |
Director |
March 5, 2010 | ||
| /s/ ROBERT S. MERRITT Robert S. Merritt |
Director |
March 5, 2010 | ||
| /s/ HAROLD O. ROSSER Harold O. Rosser |
Director |
March 5, 2010 | ||
| /s/ ALAN VITULI Alan Vituli |
Director |
March 5, 2010 | ||
46
Table of Contents
RUTH’S HOSPITALITY GROUP, INC. AND SUBSIDIARIES
INDEX TO CONSOLIDATED FINANCIAL STATEMENTS
| Page | ||
| F-2 | ||
| F-3 | ||
| F-4 | ||
| F-5 | ||
| F-6 | ||
| F-7 | ||
F-1
Table of Contents
REPORT OF INDEPENDENT REGISTERED PUBLIC ACCOUNTING FIRM
The Board of Directors and Stockholders
Ruth’s Hospitality Group, Inc.:
We have audited the accompanying consolidated balance sheets of Ruth’s Hospitality Group, Inc. and subsidiaries as of December 28, 2008 and December 27, 2009, and the related consolidated statements of income (loss), shareholders’ equity and cash flows for the fifty-two weeks ended December 30, 2007, December 28, 2008, and December 27, 2009. These consolidated financial statements are the responsibility of the Company’s management. Our responsibility is to express an opinion on these consolidated financial statements based on our audits.
We conducted our audits in accordance with the standards of the Public Company Accounting Oversight Board (United States). Those standards require that we plan and perform the audit to obtain reasonable assurance about whether the financial statements are free of material misstatement. An audit includes examining, on a test basis, evidence supporting the amounts and disclosures in the financial statements. An audit also includes assessing the accounting principles used and significant estimates made by management, as well as evaluating the overall financial statement presentation. We believe that our audits provide a reasonable basis for our opinion.
In our opinion, the consolidated financial statements referred to above present fairly, in all material respects, the financial position of Ruth’s Hospitality Group, Inc. and subsidiaries as of December 28, 2008 and December 27, 2009, and the results of their operations and their cash flows for the fifty-two weeks ended December 30, 2007, December 28, 2008, and December 27, 2009, in conformity with U.S. generally accepted accounting principles.
We also have audited, in accordance with the standards of the Public Company Accounting Oversight Board (United States), Ruth’s Hospitality Group, Inc.’s internal control over financial reporting as of December 27, 2009, based on criteria established in Internal Control—Integrated Framework issued by the Committee of Sponsoring Organizations of the Treadway Commission (COSO), and our report dated March 5, 2010 expressed an adverse opinion on the effectiveness of the Company’s internal control over financial reporting.
/s/ KPMG LLP
Orlando, Florida
March 5, 2010
Certified Public Accountants
F-2
Table of Contents
RUTH’S HOSPITALITY GROUP, INC. AND SUBSIDIARIES
Consolidated Balance Sheets
(dollar amounts in thousands, except share and per share data)
| December 28, 2008 |
December 27, 2009 |
|||||||
| Assets | ||||||||
| Current assets: |
||||||||
| Cash and cash equivalents |
$ | 3,876 | $ | 1,681 | ||||
| Accounts receivable, less allowance for doubtful accounts 2008—$597; |
13,367 | 10,079 | ||||||
| Inventory |
8,630 | 7,368 | ||||||
| Assets held for sale |
10,500 | — | ||||||
| Prepaid expenses and other |
3,426 | 1,346 | ||||||
| Deferred income taxes |
1,809 | 1,561 | ||||||
| Total current assets |
41,608 | 22,035 | ||||||
| Property and equipment, net of accumulated depreciation 2008—$66,204; |
130,380 | 114,204 | ||||||
| Goodwill |
24,320 | 22,097 | ||||||
| Franchise rights |
37,323 | 32,200 | ||||||
| Trademarks |
13,918 | 13,718 | ||||||
| Other intangible assets, net of accumulated amortization of 2008—$753; |
8,472 | 7,962 | ||||||
| Deferred income taxes |
34,700 | 38,246 | ||||||
| Other assets |
2,798 | 3,953 | ||||||
| Total assets |
$ | 293,519 | $ | 254,415 | ||||
| Liabilities and Shareholders’ Equity | ||||||||
| Current liabilities: |
||||||||
| Accounts payable |
$ | 10,080 | $ | 6,871 | ||||
| Accrued payroll |
9,524 | 10,286 | ||||||
| Accrued expenses |
7,784 | 5,995 | ||||||
| Deferred revenue |
29,421 | 27,835 | ||||||
| Accrued restructuring |
6,433 | 2,891 | ||||||
| Other current liabilities |
3,965 | 6,210 | ||||||
| Total current liabilities |
67,207 | 60,088 | ||||||
| Long-term debt |
160,250 | 125,500 | ||||||
| Deferred rent |
21,047 | 20,643 | ||||||
| Other liabilities |
7,873 | 6,419 | ||||||
| Total liabilities |
256,377 | 212,650 | ||||||
| Shareholders’ equity: |
||||||||
| Common stock, par value $.01 per share; 100,000,000 shares authorized, 23,606,943 shares issued and outstanding at December 27, 2009, 23,452,986 shares issued and outstanding at December 28, 2008 |
235 | 236 | ||||||
| Additional paid-in capital |
171,387 | 173,590 | ||||||
| Accumulated deficit |
(134,480 | ) | (132,061 | ) | ||||
| Treasury stock, at cost 71,950 shares at December 28, 2008 and December 27, 2009 |
— | — | ||||||
| Commitments and contingencies (Note 12) |
— | — | ||||||
| Total shareholders’ equity |
37,142 | 41,765 | ||||||
| Total liabilities and shareholders’ equity |
$ | 293,519 | $ | 254,415 | ||||
See accompanying notes to consolidated financial statements.
F-3
Table of Contents
RUTH’S HOSPITALITY GROUP, INC AND SUBSIDIARIES
Consolidated Statements of Income (Loss)
(dollar amounts in thousands, except share and per share data)
| Fiscal Year Ended | ||||||||||||
| December 30, 2007 |
December 28, 2008 |
December 27, 2009 |
||||||||||
| Revenues: |
||||||||||||
| Restaurant sales |
$ | 292,916 | 377,424 | 330,533 | ||||||||
| Franchise income |
12,896 | 12,703 | 10,533 | |||||||||
| Other operating income |
3,201 | 3,520 | 3,564 | |||||||||
| Total revenues |
309,013 | 393,647 | 344,630 | |||||||||
| Costs and expenses: |
||||||||||||
| Food and beverage costs |
96,660 | 122,292 | 96,934 | |||||||||
| Restaurant operating expenses |
132,615 | 188,608 | 176,995 | |||||||||
| Marketing and advertising |
8,383 | 13,939 | 11,697 | |||||||||
| General and administrative costs |
24,507 | 28,994 | 23,777 | |||||||||
| Depreciation and amortization expenses |
11,768 | 16,706 | 16,499 | |||||||||
| Pre-opening costs |
4,421 | 2,869 | 16 | |||||||||
| Hurricane and relocation costs, net of insurance proceeds |
(3,478 | ) | — | — | ||||||||
| Loss on impairment |
— | 77,051 | 8,634 | |||||||||
| Restructuring |
— | 8,926 | 40 | |||||||||
| Loss on the disposal of property and equipment, net |
1,229 | 508 | 1,963 | |||||||||
| Operating income |
32,908 | (66,246 | ) | 8,075 | ||||||||
| Other income (expense): |
||||||||||||
| Interest expense |
(5,956 | ) | (10,334 | ) | (7,754 | ) | ||||||
| Other |
726 | 868 | 532 | |||||||||
| Income (loss) from continuing operations before income tax expense |
27,678 | (75,712 | ) | 853 | ||||||||
| Income tax expense (benefit) |
8,889 | (27,203 | ) | (1,668 | ) | |||||||
| Income (loss) from continuing operations |
18,789 | (48,509 | ) | 2,521 | ||||||||
| Discontinued operations: |
||||||||||||
| Loss (income) from operations of discontinued restaurants, net of income tax benefit: 2007—$370; 2008-$632; 2009—$638 |
643 | 5,374 | 102 | |||||||||
| Net income (loss) |
$ | 18,146 | (53,883 | ) | $ | 2,419 | ||||||
| Basic earnings per share: |
||||||||||||
| Continuing operations |
$ | 0.81 | $ | (2.08 | ) | $ | 0.11 | |||||
| Discontinued operations |
(0.03 | ) | (0.23 | ) | (0.01 | ) | ||||||
| Basic earnings per share |
$ | 0.78 | $ | (2.31 | ) | $ | 0.10 | |||||
| Diluted earnings per share: |
||||||||||||
| Continuing operations |
$ | 0.81 | $ | (2.08 | ) | $ | 0.11 | |||||
| Discontinued operations |
(0.03 | ) | (0.23 | ) | (0.01 | ) | ||||||
| Diluted earnings per share |
$ | 0.78 | $ | (2.31 | ) | $ | 0.10 | |||||
| Shares used in computing net income (loss) per common share: |
||||||||||||
| Basic |
23,206,864 | 23,307,198 | 23,566,358 | |||||||||
| Diluted |
23,399,446 | 23,307,198 | 23,733,260 | |||||||||
See accompanying notes to consolidated financial statements.
F-4
Table of Contents
RUTH’S HOSPITALITY GROUP, INC. AND SUBSIDIARIES
Consolidated Statements of Shareholders’ Equity
(dollar and share amounts in thousands)
| Common Stock | Additional paid-in capital |
Accumulated Deficit |
Treasury Stock | Shareholders’ Equity (Deficit) |
||||||||||||||||||
| Shares | Value | Shares | Value | |||||||||||||||||||
| Balance at December 31, 2006 |
23,238 | $ | 232 | $ | 166,489 | $ | (98,743 | ) | — | $ | — | $ | 67,978 | |||||||||
| Net income |
— | — | — | 18,146 | — | — | 18,146 | |||||||||||||||
| Shares issued under stock option plan including tax effects |
(23 | ) | — | 368 | — | — | — | 368 | ||||||||||||||
| Compensation expense |
— | — | 1,575 | — | — | — | 1,575 | |||||||||||||||
| Repurchase of Restricted Stock |
— | — | — | — | 72 | — | — | |||||||||||||||
| Balance at December 30, 2007 |
23,215 | $ | 232 | $ | 168,432 | $ | (80,597 | ) | 72 | $ | — | $ | 88,067 | |||||||||
| Net loss |
— | — | — | (53,883 | ) | — | — | (53,883 | ) | |||||||||||||
| Shares issued under stock option plan including tax effects |
237 | 3 | 134 | — | — | — | 137 | |||||||||||||||
| Compensation expense |
— | — | 2,820 | — | — | — | 2,820 | |||||||||||||||
| Repurchase of Restricted Stock |
— | — | — | — | — | — | — | |||||||||||||||
| Balance at December 28, 2008 |
23,452 | $ | 235 | $ | 171,387 | $ | (134,480 | ) | 72 | $ | — | $ | 37,142 | |||||||||
| Net income |
— | — | — | 2,419 | — | — | 2,419 | |||||||||||||||
| Shares issued under stock option plan including tax effects |
155 | 1 | 39 | — | — | — | 40 | |||||||||||||||
| Compensation expense |
— | — | 2,163 | — | — | — | 2,163 | |||||||||||||||
| Repurchase of Restricted Stock |
— | — | — | — | — | — | ||||||||||||||||
| Balance at December 27, 2009 |
23,607 | $ | 236 | $ | 173,590 | $ | (132,061 | ) | 72 | $ | — | $ | 41,765 | |||||||||
See accompanying notes to consolidated financial statements.
F-5
Table of Contents
RUTH’S HOSPITALITY GROUP, INC. AND SUBSIDIARIES
Consolidated Statements of Cash Flows
(dollar amounts in thousands)
| Fiscal Year Ended | ||||||||||||
| December 30, 2007 |
December 28, 2008 |
December 27, 2009 |
||||||||||
| Cash flows from operating activities: |
||||||||||||
| Net income |
$ | 18,146 | (53,883 | ) | $ | 2,419 | ||||||
| Adjustments to reconcile net income to net cash provided by operating activities: |
||||||||||||
| Depreciation and amortization |
12,010 | 17,031 | 16,499 | |||||||||
| Deferred income taxes |
2,909 | (29,525 | ) | (3,298 | ) | |||||||
| Non-cash interest expense |
99 | 295 | 1,127 | |||||||||
| Loss on the disposal of property and equipment, net |
1,229 | 508 | 1,126 | |||||||||
| Loss on the disposal of assets held for sale |
— | — | 837 | |||||||||
| Loss on impairment |
— | 81,273 | 8,634 | |||||||||
| Amortization of below market lease |
— | 200 | 198 | |||||||||
| Restructuring |
— | 8,926 | 40 | |||||||||
| Non-cash compensation expense |
1,575 | 2,553 | 2,163 | |||||||||
| Changes in operating assets and liabilities: |
||||||||||||
| Accounts receivables |
(705 | ) | (1,541 | ) | 3,288 | |||||||
| Inventories |
(1,941 | ) | 1,069 | 1,262 | ||||||||
| Prepaid expenses and other |
381 | (622 | ) | 2,080 | ||||||||
| Other assets |
(1,480 | ) | 259 | 51 | ||||||||
| Accounts payable and accrued expenses |
(3,491 | ) | 3,252 | (4,658 | ) | |||||||
| Deferred revenue |
3,010 | 1,735 | (1,586 | ) | ||||||||
| Deferred rent |
2,244 | 4,809 | (291 | ) | ||||||||
| Other liabilities |
786 | 734 | (1,455 | ) | ||||||||
| Net cash provided by operating activities |
34,772 | 37,073 | 28,436 | |||||||||
| Cash flows from investing activities: |
||||||||||||
| Acquisition of property and equipment |
(42,429 | ) | (31,951 | ) | (4,270 | ) | ||||||
| Acquisition of Mitchells |
— | (93,037 | ) | — | ||||||||
| Acquisition of franchises and lease right |
(13,473 | ) | — | — | ||||||||
| Acquisition of RCSH Millwork |
(260 | ) | — | — | ||||||||
| Proceeds on disposal of property and equipment, net |
80 | — | 1,019 | |||||||||
| Proceeds on disposal of assets held for sale |
— | — | 9,663 | |||||||||
| Proceeds from sale-leaseback transactions |
— | 17,039 | — | |||||||||
| Net cash (used in) provided by investing activities |
(56,082 | ) | (107,949 | ) | 6,412 | |||||||
| Cash flows from financing activities: |
||||||||||||
| Principal repayments on long-term debt |
(5,000 | ) | (50,500 | ) | (37,250 | ) | ||||||
| Proceeds from long-term financing |
33,750 | 114,000 | 2,500 | |||||||||
| Income tax benefits credited to equity upon exercise of stock options |
279 | 108 | 24 | |||||||||
| Proceeds from exercise of stock options and warrants |
90 | 30 | 16 | |||||||||
| Deferred financing costs |
(188 | ) | (1,197 | ) | (2,333 | ) | ||||||
| Net cash (used in) provided by financing activities |
28,931 | 62,441 | (37,043 | ) | ||||||||
| Net increase (decrease) in cash and cash equivalents |
7,621 | (8,435 | ) | (2,195 | ) | |||||||
| Cash and cash equivalents at beginning of period |
4,690 | 12,311 | 3,876 | |||||||||
| Cash and cash equivalents at end of period |
$ | 12,311 | $ | 3,876 | $ | 1,681 | ||||||
| Supplemental disclosures of cash flow information: |
||||||||||||
| Cash paid during the year for: |
||||||||||||
| Interest |
$ | 5,170 | $ | 9,431 | $ | 7,978 | ||||||
| Income taxes |
$ | 8,279 | $ | 1,850 | $ | 1,511 | ||||||
See accompanying notes to consolidated financial statements.
F-6
Table of Contents
RUTH’S HOSPITALITY GROUP, INC. AND SUBSIDIARIES
Notes to Consolidated Financial Statements
(dollar amounts in thousands)
(1) Organization and Description of Business
Ruth’s Hospitality Group, Inc. and its subsidiaries (the “Company”) operate 130 Ruth’s Chris Steak House, 19 Mitchell’s Fish Market, and three Mitchell’s Steakhouse restaurants and sell franchise rights to Ruth’s Chris Steak House franchisees giving them the exclusive right to operate similar restaurants in a particular location designated in the franchise agreement. At December 28, 2008 and December 27, 2009, there were 152 restaurants operating. Of the 152 restaurants operating at December 27, 2009, 64 were company-owned Ruth’s Chris Steak House Company restaurants, 66 were Ruth’s Chris Steak House franchise restaurants, 19 were company-owned Mitchell’s Fish Markets and three were company-owned Mitchell’s Steakhouse restaurants. Of the 152 restaurants operating at December 28, 2008, 66 were company-owned Ruth’s Chris Steak House Company restaurants and 64 were Ruth’s Chris Steak House franchise restaurants. During 2009, six franchise-owned Ruth’s Chris Steak House restaurants were opened and four franchise-owned Ruth’s Chris Steak House restaurants were closed. Two company-owned Ruth’s Chris Steak House restaurants were closed during fiscal 2009. During 2008, five company-owned Ruth’s Chris Steak House restaurants were opened and seven franchisee-owned Ruth’s Chris Steak House restaurants were opened.
The Company manages its operations by restaurant.
On February 19, 2008, the Company completed the acquisition of all of the operating assets and intellectual property of Mitchell’s Fish Market, operating under the names Mitchell’s Fish Market and Columbus Fish Market, and Cameron’s Steakhouse, operating under the names Cameron’s Steakhouse and Mitchell’s Steakhouse from Cameron Mitchell Restaurants, LLC (CMR) for approximately $93.0 million. There are 19 operating Mitchell’s Fish Markets and three operating Cameron’s Steakhouses. The acquired operations are included in the consolidated financial statements from the date of acquisition.
F-7
Table of Contents
RUTH’S HOSPITALITY GROUP, INC. AND SUBSIDIARIES
Notes to Consolidated Financial Statements—(Continued)
(dollar amounts in thousands)
The following table summarizes the changes in the number of Ruth’s Chris Steak House, Mitchell’s Fish Market and Cameron’s Steakhouse company-operated and franchised restaurants during the thirteen and fifty-two weeks ended December 27, 2009:
| 13 Weeks Ended | 52 Weeks Ended | |||||||||||||||||
| December 27, 2009 | December 27, 2009 | |||||||||||||||||
| Ruth’s Chris Steak House |
Company | Franchised | Total | Company | Franchised | Total | ||||||||||||
| Beginning of period |
64 | 65 | 129 | 66 | 64 | 130 | ||||||||||||
| New |
— | 2 | 2 | — | 6 | 6 | ||||||||||||
| Closed |
— | 1 | 1 | 2 | 4 | 6 | ||||||||||||
| End of period |
64 | 66 | 130 | 64 | 66 | 130 | ||||||||||||
| % of system |
49 | % | 51 | % | 100 | % | 49 | % | 51 | % | 100 | % | ||||||
| Mitchell’s Fish Market |
Company | Franchised | Total | Company | Franchised | Total | ||||||||||||
| Beginning of period |
19 | — | 19 | 19 | — | 19 | ||||||||||||
| New |
— | — | — | — | — | — | ||||||||||||
| Closed |
— | — | — | — | — | — | ||||||||||||
| End of period |
19 | — | 19 | 19 | — | 19 | ||||||||||||
| % of system |
100 | % | 0 | % | 100 | % | 100 | % | 0 | % | 100 | % | ||||||
| Cameron’s Steakhouse |
Company | Franchised | Total | Company | Franchised | Total | ||||||||||||
| Beginning of period |
3 | — | 3 | 3 | — | 3 | ||||||||||||
| New |
— | — | — | — | — | — | ||||||||||||
| Closed |
— | — | — | — | — | — | ||||||||||||
| End of period |
3 | — | 3 | 3 | — | 3 | ||||||||||||
| 100 | % | 0 | % | 100 | % | 100 | % | 0 | % | 100 | % | |||||||
| Consolidated |
||||||||||||||||||
| Total system |
86 | 66 | 152 | 86 | 66 | 152 | ||||||||||||
| % of system |
57 | % | 43 | % | 100 | % | 57 | % | 43 | % | 100 | % | ||||||
(2) Summary of Significant Accounting Policies
(a) Reporting Period
The Company utilizes a 52- or 53-week reporting period ending on the last Sunday of December. The periods ended December 27, 2009 (fiscal 2009), December 28, 2008 (fiscal 2008) and December 30, 2007 (fiscal 2007) each had a 52-week reporting period.
(b) Principles of Consolidation
The consolidated financial statements include the financial statements of Ruth’s Hospitality Group, Inc. and its wholly owned subsidiaries. All significant inter-company balances and transactions have been eliminated in consolidation.
(c) Cash Equivalents
For purposes of the consolidated statements of cash flows, the Company considers all highly-liquid investments purchased with an original maturity of three months or less to be cash equivalents.
F-8
Table of Contents
RUTH’S HOSPITALITY GROUP, INC. AND SUBSIDIARIES
Notes to Consolidated Financial Statements—(Continued)
(dollar amounts in thousands)
(d) Accounts Receivable
Accounts receivable consists primarily of bank credit cards receivable, landlord contributions, franchise royalty payments receivable, banquet billings receivable, and other miscellaneous receivables.
(e) Allowance for Doubtful Accounts
The Company performs a specific review of account balances and applies historical collection experience to the various aging categories of receivable balances in establishing an allowance.
(f) Inventories
Inventories consist of food, beverages, and supplies and are stated at the lower of cost or market. Cost is determined using the first-in, first-out method.
(g) Property and Equipment, net
Property and equipment are stated at cost. Expenditures for improvements and major renewals are capitalized, and minor replacement, maintenance, and repairs are charged to expense. Depreciation is computed on a straight-line basis over the estimated useful lives of the assets. Leasehold improvements are amortized on the straight-line basis over the shorter of the lease term or the estimated useful lives of the assets. The estimated useful lives for assets are as follows: Building and Building Improvements, 20 to 40 years; Equipment, 5 years; Furniture and Fixtures, 5 to 7 years; Computer Equipment, 3 to 5 years; and Leasehold Improvements, 5 to 20 years.
(h) Goodwill, Franchise Rights and Trademarks
Goodwill and trademarks acquired in a purchase business combination that are determined to have an indefinite useful life are not amortized, but tested for impairment at least annually in accordance with the provisions of “Intangibles—Goodwill and Other,” FASB Accounting Standards Codification Topic 350 (Topic 350). Goodwill and trademarks are tested annually for impairment on a reporting unit basis and more frequently if events and circumstances indicate that the asset might be impaired. For purposes of testing goodwill impairment, a reporting unit is defined as a restaurant location. For purposes of testing trademark impairment, a reporting unit is defined as a group of acquired restaurants sharing a common trade name. An impairment loss is recognized to the extent that the carrying amount exceeds the asset’s fair value.
Franchise rights acquired prior to 2008 in a purchase business combination that are determined to have an indefinite useful life are not amortized, but tested for impairment at least annually on a reporting unit basis, which is defined as a group of reacquired restaurants, and more frequently if events and circumstances indicate that the asset might be impaired. The Company allows and expects franchisees to renew agreements indefinitely ensuring consistent cash flows. As a result, acquired franchise rights are determined to have indefinite useful lives. An impairment loss is recognized to the extent that the carrying amount exceeds the asset’s fair value. Franchise rights acquired after 2007 are no longer considered to have indefinite useful lives and are amortized in accordance Topic 350.
Based upon the Company’s review, goodwill, franchise rights and trademark impairment charges were required in fiscal 2008 and 2009. See Note 3.
F-9
Table of Contents
RUTH’S HOSPITALITY GROUP, INC. AND SUBSIDIARIES
Notes to Consolidated Financial Statements—(Continued)
(dollar amounts in thousands)
(i) Deferred Financing Costs
Deferred financing costs represent fees paid in connection with obtaining bank and other long-term financing. The Company paid financing costs of $188, $1,197, and $2,333 in fiscal 2007, 2008 and 2009, respectively, and amortizes these costs using a method that approximates the effective interest method over the term of the related financing. Amortization expense of deferred financing costs was $99, $295, and $1,127 in fiscal 2007, 2008 and 2009, respectively.
(j) Impairment or Disposal of Long-Lived Assets
In accordance with “Property, Plant and Equipment—Impairment or Disposal of Long-Lived Assets,” FASB Accounting Standards Codification Topic 360-10 (Topic 360-10), long lived assets, such as property, plant and equipment and purchased intangibles subject to amortization are reviewed for impairment on a restaurant-by-restaurant basis whenever events or changes in circumstances indicate that the carrying amount of an asset may not be recoverable. Recoverability of assets to be held and used is measured by a comparison of the carrying amount of an asset to estimated undiscounted future cash flows expected to be generated by the asset. If the carrying amount of an asset exceeds its estimated future cash flows, an impairment charge is recognized in the amount by which the carrying amount of the asset exceeds the fair value of the asset. Fair value of long-lived assets is calculated as the discounted future cash flows generated by these assets. Assets to be disposed of would be separately presented in the balance sheet and reported at the lower of the carrying amount or the fair value less costs to sell, and are no longer depreciated. The assets and liabilities of a disposed group classified as held for sale would be presented separately in the appropriate asset and liability sections of the balance sheet.
We account for exit or disposal activities, including restaurant closures, in accordance with Topic 360-10. Such costs include the cost of disposing of the assets as well as other facility-related expenses from previously closed restaurants. These costs are generally expensed as incurred. Additionally, at the date we cease using a property under an operating lease, we record a liability for the net present value of any remaining lease obligations, net of estimated sublease income. Any subsequent adjustments to that liability as a result of lease termination or changes in estimates of sublease income are recorded in the period incurred. Upon disposal of the assets associated with a closed restaurant, any gain or loss is recorded in the same line within our consolidated statements of income (loss) as the original impairment.
(k) Rent
Certain of the Company’s operating leases contain predetermined fixed escalations of the minimum rent during the term of the lease. For these leases, the Company recognizes the related rent expense on a straight-line basis over the life of the lease and records the difference between amounts charged to operations and amounts paid as deferred rent.
Additionally, certain of the Company’s operating leases contain clauses that provide additional contingent rent based on a percentage of sales greater than certain specified target amounts. The Company recognizes contingent rent expense prior to the achievement of the specified target that triggers the contingent rent, provided achievement of that target is considered probable.
(l) Marketing and Advertising
Marketing and advertising expenses in the accompanying consolidated statements of operations included advertising expenses of approximately $5.6 million, $9.3 million, and $8.1 million for fiscal 2007, fiscal 2008 and fiscal 2009, respectively. In 2009, Ruth’s Chris Steak House introduced a value promotion, Ruth’s Classics, a three course prix fixe meal. Ruth’s Classics was advertised via national radio and national and local print media. Advertising costs, including those related to Ruth’s Classics, are expensed as incurred.
F-10
Table of Contents
RUTH’S HOSPITALITY GROUP, INC. AND SUBSIDIARIES
Notes to Consolidated Financial Statements—(Continued)
(dollar amounts in thousands)
(m) Insurance Liability
The Company maintains various policies for workers’ compensation, employee health, general liability and property damage. Pursuant to those policies, the Company is responsible for losses up to certain limits. The Company records a liability for the estimated exposure for aggregate losses below those limits. This liability is based on estimates of the ultimate costs to be incurred to settle known claims and claims not reported as of the balance sheet date. The estimated liability is not discounted and is based on a number of assumptions and factors, including historical trends, actuarial assumptions and economic conditions.
(n) Pre-Opening Costs
Pre-opening costs incurred with the opening of new restaurants are expensed as incurred. These costs include straight-line rent during the rent holiday period, wages, benefits, travel and lodging for the training and opening management teams, and food, beverage and other restaurant operating expenses incurred prior to a restaurant opening for business.
(o) Income Taxes
Income taxes are accounted for under the asset and liability method. Deferred tax assets and liabilities are recognized for the future tax consequences attributable to differences between the financial statement carrying amounts of existing assets and liabilities and their respective tax bases. Deferred tax assets and liabilities are measured using enacted tax rates expected to apply to taxable income in the years in which those temporary differences are expected to be recovered or settled. The effect on deferred tax assets and liabilities of a change in tax rates is recognized in income in the period that includes the enactment date.
The Company adopted the provisions of “Income Taxes,” FASB Accounting Standards Codification Topic 740 (Topic 740) on January 1, 2007. Topic 740 requires that a position taken or expected to be taken in a tax return be recognized (or derecognized) in the financial statements when it is more likely than not that the position would be sustained upon examination by tax authorities. A recognized tax position is then measured at the largest amount of benefit that is greater than fifty percent likely of being realized upon ultimate settlement. The implementation of Topic 740 did not result in any changes to the Company’s unrecognized tax benefits for uncertain tax positions.
(p) Derivative Instruments
The Company utilized derivative instruments in 2008 and 2009 to manage interest rate risk. The Company does not apply hedge accounting as defined by “Derivatives and Hedging,” FASB Accounting Standards Codification Topic 815 (Topic 815) and any changes in fair value of the derivative instruments are marked to market through earnings in the period of change. Cash flows related to derivatives are included in operating activities.
(q) Revenue Recognition
Revenue from restaurant sales is recognized when food and beverage products are sold. Restaurant sales are presented net of sales taxes and discounts. Deferred revenue primarily represents the Company’s liability for gift cards that have been sold but not yet redeemed, and is recorded at the expected redemption value. When the gift cards are redeemed, the Company recognizes restaurant sales and reduces the deferred revenue. Company gift cards redeemed at franchise-owned locations reduce the deferred revenue but do not result in restaurant sales.
F-11
Table of Contents
RUTH’S HOSPITALITY GROUP, INC. AND SUBSIDIARIES
Notes to Consolidated Financial Statements—(Continued)
(dollar amounts in thousands)
The expected redemption value of the gift cards represents the full value of all gift cards issued less the amount the Company has recognized as other operating income for gift cards that are not expected to be redeemed. The Company recognizes as other operating income the remaining value of gift cards that have not been redeemed 18 months following the last date of card activity, subject to limitations in some jurisdictions in which it operates.
The Company franchises Ruth’s Chris Steak House restaurants. The Company executes franchise agreements for each franchise restaurant, which sets out the terms of its arrangement with the franchisee. The franchise agreements typically require the franchisee to pay an initial, non-refundable fee and continuing fees based upon a percentage of sales. The Company collects ongoing royalties of 5% of sales from franchise restaurants plus a 1% advertising fee applied to national advertising expenditures. The Company is not required to perform any services for the ongoing royalties and thus these royalties are recognized when the royalties are due from the franchisee on a monthly basis. These ongoing royalties are reflected in the accompanying consolidated statements of income (loss) as franchise income. The 1% advertising fee is recorded as a liability against which specified advertising and marketing costs are charged.
The Company executes an area development agreement with franchisees that gives the franchisee exclusive rights to develop a specific number of restaurants within a specified area. The Company charges an initial development fee at the time the area agreements are executed. This fee is related to feasibility studies of the area, certification of the franchisee and for the development opportunities lost or deferred as a result of the rights granted. These services are performed prior to the execution of the agreement. The Company recognizes the initial area development fee upon the signing of the area development agreement by the franchisee.
The Company executes separate, site specific, franchise agreements for each restaurant developed by a franchisee under an area development agreement. The Company charges an initial fee at the time the franchise agreement is executed. This fee is related to assistance in site selection and lease negotiation, construction consulting assistance and consulting regarding purchasing and supplies. These services are performed prior to the restaurant opening. The Company recognizes the initial franchise fee when the related restaurant opens.
(r) Foreign Revenues
The Company currently has 14 international franchise locations in Aruba, Canada, Mexico, China (Hong Kong), Japan, Taiwan and Dubai. In accordance with its franchise agreements relating to these international locations, the Company receives royalty revenue from these franchisees in U.S. dollars. Franchise fee revenues from international locations were $2.2 million, $2.3 million and $2.0 million in fiscal year 2007, 2008 and 2009, respectively.
(s) Stock-Based Compensation
The Company recognizes stock-based compensation in accordance with “Compensation—Stock Compensation,” FASB Accounting Standards Codification Topic 718 (Topic 718) using the modified prospective transition method. Compensation cost recognized during fiscal 2009 includes: a) compensation cost for all share-based payments granted prior to, but not yet vested as of December 26, 2005, based on the grant date fair value estimated in accordance with the original provisions of FAS 123, and b) compensation cost for all share-based payments granted subsequent to December 26, 2005, based on the grant date fair value estimated in accordance with the provisions of Topic 718. Compensation cost is recognized on a straight-line basis, net of estimated forfeitures, over the requisite service period of each award.
F-12
Table of Contents
RUTH’S HOSPITALITY GROUP, INC. AND SUBSIDIARIES
Notes to Consolidated Financial Statements—(Continued)
(dollar amounts in thousands)
The consolidated statements of income (loss) for fiscal 2007, 2008, and 2009 were impacted by stock-based compensation as follows:
| 2007 | 2008 | 2009 | |||||||
| Reduction in operating income from continuing operations |
$ | 1,575 | $ | 2,820 | $ | 2,163 | |||
| Reduction in income before taxes |
1,575 | 2,820 | 2,163 | ||||||
| Reduction in operating net income |
1,655 | 2,504 | 1,863 | ||||||
| Reduction in earnings per share: |
|||||||||
| Basic |
$ | 0.07 | $ | 0.11 | $ | 0.08 | |||
| Diluted |
$ | 0.07 | $ | 0.11 | $ | 0.08 | |||
(t) Use of Estimates
The preparation of consolidated financial statements in conformity with accounting principles generally accepted in the United States of America requires management to make estimates and assumptions that affect the reported amounts of assets and liabilities and disclosure of contingent assets and liabilities at the date of the consolidated financial statements and the reported amounts of revenues and expenses during the reporting period. Actual results could differ from those estimates.
(u) Fair Value of Financial Instruments
On January 1, 2008 we adopted new accounting standards for fair value measurements which define fair value, set out a framework for measuring fair value, and expand disclosures about fair value measurements of assets and liabilities to include disclosure about inputs used in the determination of fair value using the following three categories:
Level 1: Quoted market prices in active markets for identical assets or liabilities.
Level 2: Observable market based inputs or unobservable inputs that are corroborated by market data.
Level 3: Unobservable inputs that are not corroborated by market data.
The new accounting standards apply under other accounting pronouncements previously issued by the Financial Accounting Standards Board, or FASB, which require or permit fair value measurements. Our adoption of the new accounting standards did not have any effect on our consolidated financial statements.
The following methods and assumptions were used to estimate the fair value of each class of financial instruments:
| • | The carrying amount of cash and cash equivalents, receivables, prepaid expenses, accounts payable and accrued expenses and other current and long-term liabilities are a reasonable estimate of their fair values due to their short duration. |
| • | Borrowings under the senior credit facility as of December 27, 2009 and the term loan and revolving credit facility as of December 28, 2008 have variable interest rates that reflect currently available terms and conditions for similar debt. The carrying amount of this debt is a reasonable estimate of its fair value. |
| • | The fair values of interest rate swap assets and liabilities were estimated by the Company based on information provided by the bank counterparties that is model-driven and whose inputs are observable or whose significant value drivers are observable. |
F-13
Table of Contents
RUTH’S HOSPITALITY GROUP, INC. AND SUBSIDIARIES
Notes to Consolidated Financial Statements—(Continued)
(dollar amounts in thousands)
(v) Contingencies
The Company recognizes liabilities for contingencies when there is an exposure that indicates it is both probable that an asset has been impaired or that a liability has been incurred and that the amount of impairment or loss can be reasonably estimated.
(w) Segment Reporting
As of December 27, 2009, we operated the Ruth’s Chris Steak House, Mitchell’s Fish Market, Columbus Fish Market, Mitchell’s Steakhouse and Cameron’s Steakhouse restaurant concepts in North America as operating segments. The concepts operate within the full-service dining industry, providing similar products to similar customers. The concepts also possess similar economic characteristics, resulting in similar long-term expected financial performance characteristics. Revenues from external customers are derived principally from food and beverage sales. We do not rely on any major customers as a source of revenue. We believe we meet the criteria for aggregating our operating segments into a single reporting segment.
(x) Newly Adopted Accounting Pronouncements
In accordance with “Fair Value Measurements and Disclosures,” FASB Accounting Standards Codification Topic 820 (Topic 820), we adopted Topic 820 as it applies to nonfinancial assets and liabilities that are measured at fair value on a non-recurring basis during the first quarter of 2009. Our adoption of Topic 820, as it relates to our impairment assessment of long-lived and intangible assets, did not have a material impact on our consolidated financial statements.
In the second quarter of 2009, we adopted “Subsequent Events,” FASB Accounting Standards Codification Topic 855 (Topic 855). Topic 855 establishes general standards of accounting for and disclosure of events that occur after the balance sheet date but before financial statements are issued or are available to be issued. Topic 855 is effective for interim or annual financial periods ending after June 15, 2009. Our adoption of Topic 855 in the second quarter of 2009 has not had a material impact on our consolidated financial statements.
In the third quarter of 2009, we adopted “Generally Accepted Accounting Principles,” FASB Accounting Standards Codification Topic 105 (Topic 105). Topic 105 provides for the FASB Accounting Standards CodificationTM (the “Codification”) to become the single official source of authoritative, nongovernmental U.S. generally accepted accounting principles (GAAP). The Codification did not change GAAP but reorganizes the literature. Topic 105 is effective for interim and annual periods ending after September 15, 2009. Our adoption of Topic 105 in the third quarter of 2009 has not had a material impact on our consolidated financial statements.
In fiscal 2009, we adopted “Business Combinations,” FASB Accounting Standards Codification Topic 805-20 (Topic 805-20), which provides companies with guidance on how an acquiring company recognizes and measures in its financial statements the identifiable assets acquired, liabilities assumed and any non-controlling interest in the acquiree as well as the recognition and measurement of goodwill acquired in a business combination. Topic 805-20 also requires certain disclosures to enable users of the financial statements to evaluate the nature and financial effects of the business combination. Acquisition costs incurred as a result of the business combination will generally be expensed as incurred. Topic 805-20 is effective for business combinations occurring in fiscal years beginning after December 15, 2008. Early adoption of Topic 805-20 is not permitted. Our adoption of Topic 805-20 in fiscal 2009 has not had a material impact on our consolidated financial statements.
F-14
Table of Contents
RUTH’S HOSPITALITY GROUP, INC. AND SUBSIDIARIES
Notes to Consolidated Financial Statements—(Continued)
(dollar amounts in thousands)
(y) Recent Accounting Pronouncements for Future Application
Accounting standards that have been issued by the FASB or other standard-setting bodies that do not require adoption until a future date are not expected to have a material impact on the consolidated financial statements upon adoption.
(z) Reclassifications
Certain prior year amounts have been reclassified to conform with the current year presentation including discontinued operations and sales discounts (see Note 19). These reclassifications had no effect on previously reported net income.
(3) Goodwill, Franchise Rights and Trademarks
During the fourth quarter of fiscal 2009, there was continued deterioration in the Company’s business which caused the Company to revise its forward-looking business projections downward. Based on these projections, the Company completed an analysis to determine if goodwill and certain intangible assets were impaired as of the balance sheet date. The Company bases its fair value estimates on assumptions it believes to be reasonable, but which are unpredictable and inherently uncertain.
Franchise Rights
Owned franchise rights that have been determined to have indefinite lives must be reviewed for potential impairment when triggering events are detected. During the fourth quarter of fiscal 2009, the Company recorded non-cash impairment charges of $5.1 million for franchise rights previously recorded as part of the acquisition of ten formerly franchised restaurants in the Pacific Northwest, Midwest and Florida, reducing the carrying value from $37.3 million to $32.2 million. This reduction was primarily due to weakening 2009 sales impacting future sales and profitability assumptions. During the fourth quarter of fiscal 2008, the Company recorded non-cash impairment charges of $5.9 million for franchise rights previously recorded as part of the acquisition of three formerly franchised restaurants acquired in 2007, reducing the carrying value from $43.2 million to $37.3 million.
To determine the fair value of its acquired franchise rights, the Company used a multi-period excess earnings approach. This approach involves projecting future earnings, discounting those earnings using an appropriate discount rate and subtracting a contributory charge for net working capital, property, plant and equipment, assembled workforce and customer relationships to arrive at excess earnings attributable to franchise rights. The Company calculated the present value of cash flows generated from future franchise royalties and determined that the fair value did not exceed the carrying value as of December 27, 2009 and December 28, 2008.
Trademarks
In accordance with Topic 350, owned trademarks that have been determined to have indefinite lives must be reviewed for potential impairment when triggering events are detected. During the fourth quarter of fiscal 2009, the Company recorded non-cash trademark impairment charges of $0.2 million previously recorded as part of the Mitchell’s acquisition in 2008, reducing the carrying value from $13.8 million to $13.6 million. This reduction was primarily due to the weakening of 2009 sales. During the fourth quarter of fiscal 2008, the Company recorded non-cash trademark impairment charges of $12.1 million previously recorded as part of the Mitchell’s acquisition in 2008, reducing the carrying value from $25.9 million to $13.8 million.
F-15
Table of Contents
RUTH’S HOSPITALITY GROUP, INC. AND SUBSIDIARIES
Notes to Consolidated Financial Statements—(Continued)
(dollar amounts in thousands)
To determine the fair value of the Mitchell’s trademarks, including Mitchell’s Fish Market, Columbus Fish Market, Mitchell’s Steakhouse and Cameron’s Steakhouse, the Company used a relief-from-royalty approach. The method used assumes that in lieu of ownership, a third party would be willing to pay a royalty in order to exploit the related benefits of these types of assets. This approach is dependent on a number of factors, including estimates of future growth and trends, royalty rates in the category of intellectual property, discount rates and other variables. Based on the evaluation, the fair value of the Company’s trademarks did not exceed the carrying value as of December 27, 2009 and December 28, 2008.
Goodwill
During the fourth quarter of fiscal 2009, the Company recorded non-cash goodwill impairment charges of $2.2 million, reducing the carrying value from $24.3 million to $22.1 million. The impairment charges were related to goodwill recorded as part of the acquisition of the Ruth’s Chris Steak House restaurant in Palm Desert, California, in 2002. During the fourth quarter of fiscal 2008, the Company recorded non-cash goodwill impairment charges of $31.2 million, reducing the carrying value from $55.5 million to $24.3 million. Impairment charges of $22.8 million related to goodwill recorded as part of the Mitchell’s restaurants acquisition, while the remainder was related to Ruth’s Chris Steak House acquired restaurants.
In performing the 2009 evaluation of goodwill impairment under Topic 350-20 Step 1, the Company compared the carrying value of the long-lived assets to the fair value of the reporting unit, which is considered to be the individual restaurant acquired. Consistent with the valuation of restaurant operations, the Company utilized a multiple of EBITDA to approximate the fair value of the reporting unit for purposes of completing Step 1 of the evaluation. The Company considered EBITDA multiples of publicly held companies, including its own, as well as other private reporting unit acquisitions. For reporting units whose estimated fair value exceeded its carrying value, no impairment was recorded. For reporting units whose fair value did not exceed the carrying value as the balance sheet date, the Company completed Step 2 of the evaluation by comparing the implied fair value of goodwill with the net asset value of the reporting unit. The Company calculated the implied fair value by allocating the fair value of a reporting unit to all of its assets and liabilities as if the reporting unit had been acquired in a business combination and the fair value of the reporting unit was the price paid to acquire the unit. For reporting units whose implied fair value did not exceed the net asset value of the restaurant as of the balance sheet date, the Company recorded an impairment charge for the difference, not to exceed the goodwill carrying value.
The Company’s franchise rights, trademarks, and goodwill at December 27, 2009 were as follows:
| Franchise Rights |
Trademarks | |||||||
| Balance as of December 28, 2008 |
$ | 37,323 | $ | 13,918 | ||||
| Loss on impairment |
(5,123 | ) | (200 | ) | ||||
| Balance as of December 27, 2009 |
$ | 32,200 | $ | 13,718 | ||||
F-16
Table of Contents
RUTH’S HOSPITALITY GROUP, INC. AND SUBSIDIARIES
Notes to Consolidated Financial Statements—(Continued)
(dollar amounts in thousands)
| Gross Goodwill |
Accumulated Impairment Losses |
Net Carrying Value of Goodwill |
|||||||||
| Balance as of December 31, 2006 |
$ | 30,533 | — | $ | 30,533 | ||||||
| Acquisitions |
2,121 | — | 2,121 | ||||||||
| Balance as of December 30, 2007 |
32,654 | — | 32,654 | ||||||||
| Acquisitions |
22,815 | — | 22,815 | ||||||||
| Loss on impairment |
— | (31,149 | ) | (31,149 | ) | ||||||
| Balance as of December 28, 2008 |
55,469 | (31,149 | ) | 24,320 | |||||||
| Loss on impairment |
— | (2,223 | ) | (2,223 | ) | ||||||
| Balance as of December 27, 2009 |
$ | 55,469 | $ | (33,372 | ) | $ | 22,097 | ||||
These charges are included in “loss on impairment” in the accompanying consolidated statements of income (loss).
(4) Property and Equipment, net
Property and equipment consists of the following:
| December 28, 2008 |
December 27, 2009 |
|||||||
| Land |
$ | 3,251 | $ | 1,471 | ||||
| Building and building improvements |
25,494 | 24,285 | ||||||
| Equipment |
29,639 | 29,046 | ||||||
| Computer equipment |
7,851 | 8,581 | ||||||
| Furniture and fixtures |
16,209 | 15,494 | ||||||
| Automobiles |
27 | 27 | ||||||
| Leasehold improvements |
110,719 | 111,070 | ||||||
| Construction-in-progress |
3,394 | 1,873 | ||||||
| 196,584 | 191,847 | |||||||
| Less accumulated depreciation |
(66,204 | ) | (77,643 | ) | ||||
| $ | 130,380 | $ | 114,204 | |||||
During the fiscal year ended December 27, 2009, we recorded a loss on impairment of long-lived assets held for use in the amount of $1.1 million. These charges were related to the impairment of fixtures and equipment and leasehold improvements at one Mitchell’s Fish Market restaurant and two company-owned Ruth’s Chris Steak House restaurants. During the fiscal year ended December 28, 2008, we recorded a loss on impairment of long-lived assets held for use of $28.8 million, and $3.3 million on assets held for sale. There was no loss on impairment in fiscal 2007.
On December 15, 2009, we completed the sale of our home office building in Heathrow, Florida. The sale generated net proceeds of approximately $9.7 million, which were used to reduce borrowings under the credit facility. We recorded a loss of $0.8 million related to the sale, which is included in “loss on disposal of property and equipment, net” in the accompanying consolidated statements of income (loss).
F-17
Table of Contents
RUTH’S HOSPITALITY GROUP, INC. AND SUBSIDIARIES
Notes to Consolidated Financial Statements—(Continued)
(dollar amounts in thousands)
The Company capitalizes interest as a component of the cost of construction in progress. In connection with assets under construction in 2007, 2008 and 2009, the Company has capitalized $375, $239 and $0 of interest costs, respectively, in accordance with “Interest—Capitalization of Interest,” FASB Accounting Standards Codification Topic 835-20 (Topic 835-20).
(5) Long-term Debt
Long-term debt consists of the following:
| December 28, 2008 |
December 27, 2009 | |||||
| Senior Credit Facility: |
||||||
| Revolving credit facility |
$ | 160,250 | $ | 125,500 | ||
| Less current maturities |
— | — | ||||
| $ | 160,250 | $ | 125,500 | |||
On February 19, 2008, the Company amended and restated its existing credit facility to increase the revolving loan commitment to $250.0 million. The amended and restated credit extended the maturity date of the outstanding principal from March 11, 2010 to February 19, 2013, and changed the maximum Consolidated Leverage Ratio in the financial covenants to 3.50:1.00.
On February 26, 2009, the Company entered into a First Amendment to First Amended and Restated Credit Agreement. The amendment reduced the revolving loan commitment from $250.0 million to $175 million, with additional reductions scheduled beginning December 31, 2009 through the final maturity date of February 19, 2013. The amendment decreased the Company’s Fixed Charge Coverage Ratio and increased its maximum Leverage Ratio, in each case beginning with the fourth quarter of 2008 and continuing through the second quarter of 2010, after which these two covenants reset to their original levels. The amendment also added two new covenants. The first is a minimum EBITDA test and the second placed new restrictions on capital expenditures. The amendment also increased the interest rates applicable to borrowings based on the Company’s actual leverage ratio, ranging from 2.50% to 4.25% above the applicable LIBOR rate or, at the Company’s option, from 1.25% to 3.00% above the applicable base rate.
During the fourth quarter of fiscal 2009, the Company negotiated an amendment to its senior credit facility. The Second Amendment to First Amended and Restated Credit Agreement became effective on February 12, 2010. The amendment to the credit agreement reduces the revolving loan commitment to $129.6 million, extends the scheduled maturity of the credit agreement by two years, to February 2015, and provides the Company with a less restrictive set of covenants, which the Company believes will enhance its financial and operating flexibility. Specifically, the amendment provides for no financial covenant testing until the end of fiscal year 2010, provides less restrictive leverage and coverage covenants thereafter, and permanently eliminates the minimum EBITDA covenant. The amendment provides for higher interest rates under the credit facility, with interest rates based on the Company’s actual leverage ratio, ranging from 3.25% to 5.00% above the applicable LIBOR rate or, at the Company’s option, from 2.00% to 3.75% above the applicable base rate.
As of December 27, 2009, the Company had an aggregate of $125.5 million of outstanding indebtedness under its senior credit facility at a weighted average interest rate of 4.22%. The Company had approximately $41.0 million of borrowings available under its revolving credit facility, net of outstanding letters of credit of approximately $3.5 million. As of the February 12, 2010 amendment date, the outstanding indebtedness under its
F-18
Table of Contents
RUTH’S HOSPITALITY GROUP, INC. AND SUBSIDIARIES
Notes to Consolidated Financial Statements—(Continued)
(dollar amounts in thousands)
senior credit facility was $78.8 million, at a weighted average interest rate of 4.48%. Under the amended revolving loan commitment as of this date, the Company had approximately $47.3 million of borrowings available under its revolving credit facility, net of outstanding letters of credit of approximately $3.5 million. The Company is required to maintain certain financial covenants and is also subject to several restrictive covenants under its borrowings. The restrictive covenants include, but are not limited to, covenants that, subject to exceptions: (1) prohibit the Company and its subsidiaries from incurring additional indebtedness and from guaranteeing obligations of others; (2) prohibit the Company and its subsidiaries from creating, incurring, assuming or permitting to exist any lien on or with respect to any property or asset; (3) limit the Company’s ability and its subsidiaries’ ability to enter into joint ventures, acquisitions, and other investments; (4) prohibit the Company and its subsidiaries from directly or indirectly creating or becoming liable with respect to any contingent liabilities; and (5) restrict the Company and its subsidiaries from directly or indirectly declaring, ordering, paying, or making any restricted junior payments in excess of the $1.0 million in annual dividends permitted under the credit agreement.
The Company’s obligations under the senior credit facility are guaranteed by each of its existing and future subsidiaries and are secured by substantially all of its assets and a pledge of the capital stock of its subsidiaries. See also Note 20.
(6) Shareholders’ Equity
The holders of the Class A common stock are entitled to one vote per share on all matters to be voted on by the Company’s shareholders. Holders of Class A common stock are entitled to convert, at any time and from time to time, any or all of the shares of Class A common stock held by such holder into the same number of shares of Class B common stock.
(7) Employee Benefit Plan
In 2000, the Company established a 401(k) plan. Eligible employees may contribute up to 99% of their annual compensation. The Company matches the employees’ contributions at year end. Employees vest in the Company’s contributions based upon their years of service. The Company’s expenses relating to matching contributions were approximately $226, $272 and $275 for fiscal 2007, 2008 and 2009, respectively. During 2005, the Company added a profit sharing component to the 401(k) plan that provided for a payment to all employees if the Company achieved certain predetermined financial targets. The Company did not record expenses related to profit sharing in fiscal 2007, 2008 or 2009.
(8) Incentive and Stock Option Plans
As of December 27, 2009, the Company had the following share-based compensation plans:
2000 Stock Option Plan
The Company established a stock option plan (the 2000 Stock Option Plan) which allows the Company’s Board of Directors to grant stock options to directors, officers, key employees, and other key individuals performing services for the Company. The 2000 Stock Option Plan authorizes grants of options to purchase up to 1,765,981 shares of authorized but unissued Class A common stock. The Plan provides for granting of options to purchase shares of common stock at an exercise price not less than the fair value of the stock on the date of grant. Options are exercisable at various periods ranging from one to ten years from date of grant. Under the Company’s 2000 Stock Option Plan there are 155,741 shares of common stock issuable upon exercise of currently outstanding options at December 27, 2009 and 647,231 shares available for future grants. No future grants are expected to be made under the 2000 Stock Option Plan.
F-19
Table of Contents
RUTH’S HOSPITALITY GROUP, INC. AND SUBSIDIARIES
Notes to Consolidated Financial Statements—(Continued)
(dollar amounts in thousands)
2005 Long-Term Equity Incentive Plan
In connection with the initial public offering, the Company adopted the Ruth’s Chris Steak House, Inc. 2005 Long-Term Equity Incentive Plan (the “2005 Equity Incentive Plan”), which allows the Company’s Board of Directors to grant stock options, restricted stock, restricted stock units, deferred stock units and other equity-based awards to directors, officers, key employees and other key individuals performing services for the Company. The 2005 Equity Incentive Plan provides for granting of options to purchase shares of common stock at an exercise price not less than the fair value of the stock on the date of grant. Options are exercisable at various periods ranging from one to five years from date of grant. Effective May 22, 2008, the 2005 Equity Incentive Plan was amended, with stockholder approval, to increase the number of shares authorized for issuance under the plan by 1,500,000 shares.
Under the 2005 Equity Incentive Plan, as amended, there were 2,489,207 shares of common stock issuable upon exercise of currently outstanding options and restricted stock awards at December 27, 2009 and 1,069,798 shares available for future grants.
The following table summarizes stock option activity for fiscal 2009 under all plans:
| December 27, 2009 | |||||||||||
| Shares | Weighted- Average Exercise Price |
Weighted-Average Remaining Contractual Term |
Aggregate Intrinsic Value ($000’s) | ||||||||
| Outstanding at beginning of year |
2,229,494 | $ | 8.76 | ||||||||
| Granted |
122,109 | 3.23 | |||||||||
| Exercised |
(32,957 | ) | 0.48 | ||||||||
| Forfeited |
(157,698 | ) | 15.13 | ||||||||
| Outstanding at end of year |
2,160,948 | $ | 8.11 | 7.68 | $ | 504 | |||||
| Options exercisable at year end |
770,939 | $ | 10.18 | 6.27 | $ | 322 | |||||
As of December 27, 2009, there was $3.4 million of total unrecognized compensation cost related to non-vested stock options. This cost is expected to be recognized over a weighted-average period of approximately 2.79 years. As of December 27, 2009, there was $2.7 million of total unrecognized compensation cost related to 484,000 shares of non-vested restricted stock. This cost is expected to be recognized over a weighted-average period of approximately 3.26 years. The total intrinsic value of options exercised in fiscal 2007, 2008 and 2009 was $0.8, $0.3 and $0.1 million, respectively. The Company recorded $1.7, $2.8 and $2.2 million in total stock option and restricted stock compensation cost during fiscal year 2007, 2008 and 2009, respectively, that was expensed primarily in general and administrative costs.
During fiscal 2007, 2008 and 2009, the Company received $90, $22 and $24, respectively, in cash related to the exercise of options and tax benefits of $0.3, $0.1 and $0.02 million, respectively. The exercise of shares were fulfilled from shares reserved for issue under the stock option plans and resulted in an increase in issued shares outstanding.
F-20
Table of Contents
RUTH’S HOSPITALITY GROUP, INC. AND SUBSIDIARIES
Notes to Consolidated Financial Statements—(Continued)
(dollar amounts in thousands)
A summary of the status of non-vested stock options and restricted stock as of December 27, 2009 and changes during fiscal 2009 is presented below.
| December 27, 2009 | |||||||||||
| Stock Options | Restricted Stock | ||||||||||
| Shares | Weighted- Average Grant-Date Fair Value |
Shares | Weighted- Average Grant-Date Fair Value | ||||||||
| Non-vested shares at beginning of year |
1,757,347 | $ | 3.20 | 770,000 | $ | 6.95 | |||||
| Granted |
122,109 | 1.62 | — | — | |||||||
| Vested |
331,749 | (6.22 | ) | 236,000 | 7.01 | ||||||
| Canceled |
157,698 | 5.81 | 50,000 | 6.86 | |||||||
| Non-vested shares at end of period |
1,390,009 | $ | 2.82 | 484,000 | $ | 6.93 | |||||
The weighted-average grant-date per share fair value of options granted in fiscal 2009 was $1.62. The weighted-average grant-date per share fair value of options granted in fiscal 2007 and 2008 was $7.44 and $1.87, respectively. The fair value of each option award is estimated on the date of grant using the Black-Scholes option valuation model with the weighted-average assumptions noted in the following table. The Black-Scholes option valuation model requires the input of highly subjective assumptions, including the expected life of the stock-based award. The assumptions listed below represent management’s best estimates, but these estimates involve inherent uncertainties and the application of management’s judgment. In addition, the Company is required to estimate the expected forfeiture rate and only recognizes expense for those shares expected to vest. If the actual forfeiture rate is materially different from the Company’s estimate, the share-based compensation expense could be materially different.
The expected term of options granted is derived from historical data on employee exercise and post-vesting employment termination behavior. The risk-free rate for periods within the contractual life of the option is based on the U.S. Treasury constant maturities rate in effect at the time of grant. The Company utilized a blended rate for expected volatility during 2009 based on the historical volatility of our stock and a representative peer group with a similar expected term of options granted. The following weighted-average assumptions were used for stock option grants in each year:
| 2007 | 2008 | 2009 | |||||||
| Expected life |
6.3 yrs | 5.7 yrs | 5.2 yrs | ||||||
| Risk-free interest rate |
4.60 | % | 3.06 | % | 2.90 | % | |||
| Volatility |
31.13 | % | 37.46 | % | 53.49 | % | |||
| Expected dividend yield |
0.0 | % | 0.0 | % | 0.0 | % |
(9) Earnings per share
Basic earnings (loss) per common share were computed by dividing net income available to common shareholders by the weighted-average number of shares of common stock outstanding during the fiscal year. Diluted earnings (loss) per share for fiscal year 2007, 2008, and 2009 excludes 1,238,810 stock options at a weighted-average price of $17.15, 1,051,852 stock options at a weighted-average price of $16.15, and 2,425,707 stock options at a weighted-average price of $2.80, respectively, which were outstanding during the period but were anti-dilutive.
F-21
Table of Contents
RUTH’S HOSPITALITY GROUP, INC. AND SUBSIDIARIES
Notes to Consolidated Financial Statements—(Continued)
(dollar amounts in thousands)
The following table sets forth the computation of basic and diluted earnings per share:
| Fiscal Year Ended | ||||||||||||
| 2007 | 2008 | 2009 | ||||||||||
| Net income |
$ | 18,146 | $ | (53,883 | ) | $ | 2,419 | |||||
| Basic earnings per share: |
||||||||||||
| Continuing operations |
$ | 0.81 | $ | (2.08 | ) | $ | 0.11 | |||||
| Discontinued operations |
(0.03 | ) | (0.23 | ) | (0.01 | ) | ||||||
| Basic earnings per share |
$ | 0.78 | $ | (2.31 | ) | $ | 0.10 | |||||
| Diluted earnings per share: |
||||||||||||
| Continuing operations |
$ | 0.81 | $ | (2.08 | ) | $ | 0.11 | |||||
| Discontinued operations |
(0.03 | ) | (0.23 | ) | (0.01 | ) | ||||||
| Diluted earnings per share |
$ | 0.78 | $ | (2.31 | ) | $ | 0.10 | |||||
(10) Income Taxes
Total income tax expense (benefit) for fiscal 2007, 2008, and 2009 was allocated as follows:
| 2007 | 2008 | 2009 | ||||||||||
| Income (loss) from continuing operations |
$ | 8,889 | $ | (27,203 | ) | $ | (1,668 | ) | ||||
| Loss from discontinued operations |
(369 | ) | (632 | ) | (638 | ) | ||||||
| Total consolidated income tax expense (benefit) |
$ | 8,520 | $ | (27,835 | ) | $ | (2,306 | ) | ||||
Income tax expense (benefit) from continuing operations consists of the following:
| Current | Deferred | Total | |||||||||
| Year ended December 30, 2007: |
|||||||||||
| U.S. Federal |
$ | 4,334 | $ | 2,748 | $ | 7,082 | |||||
| State |
1,378 | 173 | 1,551 | ||||||||
| Foreign |
256 | — | 256 | ||||||||
| $ | 5,968 | $ | 2,921 | $ | 8,889 | ||||||
| Year ended December 28, 2008: |
|||||||||||
| U.S. Federal |
$ | 795 | $ | (28,647 | ) | $ | (27,852 | ) | |||
| State |
860 | (458 | ) | 402 | |||||||
| Foreign |
247 | — | 247 | ||||||||
| $ | 1,902 | $ | (29,105 | ) | $ | (27,203 | ) | ||||
| Year ended December 27, 2009: |
|||||||||||
| U.S. Federal |
$ | 85 | $ | (5,019 | ) | $ | (4,934 | ) | |||
| State |
822 | 2,276 | 3,098 | ||||||||
| Foreign |
168 | — | 168 | ||||||||
| $ | 1,075 | $ | (2,743 | ) | $ | (1,668 | ) | ||||
F-22
Table of Contents
RUTH’S HOSPITALITY GROUP, INC. AND SUBSIDIARIES
Notes to Consolidated Financial Statements—(Continued)
(dollar amounts in thousands)
Income tax expense differs from amounts computed by applying the federal statutory income tax rate to income from continuing operations before income taxes as follows:
| 2007 | 2008 | 2009 | ||||||||||
| Income tax expense (benefit) at statutory rates |
$ | 9,719 | $ | (26,470 | ) | $ | 290 | |||||
| Increase (decrease) in income taxes resulting from: |
||||||||||||
| State income taxes, net of federal benefit |
896 | 262 | 2,045 | |||||||||
| Stock compensation expense (benefit) |
444 | 985 | (462 | ) | ||||||||
| Employment tax credits |
(2,694 | ) | (3,425 | ) | (2,345 | ) | ||||||
| Cumulative impact of adjustment to deferred tax items |
— | 1,668 | (1,194 | ) | ||||||||
| Other |
523 | (223 | ) | (2 | ) | |||||||
| $ | 8,889 | $ | (27,203 | ) | $ | (1,668 | ) | |||||
At December 27, 2009, the state income tax expense of $2,045 includes $1,367 expense attributable to the additional valuation allowance recorded against state deferred tax assets.
The tax effects of temporary differences that give rise to significant portions of the deferred tax assets are presented below:
| December 30, 2007 |
December 28, 2008 |
December 27, 2009 |
||||||||||
| Deferred tax assets: |
||||||||||||
| Accounts payable and accrued expenses |
$ | 927 | $ | 4,250 | $ | 3,275 | ||||||
| Deferred rent |
2,710 | 3,761 | 4,457 | |||||||||
| Net state operating loss carryforwards |
6,064 | 4,086 | 4,603 | |||||||||
| Tax credit carryforwards |
— | 2,761 | 5,683 | |||||||||
| Property and equipment |
6,335 | 17,555 | 19,899 | |||||||||
| Intangible assets |
— | 9,846 | 7,592 | |||||||||
| Other |
492 | 914 | 1,344 | |||||||||
| Total gross deferred tax assets |
16,528 | 43,173 | 46,853 | |||||||||
| Less valuation allowance |
(1,438 | ) | (4,669 | ) | (7,046 | ) | ||||||
| Net deferred tax assets |
15,090 | 38,504 | 39,807 | |||||||||
| Deferred tax liabilities: |
||||||||||||
| Intangible assets |
(7,984 | ) | — | — | ||||||||
| Other |
(122 | ) | (1,995 | ) | — | |||||||
| Total gross deferred tax liabilities |
(8,106 | ) | (1,995 | ) | — | |||||||
| Net deferred tax assets |
$ | 6,984 | $ | 36,509 | $ | 39,807 | ||||||
In assessing the realizability of deferred tax assets, management considers whether it is more likely than not that some portion or all of the deferred tax assets will not be realized. The ultimate realization of deferred tax assets is dependent upon the generation of future taxable income during the periods in which those temporary differences become deductible. Management considers the scheduled reversal of deferred tax liabilities and projected future taxable income in making this assessment. Based upon the level of historical taxable income and projections for future taxable income over the periods in which the deferred tax assets are deductible, management believes it is more likely than not that the Company will realize the benefits of the net deferred tax assets.
F-23
Table of Contents
RUTH’S HOSPITALITY GROUP, INC. AND SUBSIDIARIES
Notes to Consolidated Financial Statements—(Continued)
(dollar amounts in thousands)
As of December 27, 2009, the Company has state net operating loss carry-forwards and tax credit carry-forwards of $111 million and $5.7 million, respectively, which are available to offset federal and state taxable income through 2029.
The Company adopted the provisions of “Income Taxes,” FASB Accounting Standards Codification Topic 740 (Topic 740) on January 1, 2007. The implementation of Topic 740 did not result in any changes to the Company’s unrecognized tax benefits for uncertain tax positions.
A reconciliation of the beginning and ending amount of unrecognized tax benefits is as follows:
| Unrecognized tax benefits balance at December 28, 2008 |
$ | 696 | ||
| Gross increases for tax positions of prior years |
152 | |||
| Settlements |
(13 | ) | ||
| Unrecognized tax benefits balance at December 27, 2009 |
$ | 835 | ||
As of December 27, 2009, the Company’s gross unrecognized tax benefits totaled approximately $835, of which $543, if recognized, would impact the effective tax rate. The Company does not anticipate there will be any material changes in the unrecognized tax benefits within the next 12 months. Our continuing practice is to recognize interest and penalties related to uncertain tax positions in income tax expense. As of December 28, 2008 and December 27, 2009, the Company had accrued approximately $140 and $186, respectively, for the payment of interest, which is included as a component of the unrecognized tax benefit noted above.
The Company files consolidated and separate income tax returns in the United States Federal jurisdiction, many state jurisdictions and Puerto Rico. With few exceptions, the Company is no longer subject to U.S. Federal income tax examinations for years before 2007 and is no longer subject to state and local or Puerto Rico income tax examinations by tax authorities for years before 2005.
(11) Leases
All of the Company’s Ruth’s Chris Steak House owned restaurants operate in leased premises, with the exception of the locations in Houston, Columbus and Ft. Lauderdale, which are owned properties and the locations in Anaheim, Lake Mary, Princeton and South Barrington which operate on leased land. The Company’s Mitchell’s Fish Market and Mitchell’s Steakhouse locations all operate in leased premises. Remaining lease terms range from approximately 4 to 30 years, including anticipated renewal options. The leases generally provide for minimum annual rental payments and are subject to escalations based, in some cases, upon increases in the Consumer Price Index, real estate taxes, and other costs. In addition, certain leases contain contingent rental provisions based upon the sales of the underlying restaurants. Certain leases also provide for rent deferral during the initial term of such lease and/or scheduled minimum rent increases during the terms of the leases. For financial reporting purposes, rent expense is recorded on a straight-line basis over the life of the lease. Accordingly, included in liabilities in the accompanying consolidated balance sheets at December 28, 2008 and December 29, 2009, are accruals related to such rent deferrals and the pro rata portion of scheduled rent increases of approximately $21.0 million and $20.6 million, respectively, net of the current portion included in other current liabilities $1.5 million and $1.6 million, respectively.
F-24
Table of Contents
RUTH’S HOSPITALITY GROUP, INC. AND SUBSIDIARIES
Notes to Consolidated Financial Statements—(Continued)
(dollar amounts in thousands)
The Company leases certain restaurant related equipment under non-cancellable operating lease agreements with third parties, which are included in the future minimum annual rental commitments. Future minimum annual rental commitments under leases as of December 27, 2009 are as follows:
| Lessee: |
|||
| 2010 |
24,842 | ||
| 2011 |
24,710 | ||
| 2012 |
23,430 | ||
| 2013 |
21,476 | ||
| 2014 |
20,853 | ||
| Thereafter |
206,644 | ||
| $ | 321,955 | ||
Rental expense consists of the following and is included in restaurant operating expenses in the accompanying statements of income(loss):
| Fiscal Year | |||||||||
| 2007 | 2008 | 2009 | |||||||
| Minimum rentals |
$ | 11,562 | $ | 21,711 | $ | 24,583 | |||
| Contingent rentals |
3,802 | 3,121 | 1,363 | ||||||
| $ | 15,364 | $ | 24,832 | $ | 25,946 | ||||
(12) Commitments and Contingencies
The Company currently buys most of its beef from one supplier. Although there are a limited number of beef suppliers, management believes that other suppliers could provide similar product on comparable terms. A change in suppliers, however, could cause supply shortages and a possible loss of sales, which would affect operating results adversely.
The Company is subject to various claims, possible legal actions, and other matters arising in the normal course of business. Management does not expect disposition of these other matters to have a material adverse effect on the financial position, results of operations or liquidity of the Company.
(13) Discontinued Operations
During the third quarter of fiscal 2007, we were notified that the replacement tenant in the Manhattan-UN, New York, location was placed in default by the landlord and as a result, we resumed lease payments with respect to this property during the third quarter of fiscal 2008. Payments will equal $0.6 million in the aggregate per fiscal year through September 2016. We will attempt to sublease the property in order to recover some or all of the amounts paid with respect to the lease. As of December 27, 2009, we maintained a contingent lease liability of $0.8 million related to this property. We accounted for our exit costs in accordance with the provisions of “Exit or Disposal Cost Obligations,” FASB Accounting Standards Codification Topic 420 (Topic 420), which requires that such costs be expensed in the periods whereby such costs are incurred. All of the losses incurred are included in discontinued operations in the accompanying consolidated income statements.
F-25
Table of Contents
RUTH’S HOSPITALITY GROUP, INC. AND SUBSIDIARIES
Notes to Consolidated Financial Statements—(Continued)
(dollar amounts in thousands)
During the second quarter of fiscal 2009, we made the decision to close the company-owned Ruth’s Chris Steak House restaurant in Naples, Florida. As of December 27, 2009, we maintain a liability for lease exit costs in accordance with the provisions of Topic 420. All of the losses incurred with respect to this location are included in discontinued operations in the accompanying consolidated income statements.
As discussed in Note 2 to the consolidated financial statements, the Company accounts for its closed restaurants in accordance with the provisions of Topic 360-10. Therefore, when a restaurant is closed, and the restaurant is either held for sale or abandoned, the restaurant’s operations are eliminated from the ongoing operations. Accordingly, the operations of such restaurants, net of applicable income taxes, are presented as discontinued operations and prior period operations of such restaurants, net of applicable income taxes, are reclassified. Discontinued operations consist of the following:
| Fiscal Year | ||||||||||||
| 2007 | 2008 | 2009 | ||||||||||
| Revenues |
$ | 2,292 | $ | 2,084 | $ | 716 | ||||||
| Income (loss) before income tax |
$ | (1,012 | ) | $ | (6,006 | ) | $ | (740 | ) | |||
| Income (loss) from operations of discontinued restaurants, net of income tax benefit |
$ | (643 | ) | $ | (5,374 | ) | $ | (102 | ) | |||
(14) Fair Value Measurements
Fair value is defined under “Fair Value Measurements and Disclosures,” FASB Accounting Standards Codification Topic 820 (Topic 820) as the price that would be received to sell an asset or paid to transfer a liability in the principal or most advantageous market in an orderly transaction between market participants on the measurement date. Topic 820 also establishes a three-level hierarchy, which requires an entity to maximize the use of observable inputs and minimize the use of unobservable inputs when measuring fair value.
The valuation hierarchy is based upon the transparency of inputs to the valuation of an asset or liability on the measurement date. The three levels of inputs to the valuation methodology are:
| • | Level 1—quoted prices (unadjusted) for an identical asset or liability in an active market. |
| • | Level 2—quoted prices for a similar asset or liability in an active market or model-derived valuations in which all significant inputs are observable for substantially the full term of the asset or liability. |
| • | Level 3—unobservable and significant to the fair value measurement of the asset or liability. |
The Company’s financial instruments measured at fair value on a recurring basis subject to the disclosure requirements of Topic 820 at December 27, 2009 were as follows:
| Quoted Prices in Active Markets for Identical Assets (Level 1) |
Significant Other Observable Inputs (Level 2) |
Significant Unobservable Inputs (Level 3) |
Fair Value as of December 27, 2009 | |||||||||
| Interest rate swap liability |
$ | — | $ | 797 | $ | — | $ | 797 | ||||
We believe that the carrying amount of our revolving credit facility approximates its fair value because interest rates are adjusted regularly to reflect current market rates.
F-26
Table of Contents
RUTH’S HOSPITALITY GROUP, INC. AND SUBSIDIARIES
Notes to Consolidated Financial Statements—(Continued)
(dollar amounts in thousands)
The Company’s non-financial assets measured at fair value on a non-recurring basis subject to the disclosure requirements of Topic 820 at December 27, 2009 were as follows:
| Year ended 12/27/09 | Significant Unobservable Inputs (Level 3) |
Total Gains/ (Losses) |
||||||||
| Long—lived assets held and used |
$ | 114,204 | $ | 114,204 | $ | (1,088 | ) | |||
| Goodwill |
22,097 | 22,097 | (2,223 | ) | ||||||
| Franchise rights |
32,200 | 32,200 | (5,123 | ) | ||||||
| Trademarks |
13,718 | 13,718 | (200 | ) | ||||||
Losses on these assets are recorded as loss on impairment in the accompanying statements of income (loss). See notes 2 and 3 for a description of the valuation techniques used to measure fair value, as well as inputs and information used to develop the inputs.
(15) Supplemental Consolidated Financial Statement Information
(a) Accounts Receivable, net
Accounts receivable, net consist of the following:
| December 28, 2008 |
December 27, 2009 |
|||||||
| Bank credit card receivables |
$ | 4,590 | $ | 6,736 | ||||
| Landlord contributions |
1,426 | 343 | ||||||
| Franchise fees |
1,407 | 1,310 | ||||||
| Trade |
869 | 596 | ||||||
| Net income tax refundable |
3,563 | 913 | ||||||
| Other |
2,109 | 520 | ||||||
| Allowance for doubtful accounts |
(597 | ) | (339 | ) | ||||
| $ | 13,367 | $ | 10,079 | |||||
(b) Other Assets
Other assets consist of the following:
| December 28, 2008 |
December 27, 2009 | |||||
| Deposits |
$ | 1,314 | $ | 1,141 | ||
| Deferred financing costs |
1,362 | 2,568 | ||||
| Other |
122 | 244 | ||||
| $ | 2,798 | $ | 3,953 | |||
F-27
Table of Contents
RUTH’S HOSPITALITY GROUP, INC. AND SUBSIDIARIES
Notes to Consolidated Financial Statements—(Continued)
(dollar amounts in thousands)
(c) Accounts Payable and Accrued Expenses
Accounts payable and accrued expenses consist of the following:
| December 28, 2008 |
December 27, 2009 | |||||
| Accounts payable & other accrued expenses |
$ | 17,863 | $ | 12,866 | ||
| Accrued payroll & related benefits |
9,524 | 10,286 | ||||
| Sales & use tax payable |
2,579 | 2,315 | ||||
| Accrued interest payable |
423 | 402 | ||||
| $ | 30,389 | $ | 25,869 | |||
(16) Quarterly Financial Data (Unaudited)
Summarized unaudited quarterly financial data (amounts in thousands, except per share information):
| Quarter Ended | ||||||||||||||||||||
| March 30, 2008 |
June 29, 2008 |
September 28, 2008 |
December 28, 2008 |
Total | ||||||||||||||||
| Total revenues |
$ | 95,234 | $ | 105,455 | $ | 96,015 | $ | 96,943 | $ | 393,647 | ||||||||||
| Cost and expenses |
$ | (86,003 | ) | $ | (100,513 | ) | $ | (94,363 | ) | $ | (179,016 | ) | $ | (459,893 | ) | |||||
| Operating income (loss) |
$ | 9,231 | $ | 4,941 | $ | 1,653 | $ | (82,073 | ) | $ | (66,246 | ) | ||||||||
| Interest expense, net |
$ | (3,208 | ) | $ | (1,182 | ) | $ | (2,511 | ) | $ | (3,433 | ) | $ | (10,334 | ) | |||||
| Other |
$ | 336 | $ | 185 | $ | 242 | $ | 105 | $ | 868 | ||||||||||
| Income (loss) from continuing operations before income tax expense (benefit) |
$ | 6,359 | $ | 3,944 | $ | (616 | ) | $ | (85,401 | ) | $ | (75,712 | ) | |||||||
| Income tax expense (benefit) |
$ | 1,855 | $ | 1,048 | $ | (348 | ) | $ | (29,759 | ) | $ | (27,203 | ) | |||||||
| Income (loss) from continuing operations |
$ | 4,504 | $ | 2,896 | $ | (268 | ) | $ | (55,642 | ) | $ | (48,509 | ) | |||||||
| Discontinued operations, net of income tax benefit |
$ | (27 | ) | $ | 141 | $ | 252 | $ | 5,009 | $ | 5,374 | |||||||||
| Net income (loss) |
$ | 4,532 | $ | 2,756 | $ | (519 | ) | $ | (60,652 | ) | $ | (53,883 | ) | |||||||
| Basic earnings (loss) per share: |
||||||||||||||||||||
| Continuing operations |
$ | 0.20 | $ | 0.13 | $ | (0.01 | ) | $ | (2.38 | ) | $ | (2.08 | ) | |||||||
| Discontinued operations |
0.00 | (0.01 | ) | (0.01 | ) | (0.21 | ) | (0.23 | ) | |||||||||||
| Basic earnings (loss) per share |
$ | 0.20 | $ | 0.12 | $ | (0.02 | ) | $ | (2.59 | ) | $ | (2.31 | ) | |||||||
| Diluted earnings (loss) per share: |
||||||||||||||||||||
| Continuing operations |
$ | 0.19 | $ | 0.13 | $ | (0.01 | ) | $ | (2.38 | ) | $ | (2.08 | ) | |||||||
| Discontinued operations |
0.00 | (0.01 | ) | (0.01 | ) | (0.21 | ) | (0.23 | ) | |||||||||||
| Diluted earnings (loss) per share |
$ | 0.19 | $ | 0.12 | $ | (0.02 | ) | $ | (2.59 | ) | $ | (2.31 | ) | |||||||
F-28
Table of Contents
RUTH’S HOSPITALITY GROUP, INC. AND SUBSIDIARIES
Notes to Consolidated Financial Statements—(Continued)
(dollar amounts in thousands)
| Quarter Ended | ||||||||||||||||||||
| March 29, 2009 |
June 28, 2009 |
September 27, 2009 |
December 27, 2009 |
Total | ||||||||||||||||
| Total revenues |
$ | 94,728 | $ | 86,387 | $ | 76,140 | $ | 87,374 | $ | 344,630 | ||||||||||
| Cost and expenses |
$ | (87,836 | ) | $ | (81,851 | ) | $ | (75,185 | ) | $ | (91,682 | ) | $ | (336,555 | ) | |||||
| Operating income (loss) |
$ | 6,892 | $ | 4,535 | $ | 954 | $ | (4,308 | ) | $ | 8,075 | |||||||||
| Interest expense, net |
$ | (2,284 | ) | $ | (1,849 | ) | $ | (1,926 | ) | $ | (1,694 | ) | $ | (7,754 | ) | |||||
| Other |
$ | 152 | $ | 267 | $ | (59 | ) | $ | 172 | $ | 532 | |||||||||
| Income (loss) from continuing operations before income tax expense (benefit) |
$ | 4,760 | $ | 2,953 | $ | (1,031 | ) | $ | (5,830 | ) | $ | 854 | ||||||||
| Income tax expense (benefit) |
$ | 962 | $ | 354 | $ | (113 | ) | $ | (2,871 | ) | $ | (1,668 | ) | |||||||
| Income (loss) from continuing operations |
$ | 3,798 | $ | 2,599 | $ | (918 | ) | $ | (2,959 | ) | $ | 2,521 | ||||||||
| Discontinued operations, net of income tax benefit |
$ | 53 | $ | 275 | $ | 36 | $ | (262 | ) | $ | 102 | |||||||||
| Net income (loss) |
$ | 3,745 | $ | 2,324 | $ | (954 | ) | $ | (2,697 | ) | $ | 2,419 | ||||||||
| Basic earnings (loss) per share: |
||||||||||||||||||||
| Continuing operations |
$ | 0.16 | $ | 0.11 | $ | (0.04 | ) | $ | (0.12 | ) | 0.11 | |||||||||
| Discontinued operations |
(0.00 | ) | (0.01 | ) | (0.00 | ) | 0.01 | (0.01 | ) | |||||||||||
| Basic earnings (loss) per share |
$ | 0.16 | $ | 0.10 | $ | (0.04 | ) | $ | (0.11 | ) | $ | 0.10 | ||||||||
| Diluted earnings (loss) per share: |
||||||||||||||||||||
| Continuing operations |
$ | 0.16 | $ | 0.11 | $ | (0.04 | ) | $ | (0.12 | ) | $ | 0.11 | ||||||||
| Discontinued operations |
(0.00 | ) | (0.01 | ) | (0.00 | ) | (0.01 | ) | (0.01 | ) | ||||||||||
| Diluted earnings (loss) per share |
$ | 0.16 | $ | 0.10 | $ | (0.04 | ) | $ | (0.11 | ) | $ | 0.10 | ||||||||
During the fiscal quarter ended December 27, 2009 the Company recorded a loss on the impairment of long-lived and intangible assets of $8.3 million. Of the total loss on impairment recognized, $0.8 million was related to the impairment of long-lived assets at two company-owned Ruth’s Chris Steak House restaurants, three Mitchell’s Fish Market restaurants and one Mitchell’s Steakhouse restaurant, $0.2 million was related to the impairment of the Mitchell’s Fish Market and Mitchell’s Steakhouse trademarks, $5.1 million was related to the impairment of franchise rights for ten company-owned restaurants acquired in 2007 and $2.2 million was related to the impairment of goodwill.
F-29
Table of Contents
RUTH’S HOSPITALITY GROUP, INC. AND SUBSIDIARIES
Notes to Consolidated Financial Statements—(Continued)
(dollar amounts in thousands)
(17) Restructuring
As financial markets experienced great volatility in late 2008, management undertook a corporate restructuring to better support the new strategy of little to moderate company-owned restaurant growth.
The details of the restructuring charges are as follows:
| One-time termination benefits |
Lease Obligations |
Total restructuring |
||||||||||
| Accrued restructuring as of December 28, 2008 |
$ | 1,455 | $ | 4,978 | $ | 6,433 | ||||||
| Payments |
(1,449 | ) | (2,133 | ) | (3,582 | ) | ||||||
| Additional Accruals |
— | 417 | 417 | |||||||||
| Adjustments |
— | (377 | ) | (377 | ) | |||||||
| Accrued restructuring as of December 27, 2009 |
$ | 6 | $ | 2,885 | $ | 2,891 | ||||||
The Company has accrued lease obligations related to certain locations for which a lease was signed and the Company subsequently decided not to build. The accrual of $2.9 million is based on management’s estimate of the most likely outcome of the lease exit negotiations. However, it is reasonably possible that factors could change in the near term that would result in a change in estimate.
(18) Franchise Income
The Company currently has 66 Ruth’s Chris Steak House franchise locations, including 14 international locations. During the fourth quarter of fiscal 2009, the Company opened two franchise locations, Kennesaw, Georgia, and Carolina, Puerto Rico, and closed one franchise location, Aspen, Colorado. During fiscal 2009, the Company opened six franchise locations, Durham, North Carolina, Greenville, South Carolina, Kennesaw, Georgia, St. Louis, Missouri, Carolina, Puerto Rico, and Dubai, United Arab Emirates. No franchise locations were sold or purchased during fiscal 2009. Franchise income includes opening and development fees and income generated from existing franchise locations. The Company records franchise income separately in the condensed consolidated statements of income.
The following is a summary of franchise income:
| 13 Weeks Ended | 52 Weeks Ended | |||||||||||
| December 28, 2008 |
December 27, 2009 |
December 28, 2008 |
December 27, 2009 | |||||||||
| (unaudited) | (unaudited) | |||||||||||
| Franchise activity during the period: |
||||||||||||
| Opened |
1 | 2 | 7 | 6 | ||||||||
| Closed |
0 | 1 | 0 | 4 | ||||||||
| Franchise income: |
||||||||||||
| Income from existing franchise locations |
$ | 2,952 | $ | 2,758 | $ | 12,166 | $ | 10,108 | ||||
| Opening and development fee income |
50 | 250 | 538 | 425 | ||||||||
| Total franchise income: |
$ | 3,002 | $ | 3,008 | $ | 12,703 | $ | 10,533 | ||||
(19) Correction to Previously Reported Amounts
Certain corrections have been made for the reporting of the Company’s classification of sales discounts within the consolidated statements of income (loss). The consolidated statements of income (loss) for fiscal years
F-30
Table of Contents
RUTH’S HOSPITALITY GROUP, INC. AND SUBSIDIARIES
Notes to Consolidated Financial Statements—(Continued)
(dollar amounts in thousands)
2007 and 2008 have been revised to correct an immaterial error in the accounting for sales discounts, which should have been recorded as a reduction of sales instead of as operating expenses. When reviewing the previously reported annual consolidated statements of income (loss) in comparison to those reported in this Form 10-K, restaurant sales decreased by $8.5 million and $10.9 million, other operating income increased by $0.6 million and $0.7 million, restaurant operating expenses decreased by $7.3 million and $9.8 million, and general and administrative expenses decreased by $0.6 million and $0.4 million for the fiscal years ended December 30, 2007, and December 28, 2008, respectively. For all periods above, reclassifications had no impact on previously reported operating income (loss), net income (loss) or earnings (loss) per share amounts.
(20) Subsequent Event
On February 12, 2010, the Company completed its sale of $25,000,000 of the Company’s newly-created Series A 10% Convertible Preferred Stock (the “Preferred Stock”) to Bruckmann, Rosser, Sherrill & Co. III, L.P. and BRS Coinvestor III, L.P. (collectively, “BRS”) in a private placement transaction. On February 12, 2010, the Company also closed its rights offering and sold 10,147,451 shares of the Company’s common stock, at a subscription price of $2.50 per share, for an aggregate purchase price of approximately $25.4 million.
The Company applied approximately $44.3 million of the net proceeds from the rights offering and the private placement, together with cash on hand, to reduce its outstanding borrowings under its existing credit facility. Upon the application of those net proceeds, and the satisfaction of other agreed-upon conditions, a credit agreement amendment that the Company entered into with the lenders under its existing credit facility became effective.
The amendment to the credit agreement reduces the revolving loan commitment to $129.6 million, extends the scheduled maturity of the credit agreement by two years, to February 2015, and provides the Company with a less restrictive set of covenants. Specifically, the amendment provides for no financial covenant testing until the end of fiscal year 2010, provides less restrictive leverage and coverage covenants thereafter, and permanently eliminates the minimum EBITDA covenant. The amendment provides for higher interest rates under the credit facility, with interest rates based on the Company’s actual leverage ratio, ranging from 3.25% to 5.00% above the applicable LIBOR rate or, at the Company’s option, from 2.00% to 3.75% above the applicable base rate.
In connection with the closing of these transactions, the Company entered into a Registration Rights Agreement, dated February 12, 2010, with BRS (the “Registration Rights Agreement”). Under the Registration Rights Agreement, the Company has agreed to provide certain customary registration rights to BRS upon conversion of the Preferred Stock into common stock of the Company. The Company is required to file an initial shelf registration statement for the benefit of the Preferred Stock within nine months of the issuance of the Preferred Stock and such registration statement is required to be declared effective by the SEC prior to the first anniversary of the closing. In addition, following the first anniversary of the closing, BRS is entitled to three demand registration rights on Form S-3 and piggyback registration rights if the Company files a registration statement with respect to any shares of the Company’s common stock on the Company’s account or with respect to a public offering (subject to customary restrictions and exceptions). In addition, if the Company breaches certain of its obligations under the Registration Rights Agreement (including any of those related to the requirement to timely file registration statements and include the common stock issuable upon conversion of the Preferred Stock in any applicable registration statement), the dividend rate on the Preferred Stock will increase from 10% to 11% until the breach is cured.
The Company has evaluated subsequent events through the date the financial statements were issued.
F-31
Table of Contents
EXHIBITS
In reviewing the agreements included as exhibits to this report, please remember they are included to provide you with information regarding their terms and are not intended to provide any other factual or disclosure information about the Company, its subsidiaries or other parties to the agreements. The Agreements contain representations and warranties by each of the parties to the applicable agreement. These representations and warranties have been made solely for the benefit of the other parties to the applicable agreement and:
| • | should not in all instances be treated as categorical statements of fact, but rather as a way of allocating the risk to one of the parties if those statements prove to be inaccurate; |
| • | have been qualified by disclosures that were made to the other party in connection with the negotiation of the applicable agreement, which disclosures are not necessarily reflected in the agreement; |
| • | may apply standards of materiality in a way that is different from what may be viewed as material to you or other investors; and |
| • | were made only as of the date of the applicable agreement or such other date or dates as may be specified in the agreement and are subject to more recent developments. |
Accordingly, these representations and warranties may not describe the actual state of affairs as of the date they were made or at any other time. Additional information about the Company may be found elsewhere in this report and the Company’s other public files, which are available without charge through the SEC’s website at http://www.sec.gov.
| Exhibit |
Description | |
| 2.1 | Asset Purchase Agreement dated as of November 6, 2007, between the Company and Cameron Mitchell Restaurants, LLC with M. Cameron Mitchell and 1245 Properties, LLC as interveners (incorporated by reference to Exhibit 2.1 to the Company’s Form 10-K/A filed June 25, 2009). | |
| 2.2 | Letter Agreement dated February 15, 2008 for Amendments to the Asset Purchase Agreement dated as of November 6, 2008, between the Company and Cameron Mitchell Restaurants, LLC with M. Cameron Mitchell and 1245 Properties, LLC as interveners (incorporated by reference to Exhibit 10.2 to the Company’s current report on Form 8-K filed May 6, 2008). | |
| 3.1 | Certificate of Amended and Restated Certificate of Incorporation of Ruth’s Hospitality Group, Inc. | |
| 3.2 | Certificate of Designations of the Series A 10% Convertible Preferred Stock. | |
| 3.3 | Restated By-Laws of Ruth’s Chris Steak House, Inc. (incorporated by reference to Exhibit 3.2 of the Company’s Registration Statement on Form S-1 filed July 12, 2005). | |
| 4.1 | Securities Purchase Agreement dated December 22, 2009, among Ruth’s Hospitality Group, Inc., Bruckmann, Rosser Sherrill & Co. III, L.P. and BRS Coinvestor III, L.P. (incorporated by reference to Exhibit 4.1 to the Company’s current report on Form 8-K filed December 23, 2009). | |
| 4.2 | Registration Rights Agreement dated February 12, 2010, by and among Ruth’s Hospitality Group, Inc., Bruckmann, Rosser, Sherrill & Co. III, L.P. and BRS Coinvestor III, L.P. (incorporated by reference to Exhibit 4.1 to the Company’s current report on Form 8-K filed February 17, 2010). | |
| 4.3 | Voting Agreement dated December 22, 2009, by and among the Company, Bruckmann, Rosser, Sherrill & Co. III, L.P. and BRS Coinvestor III, L.P., Madison Dearborn Capital Partners III, L.P., Madison Dearborn Special Equity III, L.P. and Special Advisors Fund I, LLC (incorporated by reference to Exhibit 10.2 to the Company’s current report of Form 8-K filed December 23, 2009). | |
| 4.4 | Form of Voting Agreement among the Company, Bruckmann, Rosser, Sherrill & Co. III, L.P. and BRS Coinvestor III, L.P. and a schedule of certain stockholders of the Company signatory thereto (incorporated by reference to Exhibit 10.3 to the Company’s current report of Form 8-K filed December 23, 2009). | |
E-1
Table of Contents
| Exhibit |
Description | |
| 4.5 | Amended and Restated Registration Agreement dated December 22, 2009, by and among Ruth’s Hospitality Group, Inc. and Madison Dearborn Capital Partners III, L.P., Madison Dearborn Special Equity III, L.P. and Special Advisors Fund I, LLC (incorporated by reference to Exhibit 4.2 to the Company’s current report on Form 8-K filed December 23, 2009). | |
| 4.6 | Shareholders Agreement dated September 17, 1999 among the Company, Madison Dearborn Capital Partners III, L.P., Madison Dearborn Special Equity III, L.P., Special Advisors Fund I, LLC, First Union Investors, Inc., GS Mezzanine Partners, L.P., GS Messanine Partners Offshore and each of the stockholders of the Company identified as Investors therein (incorporated by reference to Exhibit 10.2 of the Company’s Registration Statement on Form S-1 filed April 25, 2005). | |
| 10.1 | Transaction and Merger Agreement dated as of July 16, 1999, among the Company, RUF Merger Corp., Madison Dearborn Capital Partners III, L.P., Madison Dearborn Special Equity III, L.P. and Special Advisors Fund I, LLC (incorporated by reference to the Company’s Registration Statement on Form S-1 filed April 25, 2005). | |
| 10.2 | License Agreement dated as of July 16, 1999, between Ruth U. Fertel and the Company (incorporated by reference to Exhibit 10.4 to the Company’s Registration Statement on Form S-1 filed April 25, 2005). | |
| 10.3* | 2005 Long-Term Equity Incentive Plan, as amended (incorporated by reference to Appendix A of the Company’s Definitive Proxy Statement filed April 7, 2008). | |
| 10.4* | Form of Stock Option Agreement under the Company’s 2005 Long-Term Equity Incentive Plan, as amended (incorporated by reference to Exhibit 10.22 of the Company’s Registration Statement on Form S-1 filed August 8, 2005). | |
| 10.5* | 2004 Restricted Stock Plan (incorporated by reference to Exhibit 10.14 of the Company’s Registration Statement on Form S-1 filed April 25, 2005). | |
| 10.6* | Amendment No. 1 to the Company’s 2004 Restricted Stock Plan (incorporated by reference to Exhibit 10.15 of the Company’s Registration Statement on Form S-1 filed June 7, 2005). | |
| 10.7* | Form of Restricted Stock Agreement (incorporated by reference to Exhibit 10.16 of the Company’s Registration Statement on Form S-1 filed April 25, 2005). | |
| 10.8* | 2000 Stock Option Plan (incorporated by reference to Exhibit 10.17 of the Company’s Registration Statement on Form S-1 filed April 25, 2005). | |
| 10.9* | Form of Stock Option Agreement under 2000 Stock Option Plan (incorporated by reference to Exhibit 10.18 of the Company’s Registration Statement on Form S-1 filed April 25, 2005). | |
| 10.10* | Amended and Restated Management Bonus Plan (incorporated by reference to Exhibit 10.1 of the Company’s current report on Form 8-K filed August 7, 2006). | |
| 10.11* | Deferred Compensation Plan of the Company (incorporated by reference to Exhibits 10.1 and 10.2 of the Company’s current report on Form 8-K filed November 2 2005). | |
| 10.12* | Deferred Compensation Plan of RCSH Management, Inc. (incorporated by reference to Exhibits 10.1 and 10.3 of the Company’s current report on Form 8-K filed November 2 2005). | |
| 10.13 | Asset Purchase Agreement dated as of April 24, 2006, by and among the Company, Thomas J. Moran, Jr., individually, and Prime Steak-Chicago, Inc., Prime Steak-Troy, LLC, Prime Steak-Jacksonville, LLC, Prime Steak-Northbrook, LLC, Prime Steak-Ponte Vedra, LLC, Prime Steak-Detroit, Inc., T.J. Moran and Associates, Inc., Prime Steak-Memphis, Inc. and Bekmet, Inc. and Capital City Restaurants, Inc., as Intervenor (incorporated by reference to Exhibit 10.1 of the Company’s report on Form 10-Q filed March 3, 2006). | |
E-2
Table of Contents
| Exhibit |
Description | |
| 10.14 | Purchase and Sale Agreement between the Company and Colonial Realty Limited Partnership dated December 19, 2006 (incorporated by reference to Exhibit 99.1 of the Company’s current report n Form 8-K filed December 22, 2006). | |
| 10.15 | Asset Purchase Agreement dated as of April 16, 2007, by and among the Company, Steven Queyrouze, RCSH Bellevue, L.L.C. and Anne Queyrouze (incorporated by reference to Exhibit 10.1 of the Company’s report on Form 10-Q filed May 9, 2007). | |
| 10.16 | Asset Purchase Agreement dated as of April 16, 2007, by and among the Company, Steven Queyrouze, Bayou Investors Limited Liability Company and Anne Queyrouze (incorporated by reference to Exhibit 10.2 of the Company’s report on Form 10-Q filed May 9, 2007). | |
| 10.17 | Asset Purchase Agreement dated as of April 16, 2007, by and among the Company, Steven Queyrouze, New N.O. Crescent City Investors, L.L.C. and Anne Queyrouze (incorporated by reference to Exhibit 10.3 of the Company’s report on Form 10-Q filed May 9, 2007). | |
| 10.18 | Multi-Site Sale Leaseback Purchase Agreement dated as August 1, 2008 among the Company, RCSH Operations, LLC, RCSH Operations, Inc. and RHG Kingfish, LLC and Sovereign Investment Company (incorporated by reference to Exhibit 10.1 of the Company’s current report on Form 8-K filed August 5, 2008). | |
| 10.19 | First Amended and Restated Credit Agreement dated as of February 19, 2008 by and among the Company, the Lenders listed therein, Wells Fargo Bank, N.A. as Administrative Agent, Bank of America, N.A. as Syndication Agent and Wachovia Bank, National Association and JPMorgan Chase Bank, N.A. as Co-Documentation Agents and Banc of America Securities LLC and Wells Fargo Bank, National Association as Co-Lead Arrangers (incorporated by reference to Exhibit 10.27 to the Company’s Form 10-K/A filed June 25, 2009). | |
| 10.20 | First Amendment dated February 26, 2009 to First Amended and Restated Credit Agreement dated as of February 19, 2008 with the financial institutions from time to time party thereto, Wells Fargo Bank, National Association as Administrative Agent and the guarantors listed on the signature pages thereto (incorporated by reference to Exhibit 10.28 to the Company’s Form 10-K/A filed June 25, 2009). | |
| 10.21 | Second Amendment to First Amended and Restated Credit Agreement and Waiver, dated December 22, 2009, by and among the Company, Wells Fargo Bank, National Association as Administrative Agent, and the lenders from time to time party thereto (incorporated by reference to Exhibit 10.1 of the Company’s current report on Form 8-K filed December 23, 2009). | |
| 10.22 | Terms of Employment/Letter of Understanding and Salary Continuation Agreement dated March 17, 2008 between the company and Robert M. Vincent (incorporated by reference to Exhibit 99.1 of the Company’s current report on Form 8-K filed March 21, 2008). | |
| 10.23 | Terms of Employment/Letter of Understanding and Salary Continuation Agreement dated August 1, 2008 between the company and Michael P. O’Donnell (incorporated by reference to Exhibit 99.1 of the Company’s current report on Form 8-K filed August 5, 2008). | |
| 10.24 | Separation Agreement dated May 23, 2008 between the company and Craig S. Miller (incorporated by reference to Exhibit 99.1 of the Company’s current report on Form 8-K filed May 30, 2008). | |
| 10.25 | Separation Agreement and General Release dated December 31, 2008 between the company and Thomas E. O’Keefe (incorporated by reference to Exhibit 10.1 of the Company’s current report on Form 8-K filed December 31, 2008). | |
| 10.26 | Separation Agreement and General Release dated January 31, 2010 between the company and Sarah C. Jackson (incorporated by reference to Exhibit 99.1 of the Company’s current report on Form 8-K filed February 2, 2010). | |
E-3
Table of Contents
| Exhibit |
Description | |
| 21.1 | Subsidiaries of the Company | |
| 23.1 | Consent of KPMG, LLP | |
| 31.1 | Certification of Chief Executive Officer pursuant to Section 302 of the Sarbanes-Oxley Act of 2002. | |
| 31.2 | Certification of Chief Financial Officer pursuant to Section 302 of the Sarbanes-Oxley Act of 2002. | |
| 32 | Section 906 of the Sarbanes-Oxley Act of 2002 Certifications
The certifications in this exhibit are being furnished solely to accompany this report pursuant to 18 U.S.C. § 1350, and are not being filed for purposes of Section 18 of the Securities Exchange Act of 1934, as amended, and are not to be incorporated by reference into any of the Company’s filings, whether made before or after the date hereof, regardless of any general incorporation language in such filing. | |
| 32.1 | Certification of Chief Executive Officer pursuant to Section 906 of the Sarbanes-Oxley Act of 2002. | |
| 32.2 | Certification of Chief Financial Officer pursuant to Section 906 of the Sarbanes-Oxley Act of 2002. | |
| * | Management contract or compensatory plan or arrangement. |
E-4