Attached files
| file | filename |
|---|---|
| EX-32.2 - EX-32.2 - Ruths Hospitality Group, Inc. | ruth-ex322_6.htm |
| EX-32.1 - EX-32.1 - Ruths Hospitality Group, Inc. | ruth-ex321_7.htm |
| EX-31.2 - EX-31.2 - Ruths Hospitality Group, Inc. | ruth-ex312_8.htm |
| EX-31.1 - EX-31.1 - Ruths Hospitality Group, Inc. | ruth-ex311_9.htm |
| EX-23.1 - EX-23.1 - Ruths Hospitality Group, Inc. | ruth-ex231_10.htm |
| EX-21.1 - EX-21.1 - Ruths Hospitality Group, Inc. | ruth-ex211_11.htm |
SECURITIES AND EXCHANGE COMMISSION
Washington, D.C. 20549
FORM 10-K
(Mark One)
|
☒ |
ANNUAL REPORT PURSUANT TO SECTION 13 OR 15(d) OF THE SECURITIES EXCHANGE ACT OF 1934 |
FOR THE FISCAL YEAR ENDED DECEMBER 31, 2017
or
|
☐ |
TRANSITION REPORT PURSUANT TO SECTION 13 OR 15(d) OF THE SECURITIES EXCHANGE ACT OF 1934 |
FOR THE TRANSITION PERIOD FROM TO
Commission File Number: 000-51485
Ruth’s Hospitality Group, Inc.
(Exact name of registrant as specified in its charter)
|
Delaware |
72-1060618 |
|
(State or other jurisdiction of incorporation or organization) |
(I.R.S. Employer Identification No.) |
|
|
|
|
1030 W. Canton Avenue, Suite 100, Winter Park, FL |
32789 |
|
(Address of principal executive offices) |
(Zip code) |
Registrant’s telephone number, including area code: (407) 333-7440
Securities Registered Pursuant to Section 12(b) of the Act:
Common stock, par value $0.01 per share
The NASDAQ Stock Market LLC
|
(Title of Class) |
|
(Name of exchange on which registered) |
Securities Registered Pursuant to Section 12(g) of the Act:
None
Indicate by check mark if the registrant is a well-known seasoned issuer, as defined in Rule 405 of the Securities Act. Yes ☐ No ☒
Indicate by check mark if the registrant is not required to file reports pursuant to Section 13 or Section 15(d) of the Act. Yes ☐ No ☒
Indicate by check mark whether the registrant: (1) has filed all reports required to be filed by Section 13 or 15(d) of the Securities Exchange Act of 1934 during the preceding 12 months (or for such shorter period that the registrant was required to file such reports), and (2) has been subject to such filing requirements for the past 90 days. Yes ☒ No ☐
Indicate by check mark whether the registrant has submitted electronically and posted on its corporate Web site, if any, every Interactive Data File required to be submitted and posted pursuant to Rule 405 of Regulation S-T (§232.405 of this chapter) during the preceding 12 months (or for such shorter period that the registrant was required to submit and post such files). ☒ Yes ☐ No
Indicate by check mark if disclosure of delinquent filers pursuant to Item 405 of Regulation S-K (§229.405 of this chapter) is not contained herein, and will not be contained, to the best of registrant’s knowledge, in definitive proxy or information statements incorporated by reference in Part III of this Form 10-K or any amendment to this Form 10-K. ☒
Indicate by check mark whether the registrant is a large accelerated filer, an accelerated filer, a non-accelerated filer, a smaller reporting company, or an emerging growth company. See the definitions of “large accelerated filer,” “accelerated filer,” “smaller reporting company,” and “emerging growth company” in Rule 12b-2 of the Exchange Act (check one):
|
☐ |
Large accelerated filer |
☒ |
Accelerated filer |
☐ |
Non-accelerated filer (do not check if a smaller reporting company) |
☐ |
Smaller reporting company |
☐ |
Emerging growth company |
If an emerging growth company, indicate by check mark if the registrant has elected not to use the extended transition period for complying with accounting standards provided pursuant to Section 13(a) of the Exchange Act. ☐
Indicate by check mark whether the registrant is a shell company (as defined in Rule 12b-2 of the Act). Yes ☐ No ☒
As of June 25, 2017, the last day of the registrant’s most recently completed fiscal second quarter, the aggregate market value of the registrant’s outstanding common stock, par value $0.01 per share, held by non-affiliates was $664,369,924.
The number of shares outstanding of the registrant’s common stock as of March 1, 2018, was 30,866,496, which includes 1,215,296 shares of unvested restricted stock.
DOCUMENTS INCORPORATED BY REFERENCE
The information required by Part III of Annual Report on Form 10-K, to the extent not set forth herein, is incorporated herein by reference to the registrant’s Proxy Statement for the 2018 Annual Meeting of Stockholders, to be filed with the Securities and Exchange Commission pursuant to Regulation 14A not later than 120 days after the close of the registrant’s fiscal year.
|
|
|
|
|
Page |
|
|
|
|
|
|
|
|
|
|
|
|
|
Item 1. |
|
|
1 |
|
|
Item 1A. |
|
|
7 |
|
|
Item 1B. |
|
|
14 |
|
|
Item 2. |
|
|
14 |
|
|
Item 3. |
|
|
17 |
|
|
Item 4. |
|
|
17 |
|
|
|
|
|
|
|
|
|
|
|
|
|
|
|
|
|
|
|
|
Item 5. |
|
|
18 |
|
|
Item 6. |
|
|
21 |
|
|
Item 7. |
|
Management’s Discussion and Analysis of Results of Operations and Financial Condition |
|
23 |
|
Item 7A. |
|
|
35 |
|
|
Item 8. |
|
|
35 |
|
|
Item 9. |
|
Changes in and Disagreements with Accountants on Accounting and Financial Disclosure |
|
36 |
|
Item 9A. |
|
|
36 |
|
|
Item 9B. |
|
|
38 |
|
|
|
|
|
|
|
|
|
|
|
|
|
|
|
|
|
|
|
|
Item 10. |
|
|
39 |
|
|
Item 11. |
|
|
39 |
|
|
Item 12. |
|
Security Ownership of Certain Beneficial Owners and Management and Related Stockholder Matters |
|
39 |
|
Item 13. |
|
Certain Relationships and Related Transactions, and Director Independence |
|
39 |
|
Item 14. |
|
|
39 |
|
|
|
|
|
|
|
|
|
|
|
|
|
|
|
|
|
|
|
|
Item 15. |
|
|
40 |
|
|
Item 16. |
|
|
40 |
|
|
|
|
|
|
|
|
|
43 |
|||
This Annual Report on Form 10-K contains “forward-looking statements” that reflect, when made, the Company’s expectations or beliefs concerning future events that involve risks and uncertainties. Forward-looking statements frequently are identified by the words “believe,” “anticipate,” “expect,” “estimate,” “intend,” “project,” “targeting,” “will be,” “will continue,” “will likely result,” or other similar words and phrases. Similarly, statements herein that describe the Company’s objectives, plans or goals, including with respect to new restaurant openings, capital expenditures and the impact of healthcare inflation, tax reform legislation, also are forward-looking statements. Actual results could differ materially from those projected, implied or anticipated by the Company’s forward-looking statements. Some of the factors that could cause actual results to differ include: reductions in the availability of, or increases in the cost of, USDA Prime grade beef, fish and other food items; changes in economic conditions and general trends; the loss of key management personnel; the effect of market volatility on the Company’s stock price; health concerns about beef or other food products; the effect of competition in the restaurant industry; changes in consumer preferences or discretionary spending; labor shortages or increases in labor costs; the impact of federal, state or local government regulations relating to income taxes, unclaimed property, Company employees, the sale or preparation of food, the sale of alcoholic beverages and the opening of new restaurants; harmful actions taken by the Company’s franchisees; a material failure, interruption or security breach of the Company’s information technology network; the Company’s indemnification obligations in connection with its sale of the Mitchell’s Restaurants; the inability to integrate the Hawaiian acquisition into the Company’s business and failure to achieve the cost savings and other benefits the Company expects to be able to realize in the Hawaiian operations; the Company’s ability to protect its name and logo and other proprietary information; an impairment in the financial statement carrying value of our goodwill, other intangible assets or property; the impact of litigation; the restrictions imposed by the Company’s credit agreement; and changes in, or the discontinuation of, the Company’s quarterly cash dividend payments or share repurchase program. For a discussion of these and other risks and uncertainties that could cause actual results to differ from those contained in the forward-looking statements, see “Risk Factors” in this Annual Report on Form 10-K. All forward-looking statements are qualified in their entirety by this cautionary statement, and the Company undertakes no obligation to revise or update this Annual Report on Form 10-K to reflect events or circumstances after the date hereof. You should not assume that material events subsequent to the date of this Annual Report on Form 10-K have not occurred.
Unless the context otherwise indicates, all references in this report to the “Company,” “Ruth’s,” “we,” “us”, “our” or similar words are to Ruth’s Hospitality Group, Inc. and its subsidiaries.
Introduction
Ruth’s Hospitality Group, Inc. develops and operates fine dining restaurants under the trade name Ruth’s Chris Steak House. As of December 31, 2017, there were 155 Ruth’s Chris Steak House restaurants, including 77 Company-owned restaurants, two restaurants operating under contractual agreements and 76 franchisee-owned restaurants, including 21 international franchisee-owned restaurants in Aruba, Canada, China, Hong Kong, Indonesia, Japan, Mexico, Panama, Singapore, Taiwan and the United Arab Emirates.
On December 12, 2017, we completed the acquisition of substantially all of the assets of six franchisee-owned Ruth’s Chris Steak House restaurants located in Hawaii (the “Hawaiian Restaurants”) for a cash purchase price of $35.4 million. The results of operations, financial position and cash flows of the Hawaiian Restaurants are included in our consolidated financial statements as of the date of the acquisition. For additional information, see Note 3 of the consolidated financial statements.
The Company previously operated eighteen Mitchell’s Fish Markets and three Mitchell’s/Cameron’s Steakhouse restaurants (the Mitchell’s Restaurants), located primarily in the Midwest and Florida. On January 21, 2015, the Company sold the Mitchell’s Restaurants to a third party. For financial reporting purposes, the Mitchell’s Restaurants are classified as discontinued operations for all periods presented.
The Company has a 52/53-week fiscal year ending the last Sunday in December. The 2017 fiscal year ended December 31, 2017, the 2016 fiscal year ended December 25, 2016, and the 2015 fiscal year ended December 27, 2015. Fiscal year 2017 had 53 weeks, while fiscal years 2016 and 2015 had 52 weeks.
The following description of the Company’s business should be read in conjunction with the information in Management’s Discussion and Analysis of Results of Operations of Financial Condition in Item 7, Management’s Discussion and Analysis of Results of Operations and Financial Condition of this Annual Report on Form 10-K and the consolidated financial statements included in this Annual Report on Form 10-K.
Background
Ruth’s Hospitality Group, Inc. is a Delaware corporation formerly known as Ruth’s Chris Steak House, Inc. The Company was founded in 1965 when Ruth Fertel mortgaged her home for $22 thousand to purchase “Chris Steak House,” a 60-seat restaurant located near the New Orleans Fair Grounds racetrack. After a fire destroyed the original restaurant, Ruth relocated her restaurant to a new 160-seat facility nearby. As the terms of the original purchase prevented the use of the “Chris Steak House” name at a new restaurant, Ruth added her name to that of the original restaurant—thus creating the “Ruth’s Chris Steak House” brand.
The Company’s expansion began in 1972, when Ruth opened a second restaurant in Metairie, a suburb of New Orleans. In 1976, the first franchisee-owned Ruth’s Chris Steak House opened in Baton Rouge, Louisiana. In 2005, the Company and certain selling shareholders completed an initial public offering of the Company’s common stock, which is currently listed on the Nasdaq Global Select Market under the ticker symbol “RUTH”.
|
• |
In December 2017, the Company acquired the Hawaiian Restaurants from one of its franchise partners. |
|
• |
In 2017, the Company opened three new Ruth’s Chris Steak House restaurants in Waltham, MA, Cleveland, OH and Denver, CO and one restaurant operating under a contractual agreement in Tulsa, OK. |
|
• |
In 2017, franchisees opened two new restaurants in Chengdu, China and Kauai, HI. The Kauai, HI restaurant was acquired by the Company in December 2017. |
|
• |
The Company currently expects to open two additional Ruth’s Chris Steak House restaurants during 2018. The Company expects that franchisees will open two new Ruth’s Chris Steak House restaurants during 2018. |
Ruth’s Chris Steak House
With 155 restaurants as of December 31, 2017, Ruth’s Chris Steak House is one of the largest upscale steakhouse companies in the world. The menu features a broad selection of high-quality USDA Prime and Choice grade steaks and other premium offerings served in Ruth’s Chris’ signature fashion—“sizzling”—complemented by other traditional menu items inspired by its New Orleans heritage. Ruth’s Chris complements its distinctive food offerings with an award-winning wine list.
1
The Ruth’s Chris brand reflects its 51-year commitment to the core values instilled by its founder, Ruth Fertel, of caring for guests by delivering the highest quality food, beverages and genuine hospitality in a warm and inviting atmosphere.
Mitchell’s Restaurants
The Company acquired the Mitchell’s Restaurants in 2008. Mitchell’s Fish Market was an eighteen-restaurant upscale seafood concept and Mitchell’s/Cameron’s Steakhouse was a modern American steakhouse concept.
In November 2014, the Company and Landry’s, Inc. and Mitchell’s Entertainment, Inc., an affiliate of Landry’s Inc. (together with Landry’s Inc., Landry’s), entered into an asset purchase agreement (the Agreement). Pursuant to the Agreement, the Company agreed to sell the Mitchell’s Restaurants and related assets to Landry’s for $10 million. The sale of the Mitchell’s Restaurants closed on January 21, 2015. The assets sold consisted primarily of leasehold interests, leasehold improvements, restaurant equipment and furnishings, inventory, and related intangible assets, including brand names and trademarks associated with the 21 Mitchell’s Restaurants. Under the terms of the Agreement, Landry’s assumed the Mitchell’s Restaurants’ facility lease obligations and the Company reimbursed Landry’s for gift cards sold prior to the closing date and used at the Mitchell’s Restaurants during the eighteen months following the closing date. Landry’s offered employment to substantially all of the employees of the Mitchell’s Restaurants.
Strengths
The Company believes that the key strengths of its business model are the following:
Premier Upscale Steakhouse Brand
The Ruth’s Chris Steak House brand is one of the strongest in the upscale steakhouse segment of the restaurant industry, with high levels of brand awareness. The Company has been recognized for its award-winning core wine list, for which a majority of its Company-owned restaurants received “Awards of Excellence” from Wine Spectator magazine.
Appealing Dining Experience
At Ruth’s Chris restaurants, the Company seeks to exceed guests’ expectations by offering high-quality food with warm, friendly service. The Company’s entire restaurant staff is dedicated to ensuring that guests enjoy a superior dining experience. The Company’s team-based approach to table service is designed to enhance the frequency of guest contact and speed of service without intruding on the guest experience.
Strategy
The Company’s strategy is to deliver a total return to shareholders by maintaining a healthy core business, growing with a disciplined investment approach and returning excess capital to shareholders. The Company strives to maintain a healthy core business by growing sales through traffic, managing operating margins and leveraging infrastructure. The Company is committed to disciplined growth in markets with attractive sales attributes and solid financial returns. The Company believes that its franchisee program is a point of competitive differentiation and looks to grow its franchisee-owned restaurant locations as well. The Company also will consider acquiring franchisee-owned restaurants at terms that it believes are beneficial to both the Company and the franchisee.
Improve Sales/Profitability
The Company strives to improve sales and profitability by focusing on:
|
• |
Ensuring consistency of food quality through more streamlined preparation and presentation; |
|
• |
Expanding its brand appeal through continued menu innovation and facility remodels; |
|
• |
Increasing brand awareness through enhanced media advertising at the national and local levels; |
|
• |
Enhancing and/or developing innovative marketing programs through its website (e.g., www.ruthschris.com), social media, digital media and email communication; and |
|
• |
Creating and/or growing revenue opportunities via Ruth’s Catering, Private Dining, HD Satellite Programs, the sale of Gift Cards and opening for lunch in selected markets. |
2
Expand Relationships with New and Existing Franchisees and Others
The Company intends to grow its franchising business by developing relationships with a limited number of new franchisees and by expanding the rights of existing franchisees to open new restaurants. The Company believes that building relationships with quality franchisees is a cost-effective way to grow and strengthen the Ruth’s Chris brand and generate additional revenues. The Company intends to continue to focus on providing operational guidance to its franchisees, including the sharing of “best practices” from Company-owned Ruth’s Chris restaurants.
In fiscal year 2017, franchisees opened two new restaurants in Chengdu, China and Kauai, HI. In fiscal year 2016, franchisees opened two new restaurants in Jakarta, Indonesia and Greenville, SC. In fiscal year 2015, franchisees opened three new restaurants in Ann Arbor, MI, Charleston, SC, and San Antonio, TX. Franchisees are expected to open two new restaurants by the end of fiscal year 2018.
The Company and its franchise and licensing partners will have opened or relocated 18 new Ruth’s Chris Steak Houses worldwide during the three year period ended December 2017.
Menu
The Ruth’s Chris menu features a broad selection of high-quality USDA Prime grade steaks and other premium offerings served in Ruth’s Chris signature fashion—“sizzling” on a 500 degree plate and topped with butter and fresh parsley—complemented by other classic American steakhouse menu items. USDA Prime is the highest meat grade level, which refers to the superior quality and evenly distributed marbling that enhances the flavor of the steak. The Ruth’s Chris menu also includes premium quality lamb chops, fish, shrimp, crab, chicken and lobster. Dinner entrées are generally priced from $32 to $99. Ruth’s Chris is predominantly open dinner hours only with a limited number of restaurants open for lunch. The lunch menu offers entrées generally ranging in price from $13 to $29. The blended guest check average at Ruth’s Chris was approximately $82 during fiscal year 2017. While the Ruth’s Chris core menu is similar at all of its restaurants, the Company seasonally introduces new items such as limited time and prix fixe offerings that allow it to give its guests additional choices while taking advantage of fresh sourcing and advantageous cost opportunities.
The Company’s Ruth’s Chris restaurants offer ten to thirteen standard appetizer items, including New Orleans-style barbequed shrimp, mushrooms stuffed with crabmeat, spicy shrimp, chilled seafood tower and osso bucco ravioli, as well as six to eight different salads. They also offer a variety of potatoes and vegetables as side dishes. For dessert, crème brûlée, white chocolate bread pudding, chocolate duo, cheesecake, fresh seasonal berries with sweet cream and other selections are available.
The Company’s wine list features bottles typically ranging in price from $46 to over $1,000. Individual restaurants may supplement their 250-bottle core wine list with approximately 20 additional selections that reflect local market tastes. Most of the Company’s Ruth’s Chris restaurants also offer approximately 35 wines-by-the-glass, 13-16 handcrafted cocktails and numerous beers, premium liquors and alcoholic dessert drinks. Wine sales account for approximately 53% of the total beverage sales.
Restaurant Operations and Management
The Ruth’s Chris President and Vice President of Operations have primary responsibility for managing Company-owned restaurants and participates in analyzing restaurant-level performance and strategic planning. The Company has ten regional vice presidents that oversee restaurant operations at Company-owned restaurants, one vice president to whom the regional vice presidents report and one vice president that has oversight responsibility for franchisee-owned restaurants. In addition, restaurant education and training is overseen by a regional staff dedicated to the ongoing training and development of customer service employees and kitchen staff.
A typical Company-owned restaurant employs five managers, including a general manager, two front-of-the-house managers, an executive chef and a sous chef. The Company-owned restaurants also typically have approximately 62 hourly employees.
Purchasing
The Company’s ability to maintain consistent quality throughout its restaurants depends in part upon its ability to acquire food and other supplies from reliable sources in accordance with its specifications. Purchasing at the restaurant level is directed primarily by the executive chef, who is trained in the Company’s purchasing philosophy and specifications, and who works with regional and corporate managers to ensure consistent sourcing of fish, produce and other supplies.
3
During fiscal year 2017, the Company purchased substantially all of the beef it used in Company-owned Ruth’s Chris restaurants from two vendors, Sysco Specialty Meat Group (a subsidiary of Sysco) and Stock Yards Packing (a subsidiary of US Foods). Each vendor supplied about half of the Company’s beef requirements. In addition, the Company has a distribution arrangement with a national food and restaurant supply distributor, Distribution Market Advantage, Inc. (DMA), which purchases products for the Company from various suppliers and through which all of the Company-owned Ruth’s Chris Steak House restaurants receive a significant portion of their food supplies.
Quality Control
The Company strives to maintain quality and consistency in its Company-owned restaurants through careful training and supervision of personnel and standards established for food and beverage preparation, maintenance of facilities and conduct of personnel. The primary goal of the Company’s training and supervision programs is to ensure that its employees display the characteristics of its brand and values that distinguish it from its competitors. Restaurant managers in Company-owned restaurants must complete a training program that is typically seven to eight weeks long, during which they are instructed in multiple areas of restaurant management, including food quality and preparation, guest service, alcoholic beverage service, liquor regulation compliance and employee relations. Restaurant managers also receive operations manuals relating to food and beverage preparation and restaurant operations. Restaurant managers are certified by the National Restaurant Association Educational Foundation for food safety.
In addition to our internal quality control measures, the Ruth’s Chris Steak House restaurants also employ an independent third-party food safety firm to ensure proper training, food safety and the achievement of the highest standards for cleanliness throughout the restaurant through routine quarterly unannounced inspections. The Company instructs chefs and assistants on safety, sanitation, housekeeping, repair and maintenance, product and service specifications, ordering and receiving food products and quality assurance. At the Ruth’s Chris restaurants, the executive chef, together with the restaurant managers, oversees a line check system of quality control and must complete a quality assurance checklist verifying the flavor, presentation and proper temperature of the food and beverages.
Marketing and Promotions
The goals of the Company’s marketing efforts are to increase restaurant sales by attracting new guests, increasing the frequency of visits by current guests, enhancing the guest experience, driving innovation, improving brand recognition in new markets or markets where it intends to open a restaurant and to communicate the overall uniqueness, value and quality exemplified by our restaurants. The Company uses multiple media channels to accomplish these goals and complements its national advertising with targeted local media such as print, digital media, search engine marketing, radio and outdoor billboards.
Advertising
In fiscal year 2017, the Company spent $12.7 million, or 3.1% of its revenues, in total marketing and advertising expenditures, which included spending on national media, consisting primarily of paid search, online advertising, online initiatives, traditional public relations and consumer research. During fiscal year 2017, the Company continued to optimize its online marketing efforts, using a variety of tactics. The Company’s online strategy also included an emphasis on continued website improvement and targeted emails with special offers and announcements, as well as emails regarding seasonal specials, holiday offers and personalized birthday and anniversary invitations. In the fourth quarter of fiscal year 2017, the Company invested in paid search, digital advertising and paid social media advertising. In fiscal year 2017, Ruth’s Chris Steak House continued its participation in co-branded campaign with American Express Membership Rewards program. Many of the Company’s restaurants also schedule events to strengthen community ties and increase local market presence. The Company’s franchisees also conduct their own local media and advertising plans.
Gift Cards
The Company sells Ruth’s Chris gift cards at most of its Ruth’s Chris Steak House restaurants, including franchises, on its website and through its toll-free number. Ruth’s Chris patrons frequently purchase gift cards for holidays, including Christmas, Hanukkah, Valentine’s Day, Mothers’ Day and Fathers’ Day, and other special occasions. In the fourth quarter of fiscal year 2016, Ruth’s Chris entered into a distribution agreement where Ruth’s Chris gift cards are sold in third-party retail outlets. In 2013, Ruth’s Chris began offering e-gift cards to purchasers on its e-commerce gift card website. The e-gift card is emailed directly to the recipient and is redeemable in the same manner as a plastic gift card. Offering gift cards at third-party retailers and e-gift cards gives Ruth’s Chris the opportunity to maximize last-minute gift-giving and address its patrons’ requests for convenient, immediate purchases. In fiscal year 2017, Company and franchise sales of Ruth’s gift cards aggregated approximately $65.4 million system-wide. Ruth’s Chris gift cards are redeemable at both Company and franchisee owned Ruth’s Chris restaurants.
4
Franchise Program and Relationship
Under the Company’s franchise program, the Company offers certain services and licensing rights to the franchisee to help maintain consistency in system-wide operations. The Company’s services include training of personnel, construction assistance, providing the new franchisee with standardized operating procedures and manuals, business and financial forms, consulting with the new franchisee on purchasing and supplies and performing supervisory quality control services. The Company conducts reviews of its franchisee-owned restaurants on an ongoing basis in order to ensure compliance with its standards.
As of December 31, 2017, the Company’s 76 franchisee-owned Ruth’s Chris restaurants are owned by 30 franchisees with the three largest franchisees owning 32 restaurants in total. Currently, franchisees have agreed to open two additional Ruth’s Chris restaurants, which are expected to open by the end of fiscal year 2018.
Under the Company’s current franchise program, each franchise arrangement consists of a development agreement, if multiple restaurants are to be developed, with a separate franchise agreement executed for each restaurant. The Company’s current form of development agreement grants exclusive rights to a franchisee to develop a minimum number of restaurants in a defined area, typically during a three-to-five-year period. Individual franchise agreements govern the operation of each restaurant opened and have a 20-year term with two renewal options each for additional ten-year terms if certain conditions are met. The Company’s current form of franchise agreement requires franchisees to pay a 5% royalty on gross revenues plus up to a 1% advertising fee applied to national advertising expenditures.
Under the Company’s current form of development agreement, and unless agreed otherwise, the Company collects a $50 thousand development fee, which is credited toward the $150 thousand franchise fee, for each restaurant the franchisee has rights to develop. Under the Company’s current form of the franchise agreement, it collects up to $150 thousand of the full franchise fee at the time of executing the franchise agreement for each restaurant. If one restaurant is to be developed, a single unit franchise agreement is executed and the $150 thousand franchise fee is collected at signing.
Information Systems and Restaurant Reporting
All of the Company’s restaurants use computerized point-of-sale systems, which are designed to promote operating efficiency, provide corporate management timely access to financial and marketing data and reduce restaurant and corporate administrative time and expense. These systems record each order and print the food requests in the kitchen for the cooks to prepare. The data captured for use by operations and corporate management includes gross sales amounts, cash and credit card receipts and quantities of each menu item sold. Sales and receipts information is generally transmitted to the corporate office daily.
The Company’s corporate systems provide management with operating reports that show Company-owned restaurant performance comparisons with budget and prior year results. These systems allow the Company to monitor Company-owned restaurant sales, food and beverage costs, labor expense and other restaurant trends on a regular basis.
Service Marks
The Company has registered the main service marks “Ruth’s Chris” and its “Ruth’s Chris Steak House, U.S. Prime & Design” logo, as well as other service marks used by its restaurants, with the United States Patent and Trademark Office and in the foreign countries in which its restaurants operate. The Company has also registered in other foreign countries in anticipation of new store openings within those countries. The Company is not aware of any infringing uses that could materially affect its business. The Company believes that its service marks are valuable to the operation of its restaurants and are important to its marketing strategy.
Seasonality
The Company’s business is subject to seasonal fluctuations. Historically, the percentage of its annual revenues earned during the first and fourth fiscal quarters have been higher due, in large part, to increased restaurant sales during the year-end holiday season and the popularity of dining out in the fall and winter months.
5
Employees
As of December 31, 2017, the Company employed 4,915 persons, of whom 445 were salaried and 4,470 were hourly personnel, who were employed in the positions set forth in the table below. None of the Company’s employees are covered by a collective bargaining agreement.
|
Functional Area |
|
Number of Employees |
|
|
|
Senior Officers / Corporate VPs / Operations VPs |
|
|
28 |
|
|
General Managers |
|
|
71 |
|
|
Managers |
|
|
192 |
|
|
Regional Corporate Chefs / Executive Chefs |
|
|
69 |
|
|
Sous Chefs |
|
|
53 |
|
|
Non-Salaried Restaurant Staff |
|
|
4,433 |
|
|
Corporate Salaried |
|
|
50 |
|
|
Corporate Non-salaried |
|
|
19 |
|
|
Total number of employees |
|
|
4,915 |
|
Financial Information about Segments
The Company-owned Ruth’s Chris Steak House restaurants in North America are managed as an operating segment. The Ruth’s Chris restaurants operate within the full-service dining industry, providing similar products to similar customers. The franchise operations are also considered to be an operating segment. Financial information concerning the Company’s segments for financial reporting purposes appears in Note 18 of the consolidated financial statements.
Government Regulation
The Company is subject to extensive federal, state and local government regulation, including regulations relating to public health and safety, zoning and fire codes and the sale of alcoholic beverages and food. The Company maintains the necessary restaurant, alcoholic beverage and retail licenses, permits and approvals. Federal and state laws govern the Company’s relationship with its employees, including laws relating to minimum wage requirements, overtime, tips, tip credits and working conditions. A significant number of the Company’s hourly employees are paid at rates related to the federal or state minimum wage. During 2017, governmental entities acted to increase minimum wage rates in several jurisdictions wherein Company-owned restaurants are located. Additionally, the federal government may act to increase the U.S. federal minimum wage rate.
The offer and sale of franchises are subject to regulation by the U.S. Federal Trade Commission (FTC) and many states. The FTC requires that the Company furnish to prospective franchisees a franchise disclosure document containing prescribed information. A number of states also regulate the sale of franchises and require state registration of franchise offerings and the delivery of a franchise disclosure document to prospective franchisees. The Company’s noncompliance could result in governmental enforcement actions seeking a civil or criminal penalty, rescission of a franchise, and loss of its ability to offer and sell franchises in a state, or a private lawsuit seeking rescission, damages and legal fees.
The Company is subject to laws and regulations relating to the preparation and sale of food, including regulations regarding product safety, nutritional content and menu labeling. The Company is, or will become, subject to laws and regulations requiring disclosure of calorie, fat, trans fat, salt and allergen content. The Patient Protection and Affordable Care Act of 2010 (ACA) requires restaurant companies, such as the Company, to disclose calorie information on their menus beginning in May 2018. The Food and Drug Administration has rules to implement this provision that would require restaurants to post the number of calories for most items on menus or menu boards and to make available more detailed nutrition information upon request. A number of states, counties and cities have also enacted menu labeling laws requiring restaurant companies, such as the Company, to disclose certain nutrition information on their menus, or have enacted legislation restricting the use of certain types of ingredients in restaurants. Although the ACA is intended to preempt conflicting state and local laws regarding nutrition labeling, the Company will be subject to a patchwork of state and local laws and regulations regarding nutritional content disclosure requirements until the Company is required to comply with the federal law. Many of the current requirements are inconsistent or are interpreted differently from one jurisdiction to another. The effect of such labeling requirements on consumer choices, if any, is unclear at this time.
6
The Company maintains an employee benefits program that provides self-insured and insured coverage to employees that meet the applicable requirements under the program. Employees can elect to enroll dependents that meet eligibility criteria. Coverage includes health, dental, vision, short- and long-term disability, life insurance and other voluntary ancillary benefits. Employees share in the cost of other coverage at varying levels. The Company has historically funded a majority of the cost of employee health benefits. The ACA requires that employers offer health care coverage that is qualified and affordable. Coverage must be offered to all “full-time” employees, as defined by the ACA. The Company routinely reviews its health benefit plans to assure conformity with the ACA. The hours of service eligibility criteria the Company requires for health benefits are lower than required under the ACA. Approximately 60% of eligible employees elect to participate in the Company’s health benefit plans.
Competition
The restaurant business is highly competitive and highly fragmented, and the number, size and strength of the Company’s competitors vary widely by region. The Company believes that restaurant competition is based on, among other things, quality of food products, customer service, reputation, restaurant location, atmosphere, name recognition and price. The Company’s restaurants compete with a number of upscale steakhouses and upscale casual seafood restaurants within their markets, both locally owned restaurants and restaurants within regional or national chains. The principal upscale steakhouses with which the Company competes are Fleming’s, The Capital Grille, Smith & Wollensky, The Palm, Del Frisco’s Double Eagle Steakhouse, Fogo de Chão, Morton’s The Steakhouse, Eddie V’s and other local fine dining restaurants. The Company’s competitors may be better established in certain of the Company’s existing markets and/or markets into which the Company intends to expand.
Available Information
The Company maintains a website on the Internet at www.rhgi.com. The Company makes available free of charge, through the investor relations section of its website, its Annual Reports on Form 10-K, Quarterly Reports on Form 10-Q, Current Reports on Form 8-K and amendments to those reports electronically filed or furnished pursuant to Section 13(a) or 15(d) of the Securities Exchange Act of 1934, as amended (the “Exchange Act”). Such information is available as soon as reasonably practicable after it files such reports with the SEC. Additionally, the Company’s Code of Ethics may be accessed within the Investor Relations section of its website. Information found on the Company’s website is not part of this Annual Report on Form 10-K or any other report filed with the SEC.
In addition to the other information in this Annual Report on Form 10-K, the following risk factors should be considered carefully in evaluating the Company and its business. Additional risks and uncertainties not presently known to us or that the Company currently deems immaterial may also impair its business operations. If any of these certain risks and uncertainties were to actually occur, the Company’s business, financial condition or results of operations could be materially adversely affected. In such case, the trading price of the Company’s common stock could decline and its investors may lose all or part of their investment. These risks and uncertainties include the following:
We may not be able to compete successfully with other restaurants, which could reduce revenues.
The restaurant industry is intensely competitive with respect to price, service, location, food quality, atmosphere and overall dining experience. Our competitors include a large and diverse group of well-recognized upscale steakhouse and upscale casual restaurant chains, including steakhouse and seafood chains as well as restaurants owned by independent local operators. Some of our competitors have substantially greater financial, marketing and other resources, and may be better established in the markets where our restaurants are or may be located. If we cannot compete effectively in one or more of our markets, we may be unable to maintain recent levels of comparable restaurant sales growth and/or may be required to close existing restaurants.
Economic downturns may adversely impact consumer spending patterns.
Economic downturns could negatively impact consumer spending patterns. Any decrease in consumer spending patterns may result in a decline in our operating performance. Economic downturns may reduce guest traffic and require us to lower our prices, which reduces our revenues and operating income, which may adversely affect the market price for our common stock. In addition, some of our restaurants are located in areas that we consider tourist or vacation destinations. In those locations, we depend in large part on vacation travelers to frequent our Ruth’s Chris Steak House restaurants, and such destinations typically experience a reduction in visitors during economic downturns, thereby reducing the potential guests that could visit our restaurants. This could have a material adverse impact on our results of operations and growth strategy.
7
Negative publicity surrounding our brand or the consumption of beef generally, or shifts in consumer tastes, could reduce sales in one or more of our restaurants and make our brand less valuable.
Our success depends, in large part, upon the reputation of our brand. Negative publicity resulting from poor food quality, illness, injury or other health concerns, or operating problems including disappointing customer experiences related to one or more restaurants, could make our restaurants less appealing to consumers. Further, the influence of social media could make it more difficult for us to respond to negative publicity in a timely or effective manner. Consumers value readily available information and often act on such information without further investigation and without regard to its accuracy. The harm may be immediate without affording us the opportunity for redress or correction. In addition, any shifts in consumer preferences away from the kinds of food we offer, particularly beef, whether because of dietary or other health concerns or otherwise, would make our restaurants less appealing and adversely affect revenues. The ACA will require our restaurants to disclose calorie information on menus in the future. While we cannot predict the changes in guest behavior resulting from the implementation of this portion of the ACA, it could have an adverse effect on our revenues and results of operations.
Food safety and food-borne illness concerns throughout the supply chain may have an adverse effect on our business.
Food safety is a top priority, and we dedicate substantial resources to ensuring that our customers enjoy safe, quality food products. However, food safety risks are common throughout the restaurant industry and cannot be eliminated. Food safety issues could be caused by food suppliers, distributors or franchisees and, as a result, be out of our control. In addition, regardless of the source or cause, any report of food-borne illness such as E. coli, norovirus, hepatitis A, trichinosis or salmonella, and other food safety issues including food tampering or contamination, at one of our restaurants could adversely affect the reputation of our brand and have a negative impact on our sales. Even instances of food-borne illness, food tampering or other food contamination occurring solely at restaurants of our competitors could result in negative publicity about the food service industry generally and adversely impact our sales. The occurrence of food-borne illnesses or food safety issues could also adversely affect the price and availability of affected ingredients, resulting in higher costs and lower margins.
Increases in the prices of, or reductions in the availability of, any of our core food products could reduce our operating margins and revenues.
We purchase large quantities of beef, particularly USDA Prime grade beef, which is subject to significant price fluctuations due to seasonal shifts, climate conditions, industry demand and other factors. Our beef costs represented approximately 45% of our food and beverage costs during fiscal year 2017. We typically buy our beef on the “spot” market and from time to time we will enter into longer term pricing and supply agreements. During fiscal year 2017, we entered into contracts with beef suppliers to establish set pricing on a portion of anticipated beef purchases. As of December 31, 2017, we have not negotiated set pricing for beef requirements in 2018. The market for USDA Prime grade beef is particularly volatile. If prices increase, or the supply of beef is reduced, our operating margins could be materially adversely affected.
In addition, under the Federal Meat Inspection Act and the Poultry Products Inspection Act, the production, processing or interstate distribution of meat and poultry products is prohibited absent federal inspection. If there is a disruption to the meat inspection process, we could experience a reduction in supply and a corresponding increase in meat prices, which could be significant, either of which could materially impact our operating margin and results of operations.
In the recent past, certain types of seafood have experienced fluctuations in availability. Seafood is also subject to fluctuations in price based on availability, which is often seasonal. If certain types of seafood are unavailable, or if our costs increase, our results of operations could be adversely affected.
If our vendors or distributors do not deliver food and beverages in a timely fashion we may experience supply shortages and/or increased food and beverage costs.
Our ability to maintain consistent quality throughout Company-owned restaurants depends in part upon our ability to purchase USDA Prime and Choice grade beef, seafood and other food products in accordance with our rigid specifications. During fiscal year 2017, the Company purchased substantially all of the beef used in Company-owned Ruth’s Chris restaurants from two vendors, Sysco Food Services and Stock Yards Packing (a subsidiary of US Foods). Each vendor supplied about half of the Company’s beef requirements.
In addition, we currently have a long-term distribution arrangement with a national food and restaurant supply distributor, DMA, which purchases products for us from various suppliers, and through which all of our Company-owned Ruth’s Chris Steak House restaurants receive a significant portion of their food supplies. Consolidation in our supply chain due to mergers and acquisitions may change the relationships we have with our existing vendors and distributors and/or result in fewer alternative supply sources for purchasing our food supplies which could result in an increase in prices. If for any reason our vendors or distributors cease doing business with us, we could experience supply shortages in certain Company-owned restaurants and could be required to purchase
8
supplies at higher prices until we are able to secure an alternative supply source. Any delay we experience in replacing vendors or distributors on acceptable terms could increase food costs or, in extreme cases, require us to temporarily remove items from the menu of one or more restaurants.
Labor shortages or increases in labor costs could slow our growth or harm our business.
Our success depends in part upon our ability to continue to attract, motivate and retain employees with the qualifications to succeed in our industry and the motivation to apply our core service philosophy, including regional operational managers, restaurant general managers and chefs. If we are unable to continue to recruit and retain sufficiently qualified individuals, our business and growth could be adversely affected. Competition for these employees could require us to pay higher wages, which could result in higher labor costs.
In addition, we have a substantial number of hourly employees who are paid wage rates at or based on the federal or state minimum wage and who rely on tips as a large portion of their income. Governmental entities have acted to increase minimum wage rates in several jurisdictions wherein Company-owned restaurants are located. The federal minimum wage may be increased and there likely will be additional minimum wage increases implemented in other states in which we operate or seek to operate. Likewise, changes to existing tip credit laws (which dictate the amounts an employer is permitted to assume an employee receives in tips when calculating the employee’s hourly wage for minimum wage compliance purposes) continue to be proposed and implemented at both the federal and state government levels. As federal and/or state minimum wage rates increase and allowable tip credits decrease, we may need to increase not only the wage rates of our minimum wage employees but also the wages paid to our employees who are paid above the minimum wage, which will increase our labor costs. None of our employees are represented by a collective bargaining unit. Should some of our employees elect to be represented by a collective bargaining unit, our labor costs may increase due to higher wage rates and / or the implementation of work rules. We may be unable to increase our prices in order to pass these increased labor costs on to our guests, in which case our margins would be negatively affected.
A lack of availability of suitable locations for new restaurants, the inability to renew leases at existing restaurants on similar terms and conditions, or a decline in the quality of the locations of our current restaurants may adversely affect our sales and results of operations.
The success of our restaurants depends in large part on their locations. All, but one, of our Company-owned restaurant premises are leased. If we do not renew leases when the lease terms expire, or if we are unable to renew leases on favorable terms and conditions, our operating results could be negatively impacted. Possible declines in neighborhoods where our restaurants are located or adverse economic conditions in areas surrounding those neighborhoods could also result in reduced sales in those restaurants. In addition, desirable locations for new restaurant openings or for the relocation of existing restaurants may not be available at an acceptable cost when we identify a particular opportunity for a new restaurant or relocation. The occurrence of one or more of these events could have a significant adverse effect on our sales and results of operations.
Regulations affecting the operation of our restaurants could increase operating costs and restrict growth.
Each of our restaurants must obtain licenses from regulatory authorities allowing us to sell liquor, beer and wine, and each restaurant must obtain a food service license from local health authorities. Each restaurant’s liquor license must be renewed annually and may be revoked at any time for cause, including violation by the Company or its employees of any laws and regulations relating to the minimum drinking age, advertising, wholesale purchasing and inventory control. In certain states, including states where we have a large number of restaurants or where we may open restaurants in the future, the number of liquor licenses available is limited and licenses are traded at market prices. If we are unable to maintain existing licenses, or if we choose to open a restaurant in those states, the cost of a new license could be significant. Obtaining and maintaining licenses is an important component of each of our restaurant’s operations, and the failure to obtain or maintain food and liquor licenses and other required licenses, permits and approvals would materially adversely impact existing restaurants or our growth strategy.
We are also subject to a variety of federal and state labor laws, pertaining to matters such as minimum wage and overtime pay requirements, unemployment tax rates, workers’ compensation rates and citizenship requirements. Government-mandated increases in minimum wages, overtime pay, paid leaves of absence and mandated health benefits, or increased tax reporting and tax payment requirements for employees who receive gratuities or a reduction in the number of states that allow tips to be credited toward minimum wage requirements could increase our labor costs and reduce our operating margins. In addition, the Federal Americans with Disabilities Act prohibits discrimination on the basis of disability in public accommodations and employment. Although our restaurants are designed to be accessible to the disabled, we could be required to make modifications to our restaurants to provide service to, or make reasonable accommodations for, disabled persons.
9
The cost of our employee health care benefit program may increase in the future.
We maintain an employee benefits program that provides self-insured and insured coverage to employees that meet the applicable requirements under the program. Employees can elect to enroll dependents that meet eligibility criteria. Coverage includes health, dental, vision, short- and long-term disability, life insurance and other voluntary ancillary benefits. Employees share in the cost of other coverage at varying levels. The Company has historically funded a majority of the cost of health benefits.
The ACA requires that employers offer health care coverage that is qualified and affordable. Coverage must be offered to all “full-time” employees, as defined by the ACA. The Company routinely reviews its health benefit plans to assure conformity with the ACA. While we have raised the eligibility requirement thresholds, the hours of service eligibility criteria for health benefits are lower than required under the ACA. Approximately 60% of eligible employees elect to participate in our health benefit plans. In the future, proportionately more employees may elect to participate in our health benefit plans because the ACA includes financial penalties for people who do not have health insurance. We are unable to reliably predict to what extent, if any, the percentage of eligible employees who elect health care coverage will increase in the future. Because we fund a majority of the cost of health benefits, our financial accounting expense will increase to the extent that additional employees elect to participate in the Company’s health benefit plans.
Certain other restaurant companies may curtail the ability of their employees to participate in their health benefit plans by increasing the hours worked eligibility requirement to the minimum required under the ACA. Such restaurant companies may gain a cost advantage compared to us by reducing the cost of their employee health benefit programs.
Also, so-called “medical inflation” has historically tended to outpace general inflation. We are unable to reliably predict the extent to which future medical inflation will outpace general inflation. Additionally, because our medical benefit program is self-insured, an unusual incidence of large claims may cause our costs to unexpectedly increase.
Our strategy to open franchisee-owned restaurants subjects us to extensive government regulation, compliance with which might increase our investment costs and restrict our growth.
We are subject to the rules and regulations of the FTC and various international and state laws regulating the offer and sale of franchises. The FTC requires that we furnish to prospective franchisees a franchise disclosure document containing prescribed information and can restrict our ability to sell franchises. A number of states also regulate the sale of franchises and require the obtaining of a permit and/or registration of the franchise disclosure document with state authorities and the delivery of the franchise disclosure document to prospective franchisees. Non-compliance with those laws could result in governmental enforcement actions seeking a civil or criminal penalty, rescission of a franchise, and loss of our ability to offer and sell franchises in a state, or a private lawsuit seeking rescission, damages and legal fees, which could have a material adverse effect on our business.
Our franchisees could take actions that harm our reputation and reduce our royalty revenues.
We do not exercise control over the day-to-day operations of our franchisee-owned restaurants. While we strive to ensure that franchisee-owned restaurants maintain the same high operating standards that we demand of Company-owned restaurants, one or more of these restaurants may fail to maintain these standards or provide a customer experience consistent with our brand standards. Any operational or financial shortcomings of the franchisee-owned restaurants are likely to be attributed to our system-wide operations and could adversely affect our reputation and damage our brand as well as have a direct negative impact on the royalty income we receive from those restaurants. Franchisee noncompliance with the operational standards and the terms and conditions of our franchise agreements may reduce the overall goodwill of our brand, whether through the failure to meet health and safety standards, engage in quality control or maintain product consistency, or through the participation in improper or objectionable business practices. Moreover, unauthorized third parties may use our intellectual property to trade on the goodwill of the Company’s brand, resulting in consumer confusion or dilution. Any harm to our brand or goodwill, customer confusion or brand dilution could materially and adversely impact our business and results of operations.
The expansion into international markets by our franchisees also creates additional risks to our brands and reputation.
Our international operations are subject to all of the same risks associated with our domestic operations, as well as a number of additional risks. These include, among other things, international economic and political conditions, foreign currency fluctuations and differing cultures and consumer preferences. We are also subject to governmental regulation in such international markets, including antitrust and tax requirements, anti-boycott regulations, import/export/customs regulations and other international trade regulations, the USA Patriot Act and the Foreign Corrupt Practices Act. Any new regulatory or trade initiatives could impact our operations in certain countries. Failure to comply with any such legal requirements could subject us to monetary liabilities and other sanctions, which could harm our business, results of operations and financial condition.
10
We rely on information technology in our operations and a failure to maintain a continuous and secure network, free from material failure, interruption or security breach, could harm our ability to effectively operate our business, damage our reputation and negatively affect our operations and profits.
We rely on information systems across our operations, including for marketing programs, point-of-sale processing systems in our restaurants, online purchases of gift cards and various other processes and transactions. The failure of these systems to operate effectively, problems with transitioning to upgraded or replacement systems, a material network breach in the security of these systems as a result of a cyber-attack, or any other failure to maintain a continuous and secure network could adversely affect our reputation, negatively affect our results of operations and result in substantial harm to us or an individual. As privacy and information security laws and regulations change and cyber risks evolve, we may incur additional costs to ensure we remain in compliance and protect guest, employee and Company information. We currently carry insurance coverage to protect ourselves against some of these risks. However, our inability to continue to obtain such insurance coverage at reasonable costs also could have a material adverse effect on our financial condition and results of operations.
We accept electronic payment cards, including credit, debit and gift cards, from our guests for payment in our restaurants and on our websites. We also receive and maintain certain personal information about our customers and employees. A number of retailers and restaurant operators have experienced security breaches in which credit, debit and gift card information may have been stolen. If we experienced a security breach, we could become subject to claims, lawsuits or other proceedings for purportedly fraudulent transactions arising out of the theft of credit or debit card information, theft of gift card information, compromised security and information systems, failure of our employees to comply with applicable laws, the unauthorized acquisition or use of such information by third parties, or other similar claims. Any such incidents or proceedings could negatively affect our reputation and our results of operations, cause delays in guest service, require significant capital investments to remediate the problem, and could result in the imposition of penalties or cause us to incur significant unplanned losses and expenditures, including those necessary to remediate any damage to persons whose personal information may have been compromised. Furthermore, as a result of legislative and regulatory rules, we may be required to notify the owners of the credit and debit card information of any data breaches, which could harm our reputation and financial results, as well as subject us to litigation or other proceedings by regulatory authorities.
Our failure to enforce our service marks or other proprietary rights could adversely affect our competitive position or the value of our brands.
We own certain common law service mark rights and a number of federal and international service mark registrations, most importantly the Ruth’s Chris Steak House names and logos, copyrights relating to text and print uses, and other proprietary intellectual property rights. We believe that our service marks, copyrights and other proprietary rights are important to our success and competitive position. Protective actions we take with respect to these rights may fail to prevent unauthorized usage or imitation by others, which could harm our reputation, brand or competitive position and, if we commence litigation to enforce our rights, cause us to incur significant legal expenses.
Litigation concerning food quality, health, employment practices and other issues could require us to incur additional liabilities and/or cause guests to avoid our restaurants.
Occasionally, our guests file complaints or lawsuits against us alleging that we are responsible for some illness or injury they suffered at or after a visit to our restaurants. We are also subject to a variety of other claims arising in the ordinary course of our business, including personal injury claims, contract claims, claims from franchisees, claims from landlords, claims alleging violations of federal and state law regarding workplace and employment matters and discrimination and similar matters. In addition, we could become subject to class action lawsuits related to these matters in the future. The restaurant industry has also been subject to a growing number of claims that the menus and actions of restaurant chains have led to the obesity of certain of their guests. In addition, we are subject to “dram shop” statutes. These statutes generally permit a person injured by an intoxicated person to recover damages from an establishment that wrongfully served alcoholic beverages to the intoxicated person. The restaurant industry has also faced recent claims related to sexual harassment. Regardless of whether any claims against us are valid or whether we are liable, claims may be expensive to defend and may divert time and money away from our operations and hurt our performance. A judgment significantly in excess of our insurance coverage for any claims or for matters not covered by insurance could materially adversely affect our financial condition and results of operations. Our inability to continue to obtain such insurance coverage at reasonable costs also could have a material adverse effect on our financial condition and results of operations. Adverse publicity resulting from these claims may also negatively impact revenues at one or more of our restaurants.
11
The terms of our senior credit agreement may restrict our ability to operate our business and to pursue our business strategies.
Our senior credit agreement contains, and any agreements governing future indebtedness would likely contain, a number of restrictive covenants that impose significant operating and financial restrictions on us. Our senior credit agreement, which was entered into on February 2, 2017, limits our ability, among other things, to:
|
• |
pay dividends or purchase stock in excess of the limits permitted under the credit facility; |
|
• |
borrow money or issue guarantees; |
|
• |
make investments; |
|
• |
use assets as security in other transactions; |
|
• |
sell assets or merge with or into other companies; |
|
• |
enter into transactions with affiliates; and |
|
• |
create or permit restrictions on our subsidiaries’ ability to make payments to us. |
Our ability to engage in these types of transactions is limited even if we believe that a specific transaction would contribute to our future growth or improve our operating results. Our senior credit agreement also requires us to maintain compliance with certain financial ratios. Our ability to comply with these ratios may be affected by events outside of our control. Any non-compliance would result in a default under our senior credit agreement and could result in our lenders declaring our senior debt immediately due and payable, which would have a material adverse effect on our financial position, consolidated results of operations and liquidity.
We cannot assure our stockholders that we will continue to pay quarterly cash dividends on our common stock or repurchase shares of our common stock under our share repurchase program. Failure to continue to pay quarterly cash dividends to our stockholders or repurchase shares of our common stock under our share repurchase program could cause the market price for our common stock to decline.
During fiscal year 2017, we continued paying quarterly cash dividends to holders of our common stock and repurchased shares of our common stock under our share repurchase program. Our ability to pay future quarterly cash dividends or repurchase shares of our common stock will be subject to, among other things, our results of operations, financial condition, business prospects, capital requirements, contractual restrictions, any indebtedness we may incur, restrictions imposed by applicable law, tax considerations and other factors that our Board of Directors deems relevant. There can be no assurance that we will continue to pay a quarterly cash dividend or repurchase shares of our common stock in the future. Any reduction or discontinuance by us of the payment of quarterly cash dividends or the repurchase of shares of our common stock under our share repurchase program could cause the market price of our common stock to decline. Moreover, in the event our payment of quarterly cash dividends is reduced or discontinued, our failure or inability to resume paying quarterly cash dividends at historical levels could result in a lower market valuation of our common stock.
In the future we could incur unexpected expenses as a result of the sale of the Mitchell’s Restaurants.
Effective January 21, 2015, we sold the Mitchell’s Restaurants and related assets to Landry’s. Pursuant to the terms of the Agreement, upon closing of the sale of the Mitchell’s Restaurants, Landry’s assumed the lease obligations of the Mitchell’s Restaurants. However, we have guaranteed Landry’s lease obligations aggregating $29.4 million under seven of the leases. Also, the Agreement includes customary seller representations and warranties. There is a risk that adverse events may occur that require us to defend against or fulfill an indemnity claim, which could result in unexpected expense.
We depend on external sources of capital, which may not be available in the future.
Historically, we have relied upon external sources of capital to fund our working capital and other requirements. Currently, we utilize our senior credit agreement to fund a portion of our working capital and other financing requirements. Any non-compliance with any restrictive or financial covenants in our senior credit agreement could result in a default and could result in our lenders declaring our senior debt immediately due and payable, which would have a material adverse effect on our financial position, consolidated results of operations and liquidity.
If we are required to seek other sources of capital, additional capital may or may not be available on favorable terms or at all. Our access to third-party sources of capital depends on a number of things, including the market’s perception of our current and potential future earnings. Furthermore, additional equity offerings may result in substantial dilution of stockholders’ interests. If we are unable to access sufficient capital or enter into financing arrangements on favorable terms in the future, our financial condition and results of operations may be materially adversely affected.
12
Tax assessments by governmental authorities could adversely impact our operating results.
We remit a variety of taxes and fees to various governmental authorities, including federal and state income taxes, excise taxes, property taxes, sales and use taxes, and payroll taxes. The taxes and fees remitted by us are subject to review and audit by the applicable governmental authorities, which could result in liability for additional assessments. In addition, we are subject to unclaimed or abandoned property (escheat) laws which require us to turn over to certain government authorities the property of others held by us that has been unclaimed for a specified period of time. We are subject to audit by individual U.S. states with regard to our escheatment practices. The legislation and regulations related to tax and unclaimed property matters tend to be complex and subject to varying interpretations by both government authorities and taxpayers. Although management believes that the positions are reasonable, various taxing authorities may challenge certain of the positions we have taken, which may also potentially result in additional liabilities for taxes, unclaimed property and interest in excess of accrued liabilities. Our positions are reviewed as events occur such as the availability of new information, the lapsing of applicable statutes of limitations, the conclusion of tax audits, the measurement of additional estimated liability based on current calculations, the identification of new tax contingencies, or the rendering of relevant court decisions. An unfavorable resolution of assessments by a governmental authority could negatively impact our results of operations and cash flows in future periods.
An impairment in the financial statement carrying value of our goodwill, other intangible assets or property could adversely affect our financial condition and consolidated results of operations.
Goodwill and owned franchise rights that have been determined to have indefinite lives must be reviewed for potential impairment annually and when triggering events are detected. During the fourth quarter of each year, we complete an analysis to determine if goodwill and franchise rights are impaired as of the balance sheet date. We performed our annual impairment test of goodwill and franchise rights as of November 26, 2017 using a qualitative assessment. Using the qualitative approach, we evaluated factors, including but not limited to, recent financial performance; forecasts for future cash flows; the Company’s stock price and market capitalization; recent impairment tests; legal factors; the business climate; and the competitive environment.
If the qualitative assessment of goodwill is not performed, or if we determine that it is not more likely than not that the fair values of the intangible assets exceed the carrying values, then we compare the carrying value of a reporting unit, including goodwill, to the fair value of the unit. Carrying value is based on the assets and liabilities associated with the operations of that reporting unit. If the carrying value is less than the fair value, no impairment exists. If the carrying value is higher than the fair value, there is an indication of impairment. A significant amount of judgment is involved in determining if an indication of impairment exists. Factors may include, among others: a significant decline in our expected future cash flows; a sustained, significant decline in our stock price and market capitalization; a significant adverse change in legal factors or in the business climate; unanticipated competition; and slower growth rates. Any adverse change in these factors would have a significant impact on the recoverability of goodwill and negatively affect our financial condition and consolidated results of operations. We compute the amount of impairment by comparing the implied fair value of reporting unit goodwill with the financial statement carrying amount of that goodwill. We are required to record a non-cash impairment charge if the testing performed indicates that goodwill has been impaired.
We evaluate the useful lives of our other intangible assets to determine if they are definite or indefinite-lived. Reaching a determination on useful life requires significant judgments and assumptions regarding the future effects of obsolescence, demand, competition, other economic factors (such as the stability of the industry, legislative action that results in an uncertain or changing regulatory environment, and expected changes in distribution channels), the level of required maintenance expenditures, and the expected lives of other related groups of assets.
As with goodwill, we test our indefinite-lived intangible assets (primarily franchise rights) for impairment annually and whenever events or changes in circumstances indicate that their carrying value may not be recoverable. We performed our annual impairment test of franchise rights as of November 26, 2017 using a qualitative assessment. If the qualitative assessment is not performed, or if we determine that it is not more likely than not that the fair values of the intangible assets exceed the carrying values, then we estimate the fair value of the franchise rights based on an excess earnings valuation model, which requires assumptions related to projected revenues and cash flows from our annual strategic plan and a discount rate.
We review property and equipment (which includes leasehold improvements) for impairment when events or circumstances indicate these assets might be impaired. We test impairment using historical cash flow and other relevant facts and circumstances as the primary basis for our estimates of future cash flows. The analysis is performed at the restaurant level for indicators of impairment. In determining future cash flows, we make significant estimates with respect to future operating results of each restaurant over the expected remaining life of the primary asset in the restaurant. If assets are determined to be impaired, the loss on impairment is measured by calculating the amount by which the asset-carrying amount exceeds its fair value. This process requires the use of estimates and assumptions, which are subject to a high degree of judgment. During the fourth quarter of fiscal year 2017, we recognized a $3.9 million impairment due to the decline in the estimated fair value of the long-lived assets (primarily leasehold improvements) of one Ruth’s Chris Steak House restaurant. If these estimates and assumptions change in the future, we may be required to record additional losses on impairment on these assets.
13
We cannot accurately predict the amount and timing of any impairment of assets. Should the financial statement carrying value of goodwill, other intangible assets or property and equipment become impaired, there could be an adverse effect on our financial condition and consolidated results of operations.
Market volatility could adversely affect our stock price.
Many factors affect the trading price of our stock, including factors over which we have no control, such as reports on the economy or the price of commodities, as well as negative or positive announcements by competitors, regardless of whether the report relates directly to our business. In addition to investor expectations, trading activity in our stock can reflect the portfolio strategies and investment allocation changes of institutional holders. Any failure to meet market expectations, whether for sales growth rates, earnings per share or other metrics, could adversely affect our share price.
None.
Company-owned restaurants are generally located in spaces leased by wholly-owned direct or indirect subsidiaries. Seventy-six of the Company-owned Ruth’s Chris restaurants operate in leased space, of which the majority currently provide for an option to renew for terms ranging from approximately five years to twenty years. Historically, the Company has not had difficulty in renewing its leases in a timely manner. Restaurant leases provide for a specified annual rent, and some leases call for additional or contingent rent based on sales volumes over specified levels.
All of the Company’s Mitchell’s Fish Market, Mitchell’s Steakhouse and Cameron’s Steakhouse restaurants were in leased spaces and each lease provided for at least one option to renew, with the exception of the lease for one Mitchell’s Steakhouse. Under the terms of the Agreement to sell the Mitchell’s Restaurants, Landry’s assumed the Mitchell’s Restaurants’ facility lease obligations upon closing of the sale in January 2015. However, the Company has guaranteed Landry’s lease obligations aggregating $29.4 million under seven of the leases. Landry’s indemnified the Company in the event of a default under any of the leases.
The Company’s corporate headquarters were relocated in 2011 from Heathrow, Florida. The corporate headquarters now resides in leased space (21,211 square feet) in Winter Park, Florida, with a term set to expire on August 31, 2021.
The Company owns the real estate for one Ruth’s Chris operating restaurant in Ft. Lauderdale, FL (7,800 square feet). We sold our Columbus, OH property in 2016. The Columbus restaurant was closed in February 2016.
14
The following table sets forth information about the Company’s existing Company-owned and franchisee-owned restaurants as of December 31, 2017. As of December 31, 2017, the Company operated 77 Ruth’s Chris restaurants. In addition, franchisees operated 76 restaurants and two restaurants operated under contractual agreements. Company-owned Ruth’s Chris restaurants range in size from approximately 4,000 to approximately 13,000 square feet with approximately 180 to 375 seats. The Company expects that future restaurants will range in size from 8,000 to 12,000 square feet with approximately 230 to 250 seats.
|
Company-Owned Ruth's Chris Restaurants |
|
Franchisee-Owned Ruth's Chris Restaurants |
||||||
|
Year Opened |
|
Locations |
|
Property Leased or Owned |
|
Year Opened |
|
Locations |
|
1972 |
|
Metairie, LA |
|
Leased |
|
1976 |
|
Baton Rouge, LA |
|
1977 |
|
Lafayette, LA |
|
Leased |
|
1985 |
|
Mobile, AL |
|
1983 |
|
Washington, D.C. |
|
Leased |
|
1986 |
|
Atlanta, GA |
|
1984 |
|
Beverly Hills, CA |
|
Leased |
|
1987 |
|
Pittsburgh, PA |
|
1985 |
|
Ft. Lauderdale, FL |
|
Owned |
|
1987 |
|
Hartford, CT |
|
1985 |
|
Austin, TX |
|
Leased |
|
1988 |
|
Philadelphia, PA |
|
1986 |
|
Nashville, TN |
|
Leased |
|
1991 |
|
Richmond, VA |
|
1987 |
|
San Francisco, CA |
|
Leased |
|
1993 |
|
Birmingham, AL |
|
1987 |
|
N. Palm Beach, FL |
|
Leased |
|
1993 |
|
San Antonio, TX |
|
1988 |
|
Seattle, WA |
|
Leased |
|
1993 |
|
Taipei, Taiwan |
|
1989 |
|
Honolulu, HI |
|
Leased |
|
1993 |
|
Cancun, Mexico |
|
1989 |
|
Memphis, TN |
|
Leased |
|
1994 |
|
Indianapolis, IN |
|
1990 |
|
Weehawken, NJ |
|
Leased |
|
1995 |
|
Long Island, NY |
|
1990 |
|
Scottsdale, AZ |
|
Leased |
|
1995 |
|
Toronto, Canada |
|
1992 |
|
Palm Desert, CA |
|
Leased |
|
1996 |
|
Taichung, Taiwan |
|
1992 |
|
Minneapolis, MN |
|
Leased |
|
1996 |
|
Indianapolis, IN |
|
1992 |
|
Chicago, IL |
|
Leased |
|
1997 |
|
Kowloon, Hong Kong |
|
1993 |
|
Arlington, VA |
|
Leased |
|
1997 |
|
Raleigh (Cary), NC |
|
1993 |
|
Manhattan, NY |
|
Leased |
|
1998 |
|
Annapolis, MD |
|
1994 |
|
San Diego, CA |
|
Leased |
|
1999 |
|
Atlanta, GA |
|
1995 |
|
Westchester, NY |
|
Leased |
|
2000 |
|
Pikesville, MD |
|
1996 |
|
Dallas, TX |
|
Leased |
|
2000 |
|
San Antonio, TX |
|
1996 |
|
Troy, MI |
|
Leased |
|
2001 |
|
Kaohsiung, Taiwan |
|
1996 |
|
Tampa, FL |
|
Leased |
|
2001 |
|
King of Prussia, PA |
|
1996 |
|
Bethesda, MD |
|
Leased |
|
2001 |
|
Queensway, Hong Kong |
|
1997 |
|
Irvine, CA |
|
Leased |
|
2001 |
|
Cabo San Lucas, Mexico |
|
1997 |
|
Jacksonville, FL |
|
Leased |
|
2003 |
|
Toronto, Canada |
|
1998 |
|
Louisville, KY |
|
Leased |
|
2005 |
|
Virginia Beach, VA |
|
1998 |
|
Maui, HI |
|
Leased |
|
2005 |
|
Baltimore, MD |
|
1998 |
|
Parsippany, NJ |
|
Leased |
|
2005 |
|
Atlantic City, NJ |
|
1998 |
|
Northbrook, IL |
|
Leased |
|
2005 |
|
Charlotte, NC |
|
1999 |
|
Coral Gables, FL |
|
Leased |
|
2006 |
|
St. Louis, MO |
|
1999 |
|
Ponte Vedra, FL |
|
Leased |
|
2006 |
|
Ocean City, MD |
|
1999 |
|
Winter Park, FL |
|
Leased |
|
2006 |
|
Destin, FL |
|
2000 |
|
Sarasota, FL |
|
Leased |
|
2006 |
|
Huntsville, AL |
|
2000 |
|
Del Mar, CA |
|
Leased |
|
2006 |
|
Edmonton, Canada |
|
2000 |
|
Boca Raton, FL |
|
Leased |
|
2007 |
|
Charlotte, NC |
|
2000 |
|
Wailea, HI |
|
Leased |
|
2007 |
|
Columbia, SC |
|
2001 |
|
Orlando, FL |
|
Leased |
|
2007 |
|
Mishawaka, IN |
|
2001 |
|
Greensboro, NC |
|
Leased |
|
2007 |
|
Tokyo, Japan |
|
2002 |
|
Woodland Hills, CA |
|
Leased |
|
2007 |
|
Madison, WI |
|
2002 |
|
Fairfax, VA |
|
Leased |
|
2007 |
|
Calgary, Canada |
|
2002 |
|
Bellevue, WA |
|
Leased |
|
2007 |
|
Rogers, AR |
|
2002 |
|
Washington, D.C. |
|
Leased |
|
2007 |
|
Park City, UT |
|
2003 |
|
Walnut Creek, CA |
|
Leased |
|
2008 |
|
Aruba |
|
2005 |
|
Roseville, CA |
|
Leased |
|
2008 |
|
Myrtle Beach, SC |
15
|
Company-Owned Ruth's Chris Restaurants |
|
Franchisee-Owned Ruth's Chris Restaurants |
||||||
|
Year Opened |
|
Locations |
|
Property Leased or Owned |
|
Year Opened |
|
Locations |
|
2005 |
|
Boston, MA |
|
Leased |
|
2008 |
|
Wilmington, NC |
|
2005 |
|
Sacramento, CA |
|
Leased |
|
2008 |
|
Ridgeland, MS |
|
2006 |
|
Bonita Springs, FL |
|
Leased |
|
2008 |
|
Wilkes-Barre, PA |
|
2006 |
|
Mauna Lani, HI |
|
Leased |
|
2008 |
|
Raleigh, NC |
|
2006 |
|
Pasadena, CA |
|
Leased |
|
2008 |
|
Savannah, GA |
|
2007 |
|
Lake Mary, FL* |
|
Land Leased |
|
2009 |
|
Greenville, SC |
|
2007 |
|
Anaheim, CA* |
|
Land Leased |
|
2009 |
|
St. Louis, MO |
|
2007 |
|
Biloxi, MS |
|
Leased |
|
2009 |
|
Durham, NC |
|
2007 |
|
Knoxville, TN |
|
Leased |
|
2009 |
|
Kennesaw, GA |
|
2007 |
|
Tyson's Corner, VA |
|
Leased |
|
2010 |
|
Salt Lake City, UT |
|
2007 |
|
Waikiki, HI |
|
Leased |
|
2011 |
|
Grand Rapids, MI |
|
2007 |
|
West Palm Beach, FL |
|
Leased |
|
2011 |
|
Asheville, NC |
|
2008 |
|
Ft. Worth, TX |
|
Leased |
|
2012 |
|
Dubai, United Arab Emirates |
|
2008 |
|
New Orleans, LA |
|
Leased |
|
2012 |
|
Singapore |
|
2008 |
|
Princeton, NJ* |
|
Land Leased |
|
2012 |
|
Niagara Falls, Canada |
|
2008 |
|
Fresno, CA |
|
Leased |
|
2013 |
|
Las Vegas, NV |
|
2008 |
|
South Barrington, IL* |
|
Land Leased |
|
2013 |
|
San Juan, Puerto Rico |
|
2011 |
|
Portland, OR |
|
Leased |
|
2013 |
|
Chattanooga, TN |
|
2012 |
|
Cincinnati, OH |
|
Leased |
|
2013 |
|
Shanghai, China |
|
2013 |
|
Houston, TX |
|
Leased |
|
2014 |
|
Alpharetta, GA |
|
2014 |
|
Denver, CO |
|
Leased |
|
2014 |
|
Boise, ID |
|
2014 |
|
Gaithersburg, MD |
|
Leased |
|
2014 |
|
Panama City, Panama |
|
2014 |
|
Marina del Rey, CA |
|
Leased |
|
2014 |
|
Taipei, Taiwan |
|
2015 |
|
St. Petersburg, FL |
|
Leased |
|
2015 |
|
Ann Arbor, MI |
|
2015 |
|
Dallas, TX |
|
Leased |
|
2015 |
|
Charleston, SC |
|
2016 |
|
Albuquerque, NM |
|
Leased |
|
2015 |
|
San Antonio, TX |
|
2016 |
|
El Paso, TX |
|
Leased |
|
2016 |
|
Jakarta, Indonesia |
|
2017 |
|
Waltham, MA |
|
Leased |
|
2016 |
|
Odenton, MD |
|
2017 |
|
Cleveland, OH |
|
Leased |
|
2016 |
|
Greenville, SC |
|
2017 |
|
Kauai, HI |
|
Leased |
|
2017 |
|
Chengdu, China |
|
2017 |
|
Denver, CO |
|
Leased |
|
|
|
|
|
|
|
|
|
|
|
|
|
|
|
|
|
|
|
|
|
Ruth's Chris Restaurants Under Management Agreement |
||
|
|
|
|
|
|
|
Year Opened |
|
Locations |
|
|
|
|
|
|
|
2012 |
|
Cherokee, NC |
|
|
|
|
|
|
|
2017 |
|
Tulsa, OK |
|
* |
The Company owns the building and leases the land pursuant to a long-term ground lease. |
16
From time to time, the Company is involved in various disputes and litigation matters that arise in the ordinary course of business. While litigation is subject to uncertainties and the outcome of litigated matters is not predictable with assurance, the Company is not aware of any legal proceedings pending or threatened against it that it expects to have a material adverse effect on its financial condition or results of operations.
None.
17
|
Item 5. |
MARKET FOR THE REGISTRANT’S COMMON STOCK, RELATED STOCKHOLDER MATTERS AND ISSUER PURCHASES OF EQUITY SECURITIES |
The Company’s common stock is listed on the Nasdaq Global Select Market under the trading symbol “RUTH.” As of March 1, 2018, there were 111 holders of record of its common stock.
The following table sets forth, for the period indicated, the highest and lowest sale price for its common stock for each full quarterly period for fiscal years 2017 and 2016, as reported by the Nasdaq Global Select Market:
|
|
|
High |
|
|
Low |
|
||
|
Fiscal Year ended December 25, 2016 |
|
|
|
|
|
|
|
|
|
First Quarter |
|
$ |
17.92 |
|
|
$ |
15.32 |
|
|
Second Quarter |
|
$ |
18.48 |
|
|
$ |
15.88 |
|
|
Third Quarter |
|
$ |
16.16 |
|
|
$ |
14.85 |
|
|
Fourth Quarter |
|
$ |
19.50 |
|
|
$ |
13.99 |
|
|
Fiscal Year ended December 31, 2017 |
|
|
|
|
|
|
|
|
|
First Quarter |
|
$ |
19.85 |
|
|
$ |
16.70 |
|
|
Second Quarter |
|
$ |
22.35 |
|
|
$ |
19.60 |
|
|
Third Quarter |
|
$ |
22.20 |
|
|
$ |
18.35 |
|
|
Fourth Quarter |
|
$ |
22.20 |
|
|
$ |
19.65 |
|
Dividends and Common Stock Repurchase Program
We commenced paying quarterly cash dividends to holders of our common stock in May 2013. The payment of dividends is within the discretion of our Board of Directors and will depend upon our earnings, capital requirements and operating and financial condition, among other factors. In addition, we may not pay a dividend if there is a default (or if a default would result from such dividend payment) under our senior credit agreement. Under our senior credit facility, restricted junior payments, which include cash dividend payments, repurchases of our equity securities and payment and prepayments of subordinated indebtedness, made subsequent to February 2, 2017 are limited to $100.0 million if our consolidated debt ratio is greater than or equal to 2.00:1.00, and are not limited in amount if our consolidated debt ratio is less than 2.00:1.00. As of the date of this Annual Report $35.4 million of such payments had been made.
The Company’s Board of Directors declared the following dividends during the periods presented (amounts in thousands, except per share amounts):
|
Declaration Date |
|
Dividend per Share |
|
|
Record Date |
|
Total Amount |
|
|
Payment Date |
||
|
Fiscal Year 2017 |
|
|
|
|
|
|
|
|
|
|
|
|
|
February 17, 2017 |
|
$ |
0.09 |
|
|
February 23, 2017 |
|
$ |
2,862 |
|
|
March 9, 2017 |
|
May 5, 2017 |
|
$ |
0.09 |
|
|
May 18, 2017 |
|
$ |
2,862 |
|
|
June 1, 2017 |
|
July 28, 2017 |
|
$ |
0.09 |
|
|
August 10, 2017 |
|
$ |
2,844 |
|
|
August 24, 2017 |
|
November 3, 2017 |
|
$ |
0.09 |
|
|
November 9, 2017 |
|
$ |
2,815 |
|
|
November 22, 2017 |
|
|
|
|
|
|
|
|
|
|
|
|
|
|
|
Fiscal Year 2016 |
|
|
|
|
|
|
|
|
|
|
|
|
|
February 12, 2016 |
|
$ |
0.07 |
|
|
February 25, 2016 |
|
$ |
2,350 |
|
|
March 10, 2016 |
|
April 28, 2016 |
|
$ |
0.07 |
|
|
May 12, 2016 |
|
$ |
2,338 |
|
|
May 26, 2016 |
|
July 29, 2016 |
|
$ |
0.07 |
|
|
August 11, 2016 |
|
$ |
2,282 |
|
|
August 25, 2016 |
|
October 28, 2016 |
|
$ |
0.07 |
|
|
November 10, 2016 |
|
$ |
2,226 |
|
|
November 23, 2016 |
Subsequent to the end of fiscal year 2017, the Company’s Board of Directors declared a $0.11 per share cash dividend ($3.4 million in total) payable on March 22, 2018. Dividends are paid to holders of common stock and restricted stock.
On November 3, 2017, the Company announced that its Board of Directors approved a share repurchase program under which the Company is authorized to repurchase up to $60 million of outstanding common stock from time to time in the open market, through negotiated transactions or otherwise (including, without limitation, the use of Rule 10b5-1 plans), depending on share price, market conditions and other factors. The new share repurchase program replaces the Company’s previous share repurchase program announced in April 2016, which has been terminated. The previous share repurchase program had permitted the repurchase of up to
18
$60 million of outstanding common stock, of which approximately $12.0 million remained unused upon its termination. The Company conducts any open market share repurchase activities in compliance with the safe harbor provisions of Rule 10b-18 of the Exchange Act. The share repurchase program does not obligate the Company to repurchase any dollar amount or number of its shares. The program has no termination date. As of December 31, 2017, $50.7 million remained available for further purchases under the new program.
Stock repurchase activity during the fiscal quarter ended December 31, 2017 was as follows:
|
Period |
|
Total Number of Shares Purchased |
|
|
Average Price Paid per Share |
|
|
Total Number of Shares Purchased as Part of a Publicly Announced Program |
|
|
Maximum Dollar Value that May Yet be Purchased under the Program – Amounts in thousands |
|
||||
|
September 25, 2017 to October 29, 2017 |
|
— |
|
|
— |
|
|
— |
|
|
$ |
60,000 |
|
|||
|
October 30, 2017 to November 26, 2017 |
|
|
103,600 |
|
|
$ |
20.23 |
|
|
|
103,600 |
|
|
$ |
57,904 |
|
|
November 27, 2017 to December 31, 2017 |
|
|
346,400 |
|
|
$ |
20.93 |
|
|
|
346,400 |
|
|
$ |
50,655 |
|
|
Totals for the fiscal quarter |
|
|
450,000 |
|
|
$ |
20.77 |
|
|
|
450,000 |
|
|
$ |
50,655 |
|
Unregistered Recent Sales of Securities
None.
Securities Authorized for Issuance Under Equity Compensation Plans
See Item 12, Security Ownership of Certain Beneficial Owners and Management and Related Stockholder Matters, of this Annual Report on Form 10-K for information regarding securities authorized for issuance under the Company’s equity compensation plans.
19
Performance Graph
The following table and graph shows the cumulative total stockholder return on the Company’s Common Stock with the S&P 500 Stock Index, the S&P Small Cap 600 Index and the Dow Jones U.S. Restaurants & Bars Index, in each case assuming an initial investment of $100 on December 28, 2012 and full dividend reinvestment.
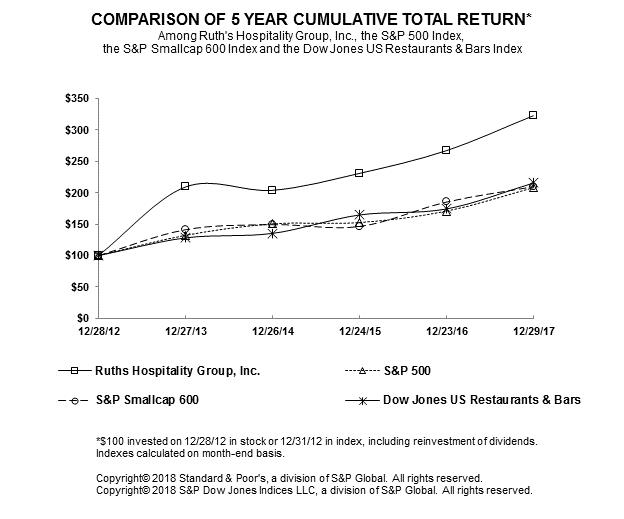
CUMULATIVE TOTAL RETURN
Assuming an investment of $100 and reinvestment of dividends
|
|
|
12/28/12 |
|
|
12/27/13 |
|
|
12/26/14 |
|
|
12/24/15 |
|
|
12/23/16 |
|
|
12/29/17 |
|
||||||
|
Ruth's Hospitality Group, Inc. |
|
$ |
100 |
|
|
$ |
209 |
|
|
$ |
204 |
|
|
|
231 |
|
|
$ |
267 |
|
|
$ |
323 |
|
|
S&P 500 |
|
$ |
100 |
|
|
$ |
132 |
|
|
$ |
151 |
|
|
|
153 |
|
|
$ |
171 |
|
|
$ |
208 |
|
|
S&P Smallcap 600 |
|
$ |
100 |
|
|
$ |
141 |
|
|
$ |
149 |
|
|
|
147 |
|
|
$ |
185 |
|
|
$ |
210 |
|
|
Dow Jones US Restaurants & Bars |
|
$ |
100 |
|
|
$ |
128 |
|
|
$ |
135 |
|
|
|
165 |
|
|
$ |
174 |
|
|
$ |
216 |
|
All amounts rounded to the nearest dollar.
**********
The stock performance graph should not be deemed filed or incorporated by reference into any other filing made by us under the Securities Act of 1933, as amended, or the Exchange Act, except to the extent that we specifically incorporate the stock performance graph by reference in another filing.
20
The following table sets forth the Company’s selected financial data for the year indicated and should be read in conjunction with the disclosures in Item 7, Management’s Discussion and Analysis of Results of Operations and Financial Condition, and Item 8, Financial Statements and Supplementary Data, of this Annual Report on Form 10-K. Certain amounts have been revised to reclassify certain operating revenues and expenses to income from discontinued operations.
|
|
|
Fiscal Year Ended |
|
|||||||||||||||||
|
|
|
2017 |
|
|
2016 |
|
|
2015 |
|
|
2014 |
|
|
2013 |
|
|||||
|
|
|
($ in thousands) |
|
|||||||||||||||||
|
Income Statement Data: |
|
|
|
|
|
|
|
|
|
|
|
|
|
|
|
|
|
|
|
|
|
Revenues: |
|
|
|
|
|
|
|
|
|
|
|
|
|
|
|
|
|
|
|
|
|
Restaurant sales |
|
$ |
390,434 |
|
|
$ |
363,147 |
|
|
$ |
351,875 |
|
|
$ |
325,437 |
|
|
$ |
304,200 |
|
|
Franchise income |
|
|
17,545 |
|
|
|
17,301 |
|
|
|
16,661 |
|
|
|
15,763 |
|
|
|
15,012 |
|
|
Other operating income |
|
|
6,844 |
|
|
|
5,499 |
|
|
|
4,897 |
|
|
|
4,897 |
|
|
|
3,142 |
|
|
|
|
|
|
|
|
|
|
|
|
|
|
|
|
|
|
|
|
|
|
|
|
Total revenues |
|
|
414,823 |
|
|
|
385,947 |
|
|
|
373,433 |
|
|
|
346,097 |
|
|
|
322,354 |
|
|
|
|
|
|
|
|
|
|
|
|
|
|
|
|
|
|
|
|
|
|
|
|
Costs and expenses: |
|
|
|
|
|
|
|
|
|
|
|
|
|
|
|
|
|
|
|
|
|
Food and beverage costs |
|
|
116,361 |
|
|
|
107,075 |
|
|
|
108,101 |
|
|
|
103,259 |
|
|
|
93,386 |
|
|
Restaurant operating expenses |
|
|
185,444 |
|
|
|
172,999 |
|
|
|
165,847 |
|
|
|
156,242 |
|
|
|
145,664 |
|
|
Marketing and advertising |
|
|
12,724 |
|
|
|
11,406 |
|
|
|
10,925 |
|
|
|
10,076 |
|
|
|
9,341 |
|
|
General and administrative costs |
|
|
32,700 |
|
|
|
31,488 |
|
|
|
30,242 |
|
|
|
24,311 |
|
|
|
27,808 |
|
|
Depreciation and amortization expenses |
|
|
14,995 |
|
|
|
13,434 |
|
|
|
12,520 |
|
|
|
10,917 |
|
|
|
10,229 |
|
|
Pre-opening costs |
|
|
2,013 |
|
|
|
1,986 |
|
|
|
1,032 |
|
|
|
1,630 |
|
|
|
691 |
|
|
Loss on impairments |
|
|
3,904 |
|
|
|
— |
|
|
|
— |
|
|
|
— |
|
|
|
— |
|
|
Gain on settlements, net |
|
|
— |
|
|
|
— |
|
|
|
— |
|
|
|
— |
|
|
|
(1,719 |
) |
|
Total costs and expenses |
|
|
368,141 |
|
|
|
338,388 |
|
|
|
328,667 |
|
|
|
306,435 |
|
|
|
285,400 |
|
|
Operating income |
|
|
46,682 |
|
|
|
47,559 |
|
|
|
44,766 |
|
|
|
39,662 |
|
|
|
36,954 |
|
|
Other income (expense): |
|
|
|
|
|
|
|
|
|
|
|
|
|
|
|
|
|
|
|
|
|
Interest expense |
|
|
(821 |
) |
|
|
(1,154 |
) |
|
|
(790 |
) |
|
|
(1,159 |
) |
|
|
(1,640 |
) |
|
Other |
|
|
53 |
|
|
|
10 |
|
|
|
358 |
|
|
|
37 |
|
|
|
(77 |
) |
|
Income from continuing operations before income tax expense |
|
|
45,914 |
|
|
|
46,415 |
|
|
|
44,334 |
|
|
|
38,540 |
|
|
|
35,237 |
|
|
Income tax expense |
|
|
15,669 |
|
|
|
15,660 |
|
|
|
14,168 |
|
|
|
11,830 |
|
|
|
10,744 |
|
|
Income from continuing operations |
|
|
30,245 |
|
|
|
30,755 |
|
|
|
30,166 |
|
|
|
26,710 |
|
|
|
24,493 |
|
|
Loss from discontinued operations, net of income taxes |
|
|
(108 |
) |
|
|
(290 |
) |
|
|
(162 |
) |
|
|
(10,255 |
) |
|
|
(2,004 |
) |
|
Net income |
|
$ |
30,137 |
|
|
$ |
30,465 |
|
|
$ |
30,004 |
|
|
$ |
16,455 |
|
|
$ |
22,489 |
|
21
|
|
|
2017 |
|
|
2016 |
|
|
2015 |
|
|
2014 |
|
|
2013 |
|
|||||
|
|
|
($ in thousands, except per share data) |
|
|||||||||||||||||
|
Basic earnings (loss) per share: |
|
|
|
|
|
|
|
|
|
|
|
|
|
|
|
|
|
|
|
|
|
Continuing operations |
|
$ |
1.00 |
|
|
$ |
0.97 |
|
|
$ |
0.88 |
|
|
$ |
0.76 |
|
|
$ |
0.71 |
|
|
Discontinued operations |
|
|
(0.01 |
) |
|
|
(0.01 |
) |
|
|
— |
|
|
|
(0.29 |
) |
|
|
(0.06 |
) |
|
Basic earnings (loss) per share |
|
$ |
0.99 |
|
|
$ |
0.96 |
|
|
$ |
0.88 |
|
|
$ |
0.47 |
|
|
$ |
0.65 |
|
|
|
|
|
|
|
|
|
|
|
|
|
|
|
|
|
|
|
|
|
|
|
|
Diluted earnings (loss) per share: |
|
|
|
|
|
|
|
|
|
|
|
|
|
|
|
|
|
|
|
|
|
Continuing operations |
|
$ |
0.98 |
|
|
$ |
0.96 |
|
|
$ |
0.87 |
|
|
$ |
0.75 |
|
|
$ |
0.69 |
|
|
Discontinued operations |
|
|
(0.01 |
) |
|
|
(0.01 |
) |
|
|
— |
|
|
|
(0.29 |
) |
|
|
(0.06 |
) |
|
Diluted earnings (loss) per share |
|
$ |
0.97 |
|
|
$ |
0.95 |
|
|
$ |
0.87 |
|
|
$ |
0.46 |
|
|
$ |
0.63 |
|
|
Shares used in computing earnings (loss) per common share: |
|
|
|
|
|
|
|
|
|
|
|
|
|
|
|
|
|
|
|
|
|
Basic |
|
|
30,346,999 |
|
|
|
31,670,189 |
|
|
|
34,018,582 |
|
|
|
34,955,760 |
|
|
|
34,761,160 |
|
|
Diluted |
|
|
30,916,364 |
|
|
|
32,108,965 |
|
|
|
34,434,407 |
|
|
|
35,415,483 |
|
|
|
35,784,430 |
|
|
Dividends declared per common share |
|
$ |
0.36 |
|
|
$ |
0.28 |
|
|
$ |
0.24 |
|
|
$ |
0.20 |
|
|
$ |
0.12 |
|
|
|
|
|
|
|
|
|
|
|
|
|
|
|
|
|
|
|
|
|
|
|
|
Balance Sheet Data (at end of fiscal year): |
|
|
|
|
|
|
|
|
|
|
|
|
|
|
|
|
|
|
|
|
|
Cash and cash equivalents |
|
$ |
4,051 |
|
|
$ |
3,788 |
|
|
$ |
3,095 |
|
|
$ |
4,301 |
|
|
$ |
10,586 |
|
|
Total assets |
|
|
242,096 |
|
|
|
207,472 |
|
|
|
198,597 |
|
|
|
218,567 |
|
|
|
228,081 |
|
|
Total long-term debt including current portion |
|
|
50,000 |
|
|
|
25,000 |
|
|
|
- |
|
|
|
13,000 |
|
|
|
19,000 |
|
|
Total shareholders' equity |
|
|
79,504 |
|
|
|
79,009 |
|
|
|
97,902 |
|
|
|
96,311 |
|
|
|
100,653 |
|
22
This discussion and analysis should be read in conjunction with our consolidated financial statements and related notes to the consolidated financial statements. We report our financial results on a 52/53-week fiscal year, which ends on the last Sunday in December. Fiscal year 2017 had 53 weeks while fiscal years 2016 and 2015 included 52 weeks of operations.
Overview
Ruth’s Hospitality Group, Inc. develops and operates fine dining restaurants under the trade name Ruth’s Chris Steak House. As of December 31, 2017, there were 155 Ruth’s Chris Steak House restaurants, including 77 Company-owned restaurants, two restaurants operating under contractual agreements and 76 franchisee-owned restaurants, including 21 international franchisee-owned restaurants in Aruba, Canada, China, Hong Kong, Indonesia, Japan, Mexico, Panama, Singapore, Taiwan and the United Arab Emirates.
On December 12, 2017, we completed the acquisition of substantially all of the assets of the Hawaiian Restaurants for a cash purchase price of $35.4 million. The results of operations, financial position and cash flows of the Hawaiian Restaurants are included in our consolidated financial statements as of the date of the acquisition. For additional information, see Note 3 of the consolidated financial statements.
On January 21, 2015, the Company sold eighteen Mitchell’s Fish Markets and three Mitchell’s/Cameron’s Steakhouse restaurants (collectively, the Mitchell’s Restaurants), to a third party. For financial reporting purposes, the Mitchell’s Restaurants are classified as a discontinued operation for all periods presented.
The Ruth’s Chris menu features a broad selection of high-quality USDA Prime and Choice grade steaks and other premium offerings served in Ruth’s Chris’ signature fashion—“sizzling” and topped with butter—complemented by other traditional menu items inspired by our New Orleans heritage. The Ruth’s Chris restaurants reflect the fifty year commitment to the core values instilled by our founder, Ruth Fertel, of caring for our guests by delivering the highest quality food, beverages and service in a warm and inviting atmosphere.
Our Ruth’s Chris restaurants cater to special occasion diners and frequent customers, in addition to the business clientele traditionally served by upscale steakhouses, by providing a dining experience designed to appeal to a wide range of guests. We believe our focus on creating this broad appeal provides us with opportunities to expand into a wide range of markets, including many markets not traditionally served by upscale steakhouses. We offer USDA Prime and other high quality steaks that are aged and prepared to exact company standards and cooked in 1,800-degree broilers. We also offer veal, lamb, poultry and seafood dishes and a broad selection of appetizers. We complement our distinctive food offerings with an award-winning wine list. During the fiscal year 2017, the average check was $82 per person at Company-owned Ruth’s Chris Restaurants.
All Company-owned Ruth’s Chris Steak House restaurants are located in the United States. The franchisee-owned Ruth’s Chris Steak House restaurants include 21 international franchisee-owned restaurants in Aruba, Canada, China (Hong Kong and Shanghai), Indonesia, Japan, Mexico, Panama, Singapore, Taiwan and the United Arab Emirates. We opened two new Company-owned Ruth’s Chris Steak House restaurants in 2015 – one in St. Petersburg, FL in February and one in Dallas, TX in November. Two new Company-owned Ruth’s Chris Steak House restaurants opened during 2016, in Albuquerque, NM and El Paso, TX. Franchisees opened two new restaurants during 2016, in Jakarta, Indonesia and Greenville, SC. The franchisee-owned Ruth’s Chris Steak House restaurant in San Salvador, El Salvador closed in January 2016. Due to local market conditions and disappointing financial results, we closed our Ruth’s Chris Steak House restaurant in Columbus, OH in February 2016 after nearly seventeen years of operations. In 2017, the Company opened three new Ruth’s Chris Steak House restaurants – one in Waltham, MA in January, one in Cleveland, OH in March and one in Denver in December. One new Ruth’s Chris Steak House restaurant operating under a contractual agreement opened in Tulsa, OK in January 2017. Franchisees opened two new restaurants in 2017, in Chengdu, China and Kauai, HI. The Kauai, HI restaurant was acquired by the Company in December 2017. During the Company’s fiscal year 2017, a franchisee-owned Ruth’s Chris Steak House restaurant in San Juan, Puerto Rico was closed.
Sale of Mitchell’s Restaurants
The Company acquired the Mitchell’s Restaurants in 2008. Mitchell’s Fish Market is an upscale seafood concept and Mitchell’s/Cameron’s Steakhouse is a modern American steakhouse concept.
In November 2014, the Company and Landry’s, Inc. and Mitchell’s Entertainment, Inc., an affiliate of Landry’s Inc. (together with Landry’s Inc., Landry’s), entered into an asset purchase agreement (the Agreement). Pursuant to the Agreement, the Company agreed to sell the Mitchell’s Restaurants and related assets to Landry’s for $10 million. The sale of the Mitchell’s Restaurants closed on January 21, 2015. The assets sold consist primarily of leasehold interests, leasehold improvements, restaurant equipment and
23
furnishings, inventory, and related intangible assets, including brand names and trademarks associated with the 21 Mitchell’s Restaurants. Under the terms of the Agreement, Landry’s assumed the Mitchell’s Restaurants’ facility lease obligations and the Company will reimburse Landry’s for gift cards sold prior to the closing date and used at the Mitchell’s Restaurants during the eighteen months following the closing date. During the third quarter of fiscal year 2016, the Company recognized a $466 thousand benefit from the extinguishment of the liability related to these gift cards. For financial reporting purposes, the Mitchell’s Restaurants are classified as a discontinued operation for all periods presented.
Recap of Fiscal Year 2017 and Fiscal Year 2016 Operating Results
Operating income for fiscal year 2017 decreased from fiscal year 2016 by $877 thousand to $46.7 million. Operating income for fiscal year 2017 was favorably impacted by a $27.3 million increase in restaurant sales, which was offset by increased food and beverage costs, restaurant operating expenses, marketing and advertising, general and administrative costs, depreciation and amortization expenses and pre-opening costs. The Company also had a $3.9 million loss on impairment during fiscal year 2017. Higher restaurant sales were attributable both to an increase in comparable Company-owned restaurant sales and new restaurants. After-tax income from continuing operations during fiscal year 2017 decreased from fiscal year 2016 by $510 thousand to $30.2 million. Fiscal year 2017 net income decreased from fiscal year 2016 by $328 thousand to $30.1 million.
Operating income for fiscal year 2016 increased from fiscal year 2015 by $2.8 million to $47.6 million. Operating income for fiscal year 2016 was favorably impacted by an $11.3 million increase in restaurant sales and a decrease in food and beverage costs of $1.0 million. These favorable impacts were somewhat offset by increased restaurant operating expenses, marketing and advertising, general and administrative costs, depreciation and amortization expenses and pre-opening costs. Higher restaurant sales were attributable both to an increase in comparable Company-owned restaurant sales and new or relocated restaurants. After-tax income from continuing operations during fiscal year 2016 increased from fiscal year 2015 by $589 thousand to $30.8 million. Fiscal year 2016 net income increased from fiscal year 2015 by $461 thousand to $30.5 million.
Key Financial Terms and Metrics
We evaluate our business using a variety of key financial measures:
Restaurant Sales. Restaurant sales consist of food and beverage sales by Company-owned restaurants. Restaurant sales are primarily influenced by total operating weeks in the relevant period and comparable restaurant sales growth. Total operating weeks is the total number of Company-owned restaurants multiplied by the number of weeks each is in operation during the relevant period. Total operating weeks are impacted by restaurant openings and closings, as well as changes in the number of weeks included in the relevant period. Comparable restaurant sales growth reflects the change in year-over-year or quarter-over-quarter, as applicable, sales for the comparable restaurant base. We define the comparable restaurant base to be those Company-owned restaurants in operation for not less than fifteen months prior to the beginning of the fiscal quarter including the period being measured. Comparable restaurant sales growth is primarily influenced by customer traffic, which is measured by the number of entrées sold, and the average guest check. Customer traffic is influenced by the popularity of our menu items, our guest mix, our ability to deliver a high-quality dining experience and overall economic conditions. Average guest check, a measure of total restaurant sales divided by the number of entrées, is driven by menu mix and pricing.
Franchise Income. Franchise income includes (1) franchise and development fees charged to franchisees and (2) royalty income. Franchise royalties consist of 5.0% of adjusted gross sales from each franchisee-owned restaurant. In addition, our more recent franchise agreements require up to a 1.0% advertising fee to be paid by the franchisee, which is applied to national advertising expenditures. Under our prior franchise agreements, the Company would pay 1.0% out of the 5.0% royalty toward national advertising. We evaluate the performance of our franchisees by measuring franchisee-owned restaurant operating weeks, which is impacted by franchisee-owned restaurant openings and closings, and comparable franchisee-owned restaurant sales growth, which together with operating weeks, drives royalty income.
Other Operating Income. Other operating income consists primarily of breakage income associated with gift cards, and also includes fees earned from a management agreement, banquet-related guarantee and services revenue and other incidental guest fees.
Food and Beverage Costs. Food and beverage costs include all restaurant-level food and beverage costs of Company-owned restaurants. We measure food and beverage costs by tracking cost of sales as a percentage of restaurant sales and cost per entrée. Food and beverage costs are generally influenced by the cost of food and beverage items, distribution costs and menu mix.
24
Restaurant Operating Expenses. We measure restaurant operating expenses for Company-owned restaurants as a percentage of restaurant sales. Restaurant operating expenses include the following:
|
• |
Labor costs, consisting of restaurant management salaries, hourly staff payroll and other payroll-related items, including taxes and fringe benefits. We measure our labor cost efficiency by tracking hourly and total labor costs as a percentage of restaurant sales; |
|
• |
Operating costs, consisting of maintenance, utilities, bank and credit card charges, and any other restaurant-level expenses; and |
|
• |
Occupancy costs, consisting of both fixed and variable portions of rent, common area maintenance charges, insurance premiums and real property taxes. |
Marketing and Advertising. Marketing and advertising includes all media, production and related costs for both local restaurant advertising and national marketing. We measure the efficiency of our marketing and advertising expenditures by tracking these costs as a percentage of total revenues. We have historically spent approximately 2.5% to 4.0% of total revenues on marketing and advertising and expect to maintain this level in the near term. All franchise agreements executed based on our new form of franchise agreement include up to a 1.0% advertising fee in addition to the 5.0% royalty fee. We spend this designated advertising fee on national advertising and record these fees as liabilities against which specified advertising and marketing costs will be charged.
General and Administrative. General and administrative costs include costs relating to all corporate and administrative functions that support development and restaurant operations and provide an infrastructure to support future Company and franchisee growth. General and administrative costs are comprised of management, supervisory and staff salaries and employee benefits, travel, performance-based compensation, stock compensation, information systems, training, corporate rent, professional and consulting fees, technology and market research. We measure our general and administrative expense efficiency by tracking these costs as a percentage of total revenues.
Depreciation and Amortization. Depreciation and amortization includes depreciation of fixed assets and certain definite life intangible assets. We depreciate capitalized leasehold improvements over the shorter of the total expected lease term or their estimated useful life.
Pre-Opening Costs. Pre-opening costs consist of costs incurred prior to opening a Company-owned restaurant, which are comprised principally of manager salaries and relocation costs, employee payroll and related training costs for new employees, including practice and rehearsal of service activities as well as lease costs incurred prior to opening.
25
Results of Operations
The table below sets forth certain operating data expressed as a percentage of restaurant sales and total revenues for the periods indicated. Our historical results are not necessarily indicative of the operating results that may be expected in the future. Certain prior year amounts have been reclassified to conform to the current year presentation of discontinued operations.
|
|
|
Fiscal Year |
|
|||||||||
|
|
|
2017 |
|
|
2016 |
|
|
2015 |
|
|||
|
Revenues: |
|
|
|
|
|
|
|
|
|
|
|
|
|
Restaurant sales |
|
|
94.1 |
% |
|
|
94.1 |
% |
|
|
94.2 |
% |
|
Franchise income |
|
|
4.2 |
% |
|
|
4.5 |
% |
|
|
4.5 |
% |
|
Other operating income |
|
|
1.7 |
% |
|
|
1.4 |
% |
|
|
1.3 |
% |
|
Total revenues |
|
|
100.0 |
% |
|
|
100.0 |
% |
|
|
100.0 |
% |
|
|
|
|
|
|
|
|
|
|
|
|
|
|
|
Costs and expenses: |
|
|
|
|
|
|
|
|
|
|
|
|
|
Food and beverage costs (percentage of restaurant sales) |
|
|
29.8 |
% |
|
|
29.5 |
% |
|
|
30.7 |
% |
|
Restaurant operating expenses (percentage of restaurant sales) |
|
|
47.5 |
% |
|
|
47.6 |
% |
|
|
47.1 |
% |
|
Marketing and advertising |
|
|
3.1 |
% |
|
|
3.0 |
% |
|
|
2.9 |
% |
|
General and administrative costs |
|
|
7.9 |
% |
|
|
8.2 |
% |
|
|
8.1 |
% |
|
Depreciation and amortization expenses |
|
|
3.6 |
% |
|
|
3.5 |
% |
|
|
3.4 |
% |
|
Pre-opening costs |
|
|
0.5 |
% |
|
|
0.5 |
% |
|
|
0.3 |
% |
|
Loss on impairment |
|
|
0.9 |
% |
|
|
— |
|
|
|
— |
|
|
Total costs and expenses |
|
|
88.7 |
% |
|
|
87.7 |
% |
|
|
88.0 |
% |
|
Operating income |
|
|
11.3 |
% |
|
|
12.3 |
% |
|
|
12.0 |
% |
|
|
|
|
|
|
|
|
|
|
|
|
|
|
|
Other income (expense): |
|
|
|
|
|
|
|
|
|
|
|
|
|
Interest expense, net |
|
|
(0.2 |
%) |
|
|
(0.3 |
%) |
|
|
(0.2 |
%) |
|
Other |
|
|
0.0 |
% |
|
|
0.0 |
% |
|
|
0.1 |
% |
|
Income from continuing operations before income tax expense |
|
|
11.1 |
% |
|
|
12.0 |
% |
|
|
11.9 |
% |
|
Income tax expense |
|
|
3.8 |
% |
|
|
4.1 |
% |
|
|
3.8 |
% |
|
Income from continuing operations |
|
|
7.3 |
% |
|
|
8.0 |
% |
|
|
8.1 |
% |
|
Loss from discontinued operations, net of income taxes |
|
|
(0.0 |
%) |
|
|
(0.1 |
%) |
|
|
(0.1 |
%) |
|
Net income |
|
|
7.3 |
% |
|
|
7.9 |
% |
|
|
8.0 |
% |
Fiscal Year 2017 Compared to Fiscal Year 2016
Restaurant Sales. Restaurant sales increased $27.3 million, or 7.5%, to $390.4 million during fiscal year 2017 from fiscal year 2016. The increase was attributable to a $14.5 million increase in comparable Company-owned restaurant sales and $12.8 million from new or relocated restaurants. Excluding discontinued operations, total operating weeks during fiscal year 2017 increased to 3,715 from 3,489 during fiscal year 2016. The 53rd week contributed $12.4 million in sales in fiscal year 2017. Comparable Company-owned restaurant sales increased 1.0% on a comparable 53-week basis, which consisted of an average check increase of 1.0%, and flat traffic.
Franchise Income. Franchise income increased $244 thousand, or 1.4%, to $17.5 million during fiscal year 2017 from fiscal year 2016. The increase is primarily attributable to an increase in comparable franchisee-owned restaurant sales of 1.3% offset by a $90 thousand decrease in fees from new or re-located locations or ownership transfers.
Other Operating Income. Other operating income increased $1.3 million, or 24.5%, to $6.8 million during fiscal year 2017 from fiscal year 2016. Other operating income includes our share of income from managed restaurants, gift card breakage revenue and miscellaneous restaurant income. The increase in other operating income was primarily due to an increase of $972 thousand in income from restaurants operating under contractual agreements, including the new location in Tulsa, OK. Fiscal year 2017 gift card breakage revenue increased $326 thousand from fiscal year 2016 due to an increase in gift card sales.
Food and Beverage Costs. Food and beverage costs increased $9.3 million, or 8.7%, to $116.4 million during fiscal year 2017 from fiscal year 2016. Food and beverage costs, as a percentage of restaurant sales, increased 32 basis points to 29.8% compared to fiscal year 2016 largely due to a 4.2% increase in total beef costs.
26
Restaurant Operating Expenses. Restaurant operating expenses increased $12.4 million, or 7.2%, to $185.4 million during fiscal year 2017 from fiscal year 2016. Restaurant operating expenses, as a percentage of restaurant sales, decreased 14 basis points to 47.5% compared to fiscal year 2016 primarily due to a reduction in performance-based compensation.
Marketing and Advertising. Marketing and advertising expenses increased $1.3 million, or 11.6% to $12.7 million during fiscal year 2017 from fiscal year 2016. Marketing and advertising, as a percent of total revenue, increased 11 basis points to 3.1% compared to fiscal year 2016. The increase in marketing and advertising expenses during fiscal year 2017 was attributable to a planned increase in advertising.
General and Administrative. General and administrative expenses increased $1.2 million or 3.8% to $32.7 million during fiscal year 2017 from fiscal year 2016. General and administrative expenses, as a percentage of total revenue decreased from 8.2% in fiscal year 2016 to 7.9% in fiscal year 2017 primarily driven by the leverage of the 53rd week in fiscal year 2017.
Depreciation and Amortization Expenses. Depreciation and amortization expense increased $1.6 million to $15.0 million during fiscal year 2017, primarily due to property additions related to new restaurants and remodel projects placed in service in fiscal years 2016 and 2017.
Pre-opening Costs. Pre-opening costs remained relatively unchanged at $2.0 million, during both fiscal years 2017 and 2016.
Loss on Impairment. During fiscal year 2017 we recognized a $3.9 million loss on impairment related to the impairment of long-lived assets at a Ruth’s Chris Steak House restaurant.
Interest Expense. Interest expense decreased $333 thousand to $821 thousand during fiscal year 2017 from fiscal year 2016. The decrease in expense was primarily due to $302 thousand in lower amortization of deferred financing costs during fiscal year 2017 compared to fiscal year 2016.
Other Income. During fiscal year 2017 we recognized $53 thousand of other income. During fiscal year 2016 we recognized $10 thousand of other income.
Income Tax Expense. During fiscal years 2017 and 2016 we recognized $15.7 million in income tax expense. The effective tax rate increased to 34.1% during fiscal year 2017 compared to 33.7% during fiscal year 2016. The increase in the effective tax rate in 2017 was primarily due to the $1.1 million expense recognized related to the revaluation of the Company’s net deferred tax assets resulting from the passage of the Tax Cuts and Jobs Act (the “2017 Tax Act”), partially offset by a 160 basis point reduction in our state income taxes.
The 2017 Tax Act significantly revises many aspects of existing U.S. tax law, most notably reducing the statutory corporate tax rate from 35% to 21% effective January 1, 2018. Since the 2017 Tax Act was signed into law on December 22, 2017, the Company is required to remeasure its net deferred tax assets to reflect the lower tax rate at which they are expected to be realized. The revaluation of the Company’s net deferred tax assets resulted in a one-time, non-cash tax charge of $1.1 million.
Income from Continuing Operations. Income from continuing operations of $30.2 million during fiscal year 2017 decreased by $510 thousand compared to fiscal year 2016 due to the factors noted above.
Loss from Discontinued Operations, net of income taxes. Loss from discontinued operations, net of income taxes during fiscal year 2017 was a loss of $108 thousand compared to a loss of $290 thousand during fiscal year 2016. Discontinued operations includes the recurring revenues and expenses of closed restaurants and related income taxes. The fiscal year 2017 loss from discontinued operations is primarily attributable to expenses related to the Mitchell’s Restaurants. The fiscal year 2016 loss from discontinued operations is primarily attributable to $842 thousand of occupancy related costs from a closed Ruth’s Chris Steak House restaurant partially offset by a $466 thousand benefit from the extinguishment of a liability related to Mitchell’s Restaurant gift cards and a $186 thousand income tax benefit.
Net Income. Net income was $30.1 million during fiscal year 2017 compared to $30.5 million net income during fiscal year 2016 due to the factors noted above.
Fiscal Year 2016 Compared to Fiscal Year 2015
Restaurant Sales. Restaurant sales increased $11.3 million, or 3.2%, to $363.1 million during fiscal year 2016 from fiscal year 2015. The increase was attributable to a $5.9 million increase in comparable Company-owned restaurant sales and $5.5 million from new or relocated restaurants. Excluding discontinued operations, total operating weeks during fiscal year 2016 increased to 3,489 from 3,433 during fiscal year 2015. Comparable Company-owned restaurant sales increased 1.6%, which consisted of an average check increase of 2.5%, partially offset by a traffic decrease of 0.8%.
27
Franchise Income. Franchise income increased $640 thousand, or 3.8%, to $17.3 million during fiscal year 2016 from fiscal year 2015. The increase was driven primarily by a $426 thousand increase from new or re-located locations which opened during fiscal years 2016. The remaining increase is from an increase in comparable franchisee-owned restaurant sales of 1.0%.
Other Operating Income. Other operating income during fiscal year 2016 increased $602 thousand, or 12.3%, to $5.5 million during fiscal year 2016 from fiscal year 2015. Other operating income includes gift card breakage revenue, our share of income from a managed restaurant and miscellaneous restaurant income. Fiscal year 2016 gift card breakage revenue increased $218 thousand from fiscal year 2015 due to an increase in gift card sales. Our management fee and our share of income from the Cherokee location was $1.4 million during fiscal year 2016 and $992 thousand during fiscal year 2015.
Food and Beverage Costs. Food and beverage costs decreased $1.0 million, or 0.9%, to $107.1 million during fiscal year 2016 from fiscal year 2015. Food and beverage costs, as a percentage of restaurant sales, decreased 124 basis points to 29.5% compared to fiscal year 2015 largely due to a 2.5% increase in menu pricing and 5.5% lower beef costs.
Restaurant Operating Expenses. Restaurant operating expenses increased $7.2 million, or 4.3%, to $173.0 million during fiscal year 2016 from fiscal year 2015. Restaurant operating expenses, as a percentage of restaurant sales, increased 51 basis points to 47.6% compared to fiscal year 2015 primarily due to increased labor costs.
Marketing and Advertising. Marketing and advertising expenses increased $481 thousand to $11.4 million during fiscal year 2016 from fiscal year 2015. The increase in marketing and advertising expenses during fiscal year 2016 was attributable to a planned increase in advertising. Marketing and advertising was 3.0% of total revenues, which was relatively unchanged from fiscal year 2015.
General and Administrative. General and administrative expenses increased $1.2 million to $31.5 million during fiscal year 2016 from fiscal year 2015, primarily due to an increase in legal fees of $1.1 million and salaries of $459 thousand, partially offset by a decrease in incentive and stock-based compensation of $757 thousand.
Depreciation and Amortization Expenses. Depreciation and amortization expense increased $914 thousand to $13.4 million during fiscal year 2016, primarily due to property additions related to new restaurants and remodel projects placed in service in fiscal years 2015 and 2016.
Pre-opening Costs. Pre-opening costs increased $954 thousand to $2.0 million during fiscal year 2016, primarily due to two new restaurant openings in 2016 and two new restaurant openings in January 2017 compared to two new openings in 2015.
Interest Expense. Interest expense increased $364 thousand to $1.2 million during fiscal year 2016 from fiscal year 2015. The increase in expense was primarily due to a higher average debt balance during fiscal year 2016.
Other Income. Other income decreased $348 thousand to $10 thousand during fiscal year 2016 from fiscal year 2015 primarily due to settlement proceeds received during fiscal year 2015 related to overbillings from a vendor for prior periods.
Income Tax Expense. During fiscal year 2016, we recognized income tax expense of $15.7 million. During fiscal year 2015, we recognized income tax expense of $14.2 million. The effective tax rate increased to 33.7% during fiscal year 2016 compared to 32.0% during fiscal year 2015. The increase in the effective tax rate in fiscal year 2016 was primarily due to an increase in state income taxes.
Income from Continuing Operations. Income from continuing operations of $30.8 million during fiscal year 2016 increased by $589 thousand compared to fiscal year 2015 due to the factors noted above.
Loss from Discontinued Operations, net of income taxes. Loss from discontinued operations, net of income taxes during fiscal year 2016 was a loss of $290 thousand compared with a loss of $162 thousand during fiscal year 2015. Discontinued operations includes: the recurring revenues and expenses of restaurants closed or held for sale; impairments and loss on assets of restaurants closed or held for sale; impacts of remeasurement of lease liabilities associated with closed restaurants; and related income taxes.
The fiscal year 2016 loss from discontinued operations is primarily attributable to $842 thousand of occupancy related costs from a closed Ruth’s Chris Steak House restaurant partially offset by a $466 thousand benefit from the extinguishment of a liability related to Mitchell’s Restaurant gift cards and a $186 thousand income tax benefit. The fiscal year 2015 loss from discontinued operations is primarily attributable to a $1.0 million loss from Mitchell’s Restaurants, partially offset by an $869 thousand income tax benefit. The $869 thousand income tax benefit is primarily due to a tax loss recognized on the sale of Mitchell’s Restaurants.
Net Income. Net income was $30.5 million during fiscal year 2016 compared to $30.0 million net income during fiscal year 2015 due to the factors noted above.
28
Segment Profitability
Segment profitability information for the Company’s two operating segments is presented in Note 18 of the consolidated financial statements. Not all operating expenses are allocated to operating segments. The Ruth’s Chris Steak House Company-owned restaurants, which are all located in North America, are managed as an operating segment. The Ruth’s Chris concept operates within the full-service dining industry, providing similar products to similar customers. The franchise operations are reported as a separate operating segment. No costs are allocated to the franchise operations segment.
|
|
|
Fiscal Year |
|
|||||||||
|
|
|
2017 |
|
|
2016 |
|
|
2015 |
|
|||
|
|
|
|
|
|
|
(dollar amounts in thousands) |
|
|
|
|
|
|
|
Revenues: |
|
|
|
|
|
|
|
|
|
|
|
|
|
Company-owned steakhouse restaurants |
|
$ |
394,359 |
|
|
$ |
366,054 |
|
|
$ |
354,398 |
|
|
Franchise operations |
|
|
17,545 |
|
|
|
17,301 |
|
|
|
16,661 |
|
|
Unallocated other revenue and revenue discounts |
|
|
2,919 |
|
|
|
2,592 |
|
|
|
2,374 |
|
|
Total revenues |
|
$ |
414,823 |
|
|
$ |
385,947 |
|
|
$ |
373,433 |
|
|
|
|
|
|
|
|
|
|
|
|
|
|
|
|
Segment profits: |
|
|
|
|
|
|
|
|
|
|
|
|
|
Company-owned steakhouse restaurants |
|
$ |
92,554 |
|
|
$ |
85,980 |
|
|
$ |
80,450 |
|
|
Franchise operations |
|
|
17,545 |
|
|
|
17,301 |
|
|
|
16,661 |
|
|
Total segment profit |
|
|
110,099 |
|
|
|
103,281 |
|
|
|
97,111 |
|
|
|
|
|
|
|
|
|
|
|
|
|
|
|
|
Unallocated operating income |
|
|
2,919 |
|
|
|
2,592 |
|
|
|
2,374 |
|
|
Marketing and advertising expenses |
|
|
(12,724 |
) |
|
|
(11,406 |
) |
|
|
(10,925 |
) |
|
General and administrative costs |
|
|
(32,700 |
) |
|
|
(31,488 |
) |
|
|
(30,242 |
) |
|
Depreciation and amortization expenses |
|
|
(14,995 |
) |
|
|
(13,434 |
) |
|
|
(12,520 |
) |
|
Pre-opening costs |
|
|
(2,013 |
) |
|
|
(1,986 |
) |
|
|
(1,032 |
) |
|
Loss on impairment |
|
|
(3,904 |
) |
|
|
— |
|
|
|
— |
|
|
Interest expense, net |
|
|
(821 |
) |
|
|
(1,154 |
) |
|
|
(790 |
) |
|
Other income |
|
|
53 |
|
|
|
10 |
|
|
|
358 |
|
|
Income from continuing operations before income tax expense |
|
$ |
45,914 |
|
|
$ |
46,415 |
|
|
$ |
44,334 |
|
Fiscal year 2017 segment profits for the Company-owned steakhouse restaurant segment increased by $6.6 million to $92.6 million from fiscal year 2016. The increase was primarily driven by an increase in revenues of $28.3 million, partially offset by an increase in segment expenses of $21.7 million. The $244 thousand increase in franchise operations segment profitability is primarily attributable to an increase in comparable franchisee-owned restaurant sales of 1.3% offset by a $90 thousand decrease in fees from new or re-located locations or ownership transfers.
Fiscal year 2016 segment profits for the Company-owned steakhouse restaurant segment increased by $5.5 million to $86.0 million from fiscal year 2015. The increase was primarily driven by an increase in revenues of $11.7 million, partially offset by an increase in segment expenses of $6.1 million. The $640 thousand increase in franchise operations segment profitability is primarily attributable to a $426 thousand increase from new or re-located locations which opened during fiscal year 2016. The remaining increase is from an increase in comparable franchisee-owned restaurant sales of 1.0%.
Potential Fluctuations in Quarterly Results and Seasonality
Our quarterly operating results may fluctuate significantly as a result of a variety of factors. See “Risk Factors” and “Quantitative and Qualitative Disclosures About Market Risk” for a discussion of certain material risks that could affect our quarterly operating results.
Our business is also subject to seasonal fluctuations. Historically, the percentages of our annual total revenues during the first and fourth fiscal quarters have been higher due, in part, to the year-end holiday season. Accordingly, results for any one quarter are not necessarily indicative of results to be expected for any other quarter or for any year, and comparable restaurant sales for any particular period may decrease.
29
Liquidity and Capital Resources
Overview
Our principal sources of cash during fiscal year 2017 were net cash provided by operating activities and borrowings under our senior credit facility. Our principal uses of cash during fiscal year 2017 were for the acquisition of franchisee restaurants, capital expenditures, principal repayments under our senior credit facility, common stock repurchases and dividend payments. Cash flows from discontinued operations are combined with the cash flows from continuing operations within each of the categories on our statement of cash flows. Except for the receipt of $10 million for the sale of the Mitchell’s Restaurants during the first quarter of fiscal year 2015, the sale of the Mitchell’s Restaurants or any of our closed restaurants reported in discontinued operations did not have a material impact on our cash flow during fiscal year 2015.
In October 2017, our Board of Directors approved a new share repurchase program authorizing the Company to repurchase up to $60 million of outstanding common stock from time to time. The new share repurchase program replaces the previous share repurchase program announced in April 2016, which has been terminated. During fiscal year 2017, 1,169,442 shares were repurchased at an aggregate cost of $23.9 million or an average cost of $20.43 per share. All repurchased shares were retired and cancelled. As of December 31, 2017, $50.7 million remained available for future purchases under the share repurchase program.
During the second quarter of fiscal year 2013, we commenced paying quarterly cash dividends to holders of common and restricted stock. We paid a quarterly cash dividend of $0.09 per share, or $2.9 million in the aggregate, during each of the first and second quarters of fiscal year 2017 and $2.8 million in the third and fourth quarters of fiscal year 2017. On February 21, 2018, we announced that our Board of Directors declared a quarterly cash dividend of $0.11 per share, or $3.4 million in the aggregate, to be paid on March 22, 2018 to common and restricted stockholders of record as of the close of business on March 8, 2018. Future dividends will be subject to the approval of our Board of Directors.
We believe that our borrowing ability under our senior credit facility coupled with our anticipated cash flow from operations should provide us with adequate liquidity in fiscal year 2018.
Senior Credit Facility
As of December 31, 2017, we had $50.0 million of outstanding indebtedness under our senior credit facility with approximately $35.8 million of borrowings available, net of outstanding letters of credit of approximately $4.2 million. As of December 31, 2017, the weighted average interest rate on our outstanding debt was 2.9% and the weighted average interest rate on our outstanding letters of credit was 1.6%. In addition, the fee on the unused portion of our senior credit facility was 0.2%.
On February 2, 2017, we entered into a credit agreement with Wells Fargo Bank, National Association as administrative agent, and certain other lenders (the Credit Agreement) governing a senior credit facility that replaced the prior credit facility. The Credit Agreement provides for a revolving credit facility of $90.0 million with a $5.0 million subfacility for letters of credit and a $5.0 million subfacility for swingline loans. Subject to the satisfaction of certain conditions and lender consent, the revolving credit facility may be increased up to a maximum of $150.0 million. The Credit Agreement has a maturity date of February 2, 2022. At our option, revolving loans may bear interest at (i) LIBOR, plus an applicable margin or (ii) the highest of (a) the rate publicly announced by Wells Fargo as its prime rate, (b) the average published federal funds rate in effect on such day plus 0.50% and (c) one month LIBOR plus 1.00%, plus an applicable margin. The applicable margin is based on our actual leverage ratio, ranging (a) from 1.50% to 2.25% above the applicable LIBOR rate or (b) at our option, from 0.50% to 1.25% above the applicable base rate.
The Credit Agreement contains customary representations and affirmative and negative covenants (including limitations on indebtedness and liens) as well as financial covenants requiring a minimum fixed coverage charge ratio and limiting our consolidated leverage ratio. As of December 31, 2017, we were in compliance with all of the covenants in the Credit Agreement. The Credit Agreement also contains events of default customary for credit facilities of this type (with customary grace periods, as applicable), including nonpayment of principal or interest when due; material incorrectness of representations and warranties when made; breach of covenants; bankruptcy and insolvency; unsatisfied ERISA obligations; unstayed material judgment beyond specified periods; default under other material indebtedness; and certain changes of control of the Company. If any event of default occurs and is not cured within the applicable grace period, or waived, the outstanding loans may be accelerated by lenders holding a majority of the commitments under the Credit Agreement and the lenders’ commitments may be terminated. The obligations under the Credit Agreement are guaranteed by certain of our subsidiaries (the Guarantors), and are secured by a lien on substantially all of our personal property assets other than any equity interest in current and future subsidiaries of the Company.
Under the Credit Agreement, restricted junior payments, which include cash dividend payments, repurchases of our equity securities and payments and prepayments of subordinated indebtedness, made subsequent to February 2, 2017 are limited to $100.0 million if our consolidated leverage ratio is greater than or equal to 2.00:1.00, and are not limited in amount if our consolidated leverage ratio is less than or equal to 2.00:1.00. As of the date of this Annual Report on Form 10-K, $35.3 million in junior restricted payments have been made since February 2, 2017.
30
Capital Expenditures and Acquisition of Restaurants
Capital expenditures in fiscal year 2017, which aggregated $56.6 million, pertained primarily to $9.8 million for new restaurants; $9.7 million for restaurant remodel and capital replacement projects; and $35.4 million related to the acquisition of the Hawaiian Restaurants from the owner franchisee. Capital expenditures in fiscal year 2016, which aggregated $26.2 million, pertained primarily to $13.5 million for new restaurants and $8.4 million for restaurant remodel projects. Capital expenditures in fiscal year 2015, which aggregated $20.3 million, pertained primarily to $12.5 million for restaurant remodel projects and $6.8 million for new restaurants. We anticipate capital expenditures in fiscal year 2018 will be approximately $29.0 to $31.0 million. We currently expect to open one Company-owned restaurant at a leased location in fiscal year 2018.
Cash Flows
The following table summarizes our primary sources and uses of cash (in thousands):
|
|
|
Fiscal Year |
|
|||||||||
|
|
|
2017 |
|
|
2016 |
|
|
2015 |
|
|||
|
Net cash provided by (used in): |
|
|
|
|
|
|
|
|
|
|
|
|
|
Operating activities |
|
$ |
68,693 |
|
|
$ |
56,294 |
|
|
$ |
54,587 |
|
|
Investing activities |
|
|
(56,612 |
) |
|
|
(25,409 |
) |
|
|
(10,292 |
) |
|
Financing activities |
|
|
(11,818 |
) |
|
|
(30,192 |
) |
|
|
(45,501 |
) |
|
Net increase (decrease) in cash and cash equivalents |
|
$ |
263 |
|
|
$ |
693 |
|
|
$ |
(1,206 |
) |
Operating Activities. Operating cash inflows pertain primarily to restaurant sales and franchise income. Operating cash outflows pertain primarily to expenditures for food and beverages, restaurant operating expenses, marketing and advertising and general and administrative costs. Operating activities provided cash flow all three fiscal years primarily because operating revenues have exceeded cash-based expenses.
Investing Activities. Cash used in investing activities in fiscal year 2017 pertained primarily to the acquisition of six franchisee owned restaurants and capital expenditure projects. Fiscal years 2016 and 2015 investing activities were primarily related to capital expenditure projects. During fiscal year 2015, the Company received $10.0 million for the sale of the Mitchell’s Restaurants and related assets.
Financing Activities. Financing activities used cash in all three years. During fiscal year 2017 we: increased the debt outstanding under our senior credit facility by $25.0 million; repurchased common stock of $23.9 million; paid dividends of $11.4 million; and paid $2.1 million in employee taxes in connection with the vesting of restricted stock and the exercise of stock options. We paid $2.1 million in taxes in connection with the vesting of restricted stock and the exercise of stock options because some recipients elected to satisfy their individual tax withholding obligations by having us withhold a number of vested shares of restricted stock and/or a number of shares otherwise issuable pursuant to stock options. During fiscal year 2016, we: used $45.1 million to repurchase common stock; increased the debt outstanding under our prior senior credit facility by $25.0 million; paid dividends of $9.2 million; and paid $1.5 million in employee taxes in connection with the vesting of restricted stock and the exercise of stock options. During fiscal year 2015, we: reduced the debt outstanding under our prior senior credit facility by $13.0 million; used $23.8 million to repurchase common stock; paid dividends of $8.3 million; and paid $1.4 million in employee taxes in connection with the vesting of restricted stock and the exercise of stock options.
Contractual Obligations
The following table summarizes our contractual obligations as of December 31, 2017:
|
|
|
Payments due by period |
|
|||||||||||||||||
|
|
|
|
|
|
|
Less than |
|
|
1-2 |
|
|
3-5 |
|
|
More than |
|
||||
|
|
|
Total |
|
|
1 year |
|
|
years |
|
|
years |
|
|
5 years |
|
|||||
|
|
|
(in millions) |
|
|||||||||||||||||
|
Long-term debt obligations |
|
$ |
51.6 |
|
|
$ |
1.6 |
|
|
$ |
— |
|
|
$ |
50.0 |
|
|
$ |
— |
|
|
Operating lease obligations |
|
|
255.9 |
|
|
|
24.7 |
|
|
|
24.0 |
|
|
|
61.8 |
|
|
|
145.4 |
|
|
Total |
|
$ |
307.5 |
|
|
$ |
26.3 |
|
|
$ |
24.0 |
|
|
$ |
111.8 |
|
|
$ |
145.4 |
|
Long-term debt obligations include principal maturities and expected interest payments. Expected interest payments were estimated using the interest and fee rates under our senior credit facility as of December 31, 2017. Operating lease obligations do not include contingent rent, common area maintenance, property taxes and other pass through charges from our landlords. The above table does not include recorded liabilities to vendors or employees nor does it include routine purchase commitments shorter than twelve months in duration for food and supplies.
31
Pursuant the terms of the Agreement, upon closing of the sale of the Mitchell’s Restaurants in January 2015, Landry’s assumed the lease obligations of the Mitchell’s Restaurants. However, the Company has guaranteed Landry’s lease obligations aggregating $29.4 million under seven of the leases. Landry’s indemnified the Company in the event of a default under any of the leases. The above table does not include potential lease obligations for the Mitchell’s Restaurants.
Off-Balance Sheet Arrangements
As of December 31, 2017, we do not have any off-balance sheet arrangements.
Critical Accounting Policies and Estimates
Our discussion and analysis of results of operations and financial condition is based upon our audited consolidated financial statements, which have been prepared in accordance with U.S. generally accepted accounting principles. The preparation of these consolidated financial statements is based, in part, on our critical accounting policies that require us to make estimates and judgments that affect the amounts reported in those consolidated financial statements. Our significant accounting policies, which may be affected by our estimates and assumptions, are more fully described in Note 2 of the consolidated financial statements. Critical accounting policies are those that we believe are most important to portraying our financial condition and results of operations and also require the greatest amount of subjective or complex judgments by management. Judgments or uncertainties regarding the application of these policies may result in materially different amounts being reported under different conditions or using different assumptions. We consider the following policies to be the most critical in understanding the judgments that are involved in preparing the consolidated financial statements.
Deferred Gift Card Revenue and Gift Card Breakage Revenue
Revenue from restaurant sales is recognized when food and beverage products are sold. Deferred revenue primarily represents the Company’s liability for gift cards that have been sold but not yet redeemed, and is recorded at the expected redemption value. When the gift cards are redeemed, the Company recognizes restaurant sales and reduces the deferred revenue liability. Company issued gift cards redeemed at franchisee-owned restaurants reduce the deferred revenue liability but do not impact our restaurant sales. Gift card transactions involving franchisees are settled on a monthly basis through the Company’s third party gift card provider. The expected redemption value of gift cards represents the full value of all gift cards issued less the amount the Company has recognized as other operating income for gift cards that are not expected to be redeemed.
The portion of gift cards sold to customers which are never redeemed is commonly referred to as gift card breakage. Gift card breakage produces a revenue stream which is a key element of the profitability of the Company’s gift card program and is classified as a component of other operating revenue.
The Company’s accounting method for recognizing breakage revenue is the redemption method. Under the redemption method, breakage revenue is recognized and the gift card liability is derecognized for unredeemed gift cards in proportion to actual gift card redemptions based on historical breakage rates. The Company will continue to review historical gift card redemption information to assess the reasonableness of projected gift card breakage rates and patterns of redemption. Future gift card usage may be different than our historical experience and as result our estimate of cards not expected to be redeemed is subject to inherent uncertainty. If actual redemption activity differs significantly from our historical experience our deferred revenue liability and results of operations could be materially impacted.
Impairment of Long-Lived Assets
We review property and equipment (which includes leasehold improvements) for impairment when events or circumstances indicate these assets might be impaired. We test impairment using historical cash flows and other relevant facts and circumstances as the primary basis for our estimates of future cash flows. The analysis is performed at the restaurant level for indicators of permanent impairment. In determining future cash flows, we make significant estimates with respect to future operating results of each restaurant over the expected remaining life of the primary asset in the restaurant. If assets are determined to be impaired, the loss on impairment is measured by calculating the amount by which the asset-carrying amount exceeds its fair value. This process requires the use of estimates and assumptions, which are subject to a high degree of judgment. If these assumptions change in the future, we may be required to record additional losses on impairment on these assets. During the fourth quarter of fiscal year 2017, the Company recognized a $3.9 million impairment loss due to the decline in the estimated fair value of the long-lived assets (primarily leasehold improvements) of one Ruth’s Chris Steak House restaurant. The decline in the estimated fair value was attributable to decreases in the restaurant’s projected profitability.
32
The judgments we make related to the expected useful lives of long-lived assets and our ability to realize undiscounted cash flows in excess of the carrying amounts of these assets are affected by factors such as the ongoing maintenance and improvements of the assets, changes in economic conditions, changes in usage or operating performance and desirability of the restaurant sites. As we assess the ongoing expected cash flows and carrying amounts of our long-lived assets, significant adverse changes in these factors could cause us to recognize a material loss on impairment.
Generally, costs for exit or disposal activities, including restaurant closures, are expensed as incurred. The costs include the cost of disposing of the assets as well as other facility-related expenses from previously closed restaurants. Additionally, at the date we cease using a property under an operating lease, we record a liability for the net present value of any remaining lease obligations, net of estimated sublease income. Any subsequent adjustments to that liability as a result of lease termination or changes in estimates of sublease income are recorded in the period incurred. Upon disposal of the assets associated with a closed restaurant, any gain or loss is recorded in the same line within our consolidated statements of income as the original impairment.
Valuation and Recoverability of Goodwill and Franchise Rights
Goodwill and franchise rights arose primarily from our acquisition of franchisee-owned Ruth’s Chris restaurants. We recognized $14.8 million of franchise rights and $12.2 million of goodwill related to the acquisition of the Hawaiian Restaurants completed on December 12, 2017. The franchise rights and goodwill recognized for the Hawaiian Restaurants represent preliminary estimates as the acquisition was completed just prior to the end of fiscal year 2017.
Prior to the acquisition of the Hawaiian Restaurants, the most significant acquisitions were completed in 1996, 1999, 2006 and 2007. Goodwill and franchise rights acquired prior to 2008 are not subject to amortization. Such assets must be tested for impairment annually and whenever events or changes in circumstances indicate that the carrying amount may not be recoverable. A variety of inherently uncertain estimates, judgments and projections are used in both assessing whether there has been an indicator that an impairment of an intangible asset may have occurred. We performed our annual impairment test of our goodwill and franchise rights as of November 26, 2017 using a qualitative assessment. In using the qualitative approach, we evaluated factors, including but not limited to, recent financial performance; forecasts for future cash flows; our stock price and market capitalization; recent impairment tests; legal factors; the business climate; and the competitive environment. Any adverse change in these factors could have a significant impact on the recoverability of these assets which could have a material impact on our consolidated financial statements. If we determine that an intangible asset may be impaired, we are required to estimate its fair value. Because similar intangible assets are not bought and sold regularly in public markets, estimates of fair value of our intangible assets are inherently uncertain.
We evaluate the useful lives of our intangible assets to determine if they are definite or indefinite-lived. Reaching a determination on useful life requires significant judgments and assumptions regarding the future effects of obsolescence, demand, competition, other economic factors (such as the stability of the industry, legislative action that results in an uncertain or changing regulatory environment, and expected changes in distribution channels), the level of required capital expenditures, and the expected lives of other related groups of assets.
Insurance Liability
We maintain various insurance policies for workers’ compensation, employee health, general liability and property damage. Pursuant to those policies, we are responsible for losses up to certain limits and are required to estimate a liability that represents our ultimate exposure for aggregate losses below those limits. The recorded liabilities are based on management’s estimates of the ultimate costs to be incurred to settle known claims and claims not reported as of the balance sheet date. We use independent actuaries to develop the estimated workers’ compensation, general and employee health liabilities. Our estimated liability is not discounted and is based on a number of assumptions and factors, including historical trends, actuarial assumptions and economic conditions. If actual trends differ from our estimates, our financial results could be impacted.
Income Taxes
We account for income taxes in accordance with Financial Accounting Standards Board (FASB) Accounting Standards Codification (ASC) Topic 740, Income Taxes (Topic 740). Topic 740 establishes financial accounting and reporting standards for the effects of income taxes that result from an enterprise’s activities during the current and preceding years. It requires an asset and liability approach for financial accounting and reporting of income taxes. We recognize deferred tax liabilities and assets for the future consequences of events that have been recognized in our consolidated financial statements or tax returns. In the event the future consequences of differences between financial reporting bases and tax bases of our assets and liabilities resulted in a net deferred tax asset, an evaluation is made of the probability of our ability to realize the future benefits indicated by such asset. A valuation allowance related to a deferred tax asset is recorded when it is more likely than not that some portion or the entire deferred tax asset will not be realized. The realization of such net deferred tax will generally depend on whether we will have sufficient taxable income of an appropriate character within the carry-forward period permitted by the tax law. Without sufficient taxable income to utilize the
33
deductible amounts and carry forwards, the related tax benefits will expire unused. We have evaluated both positive and negative evidence in making a determination as to whether it is more likely than not that all or some portion of the deferred tax asset will not be realized. Measurement of deferred items is based on enacted tax laws.
Recent Accounting Pronouncements for Future Application
In May 2014, the Financial Accounting Standards Board (FASB) issued Accounting Standards Update (ASU) No. 2014-09, Revenue from Contracts with Customers, (ASU 2014-09), which requires an entity to recognize the amount of revenue to which it expects to be entitled for the transfer of promised goods or services to customers, and will replace most existing revenue recognition guidance in U.S. generally accepted accounting principles when it becomes effective. The new standard is effective for interim and annual periods in fiscal years beginning after December 15, 2017, which will require the Company to adopt these provisions in the first quarter of fiscal 2018. The standard permits the use of either the retrospective or cumulative effect transition method and is expected to impact the Company’s recognition of revenue related to franchise development and site specific fees. The Company currently recognizes franchise development and site specific fees when new franchisee-owned restaurants open. Under ASU 2014-09, development and site specific fees will be recognized over the life of the applicable franchise agreements. The Company expects that the new standard will have a material effect on the consolidated financial statements. The Company expects that the most significant change relates to an increase of approximately $3.0 million to $4.0 million to the deferred revenue liability on the consolidated balance sheet for previously recognized franchise development and site specific fees that will be recognized over the life of the applicable franchise agreements under the new standard. In addition, ASU 2014-09 is expected to impact the classification of advertising contributions from franchisees. The Company currently records advertising contributions from franchisees as a liability against which specified advertising and marketing costs are charged. Under the new standard, advertising contributions from franchisees will be classified as franchise income on the consolidated statements of income. The Company recognized advertising contributions from franchisees totaling $1.5 million, $1.3 million and $1.4 million during fiscal years 2017, 2016 and 2015, respectively, as a reduction to marketing and advertising expense on the consolidated statements of income. The Company is evaluating other potential effects that ASU 2014-09 will have on its consolidated financial statements and related disclosures. The Company is also evaluating whether certain discounts recognized on the sale of gift cards, historically recognized as marketing expense, may potentially be reclassified as a reduction in revenue on the income statement. The Company intends to adopt ASU 2014-09 using the modified retrospective transition method, which involves recording a cumulative adjustment for the impact of transitioning to the new guidance on the transition date.
In February 2016, the FASB issued ASU 2016-02, Leases (Topic 842). This update requires a lessee to recognize on the balance sheet a liability to make lease payments and a corresponding right-of-use asset. The guidance also requires certain qualitative and quantitative disclosures about the amount, timing and uncertainty of cash flows arising from leases. This update is effective for annual and interim periods beginning after December 15, 2018, which will require the Company to adopt these provisions in the first quarter of fiscal year 2019 using a modified retrospective approach. The Company’s restaurants operate under facility lease agreements that provide for material future lease payments (see Note 9). The restaurant facility leases comprise the majority of the Company’s material lease agreements. The Company is currently evaluating the effect of the standard on its ongoing financial reporting, but expects that the adoption of ASU 2016-02 will have a material effect on its consolidated financial statements. The Company expects that the most significant changes relate to 1) the recognition of new right-of-use assets and lease liabilities on the consolidated balance sheet for restaurant facility operating leases and 2) the derecognition of existing lease liabilities on the consolidated balance sheet related to scheduled rent increases.
In August 2016, the FASB issued ASU 2016-15, Statement of Cash Flows: Classification of Certain Cash Receipts and Cash Payments (Topic 230). This update was issued to standardize how certain transactions are classified on the statement of cash flows. This update is effective for fiscal years beginning after December 15, 2017. Early adoption is permitted. The adoption of ASU 2016-15 is not expected to have a significant impact of the Company’s ongoing financial reporting.
34
Interest Rate Risk
The Company is exposed to market risk from fluctuations in interest rates. For fixed rate debt, interest rate changes affect the fair market value of such debt but do not impact earnings or cash flows. Conversely for variable rate debt, including borrowings under the Company’s credit facility, interest rate changes generally do not affect the fair market value of such debt, but do impact future earnings and cash flows, assuming other factors are held constant. At December 31, 2017, the Company had $50.0 million in variable rate debt outstanding. The Company currently does not use financial instruments to hedge its risk to market fluctuations in interest rates. Holding other variables constant (such as debt levels), a hypothetical 100 basis point change in interest rates as of December 31, 2017 would be expected to have an impact on pre-tax earnings and cash flows for fiscal year 2018 of approximately $500 thousand.
Effects of Healthcare Inflation
The Company is exposed to market price fluctuations related to the cost of providing healthcare to its employees. Claim trends are predicted to outpace inflation throughout the upcoming year. Pharmacy costs are also rising in excess of general and medical cost inflation. If prices increase, or the Company experiences significantly more claims, operating margin could be materially adversely affected. Holding other variables constant, a hypothetical 10% fluctuation in healthcare costs would have an approximate impact on pre-tax earnings of approximately $900 thousand for the 2018 fiscal year.
Foreign Currency Risk
The Company believes that fluctuations in foreign exchange rates do not present a material risk to its operations. Franchise fee revenue from international locations aggregated $2.9 million in fiscal years 2017 and 2016.
Commodity Price Risk
The Company is exposed to market price fluctuations in beef and other food product prices. Given the historical volatility of beef and other food product prices, this exposure can impact the Company’s food and beverage costs. As the Company typically sets its menu prices in advance of its beef and other food product purchases, the Company cannot quickly react to changing costs of beef and other food items. To the extent that the Company is unable to pass the increased costs on to its guests through price increases, the Company’s results of operations would be adversely affected. As of December 31, 2017, we have not negotiated set pricing for any substantial portion of our beef requirements for 2018. The market for USDA Prime grade beef is particularly volatile. If prices increase, or the supply of beef is reduced, operating margin could be materially adversely affected. Holding other variables constant, a hypothetical 10% fluctuation in beef prices would have an approximate impact on pre-tax earnings ranging from $4 million to $5 million for fiscal year 2018.
From time to time, the Company enters into purchase price agreements for other lower-volume food products, including poultry and seafood. In the past, certain types of poultry and seafood have experienced fluctuations in availability. Poultry and seafood are also subject to fluctuations in price based on availability, which is often seasonal. If certain types of poultry and seafood are unavailable, or if the Company’s costs increase, the Company’s results of operations could be adversely affected.
Effects of Inflation
Components of the Company’s operations subject to inflation include food, beverage, lease and labor costs. The Company’s leases require it to pay taxes, maintenance, repairs, insurance and utilities, all of which are subject to inflationary increases. The Company believes that general inflation, excluding increases in food, labor and employee health plan costs, has not had a material impact on its results of operations in recent years. Recently, governmental entities acted to increase minimum wage rates in several jurisdictions wherein Company-owned restaurants are located, which will increase our operating costs. The increased minimum wage rates are expected to increase employee compensation and related taxes by approximately $1.3 million in fiscal year 2018 compared to fiscal year 2017. Also, the U.S. government may act to increase the federal minimum wage rate.
The Company’s consolidated financial statements, together with the related notes and report of independent registered public accounting firm, are set forth in the pages indicated in Item 15, Exhibits and Financial Statement Schedules, of this Annual Report on Form 10-K.
35
None.
Evaluation of Disclosure Controls and Procedures
Under the supervision and with the participation of the Company’s management, including the Chief Executive Officer and the Chief Financial Officer, the Company conducted an evaluation of the effectiveness of the design and operation of its disclosure controls and procedures (as defined in Rule 13a-15(e) under the Exchange Act) as of December 31, 2017. Based on that evaluation, the Chief Executive Officer and the Chief Financial Officer concluded that the Company’s disclosure controls and procedures were effective as of December 31, 2017 to ensure that information required to be disclosed in reports filed or submitted by the Company under the Exchange Act is recorded, processed, summarized and reported within the time periods specified in the SEC’s rules and forms and that information required to be disclosed by the Company is accumulated and communicated to the Company’s management to allow timely decisions regarding the required disclosure.
Management’s Report on Internal Control over Financial Reporting
Management is responsible for establishing and maintaining adequate internal control over financial reporting (as defined in Rule 13a-15(f) under the Exchange Act).
Management, including the Chief Executive Officer and Chief Financial Officer, assessed the effectiveness of the Company’s internal control over financial reporting as of December 31, 2017. In making this assessment, management applied the criteria based on the Committee of Sponsoring Organizations of the Treadway Commission in Internal Control – Integrated Framework (2013). The Company’s assessment included documenting, evaluating and testing the design and operating effectiveness of the Company’s internal control over financial reporting. Based upon this evaluation, management concluded that the Company’s internal control over financial reporting was effective as of December 31, 2017. Management excluded from the assessment of the effectiveness of the Company’s internal control over financial reporting as of December 31, 2017, the Hawaiian Restaurants’ internal control over financial reporting associated with total assets of $39.0 million and total revenues of $2.6 million in the consolidated financial statements of the Company as of and for the year ended December 31, 2017.
KPMG LLP, the Company’s independent registered public accounting firm, has audited the consolidated financial statements included herein and issued an audit report on the Company’s internal control over financial reporting as of December 31, 2017, which follows.
Our system of internal control over financial reporting was designed to provide reasonable assurance regarding the preparation and fair presentation of published financial statements in accordance with U.S. generally accepted accounting principles. All internal control systems, no matter how well designed, have inherent limitations. Therefore, even those systems determined to be effective can provide only reasonable assurance and may not prevent or detect misstatements. Also, projections of any evaluation of effectiveness to future periods are subject to the risk that controls may become inadequate because of changes in conditions, or that the degree of compliance with the policies or procedures may deteriorate.
Changes in Internal Control over Financial Reporting
During the fiscal quarter ending December 31, 2017, there was no change in the Company’s internal control over financial reporting (as defined in Rule 13a-15(f) under the Exchange Act) that in the Company’s judgment has materially affected, or is reasonably likely to materially affect, the Company’s internal control over financial reporting.
36
Report of Independent Registered Public Accounting Firm
The Board of Directors and Stockholders
Ruth’s Hospitality Group, Inc.:
Opinion on Internal Control Over Financial Reporting
We have audited Ruth’s Hospitality Group, Inc.’s and subsidiaries’ (the Company) internal control over financial reporting as of December 31, 2017, based on criteria established in Internal Control - Integrated Framework (2013) issued by the Committee of Sponsoring Organizations of the Treadway Commission. In our opinion, the Company maintained, in all material respects, effective internal control over financial reporting as of December 31, 2017, based on criteria established in Internal Control—Integrated Framework (2013) issued by the Committee of Sponsoring Organizations of the Treadway Commission.
The Company acquired six franchisee-owned Ruth’s Chris Steak House restaurants (the “Hawaiian Restaurants”) during 2017, and management excluded from the assessment of the effectiveness of the Company’s internal control over financial reporting as of December 31, 2017, the Hawaiian Restaurants’ internal control over financial reporting associated with total assets of $39.0 million and total revenues of $2.6 million in the consolidated financial statements of the Company as of and for the year ended December 31, 2017. Our audit of internal control over financial reporting of Ruth’s Hospitality Group, Inc. and subsidiaries also excluded an evaluation of the internal control over financial reporting of the Hawaiian Restaurants.
We also have audited, in accordance with the standards of the Public Company Accounting Oversight Board (United States) (PCAOB), the consolidated balance sheets of the Company as of December 31, 2017 and December 25, 2016, the related consolidated statements of income, shareholders’ equity, and cash flows for each of the years in the three-year period ended December 31, 2017, and the related notes (collectively, the consolidated financial statements), and our report dated March 16, 2018 expressed an unqualified opinion on those consolidated financial statements.
Basis for Opinion
The Company’s management is responsible for maintaining effective internal control over financial reporting and for its assessment of the effectiveness of internal control over financial reporting, included in the accompanying Management’s Report on Internal Control Over Financial Reporting. Our responsibility is to express an opinion on the Company’s internal control over financial reporting based on our audit. We are a public accounting firm registered with the PCAOB and are required to be independent with respect to the Company in accordance with the U.S. federal securities laws and the applicable rules and regulations of the Securities and Exchange Commission and the PCAOB.
We conducted our audit in accordance with the standards of the PCAOB. Those standards require that we plan and perform the audit to obtain reasonable assurance about whether effective internal control over financial reporting was maintained in all material respects. Our audit of internal control over financial reporting included obtaining an understanding of internal control over financial reporting, assessing the risk that a material weakness exists, and testing and evaluating the design and operating effectiveness of internal control based on the assessed risk. Our audit also included performing such other procedures as we considered necessary in the circumstances. We believe that our audit provides a reasonable basis for our opinion.
Definition and Limitations of Internal Control Over Financial Reporting
A company’s internal control over financial reporting is a process designed to provide reasonable assurance regarding the reliability of financial reporting and the preparation of financial statements for external purposes in accordance with generally accepted accounting principles. A company’s internal control over financial reporting includes those policies and procedures that (1) pertain to the maintenance of records that, in reasonable detail, accurately and fairly reflect the transactions and dispositions of the assets of the company; (2) provide reasonable assurance that transactions are recorded as necessary to permit preparation of financial statements in accordance with generally accepted accounting principles, and that receipts and expenditures of the company are being made only in accordance with authorizations of management and directors of the company; and (3) provide reasonable assurance regarding prevention or timely detection of unauthorized acquisition, use, or disposition of the company’s assets that could have a material effect on the financial statements.
Because of its inherent limitations, internal control over financial reporting may not prevent or detect misstatements. Also, projections of any evaluation of effectiveness to future periods are subject to the risk that controls may become inadequate because of changes in conditions, or that the degree of compliance with the policies or procedures may deteriorate.
/s/ KPMG LLP
Orlando, Florida
March 16, 2018
Certified Public Accountants
37
None.
38
The information required by this Item is incorporated by reference to the Company’s Proxy Statement for the 2018 Annual Meeting of Stockholders to be filed with the Securities and Exchange Commission within 120 days after the end of the fiscal year covered by this Annual Report on Form 10-K.
We have adopted a Code of Conduct and Ethics Policy that applies to our principal executive officer, principal financial officer and principal accounting officer. The text of our Code of Conduct and Ethics Policy is posted on our website: www.rhgi.com. We intend to disclose future amendments to, or waivers from, certain provisions of the Code of Conduct and Ethics Policy on our website within four business days following the date of such amendment or waiver. Stockholders may request a free copy of the Code of Conduct and Ethics Policy from: Ruth’s Hospitality Group, Inc., Attention: Corporate Secretary, 1030 W. Canton Avenue, Suite 100, Winter Park, Florida 32789.
The information required by this Item is incorporated by reference to the Company’s Proxy Statement for the 2018 Annual Meeting of Stockholders to be filed with the Securities and Exchange Commission within 120 days after the end of the fiscal year covered by this Annual Report on Form 10-K.
|
Item 12. |
SECURITY OWNERSHIP OF CERTAIN BENEFICIAL OWNERS AND MANAGEMENT AND RELATED STOCKHOLDER MATTERS |
Information about security ownership is incorporated by reference to the Company’s Proxy Statement for the 2018 Annual Meeting of Stockholders to be filed with the Securities and Exchange Commission within 120 days after the end of the fiscal year covered by this Annual Report on Form 10-K.
The following table summarizes the number of stock options issued and shares of restricted stock granted, net of forfeitures and sales, the weighted-average exercise price of such stock options and the number of securities remaining to be issued under all outstanding equity compensation plans as of December 31, 2017:
|
|
|
|
|
|
|
|
|
|
Number of Securities |
|
|
|
|
|
|
|
|
|
|
|
|
Remaining Available for |
|
|
|
|
Number of Securities to |
|
|
Weighted-Average |
|
|
Future Issuance Under an |
|
|||
|
|
be Issued Upon Exercise |
|
|
Exercise Price of |
|
|
Equity Compensation Plan |
|
|||
|
|
of Outstanding Options, |
|
|
Outstanding Options, |
|
|
(Excluding Securities |
|
|||
|
Plan Category |
Warrants and Rights |
|
|
Warrants and Rights |
|
|
Reflected in Column (a)) |
|
|||
|
|
(a) |
|
|
(b) |
|
|
(c) |
|
|||
|
Equity compensation plans approved by stockholders: |
|
|
|
|
|
|
|
|
|
|
|
|
Amended and Restated 2005 Long-Term Equity Incentive Plan |
|
1,200,219 |
|
|
$ |
16.51 |
|
|
|
1,807,849 |
|
The information required by this Item is incorporated by reference to the Company’s Proxy Statement for the 2018 Annual Meeting of Stockholders to be filed with the Securities and Exchange Commission within 120 days after the end of the fiscal year covered by this Annual Report on Form 10-K.
The information required by this Item is incorporated by reference to the Company’s Proxy Statement for the 2018 Annual Meeting of Stockholders to be filed with the Securities and Exchange Commission within 120 days after the end of the fiscal year covered by this Annual Report on Form 10-K.
39
(a) Financial Statements and Financial Statement Schedules.
See Index to Consolidated Financial Statements appearing on page F-1. All schedules have been omitted because they are not required or applicable or the information is included in the consolidated financial statements or notes thereto.
(b) Exhibits.
See Exhibit Index appearing on page 41 for a list of exhibits filed with or incorporated by reference as part of this Annual Report on Form 10-K.
None.
40
In reviewing the agreements included as exhibits to this report, please remember they are included to provide you with information regarding their terms and are not intended to provide any other factual or disclosure information about the Company, its subsidiaries or other parties to the agreements. The agreements contain representations and warranties by each of the parties to the applicable agreement. These representations and warranties have been made solely for the benefit of the other parties to the applicable agreement and:
|
|
• |
should not in all instances be treated as categorical statements of fact, but rather as a way of allocating the risk to one of the parties if those statements prove to be inaccurate; |
|
|
• |
have been qualified by disclosures that were made to the other party in connection with the negotiation of the applicable agreement, which disclosures are not necessarily reflected in the agreement; |
|
|
• |
may apply standards of materiality in a way that is different from what may be viewed as material to you or other investors; and |
|
|
• |
were made only as of the date of the applicable agreement or such other date or dates as may be specified in the agreement and are subject to more recent developments. |
Accordingly, these representations and warranties may not describe the actual state of affairs as of the date they were made or at any other time. We acknowledge that, notwithstanding the inclusion of the foregoing cautionary statement, we are responsible for considering whether additional specific disclosures of material information regarding material contractual provisions are required to make the statements in this Annual Report on Form 10-K not misleading. Additional information about the Company may be found elsewhere in this Annual Report on Form 10-K and the Company’s other public files, which are available without charge through the SEC’s website at http://www.sec.gov.
|
Exhibit |
|
Description |
|
|
|
|
|
2.1 |
|
|
|
|
|
|
|
3.1 |
|
|
|
|
|
|
|
3.1.1 |
|
|
|
|
|
|
|
3.1.2 |
|
|
|
|
|
|
|
10.1 |
|
|
|
|
|
|
|
10.2* |
|
|
|
|
|
|
|
10.3* |
|
|
|
|
|
|
|
10.4* |
|
|
|
|
|
|
|
10.5* |
|
|
|
|
|
|
|
10.6* |
|
|
|
|
|
|
|
10.7* |
|
|
|
|
|
|
41
|
Exhibit |
|
Description |
|
10.8* |
|
Company’s Annual Report on Form 10-K filed March 4, 2016). |
|
|
|
|
|
10.9 |
|
|
|
|
|
|
|
10.10 |
|
|
|
|
|
|
|
10.11* |
|
|
|
|
|
|
|
10.12* |
|
|
|
|
|
|
|
10.13* |
|
|
|
|
|
|
|
10.14* |
|
|
|
|
|
|
|
21.1 |
|
|
|
|
|
|
|
23.1 |
|
|
|
|
|
|
|
31.1 |
|
Certification of Chief Executive Officer pursuant to Section 302 of the Sarbanes-Oxley Act of 2002. |
|
|
|
|
|
31.2 |
|
Certification of Chief Financial Officer pursuant to Section 302 of the Sarbanes-Oxley Act of 2002. |
|
|
|
|
|
32.1 |
|
Certification of Chief Executive Officer pursuant to Section 906 of the Sarbanes-Oxley Act of 2002. |
|
|
|
|
|
32.2 |
|
Certification of Chief Financial Officer pursuant to Section 906 of the Sarbanes-Oxley Act of 2002. |
|
|
|
|
|
101.INS |
|
XBRL Instance Document |
|
|
|
|
|
101.SCH |
|
XBRL Taxonomy Extension Schema Document |
|
|
|
|
|
101.CAL |
|
XBRL Taxonomy Extension Calculation Linkbase Document |
|
|
|
|
|
101.DEF |
|
XBRL Taxonomy Extension Definition Linkbase Document |
|
|
|
|
|
101.LAB |
|
XBRL Taxonomy Extension Label Linkbase Document |
|
|
|
|
|
101.PRE |
|
XBRL Taxonomy Extension Presentation Linkbase Document |
|
* |
Management contract or compensatory plan or arrangement |
42
Pursuant to the requirements of Section 13 or 15(d) of the Securities Exchange Act of 1934, the Registrant has duly caused this report to be signed on its behalf by the undersigned, thereunto duly authorized.
March 16, 2018
|
|
|
RUTH’S HOSPITALITY GROUP, INC. |
|
|
|
|
|
By: |
|
/s/ MICHAEL P. O’DONNELL |
|
|
|
Michael P. O’Donnell Chairman of the Board and Chief Executive Officer |
Pursuant to the requirements of the Securities Exchange Act of 1934, this report has been signed by the following persons on behalf of Ruth’s Hospitality Group, Inc. and in the capacities and on the dates indicated.
|
Signatures |
|
Title |
|
Dates |
|
|
|
|
|
|
|
/s/ MICHAEL P. O’DONNELL |
|
Chairman of the Board and Chief Executive Officer (Principal Executive Officer) |
|
March 16, 2018 |
|
Michael P. O’Donnell |
|
|
||
|
|
|
|
|
|
|
/s/ ARNE G. HAAK |
|
Executive Vice President and Chief Financial Officer (Principal Financial and Accounting Officer) |
|
March 16, 2018 |
|
Arne G. Haak |
|
|
||
|
|
|
|
|
|
|
/s/ ROBIN P. SELATI |
|
Lead Director |
|
March 16, 2018 |
|
Robin P. Selati |
|
|
||
|
|
|
|
|
|
|
/s/ GIANNELLA ALVAREZ |
|
Director |
|
March 16, 2018 |
|
Giannella Alvarez |
|
|
||
|
|
|
|
|
|
|
/s/ MARY BAGLIVO |
|
Director |
|
March 16, 2018 |
|
Mary Baglivo |
|
|
|
|
|
|
|
|
|
|
|
/s/ CARLA R. COOPER |
|
Director |
|
March 16, 2018 |
|
Carla R. Cooper |
|
|
||
|
|
|
|
|
|
|
/s/ BANNUS B. HUDSON |
|
Director |
|
March 16, 2018 |
|
Bannus B. Hudson |
|
|
||
|
|
|
|
|
|
|
/s/ STEPHEN M. KING |
|
Director |
|
March 16, 2018 |
|
Stephen M. King |
|
|
||
|
|
|
|
|
|
|
/s/ ROBERT S. MERRITT |
|
Director |
|
March 16, 2018 |
|
Robert S. Merritt |
|
|
43
RUTH’S HOSPITALITY GROUP, INC. AND SUBSIDIARIES
INDEX TO CONSOLIDATED FINANCIAL STATEMENTS
|
|
Page |
|
|
|
|
F-2 |
|
|
|
|
|
F-3 |
|
|
|
|
|
F-4 |
|
|
|
|
|
F-5 |
|
|
|
|
|
F-6 |
|
|
|
|
|
F-7 |
F-1
Report of Independent Registered Public Accounting Firm
The Board of Directors and Stockholders
Ruth’s Hospitality Group, Inc.:
Opinion on the Consolidated Financial Statements
We have audited the accompanying consolidated balance sheets of Ruth’s Hospitality Group, Inc. and subsidiaries (the “Company”) as of December 31, 2017 and December 25, 2016, and the related consolidated statements of income, shareholders’ equity and cash flows for each of the years in the three-year period ended December 31, 2017, and the related notes (collectively, the “consolidated financial statements”). In our opinion, the consolidated financial statements present fairly, in all material respects, the financial position of the Company as of December 31, 2017 and December 25, 2016, and the results of its operations and its cash flows for each of the years in the three-year period ended December 31, 2017, in conformity with U.S. generally accepted accounting principles.
We also have audited, in accordance with the standards of the Public Company Accounting Oversight Board (United States) (“PCAOB”), the Company’s internal control over financial reporting as of December 31, 2017, based on criteria established in Internal Control – Integrated Framework (2013) issued by the Committee of Sponsoring Organizations of the Treadway Commission, and our report dated March 16, 2018 expressed an unqualified opinion on the effectiveness of the Company’s internal control over financial reporting.
Basis for Opinion
These consolidated financial statements are the responsibility of the Company’s management. Our responsibility is to express an opinion on these consolidated financial statements based on our audits. We are a public accounting firm registered with the PCAOB and are required to be independent with respect to the Company in accordance with the U.S. federal securities laws and the applicable rules and regulations of the Securities and Exchange Commission and the PCAOB.
We conducted our audits in accordance with the standards of the PCAOB. Those standards require that we plan and perform the audit to obtain reasonable assurance about whether the consolidated financial statements are free of material misstatement, whether due to error or fraud. Our audits included performing procedures to assess the risks of material misstatement of the consolidated financial statements, whether due to error or fraud, and performing procedures that respond to those risks. Such procedures included examining, on a test basis, evidence regarding the amounts and disclosures in the consolidated financial statements. Our audits also included evaluating the accounting principles used and significant estimates made by management, as well as evaluating the overall presentation of the consolidated financial statements. We believe that our audits provide a reasonable basis for our opinion.
/s/ KPMG LLP
We have served as the Company’s auditor since 1994.
Orlando, Florida
March 16, 2018
Certified Public Accountants
F-2
RUTH'S HOSPITALITY GROUP, INC. AND SUBSIDIARIES
(Amounts in thousands, except share and per share data)
|
|
|
December 31, |
|
|
December 25, |
|
||
|
|
|
2017 |
|
|
2016 |
|
||
|
Assets |
|
|
|
|
|
|
|
|
|
Current assets: |
|
|
|
|
|
|
|
|
|
Cash and cash equivalents |
|
$ |
4,051 |
|
|
$ |
3,788 |
|
|
Accounts receivable, less allowance for doubtful accounts 2017 - $361; 2016 - $729 |
|
|
21,626 |
|
|
|
20,790 |
|
|
Inventory |
|
|
8,688 |
|
|
|
7,396 |
|
|
Prepaid expenses and other |
|
|
2,680 |
|
|
|
2,446 |
|
|
Total current assets |
|
|
37,045 |
|
|
|
34,420 |
|
|
Property and equipment, net of accumulated depreciation 2017 - $144,373; 2016 - $132,817 |
|
|
112,212 |
|
|
|
103,041 |
|
|
Goodwill |
|
|
36,522 |
|
|
|
24,293 |
|
|
Franchise rights, net of accumulated amortization 2017 - $396; 2016 - $218 |
|
|
46,822 |
|
|
|
32,200 |
|
|
Other intangibles, net of accumulated amortization 2017 - $1,181; 2016 - $1,179 |
|
|
3,904 |
|
|
|
2,895 |
|
|
Deferred income taxes |
|
|
4,947 |
|
|
|
9,924 |
|
|
Other assets |
|
|
644 |
|
|
|
699 |
|
|
Total assets |
|
$ |
242,096 |
|
|
$ |
207,472 |
|
|
Liabilities and Shareholders' Equity |
|
|
|
|
|
|
|
|
|
Current liabilities: |
|
|
|
|
|
|
|
|
|
Accounts payable |
|
$ |
10,510 |
|
|
$ |
7,064 |
|
|
Accrued payroll |
|
|
15,903 |
|
|
|
14,902 |
|
|
Accrued expenses |
|
|
11,203 |
|
|
|
11,672 |
|
|
Deferred revenue |
|
|
42,596 |
|
|
|
38,155 |
|
|
Other current liabilities |
|
|
8,313 |
|
|
|
7,622 |
|
|
Total current liabilities |
|
|
88,525 |
|
|
|
79,415 |
|
|
Long-term debt |
|
|
50,000 |
|
|
|
25,000 |
|
|
Deferred rent |
|
|
21,993 |
|
|
|
21,737 |
|
|
Other liabilities |
|
|
2,074 |
|
|
|
2,311 |
|
|
Total liabilities |
|
|
162,592 |
|
|
|
128,463 |
|
|
Commitments and contingencies (Note 12) |
|
|
— |
|
|
|
— |
|
|
Shareholders' equity: |
|
|
|
|
|
|
|
|
|
Common stock, par value $.01 per share; 100,000,000 shares authorized, 29,645,790 shares issued and outstanding at December 31, 2017, 30,549,283 shares issued and outstanding at December 25, 2016 |
|
|
296 |
|
|
|
305 |
|
|
Additional paid-in capital |
|
|
77,017 |
|
|
|
95,266 |
|
|
Retained earnings (accumulated deficit) |
|
|
2,191 |
|
|
|
(16,562 |
) |
|
Treasury stock, at cost; 71,950 shares at December 31, 2017 and December 25, 2016 |
|
|
— |
|
|
|
— |
|
|
Total shareholders' equity |
|
|
79,504 |
|
|
|
79,009 |
|
|
Total liabilities and shareholders' equity |
|
$ |
242,096 |
|
|
$ |
207,472 |
|
See accompanying notes to consolidated financial statements.
F-3
RUTH'S HOSPITALITY GROUP, INC. AND SUBSIDIARIES
Consolidated Statements of Income
(Dollar amounts in thousands, except share and per share data)
|
|
|
Fiscal Year Ended |
|
|||||||||
|
|
|
December 31, |
|
|
December 25, |
|
|
December 27, |
|
|||
|
|
|
2017 |
|
|
2016 |
|
|
2015 |
|
|||
|
Revenues: |
|
|
|
|
|
|
|
|
|
|
|
|
|
Restaurant sales |
|
$ |
390,434 |
|
|
$ |
363,147 |
|
|
$ |
351,875 |
|
|
Franchise income |
|
|
17,545 |
|
|
|
17,301 |
|
|
|
16,661 |
|
|
Other operating income |
|
|
6,844 |
|
|
|
5,499 |
|
|
|
4,897 |
|
|
|
|
|
|
|
|
|
|
|
|
|
|
|
|
Total revenues |
|
|
414,823 |
|
|
|
385,947 |
|
|
|
373,433 |
|
|
|
|
|
|
|
|
|
|
|
|
|
|
|
|
Costs and expenses: |
|
|
|
|
|
|
|
|
|
|
|
|
|
Food and beverage costs |
|
|
116,361 |
|
|
|
107,075 |
|
|
|
108,101 |
|
|
Restaurant operating expenses |
|
|
185,444 |
|
|
|
172,999 |
|
|
|
165,847 |
|
|
Marketing and advertising |
|
|
12,724 |
|
|
|
11,406 |
|
|
|
10,925 |
|
|
General and administrative costs |
|
|
32,700 |
|
|
|
31,488 |
|
|
|
30,242 |
|
|
Depreciation and amortization expenses |
|
|
14,995 |
|
|
|
13,434 |
|
|
|
12,520 |
|
|
Pre-opening costs |
|
|
2,013 |
|
|
|
1,986 |
|
|
|
1,032 |
|
|
Loss on impairment |
|
|
3,904 |
|
|
|
— |
|
|
|
— |
|
|
Total costs and expenses |
|
|
368,141 |
|
|
|
338,388 |
|
|
|
328,667 |
|
|
Operating income |
|
|
46,682 |
|
|
|
47,559 |
|
|
|
44,766 |
|
|
Other income (expense): |
|
|
|
|
|
|
|
|
|
|
|
|
|
Interest expense, net |
|
|
(821 |
) |
|
|
(1,154 |
) |
|
|
(790 |
) |
|
Other |
|
|
53 |
|
|
|
10 |
|
|
|
358 |
|
|
Income from continuing operations before income tax expense |
|
|
45,914 |
|
|
|
46,415 |
|
|
|
44,334 |
|
|
Income tax expense |
|
|
15,669 |
|
|
|
15,660 |
|
|
|
14,168 |
|
|
Income from continuing operations |
|
|
30,245 |
|
|
|
30,755 |
|
|
|
30,166 |
|
|
Loss from discontinued operations, net of income taxes |
|
|
(108 |
) |
|
|
(290 |
) |
|
|
(162 |
) |
|
Net income |
|
$ |
30,137 |
|
|
$ |
30,465 |
|
|
$ |
30,004 |
|
|
|
|
|
|
|
|
|
|
|
|
|
|
|
|
Basic earnings (loss) per common share: |
|
|
|
|
|
|
|
|
|
|
|
|
|
Continuing operations |
|
$ |
1.00 |
|
|
$ |
0.97 |
|
|
$ |
0.88 |
|
|
Discontinued operations |
|
|
(0.01 |
) |
|
|
(0.01 |
) |
|
|
— |
|
|
Basic earnings per share |
|
$ |
0.99 |
|
|
$ |
0.96 |
|
|
$ |
0.88 |
|
|
|
|
|
|
|
|
|
|
|
|
|
|
|
|
Diluted earnings (loss) per common share: |
|
|
|
|
|
|
|
|
|
|
|
|
|
Continuing operations |
|
$ |
0.98 |
|
|
$ |
0.96 |
|
|
$ |
0.87 |
|
|
Discontinued operations |
|
|
(0.01 |
) |
|
|
(0.01 |
) |
|
|
— |
|
|
Diluted earnings per share |
|
$ |
0.97 |
|
|
$ |
0.95 |
|
|
$ |
0.87 |
|
|
|
|
|
|
|
|
|
|
|
|
|
|
|
|
Shares used in computing earnings (loss) per common share: |
|
|
|
|
|
|
|
|
|
|
|
|
|
Basic |
|
|
30,346,999 |
|
|
|
31,670,189 |
|
|
|
34,018,582 |
|
|
Diluted |
|
|
30,916,364 |
|
|
|
32,108,965 |
|
|
|
34,434,407 |
|
|
|
|
|
|
|
|
|
|
|
|
|
|
|
|
Cash dividends declared per common share |
|
$ |
0.36 |
|
|
$ |
0.28 |
|
|
$ |
0.24 |
|
See accompanying notes to consolidated financial statements.
F-4
RUTH'S HOSPITALITY GROUP, INC AND SUBSIDIARIES
Consolidated Statements of Shareholders' Equity
(Amounts in thousands)
|
|
|
|
|
|
|
|
|
|
|
|
|
|
|
(Accumulated |
|
|
|
|
|
|
|
|
|
|
|
|
|
|
|
|
|
|
|
|
|
|
|
|
|
Additional |
|
|
Deficit) |
|
|
|
|
|
|
|
|
|
|
|
|
|
||
|
|
|
Common Stock |
|
|
Paid-in |
|
|
Retained |
|
|
Treasury Stock |
|
|
Shareholders' |
|
|||||||||||||
|
|
|
Shares |
|
|
Value |
|
|
Capital |
|
|
Earnings |
|
|
Shares |
|
|
Value |
|
|
Equity |
|
|||||||
|
Balance at December 28, 2014 |
|
|
34,334 |
|
|
$ |
343 |
|
|
$ |
155,455 |
|
|
$ |
(59,487 |
) |
|
|
72 |
|
|
$ |
— |
|
|
$ |
96,311 |
|
|
Net income |
|
|
— |
|
|
|
— |
|
|
|
— |
|
|
|
30,004 |
|
|
|
— |
|
|
|
— |
|
|
|
30,004 |
|
|
Cash dividends |
|
|
— |
|
|
|
— |
|
|
|
— |
|
|
|
(8,349 |
) |
|
|
— |
|
|
|
— |
|
|
|
(8,349 |
) |
|
Repurchase of common stock |
|
|
(1,483 |
) |
|
|
(15 |
) |
|
|
(23,737 |
) |
|
|
— |
|
|
|
— |
|
|
|
— |
|
|
|
(23,752 |
) |
|
Shares issued under stock compensation plan net of shares withheld for tax effects |
|
|
295 |
|
|
|
3 |
|
|
|
(1,145 |
) |
|
|
— |
|
|
|
— |
|
|
|
— |
|
|
|
(1,142 |
) |
|
Excess tax benefit from stock based compensation |
|
|
— |
|
|
|
— |
|
|
|
743 |
|
|
|
— |
|
|
|
— |
|
|
|
— |
|
|
|
743 |
|
|
Stock-based compensation |
|
|
— |
|
|
|
— |
|
|
|
4,087 |
|
|
|
— |
|
|
|
— |
|
|
|
— |
|
|
|
4,087 |
|
|
Balance at December 27, 2015 |
|
|
33,146 |
|
|
|
331 |
|
|
|
135,403 |
|
|
|
(37,832 |
) |
|
|
72 |
|
|
|
— |
|
|
|
97,902 |
|
|
Net income |
|
|
— |
|
|
|
— |
|
|
|
— |
|
|
|
30,465 |
|
|
|
— |
|
|
|
— |
|
|
|
30,465 |
|
|
Cash dividends |
|
|
— |
|
|
|
— |
|
|
|
— |
|
|
|
(9,195 |
) |
|
|
— |
|
|
|
— |
|
|
|
(9,195 |
) |
|
Repurchase of common stock |
|
|
(2,824 |
) |
|
|
(28 |
) |
|
|
(45,048 |
) |
|
|
— |
|
|
|
— |
|
|
|
— |
|
|
|
(45,076 |
) |
|
Shares issued under stock compensation plan net of shares withheld for tax effects |
|
|
227 |
|
|
|
2 |
|
|
|
(1,301 |
) |
|
|
— |
|
|
|
— |
|
|
|
— |
|
|
|
(1,299 |
) |
|
Excess tax benefit from stock based compensation |
|
|
— |
|
|
|
— |
|
|
|
378 |
|
|
|
— |
|
|
|
— |
|
|
|
— |
|
|
|
378 |
|
|
Stock-based compensation |
|
|
— |
|
|
|
|
|
|
|
5,834 |
|
|
|
— |
|
|
|
— |
|
|
|
— |
|
|
|
5,834 |
|
|
Balance at December 25, 2016 |
|
|
30,549 |
|
|
|
305 |
|
|
|
95,266 |
|
|
|
(16,562 |
) |
|
|
72 |
|
|
|
— |
|
|
|
79,009 |
|
|
Net income |
|
|
— |
|
|
|
— |
|
|
|
— |
|
|
|
30,137 |
|
|
|
— |
|
|
|
— |
|
|
|
30,137 |
|
|
Cash dividends |
|
|
— |
|
|
|
— |
|
|
|
— |
|
|
|
(11,383 |
) |
|
|
— |
|
|
|
— |
|
|
|
(11,383 |
) |
|
Repurchase of common stock |
|
|
(1,169 |
) |
|
|
(12 |
) |
|
|
(23,876 |
) |
|
|
— |
|
|
|
— |
|
|
|
— |
|
|
|
(23,888 |
) |
|
Shares issued under stock compensation plan net of shares withheld for tax effects |
|
|
266 |
|
|
|
3 |
|
|
|
(1,136 |
) |
|
|
— |
|
|
|
— |
|
|
|
— |
|
|
|
(1,133 |
) |
|
Stock-based compensation |
|
|
— |
|
|
|
— |
|
|
|
6,763 |
|
|
|
— |
|
|
|
— |
|
|
|
— |
|
|
|
6,763 |
|
|
Balance at December 31, 2017 |
|
|
29,646 |
|
|
$ |
296 |
|
|
$ |
77,017 |
|
|
$ |
2,191 |
|
|
|
72 |
|
|
$ |
— |
|
|
$ |
79,504 |
|
See accompanying notes to consolidated financial statements.
F-5
RUTH'S HOSPITALITY GROUP, INC AND SUBSIDIARIES
Consolidated Statements of Cash Flows
(Dollar amounts in thousands)
|
|
|
Fiscal Year Ended |
|
|||||||||
|
|
|
December 31, |
|
|
December 25, |
|
|
December 27, |
|
|||
|
|
|
2017 |
|
|
2016 |
|
|
2015 |
|
|||
|
Cash flows from operating activities: |
|
|
|
|
|
|
|
|
|
|
|
|
|
Net income |
|
$ |
30,137 |
|
|
$ |
30,465 |
|
|
$ |
30,004 |
|
|
Adjustments to reconcile net income to net cash provided by operating activities: |
|
|
|
|
|
|
|
|
|
|
|
|
|
Depreciation and amortization |
|
|
14,995 |
|
|
|
13,434 |
|
|
|
12,520 |
|
|
Deferred income taxes |
|
|
4,977 |
|
|
|
9,384 |
|
|
|
9,519 |
|
|
Non-cash interest expense |
|
|
119 |
|
|
|
421 |
|
|
|
421 |
|
|
Debt issuance costs written-off |
|
|
16 |
|
|
|
— |
|
|
|
— |
|
|
Gain on the disposal of property and equipment, net |
|
|
— |
|
|
|
(108 |
) |
|
|
— |
|
|
Loss on impairment |
|
|
3,904 |
|
|
|
— |
|
|
|
— |
|
|
Amortization of below market lease |
|
|
7 |
|
|
|
— |
|
|
|
— |
|
|
Stock-based compensation expense |
|
|
6,763 |
|
|
|
5,834 |
|
|
|
4,087 |
|
|
Changes in operating assets and liabilities: |
|
|
|
|
|
|
|
|
|
|
|
|
|
Accounts receivable |
|
|
(836 |
) |
|
|
(2,259 |
) |
|
|
1,957 |
|
|
Inventories |
|
|
(710 |
) |
|
|
83 |
|
|
|
(273 |
) |
|
Prepaid expenses and other |
|
|
(231 |
) |
|
|
(1,187 |
) |
|
|
32 |
|
|
Other assets |
|
|
482 |
|
|
|
96 |
|
|
|
92 |
|
|
Accounts payable and accrued expenses |
|
|
5,718 |
|
|
|
(5,213 |
) |
|
|
(3,763 |
) |
|
Deferred revenue |
|
|
3,692 |
|
|
|
2,953 |
|
|
|
650 |
|
|
Deferred rent |
|
|
19 |
|
|
|
1,463 |
|
|
|
285 |
|
|
Other liabilities |
|
|
(359 |
) |
|
|
928 |
|
|
|
(944 |
) |
|
Net cash provided by operating activities |
|
|
68,693 |
|
|
|
56,294 |
|
|
|
54,587 |
|
|
Cash flows from investing activities: |
|
|
|
|
|
|
|
|
|
|
|
|
|
Acquisition of property and equipment |
|
|
(21,255 |
) |
|
|
(26,211 |
) |
|
|
(20,292 |
) |
|
Acquisition of franchise restaurant, net of cash acquired |
|
|
(35,357 |
) |
|
|
— |
|
|
|
— |
|
|
Proceeds from sale of Mitchell's |
|
|
— |
|
|
|
— |
|
|
|
10,000 |
|
|
Proceeds from sale of property and equipment |
|
|
— |
|
|
|
802 |
|
|
|
— |
|
|
Net cash used in investing activities |
|
|
(56,612 |
) |
|
|
(25,409 |
) |
|
|
(10,292 |
) |
|
Cash flows from financing activities: |
|
|
|
|
|
|
|
|
|
|
|
|
|
Principal borrowings on long-term debt |
|
|
70,000 |
|
|
|
48,000 |
|
|
|
35,000 |
|
|
Principal repayments on long-term debt |
|
|
(45,000 |
) |
|
|
(23,000 |
) |
|
|
(48,000 |
) |
|
Repurchase of common stock |
|
|
(23,888 |
) |
|
|
(45,076 |
) |
|
|
(23,752 |
) |
|
Cash dividend payments |
|
|
(11,383 |
) |
|
|
(9,195 |
) |
|
|
(8,349 |
) |
|
Tax payments from the vesting of restricted stock and option exercises |
|
|
(2,079 |
) |
|
|
(1,518 |
) |
|
|
(1,393 |
) |
|
Excess tax benefits from stock compensation |
|
|
— |
|
|
|
378 |
|
|
|
743 |
|
|
Proceeds from the exercise of stock options |
|
|
945 |
|
|
|
219 |
|
|
|
250 |
|
|
Deferred financing costs |
|
|
(413 |
) |
|
|
— |
|
|
|
— |
|
|
Net cash used in financing activities |
|
|
(11,818 |
) |
|
|
(30,192 |
) |
|
|
(45,501 |
) |
|
Net increase (decrease) in cash and cash equivalents |
|
|
263 |
|
|
|
693 |
|
|
|
(1,206 |
) |
|
Cash and cash equivalents at beginning of period |
|
|
3,788 |
|
|
|
3,095 |
|
|
|
4,301 |
|
|
Cash and cash equivalents at end of period |
|
$ |
4,051 |
|
|
$ |
3,788 |
|
|
$ |
3,095 |
|
|
Supplemental disclosures of cash flow information: |
|
|
|
|
|
|
|
|
|
|
|
|
|
Cash paid during the period for: |
|
|
|
|
|
|
|
|
|
|
|
|
|
Interest, net of capitalized interest |
|
$ |
667 |
|
|
$ |
729 |
|
|
$ |
428 |
|
|
Income taxes |
|
$ |
10,680 |
|
|
$ |
3,625 |
|
|
$ |
410 |
|
|
Noncash investing and financing activities: |
|
|
|
|
|
|
|
|
|
|
|
|
|
Accrued acquisition of property and equipment |
|
$ |
3,012 |
|
|
$ |
3,962 |
|
|
$ |
1,608 |
|
See accompanying notes to consolidated financial statements.
F-6
RUTH’S HOSPITALITY GROUP, INC. AND SUBSIDIARIES
Notes to Consolidated Financial Statements
(1) The Company, Organization and Description of Business
Ruth’s Hospitality Group, Inc. and its subsidiaries (the Company) operate Ruth’s Chris Steak House restaurants and sell franchise rights to Ruth’s Chris Steak House franchisees giving the franchisees the exclusive right to operate similar restaurants in a particular area designated in the franchise agreement.
At December 31, 2017, there were 155 Ruth’s Chris Steak House restaurants, of which 77 were Company-owned, 76 were franchisee-owned, and two locations were operating under a contractual agreement. All Company-owned restaurants are located in the United States. The franchisee-owned restaurants include 21 international restaurants in Aruba, Canada, China (Hong Kong and Shanghai), Indonesia, Japan, Mexico, Panama, Singapore, Taiwan and the United Arab Emirates. Three new Company-owned Ruth’s Chris Steak House restaurants opened during 2017, in Waltham, MA, Cleveland, OH and Denver, CO. Franchisees opened two new restaurants during 2017, in Chengdu, China and Kauai, HI. One new restaurant operating under a contractual agreement opened in Tulsa, OK. During the Company’s fiscal year 2017, a franchisee-owned Ruth’s Chris Steak House restaurant in San Juan, Puerto Rico was closed.
On December 12, 2017, the Company completed the acquisition of substantially all of the assets of six franchisee-owned Ruth’s Chris Steak House restaurants located in Hawaii (the “Hawaiian Restaurants”) for a cash purchase price of $35.4 million. The acquisition was funded with borrowings under the Company’s senior credit facility. The results of operations, financial position and cash flows of the Hawaiian Restaurants are included in the Company’s consolidated financial statements as of the date of the acquisition. For additional information, see Note 3.
As of December 28, 2014, the Company also operated eighteen Mitchell’s Fish Markets and three Mitchell’s/Cameron’s Steakhouse restaurants (collectively, the Mitchell’s Restaurants), located primarily in the Midwest and Florida. On January 21, 2015, the Company sold the Mitchell’s Restaurants to a third party. For financial reporting purposes, the Mitchell’s Restaurants are classified as a discontinued operation for all periods presented. See Notes 4 and 5 for additional information regarding the Mitchell’s Restaurants and the sale.
The following table summarizes the changes in the number of Company-owned Ruth’s Chris Steak House restaurants and franchisee-owned restaurants during the fourteen and fifty-three weeks ended December 31, 2017.
|
|
|
14 Weeks Ending |
|
|
53 Weeks Ending |
|
||||||||||||||||||||||||||
|
|
|
December 31, 2017 |
|
|
December 31, 2017 |
|
||||||||||||||||||||||||||
|
Ruth's Chris Steak House |
|
Company |
|
|
Franchised |
|
|
Managed |
|
|
Total |
|
|
Company |
|
|
Franchised |
|
|
Managed |
|
|
Total |
|
||||||||
|
Beginning of period |
|
|
70 |
|
|
|
81 |
|
|
|
2 |
|
|
|
153 |
|
|
|
68 |
|
|
|
81 |
|
|
|
1 |
|
|
|
150 |
|
|
Acquired |
|
|
6 |
|
|
|
0 |
|
|
|
0 |
|
|
|
6 |
|
|
|
6 |
|
|
|
0 |
|
|
|
0 |
|
|
|
6 |
|
|
Sold |
|
|
0 |
|
|
|
6 |
|
|
|
0 |
|
|
|
6 |
|
|
|
0 |
|
|
|
6 |
|
|
|
0 |
|
|
|
6 |
|
|
New |
|
|
1 |
|
|
|
1 |
|
|
|
0 |
|
|
|
2 |
|
|
|
3 |
|
|
|
2 |
|
|
|
1 |
|
|
|
6 |
|
|
Closed |
|
|
0 |
|
|
|
0 |
|
|
|
0 |
|
|
|
0 |
|
|
|
0 |
|
|
|
1 |
|
|
|
0 |
|
|
|
1 |
|
|
End of period |
|
|
77 |
|
|
|
76 |
|
|
|
2 |
|
|
|
155 |
|
|
|
77 |
|
|
|
76 |
|
|
|
2 |
|
|
|
155 |
|
|
% of total |
|
|
50 |
% |
|
|
49 |
% |
|
|
1 |
% |
|
|
100 |
% |
|
|
50 |
% |
|
|
49 |
% |
|
|
1 |
% |
|
|
100 |
% |
(2) Summary of Significant Accounting Policies
(a) Basis of Presentation
The Company utilizes a 52- or 53-week reporting period ending on the last Sunday of December. The period ended December 31, 2017 had a 53-week reporting period. The periods ended December 25, 2016 (fiscal year 2016) and December 27, 2015 (fiscal year 2015) each had a 52-week reporting period. The consolidated financial statements are prepared in conformity with U.S. generally accepted accounting principles and include the financial statements of Ruth’s Hospitality Group, Inc. and its wholly owned subsidiaries. All significant inter-company balances and transactions have been eliminated in consolidation.
F-7
The preparation of consolidated financial statements in conformity with U.S. generally accepted accounting principles requires management to make estimates and assumptions that affect the reported amounts of assets and liabilities and the disclosure of contingent assets and liabilities at the date of the consolidated financial statements and the reported amounts of revenues and expenses during the reporting period. Actual results could differ from those estimates.
Certain prior year amounts have been reclassified to conform to the current year presentation. Most significantly, the results of the Mitchell’s Restaurants have been reclassified as a discontinued operation.
(b) Recent Accounting Pronouncements
In May 2014, the Financial Accounting Standards Board (FASB) issued Accounting Standards Update (ASU) No. 2014-09, Revenue from Contracts with Customers, (ASU 2014-09), which requires an entity to recognize the amount of revenue to which it expects to be entitled for the transfer of promised goods or services to customers, and will replace most existing revenue recognition guidance in U.S. generally accepted accounting principles when it becomes effective. The new standard is effective for interim and annual periods in fiscal years beginning after December 15, 2017, which will require the Company to adopt these provisions in the first quarter of fiscal 2018. The standard permits the use of either the retrospective or cumulative effect transition method and is expected to impact the Company’s recognition of revenue related to franchise development and site specific fees. The Company currently recognizes franchise development and site specific fees when new franchisee-owned restaurants open. Under ASU 2014-09, development and site specific fees will be recognized over the life of the applicable franchise agreements. The Company expects that the most significant change relates to an increase of approximately $3.0 million to $4.0 million to the deferred revenue liability on the consolidated balance sheet for previously recognized franchise development and site specific fees that will be recognized over the life of the applicable franchise agreements under the new standard. In addition, ASU 2014-09 is expected to impact the classification of advertising contributions from franchisees. The Company currently records advertising contributions from franchisees as a liability against which specified advertising and marketing costs are charged. Under the new standard, advertising contributions from franchisees will be classified as franchise income on the consolidated statements of income. The Company recognized advertising contributions from franchisees totaling $1.5 million, $1.3 million and $1.4 million during fiscal years 2017, 2016 and 2015, respectively, as a reduction to marketing and advertising expense on the consolidated statements of income. The Company is evaluating other potential effects that ASU 2014-09 will have on its consolidated financial statements and related disclosures. The Company is also evaluating whether certain discounts recognized on the sale of gift cards, historically recognized as marketing expense, may potentially be reclassified as a reduction in revenue on the income statement. The Company intends to adopt ASU 2014-09 using the modified retrospective transition method, which involves recording a cumulative adjustment for the impact of transitioning to the new guidance on the transition date.
In February 2016, the FASB issued ASU 2016-02, Leases (Topic 842). This update requires a lessee to recognize on the balance sheet a liability to make lease payments and a corresponding right-of-use asset. The guidance also requires certain qualitative and quantitative disclosures about the amount, timing and uncertainty of cash flows arising from leases. This update is effective for annual and interim periods beginning after December 15, 2018, which will require the Company to adopt these provisions in the first quarter of fiscal year 2019 using a modified retrospective approach. The Company’s restaurants operate under facility lease agreements that provide for material future lease payments (see Note 10). The restaurant facility leases comprise the majority of the Company’s material lease agreements. The Company is currently evaluating the effect of the standard on its ongoing financial reporting, but expects that the adoption of ASU 2016-02 will have a material effect on its consolidated financial statements. The Company expects that the most significant changes relate to 1) the recognition of new right-of–use assets and lease liabilities on the consolidated balance sheet for restaurant facility operating leases; and 2) the derecognition of existing lease liabilities on the consolidated balance sheet related to scheduled rent increases.
In August 2016 the FASB issued ASU 2016-15, Statement of Cash Flows: Classification of Certain Cash Receipts and Cash Payments (Topic 230). This update was issued to standardize how certain transactions are classified on the statement of cash flows. This update is effective for fiscal years beginning after December 15, 2017. Early adoption is permitted. The adoption of ASU 2016-15 is not expected to have a significant impact of the Company’s ongoing financial reporting.
(c) Contingencies
The Company recognizes liabilities for contingencies when there is an exposure that indicates it is both probable that an asset has been impaired or that a liability has been incurred and that the amount of impairment or loss can be reasonably estimated.
(d) Cash Equivalents
For purposes of the consolidated financial statements, the Company considers all highly liquid investments purchased with an original maturity of three months or less to be cash equivalents.
F-8
(e) Accounts Receivable
Accounts receivable consists primarily of bank credit cards receivable, landlord contributions, franchise royalty payments receivable, receivables from gift card sales, banquet billings receivable and other miscellaneous receivables.
(f) Allowance for Doubtful Accounts
The Company performs a specific review of account balances and applies historical collection experience to the various aging categories of receivable balances in establishing an allowance.
(g) Inventories
Inventories consist of food, beverages and supplies and are stated at the lower of cost or market. Cost is determined using the first-in, first-out method.
(h) Property and Equipment, net
Property and equipment are stated at cost. Expenditures for improvements and replacements are capitalized and maintenance and repairs are charged to expense. Depreciation is computed on a straight-line basis over the estimated useful lives of the assets. Leasehold improvements are amortized on the straight-line basis over the shorter of the lease term or the estimated useful lives of the assets. The estimated useful lives for assets are as follows: Building and Building Improvements, 20 to 40 years; Equipment, 5 years; Furniture and Fixtures, 5 to 7 years; Computer Equipment, 3 to 5 years; and Leasehold Improvements, 5 to 20 years (limited by the lease term).
(i) Goodwill and Franchise Rights
Goodwill acquired in a business combination that is determined to have an indefinite useful life is not amortized, but reviewed for impairment at least annually in accordance with the provisions of FASB Accounting Standards Committee (ASC) Topic 350, Intangibles-Goodwill and Other. In accordance with ASU 2017-04, Simplifying the Test for Goodwill Impairment (Topic 350), goodwill is reviewed annually for impairment on a reporting unit basis and more frequently if events and circumstances indicate that the asset might be impaired. For purposes of testing goodwill impairment, a reporting unit is defined as a group of restaurants with similar economic characteristics. An impairment loss is recognized to the extent that the financial statement carrying amount exceeds the asset’s fair value.
Franchise rights acquired prior to 2008 in a purchase business combination that are determined to have an indefinite useful life are not amortized, but are reviewed for impairment at least annually on a reporting unit basis, which is defined as a group of reacquired restaurants, and more frequently if events and circumstances indicate that the asset might be impaired. The Company allows and expects franchisees to renew agreements indefinitely ensuring consistent cash flows. As a result, franchise rights acquired prior to 2008 are determined to have indefinite useful lives. An impairment loss is recognized to the extent that the carrying amount exceeds the asset’s fair value. Franchise rights acquired after 2007 are no longer considered to have indefinite useful lives and are amortized in accordance with FASB ASC Topic 350.
(j) Impairment or Disposal of Long-Lived Assets
In accordance with FASB ASC Topic 360-10, Property, Plant and Equipment—Impairment or Disposal of Long-Lived Assets, (Topic 360-10), long lived assets, such as property and equipment and purchased intangibles subject to amortization, are reviewed for impairment on a restaurant-by-restaurant basis whenever events or changes in circumstances indicate that the carrying amount of an asset may not be recoverable. Recoverability of assets to be held and used is measured by a comparison of the carrying amount of an asset to estimated undiscounted future cash flows expected to be generated by the asset. If the financial statement carrying amount of an asset exceeds its estimated future cash flows, an impairment charge is recognized in the amount by which the carrying amount of the asset exceeds the fair value of the asset. Key assumptions in the determination of fair value are the future after-tax cash flows of the restaurant and discount rate. The after-tax cash flows incorporate reasonable sales growth and margin improvement assumptions that would be expected by a franchisee in the determination of a purchase price for the restaurant. Estimates of future cash flows are highly subjective judgments and can be significantly impacted by changes in the business or economic conditions. The discount rate used in the fair value calculations is our estimate of the required rate of return that a market participant would expect to receive when purchasing a similar restaurant or groups of restaurants and the related long-lived assets. The discount rate incorporates rates of returns for historical refranchising market transactions and is commensurate with the risks and uncertainty inherent in the forecasted cash flows.
F-9
We account for exit or disposal activities, including restaurant closures, in accordance with Topic 360-10. Such costs include the cost of disposing of the assets as well as other facility-related expenses from previously closed restaurants. These costs are generally expensed as incurred. Additionally, at the date we cease using a property under an operating lease, we record a liability under FASB ASC Topic 420, Exit and Disposal Cost Obligations for the net present value of any remaining lease obligations, net of estimated sublease income. Any subsequent adjustments to that liability as a result of lease termination or changes in estimates of sublease income are recorded in the period incurred. Upon disposal of the assets associated with a closed restaurant, any gain or loss is recorded in the same line within our consolidated statements of income as the original impairment.
(k) Deferred Financing Costs
Deferred financing costs represent fees paid in connection with obtaining bank and other long-term financing. The Company paid $413 thousand in financing costs in fiscal year 2017 and no financing costs during fiscal years 2016 and 2015. The Company amortizes deferred financing costs using a method that approximates the effective interest method over the term of the related financing. Amortization of deferred financing costs was $119 thousand in fiscal year 2017 and $421 thousand in each of the fiscal years 2016 and 2015 and is included in interest expense on the consolidated statements of income.
(l) Revenues
Revenues are derived principally from food and beverage sales. The Company does not rely on any major customers as a source of revenue.
Revenue from restaurant sales is recognized when food and beverage products are sold. Restaurant sales are presented net of sales taxes and discounts. Gratuities remitted by customers for the benefit of restaurant staff are not included in either revenues or operating expenses. Deferred revenue primarily represents the Company’s liability for gift cards that have been sold but not yet redeemed. When the gift cards are redeemed, the Company recognizes restaurant sales and reduces the deferred revenue liability. Company issued gift cards redeemed at franchisee-owned restaurants reduce the deferred revenue liability but do not result in Company restaurant sales. Gift card transactions involving franchisees are settled on a monthly basis through the Company’s third party gift card provider. The expected redemption value of gift cards represents the full value of all gift cards issued less the amount the Company has recognized as other operating income for gift cards that are not expected to be redeemed. The Company’s accounting method for recognizing breakage revenue is the redemption method. Under the redemption method, breakage revenue is recognized and the gift card liability is derecognized for unredeemed gift cards in proportion to actual gift card redemptions based on historical breakage rates. Gift card breakage revenue is classified as a component of other operating income. The Company recognized gift card breakage revenue of $2.9 million, $2.6 million and $2.4 million in fiscal years 2017, 2016 and 2015, respectively.
(m) International Revenues
The Company currently has 21 international franchisee-owned restaurants in Aruba, Canada, China, Indonesia, Japan, Mexico, Panama, Puerto Rico, Singapore, Taiwan and the United Arab Emirates. In accordance with its franchise agreements relating to these international restaurants, the Company receives royalty revenue from these franchisees in U.S. dollars. Franchise fee revenues from international restaurants were $2.9 million, $2.9 million and $3.0 million in fiscal years 2017, 2016 and 2015, respectively.
(n) Rent
Certain of the Company’s operating leases contain predetermined fixed escalations of the minimum rent during the term of the lease. For these leases, the Company recognizes the related rent expense on a straight-line basis over the life of the lease and records the difference between amounts charged to operations and amounts paid as deferred rent.
Additionally, certain of the Company’s operating leases contain clauses that provide additional contingent rent based on a percentage of sales greater than certain specified target amounts. The Company recognizes contingent rent expense prior to the achievement of the specified target that triggers the contingent rent, provided achievement of that target is considered probable.
F-10
(o) Marketing and Advertising
Marketing and advertising expenses in the accompanying consolidated statements of income include advertising expenses of $6.7 million, $6.6 million and $6.5 million in fiscal years 2017, 2016 and 2015, respectively. Advertising costs are expensed as incurred.
(p) Insurance Liability
The Company maintains various policies for workers’ compensation, employee health, general liability and property damage. Pursuant to those policies, the Company is responsible for losses up to certain limits. The Company records liabilities for the estimated exposure for aggregate losses below those limits. The recorded liabilities are based on estimates of the ultimate costs to be incurred to settle known claims and claims incurred but not reported as of the balance sheet date. The estimated liabilities are not discounted and are based on a number of assumptions and factors, including historical trends, actuarial assumptions and economic conditions. Independent actuaries are used to develop estimates of the workers’ compensation, general and employee health care liabilities.
(q) Stock-Based Compensation
The Company recognizes stock-based compensation in accordance with FASB ASC Topic 718, Compensation—Stock Compensation, (Topic 718). Stock-based compensation cost includes compensation cost for all share-based payments granted based on the grant date fair value estimated in accordance with the provisions of Topic 718. Compensation cost is recognized on a straight-line basis over the requisite service period of each award. The Company does not estimate forfeitures when recognizing compensation expense. Forfeitures are accounted for as they occur.
(r) Pre-Opening Costs
Pre-opening costs incurred with the opening of new restaurants are expensed as incurred. These costs include rent expense, wages, benefits, travel and lodging for the training and opening management teams, and food, beverage and other restaurant operating expenses incurred prior to a restaurant opening for business.
(s) Income Taxes
Income taxes are accounted for under the asset and liability method. Deferred tax assets and liabilities are recognized for the future tax consequences attributable to differences between the financial statement carrying amounts of existing assets and liabilities and their respective tax bases. Deferred tax assets and liabilities are measured using enacted tax rates expected to apply to taxable income in the years in which those temporary differences are expected to be recovered or settled. The effect on deferred tax assets and liabilities of a change in tax rates is recognized in income in the period that includes the enactment date.
The Company applies the provisions of FASB ASC Topic 740, Income Taxes (Topic 740). Topic 740 requires that a position taken or expected to be taken in a tax return be recognized (or derecognized) in the financial statements when it is more likely than not that the position would be sustained upon examination by tax authorities. A recognized tax position is then measured at the largest amount of benefit that is greater than 50% likely of being realized upon ultimate settlement. The Company’s continuing practice is to recognize interest and penalties related to uncertain tax positions in income tax expense.
(t) Earnings Per Share
Basic earnings per share is calculated by dividing net income by the weighted average number of shares of common stock outstanding during each period. Diluted earnings per share is calculated by dividing net income by the diluted weighted average shares of common stock outstanding during each period. Potentially dilutive securities include shares of non-vested stock awards. Diluted earnings per share considers the impact of potentially dilutive securities except in periods in which there is a loss because the inclusion of the potential common shares would have an antidilutive effect. Stock awards are excluded from the calculation of diluted earnings per share in the event they are antidilutive.
On December 12, 2017, the Company completed the acquisition of substantially all of the assets of the Hawaiian Restaurants for a cash purchase price of $35.4 million. The acquisition was funded with borrowings under the Company’s senior credit facility. The results of operations, financial position and cash flows of the Hawaiian Restaurants are included in the Company’s consolidated financial statements as of the date of the acquisition.
The assets and liabilities of the Hawaiian Restaurants were recorded at their respective fair values as of the date of the acquisition. The fair values recorded for the assets of the Hawaiian Restaurants, including working capital, restaurant related fixed assets,
F-11
leasehold improvements, franchise rights and goodwill, are based on preliminary valuations and are subject to adjustments as additional information is obtained. The Company is in the process of confirming the fair values using a combination of internal analysis and third party valuations. Once the process is complete, any adjustments to the fair value of assets acquired or liabilities assumed may also result in adjustments to goodwill.
The preliminary allocation of the purchase price is as follows:
|
|
|
Balances at |
|
|
|
|
|
December 12, 2017 |
|
|
|
Current assets |
|
$ |
755 |
|
|
Property and equipment |
|
|
7,355 |
|
|
Goodwill |
|
|
12,229 |
|
|
Franchise rights |
|
|
14,800 |
|
|
Other intangibles |
|
|
230 |
|
|
Other assets |
|
|
843 |
|
|
Total assets acquired |
|
$ |
36,212 |
|
|
Current liabilities |
|
|
84 |
|
|
Other liabilities |
|
|
750 |
|
|
Total liabilities assumed |
|
$ |
834 |
|
|
Net assets acquired |
|
$ |
35,378 |
|
Goodwill was measured as the excess of the consideration transferred over the net of the amounts assigned the identifiable assets acquired and the liabilities assumed as of the acquisition date. The goodwill for the Hawaiian Restaurants, which is included with the goodwill for the reporting unit identified as the steakhouse operating segment, will be reviewed for potential impairment annually or more frequently if triggering events are detected. Reacquired franchise rights will be amortized over the remaining terms of the related franchise agreements, not including renewal options. Property and equipment will be depreciated over a period of three to twenty years.
As a result of the acquisition and related integration efforts, we incurred expenses of approximately $619 thousand during the fiscal year 2017, which are included in general and administrative expenses in the Company’s consolidated statements of income. Pro-forma financial information reflecting the impact of the Hawaiian Restaurants for periods prior to the acquisition is not presented due to the immaterial impact of the financial results of the Hawaiian Restaurants on the Company’s consolidated financial statements.
(4) Mitchell’s Restaurants
The Company previously operated eighteen Mitchell’s Fish Markets and three Mitchell’s/Cameron’s Steakhouse restaurants (collectively, the Mitchell’s Restaurants). In November 2014, the Company and Landry’s, Inc. and Mitchell’s Entertainment, Inc., an affiliate of Landry’s Inc. (together with Landry’s Inc., Landry’s), entered into an asset purchase agreement (the Agreement). Pursuant to the Agreement, the Company agreed to sell the Mitchell’s Restaurants and related assets to Landry’s for $10.0 million. The sale of the Mitchell’s Restaurants closed on January 21, 2015. The assets sold consisted primarily of leasehold interests, leasehold improvements, restaurant equipment and furnishings, inventory, and related intangible assets, including brand names and trademarks associated with the 21 Mitchell’s Restaurants. The results of operations, impairment charges and loss on assets held for sale have been classified as discontinued operations in the consolidated statements of income for all periods presented. No amounts for shared general and administrative costs or interest expense were allocated to discontinued operations. Substantially all direct cash flows related to operating these restaurants were eliminated at the closing date of the sale. The Company’s continuing involvement was limited to transition services up to four months with minimal impact on cash flows.
Under the terms of the Agreement, Landry’s assumed the Mitchell’s Restaurants’ facility lease obligations and the Company reimbursed Landry’s for gift cards that were sold prior to the closing date and used at the Mitchell’s Restaurants during the eighteen months following the closing date. In the Agreement, the Company and Landry’s made customary representations and warranties and agreed to customary covenants relating to the sale of the Mitchell’s Restaurants. The Company and Landry’s have agreed to indemnify each other for losses arising from certain breaches of the Agreement and for certain other liabilities.
The Company guaranteed Landry’s lease obligations aggregating $29.4 million under seven of the Mitchell’s Restaurants’ leases. The Company did not record a financial accounting liability for the lease guarantees, because the likelihood of Landry’s defaulting on the lease agreements was deemed to be remote. Landry’s also indemnified the Company in the event of a default under any of the leases.
F-12
(5) Discontinued Operations
The Company accounts for its closed restaurants in accordance with the provisions of FASB ASC Topic 360, Property, Plant and Equipment. For fiscal years 2017, 2016 and 2015, all impairment charges, loss on disposal and remeasurement of lease liabilities along with restaurant sales, direct recurring costs and expenses and income taxes attributable to restaurants classified as discontinued operations have been aggregated to a single caption entitled loss from discontinued operations, net of tax benefit in the consolidated statements of income for all periods presented. Loss from discontinued operations, net of tax benefit is comprised of the following (in thousands):
|
|
|
Fiscal Year |
|
|||||||||
|
|
|
2017 |
|
|
2016 |
|
|
2015 |
|
|||
|
Revenues |
|
|
|
|
|
|
|
|
|
|
|
|
|
Mitchell's Restaurants |
|
$ |
— |
|
|
$ |
— |
|
|
$ |
4,343 |
|
|
Other Restaurants |
|
|
— |
|
|
|
— |
|
|
|
(3 |
) |
|
Total revenues |
|
|
— |
|
|
|
— |
|
|
|
4,340 |
|
|
|
|
|
|
|
|
|
|
|
|
|
|
|
|
Costs and expenses |
|
|
|
|
|
|
|
|
|
|
|
|
|
Recurring costs and expenses |
|
|
|
|
|
|
|
|
|
|
|
|
|
Mitchell's Restaurants |
|
|
250 |
|
|
|
(351 |
) |
|
|
5,196 |
|
|
Other Restaurants |
|
|
(74 |
) |
|
|
827 |
|
|
|
175 |
|
|
Total costs and expenses |
|
|
176 |
|
|
|
476 |
|
|
|
5,371 |
|
|
|
|
|
|
|
|
|
|
|
|
|
|
|
|
Loss before income taxes |
|
|
(176 |
) |
|
|
(476 |
) |
|
|
(1,031 |
) |
|
|
|
|
|
|
|
|
|
|
|
|
|
|
|
Income tax benefit |
|
|
(68 |
) |
|
|
(186 |
) |
|
|
(869 |
) |
|
|
|
|
|
|
|
|
|
|
|
|
|
|
|
Loss from discontinued operations, net of income taxes |
|
$ |
(108 |
) |
|
$ |
(290 |
) |
|
$ |
(162 |
) |
Cash flows from discontinued operations are combined with the cash flows from continuing operations within each of the categories on our consolidated statements of cash flows. In addition to the Mitchell’s Restaurants, discontinued operations for fiscal years 2017, 2016 and 2015 also includes the results of the other closed restaurants that were closed prior to December 29, 2014. The income from the Mitchell’s Restaurants in 2016 was primarily attributable to a $466 thousand benefit from the extinguishment of a liability related to Mitchell’s Restaurant gift cards. The Other Restaurant expense is primarily attributable to occupancy related costs from a closed Ruth’s Chris Steak House restaurant.
(6) Fair Value Measurements
Fair value is defined under FASB ASC Topic 820, Fair Value Measurements and Disclosures (Topic 820), as the price that would be received to sell an asset or paid to transfer a liability in the principal or most advantageous market in an orderly transaction between market participants on the measurement date. Topic 820 also establishes a three-level hierarchy, which requires an entity to maximize the use of observable inputs and minimize the use of unobservable inputs when measuring fair value.
The valuation hierarchy is based upon the transparency of inputs to the valuation of an asset or liability on the measurement date. The three levels of inputs are:
|
• |
Level 1—quoted prices (unadjusted) for an identical asset or liability in an active market. |
|
• |
Level 2—quoted prices for a similar asset or liability in an active market or model-derived valuations in which all significant inputs are observable for substantially the full term of the asset or liability. |
|
• |
Level 3—unobservable and significant to the fair value measurement of the asset or liability. |
F-13
The following were used to estimate the fair value of each class of financial instruments:
|
• |
The carrying amount of cash and cash equivalents, receivables, prepaid expenses, accounts payable and accrued expenses and other current liabilities are a reasonable estimate of their fair values due to their short duration. |
|
• |
Borrowings under the senior credit facility as of December 31, 2017 and December 25, 2016 have variable interest rates that reflect currently available terms and conditions for similar debt. The carrying amount of this debt is a reasonable estimate of its fair value (Level 2). |
The Company’s non-financial assets measured at fair value on a non-recurring basis as of December 31, 2017 were as follows:
|
|
|
Fair Value as of December 31, 2017 |
|
|
Significant Other Observable Inputs (Level 2) |
|
|
Significant Unobservable Inputs (Level 3) |
|
|
Total Losses on Impairment |
|
||||
|
Long-lived assets held for sale |
|
$ |
— |
|
|
$ |
— |
|
|
$ |
— |
|
|
$ |
3,904 |
|
The Company did not have any non-financial assets measured at fair value on a non-recurring basis as of the end of fiscal year 2016.
The Company concluded that it is more likely than not that the estimated future cash flows from a Ruth’s Chris Steak House restaurant will not be sufficient to recover the investment in its long-lived assets. Losses on these assets are recorded as loss on impairment in the accompanying consolidated statements of income. See Notes 1(j) and 7 for a description of the valuation techniques used to measure fair value of intangibles and long-lived assets, as well as information used to develop the inputs to the fair value measurements. Total losses on impairment include losses recognized from all non-recurring fair value measurements during each of the fiscal years.
(7) Franchise Rights and Goodwill
In accordance with FASB ASC Topic 350, goodwill and owned franchise rights that have been determined to have indefinite lives must be reviewed for potential impairment annually and when triggering events are detected. During the fourth quarter of each year, the Company completes an analysis to determine if goodwill and franchise rights are impaired as of the balance sheet date. The Company performed its annual impairment test of its goodwill and franchise rights as of November 26, 2017 using a qualitative assessment. Using the qualitative approach, the Company evaluated factors, including but not limited to, recent financial performance; forecasts for future cash flows; the Company’s stock price and market capitalization; recent impairment tests; legal factors; the business climate; and the competitive environment. Based on the results of the qualitative assessment, the Company determined that it is not more likely than not that the carrying values of goodwill and franchise rights exceed the fair values. The preliminary estimates of franchise rights and goodwill recognized for the Hawaiian Restaurants were not included in the qualitative assessment performed in 2017, as the acquisition was completed just prior to the end of fiscal year 2017.
If the qualitative assessment is not performed, or if the Company determines that it is not more likely than not that the fair values of the intangible assets exceed the carrying values, then the Company performs the following analysis for franchise rights and goodwill to measure fair values.
Franchise Rights
To determine the fair value of acquired franchise rights, the Company uses a multi-period excess earnings approach. This approach involves projecting after-royalty future earnings, discounting those earnings using an appropriate market discount rate and subtracting a contributory charge for net working capital, property and equipment, assembled workforce and customer relationships to arrive at excess earnings attributable to these franchise rights. The Company calculates the present value of cash flows generated from future excess earnings and compares the fair values to the financial statement carrying values.
Goodwill
In performing the evaluation of goodwill impairment under FASB ASC Topic 350-20, the Company compares the carrying value of its reporting unit, which is considered to be the steakhouse operating segment, to its fair value. The Company utilizes a multiple of EBITDA to approximate the fair value of the reporting unit for purposes of completing Step 1 of the evaluation. The Company considers EBITDA multiples of publicly held companies, including its own, as well as recent industry acquisitions. If a reporting unit’s fair value does not exceed its carrying value as the balance sheet date, the Company would complete Step 2 of the evaluation by comparing the implied fair value of goodwill with the net asset value of the reporting unit. The Company would calculate the implied fair value by allocating the fair value of a reporting unit to all of its assets and liabilities as if the reporting unit had been acquired in a business combination and the fair value of the reporting unit was the price paid to acquire the unit.
The financial statement carrying values of the Company’s franchise rights and other intangible assets were as follows (amounts in thousands):
F-14
|
|
Weighted Average Amortization Period |
|
Gross Carrying Value |
|
|
Accumulated Amortization |
|
|
Net Carrying Value |
|
|||
|
Amortizing intangible assets: |
|
|
|
|
|
|
|
|
|
|
|
|
|
|
Franchise rights |
9.0 yrs |
|
$ |
15,018 |
|
|
$ |
(396 |
) |
|
$ |
14,622 |
|
|
Lease assets |
12.5 yrs |
|
|
2,843 |
|
|
|
(923 |
) |
|
|
1,920 |
|
|
Other assets |
4.6 yrs |
|
|
490 |
|
|
|
(258 |
) |
|
|
232 |
|
|
|
|
|
|
18,351 |
|
|
|
(1,577 |
) |
|
|
16,774 |
|
|
Indefinite-lived intangible assets: |
|
|
|
|
|
|
|
|
|
|
|
|
|
|
Franchise rights |
|
|
|
32,200 |
|
|
|
- |
|
|
|
32,200 |
|
|
Liquor licenses |
|
|
|
1,633 |
|
|
|
- |
|
|
|
1,633 |
|
|
Other assets |
|
|
|
118 |
|
|
|
- |
|
|
|
118 |
|
|
|
|
|
|
33,952 |
|
|
|
- |
|
|
|
33,952 |
|
|
Total intangible assets |
|
|
$ |
52,303 |
|
|
$ |
(1,577 |
) |
|
$ |
50,726 |
|
Aggregate amortization expense for amortizing intangible assets was $277 thousand for the fiscal year 2017. Estimated amortization expense for the next five years is: $2.1 million in fiscal year 2018, $1.9 million in fiscal year 2019 and $1.7 million in fiscal years 2020, 2021 and 2022.
The financial statement carrying values of the Company’s goodwill was as follows (amounts in thousands):
|
|
|
Gross Goodwill |
|
|
Accumulated Goodwill Impairment Losses |
|
|
Net Carrying Value of Goodwill |
|
|||
|
Balance as of December 25, 2016 |
|
$ |
34,851 |
|
|
$ |
(10,558 |
) |
|
$ |
24,293 |
|
|
Balance as of December 31, 2017 |
|
$ |
47,080 |
|
|
$ |
(10,558 |
) |
|
$ |
36,522 |
|
(8) Property and Equipment, net
Property and equipment consists of the following (amounts in thousands):
|
|
|
December 31, |
|
|
December 25, |
|
||
|
|
|
2017 |
|
|
2016 |
|
||
|
Land |
|
$ |
616 |
|
|
$ |
616 |
|
|
Building and building improvements |
|
|
24,639 |
|
|
|
23,880 |
|
|
Equipment |
|
|
39,725 |
|
|
|
36,741 |
|
|
Computer equipment |
|
|
11,291 |
|
|
|
9,680 |
|
|
Furniture and fixtures |
|
|
22,730 |
|
|
|
20,261 |
|
|
Leasehold improvements |
|
|
150,688 |
|
|
|
130,345 |
|
|
Construction-in-progress |
|
|
6,896 |
|
|
|
14,335 |
|
|
|
|
|
256,585 |
|
|
|
235,858 |
|
|
Less accumulated depreciation |
|
|
(144,373 |
) |
|
|
(132,817 |
) |
|
|
|
$ |
112,212 |
|
|
$ |
103,041 |
|
(9) Long-term Debt
Long-term debt consists of the following (amounts in thousands):
|
|
|
December 31, |
|
|
December 25, |
|
||
|
|
|
2017 |
|
|
2016 |
|
||
|
Senior Credit Facility: |
|
|
|
|
|
|
|
|
|
Revolving credit facility |
|
$ |
50,000 |
|
|
$ |
25,000 |
|
|
Less current maturities |
|
|
— |
|
|
|
— |
|
|
|
|
$ |
50,000 |
|
|
$ |
25,000 |
|
As of December 31, 2017, the Company had $50.0 million of outstanding indebtedness under its senior credit facility with approximately $35.8 million of borrowings available, net of outstanding letters of credit of approximately $4.2 million. As of December 31, 2017, the weighted average interest rate on the Company’s outstanding debt was 2.9% and the weighted average interest rate on our outstanding letters of credit was 1.6%. In addition, the fee on the Company’s senior credit facility was 0.2%.
F-15
On February 2, 2017, we entered into a credit agreement with Wells Fargo Bank, National Association as administrative agent, and certain other lenders (the Credit Agreement) governing a senior credit facility that replaced the prior credit facility. The Credit Agreement provides for a revolving credit facility of $90.0 million with a $5.0 million subfacility for swingline loans. Subject to the satisfaction of certain conditions and lender consent, the revolving credit facility may be increased up to a maximum of $150.0 million. The Credit Agreement has a maturity date of February 2, 2022. At our option, revolving loans may bear interest at (i) LIBOR, plus an applicable margin, (ii) the highest of (a) the rate publicly announced by Wells Fargo as its prime rate, (b) the average published federal funds rate in effect on such day plus 0.50% and (c) one month LIBOR plus 1.00%, plus an applicable margin. The applicable margin is based on our actual leverage ratio, ranging (a) from 1.50% to 2.25% above the applicable LIBOR rate or (b) at our option, from 0.50% to 1.25% above the applicable base rate.
The Credit Agreement contains customary representations and affirmative and negative covenants (including limitations on indebtedness and liens) as well as financial covenants requiring a minimum fixed coverage charge ratio and limiting the Company’s consolidated leverage ratio. As of December 31, 2017, we were in compliance with all of the covenants in the Credit Agreement. The Credit Agreement also contains events of default customary for credit facilities of this type (with customary grace periods, as applicable), including nonpayment of principal or interest when due; material incorrectness of representations and warranties when made; breach of covenants; bankruptcy and insolvency; unsatisfied ERISA obligations; unstayed material judgment beyond specified periods; default under other material indebtedness; and certain changes of control of the Company. If any event of default occurs and is not cured within the applicable grace period, or waived, the outstanding loans may be accelerated by lenders holding a majority of the commitments under the Credit Agreement and the lenders’ commitments may be terminated. The obligations under the Credit Agreement are guaranteed by certain of the Company’s subsidiaries (the Guarantors), and are secured by a lien on substantially all of the Company’s personal property assets other than any equity interest in current and future subsidiaries of the Company.
(10) Leases
At December 31, 2017, all of the Company-owned Ruth’s Chris Steak House restaurants operated in leased premises, with the exception of the restaurant in Ft. Lauderdale, FL, which is an owned property, and the restaurants in Anaheim, CA, Lake Mary, FL, Princeton, NJ and South Barrington, IL, which operate on leased land. The leases generally provide for minimum annual rental payments and are subject to escalations based, in some cases, upon increases in the Consumer Price Index, real estate taxes and other costs. In addition, certain leases contain contingent rental provisions based upon the sales at the underlying restaurants. Certain leases also provide for rent deferral during the initial term of such lease and/or scheduled minimum rent increases during the terms of the leases. For financial reporting purposes, rent expense is recorded on a straight-line basis over the life of the lease. Accordingly, included in liabilities in the accompanying consolidated balance sheets at December 31, 2017 and December 25, 2016 are accruals related to such rent deferrals and the pro rata portion of scheduled rent increases of approximately $22.0 million and $21.7 million, respectively, net of the current portion included in other current liabilities $1.8 million and $1.8 million, respectively.
The Company also leases certain restaurant-related equipment under non-cancellable operating lease agreements with third parties, which are included with leased premises in future minimum annual rental commitments.
Future minimum annual rental commitments under operating leases as of December 31, 2017 are as follows (in thousands):
|
|
Company Total |
|
|
|
2018 |
$ |
24,658 |
|
|
2019 |
|
23,962 |
|
|
2020 |
|
22,372 |
|
|
2021 |
|
20,284 |
|
|
2022 |
|
19,130 |
|
|
Thereafter |
|
145,480 |
|
|
|
$ |
255,886 |
|
Pursuant to the terms of the Agreement, upon closing of the sale of the Mitchell’s Restaurants, Landry’s assumed the lease obligations of the Mitchell’s Restaurants. However, the Company has guaranteed Landry’s lease obligations aggregating $29.4 million under seven of the leases. The Company did not record a financial accounting liability for the lease guarantees, because the likelihood of Landry’s defaulting on the lease agreements was deemed to be remote. Landry’s also indemnified the Company in the event of a default under any of the leases. The above table does not include potential lease obligations for the Mitchell’s Restaurants.
F-16
Rental expense consists of the following and is included in restaurant operating expenses in the accompanying consolidated statements of income (in thousands):
|
|
Fiscal Year |
|
|||||||||
|
|
2017 |
|
|
2016 |
|
|
2015 |
|
|||
|
Minimum rentals |
$ |
21,296 |
|
|
$ |
20,300 |
|
|
$ |
18,846 |
|
|
Contingent rentals |
|
3,600 |
|
|
|
2,659 |
|
|
|
2,877 |
|
|
|
$ |
24,895 |
|
|
$ |
22,959 |
|
|
$ |
21,723 |
|
(11) Franchise Operations
The Company franchises Ruth’s Chris Steak House restaurants. The Company executes franchise agreements for each franchisee-owned restaurant, which sets out the terms of its arrangement with the franchisee. The franchise agreements typically require the franchisee to pay an initial, non-refundable fee and continuing fees based upon a percentage of sales. The Company collects ongoing royalties of 5% of sales at franchisee-owned restaurants plus a 1% advertising fee applied to national advertising expenditures. The Company is not required to perform any services for the ongoing royalties and thus these royalties are recognized when the royalties are due from the franchisee on a monthly basis. These ongoing royalties are reflected in the accompanying consolidated statements of income as franchise income. The 1% advertising fee is not recorded as revenue, but rather is recorded as a liability against which specified advertising and marketing costs are charged.
The Company executes an area development agreement with franchisees that gives each franchisee exclusive rights to develop a specific number of restaurants within a specified area. The Company receives a development fee at the time that an area development agreement is executed. The development fee is recognized as revenue as franchisee-owned restaurants are opened. The Company also executes separate, site-specific franchise agreements for each restaurant developed by a franchisee under an area development agreement. The Company charges a site-specific fee at the time the franchise agreement is executed. This fee is related to construction assistance and consulting regarding operating procedures and purchasing. These services are performed prior to the restaurant opening. The Company recognizes the site-specific franchise fee when the related restaurant opens.
The Company currently has 76 franchisee-owned Ruth’s Chris Steak House restaurants, including 21 international restaurants. Two new franchisee-owned restaurants opened in fiscal year 2017 including Chengdu, China in September and a Kauai, HI location in October. The Kauai, HI restaurant was acquired by the Company in December 2017. Two new franchisee-owned restaurants opened in fiscal year 2016 including Jakarta, Indonesia which opened in February and a second Greenville, SC location in October. Three new franchisee-owned restaurants opened in fiscal year 2015 including Ann Arbor, MI and Charleston, SC, which both opened in May, and one in San Antonio, TX in November. In September 2017, the franchisee-owned Ruth’s Chris Steak House restaurant in San Juan, Puerto Rico closed. The franchisee-owned Ruth’s Chris Steak House restaurant in San Salvador, El Salvador closed in January 2016. In December 2017, the Company acquired the Hawaiian Restaurants. No franchisee-owned restaurants were sold or purchased during fiscal years 2016 or 2015. Franchise income includes opening and development fees and income generated from existing franchisee-owned restaurants. The Company classifies franchise income separately in the consolidated statements of income (in thousands):
|
|
|
Fiscal Year |
|
|||||||||
|
|
|
2017 |
|
|
2016 |
|
|
2015 |
|
|||
|
Franchise income: |
|
|
|
|
|
|
|
|
|
|
|
|
|
Income from existing franchise locations |
|
$ |
17,335 |
|
|
$ |
17,001 |
|
|
$ |
16,361 |
|
|
Opening and development fee income |
|
|
210 |
|
|
|
300 |
|
|
|
300 |
|
|
Total franchise income: |
|
$ |
17,545 |
|
|
$ |
17,301 |
|
|
$ |
16,661 |
|
(12) Commitments and Contingencies
The Company is subject to various claims, possible legal actions and other matters arising in the normal course of business. Management does not expect disposition of these other matters to have a material adverse effect on the financial position, results of operations or liquidity of the Company. The Company expenses legal fees as incurred.
The legislation and regulations related to tax and unclaimed property matters are complex and subject to varying interpretations by both government authorities and taxpayers. The Company remits a variety of taxes and fees to various governmental authorities, including excise taxes, property taxes, sales and use taxes, and payroll taxes. The taxes and fees remitted by the Company are subject to review and audit by the applicable governmental authorities which could assert claims for additional assessments. Although management believes that the tax positions are reasonable and consequently there are no accrued liabilities for claims which may be asserted, various taxing authorities may challenge certain of the positions taken by the Company which may result in additional
F-17
liability for taxes and interest. These tax positions are reviewed periodically based on the availability of new information, the lapsing of applicable statutes of limitations, the conclusion of tax audits, the identification of new tax contingencies, or the rendering of relevant court decisions. An unfavorable resolution of assessments by a governmental authority could negatively impact the Company’s results of operations and cash flows in future periods.
The Company is subject to unclaimed or abandoned property (escheat) laws which require the Company to turn over to certain state governmental authorities the property of others held by the Company that has been unclaimed for specified periods of time. The Company is subject to audit by individual U.S. states with regard to its escheatment practices.
The Company currently buys a majority of its beef from two suppliers. Although there are a limited number of beef suppliers, management believes that other suppliers could provide similar product on comparable terms. A change in suppliers, however, could cause supply shortages and a possible loss of sales, which would affect operating results adversely.
(13) Shareholders’ Equity
The holders of the Company’s common stock are entitled to one vote per share on all matters to be voted on by the Company’s shareholders.
In April 2016, the Company announced that its Board of Directors approved a new share repurchase program under which the Company was authorized to repurchase up to $60 million of outstanding common stock from time to time. During the fiscal year 2017, 719,442 shares were repurchased under this program at an aggregate cost of $14.5 million or an average cost of $20.21 per share.
In October 2017, our Board of Directors approved a new share repurchase program authorizing the Company to repurchase up to $60 million of outstanding common stock from time to time. The new share repurchase program replaces the previous share repurchase program announced in April 2016, which has been terminated. During fiscal year 2017, 450,000 shares were purchased at an aggregate cost of $9.3 million or an average cost of $20.77 per share under this new program. All repurchased shares were retired and cancelled. As of December 31, 2017, $50.7 million remained available for future purchases under the new program. Share repurchases under both programs were accounted for under the cost method and all repurchased shares were retired and cancelled. The excess of the purchase price over the par value of the shares was recorded as a reduction in additional paid-in capital.
The Company repurchased 1,169,442, 2,824,322 and 1,483,085 shares under all share repurchase programs during fiscal years 2017, 2016, and 2015, respectively.
The Company’s Board of Directors declared the following dividends during the periods presented (amounts in thousands, except per share amounts):
|
Declaration Date |
|
Dividend per Share |
|
|
Record Date |
|
Total Amount |
|
|
Payment Date |
||
|
Fiscal Year 2017 |
|
|
|
|
|
|
|
|
|
|
|
|
|
February 17, 2017 |
|
$ |
0.09 |
|
|
February 23, 2017 |
|
$ |
2,862 |
|
|
March 9, 2017 |
|
May 5, 2017 |
|
$ |
0.09 |
|
|
May 18, 2017 |
|
$ |
2,862 |
|
|
June 1, 2017 |
|
July 28, 2017 |
|
$ |
0.09 |
|
|
August 10, 2017 |
|
$ |
2,844 |
|
|
August 24, 2017 |
|
November 3, 2017 |
|
$ |
0.09 |
|
|
November 9, 2017 |
|
$ |
2,815 |
|
|
November 22, 2017 |
|
|
|
|
|
|
|
|
|
|
|
|
|
|
|
Fiscal Year 2016 |
|
|
|
|
|
|
|
|
|
|
|
|
|
February 12, 2016 |
|
$ |
0.07 |
|
|
February 25, 2016 |
|
$ |
2,350 |
|
|
March 10, 2016 |
|
April 28, 2016 |
|
$ |
0.07 |
|
|
May 12, 2016 |
|
$ |
2,338 |
|
|
May 26, 2016 |
|
July 29, 2016 |
|
$ |
0.07 |
|
|
August 11, 2016 |
|
$ |
2,282 |
|
|
August 25, 2016 |
|
October 28, 2016 |
|
$ |
0.07 |
|
|
November 10, 2016 |
|
$ |
2,226 |
|
|
November 23, 2016 |
|
|
|
|
|
|
|
|
|
|
|
|
|
|
|
Fiscal Year 2015 |
|
|
|
|
|
|
|
|
|
|
|
|
|
February 13, 2015 |
|
$ |
0.06 |
|
|
February 26, 2015 |
|
$ |
2,082 |
|
|
March 12, 2015 |
|
April 21, 2015 |
|
$ |
0.06 |
|
|
May 14, 2015 |
|
$ |
2,090 |
|
|
May 28, 2015 |
|
July 22, 2015 |
|
$ |
0.06 |
|
|
August 13, 2015 |
|
$ |
2,108 |
|
|
August 27, 2015 |
|
October 30, 2015 |
|
$ |
0.06 |
|
|
November 19, 2015 |
|
$ |
2,069 |
|
|
December 3, 2015 |
Subsequent to the end of fiscal year 2017, the Company’s Board of Directors declared a $0.11 per share cash dividend ($3.4 million in total) payable on March 22, 2018. Dividends are paid to holders of common stock and restricted stock.
F-18
(14) Employee Benefit Plan
In 2000, the Company established a 401(k) and Profit Sharing Plan. The Company may make matching contributions in an amount determined by the Board of Directors. In addition, the Company may contribute each period, at its discretion, an additional amount from profits. The Company matches the employees’ contributions at year end. Employees vest in the Company’s contributions based upon their years of service. The Company’s expenses relating to matching contributions were approximately $324 thousand, $318 thousand and $305 thousand for fiscal years 2017, 2016 and 2015, respectively.
(15) Incentive and Stock Option Plans
As of December 26, 2016 (the first day of fiscal year 2017), the Company adopted ASU 2016-09, Compensation – Stock Compensation (Topic 718), which affects all entities that issue share-based compensation to their employees. The amendments in this ASU cover such areas as the recognition of excess tax benefits and deficiencies, the classification of those excess tax benefits on the statement of cash flows, an accounting policy election for forfeitures, the amount an employer can withhold to cover income taxes and still qualify for equity classification and the classification of those taxes paid on the statement of cash flows. Therefore, for the fiscal year 2017, the recognition of excess tax benefits and deficiencies were recognized as income tax benefits or expense on the consolidated statement of income and as an operating activity on the statement of cash flows. Prior to the Company’s adoption of ASU 2016-09, these tax benefits and deficiencies were recognized as additional paid-in capital on the balance sheet and as a financing activity on the statement of cash flows.
2005 Long-Term Equity Incentive Plan
In connection with the initial public offering, the Company adopted the Ruth’s Chris Steak House, Inc. 2005 Long-Term Equity Incentive Plan (the 2005 Equity Incentive Plan), which allows the Company’s Board of Directors to grant stock options, restricted stock, restricted stock units, deferred stock units and other equity-based awards to directors, officers, key employees and other key individuals performing services for the Company. Initially, 2.4 million shares were authorized for issuance under the 2005 Equity Incentive Plan. The 2005 Equity Incentive Plan provides for granting of options to purchase shares of common stock at an exercise price not less than the fair value of the stock on the date of grant. Options are exercisable, and restricted stock vests, at various periods ranging from one to five years from date of grant. Effective May 22, 2008, the 2005 Equity Incentive Plan was amended, with stockholder approval, to increase the number of shares authorized for issuance under the plan by 1.5 million shares. The Amended and Restated 2005 Equity Incentive Plan was adopted on October 26, 2012, and the number of shares authorized for issuance under the Amended and Restated 2005 Long-Term Equity Incentive Plan was increased by 2.0 million shares at the 2013 annual meeting of stockholders. Under the Amended and Restated 2005 Equity Incentive Plan there are 1.2 million shares of restricted stock issued and common stock issuable upon exercise of currently outstanding options at December 31, 2017, and 1.8 million shares available for future grants.
During fiscal year 2015, the Company issued 893,662 shares of restricted stock to certain employees and executive officers from available shares under the Amended and Restated 2005 Equity Incentive Plan. The shares were issued with a grant date fair market value equal to the closing price of the stock on the date of the grants. Of the 893,662 shares of restricted stock issued during 2015, 54,095 shares vest on the second anniversary of the grant date, 214,567 shares vest one-third on each of the three anniversary dates following the grant, 300,000 shares vest at 25% annually with the first vesting date occurring on the anniversary date in 2017 and ending on the anniversary date in 2020 and 325,000 shares vest at 25% annually with the first vesting date occurring on the anniversary date in 2018 and ending on the anniversary date in 2021.
During fiscal year 2016, the Company issued 376,423 shares of restricted stock to certain employees and executive officers from available shares under the Amended and Restated 2005 Equity Incentive Plan. The shares were issued with a grant date fair market value equal to the closing price of the stock on the date of the grants. Of the 376,423 shares of restricted stock issued during 2016, 95,792 shares vest on the second anniversary of the grant date, 135,631 shares vest one-third on each of the three anniversary dates following the grant date, 45,000 shares will vest on the third anniversary date of the grant date and 100,000 shares will vest at 50% annually with the first vesting date occurring on the anniversary date in 2018 and ending on the anniversary date in 2019.
During fiscal year 2017, the Company issued 251,512 shares of restricted stock to certain employees and executive officers from available shares under the Amended and Restated 2005 Equity Incentive Plan. The shares were issued with a grant date fair market value equal to the closing price of the stock on the date of the grants. Of the 251,512 shares of restricted stock issued during 2017, 96,853 shares will vest on the second anniversary of the grant date, 114,659 shares will vest one-third on each of the three anniversary dates following the grant date and 40,000 shares will vest at 25% annually with the first vesting date occurring on the anniversary date in 2020 and ending on the anniversary date in 2023.
The Company recorded $6.8 million, $5.8 million and $4.1 million in total stock option and restricted stock compensation expense during fiscal years 2017, 2016, and 2015, respectively that was classified primarily as general and administrative costs. The Company
F-19
recognized $225 thousand, $378 thousand and $743 thousand in income tax benefit related to stock-based compensation plans during fiscal years 2017, 2016, and 2015, respectively.
A summary of the status of non-vested restricted stock as of December 31, 2017 and changes during fiscal year 2017 is presented below.
|
|
|
2017 |
|
|||||
|
|
|
Shares |
|
|
Weighted-Average Grant-Date Fair Value Per Share |
|
||
|
Non-vested shares at beginning of year |
|
|
1,245,836 |
|
|
$ |
15.93 |
|
|
Granted |
|
|
251,512 |
|
|
|
18.92 |
|
|
Vested |
|
|
(291,031 |
) |
|
|
15.47 |
|
|
Forfeited |
|
|
(21,688 |
) |
|
|
15.59 |
|
|
Non-vested shares at end of year |
|
|
1,184,629 |
|
|
$ |
16.69 |
|
As of December 31, 2017, there was $11.2 million of total unrecognized compensation cost related to 1,184,629 shares of non-vested restricted stock. This cost is expected to be recognized over a weighted-average period of approximately 2.69 years. The total grant date fair value of restricted stock vested in fiscal years 2017, 2016, and 2015 was $4.5 million, $3.6 million and $2.8 million, respectively.
The following table summarizes stock option activity for fiscal year 2017:
|
|
|
2017 |
|
|||||||||||||
|
|
|
Shares |
|
|
Weighted-Average Exercise Price |
|
|
Weighted-Average Remaining Contractual Term |
|
|
Aggregate Intrinsic Value ($000's) |
|
||||
|
Outstanding at beginning of year |
|
|
124,154 |
|
|
$ |
12.50 |
|
|
|
|
|
|
|
|
|
|
Granted |
|
|
— |
|
|
|
— |
|
|
|
|
|
|
|
|
|
|
Exercised |
|
|
(82,164 |
) |
|
|
11.70 |
|
|
|
|
|
|
|
|
|
|
Forfeited |
|
|
(26,400 |
) |
|
|
20.43 |
|
|
|
|
|
|
|
|
|
|
Outstanding at end of year |
|
|
15,590 |
|
|
$ |
3.28 |
|
|
|
1.39 |
|
|
$ |
286,386 |
|
|
Options exercisable at year end |
|
|
15,590 |
|
|
$ |
3.28 |
|
|
|
1.39 |
|
|
$ |
286,386 |
|
As of December 31, 2017, there was no unrecognized compensation cost related to non-vested stock options. The total intrinsic value of options exercised in fiscal years 2017, 2016, and 2015 was $681 thousand, $444 thousand and $863 thousand, respectively.
During fiscal years 2017, 2016, and 2015, the Company received $945 thousand, $219 thousand and $250 thousand, respectively, in cash related to the exercise of options. The exercise of shares were fulfilled from shares reserved for issuance under the Amended and Restated 2005 Equity Incentive Plan and resulted in an increase in issued shares outstanding.
(16) Income Taxes
Total income tax expense (benefit) for fiscal years 2017, 2016, and 2015 was (in thousands):
|
|
|
2017 |
|
|
2016 |
|
|
2015 |
|
|||
|
Income from continuing operations |
|
$ |
15,669 |
|
|
$ |
15,660 |
|
|
$ |
14,168 |
|
|
Loss from discontinued operations |
|
|
(68 |
) |
|
|
(186 |
) |
|
|
(869 |
) |
|
Total consolidated income tax expense |
|
$ |
15,601 |
|
|
$ |
15,474 |
|
|
$ |
13,299 |
|
F-20
Income tax expense from continuing operations consists of the following:
|
|
|
Current |
|
|
Deferred |
|
|
Total |
|
|||
|
Year ended December 31, 2017 |
|
|
|
|
|
|
|
|
|
|
|
|
|
U.S. Federal |
|
$ |
8,431 |
|
|
$ |
4,557 |
|
|
$ |
12,988 |
|
|
State |
|
|
1,916 |
|
|
|
422 |
|
|
|
2,338 |
|
|
Foreign |
|
|
343 |
|
|
|
— |
|
|
|
343 |
|
|
|
|
$ |
10,690 |
|
|
$ |
4,979 |
|
|
$ |
15,669 |
|
|
Year ended December 25, 2016 |
|
|
|
|
|
|
|
|
|
|
|
|
|
U.S. Federal |
|
$ |
3,987 |
|
|
$ |
8,165 |
|
|
$ |
12,152 |
|
|
State |
|
|
1,951 |
|
|
|
1,231 |
|
|
|
3,182 |
|
|
Foreign |
|
|
326 |
|
|
|
— |
|
|
|
326 |
|
|
|
|
$ |
6,264 |
|
|
$ |
9,396 |
|
|
$ |
15,660 |
|
|
Year ended December 27, 2015 |
|
|
|
|
|
|
|
|
|
|
|
|
|
U.S. Federal |
|
$ |
14,692 |
|
|
$ |
(3,445 |
) |
|
$ |
11,247 |
|
|
State |
|
|
2,697 |
|
|
|
(120 |
) |
|
|
2,577 |
|
|
Foreign |
|
|
344 |
|
|
|
— |
|
|
|
344 |
|
|
|
|
$ |
17,733 |
|
|
$ |
(3,565 |
) |
|
$ |
14,168 |
|
Income tax expense differs from amounts computed by applying the federal statutory income tax rate to income from continuing operations before income taxes as follows (in thousands):
|
|
|
2017 |
|
|
2016 |
|
|
2015 |
|
|||
|
Income tax expense at statutory rates |
|
$ |
16,070 |
|
|
$ |
16,245 |
|
|
$ |
15,517 |
|
|
Increase (decrease) in income taxes resulting from: |
|
|
|
|
|
|
|
|
|
|
|
|
|
State income taxes, net of federal benefit |
|
|
1,316 |
|
|
|
2,193 |
|
|
|
1,787 |
|
|
Federal FICA tip credit net benefit |
|
|
(3,324 |
) |
|
|
(3,179 |
) |
|
|
(3,124 |
) |
|
Impact of the 2017 Tax Act |
|
|
1,086 |
|
|
|
— |
|
|
|
— |
|
|
Other |
|
|
521 |
|
|
|
401 |
|
|
|
(12 |
) |
|
|
|
$ |
15,669 |
|
|
$ |
15,660 |
|
|
$ |
14,168 |
|
|
Effective tax rate |
|
|
34.1 |
% |
|
|
33.7 |
% |
|
|
32.0 |
% |
The Tax Cuts and Jobs Act (the “2017 Tax Act”) was signed into law on December 22, 2017. The 2017 Tax Act significantly revises existing U.S. tax law, and includes many changes that impact the Company, most notably a reduction of the statutory corporate tax rate from 35% to 21%, and the curtailment or elimination of certain deductions. The Company recorded income tax expense of $1.1 million related to the remeasurement of its net deferred tax assets, resulting from the permanent reduction of the U.S. statutory corporate tax rate from 35% to 21%. The SEC has issued Staff Accounting Bulletin (“SAB”) No. 118 which permits registrants to record provisional amounts related to the 2017 Tax Act to the extent that the information needed to account for the income tax impacts of the legislation is not available, has not been prepared, or has not been analyzed in sufficient detail. In recognizing the income tax effects of the 2017 Tax Act, the Company has not identified items it considers to be provisional, for which relief under SAB No. 118 would be sought. The remeasurement of the Company’s net deferred tax assets incorporates assumptions based upon the Company’s current interpretation of the 2017 Tax Act, particularly as it relates to the future deductibility of executive compensation items. As such, these assumptions may change as clarification and guidance is provided by the appropriate taxing authorities.
The Company utilizes the federal FICA tip credit to reduce its periodic federal income tax expense. A restaurant company employer may claim a credit against the company’s federal income taxes for FICA taxes paid on certain tip wages (the FICA tip credit). The credit against income tax liability is for the full amount of eligible FICA taxes. Employers cannot deduct from taxable income the amount of FICA taxes taken into account in determining the credit. The Other line in the effective tax rate schedule above primarily represents non-deductible compensation in fiscal years 2017 and 2016.
Income taxes applicable to discontinued operations are comprised of (a) taxes calculated at the composite federal and state statutory tax rate times the pre-tax loss plus (b) the FICA tip credit benefit attributable to the restaurant sales of the Mitchell’s Restaurants. A reconciliation of the U.S. statutory tax rate to the effective tax rate applicable to discontinued operations for fiscal years 2016, 2015 and 2014 follows (in thousands):
F-21
|
|
|
2017 |
|
|
2016 |
|
|
2015 |
|
|||
|
Income tax benefit at statutory rates |
|
$ |
(62 |
) |
|
$ |
(167 |
) |
|
$ |
(361 |
) |
|
Increase (decrease) in income taxes resulting from: |
|
|
|
|
|
|
|
|
|
|
|
|
|
State income taxes at state statutory rate, net of federal impact |
|
|
(6 |
) |
|
|
(19 |
) |
|
|
(411 |
) |
|
Other, primarily federal FICA tip credit net benefit |
|
|
— |
|
|
|
— |
|
|
|
(97 |
) |
|
|
|
$ |
(68 |
) |
|
$ |
(186 |
) |
|
$ |
(869 |
) |
|
Effective tax rate |
|
|
38.6 |
% |
|
|
39.0 |
% |
|
|
84.3 |
% |
The tax effects of temporary differences that give rise to significant portions of the deferred tax assets are presented below (in thousands):
|
|
|
2017 |
|
|
2016 |
|
||
|
Deferred tax assets: |
|
|
|
|
|
|
|
|
|
Accounts payable and accrued expenses |
|
$ |
6,887 |
|
|
$ |
8,699 |
|
|
Deferred rent |
|
|
5,790 |
|
|
|
8,953 |
|
|
Net state operating loss carryforwards |
|
|
3,152 |
|
|
|
2,317 |
|
|
Tax credit carryforwards |
|
|
507 |
|
|
|
1,889 |
|
|
Property and equipment |
|
|
539 |
|
|
|
4,080 |
|
|
Other |
|
|
140 |
|
|
|
199 |
|
|
Total gross deferred tax assets |
|
|
17,015 |
|
|
|
26,137 |
|
|
Less valuation allowance |
|
|
(1,389 |
) |
|
|
(762 |
) |
|
Net deferred tax assets |
|
|
15,626 |
|
|
|
25,375 |
|
|
Deferred tax liabilities: |
|
|
|
|
|
|
|
|
|
Intangible assets |
|
|
(10,679 |
) |
|
|
(15,451 |
) |
|
Total gross deferred tax liabilities |
|
|
(10,679 |
) |
|
|
(15,451 |
) |
|
Net deferred tax assets |
|
$ |
4,947 |
|
|
$ |
9,924 |
|
In assessing the realizability of deferred tax assets, management considers whether it is more likely than not that some portion or all of the deferred tax assets will not be realized. The ultimate realization of deferred tax assets is dependent upon the generation of future taxable income during the periods in which those temporary differences become deductible. Management considers the scheduled reversal of deferred tax liabilities and projected future taxable income in making this assessment. Gross deferred assets were reduced by a valuation allowance of $1.4 million and $762 thousand in 2017 and 2016, respectively, related to certain state net operating loss and state tax credit carryforwards that are not likely to be offset by future state taxable income. Based upon the level of historical taxable income and projections for future taxable income over the periods in which the deferred tax assets are deductible, management believes it is more likely than not that the Company will realize the benefits of the net deferred tax assets.
As of December 31, 2017, the Company has state net operating loss carry-forwards of $61.6 million and state tax credit carry-forwards of $642 thousand, which are available to offset federal and state taxable income with the last of such benefit expiring in 2037.
As of December 31, 2017, the Company’s gross unrecognized tax benefits totaled approximately $666 thousand, of which $526 thousand, if recognized, would impact the effective tax rate. The Company does not anticipate there will be any material changes in the unrecognized tax benefits within the next 12 months. Our continuing practice is to recognize interest and penalties related to uncertain tax positions in income tax expense.
A reconciliation of the beginning and ending amount of unrecognized tax benefits follows (amounts in thousands):
|
Unrecognized tax benefits balance at December 25, 2016 |
|
|
|
$ |
579 |
|
|
Gross increases for tax positions of prior years |
|
|
|
|
345 |
|
|
Reductions due to settlements with taxing authorities |
|
|
|
|
(217 |
) |
|
Reductions to tax positions due to statute expiration |
|
|
|
|
(41 |
) |
|
Unrecognized tax benefits balance at December 31, 2017 |
|
|
|
$ |
666 |
|
F-22
The Company files consolidated and separate income tax returns in the United States Federal jurisdiction and many state jurisdictions. With few exceptions, the Company is no longer subject to U.S. Federal or state and local income tax examinations for fiscal years before 2013.
(17) Earnings Per Share
Basic earnings per share is calculated by dividing net income by the weighted average number of shares of common stock outstanding during each period. Diluted earnings per share is calculated by dividing net income by the diluted weighted average shares of common stock outstanding during each period. Potentially dilutive securities include shares of non-vested stock awards. Diluted earnings per share considers the impact of potentially dilutive securities except in periods in which there is a loss because the inclusion of the potential common shares would have an antidilutive effect. Stock awards are excluded from the calculation of diluted earnings per share in the event they are antidilutive.
The following table sets forth the computation of basic earnings per common share (amounts in thousands, except share and per share data):
|
|
|
Fiscal Year |
|
|||||||||
|
|
|
2017 |
|
|
2016 |
|
|
2015 |
|
|||
|
Income from continuing operations |
|
$ |
30,245 |
|
|
$ |
30,755 |
|
|
$ |
30,166 |
|
|
Loss from discontinued operations, net of income taxes |
|
|
(108 |
) |
|
|
(290 |
) |
|
|
(162 |
) |
|
Net income |
|
$ |
30,137 |
|
|
$ |
30,465 |
|
|
$ |
30,004 |
|
|
Shares: |
|
|
|
|
|
|
|
|
|
|
|
|
|
Weighted average number of common shares outstanding - basic |
|
|
30,346,999 |
|
|
|
31,670,189 |
|
|
|
34,018,582 |
|
|
|
|
|
|
|
|
|
|
|
|
|
|
|
|
Basic earnings (loss) per common share: |
|
|
|
|
|
|
|
|
|
|
|
|
|
Continuing operations |
|
$ |
1.00 |
|
|
$ |
0.97 |
|
|
$ |
0.88 |
|
|
Discontinued operations |
|
|
(0.01 |
) |
|
|
(0.01 |
) |
|
|
— |
|
|
Basic earnings per common share |
|
$ |
0.99 |
|
|
$ |
0.96 |
|
|
$ |
0.88 |
|
Diluted earnings (loss) per share for fiscal years 2017, 2016 and 2015 excludes 685 stock options and restricted shares at a weighted-average price of $21.60, 22,349 stock options and restricted shares at a weighted-average price of $19.04 and 46,117 stock options and restricted shares at a weighted-average price of $18.84, respectively, which were outstanding during the periods but were anti-dilutive.
The following table sets forth the computation of diluted earnings per share (amounts in thousands, except share and per share data):
|
|
|
Fiscal Year |
|
|||||||||
|
|
|
2017 |
|
|
2016 |
|
|
2015 |
|
|||
|
Income from continuing operations |
|
$ |
30,245 |
|
|
$ |
30,755 |
|
|
$ |
30,166 |
|
|
Loss from discontinued operations, net of income taxes |
|
|
(108 |
) |
|
|
(290 |
) |
|
|
(162 |
) |
|
Net income |
|
$ |
30,137 |
|
|
$ |
30,465 |
|
|
$ |
30,004 |
|
|
Shares: |
|
|
|
|
|
|
|
|
|
|
|
|
|
Weighted average number of common shares outstanding - basic |
|
|
30,346,999 |
|
|
|
31,670,189 |
|
|
|
34,018,582 |
|
|
Dilutive shares |
|
|
569,365 |
|
|
|
438,776 |
|
|
|
415,825 |
|
|
Weighted average number of common shares outstanding - diluted |
|
|
30,916,364 |
|
|
|
32,108,965 |
|
|
|
34,434,407 |
|
|
|
|
|
|
|
|
|
|
|
|
|
|
|
|
Diluted earnings (loss) per common share: |
|
|
|
|
|
|
|
|
|
|
|
|
|
Continuing operations |
|
$ |
0.98 |
|
|
$ |
0.96 |
|
|
$ |
0.87 |
|
|
Discontinued operations |
|
|
(0.01 |
) |
|
|
(0.01 |
) |
|
|
— |
|
|
Diluted earnings per common share |
|
$ |
0.97 |
|
|
$ |
0.95 |
|
|
$ |
0.87 |
|
F-23
(18) Segment Information
The Company has two reportable segments – the Company-owned steakhouse segment and the franchise operations segment. Previously reported segment information has been revised to exclude the Mitchell’s Restaurants. The Company does not rely on any major customers as a source of revenue.
The Company-owned Ruth’s Chris Steak House restaurants, all of which are located in North America, operate within the full-service dining industry, providing similar products to similar customers. Revenues are derived principally from food and beverage sales. As of December 31, 2017, (i) the Company-owned steakhouse restaurant segment included 77 Ruth’s Chris Steak House restaurants and two Ruth’s Chris Steak House restaurant operating under a management agreement and (ii) the franchise operations segment included 76 franchisee-owned Ruth’s Chris Steak House restaurants. Segment profits for the Company-owned steakhouse restaurant segments equal segment revenues less segment expenses. Segment revenues for the Company-owned steakhouse restaurants include restaurant sales, management agreement income and other restaurant income. Gift card breakage revenue is not allocated to operating segments. Not all operating expenses are allocated to operating segments. Segment expenses for the Company-owned steakhouse segment include food and beverage costs and restaurant operating expenses. No other operating costs are allocated to the segments for the purpose of determining segment profits because such costs are not directly related to the operation of individual restaurants. The accounting policies applicable to each segment are consistent with the policies used to prepare the consolidated financial statements. The profit of the franchise operations segment equals franchise income, which consists of franchise royalty fees and franchise opening fees. No costs are allocated to the franchise operations segment. Segment information related to the Company’s two reportable business segments follows.
|
|
|
Fiscal Year |
|
|||||||||
|
|
|
2017 |
|
|
2016 |
|
|
2015 |
|
|||
|
|
|
|
|
|
|
(dollar amounts in thousands) |
|
|
|
|
|
|
|
Revenues: |
|
|
|
|
|
|
|
|
|
|
|
|
|
Company-owned steakhouse restaurants |
|
$ |
394,359 |
|
|
$ |
366,054 |
|
|
$ |
354,398 |
|
|
Franchise operations |
|
|
17,545 |
|
|
|
17,301 |
|
|
|
16,661 |
|
|
Unallocated other revenue and revenue discounts |
|
|
2,919 |
|
|
|
2,592 |
|
|
|
2,374 |
|
|
Total revenues |
|
$ |
414,823 |
|
|
$ |
385,947 |
|
|
$ |
373,433 |
|
|
|
|
|
|
|
|
|
|
|
|
|
|
|
|
Segment profits: |
|
|
|
|
|
|
|
|
|
|
|
|
|
Company-owned steakhouse restaurants |
|
$ |
92,554 |
|
|
$ |
85,980 |
|
|
$ |
80,450 |
|
|
Franchise operations |
|
|
17,545 |
|
|
|
17,301 |
|
|
|
16,661 |
|
|
Total segment profit |
|
|
110,099 |
|
|
|
103,281 |
|
|
|
97,111 |
|
|
|
|
|
|
|
|
|
|
|
|
|
|
|
|
Unallocated operating income |
|
|
2,919 |
|
|
|
2,592 |
|
|
|
2,374 |
|
|
Marketing and advertising expenses |
|
|
(12,724 |
) |
|
|
(11,406 |
) |
|
|
(10,925 |
) |
|
General and administrative costs |
|
|
(32,700 |
) |
|
|
(31,488 |
) |
|
|
(30,242 |
) |
|
Depreciation and amortization expenses |
|
|
(14,995 |
) |
|
|
(13,434 |
) |
|
|
(12,520 |
) |
|
Pre-opening costs |
|
|
(2,013 |
) |
|
|
(1,986 |
) |
|
|
(1,032 |
) |
|
Loss on impairment |
|
|
(3,904 |
) |
|
|
— |
|
|
|
— |
|
|
Interest expense, net |
|
|
(821 |
) |
|
|
(1,154 |
) |
|
|
(790 |
) |
|
Other income |
|
|
53 |
|
|
|
10 |
|
|
|
358 |
|
|
Income from continuing operations before income tax expense |
|
$ |
45,914 |
|
|
$ |
46,415 |
|
|
$ |
44,334 |
|
|
|
|
|
|
|
|
|
|
|
|
|
|
|
|
Capital expenditures: |
|
|
|
|
|
|
|
|
|
|
|
|
|
Company-owned steakhouse restaurants |
|
$ |
20,363 |
|
|
$ |
24,991 |
|
|
$ |
18,934 |
|
|
Corporate assets |
|
|
892 |
|
|
|
1,220 |
|
|
|
1,133 |
|
|
Mitchell's Restaurants |
|
|
— |
|
|
|
— |
|
|
|
225 |
|
|
Total capital expenditures |
|
$ |
21,255 |
|
|
$ |
26,211 |
|
|
$ |
20,292 |
|
F-24
|
|
|
Fiscal Year |
|
|||||||||
|
|
|
December 31, |
|
|
December 25, |
|
|
December 27, |
|
|||
|
|
|
2017 |
|
|
2016 |
|
|
2015 |
|
|||
|
|
|
|
|
|
|
(dollar amounts in thousands) |
|
|
|
|
|
|
|
Total assets: |
|
|
|
|
|
|
|
|
|
|
|
|
|
Company-owned steakhouse restaurants |
|
$ |
223,354 |
|
|
$ |
185,820 |
|
|
$ |
168,766 |
|
|
Franchise operations |
|
|
3,021 |
|
|
|
2,707 |
|
|
|
2,444 |
|
|
Corporate assets - unallocated |
|
|
10,774 |
|
|
|
9,021 |
|
|
|
7,828 |
|
|
Deferred income taxes - unallocated |
|
|
4,947 |
|
|
|
9,924 |
|
|
|
19,309 |
|
|
Mitchell's Restaurants |
|
|
— |
|
|
|
— |
|
|
|
250 |
|
|
Total assets |
|
$ |
242,096 |
|
|
$ |
207,472 |
|
|
$ |
198,597 |
|
(19) Supplemental Consolidated Financial Statement Information
|
(a) |
Accounts Receivable, net |
Accounts receivable, net consists of the following (amounts in thousands):
|
|
|
December 31, |
|
|
December 25, |
|
||
|
|
|
|
2017 |
|
|
|
2016 |
|
|
Bank credit card receivables |
|
$ |
10,263 |
|
|
$ |
10,992 |
|
|
Landlord contributions |
|
|
246 |
|
|
|
704 |
|
|
Franchise fees |
|
|
2,823 |
|
|
|
2,456 |
|
|
Trade |
|
|
724 |
|
|
|
463 |
|
|
Insurance receivable |
|
|
46 |
|
|
|
446 |
|
|
Receivable from gift card issuances |
|
|
7,051 |
|
|
|
4,743 |
|
|
Other |
|
|
834 |
|
|
|
1,715 |
|
|
Allowance for doubtful accounts |
|
|
(361 |
) |
|
|
(729 |
) |
|
|
|
$ |
21,626 |
|
|
$ |
20,790 |
|
(b) Other Assets
Other assets consist of the following (amounts in thousands):
|
|
|
December 31, |
|
|
December 25, |
|
||
|
|
|
|
2017 |
|
|
|
2016 |
|
|
Deposits |
|
$ |
306 |
|
|
$ |
611 |
|
|
Deferred financing costs, net |
|
|
338 |
|
|
|
60 |
|
|
Other |
|
|
— |
|
|
|
28 |
|
|
|
|
$ |
644 |
|
|
$ |
699 |
|
F-25
(20) Quarterly Financial Data (Unaudited)
Summarized unaudited quarterly financial data (amounts in thousands, except per share information):
|
|
|
Quarter Ended |
|
|
|
|
|
|||||||||||||
|
|
|
March 26, |
|
|
June 25, |
|
|
September 24, |
|
|
December 31, |
|
|
|
|
|
||||
|
|
|
2017 |
|
|
2017 |
|
|
2017 |
|
|
2017 |
|
|
Total |
|
|||||
|
Total revenues |
|
$ |
105,538 |
|
|
$ |
100,015 |
|
|
$ |
85,167 |
|
|
$ |
124,103 |
|
|
$ |
414,823 |
|
|
Cost and expenses |
|
|
(89,293 |
) |
|
|
(88,470 |
) |
|
|
(82,180 |
) |
|
|
(104,293 |
) |
|
|
(364,237 |
) |
|
Loss on impairment |
|
|
- |
|
|
|
- |
|
|
|
- |
|
|
|
(3,904 |
) |
|
|
(3,904 |
) |
|
Operating income |
|
|
16,245 |
|
|
|
11,545 |
|
|
|
2,987 |
|
|
|
15,906 |
|
|
|
46,682 |
|
|
Interest expense, net |
|
|
(179 |
) |
|
|
(144 |
) |
|
|
(197 |
) |
|
|
(300 |
) |
|
|
(821 |
) |
|
Other |
|
|
24 |
|
|
|
14 |
|
|
|
(6 |
) |
|
|
19 |
|
|
|
53 |
|
|
Income from continuing operations before income tax expense |
|
|
16,090 |
|
|
|
11,415 |
|
|
|
2,784 |
|
|
|
15,625 |
|
|
|
45,914 |
|
|
Income tax expense |
|
|
5,005 |
|
|
|
3,611 |
|
|
|
1,017 |
|
|
|
6,036 |
|
|
|
15,669 |
|
|
Income from continuing operations |
|
|
11,085 |
|
|
|
7,804 |
|
|
|
1,767 |
|
|
|
9,589 |
|
|
|
30,245 |
|
|
Discontinued operations, net of income tax |
|
|
(37 |
) |
|
|
7 |
|
|
|
(71 |
) |
|
|
(8 |
) |
|
|
(108 |
) |
|
Net income (loss) |
|
$ |
11,048 |
|
|
$ |
7,811 |
|
|
$ |
1,696 |
|
|
$ |
9,581 |
|
|
$ |
30,137 |
|
|
Basic earnings per share: |
|
|
|
|
|
|
|
|
|
|
|
|
|
|
|
|
|
|
|
|
|
Continuing operations |
|
$ |
0.36 |
|
|
$ |
0.26 |
|
|
$ |
0.06 |
|
|
$ |
0.32 |
|
|
$ |
1.00 |
|
|
Discontinued operations |
|
|
— |
|
|
|
— |
|
|
|
— |
|
|
|
— |
|
|
|
(0.01 |
) |
|
Basic earnings per share |
|
$ |
0.36 |
|
|
$ |
0.26 |
|
|
$ |
0.06 |
|
|
$ |
0.32 |
|
|
$ |
0.99 |
|
|
Diluted earnings per share: |
|
|
|
|
|
|
|
|
|
|
|
|
|
|
|
|
|
|
|
|
|
Continuing operations |
|
$ |
0.35 |
|
|
$ |
0.25 |
|
|
$ |
0.06 |
|
|
$ |
0.31 |
|
|
$ |
0.98 |
|
|
Discontinued operations |
|
|
— |
|
|
|
— |
|
|
|
(0.01 |
) |
|
|
— |
|
|
|
(0.01 |
) |
|
Diluted earnings per share |
|
$ |
0.35 |
|
|
$ |
0.25 |
|
|
$ |
0.05 |
|
|
$ |
0.31 |
|
|
$ |
0.97 |
|
|
Dividends declared per common share |
|
$ |
0.09 |
|
|
$ |
0.09 |
|
|
$ |
0.09 |
|
|
$ |
0.09 |
|
|
$ |
0.36 |
|
|
|
|
Quarter Ended |
|
|
|
|
|
|||||||||||||
|
|
|
March 27, |
|
|
June 26, |
|
|
September 25, |
|
|
December 25, |
|
|
|
|
|
||||
|
|
|
2016 |
|
|
2016 |
|
|
2016 |
|
|
2016 |
|
|
Total |
|
|||||
|
Total revenues |
|
$ |
101,890 |
|
|
$ |
92,654 |
|
|
$ |
83,774 |
|
|
$ |
107,629 |
|
|
$ |
385,947 |
|
|
Cost and expenses |
|
|
(85,456 |
) |
|
|
(82,193 |
) |
|
|
(78,173 |
) |
|
|
(92,566 |
) |
|
|
(338,388 |
) |
|
Operating income |
|
|
16,434 |
|
|
|
10,461 |
|
|
|
5,601 |
|
|
|
15,063 |
|
|
|
47,559 |
|
|
Interest expense, net |
|
|
(213 |
) |
|
|
(253 |
) |
|
|
(333 |
) |
|
|
(355 |
) |
|
|
(1,154 |
) |
|
Other |
|
|
7 |
|
|
|
144 |
|
|
|
(92 |
) |
|
|
(50 |
) |
|
|
10 |
|
|
Income from continuing operations before income tax expense |
|
|
16,228 |
|
|
|
10,352 |
|
|
|
5,176 |
|
|
|
14,658 |
|
|
|
46,415 |
|
|
Income tax expense |
|
|
5,346 |
|
|
|
3,396 |
|
|
|
1,668 |
|
|
|
5,250 |
|
|
|
15,660 |
|
|
Income from continuing operations |
|
|
10,882 |
|
|
|
6,956 |
|
|
|
3,508 |
|
|
|
9,408 |
|
|
|
30,755 |
|
|
Discontinued operations, net of income tax |
|
|
(120 |
) |
|
|
(48 |
) |
|
|
75 |
|
|
|
(197 |
) |
|
|
(290 |
) |
|
Net income |
|
$ |
10,762 |
|
|
$ |
6,908 |
|
|
$ |
3,583 |
|
|
$ |
9,211 |
|
|
$ |
30,465 |
|
|
Basic earnings per share: |
|
|
|
|
|
|
|
|
|
|
|
|
|
|
|
|
|
|
|
|
|
Continuing operations |
|
$ |
0.33 |
|
|
$ |
0.22 |
|
|
$ |
0.11 |
|
|
$ |
0.31 |
|
|
$ |
0.97 |
|
|
Discontinued operations |
|
|
— |
|
|
|
— |
|
|
|
— |
|
|
|
(0.01 |
) |
|
|
(0.01 |
) |
|
Basic earnings per share |
|
$ |
0.33 |
|
|
$ |
0.22 |
|
|
$ |
0.11 |
|
|
$ |
0.30 |
|
|
$ |
0.96 |
|
|
Diluted earnings per share: |
|
|
|
|
|
|
|
|
|
|
|
|
|
|
|
|
|
|
|
|
|
Continuing operations |
|
$ |
0.33 |
|
|
$ |
0.21 |
|
|
$ |
0.11 |
|
|
$ |
0.31 |
|
|
$ |
0.96 |
|
|
Discontinued operations |
|
|
— |
|
|
|
— |
|
|
|
— |
|
|
|
(0.01 |
) |
|
|
(0.01 |
) |
|
Diluted earnings per share |
|
$ |
0.33 |
|
|
$ |
0.21 |
|
|
$ |
0.11 |
|
|
$ |
0.30 |
|
|
$ |
0.95 |
|
|
Dividends declared per common share |
|
$ |
0.07 |
|
|
$ |
0.07 |
|
|
$ |
0.07 |
|
|
$ |
0.07 |
|
|
$ |
0.28 |
|
F-26