Attached files
| file | filename |
|---|---|
| EX-99.1 - PRESS RELEASE ISSUED ON JANUARY 9, 2020 - Simulations Plus, Inc. | simulations_ex9901.htm |
| 8-K - FORM 8-K - Simulations Plus, Inc. | simulations_8k-01072020.htm |
Exhibit 99.2
Q1FY2020 Investor Conference Call Shawn O’Connor, CEO John Kneisel, CFO January 9, 2020 (NASDAQ:SLP)

2 With the exception of historical information, the matters discussed in this presentation are forward - looking statements that involve a number of risks and uncertainties . The actual results of the Company could differ significantly from those statements . Factors that could cause or contribute to such differences include but are not limited to : continuing demand for the Company’s products, competitive factors, the Company’s ability to finance future growth, the Company’s ability to produce and market new products in a timely fashion, the Company’s ability to continue to attract and retain skilled personnel, and the Company’s ability to sustain or improve current levels of productivity . Further information on the Company’s risk factors is contained in the Company’s quarterly and annual reports and filed with the Securities and Exchange Commission . Safe Harbor Statement
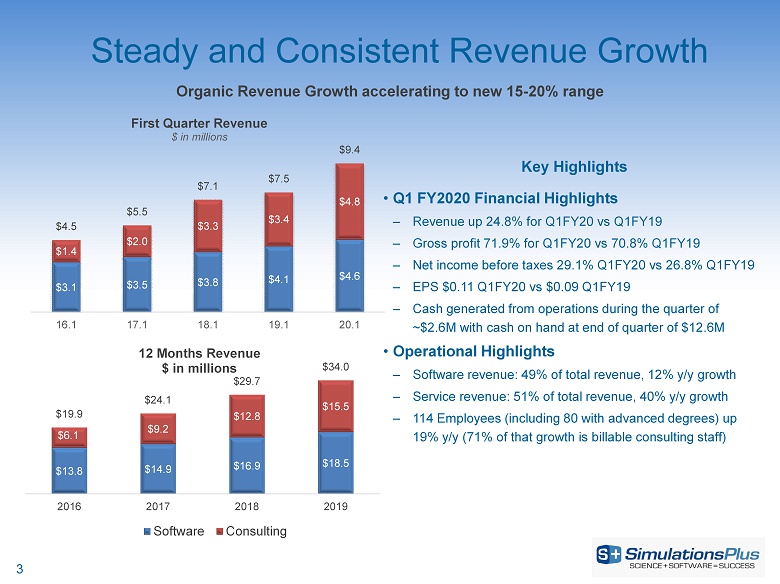
Steady and Consistent Revenue Growth 3 Organic Revenue Growth accelerating to new 15 - 20% range $13.8 $14.9 $16.9 $18.5 $6.1 $9.2 $12.8 $15.5 $19.9 $24.1 $29.7 $34.0 2016 2017 2018 2019 12 Months Revenue $ in millions Software Consulting Key Highlights • Q1 FY2020 Financial Highlights – Revenue up 24.8% for Q1FY20 vs Q1FY19 – Gross profit 71.9% for Q1FY20 vs 70.8% Q1FY19 – Net income before taxes 29.1% Q1FY20 vs 26.8% Q1FY19 – EPS $ 0.11 Q1FY20 vs $0.09 Q1FY19 – Cash generated from operations during the quarter of ~$2.6M with cash on hand at end of quarter of $12.6M • Operational Highlights – Software revenue: 49% of total revenue, 12% y/y growth – Service revenue: 51% of total revenue, 40% y/y growth – 114 Employees (including 80 with advanced degrees) up 19% y/y (71% of that growth is billable consulting staff) $3.1 $3.5 $3.8 $4.1 $4.6 $1.4 $2.0 $3.3 $3.4 $4.8 $4.5 $5.5 $7.1 $7.5 $9.4 16.1 17.1 18.1 19.1 20.1 First Quarter Revenue $ in millions

Simulations Plus Division (Lancaster) 4 The genesis of the company… providing software, training and consulting services $13.6 $14.5 $15.7 $17.3 $0.9 $1.1 $1.8 $2.3 $14.5 $15.6 $17.5 $19.6 2016 2017 2018 2019 12 Months Revenue $ in millions Software Consulting Simulations Plus represented 52.5% of total revenue and 69% of EBITDA for Q1 FY2020 Key Highlights • Q1 FY2020 Financial Highlights – Revenue up 13% for the quarter – Q1 Revenue breakdown: 69% Renewal ; 19% New Licenses ; 12% consulting – Renewal rates: 85% (accounts) and 98% (fees) – License Units (235) up 12% y/y – 16 new commercial companies and 22 non - profit groups – Projects with 26 companies and 9 funded collaborations • Operational Highlights – New funded collaboration with Bayer AG to advance the ADMET Predictor machine learning software for use within integrated drug discovery workflows – New funded collaboration agreement with a large pharmaceutical company to enhance the PKPlus ™ software – New funded collaboration with a large pharmaceutical company to modify the mechanistic oral absorption model in GastroPlus to support gastrointestinal disease research $3.1 $3.4 $3.5 $3.8 $4.3 $0.3 $0.3 $0.5 $0.6 $0.6 $3.4 $3.7 $4.0 $4.4 $4.9 16.1 17.1 18.1 19.1 20.1 First Quarter Revenue $ in millions

Key Highlights • Q1 FY2020 Financial Highlights – Revenue up 16% for the quarter – 33 contracts and 15 new projects initiated during quarter – 18 proposals outstanding with 11 companies at the start of 2QFY20 • Operational Highlights – Efficient leadership transition – Recruited 5 new staff into consulting group – 101 active projects across 34 companies in the quarter – Exit the quarter with approximately $6.5 million project backlog Cognigen Division (Buffalo) 5 A leading provider of population modeling and simulation services for the pharma and biotech industries $0.2 $0.2 $0.2 $0.2 $5.4 $7.1 $7.7 $9.2 $5.6 $7.3 $7.9 $9.4 2016 2017 2018 2019 12 Months Revenue $ in millions Software Consulting Cognigen represented 25.5% of total revenue and 4% of EBITDA for Q1 FY2020 $0.04 $0.06 $0.07 $0.04 $0.06 $1.4 $1.7 $1.9 $2.1 $2.3 $1.4 $1.8 $2.0 $2.1 $2.4 16.1 17.1 18.1 19.1 20.1 First Quarter Revenue $ in millions

$1.0 $1.0 $3.3 $4.1 $4.3 $5.1 2018 2019 12 Months Revenue $ in millions Software Consulting DILIsym Division (RTP) 6 A leading provider of software products and services in QST and QSP Key Highlights • Q1 FY2020 Financial Highlights – Revenue up 88% for the quarter – Revenue breakdown: 61% DILIsym software and projects; 15% RADAsym ™; 7% IPFsym ™ software; 6% NAFLDsym software and projects; 5% RENAsym grant; 6% Other – 7 active consortium DILIsym contracts – 19 active DILIsym projects; 2 NAFLDsym projects in process • Operational Highlights – Responded to 2 client driven accelerated project deliveries in support of regulatory strategies – Successfully recruited 2 new staff to start in Q2FY20 DILIsym represented 22% of total revenue and 27% of EBITDA for Q1 FY2020 $0.2 $0.3 $0.2 $0.9 $0.8 $1.9 $1.1 $1.1 $2.1 18.1 19.1 20.1 First Quarter Revenue $ in millions

Financial Results

8 Income Statement: 1QFY20 Versus 1QFY19 (in millions) Lancaster Buffalo North Carolina 1Q20 1Q19 Diff % chg Net sales $ 4.9 $ 2.4 $ 2.1 $ 9.4 $ 7.5 $ 1.9 24.8% Gross profit $ 4.2 $ 1.1 $ 1.5 $ 6.8 $ 5.3 $ 1.4 26.7% Gross profit margin 84.9% 46.8% 69.9% 71.9% 70.8% 1.1% 1.5% SG&A $ 1.9 $ 1.0 $ 0.5 $ 3.5 $ 2.7 $ 0.8 29.2% R&D $ 0.3 $ 0.0 $ 0.2 0.5 $ 0.5 (0.0) - 0.6% Total operating expenses $ 2.3 $ 1.1 $ 0.7 4.0 $ 3.2 0.8 24.3% Income from operations $ 1.9 $ 0.0 $ 0.8 2.7 $ 2.1 0.6 30.3% Other income (expense) $ 0.0 $ 0.0 $ 0.0 0.0 $ (0.1) 0.1 - 123.0% Income before income taxes $ 1.9 $ 0.0 $ 0.8 2.7 $ 2.0 0.7 35.2% Net income $ 1.4 $ 0.0 $ 0.6 $ 2.1 $ 1.5 $ 0.5 34.0% Diluted earnings per share (in dollars) $ 0.11 $ 0.09 $ 0.03 31.7% EBITDA $ 2.4 $ 0.1 $ 0.9 $ 3.4 $ 2.8 $ 0.7 25.1% Note: some numbers may not foot or crossfoot due to rounding

9 Consolidated Revenues: Fiscal Quarter ( in millions) $4.8 $5.2 $6.0 $4.0 $5.4 $5.7 $6.8 $6.3 $7.1 $7.4 $8.6 $6.7 $7.5 $8.5 $9.9 $8.0 $9.4 $0 $1 $2 $3 $4 $5 $6 $7 $8 $9 $10 $11 Q1 Q2 Q3 Q4 2016 2017 2018 2019 2020

10 Consolidated Income from Operations: Fiscal Quarter (in millions) $1.7 $1.7 $2.8 $1.0 $1.9 $1.8 $3.1 $1.4 $2.6 $2.4 $3.4 $1.9 $2.1 $2.7 $3.9 $2.0 $2.7 $0.0 $0.5 $1.0 $1.5 $2.0 $2.5 $3.0 $3.5 $4.0 $4.5 Q1 Q2 Q3 Q4 2016 2017 2018 2019 2020

$1.1 $1.2 $1.9 $0.8 $1.4 $1.2 $2.1 $1.2 $1.7 $3.5 $2.4 $1.3 $1.5 $2.1 $2.9 $2.1 $2.1 $0.0 $0.5 $1.0 $1.5 $2.0 $2.5 $3.0 $3.5 $4.0 Q1 Q2 Q3 Q4 2016 2017 2018 2019 2020 $2.0 11 Note: 2Q18 $1.5M tax benefit of deferred tax adjustment Consolidated Net Income: Fiscal Quarter (in millions)
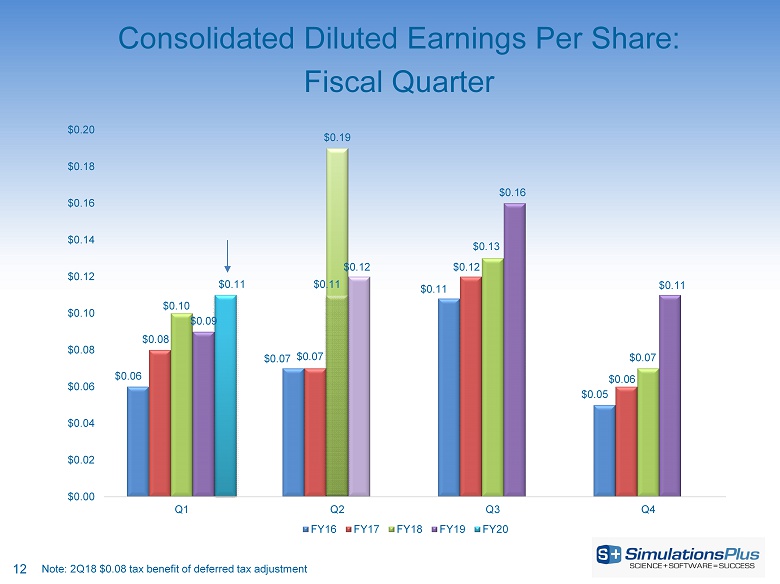
12 Consolidated Diluted Earnings Per Share: Fiscal Quarter $0.06 $0.07 $0.11 $0.05 $0.08 $0.07 $0.12 $0.06 $0.10 $0.19 $0.13 $0.07 $0.09 $0.12 $0.16 $0.11 $0.11 $0.00 $0.02 $0.04 $0.06 $0.08 $0.10 $0.12 $0.14 $0.16 $0.18 $0.20 Q1 Q2 Q3 Q4 FY16 FY17 FY18 FY19 FY20 $0.11 Note: 2Q18 $0.08 tax benefit of deferred tax adjustment

13 Consolidated EBITDA: Fiscal Quarter (in millions) $2.2 $2.2 $3.3 $1.5 $2.5 $2.3 $3.6 $2.0 $3.2 $3.1 $4.1 $2.6 $2.8 $3.4 $4.6 $2.7 $3.4 $0 $1 $2 $3 $4 $5 Q1 Q2 Q3 Q4 2016 2017 2018 2019 2020

Revenue by Region – First Quarter 2020 Europe 16 % Americas 68 % Asia 16 % Japan = 50% Korea = 25% China = 20% Other = 5% 14 A global and diversified base of revenue

15 Cash Position Excellent (in millions) Accumulating Cash while funding Acquisitions and Dividends $0.9 $0.9 $0.9 $0.9 $1.0 $1.0 $1.0 $1.1 $1.1 $1.1 $1.1 $1.1 $1.1 $1.0 $5.0 $1.6 $1.0 $1.7 $8.8 $7.4 $8.2 $6.2 $7.0 $7.5 $7.2 $9.4 $9.4 $9.9 $10.3 $11.4 $12.6 $12.7 17.1 17.2 17.3 17.4 18.1 18.2 18.3 18.4 19.1 19.2 19.3 19.4 20.1 1/7/20 Dividend Paid Acquisitions Cash on Hand Cash paid for DILIsym Earnout in 19.1 ($1.6) in Dec 2018 ($1.0M) * Chart covers period starting September 2016 . Cash paid for DILIsym earnout ($1.7M) Cash paid for DILIsym Final cash paid to t TSRL
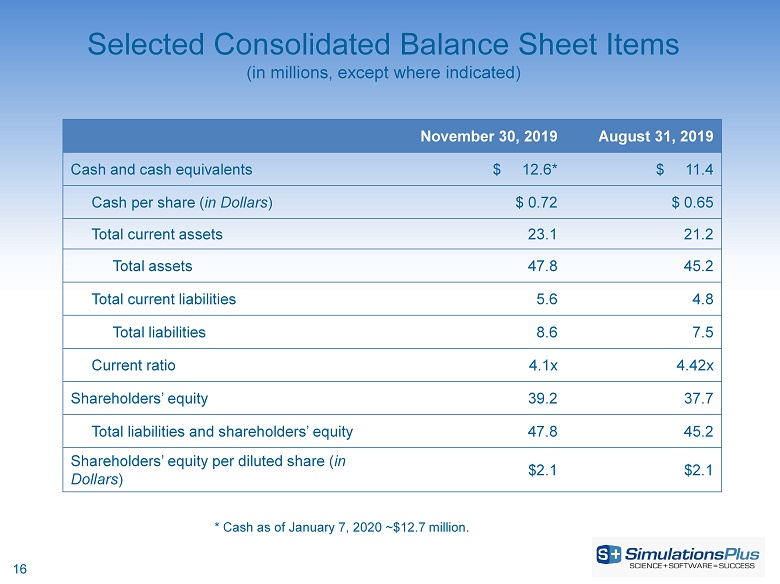
16 Selected Consolidated Balance Sheet Items (in millions, except where indicated) November 30, 2019 August 31, 2019 Cash and cash equivalents $ 12.6* $ 11.4 Cash per share ( in Dollars ) $ 0.72 $ 0.65 Total current assets 23.1 21.2 Total assets 47.8 45.2 Total current liabilities 5.6 4.8 Total liabilities 8.6 7.5 Current ratio 4.1x 4.42x Shareholders’ equity 39.2 37.7 Total liabilities and shareholders’ equity 47.8 45.2 Shareholders’ equity per diluted share ( in Dollars ) $2.1 $2.1 * Cash as of January 7, 2020 ~$12.7 million .

1 Dividend ratio for FY2019; No assurances of future cash dividends can be made as the BOD makes its decision on a quarterly ba si s based on current financial condition and strategic plans. Products & Services Software Portfolio • Modeling & simulation platform for drug R&D • Predictive software for >140 properties of chemical formulations • Analytical software for certain biological or disease states • Cloud - based web app for drug development lifecycle management Consulting Services • Provide multi - disciplinary modeling and simulation support Operating Divisions • Simulations Plus, Inc. • Cognigen • DILIsym Consistent Financial Results • > 10 years of consistent revenue growth • > 10 years of profitability • Cash generated from operations during 1QFY2020 of $2.6 Million with cash on hand of $12.7 Million at 1/7/2020 • Dividend payout ratio of 49% 1. • Quarterly dividend of $0.06 per share 1 Customers and Market Pharmaceutical and biotech companies ranging from the largest in the world to a number of medium - sized and smaller companies in the U.S., Europe and Japan Corporate Information • The company was founded in 1996 and now has 114 employees* worldwide. • Primary offices located in Lancaster, CA; Buffalo, NY; and Raleigh, NC. * As of 11/30/2019 Simulations Plus Our mission is to improve the productivity of science - based research & development enterprises by delivering innovative modeling and simulation software and insightful consulting services 17

18 Thank you! https://www.linkedin.com/company/simulations - plus https://www.linkedin.com/company/cognigen https://www.linkedin.com/company/dilisym