Attached files
| file | filename |
|---|---|
| 8-K - 8-K - McEwen Mining Inc. | a19-2956_28k.htm |
Asset Rich, Growing Gold & Silver Production Big Insider Ownership, Large Copper Deposit Investing For A Golden & Electric Future TD Mining Conference January 2019 Christina McCarthy cd@mcewenmining.com 647.258.0395 x.390

Cautionary Statement 2 This presentation contains certain forward-looking statements and information, including "forward-looking statements" within the meaning of the Private Securities Litigation Reform Act of 1995. The forward-looking statements and information expressed, as at the date of this presentation, McEwen Mining Inc.'s (the "Company") estimates, forecasts, projections, expectations or beliefs as to future events and results. Forward-looking statements and information are necessarily based upon a number of estimates and assumptions that, while considered reasonable by management, are inherently subject to significant business, economic and competitive uncertainties, risks and contingencies, and there can be no assurance that such statements and information will prove to be accurate. Therefore, actual results and future events could differ materially from those anticipated in such statements and information. Risks and uncertainties that could cause results or future events to differ materially from current expectations expressed or implied by the forward-looking statements and information include, but are not limited to, factors associated with fluctuations in the market price of precious metals, mining industry risks, political, economic, social and security risks associated with foreign operations, the ability of the corporation to receive or receive in a timely manner permits or other approvals required in connection with operations, risks associated with the construction of mining operations and commencement of production and the projected costs thereof, risks related to litigation, the state of the capital markets, environmental risks and hazards, uncertainty as to calculation of mineral resources and reserves, risk of delisting from a public exchange, and other risks. The Company's dividend policy will be reviewed periodically by the Board of Directors and is subject to change based on certain factors such as the capital needs of the Company and its future operating results. Readers should not place undue reliance on forward-looking statements or information included herein, which speak only as of the date hereof. The Company undertakes no obligation to reissue or update forward-looking statements or information as a result of new information or events after the date hereof except as may be required by law. See McEwen Mining's Annual Report on Form 10-K for the fiscal year ended December 31, 2017 and Quarterly Report on Form 10-Q for the quarter ended September 30, 2018, and other filings with the Securities and Exchange Commission, under the caption "Risk Factors", for additional information on risks, uncertainties and other factors relating to the forward-looking statements and information regarding the Company. All forward-looking statements and information made in this presentation are qualified by this cautionary statement. All currency information quoted in U.S. dollars. The technical contents of this presentation have been reviewed and approved by Chris Stewart, P.Eng., President & COO, the exploration technical contents of this presentation have been reviewed and approved by Sylvain Guerard, P. Geo., SVP Exploration and the reserves and resources contents of the presentation have been reviewed and approved by Luke Willis, P. Geo., Director of Resource Modelling, each of whom is a Qualified Person as defined by Canadian Securities Administrators National Instrument 43-101 "Standards of Disclosure for Mineral Projects". To see cautionary note regarding NON-GAAP measures, go to www.mcewenmining.com/files/presentation_disclosure.pdf To see MUX reserves and resources table, go to www.mcewenmining.com/Operations/Reserves-and-Resources/default.aspx Risk adverse? Forget about buying our shares. Past performance is unreliable in predicting the future. Unexpected events can happen and can change forecasts.
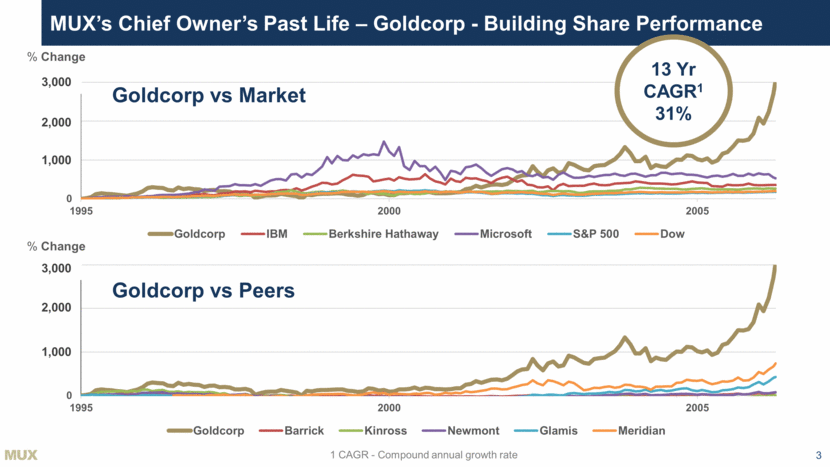
MUX’s Chief Owner’s Past Life – Goldcorp - Building Share Performance 3 % Change Goldcorp vs Market Goldcorp vs Peers 13 Yr CAGR1 31% % Change 1 CAGR - Compound annual growth rate 3,000 2,000 1,000 3,000 2,000 1,000 0 1000 2000 3000 1995 2000 2005 Goldcorp Barrick Kinross Newmont Glamis Meridian
MUX - Amplifies the Gold Price 4 Source: Bloomberg. As Jan 15, 2019. US$. 1Three year average. High Beta1 To Gold 3.0x $1.76 26x 22x $0.65 Rob McEwen Becomes CEO US Gold McEwen Mining Share Price US$ 0 2 4 6 8 10 2000 2002 2004 2006 2008 2010 2012 2014 2016 2018
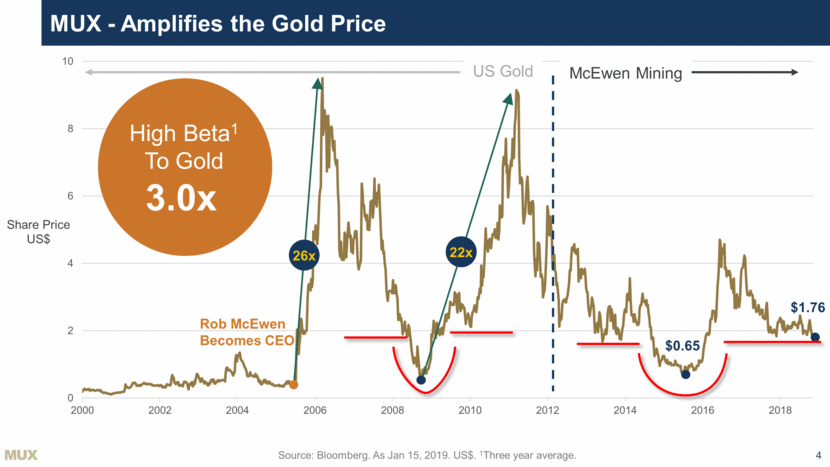
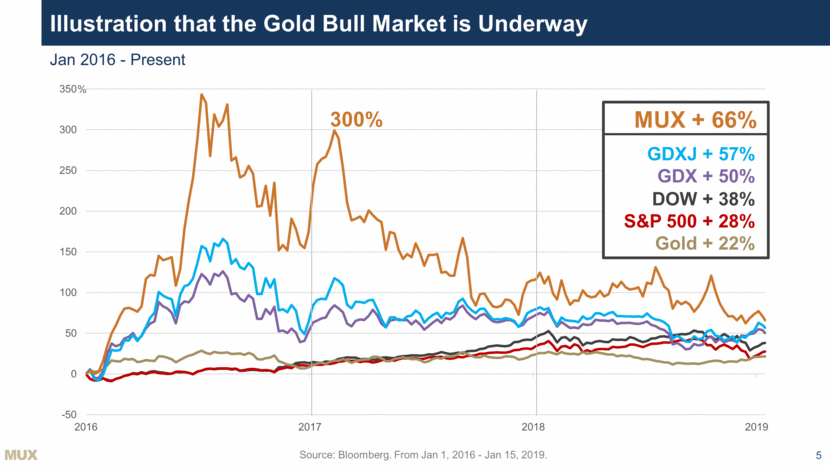
Illustration that the Gold Bull Market is Underway 5 Source: Bloomberg. From Jan 1, 2016 - Jan 15, 2019. 300% MUX + 66% % DOW + 38% S&P 500 + 28% Gold + 22% GDXJ + 57% GDX + 50% Jan 2016 - Present -50 0 50 100 150 200 250 300 350 2016 2017 2018 2019
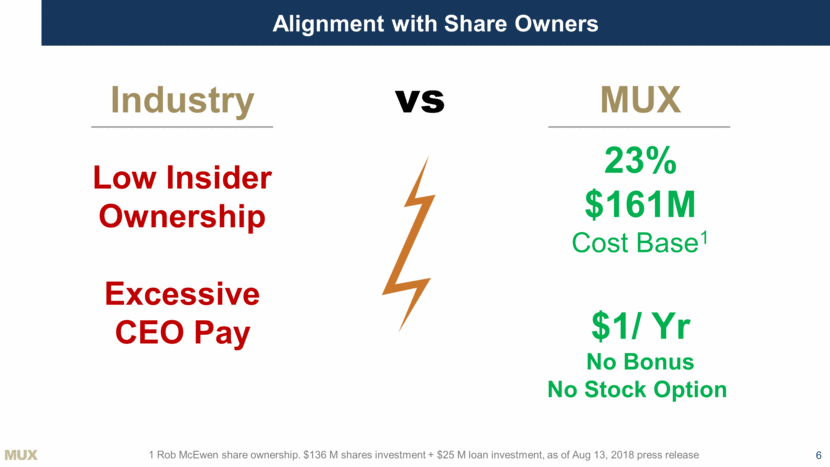
Alignment with Share Owners 6 Industry Low Insider Ownership Excessive CEO Pay 23% $161M Cost Base1 $1/ Yr No Bonus No Stock Option MUX vs 1 Rob McEwen share ownership. $136 M shares investment + $25 M loan investment, as of Aug 13, 2018 press release
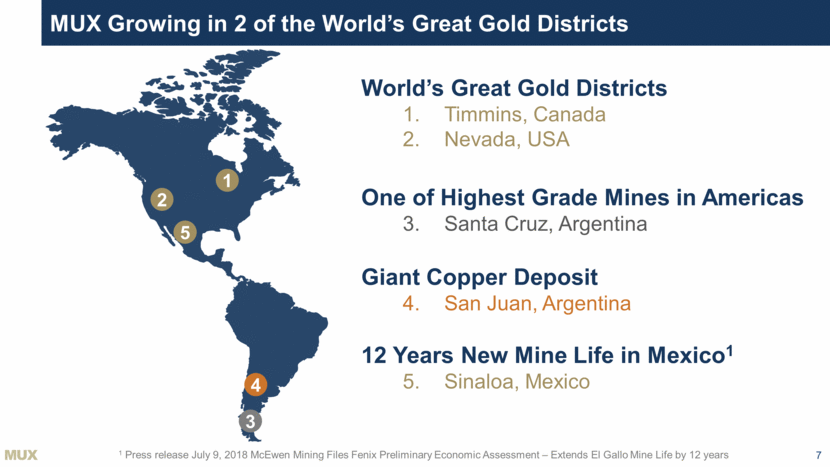
MUX Growing in 2 of the World’s Great Gold Districts 7 1 2 5 3 4 World’s Great Gold Districts Timmins, Canada Nevada, USA One of Highest Grade Mines in Americas Santa Cruz, Argentina Giant Copper Deposit San Juan, Argentina 12 Years New Mine Life in Mexico1 Sinaloa, Mexico 1 Press release July 9, 2018 McEwen Mining Files Fenix Preliminary Economic Assessment – Extends El Gallo Mine Life by 12 years
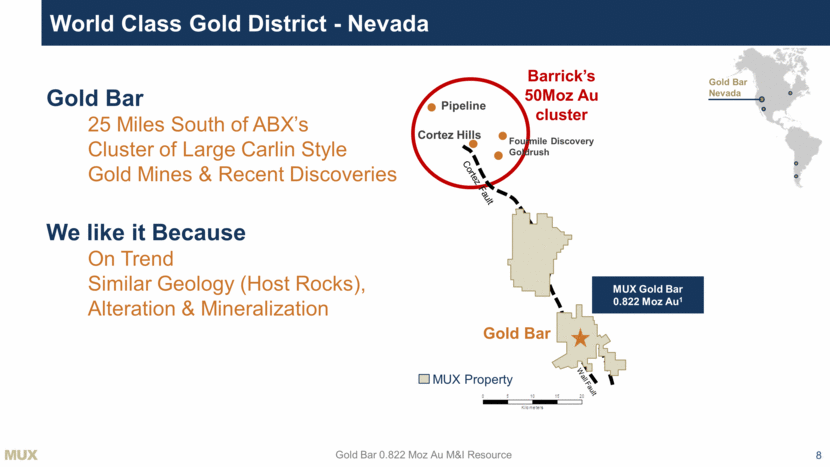
MUX Gold Bar 0.822 Moz Au1 Cortez Fault Cortez Hills Barrick’s 50Moz Au cluster Pipeline Fourmile Discovery Goldrush Wall Fault World Class Gold District - Nevada 8 Gold Bar 0.822 Moz Au M&I Resource Gold Bar 25 Miles South of ABX’s Cluster of Large Carlin Style Gold Mines & Recent Discoveries We like it Because On Trend Similar Geology (Host Rocks), Alteration & Mineralization Gold Bar Nevada MUX Property Gold Bar
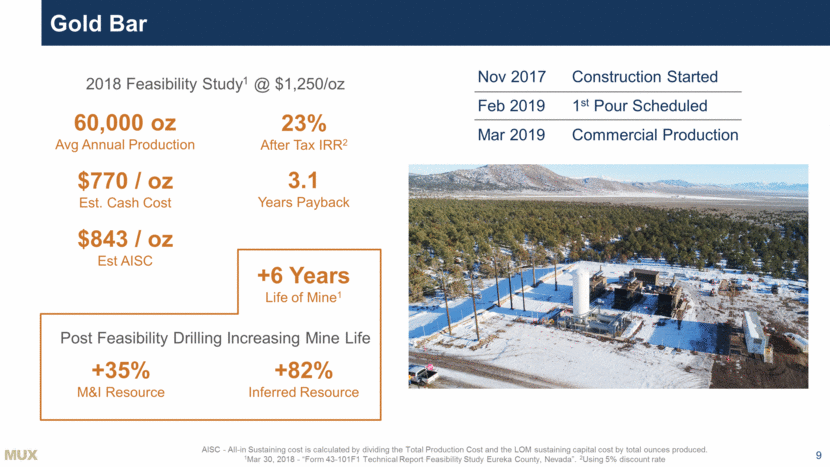
Gold Bar 9 AISC - All-in Sustaining cost is calculated by dividing the Total Production Cost and the LOM sustaining capital cost by total ounces produced. 1Mar 30, 2018 - “Form 43-101F1 Technical Report Feasibility Study Eureka County, Nevada”. 2Using 5% discount rate Nov 2017 Feb 2019 Mar 2019 Construction Started 1st Pour Scheduled Commercial Production 60,000 oz Avg Annual Production $770 / oz Est. Cash Cost $843 / oz Est AISC +6 Years Life of Mine1 2018 Feasibility Study1 @ $1,250/oz 23% After Tax IRR2 3.1 Years Payback Post Feasibility Drilling Increasing Mine Life +35% M&I Resource +82% Inferred Resource
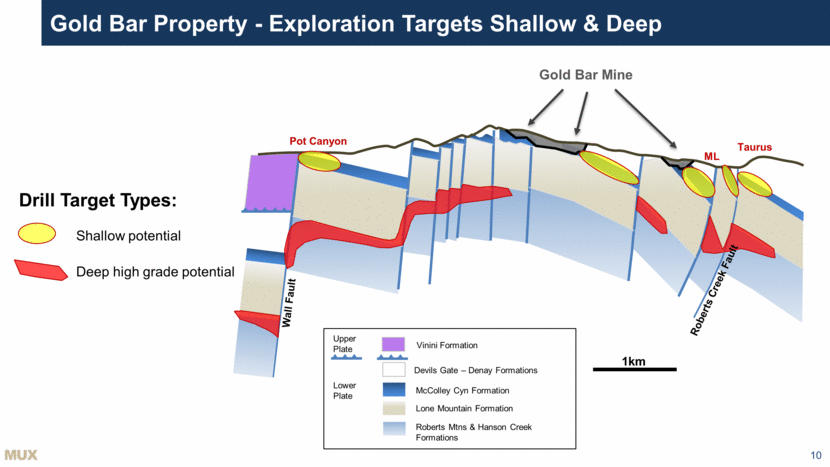
Gold Bar Property - Exploration Targets Shallow & Deep 10 1km Pot Canyon Taurus ML Roberts Mtns & Hanson Creek Formations McColley Cyn Formation Wall Fault Lone Mountain Formation Vinini Formation Devils Gate – Denay Formations Lower Plate Upper Plate Drill Target Types: Shallow potential Deep high grade potential Gold Bar Mine Roberts Creek Fault
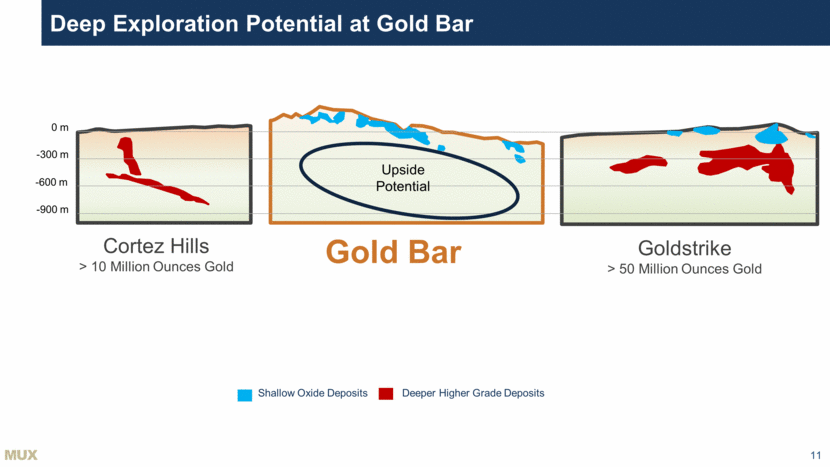
Deep Exploration Potential at Gold Bar 11 Cortez Hills > 10 Million Ounces Gold Gold Bar Goldstrike > 50 Million Ounces Gold Shallow Oxide Deposits Deeper Higher Grade Deposits 0 m -300 m -600 m -900 m Upside Potential
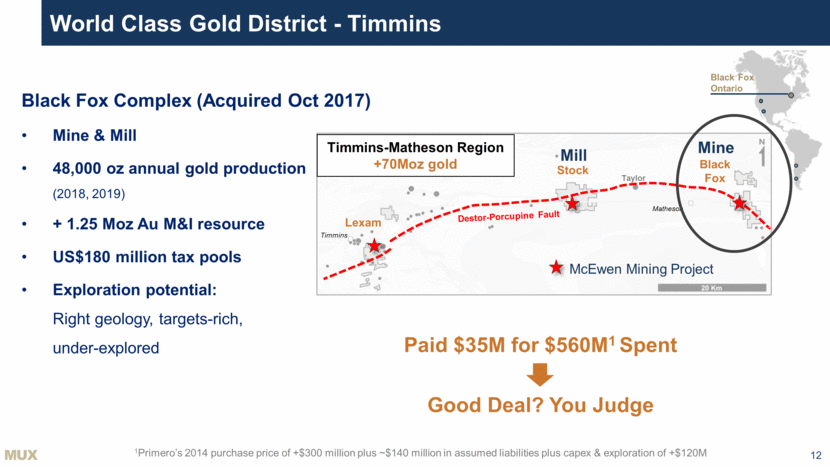
World Class Gold District - Timmins 12 Paid $35M for $560M1 Spent Good Deal? You Judge Black Fox Complex (Acquired Oct 2017) Mine & Mill 48,000 oz annual gold production (2018, 2019) + 1.25 Moz Au M&I resource US$180 million tax pools Exploration potential: Right geology, targets-rich, under-explored Stock Taylor Matheson Destor-Porcupine Fault Lexam Black Fox Timmins Timmins-Matheson Region +70Moz gold McEwen Mining Project Black Fox Ontario 1Primero’s 2014 purchase price of +$300 million plus ~$140 million in assumed liabilities plus capex & exploration of +$120M Mill Mine
Black Fox - 2018 Surface Exploration 13 Multiple new gold occurrences drilled with high grade intersections New Indicated Resources: - Tamarack 127 Koz AuEq - Froome increase to 181 Koz Au (+22 Koz) 35g/t Au / 3.3m Froome FW 493g/t Au / 1m Black Fox Depth Extension 55.1g/t Au / 1.2m 3.1g/t / 34m Incl. 9.7g/t /7m Froome +22Koz 181Koz @ 5.09g/t Au Tamarack 127Koz @ 5.08g/t AuEq Kit 13.4g/t / 3m 639g/t Au / 0.7m
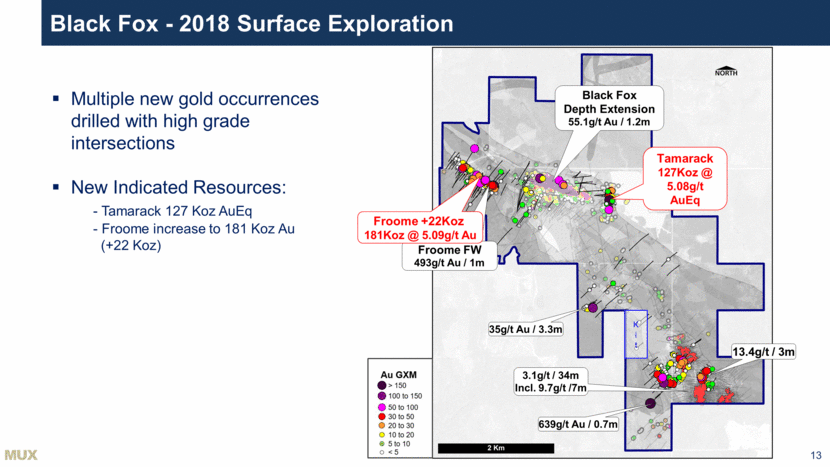
4.40 g/t Au / 5.38m 4.90 g/t Au / 6m 25.5 g/t Au / 3.35m 83.9 g/t Au / 4.92m 187.8 g/t Au / 1.12m Inc. 320.7 g/t Au / 0.6m 161.9g/t Au / 1.2m Inc. 320.7g/t Au/ 0.6m 34.8g/t Au / 3m 6.68 g/t Au / 8m 27.3g/t Au / 3.33m 147.4g/t Au / 0.53m 27.8 g/t Au / 8.1m 44.1 g/t Au / 1.2m, 12.7 g/t Au / 7m 25.0 g/t Au / 1.85m, 8.40 g/t Au / 6.46m 19.1 g/t Au / 3m 30.6 g/t Au / 1.4m 24.0 g/t Au / 1m 48.0 g/t Au / 1.42m 44.4g/t Au / 8.78m 141.2g/t Au / 2.67m 43.5g/t Au / 9m 47.9g/t Au / 3.19m 55.1g/t Au/ 1.2m 21.6g/t Au / 1.15m 7.24g/t Au / 4.85m Inc. 18.4gpt Au/ 0.8m Inc. 18.1gpt Au/ 0.65m 31.3g/t Au / 1m 51.5g/t Au / 1m 6.61g/t Au / 4m 14.8g/t Au / 1.8m 9.8 g/t Au / 3m 2018 Black Fox Underground Exploration Results 14 Depth Extension Exploration & Delineation Definition 2018 Pre2018 Priority Targets Drill Results: Converting resources to reserves Test for lateral extensions Test for extensions at depth Resource, Reserve & mine plan update in Q1 2019 Objectives 400m Level 1,050
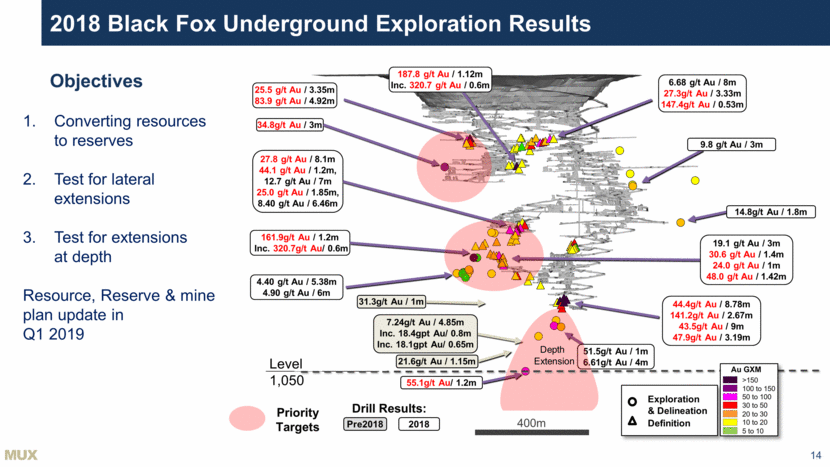
Reason for Testing for Depth Extension of Mineralization 15 1,000m 2,000m HG Young Campbell Red Lake Red Lake Black Fox Stock Stock East Macassa Kirkland Teck Hughes Lake Shore Wright- Hargreaves Sylvanite Toburn Kirkland Lake Timmins Camp Hollinger Dome Bell Creek Hoyle Pond Deepest Drill Hole MUX
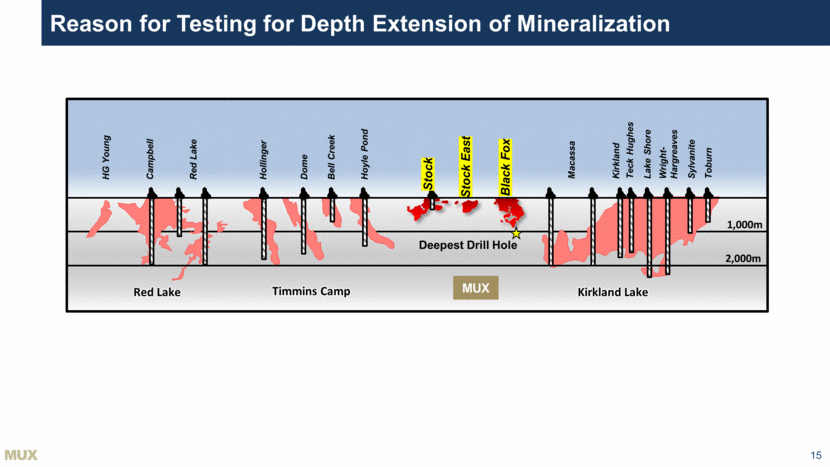
Black Fox Complex – Stock Property 16 Stock Taylor Matheson Destor-Porcupine Fault Lexam Black Fox Timmins Timmins-Matheson Region +70Moz gold McEwen Mining Project Mill Mine 700 meters from mill Near surface potential Over 2 km strike length Stock Mine Past Production 137 Koz @ 5.5 gpt Au (1989 - 2005) Resource update in Q1 2019 2018 Exploration
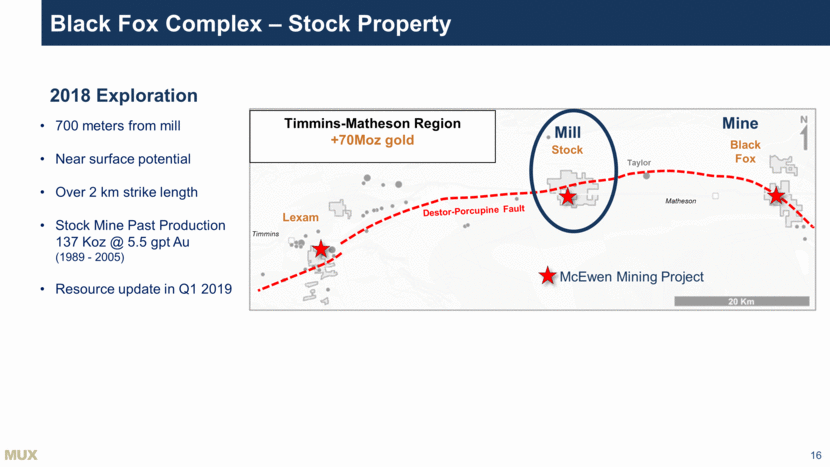
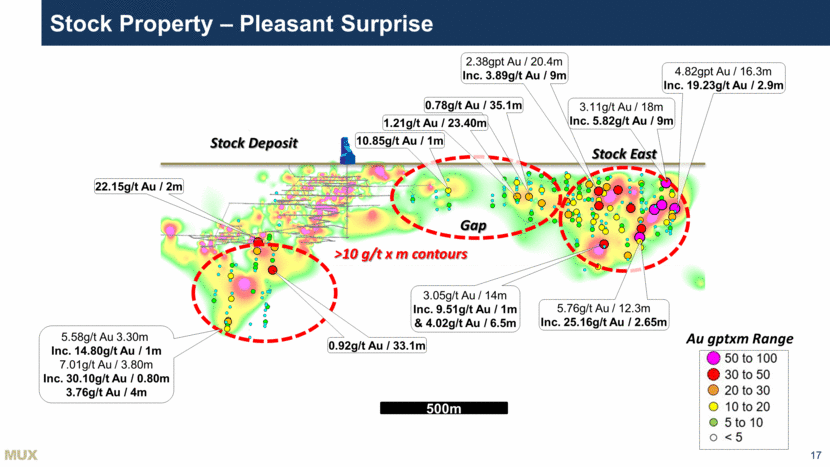
500m Gap 4.82gpt Au / 16.3m Inc. 19.23g/t Au / 2.9m 2.38gpt Au / 20.4m Inc. 3.89g/t Au / 9m 3.05g/t Au / 14m Inc. 9.51g/t Au / 1m & 4.02g/t Au / 6.5m 10.85g/t Au / 1m 0.92g/t Au / 33.1m 22.15g/t Au / 2m 5.58g/t Au 3.30m Inc. 14.80g/t Au / 1m 7.01g/t Au / 3.80m Inc. 30.10g/t Au / 0.80m 3.76g/t Au / 4m Stock Deposit Au gptxm Range 0.78g/t Au / 35.1m >10 g/t x m contours Stock Property – Pleasant Surprise 17 5.76g/t Au / 12.3m Inc. 25.16g/t Au / 2.65m 3.11g/t Au / 18m Inc. 5.82g/t Au / 9m Stock East 1.21g/t Au / 23.40m
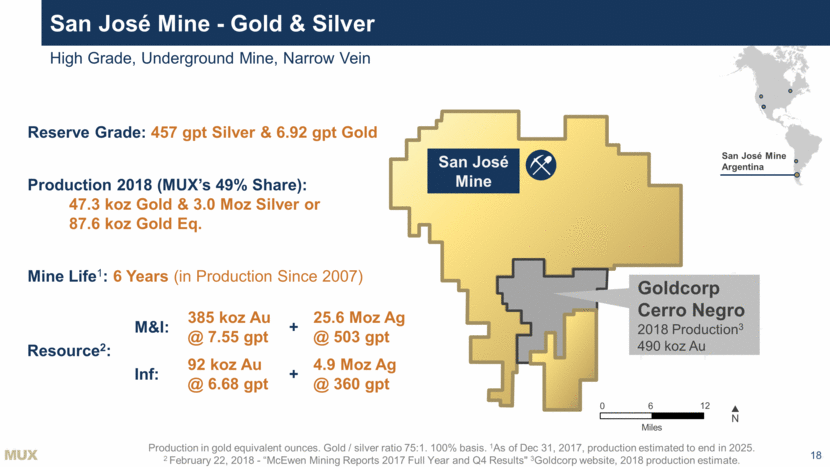
San José Mine - Gold & Silver 18 Production in gold equivalent ounces. Gold / silver ratio 75:1. 100% basis. 1As of Dec 31, 2017, production estimated to end in 2025. 2 February 22, 2018 - “McEwen Mining Reports 2017 Full Year and Q4 Results" 3Goldcorp website, 2018 production estimate. Reserve Grade: 457 gpt Silver & 6.92 gpt Gold Production 2018 (MUX’s 49% Share): 47.3 koz Gold & 3.0 Moz Silver or 87.6 koz Gold Eq. Mine Life1: 6 Years (in Production Since 2007) San José Mine N 6 Miles 0 12 Goldcorp Cerro Negro 2018 Production3 490 koz Au Resource2: M&I: 385 koz Au @ 7.55 gpt + 25.6 Moz Ag @ 503 gpt Inf: 92 koz Au @ 6.68 gpt + 4.9 Moz Ag @ 360 gpt San José Mine Argentina High Grade, Underground Mine, Narrow Vein
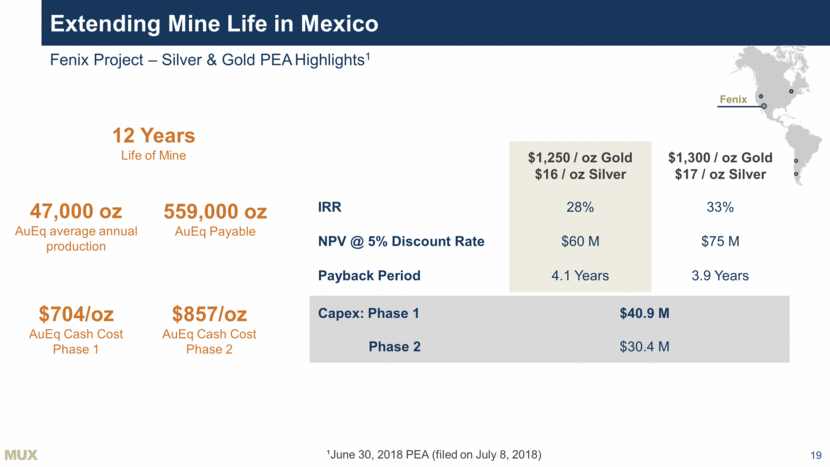
Extending Mine Life in Mexico 19 $1,250 / oz Gold $16 / oz Silver $1,300 / oz Gold $17 / oz Silver IRR 28% 33% NPV @ 5% Discount Rate $60 M $75 M Payback Period 4.1 Years 3.9 Years ¹June 30, 2018 PEA (filed on July 8, 2018) Capex: Phase 1 $40.9 M Phase 2 $30.4 M Fenix Fenix Project – Silver & Gold PEA Highlights1 12 Years Life of Mine 47,000 oz AuEq average annual production 559,000 oz AuEq Payable $704/oz AuEq Cash Cost Phase 1 $857/oz AuEq Cash Cost Phase 2
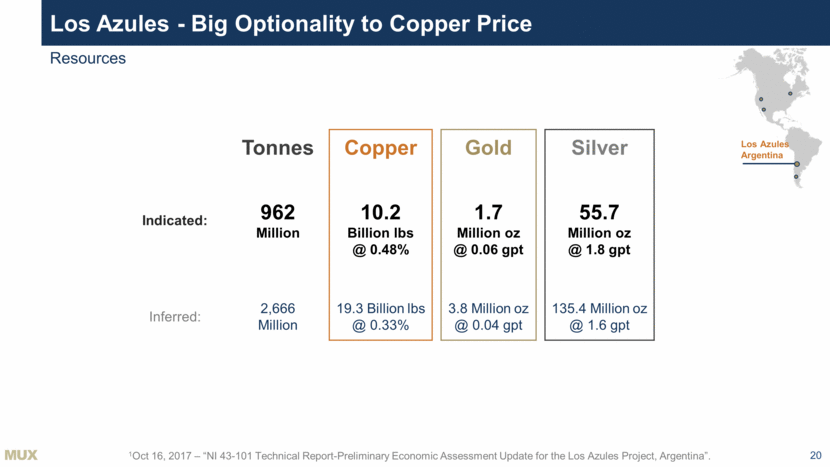
Los Azules - Big Optionality to Copper Price 20 1Oct 16, 2017 – “NI 43-101 Technical Report-Preliminary Economic Assessment Update for the Los Azules Project, Argentina”. Tonnes Copper Gold Silver Indicated: 962 Million 10.2 Billion lbs @ 0.48% 1.7 Million oz @ 0.06 gpt 55.7 Million oz @ 1.8 gpt Inferred: 2,666 Million 19.3 Billion lbs @ 0.33% 3.8 Million oz @ 0.04 gpt 135.4 Million oz @ 1.6 gpt Los Azules Argentina Resources
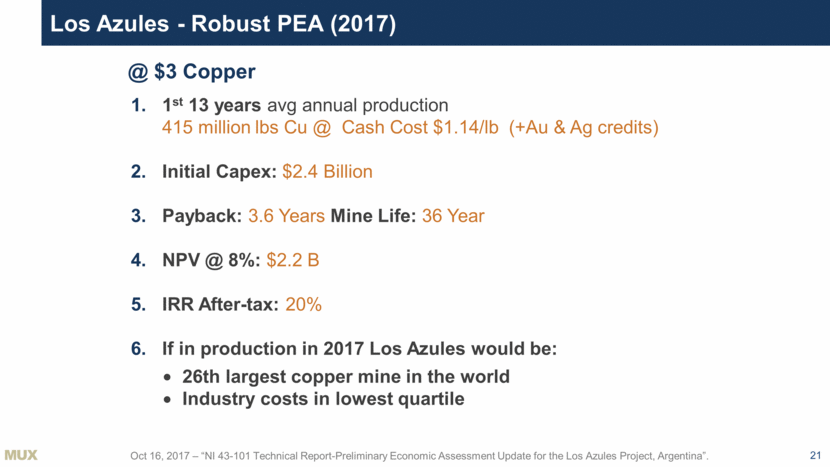
Los Azules - Robust PEA (2017) 21 Oct 16, 2017 – “NI 43-101 Technical Report-Preliminary Economic Assessment Update for the Los Azules Project, Argentina”. 1st 13 years avg annual production 415 million lbs Cu @ Cash Cost $1.14/lb (+Au & Ag credits) Initial Capex: $2.4 Billion Payback: 3.6 Years Mine Life: 36 Year NPV @ 8%: $2.2 B IRR After-tax: 20% If in production in 2017 Los Azules would be: @ $3 Copper 26th largest copper mine in the world Industry costs in lowest quartile
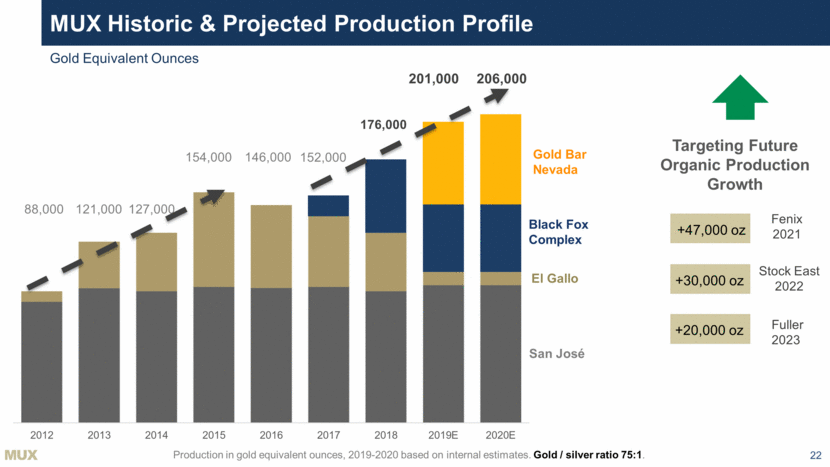
MUX Historic & Projected Production Profile 22 Production in gold equivalent ounces, 2019-2020 based on internal estimates. Gold / silver ratio 75:1. San José El Gallo Black Fox Complex Gold Bar Nevada 154,000 127,000 121,000 88,000 152,000 146,000 201,000 206,000 Targeting Future Organic Production Growth +20,000 oz +47,000 oz +30,000 oz Stock East 2022 Fuller 2023 Fenix 2021 Gold Equivalent Ounces 176,000 2012 2013 2014 2015 2016 2017 2018 2019E 2020E
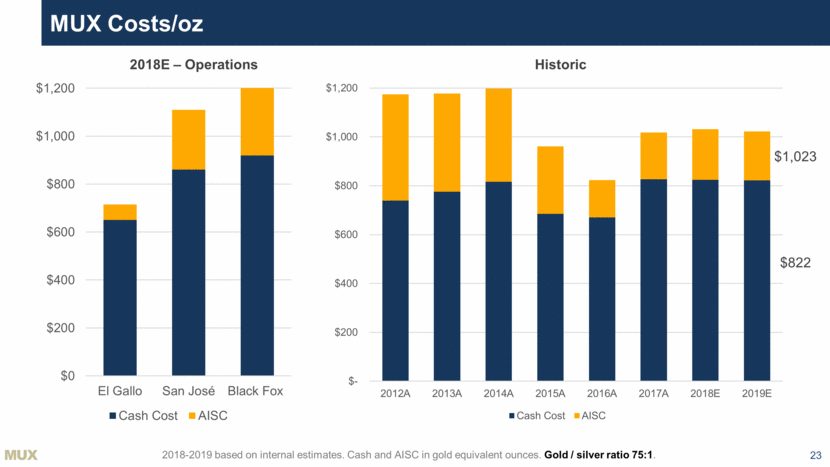
MUX Costs/oz 23 2018-2019 based on internal estimates. Cash and AISC in gold equivalent ounces. Gold / silver ratio 75:1. 2018E – Operations $822 $1,023 Historic $- $200 $400 $600 $800 $1,000 $1,200 2012A 2013A 2014A 2015A 2016A 2017A 2018E 2019E Cash Cost AISC $0 $200 $400 $600 $800 $1,000 $1,200 El Gallo San José Black Fox Cash Cost AISC
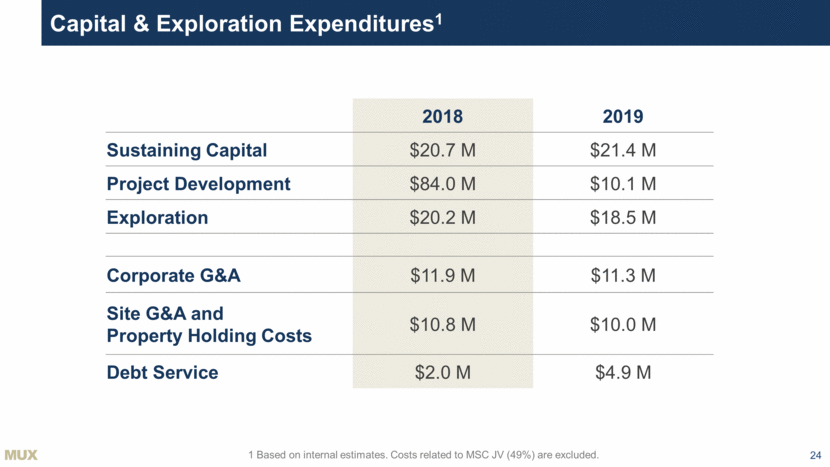
Capital & Exploration Expenditures1 24 2018 2019 Sustaining Capital $20.7 M $21.4 M Project Development $84.0 M $10.1 M Exploration $20.2 M $18.5 M Corporate G&A $11.9 M $11.3 M Site G&A and Property Holding Costs $10.8 M $10.0 M Debt Service $2.0 M $4.9 M 1 Based on internal estimates. Costs related to MSC JV (49%) are excluded.
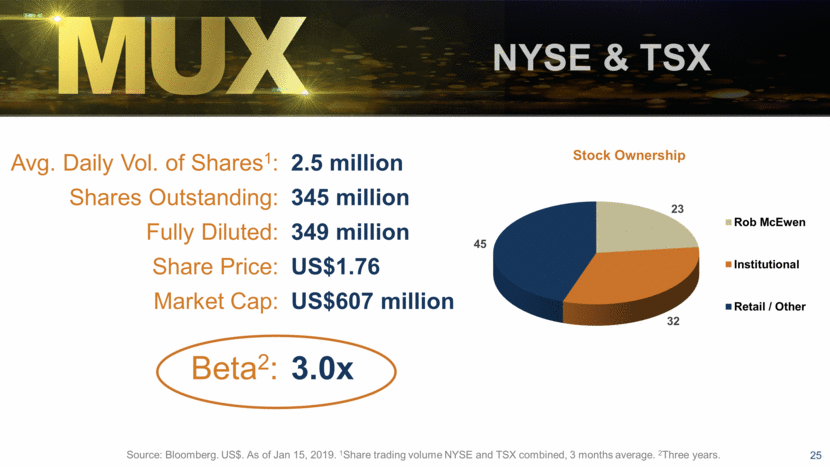
Avg. Daily Vol. of Shares1: Shares Outstanding: Fully Diluted: Share Price: Market Cap: Beta2: 2.5 million 345 million 349 million US$1.76 US$607 million 3.0x 25 Source: Bloomberg. US$. As of Jan 15, 2019. 1Share trading volume NYSE and TSX combined, 3 months average. 2Three years. NYSE & TSX 23 32 45 Stock Ownership Rob McEwen Institutional Retail / Other
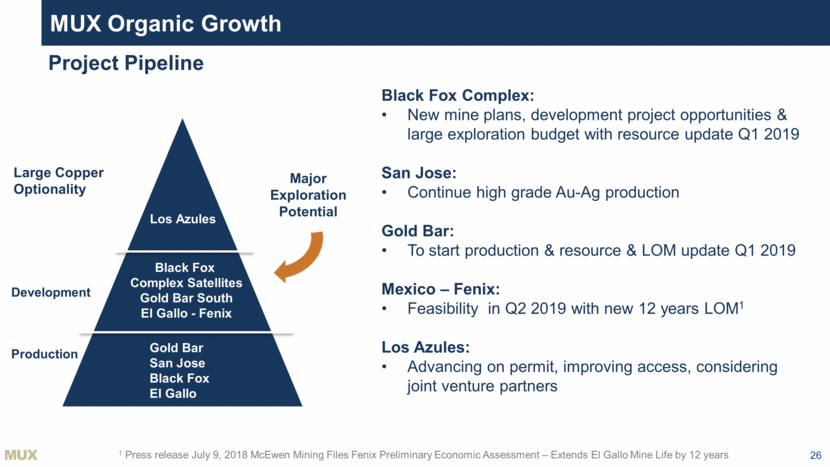
MUX Organic Growth 26 Black Fox Complex: New mine plans, development project opportunities & large exploration budget with resource update Q1 2019 San Jose: Continue high grade Au-Ag production Gold Bar: To start production & resource & LOM update Q1 2019 Mexico – Fenix: Feasibility in Q2 2019 with new 12 years LOM1 Los Azules: Advancing on permit, improving access, considering joint venture partners Gold Bar San Jose Black Fox El Gallo Black Fox Complex Satellites Gold Bar South El Gallo - Fenix Los Azules Project Pipeline Production Development Large Copper Optionality Major Exploration Potential 1 Press release July 9, 2018 McEwen Mining Files Fenix Preliminary Economic Assessment – Extends El Gallo Mine Life by 12 years
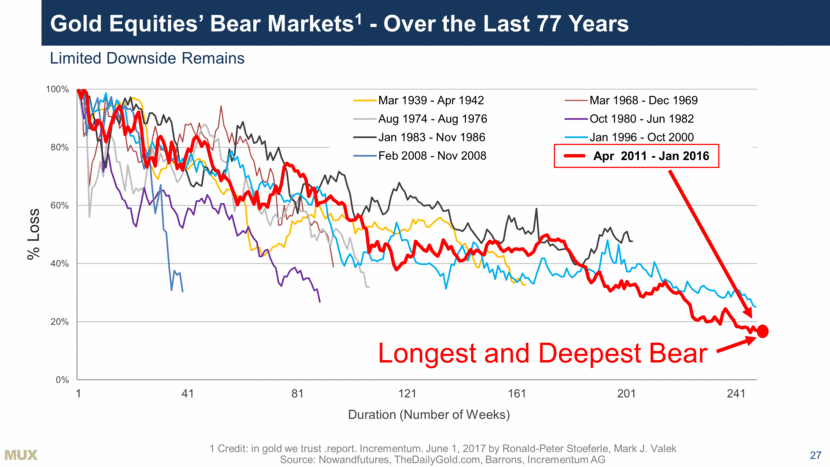
Gold Equities’ Bear Markets1 - Over the Last 77 Years 27 1 Credit: in gold we trust .report. Incrementum. June 1, 2017 by Ronald-Peter Stoeferle, Mark J. Valek Source: Nowandfutures, TheDailyGold.com, Barrons, Incrementum AG Duration (Number of Weeks) Apr 2011 - Jan 2016 Longest and Deepest Bear % Loss Limited Downside Remains 0% 20% 40% 60% 80% 100% 1 41 81 121 161 201 241 Mar 1939 - Apr 1942 Mar 1968 - Dec 1969 Aug 1974 - Aug 1976 Oct 1980 - Jun 1982 Jan 1983 - Nov 1986 Jan 1996 - Oct 2000 Feb 2008 - Nov 2008 Apr 08, 2011 - Jan 22, 2016
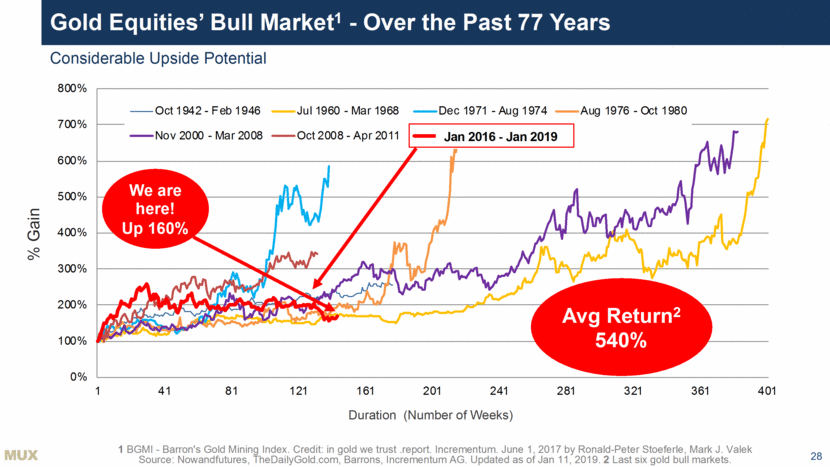
Gold Equities’ Bull Market1 - Over the Past 77 Years 28 1 BGMI - Barron's Gold Mining Index. Credit: in gold we trust .report. Incrementum. June 1, 2017 by Ronald-Peter Stoeferle, Mark J. Valek Source: Nowandfutures, TheDailyGold.com, Barrons, Incrementum AG. Updated as of Jan 11, 2019. 2 Last six gold bull markets. Duration (Number of Weeks) We are here! Up 160% Avg Return2 540% Jan 2016 - Jan 2019 % Gain Considerable Upside Potential 0% 100% 200% 300% 400% 500% 600% 700% 800% 1 41 81 121 161 201 241 281 321 361 401 Oct 1942 - Feb 1946 Jul 1960 - Mar 1968 Dec 1971 - Aug 1974 Aug 1976 - Oct 1980 Nov 2000 - Mar 2008 Oct 2008 - Apr 2011 Jan 2016 - Oct 2018 M U X 0 % 1 0 0 % 2 0 0 % 3 0 0 % 4 0 0 % 5 0 0 % 6 0 0 % 7 0 0 % 8 0 0 % 1 4 1 8 1 1 2 1 1 6 1 2 0 1 2 4 1 2 8 1 3 2 1 3 6 1 4 0 1 O c t 1 9 4 2 - F e b 1 9 4 6 J u l 1 9 6 0 - M a r 1 9 6 8 D e c 1 9 7 1 - A u g 1 9 7 4 A u g 1 9 7 6 - O c t 1 9 8 0 N o v 2 0 0 0 - M a r 2 0 0 8 O c t 2 0 0 8 - A p r 2 0 1 1 J a n 2 0 1 6 - O c t 2 0 1 8 G o l d E q u i t i e s ’ B u l l M a r k e t 1 - O v e r t h e P a s t 7 7 Y e a r s 2 8 1 B G M I - B a r r o n ' s G o l d M i n i n g I n d e x . C r e d i t : i n g o l d w e t r u s t . r e p o r t . I n c r e m e n t u m . J u n e 1 , 2 0 1 7 b y R o n a l d - P e t e r S t o e f e r l e , M a r k J . V a l e k S o u r c e : N o w a n d f u t u r e s , T h e D a i l y G o l d . c o m , B a r r o n s , I n c r e m e n t u m A G . U p d a t e d a s o f J a n 1 1 , 2 0 1 9 . 2 L a s t s i x g o l d b u l l m a r k e t s . D u r a t i o n ( N u m b e r o f W e e k s ) W e a r e h e r e ! U p 1 6 0 % A v g R e t u r n 2 5 4 0 % J a n 2 0 1 6 - J a n 2 0 1 9 % G a i n C o n s i d e r a b l e U p s i d e P o t e n t i a l
