Attached files
| file | filename |
|---|---|
| EX-32 - EX-32 - McEwen Mining Inc. | mux-20151231xex32.htm |
| EX-10.3 - EX-10.3 - McEwen Mining Inc. | mux-20151231ex103dc850a.htm |
| EX-31.2 - EX-31.2 - McEwen Mining Inc. | mux-20151231ex3128a8246.htm |
| EX-31.1 - EX-31.1 - McEwen Mining Inc. | mux-20151231ex311648c10.htm |
| EX-23.1 - EX-23.1 - McEwen Mining Inc. | mux-20151231ex231a829bf.htm |
| EX-21 - EX-21 - McEwen Mining Inc. | mux-20151231ex21355f56a.htm |
UNITED STATES
SECURITIES AND EXCHANGE COMMISSION
Washington, D.C. 20549
FORM 10‑K
|
|
|
|
☒ |
ANNUAL REPORT PURSUANT TO SECTION 13 OR 15(d) OF THE SECURITIES EXCHANGE ACT OF 1934 |
|
For the fiscal year ended December 31, 2015 |
|
|
☐ |
TRANSITION REPORT UNDER SECTION 13 OR 15(d) OF THE SECURITIES EXCHANGE ACT OF 1934 |
|
For the transition period from to |
|
Commission file number 001‑33190
MCEWEN MINING INC.
(Name of registrant as specified in its charter)
|
|
|
|
Colorado |
84‑0796160 |
|
150 King Street West, Suite 2800, Toronto, Ontario Canada |
M5H 1J9 |
(866) 441‑0690
(Registrant’s telephone number, including area code)
Securities registered pursuant to Section 12(b) of the Act:
|
|
|
|
Common Stock, no par value |
NYSE |
|
Title of each class |
Name of each exchange on which registered |
Securities registered pursuant to Section 12(g) of the Act: None
Indicate by check mark if the registrant is a well-known seasoned issuer, as defined in Rule 405 of the Securities Act. Yes ☐ No ☒
Indicate by check mark if the registrant is not required to file reports pursuant to Section 13 or Section 15(d) of the Act. Yes ☐ No ☒
Indicate by check mark whether the registrant (1) has filed all reports required to be filed by Section 13 or 15(d) of the Securities Exchange Act of 1934 during the preceding 12 months (or for such shorter period that the registrant was required to file such reports), and (2) has been subject to such filing requirements for the past 90 days. Yes ☒ No ☐
Indicate by check mark whether the registrant has submitted electronically and posted on its corporate web site, if any, every Interactive Data File required to be submitted and posted pursuant to Rule 405 of Regulation S-T (§ 232.405 of this chapter) during the preceding 12 months (or for such shorter period that the registrant was required to submit and post such files). Yes ☒ No ☐
Indicate by check mark if disclosure of delinquent filers pursuant to Item 405 of Regulation S-K (§ 229.405 of this chapter) is not contained herein, and will not be contained, to the best of registrant’s knowledge, in definitive proxy or information statements incorporated by reference in Part III of this Form 10-K or any amendment to this Form 10-K. ☐
Indicate by check mark whether the registrant is a large accelerated filer, an accelerated filer, a non‑accelerated filer, or a smaller reporting company. See the definitions of “large accelerated filer,” “accelerated filer” and “smaller reporting company” in Rule 12b‑2 of the Exchange Act.
|
|
|
|
|
|
Large accelerated filer ☐ |
Accelerated filer ☒ |
Non‑accelerated filer ☐ |
Smaller reporting company ☐ |
|
|
|
(Do not check if a |
|
Indicate by check mark whether the registrant is a shell company (as defined in Rule 12b‑2 of the Exchange Act). Yes ☐ No ☒
As of June 30, 2015 (the last business day of the registrant’s second fiscal quarter), the aggregate market value of the registrant’s voting and non-voting common equity held by non-affiliates of the registrant was $215,796,907 based on the closing price of $0.96 per share as reported on the NYSE. There were 276,855,799 shares of common stock outstanding (and 21,219,942 exchangeable shares exchangeable into McEwen Mining Inc. common stock on a one-for-one basis) on March 8, 2016
DOCUMENTS INCORPORATED BY REFERENCE: Portions of the Proxy Statement for the 2016 Annual Meeting of Shareholders are incorporated into Part III, Items 10 through 14 of this report.
ADDITIONAL INFORMATION
Descriptions of agreements or other documents in this report are intended as summaries and are not necessarily complete. Please refer to the agreements or other documents filed or incorporated herein by reference as exhibits. Please see the Exhibit Index at the end of this report for a complete list of those exhibits.
1
SPECIAL NOTE REGARDING FORWARD‑LOOKING STATEMENTS
Please see the note under “ITEM 7. MANAGEMENT’S DISCUSSION AND ANALYSIS OF FINANCIAL CONDITION AND RESULTS OF OPERATIONS,” for a description of special factors potentially affecting forward‑looking statements included in this report.
CAUTIONARY NOTE TO UNITED STATES INVESTORS—INFORMATION CONCERNING
PREPARATION OF RESOURCE AND RESERVE ESTIMATES
McEwen Mining Inc. (“McEwen Mining,” “we”, “our”, “us” or the “Company”) is required to prepare reports under the Securities Exchange Act of 1934 and the Canadian Securities Administrators’ National Instrument 43‑101 “Standards of Disclosure for Mineral Projects” (“NI 43‑101”), under the Canadian securities laws because we are listed on the Toronto Stock Exchange (“TSX”) and subject to Canadian securities laws. Standards under NI 43-101 are materially different than the standards generally permitted in reports filed with the United States (“U.S.”) Securities and Exchange Commission (“SEC”).
Definitions of terms under NI 43‑101 differ materially from the definitions of those and related terms in Industry Guide 7 (“Industry Guide 7”) promulgated by the SEC. Under U.S. standards, mineralization may not be classified as a “reserve” unless a determination has been made that the mineralization could be economically and legally produced or extracted at the time the reserve determination is made. Under Industry Guide 7 standards, a “Final” or “Bankable” feasibility study or other report is required to report reserves, the three-year historical average precious metals prices are used in any reserve or cash flow analysis to designate reserves and the primary environmental analysis or report must be filed with the appropriate government authority.
One consequence of these differences is that “reserves” calculated in accordance with Canadian standards may not be “reserves” under Industry Guide 7 standards. U.S. investors should be aware that McEwen Mining’s properties located in Argentina (with the exception of the San José mine), Mexico and the United States do not have “reserves” as defined by Industry Guide 7 and are cautioned not to assume that any part or all of the disclosed mineralized material will be confirmed or converted into Industry Guide 7 compliant “reserves”.
Further, since we have no reserves on some of our properties as defined in Industry Guide 7, we have in the past and will continue to expense substantially all design, construction and development costs with regard to those properties, even though these expenditures are expected to have a future economic benefit in excess of one year. Only certain types of property and equipment which have alternative uses or significant salvage value may be capitalized without proven and probable reserves. We also expense our asset retirement obligations on those properties. Companies that have reserves under Industry Guide 7 typically capitalize these costs, and subsequently depreciate or amortize them on a units‑of‑production basis as reserves are mined. Unlike these other companies, we depreciate or amortize any capitalized costs on a straight‑line basis based on the estimated useful life of the mine, as determined by our internal mine plans. As a result of these and other differences, our financial statements may not be comparable to the financial statements of mining companies that have established reserves.
Under NI 43‑101, we report measured, indicated and inferred resources, which are measurements that are generally not permitted in filings made with the SEC. The estimation of measured resources and indicated resources involve greater uncertainty as to their existence and economic feasibility than the estimation of proven and probable reserves under Industry Guide 7. U.S. investors are cautioned not to assume that any part of measured or indicated resources will ever be converted into economically mineable reserves. The estimation of inferred resources involves far greater uncertainty as to their existence and economic viability than the estimation of other categories of resources. It cannot be assumed that all or any part of inferred resources will ever be upgraded to a higher category. Therefore, U.S. investors are also cautioned not to assume that all or any part of inferred resources exist, or that they can be mined legally or economically.
Canadian regulations permit the disclosure of resources in terms of “contained ounces” provided that the tonnes and grade for each resource are also disclosed; however, the SEC only permits issuers to report “mineralized material” in tonnage and average grade without reference to contained ounces. Under U.S. regulations, the tonnage and average grade described herein and other information disseminated to you would be characterized as mineralized material. We provide such disclosure about our properties to allow a means of comparing our projects to those of other companies in the mining industry, many of which are Canadian and report pursuant to NI 43‑101, and to comply with applicable disclosure requirements.
We also note that drill results are not indicative of mineralized material in other areas where we have mining interests. Furthermore, mineralized material identified on our properties does not and may never have demonstrated economic or legal viability.
RELIABILITY OF INFORMATION
Minera Santa Cruz S.A.(“MSC”), the owner of the San José mine, is responsible for and has supplied to us all reported results from the San José mine. The technical information contained herein with regard to the San José mine is, with few exceptions as noted, based entirely on information provided to us by MSC. Our joint venture partner, a subsidiary of Hochschild Mining plc, and its affiliates other than MSC do not accept responsibility for the use of project data or the adequacy or accuracy of this information.
2
History and Organization
We are a mining and minerals production and exploration company focused on precious and base metals in Argentina, Mexico and the United States. We were organized under the laws of the State of Colorado on July 24, 1979 under the name Silver State Mining Corporation. On June 21, 1988, we changed our name to U.S. Gold Corporation and on March 16, 2007, we changed our name to US Gold Corporation. On January 24, 2012, we changed our name to McEwen Mining Inc. after the completion of the acquisition of Minera Andes Inc. (“Minera Andes”) by way of a statutory plan of arrangement under the laws of the Province of Alberta, Canada.
We own 100% of the El Gallo 1 gold mine in Sinaloa, Mexico and a 49% interest in Minera Santa Cruz S.A. (“MSC”), owner and operator of the producing San José mine in Santa Cruz, Argentina, which is controlled by the majority owner of the joint venture, Hochschild Mining plc (“Hochschild”). In addition to our operating properties, we also hold interests in exploration stage properties and projects in Argentina, Mexico and the United States, including the Gold Bar (“Gold Bar”) and Los Azules (“Los Azules”) projects.
Our objective is to increase the value of our shares through the exploration, advancement, and extraction of gold, silver and other valuable minerals. Other than the San José mine in Argentina, we generally conduct our exploration activities as sole operator, but we may enter into arrangements with other companies through joint venture or similar agreements in an effort to achieve our strategic objectives. We hold our mineral interests and property and operate our business through various subsidiary companies, each of which is owned entirely, directly, or indirectly, by us.
Our principal executive office is located at 150 King Street West, Suite 2800, Toronto, Ontario, Canada M5H 1J9 and our telephone number is (866) 441-0690. We also maintain offices in San Juan, Argentina; Guamuchil, Mexico; Elko and Reno, Nevada (U.S.). Our website is www.mcewenmining.com. We make available our periodic reports and news releases and certain of our corporate governance documents, including our Code of Ethics, on our website. Our common stock is listed on the New York Stock Exchange (“NYSE”) and on the Toronto Stock Exchange (“TSX”), in each case under the symbol “MUX”. Exchangeable shares of our subsidiary McEwen Mining—Minera Andes Acquisition Corp. organized in connection with the acquisition of Minera Andes, are listed on the TSX under the symbol “MAQ”.
In this report, “McEwen Mining”, the “Company”, “our” and “we” refer to McEwen Mining Inc. together with our subsidiaries, unless otherwise noted. “Au” represents gold; “Ag” represents silver; “oz” represents troy ounce; “gpt” represents grams per metric tonne; “ft.” represents feet; “m” represents meter; “km” represents kilometer; and “sq.” represents square, and C$ refers to Canadian dollars. All of our financial information is reported in United States (U.S.) dollars, unless otherwise noted.
Segment Information
Our operating segments include Mexico, Argentina and the United States. Sales and long-lived assets originated from our wholly-owned subsidiaries are geographically distributed as follows:
|
|
|
Sales |
|
Long‑Lived Assets |
|
||||||||
|
|
|
2015 |
|
2014 |
|
2013 |
|
2015 |
|
2014 |
|
2013 |
|
|
Mexico |
|
100 |
% |
100 |
% |
100 |
% |
6 |
% |
2 |
% |
1 |
% |
|
Argentina |
|
— |
% |
— |
% |
— |
% |
85 |
% |
82 |
% |
78 |
% |
|
United States |
|
— |
% |
— |
% |
— |
% |
9 |
% |
16 |
% |
21 |
% |
Products
The end product at our gold and silver operations is either in the form of doré or concentrate. Production from the El Gallo 1 mine primarily consists of doré. Doré is an alloy consisting primarily of gold and silver but also containing other metals.
3
Doré is sent to refiners to produce bullion that meets the required market standard of 99.95% gold and 99.9% silver. Under the terms of our refining agreements, the doré bars are refined for a fee, and our share of the refined gold and silver is credited to our account with the refinery. Ore concentrate, or simply concentrate, is raw ore that has been ground finely to a powdery product from which gangue (waste) is removed, thus concentrating the metal component. Production from the San José mine generally consists of approximately 45% doré production and 55% of concentrate production. Concentrates from the San José mine are shipped to third‑party smelters and refineries for further processing to produce useful metals.
During 2015, we reported consolidated production attributable to us of 110,320 gold ounces and 3,315,668 silver ounces, for a total of 154,529 gold equivalent ounces (using a silver to gold ratio of 75:1). Of our consolidated gold and silver production, approximately 57% and 1%, respectively, came from our El Gallo 1 mine in Mexico and 43% and 99%, respectively, came from the San José mine in Argentina
Gold and silver doré produced in Mexico is generally sold at the prevailing spot market price.
Gold and silver doré produced from the San José mine is sold at the prevailing spot market price based on the London A.M. fix, while concentrates are sold at the prevailing spot market price based on either the London P.M. fix or average of the London A.M. and London P.M fix depending on the sales contract. Concentrates are provisionally priced, whereby the selling price is subject to final adjustments at the end of a period ranging from 30 to 90 days after delivery to the customer. The final price is based on the market price at the relevant quotation point stipulated in the contract. Due to the time elapsed between shipment and the final settlement with the buyer, MSC must estimate the prices at which sales of metals will be settled. At the end of each financial reporting period, previously recorded provisional sales are adjusted to estimated settlement metals prices based on relevant forward market prices until final settlement with the buyer.
During 2015, total gold and silver sales for the El Gallo 1 mine were $73.0 million and for the San José mine were $186.1 million. However, since we account for the San Jose mine using the equity method of accounting, our share of earnings or losses under the equity method for the year ended December 31, 2015 was a gain of $2.4 million from the San José mine. See Item 7. Management’s Discussion and Analysis of Financial Condition and Results of Operations for additional information regarding production and operating results for our properties, and Item 8. Financial Statements and Supplementary Data, Note 2, Summary of Significant Accounting Policies—Investments, for additional information regarding the equity method of accounting.
Like all metal producers, our operations are affected by fluctuations in metal prices. The following table presents the annual high, low and average daily London P.M. fix prices per ounce for gold and silver over the past three years and 2016 to the most recent practical date on the London Bullion Market:
|
|
|
Gold |
|
Silver |
|
||||||||||||||
|
Year |
|
High |
|
Low |
|
Average |
|
High |
|
Low |
|
Average |
|
||||||
|
|
|
(in dollar per ounce) |
|
||||||||||||||||
|
2013 |
|
$ |
1,694 |
|
$ |
1,192 |
|
$ |
1,411 |
|
$ |
32.23 |
|
$ |
18.61 |
|
$ |
23.79 |
|
|
2014 |
|
|
1,385 |
|
|
1,142 |
|
|
1,266 |
|
|
22.05 |
|
|
15.28 |
|
|
19.08 |
|
|
2015 |
|
|
1,296 |
|
|
1,049 |
|
|
1,160 |
|
|
18.23 |
|
|
13.71 |
|
|
15.68 |
|
|
2016 (through March 8, 2016) |
|
|
1,278 |
|
|
1,077 |
|
|
1,163 |
|
|
15.66 |
|
|
13.58 |
|
|
14.64 |
|
On March 8, 2016, the London P.M. fix for gold was $1,267 per ounce and silver was $15.66 per ounce.
Gold and Silver Processing Methods
Gold and silver are extracted from mineralized material, by either milling or heap leaching, depending on, among other things, the amount of gold and silver contained in the material, whether the material is naturally oxidized or not oxidized, the accessibility of the mineralized material, the amenability of the material to treatment and related capital and operating costs. The mineralized material is extracted by underground (San José mine) and open pit (El Gallo 1 mine) mining methods.
4
At the El Gallo 1 mine, mineralized material is processed using heap leaching. Heap leaching consists of stacking crushed material on impermeable pads, where a weak cyanide solution is applied to the surface of the heap to leach the gold and silver. The gold and silver‑bearing solution is then collected and pumped to an Adsorption‑Desorption‑Recovery (“ADR”) processing plant consisting of carbon columns, stripping circuits and a precious metal refinery to process gold and silver into doré bars. Doré bars are then shipped from the mine to a third party refiner to obtain bullion.
The processing plant at the San José mine is composed of conventional crushing, grinding and flotation circuits. Approximately half of the silver‑gold flotation concentrate is processed in an intensive cyanide leaching circuit with the dissolved gold and silver recovered by electrowinning of a clarified solution followed by smelting to produce doré. The doré is then sent to refiners to produce a purer product. The balance of the flotation concentrate is filtered and shipped to a smelter. Flotation and leached tailings are stored in side‑by‑side engineered, zero discharge facilities. Starting in 2015, we began storing flotation tailings in a newly constructed pond, after the original pond reached the end of its useful life at the end of the year 2014. A Merrill Crowe circuit recovers small amounts of gold and silver from the electro-winning discharge solution.
Gold and Silver Reserves
There are no proven and probable reserves within the meaning of SEC Industry Guide 7, at El Gallo 1 mine or any of our other properties, except for the San José mine. The portion of proven and probable gold and silver reserves attributable to McEwen Mining from our 49% equity interest in the San José mine, as of December 31, 2015, are presented in the following table. The reserves as presented are in‑place and include mining dilution and mining losses, but do not include allowances for mill or smelter recoveries.
|
|
|
Tonnes |
|
Silver |
|
Silver ounces |
|
Gold |
|
Gold ounces |
|
|
Reserve Category |
|
(in thousands) |
|
(grams/tonne) |
|
(in millions) |
|
(grams/tonne) |
|
(in thousands) |
|
|
Proven |
|
603 |
|
521 |
|
10.1 |
|
7.43 |
|
144.0 |
|
|
Probable |
|
321 |
|
414 |
|
4.3 |
|
6.51 |
|
67.3 |
|
|
Proven & Probable |
|
924 |
|
484 |
|
14.4 |
|
7.11 |
|
211.3 |
|
For additional information about our reserves on this property, including tonnage and grade, see Item 2. Properties—San José Mine, Argentina, on page 30.
Competitive Business Conditions
We compete with many companies in the mining and mineral exploration and production industry, including large, established mining companies with substantial capabilities, personnel, and financial resources. There is a limited supply of desirable mineral lands available for claim‑staking, lease, or acquisition in Mexico, Argentina or the United States, and other areas where we may conduct our mining or exploration activities. We may be at a competitive disadvantage in acquiring mineral properties, since we compete with these individuals and companies, many of which have greater financial resources and larger technical staffs than we do. From time to time, specific properties or areas which would otherwise be attractive to us for exploration or acquisition may be unavailable due to their previous acquisition by other companies or our lack of financial resources.
Competition in the industry is not limited to the acquisition of mineral properties, but also extends to the technical expertise to find, advance, and operate such properties; the labor to operate the properties; and the capital for the purpose of funding such exploration and development. Many competitors not only explore for and mine precious and base metals, but conduct refining and marketing operations on a world‑wide basis. Such competition may result in not only our company being unable to acquire desired properties, but to recruit or retain qualified employees or to acquire the capital necessary to fund our operation and advance our properties. Our inability to compete with other companies for these resources would have a material adverse effect on our results of operation, financial condition and cash flows.
General Government Regulations
5
We believe that all of our properties are operated in compliance with all applicable governmental laws and regulations. A summary of applicable laws and regulations is set forth below.
Mexico
Mining in Mexico is subject to numerous federal, state and local laws, regulations and ordinances governing mineral rights, operations and environmental protection.
Mineral Concession Rights. Exploration and exploitation of minerals in Mexico may be carried out through Mexican companies incorporated under Mexican law by means of obtaining mining concessions. Mining concessions are granted by the Mexican government for a period of fifty years from the date of their recording in the Public Registry of Mining and are renewable for a further period of fifty years upon application within five years prior to the expiration of such concession in accordance with the Mining Law and its regulations.
Mining concessions are subject to annual work requirements and payment of annual surface taxes which are assessed and levied on a semi‑annual basis. Such concessions may be transferred or assigned by their holders, but such transfers or assignments must be registered with the Public Registry of Mining in order to be valid against third parties.
The holder of a concession must pay semi‑annual duties in January and July of each year on a per hectare basis and in accordance with the amounts provided by the Federal Fees Law.
During the month of May of each year, the concessionaire must file with the General Bureau of Mines, the work assessment reports made on each concession or group of concessions for the preceding calendar year. The regulations of the Mining Law provide tables containing the minimum investment amounts that must be made on a concession. This amount is updated annually in accordance with the changes in the Consumer Price Index.
Surface Rights. In Mexico, while mineral rights are administered by the federal government through federally issued mining concession, in addition to private owners, ejidos (communal owners of land recognized by the Agrarian Law in Mexico) and recognized agrarian communities control surface access rights to the land. An ejido may sell or lease lands directly to a private entity (provided that all formalities and procedures in the Agrarian Law are completed). While the Company has agreements or is in the process of negotiating agreements with the ejidos and recognized agrarian communities that impact all of its projects in Mexico, some of these agreements may be subject to renegotiations in order to comply with such provisions.
Water Rights. Water rights are managed by the Comisión Nacional del Agua (“CONAGUA”). According to the Mexican water rights legislation, industrial users such as mining companies must pay for the right to use as well as consumption of national waters regardless of how their rights were obtained, with the rates being determined by the availability of water and the method of extraction. We are not required to obtain water rights. According to CONAGUA, the El Gallo Complex is located in the Sinaloa River Aquifer and is termed Zona de Libre Alumbramiento, meaning a free zone because of excess capacity. As of the filing of this report, water usage costs approximately $1.10 per cubic meter consumed.
Mining Royalties. In October 2013, the Mexican lower house passed a bill levying a tax‑deductible mining royalty of 7.5% on earnings before the deduction of interest, taxes, depreciation and amortization, along with an additional 0.5% surcharge on precious metals revenue for mining companies. The effective date of the law was January 1, 2014. Although there are a number of uncertainties surrounding the scope, calculation and enforcement of the royalty, based on the Company’s current interpretation of the bill, the royalty or surcharge has been estimated in $0.4 million for 2015 and $0.2 million for 2014; therefore, an accrual of $0.6 million has been recorded by the Company as of December 31, 2015.
Further, the Company filed an Amparo, a legal recourse seeking remedy for the protection of constitutional rights. In November 2014, the Company received an unfavourable decision from the District Court in respect of this Amparo. The Company appealed the decision by submitting a Revision Recourse (Recurso de Revisión) to the Supreme Court of the Nation (Suprema Corte de la Nación). On October 23, 2015 the Company was notified that the appeal had been accepted by the Supreme Court of the Nation. This legal proceeding is still ongoing as of the filing of this report.
6
Environmental Law. The Environmental Law in Mexico, called the “General Law of Ecological Balance and Protection to the Environment” (“General Law”), provides for general environmental policies, with specific requirements for certain activities such as exploration set forth in regulations called “Mexican official norms”. Responsibility for enforcement of the General Law, the regulations and the Mexican official norms is with the Ministry of Environment and Natural Resources, which regulate all environmental matters with the assistance of Procuraduría Federal de Protección al Ambiente (“PROFEPA”).
The primary laws and regulations used by the State of Sinaloa where our El Gallo property is located which govern environmental protection for mining and exploration are: the General Law, Forestry Law, Residues Law, as well as their specific regulations on air, water and residues, and the Mexican official norms (“NOM‑120”). In order to comply with the environmental regulations, a concessionaire must obtain a series of permits during the exploitation and exploration stage. The time required to obtain the required permits is dependent on a number of factors including the type of vegetation and trees impacted by proposed activities.
Mining Permits. The Secretariat of Environmental and Natural Resources, the Mexican Government environmental authority (“SEMARNAT”), is responsible for issuing environmental permits associated with mining. Three main permits required before construction can begin are: Environmental Impact Statement (known in Mexico as Manifesto Impacto Ambiental) (“MIA”), Land Use Change (known in Mexico as Estudio Justificativo Para Cambio Uso Sueldo) (“ETJ”), and Risk Analysis (known in Mexico as Analisis de Riesgo) (“RA”). A construction permit is required from the local municipality and an archaeological release letter is required from the National Institute of Anthropology and History (“INAH”). An explosives permit is required from the ministry of defense before construction can begin. The MIA is required to be prepared by a third‑party contractor and submitted to SEMARNAT and must include a detailed analysis of climate, air quality, water, soil, vegetation, wildlife, cultural resources and socio‑economic impacts. The RA study (which is included with the MIA and submitted as one complete document) identifies potential environmental releases of hazardous substances and evaluates the risks in order to establish methods to prevent, respond to, and control environmental emergencies. The ETJ requires that an evaluation be made of the existing conditions of the land, including a plant and wildlife study, an evaluation of the current and proposed use of the land, impacts to naturally occurring resources, and an evaluation of reclamation/re‑vegetation plans.
Argentina
Mining in Argentina is subject to numerous federal, provincial and local laws, regulations and ordinances governing mineral rights, operations and environmental protection.
Mineral Concession Rights. Under Argentine Law, mining concessions are real property, which can be transferred freely and can also be pledged. Concessions are granted by provincial governments for unlimited periods of time, subject to the following conditions:
|
(a) |
the payment twice a year of a mining fee or canón ranging between 320 to 3,200 Argentine pesos per mining claim, or pertenencia, depending on the type of mining claim; and |
|
(b) |
the filing of a minimum investment plan and compliance with a minimum investment in the concession equal to 300 times the relevant canón over a five year period. |
Failure to comply with these conditions may result in the termination of the concession.
Surface Rights. A mining concession alone is not sufficient to permit mining operations. An agreement for access and occupation of the surface land is also required from the surface owner and occupier before mining may commence. Surface rights in Argentina are not automatically granted with title to either a mining lease or a concession and must be negotiated with the landowner.
Water Rights. Water rights are granted for the land or industry they have been applied for. Water rights cannot be separately seized or expropriated from the land or mining concession for which the use of water has been granted as long as the use for the mining concession is required and the obligations by the title holder are complied with.
7
Mining Royalties. As legal owners of the mineral resources, provinces are entitled to request royalties from mine operators. Regulations vary from province to province. Under a Mining Tax Stability Agreement between the Province of Santa Cruz, where the San José mine is located, and MSC, the mining royalty was fixed at 1.85% of the mine‑site value per year when the final product is doré and 2.55% when the final products are concentrates or precipitates. Starting in November 2012, MSC increased its royalty payments to the Province to the legal maximum of 3% for all products. Royalties are paid monthly.
Reserve Tax Law. In June 2013, the Province of Santa Cruz passed amendments to the Provincial Tax Code and Provincial Tax Law, which imposed a new tax on mining reserves in the Province. The law came into effect on July 5, 2013. The tax amounted to 1% of the value of mine reserves reported in feasibility studies and financial statements inclusive of variations resulting from ongoing operations. Regulations require that the tax be calculated on “measured” reserves, and MSC has interpreted this to mean “proven” reserves. The Province has not disputed this interpretation but has not provided further clarification on the definition of “measured” reserves, and the outcome is not clear at the time. MSC has filed a legal claim disputing the legality of the new tax and has paid the initial installments under protest.
Further, the Reserve Tax Law was recently voided by the new elected Congress of Santa Cruz through law 3,462, which was published in the official gazette on December 30, 2015. This law was enforced by the newly elected executive branch through decree 0144/15, and although not specified, it is applied prospectively. Subsequent to December 31, 2015, MSC negotiated an agreement with the government of Santa Cruz by which the government resigns to claim any unpaid balance from the aforementioned tax, prior to 2015, whereas MSC resigns to claim the restitution of the amount of the 2013 tax already paid. However, despite an agreement being reached, this document needs the approval of the Supreme Court of Santa Cruz to be valid. As of the filing of this report, this approval had not been received.
Environmental Law. The Environmental Protection Section of the National Mining Code of Argentina, enacted in 1995, requires that each Provincial government monitor and enforce the laws pertaining to prescribed development and protection of the environment. The Argentine Constitution establishes that the Federal Government is required to set the minimum standards. In 2002, the National Congress established such minimum standards for the sustainable management and protection of the environment and biodiversity, which are applicable throughout Argentina. Provinces are entitled to strengthen those standards. Further, the Argentine Constitution, as amended in 1994, allows any individual who believes a third party may be damaging the environment to initiate an action against such party. Existing and proposed legislation at both the federal and state levels in Argentina governing the protection of glaciers and the management of natural resources, including mining activity, in the vicinity of glaciers, may impact the Company’s ability to develop its projects.
Mining Permits. Prior to conducting mining operations, companies must submit an Environmental Impact Report (“EIR”) to the provincial government. The EIR must describe the proposed operation and the methods that will be used to prevent undue environmental damage and must be updated biennially. Mine operators are liable for environmental damage and violators of environmental standards may be required to shut down mining operations. An EIR must be submitted every two years in accordance with Argentine Law.
United States
Mining in the United States is subject to numerous federal, state and local laws. Three types of laws are of particular importance to our U.S. mineral properties: those affecting land ownership and mining rights; those regulating mining operations; and those dealing with the environment.
Land Ownership and Mining Rights. Our Nevada properties are primarily located on lands owned by the United States (Federal Lands) and are governed by the General Mining Law of 1872 (“General Mining Law”) as amended. The General Mining Law allows the location of mining claims on certain Federal Lands upon the discovery of a valuable mineral deposit and proper compliance with claim location requirements. A valid mining claim provides the holder with the right to conduct mining operations for the removal of minerals, subject to compliance with the General Mining Law and state law governing the staking and registration of mining claims, as well as compliance with various federal, state and local operating and environmental laws, regulations and ordinances. As the owner or lessee of the unpatented mining claims, we have the right to conduct mining operations on the lands subject to the prior procurement of required operating permits and approvals, compliance with the terms and conditions of any applicable mining lease, and compliance with applicable federal, state, and local laws, regulations and ordinances.
8
Mining Operations. The exploration of mining properties and development and operation of mines are governed by federal, state and local laws. Our Nevada properties are primarily administered by the United States Department of the Interior, Bureau of Land Management, which we refer to as the U.S. Bureau of Land Management (“BLM”). In general, the federal laws that govern mining claim location and maintenance and mining operations on Federal Lands are administered by the BLM. Additional federal laws, such as those governing the purchase, transport or storage of explosives, and those governing mine safety and health, also apply.
The State of Nevada likewise requires various permits and approvals before mining operations can begin, although the state and federal regulatory agencies usually cooperate to minimize duplication of permitting efforts. Among other things, a detailed reclamation plan must be prepared and approved, with bonding in the amount of projected reclamation costs. The bond is used to ensure that proper reclamation takes place, and the bond will not be released until reclamation is completed. The Nevada Department of Environmental Protection (“NDEP”) is the state agency that administers the reclamation permits, mine permits and related closure plans on our Nevada properties. Local jurisdictions (such as county governments) may also impose permitting requirements (such as conditional use permits or zoning approvals).
Environmental Law. The development, operation, closure, and reclamation of mining projects in the United States requires numerous notifications, permits, authorizations, and public agency decisions. Compliance with environmental and related laws and regulations requires us to obtain permits from regulatory agencies, and to file various reports and keep records of our operations. Certain of these permits require periodic renewal or review of their conditions and may be subject to a public review process during which opposition to our proposed operations may be encountered. We are currently operating under various permits for activities connected to mineral exploration, reclamation, and environmental requirements.
Proposed mineral processing at our Gold Bar property will require additional permitting prior to production. Various federal agencies and departments within the State of Nevada and local governments will be cooperating to review applications for any mining development and process facilities at the site. Although not expected, potential external events such as public or cooperating agency opposition could lengthen the schedule for permit acquisition. Because of previously permitted mining activity at the site, we currently have no reason to believe that permits to mine the mineral resources at Gold Bar could not be obtained from local, state and Federal regulatory agencies without unreasonable effort and expense. Production water for the Gold Bar property can be appropriated pursuant to regulations implemented by the State of Nevada. Permits have been acquired to appropriate water necessary for commercial production at the future Gold Bar operation.
Customers
Production from our El Gallo 1 mine is either sold as refined metal on the spot market, or doré under the terms set out in a doré purchase agreement between us and the Bank of Nova Scotia (“Scotia”), a Canadian financial institution. Under the terms of that agreement, dated in July 2012, we have the option to sell approximately 90% of the gold and silver contained in doré bars produced at the El Gallo 1 mine prior to the completion of refining by the third party refiner, which normally takes approximately 15 business days. During the year ended December 31, 2015, approximately 42% our sales from El Gallo 1 in Mexico were made through this doré purchase agreement. We also have an agreement to sell refined metal with a second Canadian financial institution.
During the year ended December 31, 2015, 76% of total sales from the San José mine were made to Republic Metals Corporation and LS Nikko Copper Inc. Republic Metals, a Florida corporation, is a purchaser of doré and accounted for 47% of total sales. LS Nikko Copper Inc., a South Korean company, is a purchaser of concentrate, which accounted for 29% of total sales. MSC has sales agreement with each of these purchasers.
In the event that our relationship with Scotia or MSC’s relationship with either Republic Metals or LS Nikko Copper Inc. were interrupted for any reasons, we believe that we or MSC could locate other purchasers for the products, however any interruption would temporarily disrupt the sale of our products and adversely affect our operating results.
Employees
As of March 11, 2016, we had 282 employees including 250 employees based in Mexico, 5 in Argentina, 9 in the United States, and 18 in Canada. All of our employees based in Canada work in an executive, technical or administrative position,
9
while our employees in Mexico, Argentina and the United States include laborers, engineers, geologists, permitting specialists, information technologists, and office administrators. Some of our employees in Mexico are covered by union labor contracts and we believe we have good relations with our employees and their unions. We also frequently engage independent contractors in connection with certain administrative matters and the exploration of our properties, such as drillers, geophysicists, geologists, and other technical disciplines. As of March 11, 2016, MSC had 1,077 employees in Argentina.
This report, including Management’s Discussion and Analysis of Financial Condition and Results of Operations, contains forward‑looking statements that may be affected by several risk factors. The following information summarizes all material risks known to us as of the date of filing this report:
Risks Relating to Our Company
We have incurred substantial losses on an annual basis since our inception in 1979 and may never be profitable.
Since our inception in 1979, we have never been profitable, on an annual basis. As of December 31, 2015, our accumulated deficit, which includes non‑cash impairment charges, was $940.0 million, including net loss of $20.5 million for the year ended December 31, 2015. In the future, our ability to become profitable will depend on the profitability of the El Gallo 1 and San José mines, our ability to bring the Gold Bar and El Gallo 2 projects into production and generate revenue sufficient to cover our costs and expenses, and our ability to advance, sell or otherwise monetize our other properties, including the Los Azules copper project. In pursuit of that objective, we will seek to identify additional mineralization that can be extracted economically at operating and exploration properties. For our non‑operating properties that we believe demonstrate economic potential, we need to either develop our properties, locate and enter into agreements with third party operators, or sell the properties. We may suffer significant additional losses in the future and may never be profitable. Even if we do achieve profitability, we may not be able to sustain or increase profitability on a quarterly or annual basis.
Our business requires substantial capital investment and we may be unable to raise additional funding on favorable terms to develop additional mining operations.
We will need to obtain additional financing, either in the form of debt or equity financing, to fund development of additional mining operations such as the Gold Bar or El Gallo 2 projects and to continue our exploration activities. Our working capital balance, along with expected cash generated from mining operations at El Gallo 1 mine and any dividends received from MSC, is not expected to be sufficient to allow us to develop Gold Bar or to continue our operations indefinitely. Our ability to obtain necessary funding, in turn, depends upon a number of factors, including the state of the economy and applicable commodity prices. We may not be successful in obtaining the required financing for Gold Bar or other purposes, on terms that are favorable to us or at all, in which case, our ability to continue operating would be adversely affected. Failure to obtain such additional financing could result in delay or indefinite postponement of further exploration or potential development and the possible partial or total loss of our interest in certain properties.
The feasibility of mining at our Gold Bar and El Gallo properties has not been established in accordance with SEC Industry Guide 7, and any funds spent by us on exploration and the advancement of our mineral properties could be lost.
A “reserve,” as defined by Industry Guide 7 of the SEC, is that part of a mineral deposit which could be economically and legally extracted or produced at the time of the reserve determination. A reserve requires a SEC‑compliant feasibility study or other report demonstrating with reasonable certainty that the deposit can be economically extracted and produced. Since we have not received a SEC‑compliant report on any of our properties, we currently have no reserves as defined by SEC Industry Guide 7, except for our 49% interest in the San José mine, and there are no assurances that we will be able to prove that there are reserves on our properties.
Substantial expenditures are required to establish reserves through drilling and additional study and there is no assurance that reserves will be established. Whether a mineral deposit can be commercially viable depends upon a number of factors,
10
including the particular attributes of the deposit, including size, grade, metallurgical recoveries and proximity to infrastructure; metal prices, which can be highly variable; and government regulations, including environmental and reclamation obligations. If we are unable to establish some or all of our mineralized material as proven or probable reserves in sufficient quantities to justify commercial operations, our investment in that property may be lost, and the market value of our securities may suffer.
We are required to prepare and file with the Canadian securities regulators estimates of mineralized material in accordance with NI 43‑101. These standards are substantially different from the standards generally permitted to report reserve and other estimates in reports and other materials filed with the SEC. Under NI 43‑101, we report measured, indicated and inferred resources, measurements which are generally not permitted in filings made with the SEC. U.S. investors are cautioned not to assume that all or any part of measured or indicated resources reported in our Canadian filings will ever be converted into Industry Guide 7 compliant reserves.
There are significant risks and uncertainties associated with construction, commencing or expanding production or changing production plans without a current feasibility, pre‑feasibility or scoping study. As such, the El Gallo Complex and Gold Bar properties may ultimately be determined to lack one or more geological, engineering, legal, operating, economic, social, environmental, and other relevant factors reasonably required to serve as the basis for a final decision to successfully complete all or part of these projects.
Fluctuating precious metals and copper prices have and could continue to negatively impact our business.
The potential for profitability of our gold and silver mining operations and the value of our mining properties are directly related to the market price of gold, silver and copper. The price of gold, silver and copper may also have a significant influence on the market price of our common stock. The market price of gold and silver historically has fluctuated significantly, including a significant downward trend that has continued through 2015, and is affected by numerous factors beyond our control. These factors include supply and demand fundamentals, expectations with respect to the rate of inflation, the relative strength of the U.S. dollar and other currencies, interest rates, gold and silver sales and loans by central banks, forward sales by metal producers, accumulation and divestiture by exchange traded funds, global or regional political, economic or banking crises, and a number of other factors. The market price of silver is also affected by industrial demand. The selection of a property for exploration or development, the determination to construct a mine and place it into production, and the dedication of funds necessary to achieve such purposes are decisions that must be made long before the first revenues, if any, from production will be received. Price fluctuations between the time that such decisions are made and the commencement of production can have a material adverse effect on the economics of a mine.
The volatility of mineral prices represents a substantial risk which no amount of planning or technical expertise can fully eliminate. In the event mineral prices decline and remain low for prolonged periods of time, we might be unable to develop our properties, which may adversely affect our results of operations, financial performance and cash flows. Our results of operations have been and could continue to be materially and adversely affected by the impairment of assets. An asset impairment charge may result from the occurrence of unexpected adverse events that impact our estimates of expected cash flows generated from our producing properties or the market value of our non-producing properties. The deteriorating economic outlook for companies in the mineral exploration and extraction sector and declines in commodity prices are likely to reduce the recoverable amount of our investment in MSC, El Gallo 1 mine, and other, non-producing mineral property interests including the Los Azules project, and therefore may increase our impairment charges in the future.
11
The volatility in gold, silver and copper prices is illustrated by the following table, which sets forth, for the periods indicated, the average market prices in U.S. dollars per ounce of gold and silver, based on the average daily London P.M. fix, and per pound of copper based on the London Metal Exchange Grade A copper settlement price.
|
Metal |
|
2011 |
|
2012 |
|
2013 |
|
2014 |
|
2015 |
|
|||||
|
Gold |
|
$ |
1,572 |
|
$ |
1,669 |
|
$ |
1,411 |
|
$ |
1,288 |
|
$ |
1,160 |
|
|
Silver |
|
|
35.12 |
|
|
51.15 |
|
|
23.79 |
|
|
19.95 |
|
|
15.68 |
|
|
Copper |
|
|
4.00 |
|
|
3.61 |
|
|
3.32 |
|
|
3.14 |
|
|
2.45 |
|
As at March 8, 2016, gold, silver and copper prices were $1,267 per ounce, $15.66 per ounce, and $2.22 per pound, respectively.
The figures for our estimated mineralized material are based on interpretation and assumptions and may yield less mineral production under actual conditions than is currently estimated.
Unless otherwise indicated, mineralization figures presented in our filings with securities regulatory authorities including the SEC, news releases and other public statements that may be made from time to time are based upon estimates made by independent geologists and our internal geologists. When making determinations about whether to advance any of our projects to development, we must rely upon such estimated calculations as to the mineralized material and grades of mineralization on our properties. Until ore is actually mined and processed, mineralized material and grades of mineralization must be considered as estimates only.
These estimates are imprecise and depend upon geological interpretation and statistical inferences drawn from drilling and sampling analysis, which may prove to be unreliable. We cannot ensure that:
|
· |
these estimates will be accurate; |
|
· |
mineralization estimates will be accurate; or |
|
· |
this mineralization can be mined or processed profitably. |
Any material changes in mineral estimates and grades of mineralization may affect the economic viability of placing a property into production and such property’s return on capital. There can be no assurance that minerals recovered in small scale tests will be recovered in large‑scale tests under on‑site conditions or in production scale. The estimates contained in our public filings have been determined and valued based on assumed future prices, cut‑off grades and operating costs that may prove to be inaccurate. Extended declines in market prices for gold and/or silver may render portions of our mineralization estimates uneconomic and result in reduced reported mineralization or adversely affect the commercial viability of one or more of our properties. Any material reductions in estimates of mineralization, or of our ability to extract this mineralization, could have a material adverse effect on our results of operations or financial condition.
We own our 49% interest in the San José mine, under the terms of an option and joint venture agreement (“OJVA”), and therefore we are unable to control all aspects of the exploration and development of and production from this property.
Our interest in the San José mine is subject to the risks normally associated with the conduct of joint ventures. A disagreement between joint venture partners on how to conduct business efficiently, the inability of joint venture partners to meet their obligations to the joint venture or third parties, or litigation arising between joint venture partners regarding joint venture matters could have a material adverse effect on the viability of our interests held through the joint venture.
Our operations in Argentina and Mexico are subject to changes in political conditions, regulations and crime.
Although all of our operations are subject to changes in political conditions, regulations and crime, the Company has substantial investments in Argentina and Mexico and is therefore subject to risks normally associated with the conduct of business in foreign countries. Further, both Argentina and Mexico have undergone significant government regulations with respect to, but not limited to, restrictions on production, price controls, export controls, currency remittance, importation
12
of parts and supplies, income and other taxes, expropriation of property, foreign investment, maintenance of claims, environmental legislation, land use, land claims of local people, water use and mine safety. Changes, if any, in mining or investment policies or shifts in political attitude in any of the jurisdictions in which the Company operates may adversely affect the Company’s operations or profitability. There also is the risk of political violence and increased social tension in both Mexico and Argentina as these countries have experienced periods of crime, and civil and labor unrest. Certain political and economic events such as acts, or failures to act, by government authorities in Argentina and Mexico, and acts of political violence could have a material adverse effect on our ability to operate in the country.
With respect to our San José mine, there are risks relating to an uncertain or unpredictable political and economic environment in Argentina. For instance, Argentina defaulted on foreign debt repayments and on the repayment on a number of official loans to multinational organizations in 2002 and 2003, and defaulted again on its bonds in 2014 after failing to reach an agreement with certain of its bondholders, which are currently under negotiation. In 2008, the Argentine government also reassessed its policy and practice in respect of export duties and began levying export duties on mining companies operating in the country. In 2012, Argentina’s President announced the nationalization of the majority stake of Yacimientos Petrolíferos Fiscales (YPF), Argentina’s largest oil company. In 2013, Argentina’s federal Income Tax Statute was amended to include a 10% income tax withholding on dividend distributions by Argentine corporations, and the capital gains exception for non‑resident taxpayers was repealed.
With respect to our El Gallo 1 mine in Mexico, in recent years, there has been a marked increase in the level of violence and crime relating to drug cartels in Sinaloa state, where we operate, and in other regions of Mexico. This may disrupt our ability to carry out exploration and mining activities and affect the safety and security of our employees and contractors. Our exploration and mining activities may be adversely affected in varying degrees by changing government regulations relating to the mining industry or shifts in political conditions, including as a result of periodic elections, that could increase the costs related to our activities or maintaining our properties.
Legislation has been enacted that significantly and adversely affects the mining industry.
In Argentina, the Province of Santa Cruz passed amendments to the Provincial Tax Code and Provincial Tax Law, which imposes a new tax on mining reserves in the Province (“Reserve Tax Law”). The law came into effect on July 5, 2013. The tax would amount to 1% of the value of mine reserves reported in feasibility studies and financial statements inclusive of variations resulting from ongoing operations. This tax is subject to on-going clarifications, litigation and legislation.
In Mexico, in October 2013, the Mexican lower house passed a bill proposing a tax‑deductible mining royalty of 7.5% on earnings before the deduction of interest, taxes, depreciation and amortization, along with an additional 0.5% on precious metals revenue for precious metals mining companies. In addition the long term corporate tax rate is expected to remain at 30% rather than being reduced to 28% as originally planned. The Mexican Senate approved the provisions of the Tax Reform on October 31, 2013. The effective date of the law was effective January 1, 2014.
Periodically, members of the U.S. Congress have introduced bills which would supplant or alter the provisions of the General Mining Law of 1872, which governs the unpatented claims that we control with respect to our U.S. properties. One such amendment has become law and has imposed a moratorium on the patenting of mining claims, which reduced the security of title provided by unpatented claims such as those on our U.S. properties. If additional legislation is enacted, it could substantially increase the cost of holding unpatented mining claims by requiring payment of royalties, and could significantly impair our ability to develop mineral estimates on unpatented mining claims. Such bills have proposed, among other things, to make permanent the patent moratorium, to impose a federal royalty on production from unpatented mining claims and to declare certain lands as unsuitable for mining. Although it is impossible to predict at this time what royalties may be imposed in the future, the imposition of such royalties could adversely affect the potential for development of such mining claims, and the economics of existing operating mines on federal unpatented mining claims. Passage of such legislation could adversely affect our business.
13
Our business is subject to U.S. Foreign Corrupt Practices Act and similar worldwide anti‑bribery laws, a breach or violation of which could lead to civil and criminal fines and penalties, loss of licenses or permits and reputational harm.
We operate in certain jurisdictions that have experienced governmental and private sector corruption to some degree, and, in certain circumstances, strict compliance with anti‑bribery laws may conflict with certain local customs and practices. For example, the U.S. Foreign Corrupt Practices Act and anti‑bribery laws in other jurisdictions, generally prohibit companies and their intermediaries from making improper payments for the purpose of obtaining or retaining business or other commercial advantage, and often carry substantial penalties. There can be no assurance that our internal control policies and procedures always will protect it from recklessness, fraudulent behavior, dishonesty or other inappropriate acts committed by the Company’s affiliates, employees or agents. As such, our corporate policies and processes may not prevent all potential breaches of law or other governance practices. Violations of these laws, or allegations of such violations, could lead to civil and criminal fines and penalties, litigation, and loss of operating licenses or permits, and may damage the Company’s reputation, which could have a material adverse effect on our business, financial position and results of operations or cause the market value of our common stock to decline.
We are subject to foreign currency risk.
While we transact most of our business in U.S. dollars, expenses, such as labor, operating supplies, and property and equipment, are denominated in Canadian dollars, Mexican pesos or Argentine pesos. As a result, currency exchange fluctuations may impact our operating costs. The appreciation of non‑U.S. dollar currencies against the U.S. dollar increases costs and the cost of purchasing property and equipment in U.S. dollar terms in Mexico, Argentina and Canada, which can adversely impact our operating results and cash flows. Conversely, a depreciation of non‑U.S. dollar currencies usually decreases operating costs and property and equipment purchases in U.S. dollar terms in foreign countries.
The value of cash and cash equivalents denominated in foreign currencies also fluctuates with changes in currency exchange rates. Appreciation of non‑U.S. dollar currencies results in a foreign currency gain on such investments and a depreciation in non‑U.S. dollar currencies results in a loss. We have not utilized market risk sensitive instruments to manage our exposure to foreign currency exchange rates but may in the future actively manage our exposure to foreign currency exchange rate risk. We also hold portions of our cash reserves in Canadian, Mexican and Argentine currency.
Increased operating and capital costs could affect our profitability.
Costs at any particular mining location are subject to variation due to a number of factors, such as variable ore grade, changing metallurgy and revisions to mine plans in response to the physical shape and location of the ore body, as well as the age and utilization rates for the mining and processing‑related facilities and equipment. In addition, costs are affected by the price and availability of input commodities, such as fuel, electricity, labor, chemical reagents, explosives, steel and concrete and mining and processing‑related equipment and facilities. Reported costs may also be affected by changes in accounting standards. A material increase in costs at any significant location could have a significant effect on our profitability and operating cash flow.
We could have significant increases in capital and operating costs over the next several years in connection with the development of new projects in challenging jurisdictions and in the sustaining and/or expansion of existing mining and processing operations. Costs associated with capital expenditures have escalated on an industry‑wide basis over the last several years, as a result of factors beyond our control, including the prices of oil, steel and other commodities and labor, as well as the demand for certain mining and processing equipment. Increased capital expenditures may have an adverse effect on the profitability of and cash flow generated from existing operations, as well as the economic returns anticipated from new projects.
Our estimated timetables to achieve production for the El Gallo 2 and Gold Bar properties may not be accurate.
Based on estimates by state and federal agencies and included in a feasibility study completed in 2015, we expect to begin operation of our Gold Bar project in 2018. However, there is no certainty that the economics estimated in the feasibility study will be realized or that we will be able to begin production within the timelines estimated, if at all.
14
In regard to El Gallo 2, the final decision to proceed with the construction of our El Gallo 2 project has not been made. The Company plans to complete its cost savings studies and review financing alternatives. Any decision to proceed would be based on silver prices and securing financing on terms that we believe are more favorable to us than those that were available to us at the time of filing this report.
Further, we may also be unable to obtain the necessary permits in a timely manner, on reasonable terms or on terms that provide us sufficient resources to develop our properties. These and other factors may cause us to delay production at El Gallo 2 and our Gold Bar properties beyond our current expectations, or cancel our plans entirely.
Development at Los Azules presents development challenges that may negatively affect, if not completely negate, the feasibility of development of the property.
The Los Azules property is located in a remote location that is accessed by 75 miles (120 kilometers) of unimproved dirt road with eight river crossings and two mountain passes both above 13,451 feet (4,100 meters). Even assuming that technical difficulties associated with this remote location can be overcome, the capital costs may make the project uneconomical. According to the NI 43‑101 Preliminary Economic Assessment (“PEA”) filed on November 7, 2013 with an effective date of August 1, 2013, capital costs were estimated to be $3.9 billion initially and $5.5 billion over the life of the mine with an accuracy target of plus or minus 35%. In order for Los Azules to be economically feasible for development, the price of copper would have to achieve and remain at a level high enough to justify the high capital costs estimated for the project. There can be no assurance that these capital cost estimates are accurate, given the inflationary pressure in the mining industry and in Argentina in particular. If the long term price of copper were to remain low or decrease significantly below the current price or capital cost estimates increase significantly, Los Azules may not be feasible for development, and we may have to write‑off the remaining carrying value of the asset. Furthermore, the project’s economic feasibility has not yet been demonstrated through a full feasibility study. The PEA is preliminary in nature, includes NI 43‑101 mineral resources that are considered too speculative geologically to have economic considerations applied to them that would allow them to be categorized as mineral reserves either under Industry Guide 7 or NI 43‑101, and there is no certainty that the PEA will be realized. Finally, we may not be able to raise sufficient capital to develop the property; we may not receive the required permits or environmental approvals; we may not be able to construct the necessary power and infrastructure assets; and, we may not be able to attract qualified workers to build such a project, any of which could result in the delay or indefinite postponement of development at the property. Such a result would have a material adverse effect on our Company.
We may acquire additional exploration stage properties and we may face negative reactions if reserves are not located on acquired properties.
We have in the past and may in the future acquire additional exploration stage properties. There can be no assurance that we have or will be able to complete the acquisition of such properties at reasonable prices or on favorable terms and that reserves will be identified on any properties that we acquire. We may also experience negative reactions from the financial markets if we are unable to successfully complete acquisitions of additional properties or if reserves are not located on acquired properties. These factors may adversely affect the trading price of our common stock or our financial condition or results of operations.
The nature of mineral exploration and production activities involves a high degree of risk and the possibility of uninsured losses that could materially and adversely affect our operations.
Exploration for and production of minerals is highly speculative and involves greater risk than many other businesses. Many exploration programs do not result in the discovery of mineralization, and any mineralization discovered may not be of sufficient quantity or quality to be profitably mined. Few properties that are explored are ultimately advanced to production. Our current exploration efforts are, and future development and mining operations we conduct will be, subject to all of the operating hazards and risks normally incident to exploring for and developing mineral properties, such as, but not limited to:
|
· |
economically insufficient mineralized material; |
|
· |
fluctuations in production costs that may make mining uneconomical; |
15
|
· |
availability of labor, contractors, engineers, power, transportation and infrastructure; |
|
· |
labor disputes; |
|
· |
potential delays related to social, public health, and community issues; |
|
· |
unanticipated variations in grade and other geologic problems; |
|
· |
environmental hazards; |
|
· |
water conditions; |
|
· |
difficult surface or underground conditions; |
|
· |
industrial accidents; |
|
· |
metallurgical and other processing problems; |
|
· |
mechanical and equipment performance problems; |
|
· |
failure of pit walls or dams; |
|
· |
unusual or unexpected rock formations; |
|
· |
personal injury, fire, flooding, cave‑ins and landslides; and |
|
· |
decrease in reserves or mineralized material due to a lower silver, gold or copper price. |
Any of these risks can materially and adversely affect, among other things, the development of properties, production quantities and rates, costs and expenditures, potential revenues and production dates. We currently have no insurance to guard against any of these risks, except in very limited circumstances. If we determine that capitalized costs associated with any of our mineral interests are not likely to be recovered, we would incur a write‑down of our investment in these interests. All of these factors may result in losses in relation to amounts spent which are not recoverable.
We do not insure against all risks to which we may be subject in our operations.
While we currently maintain insurance to insure against general commercial liability claims and physical assets at our properties in Argentina, Mexico, and the United States, we do not maintain insurance to cover all of the potential risks associated with our operations. Our other exploration projects have no existing infrastructure for which we insure. We may also be unable to obtain insurance to cover other risks at economically feasible premiums or at all. Insurance coverage may not continue to be available, or may not be adequate to cover liabilities. We might also become subject to liability for environmental, pollution or other hazards associated with mineral exploration and production which may not be insured against, which may exceed the limits of our insurance coverage or which we may elect not to insure against because of premium costs or other reasons. Losses from these events may cause us to incur significant costs that could materially adversely affect our financial condition and our ability to fund activities on our property. A significant loss could force us to reduce or terminate our operations.
Shortages of critical parts and equipment may adversely affect our operations and development projects.
The mining industry has been impacted, from time to time, by increased demand for critical resources such as input commodities, drilling equipment, trucks, shovels and tires. These shortages have, at times, impacted the efficiency of our operations, and resulted in cost increases and delays in construction of projects; thereby impacting operating costs, capital expenditures and production and construction schedules.
16
Our operations are subject to permitting requirements which could require us to delay, suspend or terminate our operations on our mining properties.
Our mining operations, including ongoing exploration drilling programs, require permits from the state and federal governments, including permits for the use of water and for drilling wells for water. We may be unable to obtain these permits in a timely manner, on reasonable terms or on terms that provide us sufficient resources to develop our properties, or at all. Even if we are able to obtain such permits, the time required by the permitting process can be significant. If we cannot obtain or maintain the necessary permits, or if there is a delay in receiving these permits, our timetable and business plan for exploration of our properties will be adversely affected, which may in turn adversely affect our results of operations, financial condition, cash flows and market price of our securities.
Title to mineral properties can be uncertain, and we are at risk of loss of ownership of one or more of our properties.
Our ability to explore and operate our properties depends on the validity of our title to that property. Our U.S. mineral properties include leases of unpatented mining claims, as well as unpatented mining and millsite claims, which we control directly. Unpatented mining claims provide only possessory title and their validity is often subject to contest by third parties or the federal government, which makes the validity of unpatented mining claims uncertain and generally more risky. Our concessions in Mexico are subject to continuing government regulation and failure to adhere to such regulations will result in termination of the concession. Similarly, under Argentine Law, failure to comply with applicable conditions may result in the termination of the concession. Uncertainties inherent in mineral properties relate to such things as the sufficiency of mineral discovery, proper posting and marking of boundaries, assessment work and possible conflicts with other claims not determinable from public record. We have not obtained title opinions covering our entire property, with the attendant risk that title to some claims, particularly title to undeveloped property, may be defective. There may be valid challenges to the title to our property which, if successful, could impair development and/or operations.
We cannot ensure that we will have an adequate supply of water to complete desired exploration or development of our mining properties.
Our mining operations require significant quantities of water for mining, ore processing and related support facilities. Our operations in Argentina, Mexico and the United States are in areas where water is scarce and competition among users for continuing access to water is significant. Continuous production at our mines is dependent on our ability to maintain our water rights and claims and to defeat claims adverse to our current water uses in legal proceedings. Although each of our operations currently has sufficient water rights and claims to cover its operational demands, we cannot predict the potential outcome of pending or future legal proceedings relating to our water rights, claims and uses. Water shortages may also result from weather or environmental and climate impacts out of the Company’s control.
Our continuing reclamation obligations at Tonkin, El Gallo and other properties could require significant additional expenditures.
We are responsible for the reclamation obligations related to disturbances located on all of our properties, including the Tonkin Complex. On February 10, 2014 we submitted to the BLM an amendment to the original mine closure plan for the Tonkin Complex, which was approved by the BLM on September 21, 2015, including our $3.6 million estimate of anticipated reclamation requirements, for which a financial guarantee has been put in place. In regards to the El Gallo Complex, we have not posted a bond in Mexico as none is required by the current legislation; however we have recorded a liability based on the estimated amount of our reclamation obligations. There is a risk that any surety bond or recorded liability, even if increased based on the analysis and work performed to update the reclamation obligations, could be inadequate to cover the actual costs of reclamation when carried out. The satisfaction of bonding requirements and continuing reclamation obligations will require a significant amount of capital. Further, it is possible that the BLM may request that the Company provides additional long term financing supported by a long-term trust for an amount that cannot be determined at this point. There is a risk that we will be unable to fund any additional bonding requirements, that the surety bonds may no longer be accepted by the governmental agencies as satisfactory reclamation coverage, in which case we would be required to replace the surety bonding with cash, and further, that the regulatory authorities may increase reclamation and bonding requirements to such a degree that it would not be commercially reasonable to continue exploration activities, which may adversely affect our results of operations, financial performance and cash flows.
17
Our ongoing operations and past mining activities are subject to environmental risks, which could expose us to significant liability and delay, suspension or termination of our operations.
All phases of our operations are subject to Argentine, Mexican and American federal, state and local environmental regulation. These regulations mandate, among other things, the maintenance of air and water quality standards and land reclamation. They also set forth limitations on the generation, transportation, storage and disposal of solid and hazardous waste, including cyanide. Environmental legislation is evolving in a manner which will require stricter standards and enforcement, increased fines and penalties for non‑compliance, more stringent environmental assessments of proposed projects, and a heightened degree of responsibility for us and our officers, directors and employees. Future changes in environmental regulation, if any, may adversely affect our operations, make our operations prohibitively expensive, or prohibit them altogether. Environmental hazards may exist on our properties that are unknown to us at the present and that have been caused by us, or previous owners or operators, or that may have occurred naturally. We utilize explosives in our business, which could cause injury to our personnel, and damage to our equipment or assets. Mining properties from the companies we have acquired may cause us to be liable for remediating any damage that those companies may have caused. The liability could include response costs for removing or remediating the release and damage to natural resources, including ground water, as well as the payment of fines and penalties. Failure to comply with applicable environmental laws, regulations and permitting requirements may also result in enforcement actions thereunder, including orders issued by regulatory or judicial authorities, causing operations to cease or be curtailed, and may include corrective measures requiring capital expenditures, installation of additional equipment, or remedial actions.
We have transferred our interest in several mining properties over past years, some of which are now being operated by third parties. Under applicable U.S. federal and state environmental laws, as prior owner of these properties, we may be liable for remediating any damage that we may have caused. The liability could include response costs for removing or remediating the release and damage to natural resources, including ground water, as well as the payment of fines and penalties.
Due to an increased level of non‑governmental organization activity targeting the mining industry, the potential for the government to delay the issuance of permits or impose new requirements or conditions upon mining operations may be increased. Any changes in government policies may be costly to comply with and may delay mining operations. Future changes in such laws and regulations, if any, may adversely affect our operations, make our operations prohibitively expensive, or prohibit them altogether. If our interests are materially adversely affected as a result of a violation of applicable laws, regulations, or permitting requirements or a change in applicable law or regulations, it would have a significant negative impact on the value of our company and could have a significant impact on our stock price.
Global climate change is an international concern, and could impact our ability to conduct future operations.
Global climate change is an international issue and receives a substantial amount of publicity. We would expect that the imposition of international treaties or Argentina, Mexican, and American federal, state, provincial or local laws or regulations pertaining to mandatory reductions in energy consumption or emissions of greenhouse gasses could affect the feasibility of our mining projects and increase our operating costs.
Our industry is highly competitive, attractive mineral lands are scarce, and we may not be able to obtain quality properties.
We compete with many companies in the mining industry, including large, established mining companies with substantial capabilities, personnel and financial resources. There is a limited supply of desirable mineral lands available for claim staking, lease or acquisition in Argentina, Mexico and the United States, and other areas where we may conduct exploration activities. We may be at a competitive disadvantage in acquiring mineral properties, since we compete with these individuals and companies, many of which have greater financial resources and larger technical staffs than we do. From time to time, specific properties or areas which would otherwise be attractive to us for exploration or acquisition may be unavailable to us due to their previous acquisition by other companies or our lack of financial resources. Competition in the industry is not limited to the acquisition of mineral properties but also extends to the technical expertise to find, advance, and operate such properties; the labor to operate the properties; and the capital for the purpose of funding such properties. Many competitors not only explore for and mine precious metals, but conduct refining and marketing operations
18
on a world‑wide basis. Such competition may result in our Company being unable not only to acquire desired properties, but to recruit or retain qualified employees or to acquire the capital necessary to fund our operation and advance our properties. Our inability to compete with other companies for these resources would have a material adverse effect on our results of operation, financial condition and cash flows.
Our lack of operating experience may cause us difficulty in managing our growth.
Our management team, as a whole, has limited experience in developing and operating a mine. We are currently working towards the development of El Gallo 2 in Mexico and Gold Bar project in Nevada. If we are unable to successfully finance and place these projects into production, our stock price may suffer and you may lose some or all of your investment. Our ability to manage the anticipated growth that we expect will accompany placing one or more of those properties into production will require us to improve and expand our management and our operational systems and controls. If our management is unable to manage growth effectively, our business and financial condition would be materially harmed. In addition, if rapid growth occurs, it may strain our operational, managerial and financial resources.
To the extent that we seek to expand our operations and increase our reserves through acquisitions, we may experience issues in executing acquisitions or integrating acquired operations.
From time to time, we examine opportunities to make selective acquisitions in order to provide increased returns to our shareholders and to expand our operations and reported reserves and, potentially, generate synergies. The success of any acquisition would depend on a number of factors, including, but not limited to:
|
· |
Identifying suitable candidates for acquisition and negotiating acceptable terms; |
|
· |
Obtaining approval from regulatory authorities and potentially the Company’s shareholders; |
|
· |
Maintaining our financial and strategic focus and avoiding distraction of management during the process of integrating the acquired business; |
|
· |
Implementing our standards, controls, procedures and policies at the acquired business and addressing any pre‑existing liabilities or claims involving the acquired business; and |
|
· |
To the extent the acquired operations are in a country in which we have not operated historically, understanding the regulations and challenges of operating in that new jurisdiction. |
There can be no assurance that we will be able to conclude any acquisitions successfully, or that any acquisition will achieve the anticipated synergies or other positive results. Any material problems that we encounter in connection with such an acquisition could have a material adverse effect on our business, results of operations and financial position.
We rely on contractors to conduct a significant portion of our operations and construction projects.
A significant portion of our operations and construction projects are currently conducted in whole or in part by contractors, including specifically our mining contractor at the El Gallo 1 mine. As a result, our operations are subject to a number of risks, some of which are outside our control, including:
|
· |
Negotiating agreements with contractors on acceptable terms; |
|
· |
The inability to replace a contractor and its operating equipment in the event that either party terminates the agreement; |
|
· |
Reduced control and oversight over those aspects of operations which are the responsibility of the contractor; |
19
|
· |
Failure of a contractor to perform under its agreement; |
|
· |
Interruption of operations or increased costs in the event that a contractor ceases its business due to insolvency or other unforeseen events; |
|
· |
Failure of a contractor to comply with applicable legal and regulatory requirements, to the extent it is responsible for such compliance; and |
|
· |
Problems of a contractor with managing its workforce, labor unrest or other related employment issues. |
In addition, we may incur liability to third parties as a result of the actions of our contractors. The occurrence of one or more of these risks could adversely affect our results of operations and financial position.
If our employees or contractors engage in a strike, work stoppage or other slowdown, we could experience business disruptions or increased costs.
As of December 31, 2015, a number of our employees were represented by different trade unions and work councils which subject us to employment arrangements very similar to collective bargaining agreements. Further, most of our employees are based in foreign locations. The laws of certain foreign countries may place restrictions on our ability to take certain employee-related actions or require that we conduct additional negotiations with trade unions, works councils or other governmental authorities before we can take such actions.
If the employees or contractors at the San José mine or the El Gallo 1 mine were to engage in a strike, work stoppage, or other slowdown in the future, we could experience a significant disruption of our operations. Such disruption could interfere with our business operations and could lead to decreased productivity, increased labor costs, and lost revenue. We may not be successful in negotiating new collective bargaining agreements or other employment arrangements when the current ones expire. Furthermore, future labor negotiations could result in significant increases in our labor costs. The occurrence of any of the foregoing could have a material adverse effect on our business, financial condition, and results of operations.
We depend on a limited number of personnel and the loss of any of these individuals could adversely affect our business.
Our company is dependent on key management, namely our Chairman and Chief Executive Officer; our President; our Senior Vice President and Chief Financial Officer; our Chief Operating Officer; our Managing Director; our Vice President, Projects; our Vice President, Finance and our General Counsel. Robert R. McEwen (Mr. McEwen), our Chairman and Chief Executive Officer, is responsible for the strategic direction and the oversight of our business. Colin Sutherland, our President, Nathan Stubina, our Managing Director; William Faust, our Chief Operating Officer; and Simon Quick, our Vice President, Projects oversee project development in Mexico, Nevada and Argentina. Carmen Diges, our General Counsel, Andrew Elinesky, our Senior Vice President and Chief Financial Officer, and Andrew Iaboni, our Vice President, Finance are responsible for our public reporting and administrative functions. We rely heavily on these individuals for the conduct of our business. The loss of any of these officers may significantly and adversely affect our business. In that event, we would be forced to identify and retain an individual to replace the departed officer. We may not be able to replace one or more of these individuals on terms acceptable to us. We have no life insurance on the life of any officer, where the Company is the beneficiary.
Some of our directors or officers may have conflicts of interest as a result of their involvement with other natural resource companies.
Some of our directors and officers are directors or officers of other natural resource or mining‑related companies, or may be involved in related pursuits that could present conflicts of interest with their roles at our Company. These associations may give rise to conflicts of interest from time to time. In the event that any such conflict of interest arises, a director who has such a conflict is required to disclose the conflict to the other directors and may be required to abstain from voting on the matter.
20
The laws of the State of Colorado, our Articles of Incorporation and agreements with certain officers and directors may protect our directors from certain types of lawsuits.
The laws of the State of Colorado provide that our directors will not be liable to us or our shareholders for monetary damages for all but certain types of conduct as directors of the Company. Our Articles of Incorporation permit us to indemnify our directors and officers against all damages incurred in connection with our business to the fullest extent provided or allowed by law, including through stand‑alone indemnity agreements. We have also entered into indemnification agreements with our executive officers and directors which require that we indemnify them against certain liabilities incurred by them in their capacity as such. The exculpation provisions may have the effect of preventing shareholders from recovering damages against our directors caused by their negligence, poor judgment or other circumstances. The indemnification provisions may require us to use our limited assets to defend our directors and officers against claims, including claims arising out of their negligence, poor judgment, or other circumstances.
We are subject to litigation risks.
All industries, including the mining industry, are subject to legal claims, with and without merit. Defense and settlement costs can be substantial, even with respect to claims that have no merit. Due to the inherent uncertainty of the litigation process, the resolution of any particular legal proceeding, including regulatory proceedings, could have a material adverse effect on our financial position and results of operations.
Risks Relating to Our Common Stock
A small number of existing shareholders own a significant portion of McEwen Mining common stock, which could limit your ability to influence the outcome of any shareholder vote.
As of March 8, 2016, Mr. McEwen beneficially owned approximately 25%, or 75.8 million shares, of the 298.1 million shares of McEwen Mining common stock (assuming all outstanding Exchangeable shares not held by McEwen Mining or its subsidiaries are exchanged for an equivalent amount of McEwen Mining common stock). Under our Articles of Incorporation and the laws of the State of Colorado, the vote of the holders of a majority of the shares voting at a meeting at which a quorum is present is generally required to approve most shareholder action. As a result, Mr. McEwen will be able to significantly influence the outcome of shareholder votes for the foreseeable future, including votes concerning the election of directors, amendments to our Articles of Incorporation or proposed mergers, acquisitions or other significant corporate transactions.
Our stock price may be volatile, and as a result you could lose all or part of your investment.
In addition to other risk factors identified herein and to volatility associated with equity securities in general, the value of your investment could decline due to the impact of any of the following factors upon the market price of our common stock:
|
· |
Changes in the worldwide price for gold, silver and/or copper; |
|
· |
Volatility in the equities markets; |
|
· |
Disappointing results from our exploration or production efforts; |
|
· |
Producing at rates lower than those targeted; |
|
· |
Political and regulatory risks; |
|
· |
Weather conditions, including unusually heavy rains; |
|
· |
Failure to meet our revenue or profit goals or operating budget; |
21
|
· |
Decline in demand for our common stock; |
|
· |
Downward revisions in securities analysts’ estimates or changes in general market conditions; |
|
· |
Technological innovations by competitors or in competing technologies; |
|
· |
Investor perception of our industry or our prospects; |
|
· |
Actions by government central banks; and |
|
· |
General economic trends. |
During the 2015 calendar year, the price of our stock has ranged from a low of $0.68 to a high of $1.35. In addition, stock markets in general have experienced extreme price and volume fluctuations and the market prices of securities have been highly volatile. These fluctuations are often unrelated to operating performance and may adversely affect the market price of our common stock. Adverse price fluctuations may lead to threatened or actual delisting of our common stock from the NYSE. As a result, you may be unable to resell your shares at a desired price.
There is no guarantee that the Company will continue to declare return of capital or buy shares under the repurchase program.
On June 18, 2015, the Board of Directors declared an annual return of capital of $0.01 per share of common stock, payable semi-annually. The first semi-annual return of capital installment of $0.005 was paid on August 17, 2015 and the second on February 18, 2016. On October 1, 2015 the Board of Directors authorized a share repurchase program authorizing the Company to purchase up to 15,000,000 shares of its common stock over a twelve month period, with an authorized maximum of $15.0 million to be spent in the repurchases. Under the program, purchases of common stock may be made from time-to-time in the open market, subject to compliance with applicable U.S. and Canadian laws. Any determination to continue to declare return of capital on our common stock or to repurchase our common stock will be based primarily upon our financial condition, results of operations and capital requirements, including for capital expenditures and acquisitions, the price of our common stock in the case of the repurchase program, and our Board of Directors determination that the repurchase program and the declaration of the return of capital are in the best interests of our stockholders and are in compliance with all laws and agreements applicable to the Company.
Gains recognized by non‑U.S. holders and non‑U.S. persons holding any interest in the Company other than solely as a creditor (including, for example, interests in the form of our convertible debt, if any) on the sale or other disposition of our securities may be subject to U.S. federal income tax.
We believe that we currently are a “United States real property holding corporation” under section 897(c) of the Internal Revenue Code (the “Code”), or USRPHC, and that there is a substantial likelihood that we will continue to be a USRPHC in the future. Subject to certain exceptions, securities (other than securities that provide no interest in a corporation other than solely as a creditor) issued by a corporation that has been a USRPHC at any time during the preceding five years (or the non‑U.S. holder’s holding period for such securities, if shorter) are treated as U.S. real property interests, or USRPIs, and a gain recognized by a non‑U.S. holder on the sale or other disposition of a USRPI is subject to regular U.S. federal income tax, on a net basis at graduated rates, as if such gain were effectively connected with the conduct by such holder of a U.S. trade or business. If a gain recognized by a non‑U.S. holder from the sale or other disposition of our common stock or other securities is subject to regular net basis income tax under these rules, the transferee of such common stock or other securities may be required to deduct and withhold a tax equal to 10% of the gross amount paid to the non‑U.S. holder with respect to the sale or other disposition, unless certain exceptions apply. Any tax withheld may be credited against the U.S. federal income tax owed by the non‑U.S. holder for the year in which the sale or other disposition occurs.
22
The exercise of options and the future issuances of our common stock will dilute current shareholders and may reduce the market price of our common stock.
Under certain circumstances, our board of directors (the “McEwen Mining Board”) has the authority to authorize the offer and sale of additional securities without the vote of or notice to existing shareholders. We may issue equity in the future in connection with acquisitions, strategic transactions or for other purposes. Based on the need for additional capital to fund expected growth, it is likely that we will issue additional securities to provide such capital and that such additional issuances may involve a significant number of shares of our common stock. Issuance of additional securities in the future will dilute the percentage interest of existing shareholders and may reduce the market price of our common stock and any other outstanding securities. Furthermore, the sale of a significant amount of our common stock by any selling security holders, including Mr. McEwen, may depress the price of our common stock. As a result, you may lose all or a portion of your investment.
ITEM 1B. UNRESOLVED STAFF COMMENTS
None.
23
We classify our mineral properties into: “Production Properties”, “Advanced-Stage Properties” and “Exploration Properties”. Advanced-stage properties consist of properties for which a feasibility study has been completed indicating the presence of mineralized material, and that have obtained or are in the process of obtaining the required permitting. Our designation of certain properties as “Production Properties” or “Advanced-stage Properties” should not suggest that we have proven or probable reserves at those properties as defined by the SEC Industry Guide 7.
In addition, as described under the Critical Accounting Policies section below, we define “Mine Development Costs” as the costs incurred to design and construct mining and processing facilities, including engineering and metallurgical studies, drilling, and other related costs to delineate an ore body, and the removal of overburden to initially expose an ore body at open pit surface mines. Since no proven and probable reserves have been established on any of our properties except for our 49% interest in the San José mine, mine development costs are not capitalized at any of the our properties, but rather are expensed as incurred, and allocated within “Mine Development Costs” in the Consolidated Statement of Operations and Comprehensive Loss.
Our significant production, advanced-stage and exploration properties are described below.
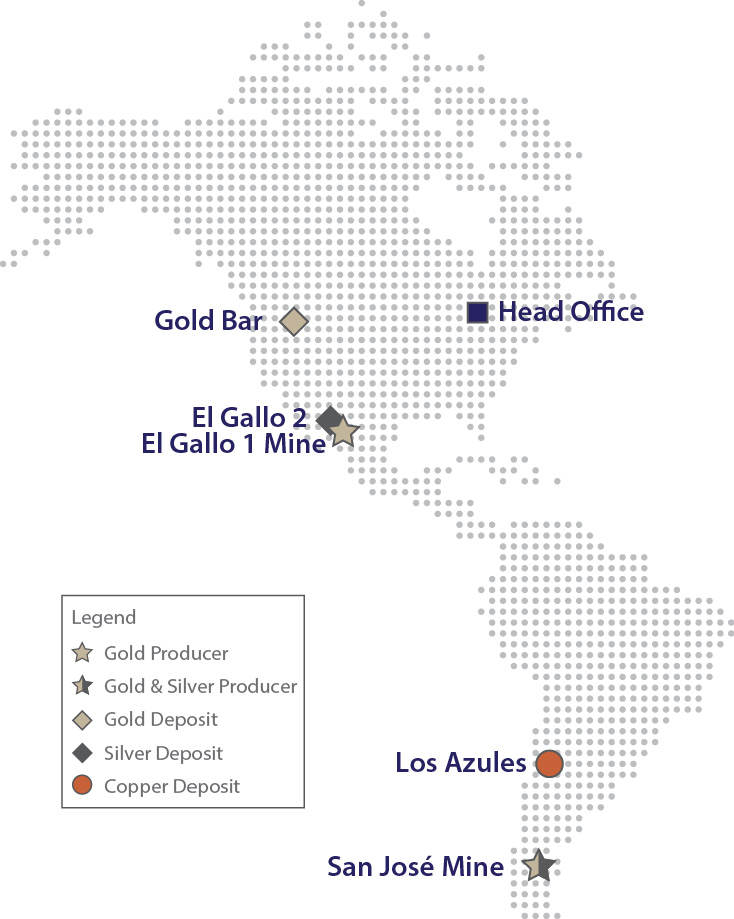
24
Production Properties
El Gallo 1 mine, México (100%)
For detailed information on the El Gallo 1 mine production statistics and financial results, refer to Item 7. Management’s Discussion and Analysis of Financial Condition and Results of Operations.
Overview and History
The Company, through its Mexican subsidiary Compañia Minera Pangea S.A. de C.V. (“Minera Pangea”) owns 100% of the El Gallo 1 mine. El Gallo 1 mine refers to the open‑pit mine, heap leach operation formerly known as the Magistral mine. We completed the first gold pour in September 2012, with commercial production commencing January 1, 2013. During the year ended December 31, 2015, El Gallo 1 mine produced a total of 62,967 ounces of gold and 29,917 ounces of silver, and a cumulative total of 145,044 ounces of gold and 85,204 ounces of silver since commencement of commercial production.
An annual lease agreement for surface access to the El Gallo 1 mine is currently in place between Minera Pangea and certain of our employees who hold the surface rights. These lease agreements provide for access and site preparation to accommodate exploration activities and drilling. The employees who hold the surface rights have commenced the required legal process to convert the land into private ownership so it can be transferred to us. We are not required to make any additional payments, as the purchase price was agreed to and paid at the time of the lease agreements. Although the agreements cover a large area around the project, there can be no assurances that additional surface rights will not be required.
Various environmental permits are required in order to perform exploration drilling in Sinaloa State. Permitting requirements are dependent upon the level of disturbance. Exemptions can generally be obtained if drilling occurs in areas where no new disturbance will occur and vegetation will not be removed (agricultural areas, dirt roads, previously mined sites). If drilling occurs on previously undisturbed land and vegetation will be removed, an Environmental Impact Study and Land Use Change are required. Each of the areas where we are currently conducting exploration drilling has the required permit or exemption.
As of the date of filing this report, the El Gallo 1 mine has all of the necessary permits for current operations, which must be renewed in June 2022. Further permits are or may be required for the satellite deposits. Specific permit‑required conditions must be followed during operations including, but not limited to: environmental impact study, change in land use, and risk analysis plan.
Location and Access
The El Gallo 1 mine and El Gallo 2 project are part of the El Gallo Complex, which is located in northwestern Mexico, within Sinaloa State, Mocorito Municipality. It is situated approximately 60 miles (100 kilometers) by air northwest of the Sinaloa state capital city of Culiacan in the western foothills of the Sierra Madre Occidental mountain range. The concessions are located approximately 2.5 miles (4.0 kilometers) by road from the village of Mocorito, approximately 10 miles (16 kilometers) from the town of Guamuchil. Access is either by paved or well maintained, two‑way, dirt roads.
25
The following map depicts the location of the El Gallo Complex:
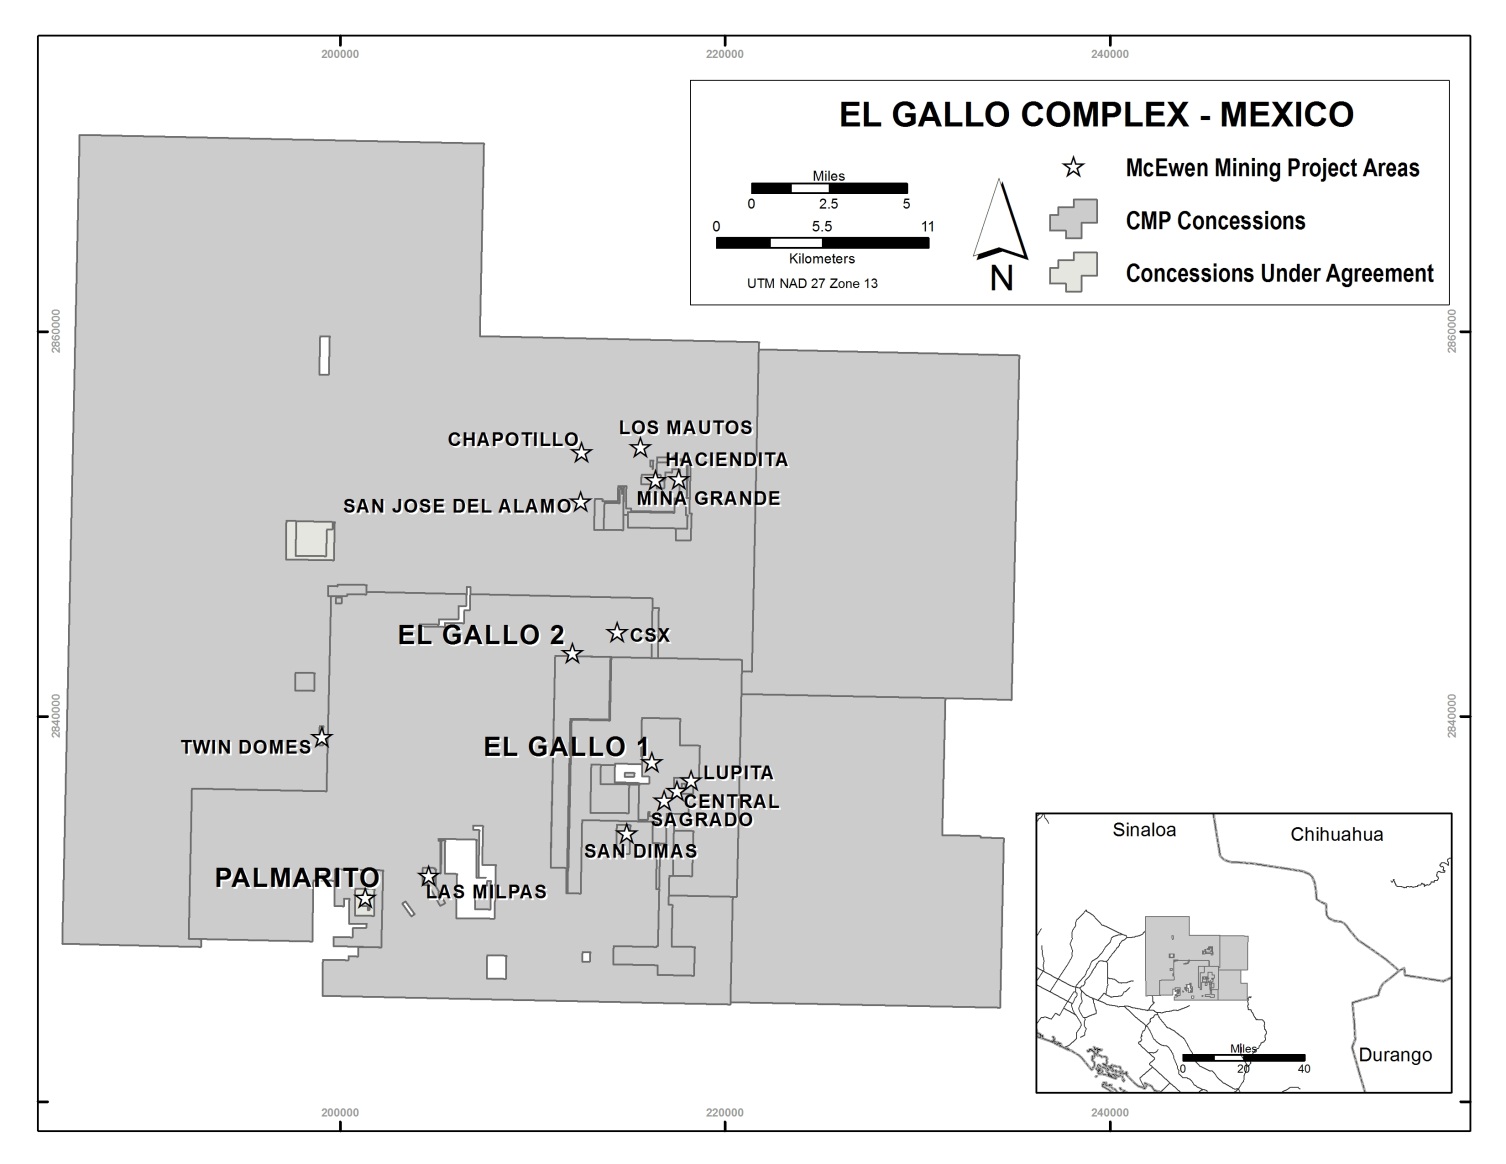
Geology and Mineralization
Gold mineralization in the El Gallo 1 mine area occurs in six deposits along two distinct structural trends, northwest and northeast. A northwest trending structural zone hosts the Samaniego and San Rafael deposits. San Dimas also is hosted by a northwest‑striking structure. The second structural trend is northeast‑striking and includes the Sagrado Corazón, Lupita and Central deposits. Along these structural trends the mineralization is located within numerous sub‑structures that may be parallel, oblique or even perpendicular to the principal trends. Mineralization among the various deposits of the El Gallo 1 area is generally similar, with the individual structural zones consisting of quartz stockwork, breccia, and local quartz vein mineralization occurring within propylitically altered andesitic volcanic rocks. The Samaniego, San Rafael, Lupita, Sagrado Corazon and Central deposits are characterized by gold accompanied by iron oxide and variable copper; the San Dimas deposit is polymetallic containing gold, silver, copper, lead and zinc.
Facilities and Infrastructure
The El Gallo property has well‑developed infrastructure including electricity and well developed roads. At the El Gallo 1 mine, significant mining has occurred in the past and most recent operations included open pit mining in two pits, with gold and silver ores processed in a heap leaching facility. There is a truck shop, a warehouse, two core logging facilities, heap leach pad, process ponds, laboratory, three stage crushing plant, an ADR process plant and an administrative office. The laboratory is equipped to process all assays (blasthole samples from the mine, core, chips and soil) and incorporates fire assaying and atomic absorption equipment. Also included is a metallurgical lab capable of processing bottle rolls and columns to determine gold and silver recoveries of ores amenable to cyanide leaching.
26
In 2014, we undertook an expansion to the plant, which increased the processing capacity of the plant from a nominal 3,000 to 4,500 tonnes per day, at a cost of approximately of $2.8 million. Commissioning commenced during the second quarter of 2014, and was fully operational by the fourth quarter of 2014.
There is also access to a local work force that is familiar with mining operations. Mining operations and site security are performed by contractors and the Company has its own workforce in the administrative and processing areas.
The primary water supply for the El Gallo 1 mine comes from two currently operating water wells located 0.9 miles (1.5 km) from the process facility. Wells are powered by a generator that pumps water into a raw water pond, which is then used for operations. The well field combined with local annual precipitation of 32 inches (~830 mm) provide sufficient supply for El Gallo 1 mine production.
No Proven or Probable Reserves
We have not yet demonstrated the existence of proven or probable reserves at the El Gallo Complex as defined by SEC Industry Guide 7.
Royalties
Coeur Mining Inc. a NYSE listed company, holds a sliding scale net smelter return royalty (“NSR”) on gold or gold equivalent material recovered from the El Gallo 1 mine and the El Gallo mineralized material area. The royalty is calculated at a rate of 1% of NSR on the initial 30,000 ounces of gold equivalent production, at a rate of 3.5% of NSR on the next 350,000 ounces of gold equivalent production, and thereafter, at a rate of 1% of NSR on gold recovered from the areas, in perpetuity. Cumulatively, on a life‑of‑mine basis through to December 31, 2015, approximately 212,200 gold and gold equivalent ounces have been produced from mineralized material within the scope of the NSR agreement.
For Palmarito, a 2% NSR exists on certain mineral claims around the area that were optioned from a third party. The NSR affects strike extensions and down‑dip portions of the in‑situ mineralized material and the majority of historic tailings.
San José Mine, Argentina (49%)
For detailed information on the San José mine production statistics and financial results, refer to Item 7. Management’s Discussion and Analysis of Financial Condition and Results of Operations.
Overview and History
The San José mine is an underground mine located in Santa Cruz Province, Argentina, and operated by a subsidiary of Hochschild, MSC. The San José mine is part of a larger property, which covers a total area of approximately 730 sq. miles. (1,892 sq. km) and consists of 146 mining concessions (consisting of 71 Minas or approved mining claims; 54 Manifestaciones de Descubrimiento, or claims that are in the application process for mining claim status; and 21 Cateos, or claims that are for exploration only). This includes mineral rights that were transferred to MSC pursuant to two separate vend‑in agreements between MSC, the Company and Hochschild (described in further detail in Item 2—Properties, Other Argentina Properties, below), which were completed in October 2013 and October 2015. Under the agreements, we agreed to contribute to MSC the mining rights to a certain number of our Santa Cruz exploration properties, totaling approximately 563 sq. miles (1,460 sq. km), with Hochschild also contributing to MSC certain of its mineral properties located in the same region, totaling approximately 440 sq. miles (1,140 sq. km).
We acquired our interest in the San José mine in connection with our acquisition of Minera Andes in January 2012. The property was acquired by Minera Andes in 1997, following the completion of a regional geological study. Minera Andes embarked on an exploration program from 1997 to 2001, which led to the discovery of the silver and gold bearing Huevos Verdes and Saavedra West Zones. In March 2001 (and subsequently amended by agreements dated May 14, 2002, August 27, 2002, September 10, 2004, and September 17, 2010), an option and joint venture agreement was signed between Minera Andes (49%) and Hochschild (51%) covering the San José property. Under the terms of the OJVA, a subsidiary of Hochschild acquired a majority interest in the property and title to the San José property and the San José
27
mine is held by MSC, the holding and operating company set up under the terms of the OJVA. MSC has purchased the land and corresponding occupation rights that are necessary to conduct its operations. All of the known mineralized zones, mineral resources and mineral reserves and active mine workings, existing tailing ponds and waste are within MSC’s concessions.
Location and Access
The San José property is located in the District of Perito Moreno, in Santa Cruz, Argentina, lying approximately between latitude 46°41’S and 46°47’S and longitude 70°17’W and 70°00’W. The mine is 1,087 miles (1,750 kilometers) south‑southwest of Buenos Aires and 217 miles (350 kilometers) southwest of the Atlantic port of Comodoro Rivadavia. The principal access route to the San José property is an unsealed dirt road section of 20 miles (32 kilometers) and then tarmac road to the port of Comodoro Rivadavia, a total distance of 217 miles (350 kilometers). Comodoro Rivadavia has scheduled national air services to Buenos Aires, the capital of Argentina, with international air connections. The nearest town is Perito Moreno, which is approximately 19 miles (30 kilometers) west of the San José property.
The following map depicts the location of the San José property.
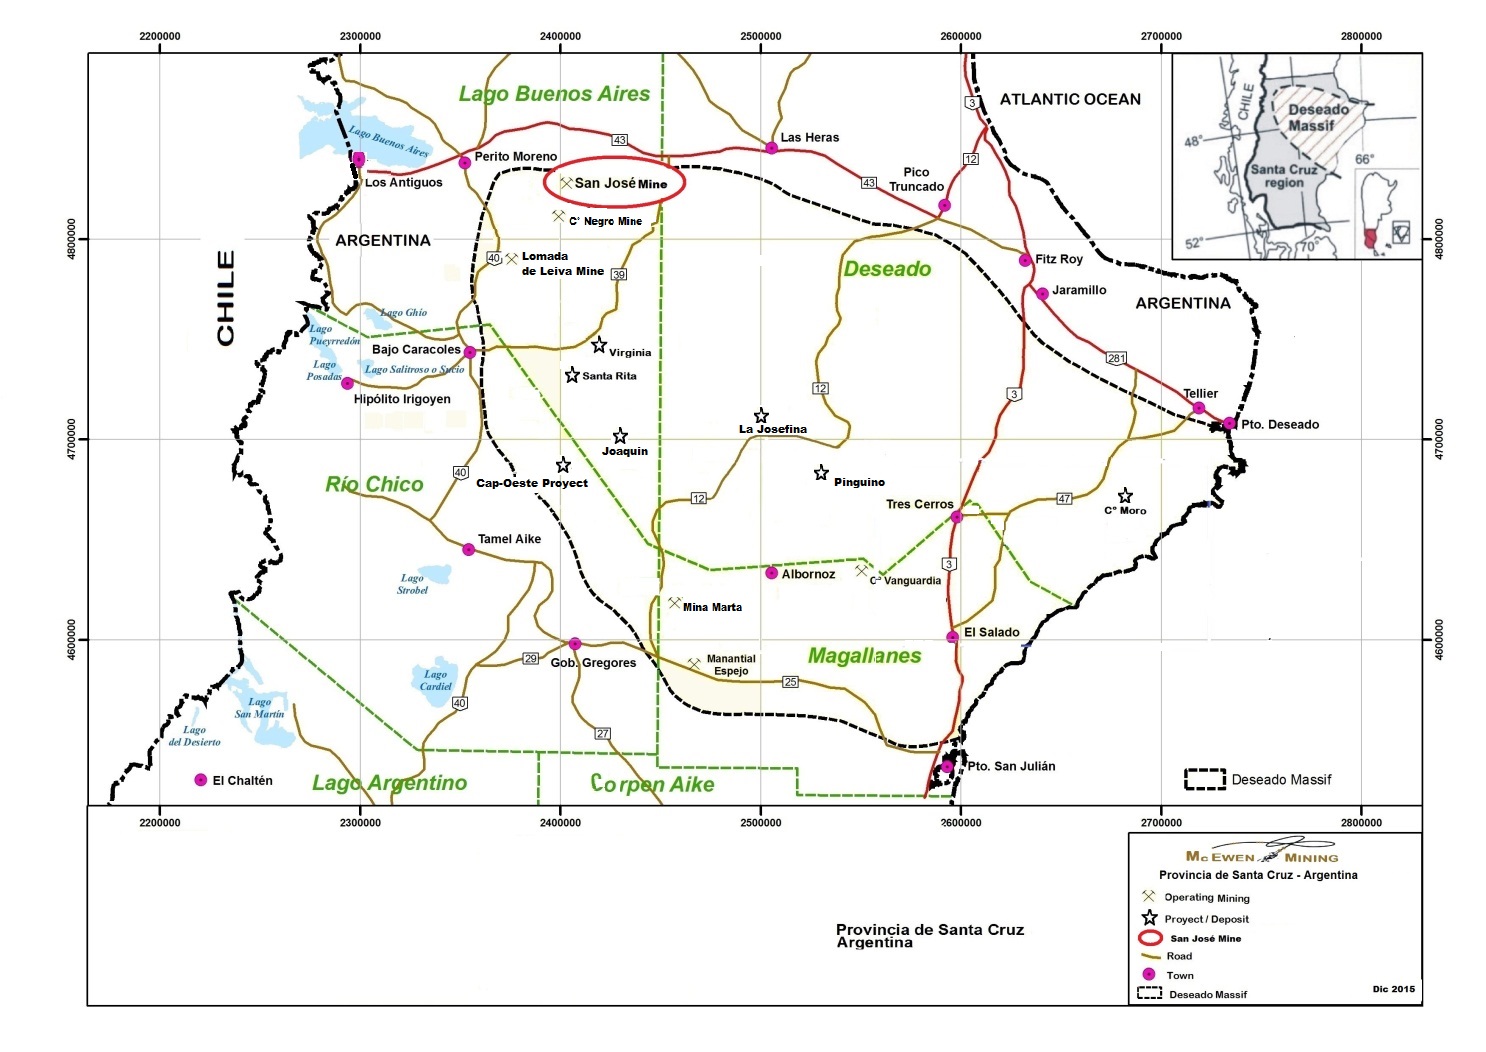
The San José property is within an arid to semi‑arid area of Argentina, with short, warm summers reaching temperatures above 70°F (21°C) and winters with temperatures commonly below 32°F (0°C). Strong and persistent winds are common especially during the warmer months (October to May). Average rainfall at the site is estimated to be 5.7 inches (144 millimeters) and snowfall amounts to 1.3 inches (32.5 millimeters). Annual average temperature is 48°F (8.9°C). MSC has maintained a weather station at the property since January 2005. Mining and exploration continue year round in this part of Argentina.
28
Vegetation is comprised of low scrub bushes and grass, typical of harsh climate and poor soils. Fauna consists of birds, small mammals and reptiles. Most of the property area is uninhabited; however, it is used by local farmers for sheep and cattle grazing.
Geology and Mineralization
The San José property is approximately located in the northwest corner of the 23,166 sq. mile (60,000 sq. km) Deseado Massif of the Santa Cruz Province, Argentina. The Deseado Massif consists of Paleozoic metamorphic basement rocks unconformably overlain by Middle to Upper Jurassic bimodal andesitic and rhyolitic volcanics and volcaniclastics. Cretaceous sediments and Tertiary to Quaternary basalts overlie the Jurassic volcanics. The Jurassic Bajo Pobre Formation is the main host of gold and silver vein mineralization at the mine as well as many regional prospects. The Formation also hosts some of the mineralization at Saavedra West Zone. The formation is comprised of a lower andesite volcaniclastic unit and an upper andesite lava flow and has a maximum thickness of 394 ft. (120 m). Mineralization in the San José area occurs as low sulfidation epithermal quartz veins, breccias and stockwork systems accompanying normal‑sinistral faults striking 330° to 340°. The main structural trend of fault and vein systems on the property is west‑northwest to north‑northwest.
Facilities and Infrastructure
Infrastructure of the property consists of camp facilities that can accommodate up to approximately 1,100 personnel, a medical clinic, a security building, a maintenance shop, a laboratory, processing facilities, a mine and process facility warehouse, a surface tailings impoundment, support buildings and mine portals, a change house, a core warehouse, an administration building and offices. The laboratory is equipped to process all assays (core, chips and soil) and incorporates fire assaying and atomic absorption equipment. MSC has installed a satellite‑based telephone/data/internet communication system.
The San José mine is a ramp access underground mining operation. The San José veins are accessed from three main portals: the Tehuelche Portal, the Kospi Portal and the Güer Aike Portal. The main ramps are located about 164 ft. (50 m) from the vein, depending on the dip of the ore. Cross‑cuts to the ramp are centrally positioned on the vein and usually have an ore pass and a waste/backfill pass.
Electricity is provided by an 81‑mile (130 km) 132 kV electric transmission line, which was constructed in 2009 and connects the San José mine processing facility to the national power grid.
The processing plant at the San José mine is composed of conventional crushing, grinding and flotation circuits. Approximately one‑half of the silver‑gold flotation concentrate is processed in an intensive cyanide leaching circuit with the dissolved gold and silver recovered by electrowinning of a clarified solution followed by smelting to produce doré. The balance of the flotation concentrate is filtered and shipped to a smelter. Flotation and leached tailings are stored in side‑by‑side engineered, zero discharge facilities. A Merrill Crowe circuit recovers small amounts of gold and silver from the electrowinning discharge solution. In 2012, modifications were undertaken to modify the crushing circuit, in order to increase the mill throughput capacity by 10%, from a nominal 1,500 tonnes per day to 1,650 tonnes per day. The modifications were completed in 2013. In 2013, the capacity of the flotation tailing dam was also increased, followed by the construction of a new tailing dam in 2014. Construction was completed in the fourth quarter of 2014, and operational in the first quarter 2015.
Exploration Activities
Exploration by Minera Andes on the San José property from 1997 to 2001 was concentrated over the northern part of the property and consisted of geological mapping, sampling, trenching, geophysics, alteration and metallurgical studies and reverse circulation (“RC”) and diamond drilling. In 2001, an extensive exploration program was undertaken which included detailed topographic surveying of the property, induced polarization (“IP”) geophysics and drilling. Exploration during 2003‑2004 consisted of underground exploration/development, environmental and metallurgical studies and the construction and commissioning of a pilot plant at the Huevos Verdes Vein. Surveying of the topography, planned access and infrastructure in the Huevos Verdes and Frea areas was carried out during 2005 to 2007. From 2007 to 2008, a total
29
of 193 diamond drill holes totaling 155,108 ft. (47,277 m) and focused on regional prospects as well as strike extensions of known veins with most of the drilling concentrated on the Ayelén, Frea and Odin veins. From 2009 to 2015, a total of approximately 968,760 ft. (295,280 m) of diamond core drilling was completed. During 2015 a total of 70,140 ft. (21,380 m) of drilling were completed, from which 56,910 ft. (17,345 m) related to a combined infill and geologic management program around the Kospi targets located on the south side of the San Jose area. The remaining 13,230 ft (4,035 m) of drilling related to the potential development program, which targeted the Maite/Matilde, Ria, and Juanita areas and the Huevos Verdes vein.
Reserves
The following is the reserve information calculated by Hochschild for the San José mine as at December 31, 2015. These figures, reported on a 100% basis, were prepared by Hochschild and audited by P&E Mining Consultants Inc. whose report dated February 25, 2016, concluded that the reserve estimates for the San José mine prepared by Hochschild at December 31, 2015 provide a reliable estimation of reserves in accordance with the standards of the Joint Ore Reserve Committee of the Australian Institute of Mining and Metallurgy (“JORC”), NI 43‑101, the Canadian Institute of Mining, Metallurgy and Petroleum (“CIM”) best practices and Industry Guide 7. The mineral reserves were estimated using metal prices of $1,200 per ounce of gold and $20 per ounce of silver with a marginal revenue cut‑off value of $83.81 per tonne. The reserves as presented are in‑ place and include mining dilution and mining losses, but do not include allowances for mill or smelter recoveries.
San José Reserves and Resources—100%
|
|
|
Tonnes |
|
Silver |
|
Silver ounces |
|
Gold |
|
Gold ounces |
|
|
Reserve Category |
|
(in thousands) |
|
(grams/tonne) |
|
(in millions) |
|
(grams/tonne) |
|
(in thousands) |
|
|
Proven |
|
1,230 |
|
521 |
|
20.6 |
|
7.43 |
|
293.8 |
|
|
Probable |
|
656 |
|
414 |
|
8.7 |
|
6.51 |
|
137.3 |
|
|
Proven & Probable |
|
1,886 |
|
484 |
|
29.3 |
|
7.11 |
|
431.1 |
|
Advanced-stage Properties
Gold Bar Project, Nevada (100%)
Overview and History
The Gold Bar Project is a proposed mine project which, if constructed, would consist of a conventional open pit mine with an oxide gold heap leach recovery circuit. The property is located within the Battle Mountain‑Eureka‑Cortez gold trend in Eureka County, central Nevada, and covers an area of 8.2 sq. miles (21.3 sq. km) consisting of 310 unpatented lode mining claims and 10 patented mining claims within one parcel of private land. The property was previously mined from 1987 to 1994 by Atlas Precious Metals Inc. The Gold Bar project is currently in the permitting phase. The timeline to obtain permits is uncertain, but similar projects on public lands in Nevada have required between 36 and 60 months. The formal permitting process began in 2012.
On October 27, 2015 the Company filed a Feasibility Study (“FS”) completed by SRK Consulting with a report date of December 3, 2015 and effective date of September 19, 2015. The FS included a NI 43‑101 resource estimate of 22.1 million tonnes of measured and indicated mineralized material at a grade of 0.95 gpt gold. Based on the FS, initial capital expenditures for the project are estimated at $60.4 million including an allocation of $4.8 million for contingencies. The full FS report is available on SEDAR at www.sedar.com under the Company’s profile, and is subject to the assumptions and conditions set forth therein. Although the FS report is compliant with NI 43-101, the reserves do not comply with SEC Industry Guide 7.
Location and Access
30
The Gold Bar Complex is in the Roberts Creek Mountains, in Eureka County, Nevada, approximately 30 miles (48 km) northwest of the town of Eureka, Nevada, primarily in Township 22 North; Range 50 East (N39°48’16.5”; W116°21’09.65”).
The project site is accessed by traveling 25 miles (40 km) west on US Highway 50 from Eureka, NV, the nearest town, or 45 miles (72 km) east on US Highway 50 from Austin, NV to the Three Bars Road. Travel is then 16 miles (26 km) north on the Three Bars Road, a gravel, all weather road maintained by Eureka County. The project area is approximately 15 miles (24 km) from the Three Bars Road, and is accessed through unimproved dirt roads that are not maintained by the county.
The following map depicts the location of the Gold Bar Complex:
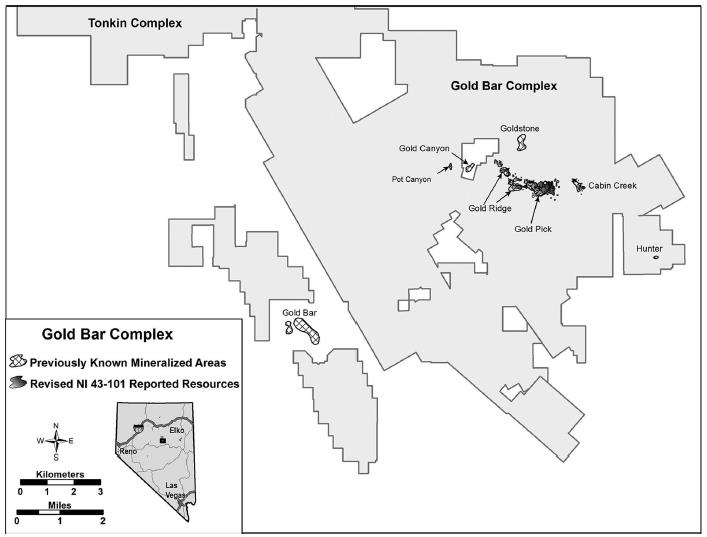
Geology and Mineralization
The Gold Pick‑Gold Ridge area occurs on the Battle Mountain‑Eureka mineral belt in a large window of lower‑plate carbonate rocks surrounded by upper‑plate rocks. The lower‑plate carbonates at Gold Pick‑Gold Ridge consist of an east‑dipping section of Silurian Lone Mountain Dolomite, Devonian McColley Canyon Formation, Devonian Denay Formation, and Devonian Devils Gate Limestone (from oldest to youngest). Northwest‑trending and northeast‑trending structures cut the area; the Gold Pick mineralization is localized in an apparent northwest‑trending horst of McColley Canyon Formation which is cut by a series of northeast‑trending structures.
31
Gold mineralization is hosted primarily in the Bartine Member of the McColley Canyon Formation, which consists of carbonate wackestones and packstones approximately 250 to 380 feet thick. Minor amounts of mineralization are found in the underlying dolomitic limestone Kobeh Member of the McColley Canyon Formation when it is adjacent to apparent feeder structures. Gold Pick‑Gold Ridge is “Carlin‑Type” sediment‑hosted gold mineralization with typical associated alteration (decalcification, silicification) and trace elements (antimony, arsenic, mercury, and barium). Carlin‑Type deposits are deposits that are restricted to a small part of the North American Cordillera in northern Nevada and northwest Utah.
Three‑dimensional modeling by our geologists has led to the identification of an unconformity (erosional surface) between the basement and gold host rocks at the Gold Bar Project. Channels in this unconformity were filled with porous limestone, which then acted as preferred pathways for gold mineralization. Much of the gold mineralization in the Gold Pick‑Gold Ridge area occurs in the porous limestone above these channels.
Exploration Activities
Since 2012, we have continued to advance the permitting process for construction and production. Since the formal permitting process began, we may not perform any drilling activities within the production area subject to the Plan Of Operations (“POO”). During this time, we have continued to advance the Gold Bar project by completing baseline studies in support of the BLM and State of Nevada permitting required for mine development and construction. We also drilled and pump‑tested one potential water well location for future mining operations.
We submitted our POO permit application in 2013. The POO was determined complete and the BLM has determined that an Environmental Impact Statement (“EIS”) is necessary to fulfill the requirements under the National Environmental Policy Act (“NEPA”). Upon completion of the EIS, the BLM will be able to proceed with the approval determination of the POO. A third‑party consulting firm has been contracted to assist the BLM in the preparation of an EIS for the Gold Bar project. Final permit approval is scheduled for the first quarter of 2017.
No Proven or Probable Reserves
We have not yet demonstrated the existence of proven or probable reserves at the Gold Bar Complex as defined by SEC Industry Guide 7.
El Gallo 2 Project, Mexico (100%)
Overview and History
The El Gallo 2 is an advanced-stage project with 34.3 million tonnes of contained mineralized material at an average grade of 58 gpt of silver and 0.18 gpt of gold. The project is located 3.0 miles (4.8 km) north west of our El Gallo mine in Sinaloa State, Mocorito Municipality. It is also 100% owned by our subsidiary Minera Pangea and subject to the environmental permitting requirements applicable to the Sinaloa State previously described.
Geology and Mineralization
Silver mineralization at El Gallo 2 is hosted in siliceous breccia zones and quartz stockwork zones within the predominantly andesitic rock package. These zones often occur at lithologic contacts, particularly contacts of Tertiary porphyry intrusions. Multi‑lithologic breccias zones are often adjacent to these contacts and these breccias are locally mineralized. Mineral zones commonly have gently‑dipping tabular geometry. Often, these zones reflect control by sill contacts of the Tertiary intrusives.
Silver mineralization at Palmarito occurs along or near the contact of andesitic‑dacitic volcanic country rocks and a Tertiary rhyolite intrusive forming a horseshoe‑shaped zone which wraps around the margin of the intrusive. The strongest mineralization in the main Palmarito ore body occurs along a northeast‑trending zone which appears to represent the intersection of two contact structures. Generally, mineralization occurs in a breccia zone and is associated with strong silicification in the form of siliceous breccia, stockwork veining and silica flooding.
32
Facilities and Infraestructure
The primary water supply for El Gallo 2 is expected to come from three locally drilled water wells. Sufficient water yields required for the El Gallo 2 project were confirmed through several long‑term pumping tests during the 2013 hydraulic aquifer investigation. Each well is located within 1.2 miles (2 km) of the proposed El Gallo 2 process facility. Wells will be powered by electricity and pump water into a raw water storage tank for mine usage.
No Proven or Probable Reserves
We have not yet demonstrated the existence of proven or probable reserves at the El Gallo 2 project as defined by SEC Industry Guide 7.
Exploration Properties
Los Azules Copper Project, Argentina (100%)
The Los Azules copper project is a 100% owned advanced‑stage porphyry copper exploration project located in the cordilleran region of San Juan Province, Argentina near the border with Chile. We acquired this property, along with other Argentina exploration properties and our interest in the San José mine, in connection with the acquisition of Minera Andes in January 2012. Located at approximately 31o 13’30” south latitude and 70o 13’50” west longitude, Los Azules is 4 miles (6 km) east of the Chilean‑Argentine border. It is accessible by unimproved dirt roads except for seasonal closures in winter. The elevation at site ranges between 11,500 feet ‑ 14,750 feet (3,500 m ‑ 4,500 m) above sea level.
33
The following map illustrates the location of the Los Azules Copper Project as well as our other properties in the Province of San Juan:
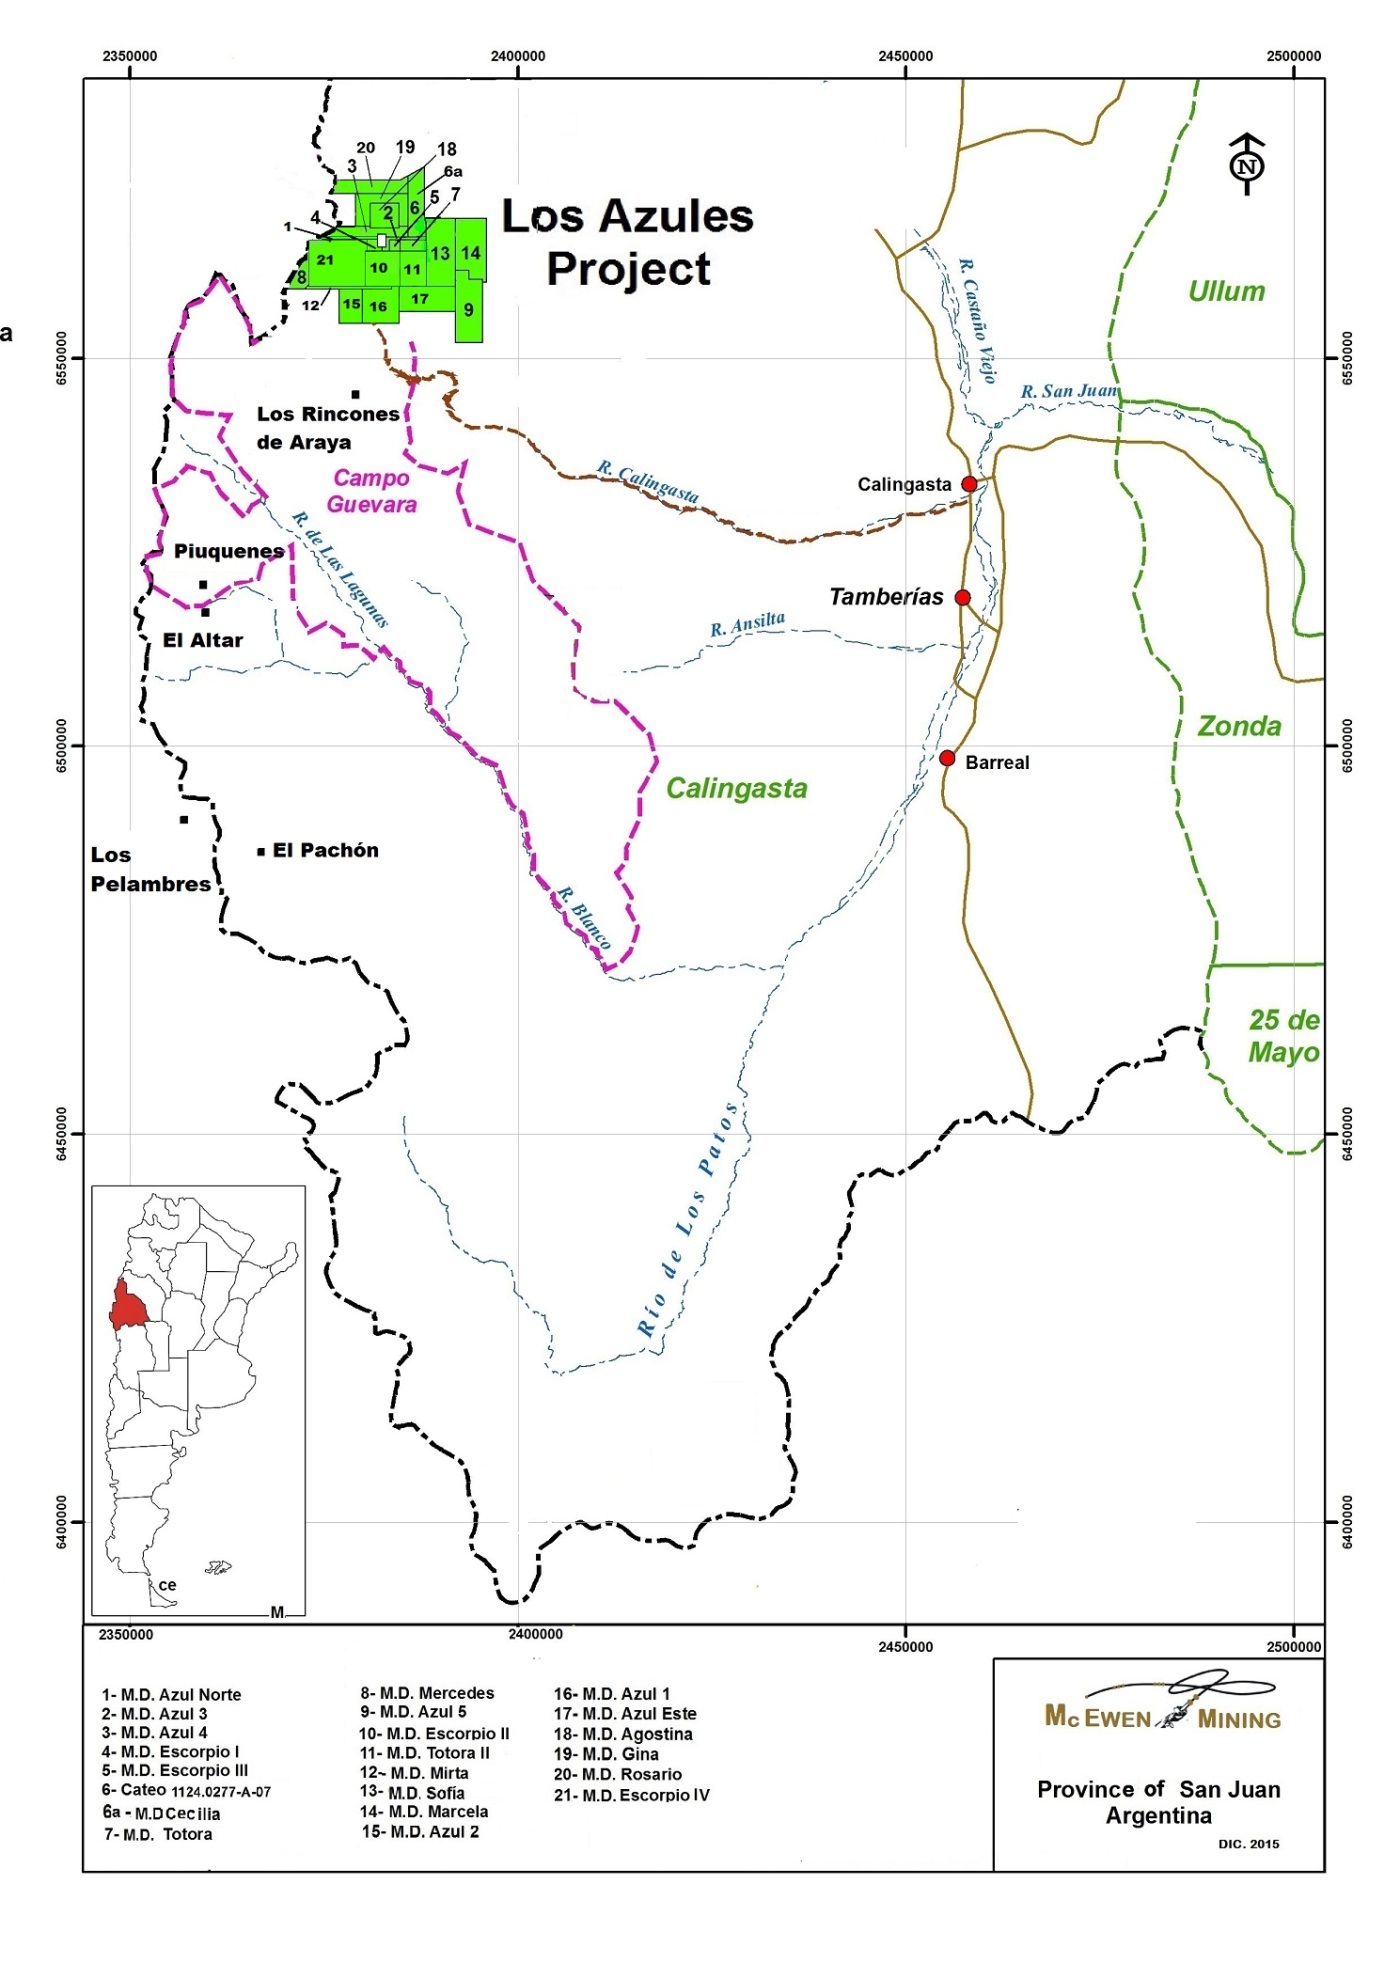
34
The deposit is located within a copper porphyry belt that is host to some of the world’s largest copper mines. The upper part of the system consists of a barren leached cap, which is underlain by a high‑grade secondary enrichment blanket. Primary mineralization below the secondary enrichment zone has been intersected in drilling up to a depth of more than 3,280 ft. (1,000 mt.) below surface. The property encompasses 127 sq. miles (328 sq. km) and surrounds a large alteration zone that is approximately 5 miles (8 km) long by 1.2 miles (2 km) wide.
Drilling programs have been undertaken at Los Azules between 1998 and 2014 by four different mineral exploration companies: Battle Mountain Gold (now Newmont Mining Inc.), Mount Isa Mines S.A. (now Xstrata Copper Plc.), Minera Andes and McEwen Mining. Drilling, including early reverse circulation programs, focused initially on gold exploration and subsequently on diamond drilling for porphyry style copper mineralization. Drilling conditions are difficult, especially in highly faulted zones and in areas of unconsolidated surface scree or talus. Due to snow conditions on two mountain passes on the access road to the site, seasonal exploration typically commences in December and extends into late April or early May. From 1998 until the end of 2015, a total of 195,210 ft. (59,500 mt.) were drilled on the property. No significant drilling took place during the 2013-2014 and 2014‑2015 seasons, as we focused on baseline studies regarding flora, fauna, water quality and other environmental compliance matters.
In November 2013, we filed a NI 43‑101 Preliminary Economic Assessment (“PEA”) prepared by Samuel Engineering Inc. The PEA was expanded to include an updated mineralized material estimate, which we released in May 2013, indicating a mineralized material base of 0.4 billion tonnes of mineralized material with a weighted average grade of 0.63 percent copper. Note this mineralized material includes indicated resources only, and does not include estimates of inferred resources.
The PEA also considers new metallurgical processes and an increased production profile. The updated PEA contemplates the construction of a mine and process plant operating over a 35‑year mine life at a throughput of 120,000 tonnes per day. The proposed mine is projected to produce copper cathode via a pressure oxidative leach process, in addition to heap leaching the lower grade mineralized material. The advantages of being able to produce copper cathode rather than copper concentrate would be to eliminate the capital intensive concentrate pipeline through Chile and remove the treatment and refining charges from the smelting process. The complete technical report was filed on November 7, 2013. It is available on SEDAR under the Company’s profile, and is subject to the assumptions and conditions set forth therein.
In October 2014, the Company terminated the option held by TNR Gold Corp (“TNR”) to acquire a minority ownership position in Los Azules (the “Back‑In Right Option”). The Back‑In Right Option gave TNR the option of owning up to 25% in the northern portion of Los Azules. Based on the estimated resources for those northern claims, this would represent approximately 13% of the total deposit. In exchange for the termination of the Back‑In Right Option, the Company issued 850,000 shares of the Company’s common stock to TNR, and granted a 0.4% net smelter royalty on Los Azules. Further, if the Company sells all of its interest in the project within thirty six months of closing the transaction on October 16, 2014, the Company will grant a bonus payment equal to 1% of the gross proceeds of such transaction to TNR.
As previously reported, the staff of the SEC had commenced an investigation into what we believe were certain accounting matters related to the Los Azules project in Argentina. On August 7, 2015, we were notified by the SEC, that the SEC had concluded its investigation over the accounting for our Los Azules project and, based on the information it had, it did not intend to recommend any enforcement action by the SEC against us.
35
Other Exploration Properties in Argentina
The following map depicts the location of our exploration properties in the Province of San Juan:
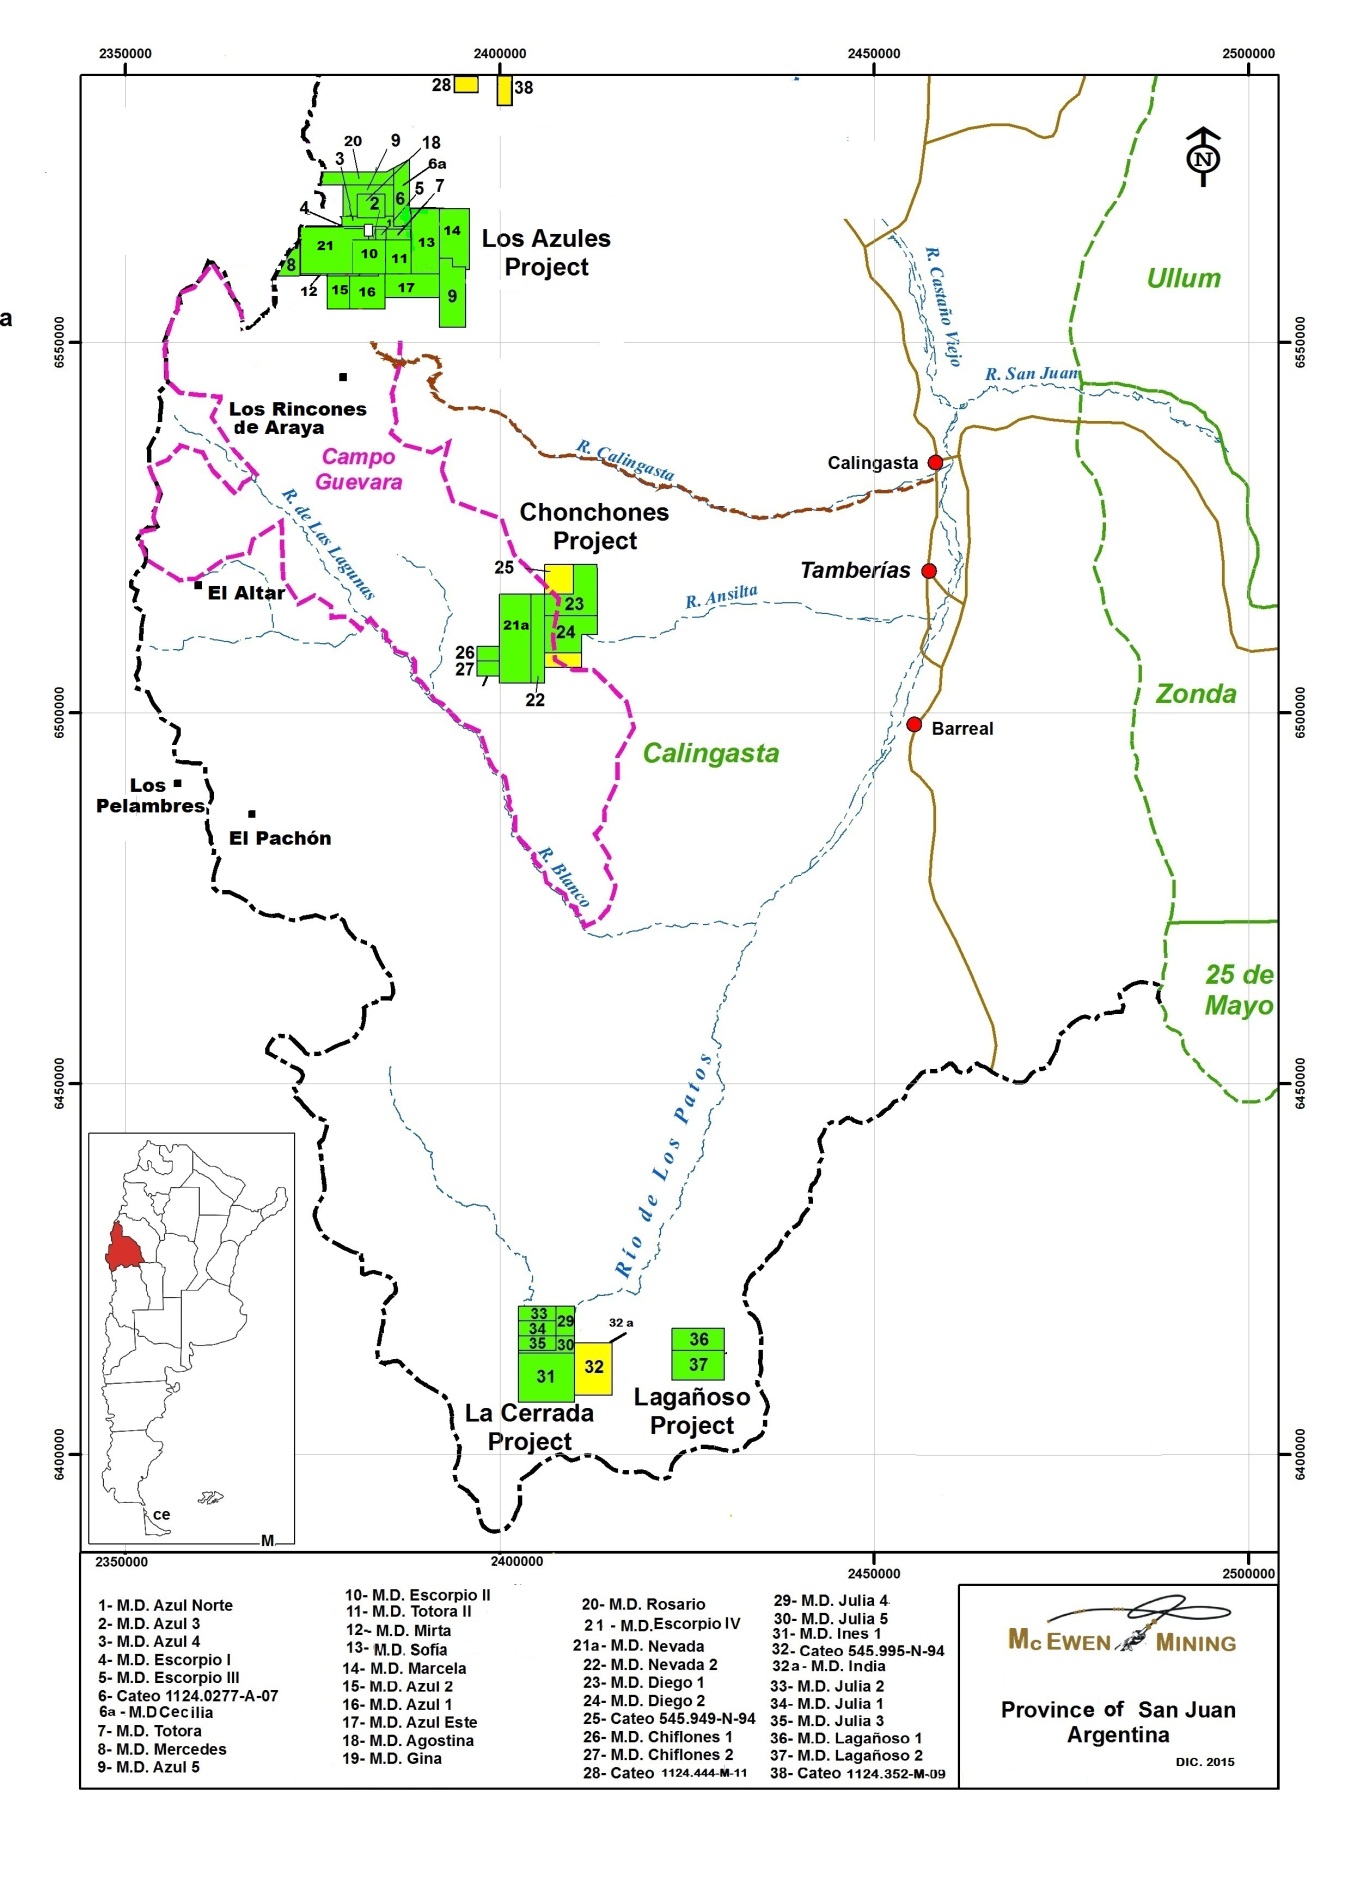
36
No significant drilling took place during 2015. As of the date of this report, we have made the decision to rationalize our mineral property interests in this area in an effort to focus our exploration efforts on more prospective areas, and as a result, do not intend to pursue the exploration of the San Juan properties.
In October 2013, we and Hochschild entered into a vend-in agreement with MSC pursuant to which we agreed to contribute to MSC the mining rights to a certain number of our Santa Cruz exploration properties. The properties transferred, totaling approximately 188 sq. miles (489 sq. km), included amongst others the Telken, Piramides, Tobias, and Este tenements, and are in close proximity to or abutting the properties comprising the San José mine. Hochschild also contributed to MSC certain of its mineral properties located in the same region, totaling approximately 319 sq. miles (827 sq. km). The agreement also contains a 2% net smelter return royalty payable to us or Hochschild based on any of MSC’s production from the respective mineral properties contributed by each party. Registration of title changes with the Argentine government were finalized in the second quarter of 2014.
On October 22, 2015 we and Hochschild entered into a second vend-in agreement with MSC pursuant to which we agreed to vend-in our remaining Santa Cruz exploration properties, which did not have assigned any carrying value. The properties transferred totaled approximately 376 sq. miles (976 sq. km), and were located in the province of Santa Cruz. Hochschild also contributed to MSC certain of its mineral properties located in the same region, totaling approximately 122 sq. miles (316 sq. km). The agreement also contains a 2% net smelter return royalty payable to us or Hochschild based on any of MSC’s production from the respective mineral properties contributed by each party.
The following map illustrates the location of the respective Santa Cruz exploration properties transferred to MSC pursuant to the vend‑in agreement:
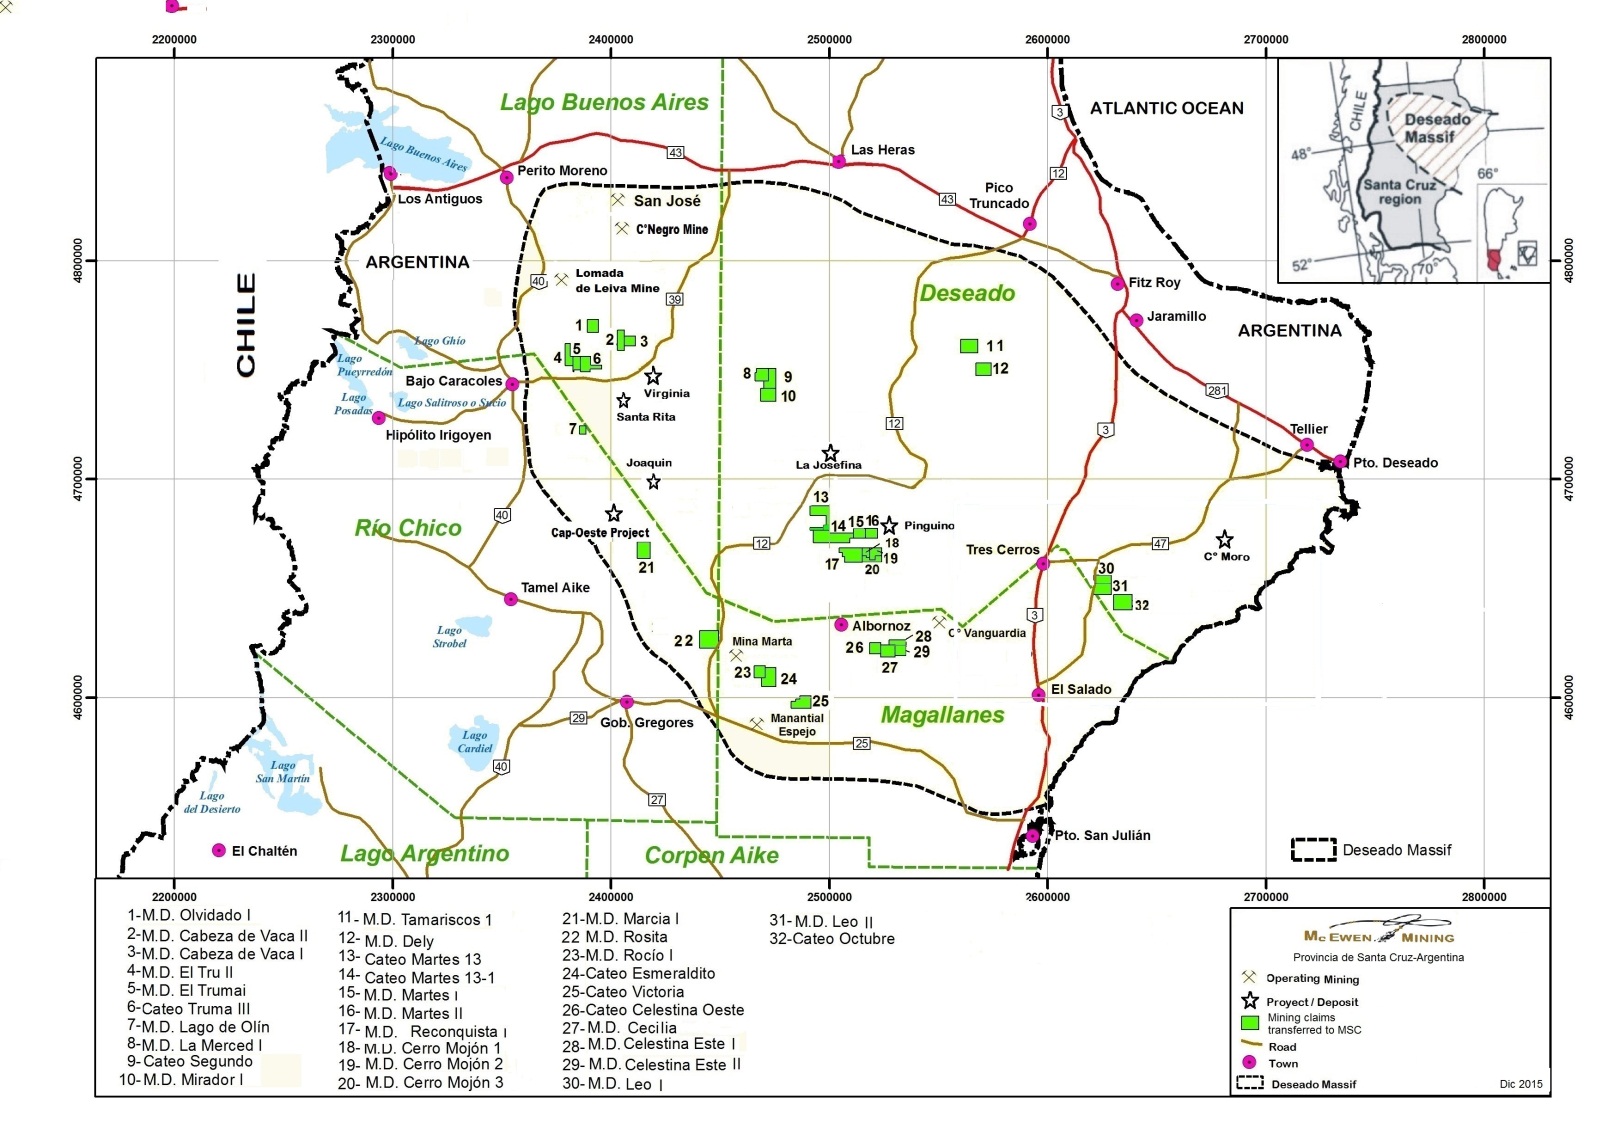
37
Nevada Exploration Properties
The following table summarizes the Nevada land position of our Company as of December 31, 2015:
|
|
|
Number of |
|
Square |
|
Square |
|
|
Nevada Mineral Property Interest |
|
Claims |
|
Miles |
|
Kilometers |
|
|
Gold Bar Complex |
|
1,157 |
|
34 |
|
89 |
|
|
Tonkin Complex |
|
1,984 |
|
59 |
|
154 |
|
|
Limo Complex |
|
755 |
|
24 |
|
61 |
|
|
Battle Mountain Complex |
|
648 |
|
19 |
|
49 |
|
|
Other United Stated Properties |
|
720 |
|
24 |
|
62 |
|
|
Total Nevada Properties |
|
5,264 |
|
160 |
|
415 |
|
Of all the Nevada properties held by the Company, only Gold Bar, previously discussed in more detail, is considered to be of significance to the Company’s development plans at the time of filing this report. No significant drilling or exploration activities took place during the year 2015. As of the date of this report, the Company has made the decision to rationalize its mineral property interests in an effort to focus its exploration efforts on more prospective areas, and as a result, does not intend to pursue the exploration of its Nevada properties, with the exception of the Gold Bar, Tonkin and North Battle Mountain properties.
We generally hold mineral interests in Nevada through patented and unpatented lode mining and mill site claims, leases of unpatented mining claims, and joint venture and other agreements. Unpatented mining claims are held subject to paramount title in the United States. In order to retain these claims, we must pay annual maintenance fees to the BLM, and to the counties within which the claims are located. Rates for these jurisdictions vary and may change over time. Other obligations which must be met include continuing assessment work, obtaining and maintaining necessary regulatory permits, and lease and option payments to claim owners.
38
The following map illustrates the general location of the trends and our properties in Nevada:
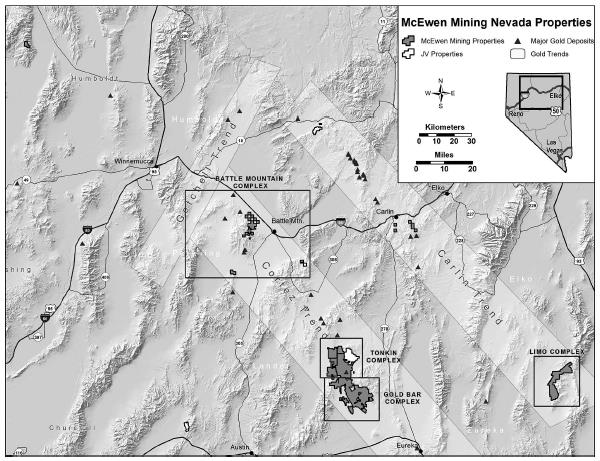
Tonkin Complex
The Tonkin Complex represents our largest holding in the State of Nevada at approximately 59 sq. miles (154 sq. km). The Tonkin Project is a gold mining property located within the Battle Mountain‑Eureka Trend in Eureka County, Nevada. From 1985 through 1989, Tonkin produced approximately 30,000 ounces of gold utilizing an oxide heap leach and a separate ball mill involving bioxidation to treat the problematic sulphide ore. Due to cost escalation and recovery issues associated with the refractory and preg‑robbing carbonaceous mineralogy, the operation was shut down.
We are not currently subject to any material legal proceedings, and to the best of our knowledge, no such proceeding is threatened, the results of which would have a material impact on our properties, results of operations, or financial condition. Nor, to the best of our knowledge, are any of our officers or directors involved in any legal proceedings in which we are an adverse party.
ITEM 4. MINE SAFETY DISCLOSURES
As we have no mines located in the U.S. or any of its territories, the disclosure required by this Item is not applicable.
39
ITEM 5. MARKET FOR COMMON EQUITY, RELATED STOCKHOLDER MATTERS AND ISSUER PURCHASES OF EQUITY SECURITIES
Market Information
On January 24, 2012, our common stock commenced trading on the NYSE and TSX under the symbol “MUX”, subsequent to the completion of the acquisition of Minera Andes. Prior to that, our common stock traded on the NYSE and TSX under the symbol “UXG”. Exchangeable shares of McEwen Mining—Minera Andes Canadian Acquisition Corp. (“Exchange Co.“) are traded on the TSX, under the symbol “MAQ”.
The table below sets forth the high and low sales prices for our common stock on a quarterly basis as reported by the NYSE and TSX from January 1, 2014 to December 31, 2015.
|
|
|
NYSE |
|
TSX (C$) |
|
||||||||
|
|
|
High |
|
Low |
|
High |
|
Low |
|
||||
|
Year ended December 31, 2015 |
|
|
|
|
|
|
|
|
|
|
|
|
|
|
First Quarter |
|
$ |
1.40 |
|
$ |
0.90 |
|
$ |
1.71 |
|
$ |
1.14 |
|
|
Second Quarter |
|
|
1.15 |
|
|
0.92 |
|
|
1.38 |
|
|
1.15 |
|
|
Third Quarter |
|
|
1.04 |
|
|
0.65 |
|
|
1.36 |
|
|
0.84 |
|
|
Fourth Quarter |
|
|
1.18 |
|
|
0.79 |
|
|
1.64 |
|
|
1.05 |
|
|
Year ended December 31, 2014 |
|
|
|
|
|
|
|
|
|
|
|
|
|
|
First Quarter |
|
$ |
3.56 |
|
$ |
2.07 |
|
$ |
3.93 |
|
$ |
2.23 |
|
|
Second Quarter |
|
|
3.03 |
|
|
2.07 |
|
|
3.27 |
|
|
2.25 |
|
|
Third Quarter |
|
|
3.1 |
|
|
1.96 |
|
|
3.33 |
|
|
2.2 |
|
|
Fourth Quarter |
|
|
1.92 |
|
|
0.92 |
|
|
2.15 |
|
|
1.07 |
|
As of March 8, 2016, there were outstanding 276,855,799 shares of our common stock, which were held by approximately 5,269 stockholders of record. As of March 8, 2016, there were outstanding 21,219,942 exchangeable shares, which were held by approximately 68 holders of record. The exchangeable shares are exchangeable at the option of the holders into our common stock on a one‑for‑one basis.
Transfer Agent
Computershare Investor Services Inc. is the transfer agent for our common stock. The principal office of Computershare is 250 Royall Street, Canton, Massachusetts, 02021 and its telephone number is (303) 262‑0600. The transfer agent in Canada and transfer agent for exchangeable shares is Computershare Investor Services at 100 University Ave., 9th Floor, Toronto ON, M5J 2Y1 and its telephone number is 1‑800‑564‑6253.
Dividend Policy
On June 18, 2015, our Board of Directors and the board of our subsidiary Exchange Co., declared a dividend, which is defined as a return of capital since we have accumulated losses and cannot distribute from retained earnings. The annual return of capital was determined as $0.01 per share of common stock and exchangeable shares, payable semi-annually. The first semi-annual return of capital installment of $0.005 was paid on August 17, 2015 and the second on February 12, 2016. This was the first distribution or return of capital since our inception. Whether future returns of capital distributions will be declared depends upon our future growth and earnings, of which there can be no assurance, as well as our future cash flow needs.
40
Purchases of Equity Securities by the Company
The following table provides information regarding repurchases made by us during the quarter ended December 31, 2015 of our common stock that is registered pursuant to the Exchange Act:
|
Issuer Purchases of Equity Securities |
|||||||||
|
Fourth Quarter 2015 |
|||||||||
|
Period |
|
(a) Total number of shares (or units) purchased |
|
(b) Average price paid per share (or unit) |
|
(c) Total number of shares (or units) purchased as part of publicly announced plans or programs(1) |
|
(d) Maximum number (or approximate dollar value) of shares (or units) that may yet be purchased under the plans or programs(2) |
|
|
November 1, 2015 – November 30, 2015 |
|
200,000 |
|
$ |
0.87 |
|
200,000 |
|
14,800,000 |
|
December 1, 2015 – December 31, 2015 |
|
1,696,442 |
|
|
0.95 |
|
1,696,442 |
|
13,103,558 |
|
Total |
|
1,896,442 |
|
$ |
0.94 |
|
1,896,442 |
|
|
|
(1) |
On October 1, 2015, our Board of Directors authorized and we publicly announced a plan to repurchase up to 15,000,000 shares of our Company’s outstanding common stock (representing approximately 5.4% of the total outstanding common stock as of December 31, 2015), or up to $15.0 million, whichever is less. The repurchase plan expires on September 30, 2016. |
(2)The maximum amount remaining under the publicly-announced repurchase plan is approximately $13.2 million or 13,103,558 shares, whichever is less.
Securities Authorized for Issuance Under Equity Compensation Plans
Set out below is information as of December 31, 2015 with respect to compensation plans (including individual compensation arrangements) under which our equity securities are authorized for issuance. This information relates to our Equity Incentive Plan.
|
|
|
|
|
Weighted‑average |
|
Number of securities |
|
|
|
|
|
Number of securities to |
|
exercise price per |
|
remaining available for |
|
|
|
|
|
be issued upon exercise |
|
share of outstanding |
|
future issuance under equity |
|
|
|
Plan Category |
|
of outstanding options |
|
options |
|
compensation plans |
|
|
|
Equity compensation plans approved by security holders |
|
6,953,967 |
|
$ |
2.49 |
|
4,357,137 |
|
|
Equity compensation plans not approved by security holders(1) |
|
199,143 |
|
C$ |
5.11 |
|
— |
|
|
TOTAL |
|
7,153,110 |
|
|
|
|
4,357,137 |
|
|
(1) |
In connection with certain acquisitions completed in 2007, we assumed stock options covering 812,918 shares of our common stock. Following certain exercises and expirations of 613,775 options between 2007 and 2015, a total of 199,143 options remain exercisable at December 31, 2015. |
The options that we assumed in connection with the 2007 acquisitions were not approved by our security holders. These options are exercisable at prices ranging from C$4.30 to C$6.70 and expire on dates between 2016 and 2017. We are not authorized to issue any additional options under any of these plans.
On May 28, 2015, shareholders approved an amendment to our Equity Incentive Plan to, among other things, increase the number of shares of common stock reserved for issuance thereunder from 13,500,000 to 17,500,000 shares. The number of securities shown in the table above as remaining available for future issuance is net of securities previously issued and exercised.
41
Performance Graph
The following graph compares our cumulative total shareholder return for the five years ended December 31, 2015 with (i) the NYSE Arca Gold Bugs Index, which is an index of companies involved in the gold industry and (ii) the NYSE Composite Index, which is a performance indicator of the overall stock market. The graph assumes a $100 investment on December 31, 2010 in our common stock and the two other stock market indices, and assumes the reinvestment of dividends, if any.
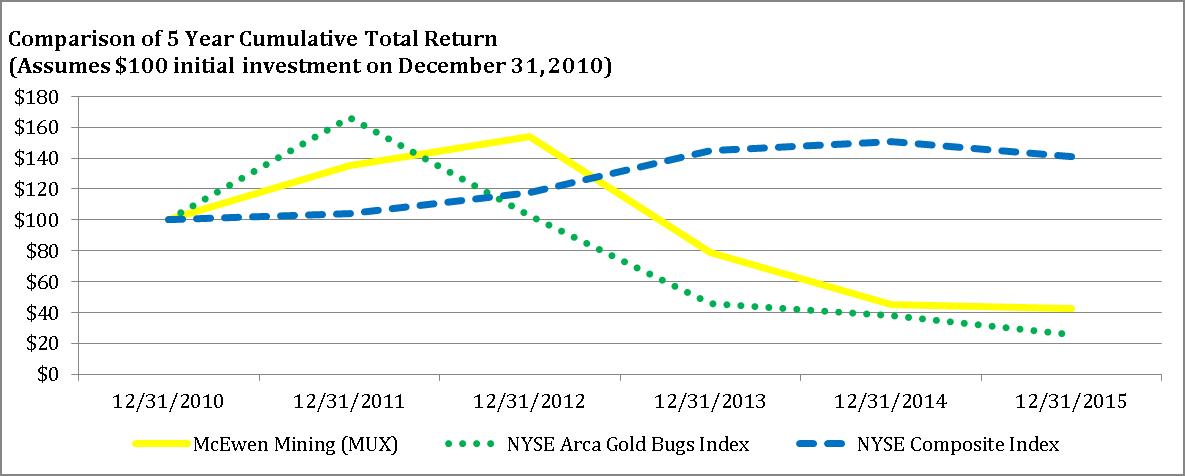
|
|
|
December 31, |
|
||||||||||||||||
|
|
|
2010 |
|
2011 |
|
2012 |
|
2013 |
|
2014 |
|
2015 |
|
||||||
|
McEwen Mining (MUX) |
|
$ |
100 |
|
$ |
135 |
|
$ |
154 |
|
$ |
79 |
|
$ |
45 |
|
$ |
43 |
|
|
NYSE Arca Gold Bugs Index |
|
|
100 |
|
|
166 |
|
|
103 |
|
|
46 |
|
|
38 |
|
|
26 |
|
|
NYSE Composite Index |
|
|
100 |
|
|
104 |
|
|
118 |
|
|
145 |
|
|
151 |
|
|
141 |
|
ITEM 6. SELECTED FINANCIAL DATA
The following table summarizes certain selected historical financial data about our Company for the last five years. The data has been derived from our audited consolidated financial statements for the years indicated. The data for 2012 reflects the acquisition of Minera Andes effective January 24, 2012. You should read this data in conjunction with the MANAGEMENT’S DISCUSSION AND ANALYSIS OF FINANCIAL CONDITION AND RESULTS OF OPERATIONS and our audited consolidated financial statements contained herein. All amounts are stated in thousands of U.S. dollars unless otherwise indicated.
|
|
|
For the year ended December 31, |
|
|||||||||||||
|
|
|
2015 |
|
2014 |
|
2013 |
|
2012 |
|
2011 |
|
|||||
|
Operating data |
|
|
|
|
|
|
|
|
|
|
|
|
|
|
|
|
|
Revenue |
|
$ |
72,956 |
|
$ |
45,303 |
|
$ |
45,982 |
|
$ |
5,966 |
|
$ |
— |
|
|
Income (Loss) on investment in Minera Santa Cruz S.A. |
|
|
2,414 |
|
|
(5,284) |
|
|
846 |
|
|
20,835 |
|
|
— |
|
|
Operating loss(1) |
|
|
(49,320) |
|
|
(410,165) |
|
|
(200,397) |
|
|
(91,405) |
|
|
(60,185) |
|
|
Other income (expenses) |
|
|
4,310 |
|
|
(8,948) |
|
|
(710) |
|
|
(2,493) |
|
|
(1,867) |
|
|
Net loss(1) |
|
|
(20,450) |
|
|
(311,943) |
|
|
(147,742) |
|
|
(66,654) |
|
|
(61,872) |
|
|
Basic loss per share(2) |
|
$ |
(0.07) |
|
$ |
(1.05) |
|
$ |
(0.50) |
|
$ |
(0.26) |
|
$ |
(0.42) |
|
|
Weighted average number of shares - basic(2) |
|
|
300,341 |
|
|
297,763 |
|
|
297,041 |
|
|
261,233 |
|
|
147,692 |
|
42
|
|
|
As at December 31, |
|
|||||||||||||
|
|
|
2015 |
|
2014 |
|
2013 |
|
2012 |
|
2011 |
|
|||||
|
Balance sheet data |
|
|
|
|
|
|
|
|
|
|
|
|
|
|
|
|
|
Cash and cash equivalents |
|
$ |
25,874 |
|
$ |
12,380 |
|
$ |
24,321 |
|
$ |
70,921 |
|
$ |
13,416 |
|
|
Short‑term investments |
|
|
— |
|
|
— |
|
|
— |
|
|
— |
|
|
3,933 |
|
|
Marketable equity securities |
|
|
1,032 |
|
|
1,082 |
|
|
2 |
|
|
3 |
|
|
1,480 |
|
|
Gold and silver bullion |
|
|
— |
|
|
— |
|
|
— |
|
|
1,690 |
|
|
22,810 |
|
|
IVA taxes receivable |
|
|
10,032 |
|
|
11,739 |
|
|
11,591 |
|
|
9,150 |
|
|
2,983 |
|
|
Inventories |
|
|
14,975 |
|
|
12,404 |
|
|
8,800 |
|
|
7,262 |
|
|
139 |
|
|
Property and equipment, net |
|
|
15,759 |
|
|
17,896 |
|
|
15,143 |
|
|
12,767 |
|
|
11,772 |
|
|
Mineral property interests |
|
|
237,245 |
|
|
287,812 |
|
|
642,968 |
|
|
767,067 |
|
|
245,454 |
|
|
Investment in Minera Santa Cruz S.A. |
|
|
167,107 |
|
|
177,018 |
|
|
212,947 |
|
|
273,948 |
|
|
— |
|
|
Other assets |
|
|
3,061 |
|
|
2,627 |
|
|
7,294 |
|
|
8,129 |
|
|
8,368 |
|
|
Total assets |
|
$ |
475,085 |
|
$ |
522,958 |
|
$ |
923,066 |
|
$ |
1,150,937 |
|
$ |
310,355 |
|
|
Current liabilities |
|
$ |
22,039 |
|
$ |
24,082 |
|
$ |
11,189 |
|
$ |
25,195 |
|
$ |
6,124 |
|
|
Deferred income tax liability |
|
|
26,899 |
|
|
51,899 |
|
|
158,855 |
|
|
229,522 |
|
|
78,786 |
|
|
Other long‑term liabilities |
|
|
7,855 |
|
|
5,763 |
|
|
6,255 |
|
|
6,629 |
|
|
6,141 |
|
|
Shareholders’ equity |
|
|
418,292 |
|
|
441,214 |
|
|
746,767 |
|
|
889,591 |
|
|
219,304 |
|
|
Total liabilities and shareholders’ equity |
|
$ |
475,085 |
|
$ |
522,958 |
|
$ |
923,066 |
|
$ |
1,150,937 |
|
$ |
310,355 |
|
|
(1) |
Includes a non‑cash expense of $50,600, $353,736, $62,963, and $18,468 relating to the write‑downs of mineral property interests, and property and equipment in 2015, 2014, 2013, and 2012, respectively. Also includes a non‑cash expense of $11,777, $21,162 and $95,878 relating to the write‑down of our investment in Minera Santa Cruz S.A. in 2015, 2014 and 2013, respectively. |
|
(2) |
Includes a retroactive adjustment on the weighted average number of shares outstanding for 2011 as a result of a rights offering in 2012, as the rights offering was offered to all existing shareholders and was considered to contain a bonus element. |
43
ITEM 7. MANAGEMENT’S DISCUSSION AND ANALYSIS OF FINANCIAL CONDITION AND RESULTS OF OPERATIONS
Introduction
The following discussion updates our plan of operation as of March 11, 2016 for the foreseeable future. It also discusses our results of operations for three fiscal years ended December 31, 2015 and our financial condition at December 31, 2015 and 2014, with a particular emphasis on the year ended December 31, 2015. With regard to properties or projects that are not in production, we provide some details of our plan of operation.
The discussion also presents certain non‑GAAP financial performance measures, such as earnings from mining operations, adjusted net loss, total cash costs, total cash cost per ounce, all‑in sustaining costs, all‑in sustaining cost per ounce, all‑in costs, all‑in cost per ounce, and average realized price per ounce, that are important to management in its evaluation of our operating results and which are used by management to compare our performance to what we perceive to be peer group mining companies and relied on as part of management’s decision‑making process. Management believes these measures may also be important to investors in evaluating our performance. For a detailed description of each of the non‑GAAP financial performance measures and certain limitations inherent in such measures, please see the discussion under “Non‑GAAP Financial Performance Measures” below, on page 61.
The information in this section should be read in conjunction with our consolidated financial statements and the notes thereto included in this annual report.
Reliability of Information: MSC, the owner of the San José mine, is responsible for and has supplied to us all reported results from the San José mine. The technical information contained herein is, with few exceptions as noted, based entirely on information provided to us by MSC. Our joint venture partner, a subsidiary of Hochschild Mining plc, and its affiliates other than MSC do not accept responsibility for the use of project data or the adequacy or accuracy of this document.
44
Selected Financial and Operating Results
|
|
|
Three months ended |
|
Year ended |
|
|||||||||||
|
|
|
December 31, |
|
December 31, |
|
|||||||||||
|
|
|
2015 |
|
2014 |
|
2015 |
|
2014 |
|
2013 |
|
|||||
|
|
|
(in thousands, unless otherwise indicated) |
|
|||||||||||||
|
Gold and silver sales |
|
$ |
11,411 |
|
$ |
13,683 |
|
$ |
72,956 |
|
$ |
45,303 |
|
$ |
45,982 |
|
|
Income (loss) on investment in MSC, net of amortization |
|
$ |
6,378 |
|
$ |
(5,434) |
|
$ |
2,414 |
|
$ |
(5,284) |
|
$ |
846 |
|
|
Impairments |
|
$ |
(32,637) |
|
$ |
(254,500) |
|
$ |
(62,377) |
|
$ |
(374,898) |
|
$ |
(158,841) |
|
|
Operating loss |
|
$ |
(26,706) |
|
$ |
(265,480) |
|
$ |
(49,320) |
|
$ |
(410,165) |
|
$ |
(200,397) |
|
|
Net loss |
|
$ |
(14,988) |
|
$ |
(212,775) |
|
$ |
(20,450) |
|
$ |
(311,943) |
|
$ |
(147,742) |
|
|
Net loss per common share |
|
$ |
(0.05) |
|
$ |
(0.71) |
|
$ |
(0.07) |
|
$ |
(1.05) |
|
$ |
(0.50) |
|
|
Adjusted net loss(3) |
|
$ |
(10,954) |
|
$ |
(9,744) |
|
$ |
(8,612) |
|
$ |
(32,998) |
|
$ |
(30,965) |
|
|
Earnings from mining operations (1)(3) |
|
$ |
9,132 |
|
$ |
8,218 |
|
$ |
53,103 |
|
$ |
25,455 |
|
$ |
37,634 |
|
|
Adjusted net loss per common share(3) |
|
$ |
(0.04) |
|
$ |
(0.03) |
|
$ |
(0.03) |
|
$ |
(0.11) |
|
$ |
(0.10) |
|
|
Consolidated gold ounces(1): |
|
|
|
|
|
|
|
|
|
|
|
|
|
|
|
|
|
Produced |
|
|
25.5 |
|
|
27.4 |
|
|
110.3 |
|
|
84.4 |
|
|
79.2 |
|
|
Sold |
|
|
21.6 |
|
|
26.0 |
|
|
105.7 |
|
|
80.3 |
|
|
79.1 |
|
|
Consolidated silver ounces(1): |
|
|
|
|
|
|
|
|
|
|
|
|
|
|
|
|
|
Produced |
|
|
982 |
|
|
973 |
|
|
3,316 |
|
|
3,196 |
|
|
3,135 |
|
|
Sold |
|
|
791 |
|
|
1,068 |
|
|
3,142 |
|
|
3,114 |
|
|
3,099 |
|
|
Consolidated gold equivalent ounces(1)(2): |
|
|
|
|
|
|
|
|
|
|
|
|
|
|
|
|
|
Produced |
|
|
38.5 |
|
|
43.6 |
|
|
154.5 |
|
|
137.6 |
|
|
139.5 |
|
|
Sold |
|
|
32.1 |
|
|
43.8 |
|
|
147.6 |
|
|
132.2 |
|
|
138.7 |
|
|
Consolidated average realized price ($/ounce)(1)(3): |
|
|
|
|
|
|
|
|
|
|
|
|
|
|
|
|
|
Gold |
|
$ |
1,084 |
|
$ |
1,182 |
|
$ |
1,146 |
|
$ |
1,248 |
|
$ |
1,328 |
|
|
Silver |
|
$ |
14.01 |
|
$ |
15.49 |
|
$ |
15.06 |
|
$ |
17.68 |
|
$ |
21.28 |
|
|
Consolidated costs per gold equivalent ounce sold ($/ounce)(1)(2): |
|
|
|
|
|
|
|
|
|
|
|
|
|
|
|
|
|
Total cash costs(3)(4)(5) |
|
$ |
679 |
|
$ |
709 |
|
$ |
685 |
|
$ |
817 |
|
$ |
776 |
|
|
All‑in sustaining costs(3)(5) |
|
$ |
946 |
|
$ |
1,603 |
|
$ |
962 |
|
$ |
1,198 |
|
$ |
1,178 |
|
|
All‑in costs(3)(5) |
|
$ |
1,022 |
|
$ |
1,194 |
|
$ |
1,055 |
|
$ |
1,368 |
|
$ |
1,412 |
|
|
Silver : gold ratio(2) |
|
|
75 : 1 |
|
|
60:1 |
|
|
75 : 1 |
|
|
60:1 |
|
|
52:1 |
|
|
(1) |
Includes production attributable to us from our 49% owned San José mine. |
|
(2) |
Silver production is presented as a gold equivalent. Gold equivalent ounces calculations are based on prevailing spot prices at the beginning of the year. The silver to gold ratio used for 2015 was 75:1, the ratio for 2014 was 60:1, and the ratio for 2013 was 52:1. |
|
(3) |
Earnings from mining operations, adjusted net loss, total cash costs, all‑in sustaining costs, all‑in costs, and average realized prices are non‑GAAP financial performance measures with no standardized definition under U.S. GAAP. See “Non‑GAAP Financial Performance Measures” on page 61 for additional information, including definitions of these terms. |
|
(4) |
In 2013, the Company revised its allocation of general and administrative expenses to total cash costs to conform to the Gold Institute Production Cost standard. |
|
(5) |
In 2013, the Company adopted the new guidance on all‑in sustaining and all‑in costs published by the World Gold Council on June 27, 2013. |
45
Operating and Financial Highlights
|
· |
Both the El Gallo 1 and San Jose mines exceeded 2015 production guidance. Gold equivalent production in the year 2015 totaled 154,529 ounces, which includes 91,163 gold equivalent ounces attributable to us from our 49% interest in the San José mine (compared to 2015 guidance of 87,800 gold equivalent ounces), and 63,366 gold equivalent ounces from the El Gallo 1 mine (compared to the revised guidance of 62,200 gold equivalent ounces). Production at the El Gallo 1 mine exceeding guidance was the result of higher-grade ore being mined and placed on the leach pad, better metallurgical recovery, reduced downtime, and continued strong operational performance from our team in Mexico. |
|
· |
Both the El Gallo 1 and San José mines met or were below 2015 cost guidance. Total cash costs, all‑in sustaining costs and all‑in costs per gold equivalent ounce sold for the year ended December 31, 2015 for all of our operations on a consolidated basis totaled $685, $962 and $1,055 per ounce, respectively. Total cash costs and all‑in sustaining cash costs at our El Gallo 1 mine totaled $440 and $581 per gold equivalent ounce, respectively. These also compare favorably to the 2015 guidance of $500-$600 and $700‑$800 per gold equivalent ounce, respectively. Costs at the El Gallo 1 mine were below guidance due to the higher than expected average grade of metal processed, cost reductions, and better recoveries obtained during the year. Total cash costs and all‑in sustaining costs at the San José mine for the year 2015 were $865 and $1,111 per gold equivalent ounce, respectively, which compare to the 2015 cost guidance of $775‑$875 and $1,175‑$1,275 per gold equivalent ounce, respectively. |
|
· |
Consolidated production for 2016 is expected to be 96,500 ounces of gold and 3,337,500 ounces of silver. This is comprised of 45,000 ounces of gold and 3,300,000 ounces of silver from the San José mine, and 51,500 ounces of gold and 37,500 ounces of silver from the El Gallo 1 mine. Using a silver to gold ratio of 75:1 for the year 2016, this represents projected consolidated production of 141,000 gold equivalent ounces. The silver to gold ratio is reviewed annually based on prevailing spot prices at the beginning of the year. The silver to gold ratio used for the year 2015 was 75:1, while the ratio used for 2014 was 60:1. |
|
· |
Consolidated cost guidance for 2016 is forecast at $760‑$800 per gold equivalent ounce for total cash costs and $915-$955 per gold equivalent ounce for all‑in sustaining costs. Total cash costs and all‑in sustaining costs at the San José mine are forecast at $760‑$800 per gold equivalent ounce and $970-$1,010, respectively, while at El Gallo 1 mine, forecast costs are $760‑$800 per gold equivalent ounce and $820‑$860 per gold equivalent ounce, respectively. These are based on a based on a silver to gold ratio of 75:1. |
|
· |
Consolidated gold equivalent ounces sold in year ended December 31, 2015 totaled 147,632 ounces. This includes 62,704 gold equivalent ounces from El Gallo 1 mine and 84,928 gold equivalent ounces attributable to us from our 49% interest in the San José mine. The year‑over‑year increase in gold equivalent ounces sold is the result of a significantly greater number of ounces sold at our El Gallo 1 mine during 2015, partially offset by fewer ounces sold from San José. |
|
· |
Consolidated average realized prices for the year 2015 were $1,146 per ounce of gold sold, and $15.06 per ounce of silver sold. In comparison, the consolidated average realized prices in 2014 were $1,248 per ounce of gold sold, and $17.68 per ounce of silver sold. The decrease year‑over‑year reflects the continued weakness of gold and silver prices that existed through 2015. Average realized prices are presented net of adjustments of provisionally priced sales of concentrates, from the San José mine. |
|
· |
A consolidated net loss of $20.5 million, or $0.07 per share for the year ended December 31, 2015, compared to a net loss of $311.9 million, or $1.05 per share in 2014. The net loss in 2015 was the result of after tax impairment charges recorded on our mineral property interests, property and equipment and investment in MSC for an aggregate of $48.4 million, which offset the 61% increase in revenue that resulted from higher volume of ounces of gold and silver sold during the year, and the 15% decrease in production costs. Production costs per ounce in 2015 was lower than in the previous year due to higher grades, cost savings efforts, and improved efficiencies in the tonnes produced at the El Gallo 1 mine. In comparison, the net loss reported during the year ended December 31, 2014 was mostly the result of impairment charges |
46
totaling $277.1 million to reflect the reduction in our planned exploration program, land optimization initiatives, and the decline in market value of comparable transactions observed in 2014. Further, during 2014 we recorded an impairment of $21.2 million relating to our investment in MSC, and incurred registration taxes of $6.8 million relating to intercompany financing agreements with certain of our subsidiaries. |
|
· |
Adjusted net loss for the year ended December 31, 2015 was $8.6 million, or $0.03 per share. This compares to an adjusted loss of $33.0 million, or $0.11 per share for 2014. Adjusted net loss removes the impact of impairment charges and foreign currency gains or losses resulting from the devaluation of the Argentine peso, Mexican peso and Canadian dollar relative to the U.S. dollar, as well as nonrecurring items such as registration taxes. The impact of the higher devaluation of the Argentine peso, particularly in December 2015, resulted in a $25.3 million gain in 2015 compared to a gain of $5.3 million in 2014. |
|
· |
Our consolidated earnings from mining operations for the year ended December 31, 2015 was $53.1 million, compared to $25.5 million in 2014. The increase in 2015 compared to 2014 was due to a higher number of ounces sold during the year at a lower production cost applicable to sales, on an individual basis, due to the higher grades and recoveries at our El Gallo 1 mine, previously discussed, which was offset by the lower average metal prices on sales realized in 2015. |
|
· |
$32.0 million in cash, investments and precious metals valued at the London PM Fix spot price and $3.4 million in short-term bank indebtedness at year-end. In comparison, we ended 2014 with $18.3 million in cash, investments and precious metals valued at the London PM Fix spot price, and no short-term bank indebtedness. For a reconciliation of precious metals valued at the London PM Fix spot price and cost, please see the discussion under “Non GAAP Financial Performance Measures” below, on page 61. |
Consolidated Performance
For the year ended December 31, 2015, our net loss was $20.5 million or $0.07 per share, compared to a net loss of $311.9 million or $1.50 per share in 2014, as a result of pre-tax impairment charges in 2015 of $50.6 million and $11.8 million recognized on our mineral property interests and property and equipment, and investment in MSC, respectively. In 2015 we produced 110,320 ounces of gold and 3,315,668 ounces of silver, compared to 84,851 ounces of gold and 3,195,733 ounces of silver in 2014. Production of gold increased as a result of higher grades mined and processed, and improved recoveries as a result of efficiencies obtained at our El Gallo 1 mine, which was reflected in the decrease of production costs applicable to sales to $34.6 million in 2015 from $40.6 million in 2014. Further, we recorded $2.4 million income from our Investment in MSC, compared to net loss of $5.3 million in the previous year.
Results of Consolidated Operations
Year ended December 31, 2015 compared to 2014
Revenue. Gold and silver sales increased by $27.7 million or 61% to $73.0 million from $45.3 million in 2014 due to higher number of ounces sold during the year at our El Gallo 1 mine, partially offset by a decrease in the average realized prices of gold and silver during the year. Sales of gold and silver by value for 2015 were approximately 51% gold and 49% silver, compared to 50% each in 2014.
Costs and Expenses. Total costs and expenses, excluding impairment charges, in the year ended December 31, 2015 totaled $60.0 million, compared to $80.6 million in 2014. The decrease was largely a result of reduced production costs as a result of higher grades mined and processed and higher recoveries from improvements and efficiencies at our El Gallo 1 mine, in addition to the cost savings efforts and the devaluation of the Mexican peso that occurred during the year. The reduction of exploration activities, lower mine construction costs and attributable income recognized from our investment in MSC also contributed to the decrease in costs and expenses when compared to 2014.
Production costs applicable to sales at the El Gallo 1 mine decreased by $6.0 million or 15% to $34.6 million in the year ended December 31, 2015, compared to $40.6 million in 2014. Although 75% more ounces were sold during 2015 compared to 2014, the reduction in mining costs is due to higher average grades resulting in a net decrease in production
47
costs applicable to sales. In 2014, production costs were also higher due to higher average strip ratio, higher haulage costs and operating challenges resulting from severe rainfalls that affected the El Gallo 1 mine during the third quarter of 2014.
Mine construction costs were $nil in the year 2015 compared to $1.7 million in 2014. Mine construction costs in 2014 primarily related to the El Gallo 1 processing capacity expansion, which was fully operational in the fourth quarter of 2014.
Mine development costs in the year ended December 31, 2015 decreased by $0.7 million or 36% to $1.2 million, from $1.9 million in 2014. Mine development costs relate to engineering and development expenditures of $0.8 million and $0.4 million incurred at El Gallo 2 and the Gold Bar project, respectively. Development expenditures at the Gold Bar project were incurred during the fourth quarter of 2015, when the positive feasibility study was completed.
Exploration costs in 2015 decreased by $2.5 million or 22% to $8.8 million from $11.3 million in 2014, reflecting the continuous reduction in exploration expenditures and drilling activities across most projects, in an effort to conserve capital. During the year 2015, we incurred $1.2 million in exploration costs in Argentina primarily relating to basic geological and environmental work on the Los Azules Project, compared to $2.5 million in 2014. For Mexico, during the year 2015, we spent $4.5 million on exploration activities primarily at the El Gallo 1 mine, compared to $5.5 million in 2014. For Nevada, we incurred $2.5 million in exploration expenditures, which included the infill drilling program at the Gold Bar and drilling program at the Lucky Friday project completed during the year, compared to $5.5 million spent in 2014.
Property holding costs decreased by $2.0 million year‑over‑year, to $4.3 million in the year ended December 31, 2015, compared to $6.4 million in 2014, as a result of our decision during the second quarter of 2015, to drop non-essential claims particularly at our projects in Nevada, in order to reduce annual property holding costs. A pre-tax impairment charge of $29.7 million was also recognized as a result of this decision.
During 2015 we recognized income of $2.4 million from our investment in MSC, net of amortization of fair value increments. This compares to a loss of $5.3 million recognized during 2014. The change in MSC’s operating results during 2015, despite the decrease in revenue and average realized prices of gold and silver, was the result of inflation outpacing the devaluation of the Argentine Peso which was offset by MSC’s management efforts to maintain costs and the effect of the fair value increments that resulted in gains on revaluation of the deferred tax liability.
Further, during 2015 we recorded a $11.8 million impairment charge to our investment in MSC. The impairment was triggered by the significant decline of silver prices during the year, as well as a decline in the observed market value of comparable transactions in South America, indicating a potential significant decrease in the market price of the exploration properties owned by MSC. In comparison, we recorded a $21.2 million impairment charge on our investment in MSC during the year ended 2014.
During the year ended December 31, 2015, we recorded a total pre-tax impairment charge of $50.6 million to our mineral property interests located in Argentina, Nevada and Mexico, with a deferred income tax recovery of $13.9 million, for a net impairment charge of $36.7 million. In regards to the Los Azules project, a pre-tax impairment charge of $11.4 million was recorded as a result of the decrease in the estimated market value per pound of copper equivalent mineralized material from comparable transactions. In regards to our Nevada properties, pre-tax impairment charges of $20.8 million to the Gold Bar Complex, $14.9 million to the Tonkin Complex, and $1.4 million to the North Battle Mountain Complex, were recorded due to our decision to allow non-essential claims and portions of claims included in those areas to lapse therefore reducing the property holding costs related to them. In regards to our Mexican properties, a fair value analysis was performed to our the El Gallo 2 assets, including mineral property interest, land, surface ownership and construction-in-progress. Such analysis resulted in the carrying value of the asset being greater than its estimated fair value, for which a pre-tax impairment charge of $2.0 million was recognized and allocated to construction-in-progress.
By comparison, for the year ended December 31, 2014, a total of $353.7 million impairment charge was recorded, which included $228.3 million to the Los Azules project, $98.4 million to the Nevada properties, and $27.0 million to our Argentina properties. The impairment of Los Azules was triggered by the contemporaneous sale of a copper project located in Argentina, which we believed shared similarities with Los Azules, and the decline in the observed market value of comparable transactions observed in 2014. The impairment of the Nevada and Argentina properties, was primarily a result
48
of significant declines in the estimated market value of comparable transactions noted as part of our year‑end annual impairment analysis, which indicated a decrease in the market value of our properties, as well as the strategic review of our exploration program, pursuant to which we have made the decision to focus primarily on core assets, namely our Los Azules, Gold Bar, Tonkin and North Battle Mountain properties. Further, these events resulted in a total deferred income tax recovery of $76.6 million.
Other income (expenses). Other income in the year ended December 31, 2015 totaled $2.4 million, mainly related to insurance proceeds receivable related to the theft of gold in concentrate stolen from our refinery in Mexico, in April 2015. These proceeds were collected on July 16, 2015 and were offset by $0.5 million of stamp tax and penalties accrued for certain of our subsidiaries. In addition, we reported a $1.9 million gain on foreign exchange as a result of the devaluation of the Mexican Peso and Canadian dollar observed during the year. In 2014, other expenses consisted of $6.8 million in registration taxes payable in relation to intercompany financing agreements with certain of our subsidiaries, and $2.4 million foreign exchange loss.
Recovery of income taxes. Recovery of income taxes was $24.6 million in 2015, compared to $107.2 million in 2014. The decrease in income tax recovery is due to lower tax recoveries of $13.9 million recorded in 2015 as a result of the impairments previously discussed and a tax recovery of $9.4 million resulting from the devaluating Argentine peso on peso‑denominated deferred income tax liabilities. By comparison, recovery of income taxes for the year ended December 31, 2014 included tax recoveries of $76.6 million related to impairments, $23.6 million related to the devaluation of Argentine peso and $5.8 million resulting from the tax effect of temporary differences related to exploration expenditures incurred in Argentina in prior years and deductible for tax purposes in 2014.
Year ended December 31, 2014 compared to 2013
Revenue. Gold and silver sales in the year ended December 31, 2014 totaled $45.3 million, compared to $46.0 million in 2013. The decrease was driven by the decrease in average realized metals prices, which more than offset the increase in ounces sold from our El Gallo 1 mine.
Costs and Expenses. Total costs and expenses, excluding impairment charges, in the year ended December 31, 2014 totaled $80.6 million, compared to $87.5 million in 2013. The decrease was largely a result of reduced exploration costs and general and administrative expenses, partly offset by higher production costs applicable to sales. The 2013 period also included a loss on disposal of $6.8 million relating to the sale of certain Nevada properties.
Production costs applicable to sales at the El Gallo 1 mine were $40.6 million in the year ended December 31, 2014, compared to $34.6 million in 2013. While the increase was partly a reflection of the higher number of ounces sold, production costs applicable to sales on a per ounce basis also increased due to higher average strip ratio, higher haulage cost and operating challenges due to severe rainfalls in 2014, topped with a $2.0 million inventory write‑down, and expenditures of $0.4 million to repair and improve the integrity of the excess pond liners and foundation of the ADR plant, as well as to provide a higher margin of safety in the event of extraordinary rainfall.
Mine construction costs were $1.7 million in the year 2014 compared to $1.4 million in 2013. Mine construction costs both in 2014 and 2013 were primarily related to the El Gallo 1 processing capacity expansion, which was substantially completed in the second quarter of 2014, and fully operational in the fourth quarter of 2014.
Mine development costs, which are comprised of engineering and development costs for El Gallo 2, were $1.8 million in the year ended December 31, 2014, compared to $0.8 million in 2013, and included a payment of $1.4 million for the Land Use Change permit at the El Gallo 2 property, which was made in January 2014.
Exploration costs in the year 2014 decreased to $11.3 million from $24.8 million in 2013, reflecting a reduction in exploration and drilling activities across most projects in 2014 in an effort to conserve capital. During 2014, we incurred $2.5 million in exploration expenditures in Argentina, including basic geological work primarily on Los Azules. This compares to $14.8 million in exploration expenditures in 2013. For Mexico, in 2014 we spent $5.5 million in exploration expenditures in 2014, including approximately 76,500 ft. (23,325 m) of drilling primarily at the El Gallo 1 mine, compared to $6.7 million in 2013 for 89,650 ft. (27,334 m) of drilling. For Nevada, we spent $3.1 million in 2014 in exploration
49
expenditures, which include drilling of approximately 7,180 ft. (2,190 m) at the South Roberts project and 2,670 ft. (810 m) at the Grass Valley project, compared to $3.0 million in 2013.
Property holding costs increased year‑over‑year, to $6.4 million in 2014 from $4.6 million in 2013, due to an additional accrual of $1.4 million for our obligation relating to the long‑term trust fund required by the BLM for the closure of the Tonkin mine in Nevada. Our accrual for this obligation totaled $2.5 million at December 31, 2014. The liability was recorded in accounts payable and accrued liabilities on our Consolidated Balance Sheet as at December 31, 2014.
Loss on investment in MSC, net of amortization of fair value increments, during the year ended December 31, 2014 was $5.3 million, compared to income of $0.8 million in 2013. The decline in operating results is primarily a result of lower average realized prices in the 2014 period compared to 2013.
In 2014 we also recorded an impairment charge on our investment in MSC, which was triggered by the significant decline of silver prices during 2014, as well as a decline in the observed market value of comparable transactions in South America, indicating a potential significant decrease in the market price of the exploration properties owned by MSC. As the decline in the estimated fair value of our investment in MSC was considered other than temporary, we recorded an impairment charge of $21.2 million for the year ended December 31, 2014. This compares to an impairment of $95.9 million in the year 2013.
Impairment of mineral property interests for the year ended December 31, 2014 consisted of a pre-tax impairment charge of $353.7 million and a deferred income tax recovery of $76.6 million, compared to a pre-tax impairment charge of $63.0 million related to certain exploration properties in Santa Cruz, Argentina and Nevada, U.S.A., with a deferred income tax recovery of $14.6 million.
Other income (expenses). Other expenses in the year ended December 31, 2014 totaled $8.9 million, and primarily consisted of $6.8 million in registration taxes payable in relation to intercompany financing agreements with certain of our subsidiaries. The liability was recorded in accounts payable and accrued liabilities on our Consolidated Balance Sheet as at December 31, 2014. Timing of payment is yet to be determined.
Recovery of income taxes. Recovery of income taxes was $107.2 million in 2014, compared to $53.4 million in 2013. For 2014, income tax recovery included tax recoveries of $41.8 million, $31.6 million and $3.2 million relating to the impairments of the Los Azules, Nevada and Argentina properties, respectively. In addition, a tax recovery of $23.6 million due to the impact of the devaluating Argentine peso on peso‑denominated deferred income tax liabilities, and an adjustment of $5.8 million to record the tax effect of temporary differences related to exploration expenditures incurred in Argentina in prior years and deductible for tax purposes in future years, were recorded in the year ended December 31, 2014.
Total Cash Costs, All‑In Sustaining Costs, and All‑In Costs
Total cash costs for all of our operating properties on a consolidated basis for the year ended December 31, 2015 were $685 per gold equivalent ounce sold, based on a silver to gold ratio of 75:1, compared to $817 per gold equivalent ounce in 2014, based on a silver to gold ratio of 60:1. Using a 75:1 conversion ratio, total cash costs per gold equivalent ounce for the year 2014 would have been $886 per ounce.
On an aggregate basis, total cash costs decreased by $6.9 million or 6% to $101.1 million from $108.0 million in 2014. The decrease in total cash costs on an aggregate basis, despite the increase in ounces of gold produced and sold was a result of the decrease in total cash costs at the El Gallo 1 mine, partly offset by higher total cash costs at the San José Mine. In 2014 total cash costs at the El Gallo 1 mine were affected mainly by higher strip ratios as well as higher haulage costs resulting from an unusually heavier rainy season in 2014.
Consolidated all‑in sustaining costs, which include corporate general and administrative expenses not separately allocated to either the El Gallo 1 or San José mines, were $962 per gold equivalent ounce, compared to $1,198 per gold equivalent ounce in 2014, based on a silver to gold ratio of 60:1. Using a 75:1 conversion ratio, all‑in sustaining costs per gold equivalent ounce for 2014 would have been $1,300.
50
On an aggregate basis, all‑in sustaining costs decreased by $16.2 million or 10% from $158.3 million in 2014 to $142.1 million in 2015. Lower operating costs and lower stripping costs at the El Gallo 1 mine, as well as lower exploration and capital expenditures at the San Jose mine were partly offset by the increase in reclamation costs at the El Gallo 1 mine, and general and administrative expenses noted during 2015 compared to 2014.
Consolidated all‑in costs for the year ended December 31, 2015 were $1,055 per gold equivalent ounce sold, compared to $1,368 per gold equivalent ounce in 2014, based on a silver to gold ratio of 60:1. Using a 75:1 conversion ratio, all‑in costs per gold equivalent ounce for 2014 would have been $1,484.
On an aggregate basis, all‑in costs decreased by $25.1 million or 14% from $180.9 million in 2014 to $155.7 million in 2015, primarily as a result of lower holding costs, lower exploration costs mainly at our Los Azules and Santa Cruz exploration properties and lower construction and capital expenditures at our El Gallo 1 mine.
Results of Operations—El Gallo 1 mine
Overview
The following table sets out production totals, sales totals, total cash costs, and all‑in sustaining cash costs (on a gold equivalent basis) for the El Gallo 1 mine for the three months ended December 31, 2015 and 2014, and for the years ended December 31, 2015, 2014 and 2013. The mine achieved commercial production, for accounting purposes, after its initial gold pour in September 2012. For operational purposes, commercial production was declared as of January 1, 2013.
|
|
|
Three months ended |
|
Year ended |
|
|||||||||||
|
|
|
December 31, |
|
December 31, |
|
|||||||||||
|
|
|
2015 |
|
2014 |
|
2015 |
|
2014 |
|
2013 |
|
|||||
|
|
|
(in thousands, unless otherwise indicated) |
|
|||||||||||||
|
Tonnes of ore mined |
|
|
256 |
|
|
369 |
|
|
1,209 |
|
|
1,271 |
|
|
1,278 |
|
|
Average grade gold (gpt) |
|
|
3.58 |
|
|
2.20 |
|
|
3.37 |
|
|
1.40 |
|
|
1.31 |
|
|
Tonnes of ore processed |
|
|
279 |
|
|
522 |
|
|
1,128 |
|
|
1,462 |
|
|
1,255 |
|
|
Average grade gold (gpt) |
|
|
4.20 |
|
|
2.39 |
|
|
3.41 |
|
|
1.58 |
|
|
1.22 |
|
|
Gold ounces: |
|
|
|
|
|
|
|
|
|
|
|
|
|
|
|
|
|
Produced(3) |
|
|
11.0 |
|
|
14.1 |
|
|
63.0 |
|
|
38.2 |
|
|
30.7 |
|
|
Sold |
|
|
10.2 |
|
|
11.3 |
|
|
62.2 |
|
|
35.6 |
|
|
32.7 |
|
|
Silver ounces: |
|
|
|
|
|
|
|
|
|
|
|
|
|
|
|
|
|
Produced |
|
|
4.8 |
|
|
13.5 |
|
|
29.9 |
|
|
25.9 |
|
|
20.7 |
|
|
Sold |
|
|
4.4 |
|
|
8.0 |
|
|
35.9 |
|
|
19.4 |
|
|
22.7 |
|
|
Gold equivalent ounces(1): |
|
|
|
|
|
|
|
|
|
|
|
|
|
|
|
|
|
Produced(3) |
|
|
11.1 |
|
|
14.3 |
|
|
63.4 |
|
|
38.7 |
|
|
31.1 |
|
|
Sold |
|
|
10.3 |
|
|
11.4 |
|
|
62.7 |
|
|
35.9 |
|
|
33.1 |
|
|
Net sales |
|
$ |
11,411 |
|
$ |
13,683 |
|
$ |
72,956 |
|
$ |
45,303 |
|
$ |
45,982 |
|
|
Average realized price ($/ounce)(2): |
|
|
|
|
|
|
|
|
|
|
|
|
|
|
|
|
|
Gold |
|
$ |
1,111 |
|
$ |
1,203 |
|
$ |
1,163 |
|
$ |
1,263 |
|
$ |
1,389 |
|
|
Silver |
|
$ |
14.40 |
|
$ |
16.08 |
|
$ |
16.16 |
|
$ |
17.89 |
|
$ |
23.92 |
|
|
Total cash costs(2)(3) |
|
$ |
5,090 |
|
$ |
8,106 |
|
$ |
27,607 |
|
$ |
31,418 |
|
$ |
24,821 |
|
|
Total cash cost per gold equivalent ounce sold ($/ounce)(1)(2)(3) |
|
$ |
496 |
|
$ |
711 |
|
$ |
440 |
|
$ |
875 |
|
$ |
749 |
|
|
All‑in sustaining costs(2)(4) |
|
$ |
6,112 |
|
$ |
10,618 |
|
$ |
36,439 |
|
$ |
42,895 |
|
$ |
38,575 |
|
|
All‑in sustaining cost per gold equivalent ounce sold ($/ounce)(1)(2)(4) |
|
$ |
595 |
|
$ |
931 |
|
$ |
581 |
|
$ |
1,194 |
|
$ |
1,164 |
|
|
Silver : gold ratio(1) |
|
|
75 : 1 |
|
|
60 : 1 |
|
|
75 : 1 |
|
|
60 : 1 |
|
|
52 : 1 |
|
|
(1) |
Silver production presented as a gold equivalent. Gold equivalent ounces calculations are based on prevailing spot prices at the beginning of the year. The silver to gold ratio used for 2014 was 60:1, while the ratio for 2013 and prior was 52:1. For 2015, the silver to gold ratio has been set to 75:1. |
|
(2) |
Average realized prices, total cash costs, all‑in sustaining costs, and all‑in costs are non‑GAAP financial performance |
51
measures with no standardized definition under U.S. GAAP. See “Non‑GAAP Financial Performance Measures” on page 61 for additional information, including definitions of these terms. |
|
(3) |
In 2013, the Company revised its allocation of general and administrative expenses to total cash costs to conform to the Gold Institute Production Cost standard. |
|
(4) |
In 2013, the Company adopted the new guidance on all‑in sustaining and all‑in costs published by the World Gold Council on June 27, 2013. |
Production
Due to the 116% increase in the grade of ore processed in 2015 compared to 2014, we decided to adjust our plan to lower the number of tonnes mined and processed during the year, which therefore resulted in a decrease of 5% in tonnes mined and 23% in tonnes processed, when compared to the year 2014. Despite the lower number of tonnes mined and processed, production at the El Gallo 1 mine for the year ended December 31, 2015 increased by 64% to 63,366 gold equivalent ounces, from 38,643 gold equivalent ounces in 2014, exceeding the 2015 adjusted production guidance of 62,000 gold equivalent ounces announced in September 2015.
Grades of ore processed during the year ended December 31, 2015 averaged 3.41 g/t, compared to 1.58 g/t in 2014. In the fourth quarter of 2015, grades of ore processed averaged 4.2 g/t compared to 2.39 g/t obtained in the same period of 2014.
Tonnes mined represent tonnes of ore extracted, while tonnes processed represent tonnes of ore crushed and placed on the leach pads. The difference between tonnes mined of 1,208,738 and tonnes processed of 1,127,764 were added to the existing stockpile inventory. Due to long process cycles, actual recoveries from the heap are difficult to measure and may fluctuate significantly based on the timing, quantity and metallurgical attributes of new mineralized material placed on the leach pads, among other variables. The cumulative recovery rate for gold production from September 1, 2012 (start of production at the El Gallo 1 mine) to December 31, 2015 is estimated at 56%.
Sales
For the year ended December 31, 2014, sales from the El Gallo 1 amounted to $73.0 million, a 131% increase compared to $45.3 million in 2014. The increase was the result of 75% more ounces of gold and 85% more ounces of silver sold during the year, partly offset by a decrease in the average realized price of gold and silver of 8% and 10% respectively. The average realized price of gold was $1,163 per ounce in 2015, compared to $1,263 per ounce in 2014, while the average realized price of silver was $16.16 per ounce in 2015, compared to $17.89 in 2014.
Total Cash Costs and All‑In Sustaining Costs
Total cash costs per gold equivalent ounce sold for the El Gallo 1 mine for the year ended December 31, 2015 decreased to $440 per ounce, compared to $875 per ounce in 2014. On an aggregate basis, total cash costs in 2015 decreased by 12% to $27.6 million, compared to $31.4 million in 2014. The significant decrease in total cash costs is primarily due to an overall reduction in the cost per tonne mined during the year, coupled with higher grades processed that resulted in a greater number of gold equivalent ounces produced and sold. Total cash costs were below the updated 2015 guidance of $500‑$600 per gold equivalent ounces primarily as a result of the average higher grade processed of 3.41 g/t compared to a forecast of 2.60 g/t for 2015.
All‑in sustaining costs per gold equivalent ounce for the year ended December 31, 2015 were $581 compared to $1,194 per ounce in 2014. The 51% lower all-in cash cost per gold equivalent ounce is attributable to higher average grades processed during 2015 and higher number of gold equivalent ounces sold compared to the prior year. Despite the higher number of gold equivalent ounces sold in 2015, on an aggregate basis all‑in sustaining costs decreased by 15% to $36.4 million in 2015, compared to $42.9 million in 2014. All‑in sustaining costs were also below the updated 2015 guidance of $700‑$800 per gold equivalent ounces primarily as a result of the average higher grade processed, as noted above.
52
2016 Guidance
For 2016, the El Gallo 1 mine is forecast to produce approximately 52,000 gold equivalent ounces (51,500 gold ounces and 37,500 silver ounces, using a silver to gold ratio of 75:1). Total cash costs and all‑in sustaining costs per gold equivalent ounce are expected to be between $760‑$800 per ounce and $820-860 per ounce, respectively.
Results of Operations—MSC (on a 100% basis)
Overview
The following discussion relates only to MSC. The following table sets out production totals, sales totals, total cash costs and all‑in sustaining costs (on a co‑product and gold equivalent basis) for the San José mine for the periods presented, on a 100% basis. Also included below are the production figures on a 49% attributable basis. As noted in Note 2, Summary of Significant Accounting Policies—Investments, we account for investments over which we exert significant influence but do not control through majority ownership using the equity method of accounting. In applying the equity method of accounting to our 49% Investment in MSC, MSC’s financial statements, which are originally prepared in accordance with International Financial Reporting Standards as issued by the International Accounting Standards Board, have been adjusted
53
to conform with U.S. GAAP. As such, the summarized financial data presented under this heading is presented in accordance with U.S. GAAP.
|
|
|
Three months ended |
|
Year ended |
|
|||||||||||
|
|
|
December 31, |
|
December 31, |
|
|||||||||||
|
|
|
2015 |
|
2014 |
|
2015 |
|
2014 |
|
2013 |
|
|||||
|
|
|
(in thousands, unless otherwise indicated) |
|
|||||||||||||
|
San José Mine—100% |
|
|
|
|
|
|
|
|
|
|
|
|
|
|
|
|
|
Tonnes of ore mined |
|
|
148 |
|
|
161 |
|
|
507 |
|
|
539 |
|
|
550 |
|
|
Average grade (gpt): |
|
|
|
|
|
|
|
|
|
|
|
|
|
|
|
|
|
Gold |
|
|
7.00 |
|
|
6.11 |
|
|
6.73 |
|
|
6.06 |
|
|
6.7 |
|
|
Silver |
|
|
511 |
|
|
490 |
|
|
505 |
|
|
448 |
|
|
462 |
|
|
Tonnes of ore processed |
|
|
155 |
|
|
153 |
|
|
532 |
|
|
571 |
|
|
537 |
|
|
Average grade (gpt): |
|
|
|
|
|
|
|
|
|
|
|
|
|
|
|
|
|
Gold |
|
|
6.63 |
|
|
6.19 |
|
|
6.36 |
|
|
5.77 |
|
|
6.42 |
|
|
Silver |
|
|
453 |
|
|
454 |
|
|
448 |
|
|
404 |
|
|
425 |
|
|
Average recovery (%): |
|
|
|
|
|
|
|
|
|
|
|
|
|
|
|
|
|
Gold |
|
|
89.3 |
|
|
89.6 |
|
|
88.8 |
|
|
88.8 |
|
|
89.2 |
|
|
Silver |
|
|
88.6 |
|
|
87.8 |
|
|
87.5 |
|
|
87.2 |
|
|
86.7 |
|
|
Gold ounces: |
|
|
|
|
|
|
|
|
|
|
|
|
|
|
|
|
|
Produced |
|
|
29.4 |
|
|
27.0 |
|
|
96.6 |
|
|
94.0 |
|
|
99.0 |
|
|
Sold |
|
|
23.2 |
|
|
30.0 |
|
|
88.8 |
|
|
91.0 |
|
|
95.0 |
|
|
Silver ounces: |
|
|
|
|
|
|
|
|
|
|
|
|
|
|
|
|
|
Produced |
|
|
1,994 |
|
|
1,959 |
|
|
6,706 |
|
|
6,469 |
|
|
6,357 |
|
|
Sold |
|
|
1,604 |
|
|
2,163 |
|
|
6,340 |
|
|
6,316 |
|
|
6,278 |
|
|
Gold equivalent ounces(1): |
|
|
|
|
|
|
|
|
|
|
|
|
|
|
|
|
|
Produced |
|
|
56.0 |
|
|
60.0 |
|
|
186.0 |
|
|
202.0 |
|
|
221 |
|
|
Sold |
|
|
44.6 |
|
|
66.0 |
|
|
173.3 |
|
|
197.0 |
|
|
215 |
|
|
Net sales |
|
$ |
44,989 |
|
$ |
64,627 |
|
$ |
186,095 |
|
$ |
212,013 |
|
$ |
240,723 |
|
|
Gross average realized price ($/ounce)(2): |
|
|
|
|
|
|
|
|
|
|
|
|
|
|
|
|
|
Gold |
|
$ |
1,060 |
|
$ |
1,165 |
|
$ |
1,120 |
|
$ |
1,236 |
|
$ |
1,284 |
|
|
Silver |
|
$ |
14.00 |
|
$ |
15.49 |
|
$ |
15.05 |
|
$ |
17.68 |
|
$ |
21.26 |
|
|
Total cash costs(2) |
|
$ |
34,100 |
|
$ |
46,856 |
|
$ |
149,937 |
|
$ |
156,224 |
|
$ |
169,091 |
|
|
Total cash costs per ounce sold ($/ounce)(2)(3): |
|
|
|
|
|
|
|
|
|
|
|
|
|
|
|
|
|
Gold |
|
$ |
764 |
|
$ |
812 |
|
$ |
871 |
|
$ |
874 |
|
$ |
876 |
|
|
Silver |
|
$ |
10.22 |
|
$ |
10.36 |
|
$ |
11.45 |
|
$ |
12.11 |
|
$ |
13.71 |
|
|
Gold equivalent(1) |
|
$ |
765 |
|
$ |
708 |
|
$ |
865 |
|
$ |
795 |
|
$ |
785 |
|
|
All‑in sustaining costs(2) |
|
$ |
43,217 |
|
$ |
67,767 |
|
$ |
192,633 |
|
$ |
213,384 |
|
$ |
228,080 |
|
|
All‑in sustaining costs per ounce sold ($/ounce)(2)(4): |
|
|
|
|
|
|
|
|
|
|
|
|
|
|
|
|
|
Gold |
|
$ |
969 |
|
$ |
1,174 |
|
$ |
1,119 |
|
$ |
1,193 |
|
$ |
1,182 |
|
|
Silver |
|
$ |
12.95 |
|
$ |
14.98 |
|
$ |
14.72 |
|
$ |
16.54 |
|
$ |
18.49 |
|
|
Gold equivalent(1) |
|
$ |
970 |
|
$ |
1,024 |
|
$ |
1,111 |
|
$ |
1,086 |
|
$ |
1,058 |
|
|
Silver : gold ratio(1) |
|
|
75 : 1 |
|
|
60:1 |
|
|
75 : 1 |
|
|
60:1 |
|
|
52:1 |
|
|
McEwen Mining—49% attributable share |
|
|
|
|
|
|
|
|
|
|
|
|
|
|
|
|
|
Ounces produced: |
|
|
|
|
|
|
|
|
|
|
|
|
|
|
|
|
|
Gold |
|
|
14.0 |
|
|
13.0 |
|
|
47.4 |
|
|
46.0 |
|
|
48.0 |
|
|
Silver |
|
|
977 |
|
|
960 |
|
|
3,286 |
|
|
3,170 |
|
|
3,115 |
|
|
Gold equivalent(1) |
|
|
27.0 |
|
|
29.0 |
|
|
91.2 |
|
|
99.0 |
|
|
108.0 |
|
|
(1) |
Silver production is presented as a gold equivalent. Gold equivalent ounces calculations are based on prevailing spot prices at the beginning of the year. The silver to gold ratio used for 2015 was 75:1, while the ratio for 2014 was 60:1 and for 2013 was 52:1. For 2016, the silver to gold ratio has been maintained as 75:1. |
|
(2) |
Average realized prices, total cash costs, all‑in sustaining costs, and all‑in costs are non‑GAAP financial performance measures with no standardized definition under U.S. GAAP. See “Non‑GAAP Financial Performance Measures” on page 61 for additional information, including definitions of these terms. |
|
(3) |
In 2013, the Company revised its allocation of general and administrative expenses to total cash costs to conform to the Gold Institute Production Cost standard. |
54
|
(4) |
In 2013, the Company adopted the new guidance on all‑in sustaining and all‑in costs published by the World Gold Council on June 27, 2013. |
Production
Gold production for the year ended December 31, 2015, on a 100% basis, was 96,638 ounces, exceeding the 2015 guidance of 95,000 gold ounces by 2%, as a result of higher than forecast average gold grade processed during the year.
Silver production during 2015 on a 100% basis was 6,705,614 ounces, exceeding the 2015 guidance of 6,300,000 silver ounces by 6%. An increase in the number of silver ounces produced was driven by better than projected silver grades. Average silver grades in 2015 were 448 g/t compared to the 2015 guidance of 414 g/t.
Tonnes processed decreased by 7% to 532,488 tonnes in 2015 from 571,018 tonnes in 2014, as a result of a longer labour stoppage that totaled 18 days in 2015, 16 of which occurred during the first quarter of the year. Comparatively, labour interruptions at the mine in 2014 totaled eight days, primarily due to employee travel being affected by national strikes throughout Argentina.
Sales
For year ended December 31, 2015, net sales realized by MSC from the sale of gold and silver, on a 100% basis, decreased by 12% to $186.1 million from $212.0 million in 2014. The decrease in 2015 was primarily a result of lower average realized prices, coupled with the fewer number of ounces of gold sold in the year due to a strike that delayed the shipments at Puerto Deseado during December, compared to 2014. Sales volumes in 2015 were 88,792 ounces of gold and 6,339,684 ounces of silver, compared to 91,276 ounces of gold and 6,315,799 ounces of silver sold in 2014. Sales in the fourth quarter of 2015 were unusually low due to a strike that delayed the shipments at the port from which concentrate is typically shipped. The build‑up of concentrate inventory was resolved in the first quarter of 2016.
The average realized gross sale price for gold sold, after mark‑to‑market provisional price adjustments, discussed below, for the year ended December 31, 2015 was $1,120 per ounce, a decrease of 9% compared to $1,236 per ounce realized in 2014. In comparison, the average London P.M. fix price for gold was $1,160 per ounce in 2015, and $1,266 per ounce in 2014.
The average realized gross sale price for silver sold, after mark‑to‑market provisional price adjustments, for the year ended December 31, 2015 was $15.05 per ounce, a decrease of 11% compared to an average $17.68 per ounce realized in 2014. In comparison, the average London P.M. fix price for silver was $15.70 per ounce in 2015, and $19.08 per ounce in 2014.
The difference between the average gross realized sale price per ounce of gold and silver sold by MSC and the average London fix prices noted above is due to adjustments of certain provisionally priced shipments of concentrates. Certain sales are ‘provisionally priced’ where the selling price is subject to final adjustment at the end of a period, normally ranging from 15 to 90 days after the start of the delivery process to the customer, based on the market price at the relevant quotation point stipulated in the contract. Sales revenue on provisionally priced sales of concentrates is recognized based on estimates of the final pricing receivable, which in turn are based on relevant forward market prices. At each reporting date, provisionally priced metal is marked to market based on the forward selling price for the quotational period of the sales contract.
Total Cash Costs and All‑In Sustaining Costs
Total cash costs for the San José mine per gold equivalent ounce sold for the year ended December 31, 2015 were within the 2015 guidance range of $775‑875 per gold equivalent ounce, ending at $865 per ounce based on a 75:1 ratio, compared to $795 per ounce sold in 2014 based on a silver to gold ratio of 60:1, or $890 based on a 75:1 ratio. On a co‑product basis (gold and silver), total cash costs for the year ended December 31, 2015 were $871 per ounce of gold, and $11.45 per ounce of silver, compared to $874 per ounce of gold and $12.11 per ounce of silver in 2014.
55
Total cash costs on an aggregate basis decreased to $149.9 million from $156.2 million, reflecting lower sales volume in the year 2015 compared to 2014, as well as higher inventory levels due to delay in the shipment of concentrate during December, as a result of the strike at Puerto Deseado previously mentioned.
All‑in sustaining costs were below the 2015 guidance range of $1,175‑1,275 per gold equivalent ounce, due to significant reductions in capital and exploration expenditures as part of MSC’s continued cost cutting measures. All‑in sustaining cash costs per gold equivalent ounce sold for the year ended December 31, 2015 were $1,111 per ounce based on a 75:1 ratio, compared to $1,086 per ounce in 2014 based on a silver to gold ratio of 60:1, or $1,216 based on a 75:1 ratio. On a co‑product basis, all‑in sustaining costs for the year ended December 31, 2015 were $1,119 per ounce of gold, compared to $1,193 per ounce in 2014, and $14.72 per ounce of silver, compared to $16.54 per ounce in 2014.
On an aggregate basis, all‑in sustaining costs decreased year‑over‑year by 10% from $213.4 million to $192.6 million due to significant reductions in capital and exploration expenditures as part of MSC’s continued cost cutting measures.
2016 Guidance
We expect 2016 production at MSC, on a 100% basis, to be approximately 6.7 million ounces of silver and 92,000 ounces of gold, for a 49% share attributable to us of approximately 89,000 gold equivalent ounces (3.3 million ounces of silver and 45,000 ounces of gold, using a silver to gold ratio of 75:1). The decrease in forecast production for 2016 compared to 2015 reflects a slight decrease in the expected average grade of gold. Total cash costs and all‑in sustaining costs per gold equivalent ounce are expected to be between $760‑$800 per ounce and $970‑$1,010 per ounce, respectively.
Investment in MSC (49%)
Our 49% attributable share of operations from our investment in MSC was income of $2.4 million for the year ended December 31, 2015, compared to a net loss of $5.3 million in 2014. The income of $2.4 million for the year ended December 31, 2015 is net of the amortization of the fair value increments arising from the purchase price allocation recorded as part of the acquisition of Minera Andes of $10.7 million and related deferred income tax recovery of $15.9 million. Included in the income tax recovery is the impact of fluctuations in the exchange rate between the Argentine peso and the U.S. dollar on the peso‑denominated deferred tax liability associated with the investment in MSC recorded as part of the acquisition of Minera Andes.
A summary of the financial results from MSC, including our 49% attributable share of operations from our investment in MSC, for the year ended December 31, 2015, 2014 and 2013, is as follows.
|
|
|
For the Year ended |
|
|||||||
|
|
|
December 31, |
|
|||||||
|
|
|
2015 |
|
2014 |
|
2013 |
|
|||
|
Minera Santa Cruz S.A. (100%) |
|
|
|
|
|
|
|
|
|
|
|
Net sales |
|
$ |
186,095 |
|
$ |
213,013 |
|
$ |
240,723 |
|
|
Production costs applicable to sales |
|
|
(158,615) |
|
|
(173,274) |
|
|
(190,281) |
|
|
Net (loss) income |
|
|
(5,835) |
|
|
(5,300) |
|
|
4,338 |
|
|
Portion attributable to McEwen Mining Inc. (49%) |
|
|
|
|
|
|
|
|
|
|
|
Net (loss) income |
|
$ |
(2,859) |
|
$ |
(2,597) |
|
$ |
2,126 |
|
|
Amortization of fair value increments |
|
|
(10,669) |
|
|
(13,190) |
|
|
(18,424) |
|
|
Income tax recovery |
|
|
15,942 |
|
|
10,503 |
|
|
17,144 |
|
|
Income (loss) from investment in MSC, net of amortization |
|
$ |
2,414 |
|
$ |
(5,284) |
|
$ |
846 |
|
During the year ended December 31, 2015, we received $0.5 million in dividends from MSC, compared to $9.5 million in 2014.
56
Changes in our investment in MSC for the year ended December 31, 2015 and 2014 are as follows:
|
|
|
2015 |
|
2014 |
|
||
|
Investment in MSC, beginning balance |
|
$ |
177,018 |
|
$ |
212,947 |
|
|
Attributable net (loss) income from MSC |
|
|
(2,859) |
|
|
(2,597) |
|
|
Amortization of fair value increments |
|
|
(10,669) |
|
|
(13,190) |
|
|
Income tax recovery |
|
|
15,942 |
|
|
10,503 |
|
|
Dividend distribution received |
|
|
(548) |
|
|
(9,483) |
|
|
Impairment of investment in MSC |
|
|
(11,777) |
|
|
(21,162) |
|
|
Investment in MSC, ending balance |
|
$ |
167,107 |
|
$ |
177,018 |
|
During the year ended December 31, 2015 we recorded a $11.8 million impairment charge on our investment in MSC, as discussed above.
As at December 31, 2015, MSC had current assets of $95.3 million, total assets of $486.3 million, current liabilities of $38.8 million and total liabilities of $145.3 million. These balances include the increase in fair value and amortization of the fair value increments arising from the purchase price allocation and are net of the impairment charges. Excluding the fair value increments from the purchase price allocation and impairment charges, MSC had current assets of $91.1 million, total assets of $282.5 million, current liabilities of $44.4 million, and total liabilities of $79.5 million as at December 31, 2015.
Advanced-stage Properties
Advanced-stage properties consist of properties for which a feasibility study has been completed indicating the presence of mineralized material, and that have obtained or are in the process of obtaining the required permitting. Our designation of certain properties as “Advanced-stage Properties” should not suggest that we have proven or probable reserves at those properties as defined by the SEC Industry Guide 7.
In addition, as described under Critical Accounting Policies section below, we define “Mine Development Costs” as the costs incurred to design and construct mining and processing facilities, including engineering and metallurgical studies, drilling, and other related costs to delineate an ore body, and the removal of overburden to initially expose an ore body at open pit surface mines. Since no proven and probable reserves have been established on any of our properties except for our 49% interest in the San José mine, mine development costs are not capitalized at any of the our properties, but rather are expensed as incurred, and allocated within “Mine Development Costs” in the Consolidated Statement of Operations and Comprehensive Loss.
Advanced-stage Properties – Nevada, U.S.
Gold Bar Project
Gold Bar is located primarily on public lands managed by the BLM. During 2015, we spent $1.3 million, primarily for the advancement and completion of the Environmental Impact Study (“EIS”), as well as an infill drill program of approximately 13,300 ft. (4,000 m). The 2015 Gold Bar drilling results were incorporated into an updated Mineral Resource Estimate and Feasibility Study, released on October 21, 2015, with key estimates including initial capital of $60 million; after-tax internal rate of return of 20% at current gold price; average annual gold production of 65,000 ounces; and an estimated average all-in cost of $728 per ounce. The complete report was filed on December 7, 2015, and is available electronically under our issuer profile on SEDAR at www.sedar.com, and at our website at www.mcewenmining.com.
In 2015, we performed a strategic review of our mineral property interests in Nevada, including the Gold Bar Project. A decision was made to allow certain non-essential claims and portions of claims to lapse on the September 1, 2015 renewal date, which allowed us to reduce property holding costs that otherwise would have been incurred in the third quarter of 2015. This resulted in a pre-tax impairment charge of $20.8 million for the Gold Bar project recognized in the Statement of Operations and Comprehensive Loss for the year ended December 31, 2015.
57
We continue to advance the permitting process for construction and production at Gold Bar. Formal notice from the Bureau of Land Management states our Record of Decision (ROD) for the Gold Bar Environmental Impact Statement (EIS) is expected in January, 2017. The Company expects that all other applicable State and local permits will also be acquired within this timeframe. Once the ROD and permits are received and cultural mitigation is complete, the Company can begin mine construction, which is expected to take approximately 10-12 months to complete.
For 2016, we have budget approximately $8.3 million for our Nevada properties, including $0.9 million for holding costs. Gold Bar development activities will accelerate in 2016 in areas such as final design engineering for the process plant and conveyor stacker system necessary for State and Federal permit documents. The budget for Gold Bar development is $3.5 million. The exploration budget is $1.1 million totaling 16,000 ft. of drilling and Tonkin expenditures are budget for $0.3 million.
In January 2016, we executed an agreement with NV Gold Corporation, a unaffiliated corporation, to acquire the Afgan-Kobeh Project, for $0.4 million. Afgan-Kobeh consists of 109 mining claims located in Nevada and is located approximately 3 miles (5 km) from the Gold Bar project. Afgan-Kobeh also contains indicated resources of 3,206,000 tons with an average of 0.71gpt of gold, and inferred resources of 3,972,000 tons with an average of 0.48 gpt of gold. Exploration potential exists on the project which we expect to test in the second half of 2016.
Advanced-stage Properties - El Gallo Complex, México
El Gallo 1 mine
We completed the construction of the expansion of the El Gallo Mine 1 in April 2014 in order to increase capacity from a nominal 3,000 tonnes per day to 4,500 tonnes per day. Commissioning commenced during the second quarter of 2014, with the expansion fully operational by the fourth quarter of 2014. Increases in tonnes of ore mined and processed during 2015 reflect this increased capacity as well as the rental of a second crushing plant in the fourth quarter.
During 2015, we spent approximately $1.1 million in process improvements, sustaining and capital expenditures, including the leach pad expansion project. The leach pad expansion was initially expected to be completed during the fourth quarter of 2015, but was deferred to the first quarter of 2016.
For 2016, we are planning to spend approximately $3.3 million at the El Gallo 1 mine, $2.3 million of which relates to sustaining costs, and $1.0 million relates to capital expenditures including completion of the leach pad expansion mentioned above, as well as the excess pond berm, to be completed in the first half of 2016.
El Gallo 2 Project
As a result of changes in commodity prices since the publication of the technical report titled “El Gallo Complex Phase II Project, NI 43-101 Technical Report, Feasibility Study, Mocorito Municipality, Sinaloa, Mexico” with an effective date of September 10, 2012 (the “2012 Report”), we are of the view that there is no current feasibility study in respect of the El Gallo 2 project. We believe that the figures set out in the 2012 Report are historical in nature and should not be relied on. We are currently evaluating such historical figures in contemplation of being able to produce an updated economic model for the El Gallo 2 project.
During, 2015, we spent $1.8 million in furthering studies on the feasibility and development of the El Gallo 2 project. For 2016, we have budget $0.3 million to continue with our cost-savings studies. These studies are intended to identify opportunities to reduce the initial capital investment required to start the project while minimizing the impact on production. Potential changes include reducing the number of leach tanks and transformers, building a smaller process plant / refinery, and using modular crushers. The $180 million of capital expenditures required in the El Gallo 2 Feasibility Study, has not been updated to reflect these possible changes.
Exploration Projects
Exploration Activities – Mexico
58
El Gallo Complex, Sinaloa, México
During 2015, one core drill was operating throughout the year at the El Gallo Complex, with a second drill added during April and May. In the third quarter of 2015 we changed drilling contractors based on equipment capabilities and lower overall costs, being able to reduce drilling costs as expected. Further, we completed 65,270 ft. (19,900 m) of drilling during the year, slightly below our adjusted projection of 73,470 ft. (22,400 m), and at a total cost of $3.4 million. The exploration program was focused on core drilling, blast hole drilling and surface mapping, which also includes rock and soil sampling.
For 2016, we have budget a total of $3.4 million for exploration activities at El Gallo Complex, from which $2.6 million are allocated to El Gallo 1, and $0.8 million to El Gallo 2. Our goal is to complete 58,400 ft (17,800 m) of drilling in the area.
Exploration Activities – Argentina
Los Azules Copper Project
The 2014-2015 exploration season started in December 2014 and was completed in March 2015. While no significant exploration work or drilling program was undertaken, we have continued to advance the project with baseline environmental and optimization studies. During 2015, we spent $0.7 million in further baseline environmental and optimization studies, and for 2016 we have a budget of $0.5 million for those activities at Los Azules.
Other Argentina Exploration Properties
On October 22, 2015 the Company and Hochschild entered into a vend-in agreement with MSC pursuant to which we agreed to vend-in our remaining Santa Cruz exploration properties, which did not have assigned any carrying value. The properties transferred, total approximately 100,600 hectares, and are located in the province of Santa Cruz. The agreement also contains a 2% net smelter return royalty payable to the Company or Hochschild based on any of MSC’s production from the respective mineral properties contributed by each party.
Exploration Activities at MSC
During 2015 a total of 70,140 ft. (21,380 m) of drilling were completed, from which 56,910 ft. (17,345 m) related to a combined infill and geologic management program around the Kospi targets located on the south side of the San Jose area. The remaining 13,230 ft. (4,035 m) of drilling related to the potential development program, which targeted the Maite/Matilde, Ria, and Juanita areas and the Huevos Verdes vein.
Liquidity and Capital Resources
As of December 31, 2015, we had working capital of $32.4 million, comprised of current assets of $54.4 million and current liabilities of $22.0 million. This represents a increase of approximately $16.8 million from the working capital balance of $15.6 million as of December 31, 2014. The increase in working capital is a direct result of the strong revenue generated by our El Gallo 1 mine property, which along with a lower production cost provided $15.6 million in operating cash inflows, including $0.5 million in dividends from MSC. Furthermore, in 2015 we collected $6.0 million in Value Added Taxes (“VAT”) receivable in Mexico.
We believe our working capital at December 31, 2015 is sufficient to fund ongoing operations, development and corporate activities over the next 12 months. Our sources of working capital at December 31, 2015 include cash flows from El Gallo 1 mine, dividends received from MSC, cash on hand and other current assets.
59
If we make a positive production decision to develop either of our advanced projects: Gold Bar or the El Gallo 2, we will need to raise additional capital of approximately $60 million or $150 million respectively (under existing estimates), given that their estimated capital cost significantly exceed our available working capital. In such case, we would explore several financing methods to complete the required development and construction stages, which may include incurring debt, issuing additional equity, equipment leasing and other forms of financing. Our ability to build either the Gold Bar or the El Gallo 2 projects is dependent on one or several of the alternatives being completed.
Net cash provided by operations for the year ended December 31, 2015 increased to $15.6 million compared to cash used in operations of $14.9 million in 2014. Our El Gallo 1 mine contributed $70.2 million in gold and silver sales to operating cash flows in the year 2015 compared to $43.8 million in 2014. As noted above, we received $0.5 million in dividends from our investment in MSC, compared to $9.5 million in 2014. However, these cash inflows were partly offset by cash paid to suppliers and employees of $55.2 million in 2015, compared to $69.0 million in 2014. Cash paid to suppliers and employees decreased year‑over‑year primarily due to lower level of exploration activities in the 2015 period than in 2014, as well as the cost saving measures and efforts taken by management.
Cash used in investing activities for the year ended December 31, 2015 was $1.9 million, as a result of additions to property, plant and equipment for our El Gallo 1 mine and marketable securities purchased during the year. In comparison, during 2014, cash provided by investing activities was $1.5 million, as a result of the collection of $5.2 million related to the reclamation bonding released in that year offset by additions to the ball mill needed for our El Gallo 2 project.
Cash provided by financing activities for the year ended December 31, 2015 was $0.1 million, resulting from the short-term bank indebtedness balance of $3.4 million obtained by our Mexican subsidiary, offset by $1.5 million used in return of capital payment and $1.8 million used in our share repurchase program. This compares to $2.3 million in 2014 obtained from the issuance of common shares due to the exercise of options from the Company’s incentive plan.
On January 13, 2016 our Mexican subsidiary paid the remaining balance of the short-term bank indebtedness in the amount of 58,248,899 Mexican Pesos (approximately $3.4 million as of December 31, 2015) and fulfilled its obligation. Upon the final payment, the short-term bank indebtedness was closed.
Contractual Obligations
The following table presents certain payments due by the Company under contractual obligations with minimum firm commitments as of December 31, 2015, and excludes amounts already recorded on the Consolidated Balance Sheet:
|
|
|
|
|
|
Payments due by period |
|
||||||||||||
|
|
|
|
|
|
Less than |
|
|
|
|
|
|
|
More than |
|
||||
|
Contractual Obligations |
|
Total |
|
1 year |
|
1‑3 years |
|
4‑5 years |
|
5 years |
|
|||||||
|
Operating Lease Obligations |
|
$ |
5,508 |
|
$ |
2,510 |
|
$ |
1,099 |
|
$ |
1,113 |
|
$ |
786 |
|
||
|
Purchase Obligations |
|
|
267 |
|
|
267 |
|
|
— |
|
|
— |
|
|
— |
|
||
|
Total |
|
$ |
5,775 |
|
$ |
2,777 |
|
$ |
1,099 |
|
$ |
1,113 |
|
$ |
786 |
|
||
Operating lease obligations include long‑term leases covering office space, exploration expenditures, option payments and option payments on properties.
Contingencies
We have surety bonds outstanding to provide bonding for our environmental reclamation obligations in the United States. These surety bonds are available for draw down by the BLM in the event we do not perform our reclamation obligations. If the specific reclamation requirements are met, the beneficiary of the surety bonds will cancel and/or return the instrument to the issuing entity. As of December 31, 2015, no liability has been recognized for our surety bonds of $4.8 million.
60
Off‑Balance Sheet Arrangements
As of December 31, 2015, we did not have any off‑balance sheet arrangements (as that phrase is defined by SEC rules applicable to this report) which have or are reasonably likely to have a material adverse effect on our financial condition, results of operations or liquidity.
Non‑GAAP Financial Performance Measures
In this report, we have provided information prepared or calculated according to U.S. GAAP, as well as provided some non‑U.S. GAAP financial performance measures. Because the non‑GAAP performance measures do not have any standardized meaning prescribed by U.S. GAAP, they may not be comparable to similar measures presented by other companies. These measures should not be considered in isolation or as substitutes for measures of performance prepared in accordance with GAAP. There are limitations associated with the use of such non‑GAAP measures. Since these measures do not incorporate revenues, changes in working capital and non‑operating cash costs, they are not necessarily indicative of operating profit or loss, or cash flow from operations as determined in accordance with U.S. GAAP.
Earnings (Loss) from Mining Operations
The term Earnings or Loss from Mining Operations used in this report is a non‑GAAP financial measure. We use and report this measure because we believe it provides investors and analysts with a useful measure of the underlying earnings or loss from our mining operations.
We define Earnings from Mining Operations as Gold and Silver Sales from our El Gallo 1 mine and our 49% attributable share of the San José mine’s Net Sales, less their respective Production Costs Applicable to Sales. To the extent that Production Costs Applicable to Sales may include depreciation and amortization expense related to the fair value increments on historical business acquisitions (fair value paid in excess of the carrying value of the underlying assets and liabilities assumed on the date of acquisition), we deduct this expense in order to arrive at Production Costs Applicable to Sales that only include depreciation and amortization expense incurred at the mine‑site level. The San José mine Net Sales and Production Costs Applicable to Sales are presented, on a 100% basis, in Note 6 of the accompanying financial statements.
61
The following table presents a reconciliation of Earnings from Mining Operations to Gross Profit, a GAAP financial measure.
|
|
|
Three months ended |
|
Year ended |
|
||||||||
|
|
|
December 31, |
|
December 31, |
|
||||||||
|
|
|
2015 |
|
2014 |
|
2015 |
|
2014 |
|
||||
|
El Gallo 1 Mine earnings from mining operations |
|
|
|
|
|
|
|
|
|
|
|
|
|
|
Gold and silver sales |
|
$ |
11,411 |
|
$ |
13,683 |
|
$ |
72,956 |
|
$ |
45,303 |
|
|
Production costs applicable to sales |
|
|
(5,695) |
|
|
(10,184) |
|
|
(34,607) |
|
|
(40,608) |
|
|
Gross profit |
|
|
5,716 |
|
|
3,499 |
|
|
38,349 |
|
|
4,695 |
|
|
Add: Amortization related to fair value increments on historical acquisitions included in Production Costs Applicable to Sales |
|
|
322 |
|
|
322 |
|
|
1,288 |
|
|
1,288 |
|
|
El Gallo 1 Mine earnings from mining operations |
|
|
6,038 |
|
|
3,821 |
|
|
39,637 |
|
|
5,983 |
|
|
San José earnings from mining operations (49% attributable basis) |
|
|
|
|
|
|
|
|
|
|
|
|
|
|
Net sales |
|
|
22,045 |
|
|
31,667 |
|
|
91,187 |
|
|
104,376 |
|
|
Production costs applicable to sales |
|
|
(18,951) |
|
|
(27,270) |
|
|
(77,721) |
|
|
(84,904) |
|
|
San José earnings from mining operations |
|
|
3,094 |
|
|
4,397 |
|
|
13,466 |
|
|
19,472 |
|
|
Consolidated earnings from mining operations |
|
|
9,132 |
|
|
8,218 |
|
|
53,103 |
|
|
25,455 |
|
Adjusted Net loss, and Adjusted Net Loss Per Share
The terms adjusted net loss and adjusted net loss per share used in this report are non‑GAAP financial measures. We use and report these measures because we believe they provide investors and analysts with useful measures of the underlying operating performance of our core mining business.
Adjusted net loss excludes the following items from net loss:
|
· |
impairment charges (including inventory and VAT receivable write‑downs, and impairments of long‑lived assets), and the related income tax recovery; |
|
· |
foreign currency gains and losses, including the impact of foreign currency fluctuations on our deferred income tax liabilities denominated in Argentine peso; and |
|
· |
other non‑recurring items, as applicable. |
62
The following table presents a reconciliation of Adjusted Net Loss to Net Loss, a GAAP financial measure.
|
|
|
Three months ended |
|
Year ended |
|
|||||||||||
|
|
|
December 31, |
|
December 31, |
|
|||||||||||
|
|
|
2015 |
|
2014 |
|
2015 |
|
2014 |
|
2013 |
|
|||||
|
Net loss |
|
$ |
(14,988) |
|
$ |
(212,775) |
|
$ |
(20,450) |
|
$ |
(311,943) |
|
$ |
(147,742) |
|
|
Write-down of VAT receivable |
|
|
— |
|
|
— |
|
|
— |
|
|
340 |
|
|
— |
|
|
Impairment of investment in MSC, net of income taxes |
|
|
11,777 |
|
|
21,162 |
|
|
11,777 |
|
|
21,162 |
|
|
95,878 |
|
|
Impairment of mineral property interests, net of income taxes |
|
|
18,721 |
|
|
179,159 |
|
|
36,684 |
|
|
277,100 |
|
|
48,322 |
|
|
Registration taxes on intercompany financing agreements (non-recurring) |
|
|
— |
|
|
76 |
|
|
— |
|
|
6,788 |
|
|
— |
|
|
(Gain) loss on sale of assets, net of income taxes |
|
|
— |
|
|
— |
|
|
(13) |
|
|
— |
|
|
4,268 |
|
|
Foreign currency (income) loss |
|
|
(2,272) |
|
|
1,487 |
|
|
(1,906) |
|
|
2,419 |
|
|
1,309 |
|
|
Portion of income on investment in MSC resulting from foreign currency fluctuations |
|
|
(17,690) |
|
|
1,053 |
|
|
(25,283) |
|
|
(5,263) |
|
|
(9,411) |
|
|
Portion of income tax recovery resulting from foreign currency fluctuations |
|
|
(6,502) |
|
|
94 |
|
|
(9,421) |
|
|
(23,601) |
|
|
(23,589) |
|
|
Adjusted net loss |
|
|
(10,954) |
|
|
(9,744) |
|
|
(8,612) |
|
|
(32,998) |
|
|
(30,965) |
|
|
Adjusted net loss per share - basic |
|
$ |
(0.04) |
|
$ |
(0.03) |
|
$ |
(0.03) |
|
$ |
(0.11) |
|
$ |
(0.10) |
|
|
Weighted average common shares outstanding (thousands) - basic |
|
|
300,107 |
|
|
299,009 |
|
|
300,341 |
|
|
297,763 |
|
|
297,001 |
|
Total Cash Costs, All‑In Sustaining Costs and All‑In Costs
The terms total cash costs, total cash cost per ounce, all‑in sustaining costs, all‑in sustaining cost per ounce, all‑in costs and all‑in cost per ounce used in this report are non‑GAAP financial measures. We report these measures to provide additional information regarding operational efficiencies both on a consolidated and an individual mine basis (San José mine and El Gallo 1 mine), and believe these measures provide investors and analysts with useful information about our underlying costs of operations. For the San José mine, where we hold a 49% share in the production through our 49% interest in MSC, we exclude the share of gold or silver production attributable to the controlling interest.
The measures of total cash costs and total cash cost per ounce are calculated in accordance with the Production Cost Standard developed by The Gold Institute, which was a worldwide association of suppliers of gold and gold products and included leading North American gold producers. The Gold Institute ceased operations in 2002, but we believe the standard is still the accepted standard of reporting cash costs of production in North America. Adoption of the standard is voluntary and the cost measures presented may not be comparable to other similarly titled measures of other companies.
The measures all‑in sustaining costs, all‑in sustaining costs per ounce, all‑in costs and all‑in costs per ounce were adopted by us in 2013, as we believe that these measures better represent the total costs associated with producing gold. We have adopted this reporting methodology based on the standard from the World Gold Council (as promulgated in their June 27, 2013 press release, World Gold Council’s Guidance Note on Non‑GAAP Metrics—All‑In Sustaining Costs and All‑In Costs). There is no assurance that these measures are necessarily comparable to our industry peers.
Total cash costs consists of mining, processing, on‑site general and administrative costs, community and permitting costs related to current operations, royalty costs, refining and treatment charges (for both doré and concentrate products), sales costs, export taxes and operational stripping costs, and exclude depreciation and amortization. In order to arrive at our consolidated total cash costs, we also include our attributable share of total cash costs from operations where we hold less than a 100% economic share in the production, such as MSC where we hold a 49% interest. The sum of these costs is divided by the corresponding gold equivalent ounces sold to determine a per ounce amount.
All‑in sustaining costs consists of total cash costs (as described above), plus environmental rehabilitation costs and amortization of the asset retirement costs related to operating sites, sustaining exploration and development costs, and sustaining capital expenditures. In order to arrive at our consolidated all‑in sustaining costs, we also include our attributable share of all‑in sustaining costs from operations where we hold less than a 100% economic share in the production, as well
63
as attributable corporate general and administrative expenses. The sum of these costs is divided by the corresponding gold equivalent ounces sold to determine a per ounce amount.
All‑in costs include community, permitting and reclamation and remediation costs not related to current operations, non‑sustaining exploration and development costs and non‑sustaining capital expenditures. As these costs do not relate to any particular producing operation, we divide the sum of these costs by the consolidated gold equivalent ounces sold, including our attributable share of any operation where we hold less than a 100% interest, and do not provide this measure on a per mine basis.
Costs excluded from total cash costs, sustaining all‑in sustaining costs and all‑in costs are income tax expense, all financing charges, costs related to business combinations, asset acquisitions and asset disposal, and any items that are deducted for the purpose of normalizing items, as described in Adjusted Net loss, and Adjusted Net Loss Per Share above.
For MSC, co‑product total cash costs and all‑in sustaining costs are calculated by dividing the respective proportionate share of the total cash costs, all‑in sustaining costs, and all‑in costs for each metal sold for the period by the ounces of each respective metal sold. The respective proportionate share of each metal sold is calculated based on their pro‑rated sales value. Approximately 52% of the value of the sales in the fourth quarter of 2015 was derived from gold and 48% was derived from silver. This compares to 51% and 49% for gold and silver, respectively, for the same period in 2014. For the year ended December 31, 2015, approximately 51% of the value of the sales was derived from gold and 49% from silver, compared to 50% and 50% in 2014, respectively.
The following tables reconcile these non‑GAAP measures to the most directly comparable GAAP measure, Production Costs Applicable to Sales. Total cash costs, all‑in sustaining costs, all‑in costs and ounces of gold and silver sold for the San José mine are provided to us by MSC.
|
|
|
Three months ended |
|
Year ended |
|
||||||||
|
|
|
December 31, |
|
December 31, |
|
||||||||
|
|
|
2015 |
|
2014 |
|
2015 |
|
2014 |
|
||||
|
|
|
(in thousands, except per ounce) |
|
||||||||||
|
Production costs applicable to sales |
|
$ |
5,695 |
|
$ |
10,184 |
|
$ |
34,607 |
|
$ |
40,608 |
|
|
Less: Depreciation |
|
|
(322) |
|
|
(322) |
|
|
(1,288) |
|
|
(1,288) |
|
|
Less: Pre‑stripping costs for future pit access |
|
|
(698) |
|
|
(2,052) |
|
|
(6,408) |
|
|
(8,763) |
|
|
On‑site general and administrative expenses |
|
|
195 |
|
|
296 |
|
|
805 |
|
|
1,174 |
|
|
Property holding costs |
|
|
— |
|
|
— |
|
|
26 |
|
|
27 |
|
|
Other non‑cash adjustments |
|
|
220 |
|
|
— |
|
|
(135) |
|
|
(340) |
|
|
Total cash costs (El Gallo 1 Mine) |
|
$ |
5,090 |
|
$ |
8,106 |
|
$ |
27,607 |
|
$ |
31,418 |
|
|
McEwen’s share of MSC total cash costs (49%) |
|
|
16,709 |
|
|
22,959 |
|
|
73,469 |
|
|
76,550 |
|
|
Consolidated total cash costs |
|
$ |
21,799 |
|
$ |
31,065 |
|
$ |
101,076 |
|
$ |
107,968 |
|
|
Per gold equivalent ounce sold: |
|
|
|
|
|
|
|
|
|
|
|
|
|
|
Total cash costs (El Gallo 1 Mine) |
|
$ |
496 |
|
$ |
711 |
|
$ |
440 |
|
$ |
875 |
|
|
McEwen’s share of MSC total cash costs (49%) |
|
|
765 |
|
|
708 |
|
|
865 |
|
|
795 |
|
|
Consolidated total cash costs (including McEwen’s share of MSC) |
|
|
679 |
|
|
709 |
|
|
685 |
|
|
817 |
|
64
Reconciliation of All‑In Sustaining Costs to Total Cash Costs
|
|
|
Three months ended |
|
Year ended |
|
||||||||
|
|
|
December 31, |
|
December 31, |
|
||||||||
|
|
|
2015 |
|
2014 |
|
2015 |
|
2014 |
|
||||
|
|
|
(in thousands, except per ounce) |
|
||||||||||
|
Total cash costs (excluding McEwen’s share of MSC) |
|
$ |
5,090 |
|
$ |
8,106 |
|
$ |
27,607 |
|
$ |
31,418 |
|
|
Operating site reclamation accretion and amortization |
|
|
(20) |
|
|
200 |
|
|
936 |
|
|
802 |
|
|
On‑site exploration expenses |
|
|
344 |
|
|
260 |
|
|
1,488 |
|
|
1,592 |
|
|
Mine construction and capital expenditures (sustaining) |
|
|
— |
|
|
— |
|
|
— |
|
|
320 |
|
|
Pre‑stripping costs for future pit access |
|
|
698 |
|
|
2,052 |
|
|
6,408 |
|
|
8,763 |
|
|
All‑in sustaining costs (El Gallo 1 Mine) |
|
$ |
6,112 |
|
$ |
10,618 |
|
$ |
36,439 |
|
$ |
42,895 |
|
|
McEwen’s share of MSC all‑in sustaining costs (49%) |
|
|
21,176 |
|
|
33,206 |
|
|
94,390 |
|
|
104,558 |
|
|
Corporate general and administrative expenses |
|
|
3,089 |
|
|
2,784 |
|
|
11,240 |
|
|
10,895 |
|
|
Consolidated all‑in sustaining costs (including McEwen’s share of MSC) |
|
$ |
30,377 |
|
$ |
46,608 |
|
$ |
142,069 |
|
$ |
158,348 |
|
|
Per gold equivalent ounce sold: |
|
|
|
|
|
|
|
|
|
|
|
|
|
|
All‑in sustaining costs (El Gallo 1 Mine) |
|
$ |
595 |
|
$ |
931 |
|
$ |
581 |
|
$ |
1,194 |
|
|
McEwen’s share of MSC all‑in sustaining costs (49%) |
|
|
970 |
|
|
1,024 |
|
|
1,111 |
|
|
1,086 |
|
|
Consolidated all‑in sustaining costs (including McEwen’s share of MSC) |
|
|
946 |
|
|
1,063 |
|
|
962 |
|
|
1,198 |
|
Reconciliation of All‑In Costs to All‑In Sustaining Costs
|
|
|
Three months ended |
|
Year ended |
|
||||||||
|
|
|
December 31, |
|
December 31, |
|
||||||||
|
|
|
2015 |
|
2014 |
|
2015 |
|
2014 |
|
||||
|
|
|
(in thousands, except per ounce) |
|
||||||||||
|
Consolidated all‑in sustaining costs (including McEwen’s share of MSC) |
|
$ |
30,377 |
|
$ |
46,608 |
|
$ |
142,069 |
|
$ |
158,348 |
|
|
Property holding costs (non‑sustaining) |
|
|
275 |
|
|
1,797 |
|
|
4,310 |
|
|
6,338 |
|
|
Reclamation accretion and amortization (non‑operating sites) |
|
|
3 |
|
|
310 |
|
|
91 |
|
|
407 |
|
|
Exploration expenses (non‑sustaining) |
|
|
1,202 |
|
|
3,449 |
|
|
7,310 |
|
|
9,740 |
|
|
Mine development (non‑sustaining) |
|
|
720 |
|
|
75 |
|
|
1,169 |
|
|
3,264 |
|
|
Mine construction and capital expenditures (non‑sustaining) |
|
|
229 |
|
|
97 |
|
|
777 |
|
|
2,756 |
|
|
Consolidated all‑in costs (including McEwen’s share of MSC) |
|
$ |
32,806 |
|
$ |
52,336 |
|
$ |
155,726 |
|
$ |
180,853 |
|
|
Per gold equivalent ounce sold: |
|
|
|
|
|
|
|
|
|
|
|
|
|
|
Consolidated all‑in costs (including McEwen’s share of MSC) |
|
$ |
1,022 |
|
$ |
1,194 |
|
$ |
1,055 |
|
$ |
1,368 |
|
The following table summarizes the consolidated number of gold equivalent ounces sold used to calculate total cash costs, all‑in sustaining costs and all‑in costs on a per ounce basis, as discussed above. Gold equivalent ounces are calculated using an average silver to gold ratio of 60:1 for 2014.
|
|
|
Three months ended December 31, |
|
Year ended December 31, |
|
||||
|
|
|
2015 |
|
2014 |
|
2015 |
|
2014 |
|
|
Gold equivalent ounces sold (El Gallo 1 Mine) |
|
10,270 |
|
11,406 |
|
62,704 |
|
35,924 |
|
|
McEwen’s share of MSC gold equivalent ounces sold |
|
21,836 |
|
32,425 |
|
84,927 |
|
96,304 |
|
|
Consolidated gold equivalent ounces sold (including McEwen’s share of MSC) |
|
32,106 |
|
43,831 |
|
147,631 |
|
132,228 |
|
|
Silver : gold ratio |
|
75 : 1 |
|
60:1 |
|
75 : 1 |
|
60:1 |
|
Average realized prices
The term average realized price per ounce used in this report is also a non‑GAAP financial measure. We report this measure to better understand the price realized in each reporting period for gold and silver.
65
Average realized price is calculated as gross sales of gold and silver (excluding commercial deductions) over the number of net ounces sold in the period (net of deduction units).
The following table reconciles this non‑GAAP measure to the most directly comparable U.S. GAAP measure, Sales of Gold and Silver. Ounces of gold and silver sold for the San José mine are provided to us by MSC.
|
|
|
Three months ended December 31, |
|
||||||||||||||||
|
|
|
2015 |
|
2014 |
|
||||||||||||||
|
|
|
(in thousands, except ounce and per ounce) |
|
||||||||||||||||
|
|
|
El Gallo |
|
MSC |
|
|
|
|
El Gallo |
|
MSC |
|
|
|
|
||||
|
|
|
Phase 1 |
|
(49% interest) |
|
Total |
|
Phase 1 |
|
(49% interest) |
|
Total |
|
||||||
|
Gold sales |
|
$ |
11,347 |
|
$ |
12,030 |
|
$ |
23,377 |
|
$ |
13,555 |
|
$ |
17,207 |
|
$ |
30,762 |
|
|
Silver sales |
|
|
64 |
|
|
11,009 |
|
|
11,073 |
|
|
129 |
|
|
16,409 |
|
|
16,538 |
|
|
Gold and silver sales |
|
$ |
11,411 |
|
$ |
23,039 |
|
$ |
34,450 |
|
$ |
13,684 |
|
$ |
33,616 |
|
$ |
47,300 |
|
|
Gold ounces sold |
|
|
10,211 |
|
|
11,353 |
|
|
21,564 |
|
|
11,272 |
|
|
14,764 |
|
|
26,036 |
|
|
Silver ounces sold |
|
|
4,416 |
|
|
786,168 |
|
|
790,584 |
|
|
8,000 |
|
|
1,059,669 |
|
|
1,067,669 |
|
|
Gold equivalent ounces sold |
|
|
10,270 |
|
|
21,836 |
|
|
32,106 |
|
|
11,406 |
|
|
32,425 |
|
|
43,831 |
|
|
Average realized price per gold ounce sold |
|
$ |
1,111 |
|
$ |
1,060 |
|
$ |
1,084 |
|
$ |
1,203 |
|
$ |
1,165 |
|
$ |
1,182 |
|
|
Average realized price per silver ounce sold |
|
$ |
14.49 |
|
$ |
14.00 |
|
$ |
14.01 |
|
$ |
16.08 |
|
$ |
15.49 |
|
$ |
15.49 |
|
|
Average realized price per gold equivalent ounce sold |
|
$ |
1,111 |
|
$ |
1,055 |
|
$ |
1,073 |
|
$ |
1,200 |
|
$ |
1,037 |
|
$ |
1,079 |
|
|
|
|
Year ended December 31, |
|
||||||||||||||||
|
|
|
2015 |
|
2014 |
|
||||||||||||||
|
|
|
(in thousands, except ounce and per ounce) |
|
||||||||||||||||
|
|
|
El Gallo |
|
MSC |
|
|
|
|
El Gallo |
|
MSC |
|
|
|
|
||||
|
|
|
Phase 1 |
|
(49% interest) |
|
Total |
|
Phase 1 |
|
(49% interest) |
|
Total |
|
||||||
|
Gold sales |
|
$ |
72,377 |
|
$ |
48,745 |
|
$ |
121,122 |
|
$ |
44,956 |
|
$ |
55,268 |
|
$ |
100,224 |
|
|
Silver sales |
|
|
579 |
|
|
46,749 |
|
|
47,328 |
|
|
347 |
|
|
54,711 |
|
|
55,058 |
|
|
Gold and silver sales |
|
$ |
72,956 |
|
$ |
95,494 |
|
$ |
168,450 |
|
$ |
45,303 |
|
$ |
109,979 |
|
$ |
155,282 |
|
|
Gold ounces sold |
|
|
62,226 |
|
|
43,508 |
|
|
105,734 |
|
|
35,600 |
|
|
44,725 |
|
|
80,325 |
|
|
Silver ounces sold |
|
|
35,862 |
|
|
3,106,445 |
|
|
3,142,307 |
|
|
19,417 |
|
|
3,094,742 |
|
|
3,114,159 |
|
|
Gold equivalent ounces sold |
|
|
62,704 |
|
|
84,927 |
|
|
147,631 |
|
|
35,924 |
|
|
96,304 |
|
|
132,228 |
|
|
Average realized price per gold ounce sold |
|
$ |
1,163 |
|
$ |
1,120 |
|
$ |
1,146 |
|
$ |
1,263 |
|
$ |
1,236 |
|
$ |
1,248 |
|
|
Average realized price per silver ounce sold |
|
$ |
16.15 |
|
$ |
15.05 |
|
$ |
15.06 |
|
$ |
17.89 |
|
$ |
17.68 |
|
$ |
17.68 |
|
|
Average realized price per gold equivalent ounce sold |
|
$ |
1,163 |
|
$ |
1,124 |
|
$ |
1,141 |
|
$ |
1,261 |
|
$ |
1,142 |
|
$ |
1,174 |
|
Cash, investments and precious metals
The term cash, investments and precious metals used in this report is also a non‑GAAP financial measure. We report this measure to better understand our liquidity in each reporting period.
Cash, investments and precious metals is calculated as the sum of cash, investments and ounces of doré held in inventory, valued at the London PM Fix spot price at the corresponding period. The following table summarizes the calculation of cash, investments and precious metals amounts shown in this report:
|
|
|
Year ended |
||||
|
|
|
December 31, |
||||
|
|
|
2015 |
|
2014 |
||
|
Cash |
|
$ |
25,874 |
|
$ |
12,380 |
|
Investments |
|
|
1,032 |
|
|
1,082 |
|
Precious Metals(1) |
|
|
5,065 |
|
|
4,875 |
|
Total cash, investments and precious metals |
|
$ |
31,971 |
|
$ |
18,337 |
66
|
(1) |
Precious Metals is calculated using the number of ounces held in inventory at the end of the year, and valued at the London PM Fix spot |
A reconciliation between precious metals valued at cost and precious metals valued at market value is described in the following table:
|
|
|
Year ended |
||||
|
|
|
December 31, |
||||
|
|
|
2015 |
|
2014 |
||
|
Precious Metals (note 4) |
|
$ |
1,820 |
|
$ |
2,403 |
|
Number of ounces of doré in inventory |
|
|
4,778 |
|
|
4,042 |
|
London PM Fix |
|
|
1,060 |
|
|
1,206 |
|
Precious Metals valued at market value |
|
$ |
5,065 |
|
$ |
4,875 |
Critical Accounting Policies
Listed below are the accounting policies that require significant judgments and estimates that we believe are critical to our consolidated financial statements.
Use of Estimates: The Company’s consolidated financial statements have been prepared in accordance with accounting principles generally accepted in the United States of America. The preparation of the Company’s consolidated financial statements requires the Company to make estimates and assumptions that affect the reported amounts of assets and liabilities and the related disclosure of contingent assets and liabilities at the date of the consolidated financial statements and the reported amounts of expenses during the reporting period. The more significant areas requiring the use of management estimates and assumptions relate to environmental, reclamation and closure obligations; estimates of fair value for asset impairments; estimates regarding the collectability of value added taxes receivable; valuation allowances for deferred tax assets; estimate of income tax provisions, reserves for contingencies and litigation; and estimates with respect to assumptions regarding stock-based compensation expense. The Company bases its estimates on historical experience and on various other assumptions that are believed to be reasonable under the circumstances. Actual results may differ significantly from these estimates.
Investments: The Company accounts for investments over which the Company exerts significant influence but does not control through majority ownership using the equity method of accounting pursuant to ASC Topic 323, Investments – Equity Method and Joint Ventures. Under this method, the Company’s share of earnings and losses is included in the Consolidated Statement of Operations and Comprehensive Loss and the balance of the investment is adjusted by the same amount. Under the equity method, dividends received from an investee are recorded as decreases in the investment account, not as income. If and when there has been a loss in value that is other than a temporary decline, the carrying value is reduced to its fair value.
Stockpiles, Material on Leach Pads, In‑process Inventory, Precious Metals Inventory and Materials and Supplies: Stockpiles, material on leach pads, in-process inventory, precious metals inventory and materials and supplies are carried at the lower of average cost or net realizable value. Net realizable value represents the estimated future sales price of the product based on current and long-term metals prices, less the estimated costs to complete production and bring the product to sale. Write-downs of stockpiles, material on leach pads, in-process inventory, precious metals inventory and materials and supplies, resulting from net realizable value impairments, are reported as a component of production costs applicable to sales. The current portion of stockpiles, material on leach pad, in-process inventory and materials and supplies is determined based on the expected amounts to be processed within the next 12 months. Stockpiles, material on leach pads, in‑process inventory and materials and supplies not expected to be processed within the next 12 months, if any, are classified as long‑term.
Stockpiles represent mineralized material that has been extracted from the mine and is available for further processing. Stockpiles are measured by estimating the number of tonnes added and removed from the stockpile, an estimate of the contained metals (based on assay data) and the estimated metallurgical recovery rates. Costs are allocated to stockpiles
67
based on relative values of material stockpiled and processed using current mining costs incurred up to the point of stockpiling the mineralized material. Material is removed from the stockpile at an average cost per tonne.
Mineralized material on leach pads is the ore that is placed on pads where it is treated with a chemical solution that dissolves the gold contained in the ore over a period of months. Costs are attributed to the ore on leach pads based on current mining costs incurred up to the point of placing the ore on the pad. Costs are removed from the leach pad inventory based on the average cost per estimated recoverable ounce of gold on the leach pad as the gold is recovered. The estimates of recoverable gold on the leach pads are calculated from the quantities of ore placed on the leach pads (measured tons added to the leach pads), the grade of ore placed on the leach pads (based on assay data) and a recovery percentage.
In general, leach pads recover between 50% and 95% of the recoverable ounces in the first year of leaching, declining each year thereafter until the leaching is complete. The cumulative metallurgical recovery rate for gold production at the El Gallo 1 mine from September 2012 (start of production) to December 31, 2015 was approximately 56% (2014 – 56%). Although the quantities of recoverable gold placed on the leach pads are reconciled by comparing the grades of ore placed on the pads to the quantities of gold actually recovered (metallurgical balancing), the nature of the leaching process inherently limits the ability to precisely monitor inventory levels. As a result, the metallurgical balancing process is constantly monitored and the engineering estimates are refined based on actual results over time.
In-process inventories represent materials that are currently in the process of being converted to a saleable product. In-process material is measured based on assays of the material fed into the process and the projected recoveries of the respective plants. Costs are allocated to in-process inventories based on the costs of the material fed into the process attributable to the source material coming from the mines, stockpiles and/or leach pads plus the in-process conversion costs incurred to that point in the process.
Precious metal inventories include gold and silver doré and bullion that is unsold and held at the Company’s or the refinery’s facilities. Costs are allocated to precious metal inventories based on costs of the respective in-process inventories incurred prior to the refining process plus applicable refining costs.
Materials and supplies inventories are comprised of chemicals, reagents and consumable parts used in drilling and other operating activities. They are valued at the lower of average cost or net realizable value. Cost includes applicable taxes and freight.
Proven and Probable Reserves: The definition of proven and probable reserves is set forth in SEC Industry Guide 7. Proven reserves are reserves for which (a) quantity is computed from dimensions revealed in outcrops, trenches, workings or drill holes, grade and/or quality are computed from the results of detailed sampling and (b) the sites for inspection, sampling and measurement are spaced so closely and the geological character is so well defined that size, shape, depth and mineral content of the reserves are well‑established. Probable reserves are reserves for which quantity and grade and/or quality are computed from information similar to that used for proven (measured) reserves, but the sites for inspection, sampling, and measurement are farther apart or are otherwise less adequately spaced. The degree of assurance, although lower than that for proven (measured) reserves, is high enough to assume continuity between points of observations.
As of December 31, 2015, except for the Company’s 49% interest in the San José mine, none of the Company’s properties contain resources that satisfy the definition of proven and probable reserves. The Company classifies the development of its properties, including the El Gallo 1 mine, as exploration stage projects since no proven or probable reserves have been established.
Property and Equipment: As described in Note 2, Summary of Significant Accounting Policies – Design, Construction and Development Costs below, substantially all costs, including design, engineering, construction, and installation of equipment are expensed as incurred as the Company has not established proven and probable reserves on any of its properties except for the Company’s 49% interest in the San José mine. Only certain types of equipment which has alternative uses or significant salvage value, may be capitalized without proven and probable reserves. Depreciation is computed using the straight-line method with the exception of mining equipment. Mining equipment is depreciated using the units-of-production method based on tonnes processed over the estimated total mine life. Office furniture, equipment and light vehicles are being depreciated over estimated economic lives ranging from 3 to 5 years. Leasehold improvements,
68
which relate to the Company’s corporate office, are being amortized over the term of the lease of 10 years. Trailers, heavy vehicles and other site equipment are being depreciated over estimated economic lives from 5 to 15 years. Buildings are being depreciated over an estimated economic life of 20 years.
Design, Construction, and Development Costs: Mine development costs include engineering and metallurgical studies, drilling and other related costs to delineate an ore body, and the removal of overburden to initially expose an ore body at open pit surface mines.
When proven and probable reserves as defined by SEC Industry Guide 7 exist, development costs are capitalized. Mine development costs incurred either to develop new ore deposits, expand the capacity of operating mines, or to develop mine areas substantially in advance of current production would be capitalized. Costs of start‑up activities and costs incurred to maintain current production or to maintain assets on a standby basis are charged to operations as incurred. If or when a project is abandoned, costs projects are charged to operations upon abandonment. All capitalized costs would be amortized using the units of production method over the estimated life of the ore body based on recoverable ounces to be mined from proven and probable reserves.
Certain costs to design and construct mining and processing facilities may be incurred prior to establishing proven and probable reserves. As no proven and probable reserves have been established on any of the Company’s properties except for the Company’s 49% interest in the San José mine, design, construction and development costs are not capitalized at any of the Company’s properties, and accordingly, substantially all costs are expensed as incurred. Additionally, the Company does not have a corresponding depreciation or amortization of these costs going forward since these expenditures were expensed as incurred as opposed to being capitalized.
Mineral Property Interests: Mineral property interests include acquired interests in advanced-stage properties and exploration stage properties, which are considered tangible assets. The amount capitalized relating to a mineral property interest represents its fair value at the time of acquisition, either as an individual asset purchase or as a part of a business combination. The value of mineral property interests is primarily driven by the nature and amount of mineralized material believed to be contained in the properties. When proven and probable reserves exist, the relevant capitalized costs and mineral property interests are to be charged to expense based on the units of production method and upon commencement of production. However, when a property does not contain mineralized material that satisfies the definition of proven and probable reserves, the amortization of the capitalized costs and mineral property interests are charged to expense based on the straight-line method over the estimated useful life of the mine, which according to the existing permits in place as of December 31, 2015 is estimated to end in late 2017. As a result of these and other differences, the Company’s financial statements will not be comparable to the financial statements of mining companies that have established reserves as defined by SEC Industry Guide 7.
Impairment of Assets: The Company reviews and evaluates its long-lived assets for impairment when events or changes in circumstances indicate that the related carrying amounts may not be recoverable. Mineral properties are monitored for impairment based on factors such as mineral prices, government regulation and taxation, the Company’s continued right to explore the area, exploration reports, assays, technical reports, drill results and its continued plans to fund exploration programs on the property.
For operating mines, recoverability is measured by comparing the undiscounted future net cash flows to the net book value. If the net book value exceeds future net undiscounted cash flows, an impairment loss is measured and recorded based on the excess of the net book value over fair value. Fair value for operating mines is determined using a combined approach, which uses a discounted cash flow model for the existing operations and a market approach for the fair value assessment of exploration land claims. Future cash flows are estimated based on quantities of recoverable mineralized material, expected gold and silver prices (considering current and historical prices, trends and related factors), production levels, operating costs, capital requirements and reclamation costs, all based on life-of-mine plans. The term “recoverable mineralized material” refers to the estimated amount of gold or other commodities that will be obtained after taking into account losses during processing and treatment of mineralized material. In estimating future cash flows, assets are grouped at the lowest level for which there are identifiable cash flows that are largely independent of future cash flows from other asset groups. The Company’s estimates of future cash flows are based on numerous assumptions and it is possible that actual future cash flows will be significantly different than the estimates, as actual future quantities of recoverable minerals,
69
gold, silver and other commodity prices, production levels and costs and capital are each subject to significant risks and uncertainties.
For exploration properties, the Company considers various methods to indicate fair value. In performing this assessment, the Company will evaluate project characteristics and level of advancement. Generally, when a feasibility study is available, the Company will consider undiscounted future net cash flow. This approach was taken to evaluate Gold Bar for impairment.
If the Company is unable to estimate undiscounted future net cash flow, the Company will adopt a market approach to estimate fair value by using a combination of observed market value per square mile and observed market value per ounce or pound of mineral material based on comparable transactions. This approach was adopted in testing the following properties for impairment: Tonkin Complex, North Battle Mountain Complex, Los Azules, and the El Gallo Complex.
For purposes of recognition and measurement of an impairment loss, the Company groups its properties by geological mineral complex, as this represents the lowest level at which the Company allocates its exploration spending independent of other assets and liabilities.
Asset Retirement Obligation: The Company records the fair value of a liability for an asset retirement obligation (“ARO”) in the period that it is incurred if a reasonable estimate of fair value can be made. The associated asset retirement costs are capitalized as part of the carrying amount of the long-lived asset when proven or probable reserves exist, or if they relate to an acquired mineral property interest. Since no proven or probable reserves have been established for any of the Company’s properties, other than at the San José mine, incremental asset retirement costs associated with the re-measurement of the fair value of the ARO at the El Gallo 1 mine or Tonkin property are charged to expense. Ongoing environmental and reclamation expenditures are debited against the ARO as incurred to the extent they relate to the ARO and to expense to the extent they do not. The fair value of AROs is measured by discounting the expected cash flows using a discount factor that reflects the credit-adjusted risk free rate of interest, while taking into account an inflation rate. The Company prepares estimates of the timing and amounts of expected cash flows when an ARO is incurred, which are updated to reflect changes in facts and circumstances. Changes in regulations or laws, any instances of non-compliance with laws or regulations that result in fines, or any unforeseen environmental contamination could result in a material impact to the amounts charged to operations for reclamation and remediation. Significant judgments and estimates are made when estimating the fair value of AROs. Expected cash flows relating to AROs could occur over long periods of time and the assessment of the extent of environmental remediation work is highly subjective. Considering all of these factors that go into the determination of an ARO, the fair value of the AROs can materially change over time.
Revenue Recognition: Revenue consists of sales value received for the Company’s principal products, gold and silver. The Company currently does not earn revenue from any products other than gold and silver. Revenue is recognized when title to gold and silver passes to the buyer and when collectability is reasonably assured. Title passes to the buyer based on terms of the sales contract. Product pricing is determined at the point revenue is recognized by reference to active and freely traded commodity markets, for example, the London Bullion Market for both gold and silver, in an identical form to the product sold.
The Company entered into a doré sales agreement with a Canadian financial institution in July 2012. Under that agreement, the Company has the option to sell to the institution approximately 90% of the gold and silver contained in doré bars produced at the El Gallo 1 mine prior to the completion of refining by the third party refiner, which normally takes approximately 15 business days. Revenue is recognized when the Company has provided irrevocable instructions to the refiner to transfer to the purchaser the refined ounces sold upon final outturn, and when payment of the purchase price for the purchased doré or bullion has been made in full by the purchaser.
Royalty Expense: The Company has a net smelter return (“NSR”) royalty agreement with a third party on all metal production from the El Gallo 1 mine and a portion of expected future metal production from the El Gallo 2 project. The terms of the royalty agreement stipulate that production up to 30,000 of gold and gold equivalent ounces are subject to a 1% NSR, production between 30,001 to 380,000 of gold and gold equivalent ounces are subject to a 3.5% NSR, and 1% thereafter. Currently the Company is subject to the 3.5% NSR. Under the terms of the royalty agreement, the royalty holder has the option to settle the NSR payment in cash or gold and gold equivalent ounces. The royalty holder has indicated a
70
preference to settle the NSR payment in gold and gold equivalent ounces which would be calculated on the day the refiner credits the Company’s metals account. Cumulatively, on a life‑of‑mine basis through to December 31, 2015, approximately 212,200 gold and gold equivalent ounces have been produced from mineralized material within the scope of the NSR agreement. Royalty expenses are included in Production Costs Applicable to Sales in the Statement of Operations and Comprehensive Loss.
Property Holding Costs: Holding costs to maintain a property on a care and maintenance basis are expensed in the period they are incurred. These costs include security and maintenance expenses, lease and claim fees and payments, and environmental monitoring and reporting costs.
Exploration Costs: Exploration costs include costs incurred to identify new mineral resources, evaluate potential resources, and convert mineral resources into proven and probable reserves. Exploration costs are expensed as incurred.
Stock‑Based Compensation: The Company accounts for stock options at fair value as prescribed in ASC 718. The Company estimates the fair value of each stock option at the grant date by using the Black-Scholes option-pricing model and provides for expense recognition over the service period, if any, of the stock option.
In 2013, the Company entered into an agreement with one of its mining contractors to pay for a portion of mining services with shares of common stock of the Company, up to a maximum of 2,500,000 shares. The number of shares to be issued is determined monthly, based on the amount payable by the Company for services rendered above a defined tonnage threshold, using the closing price of the Company’s common stock quoted on active markets at the end of every month. The cost of the shares required to be issued are included in Production Costs Applicable to Sales. At every period-end, any outstanding shares owed are marked to market based on the price of the Company’s stock quoted on active markets. The agreement was terminated on February 1, 2015.
Income Taxes: The Company accounts for income taxes under ASC 740. Using the liability method, recognizing certain temporary differences between the financial reporting basis of liabilities and assets and the related income tax basis for such liabilities and assets. This method generates either a net deferred income tax liability or asset for the Company, as measured by the statutory tax rates in effect. The Company derives the deferred income tax charge or benefit by recording the change in either the net deferred income tax liability or asset balance for the year. The Company records a valuation allowance against any portion of those deferred income tax assets when it believes, based on the weight of available evidence, it is more likely than not that some portion or all of the deferred income tax asset will not be realized.
Forward‑Looking Statements
This report contains or incorporates by reference “forward‑looking statements”, as that term is used in federal securities laws, about our financial condition, results of operations and business. These statements include, among others:
|
· |
statements about our anticipated exploration results, cost and feasibility of production, receipt of permits or other regulatory or government approvals and plans for the development of our properties; |
|
· |
statements concerning the benefits or outcomes that we expect will result from our business activities and certain transactions that we contemplate or have completed, such as receipt of proceeds, increased revenues, decreased expenses and avoided expenses and expenditures; and |
|
· |
statements of our expectations, beliefs, future plans and strategies, anticipated developments and other matters that are not historical facts. |
These statements may be made expressly in this document or may be incorporated by reference to other documents that we will file with the SEC. You can find many of these statements by looking for words such as “believes”, “expects”, “anticipates”, “estimates” or similar expressions used in this report or incorporated by reference in this report.
Forward‑looking statements and information are necessarily based upon a number of estimates and assumptions that, while considered reasonable by management, are inherently subject to significant business, economic and competitive
71
uncertainties, risks and contingencies, and there can be no assurance that such statements and information will prove to be accurate. Therefore, actual results and future events could differ materially from those anticipated in such statements and information. We caution you not to put undue reliance on these statements, which speak only as of the date of this report. Further, the information contained in this document or incorporated herein by reference is a statement of our present intention and is based on present facts and assumptions, and may change at any time and without notice, based on changes in such facts or assumptions. Readers should not place undue reliance on forward‑looking statements.
Risk Factors Impacting Forward‑Looking Statements
The important factors that could prevent us from achieving our stated goals and objectives include, but are not limited to, those set forth in other “Risk Factors” section in this report and the following:
|
· |
our ability to raise funds required for the execution of our business strategy; |
|
· |
our ability to secure permits or other regulatory and government approvals needed to operate, develop or explore our mineral properties and projects; |
|
· |
decisions of foreign countries and banks within those countries; |
|
· |
unexpected changes in business, economic, and political conditions; |
|
· |
operating results of MSC; |
|
· |
fluctuations in interest rates, currency exchange rates, or commodity prices; |
|
· |
timing and amount of mine production; |
|
· |
our ability to retain and attract key personnel; |
|
· |
technological changes in the mining industry; |
|
· |
changes in operating, exploration or overhead costs; |
|
· |
access and availability of materials, equipment, supplies, labor and supervision, power and water; |
|
· |
results of current and future exploration activities; |
|
· |
results of pending and future feasibility studies or the expansion or commencement of mining operations without feasibility studies having been completed; |
|
· |
changes in our business strategy; |
|
· |
interpretation of drill hole results and the geology, grade and continuity of mineralization; |
|
· |
the uncertainty of reserve estimates and timing of development expenditures; |
|
· |
litigation or regulatory investigations and procedures affecting us; |
|
· |
local and community impacts and issues including criminal activity and violent crimes; and |
|
· |
accidents, public health issues, and labor disputes. |
72
We undertake no responsibility or obligation to update publicly these forward‑looking statements, except as required by law and may update these statements in the future in written or oral statements. Investors should take note of any future statements made by or on our behalf.
ITEM 7A. QUANTITATIVE AND QUALITATIVE DISCLOSURE ABOUT MARKET RISK
Our exposure to market risks includes, but is not limited to, the following risks: changes in foreign currency exchange rates, changes in interest rates, equity price risks, commodity price fluctuations and country risk. We do not use derivative financial instruments as part of an overall strategy to manage market risk.
Further, our participation in the joint venture with Hochschild for the 49% interest held at MSC creates additional risks because, among other things, we do not exercise decision making power over the day-to-day activities at MSC; however, implications from our partner’s decisions may result in us having to provide additional funding to MSC or in a decrease in our percentage of ownership.
Foreign Currency Risk
While we transact most of our business in U.S. dollars, some expenses, labor, operating supplies and property and equipment are denominated in Canadian dollars, Mexican pesos or Argentine pesos. As a result, currency exchange fluctuations may impact our operating costs. The appreciation of non‑U.S. dollar currencies against the U.S. dollar increases costs and the cost of purchasing property and equipment in U.S. dollar terms in Canada, Mexico and Argentina, which can adversely impact our operating results and cash flows. Conversely, a depreciation of non‑U.S. dollar currencies usually decreases operating costs and property and equipment purchases in U.S. dollar terms in foreign countries.
Since 2008, the Argentine peso has been steadily devaluing against the U.S. dollar by 10-30% on an annual basis. In 2013 and 2014 the peso devalued by 29% and 28% respectively. As noted in the graph below, during the year ended December 31, 2015, the Argentine peso devalued 35% with a sharp 25% decrease on December alone.
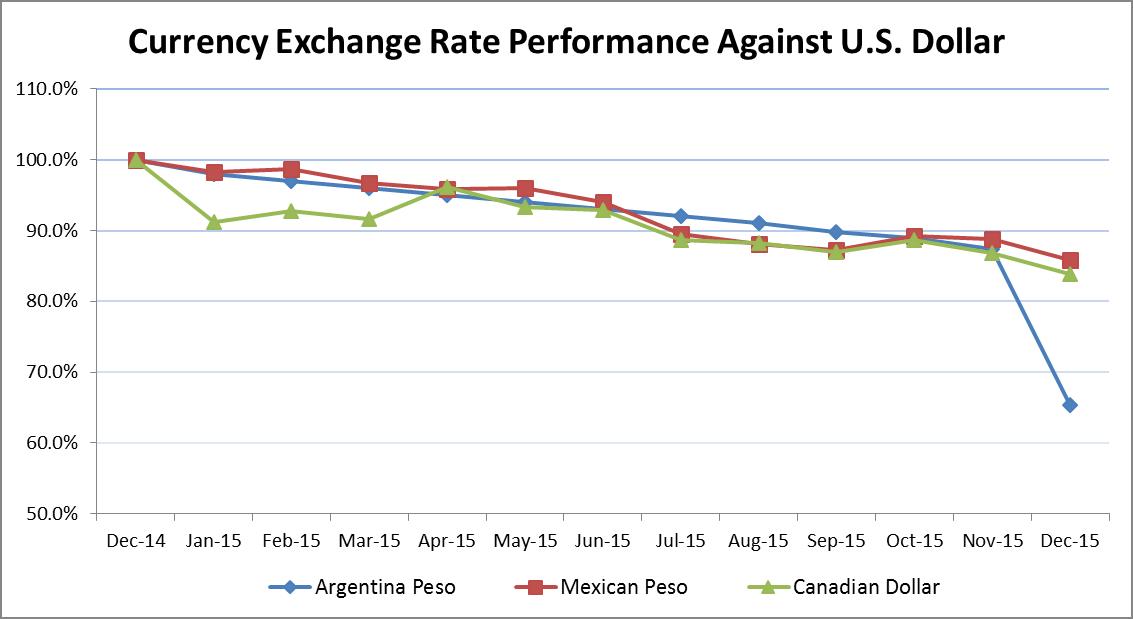
Due to restrictions in holding other currencies, MSC holds all of its local cash balances in Argentine pesos and is therefore exposed to the effects of this continued devaluation and also the risk that there may be a sudden severe devaluation of the Argentine peso. A severe devaluation could result in material foreign exchange losses as reported in U.S. dollars.
The line of credit obtained by our Mexican subsidiary during the second quarter of 2015 is denominated in Mexican Pesos, and therefore is subject to the fluctuation in currency exchange rate against the US dollar. The total balance outstanding
73
as of December 31, 2015 was 58,248,900 Mexican pesos, equivalent to approximately $3.4 million, for which a 1% change in the Mexican peso would have resulted in a gain/loss of $0.03 million in the Consolidated Statement of Operations and Comprehensive Loss.
We are also subject to foreign currency risk on the fluctuation of the Mexican peso on our VAT receivable balance. As of December 31, 2015, our VAT receivable balance was 127,524,501 Mexican pesos equivalent to approximately $10.0 million, for which a 1% change in the Mexican peso would have resulted in a gain/loss of $0.1 million in the Consolidated Statement of Operations and Comprehensive Loss.
During the year ended December 31, 2015, the Mexican peso devalued 14% against the US dollar.
The value of cash and cash equivalents denominated in foreign currencies also fluctuates with changes in currency exchange rates. Appreciation of non‑U.S. dollar currencies results in a foreign currency gain on such investments and a depreciation in non‑U.S. dollar currencies results in a loss. We have not utilized material market risk‑sensitive instruments to manage our exposure to foreign currency exchange rates but may in the future actively manage our exposure to foreign currency exchange rate risk. We hold portions of our cash reserves in non‑U.S. dollar currencies. Based on our Canadian dollar holdings of $0.6 million (C$0.8 million) at December 31, 2015, a 1% change in the Canadian dollar would result in a gain/loss of $0.01 million in the Consolidated Statement of Operations and Comprehensive Loss.
Further, as of December 31, 2015 we also had cash and cash equivalent balances in Mexican pesos. Accordingly, the total balance of 32,803,020 Mexican pesos was held by our subsidiary as of December 31, 2015, which was equivalent to approximately $1.9 million, for which a 1% change in the Mexican peso would have resulted in a gain/loss of $0.02 million in the Consolidated Statement of Operations and Comprehensive Loss. We also hold immaterial portions of our cash reserves in Argentine pesos.
Interest Rate Risk
In Mexico, our exposure to interest rate risk arises from the interest due on the line of credit obtained by our subsidiary during the second quarter of 2015. The applicable interest on this line of credit is based on a fixed portion of 2.5% per annum plus a variable portion determined by the 91 day Interbank Equilibrium Interest Rate (“TIIE”) rate published by the Bank of Mexico, and which is payable quarterly. The 91 day TIIE rate listed as of December 31, 2015 was 3.58%. If interest rates rise before the line of credit is retired, we may incur in greater expense related to the variable part of the interest calculation.
On January 13, 2016 our Mexican subsidiary paid the remaining balance of 58,248,899 Mexican Pesos (approximately $3.4 million as of December 31, 2015) and fulfilled its obligation with Banco Nacional. As a result, this line of credit has been closed.
Equity Price Risk
We have in the past sought and will likely in the future seek to acquire additional funding by sale of common stock. Movements in the price of our common stock have been volatile in the past and may also be volatile in the future. As a result, there is a risk that we may not be able to sell common stock at an acceptable price to meet future funding requirements.
Commodity Price Risk
We produce and sell gold and silver, therefore changes in the price of gold and silver could significantly affect our results of operations and cash flows in the future. We have in the past and may in the future hold a portion of our treasury in gold and silver bullion, which is recorded at the lower of cost or market. Gold and silver prices fluctuate widely from time to time. Based on our revenues from gold and silver sales of $73.0 million for the year ended December 31, 2015, a 10% change in the price of gold and silver would have had an impact of approximately $7.3 million on our revenues.
74
Credit Risk
We may be exposed to credit loss through our precious metals and doré sales agreements with Canadian financial institutions if these institutions are unable to make payment in accordance with the terms of the agreement. However, based on the history and financial condition of our counterparties, we do not anticipate any of the financial institutions to default on their obligation. As of December 31, 2015, we do not believe we have any significant credit exposure associated with precious metals and our doré sales agreements.
In Mexico, we are exposed to credit loss regarding our VAT taxes receivable, if the Mexican tax authorities are unable or unwilling to make payments in accordance with our monthly filings. Timing of collection on VAT receivables is uncertain as VAT refund procedures require a significant amount of information and follow‑up. The risk is mitigated to the extent that the VAT receivable balance can be applied against future income taxes payable. However, at this time we are uncertain when, if ever, our Mexican operations will generate sufficient taxable operating profits to offset this receivable against taxes payable. During 2016 and as of the filing of this report, additional VAT receivables of $6.0 million have been collected. Despite being successful in collecting our VAT claims, we continue to face risk on the collection of future VAT receivables.
In Nevada, we are required to provide security to cover our projected reclamation costs. We have surety bonds of $4.8 million in place to satisfy bonding requirements for this purpose. The bonds have an annual fee of 1.5% of their value, with an upfront deposit of 10%. Although we do not believe we have any significant credit exposure associated with these bonds, we are exposed to credit loss regarding our deposit if the surety bond underwriter defaults on its coverage of the bond. There is also the risk the surety bonds may no longer be accepted by the governmental agencies as satisfactory reclamation coverage, in which case we would be required to replace the surety bonding with cash.
75
ITEM 8. FINANCIAL STATEMENTS AND SUPPLEMENTARY DATA
|
Index to Financial Statements: |
|
|
|
|
|
|
|
Management’s Report on Internal Control Over Financial Reporting |
|
76 |
|
|
|
|
|
|
77 | |
|
|
|
|
|
|
79 | |
|
|
|
|
|
Consolidated Balance Sheets as of December 31, 2015 and 2014 |
|
80 |
|
|
|
|
|
|
81 | |
|
|
|
|
|
Consolidated Statements of Cash Flows for the years ended December 31, 2015, 2014 and 2013 |
|
82 |
|
|
|
|
|
|
83 |
76
MANAGEMENT’S REPORT ON INTERNAL CONTROL OVER FINANCIAL REPORTING
Management of the Company is responsible for establishing and maintaining adequate internal control over financial reporting. The Securities Exchange Act of 1934 defines internal control over financial reporting in Rule 13a‑ 15(f) and 15d‑15(f) as a process designed by, or under the supervision of, the Company’s principal executive and principal financial officers and effected by the Company’s board of directors, management and other personnel, to provide reasonable assurance regarding the reliability of financial reporting and the preparation of financial statements for external purposes in accordance with generally accepted accounting principles and includes those policies and procedures that:
|
· |
Pertain to the maintenance of records that in reasonable detail accurately and fairly reflect the transactions and dispositions of the assets of the Company; |
|
· |
Provide reasonable assurance that transactions are recorded as necessary to permit preparation of financial statements in accordance with generally accepted accounting principles, and that receipts and expenditures of the Company are being made only in accordance with authorizations of management and the board of directors of the Company; and |
|
· |
Provide reasonable assurance regarding prevention or timely detection of unauthorized acquisition, use or disposition of the Company’s assets that could have a material effect on the consolidated financial statements. |
Because of its inherent limitations, internal control over financial reporting may not prevent or detect misstatements. Also, projections of any evaluation of effectiveness to future periods are subject to risk that controls may become inadequate because of changes in conditions, or that the degree of compliance with the policies or procedures may deteriorate.
The Company’s management assessed the effectiveness of the Company’s internal control over financial reporting as of December 31, 2015. In making this assessment, the Company’s management used the criteria set forth by the Committee of Sponsoring Organizations of the Treadway Commission (COSO) in Internal Control—Integrated Framework (2013).
Based upon its assessment, management concluded that, as of December 31, 2015, the Company’s internal control over financial reporting was effective based upon those criteria. KPMG LLP, an independent registered public accounting firm, has audited the effectiveness of the Company’s internal control over financial reporting as of December 31, 2015.
77
REPORT OF INDEPENDENT REGISTERED PUBLIC ACCOUNTING FIRM
The Board of Directors and Shareholders
McEwen Mining Inc.:
We have audited the accompanying consolidated balance sheets of McEwen Mining Inc. and subsidiaries as of December 31, 2015 and December 31, 2014, and the related consolidated statements of operations and comprehensive loss, changes in shareholders’ equity and cash flows for each of the years in the three-year period ended December 31, 2015. These consolidated financial statements are the responsibility of McEwen Mining Inc.'s management. Our responsibility is to express an opinion on these consolidated financial statements based on our audits.
We conducted our audits in accordance with the standards of the Public Company Accounting Oversight Board (United States). Those standards require that we plan and perform the audit to obtain reasonable assurance about whether the financial statements are free of material misstatement. An audit includes examining, on a test basis, evidence supporting the amounts and disclosures in the financial statements. An audit also includes assessing the accounting principles used and significant estimates made by management, as well as evaluating the overall financial statement presentation. We believe that our audits provide a reasonable basis for our opinion.
In our opinion, the consolidated financial statements referred to above present fairly, in all material respects, the financial position of McEwen Mining Inc. and subsidiaries as of December 31, 2015 and December 31, 2014, and the results of their operations and their cash flows for each of the years in the three-year period ended December 31, 2015, in conformity with U.S. generally accepted accounting principles.
We also have audited, in accordance with the standards of the Public Company Accounting Oversight Board (United States), McEwen Mining Inc.’s internal control over financial reporting as of December 31, 2015, based on the criteria established in Internal Control – Integrated Framework (2013) issued by the Committee of Sponsoring Organizations of the Treadway Commission, and our report dated March 11, 2016 expressed an unqualified opinion on the effectiveness of McEwen Mining Inc.’s internal control over financial reporting.
/s/ KPMG LLP
Chartered Professional Accountants, Licensed Public Accountants
March 11, 2016
Toronto, Canada
78
REPORT OF INDEPENDENT REGISTERED PUBLIC ACCOUNTING FIRM
The Board of Directors and Shareholders
McEwen Mining Inc.:
We have audited McEwen Mining Inc.’s internal control over financial reporting as of December 31, 2015, based on criteria established in Internal Control – Integrated Framework (2013) issued by the Committee of Sponsoring Organizations of the Treadway Commission. McEwen Mining Inc.’s management is responsible for maintaining effective internal control over financial reporting and for its assessment of the effectiveness of internal control over financial reporting, included in the accompanying Management’s Report on Internal Control over Financial Reporting. Our responsibility is to express an opinion on the Company’s internal control over financial reporting based on our audit.
We conducted our audit in accordance with the standards of the Public Company Accounting Oversight Board (United States). Those standards require that we plan and perform the audit to obtain reasonable assurance about whether effective internal control over financial reporting was maintained in all material respects. Our audit included obtaining an understanding of internal control over financial reporting, assessing the risk that a material weakness exists, and testing and evaluating the design and operating effectiveness of internal control based on the assessed risk. Our audit also included performing such other procedures as we considered necessary in the circumstances. We believe that our audit provides a reasonable basis for our opinion.
A company’s internal control over financial reporting is a process designed to provide reasonable assurance regarding the reliability of financial reporting and the preparation of financial statements for external purposes in accordance with generally accepted accounting principles. An entity’s internal control over financial reporting includes those policies and procedures that (1) pertain to the maintenance of records that, in reasonable detail, accurately and fairly reflect the transactions and dispositions of the assets of the company; (2) provide reasonable assurance that transactions are recorded as necessary to permit preparation of financial statements in accordance with generally accepted accounting principles, and that receipts and expenditures of the company are being made only in accordance with authorizations of management and those charged with governance; and (3) provide reasonable assurance regarding prevention or timely detection of unauthorized acquisition, use, or disposition of the entity’s assets that could have a material effect on the financial statements.
Because of its inherent limitations, internal control over financial reporting may not prevent or detect misstatements. Also, projections of any evaluation of effectiveness to future periods are subject to the risk that controls may become inadequate because of changes in conditions, or that the degree of compliance with the policies or procedures may deteriorate.
In our opinion, McEwen Mining Inc. maintained, in all material respects, effective internal control over financial reporting as of December 31, 2015, based on criteria established in Internal Control – Integrated Framework (2013) issued by the Committee of Sponsoring Organizations of the Treadway Commission (COSO).
We also have audited, in accordance with the standards of the Public Company Accounting Oversight Board (United States), the consolidated balance sheets of McEwen Mining Inc. as of December 31, 2015 and December 31, 2014, and the related consolidated statements of operations and comprehensive loss, changes in shareholders’ equity and cash flows for each of the years in the three-year period ended December 31, 2015, and our report dated March 11, 2016 expressed an unqualified opinion on those consolidated financial statements.
/s/ KPMG LLP
Chartered Professional Accountants, Licensed Public Accountants
March 11, 2016
Toronto, Canada
79
MCEWEN MINING INC.
CONSOLIDATED STATEMENTS OF OPERATIONS AND COMPREHENSIVE LOSS
FOR THE YEARS ENDED DECEMBER 31,
(in thousands of U.S. dollars, except per share amounts)
|
|
|
|
|
|
|
|
|
|
|
|
|
|
|
2015 |
|
2014 |
|
2013 |
|
|||
|
REVENUE: |
|
|
|
|
|
|
|
|
|
|
|
Gold and silver sales |
|
$ |
72,956 |
|
$ |
45,303 |
|
$ |
45,982 |
|
|
|
|
|
72,956 |
|
|
45,303 |
|
|
45,982 |
|
|
COSTS AND EXPENSES: |
|
|
|
|
|
|
|
|
|
|
|
Production costs applicable to sales |
|
|
34,607 |
|
|
40,608 |
|
|
34,594 |
|
|
Mine construction costs |
|
|
— |
|
|
1,723 |
|
|
1,383 |
|
|
Mine development costs |
|
|
1,169 |
|
|
1,829 |
|
|
847 |
|
|
Exploration costs |
|
|
8,798 |
|
|
11,332 |
|
|
24,829 |
|
|
Property holding costs |
|
|
4,336 |
|
|
6,365 |
|
|
4,584 |
|
|
General and administrative |
|
|
12,045 |
|
|
12,069 |
|
|
14,001 |
|
|
Depreciation |
|
|
942 |
|
|
979 |
|
|
942 |
|
|
Accretion of asset retirement obligation and reclamation expenses (note 5) |
|
|
429 |
|
|
407 |
|
|
461 |
|
|
(Income) loss from investment in Minera Santa Cruz S.A., net of amortization (note 6) |
|
|
(2,414) |
|
|
5,284 |
|
|
(846) |
|
|
Impairment of investment in Minera Santa Cruz S.A. (note 6) |
|
|
11,777 |
|
|
21,162 |
|
|
95,878 |
|
|
Impairment of mineral property interests and property and equipment (note 5) |
|
|
50,600 |
|
|
353,736 |
|
|
62,963 |
|
|
(Gain) loss on sale of assets |
|
|
(13) |
|
|
(26) |
|
|
6,743 |
|
|
Total costs and expenses |
|
|
122,276 |
|
|
455,468 |
|
|
246,379 |
|
|
Operating loss |
|
|
(49,320) |
|
|
(410,165) |
|
|
(200,397) |
|
|
OTHER INCOME (EXPENSE): |
|
|
|
|
|
|
|
|
|
|
|
Interest income and other income |
|
|
2,404 |
|
|
259 |
|
|
262 |
|
|
Loss on sales of gold and silver bullion held as investments |
|
|
— |
|
|
— |
|
|
(223) |
|
|
Registration taxes |
|
|
— |
|
|
(6,788) |
|
|
— |
|
|
Gain on litigation settlement |
|
|
— |
|
|
— |
|
|
560 |
|
|
Foreign currency gain (loss) |
|
|
1,906 |
|
|
(2,419) |
|
|
(1,309) |
|
|
Total other income (expense) |
|
|
4,310 |
|
|
(8,948) |
|
|
(710) |
|
|
Loss before income taxes |
|
|
(45,010) |
|
|
(419,113) |
|
|
(201,107) |
|
|
Income tax recovery (note 8) |
|
|
24,560 |
|
|
107,170 |
|
|
53,365 |
|
|
Net loss |
|
|
(20,450) |
|
|
(311,943) |
|
|
(147,742) |
|
|
OTHER COMPREHENSIVE LOSS |
|
|
|
|
|
|
|
|
|
|
|
Unrealized (loss) gain on available-for-sale securities, net of taxes (note 3) |
|
|
(949) |
|
|
419 |
|
|
(1) |
|
|
Comprehensive loss |
|
$ |
(21,399) |
|
$ |
(311,524) |
|
$ |
(147,743) |
|
|
Net loss per share (note 12): |
|
|
|
|
|
|
|
|
|
|
|
Basic |
|
$ |
(0.07) |
|
$ |
(1.05) |
|
$ |
(0.50) |
|
|
Weighted average common shares outstanding (thousands) (note 12): |
|
|
|
|
|
|
|
|
|
|
|
Basic |
|
|
300,341 |
|
|
297,763 |
|
|
297,041 |
|
The accompanying notes are an integral part of these consolidated financial statements.
80
MCEWEN MINING INC.
AS AT DECEMBER 31,
(in thousands of U.S. dollars)
|
|
|
|
|
|
|
|
|
|
|
|
|
2015 |
|
2014 |
|
|
||
|
ASSETS |
|
|
|
|
|
|
|
|
|
Current assets: |
|
|
|
|
|
|
|
|
|
Cash and cash equivalents |
|
$ |
25,874 |
|
$ |
12,380 |
|
|
|
Investments (note 3) |
|
|
1,032 |
|
|
1,082 |
|
|
|
Value added taxes receivable |
|
|
10,032 |
|
|
11,739 |
|
|
|
Inventories (note 4) |
|
|
14,975 |
|
|
12,404 |
|
|
|
Other current assets |
|
|
2,530 |
|
|
2,096 |
|
|
|
Total current assets |
|
|
54,443 |
|
|
39,701 |
|
|
|
Mineral property interests (note 5) |
|
|
237,245 |
|
|
287,812 |
|
|
|
Investment in Minera Santa Cruz S.A. (note 6) |
|
|
167,107 |
|
|
177,018 |
|
|
|
Property and equipment, net (note 7) |
|
|
15,759 |
|
|
17,896 |
|
|
|
Other assets |
|
|
531 |
|
|
531 |
|
|
|
TOTAL ASSETS |
|
$ |
475,085 |
|
$ |
522,958 |
|
|
|
LIABILITIES & SHAREHOLDERS’ EQUITY |
|
|
|
|
|
|
|
|
|
Current liabilities: |
|
|
|
|
|
|
|
|
|
Accounts payable and accrued liabilities |
|
$ |
18,429 |
|
$ |
21,654 |
|
|
|
Short-term bank indebtedness (note 9) |
|
|
3,395 |
|
|
— |
|
|
|
Current portion of asset retirement obligation (note 5) |
|
|
215 |
|
|
2,427 |
|
|
|
Total current liabilities |
|
|
22,039 |
|
|
24,081 |
|
|
|
Asset retirement obligation, less current portion (note 5) |
|
|
7,569 |
|
|
5,044 |
|
|
|
Deferred income tax liability (notes 8) |
|
|
26,899 |
|
|
51,899 |
|
|
|
Deferred rent expense |
|
|
286 |
|
|
319 |
|
|
|
Other liabilities |
|
|
— |
|
|
400 |
|
|
|
Total liabilities |
|
$ |
56,793 |
|
$ |
81,743 |
|
|
|
|
|
|
|
|
|
|
|
|
|
Shareholders’ equity: |
|
|
|
|
|
|
|
|
|
Common stock, no par value, 500,000 shares authorized; |
|
|
|
|
|
|
|
|
|
Common: 274,421 as of December 31, 2015 and 271,579 as of December 31, 2014 issued and outstanding |
|
|
|
|
|
|
|
|
|
Exchangeable: 24,213 shares as of December 31, 2015 and 28,521 shares as of December 31, 2014 issued and outstanding |
|
|
1,359,144 |
|
|
1,360,668 |
|
|
|
Accumulated deficit |
|
|
(940,027) |
|
|
(919,577) |
|
|
|
Accumulated other comprehensive (loss) income |
|
|
(825) |
|
|
124 |
|
|
|
Total shareholders’ equity |
|
|
418,292 |
|
|
441,215 |
|
|
|
TOTAL LIABILITIES & SHAREHOLDERS’ EQUITY |
|
$ |
475,085 |
|
$ |
522,958 |
|
|
The accompanying notes are an integral part of these consolidated financial statements.
Subsequent events: notes 9 and 10.
81
MCEWEN MINING INC.
CONSOLIDATED STATEMENTS OF CHANGES IN SHAREHOLDERS’ EQUITY
FOR THE YEARS ENDED DECEMBER 31,
(in thousands of U.S. dollars, expect share amounts)
|
|
|
|
|
|
|
|
Accumulated |
|
|
|
|
|
|
|
|
|
|
|
|
|
|
|
|
Other |
|
|
|
|
|
|
|
|
|
|
|
Common Stock |
|
Comprehensive |
|
Accumulated |
|
|
|
|
|||||
|
|
|
Shares |
|
Amount |
|
(Loss) Income |
|
Deficit |
|
Total |
|
||||
|
Balance, December 31, 2012 |
|
296,025 |
|
$ |
1,349,777 |
|
$ |
(294) |
|
$ |
(459,892) |
|
$ |
889,591 |
|
|
Stock-based compensation |
|
— |
|
|
1,382 |
|
|
— |
|
|
— |
|
|
1,382 |
|
|
Exercise of stock options |
|
48 |
|
|
95 |
|
|
— |
|
|
— |
|
|
95 |
|
|
Exercise of stock options assumed from Minera Andes Inc. acquisition |
|
45 |
|
|
76 |
|
|
— |
|
|
— |
|
|
76 |
|
|
Share issued for litigation settlement |
|
1,000 |
|
|
3,270 |
|
|
— |
|
|
— |
|
|
3,270 |
|
|
Shares issued for Mexico mining concessions |
|
41 |
|
|
96 |
|
|
— |
|
|
— |
|
|
96 |
|
|
Unrealized loss on marketable securities |
|
— |
|
|
— |
|
|
(1) |
|
|
— |
|
|
(1) |
|
|
Net loss |
|
— |
|
|
— |
|
|
— |
|
|
(147,742) |
|
|
(147,742) |
|
|
Balance, December 31, 2013 |
|
297,159 |
|
$ |
1,354,696 |
|
$ |
(295) |
|
$ |
(607,634) |
|
$ |
746,767 |
|
|
Balance, December 31, 2013 |
|
297,159 |
|
$ |
1,354,696 |
|
$ |
(295) |
|
$ |
(607,634) |
|
$ |
746,767 |
|
|
Stock-based compensation |
|
— |
|
|
1,324 |
|
|
— |
|
|
— |
|
|
1,324 |
|
|
Exercise of stock options |
|
1,499 |
|
|
1,932 |
|
|
— |
|
|
— |
|
|
1,932 |
|
|
Exercise of stock options assumed from Minera Andes Inc. acquisition |
|
198 |
|
|
360 |
|
|
— |
|
|
— |
|
|
360 |
|
|
Shares issued for settlement of accounts payable |
|
394 |
|
|
1,004 |
|
|
— |
|
|
— |
|
|
1,004 |
|
|
Shares issued to terminate TNR Gold Corp's back-in right |
|
850 |
|
|
1,352 |
|
|
— |
|
|
— |
|
|
1,352 |
|
|
Unrealized gain on available-for-sale securities, net of taxes |
|
— |
|
|
— |
|
|
419 |
|
|
— |
|
|
419 |
|
|
Net loss |
|
— |
|
|
— |
|
|
— |
|
|
(311,943) |
|
|
(311,943) |
|
|
Balance, December 31, 2014 |
|
300,100 |
|
$ |
1,360,668 |
|
$ |
124 |
|
$ |
(919,577) |
|
$ |
441,215 |
|
|
Balance, December 31, 2014 |
|
300,100 |
|
$ |
1,360,668 |
|
$ |
124 |
|
$ |
(919,577) |
|
$ |
441,215 |
|
|
Stock-based compensation |
|
— |
|
|
1,305 |
|
|
— |
|
|
— |
|
|
1,305 |
|
|
Return of capital distribution (note 10) |
|
— |
|
|
(1,503) |
|
|
— |
|
|
— |
|
|
(1,503) |
|
|
Share repurchase (note 10) |
|
(1,896) |
|
|
(1,769) |
|
|
— |
|
|
— |
|
|
(1,769) |
|
|
Share issued for settlement of accounts payable |
|
430 |
|
|
443 |
|
|
— |
|
|
— |
|
|
443 |
|
|
Unrealized loss on available-for-sale securities, net of taxes (note 3) |
|
— |
|
|
— |
|
|
(949) |
|
|
— |
|
|
(949) |
|
|
Net loss |
|
— |
|
|
— |
|
|
— |
|
|
(20,450) |
|
|
(20,450) |
|
|
Balance, December 31, 2015 |
|
298,634 |
|
$ |
1,359,144 |
|
$ |
(825) |
|
$ |
(940,027) |
|
$ |
418,292 |
|
The accompanying notes are an integral part of these consolidated financial statements.
82
MCEWEN MINING INC.
CONSOLIDATED STATEMENTS OF CASH FLOWS
FOR THE YEARS ENDED DECEMBER 31,
(in thousands of U.S. dollars)
|
|
|
2015 |
|
2014 |
|
2013 |
|
|||
|
Cash flows from operating activities: |
|
|
|
|
|
|
|
|
|
|
|
Cash paid to suppliers and employees |
|
$ |
(55,260) |
|
$ |
(68,993) |
|
$ |
(90,365) |
|
|
Cash received from gold and silver sales |
|
|
70,178 |
|
|
43,812 |
|
|
44,416 |
|
|
Dividends received from Minera Santa Cruz S.A.(note 6) |
|
|
548 |
|
|
9,483 |
|
|
1,826 |
|
|
Proceeds from sale of gold and silver bullion held as investments |
|
|
— |
|
|
— |
|
|
1,467 |
|
|
Lease incentive received |
|
|
— |
|
|
328 |
|
|
— |
|
|
Interest paid |
|
|
(156) |
|
|
— |
|
|
— |
|
|
Interest received |
|
|
287 |
|
|
464 |
|
|
262 |
|
|
Cash provided by (used in) operating activities |
|
|
15,597 |
|
|
(14,906) |
|
|
(42,394) |
|
|
Cash flows from investing activities: |
|
|
|
|
|
|
|
|
|
|
|
Acquisition of mineral property interests |
|
|
— |
|
|
— |
|
|
(150) |
|
|
Additions to property and equipment (note 7) |
|
|
(777) |
|
|
(2,788) |
|
|
(4,306) |
|
|
Investment in marketable equity securities (note 3) |
|
|
(1,114) |
|
|
(446) |
|
|
— |
|
|
Decrease in restricted time deposits for reclamation bonding (note 5) |
|
|
— |
|
|
5,183 |
|
|
— |
|
|
Deposits for surety bonds for reclamation bonding (note 5) |
|
|
— |
|
|
(481) |
|
|
— |
|
|
Proceeds from disposal of mineral property interests and property and equipment |
|
|
13 |
|
|
38 |
|
|
1,455 |
|
|
Cash (used in) provided by investing activities |
|
|
(1,878) |
|
|
1,506 |
|
|
(3,001) |
|
|
Cash flows from financing activities: |
|
|
|
|
|
|
|
|
|
|
|
Short-term bank indebtedness withdrawal (note 9) |
|
|
5,171 |
|
|
— |
|
|
— |
|
|
Short-term bank indebtedness paid (note 9) |
|
|
(1,776) |
|
|
— |
|
|
— |
|
|
Return of capital distribution paid (note 10) |
|
|
(1,503) |
|
|
— |
|
|
— |
|
|
Share repurchase (note 10) |
|
|
(1,769) |
|
|
— |
|
|
— |
|
|
Exercise of stock options (note 11) |
|
|
— |
|
|
2,292 |
|
|
171 |
|
|
Cash provided by financing activities |
|
|
123 |
|
|
2,292 |
|
|
171 |
|
|
Effect of exchange rate change on cash and cash equivalents |
|
|
(348) |
|
|
(833) |
|
|
(1,376) |
|
|
Increase (decrease) in cash and cash equivalents |
|
|
13,494 |
|
|
(11,941) |
|
|
(46,600) |
|
|
Cash and cash equivalents, beginning of period |
|
|
12,380 |
|
|
24,321 |
|
|
70,921 |
|
|
Cash and cash equivalents, end of period |
|
$ |
25,874 |
|
$ |
12,380 |
|
$ |
24,321 |
|
|
|
|
|
|
|
|
|
|
|
|
|
|
Reconciliation of net loss to cash provided by (used in) operating activities: |
|
|
|
|
|
|
|
|
|
|
|
Net loss |
|
$ |
(20,450) |
|
$ |
(311,943) |
|
$ |
(147,742) |
|
|
Adjustments to reconcile net loss from operating activities: |
|
|
|
|
|
|
|
|
|
|
|
(Income) Loss on investment in Minera Santa Cruz S.A., net of amortization |
|
|
(2,414) |
|
|
5,284 |
|
|
(846) |
|
|
Impairment of investment in Minera Santa Cruz S.A. |
|
|
11,777 |
|
|
21,162 |
|
|
95,878 |
|
|
Impairment of mineral property interests and property and equipment |
|
|
50,600 |
|
|
353,736 |
|
|
62,963 |
|
|
(Gain) loss on sale of assets |
|
|
(13) |
|
|
(26) |
|
|
6,743 |
|
|
Lease incentive |
|
|
— |
|
|
328 |
|
|
— |
|
|
Recovery of deferred income taxes |
|
|
(24,560) |
|
|
(107,170) |
|
|
(53,365) |
|
|
Gain on litigation settlement |
|
|
— |
|
|
— |
|
|
(560) |
|
|
Loss on sale of gold and silver bullion held as investments |
|
|
— |
|
|
— |
|
|
223 |
|
|
Proceeds on sale of gold and silver bullion held as investments |
|
|
— |
|
|
— |
|
|
1,467 |
|
|
Stock-based compensation |
|
|
1,305 |
|
|
1,324 |
|
|
1,382 |
|
|
Depreciation |
|
|
942 |
|
|
979 |
|
|
942 |
|
|
Accretion of asset retirement obligation |
|
|
429 |
|
|
407 |
|
|
461 |
|
|
Adjustment to the asset retirement obligation estimate |
|
|
135 |
|
|
— |
|
|
— |
|
|
Amortization of mineral property interests and asset retirement obligations |
|
|
1,288 |
|
|
1,236 |
|
|
1,530 |
|
|
Foreign exchange loss |
|
|
348 |
|
|
833 |
|
|
1,376 |
|
|
Change in non-cash working capital items: |
|
|
|
|
|
|
|
|
|
|
|
Shares issued to supplier for settlement of accounts payable |
|
|
443 |
|
|
1,004 |
|
|
— |
|
|
Decrease (increase) in VAT taxes receivable, net of collection of $6,025 (2014 - $5,049; 2013 - $3,438) |
|
|
1,707 |
|
|
(148) |
|
|
(2,441) |
|
|
Increase in other assets related to operations |
|
|
(3,003) |
|
|
(3,638) |
|
|
(703) |
|
|
(Decrease) increase in liabilities related to operations |
|
|
(3,485) |
|
|
10,891 |
|
|
(11,528) |
|
|
Shares issued to TNR Gold Corp. to terminate back-in-right |
|
|
— |
|
|
1,352 |
|
|
— |
|
|
Dividends received from Minera Santa Cruz S.A |
|
|
548 |
|
|
9,483 |
|
|
1,826 |
|
|
Cash provided by (used in) operating activities |
|
$ |
15,597 |
|
$ |
(14,906) |
|
$ |
(42,394) |
|
The accompanying notes are an integral part of these consolidated financial statements.
83
MCEWEN MINING INC.
NOTES TO CONSOLIDATED FINANCIAL STATEMENTS
December 31, 2015
(tabular amounts are in thousands of U.S. dollars, unless otherwise noted)
McEwen Mining Inc. (the “Company”) was organized under the laws of the State of Colorado on July 24, 1979. The Company is engaged in the exploration for, development of, production and sale of gold and silver. On January 24, 2012, the Company changed its name from US Gold Corporation to McEwen Mining Inc. after the completion of the acquisition of Minera Andes Inc. by way of a statutory plan of arrangement under the laws of the Province of Alberta, Canada.
The Company operates in Argentina, Mexico, and the United States. It owns a 49% interest in Minera Santa Cruz S.A. (“MSC”), owner of the producing San José silver-gold mine in Santa Cruz, Argentina, which is operated by the majority owner of the joint venture, Hochschild Mining plc. It also owns and operates the El Gallo 1 mine in Sinaloa, Mexico. Finally, the Company owns the Los Azules copper deposit in San Juan, Argentina, the El Gallo 2 project in Sinaloa, Mexico, the Gold Bar project in Nevada in the United States, and a portfolio of exploration properties in Argentina, Mexico and Nevada.
NOTE 2 SUMMARY OF SIGNIFICANT ACCOUNTING POLICIES
Use of Estimates: The Company’s consolidated financial statements have been prepared in accordance with accounting principles generally accepted in the United States of America (“U.S. GAAP”). The preparation of the Company’s consolidated financial statements requires the Company to make estimates and assumptions that affect the reported amounts of assets and liabilities and the related disclosure of contingent assets and liabilities at the date of the consolidated financial statements and the reported amounts of expenses during the reporting period. The more significant areas requiring the use of management estimates and assumptions relate to environmental, reclamation and closure obligations; estimates of fair value for asset impairments; estimates regarding the collectability of value added taxes receivable; valuation allowances for deferred tax assets; estimate of income tax provisions, reserves for contingencies and litigation; and estimates with respect to assumptions regarding stock-based compensation expense. The Company bases its estimates on historical experience and on various other assumptions that are believed to be reasonable under the circumstances. Actual results may differ significantly from these estimates.
Basis of Consolidation: The consolidated financial statements include the accounts of the Company and its wholly-owned subsidiaries. Significant intercompany accounts and transactions have been eliminated. Investments over which the Company exerts significant influence but does not control through majority ownership are accounted for using the equity method, as described in Investments, below.
Cash and Cash Equivalents: The Company considers cash in banks, deposits in transit, and highly liquid term deposits with original maturities of three months or less to be cash and cash equivalents. Because of the short maturity of these instruments, the carrying amounts approximate their fair value. Restricted cash is excluded from cash and cash equivalents and is included in long‑term assets.
Investments: The Company accounts for investments over which the Company exerts significant influence but does not control through majority ownership using the equity method of accounting pursuant to ASC Topic 323, Investments – Equity Method and Joint Ventures. Under this method, the Company’s share of earnings and losses is included in the Consolidated Statement of Operations and Comprehensive Loss and the balance of the investment is adjusted by the same amount. Under the equity method, dividends received from an investee are recorded as decreases in the investment account, not as income. If and when there has been a loss in value that is other than a temporary decline, the carrying value is reduced to its fair value.
The Company accounts for its investment in marketable equity securities as available for sale securities in accordance with ASC guidance on accounting for certain investments in debt and equity securities. The Company periodically evaluates whether declines in fair values of its investments below the Company’s carrying value are other‑than‑temporary in
84
MCEWEN MINING INC.
NOTES TO CONSOLIDATED FINANCIAL STATEMENTS
December 31, 2015
(tabular amounts are in thousands of U.S. dollars, unless otherwise noted) (continued)
accordance with ASC guidance. Declines in fair value below the Company’s carrying value deemed to be other‑than‑temporary are charged to operations.
Value Added Taxes Receivable: In Mexico, value added taxes (“VAT”) are assessed on purchases of materials and services and sales of products. Businesses are generally entitled to recover the taxes they have paid related to purchases of materials and services, either as a refund or as a credit against future taxes payable. In Argentina, except at the San José mine, the Company expenses all VAT as their recoverability is uncertain.
Stockpiles, Material on Leach Pads, In‑process Inventory, Precious Metals Inventory and Materials and Supplies: Stockpiles, material on leach pads, in-process inventory, precious metals inventory and materials and supplies are carried at the lower of average cost or net realizable value. Net realizable value represents the estimated future sales price of the product based on current and long-term metals prices, less the estimated costs to complete production and bring the product to sale. Write-downs of stockpiles, material on leach pads, in-process inventory, precious metals inventory and materials and supplies, resulting from net realizable value impairments, are reported as a component of production costs applicable to sales. The current portion of stockpiles, material on leach pad, in-process inventory and materials and supplies is determined based on the expected amounts to be processed within the next 12 months. Stockpiles, material on leach pads, in‑process inventory and materials and supplies not expected to be processed within the next 12 months, if any, are classified as long‑term.
Stockpiles represent mineralized material that has been extracted from the mine and is available for further processing. Stockpiles are measured by estimating the number of tonnes added and removed from the stockpile, an estimate of the contained metals (based on assay data) and the estimated metallurgical recovery rates. Costs are allocated to stockpiles based on relative values of material stockpiled and processed using current mining costs incurred up to the point of stockpiling the mineralized material. Material is removed from the stockpile at an average cost per tonne.
Mineralized material on leach pads is the ore that is placed on pads where it is treated with a chemical solution that dissolves the gold contained in the ore over a period of months. Costs are attributed to the ore on leach pads based on current mining costs incurred up to the point of placing the ore on the pad. Costs are removed from the leach pad inventory based on the average cost per estimated recoverable ounce of gold on the leach pad as the gold is recovered. The estimates of recoverable gold on the leach pads are calculated from the quantities of ore placed on the leach pads (measured tons added to the leach pads), the grade of ore placed on the leach pads (based on assay data) and a recovery percentage.
In general, leach pads recover between 50% and 95% of the recoverable ounces in the first year of leaching, declining each year thereafter until the leaching is complete. The cumulative metallurgical recovery rate for gold production at the El Gallo 1 mine from September 2012 (start of production) to December 31, 2015 was approximately 56% (2014 – 56%). Although the quantities of recoverable gold placed on the leach pads are reconciled by comparing the grades of ore placed on the pads to the quantities of gold actually recovered (metallurgical balancing), the nature of the leaching process inherently limits the ability to precisely monitor inventory levels. As a result, the metallurgical balancing process is constantly monitored and the engineering estimates are refined based on actual results over time.
In-process inventories represent materials that are currently in the process of being converted to a saleable product. In-process material is measured based on assays of the material from the various stages of the ADR process that fed into the process and the projected recoveries of the respective plants. Costs are allocated to in-process inventories based on the costs of the material fed into the process attributable to the source material coming from the mines, stockpiles and/or leach pads plus the in-process conversion costs incurred to that point in the process.
Precious metal inventories include gold and silver doré and bullion that is unsold and held at the Company’s or the refinery’s facilities. Costs are allocated to precious metal inventories based on costs of the respective in-process inventories incurred prior to the refining process plus applicable refining costs.
85
MCEWEN MINING INC.
NOTES TO CONSOLIDATED FINANCIAL STATEMENTS
December 31, 2015
(tabular amounts are in thousands of U.S. dollars, unless otherwise noted) (continued)
Materials and supplies inventories are comprised of chemicals, reagents and consumable parts used in drilling and other operating activities. They are valued at the lower of average cost or net realizable value. Cost includes applicable taxes and freight.
Proven and Probable Reserves: The definition of proven and probable reserves is set forth in SEC Industry Guide 7. Proven reserves are reserves for which (a) quantity is computed from dimensions revealed in outcrops, trenches, workings or drill holes, grade and/or quality are computed from the results of detailed sampling and (b) the sites for inspection, sampling and measurement are spaced so closely and the geological character is so well defined that size, shape, depth and mineral content of the reserves are well‑established. Probable reserves are reserves for which quantity and grade and/or quality are computed from information similar to that used for proven (measured) reserves, but the sites for inspection, sampling, and measurement are farther apart or are otherwise less adequately spaced. The degree of assurance, although lower than that for proven (measured) reserves, is high enough to assume continuity between points of observations.
As of December 31, 2015, except for the Company’s 49% interest in the San José mine, none of the Company’s properties contain resources that satisfy the definition of proven and probable reserves. The Company classifies the development of its properties, including the El Gallo 1 mine, as exploration stage projects since no proven or probable reserves have been established.
Property and Equipment: As described in Design, Construction and Development Costs below, substantially all costs, including design, engineering, construction, and installation of equipment are expensed as incurred as the Company has not established proven and probable reserves on any of its properties except for the Company’s 49% interest in the San José mine. Only certain types of equipment which has alternative uses or significant salvage value, may be capitalized without proven and probable reserves. Depreciation is computed using the straight-line method with the exception of mining equipment. Mining equipment is depreciated using the units-of-production method based on tonnes processed over the estimated total mine life. Office furniture, equipment and light vehicles are being depreciated over estimated economic lives ranging from 3 to 5 years. Leasehold improvements, which relate to the Company’s corporate office, are being amortized over the term of the lease of 10 years. Trailers, heavy vehicles and other site equipment are being depreciated over estimated economic lives from 5 to 15 years. Buildings are being depreciated over an estimated economic life of 20 years.
Design, Construction, and Development Costs: Mine development costs include engineering and metallurgical studies, drilling and other related costs to delineate an ore body, and the removal of overburden to initially expose an ore body at open pit surface mines.
When proven and probable reserves as defined by SEC Industry Guide 7 exist, development costs are capitalized. Mine development costs incurred either to develop new ore deposits, expand the capacity of operating mines, or to develop mine areas substantially in advance of current production would be capitalized. Costs of start‑up activities and costs incurred to maintain current production or to maintain assets on a standby basis are charged to operations as incurred. If or when a project is abandoned, costs are charged to operations upon abandonment. All capitalized costs would be amortized using the units of production method over the estimated life of the ore body based on recoverable ounces to be mined from proven and probable reserves.
Certain costs to design and construct mining and processing facilities may be incurred prior to establishing proven and probable reserves. As no proven and probable reserves have been established on any of the Company’s properties except for the Company’s 49% interest in the San José mine, design, construction and development costs are not capitalized at any of the Company’s properties, and accordingly, substantially all costs are expensed as incurred. Additionally, the Company does not have a corresponding depreciation or amortization of these costs going forward since these expenditures were expensed as incurred as opposed to being capitalized.
86
MCEWEN MINING INC.
NOTES TO CONSOLIDATED FINANCIAL STATEMENTS
December 31, 2015
(tabular amounts are in thousands of U.S. dollars, unless otherwise noted) (continued)
Mineral Property Interests: Mineral property interests include acquired interests in advanced-stage properties and exploration stage properties, which are considered tangible assets. The amount capitalized relating to a mineral property interest represents its fair value at the time of acquisition, either as an individual asset purchase or as a part of a business combination. The value of mineral property interests is primarily driven by the nature and amount of mineralized material believed to be contained in the properties. When proven and probable reserves exist, the relevant capitalized costs and mineral property interests are to be charged to expense based on the units of production method and upon commencement of production. However, when a property does not contain mineralized material that satisfies the definition of proven and probable reserves, the amortization of the capitalized costs and mineral property interests are charged to expense based on the straight-line method over the estimated useful life of the mine, which according to the existing permits in place as of December 31, 2015 is estimated to end in late 2017. As a result of these and other differences, the Company’s financial statements will not be comparable to the financial statements of mining companies that have established reserves as defined by SEC Industry Guide 7.
Impairment of Assets: The Company reviews and evaluates its long-lived assets for impairment when events or changes in circumstances indicate that the related carrying amounts may not be recoverable. Mineral properties are monitored for impairment based on factors such as mineral prices, government regulation and taxation, the Company’s continued right to explore the area, exploration reports, assays, technical reports, drill results and its continued plans to fund exploration programs on the property.
For operating mines, recoverability is measured by comparing the undiscounted future net cash flows to the net book value. If the net book value exceeds future net undiscounted cash flows, an impairment loss is measured and recorded based on the excess of the net book value over fair value. Fair value for operating mines is determined using a combined approach, which uses a discounted cash flow model for the existing operations and a market approach for the fair value assessment of exploration land claims. Future cash flows are estimated based on quantities of recoverable mineralized material, expected gold and silver prices (considering current and historical prices, trends and related factors), production levels, operating costs, capital requirements and reclamation costs, all based on life-of-mine plans. The term “recoverable mineralized material” refers to the estimated amount of gold or other commodities that will be obtained after taking into account losses during processing and treatment of mineralized material. In estimating future cash flows, assets are grouped at the lowest level for which there are identifiable cash flows that are largely independent of future cash flows from other asset groups. The Company’s estimates of future cash flows are based on numerous assumptions and it is possible that actual future cash flows will be significantly different than the estimates, as actual future quantities of recoverable minerals, gold, silver and other commodity prices, production levels and costs and capital are each subject to significant risks and uncertainties.
For exploration properties, the Company considers various methods to indicate fair value. In performing this assessment, the Company will evaluate project characteristics and level of advancement. Generally, when a feasibility study is available, the Company will consider undiscounted future net cash flow. This approach was taken to evaluate Gold Bar for impairment.
If the Company is unable to estimate undiscounted future net cash flow, the Company will adopt a market approach to estimate fair value by using a combination of observed market value per square mile and observed market value per ounce or pound of mineral material based on comparable transactions. This approach was adopted in testing the following properties for impairment: Tonkin Complex, North Battle Mountain Complex, Los Azules and the El Gallo Complex.
For purposes of recognition and measurement of an impairment loss, the Company groups its properties by geological mineral complex, as this represents the lowest level at which the Company allocates its exploration spending independent of other assets and liabilities.
87
MCEWEN MINING INC.
NOTES TO CONSOLIDATED FINANCIAL STATEMENTS
December 31, 2015
(tabular amounts are in thousands of U.S. dollars, unless otherwise noted) (continued)
Asset Retirement Obligation: The Company records the fair value of a liability for an asset retirement obligation (“ARO”) in the period that it is incurred if a reasonable estimate of fair value can be made. The associated asset retirement costs are capitalized as part of the carrying amount of the long-lived asset when proven or probable reserves exist, or if they relate to an acquired mineral property interest. Since no proven or probable reserves have been established for any of the Company’s properties, other than at the San José mine, incremental asset retirement costs associated with the re-measurement of the fair value of the ARO at the El Gallo 1 mine or Tonkin property are charged to expense. Ongoing environmental and reclamation expenditures are debited against the ARO as incurred to the extent they relate to the ARO and to expense to the extent they do not. The fair value of AROs is measured by discounting the expected cash flows using a discount factor that reflects the credit-adjusted risk free rate of interest, while taking into account an inflation rate. The Company prepares estimates of the timing and amounts of expected cash flows when an ARO is incurred, which are updated to reflect changes in facts and circumstances. Changes in regulations or laws, any instances of non-compliance with laws or regulations that result in fines, or any unforeseen environmental contamination could result in a material impact to the amounts charged to operations for reclamation and remediation. Significant judgments and estimates are made when estimating the fair value of AROs. Expected cash flows relating to AROs could occur over long periods of time and the assessment of the extent of environmental remediation work is highly subjective. Considering all of these factors that go into the determination of an ARO, the fair value of the AROs can materially change over time.
Revenue Recognition: Revenue consists of sales value received for the Company’s principal products, gold and silver. The Company currently does not earn revenue from any products other than gold and silver. Revenue is recognized when title to gold and silver passes to the buyer and when collectability is reasonably assured. Title passes to the buyer based on terms of the sales contract. Product pricing is determined under the sales agreements at the point revenue is recognized by reference to active and freely traded commodity markets, for example, the London Bullion Market for both gold and silver, in an identical form to the product sold.
Gold and silver doré produced from the San José mine is sold at the prevailing spot market price based on the London A.M. fix, while concentrates are sold at the prevailing spot market price based on either the London P.M. fix or average of the London A.M. and London P.M fix depending on the sales contract. Concentrates are provisionally priced, whereby the selling price is subject to final adjustments at the end of a period ranging from 30 to 90 days after delivery to the customer. The final price is based on the market price at the relevant quotation point stipulated in the contract. Due to the time elapsed between shipment and the final settlement with the buyer, MSC must estimate the prices at which sales of metals will be settled. At the end of each financial reporting period, previously recorded provisional sales are adjusted to estimated settlement metals prices based on relevant forward market prices until final settlement with the buyer.
The Company entered into a doré sales agreement with a Canadian financial institution in July 2012. Under that agreement, the Company has the option to sell to the institution approximately 90% of the gold and silver contained in doré bars produced at the El Gallo 1 mine prior to the completion of refining by the third party refiner, which normally takes approximately 15 business days. Revenue is recognized when the Company has provided irrevocable instructions to the refiner to transfer to the purchaser the refined ounces sold upon final outturn, and when payment of the purchase price for the purchased doré or bullion has been made in full by the purchaser.
Royalty Expense: The El Gallo 1 mine has a net smelter return (“NSR”) royalty agreement with a third party on all mineral production from the El Gallo 1 mine and a portion of expected future mineral production from the El Gallo 2 project. The terms of the royalty agreement stipulate that production up to 30,000 of gold and gold equivalent ounces are subject to a 1% NSR, production between 30,001 to 380,000 of gold and gold equivalent ounces are subject to a 3.5% NSR, and 1% thereafter. Currently production from the El Gallo 1 mine is subject to the 3.5% NSR. Under the terms of the royalty agreement, the royalty holder has the option to settle the NSR payment in cash or gold and gold equivalent ounces. The royalty holder has indicated a preference to settle the NSR payment in gold and gold equivalent ounces which would be calculated on the day the refiner credits the mine’s metals account. Cumulatively, on a life‑of‑mine basis through to December 31, 2015, approximately 212,200 gold and gold equivalent ounces have been produced from mineralized
88
MCEWEN MINING INC.
NOTES TO CONSOLIDATED FINANCIAL STATEMENTS
December 31, 2015
(tabular amounts are in thousands of U.S. dollars, unless otherwise noted) (continued)
material within the scope of the NSR agreement. Royalty expenses are included in Production Costs Applicable to Sales in the Statement of Operations and Comprehensive Loss.
Property Holding Costs: Holding costs to maintain a property are expensed in the period they are incurred. These costs include security and maintenance expenses, lease and claim fees and payments, and environmental monitoring and reporting costs.
Exploration Costs: Exploration costs include costs incurred to identify new mineral resources, evaluate potential resources, and convert mineral resources into proven and probable reserves. Exploration costs are expensed as incurred.
Foreign Currency: The functional currency for the Company’s operations is the U.S. dollar. All monetary assets and liabilities denominated in a currency which is not the U.S. dollar are translated at current exchange rates at each balance sheet date and the resulting adjustments are included in a separate line item under other income (expense). Revenue and expense in foreign currencies are translated at the average exchange rates for the period.
Stock‑Based Compensation: The Company accounts for stock options at fair value as prescribed in ASC 718. The Company estimates the fair value of each stock option at the grant date by using the Black-Scholes option-pricing model and provides for expense recognition over the service period, if any, of the stock option.
In 2013, the Company entered into an agreement with one of its mining contractors to pay for a portion of mining services with shares of common stock of the Company, up to a maximum of 2,500,000 shares. The number of shares to be issued is determined monthly, based on the amount payable by the Company for services rendered above a defined tonnage threshold, using the closing price of the Company’s common stock quoted on active markets at the end of every month. The cost of the shares required to be issued are included in Production Costs Applicable to Sales. At every period-end, any outstanding shares owed are marked to market based on the price of the Company’s stock quoted on active markets. The agreement with this mining contractor expired and was renegotiated during 2015. Under the revised agreement, the Company can no longer make share payments and instead is required to settle the liabilities in cash.
Income Taxes: The Company accounts for income taxes under ASC 740. Using the liability method, recognizing certain temporary differences between the financial reporting basis of liabilities and assets and the related income tax basis for such liabilities and assets. This method generates either a net deferred income tax liability or asset for the Company, as measured by the statutory tax rates in effect. The Company derives the deferred income tax charge or benefit by recording the change in either the net deferred income tax liability or asset balance for the year. The Company records a valuation allowance against any portion of those deferred income tax assets when it believes, based on the weight of available evidence, it is more likely than not that some portion or all of the deferred income tax asset will not be realized.
Comprehensive Loss: In addition to net loss, comprehensive loss includes all changes in equity during a period, such as cumulative unrecognized changes in fair value of marketable equity securities classified as available‑for‑sale or other investments.
Per Share Amounts: Basic earnings or loss per share includes no dilution and is computed by dividing income or loss available to common shareholders by the weighted average number of common and exchangeable shares outstanding during the period. Diluted earnings or loss per share reflect the potential dilution of securities that could share in the earnings of the Company and are computed in accordance with the treasury stock method based on the average number of common shares and dilutive common share equivalents outstanding. In these financial statements stock options are not considered in the computation of diluted loss per share as their inclusion would be anti‑dilutive for the periods presented.
89
MCEWEN MINING INC.
NOTES TO CONSOLIDATED FINANCIAL STATEMENTS
December 31, 2015
(tabular amounts are in thousands of U.S. dollars, unless otherwise noted) (continued)
Loans and borrowings: Borrowings are recognized initially at fair value, net of financing costs incurred, and subsequently measured at amortized cost. Any difference between the amounts originally received and the redemption value of the debt is recognized in the consolidated statement of operations over the period to maturity using the effective interest method.
Fair Value of Financial Instruments: Fair value accounting, as prescribed in ASC Section 825, utilizes a fair value hierarchy that prioritizes the inputs to valuation techniques used to measure fair value. The hierarchy gives the highest priority to unadjusted quoted prices in active markets for identical assets and liabilities (Level 1 measurements) and the lowest priority to unobservable inputs (Level 3 measurements). The three levels of the fair value hierarchy are described below:
|
Level 1 |
Unadjusted quoted prices in active markets that are accessible at the measurement date for identical, unrestricted assets or liabilities; |
|
Level 2 |
Quoted prices in markets that are not active, or inputs that are observable, either directly or indirectly, for substantially the full term of the asset or liability; and |
|
Level 3 |
Prices or valuation techniques that require inputs that are both significant to the fair value measurement and unobservable (supported by little or no market activity). |
Recently Adopted Accounting Pronouncements
Presentation of Financial Statements and Property, Plant and Equipment – Reporting Discontinued Operations and Disclosures of Components of an Entity: In April 2014, Accounting Standards Codification (“ASC”) 205 and ASC 360 guidance were amended to change the requirements for reporting discontinued operations in ASC 205-20. A disposal of a component of an entity or a group of components of an entity is required to be reported in discontinued operations only if the disposal represents a strategic shift that has, or will have, a major effect on an entity’s operations and financial results when any of the following occurs: (1) the component of an entity or group of components of an entity meets the criteria in ASC 205-20-45-1E to be classified as held for sale; (2) the component of an entity or group of components of an entity is disposed of by sale; or (3) the component of an entity or group of components of an entity is disposed of other than by sale. The update is effective for the Company’s fiscal year beginning January 1, 2015. The new guidance did not have an impact on the Company’s consolidated financial statements.
Income Taxes – Classification of Deferred Taxes: In November 2015, the FASB issued ASU 2015-17 which simplifies income tax accounting. The update requires that all deferred tax assets and liabilities be classified as noncurrent on the balance sheet instead of separating deferred taxes into current and noncurrent amounts. This update is effective for fiscal years beginning after December 15, 2016, and interim periods within those fiscal years, and early adoption is permitted. The Company adopted this update as of December 31, 2015 and applied the change retrospectively, resulting in no changes in the Consolidated Balance Sheet previously reported.
Inventory – Simplifying the Measurement of Inventory: In July 2015, the FASB issued Accounting Standard Update (“ASU”) 2015-11 which provides authoritative guidance requiring inventory to be measured at the lower of cost or net realizable value. The new guidance defines net realizable value as the estimated selling price in the ordinary course of business, less reasonably predictable costs of completion, disposal and transportation. Current guidance requires inventory to be measured at the lower of cost or market where market could be replacement cost, net realizable value or net realizable value less an approximately normal profit margin. This pronouncement is effective for periods beginning after December 15, 2016, including interim periods within those fiscal years. The guidance is required to be applied prospectively, with early adoption permitted. The Company adopted this new guidance as of December 31, 2015, and as a result there was no impact on the Company’s consolidated financial statements.
Presentation of Financial Statements – Going Concern – Disclosure of Uncertainties about an Entity’s Ability to Continue as a Going Concern: In August 2014, ASC 205-40 guidance was amended to provide guidance about
90
MCEWEN MINING INC.
NOTES TO CONSOLIDATED FINANCIAL STATEMENTS
December 31, 2015
(tabular amounts are in thousands of U.S. dollars, unless otherwise noted) (continued)
management’s responsibility to evaluate whether there is substantial doubt about an entity’s ability to continue as a going concern and to provide related footnote disclosures. The amendments require management to assess an entity’s ability to continue as a going concern by incorporating and expanding upon certain principles that are currently in U.S. auditing standards. Specifically, the amendments (1) provide a definition of the term substantial doubt, (2) require an evaluation every reporting period including interim periods, (3) provide principles for considering the mitigating effect of management’s plans, (4) require certain disclosures when substantial doubt is alleviated as a result of consideration of management’s plans, (5) require an express statement and other disclosures when substantial doubt is not alleviated, and (6) require an assessment for a period of one year after the date that the financial statements are issued (or available to be issued). The amendments in this update shall be effective for annual periods ending after December 15, 2016, and interim periods within annual periods beginning after December 15, 2016, with early application permitted. The Company adopted this new guidance as of December 31, 2015, and as a result there was no impact on the Company’s consolidated financial statements.
Recently Issued Accounting Pronouncements
Leases – Amendments: In February 2016, the FASB issued ASU 2016-02 “leases (Topic 842)” which core principle is that a lessee should recognize the assets and the liabilities that arise from leases, including operating leases. Under the new requirements, a lessee will recognize in the statement of financial position a liability to make lease payments (the lease liability) and the right-of-use asset representing the right to the underlying asset for the lease term. For leases with a term of twelve months or less, the lessee is permitted to make an accounting policy election by class of underlying asset not to recognize lease assets and lease liabilities. The recognition, measurement, and presentation of expenses and cash flows arising from a lease by a lessee have not significantly changed from the previous GAAP. The standard is effective for fiscal years beginning after December 15, 2018, including interim periods within such fiscal year, with early adoption permitted. The ASU requires a modified retrospective transition method with the option to elect a package of practical expedients. The Company is evaluating the effect of this amendment and the impact it will have on the Company’s consolidated financial statements.
Business Combinations – Simplifying the Accounting for Measurement Period Adjustments: In September 2015, the FASB issued amended guidance which requires measurement period adjustments to be recorded in the reporting period in which the adjustment amounts are determined. Previously, such adjustments were required to be retrospectively recorded in prior period financial information. This amended guidance is effective for fiscal years beginning after December 15, 2015, including interim periods within those fiscal years. The amendments should be applied prospectively to adjustments to provisional amounts that occur after the effective date, with earlier application permitted for financial statements that have not been issued. The Company is evaluating this new guidance and does not expect it to have any impact on the Company’s consolidated financial statements.
Revenue from Contracts with Customers – Deferral of the Effective Date: In August 2015, the FASB issued ASU 2015-14, which defers the effective date of ASU 2014-09. ASU 2014-09 outlines a single comprehensive model for entities to use in accounting for revenue arising from contracts with customers and supersedes most current revenue recognition guidance, including industry-specific guidance. The effective date of this pronouncement is for fiscal years beginning after December 15, 2017. Earlier application is permitted only as of annual reporting periods beginning after December 15, 2016, including interim reporting periods within that reporting period. The Company is evaluating this new guidance and does not expect it to have any impact on the Company’s consolidated financial statements.
Interest – Imputation of Interest – Simplifying the Presentation of Debt Issuance Costs: In April 2015, the FASB issued ASU 2015-03 which requires entities to present debt issuance costs related to a debt liability as a direct deduction from the carrying amount of that debt liability on the balance sheet as opposed to being presented as a deferred charge. ASU 2015-03 does not contain guidance for debt issuance costs related to line-of-credit arrangements. Consequently, in
August 2015, the FASB issued ASU 2015-15 to add paragraphs indicating that the SEC staff would not object to an entity deferring and presenting debt issuance costs related to line-of-credit arrangements as an asset and subsequently amortizing the deferred debt issuance costs ratably over the term of the line-of-credit arrangement, regardless of whether there are any outstanding borrowings on the line-of-credit arrangement. The effective date of these pronouncements is for fiscal years beginning after December 15, 2015, with early adoption permitted. The Company is evaluating this new guidance and does not anticipate it to have any impact on the Company’s consolidated financial statements.
NOTE 3 INVESTMENTS
During the year ended December 31, 2015, the Company invested an additional $1.1 million of cash in marketable equity securities. As of December 31, 2015, the total cost of all marketable equity securities was $1.9 million (December 31, 2014 - $0.7 million). These securities are classified as available-for-sale securities and are valued at fair value. As at December 31, 2015, the fair value of these securities was $1.0 million, consequently the Company recorded a loss, net of tax, of $0.9 million in other comprehensive loss. The loss is recorded to an unrealized income and loss account (accumulated other comprehensive loss) that is reported as a separate line item in the shareholders' equity section of the balance sheet. The gains and losses for available-for-sale securities are not reported on the statement of operations until the securities are sold or if there is an other than temporary decline in fair value below cost.
NOTE 4 INVENTORIES
Inventories at December 31, 2015 and 2014 consist of the following:
|
|
|
December 31, 2015 |
|
December 31, 2014 |
|
||
|
Ore on leach pads |
|
$ |
7,150 |
|
$ |
6,221 |
|
|
In-process inventory |
|
|
2,830 |
|
|
2,302 |
|
|
Stockpiles |
|
|
1,923 |
|
|
— |
|
|
Precious metals |
|
|
1,820 |
|
|
2,403 |
|
|
Materials and supplies |
|
|
1,252 |
|
|
1,478 |
|
|
Total Inventories |
|
$ |
14,975 |
|
$ |
12,404 |
|
During the year ended December 31, 2015, no write-downs of inventory were recorded by the Company. During the year ended December 31, 2014, write-downs for an aggregate of $2.0 million were included as a component of Production Costs Applicable to Sales, to reduce the carrying value of ore on leach pads inventory, in-process inventory, and precious metals inventory to their net realizable value.
NOTE 5 MINERAL PROPERTY INTERESTS AND ASSET RETIREMENT OBLIGATIONS
Mineral Property Interests
The Company conducts a review of potential triggering events for all its mineral projects on a quarterly basis. When events or changes in circumstances indicate that the related carrying amounts may not be recoverable, the Company carries out a review and evaluation of its long-lived assets. In the year ended December 31, 2015, such triggering events were identified with respect to the Company’s Nevada, Argentinean and Mexico properties.
During the fourth quarter of 2015, the Company noted that the estimated market value per pound of copper equivalent mineralized material from comparable transactions was below the carrying value per pound of copper equivalent mineralized material of the Los Azules project, indicating a potential decrease in its market value, and therefore a requirement to test the Los Azules Project for recoverability. To assist in performing a recoverability test, the Company engaged a third-party valuation firm which determined that the carrying value of the property exceeded its estimated fair
91
MCEWEN MINING INC.
NOTES TO CONSOLIDATED FINANCIAL STATEMENTS
December 31, 2015
(tabular amounts are in thousands of U.S. dollars, unless otherwise noted) (continued)
value, resulting in an impairment charge of $11.4 million, along with a resulting deferred income tax recovery of $1.3 million, recorded in the Statement of Operations and Comprehensive Loss for the year ended December 31, 2015.
In addition, during the fourth quarter of 2015, the Company noted a decline in the observed market value of comparable transactions in Nevada, which indicated a potential significant decrease in the recoverable amount of the Tonkin project and North Battle Mountain Complex. In performing the recoverability test for these properties, the Company used the observed market value per acre and per ounce of gold mineralized material of comparable transactions to estimate the fair value of each property. The carrying value of each of the properties exceeded their estimated fair value, resulting in a pre-tax impairment charge of $6.1 million for Tonkin and $1.4 million for the North Battle Mountain Complex, along with a resulting deferred income tax recovery of $1.7 million and $0.5 million respectively, being recorded in the Statement of Operations and Comprehensive Loss for the year ended December 31, 2015.
For Nevada, during the second and third quarters of 2015 the Company performed a strategic review of its mineral property interests from which a decision was made to allow certain non-essential claims and portions of claims, included within the Gold Bar Complex (“Gold Bar” project) and Tonkin Complex (“Tonkin” project), to lapse on the September 1, 2015 renewal date and therefore reduce property holding costs that otherwise would have been incurred in 2015. This resulted in a pre-tax impairment charge of $29.7 million, from which $20.8 million was attributed to the Gold Bar project and $8.9 million to the Tonkin Project. An income tax recovery of $10.4 million related to the impairment loss was also recognized in the Statement of Operations and Comprehensive Loss for the year ended December 31, 2015.
Since the plan to develop the El Gallo 2 project has been deferred, during the fourth quarter of 2015 the Company performed a fair value analysis on the El Gallo 2 assets, including mineral property interest, land, surface ownership and construction-in-progress. As a result of this analysis, the carrying value of the asset was found to exceed its fair value in the amount of $2.0 million. Therefore, an impairment charge of $2.0 million was recorded in the Statement of Operations and Comprehensive Loss, and allocated to construction-in-progress, based on the impairment results for the year ended December 31, 2015.
For the year ended December 31, 2014, the Company recognized impairments on its Argentina and Nevada properties, for an aggregate of $353.7 million. For the Argentina properties, an initial $120.4 million impairment was recorded in the second quarter of 2014 when the Los Azules project was deemed to have a lower carrying value than the market price determined from a contemporaneous and comparable transaction completed at the time. Subsequently, during the fourth quarter of 2014 an additional $107.9 million was recorded given the continuous decline in the observed market value of the Los Azules project.
The deferred income tax recoveries resulting from these impairments were $22.5 million and $19.3 million, respectively. Further, when performing the recoverability test for the Gold Bar, Tonkin and North Battle Mountain properties, the Company noted that the carrying value of each of the properties exceeded their estimated fair value, resulting in a total impairment charge for Nevada and Argentina properties amounted to $98.4 million and $27.0 million, respectively, along with a resulting deferred income tax recovery of $31.6 million and $3.2 million, respectively, being recorded in the Statement of Operations and Comprehensive Loss for the year ended December 31, 2014. Refer to Note 17, Fair Value Accounting, for further details.
Impairments recorded in the year ended December 31, 2013 related to the Company’s exploration properties in Santa Cruz, Argentina, and Nevada, respectively. The impairment charge of $27.7 million, along with a deferred income tax recovery of $2.3 million, recorded in the second quarter of 2013 related to the Santa Cruz properties and were primarily due to an unexpected significant decline in gold and silver market prices, continued inflationary pressures and a new tax on mining reserves in the Province, resulting in a depressed market for exploration properties in Argentina.
92
MCEWEN MINING INC.
NOTES TO CONSOLIDATED FINANCIAL STATEMENTS
December 31, 2015
(tabular amounts are in thousands of U.S. dollars, unless otherwise noted) (continued)
Relating to the Company’s Nevada properties, an impairment charge of $6.3 million, along with a deferred income tax recovery of $2.2 million, was recorded in the third quarter of 2013 as a result of the Company selling or allowing certain claims to lapse. Finally, in the fourth quarter of 2013, an additional impairment charge of $28.9 million, along with a deferred tax recovery of $10.1 million, was recorded in relation to certain mineral property interests in Nevada, as part of the Company’s annual impairment test for the year ended December 31, 2013. The Company used the market approach to estimate the fair value of the impaired properties by using the observed market value per square mile based on comparable transactions in North America.
Based on the above, impairment charges were recorded on the following mineral property interests for the years ended December 31, 2015, 2014, and 2013:
|
Name of Property/Complex |
|
Segment |
|
|
2015 |
|
2014 |
|
2013 |
|
|||
|
Los Azules Project |
|
Argentina |
|
|
$ |
11,399 |
|
$ |
228,301 |
|
$ |
— |
|
|
Other San Juan Properties |
|
Argentina |
|
|
|
— |
|
|
7,817 |
|
|
— |
|
|
Telken Tenements(1) |
|
Argentina |
|
|
|
— |
|
|
— |
|
|
13,792 |
|
|
Este Tenements(1) |
|
Argentina |
|
|
|
— |
|
|
— |
|
|
2,784 |
|
|
Piramides Tenements(1) |
|
Argentina |
|
|
|
— |
|
|
— |
|
|
5,079 |
|
|
Tobias Tenements(1) |
|
Argentina |
|
|
|
— |
|
|
— |
|
|
6,074 |
|
|
Cerro Mojon Tenements |
|
Argentina |
|
|
|
— |
|
|
1,971 |
|
|
— |
|
|
La Merced Tenements |
|
Argentina |
|
|
|
— |
|
|
1,891 |
|
|
— |
|
|
Cabeza de Vaca Tenements |
|
Argentina |
|
|
|
— |
|
|
877 |
|
|
— |
|
|
El Trumai Tenements |
|
Argentina |
|
|
|
— |
|
|
1,534 |
|
|
— |
|
|
Martes 13 Tenements |
|
Argentina |
|
|
|
— |
|
|
3,568 |
|
|
— |
|
|
Celestina Tenements |
|
Argentina |
|
|
|
— |
|
|
1,753 |
|
|
— |
|
|
Other Santa Cruz Exploration Properties |
|
Argentina |
|
|
|
— |
|
|
7,601 |
|
|
— |
|
|
Gold Bar Complex |
|
Nevada |
|
|
|
20,847 |
|
|
25,435 |
|
|
— |
|
|
Tonkin Complex |
|
Nevada |
|
|
|
14,939 |
|
|
31,391 |
|
|
— |
|
|
Limo Complex |
|
Nevada |
|
|
|
— |
|
|
23,438 |
|
|
19,450 |
|
|
North Battle Mountain Complex |
|
Nevada |
|
|
|
1,443 |
|
|
1,921 |
|
|
— |
|
|
East Battle Mountain Complex |
|
Nevada |
|
|
|
— |
|
|
4,060 |
|
|
— |
|
|
West Battle Mountain Complex |
|
Nevada |
|
|
|
— |
|
|
2,567 |
|
|
6,287 |
|
|
Other United States Properties |
|
Nevada |
|
|
|
— |
|
|
9,611 |
|
|
9,497 |
|
|
Property, plant and equipment |
|
Mexico |
|
|
|
1,972 |
|
|
— |
|
|
— |
|
|
Total impairment |
|
|
|
|
$ |
50,600 |
|
$ |
353,736 |
|
$ |
62,963 |
|
|
1. |
In the fourth quarter of 2013, these tenements were transferred to MSC as part of the vend-in agreement described in Note 6, Investment in Minera Santa Cruz S.A. (“MSC”) – San José Mine, and were therefore not included in the Company’s mineral property interests as at December 31, 2015 and 2014. |
The carrying values for all of the mineral properties held by the Company as at December 31, 2015 and 2014 are noted below:
|
Name of Property/Complex |
|
State/Province |
|
Country |
|
2015 |
|
2014 |
|
||
|
Los Azules Copper Project |
|
San Juan |
|
Argentina |
|
$ |
191,490 |
|
$ |
202,889 |
|
|
Tonkin Complex |
|
Nevada |
|
United States |
|
|
4,833 |
|
|
20,423 |
|
|
Gold Bar Complex |
|
Nevada |
|
United States |
|
|
30,730 |
|
|
51,577 |
|
|
North Battle Mountain Complex |
|
Nevada |
|
United States |
|
|
785 |
|
|
2,227 |
|
|
El Gallo 1 Mine |
|
Sinaloa |
|
Mexico |
|
|
5,925 |
|
|
7,214 |
|
|
El Gallo 2 Properties |
|
Sinaloa |
|
Mexico |
|
|
3,482 |
|
|
3,482 |
|
|
Total Mineral Property Interests |
|
|
|
|
|
$ |
237,245 |
|
$ |
287,812 |
|
93
MCEWEN MINING INC.
NOTES TO CONSOLIDATED FINANCIAL STATEMENTS
December 31, 2015
(tabular amounts are in thousands of U.S. dollars, unless otherwise noted) (continued)
During the years ended December 31, 2015, 2014 and 2013, the Company incurred $8.8 million, $11.3 million, and $24.8 million, respectively, in exploration expenses and related expenditure costs which are included in the Statement of Operations and Comprehensive Loss in each of the years presented.
For the year ended December 31, 2015, the Company recorded $1.3 million (2014 - $1.3 million) of amortization expense related to El Gallo 1, which is included in Production Costs Applicable to Sales in the Statement of Operations and Comprehensive Loss for the year ended December 31, 2015. This included $0.8 million for the year ended December 31, 2015 (2014 - $0.8 million) in amortization expense related to its mineral properties in Mexico.
Asset Retirement Obligations
The Company is responsible for reclamation of certain past and future disturbances at its properties. The two most significant properties subject to these obligations are the depleted Tonkin property in Nevada and the El Gallo 1 mine in Mexico.
The current undiscounted estimate of the reclamation costs for existing disturbances on the Tonkin property to the degree required by the U.S. Bureau of Land Management (“BLM”) and the Nevada Department of Environmental Protection (“NDEP”) is $2.7 million. Assumptions used to compute the asset retirement obligations for the year ended December 31, 2015 for the Tonkin property included a credit adjusted risk free rate and inflation rate of 6.8% (2014, 2013 – 8.7%) and 1.69% (2014, 2013 – 3.0%), respectively. Expenses are expected to be incurred between the years 2016 and 2021. The Company submitted a mine closure plan to the NDEP and BLM for the Tonkin property during the fourth quarter of 2010. The closure plan was approved by the NDEP in March 2012 and by the BLM pursuant to the National Environmental Policy Act on September 21, 2015. Subsequently, on October 3, 2015 the BLM requested an updated bonding requirement in the amount of $3.6 million, which is covered within the surety bonds that the Company has as of December 31, 2015.
For mineral properties in the United States, the Company maintains required reclamation bonding with various governmental agencies. During the third quarter of 2014, the Company replaced its cash bonding of $4.8 million with surety bonds of the same amounts, as discussed in Note 13, Contingencies.
The current undiscounted estimate of the reclamation costs for existing disturbances at the El Gallo 1 mine is $6.8 million. Assumptions used to compute the asset retirement obligations for the year ended December 31, 2015 for the El Gallo 1 mine included a credit adjusted risk free rate and inflation rate of 6.8% (2014 – 6.4%) and 1.4% (2014 – 4.1%), respectively. Expenses are expected to be incurred between the years 2020 and 2022. Under current Mexican regulations, surety bonding of projected reclamation costs is not required.
The Company’s asset retirement obligations for years ended December 31, 2015 and 2014 are as follows:
|
|
|
Year ended December 31, 2015 |
|
Year ended December 31, 2014 |
|
||
|
Asset retirement obligation liability, beginning balance |
|
$ |
7,471 |
|
$ |
7,247 |
|
|
Settlements |
|
|
— |
|
|
(52) |
|
|
Accretion of liability |
|
|
429 |
|
|
407 |
|
|
Adjustment reflecting updated estimates |
|
|
(116) |
|
|
(131) |
|
|
Asset retirement obligation liability, ending balance |
|
$ |
7,784 |
|
$ |
7,471 |
|
As at December 31, 2015, the current portion of the asset retirement obligation was $0.2 million (December 31, 2014 - $2.4 million).
94
MCEWEN MINING INC.
NOTES TO CONSOLIDATED FINANCIAL STATEMENTS
December 31, 2015
(tabular amounts are in thousands of U.S. dollars, unless otherwise noted) (continued)
The definition of proven and probable reserves is set forth in SEC Industry Guide 7. If and when proven and probable reserves, as defined under SEC Industry Guide 7, exist at the Company’s properties, the relevant capitalized mineral property interests and asset retirement costs are to be amortized to expense based on the units of production method and upon commencement of production. Since the Company has not completed feasibility or other studies sufficient to characterize the mineralized material at El Gallo 1 as proven or probable reserves under the SEC definition, the amortization of the capitalized mineral property interests and asset retirement costs are amortized to expense based on the straight-line method over the estimated useful life of the mine. For the year ended December 31, 2015, the Company recorded $1.3 million (2014 – $1.3 million) of straight-line amortization expense related to El Gallo 1, which is included in Production Costs Applicable to Sales in the Statement of Operations and Comprehensive Loss for the year ended December 31, 2015, of which $0.5 million (2014 – $0.5 million) related to the amortization of capitalized asset retirement costs.
NOTE 6 INVESTMENT IN MINERA SANTA CRUZ S.A. (“MSC”) - SAN JOSÉ MINE
As noted in Note 2, Summary of Significant Accounting Policies - Investments, the Company accounts for investments over which it exerts significant influence but does not control through majority ownership using the equity method of accounting. In applying the equity method of accounting to the Company’s investment in MSC, MSC’s financial statements, which are originally prepared by MSC in accordance with International Financial Reporting Standards as issued by the International Accounting Standards Board, have been adjusted to conform with U.S. GAAP. As such, the summarized financial data presented under this heading is in accordance with U.S. GAAP.
The Company’s 49% attributable share of operations from its investment in MSC was income of $2.4 million for the year ended December 31, 2015, compared to a loss of $5.3 million for the year ended December 31, 2014 and income of $0.8 million for the year ended December 31, 2013. These amounts are net of the amortization of the fair value increments arising from the purchase price allocation and related income tax recovery. Included in the income tax recovery is the impact of fluctuations in the exchange rate between the Argentine peso and the U.S. dollar on the peso-denominated deferred tax liability associated with the investment in MSC recorded as part of the acquisition of Minera Andes. As a devaluation of the Argentine peso relative to the U.S. dollar results in a recovery of deferred income taxes, the impact has been a decrease to the Company’s loss, or an increase to the Company’s income, from its investment in MSC.
On October 22, 2015 the Company and Hochschild, both entered into vend-in agreements with MSC pursuant to which the Company agreed to vend-in its remaining Santa Cruz exploration properties, which did not have any assigned carrying value. The properties transferred, total approximately 100,600 hectares, and are located in the province of Santa Cruz. The agreement also provides for 2% net smelter return royalty payable to the Company or Hochschild based on any of MSC’s production from the respective mineral properties contributed by each party.
During the year ended December 31, 2015, the Company recorded an impairment charge of $11.8 million on its investment in MSC (2014 - $21.2 million), primarily as a result of the significant decline in long-term estimated silver market prices, as well as in the observed market value of comparable transactions in South America, which indicated a likely significant decrease in the value of the exploration properties owned by MSC. These factors caused the Company to assess that there was a decline in fair value of its investment in MSC that was other than temporary. To estimate the fair value of the Company’s investment in MSC and measure the impairment, the Company used a combined approach, which uses a discounted cash flow model for the operating mine and a market approach for the fair value assessment of exploration properties, and determined that the carrying value of the investment in MSC exceeded its estimated fair value. As the loss in value of the investment was considered other than temporary, an impairment of $11.8 million was recorded in the Company’s Consolidated Statement of Operations and Comprehensive Loss for the year ended December 31, 2015 (2014 - $21.2 million). Refer to Note 17, Fair Value Accounting, for further detail of the valuation of MSC.
95
MCEWEN MINING INC.
NOTES TO CONSOLIDATED FINANCIAL STATEMENTS
December 31, 2015
(tabular amounts are in thousands of U.S. dollars, unless otherwise noted) (continued)
During the fourth quarter of 2013, the Company entered into a vend-in agreement with MSC and subsidiaries of Hochschild pursuant to which both parties agreed to contribute to MSC the mining rights of certain exploration properties located in Santa Cruz Province. The carrying value of the Company’s properties at the time of the transfer of $35.9 million, net of the related deferred tax liability of $17.3 million, was recorded as an increase in the Company’s investment in MSC, with no gain or loss recognized upon transfer.
During the year ended December 31, 2015, the Company received $0.5 million in dividends from MSC, compared to $9.5 million in 2014.
Changes in the Company’s investment in MSC for the year ended December 31, 2015 and 2014 are as follows:
|
|
|
Year ended December 31, 2015 |
|
Year ended December 31, 2014 |
|
||
|
Investment in MSC, beginning of the year |
|
$ |
177,018 |
|
$ |
212,947 |
|
|
Attributable net loss from MSC |
|
|
(2,859) |
|
|
(2,597) |
|
|
Amortization of fair value increments |
|
|
(10,669) |
|
|
(13,190) |
|
|
Income tax recovery |
|
|
15,942 |
|
|
10,503 |
|
|
Dividend distribution received |
|
|
(548) |
|
|
(9,483) |
|
|
Impairment of investment in MSC |
|
|
(11,777) |
|
|
(21,162) |
|
|
Investment in MSC, end of the year |
|
$ |
167,107 |
|
$ |
177,018 |
|
A summary of the operating results from MSC for the year ended December 31, 2015, 2014, and 2013 is as follows:
|
|
|
Year ended December 31, |
|
|||||||
|
|
|
2015 |
|
2014 |
|
2013 |
|
|||
|
Minera Santa Cruz S.A. (100%) |
|
|
|
|
|
|
|
|
|
|
|
Net Sales |
|
$ |
186,095 |
|
$ |
213,013 |
|
$ |
240,723 |
|
|
Production costs applicable to sales |
|
|
(158,615) |
|
|
(173,274) |
|
|
(190,281) |
|
|
Net (loss) income |
|
|
(5,835) |
|
|
(5,300) |
|
|
4,338 |
|
|
|
|
|
|
|
|
|
|
|
|
|
|
Portion attributable to McEwen Mining Inc. (49%) |
|
|
|
|
|
|
|
|
|
|
|
Net (loss) income |
|
$ |
(2,859) |
|
$ |
(2,597) |
|
$ |
2,126 |
|
|
Amortization of fair value increments |
|
|
(10,669) |
|
|
(13,190) |
|
|
(18,425) |
|
|
Income tax recovery |
|
|
15,942 |
|
|
10,503 |
|
|
17,145 |
|
|
Income (loss) from investment in MSC, net of amortization |
|
$ |
2,414 |
|
$ |
(5,284) |
|
$ |
846 |
|
As at December 31, 2015, MSC had current assets of $95.3 million, total assets of $486.3 million, current liabilities of $38.8 million and total liabilities of $145.3 million. These balances include the increase in fair value and amortization of the fair value increments arising from the purchase price allocation and are net of the impairment charges. Excluding the fair value increments from the purchase price allocation and impairment charges, MSC had current assets of $91.1 million, total assets of $282.5 million, current liabilities of $44.4 million, and total liabilities of $79.5 million as at December 31, 2015.
96
MCEWEN MINING INC.
NOTES TO CONSOLIDATED FINANCIAL STATEMENTS
December 31, 2015
(tabular amounts are in thousands of U.S. dollars, unless otherwise noted) (continued)
NOTE 7 PROPERTY AND EQUIPMENT
As of December 31, 2015 and 2014, property and equipment consisted of the following:
|
|
|
December 31, 2015 |
|
December 31, 2014 |
|
||
|
Trucks and trailers |
|
$ |
1,065 |
|
$ |
1,012 |
|
|
Office furniture and equipment |
|
|
1,543 |
|
|
1,404 |
|
|
Leasehold improvements |
|
|
661 |
|
|
661 |
|
|
Drill rigs |
|
|
1,061 |
|
|
998 |
|
|
Building |
|
|
1,514 |
|
|
1,514 |
|
|
Land |
|
|
8,699 |
|
|
8,699 |
|
|
Mining equipment |
|
|
1,625 |
|
|
1,548 |
|
|
Construction-in-process |
|
|
4,314 |
|
|
6,286 |
|
|
Subtotal |
|
$ |
20,482 |
|
$ |
22,122 |
|
|
Less: accumulated depreciation |
|
|
(4,723) |
|
|
(4,226) |
|
|
Total |
|
$ |
15,759 |
|
$ |
17,896 |
|
Additions to property and equipment during the year ended December 31, 2015 are mainly in relation to drill rigs and mining equipment acquired for the El Gallo 1 mine. Depreciation expense for 2015 was $0.9 million (2014 - $1.0 million, 2013 - $0.9 million).
97
MCEWEN MINING INC.
NOTES TO CONSOLIDATED FINANCIAL STATEMENTS
December 31, 2015
(tabular amounts are in thousands of U.S. dollars, unless otherwise noted) (continued)
NOTE 8 INCOME TAXES
A reconciliation of the tax provision for 2015, 2014 and 2013 at statutory U.S. Federal and State income tax rates to the actual tax provision recorded in the financial statements is computed as follows:
|
Expected tax recovery at |
|
2015 |
|
2014 |
|
2013 |
|
|||
|
Loss before income taxes |
|
$ |
(45,010) |
|
|
(419,113) |
|
|
(201,107) |
|
|
Statutory tax rate |
|
|
34% |
|
|
34% |
|
|
34% |
|
|
US Federal and State tax recovery at statutory rate |
|
$ |
(15,303) |
|
$ |
(142,498) |
|
$ |
(68,376) |
|
|
Reconciling items: |
|
|
|
|
|
|
|
|
|
|
|
Equity pickup in MSC |
|
|
(821) |
|
|
1,850 |
|
|
(2,924) |
|
|
Impairment of MSC |
|
|
4,004 |
|
|
7,407 |
|
|
33,557 |
|
|
Revisions to prior year estimates |
|
|
906 |
|
|
8,330 |
|
|
(19,016) |
|
|
Adjustment for foreign tax rates |
|
|
(1,230) |
|
|
(1,803) |
|
|
6,573 |
|
|
Other permanent differences |
|
|
(15,694) |
|
|
(14,760) |
|
|
(11,296) |
|
|
Unrealized foreign exchange rate (loss)/gain |
|
|
9,389 |
|
|
19,444 |
|
|
(28,319) |
|
|
NOL expired |
|
|
1,215 |
|
|
10,268 |
|
|
1,711 |
|
|
Valuation allowance |
|
|
(7,026) |
|
|
4,592 |
|
|
34,725 |
|
|
Tax Recovery |
|
$ |
(24,560) |
|
$ |
(107,170) |
|
$ |
(53,365) |
|
The tax effects of temporary differences that give rise to significant portions of the deferred tax assets and deferred tax liabilities as at December 31, 2015 and 2014 respectively are presented below:
|
|
|
2015 |
|
2014 |
|
||
|
Deferred tax assets: |
|
|
|
|
|
|
|
|
Net operating loss carryforward |
|
$ |
105,555 |
|
$ |
108,070 |
|
|
Mineral Properties |
|
|
11,842 |
|
|
14,797 |
|
|
Other temporary differences |
|
|
5,371 |
|
|
7,141 |
|
|
Total gross deferred tax assets |
|
|
122,768 |
|
|
130,008 |
|
|
Less: valuation allowance |
|
|
(122,768) |
|
|
(129,794) |
|
|
Net deferred tax assets |
|
$ |
— |
|
$ |
214 |
|
|
Deferred tax liabilities: |
|
|
|
|
|
|
|
|
Investments |
|
$ |
— |
|
$ |
(214) |
|
|
Acquired mineral property interests |
|
|
(26,899) |
|
|
(51,899) |
|
|
Total deferred tax liabilities |
|
|
(26,899) |
|
|
(52,113) |
|
|
Total net deferred tax liabilities |
|
$ |
(26,899) |
|
$ |
(51,899) |
|
The Company believes that it is unlikely that the full amount of deferred tax assets will be realized. Therefore, a valuation allowance has been provided for most of the full amount of deferred tax assets. The change in valuation allowance of approximately $7.0 million primarily reflects a decrease of net operating loss carryforwards and mineral properties. In 2014 the change in valuation allowance of approximately $4.6 million primarily reflects a decrease of net operating loss carryforwards.
98
MCEWEN MINING INC.
NOTES TO CONSOLIDATED FINANCIAL STATEMENTS
December 31, 2015
(tabular amounts are in thousands of U.S. dollars, unless otherwise noted) (continued)
The table below summarizes changes to the valuation allowance:
|
For the year ended December 31, |
|
|
Balance at Beginning of Period |
|
|
Additions (a) |
|
|
Deductions (b) |
|
|
Balance at End of Period |
|
2015 |
|
$ |
129,794 |
|
$ |
6,873 |
|
$ |
(13,899) |
|
$ |
122,768 |
|
2014 |
|
|
125,202 |
|
|
11,514 |
|
|
(6,922) |
|
|
129,794 |
|
2013 |
|
|
90,477 |
|
|
35,547 |
|
|
(822) |
|
|
125,202 |
|
(a) |
The additions to valuation allowance mainly results from the Company and its subsidiaries incurring losses and exploration expenses for tax purposes which do not meet the more-likely-than-not criterion for recognition of deferred tax assets. |
|
(b) |
The reductions to valuation allowance mainly results from expiration of the Company's tax attributes and foreign exchange reductions of tax attributes in Mexico and Argentina. |
The deferred tax liability related to the Minera Andes acquisition was $19.8 million as at December 31, 2015 (2014 - $26.6 million).
On December 11, 2013, the Mexican government enacted a tax reform that increased the effective tax rate applicable to the Company's Mexican operations. The law, effective January 1, 2014, introduced a Special Mining Duty of 7.5%. The Special Mining duty is deductible for income tax purposes. The Special Mining Duty is generally applicable to earnings before income tax, depreciation, depletion, amortization and interest. There are no deductions allowed for development type costs but exploration and prospecting costs can be claimed. In addition, certain undeducted exploration expenditures incurred prior to January 1, 2014 are also deductible in the calculation of the Special Mining Duty. For the year ended December 31, 2015 and 2014, the Company had no taxes payable under the 7.5% Special Mining Duty.
The following table summarizes the Company’s losses that can be applied against future taxable profit:
|
Country |
Type of Loss |
|
|
Amount |
Expiry Period |
|
United States (a) |
Non operating losses |
|
$ |
158,974 |
2016-2035 |
|
Mexico |
Non operating losses |
|
|
57,822 |
2016-2025 |
|
Canada |
Non operating losses |
|
|
20,349 |
2016-2035 |
|
Argentina |
Non operating losses |
|
|
85,878 |
2016-2020 |
|
(a) |
The losses in the United States and Argentina are part of a multiple consolidating groups, and therefore, may be restricted in use to specific projects. |
The Company or its subsidiaries file income tax returns in Canada, the United States, Mexico, and Argentina. These tax returns are subject to examination by local taxation authorities provided the tax years remain open to audit under the relevant statute of limitations. The following summarizes the open tax years by major jurisdiction:
United States: 2012 to 2015
Canada: 2008 to 2015
Mexico: 2011 to 2015
Argentina: 2011 to 2015
NOTE 9 SHORT-TERM BANK INDEBTEDNESS
On May 29, 2015, Compañía Minera Pangea S.A. de C.V. (“CMP”), a wholly-owned subsidiary of the Company, finalized a line of credit agreement with Banco Nacional de Comercio Exterior (“Banco Nacional”), for an amount up to 90,000,000 Mexican pesos (approximately $5.9 million as of May 29, 2015), which is secured by CMP’s VAT receivable balance.
99
MCEWEN MINING INC.
NOTES TO CONSOLIDATED FINANCIAL STATEMENTS
December 31, 2015
(tabular amounts are in thousands of U.S. dollars, unless otherwise noted) (continued)
The applicable interest rate is equal to: (i) two and one-half percent (2.5%) per annum plus (ii) the 91 day Interbank Equilibrium Interest Rate (“TIIE”) rate, as published by the Bank of Mexico, payable quarterly. As of December 31, 2015, the 91 day TIIE rate was 3.58%. Interest payments are due quarterly and a final payment of all principal and any accrued interest is due twenty-four (24) months following the date of the first withdrawal. CMP is permitted to prepay any amounts owed without penalty. Upon signing the agreement, CMP paid a 1% commission on the total value of the simple credit agreement to Banco Nacional.
On June 1, 2015, CMP drew down the entire 90,000,000 Mexican pesos, equivalent to $5.2 million as of December 31, 2015 from the line of credit, and realized a foreign exchange gain of approximately $0.7 million during the period. During the year ended December 31, 2015, CMP collected 34,654,201 Mexican pesos (equivalent to $2.0 million as of December 31, 2015) of VAT receivable, from which 2,903,100 Mexican pesos were applied against the accrued interest and the remaining 31,751,101 Mexican pesos (approximately $1.8 million as of December 31, 2015) were applied against the principal. The Company has guaranteed CMP’s obligations under the line of credit.
On January 13, 2016 CMP paid the remaining balance of 58,248,899 Mexican Pesos (approximately $3.4 million as of December 31, 2015) and fulfilled its obligation to Banco Nacional. As a result, this line of credit has been closed.
NOTE 10 SHAREHOLDERS’ EQUITY
During the year ended December 31, 2015, there were no exercises of stock options under the Equity Incentive Plan. This compares to approximately 1,499,300 shares of common stock issued during 2014 upon exercise at a weighted average exercise price of $1.29 per share, for proceeds of $1.9 million. During the year ended December 31, 2014 the Company also issued 198,000 shares of common stock upon exercise of certain stock options the Company assumed as part of the Minera Andes Inc. acquisition, at a weighted average exercise price of C$1.96 per share for proceeds of $0.4 million.
During the year ended December 31, 2015, the Company issued 430,295 shares of common stock as part of an agreement with one of its mining contractors to settle parts of its accounts payable for services rendered above a defined tonnage threshold. The fair value of the common stock at the time of issuance was $0.4 million. The agreement with this mining contractor expired and was renegotiated during the year and under the revised agreement, the Company can no longer make share payments and instead is required to pay in cash.
On June 18, 2015, the Board of Directors declared an annual return of capital distribution of $0.01 per share of common stock, payable semi-annually. The first semi-annual return of capital distribution payment of $0.005 was paid on August 17, 2015 to shareholders of record as of the close of business on July 31, 2015. The aggregate total semi-annual return of capital distribution paid was $1.5 million. Return of capital distribution is paid to holders of the Company’s common stock and exchangeable shares.
Subsequent to December 31, 2015, the Company paid aggregate total of $1.5 million as a result of the second semi-annual return of capital distribution made on February 12, 2016.
During the year ended December 31, 2015, 4.3 million (2014 – 3.7 million) exchangeable shares were converted into common stock. At December 31, 2015, the total outstanding exchangeable shares not exchanged and not owned by the Company or its subsidiaries totaled 24.2 million (2014 – 28.5 million). These exchangeable shares were initially issued by the Company in connection with the acquisition of Minera Andes. The exchangeable shares, by virtue of the redemption and exchange rights attached to them and the provisions of certain voting and support agreements, provide the holders with economic and voting rights that are, as nearly as practicable, equivalent to those of a holder of common stock of the Company. Accordingly, remaining exchangeable shares are included as part of the consolidated share capital of the Company.
100
MCEWEN MINING INC.
NOTES TO CONSOLIDATED FINANCIAL STATEMENTS
December 31, 2015
(tabular amounts are in thousands of U.S. dollars, unless otherwise noted) (continued)
On October 1, 2015, the Board of Directors approved a share repurchase program authorizing the Company to purchase up to 15,000,000 shares of its common stock over a twelve month period, with an authorized maximum of $15.0 million to be spent on the repurchases. Under the program, purchases of common stock may be made from time-to-time in the open market, subject to compliance with applicable U.S. and Canadian laws. The timing and amounts of any purchase are based on market conditions and other factors including share price, regulatory requirements and capital availability. Further, the repurchase program may be suspended, discontinued or modified at any time, at the discretion of the Board of Directors. As of December 31, 2015 the Company had repurchased 1,896,442 shares of common stock at a total cost of $1.8 million, which have been cancelled.
On October 16, 2014, the Company terminated the Back-In Right Option entered into with TNR Gold Corp (“TNR”) in November 2012. In exchange for the termination of the Back-In Right Option, the Company issued 850,000 shares of common stock to TNR, and granted a 0.4% net smelter royalty (“NSR”) on the Los Azules project. The value of the 850,000 shares of $1.4 million was recorded as Exploration Costs in the Statement of Operations and Comprehensive Loss for the year ended December 31, 2014.
NOTE 11 STOCK BASED COMPENSATION
Stock Options
The Company has an equity incentive plan, under which equity awards may be granted to employees, consultants, advisors, and directors (the “Plan”). The Plan is administered by the Board of Directors, which determines the terms pursuant to which any award is granted. The Board of Directors may delegate to certain officers the authority to grant awards to certain employees (other than such officers), consultants and advisors. The number of shares of common stock reserved for issuance thereunder is 17.5 million shares, with no more than 1 million shares subject to grants of options to an individual in a calendar year. The plan also provides for the grant of incentive options under Section 422 of the Internal Revenue Code (the “Code”), which provide potential tax benefits to the recipients compared to non-qualified options.
101
MCEWEN MINING INC.
NOTES TO CONSOLIDATED FINANCIAL STATEMENTS
December 31, 2015
(tabular amounts are in thousands of U.S. dollars, unless otherwise noted) (continued)
The following table summarizes information about stock options under the Plan outstanding at December 31, 2015:
|
|
|
|
|
|
|
|
Weighted |
|
|
|
|
|
|
|
|
|
Weighted |
|
Average |
|
|
|
|
|
|
Average |
Remaining |
||||||||||
|
|
|
Number of |
|
Exercise |
|
Contractual |
|
Intrinsic |
|
||
|
|
|
Shares |
|
Price |
|
Life (Years) |
|
Value |
|
||
|
|
|
(in thousands, except per share and year data) |
|
||||||||
|
Balance at December 31, 2012 |
|
3,561 |
|
|
3.47 |
|
6.6 |
|
|
— |
|
|
Granted |
|
1,728 |
|
|
2.26 |
|
— |
|
|
— |
|
|
Exercised |
|
(48) |
|
|
1.97 |
|
— |
|
$ |
47 |
|
|
Forfeited |
|
(400) |
|
|
4.57 |
|
— |
|
|
— |
|
|
Balance at December 31, 2013 |
|
4,841 |
|
|
2.96 |
|
5.2 |
|
|
— |
|
|
Granted |
|
1,731 |
|
|
2.90 |
|
— |
|
|
— |
|
|
Exercised |
|
(1,499) |
|
|
1.29 |
|
— |
|
$ |
438 |
|
|
Forfeited |
|
(422) |
|
|
4.39 |
|
— |
|
|
— |
|
|
Balance at December 31, 2014 |
|
4,651 |
|
|
3.35 |
|
4.4 |
|
|
— |
|
|
Granted |
|
2,733 |
|
|
1.03 |
|
— |
|
|
— |
|
|
Forfeited |
|
(272) |
|
|
2.82 |
|
— |
|
|
— |
|
|
Expired |
|
(158) |
|
|
2.12 |
|
— |
|
|
— |
|
|
Balance at December 31, 2015 |
|
6,954 |
|
|
2.49 |
|
4.1 |
|
$ |
98 |
|
|
Exercisable at December 31, 2015 |
|
2,772 |
|
|
3.80 |
|
3.7 |
|
$ |
8 |
|
Stock options have been granted to key employees, directors and consultants under the Plan. Options to purchase shares under the Plan were granted at or above market value as of the date of the grant. During the year ended December 31, 2015, the Company granted stock options to certain employees and directors for an aggregate of 2.7 million shares of common stock (2014 - 1.7 million, 2013 - 1.7 million) at a weighted average exercise price of $1.03 per share (2014 – $2.90, 2013 - $2.26). The options vest equally over a three‑year period if the individual remains affiliated with the Company (subject to acceleration of vesting in certain events) and are exercisable for a period of 5 years from the date of issue.
The fair value of the options granted under the Plan was estimated at the date of grant, using the Black-Scholes Option Valuation Model, with the following weighted-average assumptions:
|
|
|
|
|
|
|
|
|
|
|
|
|
|
|
|
|
|
2015 |
|
|
2014 |
|
2013 |
|
|||||
|
Risk-free interest rate |
|
|
1.10 |
% |
to |
1.79 |
% |
|
1.01 |
% |
|
0.5% to 0.86% |
|
|
Dividend yield |
|
|
0 |
% |
to |
1.15 |
% |
|
0 |
% |
|
0 |
% |
|
Volatility factor of the expected market price of common stock |
|
|
73 |
% |
to |
74 |
% |
|
70 |
% |
|
66% to 69% |
|
|
Weighted-average expected life of option |
|
|
3.5 years |
|
|
3.5 years |
|
|
3.5 years |
|
|||
|
Weighted-average grant date fair value |
|
$ |
0.49 |
|
$ |
1.45 |
|
$ |
1.02 |
|
|||
During the year ended December 31, 2015, the Company recorded stock option expense of $1.3 million (2014 -$1.3 million, 2013 - $1.4 million).
At December 31, 2015, there was $1.6 million (2014 - $1.8 million, 2013 - $1.1 million) of unrecognized compensation expense related to 4.2 million (2014 - 2.7 million, 2013 - 2.0 million) unvested stock options outstanding. This cost is expected to be recognized over a weighted-average period of approximately 1.6 years (2014 - 1.6 years, 2013 – 1.4 years).
102
MCEWEN MINING INC.
NOTES TO CONSOLIDATED FINANCIAL STATEMENTS
December 31, 2015
(tabular amounts are in thousands of U.S. dollars, unless otherwise noted) (continued)
The following tables summarize information about stock options outstanding and exercisable at December 31, 2015 for the Company’s Plan and the replacement options from the acquisition of Nevada Pacific Gold Ltd. in 2007. The replacement options from the acquisition of Minera Andes in 2012 were fully expired as of December 31, 2015. C$ refers to Canadian dollars.
McEwen Mining Inc.
|
|
|
|
|
|
|
Options Outstanding |
|
Options Exercisable |
|
||||||||||
|
|
|
|
|
|
|
|
|
|
|
|
Weighted |
|
|
|
|
|
|
Weighted |
|
|
|
|
|
|
|
|
|
|
Weighted |
|
Average |
|
|
|
Weighted |
|
Average |
|
||
|
|
|
|
|
|
|
|
|
Average |
|
Remaining |
|
|
|
Average |
|
Remaining |
|
||
|
|
|
|
|
|
|
Number |
|
Exercise |
|
Contractual |
|
Number |
|
Exercise |
|
Contractual |
|
||
|
Range of Exercise Price |
|
Outstanding |
|
Price |
|
Life (Years) |
|
Exercisable |
|
Price |
|
Life (Years) |
|
||||||
|
$ |
0.91 |
- |
$ |
1.04 |
|
2,298,667 |
|
$ |
1.02 |
|
4.9 |
|
55,667 |
|
$ |
0.91 |
|
3.0 |
|
|
$ |
1.05 |
- |
$ |
2.38 |
|
1,745,000 |
|
$ |
1.92 |
|
3.1 |
|
850,669 |
|
$ |
2.24 |
|
2.4 |
|
|
$ |
2.39 |
- |
$ |
2.71 |
|
306,800 |
|
$ |
2.51 |
|
4.1 |
|
306,800 |
|
$ |
2.51 |
|
4.1 |
|
|
$ |
2.72 |
- |
$ |
3.09 |
|
1,567,500 |
|
$ |
2.90 |
|
3.6 |
|
522,498 |
|
$ |
2.90 |
|
3.6 |
|
|
$ |
3.10 |
- |
$ |
8.30 |
|
1,036,000 |
|
$ |
6.09 |
|
4.7 |
|
1,036,000 |
|
$ |
6.09 |
|
4.7 |
|
|
|
Total |
|
6,953,967 |
|
$ |
2.49 |
|
4.1 |
|
2,771,634 |
|
$ |
3.80 |
|
3.7 |
|
|||
Nevada Pacific Gold Ltd.
|
|
|
|
|
|
|
Options Outstanding |
|
Options Exercisable |
|
||||||||||
|
|
|
|
|
|
|
|
|
|
|
|
Weighted |
|
|
|
|
|
|
Weighted |
|
|
|
|
|
|
|
|
|
|
Weighted |
|
Average |
|
|
|
Weighted |
|
Average |
|
||
|
|
|
|
|
|
|
|
|
Average |
|
Remaining |
|
|
|
Average |
|
Remaining |
|
||
|
|
|
|
|
|
|
Number |
|
Exercise |
|
Contractual |
|
Number |
|
Exercise |
|
Contractual |
|
||
|
Range of Exercise Price |
|
Outstanding |
|
Price |
|
Life (Years) |
|
Exercisable |
|
Price |
|
Life (Years) |
|
||||||
|
C$ |
4.30 |
- |
C$ |
4.52 |
|
40,500 |
|
C$ |
4.30 |
|
0.2 |
|
40,500 |
|
C$ |
4.30 |
|
0.2 |
|
|
C$ |
4.53 |
- |
C$ |
4.83 |
|
110,343 |
|
C$ |
4.74 |
|
0.9 |
|
110,343 |
|
C$ |
4.74 |
|
0.9 |
|
|
C$ |
4.84 |
- |
C$ |
5.81 |
|
2,300 |
|
C$ |
4.91 |
|
1.1 |
|
2,300 |
|
C$ |
4.91 |
|
1.1 |
|
|
C$ |
5.82 |
- |
C$ |
6.70 |
46,000 |
C$ |
6.70 | 0.4 | 46,000 |
C$ |
6.70 | 0.4 | |||||||
|
Total |
|
199,143 |
|
C$ |
5.11 |
|
0.7 |
|
199,143 |
|
C$ |
5.11 |
|
0.7 |
|
||||
NOTE 12 LOSS PER SHARE
Basic net loss per share is computed by dividing the net loss available to common shareholders by the weighted average number of common shares outstanding during the period. Diluted net loss per share is computed similarly except that the weighted average number of common shares is increased to reflect all dilutive instruments.
Below is a reconciliation of the basic and diluted weighted average number of common shares and the computations for basic loss per share for the year ended December 31, 2015, 2014 and 2013:
|
|
|
|
2015 |
|
2014 |
|
2013 |
|
|||
|
|
|
|
(in thousands, except per share amounts) |
|
|||||||
|
Net loss |
|
|
$ |
(20,450) |
|
$ |
(311,943) |
|
$ |
(147,742) |
|
|
Weighted average common shares |
|
|
|
300,341 |
|
|
297,763 |
|
|
297,041 |
|
|
Loss per common share |
|
|
$ |
(0.07) |
|
$ |
(1.05) |
|
$ |
(0.50) |
|
|
Diluted |
|
|
$ |
(0.07) |
|
$ |
(1.05) |
|
$ |
(0.50) |
|
103
MCEWEN MINING INC.
NOTES TO CONSOLIDATED FINANCIAL STATEMENTS
December 31, 2015
(tabular amounts are in thousands of U.S. dollars, unless otherwise noted) (continued)
Options to purchase 6.9 million shares of common stock (2014 – 3.3 million, 2013 – 2.1 million) at an average exercise price of $2.49 at December 31, 2015 (2014 - $3.95, 2013 - $5.04) were not included in the computation of diluted weighted average shares because their exercise price exceeded the average price of the Company’s common stock for the year ended December 31, 2015, and because their effect would have been anti-dilutive. Other outstanding options to purchase 0.1 million shares of common stock (2014 – 1.8 million, 2013 – 3.6 million) were not included in the computation of diluted weighted average shares in the year ended December 31, 2015 because their effect would have been anti‑dilutive.
NOTE 13 RENTAL EXPENSE, COMMITMENTS AND CONTINGENCIES
Rental Expense
For the year ended December 31, 2015, the Company had rental expense under operating leases of $0.5 million (2014 - $0.5 million; 2013 - $0.8 million).
Commitments
At December 31, 2015, the Company is obligated for the next five years under purchase commitments, long term leases covering office space, exploration expenditures, option payments on properties for the following minimum amounts:
|
|
|
Payments due by period |
|
|||||||||||||
|
|
|
2016 |
|
2017 |
|
2018 |
|
2019 |
|
2020 |
|
|||||
|
Lease Obligations |
|
$ |
2,510 |
|
$ |
545 |
|
$ |
554 |
|
$ |
558 |
|
$ |
555 |
|
|
Purchase Commitments |
|
|
267 |
|
|
— |
|
|
— |
|
|
— |
|
|
— |
|
|
Total |
|
$ |
2,777 |
|
$ |
545 |
|
$ |
554 |
|
$ |
558 |
|
$ |
555 |
|
Surety Bonds
As part of its ongoing business and operations, the Company is required to provide bonding for its environmental reclamation obligations in the United States, as discussed in Note 5, Mineral Properties and Asset Retirement Obligations. These surety bonds are available for draw down by the beneficiary in the event the Company does not perform its reclamation obligations. If the specific reclamation requirements are met, the beneficiary of the surety bonds will release the instrument to the issuing entity. The Company believes it is in compliance with all applicable bonding obligations and will be able to satisfy future bonding requirements, through existing or alternative means, as they arise. As at December 31, 2015 there were $4.8 million of outstanding surety bonds (2014 - $4.8 million). The annual financing fees are 1.5% of the value of the surety bonds, with an upfront 10% deposit of $0.5 million which is included in Other Assets in the Consolidated Balance Sheet.
Contingencies
The Company’s mining and exploration activities are subject to various laws and regulations governing the protection of the environment. These laws and regulations are continually changing and generally becoming more restrictive. The Company conducts its operations so as to protect public health and the environment, and believes its operations are materially in compliance with all applicable laws and regulations. The Company has made, and expects to make in the future, expenditures to comply with such laws and regulations.
The Company has transferred its interest in several mining properties to third parties. The Company could remain potentially liable for environmental enforcement actions related to its prior ownership of such properties. However, the
104
MCEWEN MINING INC.
NOTES TO CONSOLIDATED FINANCIAL STATEMENTS
December 31, 2015
(tabular amounts are in thousands of U.S. dollars, unless otherwise noted) (continued)
Company has no reasonable belief that any violation of relevant environmental laws or regulations has occurred regarding these transferred properties.
NOTE 14 RELATED PARTY TRANSACTIONS
An aircraft owned and operated by Lexam L.P. (which is controlled by Robert R. McEwen, limited partner and beneficiary of Lexam L.P.) has been made available to the Company in order to expedite business travel. In his role as Chairman and Chief Executive Officer of the Company, Mr. McEwen must travel extensively and frequently on short notice.
Mr. McEwen is able to charter the aircraft from Lexam L.P. at a preferential rate approved by the Company’s independent board members under a policy whereby only the variable expenses of operating this aircraft for business related travel are eligible for reimbursement by the Company. For the year ended December 31, 2015, the Company incurred and paid $0.1 million (2014 - $0.1 million; 2013 - $0.2 million) to Lexam L.P. for the use of this aircraft.
During the year ended December 31, 2015, legal fees of $0.1 million (2014 – $nil, 2013- $nil) were incurred with REVlaw, a company related to Ms. Carmen Diges, General Counsel of the Company, from which an owing balance of $0.1 million is included within accounts payable at December 31, 2015 (2014 – $nil, 2013 - $nil). The services of Ms. Diges as General Counsel are provided by REVlaw. These legal fees have been recorded at their exchange amount – being the amount agreed to by the parties.
NOTE 15 UNAUDITED SUPPLEMENTARY QUARTERLY INFORMATION
The following table summarizes unaudited supplementary quarterly information for the years ended December 31, 2015, 2014, and 2013.
|
|
|
Three months ended |
|
||||||||||
|
|
|
March 31, 2015 |
|
June 30, 2015 |
|
September 30, 2015 |
|
December 31, 2015 |
|
||||
|
|
|
(unaudited) (in thousands, except per share) |
|
||||||||||
|
Net income (loss) |
|
$ |
6,021 |
|
$ |
(14,116) |
|
$ |
2,633 |
|
$ |
(14,988) |
|
|
Net income (loss) per share: |
|
|
|
|
|
|
|
|
|
|
|
|
|
|
Basic |
|
$ |
0.02 |
|
$ |
(0.05) |
|
$ |
0.01 |
|
$ |
(0.05) |
|
|
Diluted |
|
$ |
0.02 |
|
$ |
(0.05) |
|
$ |
0.01 |
|
$ |
(0.05) |
|
|
Weighted average shares outstanding: |
|
|
|
|
|
|
|
|
|
|
|
|
|
|
Basic |
|
|
297,255 |
|
|
300,530 |
|
|
300,530 |
|
|
300,107 |
|
|
Diluted |
|
|
297,266 |
|
|
300,530 |
|
|
300,530 |
|
|
300,107 |
|
|
|
|
Three months ended |
|
||||||||||
|
|
|
March 31, 2014 |
|
June 30, 2014 |
|
September 30, 2014 |
|
December 31, 2014 |
|
||||
|
|
|
(unaudited) (in thousands, except per share) |
|
||||||||||
|
Net income (loss) |
|
$ |
17,887 |
|
$ |
(104,022) |
|
$ |
(13,033) |
|
$ |
(212,775) |
|
|
Net income (loss) per share: |
|
|
|
|
|
|
|
|
|
|
|
|
|
|
Basic |
|
$ |
0.06 |
|
$ |
(0.35) |
|
$ |
(0.04) |
|
$ |
(0.71) |
|
|
Diluted |
|
$ |
0.06 |
|
$ |
(0.35) |
|
$ |
(0.04) |
|
$ |
(0.71) |
|
|
Weighted average shares outstanding: |
|
|
|
|
|
|
|
|
|
|
|
|
|
|
Basic |
|
|
297,159 |
|
|
297,164 |
|
|
297,164 |
|
|
299,009 |
|
|
Diluted |
|
|
298,410 |
|
|
297,164 |
|
|
297,164 |
|
|
299,009 |
|
105
MCEWEN MINING INC.
NOTES TO CONSOLIDATED FINANCIAL STATEMENTS
December 31, 2015
(tabular amounts are in thousands of U.S. dollars, unless otherwise noted) (continued)
|
|
|
Three months ended |
|
||||||||||
|
|
|
March 31, 2013 |
|
June 30, 2013 |
|
September 30, 2013 |
|
December 31, 2013 |
|
||||
|
|
|
(in thousands, except per share) |
|
||||||||||
|
Net (loss) income |
|
$ |
(10,982) |
|
$ |
(128,681) |
|
$ |
3,264 |
|
$ |
(11,343) |
|
|
Net (loss) income per share: |
|
|
|
|
|
|
|
|
|
|
|
|
|
|
Basic |
|
$ |
(0.04) |
|
$ |
(0.43) |
|
$ |
0.01 |
|
$ |
(0.04) |
|
|
Diluted |
|
$ |
(0.04) |
|
$ |
(0.43) |
|
$ |
0.01 |
|
$ |
(0.04) |
|
|
Weighted average shares outstanding: |
|
|
|
|
|
|
|
|
|
|
|
|
|
|
Basic |
|
|
296,778 |
|
|
297,097 |
|
|
297,125 |
|
|
297,159 |
|
|
Diluted |
|
|
296,778 |
|
|
297,097 |
|
|
297,899 |
|
|
297,159 |
|
NOTE 16 OPERATING SEGMENT REPORTING
McEwen Mining is a mining and minerals exploration company focused on precious metals in Argentina, Mexico and the United States. The Company identifies its reportable segments as those consolidated operations that are currently engaged in the exploration for and production of precious metals. Operations not actively engaged in the exploration for, or production of precious metals, are aggregated at the corporate level for segment reporting purposes.
|
|
|
For the year ended December 31, 2015 |
|
||||||||||||||||||
|
|
|
|
|
|
|
|
|
|
|
|
Corporate & |
|
|
|
|
||||||
|
|
|
Argentina |
|
Mexico |
|
U.S. |
|
Other |
|
Total |
|
||||||||||
|
Gold and silver sales |
|
$ |
— |
|
$ |
72,956 |
|
$ |
— |
|
$ |
— |
|
$ |
72,956 |
|
|||||
|
Production costs applicable to sales |
|
|
— |
|
|
(34,607) |
|
|
— |
|
|
— |
|
|
(34,607) |
|
|||||
|
Mine construction costs |
|
|
— |
|
|
— |
|
|
— |
|
|
— |
|
|
— |
|
|||||
|
Mine development costs |
|
|
— |
|
|
(761) |
|
|
(408) |
|
|
— |
|
|
(1,169) |
|
|||||
|
Exploration costs |
|
|
(1,481) |
|
|
(4,526) |
|
|
(2,517) |
|
|
(274) |
|
|
(8,798) |
|
|||||
|
General and administrative expenses |
|
|
(647) |
|
|
(3,953) |
|
|
(203) |
|
|
(7,242) |
|
|
(12,045) |
|
|||||
|
Impairment of mineral property interests and property and equipment |
|
|
(11,399) |
|
|
(1,972) |
|
|
(37,229) |
|
|
— |
|
|
(50,600) |
|
|||||
|
Impairment of Investment in Minera Santa Cruz S.A. |
|
|
(11,777) |
|
|
— |
|
|
— |
|
|
— |
|
|
(11,777) |
|
|||||
|
Income on investment in Minera Santa Cruz S.A. (net of amortization) |
|
|
2,414 |
|
|
— |
|
|
— |
|
|
— |
|
|
2,414 |
|
|||||
|
Operating (loss) income |
|
|
(23,434) |
|
|
23,864 |
|
|
(41,975) |
|
|
(7,775) |
|
|
(49,320) |
|
|||||
|
Income tax recovery (expense) |
|
|
10,759 |
|
|
1,292 |
|
|
12,952 |
|
|
(443) |
|
|
24,560 |
|
|||||
|
|
|
|
|
|
|
|
|
|
|
|
|
|
|
|
|
|
|||||
|
As at December 31, 2015 |
|
|
|
|
|
|
|
|
|
|
|
|
|
|
|
|
|||||
|
Investment in Minera Santa Cruz S.A. |
|
$ |
167,107 |
|
$ |
— |
|
$ |
— |
|
$ |
— |
|
$ |
167,107 |
|
|||||
|
Mineral property interests |
|
|
191,490 |
|
|
9,408 |
|
|
36,347 |
|
|
— |
|
|
237,245 |
|
|||||
|
Total assets |
|
|
361,023 |
|
|
62,983 |
|
|
36,983 |
|
|
14,096 |
|
|
475,085 |
|
|||||
106
MCEWEN MINING INC.
NOTES TO CONSOLIDATED FINANCIAL STATEMENTS
December 31, 2015
(tabular amounts are in thousands of U.S. dollars, unless otherwise noted) (continued)
|
|
|
For the year ended December 31, 2014 |
|
|||||||||||||
|
|
|
|
|
|
|
|
|
|
|
|
Corporate & |
|
|
|
|
|
|
|
|
Argentina |
|
Mexico |
|
U.S. |
|
Other |
|
Total |
|
|||||
|
Gold and silver sales |
|
$ |
— |
|
$ |
45,303 |
|
$ |
— |
|
$ |
— |
|
$ |
45,303 |
|
|
Production costs applicable to sales |
|
|
— |
|
|
(40,608) |
|
|
— |
|
|
— |
|
|
(40,608) |
|
|
Mine construction costs |
|
|
— |
|
|
(1,723) |
|
|
— |
|
|
— |
|
|
(1,723) |
|
|
Mine development costs |
|
|
— |
|
|
(1,829) |
|
|
— |
|
|
— |
|
|
(1,829) |
|
|
Exploration costs |
|
|
(2,453) |
|
|
(5,468) |
|
|
(3,060) |
|
|
(351) |
|
|
(11,332) |
|
|
General and administrative expenses |
|
|
(969) |
|
|
(3,194) |
|
|
(211) |
|
|
(7,695) |
|
|
(12,069) |
|
|
Impairment of mineral property interests and property and equipment |
|
|
(255,313) |
|
|
— |
|
|
(98,423) |
|
|
— |
|
|
(353,736) |
|
|
Impairment of Investment in Minera Santa Cruz S.A. |
|
|
(21,162) |
|
|
— |
|
|
— |
|
|
— |
|
|
(21,162) |
|
|
Loss on investment in Minera Santa Cruz S.A. (net of amortization) |
|
|
(5,284) |
|
|
— |
|
|
— |
|
|
— |
|
|
(5,284) |
|
|
Operating loss |
|
|
(285,800) |
|
|
(10,101) |
|
|
(105,797) |
|
|
(8,467) |
|
|
(410,165) |
|
|
Income tax recovery |
|
|
74,952 |
|
|
371 |
|
|
31,632 |
|
|
215 |
|
|
107,170 |
|
|
|
|
|
|
|
|
|
|
|
|
|
|
|
|
|
|
|
|
As at December 31, 2014 |
|
|
|
|
|
|
|
|
|
|
|
|
|
|
|
|
|
Investment in Minera Santa Cruz S.A. |
|
$ |
177,018 |
|
$ |
— |
|
$ |
— |
|
$ |
— |
|
$ |
177,018 |
|
|
Mineral property interests |
|
|
202,889 |
|
|
10,696 |
|
|
74,227 |
|
|
— |
|
|
287,812 |
|
|
Total assets |
|
|
382,637 |
|
|
58,936 |
|
|
74,806 |
|
|
6,579 |
|
|
522,958 |
|
|
|
|
For the year ended December 31, 2013 |
|
|||||||||||||
|
|
|
|
|
|
|
|
|
|
|
|
|
Corporate & |
|
|
|
|
|
|
|
Argentina |
|
|
Mexico |
|
|
U.S. |
|
|
Other |
|
|
Total |
|
|
|
Gold and silver sales |
|
$ |
— |
|
$ |
45,982 |
|
$ |
— |
|
$ |
— |
|
$ |
45,982 |
|
|
Production costs applicable to sales |
|
|
— |
|
|
34,594 |
|
|
— |
|
|
— |
|
|
34,594 |
|
|
Mine construction costs |
|
|
— |
|
|
(1,383) |
|
|
— |
|
|
— |
|
|
(1,383) |
|
|
Mine development costs |
|
|
— |
|
|
(847) |
|
|
— |
|
|
— |
|
|
(847) |
|
|
Exploration costs |
|
|
(14,776) |
|
|
(6,658) |
|
|
(2,952) |
|
|
(443) |
|
|
(24,829) |
|
|
General and administrative expenses |
|
|
(1,267) |
|
|
(2,858) |
|
|
(314) |
|
|
(9,562) |
|
|
(14,001) |
|
|
Income on investment in Minera Santa Cruz S.A. |
|
|
846 |
|
|
— |
|
|
— |
|
|
— |
|
|
846 |
|
|
Impairment of investment in Minera Santa Cruz S.A. |
|
|
(95,878) |
|
|
— |
|
|
— |
|
|
— |
|
|
(95,878) |
|
|
Impairment of mineral property interests and property and equipment |
|
|
(27,729) |
|
|
— |
|
|
(35,234) |
|
|
— |
|
|
(62,963) |
|
|
(Loss) gain on sales of assets |
|
|
(316) |
|
|
— |
|
|
(6,430) |
|
|
3 |
|
|
(6,743) |
|
|
Operating loss |
|
|
(139,784) |
|
|
(2,998) |
|
|
(47,422) |
|
|
(10,193) |
|
|
(200,397) |
|
|
Income tax recovery |
|
|
38,015 |
|
|
495 |
|
|
14,855 |
|
|
— |
|
|
53,365 |
|
|
|
|
|
|
|
|
|
|
|
|
|
|
|
|
|
|
|
|
As at December 31, 2013 |
|
|
|
|
|
|
|
|
|
|
|
|
|
|
|
|
|
Investment in Minera Santa Cruz S.A. |
|
$ |
212,947 |
|
$ |
— |
|
$ |
— |
|
$ |
— |
|
$ |
212,947 |
|
|
Mineral property interests |
|
|
458,203 |
|
|
11,984 |
|
|
172,781 |
|
|
— |
|
|
642,968 |
|
|
Total assets |
|
|
674,269 |
|
|
54,131 |
|
|
177,284 |
|
|
17,418 |
|
|
923,102 |
|
NOTE 17 FAIR VALUE ACCOUNTING
Assets and liabilities measured at fair value on a recurring basis
The following tables set forth the fair value of the Company’s assets and liabilities measured at fair value on a recurring basis (at least annually) by level within the fair value hierarchy as at December 31, 2015 and 2014. As required by
107
MCEWEN MINING INC.
NOTES TO CONSOLIDATED FINANCIAL STATEMENTS
December 31, 2015
(tabular amounts are in thousands of U.S. dollars, unless otherwise noted) (continued)
accounting guidance, assets and liabilities are classified in their entirety based on the lowest level of input that is significant to the fair value measurement.
|
|
|
Fair Value as at December 31, 2015 |
|
||||||||||
|
|
|
Total |
|
Level 1 |
|
Level 2 |
|
Level 3 |
|
||||
|
Assets: |
|
|
|
|
|
|
|
|
|
|
|
|
|
|
Investments |
|
$ |
1,032 |
|
$ |
1,032 |
|
$ |
— |
|
$ |
— |
|
|
|
|
$ |
1,032 |
|
$ |
1,032 |
|
$ |
— |
|
$ |
— |
|
|
|
|
Fair Value as at December 31 2014 |
|
||||||||||
|
|
|
Total |
|
Level 1 |
|
Level 2 |
|
Level 3 |
|
||||
|
Assets: |
|
|
|
|
|
|
|
|
|
|
|
|
|
|
Investments |
|
$ |
1,082 |
|
$ |
1,082 |
|
$ |
— |
|
$ |
— |
|
|
|
|
$ |
1,082 |
|
$ |
1,082 |
|
$ |
— |
|
$ |
— |
|
|
Liabilities: |
|
|
|
|
|
|
|
|
|
|
|
|
|
|
Portion of accounts payable and accrued liabilities recorded at fair value |
|
$ |
355 |
|
$ |
355 |
|
$ |
— |
|
$ |
— |
|
|
|
|
$ |
355 |
|
$ |
355 |
|
$ |
— |
|
$ |
— |
|
The Company's investments are marketable equity securities which are exchange traded and are valued using quoted market prices in active markets and as such are classified within Level 1 of the fair value hierarchy. The fair value of the investments is calculated as the quoted market price of the marketable equity security multiplied by the quantity of shares held by the Company.
As at December 31, 2014, accounts payable included an accrual of $0.4 million on for the fair value approximately 319,640 shares of common stock, which were issued in payment during 2015, as discussed in Note 10, Shareholders’ Equity. The fair value of these accounts payable is assumed to approximate the fair value of the underlying shares with which they were settled. As the Company's stock is quoted on an active market, this liability is classified within Level 1 of the fair value hierarchy.
The fair value of other financial assets and liabilities were assumed to approximate their carrying values due to their short-term nature and historically negligible credit losses.
Assets and liabilities measured at fair value on a non‑recurring basis
As discussed in Note 5, Mineral Property Interests and Asset Retirement Obligations, the Company recorded several impairment charges in the year ended December 31, 2015.
During the year ended December 31, 2015, the Company recorded impairment charges of $20.8 million for the Gold Bar project, $14.9 million for the Tonkin project and $1.4 million for the North Battle Mountain Complex. Fair value of these projects was estimated using an observed precedent transaction market value per acre and per ounce of gold equivalent mineralized material, which indicated a potential significant decrease in the market price of the projects, as of December 31, 2015.
During the fourth quarter of 2015, the Company noted that the estimated market value per pound of copper equivalent mineralized material from comparable projects was below the carrying value per pound of copper equivalent mineralized material of the Los Azules project, indicating a potential decrease on its market value, and therefore a requirement to test the Los Azules Project for recoverability. To assist in performing a recoverability test, the Company engaged a third-party valuation firm which determined that the carrying value of the property exceeded its estimated fair value, resulting in an
108
MCEWEN MINING INC.
NOTES TO CONSOLIDATED FINANCIAL STATEMENTS
December 31, 2015
(tabular amounts are in thousands of U.S. dollars, unless otherwise noted) (continued)
impairment charge of $11.4 million, along with a resulting deferred income tax recovery of $1.3 million, recorded in the Statement of Operations and Comprehensive Loss for the year ended December 31, 2015.
Further, during the fourth quarter of 2015 the Company also performed a fair value analysis on the El Gallo 2 assets, including mineral property interest, land, surface ownership and construction-in-progress. As a result of this analysis, the carrying value of the asset was found to exceed its fair value in the amount of $2.0 million. Therefore, an impairment charge of $2.0 million was recorded in the Statement of Operations and Comprehensive Loss, and allocated to construction-in-progress, based on the impairment results for the year ended December 31, 2015.
During the fourth quarter of 2015, an impairment loss of $11.8 million was also recorded with respect to the Company’s investment in MSC. To estimate the fair value of the Company’s investment in MSC, the Company used a combined approach, which uses a discounted cash flow model for the operating mine and an observed precedent transaction market value per acre for the fair value of exploration properties.
During the year ended December 31, 2014, a total of $353.7 million impairment charge was recorded, which included $228.3 million to the Los Azules project, $98.4 million to the Nevada properties, and $27.0 million to our Argentina properties. The impairment of Los Azules was triggered by a contemporaneous acquisition of a copper project located in Argentina, which we believed shared similarities with Los Azules, and the decline in the observed market value of comparable transactions observed in 2014. The impairment of the Nevada and Argentina properties, was primarily as a result of significant declines in the observed market value of comparable transactions noted as part of our year‑end annual impairment analysis, which indicated a decrease in the market value of our properties, as well as the strategic review of our exploration program, pursuant to which we have made the decision to focus primarily on core assets, namely our Los Azules, Gold Bar, Tonkin and North Battle Mountain properties. Further, these events resulted in a total deferred income tax recovery of $76.6 million.
Further, during the year ended December 31, 2014 an impairment loss of $21.2 million was also recorded with respect to the Company’s investment in MSC. To estimate the fair value of the Company’s investment in MSC, the Company used a combined approach, which uses a discounted cash flow model for the operating mine and a market approach for the fair value of exploration properties. Further, a discount of 20% was applied to the observable market value per acre for the Argentina exploration properties to reflect the country risk associated with early-stage exploration lands located in Argentina at the date of assessment.
The following table sets forth a summary of the quantitative and qualitative information related to the unobservable inputs used in the calculation of the Company’s non‑recurring Level 3 fair value measurements for the year ended December 31, 2015 and 2014.
|
|
|
2015 |
||||||||
|
|
|
Date of Fair Value |
|
|
|
|
|
Range / |
|
|
|
|
|
Measurement |
|
Valuation Technique |
|
Unobservable Input |
|
Weighted Average |
|
|
|
|
|
|
|
|
|
|
|
|
|
|
|
|
|
|
|
|
|
Discount Rate |
|
|
10 |
% |
|
|
|
|
|
Discounted cash flow |
|
Long Term Gold Price |
|
$ |
1,245 |
per ounce |
|
Investment in MSC |
|
December 31, 2015 |
|
for operating mine |
|
Long Term Silver Price |
|
$ |
18 |
per ounce |
|
|
|
|
|
|
|
Argentina Inflation Index |
|
|
21 |
% |
|
|
|
|
|
|
|
United States Inflation Index |
|
|
2.4 |
% |
|
|
|
|
|
|
|
|
|
|
|
|
|
|
|
|
|
|
|
|
|
|
|
|
|
|
|
|
|
|
|
|
|
|
|
|
109
MCEWEN MINING INC.
NOTES TO CONSOLIDATED FINANCIAL STATEMENTS
December 31, 2015
(tabular amounts are in thousands of U.S. dollars, unless otherwise noted) (continued)
|
|
|
2014 |
||||||||
|
|
|
Date of Fair Value |
|
|
|
|
|
Range / |
|
|
|
|
|
Measurement |
|
Valuation Technique |
|
Unobservable Input |
|
Weighted Average |
|
|
|
|
|
|
|
|
|
|
|
|
|
|
|
|
|
|
|
|
|
Discount to reflect decline in |
|
|
|
|
|
|
|
|
|
Market value per |
|
observed market value of comparable |
|
|
35 |
% |
|
Los Azules Copper Project |
|
December 31, 2014 |
|
pound of copper |
|
transactions from June 2014 (date of |
|
|
|
|
|
|
|
|
|
equivalent mineralized |
|
the last impairment test) to December |
|
|
|
|
|
|
|
|
|
material |
|
31, 2014 |
|
|
|
|
|
|
|
|
|
|
|
|
|
|
|
|
|
|
|
|
|
|
|
Discount Rate |
|
|
10 |
% |
|
|
|
|
|
Discounted cash flow |
|
Long Term Gold Price |
|
$ |
1,300 |
per ounce |
|
|
|
|
|
for operating mine |
|
Long Term Silver Price |
|
$ |
20.50 |
per ounce |
|
|
|
December 31, 2014 |
|
|
|
Argentina Inflation Index |
|
|
11.9 |
% |
|
Investment in MSC |
|
|
|
|
|
United States Inflation Index |
|
|
2.1 |
% |
|
|
|
|
|
|
|
|
|
|
|
|
|
|
|
|
|
Market value per acre |
|
Discount to observed market value |
|
|
|
|
|
Investment in MSC |
|
December 31, 2014 |
|
for exploration |
|
pre acre to reflect Argentina country |
|
|
20 |
% |
|
|
|
|
|
properties |
|
risk |
|
|
|
|
The following non financial assets and the company’s investment in MSC were measured at fair value on a non‑recurring basis as part of the Company’s impairment assessments during the year ended December 31, 2015 and 2014.
|
|
|
|
|
2015 |
|
||||||||||||||||||||||||||||||||
|
|
|
Date of Fair Value |
|
|
|
|
|
|
|
|
|
|
|
|
|
Total |
|
||||||||||||||||||||
|
|
|
Measurement |
|
Total |
|
Level 1 |
|
Level 2 |
|
Level 3 |
|
Impairment |
|
||||||||||||||||||||||||
|
Mineral property interests |
|
|
|
|
|
|
|
|
|
|
|
|
|
|
|
|
|
|
|||||||||||||||||||
|
Los Azules Copper Project |
|
December 31, 2015 |
|
|
191,490 |
|
|
— |
|
|
— |
|
|
191,490 |
|
|
11,399 |
|
|||||||||||||||||||
|
Tonkin Complex |
|
December 31, 2015 |
|
|
4,833 |
|
|
— |
|
|
— |
|
|
4,833 |
|
|
14,939 |
|
|||||||||||||||||||
|
Gold Bar Complex |
|
December 31, 2015 |
|
|
30,730 |
|
|
— |
|
|
— |
|
|
30,730 |
|
|
20,847 |
|
|||||||||||||||||||
|
North Battle Mountain Complex |
|
December 31, 2015 |
|
|
785 |
|
|
— |
|
|
— |
|
|
785 |
|
|
1,443 |
|
|||||||||||||||||||
|
Investment in MSC |
|
December 31, 2015 |
|
|
167,107 |
|
|
— |
|
|
— |
|
|
167,107 |
|
|
11,777 |
|
|||||||||||||||||||
|
|
|
|
|
$ |
394,945 |
|
$ |
— |
|
$ |
— |
|
$ |
394,945 |
|
$ |
60,405 |
|
|||||||||||||||||||
|
|
|
|
|
2014 |
|
|||||||||||||
|
|
|
Date of Fair Value |
|
|
|
|
|
|
|
|
|
|
|
|
|
Total |
|
|
|
|
|
Measurement |
|
Total |
|
Level 1 |
|
Level 2 |
|
Level 3 |
|
Impairment |
|
|||||
|
Mineral property interests |
|
|
|
|
|
|
|
|
|
|
|
|
|
|
|
|
|
|
|
Los Azules Copper Project |
|
December 31, 2014 |
|
$ |
202,889 |
|
$ |
— |
|
$ |
— |
|
$ |
202,889 |
|
$ |
228,301 |
|
|
Tonkin Complex |
|
December 31, 2014 |
|
|
20,423 |
|
|
— |
|
|
— |
|
|
20,423 |
|
|
31,391 |
|
|
Gold Bar Complex |
|
December 31, 2014 |
|
|
51,577 |
|
|
— |
|
|
— |
|
|
51,577 |
|
|
25,435 |
|
|
North Battle Mountain Complex |
|
December 31, 2014 |
|
|
2,227 |
|
|
— |
|
|
— |
|
|
2,227 |
|
|
1,921 |
|
|
Investment in MSC |
|
December 31, 2014 |
|
|
177,018 |
|
|
— |
|
|
— |
|
|
177,018 |
|
|
21,162 |
|
|
|
|
|
|
$ |
454,134 |
|
$ |
— |
|
$ |
— |
|
$ |
454,134 |
|
$ |
308,210 |
|
|
|
|
|
|
|
|
|
|
|
|
|
|
|
|
|
|
|
|
|
NOTE 18 COMPARATIVE FIGURES
Certain prior year information has been reclassified to conform with the current year’s presentation.
110
ITEM 9. CHANGES IN AND DISAGREEMENTS WITH ACCOUNTANTS ON ACCOUNTING AND FINANCIAL DISCLOSURE
The change in our independent registered accountants was disclosed in a Form 8-K dated November 27, 2015 and filed with the SEC on December 3, 2015. No other information is required by this Item.
ITEM 9A. CONTROLS AND PROCEDURES
During the fiscal period covered by this report, our management, with the participation of the Chief Executive Officer and Chief Financial Officer of the Company, carried out an evaluation of the effectiveness of the design and operation of our disclosure controls and procedures (as defined in Rules 13a‑15(e) and 15d‑15(e) of the Exchange Act). Based on such evaluation, our Chief Executive Officer and Chief Financial Officer have concluded that, as of the end of the period covered by this report, our disclosure controls and procedures were effective to ensure that information required to be disclosed by us in reports that we file or submit under the Exchange Act is recorded, processed, summarized and reported within the required time periods specified in the Commission’s rules and forms and are designed to ensure that information required to be disclosed in our reports is accumulated and communicated to our management, including our Chief Executive Officer and Chief Financial Officer, as appropriate to allow timely decisions regarding required disclosure.
There has been no change in our internal control over financial reporting during the most recent fiscal quarter that has materially affected, or that is reasonably likely to materially affect, our internal control over financial reporting.
Management’s report on internal control over financial reporting and the attestation report of KPMG LLP, an independent registered public accounting firm, are included in Item 8 of this annual report on Form 10‑K.
None.
111
ITEM 10. DIRECTORS, EXECUTIVE OFFICERS AND CORPORATE GOVERNANCE
Pursuant to General Instruction G of Form 10‑K, the information contained in this Item 10 is incorporated by reference to our Definitive Proxy Statement for our 2016 Annual Meeting of Shareholders, expected to be filed with the SEC on or before April 30, 2016.
The Company has a code of business conduct and ethics that applies to all of its employees, officers and directors. The code of business conduct and ethics is available on our website at www.mcewenmining.com and we will post any amendments to, or waivers, from, the code of ethics on that website.
ITEM 11. EXECUTIVE COMPENSATION
The information contained in this Item 11 is incorporated by reference to our Definitive Proxy Statement for our 2016 Annual Meeting of Shareholders.
ITEM 12. SECURITY OWNERSHIP OF CERTAIN BENEFICIAL OWNERS AND MANAGEMENT AND RELATED STOCKHOLDER MATTERS
The information contained in this Item 12 is incorporated by reference to our Definitive Proxy Statement for our 2016 Annual Meeting of Shareholders.
ITEM 13. CERTAIN RELATIONSHIPS, RELATED TRANSACTIONS AND DIRECTOR INDEPENDENCE
The information contained in this Item 13 is incorporated by reference to our Definitive Proxy Statement for our 2016 Annual Meeting of Shareholders.
ITEM 14. PRINCIPAL ACCOUNTING FEES AND SERVICES
The information contained in this Item 14 is incorporated by reference to our Definitive Proxy Statement for our 2016 Annual Meeting of Shareholders.
ITEM 15. EXHIBITS, FINANCIAL STATEMENT SCHEDULES
The exhibits listed in the accompanying exhibit index are filed (except where otherwise indicated) as part of this report.
112
In accordance with Section 13 or 15(d) of the Exchange Act, the Company caused this Report to be signed on its behalf by the undersigned, thereunto duly authorized.
|
|
MCEWEN MINING INC. |
|
|
|
By: |
/s/ Robert R. McEwen |
|
Dated: March 11, 2016 |
|
Robert R. McEwen, |
|
|
|
Chairman of the Board of Directors and |
|
|
|
Chief Executive Officer |
In accordance with the Exchange Act, this Report has been signed below by the following persons on behalf of the Company and in the capacities and on the dates indicated.
|
/s/ Robert R. McEwen |
|
Chairman of the Board of Directors and Chief Executive Officer (Principal Executive Officer) |
|
March 11, 2016 |
|
Robert R. McEwen |
|
|
||
|
|
|
|
|
|
|
/s/ Andrew Elinesky |
|
Senior Vice President, Chief Financial Officer (Principal Financial and Accounting Officer) |
|
March 11, 2016 |
|
Andrew Elinesky |
|
|
||
|
|
|
|
|
|
|
/s/ Allen V. Ambrose |
|
Director |
|
March 11, 2016 |
|
Allen V. Ambrose |
|
|
||
|
|
|
|
|
|
|
/s/ Michele L. Ashby |
|
Director |
|
March 11, 2016 |
|
Michele L. Ashby |
|
|
||
|
|
|
|
|
|
|
/s/ Leanne M. Baker |
|
Director |
|
March 11, 2016 |
|
Leanne M. Baker |
|
|
||
|
|
|
|
|
|
|
/s/ Richard W. Brissenden |
|
Director |
|
March 11, 2016 |
|
Richard W. Brissenden |
|
|
||
|
|
|
|
|
|
|
/s/ Gregory P. Fauquier |
|
Director |
|
March 11, 2016 |
|
Gregory P. Fauquier |
|
|
||
|
|
|
|
|
|
|
/s/ Donald R. M. Quick |
|
Director |
|
March 11, 2016 |
|
Donald Quick |
|
|
||
|
|
|
|
|
|
|
/s/ Michael L. Stein |
|
Director |
|
March 11, 2016 |
|
Michael L. Stein |
|
|
113
| 2.1 |
|
Arrangement Agreement, dated September 22, 2011, by and among the Company, McEwen Mining –Minera Andes Acquisition Corp. (“Canadian Exchange Co.”) and Minera Andes Inc. (incorporated by reference from the Report on Form 8‑K filed with the SEC on September, 23, 2011, Exhibit 2.1, File No. 001‑33190) |
|
3.1.1 |
|
Second Amended and Restated Articles of Incorporation of the Company as filed with the Colorado Secretary of State on January 20, 2012 (incorporated by reference from the Report on Form 8‑K filed with the SEC on January 24, 2012, Exhibit 3.1, File No. 001‑33190) |
|
3.1.2 |
|
Articles of Amendment to the Second Amended and Restated Articles of Incorporation of the Company as filed with the Colorado Secretary of State on January 24, 2012 (incorporated by reference from the Report on Form 8‑K filed with the SEC on January 24, 2012, Exhibit 3.2, File No. 001‑33190) |
| 3.2 |
|
Amended and Restated Bylaws of the Company (incorporated by reference from the Report on Form 8‑K filed with the SEC on March 12, 2012, Exhibit 3.2, File No. 001‑33190) |
| 9.1 |
|
Voting and Exchange Trust Agreement, dated January 24, 2012, by and among the Company, Canadian Exchange Co., McEwen Mining (Alberta) ULC (“Callco” and Computershare Trust Company of Canada, as trustee (incorporated by reference from the Report on Form 8‑K filed with the SEC on January 24, 2012, Exhibit 10.2, File No. 001‑33190) |
| 10.1 |
|
Support Agreement, dated January 24, 2012, by and among the Company, Canadian Exchange Co. and Callco (incorporated by reference from the Report on Form 8‑K filed with the SEC on January 24, 2012, Exhibit 10.1, File No. 001‑33190) |
|
10.2* |
|
Amended and Restated Equity Incentive Plan dated as of March 17, 2015 (incorporated by reference from the report on Form 8-K filed with the SEC on May 29, 2015, Exhibit 4.1, File No. 001-33190) |
|
10.3*+ |
|
Form of Stock Option Agreement for executives of the Company |
| 10.4 |
|
Agreement to Pay Distributions dated February 21, 1992, by and between Tonkin Springs Gold Mining Company and French American Banking Corporation (incorporated by reference from the Report on Form 8‑K dated February 21, 1992, Exhibit 4, File No. 000‑09137) |
| 10.5 |
|
Form of Indemnification Agreement between the Company and its officers and directors (incorporated by reference from the Report on Form 8‑K dated December 7, 2005, Exhibit 10.1, File No. 000‑09137) |
| 10.6 |
|
Purchase and Sale Agreement between the Company and Tonkin Springs LLC, as purchasers, and Gold Standard Royalty (Nevada) Inc., and Julian E. Simpson, as Sellers, dated July 19, 2011 (incorporated by reference from the Report on Form 8‑K filed with the SEC on July 25, 2011, Exhibit 10.1, File No. 001‑33190) |
|
10.7* |
|
Employment Agreement between the Company and William Faust dated July 27, 2011 (incorporated by reference from the Report on Form 8‑K filed with the SEC on August 2, 2011, Exhibit 10.1, File No. 001‑33190) |
| 10.8 |
|
Settlement Agreement dated for reference purposes February 4, 2013 between TNR Gold Corp. and Solitario Argentina, S.A., plaintiffs, and MIM Argentina Exploraciones S.A. and certain subsidiaries of the Company, defendants (incorporated by reference from the Report on Form 8‑K filed with the SEC on February 7, 2013, Exhibit 10.1, File No. 001‑33190) |
| 10.9 |
|
Refining Agreement dated December 16, 2013, by and among the Company and Johnson Matthey Gold & Silver Refining Inc. (incorporated by reference from the Report on Form 10‑K filed with the SEC on March 10, 2014, Exhibit 10.8, File No. 001‑33190) |
| 10.10 |
|
Mining Production Work Agreement dated September 23, 2013, by and among the Company, and Exploraciones Mineras Del Desierto SA de CV (incorporated by reference from the Report on Form 10‑K filed with the SEC on March 10, 2014, Exhibit 10.9, File No. 001‑33190) |
|
10.11* |
|
Offer of Employment Agreement dated November 17, 2015 between the Company and Colin Sutherland (incorporated by reference to the Report on Form 8-K filed with the SEC on January 6, 2016, Exhibit 10.1, File No. 001-33190) |
| 10.12 |
|
English Summary of Line of Credit Agreement, dated April 17, 2015, and finalized May 29, 2015 between Banco Nacional de Comercio Exterior and Compañia Minera Pangea (incorporated by reference to Form 8-K filed with the SEC on June 2, 2015, Exhibit 10.1, File No. 001-33190) |
114
| 10.13 |
|
Guaranty and Subordination Agreement, dated April 17, 2015, by McEwen Mining Inc. for the benefit of El Banco Nacional de Comercio Exterior, S.N.C. (incorporated by reference to Form 8-K filed with the SEC on June 2, 2015, Exhibit 10.2, File No. 001-33190) |
| 16 |
|
Letter from KPMG LLP dated December 3, 2015 addressed to the SEC (incorporated by reference to Form 8-K filed with the SEC on December 3, 2015, Exhibit 16.1, File No. 001-33190) |
|
21+ |
|
List of subsidiaries of the Company, filed herein. |
|
23.1+ |
|
Consent of KPMG LLP, Independent Registered Public Accounting Firm, filed herein. |
|
31.1+ |
|
Certification pursuant to Section 302 of the Sarbanes‑Oxley Act of 2002 for Robert R. McEwen, filed herein. |
|
31.2+ |
|
Certification pursuant to Section 302 of the Sarbanes‑Oxley Act of 2002 for Andrew Elinesky, filed herein. |
|
32+ |
|
Certification pursuant to Section 906 of the Sarbanes‑Oxley Act of 2002 for Robert R. McEwen and Andrew Elinesky, filed herein. |
|
101+ |
|
The following materials from the Company’s Annual Report on Form 10‑K for the year ended December 31, 2015 are filed herewith, formatted in XBRL (Extensible Business Reporting Language): (i) the Audited Consolidated Statements of Operations and Other Comprehensive Loss for the years ended December 31, 2015, 2014 and 2013, (ii) the Audited Consolidated Balance Sheets as of December 31, 2015 and 2014, (iii) the Audited Consolidated Statement of Changes in Shareholders’ Equity for the years ended December 31, 2015, 2014 and 2013, (iv) the Audited Consolidated Statements of Cash Flows for the years ended December 31, 2015, 2014 and 2013, and (v) the Notes to the Audited Consolidated Financial Statements, filed herein. |
*Management contract or compensatory plan or arrangement.
+Filed with this report.
115