Attached files
| file | filename |
|---|---|
| 8-K - FORM 8-K - Simulations Plus, Inc. | simulations_8k.htm |
Exhibit 99.1
LD MICRO MAIN EVENT INVESTOR CONFERENCE December 4, 2018 Shawn O’Connor Chief Executive Officer John Kneisel Chief Financial Officer Simulations Plus, Inc. shawn@simulations - plus.com Nasdaq: SLP
Safe Harbor Statement With the exception of historical information, the matters discussed in this presentation are forward - looking statements that involve a number of risks and uncertainties. The actual results of the Company could differ significantly from those statements. Factors that could cause or contribute to such differences include, but are not limited to: continuing demand for the Company’s products, competitive factors, the Company’s ability to finance future growth, the Company’s ability to produce and market new products in a timely fashion, the Company’s ability to continue to attract and retain skilled personnel, and the Company’s ability to sustain or improve current levels of productivity. Further information on the Company’s risk factors is contained in the Company’s quarterly and annual reports and filed with the Securities and Exchange Commission. 2 Nasdaq: SLP

Products & Services Software Product Portfolio • Physiologically - based modeling & simulation platform for drug R&D • Predictive software for >140 properties of chemical formulations • Analytical software for certain biological or disease states • Cloud - based web app for drug development lifecycle management Consulting Services • Provide multi - disciplinary modeling and simulation support Operating Divisions • Simulations Plus, Inc. • Cognigen • DILIsym Consistent Financial Results • > 10 years of consistent revenue growth • > 10 years of profitability • Cash generated from operations during 2018 of $9.3M with cash on hand at year end of $9.4M • Dividend payout ratio of 46% • Quarterly dividend of $0.06 per share 1 • Stock price has increased 43.8% over the last year 2 Customers and Market Pharmaceutical and biotech companies ranging from the largest in the world to a number of medium - sized and smaller companies in the U.S., Europe and Asia. Corporate Information • The company was founded in 1996 and now has 96 employees* worldwide. • Primary offices located in Lancaster, CA; Buffalo, NY and Raleigh, NC. * As of 11/14/2018 Simulations Plus Our mission is to improve the productivity of science - based research & development enterprises by delivering innovative modeling and simulation software and insightful consulting services Nasdaq: SLP 3 1 No assurances can be made as the BOD makes its decision on a quarterly basis based on current financial condition and strateg ic plans 2 Based on 8/31/17 and 8/31/18 closing prices as reported on the Nasdaq Capital Market
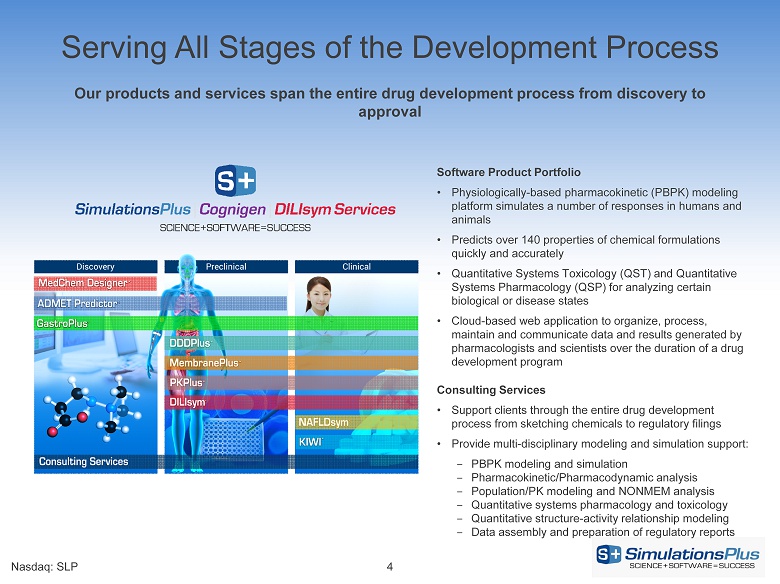
Serving All Stages of the Development Process Nasdaq: SLP 4 Our products and services span the entire drug development process from discovery to approval Software Product Portfolio • Physiologically - based pharmacokinetic (PBPK) modeling platform simulates a number of responses in humans and animals • Predicts over 140 properties of chemical formulations quickly and accurately • Quantitative Systems Toxicology (QST) and Quantitative Systems Pharmacology (QSP) for analyzing certain biological or disease states • Cloud - based web application to organize, process, maintain and communicate data and results generated by pharmacologists and scientists over the duration of a drug development program Consulting Services • Support clients through the entire drug development process from sketching chemicals to regulatory filings • Provide multi - disciplinary modeling and simulation support: ‒ PBPK modeling and simulation ‒ Pharmacokinetic/Pharmacodynamic analysis ‒ Population/PK modeling and NONMEM analysis ‒ Quantitative systems pharmacology and toxicology ‒ Quantitative structure - activity relationship modeling ‒ Data assembly and preparation of regulatory reports
• Industry Drivers – Pharmaceutical companies under increasing pressure to reduce the cost and time of drug discovery and development – Pharmaceutical companies targeting drug candidates for smaller markets requiring more efficient development process – Pharmaceutical companies integrating the use of modeling and simulation into their development standard practices with resulting increase in budgets for tools and services – Modeling and simulation tools and services are supporting data analytics and personalized medicine initiatives • Regulatory Drivers – Regulatory agencies are receiving more new drug and generic product applications for review and need to improve efficiency to reduce burden – Regulatory agencies have developed confidence that modeling & simulation technology can reproduce certain observed outcomes – Regulatory agencies are encouraging companies to utilize modeling & simulation technology to support applications and ensure new therapies reach patients in a timely and cost - effective fashion – Regulatory agencies are reporting an exponential rise in the number of applications citing modeling & simulation results – There are now >15 regulatory guidance documents that specifically reference modeling & simulation technology Nasdaq: SLP 5 Market Growth Drivers Market trends create substantial tail winds for growth across products and services Source: “How FDA Plans to Help Consumers Capitalize on Advances in Science” FDA Voice blog: July 7, 2017
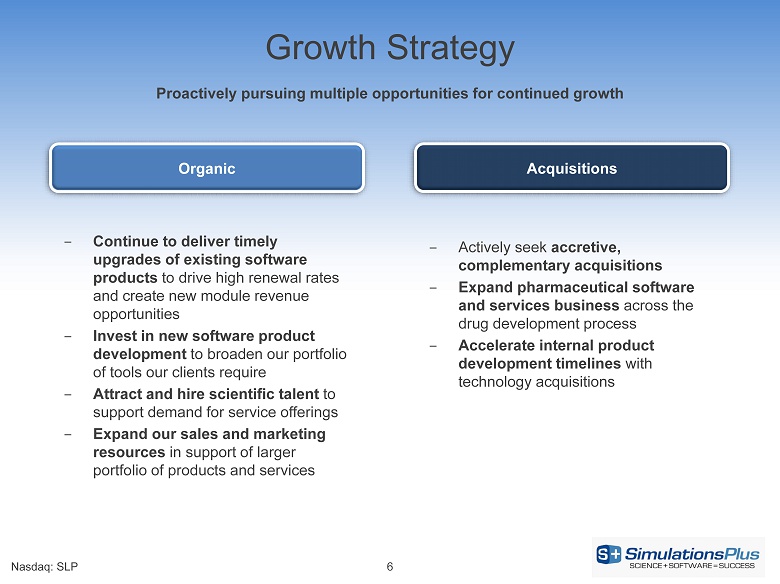
Growth Strategy Nasdaq: SLP 6 ‒ Continue to deliver timely upgrades of existing software products to drive high renewal rates and create new module revenue opportunities ‒ Invest in new software product development to broaden our portfolio of tools our clients require ‒ Attract and hire scientific talent to support demand for service offerings ‒ Expand our sales and marketing resources in support of larger portfolio of products and services Acquisitions Organic ‒ Actively seek accretive, complementary acquisitions ‒ Expand pharmaceutical software and services business across the drug development process ‒ Accelerate internal product development timelines with technology acquisitions Proactively pursuing multiple opportunities for continued growth
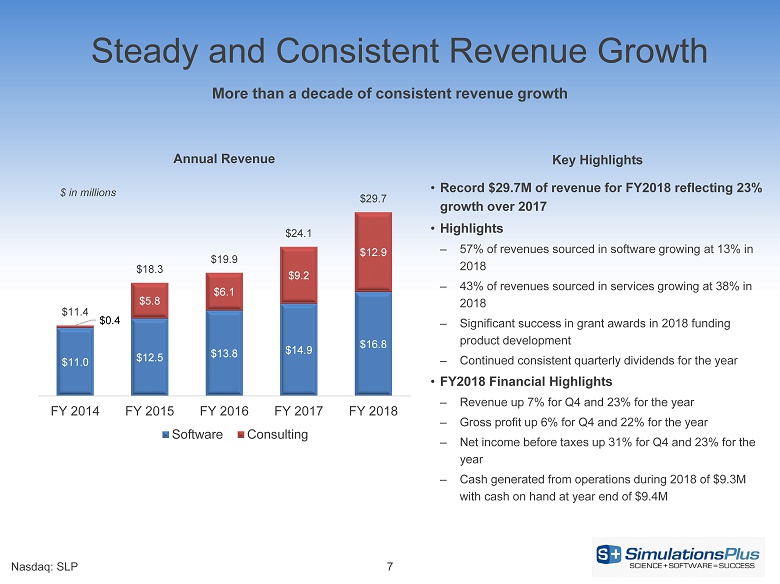
Steady and Consistent Revenue Growth 7 Nasdaq: SLP More than a decade of consistent revenue growth $11.0 $12.5 $13.8 $14.9 $16.8 $0.4 $5.8 $6.1 $9.2 $12.9 $11.4 $18.3 $19.9 $24.1 $29.7 FY 2014 FY 2015 FY 2016 FY 2017 FY 2018 Annual Revenue Software Consulting Key Highlights • Record $29.7M of revenue for FY2018 reflecting 23% growth over 2017 • Highlights – 57% of revenues sourced in software growing at 13% in 2018 – 43% of revenues sourced in services growing at 38% in 2018 – Significant success in grant awards in 2018 funding product development – Continued consistent quarterly dividends for the year • FY2018 Financial Highlights – Revenue up 7% for Q4 and 23% for the year – Gross profit up 6% for Q4 and 22% for the year – Net income before taxes up 31% for Q4 and 23% for the year – Cash generated from operations during 2018 of $9.3M with cash on hand at year end of $9.4M $ in millions
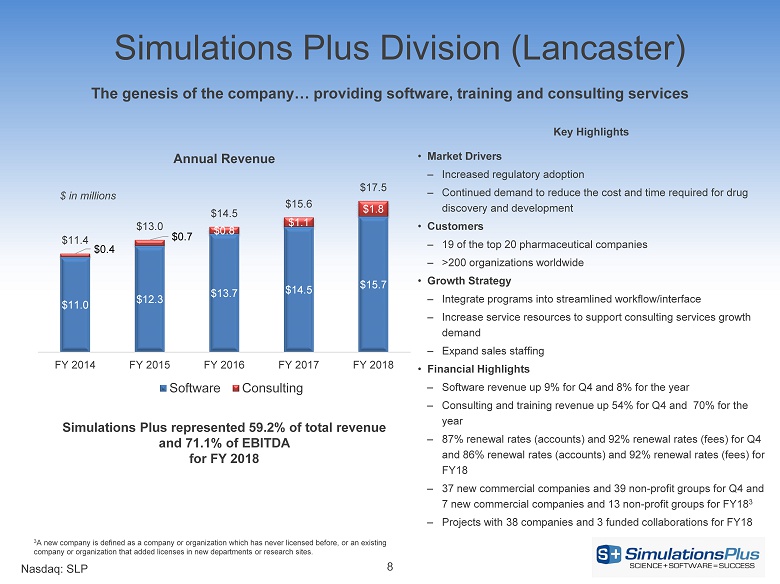
Simulations Plus Division (Lancaster) 8 Nasdaq: SLP The genesis of the company… providing software, training and consulting services $11.0 $12.3 $13.7 $14.5 $15.7 $0.4 $0.7 $0.8 $1.1 $1.8 $11.4 $13.0 $14.5 $15.6 $17.5 FY 2014 FY 2015 FY 2016 FY 2017 FY 2018 Annual Revenue Software Consulting $ in millions Simulations Plus represented 59.2% of total revenue and 71.1% of EBITDA for FY 2018 Key Highlights • Market Drivers – Increased regulatory adoption – Continued demand to reduce the cost and time required for drug discovery and development • Customers – 19 of the top 20 pharmaceutical companies – >200 organizations worldwide • Growth Strategy – Integrate programs into streamlined workflow/interface – Increase service resources to support consulting services growth demand – Expand sales staffing • Financial Highlights – Software revenue up 9% for Q4 and 8% for the year – Consulting and training revenue up 54% for Q4 and 70% for the year – 87% renewal rates (accounts) and 92% renewal rates (fees) for Q4 and 86% renewal rates (accounts) and 92% renewal rates (fees) for FY18 – 37 new commercial companies and 39 non - profit groups for Q4 and 7 new commercial companies and 13 non - profit groups for FY18 3 – Projects with 38 companies and 3 funded collaborations for FY18 3 A new company is defined as a company or organization which has never licensed before, or an existing company or organization that added licenses in new departments or research sites.
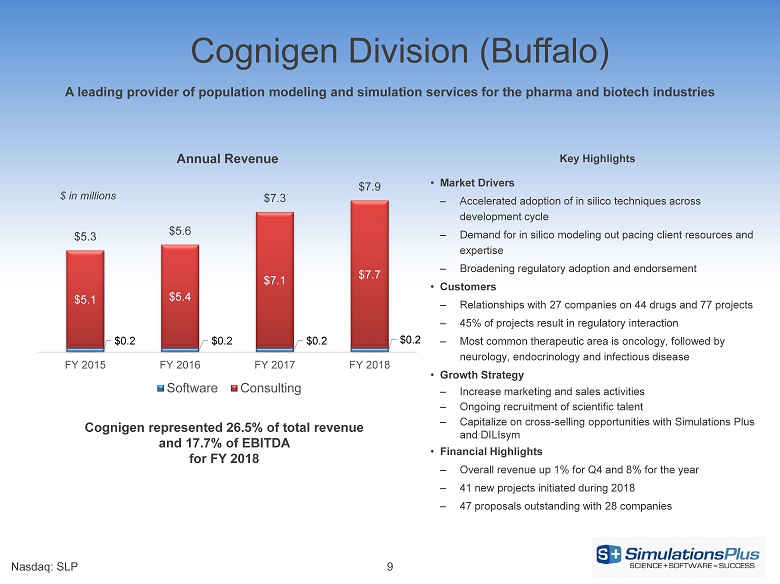
Cognigen Division (Buffalo) 9 Nasdaq: SLP A leading provider of population modeling and simulation services for the pharma and biotech industries $0.2 $0.2 $0.2 $0.2 $5.1 $5.4 $7.1 $7.7 $5.3 $5.6 $7.3 $7.9 FY 2015 FY 2016 FY 2017 FY 2018 Annual Revenue Software Consulting Key Highlights • Market Drivers – Accelerated adoption of in silico techniques across development cycle – Demand for in silico modeling out pacing client resources and expertise – Broadening regulatory adoption and endorsement • Customers – Relationships with 27 companies on 44 drugs and 77 projects – 45% of projects result in regulatory interaction – Most common therapeutic area is oncology, followed by neurology, endocrinology and infectious disease • Growth Strategy – Increase marketing and sales activities – Ongoing recruitment of scientific talent – Capitalize on cross - selling opportunities with Simulations Plus and DILIsym • Financial Highlights – Overall revenue up 1% for Q4 and 8% for the year – 41 new projects initiated during 2018 – 47 proposals outstanding with 28 companies $ in millions Cognigen represented 26.5% of total revenue and 17.7% of EBITDA for FY 2018
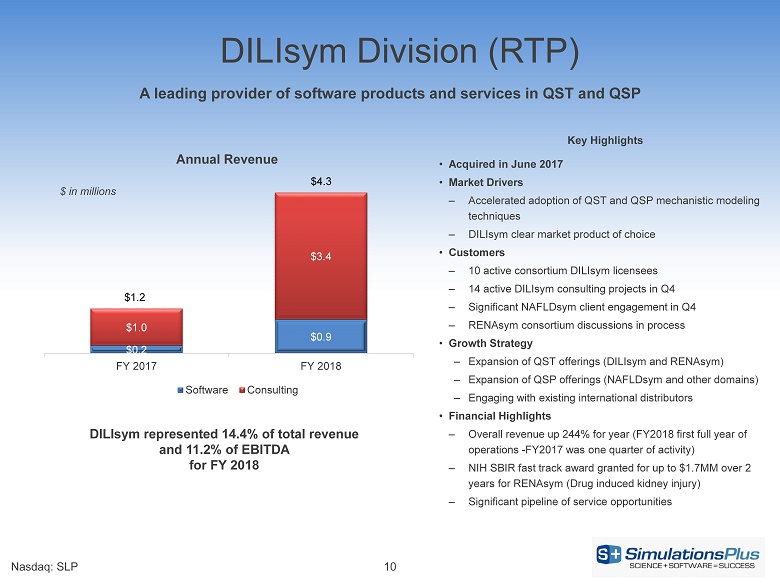
$0.2 $0.9 $1.0 $3.4 $1.2 $4.3 FY 2017 FY 2018 Annual Revenue Software Consulting DILIsym Division (RTP) 10 Nasdaq: SLP A leading provider of software products and services in QST and QSP Key Highlights • Acquired in June 2017 • Market Drivers – Accelerated adoption of QST and QSP mechanistic modeling techniques – DILIsym clear market product of choice • Customers – 10 active consortium DILIsym licensees – 14 active DILIsym consulting projects in Q4 – Significant NAFLDsym client engagement in Q4 – RENAsym consortium discussions in process • Growth Strategy – Expansion of QST offerings (DILIsym and RENAsym ) – Expansion of QSP offerings ( NAFLDsym and other domains) – Engaging with existing international distributors • Financial Highlights – Overall revenue up 244% for year (FY2018 first full year of operations - FY2017 was one quarter of activity) – NIH SBIR fast track award granted for up to $1.7MM over 2 years for RENAsym (Drug induced kidney injury) – Significant pipeline of service opportunities $ in millions DILIsym represented 14.4% of total revenue and 11.2% of EBITDA for FY 2018
Financial Overview Nasdaq: SLP
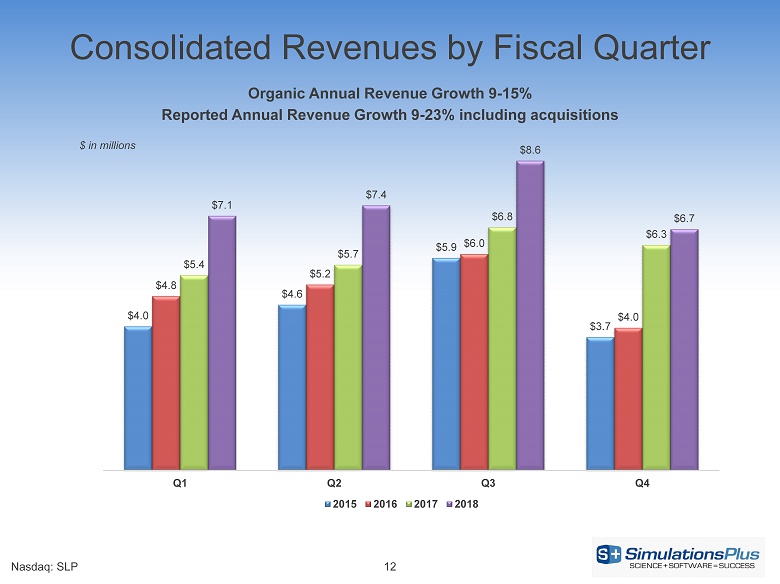
Consolidated Revenues by Fiscal Quarter Nasdaq: SLP 12 $4.0 $4.6 $5.9 $3.7 $4.8 $5.2 $6.0 $4.0 $5.4 $5.7 $6.8 $6.3 $7.1 $7.4 $8.6 $6.7 Q1 Q2 Q3 Q4 2015 2016 2017 2018 $ in millions Organic Annual Revenue Growth 9 - 15% Reported Annual Revenue Growth 9 - 23% including acquisitions
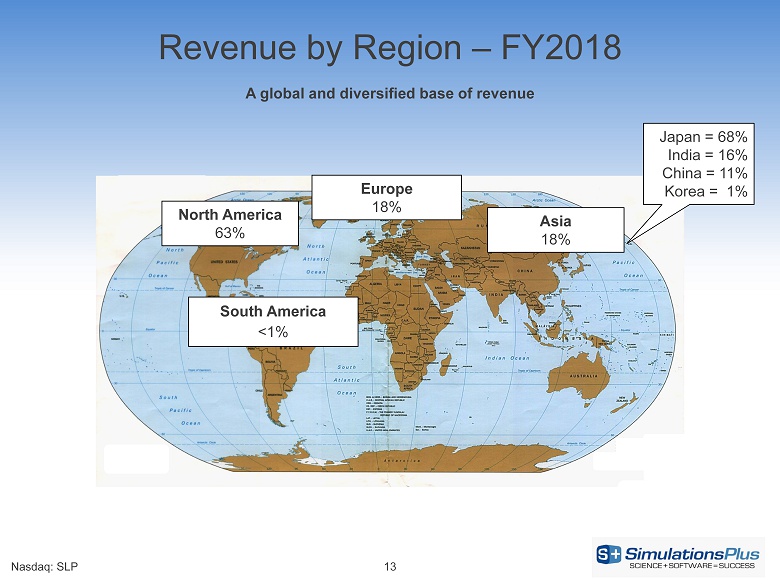
Revenue by Region – FY2018 Nasdaq: SLP Europe 18% North America 63% Asia 18% South America <1% Japan = 68% India = 16% China = 11% Korea = 1% 13 A global and diversified base of revenue
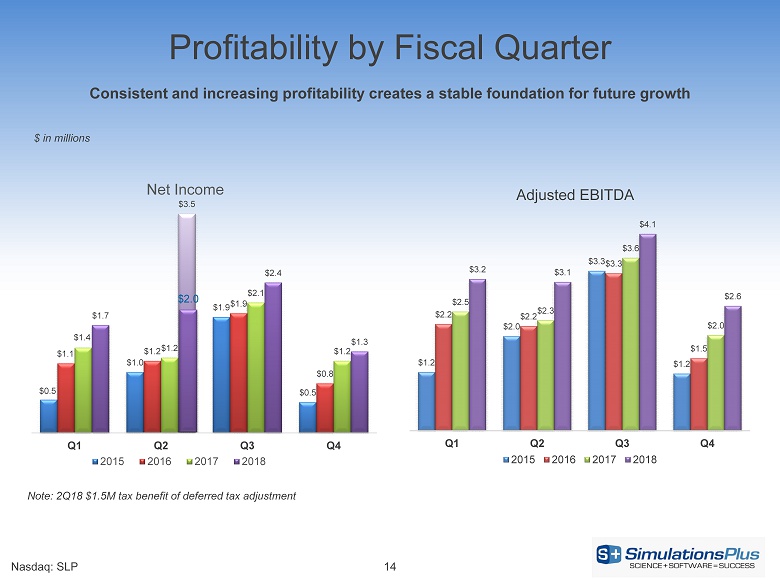
$0.5 $1.0 $1.9 $0.5 $1.1 $1.2 $1.9 $0.8 $1.4 $1.2 $2.1 $1.2 $1.7 $3.5 $2.4 $1.3 Q1 Q2 Q3 Q4 Net Income 2015 2016 2017 2018 Profitability by Fiscal Quarter Nasdaq: SLP 14 Note: 2Q18 $1.5M tax benefit of deferred tax adjustment $1.2 $2.0 $3.3 $1.2 $2.2 $2.2 $3.3 $1.5 $2.5 $2.3 $3.6 $2.0 $3.2 $3.1 $4.1 $2.6 Q1 Q2 Q3 Q4 Adjusted EBITDA 2015 2016 2017 2018 Consistent and increasing profitability creates a stable foundation for future growth $ in millions $2.0
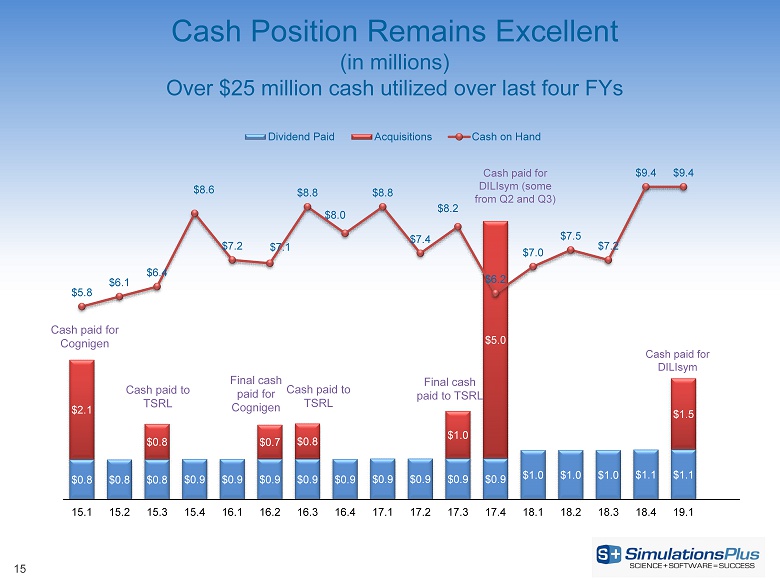
15 Cash Position Remains Excellent (in millions) Over $25 million cash utilized over last four FYs $0.8 $0.8 $0.8 $0.9 $0.9 $0.9 $0.9 $0.9 $0.9 $0.9 $0.9 $0.9 $1.0 $1.0 $1.0 $1.1 $1.1 $2.1 $0.8 $0.7 $0.8 $1.0 $5.0 $1.5 $5.8 $6.1 $6.4 $8.6 $7.2 $7.1 $8.8 $8.0 $8.8 $7.4 $8.2 $6.2 $7.0 $7.5 $7.2 $9.4 $9.4 15.1 15.2 15.3 15.4 16.1 16.2 16.3 16.4 17.1 17.2 17.3 17.4 18.1 18.2 18.3 18.4 19.1 Dividend Paid Acquisitions Cash on Hand Cash paid for DILIsym Cash paid for Cognigen Final cash paid for Cognigen Cash paid for DILIsym (some from Q2 and Q3) Cash paid to TSRL Cash paid to TSRL Final cash paid to TSRL
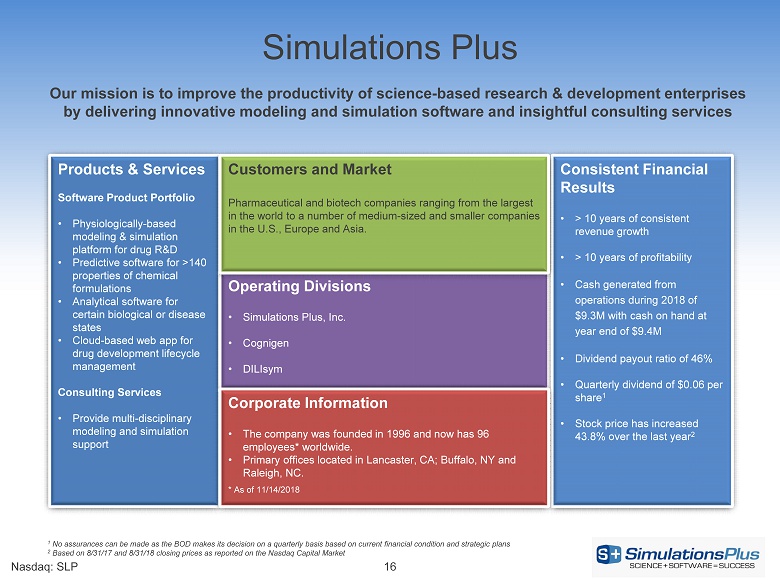
Products & Services Software Product Portfolio • Physiologically - based modeling & simulation platform for drug R&D • Predictive software for >140 properties of chemical formulations • Analytical software for certain biological or disease states • Cloud - based web app for drug development lifecycle management Consulting Services • Provide multi - disciplinary modeling and simulation support Operating Divisions • Simulations Plus, Inc. • Cognigen • DILIsym Consistent Financial Results • > 10 years of consistent revenue growth • > 10 years of profitability • Cash generated from operations during 2018 of $9.3M with cash on hand at year end of $9.4M • Dividend payout ratio of 46% • Quarterly dividend of $0.06 per share 1 • Stock price has increased 43.8% over the last year 2 Customers and Market Pharmaceutical and biotech companies ranging from the largest in the world to a number of medium - sized and smaller companies in the U.S., Europe and Asia. Corporate Information • The company was founded in 1996 and now has 96 employees* worldwide. • Primary offices located in Lancaster, CA; Buffalo, NY and Raleigh, NC. * As of 11/14/2018 Simulations Plus Our mission is to improve the productivity of science - based research & development enterprises by delivering innovative modeling and simulation software and insightful consulting services Nasdaq: SLP 16 1 No assurances can be made as the BOD makes its decision on a quarterly basis based on current financial condition and strateg ic plans 2 Based on 8/31/17 and 8/31/18 closing prices as reported on the Nasdaq Capital Market
Nasdaq: SLP 17 Thank you for your attention… Website: https:// www.simulations - plus.com LinkedIn Company Profile: https://www.linkedin.com/company/95827/