Attached files
| file | filename |
|---|---|
| EX-99.2 - EXHIBIT 99.2 - TECH DATA CORP | q3fy19cfofinancialhighli.htm |
| 8-K - 8-K - TECH DATA CORP | fy19-q3earningsrelease8xk.htm |
Page 1 of 11

NEWS
FOR IMMEDIATE RELEASE
TECH DATA CORPORATION REPORTS THIRD QUARTER
FISCAL YEAR 2019 RESULTS
CLEARWATER, Fla., (November 29, 2018) -- Tech Data (Nasdaq: TECD) (the “Company”) today announced its financial results for the third quarter ended October 31, 2018.
Third quarter ended October 31, | Nine months ended October 31, | |||||
($ in millions, except per share amounts) | 2018 | 2017 | Y/Y Change | 2018 | 2017 | Y/Y Change |
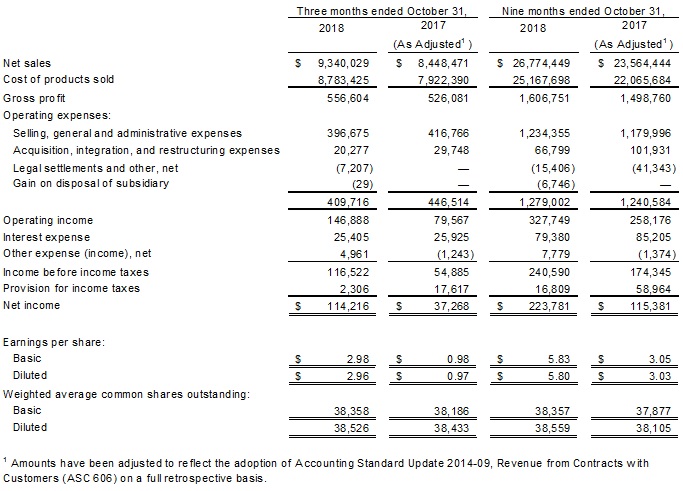
Net Sales | $9,340.0 | $8,448.5 | 11% | $26,774.4 | $23,564.4 | 14% |
Operating income (GAAP) | $146.9 | $79.6 | 85% | $327.7 | $258.2 | 27% |
Operating margin (GAAP) | 1.57% | 0.94% | 63 bps | 1.22% | 1.10% | 12 bps |
Operating income (Non-GAAP) | $188.0 | $135.7 | 39% | $447.0 | $386.8 | 16% |
Operating margin (Non-GAAP) | 2.01% | 1.61% | 40 bps | 1.67% | 1.64% | 3 bps |
Net income (GAAP) | $114.2 | $37.3 | 206% | $223.8 | $115.4 | 94% |
Net income (Non-GAAP) | $116.3 | $76.7 | 52% | $264.8 | $213.5 | 24% |
EPS - diluted (GAAP) | $2.96 | $0.97 | 205% | $5.80 | $3.03 | 91% |
EPS - diluted (Non-GAAP) | $3.02 | $2.00 | 51% | $6.87 | $5.60 | 23% |
A reconciliation of GAAP to non-GAAP financial measures is presented in the financial tables of this press release.
This information is also available on the Investor Relations section of Tech Data’s website at www.techdata.com/investor.
Financial Highlights for the Third Quarter Ended October, 31, 2018:
• | Net sales were $9.3 billion, an increase of 11 percent compared to the prior-year quarter. On a constant currency basis, net sales increased 12 percent. |
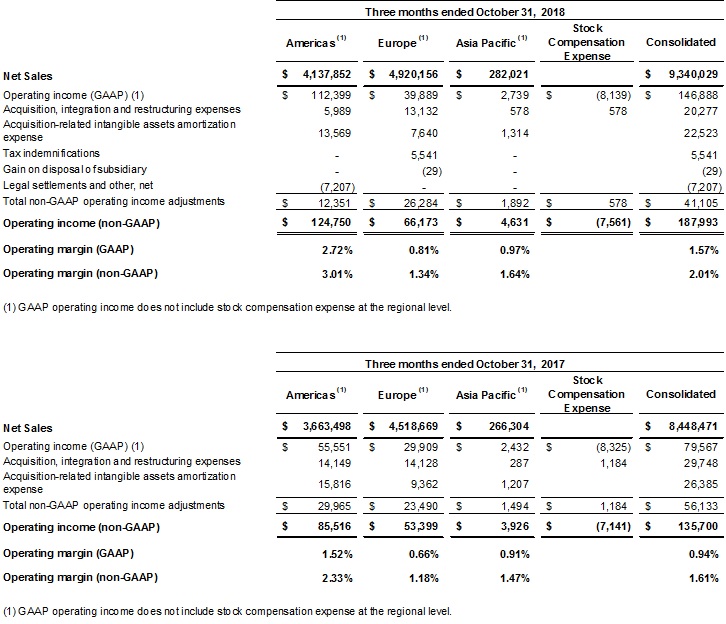
o | Americas: Net sales were $4.1 billion (44 percent of worldwide net sales), an increase of 13 percent. On a constant currency basis, net sales increased 14 percent. |
o | Europe: Net sales were $4.9 billion (53 percent of worldwide net sales), an increase of 9 percent. On a constant currency basis, net sales increased 12 percent. |
o | Asia Pacific: Net sales were $0.3 billion (3 percent of worldwide net sales), an increase of 6 percent. On a constant currency basis, net sales increased 12 percent. |
• | Gross profit was $556.6 million, an increase of $30.5 million, or 6 percent. As a percentage of net sales, gross profit was 5.96 percent compared to 6.23 percent in the prior-year quarter. |
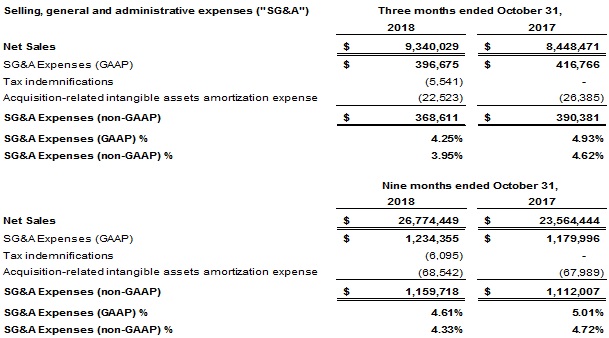
• | Selling, general and administrative expenses (“SG&A”) were $396.7 million, or 4.25 percent of net sales, compared to $416.8 million, or 4.93 percent of net sales in the prior-year quarter. Non-GAAP SG&A was $368.6 million, a decrease of $21.8 million, or 6 percent. As a percentage of net sales, non-GAAP SG&A was 3.95 percent, compared to 4.62 percent in the prior-year quarter. Included in SG&A and non-GAAP SG&A expenses is a $25 million benefit from the collection of a previously reserved accounts receivable. |
Page 2 of 11
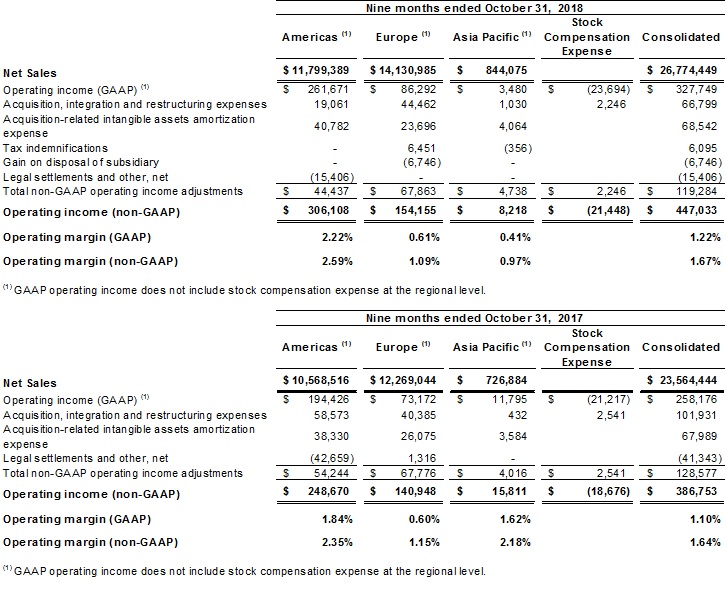
• | Worldwide operating income was $146.9 million, or 1.57 percent of net sales compared to $79.6 million or 0.94 percent of net sales in the prior-year quarter. Non-GAAP operating income was $188.0 million, an increase of $52.3 million, or 39 percent. As a percentage of net sales, non-GAAP operating income was 2.01 percent, an improvement of 40 basis points. |
o | Americas: Operating income was $112.4 million, or 2.72 percent of net sales, compared to $55.6 million, or 1.52 percent of net sales in the prior-year quarter. Non-GAAP operating income was $124.8 million, an increase of $39.3 million, or 46 percent. As a percentage of net sales, non-GAAP operating income was 3.01 percent, an improvement of 68 basis points. |
o | Europe: Operating income was $39.9 million, or 0.81 percent of net sales, compared to $29.9 million, or 0.66 percent of net sales in the prior-year quarter. Non-GAAP operating income was $66.2 million, an increase of $12.8 million, or 24 percent. As a percentage of net sales, non-GAAP operating income was 1.34 percent, an improvement of 16 basis points. |
o | Asia Pacific: Operating income was $2.7 million, or 0.97 percent of net sales, compared to $2.4 million, or 0.91 percent of net sales in the prior-year quarter. Non-GAAP operating income was $4.6 million, an increase of $0.7 million, or 18 percent. As a percentage of net sales, non-GAAP operating income was 1.64 percent, an improvement of 17 basis points. |
o | Included in worldwide and Americas operating income and non-GAAP operating income is a $25 million benefit from the collection of a previously reserved accounts receivable. |
o | Stock-based compensation expense was $8.1 million, compared to $8.3 million in the prior-year quarter. This includes $0.6 million of acquisition and integration-related stock compensation expense. These expenses are excluded from the regional operating results and presented as a separate line item in the company’s segment reporting (see the GAAP to non-GAAP reconciliation in the financial tables of this press release). |
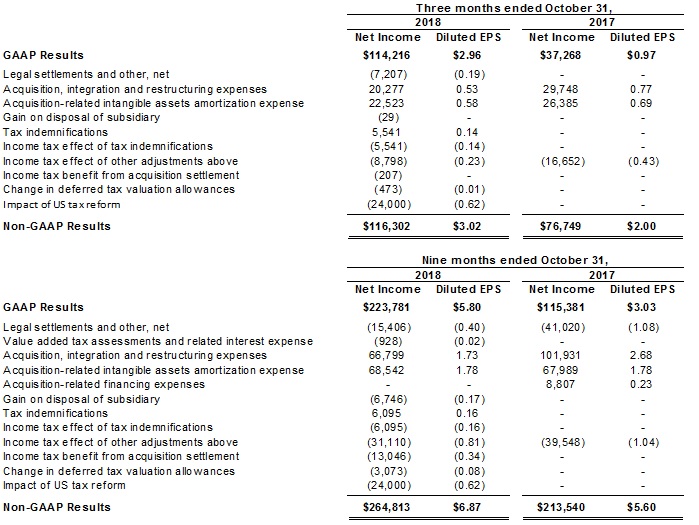
• | Net income was $114.2 million, compared to $37.3 million in the prior-year quarter. Non-GAAP net income was $116.3 million, an increase of $39.6 million, or 52 percent. Included in net income and non-GAAP net income is an $18 million (net of tax) benefit from the collection of a previously reserved accounts receivable. |
• | Earnings per share on a diluted basis (“EPS”) were $2.96 compared to $0.97 in the prior year quarter. Non-GAAP EPS were $3.02, an increase of $1.02, or 51 percent compared to the prior-year quarter. Included in earnings per share and non-GAAP earnings per share is a $0.47 benefit from the collection of a previously reserved accounts receivable. |
• | Net cash generated by operations during the quarter was $155 million. |
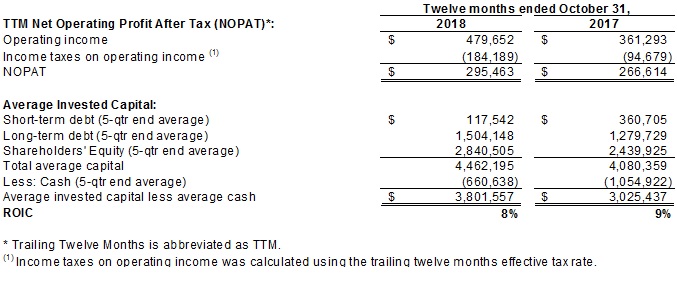
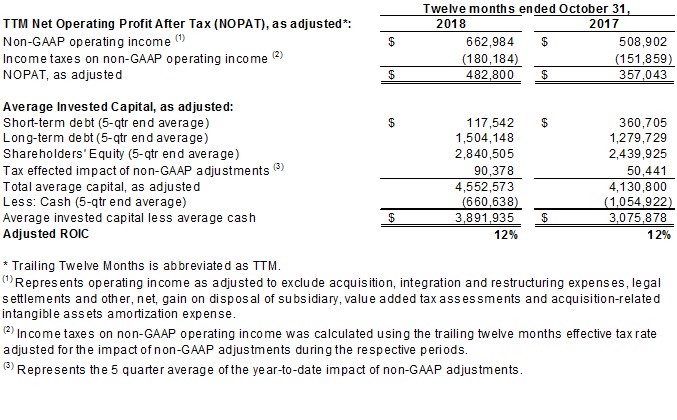
• | Return on invested capital for the trailing twelve months was 8 percent, compared to 9 percent in the prior-year period. The adjusted return on invested capital for the trailing twelve month period was 12 percent, essentially flat from the prior-year period. |
“I am pleased to report that our teams delivered a strong Q3 performance with great execution across our three regions. Worldwide sales grew 11 percent and we achieved high double-digit non-GAAP operating income and earnings per share growth. In addition, we generated $155 million in cash from operations, earned an adjusted return on invested capital of 12 percent, paid down $100 million of debt and returned $44 million to our shareholders through share repurchases,” said Rich Hume, chief executive officer. “Our Q3 results reflect the powerful combination of our end-to-end portfolio and strong execution by our global teams. They also validate the strategic role we play in the IT Supply chain – delivering high value through our end-to-end portfolio to channel partners across the broad spectrum of IT products and solutions.”
Business Outlook
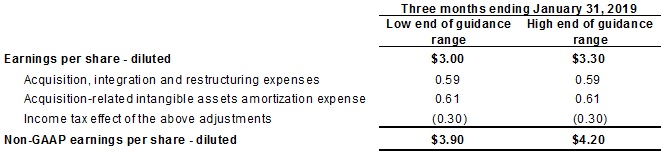
• | For the quarter ending January 31, 2019, the Company anticipates: |
o | Worldwide net sales to be in the range of $10.5 billion to $10.9 billion |
o | EPS to be in the range of $3.00 to $3.30 and non-GAAP EPS to be in the range of $3.90 to $4.20 |
o | An effective tax rate in the range of 24 percent to 26 percent |
• | This guidance assumes an average U.S. dollar to euro exchange rate of $1.15 to €1.00. |
Page 3 of 11
Webcast Details
Tech Data will hold a conference call today at 9:00 a.m. (ET) to discuss its financial results for the third quarter ended October 31, 2018. A webcast of the call, including supplemental schedules, will be available to all interested parties and can be obtained at www.techdata.com/investor. The webcast will be available for replay for three months.
Non-GAAP Financial Information
The non-GAAP financial information contained in this release is included with the intention of providing investors a more complete understanding of the Company’s operational results and trends, but should only be used in conjunction with results reported in accordance with Generally Accepted Accounting Principles (“GAAP”). Certain non-GAAP measures presented in this release or other releases, presentations and similar documents issued by the Company include sales, income or expense items as adjusted for the impact of changes in foreign currencies (referred to as “constant currency”), non-GAAP operating income, non-GAAP operating margin, non-GAAP net income, non-GAAP earnings per diluted share and Adjusted Return on Invested Capital. Certain non-GAAP measures also exclude acquisition-related intangible assets amortization expense, benefits associated with legal settlements, acquisition, integration and restructuring expenses, value-added tax assessments and related interest expense, gain on disposal of subsidiary, tax indemnifications, acquisition-related financing expenses, changes in deferred tax valuation allowances and the impact of U.S. tax reform. A detailed reconciliation of the adjustments between results calculated using GAAP and non-GAAP in this release is contained in the attached financial schedules. This information can also be obtained from the Company’s Investor Relations website at www.techdata.com/investor.
Forward-Looking Statements
Certain statements in this communication may contain “forward-looking statements” within the meaning of the Private Securities Litigation Reform Act of 1995. These statements, including statements regarding Tech Data’s plans, objectives, expectations and intentions, Tech Data’s financial results and estimates and/or business prospects, involve a number of risks and uncertainties, and actual results could differ materially from those projected. These forward looking statements are based on current expectations, estimates, forecasts and projections about the operating environment, economies and markets in which Tech Data operates, and the beliefs and assumptions of our management. Words such as “expects,” “anticipates,” “targets,” “goals,” “projects,” “intends,” “plans,” “believes,” “seeks,” “estimates,” variations of such words, and similar expressions are intended to identify such forward looking statements. In addition, any statements that refer to projections of Tech Data’s future financial performance, our anticipated growth and trends in our businesses, and other characterizations of future events or circumstances, are forward looking statements. These forward looking statements are only predictions and are subject to risks, uncertainties, and assumptions. Therefore, actual results may differ materially and adversely from those expressed in any forward looking statements.
For additional information with respect to risks and other factors which could occur, see Tech Data’s Annual Report on Form 10-K for the year ended January 31, 2018, including Part I, Item 1A, “Risk Factors” therein, Quarterly Reports on Form 10-Q, Current Reports on Form 8-K and other securities filings with the Securities and Exchange Commission (the “SEC”) that are available at the SEC’s website at www.sec.gov and other securities regulators. Readers are cautioned not to place undue reliance upon any such forward-looking statements, which speak only as of the date made. Many of these factors are beyond Tech Data’s control. Unless otherwise required by applicable securities laws, Tech Data disclaims any intention or obligation to update or revise any forward-looking statements, whether as a result of new information, future events or otherwise. Tech Data undertakes no duty to update any forward looking statements contained herein to reflect actual results or changes in Tech Data’s expectations.
About Tech Data
Tech Data connects the world with the power of technology. Our end-to-end portfolio of products, services and solutions, highly specialized skills, and expertise in next-generation technologies enable channel partners to bring to market the products and solutions the world needs to connect, grow and advance. Tech Data is ranked No. 83 on the Fortune 500® and has been named one of Fortune's "World's Most Admired Companies" for nine straight years. To find out more, visit www.techdata.com or follow us on Twitter, LinkedIn and Facebook.
Page 4 of 11
Contacts:
Charles V. Dannewitz, Executive Vice President, Chief Financial Officer
727-532-8028 (chuck.dannewitz@techdata.com)
Arleen Quiñones, Corporate Vice President, Investor Relations and Corporate Communications
727-532-8866 (arleen.quinones@techdata.com)
Page 5 of 11
TECH DATA CORPORATION AND SUBSIDIARIES
CONSOLIDATED STATEMENT OF OPERATIONS
(In thousands, except per share amounts)
(Unaudited)
Page 6 of 11
TECH DATA CORPORATION AND SUBSIDIARIES
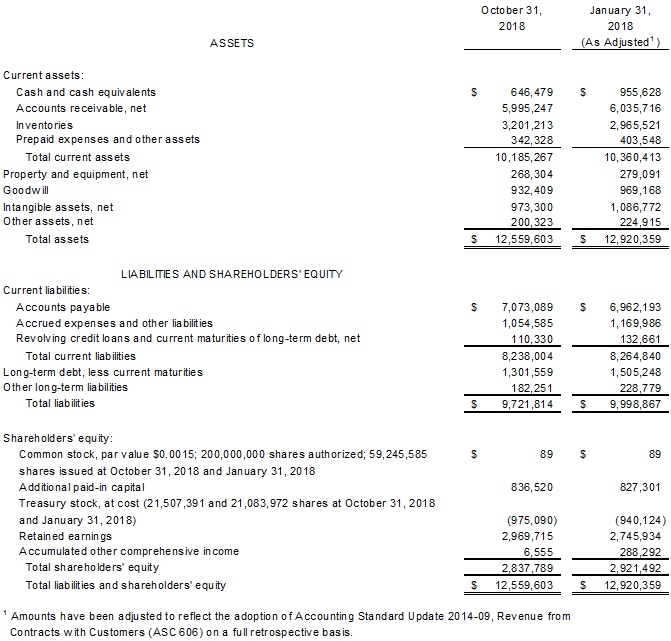
CONSOLIDATED BALANCE SHEET
(In thousands, except par value and share amounts)
(Unaudited)
Page 7 of 11
TECH DATA CORPORATION AND SUBSIDIARIES
GAAP TO NON-GAAP RECONCILIATION
(In thousands)
Page 8 of 11
TECH DATA CORPORATION AND SUBSIDIARIES
GAAP TO NON-GAAP RECONCILIATION
(In thousands)
Page 9 of 11
TECH DATA CORPORATION AND SUBSIDIARIES
GAAP TO NON-GAAP RECONCILIATION
(In thousands)
Page 10 of 11
TECH DATA CORPORATION AND SUBSIDIARIES
GAAP TO NON-GAAP RECONCILIATION
(In thousands)
Return on Invested Capital (ROIC)
Adjusted Return on Invested Capital (ROIC)
Page 11 of 11
TECH DATA CORPORATION AND SUBSIDIARIES
GAAP TO NON-GAAP RECONCILIATION
Guidance Reconciliation