Attached files
Table of Contents
UNITED STATES
SECURITIES AND EXCHANGE COMMISSION
Washington, D.C. 20549
FORM 10-K
(Mark One)
| x | ANNUAL REPORT PURSUANT TO SECTION 13 OR 15(d) OF THE SECURITIES EXCHANGE ACT OF 1934 |
For the fiscal year ended January 31, 2010
OR
| ¨ | TRANSITION REPORT PURSUANT TO SECTION 13 or 15(d) OF THE SECURITIES EXCHANGE ACT OF 1934 |
For the transition period from to .
Commission File Number 0-14625
TECH DATA CORPORATION
(Exact name of Registrant as specified in its charter)
| Florida | 59-1578329 | |
| (State or other jurisdiction of incorporation or organization) |
(I.R.S. Employer Identification Number) |
| 5350 Tech Data Drive Clearwater, Florida |
33760 | |
| (Address of principal executive offices) | (Zip Code) |
(Registrant’s Telephone Number, including Area Code): (727) 539-7429
Securities registered pursuant to Section 12(b) of the Act:
Common stock, par value $.0015 per share
Securities registered pursuant to Section 12 (g) of the Act: None
Indicate by a check mark if the registrant is a well-known seasoned issuer, as defined in Rule 405 of the Securities Act. Yes x No ¨
Indicate by a check mark if the registrant is not required to file reports pursuant to Section 13 or Section 15(d) of the Act. Yes ¨ No x
Indicate by check mark whether the registrant (1) has filed all reports required to be filed by Section 13 or 15(d) of the Securities Exchange Act of 1934 during the preceding 12 months (or shorter period that the registrant was required to file such reports), and (2) has been subject to such filing requirements for the past 90 days. Yes x No ¨
Indicate by check mark whether the registrant has submitted electronically and posted on its corporate Web site, if any, every Interactive Data File required to be submitted and posted pursuant to Rule 405 of Regulation S-T (§232.405 of this chapter) during the preceding 12 months (or for such shorter period that the registrant was required to submit and post such files). Yes ¨ No ¨
Indicate by check mark if disclosure of delinquent filers pursuant to Item 405 of Regulation S-K is not contained herein, and will not be contained to the best of registrant’s knowledge, in definitive proxy or information statements incorporated by reference in Part III of this Form 10-K or any amendment to this Form 10-K. x
Indicate by check mark whether the registrant is a large accelerated filer, an accelerated filer, a non-accelerated filer or a smaller reporting company. See the definitions of “accelerated filer”, “large accelerated filer” and “smaller reporting company” in Rule 12b-2 of the Exchange Act. (Check one):
| Large accelerated filer | x | Accelerated Filer | ¨ | |||
| Non-accelerated Filer | ¨ | Smaller Reporting Company Filer | ¨ | |||
Indicate by check mark whether the registrant is a shell company (as defined in Rule 12b-2 of the Act). Yes ¨ No x
Aggregate market value of the voting stock held by non-affiliates was $1,741,882,184 based on the reported last sale price of common stock on July 31, 2009, which is the last business day of the registrant’s most recently completed second fiscal quarter.
Indicate the number of shares outstanding of each of the registrant’s classes of common stock, as of the latest practicable date.
| Class |
Outstanding at February 25, 2010 | |
| Common stock, par value $.0015 per share | 51,460,888 |
DOCUMENTS INCORPORATED BY REFERENCE
The registrant’s Proxy Statement for use at the Annual Meeting of Shareholders on June 2, 2010, is incorporated by reference in Part III of this Form 10-K to the extent stated herein.
Table of Contents
| ITEM 1. |
Business | 3 | ||
| ITEM 1A. |
Risk Factors | 8 | ||
| ITEM 1B. |
Unresolved Staff Comments | 12 | ||
| ITEM 2. |
Properties | 12 | ||
| ITEM 3. |
Legal Proceedings | 12 | ||
| ITEM 4. |
Reserved | 12 | ||
| ITEM 5. |
Market for Registrant’s Common Equity, Related Stockholder Matters and Issuer Purchases of Equity Securities | 12 | ||
| ITEM 6. |
Selected Financial Data | 15 | ||
| ITEM 7. |
Management’s Discussion and Analysis of Financial Condition and Results of Operations | 17 | ||
| ITEM 7A. |
Quantitative and Qualitative Disclosures about Market Risk | 29 | ||
| ITEM 8. |
Financial Statements and Supplementary Data | 31 | ||
| ITEM 9. |
Changes in and Disagreements With Accountants on Accounting and Financial Disclosure | 62 | ||
| ITEM 9A. |
Controls and Procedures | 62 | ||
| ITEM 9B. |
Other Information | 64 | ||
| 64 | ||||
| ITEM 14. |
Principal Accountant Fees and Services | 64 | ||
| ITEM 15. |
Exhibits, Financial Statement Schedules | 65 | ||
| Signatures | 71 | |||
| Exhibits | ||||
| Certifications | ||||
Table of Contents
PART I
| ITEM 1. | Business. |
Overview
Tech Data Corporation (“Tech Data,” “we,” “our,” “us,” or the “Company”), ranked 102nd on the 2009 FORTUNE 500(R), is a leading distributor of information technology (“IT”) products, logistics management and other value-added services. Tech Data provides a strategic link in the IT supply chain through the distribution of technology products to value-added resellers, direct marketers, resellers and corporate resellers. We serve more than 125,000 value-added resellers (“VARs”), direct marketers, retailers and corporate resellers in more than 100 countries throughout North America, Latin America and Europe. Throughout this document we will make reference to the two primary geographic markets we serve as the Americas (including North America and Latin America) and Europe. For a discussion of our geographic reporting segments, see “Item 8. Financial Statements and Supplemental Data.”
We offer a variety of products from our technology partners such as Acer, Adobe, American Power Conversion, Apple, Asus Computer, Autodesk, Canon, Cisco Systems, Epson, Fujitsu-Siemens, Hewlett-Packard, IBM, Intel, Kingston, Lexmark, Lenovo, McAfee, Microsoft, Samsung, Sony, Symantec, Toshiba, VMware, Western Digital and Xerox. Products are generally shipped from regionally located logistics centers the same day the orders are received.
Customers are provided with a high level of customer service through the Company’s technical support, electronic commerce tools (including on-line order entry and electronic data interchange (“EDI”) services), product integration services, customized shipping documents and flexible financing programs. While we strive to provide our customers with a full array of services, revenues generated from the direct sale of services contributed less than 10% to Tech Data’s overall net sales.
History
Tech Data was incorporated in 1974 to market data processing supplies such as tapes, disk packs, and custom and stock tab forms for mini and mainframe computers directly to end users. With the advent of microcomputer dealers, we made the transition to a wholesale distributor in 1984 by broadening our product line to include hardware products and withdrawing entirely from end-user sales. From 1989 to 1994, we expanded internationally through the acquisition of privately-held distribution companies in Canada and France.
In fiscal 1999, we substantially enhanced our European presence with the acquisition of 83% of the voting common stock of Europe’s leading technology products distributor, Computer 2000 AG (“Computer 2000”). In 2003, the remaining minority interests of Computer 2000 were acquired.
From fiscal 2000 through fiscal 2007, we made several significant acquisitions to leverage our infrastructure in certain geographies and to strengthen our position in certain technology and customer segments, including the networking and small- and medium-business markets, respectively. These acquisitions included Azlan Group PLC in Europe and Globelle Corporation in Canada. In fiscal 2007, in order to provide greater focus and resources on core growth opportunities, we sold our European training business to a third-party.
In fiscal 2008, we executed a joint venture agreement with Brightstar Corporation, one of the world’s largest wireless distributor and supply chain solutions providers. The joint venture distributes mobile phones and other wireless devices to a variety of customers including mobile operators, dealers, agents, retailers and e-tailers in certain European markets. Each of the joint venture partners has a 50% ownership in the entity. In addition, in order to further enhance our long-term profitability and return on capital employed in Europe, during fiscal 2008, we ceased our operations in the United Arab Emirates, sold our operations in Israel and acquired certain assets and the customer base of Actebis Switzerland AG.
In fiscal 2009, we acquired certain assets of Scribona, AB, a publicly-traded IT distribution company in the Nordic region of Europe, with operations in Sweden, Finland and Norway (“Scribona”). The acquisition expands our presence and leverages our infrastructure in the Nordic region of Europe.
In fiscal 2010, we made several business acquisitions in the European distribution marketplace. While the acquisitions did not have a significant impact on our consolidated results of operations during fiscal 2010, we believe these acquisitions will further diversify our product and customer portfolio and are important additions in their respective markets, while leveraging our existing infrastructure in Europe.
We believe our strategy focused on execution, diversification and innovation will drive further improvements to our financial results in the future. The timing of such improvements will be impacted by the pace of the economic recovery as well as the magnitude of any future investments which may be made. We are constantly monitoring the factors that we can control, including our management of costs, working capital and capital spending and we will continue to work to manage our net sales, profitability and market share. We will also continue to make selective acquisitions to expand our customer and product mix and leverage our infrastructure.
3
Table of Contents
Industry
The wholesale distribution model has proven to be well suited for both manufacturers and publishers of IT products (also referred to throughout this document as “vendors”) and resellers of those products. The large number of resellers makes it cost efficient for vendors to rely on wholesale distributors to serve this diverse customer base.
Resellers in the traditional distribution model are able to build efficiencies and reduce costs by depending on distributors, such as Tech Data, for a number of services, including product availability, marketing, credit, technical support, and inventory management, which includes direct shipment to end-users and, in some cases, provides end-users with the distributors’ inventory availability.
Due to the large number of vendors and products, resellers often cannot or choose not to establish direct purchasing relationships with vendors. As a result, they frequently rely on wholesale distributors, such as Tech Data, who can leverage purchasing costs across multiple vendors to satisfy a significant portion of their product procurement, logistics, financing, marketing and technical support needs.
Through collaborative supply chain management initiatives, Tech Data continues to advance the efficiency of our distribution model. By leveraging our infrastructure and logistics expertise, vendors benefit from a cost-effective alternative to selling directly to resellers. Our ability to provide a “virtual warehouse” of products for resellers means they no longer need to hold inventory, which reduces their costs and risks associated with handling products. In addition to enabling reseller access to a comprehensive hardware and software offering, we frequently ship products directly to end-users on behalf of our resellers, thereby reducing their cost of doing business.
The IT distribution industry continues to address a broad spectrum of reseller and vendor requirements. While some vendors have elected to sell directly to resellers or end-users for particular customer and product segments, we believe that vendors continue to embrace traditional distributors that have a proven ability to manage multiple products and resellers, provide access to fragmented markets, and deliver products in an efficient manner. New products and market opportunities have also offset the impact of vendor direct sales on IT distributors. Further, vendors continue to seek the logistics expertise of distributors to penetrate key markets like the small- and medium-sized business (“SMB”) sector, which rely on VARs, our primary customer base, to gain access to and support for new technology. The economies of scale and global reach of large industry-leading distributors are expected to continue to be significant competitive advantages in this marketplace.
Products and Vendors
We distribute and market more than 150,000 products from the world’s premier computer hardware suppliers, networking equipment suppliers, software publishers, and other suppliers of computer peripherals, physical security, consumer electronics, digital signage and mobility hardware. These products are typically purchased directly from the manufacturer or software publisher on a non-exclusive basis. Conversely, our vendor agreements do not restrict us from selling similar products manufactured by competitors, nor do they require us to sell a specified quantity of product. As a result, we have the flexibility to terminate or curtail sales of one product line in favor of another due to technological change, pricing considerations, product availability, customer demand, or vendor distribution policies.
We continually strengthen our product line in order to provide our customers with access to the latest technology products. However, from time to time, the demand for certain products that we sell exceeds the supply available from the manufacturer or publisher. In such cases, we generally receive an allocation of the available products. We believe that our ability to compete is not adversely affected by these periodic shortages and the resulting allocations.
We believe that our vendor agreements are in the form customarily used by manufacturers and distributors. Agreements typically contain provisions that allow termination by either party upon a short notice period. In most instances, a vendor who elects to terminate a distribution agreement will repurchase from the distributor the vendor’s products carried in the distributor’s inventory.
Most of our vendor agreements also allow for stock rotation and price protection provisions. Stock rotation rights give us the ability, subject to certain limitations, to return for credit or exchange a portion of those inventory items purchased from the vendor. Price protection situations occur when a vendor credits us for declines in inventory value resulting from the vendor’s price reductions. Along with our inventory management policies and practices, these provisions reduce our risk of loss due to slow-moving inventory, vendor price reductions, product updates or obsolescence.
4
Table of Contents
Sometimes the industry practices discussed above are not embodied in agreements and do not protect us in all cases from declines in inventory value. However, we believe that these practices provide a significant level of protection from such declines, although no assurance can be given that such practices will continue or that they will adequately protect us against declines in inventory value.
We sell products in various countries throughout the world, and product categories may vary from region to region. On a consolidated basis our revenue mix by product category has remained relatively stable over the past several years, although it may fluctuate between and within different operating regions. During fiscal 2010, sales within our consolidated product categories approximated the following:
| Peripherals |
35 | % | |
| Systems |
31 | % | |
| Networking |
17 | % | |
| Software |
17 | % |
We generated approximately 28%, 29% and 28% of our consolidated net sales in fiscal 2010, 2009 and 2008, respectively, from products purchased from Hewlett Packard. There were no other vendors that accounted for 10% or more of our consolidated net sales in fiscal 2010, 2009 or 2008.
Customers and Services
Our products are purchased directly from manufacturers and publishers in significant quantities and are marketed to an active reseller base of more than 125,000 VARs, direct marketers, retailers and corporate resellers. While we sell products in various countries throughout the world, and customer channels may vary from region to region, during both fiscal 2010 and 2009, sales within our consolidated customer channels approximated the following:
| VARs |
50 | % | |
| Direct marketers and retailers |
30 | % | |
| Corporate resellers |
20 | % |
No single customer accounted for more than 10% percent of our net sales during fiscal 2010, 2009 or 2008.
The market for VARs is attractive because VARs generally rely on distributors as their principal source of computer products and financing. This reliance is due to VARs typically lacking the resources to establish a large number of direct purchasing relationships or stock significant product inventories. Direct marketers, retailers and corporate resellers may establish direct relationships with manufacturers and publishers for their more popular products, but utilize distributors as the primary source for other product requirements and the alternative source for products acquired directly. We have also developed special programs to meet the unique needs of direct marketers and retailers.
In addition to a strong product offering, we provide resellers a high level of customer service through our training and technical support, suite of electronic commerce tools (including internet order entry and EDI services), customized shipping documents, product configuration/integration services and access to flexible financing programs. We also provide services to our vendors by providing them the opportunity to participate in a number of special promotions, and marketing services targeted to the needs of our resellers. While we believe that services such as these help to set us apart from our competition, they contribute less than 10% to our overall revenues.
We provide our vendors with one of the largest bases of resellers throughout the Americas and Europe, delivering products to customers from our 24 regionally located logistics centers. We have located our logistics centers near our customers which enables us to deliver products on a timely basis, thereby reducing the customers’ need to invest in inventory (see also “Item 2—Properties” for further discussion of our locations and logistics centers).
Sales and Electronic Commerce
Our sales representatives consist of field and inside telemarketing sales representatives. The sales representatives are provided comprehensive training regarding our policies and procedures, technical characteristics of our products and product seminars offered by manufacturers and publishers. Field sales representatives are located in major metropolitan areas and are supported by inside telemarketing sales teams covering a designated territory. Our team concept provides a strong personal relationship between our customers’ representatives and Tech Data. Territories with no field representation are serviced exclusively by the inside telemarketing sales teams. Customers typically call our inside sales teams on dedicated telephone numbers or contact us through various electronic methods to place orders. If the product is in stock and the customer has available credit, customer orders are generally shipped the same day from the logistics center nearest the customer or the intended end-user.
5
Table of Contents
Customers often utilize our electronic ordering and information systems. Through our website our customers can gain remote access to our information systems to place orders, or check order status, inventory availability and pricing. Certain of our larger customers have EDI services available whereby orders, order acknowledgments, invoices, inventory status reports, customized pricing information and other industry standard EDI transactions are consummated on-line, which improves efficiency and timeliness for ourselves and our customers. During fiscal 2010, approximately $9.9 billion (45%) of our consolidated net sales originated from orders received electronically, compared to approximately $10.8 billion (45%) of our consolidated net sales in fiscal 2009.
Competition
We operate in a market characterized by intense competition, based upon such factors as product availability, credit availability, price, delivery and various services and support provided by the distributor to the customer. We believe that we are well equipped to compete effectively with other distributors in all of these areas.
We compete against several distributors in the Americas market, including Ingram Micro Inc., Synnex Corp., and several regional and local distributors. The competitive environment within Europe is highly fragmented, with market share spread among many regional and local competitors such as Actebis and international distributors such as Ingram Micro Inc. and Westcon/Comstor.
The evolving direct-sales relationships between manufacturers, resellers, and end-users continue to introduce change into the competitive environment of our industry. We compete, in some cases, with manufacturers and publishers who sell directly to resellers and end-users. However, we usually are also a business partner to these companies by providing supply chain or other services tailored to the IT market. We believe manufacturers and publishers will continue to sell their products through distributors, such as Tech Data, due to our ability to provide vendors with access to our broad customer base in a highly efficient manner. Our network of logistics centers and our sales, credit and product management expertise allow our vendors to benefit by lowering their selling and inventory costs.
Employees
On January 31, 2010, we had approximately 7,600 employees (as measured on a full-time equivalent basis). Certain of our employees in various countries outside of the United States are subject to laws providing representation rights to employees on workers councils. Our success depends on the talent and dedication of our employees and we strive to attract, hire, develop and retain outstanding employees. We believe we realize significant benefits from having a strong and seasoned management team with many years of experience in the IT and related industries. We consider relations with our employees to be good.
Foreign and Domestic Operations and Export Sales
We operate predominately in a single industry segment as a distributor of IT products, logistics management, and other value-added services. While we operate primarily in one industry, we manage our business based on our geographic segments. Our geographic segments include the Americas (including North America and Latin America) and Europe.
Over the past several years, we have entered new markets, expanded our presence in existing markets and exited certain markets based upon our assessment of, among other factors, risk and earnings potential. We continue to evaluate our risk exposure (e.g. risks surrounding currency rates, regulatory environments, political instability, etc.) and earnings potential around the world. To the extent we decide to close any of our operations, we may incur charges and operating losses related to such closures or recognize a portion of our accumulated other comprehensive (loss) income in connection with such a disposition.
Asset Management
We manage our inventories in an effort to maintain sufficient quantities to achieve high order fill rates while attempting to stock only those products in high demand with a rapid turnover rate. Inventory balances fluctuate as we add new product lines and when appropriate, we make large purchases, including cash purchases from manufacturers and publishers when the terms of such purchases are considered advantageous. Our contracts with most of our vendors provide price protection and stock rotation privileges to reduce the risk of loss due to manufacturer price reductions and slow moving or obsolete inventory. In the event of a vendor price reduction, we generally receive a credit for the impact on products in inventory and we have the right to rotate a certain percentage of purchases, subject to certain limitations. Historically, price protection and stock rotation privileges, as well as our inventory management procedures, have helped to reduce the risk of loss of inventory value.
We attempt to control losses on credit sales by closely monitoring customers’ creditworthiness through our IT systems, which contain detailed information on each customer’s payment history and other relevant information. In certain countries, we have obtained credit insurance that insures a percentage of the credit extended by us to certain customers against possible loss. Customers who qualify for credit terms are typically granted net 30-day payment terms in the Americas. While credit terms in Europe vary by country, the vast majority of customers are granted credit terms ranging from 30-60 days. We also sell products on a prepay, credit card and cash-on- delivery basis. In addition, certain of the Company’s vendors subsidize floorplan financing arrangements for the benefit of our customers.
6
Table of Contents
Additional Information Available
Our principal Internet address is www.techdata.com. We provide our annual and quarterly reports free of charge on www.techdata.com, as soon as reasonably practicable after they are electronically filed with, or furnished to, the Securities and Exchange Commission (“SEC”). We provide a link to all SEC filings where current reports on Form 8-K and any amendments to previously filed reports may be accessed, free of charge.
Executive Officers
The following table sets forth the name, age and title of each of the persons who were serving as executive officers of Tech Data as of March 10, 2010:
| Name |
Age |
Title | ||
| Robert M. Dutkowsky |
55 | Chief Executive Officer | ||
| Jeffery P. Howells |
52 | Executive Vice President and Chief Financial Officer | ||
| Néstor Cano |
46 | President, Europe | ||
| Charles V. Dannewitz |
55 | Senior Vice President and Treasurer | ||
| Joseph B. Trepani |
49 | Senior Vice President and Corporate Controller | ||
| John Tonnison |
41 | Executive Vice President and Chief Information Officer | ||
| David R. Vetter |
50 | Senior Vice President, General Counsel and Secretary |
Robert M. Dutkowsky, Chief Executive Officer, joined Tech Data as chief executive officer and was appointed to the board of directors in October 2006. He has over 30 years of experience in the IT industry including senior management positions in sales, marketing and channel distribution with leading manufacturers and software publishers IBM, EMC and J.D. Edwards. His IT career began in 1977 with IBM. During his 20 years with IBM, he served in several senior management positions, including executive assistant to former IBM CEO Lou Gerstner, and Vice President, Distribution – IBM Asia/Pacific. Prior to joining Tech Data, Mr. Dutkowsky was chairman, president and CEO of GenRad, Inc., J.D. Edwards, Inc. and most recently Egenera, Inc. He earned a bachelor’s degree in labor and industrial relations from Cornell University.
Jeffery P. Howells, Executive Vice President and Chief Financial Officer, joined the Company in October 1991 as Vice President of Finance and assumed the responsibilities of Chief Financial Officer in March 1992. In March 1993, he was promoted to Senior Vice President and Chief Financial Officer and was promoted to Executive Vice President and Chief Financial Officer in March 1997. In 1998, Mr. Howells was appointed to the Company’s Board of Directors. From 1979 to 1991, he was employed by Price Waterhouse. Mr. Howells is a Certified Public Accountant and holds a Bachelor of Business Administration Degree in Accounting from Stetson University.
Néstor Cano, President, Europe, joined the Company (via the Computer 2000 acquisition) in July 1989 as a Software Product Manager and served in various management positions within the Company’s operations in Spain and Portugal from 1990 to 1995, after which time he was promoted to Regional Managing Director. In March 1999 he was appointed Executive Vice President of U.S. Sales and Marketing, and in January 2000 he was promoted to President of the Americas. He was promoted to President, Worldwide Operations in August 2000 and was appointed to the position of President, Europe in June 2007. Mr. Cano holds a PDG (similar to an Executive MBA) from IESE Business School in Barcelona and an Engineering Degree from Barcelona University.
Charles V. Dannewitz, Senior Vice President and Treasurer, joined the Company in February 1995 as Vice President of Taxes. He was promoted to Senior Vice President of Taxes in March 2000, and assumed responsibility for treasury in July 2003. Prior to joining the Company, he was employed by Price Waterhouse for 13 years, most recently as a Tax Partner. Mr. Dannewitz is a Certified Public Accountant and holds a Bachelor of Science Degree in Accounting from Illinois Wesleyan University.
Joseph B. Trepani, Senior Vice President and Corporate Controller, joined the Company in March 1990 as Controller and held the position of Director of Operations from October 1991 through January 1995. In February 1995, he was promoted to Vice President and Worldwide Controller and to Senior Vice President and Corporate Controller in March 1998. Prior to joining the Company, Mr. Trepani was Vice President of Finance for Action Staffing, Inc. from July 1989 to February 1990. From 1982 to 1989, he was employed by Price Waterhouse. Mr. Trepani is a Certified Public Accountant and holds a Bachelor of Science Degree in Accounting from Florida State University.
7
Table of Contents
John Tonnison, Executive Vice President and Chief Information Officer, joined the Company in 2001 as Vice President, Worldwide E-Business and assumed the responsibilities of Senior Vice President of Information Technology in December 2006. In February 2010, he was promoted to Executive Vice President and Chief Information Officer. Prior to joining Tech Data, Mr. Tonnison held executive management positions in the U.S., United Kingdom and Germany with Computer 2000, Technology Solutions Network and Mancos Computers. Mr. Tonnison was educated in the United Kingdom and became a U.S. citizen in 2006.
David R. Vetter, Senior Vice President, General Counsel and Secretary, joined the Company in June 1993 as Vice President and General Counsel and was promoted to Corporate Vice President and General Counsel in April 2000. In March 2003, he was promoted to his current position of Senior Vice President, and effective July 2003, was appointed Corporate Secretary. Prior to joining the Company, he was employed by the law firm of Robbins, Gaynor & Bronstein, P.A. from 1984 to 1993, most recently as a partner. Mr. Vetter is a member of the Florida Bar Association and holds Bachelor of Arts Degrees in English and Economics from Bucknell University and a Juris Doctorate Degree from the University of Florida.
| ITEM 1A. | Risk Factors. |
The following are certain risk factors that could affect our business, financial position and results of operations. These risk factors should be considered in connection with evaluating the forward-looking statements contained in this Annual Report on Form 10-K because these factors could cause the actual results and conditions to differ materially from those projected in the forward-looking statements. Before you buy our common stock or other securities, you should know that making such an investment involves risks, including the risks described below. The risks that have been highlighted below are not the only risks of our business. If any of the risks actually occur, our business, financial condition or results of operations could be negatively affected. In that case, the trading price of our common stock or other securities could decline, and you may lose all or part of your investment. Risk factors that could cause actual results to differ materially from our forward-looking statements are as follows:
Global Economic Instability
Although there are indications that the global economic downturn may be abating, there can be no assurance that it will continue to stabilize or that it will improve. There could be additional global economic instability or another downturn. Such an environment creates several risks relating to our financial results, operations and prospects. We may experience a rapid decline in demand for the products we sell resulting in a more competitive environment and pressure to reduce the cost of operations. The benefits from cost reductions may take longer to fully realize and may not fully mitigate the impact of the reduced demand. The recent global economic downturn may also result in changes in vendor terms and conditions, such as rebates, cash discounts and cooperative marketing efforts, which may result in downward pressure on our gross margins. Deterioration in the financial and credit markets heightens the risk of customer bankruptcies and delay in payment. Deterioration in the credit markets in Europe has resulted in reduced availability of credit insurance to cover customer accounts. This, in turn, may result in our reducing the credit lines we provide to customers, thereby having a negative impact on our net sales. In addition, in such an environment, there is a greater uncertainty in the capital markets related to our cost of or access to capital to finance our business, including the ability of financial institutions to fund their commitments to us.
Competition
The Company operates in a highly competitive environment. The IT distribution industry is characterized by intense competition, based primarily on product availability, credit availability, price, speed of delivery, ability to tailor specific solutions to customer needs, quality and depth of product lines and training, service and support. Weakness in demand in the market intensifies the competitive environment in which the Company operates. The Company competes with a variety of regional, national and international wholesale distributors, some of which may have greater financial resources than the Company. The Company also faces competition from companies entering or expanding into the logistics and product fulfillment and e-commerce supply chain services market.
Narrow Margins
The IT distribution industry is characterized by narrow gross and operating margins. These narrow margins magnify the impact on the Company’s operating results attributed to variations in sales and operating costs. Future gross and operating margins may be adversely affected by changes in product mix, vendor pricing actions and competitive and economic pressures. In addition, failure to attract new sources of business from expansion of products or services or entry into new markets may adversely affect future gross and operating margins.
Dependence on Information Systems
The Company is highly dependent upon its internal computer and telecommunication systems to operate its business. There can be no assurance that the Company’s information systems will not fail or experience disruptions, that the Company will be able to attract
8
Table of Contents
and retain qualified personnel necessary for the operation of such systems, that the Company will be able to expand and improve its information systems, that the Company will be able to convert to new systems efficiently, or that the Company will be able to integrate new programs effectively with its existing programs. Any of such problems could have an adverse effect on the Company’s business.
Acquisitions and Dispositions
As part of its growth and diversification strategies, the Company pursues the acquisition of companies that either complement or expand its existing business. As a result, the Company regularly evaluates potential acquisition opportunities, which may be material in size and scope. Acquisitions involve a number of risks and uncertainties, including expansion into new geographic markets and business areas, the requirement to understand local business practices, the diversion of management’s attention to the assimilation of the operations and personnel of the acquired companies, the possible requirement to upgrade the acquired companies’ management information systems to the Company’s standards, potential adverse short-term effects on the Company’s operating results and the amortization or impairment of any acquired intangible assets. The Company also regularly evaluates the divestiture of business units that may not meet the Company’s strategic, financial and/or risk tolerance objectives. No assurance can be given that the Company will be able to dispose of business units on favorable terms or on particular timelines.
Exposure to Natural Disasters, War, and Terrorism
The Company’s headquarters facilities and some of its logistics centers, as well as certain vendors and customers, are located in areas prone to natural disasters such as floods, hurricanes, tornadoes, or earthquakes. In addition, demand for the Company’s services is concentrated in major metropolitan areas. Adverse weather conditions, major electrical failures or other natural disasters in these major metropolitan areas may disrupt the Company’s business should its ability to distribute products be impacted by such an event.
The Company operates in multiple geographic markets, several of which may be susceptible to acts of war and terrorism. The Company’s business could be adversely affected should its ability to distribute products be impacted by such events.
The Company and its vendors operate in many parts of the world that may be susceptible to disease or epidemic that may disrupt the Company’s ability to receive or deliver products or result in other disruptions in operations.
Dependence on Independent Shipping Companies
The Company relies on arrangements with independent shipping companies, such as FedEx and United Parcel Service, for the delivery of its products from vendors and to customers. The failure or inability of these shipping companies to deliver products, or the unavailability of their shipping services, even temporarily, could have an adverse effect on the Company’s business. The Company may also be adversely affected by an increase in freight surcharges due to rising fuel costs and added security. There can be no assurance that Tech Data will be able to pass along the full effect of an increase in these surcharges to its customers.
Impact of Policy Changes
The Company may implement or modify policies designed to offset certain costs, such as our policies concerning freight and handling fees to customers. These policies are designed to help offset specific costs that have significantly increased or that can no longer be included in the overall price of the products the Company sells. Given the competitive nature of the markets in which the Company operates, these policies may result in customers seeking alternative sources for their IT products, and therefore, could have an adverse effect on the Company’s business.
Labor Strikes
The Company’s labor force is currently non-union with the exception of employees of certain European and Latin American subsidiaries, which are subject to collective bargaining or similar arrangements. The Company does business in certain foreign countries where labor disruption is more common than is experienced in the United States and some of the freight carriers used by the Company are unionized. A labor strike by a group of the Company’s employees, one of the Company’s freight carriers, one of its vendors, a general strike by civil service employees, or a governmental shutdown could have an adverse effect on the Company’s business. Many of the products the Company sells are manufactured in countries other than the countries in which the Company’s logistics centers are located. The inability to receive products into the logistics centers because of government action or labor disputes at critical ports of entry may have an adverse effect on the Company’s business.
9
Table of Contents
Risk of Declines in Inventory Value
The Company is subject to the risk that the value of its inventory will decline as a result of price reductions by vendors or technological obsolescence. It is the policy of most of the Company’s vendors to protect distributors from the loss in value of inventory due to technological change or the vendors’ price reductions. Some vendors, however, may be unwilling or unable to pay the Company for price protection claims or products returned to them under purchase agreements. Moreover, industry practices are sometimes not embodied in written agreements and do not protect the Company in all cases from declines in inventory value. No assurance can be given that such practices to protect distributors will continue, that unforeseen new product developments will not adversely affect the Company, or that the Company will be able to successfully manage its existing and future inventories.
Product Availability
The Company is dependent upon the supply of products available from its vendors. The industry is characterized by periods of product shortages due to vendors’ difficulties in projecting demand for certain products distributed by the Company. When such product shortages occur, the Company typically receives an allocation of products from the vendor. There can be no assurance that vendors will be able to maintain an adequate supply of products to fulfill all of the Company’s customer orders on a timely basis. Failure to obtain adequate product supplies could have an adverse effect on the Company’s business.
Vendor Terms and Conditions
The Company relies on various rebates, cash discounts, and cooperative marketing programs offered by its vendors to support expenses associated with distributing and marketing the vendors’ products. Currently, the rebates and purchase discounts offered by vendors are influenced by sales volumes and are subject to changes. Additionally, certain of the Company’s vendors subsidize floorplan financing arrangements for the benefit of our customers. Terminations of a supply or services agreement or a significant change in vendor terms or conditions of sale could negatively affect our operating margins, revenue or the level of capital required to fund our operations.
The Company receives a significant percentage of revenues from products it purchases from relatively few manufacturers. A manufacturer may make rapid, significant and adverse changes in its sales terms and conditions, such as reducing the amount of price protection and return rights as well as reducing the level of purchase discounts and rebates they make available to us, or may merge with or acquire other significant manufacturers. The Company’s gross margins could be negatively impacted if the Company is unable to pass through the impact of these changes to the Company’s customers or cannot develop systems to manage ongoing vendor programs. In addition, the Company’s standard vendor distribution agreement permits termination without cause by either party upon 30 days notice. The loss of a relationship with any of the Company’s key vendors, a change in their strategy (such as increasing direct sales); the merging of significant manufacturers, or significant changes in terms on their products may adversely effect the Company’s business.
Loss of Significant Customers
Customers do not have an obligation to make purchases from the Company. In some cases, the Company has made adjustments to its systems, vendor offerings, and processes, and made staffing decisions, in order to accommodate the needs of an important and / or significant customer. In the event a significant customer decides to make its purchases from another distributor, experiences a significant change in demand from its own customer base, becomes financially unstable, or is acquired by another company, the Company’s revenues may be negatively impacted, resulting in an adverse effect on the Company’s business.
Customer Credit Exposure
The Company sells its products to a large customer base of value-added resellers, direct marketers, retailers and corporate resellers. The Company finances a significant portion of such sales through trade credit. As a result, the Company’s business could be adversely affected in the event of a deterioration of the financial condition of its customers, resulting in the customers’ inability to repay the Company. This risk may increase during a general economic downturn affecting a large number of the Company’s customers and in the event the Company’s customers do not adequately manage their business or properly disclose their financial condition.
The Company also offers our customers financing alternatives provided by financing companies. In the event these financing companies no longer offer these programs or significantly change the terms, our customers may move their business to another distributor or reduce their purchases from the Company, which may adversely affect the Company’s business.
10
Table of Contents
Need for Liquidity and Capital Resources; Fluctuations in Interest Rates
The Company’s business requires substantial capital to operate and to finance accounts receivable and product inventory that are not financed by trade creditors. The Company has historically relied upon cash generated from operations, bank credit lines, trade credit from vendors, proceeds from public offerings of its common stock and proceeds from debt offerings to satisfy its capital needs and finance growth. The Company utilizes various financing instruments such as receivables securitization, leases, revolving credit facilities and trade receivable purchase facilities. As the financial markets change and new regulations come into effect, the cost of acquiring financing and the methods of financing may change. Changes in our credit rating or other market factors may increase our interest expense or other costs of capital or capital may not be available to us on acceptable terms to fund our working capital needs. The inability to obtain such sources of capital could have an adverse effect on the Company’s business. The Company’s credit facilities contain various financial and other covenants that may limit the Company’s ability to borrow or limit the Company’s flexibility in responding to business conditions. These financing instruments involve variable rate debt, thus exposing the Company to risk of fluctuations in interest rates. Such fluctuations in interest rates could have an adverse effect on the Company’s business.
Foreign Currency Exchange Risks; Exposure to Foreign Markets
The Company conducts business in countries outside of the United States, which exposes the Company to fluctuations in foreign currency exchange rates. The Company may enter into short-term forward exchange or option contracts to hedge this risk; nevertheless, volatile foreign currency exchange rates increase our risk related to products purchased in a currency other than the currency in which those products are sold. While we maintain policies to protect against fluctuation in currency exchange rates, extreme fluctuations have resulted in our incurrence of losses in some countries. The realization of any or all of these risks could have a significant adverse effect on our financial results. In addition, the value of the Company’s equity investment in foreign countries may fluctuate based upon changes in foreign currency exchange rates. These fluctuations, which are recorded in a cumulative translation adjustment account, may result in losses in the event a foreign subsidiary is sold or closed at a time when the foreign currency is weaker than when the Company initially invested in the country.
The Company’s international operations are subject to other risks such as the imposition of governmental controls, export license requirements, restrictions on the export of certain technology, political instability, trade restrictions, tariff changes, difficulties in staffing and managing international operations, changes in the interpretation and enforcement of laws (in particular related to items such as duty and taxation), difficulties in collecting accounts receivable, longer collection periods and the impact of local economic conditions and practices. There can be no assurance that these and other factors will not have an adverse effect on the Company’s business.
Changes in Income Tax and Other Regulatory Legislation
The Company operates in compliance with applicable laws and regulations. When new legislation is enacted with minimal advance notice, or when new interpretations or applications of existing laws are made, the Company may need to implement changes in its policies or structure.
The Company makes plans for its structure and operations based upon existing laws and anticipated future changes in the law. The Company is susceptible to unanticipated changes in legislation, especially relating to income and other taxes, import/export laws, hazardous materials and electronic waste recovery legislation, and other laws related to trade, accounting, and business activities. Such changes in legislation, both domestic and international, may have a significant adverse effect on the Company’s business.
Changes in Accounting Rules
The Company prepares its financial statements in conformity with accounting principles generally accepted in the United States. These accounting principles are subject to interpretation by the Financial Accounting Standards Board, the Public Company Accounting Oversight Board, the Securities and Exchange Commission, the American Institute of Certified Public Accountants and various other bodies formed to interpret and create appropriate accounting policies. A change in these policies or a new interpretation of an existing policy could have a significant effect on our reported results and may affect our reporting of transactions before a change is adopted.
Volatility of Common Stock Price
Because of the foregoing factors, as well as other variables affecting the Company’s operating results, past financial performance should not be considered a reliable indicator of future performance, and investors should not use historical trends to anticipate results or trends in future periods. In addition, the Company’s participation in a highly dynamic industry often results in significant volatility of the common stock price. Some of the factors that may affect the market price of the common stock, in addition to those discussed above, are changes in investment recommendations by securities analysts, changes in market valuations of competitors and key vendors, and fluctuations in the overall stock market, but particularly in the technology sector.
11
Table of Contents
| ITEM 1B. | Unresolved Staff Comments. |
Not applicable.
| ITEM 2. | Properties. |
Our executive offices are located in Clearwater, Florida. As of January 31, 2010, we operated a total of 24 logistics centers to provide our customers timely delivery of products. These logistics centers are located in the following principal markets: Americas – 15, and Europe – 9.
As of January 31, 2010, we leased or owned approximately 7.1 million square feet of space. The majority of our office facilities and logistics centers are leased. Our facilities are well maintained and are adequate to conduct our current business. We do not anticipate significant difficulty in renewing our leases as they expire or securing replacement facilities.
| ITEM 3. | Legal Proceedings. |
Prior to fiscal 2004, one of our European subsidiaries was audited in relation to various value-added tax (“VAT”) matters. As a result of those audits, the subsidiary received notices of assessment that allege the subsidiary did not properly collect and remit VAT. It is our opinion, based upon the opinion of outside legal counsel, that we have valid defenses related to a substantial portion of these assessments. Although we are vigorously pursuing administrative and judicial action to challenge the assessments, no assurance can be given as to the ultimate outcome. The resolution of such assessments could be material to our operating results for any particular period, depending upon the level of income for such period. We are also subject to various other legal proceedings and claims arising in the ordinary course of business. We do not expect that the outcome in any of these other legal proceedings, individually or collectively, will have an adverse effect on our financial condition, results of operations or cash flows.
| ITEM 4. | Reserved. |
| ITEM 5. | Market for Registrant’s Common Equity, Related Stockholder Matters and Issuer Purchases of Equity Securities. |
Our common stock is traded on the NASDAQ Stock Market, Inc. (“NASDAQ”) under the symbol “TECD”. We have not paid cash dividends since fiscal 1983 and the Board of Directors has no current plans to institute a cash dividend payment policy in the foreseeable future. The table below presents the quarterly high and low sale prices for our common stock as reported by the NASDAQ. As of February 25, 2010, there were 301 holders of record and we believe that there are approximately 20,003 beneficial holders.
| Sales Price | ||||||
| High | Low | |||||
| Fiscal year 2010 |
||||||
| Fourth quarter |
$ | 48.83 | $ | 38.12 | ||
| Third quarter |
44.63 | 33.41 | ||||
| Second quarter |
36.83 | 27.02 | ||||
| First quarter |
29.30 | 16.20 | ||||
| High | Low | |||||
| Fiscal year 2009 |
||||||
| Fourth quarter |
$ | 22.62 | $ | 14.14 | ||
| Third quarter |
36.38 | 19.13 | ||||
| Second quarter |
37.80 | 32.90 | ||||
| First quarter |
35.23 | 30.91 | ||||
12
Table of Contents
Stock Performance Chart
The five-year stock performance chart below assumes an initial investment of $100 on February 1, 2005 and compares the cumulative total return for Tech Data, the NASDAQ Stock Market (U.S.) Index, and the Standard Industrial Classification, or SIC, Code 5045 – Computer and Peripheral Equipment and Software. The comparisons in the table are required by the SEC and are not intended to forecast or be indicative of possible future performance of our common stock.
Comparison of Cumulative Total Return
Assumes Initial Investment of $100 on February 1, 2005
Among Tech Data Corporation,
NASDAQ Stock Market (U.S.) Index and SIC Code 5045
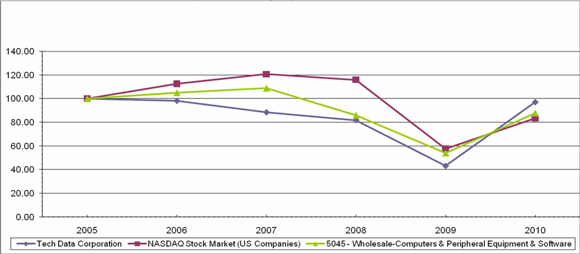
| 2005 | 2006 | 2007 | 2008 | 2009 | 2010 | |||||||
| Tech Data Corporation |
100 | 98 | 88 | 82 | 43 | 97 | ||||||
| NASDAQ Stock Market (U.S.) Index |
100 | 113 | 121 | 116 | 58 | 83 | ||||||
| SIC Code 5045 – Computer and Peripheral Equipment and Software |
100 | 105 | 109 | 86 | 54 | 88 | ||||||
Unregistered Sales of Equity Securities
None.
Issuer Purchases of Equity Securities
In December 2009, the Company’s Board of Directors authorized a share repurchase program of up to $100.0 million of the Company’s common stock. The share repurchases are to be made on the open market, through block trades or otherwise. The number of shares purchased and the timing of the purchases will be based on working capital requirements, general business conditions and other factors, including alternative investment opportunities. In conjunction with the $100.0 million share repurchase program, the Company executed a 10b5-1 and 10b-18 Repurchase Agreement (“Repurchase Agreement”) that instructs the broker selected by the Company to repurchase shares on behalf of the Company. The amount of common stock repurchased in accordance with the Repurchase Agreement on any given trading day is determined by a formula in the Repurchase Agreement, which is based on the market price of the Company’s common stock. Shares repurchased by the Company are held in treasury for general corporate purposes, including issuances under equity incentive and benefit plans. Through January 31, 2010, the Company has made no repurchases of common stock in connection with this repurchase program.
13
Table of Contents
The following table presents information with respect to purchases of common stock by the Company during the quarter ended January 31, 2010:
| Issuer Purchases of Equity Securities | ||||||||||
| Period |
Total number of shares purchased |
Average price paid per share |
Total numbers of shares purchased as part of publicly announced plan or programs |
Maximum dollar value of shares that may yet be purchased under the plan or programs | ||||||
| November 1 – November 30, 2009 |
— | $ | — | — | ||||||
| December 1 – December 31, 2009(1) |
272,426 | $ | 33.32 | — | ||||||
| January 1 – January 31, 2010 |
— | $ | — | — | ||||||
| Total |
272,426 | $ | 33.32 | — | $ | 100,000,000 | ||||
| (1) | Represents shares purchased outside of the share repurchase program, related to the exercise of an employee’s equity incentives, and includes 55,316 shares purchased during the fourth quarter of fiscal 2010 at an average price of $47.31 per share and 219,110 shares purchased during the first nine months of fiscal 2010 at an average price of $29.48 per share not previously reported in the Company’s Fiscal 2010 Form 10-Q filings under Part II Item 2. |
14
Table of Contents
| ITEM 6. | Selected Financial Data. |
The following table sets forth certain selected consolidated financial data. This data includes the effect of accounting pronouncements adopted by the Company effective February 1, 2009 relating to (a) the accounting for noncontrolling interests (previously referred to as minority interest) and (b) the accounting for convertible debt instruments. Both of these pronouncements are further discussed within Note 1 of Notes to Consolidated Financial Statements. Under the provisions of the accounting standard for convertible debt instruments, the Company adopted the standard retroactively to convertible debt instruments which were outstanding during any of the periods presented in the annual financial statements in the period of adoption, which was February 1, 2009. As a result, the selected financial data table below does not include restatement of the accounting treatment of the Company’s $290 million convertible senior debentures repaid in December 2005.
This information should be read in conjunction with Management’s Discussion and Analysis of Financial Condition and Results of Operations and our consolidated financial statements and notes thereto appearing elsewhere in this Annual Report.
FIVE-YEAR FINANCIAL SUMMARY
(In thousands, except per share data)
| Year ended January 31, | ||||||||||||||||||
| 2010 | 2009 | 2008 | 2007 | 2006 | ||||||||||||||
| As Adjusted | As Adjusted | As Adjusted | ||||||||||||||||
| Income statement data: (1) |
||||||||||||||||||
| Net sales |
$ | 22,099,876 | $ | 24,080,484 | $ | 23,423,078 | $ | 21,440,445 | $ | 20,482,851 | ||||||||
| Cost of products sold |
20,943,162 | 22,867,488 | 22,288,670 | 20,433,674 | 19,460,332 | |||||||||||||
| Gross profit |
1,156,714 | 1,212,996 | 1,134,408 | 1,006,771 | 1,022,519 | |||||||||||||
| Operating expenses: |
||||||||||||||||||
| Selling, general and administrative expenses |
892,878 | 970,837 | 915,434 | 851,097 | 828,278 | |||||||||||||
| Goodwill impairment (2) |
— | — | — | 136,093 | — | |||||||||||||
| Loss on disposal of subsidiaries (3) |
— | — | 14,471 | — | — | |||||||||||||
| Restructuring charges(4) |
— | — | 16,149 | 23,764 | 30,946 | |||||||||||||
| 892,878 | 970,837 | 946,054 | 1,010,954 | 859,224 | ||||||||||||||
| Operating income (loss) |
263,836 | 242,159 | 188,354 | (4,183 | ) | 163,295 | ||||||||||||
| Other expense (income): |
||||||||||||||||||
| Discount on sale of accounts receivable |
— | 1,872 | 7,219 | 12,509 | 5,503 | |||||||||||||
| Interest expense, net |
24,355 | 31,513 | 25,304 | 29,998 | 23,996 | |||||||||||||
| Net foreign currency exchange loss (gain) |
4,341 | 31,001 | (3,994 | ) | (15 | ) | 1,816 | |||||||||||
| 28,696 | 64,386 | 28,529 | 42,492 | 31,315 | ||||||||||||||
| Income (loss) income from continuing operations before income taxes and noncontrolling interest |
235,140 | 177,773 | 159,825 | (46,675 | ) | 131,980 | ||||||||||||
| Provision for income taxes(5) |
53,940 | 62,317 | 61,255 | 55,013 | 109,013 | |||||||||||||
| Consolidated net income |
181,200 | 115,456 | 98,570 | (101,688 | ) | 22,967 | ||||||||||||
| Net (income) loss attributable to noncontrolling interest |
(1,045 | ) | 1,822 | 3,559 | — | — | ||||||||||||
| Income (loss) from continuing operations |
180,155 | 117,278 | 102,129 | (101,688 | ) | 22,967 | ||||||||||||
| Discontinued operations, net of tax |
— | — | — | 3,946 | 3,619 | |||||||||||||
| Net income (loss) attributable to shareholders of Tech Data Corporation |
$ | 180,155 | $ | 117,278 | $ | 102,129 | $ | (97,742 | ) | $ | 26,586 | |||||||
15
Table of Contents
| Year ended January 31, | ||||||||||||||||
| 2010 | 2009 | 2008 | 2007 | 2006 | ||||||||||||
| Net income (loss) per share attributable to shareholders of Tech Data Corporation—basic: |
||||||||||||||||
| Continuing operations |
$ | 3.57 | $ | 2.29 | $ | 1.86 | $ | (1.84 | ) | $ | 0.40 | |||||
| Discontinued operations |
— | — | — | 0.07 | 0.06 | |||||||||||
| Net income (loss) per share attributable to shareholders of Tech Data Corporation—basic |
$ | 3.57 | $ | 2.29 | $ | 1.86 | $ | (1.77 | ) | $ | 0.46 | |||||
| Net income (loss) per share attributable to shareholders of Tech Data Corporation—diluted: |
||||||||||||||||
| Continuing operations |
$ | 3.54 | $ | 2.28 | $ | 1.85 | $ | (1.84 | ) | $ | 0.39 | |||||
| Discontinued operations |
— | — | — | 0.07 | 0.06 | |||||||||||
| Net income (loss) per common share attributable to shareholders of Tech Data Corporation—diluted |
$ | 3.54 | $ | 2.28 | $ | 1.85 | $ | (1.77 | ) | $ | 0.45 | |||||
| Weighted average common shares outstanding: |
||||||||||||||||
| Basic |
50,517 | 51,276 | 54,904 | 55,129 | 57,749 | |||||||||||
| Diluted |
50,938 | 51,498 | 55,287 | 55,129 | 58,414 | |||||||||||
| Dividends per common share |
— | — | — | — | — | |||||||||||
| Balance sheet data: |
||||||||||||||||
| Working capital |
$ | 2,250,430 | $ | 1,891,897 | $ | 2,044,418 | $ | 1,816,564 | $ | 1,392,108 | ||||||
| Total assets |
5,902,087 | 5,023,096 | 5,220,048 | 4,702,748 | 4,404,634 | |||||||||||
| Revolving credit loans |
65,384 | 57,906 | 18,315 | 77,195 | 235,088 | |||||||||||
| Long-term debt, net |
338,157 | 331,233 | 323,810 | 313,498 | 14,378 | |||||||||||
| Other long-term liabilities |
76,255 | 69,950 | 66,639 | 64,491 | 38,598 | |||||||||||
| Equity attributable to shareholders of Tech Data Corporation |
2,088,895 | 1,737,693 | 1,945,332 | 1,733,471 | 1,760,307 | |||||||||||
| (1) | See Note 5 of Notes to Consolidated Financial Statements for discussion of the acquisition of certain assets of Scribona, AB, a publicly-traded IT distribution company in the Nordic region of Europe in fiscal 2009. |
| (2) | Due to certain indicators of impairment within the European reporting unit, the Company performed an impairment test for goodwill as of July 31, 2006 and as a result the Company recorded a $136.1 million non-cash charge for the goodwill impairment in Europe. |
| (3) | See Note 6 of Notes to Consolidated Financial Statements for discussion of the $14.5 million loss on disposal of subsidiaries recorded in fiscal 2008. |
| (4) | See Note 7 of Notes to Consolidated Financial Statements for discussion of restructuring costs incurred in fiscal 2008, 2007 and 2006, respectively. |
| (5) | See Note 10 of Notes to Consolidated Financial Statements for discussion of the $5.4 million decrease in the deferred tax valuation allowance recorded in fiscal 2010, the net amount of $8.7 million reversal in income tax reserves recorded in fiscal 2009 and the $7.5 million decrease in the deferred tax asset valuation allowance recorded in fiscal 2008. In fiscal 2007, the Company also recorded an $8.4 million increase in the deferred tax asset valuation allowance. |
16
Table of Contents
| ITEM 7. | Management’s Discussion and Analysis of Financial Condition and Results of Operations. |
Forward-Looking Statements
This Annual Report on Form 10-K, including this Management’s Discussion and Analysis of Financial Condition and Results of Operations (“MD&A”), contains forward-looking statements, as described in the “safe harbor” provision of the Private Securities Litigation Reform Act of 1995. These statements involve a number of risks and uncertainties and actual results could differ materially from those projected. These forward-looking statements regarding future events and the future results of Tech Data Corporation are based on current expectations, estimates, forecasts, and projections about the industries in which we operate and the beliefs and assumptions of our management. Words such as “expects,” “anticipates,” “targets,” “goals,” “projects,” “intends,” “plans,” “believes,” “seeks,” “estimates,” variations of such words, and similar expressions are intended to identify such forward-looking statements. In addition, any statements that refer to projections of our future financial performance, our anticipated growth and trends in our businesses, and other characterizations of future events or circumstances, are forward-looking statements. Readers are cautioned that these forward-looking statements are only predictions and are subject to risks, uncertainties, and assumptions. Therefore, actual results may differ materially and adversely from those expressed in any forward-looking statements. Readers are referred to the cautionary statements and important factors discussed in Item 1A. Risk Factors in this Annual Report on Form 10-K for the year ended January 31, 2010 for further information. We undertake no obligation to revise or update publicly any forward-looking statements for any reason.
Factors that could cause actual results to differ materially include the following:
| • | global economic instability |
| • | competition |
| • | narrow margins |
| • | dependence on information systems |
| • | acquisitions and dispositions |
| • | exposure to natural disasters, war and terrorism |
| • | dependence on independent shipping companies |
| • | impact of policy changes |
| • | labor strikes |
| • | risk of declines in inventory value |
| • | product availability |
| • | vendor terms and conditions |
| • | loss of significant customers |
| • | customer credit exposure |
| • | need for liquidity and capital resources; fluctuations in interest rates |
| • | foreign currency exchange rates; exposure to foreign markets |
| • | changes in income tax and other regulatory legislation |
| • | changes in accounting rules |
| • | volatility of common stock price |
Overview
Tech Data is a leading distributor of information technology (“IT”) products, logistics management and other value-added services. We provide a strategic link in the IT supply chain through the distribution of technology products to value-added resellers, direct marketers, retailers and corporate resellers. Our offering of customer services includes training and technical support, external financing options, configuration services, outbound telemarketing, marketing services and a suite of electronic commerce solutions. We manage our business in two geographic segments, the Americas (including North America and Latin America) and Europe.
A key tenet of our strategy is superior execution focused on our ability to leverage our efficient cost structure combined with our multiple service offerings to generate demand, develop markets and cost efficiencies for our vendors and customers. The IT distribution industry in which we operate is characterized by narrow gross profit as a percentage of sales (“gross margin”) and narrow income from operations as a percentage of sales (“operating margin”). Historically, our gross and operating margins have been impacted by intense price competition and declining average selling prices per unit, as well as changes in terms and conditions
17
Table of Contents
with our vendors, including those terms related to rebates, price protection, product returns and other incentives. We expect these conditions to continue in the foreseeable future and, therefore, we will continue to proactively evaluate our pricing policies and inventory management practices in response to potential changes in our vendor terms and conditions and the general market environment. From a balance sheet perspective, we require working capital primarily to finance accounts receivable and inventory. We have historically relied upon debt, trade credit from our vendors, and accounts receivable financing programs for our working capital needs. At January 31, 2010, we had a debt to capital ratio (calculated as total debt divided by the aggregate of total debt and total shareholders’ equity) of 16%.
In addition to focusing on superior execution, we continue to drive diversification and the realignment of our customer and vendor portfolio to help drive long-term profitability throughout our operations. During fiscal 2010, we expanded the operations of our joint venture with Brightstar Corporation into several new geographies in Europe as we strive to become the leading distributor for mobile data solutions and services in Europe. In addition, we continue to strengthen our position in the enterprise market and with the small- and medium-business customer segment in several countries in which we operate, both organically and through acquisitions. In the Americas, we continued to expand our product portfolio to include leading consumer electronics offerings and technologies for data centers. As we execute our diversification strategy, we continuously monitor the extension of credit and other terms and conditions offered to our customers to prudently balance risk, profitability and return on capital employed.
The global economic environment has remained challenging and the related softness in IT demand has continued to require even greater focus on productivity and the containment of payroll and other costs. The impact of the economic downturn has resulted in certain vendor terms and conditions and incentive goals being changed. The economic downturn has also led to a global tightening of credit and has impacted those institutions insuring us against credit risks in several markets, primarily in Europe. Modifications to our insurance agreements could impact the credit lines we offer to our customers. This reduction in credit availability could have a positive effect on our results to the extent that our vendors rely more on distributors with the financial strength of Tech Data to distribute their products. All of these constraints impact the financing available to our customers through financial institutions and as a result, we remain cautious in our credit management practices as we may experience a higher level of customer defaults than we have seen in recent years. During the third quarter of fiscal 2010, we saw some moderation in the overall decline in IT spending in the Americas and certain markets in Europe and during the fourth quarter we experienced year-over-year sales growth in both the Americas and Europe. While the demand remains somewhat inconsistent across our markets, we believe that overall IT spending is beginning to show signs of an improving outlook. As we continue to manage through these challenges and evaluate our pricing, credit management and purchasing policies and make adjustments, if any, within our customer or vendor portfolio or our cost structure, we may experience sales declines in many of the markets in which we operate, thereby impacting our consolidated financial results.
Our strength in execution, along with our diversification strategy and prudent cost management has driven continued improvement in our operating performance during fiscal 2010, despite the challenges of the economic environment during the period. During fiscal 2010, we achieved a year-over-year increase in both gross margin and operating margin. In Europe, we continued to improve our business execution, resulting in higher year-over-year gross margins and operating income in a majority of the countries in which we operate. In the Americas, we saw sequential improvement in the region’s operating income in the second, third and fourth quarters compared to the first quarter of fiscal year 2010 and had sequential net sales growth in each quarter of the fiscal year.
Throughout fiscal 2010, we made several business acquisitions in the European distribution marketplace. While these acquisitions did not have a significant impact on our consolidated results of operations during fiscal 2010, we believe the acquisitions will further diversify our product and customer portfolio and are important additions in their respective markets, while leveraging our existing infrastructure in Europe
We believe our strategy of execution, diversification and innovation will drive further improvements to our financial results in the future. The timing of such improvements will be impacted by the pace of the economic recovery as well as the magnitude of any future investments which may be made. We are constantly monitoring the factors that we can control, including our management of costs, working capital and capital spending and we will continue to work to manage our net sales, profitability and market share. We also continue to evaluate targeted strategic investments across our operations in IT enhancements and new business opportunities.
Effective February 1, 2009, we adopted the provisions of an accounting standard which changed the accounting treatment for convertible debt instruments which requires or permits partial cash settlement upon conversion. The accounting changes require issuers to separate convertible debt instruments into two components: a non-convertible bond and a conversion option. The separation of the conversion option creates an original issue discount in the bond component which is to be accreted as interest expense over the term of the instrument using the interest method, resulting in an increase to interest expense and a decrease in net income and earnings per share. The provisions of this standard required retrospective application to all periods presented and we have applied the provisions to the Company’s $350.0 million convertible senior debentures issued in December 2006. The impact of
18
Table of Contents
the adoption of this standard for fiscal 2010 was an increase in non-cash interest expense of approximately $10.0 million, partially offset by the related tax benefit of approximately $4.0 million, resulting in a decrease in net income of approximately $6.0 million. This annualized impact will also recur for fiscal 2011 and through December 20, 2011, the Company’s first repurchase date for the convertible senior debentures. The adoption of this standard has had no impact on the Company’s consolidated cash flows. The accompanying comparative consolidated financial statements and footnotes have been adjusted for all periods presented to reflect the retrospective application of this standard (see further discussion related to our adoption of this standard included in Note 1 of Notes to the Consolidated Financial Statements).
Critical Accounting Policies and Estimates
The information included within MD&A is based upon our consolidated financial statements, which have been prepared in accordance with accounting principles generally accepted in the United States. The preparation of these financial statements requires us to make estimates and judgments that affect the reported amounts of assets, liabilities, revenues and expenses, and related disclosures. On an on-going basis, we evaluate these estimates, including those related to bad debts, inventory, vendor incentives, goodwill and intangible assets, deferred taxes, and contingencies. Our estimates and judgments are based on currently available information, historical results, and other assumptions we believe are reasonable. Actual results could differ materially from these estimates. We believe the critical accounting policies discussed below affect the more significant judgments and estimates used in the preparation of our consolidated financial statements.
Accounts Receivable
We maintain allowances for doubtful accounts for estimated losses resulting from the inability of our customers to make required payments. In estimating the required allowance, we take into consideration the overall quality and aging of the receivable portfolio, the existence of credit insurance and specifically identified customer risks. Also influencing our estimates are the following: (1) the large number of customers and their dispersion across wide geographic areas; (2) the fact that no single customer accounts for more than 10% of our net sales; (3) the value and adequacy of collateral received from customers, if any; 4) our historical loss experience and 5) the current economic environment. If actual customer performance were to deteriorate to an extent not expected by us, additional allowances may be required which could have an adverse effect on our consolidated financial results. Conversely, if actual customer performance were to improve to an extent not expected by us, a reduction in allowances may be required which could have a favorable effect on our consolidated financial results.
Inventory
We value our inventory at the lower of its cost or market value, with cost being determined on the first-in, first-out method. We write down our inventory for estimated obsolescence equal to the difference between the cost of inventory and the estimated market value based upon an aging analysis of the inventory on hand, specifically known inventory-related risks (such as technological obsolescence and the nature of vendor terms surrounding price protection and product returns), foreign currency fluctuations for foreign-sourced product, and assumptions about future demand. Market conditions or changes in terms and conditions by our vendors that are less favorable than those projected by management may require additional inventory write-downs, which could have an adverse effect on our consolidated financial results.
Vendor Incentives
We receive incentives from vendors related to cooperative advertising allowances, infrastructure funding, volume rebates and other incentive agreements. These incentives are generally under quarterly, semi-annual or annual agreements with the vendors; however, some of these incentives are negotiated on an ad-hoc basis to support specific programs mutually developed with the vendor. Unrestricted volume rebates and early payment discounts received from vendors are recorded when they are earned as a reduction of inventory and as a reduction of cost of products sold as the related inventory is sold. Vendor incentives for specifically identified cooperative advertising programs and infrastructure funding are recorded when earned as adjustments to product costs or selling, general and administrative expenses, depending on the nature of the programs.
We also provide reserves for receivables on vendor programs for estimated losses resulting from vendors’ inability to pay or rejections by vendors of claims. Should amounts recorded as outstanding receivables from vendors be deemed uncollectible, additional allowances may be required which could have an adverse effect on our consolidated financial results.
Goodwill, Intangible Assets and Other Long-Lived Assets
The carrying value of goodwill is reviewed at least annually for impairment and may also be reviewed more frequently if current events and circumstances indicate a possible impairment. An impairment loss, if any, is charged to expense in the period identified. The Company performed its annual goodwill impairment test as of January 31, 2010 and determined there was no impairment. We also examine the carrying value of our intangible assets with finite lives, which includes capitalized software and development costs, purchased intangibles, and other long-lived assets as current events and circumstances warrant determining whether there are any
19
Table of Contents
impairment losses. If indicators of impairment are present and future cash flows are not expected to be sufficient to recover the assets’ carrying amount, an impairment loss is charged to expense in the period identified. Factors that may cause a goodwill, intangible asset or other long-lived asset impairment include negative industry or economic trends and significant underperformance relative to historical or projected future operating results. Our valuation methodologies include, but are not limited to, a discounted cash flow model, which estimates the net present value of the projected cash flows of our reporting units and a market approach, which evaluates comparative market multiples applied to our reporting units’ businesses to yield a second assumed value of each reporting unit. If actual results are substantially lower than our projections underlying these assumptions, or if market discount rates substantially increase, our future valuations could be adversely affected, potentially resulting in future impairment charges.
Income Taxes
We record valuation allowances to reduce our deferred tax assets to the amount expected to be realized. In assessing the adequacy of a recorded valuation allowance, we consider all positive and negative evidence and a variety of factors including the scheduled reversal of deferred tax liabilities, historical and projected future taxable income, and prudent and feasible tax planning strategies. If we determine we would be able to use a deferred tax asset in the future in excess of its net carrying value, an adjustment to the deferred tax asset valuation allowance would be made to reduce income tax expense, thereby increasing net income in the period such determination was made. Should we determine that we are unable to realize all or part of our net deferred tax assets in the future, an adjustment to the deferred tax asset valuation allowance would be made to income tax expense, thereby reducing net income in the period such determination was made.
Contingencies
We accrue for contingent obligations, including estimated legal costs, when the obligation is probable and the amount is reasonably estimable. As facts concerning contingencies become known, we reassess our position and make appropriate adjustments to the financial statements. Estimates that are particularly sensitive to future changes include those related to tax, legal, and other regulatory matters such as imports and exports, the imposition of international governmental controls, changes in the interpretation and enforcement of international laws (in particular related to items such as duty and taxation), and the impact of local economic conditions and practices, which are all subject to change as events evolve and as additional information becomes available during the administrative and litigation process.
Recent Accounting Pronouncements and Legislation
See Note 1 of Notes to Consolidated Financial Statements for the discussion on recent accounting pronouncements.
Results of Operations
We do not consider stock-based compensation expense in assessing the performance of our operating segments, and therefore the Company reports stock-based compensation expense separately. The following table summarizes our net sales, change in net sales and operating income, by geographic region, for the fiscal years ended January 31, 2010, 2009 and 2008:
| 2010 | % of net sales |
2009 | % of net sales |
2008 | % of net sales |
|||||||||||||
| Net sales by geographic region ($ in thousands): |
||||||||||||||||||
| Americas |
$ | 9,570,088 | 43.3 | % | $ | 10,609,001 | 44.1 | % | $ | 11,003,893 | 47.0 | % | ||||||
| Europe |
12,529,788 | 56.7 | 13,471,483 | 55.9 | 12,419,185 | 53.0 | ||||||||||||
| Total |
$ | 22,099,876 | 100.0 | % | $ | 24,080,484 | 100.0 | % | $ | 23,423,078 | 100.0 | % | ||||||
| Year-over-year increase (decrease) in net sales (%): |
||||||||||||||||||
| Americas (US$) |
(9.8)% | (3.6)% | 10.4 % | |||||||||||||||
| Europe (US$) |
(7.0)% | 8.5 % | 8.2 % | |||||||||||||||
| Europe (Euro) |
(4.2)% | 4.0 % | (1.4)% | |||||||||||||||
| Total (US$) |
(8.2)% | 2.8 % | 9.2 % | |||||||||||||||
| 2010 | % of net sales |
2009 | % of net sales |
2008 | % of net sales |
||||||||||||||||
| Operating income ($ in thousands): |
|||||||||||||||||||||
| Americas |
$ | 142,430 | 1.49 | % | $ | 157,177 | 1.48 | % | $ | 170,685 | 1.55 | % | |||||||||
| Europe |
132,631 | 1.06 | % | 96,972 | 0.72 | % | 27,956 | 0.23 | % | ||||||||||||
| Stock-based compensation expense |
(11,225 | ) | (0.05 | )% | (11,990 | ) | (0.05 | )% | (10,287 | ) | (0.04 | )% | |||||||||
| Total |
$ | 263,836 | 1.19 | % | $ | 242,159 | 1.01 | % | $ | 188,354 | 0.80 | % | |||||||||
20
Table of Contents
We sell many products purchased from the world’s leading peripheral, system and networking manufacturers and software publishers. Products purchased from Hewlett Packard generated 28%, 29% and 28% of our net sales in fiscal 2010, 2009 and 2008, respectively. There were no other manufacturers or publishers that accounted for 10% or more of our net sales in the past three years.
The following table sets forth our Consolidated Statement of Operations as a percentage of net sales for each of the three most recent fiscal years:
| 2010 | 2009 | 2008 | |||||||
| (As Adjusted- See Note 1) |
(As Adjusted- See Note 1) |
||||||||
| Net sales |
100.00 | % | 100.00 | % | 100.00 | % | |||
| Cost of products sold |
94.77 | 94.96 | 95.16 | ||||||
| Gross profit |
5.23 | 5.04 | 4.84 | ||||||
| Operating expenses: |
|||||||||
| Selling, general and administrative expenses |
4.04 | 4.03 | 3.91 | ||||||
| Loss on disposal of subsidiaries |
— | — | 0.06 | ||||||
| Restructuring charges |
— | — | 0.07 | ||||||
| 4.04 | 4.03 | 4.04 | |||||||
| Operating income |
1.19 | 1.01 | 0.80 | ||||||
| Other expense (income): |
|||||||||
| Interest expense |
0.12 | 0.17 | 0.17 | ||||||
| Discount on sale of accounts receivable |
— | 0.01 | 0.03 | ||||||
| Interest income |
(0.01 | ) | (0.04 | ) | (0.06 | ) | |||
| Net foreign currency exchange loss (gain) |
0.02 | 0.13 | (0.02 | ) | |||||
| 0.13 | 0.27 | 0.12 | |||||||
| Income before income taxes |
1.06 | 0.74 | 0.68 | ||||||
| Provision for income taxes |
0.24 | 0.26 | 0.26 | ||||||
| Consolidated net income |
0.82 | 0.48 | 0.42 | ||||||
| Net loss attributable to noncontrolling interest |
— | 0.01 | 0.02 | ||||||
| Net income attributable to shareholders of Tech Data Corporation |
0.82 | % | 0.49 | % | 0.44 | % | |||
Net Sales
Our consolidated net sales were $22.1 billion in fiscal 2010, a decrease of 8.2% when compared to fiscal 2009. On a regional basis, during fiscal 2010, net sales in the Americas declined by 9.8% compared to fiscal 2009 and decreased by 7.0% in Europe (a decrease of 4.2% on a euro basis). The decline in net sales in both the Americas and Europe during fiscal 2010 was attributable to the softened demand environment and related slowdown in IT spending. The year-over-year decline was most pronounced during the first semester of fiscal 2010. We saw the decline moderate during the third quarter of fiscal 2010 and experienced year-over-year sales growth during our fourth quarter, possibly indicating the beginning of an economic recovery in many of the markets we operate.
Our consolidated net sales were $24.1 billion in fiscal 2009, an increase of 2.8% when compared to fiscal 2008. On a regional basis, during fiscal 2009, net sales in the Americas declined by 3.6% compared to fiscal 2008 and increased by 8.5% in Europe (an increase of 4.0% on a euro basis). Our fiscal 2009 sales performance in the Americas is the result of softer demand throughout the region, especially during the second semester, and an increase in competitive pricing conditions compared to the prior year. Our sales growth on a euro basis in Europe is primarily the result of the May 2008 acquisition of Scribona, AB, and growth in our
21
Table of Contents
German operations offset by lower IT demand within most of the other European countries in which we operate, as well as our continuous efforts to remix our customer portfolio in Europe. Declining average selling prices for the majority of the products we sell continued to have a negative impact on our sales results within both the Americas and Europe.
Gross Profit
Gross profit as a percentage of net sales (“gross margin”) during fiscal 2010 was 5.23%, a 19 basis point increase from 5.04% in fiscal 2009. The increase in gross margin is primarily attributable to solid execution of our inventory, pricing and freight management practices and continued diversification of our customer and product mix.
Gross margin during fiscal 2009 was 5.04%, a 20 basis point increase from 4.84% in fiscal 2008. The increase in gross margin is primarily attributable to improvements in our inventory, pricing and freight management practices, continued diversification of our customer and product mix and a recovery of foreign currency exchange losses, as further discussed below. These results were partially offset by competitive pricing conditions, particularly in the Americas.
Operating Expenses
Selling, general and administrative expenses (“SG&A”)
SG&A as a percentage of net sales remained relatively constant at 4.04% in fiscal 2010, compared to 4.03% in fiscal 2009. We were able to maintain our SG&A as a percentage of sales consistent with the prior year as we reduced our SG&A expenses in absolute dollars, as further discussed below, to help mitigate the effect of the year-over-year net sales declines discussed above. In absolute dollars, SG&A decreased by $78.0 million in fiscal 2010 compared to fiscal 2009. The decrease in SG&A during fiscal 2010 is primarily attributable to cost management actions, including adjustments to headcount and the associated reductions in payroll-related expenses and the relative strength, on average, of the U.S. dollar against certain foreign currencies throughout fiscal 2010 compared to fiscal 2009 (which contributed approximately $22.2 million of the decrease). In addition, SG&A during fiscal 2009 included $7.6 million of consulting and integration costs related to the acquisition of certain assets of Nordic-based Scribona, AB which did not recur during fiscal 2010.
SG&A as a percentage of net sales increased to 4.03% in fiscal 2009, compared to 3.91% in fiscal 2008. The increase in SG&A as a percentage of sales in fiscal 2009 is primarily due to a lower level of net sales on a year-over-year basis in the Americas, our investments to support our sales growth in Europe, as well as our acquisition of certain assets from Nordic-based Scribona, AB and the related consulting and integration costs of $7.6 million in fiscal 2009.
In absolute dollars, SG&A increased by $55.4 million in fiscal 2009 compared to fiscal 2008. The year-over-year increase in SG&A is primarily attributable to the stronger euro versus the U.S. dollar and the factors discussed above.
Loss on Disposal of Subsidiaries
We incurred losses on the disposal of subsidiaries of $14.5 million during fiscal 2008, comprised of $10.8 million of losses related to the closure of our UAE operations and a $3.7 million loss related to the sale of our Israel operations. The loss related to the closure of our UAE operations includes a $9.8 million impairment on our investment in the UAE due to a foreign currency exchange loss (previously recorded in shareholders’ equity as a component of other comprehensive income) and $1.0 million in severance costs and certain asset write-offs related to the exit. The $3.7 million loss related to the sale of our Israel operations includes a $2.7 million impairment on our investment in Israel due to a foreign currency exchange loss (previously recorded in shareholders’ equity as a component of other comprehensive income) and $1.0 million in selling costs (see further discussion in Note 6 of Notes to Consolidated Financial Statements).
22
Table of Contents
Restructuring Charges
No restructuring charges were incurred during either fiscal 2010 or 2009. Restructuring charges were $16.1 million during fiscal 2008 and include the charges related to the closure of the German logistics center, announced in the second quarter of fiscal 2008, and credits related to the European restructuring program completed in October 2006.
Closure of European Logistics Center
In May 2007, our Board of Directors approved the exit from our logistics center in Germany (the “Moers logistics center”). The decision to exit this logistics center was made to enable the Company to capitalize on the long-term synergies of having one logistics center serving Germany, Austria and the Czech Republic and to reduce the Company’s expenses. During the year ended January 31, 2008, the Company completed its exit of the Moers logistics facility and recorded $18.1 million in restructuring charges related to the closure, comprised of $8.7 million of workforce reductions and $9.4 million for facility costs and other fixed asset write-offs.
European Restructuring Program
In May 2005, we announced a formal restructuring program to better align the European operating cost structure with the business environment prevailing at the time. As of October 31, 2006, the initiatives related to the European restructuring program had been completed. During fiscal 2008, we recorded credits of $2.0 million related to changes in estimates of previously recorded restructuring accruals, comprised of a $1.6 million credit for facility costs and a $0.4 million credit for workforce reductions.
Interest Expense, Discount on Sale of Accounts Receivable, Interest Income
Interest expense decreased 32.6% to $27.6 million in fiscal 2010 compared to $41.0 million in the prior year. The decrease in interest expense in fiscal 2010 is primarily attributable to lower interest rates on revolving credit loans and lower outstanding average debt balances as compared to fiscal 2009.
Interest expense increased 5.7% to $41.0 million in fiscal 2009 compared to $38.8 million in fiscal 2008. The increase in interest expense in fiscal 2009 is primarily attributable to an increase in the average outstanding debt balances, partially offset by a decrease in interest rates on revolving credit loans in certain jurisdictions.
During each of the fiscal years 2010, 2009 and 2008, interest expense includes non-cash interest expense of $10.3 million resulting from the retrospective adoption of an accounting standard related to the $350 million convertible senior debentures (see Note 1 of Notes to Consolidated Financial Statements for further discussion).
There was no discount on sale of accounts receivable for fiscal 2010 as we did not sell accounts receivable during the fiscal year. Discount on sale of accounts receivable totaled $1.9 million and $7.2 million, respectively, in fiscal 2009 and 2008. The decrease in the discount on sale of accounts receivables in fiscal 2009 was due to the decrease in the accounts receivable sold and a decrease in the discount rate related to the sale of the accounts receivable.
Interest income decreased 65.4% to $3.3 million in fiscal 2010 compared to $9.5 million in fiscal 2009. The decrease in interest income during fiscal 2010 is attributable to lower interest rates on short-term cash investments, partially offset by an increase in the average short-term cash investment balances compared to the same period of the prior year. Interest income decreased 29.7% to $9.5 million in fiscal 2009 compared to $13.5 million in fiscal 2008. The decrease in interest income during fiscal 2009 is primarily attributable to a decrease in the average cash balances invested and a decrease in interest rates during fiscal 2009 compared to the same period of the prior year.
Foreign Currency Exchange Loss (Gain)
We realized a net foreign currency exchange loss of $4.3 million during fiscal 2010, a net foreign currency exchange loss of $31.0 million during fiscal 2009, and a net foreign currency exchange gain of $4.0 million in fiscal 2008. The net foreign currency exchange losses incurred during fiscal 2010 and fiscal 2009 and the net foreign currency exchange gain in fiscal 2008, are primarily comprised of the net foreign currency exchange gains or losses on accounts payable denominated in currencies other than the functional currency of the respective market where we consider inventory as an economic hedge (further discussed below) and the costs of utilizing forward contracts to hedge our foreign currency exposures. The $31.0 million foreign currency exchange loss in fiscal 2009 reflected the significant volatility in foreign currency exchange rates during the second half of fiscal 2009 as the global economic downturn intensified. As further discussed below, a significant portion of this foreign currency exchange loss was recovered through higher gross margins in the same period.
As a result of subsidiaries outside of the U.S. purchasing certain inventory in currencies other than the currency in which the inventory is sold, we recognize net foreign currency exchange gains and losses primarily due to the fluctuation in the value of the
23
Table of Contents
U.S. dollar versus the euro, and the euro and the U.S. dollar versus other currencies. It is our policy to minimize foreign currency exchange gains and losses through an effective hedging program. Under this program, we will typically enter into forward contracts to hedge a portion of our net monetary exposure. In certain cases where we expect our product selling prices to fluctuate with changes in foreign currency exchange rates, we consider the value of such inventory on hand as a hedge against the related foreign currency denominated accounts payable. Under this strategy, to the extent we incur a foreign currency exchange loss (gain) on the underlying accounts payable denominated in the foreign currency as a result of changes in foreign currency exchange rates, we would typically expect to see a corresponding increase (decrease) in selling prices (and gross margin) upon the sale of the respective inventory. As discussed above, the $31.0 million net foreign currency exchange loss incurred in fiscal 2009, can be primarily attributed to the use of certain portions of inventory as an economic hedge against foreign currency exposure in accounts payable, a significant portion of which was recorded through higher selling prices and gross margins in the same period.
To the extent that foreign currencies remain volatile and the market conditions remain competitive, we may incur significant foreign currency exchange losses in the future and there can be no assurance as to the amount of additional gross margin we will be able to realize to offset such losses. We will continue to use inventory as an economic hedge to offset related foreign currency exposure in accounts payable where we believe there is product selling price elasticity related to changes in underlying foreign currency exchange rates. Our hedging policy continues to prohibit speculative foreign currency exchange transactions.
Provision for Income Taxes
Our effective tax rate was 22.9% in fiscal 2010 and 35.1% in fiscal 2009. The change in the effective tax rate during fiscal 2010 compared to fiscal 2009 is primarily due to the relative mix of earnings and losses within the taxing jurisdictions in which we operate and changes in the amounts of income tax reserves and valuation allowances during the respective periods. The improvement in our results in certain European countries where we have valuation allowances on deferred tax assets contributed to the lower effective tax rate during fiscal 2010. In fiscal 2010, we also reversed a $5.4 million deferred tax valuation allowance in a specific European jurisdiction and recorded the amount as an income tax benefit. In fiscal 2009, we reversed a net amount of $8.7 million of income tax reserves primarily due to statute expirations and resolution of income tax examinations (see Note 10 of Notes to Consolidated Financial Statements for further discussion).
On an absolute dollar basis, the provision for income taxes decreased 13.4% to $53.9 million in fiscal 2010 compared to $62.3 million in fiscal 2009. The change in the provision for income taxes is primarily due to the relative mix of earnings and losses within certain countries in which we operate and the adjustments to income tax reserves and valuation allowances discussed above.
Our effective tax rate was 35.1% in fiscal 2009 and 38.3% in fiscal 2008. The change in the effective tax rate during fiscal 2009 compared to fiscal 2008 is primarily due to the relative mix of earnings and losses within the taxing jurisdictions in which we operate and changes in the amounts of income tax reserves and valuation allowances. As discussed above, in fiscal 2009, we reversed a net amount of $8.7 million of income tax reserves and in fiscal 2008, a $7.5 million deferred tax valuation allowance for Brazil was reversed and recorded as an income tax benefit.
On an absolute dollar basis, the provision for income taxes increased 1.7% to $62.3 million in fiscal 2009 compared to $61.3 million in fiscal 2008. The change in the provision for income taxes is primarily due to an increase in earnings in certain countries in which we operate and the adjustments to income tax reserves and valuation allowances discussed above.
To the extent we generate future consistent taxable income within those operations currently requiring the valuation allowance, the valuation allowance on the related deferred tax assets will be reduced, thereby reducing tax expense and increasing net income in the same period. The underlying net operating loss carryforwards remain available to offset future taxable income in the specific jurisdictions requiring the valuation allowance, subject to applicable tax laws and regulations.
The effective tax rate differed from the U.S. federal statutory rate of 35% during fiscal 2010, 2009 and 2008, due to the relative mix of earnings or losses within the tax jurisdictions in which we operate such as: a) losses in tax jurisdictions where we are not able to record a tax benefit; b) earnings in tax jurisdictions where we have previously recorded a valuation allowance on deferred tax assets; and c) earnings in lower-tax jurisdictions for which no U.S. taxes have been provided because such earnings are planned to be reinvested indefinitely outside the United States. The effective tax rate was also affected by the reversal of income tax reserves during the fiscal years discussed above.
The overall effective tax rate will continue to be dependent upon the geographic distribution of our earnings or losses and changes in tax laws or interpretations of these laws in these operating jurisdictions. We monitor the assumptions used in estimating the annual effective tax rate and make adjustments, if required, throughout the year. If actual results differ from the assumptions used in estimating our annual income tax rates, future income tax expense could be materially affected.
Our future effective tax rates could be adversely affected by lower earnings than anticipated in countries with lower statutory rates, changes in the relative mix of taxable income and taxable loss jurisdictions, changes in the valuation of our deferred tax assets or
24
Table of Contents
liabilities or changes in tax laws or interpretations thereof. In addition, our income tax returns are subject to continuous examination by the Internal Revenue Service and other tax authorities. We regularly assess the likelihood of adverse outcomes from these examinations to determine the adequacy of our provision for income taxes. To the extent we prevail in matters for which accruals have been established or are required to pay amounts in excess of such accruals, our effective tax rate could be materially affected.
Net (income) loss attributable to noncontrolling interest
Net income attributable to noncontrolling interest (previously referred to as minority interest) was $1.0 million in fiscal 2010, compared to net losses attributable to noncontrolling interest of $1.8 million in fiscal 2009 and $3.6 million in fiscal 2008. The net income (loss) attributable to noncontrolling interest represents Brightstar Corporation’s share of the joint venture income (loss), as the joint venture is a consolidated subsidiary in our financial statements and the year-over-year changes can be attributed to the improving results and geographic expansions in the joint venture’s operations. The joint venture commenced sales in the third quarter of fiscal 2008, and to date the joint venture’s results of operations have not been material to our operating results as a whole.
Impact of Inflation
During the fiscal years ended January 31, 2010, 2009 and 2008, we do not believe that inflation had a material impact on our consolidated operations or on our financial position.
Quarterly Data—Seasonality
Our quarterly operating results have fluctuated significantly in the past and will likely continue to do so in the future as a result of currency fluctuations and seasonal variations in the demand for the products and services we offer. Narrow operating margins may magnify the impact of these factors on our operating results. Recent historical seasonal variations have included an increase in European demand during our fiscal fourth quarter and decreased demand in other fiscal quarters, particularly quarters that include summer months. Given that the majority of our net sales are derived from Europe, our consolidated results closely follow the seasonality trends in Europe. Additionally, the life cycles of major products, as well as the impact of future acquisitions and dispositions, may also materially impact our business, financial condition, or results of operations (see Note 17 of Notes to Consolidated Financial Statements for further information regarding our quarterly results).
Liquidity and Capital Resources
Our discussion of liquidity and capital resources includes an analysis of our cash flows and capital structure for all periods presented.
The following table summarizes Tech Data’s Consolidated Statement of Cash Flows for the fiscal years ended January 31, 2010, 2009 and 2008:
| Years ended January 31, | |||||||||||
| 2010 | 2009 | 2008 | |||||||||
| (In thousands) | |||||||||||
| Net cash provided by (used in): |
|||||||||||
| Operating activities |
$ | 543,930 | $ | 279,810 | $357,422 | ||||||
| Investing activities |
(31,527 | ) | (110,813 | ) | (52,701 | ) | |||||
| Financing activities |
37,360 | (46,612 | ) | (136,933 | ) | ||||||
| Effect of exchange rate changes on cash and cash equivalents |
38,793 | (41,702 | ) | 14,546 | |||||||
| Net increase in cash and cash equivalents |
$ | 588,556 | $ | 80,683 | $182,334 | ||||||
25
Table of Contents
As a distribution company, our business requires significant investment in working capital, particularly accounts receivable and inventory, partially financed through our accounts payable with vendors. Overall, as our sales volume increases, our net investment in working capital dollars typically increases, which, in general, results in decreased cash flow from operating activities. Conversely, when sales volume decreases, our net investment in working capital typically decreases, which, in general, results in increased cash flow from operating activities.
Net cash provided by operating activities was $543.9 million in fiscal 2010 compared to $279.8 million in fiscal 2009. The $543.9 million cash provided by operations in fiscal 2010 was due primarily to our earnings and the timing of both cash receipts from our customers and payments to our vendors, in addition to positive results from our working capital management programs, especially in Europe, and the reduced working capital requirements resulting from the 8.2% reduction in net sales in fiscal 2010 compared to fiscal 2009. Net cash provided by operating activities was $279.8 million in fiscal 2009 compared to $357.4 million in fiscal 2008. The $77.6 million decrease in cash provided by operations in fiscal 2009 compared to fiscal 2008 was due primarily to the timing of both cash receipts from our customers and payments to our vendors. We manage working capital primarily by monitoring our cash conversion cycle (also referred to as “net cash days”). Our net cash days are defined as days of sales outstanding in accounts receivable (“DSO”) plus days of supply on hand in inventory (“DOS”), less days of purchases outstanding in accounts payable (“DPO”). Our net cash days improved to 22 days at the end of fiscal 2010 compared to 27 days at the end of fiscal 2009. We have closely managed our working capital throughout fiscal 2010 and we believe the improvement in our working capital metrics can be largely attributed to our enhanced focus on reducing our working capital requirements, particularly in Europe. While we continue to focus on working capital management, the performance level achieved for fiscal 2010 was better than our historical and targeted ranges and may be difficult to sustain on a consistent basis in the future.
The following table presents the components of Tech Data’s cash conversion cycle, in days, as of January 31, 2010, 2009 and 2008:
| As of January 31, | ||||||
| 2010 | 2009 | 2008 | ||||
| Days of sales outstanding |
38 | 37 | 37 | |||
| Days of supply in inventory |
26 | 29 | 24 | |||
| Days of purchases outstanding |
(42) | (39) | (33) | |||
| Cash conversion cycle (days) |
22 | 27 | 28 | |||
Net cash used in investing activities of $31.5 million during fiscal 2010 is the net result of $5.5 million of proceeds received from the sale of certain facilities in the U.S. and Europe, $8.2 million of cash used for acquisitions in Europe and $28.9 million of expenditures for the continuing expansion and upgrading of our IT systems, office facilities and equipment for our logistics centers. We expect to make total capital expenditures of approximately $36.0 million during fiscal 2011 for equipment and machinery in our logistics centers, office facilities and IT systems.
Net cash used in investing activities of $110.8 million during fiscal 2009 was the result of $78.3 million of cash payments made related to the acquisition of certain assets of Scribona and $32.5 million of expenditures for the continuing expansion and upgrading of our IT systems, office facilities and equipment for our logistics centers.
Net cash provided by financing activities of $37.4 million during fiscal 2010 reflects $38.0 million in proceeds received for the reissuance of treasury stock related to exercises of equity-based incentive awards and purchases made through our Employee Stock Purchase Plan (“ESPP”), $23.2 million of net borrowings on the revolving credit loan from our joint venture partner, partially offset by $24.8 million of net repayments borrowings made on our revolving credit lines and long-term debt.
Net cash used in financing activities of $46.6 million during fiscal 2009 reflects $100.0 million of cash used in the repurchase of 2,912,517 shares of our common stock, partially offset by $41.1 million of net borrowings made on our revolving credit lines and long-term debt and $10.8 million of borrowings and capital contributions from our joint venture partner and $1.5 million in proceeds received for the reissuance of treasury stock related to exercises of equity-based incentive awards and purchases made through our ESPP.
As of January 31, 2010, we maintained a Receivables Securitization Program with a syndicate of banks which allows us to transfer an undivided interest in a designated pool of U.S. accounts receivable, on an ongoing basis, to provide security or collateral for borrowings up to a maximum of $150.0 million, which expires in October 2010. We pay interest on the Receivables Securitization Program at designated commercial paper rates plus an agreed-upon margin. Additionally, we maintained a $250.0 million Multi-currency Revolving Credit Facility with a syndicate of banks, which expires in March 2012. We pay interest under this facility at the applicable LIBOR rate plus a margin based on our credit ratings. In addition to the facilities described above, we have additional uncommitted lines of credit and overdraft facilities totaling approximately $519.5 million at January 31, 2010 to support our operations. The total capacity of the aforementioned credit facilities was approximately $919.5 million, of which $32.4 million was
26
Table of Contents
outstanding at January 31, 2010. Our credit agreements contain limitations on the amounts of annual dividends and repurchases of common stock. Additionally, the credit agreements require compliance with certain warranties and covenants. The financial ratio covenants contained within the credit agreements include a debt to capitalization ratio, an interest to EBITDA (as defined per the credit agreements) ratio and a tangible net worth requirement. At January 31, 2010, the Company was in compliance with all such covenants. The ability to draw funds under these credit facilities is dependent upon sufficient collateral (in the case of the Receivables Securitization Program) and meeting the aforementioned financial covenants, which may limit the Company’s ability to draw the full amount of these facilities. As of January 31, 2010, the total maximum amount that could be borrowed under these facilities, in consideration of the availability of collateral and the financial covenants, was approximately $919.5 million.
We also have an interest-free revolving credit loan from Brightstar Corporation “(Brightstar”) that was issued in connection with our joint venture. This revolving credit loan from Brightstar has no contractual repayment date and will increase or decrease in accordance with the working capital requirements of the joint venture, as determined by the Company. The amount outstanding at January 31, 2010 totaled $33.0 million.
At January 31, 2010, the Company had issued standby letters of credit of $34.4 million. These letters of credit typically act as a guarantee of payment to certain third parties in accordance with specified terms and conditions. The issuance of these letters of credit reduces the Company’s available capacity under the above-mentioned facilities by the same amount.
In December 2006, we issued $350.0 million of convertible senior debentures due 2026. The debentures bear interest at 2.75% per year. We pay interest on the debentures on June 15 and December 15 of each year. In addition, beginning with the period commencing on December 20, 2011 and ending on June 15, 2012 and for each six-month period thereafter, we will pay contingent interest on the interest payment date for the applicable interest period, if the market price of the debentures exceeds specified levels. The convertible senior debentures are convertible into our common stock and cash anytime after June 15, 2026, or i) if the market price of the common stock, as defined, exceeds 135% of the conversion price per share of common stock, or ii) if the Company calls the debentures for redemption, or iii) upon the occurrence of certain corporate transactions, as defined. Holders have the right to convert the debentures into 18.4310 shares per $1,000 principal amount of debentures, equivalent to a conversion price of approximately $54.26 per share. Upon conversion, we will deliver cash equal to the lesser of the aggregate principal amount of the debentures to be converted and our total conversion obligation and shares of our common stock in respect of the remainder, if any, of our conversion obligation. Holders have the option to require us to repurchase the debentures in cash on any of the fifth, tenth or fifteenth anniversary dates from the issue date at 100% of the principal amount plus accrued interest to the repurchase date. The debentures are redeemable in whole or in part for cash at our option at any time on or after December 20, 2011. Additionally, the debentures are senior, unsecured obligations and rank equally in right of payment with all of our other unsecured and unsubordinated indebtedness. The debentures are effectively subordinated to all of our existing and future secured debt and are structurally subordinated to the indebtedness and other liabilities of our subsidiaries.
In December 2009, our Board of Directors authorized a share repurchase program of up to $100.0 million of our common stock. Through January 31, 2010, we have not made any repurchases of common stock in connection with this repurchase program.
In June 2008, our Board of Directors authorized a share repurchase program of up to $100.0 million of our common stock. During the second and third quarters of fiscal 2009, we repurchased 2,912,517 shares at an average of $34.33 per share, for a total cost, including expenses, of $100.0 million in connection with this repurchase program.
For our share repurchase programs, the number of shares purchased and the timing of the purchases was based on working capital requirements, general business conditions and other factors, including alternative investment opportunities. Shares we repurchase are held in treasury for general corporate purposes, including issuances under employee equity incentive plans.
Our debt to capital ratio was 16% at January 31, 2010. We believe that our existing sources of liquidity, including cash resources and cash provided by operating activities, supplemented as necessary with funds available under our credit arrangements, will provide sufficient resources to meet our present and future working capital and cash requirements for at least the next 12 months. Changes in our credit rating or other market factors may increase our interest expense or other costs of capital or capital may not be available to us on acceptable terms to fund our working capital needs. The Company will continue to need additional financing, including debt financing. The inability to obtain such sources of capital could have an adverse effect on the Company’s business. The Company’s credit facilities contain various financial and other covenants that may limit the Company’s ability to borrow or limit the Company’s flexibility in responding to business conditions.
27
Table of Contents
Contractual Obligations
As of January 31, 2010, future payments of long-term debt and amounts due under future minimum lease payments, including minimum commitments under IT outsourcing agreements, are as follows (in thousands):
| Operating leases |
Capital lease |
Long-term debt (1) |
Total | ||||||||||||
| Fiscal year: |
|||||||||||||||
| 2011 |
$ | 60,607 | $ | 875 | $ | 9,625 | $ | 71,107 | |||||||
| 2012 |
41,308 | 875 | 358,517 | 400,700 | |||||||||||
| 2013 |
35,799 | 875 | — | 36,674 | |||||||||||
| 2014 |
29,571 | 875 | — | 30,446 | |||||||||||
| 2015 |
24,217 | 875 | — | 25,092 | |||||||||||
| Thereafter |
31,210 | 4,910 | — | 36,120 | |||||||||||
| Total payments |
222,712 | 9,285 | 368,142 | 600,139 | |||||||||||
| Less amounts representing interest |
— | (1,378 | ) | (18,142 | ) | (19,520 | ) | ||||||||
| Total principal payments |
$ | 222,712 | $ | 7,907 | $ | 350,000 | $ | 580,619 | |||||||
| (1) | Amounts include interest on $350 million convertible senior debentures calculated at the fixed rate of 2.75% per year assuming the convertible senior debentures will be redeemed on the first redemption date of December 20, 2011. |
Fair value renewal and escalation clauses exist for a substantial portion of the operating leases included above. Purchase orders for the purchase of inventory and other goods and services are not included in the table above. We are not able to determine the aggregate amount of such purchase orders that represent contractual obligations, as purchase orders typically represent authorizations to purchase rather than binding agreements. For the purposes of this table, contractual obligations for purchase of goods or services are defined as agreements that are enforceable and legally binding on Tech Data and that specify all significant terms, including: fixed or minimum quantities to be purchased; fixed, minimum or variable price provisions; and the approximate timing of the transaction. Our purchase orders are based on our current demand expectations and are fulfilled by our vendors within short time horizons. We do not have significant non-cancelable agreements for the purchase of inventory or other goods specifying minimum quantities or set prices that exceed our expected requirements for the next three months. We also enter into contracts for outsourced services; however, the obligations under these contracts were not significant and the contracts generally contain clauses allowing for cancellation without significant penalty.
At January 31, 2010, we have $1.7 million recorded as a current liability for uncertain tax positions. We are not able to reasonably estimate the timing of long-term payments, or the amount by which our liability will increase or decrease over time; therefore, the long-term portion of our liability for uncertain tax position of $1.7 million has not been included in the contractual obligations table above (see Note 10 of Notes to Consolidated Financial Statements).
Off-Balance Sheet Arrangements
Synthetic Lease Facility
We have a synthetic lease facility (the “Synthetic Lease”) with a group of financial institutions under which we lease certain logistics centers and office facilities from a third-party lessor. During the second quarter of fiscal 2009, we renewed our existing Synthetic Lease with a new lease agreement that expires in June 2013. Properties leased under the Synthetic Lease are located in Clearwater and Miami, Florida; Fort Worth, Texas; Fontana, California; Suwanee, Georgia; Swedesboro, New Jersey; and South Bend, Indiana. The Synthetic Lease has been accounted for as an operating lease and rental payments are calculated at the applicable LIBOR rate plus a margin based on our credit ratings.
During the first four years of the lease term, we may, at our option, purchase any combination of the seven properties, at an amount equal to each of the property’s cost, as long as the lease balance does not decrease below a defined amount. During the last year of the lease term, until 180 days prior to the lease expiration, we may, at our option, i) purchase a minimum of two of the seven properties, at an amount equal to each of the property’s cost, ii) exercise the option to renew the lease for a minimum of two of the seven properties or iii) exercise the option to remarket a minimum of two of the seven properties and cause a sale of the properties. If we elect to remarket the properties, we have guaranteed the lessor a percentage of the cost of each property, in the aggregate amount of approximately $107.4 million (the “residual value”). We have also provided a residual value guarantee related to the Synthetic Lease, which has been recorded at the estimated fair value of the residual guarantee.
The sum of future minimum lease payments under the Synthetic Lease is approximately $6.6 million at January 31, 2010 and such amounts are included in the future minimum lease payments presented above. The Synthetic Lease contains covenants that must be complied with, similar to the covenants described in certain of the credit facilities. As of January 31, 2010, we were in compliance with all such covenants.
28
Table of Contents
Guarantees
As is customary in the IT industry, to encourage certain customers to purchase product from us, we have arrangements with certain finance companies that provide inventory-financing facilities for our customers. In conjunction with certain of these arrangements, we have agreements with the finance companies that would require us to repurchase certain inventory, which might be repossessed from the customers by the finance companies. Due to various reasons, including among other items, the lack of information regarding the amount of saleable inventory purchased from us still on hand with the customer at any point in time, our repurchase obligations relating to inventory cannot be reasonably estimated. Repurchases of inventory by us under these arrangements have been insignificant to date. We also provide additional financial guarantees to finance companies on behalf of certain customers. The majority of these guarantees are for an indefinite period of time, where we would be required to perform if the customer is in default with the finance company related to purchases made from the Company. The Company reviews the underlying credit for these guarantees on at least an annual basis. As of January 31, 2010 and 2009, the aggregate amount of guarantees under these arrangements totaled approximately $62.3 million and $31.9 million, respectively, of which approximately $40.9 million and $23.1 million, respectively, was outstanding. We believe that, based on historical experience, the likelihood of a material loss pursuant to the above guarantees is remote.
| ITEM 7A. | Quantitative and Qualitative Disclosures About Market Risk. |
As a large global organization, we face exposure to adverse movements in foreign currency exchange rates. These exposures may change over time as business practices evolve and could have a material impact on our financial results in the future. In the normal course of business, we employ established policies and procedures to manage our exposure to fluctuations in the value of foreign currencies. It is our policy to utilize financial instruments to reduce risks where internal netting cannot be effectively employed. Additionally, we do not enter into derivative instruments for speculative or trading purposes. With respect to our internal netting practices, we will consider inventory as an economic hedge against foreign currency exposure in accounts payable in certain circumstances. This practice offsets such inventory against corresponding accounts payables denominated in currencies other than the functional currency of the subsidiary buying the inventory, when determining our net exposure to be hedged using traditional forward contracts. Under this strategy, we would expect to increase or decrease our selling prices for product purchased in foreign currencies based on fluctuations in foreign currency exchange rates affecting the underlying accounts payable. To the extent we incur a foreign currency exchange loss (gain) on the underlying accounts payable denominated in the foreign currency, we would expect to see a corresponding increase (decrease) in gross profit as the related inventory is sold. This strategy can result in a certain degree of quarterly earnings volatility as the underlying accounts payable is remeasured using the foreign currency exchange rate prevailing at the end of each period, or settlement date if earlier, whereas the corresponding increase (decrease) in gross profit is not realized until the related inventory is sold.
Our foreign currency exposure relates to our transactions in Europe, Canada and Latin America, where the currency collected from customers can be different from the currency used to purchase the product. During fiscal 2010 and 2009, the underlying exposures are denominated primarily in the following currencies: U.S. dollar, British pound, Canadian dollar, Chilean Peso, Czech koruna, Danish krone, euros, Norwegian krone, Polish zloty, Swedish krona and Swiss franc. Our foreign currency risk management objective is to protect our earnings and cash flows from the adverse impact of exchange rate changes through the use of foreign currency forward, option and swap contracts to primarily hedge loans, accounts receivable and accounts payable.
We are also exposed to changes in interest rates primarily as a result of our short-term and long-term debt used to maintain liquidity and to finance working capital, capital expenditures and acquisitions. Interest rate risk is also present in the forward foreign currency contracts hedging intercompany and loans. Our interest rate risk management objective is to limit the impact of interest rate changes on earnings and cash flows and to minimize overall borrowing costs. To achieve our objective, we use a combination of fixed and variable rate debt. The nature and amount of our long-term and short-term debt can be expected to vary as a result of future business requirements, market conditions and other factors. As of January 31, 2010 and 2009, approximately 84% and 86%, respectively, of our outstanding debt had fixed interest rates. We utilize various financing instruments, such as receivables securitization, leases, revolving credit facilities, convertible senior debentures and trade receivable purchase facilities, to finance working capital needs. To the extent that there are changes in interest rates, the fair value of the Company’s fixed rate debt may fluctuate.
In order to provide an assessment of the Company’s foreign currency exchange rate and interest rate risk, the Company performed a sensitivity analysis using a value-at-risk (“VaR”) model. The VaR model consisted of using a Monte Carlo simulation to generate 1,000 random market price paths. The VaR model determines the potential impact of the fluctuation in foreign exchange rates and interest rates assuming a one-day holding period, normal market conditions and a 95% confidence level. The VaR is the maximum expected loss in fair value for a given confidence interval to the Company’s foreign exchange and debt portfolio due to adverse movements in the rates. The model is not intended to represent actual losses but is used as a risk estimation and management tool. Firm commitments, assets and liabilities denominated in foreign currencies were excluded from the model.
29
Table of Contents
The following table represents the estimated maximum potential one-day loss in fair value, calculated using the VaR model at January 31, 2010 and 2009. We believe that the hypothetical loss in fair value of our foreign exchange derivatives would be offset by the gains in the value of the underlying transactions being hedged.
| VaR as of | ||||||||
| January 31, 2010 | January 31, 2009 | |||||||
| (in thousands) | ||||||||
| Currency rate sensitive financial instruments |
$ | (2,886 | ) | $ | (5,004 | ) | ||
| Interest rate sensitive financial instruments |
(603 | ) | (657 | ) | ||||
| Combined portfolio |
$ | (3,489 | ) | $ | (5,661 | ) | ||
Actual future gains and losses associated with the Company’s derivative positions may differ materially from the analyses performed as of January 31, 2010 due to the inherent limitations associated with predicting the changes in the timing and amount of interest rates, foreign currency exchanges rates, and the Company’s actual exposures and positions.
30
Table of Contents
| ITEM 8. | Financial Statements and Supplementary Data. |
Index to Financial Statements
| Page | ||
| Financial Statements |
||
| Report of Independent Registered Certified Public Accounting Firm |
32 | |
| 33 | ||
| 34 | ||
| 35 | ||
| 36 | ||
| 37 | ||
| Financial Statement Schedule |
||
| 70 | ||
All schedules and exhibits not included are not applicable, not required or would contain information which is shown in the financial statements or notes thereto.
31
Table of Contents
Report of Independent Registered Certified Public Accounting Firm
The Board of Directors and Shareholders of
Tech Data Corporation
We have audited the accompanying consolidated balance sheets of Tech Data Corporation and subsidiaries as of January 31, 2010 and 2009, and the related consolidated statements of operations, shareholders’ equity, and cash flows for each of the three years in the period ended January 31, 2010. Our audits also included the financial statement schedule listed in the Index at Item 15(a). These financial statements and schedule are the responsibility of the Company’s management. Our responsibility is to express an opinion on these financial statements and schedule based on our audits.
We conducted our audits in accordance with the standards of the Public Company Accounting Oversight Board (United States). Those standards require that we plan and perform the audit to obtain reasonable assurance about whether the financial statements are free of material misstatement. An audit includes examining, on a test basis, evidence supporting the amounts and disclosures in the financial statements. An audit also includes assessing the accounting principles used and significant estimates made by management, as well as evaluating the overall financial statement presentation. We believe that our audits provide a reasonable basis for our opinion.
In our opinion, the financial statements referred to above present fairly, in all material respects, the consolidated financial position of Tech Data Corporation and subsidiaries at January 31, 2010 and 2009, and the consolidated results of their operations and their cash flows for each of the three years in the period ended January 31, 2010, in conformity with U.S. generally accepted accounting principles. Also, in our opinion, the related financial statement schedule, when considered in relation to the basic financial statements taken as a whole, presents fairly in all material respects the information set forth therein.
As discussed in Note 10 to the consolidated financial statements, effective February 1, 2007, the Company changed its method of accounting for uncertainty in income taxes. As discussed in Note 1 to the consolidated financial statements, effective February 1, 2009, the Company changed its method of accounting for convertible debt instruments that may be settled in cash upon conversion.
We also have audited, in accordance with the standards of the Public Company Accounting Oversight Board (United States), Tech Data Corporation’s internal control over financial reporting as of January 31, 2010, based on criteria established in Internal Control—Integrated Framework issued by the Committee of Sponsoring Organizations of the Treadway Commission and our report dated March 24, 2010, expressed an unqualified opinion thereon.
/s/ Ernst & Young LLP
Tampa, Florida
March 24, 2010
32
Table of Contents
TECH DATA CORPORATION AND SUBSIDIARIES
CONSOLIDATED BALANCE SHEET
(In thousands, except share amounts)
| January 31, | |||||||
| 2010 | 2009 | ||||||
| (As Adjusted – See Note 1) |
|||||||
| ASSETS | |||||||
| Current assets: |
|||||||
| Cash and cash equivalents |
$ | 1,116,579 | $ 528,023 | ||||
| Accounts receivable, less allowance for doubtful accounts of $54,627 and $55,598 |
2,648,460 | 2,346,185 | |||||
| Inventories |
1,704,658 | 1,728,916 | |||||
| Prepaid expenses and other assets |
173,875 | 168,673 | |||||
| Total current assets |
5,643,572 | 4,771,797 | |||||
| Property and equipment, net |
90,634 | 102,937 | |||||
| Other assets, net |
167,881 | 148,362 | |||||
| Total assets |
$ | 5,902,087 | $5,023,096 | ||||
| LIABILITIES AND EQUITY | |||||||
| Current liabilities: |
|||||||
| Revolving credit loans |
$ | 65,384 | $ 57,906 | ||||
| Accounts payable |
2,788,098 | 2,325,702 | |||||
| Accrued expenses and other liabilities |
539,660 | 496,292 | |||||
| Total current liabilities |
3,393,142 | 2,879,900 | |||||
| Long-term debt, net |
338,157 | 331,233 | |||||
| Other long-term liabilities |
76,255 | 69,950 | |||||
| Total liabilities |
3,807,554 | 3,281,083 | |||||
| Commitments and contingencies (Note 15) |
|||||||
| Shareholders’ equity: |
|||||||
| Common stock, par value $.0015; 200,000,000 shares authorized; 59,239,085 shares issued at January 31, 2010 and 2009 |
89 | 89 | |||||
| Additional paid-in capital |
769,295 | 775,754 | |||||
| Treasury stock, at cost (7,776,419 and 9,214,889 shares at January 31, 2010 and 2009) |
(279,198 | ) | (331,692 | ) | |||
| Retained earnings |
1,239,128 | 1,058,973 | |||||
| Accumulated other comprehensive income |
359,581 | 234,569 | |||||
| Equity attributable to shareholders of Tech Data Corporation |
2,088,895 | 1,737,693 | |||||
| Noncontrolling interest |
5,638 | 4,320 | |||||
| Total equity |
2,094,533 | 1,742,013 | |||||
| Total liabilities and equity |
$ | 5,902,087 | $5,023,096 | ||||
The accompanying Notes to Consolidated Financial Statements are an integral part of these financial statements.
33
Table of Contents
TECH DATA CORPORATION AND SUBSIDIARIES
CONSOLIDATED STATEMENT OF OPERATIONS
(In thousands, except per share amounts)
| Year ended January 31, | ||||||||||||
| 2010 | 2009 | 2008 | ||||||||||
| (As Adjusted – See Note 1) |
(As Adjusted – See Note 1) |
|||||||||||
| Net sales |
$ | 22,099,876 | $ | 24,080,484 | $ | 23,423,078 | ||||||
| Cost of products sold |
20,943,162 | 22,867,488 | 22,288,670 | |||||||||
| Gross profit |
1,156,714 | 1,212,996 | 1,134,408 | |||||||||
| Operating expenses: |
||||||||||||
| Selling, general and administrative expenses |
892,878 | 970,837 | 915,434 | |||||||||
| Loss on disposal of subsidiaries |
— | — | 14,471 | |||||||||
| Restructuring charges |
— | — | 16,149 | |||||||||
| 892,878 | 970,837 | 946,054 | ||||||||||
| Operating income |
263,836 | 242,159 | 188,354 | |||||||||
| Other expense (income): |
||||||||||||
| Interest expense |
27,639 | 41,004 | 38,799 | |||||||||
| Discount on sale of accounts receivable |
— | 1,872 | 7,219 | |||||||||
| Interest income |
(3,284 | ) | (9,491 | ) | (13,495 | ) | ||||||
| Net foreign currency exchange loss (gain) |
4,341 | 31,001 | (3,994 | ) | ||||||||
| 28,696 | 64,386 | 28,529 | ||||||||||
| Income before income taxes |
235,140 | 177,773 | 159,825 | |||||||||
| Provision for income taxes |
53,940 | 62,317 | 61,255 | |||||||||
| Consolidated net income |
181,200 | 115,456 | 98,570 | |||||||||
| Net (income) loss attributable to noncontrolling interest |
(1,045 | ) | 1,822 | 3,559 | ||||||||
| Net income attributable to shareholders of Tech Data Corporation |
$ | 180,155 | $ | 117,278 | $ | 102,129 | ||||||
| Net income per share attributable to shareholders of Tech Data Corporation |
||||||||||||
| Basic |
$ | 3.57 | $ | 2.29 | $ | 1.86 | ||||||
| Diluted |
$ | 3.54 | $ | 2.28 | $ | 1.85 | ||||||
| Weighted average common shares outstanding: |
||||||||||||
| Basic |
50,517 | 51,276 | 54,904 | |||||||||
| Diluted |
50,938 | 51,498 | 55,287 | |||||||||
The accompanying Notes to Consolidated Financial Statements are an integral part of these financial statements.
34
Table of Contents
TECH DATA CORPORATION AND SUBSIDIARIES
CONSOLIDATED STATEMENT OF SHAREHOLDERS’ EQUITY
(In thousands)
| Tech Data Corporation Shareholders | |||||||||||||||||||||||||||||
| Common Stock | Additional paid-in capital |
Treasury stock |
Retained earnings |
Accumulated other comprehensive income (loss) |
Noncontrolling interest |
Total equity |
|||||||||||||||||||||||
| Shares | Amount | ||||||||||||||||||||||||||||
| (As Adjusted- See Note 1) |
(As Adjusted- See Note 1) |
(As Adjusted- See Note 1) |
(As Adjusted- See Note 1) |
||||||||||||||||||||||||||
| Balance—January 31, 2007 |
59,239 | $ | 89 | $ | 763,890 | $ | (157,628 | ) | $ | 840,641 | $ | 286,479 | $ | — | $ | 1,733,471 | |||||||||||||
| Purchase of treasury stock, at cost |
— | — | — | (100,019 | ) | — | — | — | (100,019 | ) | |||||||||||||||||||
| Issuance of treasury stock for benefit plans and equity-based awards exercised, including related tax benefit of $1,078 |
— | — | (4,970 | ) | 18,590 | — | — | — | 13,620 | ||||||||||||||||||||
| Contribution of treasury stock to 401(k) savings plan |
— | — | 64 | 2,097 | — | — | — | 2,161 | |||||||||||||||||||||
| Stock-based compensation expense |
— | — | 10,287 | — | — | — | — | 10,287 | |||||||||||||||||||||
| Adjustment for the cumulative effect of prior years of the adoption of FIN No. 48 |
— | — | — | — | (1,075 | ) | — | — | (1,075 | ) | |||||||||||||||||||
| Capital contributions from joint venture partner |
— | — | — | — | — | — | 9,000 | 9,000 | |||||||||||||||||||||
| Currency translation adjustment |
— | — | — | — | — | 184,758 | 262 | 185,020 | |||||||||||||||||||||
| Net income (loss) |
— | — | — | — | 102,129 | (3,559 | ) | 98,570 | |||||||||||||||||||||
| Balance—January 31, 2008 |
59,239 | 89 | 769,271 | (236,960 | ) | 941,695 | 471,237 | 5,703 | 1,951,035 | ||||||||||||||||||||
| Purchase of treasury stock, at cost |
— | — | — | (100,000 | ) | — | — | (100,000 | ) | ||||||||||||||||||||
| Issuance of treasury stock for benefit plans and equity-based awards exercised, including related tax benefit of $569 |
— | — | (5,507 | ) | 5,268 | — | — | — | (239 | ) | |||||||||||||||||||
| Stock-based compensation expense |
— | — | 11,990 | — | — | — | — | 11,990 | |||||||||||||||||||||
| Capital contribution from joint venture partner |
— | — | — | — | — | — | 1,000 | 1,000 | |||||||||||||||||||||
| Currency translation adjustment |
— | — | — | — | — | (236,668 | ) | (561 | ) | (237,229 | ) | ||||||||||||||||||
| Net income (loss) |
— | — | — | — | 117,278 | — | (1,822 | ) | 115,456 | ||||||||||||||||||||
| Balance—January 31, 2009 |
59,239 | 89 | 775,754 | (331,692 | ) | 1,058,973 | 234,569 | 4,320 | 1,742,013 | ||||||||||||||||||||
| Issuance of treasury stock for benefit plans and equity-based awards exercised, including related tax benefit of $1,873 |
— | — | (17,684 | ) | 52,494 | — | — | — | 34,810 | ||||||||||||||||||||
| Stock-based compensation expense |
— | — | 11,225 | — | — | — | — | 11,225 | |||||||||||||||||||||
| Currency translation adjustment |
— | — | — | — | — | 125,012 | 273 | 125,285 | |||||||||||||||||||||
| Net income |
— | — | — | — | 180,155 | — | 1,045 | 181,200 | |||||||||||||||||||||
| Balance—January 31, 2010 |
59,239 | $ | 89 | $ | 769,295 | $ | (279,198 | ) | $ | 1,239,128 | $ | 359,581 | $ | 5,638 | $ | 2,094,533 | |||||||||||||
The accompanying Notes to Consolidated Financial Statements are an integral part of these financial statements.
35
Table of Contents
TECH DATA CORPORATION AND SUBSIDIARIES
CONSOLIDATED STATEMENT OF CASH FLOWS
(In thousands)
| Year ended January 31, | |||||||||
| 2010 | 2009 | 2008 | |||||||
| (As Adjusted- See Note 1) |
(As Adjusted- See Note 1) |
||||||||
| Cash flows from operating activities: |
|||||||||
| Cash received from customers |
$21,927,372 | $23,989,567 | $23,473,295 | ||||||
| Cash paid to vendors and employees |
(21,320,637 | ) | (23,636,388 | ) | (23,053,048 | ) | |||
| Interest paid, net |
(14,015 | ) | (20,382 | ) | (14,273 | ) | |||
| Income taxes paid |
(48,790 | ) | (52,987 | ) | (48,552 | ) | |||
| Net cash provided by operating activities |
543,930 | 279,810 | 357,422 | ||||||
| Cash flows from investing activities: |
|||||||||
| Acquisition of business, net of cash acquired |
(8,153 | ) | (78,266 | ) | (21,503 | ) | |||
| Proceeds from sale of business |
— | — | 7,161 | ||||||
| Proceeds from sale of property and equipment |
5,491 | — | — | ||||||
| Expenditures for property and equipment |
(14,486 | ) | (17,272 | ) | (21,474 | ) | |||
| Software and software development costs |
(14,379 | ) | (15,275 | ) | (16,885 | ) | |||
| Net cash used in investing activities |
(31,527 | ) | (110,813 | ) | (52,701 | ) | |||
| Cash flows from financing activities: |
|||||||||
| Proceeds from the issuance of common stock and reissuance of treasury stock |
37,959 | 1,530 | 12,542 | ||||||
| Cash paid for purchase of treasury stock |
— | (100,000 | ) | (100,019 | ) | ||||
| Capital contributions and net borrowings from joint venture partner |
23,208 | 10,810 | 9,000 | ||||||
| Net (repayments) borrowings on revolving credit loans |
(19,116 | ) | 42,834 | (56,297 | ) | ||||
| Principal payments on long-term debt |
(5,654 | ) | (1,786 | ) | (2,371 | ) | |||
| Excess tax benefit from stock-based compensation |
963 | — | 212 | ||||||
| Net cash provided by (used in) financing activities |
37,360 | (46,612 | ) | (136,933 | ) | ||||
| Effect of exchange rate changes on cash and cash equivalents |
38,793 | (41,702 | ) | 14,546 | |||||
| Net increase in cash and cash equivalents |
588,556 | 80,683 | 182,334 | ||||||
| Cash and cash equivalents at beginning of year |
528,023 | 447,340 | 265,006 | ||||||
| Cash and cash equivalents at end of year |
$ 1,116,579 | $ 528,023 | $ 447,340 | ||||||
| Reconciliation of net income to net cash provided by operating activities: |
|||||||||
| Net income attributable to shareholders of Tech Data Corporation |
$ 180,155 | $ 117,278 | $ 102,129 | ||||||
| Net income (loss) attributable to noncontrolling interest |
1,045 | (1,822 | ) | (3,559 | ) | ||||
| Consolidated net income |
181,200 | 115,456 | 98,570 | ||||||
| Adjustments to reconcile net income to net cash provided by (used in) operating activities: |
|||||||||
| Loss on disposal of subsidiaries |
— | — | 14,471 | ||||||
| Depreciation and amortization |
45,954 | 51,234 | 53,881 | ||||||
| Provision for losses on accounts receivable |
10,953 | 15,000 | 11,200 | ||||||
| Stock-based compensation expense |
11,225 | 11,990 | 10,287 | ||||||
| Accretion of debt discount on convertible senior debentures |
10,278 | 10,278 | 10,278 | ||||||
| Deferred income taxes |
(2,541 | ) | 18,221 | 2,629 | |||||
| Excess tax benefit from stock-based compensation |
(963 | ) | — | (212 | ) | ||||
| Changes in operating assets and liabilities: |
|||||||||
| Accounts receivable |
(168,152 | ) | (86,423 | ) | 57,419 | ||||
| Inventories |
116,543 | (261,974 | ) | 57,904 | |||||
| Prepaid expenses and other assets |
21,290 | (18,761 | ) | (40,951 | ) | ||||
| Accounts payable |
336,587 | 374,696 | 83,845 | ||||||
| Accrued expenses and other liabilities |
(18,444 | ) | 50,093 | (1,899 | ) | ||||
| Total adjustments |
362,730 | 164,354 | 258,852 | ||||||
| Net cash provided by operating activities |
$ 543,930 | $ 279,810 | $ 357,422 | ||||||
The accompanying Notes to Consolidated Financial Statements are an integral part of these financial statements.
36
Table of Contents
TECH DATA CORPORATION AND SUBSIDIARIES
NOTES TO CONSOLIDATED FINANCIAL STATEMENTS
NOTE 1 — BUSINESS AND SUMMARY OF SIGNIFICANT ACCOUNTING POLICIES
Description of Business
Tech Data Corporation (“Tech Data” or the “Company”) is a leading provider of information technology (“IT”) products, logistics management and other value-added services. The Company distributes microcomputer hardware and software products to value-added resellers, direct marketers, retailers and corporate resellers. The Company is managed in two geographic segments: the Americas (including North America and Latin America) and Europe.
Principles of Consolidation
The consolidated financial statements include the accounts of Tech Data and its subsidiaries. All significant intercompany accounts and transactions have been eliminated in consolidation. Noncontrolling interest is recognized for the portion of a consolidated joint venture not owned by the Company. The Company operates on a fiscal year that ends on January 31.
Basis of Presentation
The consolidated financial statements have been prepared by the Company pursuant to the rules and regulations of the United States Securities and Exchange Commission (“SEC”). The Company prepares its financial statements in conformity with generally accepted accounting principles in the United States. These principles require management to make estimates and assumptions that affect the reported amounts of assets and liabilities and disclosure of contingent assets and liabilities at the date of the financial statements and the reported amounts of revenues and expenses during the reporting period. Actual results could differ from those estimates.
In December 2007, the Financial Accounting Standards Board (“FASB”) issued a new accounting and reporting standard for the noncontrolling interest (previously referred to as minority interest) in a subsidiary and the accounting for the deconsolidation of a subsidiary. The standard clarifies that changes in a parent’s ownership interest in a subsidiary that do not result in deconsolidation are equity transactions if the parent retains its controlling financial interest and requires that a parent recognize a gain or loss in net income when a subsidiary is deconsolidated. The gain or loss will be measured using the fair value of the noncontrolling equity investment on the deconsolidation date. In addition, the standard also includes expanded disclosure requiring the ownership interest in subsidiaries held by parties other than the parent be clearly identified and presented in the consolidated balance sheet within equity, but separate from the parent’s equity; the amount of consolidated net income attributable to the parent and noncontrolling interest be clearly identified and presented on the face of the consolidated statement of operations; and changes in the parent’s ownership interest while the parent retains its controlling financial interest in its subsidiary be accounted for consistently. The Company has adopted this standard effective February 1, 2009 and pursuant to the transition provisions of the standard, the presentation and disclosure requirements have been applied retrospectively for all periods presented.
In May 2008, the FASB issued an accounting standard which changes the accounting treatment for convertible debt instruments that require or permit partial cash settlement upon conversion. The new standard requires issuers to separate convertible debt instruments into two components: a non-convertible bond and a conversion option. The separation of the conversion option creates an original issue discount in the bond component which is to be accreted as interest expense over the term of the instrument using the interest method, resulting in an increase to interest expense and a decrease in net income and earnings per share. The Company concluded that this standard is applicable to the Company’s $350.0 million convertible senior debentures issued in December 2006. The provisions of this standard were effective for the Company’s fiscal year beginning February 1, 2009 and require retrospective application to all periods presented. The impact of the adoption of this standard was an increase in non-cash interest expense of approximately $10.0 million, partially offset by the related tax benefit of approximately $4.0 million, resulting in a decrease in net income of approximately $6.0 million on an annual basis. This annualized impact will also recur for fiscal 2011 and through December 20, 2011, the Company’s first repurchase date of the convertible senior debentures. The adoption of this standard has had no impact on the Company’s consolidated cash flows. The accompanying comparative consolidated financial statements and footnotes have been adjusted for all periods presented to reflect the retrospective application of this standard.
37
Table of Contents
The following financial statement line items for the fiscal years January 31, 2009 and 2008 and as of January 31, 2009, were impacted by the retroactive application of accounting standard:
| Fiscal year ended January 31, 2009 | Effect of change increase (decrease) |
|||||||||
| As adjusted | As previously reported |
|||||||||
| (In thousands, except per share data) | ||||||||||
| Consolidated Statement of Operations: |
||||||||||
| Interest expense (1) |
$ | 41,004 | $ | 30,956 | $ | 10,048 | ||||
| Income before income taxes |
177,773 | 187,821 | (10,048 | ) | ||||||
| Provision for income taxes |
62,317 | 66,017 | (3,700 | ) | ||||||
| Consolidated net income |
115,456 | 121,804 | (6,348 | ) | ||||||
| Net income attributable to shareholders of Tech Data Corporation |
117,278 | 123,626 | (6,348 | ) | ||||||
| Net income per common share attributable to shareholders of Tech Data Corporation: |
||||||||||
| Basic |
$ | 2.29 | $ | 2.41 | $ | (0.12 | ) | |||
| Diluted |
$ | 2.28 | $ | 2.40 | $ | (0.12 | ) | |||
| Fiscal year ended January 31, 2008 | Effect of change increase (decrease) |
|||||||||
| As adjusted | As previously reported |
|||||||||
| (In thousands, except per share data) | ||||||||||
| Consolidated Statement of Operations: |
||||||||||
| Interest expense (1) |
$ | 38,799 | $ | 28,751 | $ | 10,048 | ||||
| Income before income taxes |
159,825 | 169,873 | (10,048 | ) | ||||||
| Provision for income taxes |
61,255 | 65,163 | (3,908 | ) | ||||||
| Consolidated net income |
98,570 | 104,710 | (6,140 | ) | ||||||
| Net income attributable to shareholders of Tech Data Corporation |
102,129 | 108,269 | (6,140 | ) | ||||||
| Net income per common share attributable to shareholders of Tech Data Corporation: |
||||||||||
| Basic |
$ | 1.86 | $ | 1.97 | $ | (0.11 | ) | |||
| Diluted |
$ | 1.85 | $ | 1.96 | $ | (0.11 | ) | |||
| As of January 31, 2009 | Effect of change increase (decrease) |
|||||||||
| As adjusted | As previously reported |
|||||||||
| (In thousands) | ||||||||||
| Consolidated Balance Sheet: |
||||||||||
| Other assets, net |
$ | 148,362 | $ | 149,020 | $ | (658 | ) | |||
| Long-term debt, net |
331,233 | 360,785 | (29,552 | ) | ||||||
| Other long-term liabilities (2) |
69,950 | 63,639 | 6,311 | |||||||
| Additional paid-in capital |
775,754 | 744,242 | 31,512 | |||||||
| Retained earnings |
1,058,973 | 1,072,222 | (13,249 | ) | ||||||
| (1) | The $10.0 million of interest expense is comprised of $10.3 million for accretion of debt discount on the convertible senior debentures offset by a $0.3 million reduction in the amortization of debt issuance costs on the convertible senior debentures, as a result of the reclassification of a portion of the debt issuance costs to additional paid-in capital upon retroactive adoption of the respective accounting standard. |
| (2) | The $6.3 million increase in other long-term liabilities is comprised of a $10.6 million increase in deferred tax liabilities resulting from the adoption of the standard offset by a $4.3 million decrease resulting from the reclassification of the Company’s noncontrolling interest (previously referred to as a “minority interest”) to a component of equity. |
38
Table of Contents
Revenue Recognition
Revenue is recognized once four criteria are met: (1) the Company must have persuasive evidence that an arrangement exists; (2) delivery must occur, which generally happens at the point of shipment (this includes the transfer of both title and risk of loss, provided that no significant obligations remain); (3) the price must be fixed or determinable; and (4) collectability must be reasonably assured. Shipping revenue is included in net sales while the related costs, including shipping and handling costs, are included in the cost of products sold. The Company allows its customers to return product for exchange or credit subject to certain limitations. A provision for such returns is recorded at the time of sale based upon historical experience. Taxes imposed by governmental authorities on the Company’s revenue-producing activities with customers, such as sales taxes and value-added taxes, are excluded from net sales.
Service revenue associated with configuration, training and other services is recognized when the work is complete and the four criteria discussed above have been met. Service revenues have represented less than 10% of total net sales for fiscal years 2010, 2009 and 2008.
The Company generated approximately 28%, 29% and 28% of consolidated net sales in fiscal 2010, 2009 and 2008, respectively, from products purchased from Hewlett Packard. There were no other vendors that accounted for 10% or more of the Company’s consolidated net sales in fiscal 2010, 2009 or 2008.
Accounts Receivable
The Company maintains an allowance for doubtful accounts for estimated losses resulting from the inability of our customers to make required payments. In estimating the required allowance, the Company takes into consideration the overall quality and aging of the receivable portfolio, the existence of credit insurance, specifically identified customer risks, and historical write-off experience. If actual customer performance were to deteriorate to an extent not expected by the Company, additional allowances may be required which could have an adverse effect on the Company’s financial results. Conversely, if actual customer performance were to improve to an extent not expected by us, a reduction in the allowance may be required which could have a favorable effect on the Company’s consolidated financial results.
Inventories
Inventories, consisting entirely of finished goods, are stated at the lower of cost or market, cost being determined on the first-in, first-out (“FIFO”) method. Inventory is written down for estimated obsolescence equal to the difference between the cost of inventory and the estimated market value, based upon an aging analysis of the inventory on hand, specifically known inventory-related risks (such as technological obsolescence and the nature of vendor terms surrounding price protection and product returns), foreign currency fluctuations for foreign-sourced product and assumptions about future demand. Market conditions or changes in terms and conditions by the Company’s vendors that are less favorable than those projected by management may require additional inventory write-downs, which could have an adverse effect on the Company’s consolidated financial results.
Vendor Incentives
The Company receives incentives from vendors related to cooperative advertising allowances, infrastructure funding, volume rebates and other incentive agreements. These incentives are generally under quarterly, semi-annual or annual agreements with the vendors; however, some of these incentives are negotiated on an ad-hoc basis to support specific programs mutually developed with the vendor. Unrestricted volume rebates and early payment discounts received from vendors are recorded when they are earned as a reduction of inventory and as a reduction of cost of products sold as the related inventory is sold. Vendor incentives for specifically identified cooperative advertising programs and infrastructure funding are recorded when earned as adjustments to product costs or selling, general and administrative expenses, depending on the nature of the program.
Reserves for receivables on vendor programs are recorded for estimated losses resulting from vendors’ inability to pay or rejections by vendors of claims. Should amounts recorded as outstanding receivables from vendors be deemed uncollectible, additional allowances may be required which could have an adverse effect on the Company’s consolidated financial results. Conversely, if amounts recorded as outstanding receivables from vendor were to improve to an extent not expected by us, a reduction in the allowance may be required which could have a favorable effect on the Company’s consolidated financial results.
Property and Equipment
Property and equipment are stated at cost and property and equipment under capital leases are stated at the present value of the future minimum lease payments determined at the inception of the lease. Depreciation expense includes depreciation of purchased property and equipment and assets recorded under capital leases. Depreciation expense is computed over the shorter of the estimated economic lives or lease periods using the straight-line method as follows:
| Years | ||
| Buildings and improvements |
15-39 | |
| Leasehold improvements |
3-10 | |
| Furniture, fixtures and equipment |
3-10 |
39
Table of Contents
Expenditures for renewals and improvements that significantly add to productive capacity or extend the useful life of an asset are capitalized. Expenditures for maintenance and repairs are charged to operations when incurred. When assets are sold or retired, the cost of the asset and the related accumulated depreciation are eliminated and any gain or loss is recognized at such time.
Long-Lived Assets
Long-lived assets are reviewed for potential impairment at such time when events or changes in circumstances indicate that the carrying amount of the asset may not be recoverable. An impairment loss is evaluated when the sum of the expected, undiscounted future net cash flows is less than the carrying amount of the asset. Any impairment loss is measured by comparing the fair value of the asset to its carrying value.
Goodwill
The Company performs an annual review for the potential impairment of the carrying value of goodwill, or more frequently if current events and circumstances indicate a possible impairment. An impairment loss is charged to expense in the period identified. This testing includes the determination of each reporting unit’s fair value using market multiples and discounted cash flow modeling. The Company performs its annual review for goodwill impairment as of January 31st of each fiscal year.
Intangible Assets
Included within other assets at both January 31, 2010 and 2009 are certain intangible assets including capitalized software costs and customer relationships and trademarks acquired in connection with various business acquisitions. Such capitalized costs and intangibles are being amortized over a period of three to ten years.
The Company’s capitalized software has been obtained or developed for internal use only. Development and acquisition costs are capitalized for computer software only when management authorizes and commits to funding a computer software project through the approval of a capital expenditure requisition, and the software project is either for the development of new software, to increase the life of existing software or to add significantly to the functionality of existing software. Once these requirements have been met, capitalization would begin at the point that conceptual formulation, evaluation, design, and testing of possible software project alternatives have been completed. Capitalization ceases when the software project is substantially complete and ready for its intended use.
Costs of computer software developed or obtained for internal use that are capitalized include external direct costs of materials and services consumed in developing or obtaining internal-use computer software and payroll and payroll-related costs for the Company’s IT programmers performing software coding and testing activities (including development of data conversion programs) directly associated with the internal-use computer software project. Prepaid maintenance fees associated with a software application are accounted for separately from the related software and amortized over the life of the maintenance agreement. General, administrative, overhead, training, non-development data conversion processes, and maintenance costs, as well as the costs associated with the preliminary project and post-implementation stages are expensed as incurred.
The Company’s accounting policy is to amortize capitalized software costs on a straight-line basis over periods ranging from three to ten years, depending upon the nature of the software, the stability of the hardware platform on which the software is installed, its fit in the Company’s overall strategy, and our experience with similar software. It is the Company’s policy to amortize personal computer-related software, such as spreadsheet and word processing applications, over three years, which reflects the rapid changes in personal computer software. Mainframe software licenses are amortized over five years, which is in line with the longer economic life of mainframe systems compared to personal computer systems. Finally, strategic applications such as customer relationship management and enterprise-wide systems are amortized over seven to ten years based on their strategic fit and the Company’s historical experience with such applications.
Product Warranty
The Company’s vendors generally warrant the products distributed by the Company and allow the Company to return defective products, including those that have been returned to the Company by its customers. The Company does not independently warrant the products it distributes. However, in several countries where the Company operates, the Company is responsible for defective product as a matter of law. The time period required by law in certain countries exceeds the warranty period provided by the manufacturer. The Company is obligated to provide warranty protection for sales of certain IT products within the European Union (“EU”) for up to two years as required under the EU directive where vendors have not affirmatively agreed to provide pass-through
40
Table of Contents
protection. To date, the Company has not incurred any significant costs for defective products under these legal requirements. The Company does warrant services with regard to products integrated for its customers. A provision for estimated warranty costs is recorded at the time of sale and periodically adjusted to reflect actual experience. To date, the Company has not incurred any significant service warranty costs. Fees charged for products configured by the Company represented less than 10% of net sales for fiscal years 2010, 2009 and 2008.
Income Taxes
Income taxes are accounted for under the asset and liability method, which requires the recognition of deferred tax assets and liabilities for the expected future tax consequences of events that have been included in the financial statements or tax returns. Under this method, deferred tax assets and liabilities are determined based on differences between the financial statements and tax basis of assets and liabilities using enacted tax rates in effect for the year in which the differences are expected to reverse. The effect of a change in tax rates on deferred tax assets and liabilities is recognized in income in the fiscal period that includes the enactment date. Deferred taxes have not been provided on the cumulative undistributed earnings of foreign subsidiaries or the cumulative translation adjustment related to those investments because such amounts are expected to be reinvested indefinitely.
The Company’s future effective tax rates could be adversely affected by earnings being lower than anticipated in countries with lower statutory rates, changes in the relative mix of taxable income and taxable loss jurisdictions, changes in the valuation of deferred tax assets or liabilities or changes in tax laws or interpretations thereof. In addition, the Company is subject to the continuous examination of its income tax returns by the Internal Revenue Service and other tax authorities. The Company regularly assesses the likelihood of adverse outcomes resulting from these examinations to determine the adequacy of its provision for income taxes. To the extent the Company were to prevail in matters for which accruals have been established or be required to pay amounts in excess of such accruals, the Company’s effective tax rate in a given financial statement period could be materially affected.
Concentration of Credit Risk
The Company’s financial instruments which are subject to concentrations of credit risk consist primarily of cash and cash equivalents, accounts receivable and foreign currency exchange contracts. The Company’s cash and cash equivalents are deposited and/or invested with various financial institutions globally that are monitored on a regular basis by the Company for credit quality.
The Company sells its products to a large base of value-added resellers, direct marketers, retailers and corporate resellers throughout North America, Latin America and Europe. The Company performs ongoing credit evaluations of its customers and generally does not require collateral. The Company has obtained credit insurance, primarily in Europe, which insures a percentage of credit extended by the Company to certain of its customers against possible loss. The Company makes provisions for estimated credit losses at the time of sale. No single customer accounted for more than 10% of the Company’s net sales during fiscal years 2010, 2009 or 2008.
The Company also enters into foreign currency exchange contracts. In the event of a failure to honor one of these contracts by one of the banks with which the Company has contracted, the Company believes any loss would be limited to the exchange rate differential from the time the contract was executed until the time the contract was settled. The Company’s foreign currency exchange contracts are executed with various financial institutions globally that are monitored on a regular basis by the Company for credit quality.
Foreign Currency Translation
Assets and liabilities of foreign operations that operate in a local functional currency environment are translated to U.S. dollars at the exchange rates in effect at the balance sheet date, with the related translation gains or losses reported as components of accumulated other comprehensive income in shareholders’ equity. Income and expense accounts of foreign operations are translated at weighted average exchange rates during the year.
Derivative Financial Instruments
The Company faces exposure to changes in foreign currency exchange rates and interest rates. The Company reduces its exposure by creating offsetting positions through the use of derivative financial instruments in situations where there are not offsetting balances that create an economic hedge. The majority of these instruments have terms of 90 days or less. It is the Company’s policy to utilize financial instruments to reduce risk where appropriate and prohibit entering into derivative financial instruments for speculative or trading purposes.
Derivative financial instruments are marked-to-market each period with gains and losses on these contracts recorded in the Company’s Consolidated Statement of Operations within “net foreign currency exchange loss (gain)” in the period in which their value changes, with the offsetting entry for unsettled positions being recorded to either other current assets or other current liabilities.
41
Table of Contents
Comprehensive Income (Loss)
Comprehensive income (loss) is defined as the change in equity (net assets) of a business enterprise during a period from transactions and other events and circumstances from non-owner sources, and is comprised of “net income” and “other comprehensive income (loss).”
Comprehensive income attributable to the shareholders of the Company for the fiscal years ended January 31, 2010, 2009 and 2008 is as follows:
| Year ended January 31, | |||||||||
| 2010 | 2009 | 2008 | |||||||
| (In thousands) | |||||||||
| (As Adjusted – See Note 1) |
(As Adjusted – See Note 1) |
||||||||
| Comprehensive income (loss): |
|||||||||
| Consolidated net income |
$ | 181,200 | $ 115,456 | $ 98,570 | |||||
| Change in consolidated CTA account(1) |
125,285 | (237,229 | ) | 185,020 | |||||
| Total comprehensive income (loss) |
306,485 | (121,773 | ) | 283,590 | |||||
| Less – comprehensive income (loss) attributable to noncontrolling interest |
1,318 | (2,383 | ) | (3,297 | ) | ||||
| Comprehensive income (loss) attributable to shareholders of Tech Data Corporation |
$ | 305,167 | $(119,390 | ) | $286,887 | ||||
| (1) | There was no income tax effect in the fiscal years ended January 31, 2010 and 2009. Amount for the fiscal year ended January 31, 2008 is net of a $5.6 million income tax benefit. |
Comprehensive income (loss) attributable to shareholders of the Company increased significantly during the fiscal years ended January 31, 2010 and 2008, primarily as a result of the strengthening of most currencies in which the Company operates during the fiscal year in comparison to the U.S. dollar. Comprehensive income (loss) attributable to shareholders of the Company decreased significantly during the fiscal year ended January 31, 2009, as most local currencies in which the Company operates weakened during the fiscal year compared to the U.S. dollar.
The Company’s accumulated other comprehensive income (loss) included in total equity is comprised exclusively of changes in the Company’s currency translation adjustment account (“CTA account”), including income taxes attributable to those changes. Total accumulated other comprehensive income includes $23.0 million of income taxes at January 31, 2010, 2009 and 2008.
Stock-Based Compensation
The Company records all stock-based payments to employees and non-employee members of the board of directors, including grants of all employee equity incentives, in the Company’s Consolidated Statement of Operations based on their fair values determined on the date of grant. Compensation expense, reduced for estimated forfeitures, is recognized on a straight-line basis over the requisite service period of the award, which is generally the vesting term of the outstanding stock awards. The Company estimates forfeiture rates based on its historical experience during the preceding five fiscal years. Stock based compensation expense for awards granted prior to February 1, 2006, is based on the date of grant, as determined under a previous accounting standard related to equity-based instruments.
Treasury Stock
Treasury stock is accounted for at cost. The reissuance of shares from treasury stock for exercises of stock-based awards or other corporate purposes is based on the weighted average purchase price of the shares.
Cash and Cash Equivalents
Short-term investments which are highly liquid and have an original maturity of ninety days or less are considered cash equivalents.
Book overdrafts of $130.8 million and $125.2 million as of January 31, 2010 and 2009, respectively, represent checks issued that have not been presented for payment to the banks and are classified in accounts payable in the Consolidated Balance Sheet. The Company typically funds these overdrafts through transfers from separate bank accounts and under the terms of the Company’s agreements with its banks, the funding of these overdrafts is at the direction of the Company.
42
Table of Contents
Contingencies
The Company accrues for contingent obligations, including estimated legal costs, when the obligation is probable and the amount is reasonably estimable. As facts concerning contingencies become known, the Company reassesses its position and makes appropriate adjustments to the financial statements. Estimates that are particularly sensitive to future changes include those related to tax, legal and other regulatory matters such as imports and exports, the imposition of international governmental controls, changes in the interpretation and enforcement of international laws (particularly related to items such as duty and taxation), and the impact of local economic conditions and practices, which are all subject to change as events evolve and as additional information becomes available during the administrative and litigation process.
Recently Adopted Accounting Standards
In July 2009, the FASB established “The FASB Accounting Standards Codification” (the “Codification”). The Codification replaced the Hierarchy of Generally Accepted Accounting Principles (“GAAP”) and became the single source of authoritative, nongovernmental GAAP, except for rules and interpretive releases of the SEC, which are also sources of authoritative GAAP for SEC registrants. The Codification supersedes all existing non-SEC accounting and reporting standards and was effective for the Company’s quarter ended October 31, 2009. The Codification did not change or alter existing GAAP, but rather grouped existing GAAP into a topic-based model. As such, the implementation of the Codification had no impact on the Company’s consolidated financial position, results of operations or cash flows.
In April 2009, the FASB issued a new standard that requires enhanced disclosures about fair value of financial instruments for interim periods as well as in annual financial statements. The Company has adopted this standard effective July 31, 2009, which had no impact on the consolidated financial results as the requirements are only disclosure in nature (see related disclosures in Note 13 – Fair Value of Financial Instruments and Note 14 – Derivative Instruments).
In March 2008, the FASB issued a new standard requiring entities to provide greater transparency about (a) how and why an entity uses derivative instruments, (b) how derivative instruments and related hedged items are accounted for under other accounting standards and the related interpretations, and (c) how derivative instruments and related hedged items affect an entity’s financial position, results of operations and cash flows. The provisions of this standard require expanded disclosures concerning where derivatives are recorded on the consolidated balance sheet and where gains / losses are recognized in the consolidated results of operations. The Company adopted these disclosure provisions beginning with the quarter ended April 30, 2009, as discussed in Note 14 – Derivative Instruments.
In December 2007, the FASB issued a new standard establishing principles and requirements as to how an acquirer in a business combination recognizes and measures in its financial statements: the identifiable assets acquired, the liabilities assumed and any noncontrolling interest; goodwill acquired in the business combination; or a gain from a bargain purchase. This standard requires the acquirer to record contingent consideration at the estimated fair value at the time of purchase and establishes principles for treating subsequent changes in such estimates which could affect earnings in those periods. This standard also requires additional disclosure designed to enable users of the financial statements to evaluate the nature and financial effects of the business combination and disallows the capitalization of acquisition costs. In April 2009, the FASB issued an amendment to this standard to clarify the initial and subsequent accounting disclosures of contingencies in a business combination. The Company adopted this standard effective February 1, 2009, and has applied the provisions of this standard and the amendment prospectively to business combinations made by the Company subsequent to January 31, 2009.
Recently Issued Accounting Standards
In October 2009, the FASB issued an accounting standard requiring an entity to allocate revenue arrangement consideration at the inception of a multiple-element revenue arrangement to all deliverables based on their relative selling prices. This accounting is effective for revenue arrangements entered into or materially modified by the Company beginning February 1, 2011, with early adoption permitted. The Company is currently in the process of assessing what impact this standard may have on its consolidated financial position, results of operations or cash flows.
In October 2009, the FASB issued an accounting standard addressing how entities account for revenue arrangements that contain both hardware and software elements. Due to the significant difference in the level of evidence required for separation of multiple deliverables within different accounting standards, this particular accounting standard will modify the scope of accounting guidance for software revenue recognition. Many tangible products containing software and non software components that function together to deliver the tangible products’ essential functionality will be accounted for under the revised multiple-element revenue arrangement recognition guidance disclosed above. This accounting standard is effective for revenue arrangements entered into or materially modified by the Company beginning February 1, 2011 with early adoption permitted. The Company is currently in the process of assessing what impact this new standard may have on its consolidated financial position, results of operations or cash flows.
43
Table of Contents
In June 2009, the FASB issued an accounting standard limiting the circumstances in which a financial asset may be derecognized when the transferor has not transferred the entire financial asset or has continuing involvement with the transferred asset. The concept of a qualifying special-purpose entity, which had previously facilitated sale accounting for certain asset transfers, is removed by this standard. The new standard is effective for the Company beginning February 1, 2010 and early application is prohibited. The adoption of this standard did not have an impact on the Company’s consolidated financial position, results of operations or cash flows.
In June 2009, the FASB issued an accounting standard which amends the accounting for variable interest entities (“VIEs”) and changes the process as to how an enterprise determines which party consolidates a VIE. This accounting standard also defines the party that consolidates the VIE (the primary beneficiary) as the party with (1) the power to direct activities of the VIE that most significantly affect the VIE’s economic performance and (2) the obligation to absorb losses of the VIE or the right to receive benefits from the VIE. Upon adoption of this accounting standard, the reporting enterprise must reconsider its conclusions on whether an entity should be consolidated, and should a change result, the effect on its net assets will be recorded as a cumulative effect adjustment to retained earnings. This accounting standard will be effective for the Company beginning February 1, 2010 and early application is prohibited. The adoption of this standard did not have an impact on the Company’s consolidated financial position, results of operations or cash flows.
Reclassifications
Certain reclassifications have been made to the January 31, 2009 and 2008 financial statements to conform to the January 31, 2010 financial statement presentation. These reclassifications did not change previously reported total assets, liabilities and shareholders’ equity or net income.
NOTE 2 — EARNINGS PER SHARE (“EPS”)
The Company reports a dual presentation of basic and diluted EPS. Basic EPS is computed by dividing net income attributable to shareholders of Tech Data Corporation by the weighted average number of shares outstanding during the reported period. Diluted EPS reflects the potential dilution related to equity-based incentives (further discussed in Note 11—Employee Benefit Plans) using the if-converted and treasury stock methods, as applicable. The composition of basic and diluted EPS is as follows:
| Year ended January 31, 2010 | Year ended January 31, 2009 | Year ended January 31, 2008 | ||||||||||||||||||||||
| Net income |
Weighted average shares |
Per share amount |
Net income |
Weighted average shares |
Per share amount |
Net income |
Weighted average shares |
Per share amount | ||||||||||||||||
| (In thousands, except per share data) | ||||||||||||||||||||||||
| (As Adjusted - See Note 1) | (As Adjusted - See Note 1) | |||||||||||||||||||||||
| Net income per common share-attributable to shareholders of Tech Data Corporation - basic |
$ | 180,155 | 50,517 | $ | 3.57 | $ | 117,278 | 51,276 | $ | 2.29 | $ | 102,129 | 54,904 | $ | 1.86 | |||||||||
| Effect of dilutive securities: |
||||||||||||||||||||||||
| Equity-based awards |
— | 421 | — | 222 | — | 383 | ||||||||||||||||||
| Net income per common share attributable to shareholders of Tech Data Corporation - diluted |
$ | 180,155 | 50,938 | $ | 3.54 | $ | 117,278 | 51,498 | $ | 2.28 | $ | 102,129 | 55,287 | $ | 1.85 | |||||||||
At January 31, 2010, 2009 and 2008, there were 2,421,279, 5,589,592 and 6,017,838 shares, respectively, excluded from the computation of diluted earnings per share because their effect would have been anti-dilutive.
44
Table of Contents
In December 2006, the Company issued $350.0 million of convertible senior debentures due 2026. The dilutive impact of the $350.0 million convertible senior debentures does not impact earnings per share at January 31, 2010, 2009 or 2008, as the conditions for the contingent conversion feature have not been met (see further discussion in Note 9—Long-Term Debt).
45
Table of Contents
NOTE 3 — PROPERTY AND EQUIPMENT, NET
| January 31, | ||||||||
| 2010 | 2009 | |||||||
| (In thousands) | ||||||||
| Land |
$ | 5,002 | $ | 6,594 | ||||
| Buildings and leasehold improvements |
73,562 | 76,607 | ||||||
| Furniture, fixtures and equipment |
316,645 | 293,212 | ||||||
| 395,209 | 376,413 | |||||||
| Less accumulated depreciation |
(304,575 | ) | (273,476 | ) | ||||
| $ | 90,634 | $ | 102,937 | |||||
Depreciation expense, including amortization expense of assets recorded under capital leases, included in income for the years ended January 31, 2010, 2009 and 2008 totaled $23.8 million, $28.5 million and $29.8 million, respectively. The Company has property and equipment leased under capital leases for the German logistics center, which was vacated during fiscal 2008 (see further discussion at Note 7 – Restructuring Programs).
NOTE 4 — GOODWILL AND INTANGIBLE ASSETS
The Company’s goodwill balance of $17.0 million and $14.6 million at January 31, 2010 and 2009, respectively, is included within “other assets, net” in the Consolidated Balance Sheet. Approximately $14.1 million and $11.6 million of the goodwill at January 31, 2010 and 2009, respectively, is due to the acquisition of certain assets of Scribona AB (“ Scribona”) (see also Note 5 – Acquisitions).
In conjunction with the Company’s annual impairment testing, the Company’s goodwill was tested for impairment as of January 31, 2010. The impairment testing included a determination of the fair value of the Company’s reporting units, which are also the Company’s operating segments, using market multiples and discounted cash flows modeling. The results of the testing, which reflected the continuing improvement in the Company’s European operations, indicated that the fair value of the Company’s reporting units was greater than the carrying value of the Company’s reporting units, including goodwill. As a result, no goodwill impairment was recorded at January 31, 2010.
Also included within “other assets, net” are intangible assets as follows:
| January 31, 2010 | January 31, 2009 | |||||||||||||||
| Gross carrying amount |
Accumulated amortization |
Net book value |
Gross carrying amount |
Accumulated amortization |
Net book value | |||||||||||
| (In thousands) | (In thousands) | |||||||||||||||
| Capitalized software and development costs |
$ | 265,789 | $189,660 | $ | 76,129 | $ | 241,402 | $165,070 | $ | 76,332 | ||||||
| Customer relationships |
30,743 | 19,718 | 11,025 | 35,333 | 27,174 | 8,159 | ||||||||||
| Trademarks |
240 | 100 | 140 | 7,912 | 7,742 | 170 | ||||||||||
| Other intangible assets |
2,412 | 2,291 | 121 | 2,077 | 1,521 | 556 | ||||||||||
| Total |
$ | 299,184 | $211,769 | $ | 87,415 | $ | 286,724 | $201,507 | $ | 85,217 | ||||||
46
Table of Contents
The Company capitalized intangible assets of $19.1 million, $24.6 million and $18.4 million for the years ended January 31, 2010, 2009 and 2008, respectively. These capitalized assets related primarily to software and software development expenditures to be used in the Company’s operations and customer relationships acquired with the acquisition of Scribona assets in fiscal 2009 (see also Note 5 — Acquisitions). There was no interest capitalized during the fiscal years ended January 31, 2010, 2009 and 2008.
The weighted average amortization period for all intangible assets capitalized during fiscal 2010 approximated six years and for both fiscal 2009 and 2008, approximately five years. The weighted average amortization period of all intangible assets was approximately six years for fiscal 2010 and 2009 and seven years for fiscal 2008.
Amortization expense resulting primarily from capitalized software and development costs and customer relationships, for the years ended January 31, 2010, 2009 and 2008 totaled $22.2 million, $22.7 million and $24.1 million, respectively. Estimated amortization expense of currently capitalized costs for intangible assets placed in service is as follows (in thousands):
| Fiscal year: |
|||
| 2011 |
$ | 20,200 | |
| 2012 |
17,400 | ||
| 2013 |
15,000 | ||
| 2014 |
10,800 | ||
| 2015 |
7,200 |
NOTE 5 — ACQUISITIONS
Throughout fiscal 2010, the Company made several business acquisitions in the European distribution marketplace. Although these acquisitions did not have a significant impact on the Company’s consolidated results of operations during fiscal 2010, they will further diversify the Company’s product and customer portfolio while leveraging the Company’s existing infrastructure in Europe.
In May 2008, the Company completed the acquisition of certain assets of Scribona, AB, a publicly-traded IT distribution company in the Nordic region of Europe, with operations in Sweden, Finland and Norway (“Scribona”). The acquisition expands the Company’s presence and leverages the Company’s infrastructure in the Nordic region of Europe. In conjunction with the acquisition, the Company paid approximately $78.3 million in cash (based on the foreign currency exchange rates on the date of the payments) for the net value of the acquired assets, including inventory and certain other assets, and the assumption of certain liabilities. The purchase price has been allocated to the assets acquired and liabilities assumed based on their estimated fair values on the acquisition date, including $9.4 million for customer relationships with estimated useful lives of seven years and $15.4 million of goodwill (using exchange rates on the date of acquisition). During the fiscal year ended January 31, 2009, the Company completed the integration of Scribona and recognized $7.6 million of integration costs, primarily associated with customer transition, relocation initiatives, consulting and other integration activities related to the acquisition, which are included in “selling, general and administrative expenses” in the Consolidated Statement of Operations. The operating results from the acquisition of certain assets of Scribona have been included in the Company’s consolidated results of operations subsequent to the date of acquisition.
NOTE 6 — LOSS ON DISPOSAL OF SUBSIDIARIES
The Company’s fiscal 2008 loss on disposal of subsidiaries is the result of the Company’s decision to exit its operations in Israel and the United Arab Emirates (“UAE”) as part of its ongoing initiatives to optimize profitability and return on capital employed.
During the fiscal year ended January 31, 2008, the Company ceased operations in the UAE and recorded a loss on disposal of this subsidiary of $10.8 million, which is included in the Consolidated Statement of Operations as “loss on disposal of subsidiaries”. The loss on disposal includes a $9.8 million impairment on the Company’s investment in the UAE due to a foreign currency exchange loss (previously recorded in shareholders’ equity as accumulated other comprehensive income) and $1.0 million for severance costs and fixed asset write-offs. In addition, the UAE incurred operating losses of approximately $0.9 million during the year ended January 31, 2008, comprised primarily of inventory write-downs and occupancy-related expenses.
During the fiscal year ended January 31, 2008, the Company also sold the Company’s Israel operations at an amount approximating local currency net book value. In connection with this agreement, the Company recorded a loss on disposal of this subsidiary of $3.7 million, which includes a $2.7 million impairment on the Company’s investment in Israel due to a foreign currency exchange loss (previously recorded in shareholders’ equity as accumulated other comprehensive income) and $1.0 million for costs related to the sale. These costs are reflected in the Consolidated Statement of Operations as “loss on disposal of subsidiaries”. Israel had an operating loss of $0.1 million during fiscal 2008 through the date of closing.
47
Table of Contents
NOTE 7 — RESTRUCTURING PROGRAMS
The Company’s restructuring charges discussed below were incurred pursuant to formal plans developed by management and the costs related to these restructuring programs are reflected in the Consolidated Statement of Operations as “restructuring charges”, which is a component of operating income. The accrued restructuring charges are included in “accrued expenses and other liabilities” in the Consolidated Balance Sheet.
Closure of European Logistics Center
In May, 2007, the Company’s Board of Directors approved the exit from our logistics center in Germany (the “Moers logistics center”) to enable the Company to capitalize on the long-term synergies of having one logistics center serving Germany, Austria and the Czech Republic. In connection with this closure, during fiscal 2008, the Company recorded $18.1 million in restructuring charges, comprised of $8.7 million of workforce reductions and $9.4 million for facility costs and other fixed asset write-offs. During fiscal 2009, the Company executed an agreement for the sublease of the Moers logistics center, which has a remaining balance of $8.6 million and $7.6 million, respectively, included in “other assets, net” within the Consolidated Balance Sheet at January 31, 2010 and 2009.
European Restructuring Program
In May 2005, the Company announced a formal restructuring program to better align the European operating cost structure with the business environment prevailing at the time, which was completed during the third quarter of fiscal 2007. In connection with this restructuring program, the Company recorded charges for workforce reductions and the optimization of facilities and systems. During the fiscal year ended January 31, 2008, the Company recorded credits of $2.0 million related to changes in estimates of previously recorded restructuring accruals. Through January 31, 2008 (since inception of the program), the Company incurred $52.7 million in charges related to the restructuring program, comprised of $38.5 million for workforce reductions and $14.2 million for facility costs. No additional adjustments were recorded during fiscal 2010 or 2009.
NOTE 8 — REVOLVING CREDIT LOANS
| January 31, | ||||||
| 2010 | 2009 | |||||
| (In thousands) | ||||||
| Receivables Securitization Program, interest rate of 1.35% and 2.25% at January 31, 2010 and 2009, expiring October 2010 |
$ | — | $ | — | ||
| Multi-currency Revolving Credit Facility, interest rate of 0.86% and 1.05% at January 31, 2010 and 2009, expiring March 2012 |
— | — | ||||
| Uncommitted revolving credit facilities, average interest rate of 3.62% and 4.33% at January 31, 2010 and 2009, expiring on various dates throughout fiscal 2011 |
32,366 | 48,096 | ||||
| Interest-free revolving credit loan payable to Brightstar Corporation |
33,018 | 9,810 | ||||
| $ | 65,384 | $ | 57,906 | |||
The Company has an agreement (the “Receivables Securitization Program”) with a syndicate of banks that allows the Company to transfer an undivided interest in a designated pool of U.S. accounts receivable, on an ongoing basis, to provide security or collateral for borrowings up to a maximum of $150.0 million. Under this program, which was amended in October 2009, the Company legally isolates certain U.S. trade receivables into a wholly-owned bankruptcy remote special purpose entity. Such receivables, which are recorded in the Consolidated Balance Sheet, totaled $487.8 million and $439.9 million at January 31, 2010 and 2009, respectively. As collections reduce accounts receivable balances included in the pool, the Company may transfer interests in new receivables to bring the amount available to be borrowed up to the maximum. The Company pays interest on advances under the Receivables Securitization Program at designated commercial paper rates plus an agreed-upon margin. In addition, the Company is required to pay a commitment fee of. 50% per annum on the unused portion of the Receivables Securitization Program.
Under the terms of the Company’s Multi-currency Revolving Credit Facility with a syndicate of banks, the Company is able to borrow funds in major foreign currencies up to a maximum of $250.0 million. Under this facility, which expires in March 2012, the Company has provided either a pledge of stock or a guarantee of certain of its significant subsidiaries. The Company pays interest on advances under this facility at the applicable LIBOR rate plus a margin based on the Company’s credit ratings. The Company can fix the interest rate for periods of seven to 180 days under various interest rate options. In addition, the Company is required to pay a commitment fee of .125% per annum on the unused portion of the Multi-currency Revolving Credit Facility.
48
Table of Contents
In addition to the facilities described above, the Company has uncommitted lines of credit and overdraft facilities totaling approximately $519.5 million at January 31, 2010 to support its operations. Most of these facilities are provided on an unsecured, short-term basis and are reviewed periodically for renewal.
The total capacity of the aforementioned credit facilities was approximately $919.5 million, of which $32.4 million was outstanding at January 31, 2010. The Company’s credit agreements contain limitations on the amounts of annual dividends and repurchases of common stock. Additionally, the credit agreements require compliance with certain warranties and covenants. The financial ratio covenants contained within the credit agreements include a debt to capitalization ratio, an interest to EBITDA (as defined per the credit agreements) ratio and a tangible net worth requirement. At January 31, 2010, the Company was in compliance with all such covenants. The ability to draw funds under these credit facilities is dependent upon sufficient collateral (in the case of the Receivables Securitization Program) and meeting the aforementioned financial covenants, which may limit the Company’s ability to draw the full amount of these facilities. As of January 31, 2010, the total maximum amount that could be borrowed under these facilities, in consideration of the availability of collateral and the financial covenants, was approximately $919.5 million.
The Company also has an interest-free revolving credit loan from Brightstar Corporation (“Brightstar”) that was issued in connection with the Company’s joint venture. This revolving credit loan from Brightstar has no contractual repayment date and will increase or decrease in accordance with the working capital requirements of the joint venture, as determined by the Company.
At January 31, 2010, the Company had issued standby letters of credit of $34.4 million. These letters of credit typically act as a guarantee of payment to certain third parties in accordance with specified terms and conditions. The issuance of these letters of credit reduces the Company’s available capacity under the above-mentioned facilities by the same amount.
NOTE 9 — LONG-TERM DEBT
| January 31, | |||||||
| 2010 | 2009 | ||||||
| (In thousands) | |||||||
| (As Adjusted – See Note 1) |
|||||||
| Convertible senior debentures, interest at 2.75% payable semi-annually, due December 2026 |
$ | 350,000 | $350,000 | ||||
| Less—unamortized debt discount |
(19,274 | ) | (29,552 | ) | |||
| Convertible senior debentures, net |
330,726 | 320,448 | |||||
| Capital leases |
7,907 | 11,767 | |||||
| 338,633 | 332,215 | ||||||
| Less—current maturities (included in “accrued expenses and other liabilities”) |
(476 | ) | (982 | ) | |||
| Total |
$ | 338,157 | $331,233 | ||||
49
Table of Contents
In December 2006, the Company issued $350.0 million of convertible senior debentures due 2026. The debentures bear interest at 2.75% per year. The Company pays interest on the debentures on June 15 and December 15 of each year. In addition, beginning with the period commencing on December 20, 2011 and ending on June 15, 2012 and for each six-month period thereafter, the Company will pay contingent interest on the interest payment date for the applicable interest period if the market price of the debentures equals specified levels. The convertible senior debentures are convertible into the Company’s common stock and cash, anytime after June 15, 2026, or i) if the market price of the common stock, as defined, exceeds 135% of the conversion price per share of common stock or ii) if the Company calls the debentures for redemption or iii) upon occurrence of certain corporate transactions, as defined. Holders have the right to convert the debentures into cash and shares of the Company’s common stock, if any, at a conversion rate of 18.4310 shares per $1,000 principal amount of debentures, equivalent to a conversion price of approximately $54.26 per share. Upon conversion, the Company will deliver cash equal to the lesser of the aggregate principal amount of the debentures to be converted and the Company’s total conversion obligation and shares of the Company’s common stock in respect of the remainder, if any, of the Company’s conversion obligation. Holders have the option to require the Company to repurchase the debentures in cash on any of the fifth, tenth or fifteenth anniversary dates from the issue date at 100% of the principal amount plus accrued interest to the repurchase date. The debentures are redeemable in whole or in part for cash at the Company’s option at any time on or after December 20, 2011. Additionally, the debentures are senior, unsecured obligations and rank equally in right of payment with all of the Company’s other unsecured and unsubordinated indebtedness. The debentures are effectively subordinated to all of the Company’s existing and future secured debt and are structurally subordinated to the indebtedness and other liabilities of the Company’s subsidiaries.
As previously discussed in Note 1—Business and Summary of Significant Accounting Policies, the provisions of a new accounting standard for convertible debt instruments requiring or permitting partial cash settlement upon conversion were effective for the Company’s fiscal year beginning February 1, 2009 and required retrospective application of all periods presented. The Company concluded that this new standard is applicable to the Company’s $350.0 million convertible senior debentures issued in December 2006 and has accounted for the debt and equity components of the debentures in a manner that reflects the estimated nonconvertible debt borrowing rate at the date of the issuance of the debentures of 6.30%. At January 31, 2010, the if-converted value of the convertible senior debentures did not exceed the principal balance. At January 31, 2010, the $19.3 million unamortized debt discount has a remaining amortization period of approximately 23 months assuming redemption of the debentures at the first repurchase date of December 20, 2011. During each of the years ended January 31, 2010, 2009 and 2008, the Company has recorded contractual interest expense of $9.6 million and non-cash interest expense of $10.3 million resulting from the retrospective adoption of the new accounting treatment related to the $350 million convertible senior debentures.
Future payments of long-term debt and capital leases at January 31, 2010 and for succeeding fiscal years, which assumes the $350 million convertible senior debentures will be redeemed on the first redemption date of December 20, 2011, are as follows (in thousands):
| Fiscal year: |
||||
| 2011 |
$ | 875 | ||
| 2012 |
350,875 | |||
| 2013 |
875 | |||
| 2014 |
875 | |||
| 2015 |
875 | |||
| Thereafter |
4,910 | |||
| Total payments |
359,285 | |||
| Less amounts representing interest on capital leases |
(1,378 | ) | ||
| Total principal payments |
$ | 357,907 | ||
NOTE 10 — INCOME TAXES
The Company accounts for income taxes under the asset and liability method, which requires the recognition of deferred tax assets and liabilities for the expected future tax consequences of events that have been included in the financial statements. The Company performs an evaluation of the realizability of the Company’s deferred tax assets on a quarterly basis. This evaluation considers all positive and negative evidence and factors, such as the scheduled reversal of temporary differences,
50
Table of Contents
historical and projected future taxable income, and prudent and feasible tax planning strategies. The estimates and assumptions used by the Company in computing the income taxes reflected in the Company’s consolidated financial statements could differ from the actual results reflected in the income tax returns filed during the subsequent year. Adjustments are recorded based on filed returns when such returns are finalized or the related adjustments are identified.
Effective February 1, 2007, the Company adopted an accounting standard which clarifies the accounting for uncertainty in income taxes recognized in the financial statements and prescribes a recognition threshold and measurement attribute for the financial statement recognition and measurement of a tax position taken or expected to be taken in a tax return. The accounting standard also provides guidance on derecognition, classification, interest and penalties, accounting in interim periods, disclosure and transition. The adoption of this accounting standard on February 1, 2007, resulted in the reduction of the Company’s consolidated beginning retained earnings of $1.1 million.
Significant components of the provision for income taxes are as follows:
| Year ended January 31, | ||||||||||
| 2010 | 2009 | 2008 | ||||||||
| (In thousands) (As Adjusted - |
(As Adjusted - See Note 1) |
|||||||||
| Current: |
||||||||||
| Federal |
$ | 27,431 | $20,100 | $31,857 | ||||||
| State |
916 | 1,265 | 1,633 | |||||||
| Foreign |
28,134 | 22,731 | 25,136 | |||||||
| Total current |
56,481 | 44,096 | 58,626 | |||||||
| Deferred: |
||||||||||
| Federal |
2,403 | 13,472 | 8,884 | |||||||
| State |
538 | (401 | ) | (286 | ) | |||||
| Foreign |
(5,482 | ) | 5,150 | (5,969 | ) | |||||
| Total deferred |
(2,541 | ) | 18,221 | 2,629 | ||||||
| $ | 53,940 | $62,317 | $61,255 | |||||||
The reconciliation of income tax computed at the U.S. federal statutory tax rate to income tax expense for continuing operations is as follows:
| Year ended January 31, | |||||||||
| 2010 | 2009 | 2008 | |||||||
| (As Adjusted - See Note 1) |
(As Adjusted- See Note 1) |
||||||||
| U.S. statutory rate |
35.0 | % | 35.0 | % | 35.0 | % | |||
| State income taxes, net of federal benefit |
0.5 | 0.4 | 0.8 | ||||||
| Changes in valuation allowance |
(3.3 | ) | 15.8 | 18.3 | |||||
| Tax on foreign earnings different than U.S. rate |
(9.7 | ) | (18.0 | ) | (19.3 | ) | |||
| Nondeductible interest |
3.0 | 2.9 | 1.9 | ||||||
| Reserves established for foreign income tax contingencies |
0.1 | 1.1 | 2.1 | ||||||
| Reversal of previously accrued income taxes |
(1.4 | ) | (5.7 | ) | (0.7 | ) | |||
| Effect of company-owned life insurance |
(1.0 | ) | 1.9 | 0.1 | |||||
| Other—net |
(0.3 | ) | 1.7 | 0.1 | |||||
| 22.9 | % | 35.1 | % | 38.3 | % | ||||
In fiscal 2010, an income tax benefit of $5.4 million was recognized for the reversal of a valuation allowance on deferred tax assets related to a specific European jurisdiction, which was recorded in prior fiscal years. In fiscal 2009, $10.7 million of previously accrued income taxes were reversed due to statute expirations and the resolution of income tax examinations. Included in the changes in the valuation allowance for fiscal 2008 is an income tax benefit of $7.5 million for the reversal of a valuation allowance on deferred tax assets related to Brazil, which was recorded in prior fiscal years.
51
Table of Contents
The components of pretax income are as follows:
| Year ended January 31, | |||||||
| 2010 | 2009 | 2008 | |||||
| (In thousands) | |||||||
| (As Adjusted - See Note 1) |
(As Adjusted - See Note 1) | ||||||
| United States |
$ | 92,551 | $ 88,043 | $117,454 | |||
| Foreign |
142,589 | 89,730 | 42,371 | ||||
| $ | 235,140 | $177,773 | $159,825 | ||||
Significant components of the Company’s deferred tax liabilities and assets are as follows:
| January 31, | ||||||||
| 2010 | 2009 | |||||||
| (In thousands) | ||||||||
| (As Adjusted - See Note 1) |
||||||||
| Deferred tax liabilities: |
||||||||
| Depreciation and amortization |
$ | 29,290 | $ 28,202 | |||||
| Capitalized marketing program costs |
2,977 | 4,530 | ||||||
| Convertible senior debentures interest |
24,714 | 23,246 | ||||||
| Goodwill |
1,999 | 919 | ||||||
| Deferred costs currently deductible |
14,651 | 18,692 | ||||||
| Other, net |
3,662 | 2,128 | ||||||
| Total deferred tax liabilities |
77,293 | 77,717 | ||||||
| Deferred tax assets: |
||||||||
| Accrued liabilities |
41,348 | 43,079 | ||||||
| Loss carryforwards |
145,941 | 158,733 | ||||||
| Amortizable goodwill |
22,692 | 11,560 | ||||||
| Depreciation and amortization |
6,261 | 3,783 | ||||||
| Disallowed interest expense |
16,286 | 9,166 | ||||||
| Other, net |
12,968 | 7,019 | ||||||
| 245,496 | 233,340 | |||||||
| Less: valuation allowance |
(185,929 | ) | (175,752 | ) | ||||
| Total deferred tax assets |
59,567 | 57,588 | ||||||
| Net deferred tax (liability) asset |
$ | (17,726 | ) | $ | (20,129 | ) | ||
The net change in the deferred income tax valuation allowance was an increase of $10.2 million in fiscal 2010, a decrease of $6.7 million in fiscal 2009 and a decrease of $4.6 million in fiscal 2008. The valuation allowance at January 31, 2010 and 2009 primarily relates to foreign net operating loss carryforwards of $747.0 million and $764.3 million, respectively. The majority of the net operating losses have an indefinite carryforward period with the remaining portion expiring in fiscal years 2011 through 2024. The Company evaluates a variety of factors in determining the realizability of deferred tax assets, including the scheduled reversal of temporary differences, projected future taxable income, and prudent and feasible tax planning strategies.
To the extent that the Company generates consistent taxable income within those operations requiring a valuation allowance, the Company may reduce the valuation allowance, thereby reducing the income tax expense and increasing net income in the same period. The underlying net operating loss carryforwards remain available to offset future taxable income in the specific jurisdictions requiring a valuation allowance, subject to applicable tax laws and regulations.
At January 31, 2010, there are no consolidated cumulative undistributed earnings of foreign subsidiaries. It is not currently practical to estimate the amount of unrecognized deferred U.S. income tax that might be payable if any earnings were to be distributed by individual foreign subsidiaries.
52
Table of Contents
A reconciliation of the beginning and ending balances of the total amount of gross unrecognized tax benefits, excluding accrued interest and penalties, for the years ended January 31, 2010 and 2009 is as follows (in thousands):
| Gross unrecognized tax benefits at February 1, 2007 |
$ | 10,481 | ||
| Increases in tax positions for prior years |
5,137 | |||
| Increases in tax positions for current year |
3,132 | |||
| Expiration of statutes of limitation |
(359 | ) | ||
| Changes due to translation of foreign currencies |
1,190 | |||
| Gross unrecognized tax benefits at January 31, 2008 |
19,581 | |||
| Increases in tax positions for prior years |
1,748 | |||
| Increases in tax positions for current year |
78 | |||
| Expiration of statutes of limitation |
(9,426 | ) | ||
| Settlements |
(5,262 | ) | ||
| Changes due to translation of foreign currencies |
(2,056 | ) | ||
| Gross unrecognized tax benefits at January 31, 2009 |
4,663 | |||
| Increases in tax positions for current year |
1,071 | |||
| Expiration of statutes of limitation |
(2,770 | ) | ||
| Settlements |
(223 | ) | ||
| Changes due to translation of foreign currencies |
366 | |||
| Gross unrecognized tax benefits at January 31, 2010 |
$ | 3,107 | ||
At January 31, 2010, 2009 and 2008, the amount of unrecognized tax benefits that, if recognized, would impact the effective tax rate was $3.1 million, $4.7 and $12.0 million, respectively.
Unrecognized tax benefits that have a reasonable possibility of significantly decreasing within the 12 months following January 31, 2010 totaled $1.5 million and were primarily related to the foreign taxation of certain transactions. Consistent with prior periods, the Company recognizes interest and penalties related to unrecognized tax benefits in the provision for income taxes. The Company has accrued interest of $0.2 million at January 31, 2010, all of which would impact the effective tax rate if reversed. The provision for income taxes for the fiscal years ended January 31, 2010, 2009 and 2008 includes interest expense of $0.2 million, $0.5 million and $1.0 million, respectively, on unrecognized income tax benefits for current and prior years. The change in the balance of accrued interest for fiscal 2010, 2009 and fiscal 2008 includes the current year end accrual, an interest benefit resulting from the expiration of statutes of limitation, and the translation adjustments on foreign currencies.
The Company conducts business primarily in the Americas and Europe and, as a result, one or more of its subsidiaries files income tax returns in the U.S. federal, various state, local and foreign tax jurisdictions. In the normal course of business, the Company is subject to examination by taxing authorities. The Company is no longer subject to examinations by the Internal Revenue Service for years before fiscal 2007. Income tax returns of various foreign jurisdictions for fiscal 2004 and forward are currently under taxing authority examination or remain subject to audit.
NOTE 11 — EMPLOYEE BENEFIT PLANS
Overview of Equity Incentive Plans
At January 31, 2010, the Company had awards outstanding from five equity-based compensation plans, only one of which is currently active. The active plan was approved by the Company’s shareholders in June 2009 and includes 4.0 million shares available for grant, of which approximately 3.8 million shares remain available for future grant at January 31, 2010. Under the active plan, the Company is authorized to award officers, employees, and non-employee members of the Board of Directors restricted stock, options to purchase common stock, maximum value stock-settled stock appreciation rights (“MV Stock-settled SARs”), maximum value options (“MVOs”), and performance awards that are dependent upon achievement of specified performance goals. Equity-based compensation awards have a maximum term of 10 years, unless a shorter period is specified by the Compensation Committee of the Board of Directors or is required under local law. Awards under the plans are priced as determined by the Compensation Committee and under the terms of the Company’s active equity-based compensation plan are required to be priced at, or above, the fair market value of the Company’s common stock on the date of grant. Awards generally vest between one and four years from the date of grant.
For the fiscal years ended January 31, 2010, 2009 and 2008, the Company recorded $11.2 million, $12.0 million and $10.3 million, respectively, of stock-based compensation expense, which is included in “selling, general and administrative expenses” in the Consolidated Statement of Operations. Cash received from equity-based incentives exercised during the fiscal years ended January 31, 2010, 2009 and 2008 was $38.0 million, $1.0 million and $12.5 million, respectively, and the actual benefit received from the tax deduction from the exercise of equity-based incentives was $1.9 million, $0.6 million and $1.1 million, respectively, for the fiscal years ended January 31, 2010, 2009 and 2008.
53
Table of Contents
Restricted Stock
The Company’s restricted stock awards are primarily in the form of restricted stock units (“RSUs”) and typically vest annually over four years, unless mandated by country law. All of the restricted stock awards have a fair market value equal to the closing price of the Company’s common stock on the date of grant. Stock-based compensation expense includes $7.4 million, $7.5 million and $4.9 million for the vesting of RSUs during fiscal 2010, 2009 and 2008, respectively.
A summary of the status of the Company’s restricted stock activity for the fiscal year ended January 31, 2010 is as follows:
| Shares | Weighted- average grant date fair value | ||||
| Outstanding at January 31, 2009 |
622,678 | $35.81 | |||
| Granted |
178,041 | 31.11 | |||
| Vested |
(251,291 | ) | 37.44 | ||
| Canceled |
(53,588 | ) | 34.17 | ||
| Outstanding at January 31, 2010 |
495,840 | 33.47 | |||
The total fair value of restricted stock which vested during the fiscal years ended January 31, 2010, 2009 and 2008 is $9.4 million, $4.6 million, and $0.8 million, respectively. As of January 31, 2010, the unrecognized stock-based compensation expense related to non-vested RSUs was $14.7 million, which the Company expects to be recognized over the next four years (over a remaining weighted average period of three years).
The Company granted 351,715 shares and 205,547 shares of restricted stock in fiscal 2009 and fiscal 2008 with a weighted average grant price of $32.95 and $35.74, respectively.
MV Stock-settled SARs, MVOs and Stock Options
MV Stock-settled SARs and MVOs are similar to traditional stock options, except these instruments contain a predetermined cap on the maximum earnings potential a recipient can expect to receive upon exercise. In addition, upon exercise, holders of an MV Stock-settled SAR will only receive shares with a value equal to the spread (the difference between the current market price per share of the Company’s common stock subject to the predetermined cap and the grant price). The grant price of the MV Stock-settled SARs and MVOs is determined using the last sale price of the Company’s common stock as quoted on the NASDAQ on the date of grant (or such higher price as may be required by applicable laws and regulations of specific foreign jurisdictions). The other terms of the awards (i.e., vesting schedule, contractual term, etc.) are not materially different from the terms of traditional stock options previously granted by the Company.
A summary of the status of the Company’s MV Stock-settled SARs, MVOs and stock options activity for the fiscal year ended January 31, 2010 is as follows:
| Shares | Weighted- average exercise price |
Weighted- Average remaining contractual term (in years) |
Aggregate intrinsic value (in thousands) | |||||||
| Outstanding at January 31, 2009 |
5,189,094 | $36.46 | ||||||||
| Granted |
798,554 | 22.04 | ||||||||
| Exercised |
(2,321,352 | ) | 33.27 | |||||||
| Canceled |
(299,398 | ) | 36.58 | |||||||
| Outstanding at January 31, 2010 |
3,366,898 | 34.74 | 5.4 | $ | 22,176 | |||||
| Vested and expected to vest at January 31, 2010 |
3,304,084 | 34.96 | 5.4 | $ | 21,037 | |||||
| Exercisable at January 31, 2010 |
2,251,011 | 38.69 | 4.0 | $ | 6,554 | |||||
No MV Stock-settled SARS or MVOs were issued during the fiscal year ended January 31, 2009. During the fiscal year ended January 31, 2008, the Company’s Board of Directors approved the issuance of 0.2 million of MV Stock-settled SARs with a weighted average exercise price of $35.44.
54
Table of Contents
Stock-based compensation expense includes $3.8 million, $4.5 million and $5.3 million for the vesting of Stock-settled SARS and MVOs during fiscal 2010, 2009 and 2008, respectively.
The aggregate intrinsic value in the table above represents the difference between the closing price of the Company’s common stock on January 31, 2010 and the grant price for all “in-the-money” options at January 31, 2010. The intrinsic value of the equity-based awards changes based on the fair market value of the Company’s common stock. The intrinsic value of the MV Stock-settled SARs, MVO and stock option awards exercised during the fiscal year ended January 31, 2010, 2009 and 2008 was $19.7 million, $0.4 million and $6.6 million, respectively. As of January 31, 2010, the Company expects $7.9 million of total unrecognized compensation cost related to MV Stock-settled SARs, MVOs and stock options to be recognized over the next four fiscal years (over a weighted-average period of two years). The total fair value of MV Stock-settled SARs, MVOs and stock options which vested during the fiscal year ended January 31, 2010, 2009 and 2008 was $6.1 million, $9.2 million and $8.3 million, respectively.
The Company has elected to use the Hull-White Lattice (binomial) and Black-Scholes option-pricing models to determine the fair value of MV Stock-settled SARs and MVO awards. The Company used the Black-Scholes option-pricing model for awards granted prior to fiscal 2006. Both the Hull-White Lattice and Black-Scholes option–pricing models incorporate various assumptions including expected volatility, expected life and risk-free interest rates, while the Hull-White Lattice model also incorporates a suboptimal exercise factor (“SEF”) assumption. The Company calculates expected volatility using an equal blend of the historical volatility of the Company’s common stock over the most recent period equal to the contractual term of the award and the implied volatility using traded options with a variety of remaining maturities. The expected life for the Hull-White component of the valuation is equal to the contractual term of the award and the Black-Scholes component is based on historical experience. The risk-free rate corresponds to the ten-year Treasury rate on the date of the award as the contractual term of the award is generally 10 years. The SEF takes into consideration early exercise behavior or patterns based on stock-price appreciation. The SEF is computed by analyzing historical exercises and stock prices on the exercise date as a multiple of the original award price. Fair value calculations are subject to change based upon the assumptions applied within the applicable models.
The weighted-average estimated fair value of the MV Stock-settled SARs and MVOs granted during the years ended January 31, 2010 and 2008 was $7.02 and $7.00, respectively, based on a two-step valuation utilizing both the Hull-White Lattice (binomial) and Black-Scholes option-pricing models using the following weighted-average assumptions (as discussed above, there were no MV Stock-settled SARS or MVOs issued by the Company during the fiscal year ended January 31, 2009):
| Year ended January 31, 2010 |
Expected option term (years) |
Expected volatility |
Risk-free interest rate |
Expected dividend yield |
Suboptimal exercise factor | |||||
| Hull-White Lattice |
10 | 44% | 3.27% | 0% | 1.66 | |||||
| Black-Scholes |
4 | 44% | 4.77% | 0% | — | |||||
| Year ended January 31, 2008 |
Expected option term (years) |
Expected volatility |
Risk-free interest rate |
Expected dividend yield |
Suboptimal exercise factor | |||||
| Hull-White Lattice |
10 | 42% | 4.74% | 0% | 1.19 | |||||
| Black-Scholes |
4 | 42% | 4.55% | 0% | — | |||||
55
Table of Contents
A summary of the status of the Company’s stock-based equity incentives outstanding representing MV Stock-settled SARs, MVOs and stock options is as follows:
| Outstanding | Exercisable | |||||||||||
| Range of exercise prices |
Number outstanding at 1/31/10 |
Weighted- average remaining contractual life (years) |
Weighted- average exercise price |
Number exercisable at 1/31/10 |
Weighted- average exercise price | |||||||
| $16.50 – $24.69 |
859,436 | 7.9 | $ | 21.74 | 166,263 | $ | 24.29 | |||||
| 24.70 – 36.34 |
334,183 | 6.7 | 34.18 | 175,056 | 34.19 | |||||||
| 36.35 – 37.05 |
573,374 | 6.2 | 36.99 | 325,561 | 37.04 | |||||||
| 37.06 – 37.06 |
368,540 | 5.1 | 37.06 | 368,540 | 37.06 | |||||||
| 37.07 – 41.07 |
75,883 | 4.7 | 39.07 | 66,700 | 39.25 | |||||||
| 41.08 – 41.08 |
520,795 | 4.1 | 41.08 | 520,795 | 41.08 | |||||||
| 41.09 – 51.38 |
634,687 | 2.1 | 43.51 | 628,096 | 43.52 | |||||||
| 3,366,898 | 5.4 | 34.74 | 2,251,011 | 38.69 | ||||||||
The Company’s policy is to utilize shares of its treasury stock, to the extent available, for the exercise of awards (see further discussion of the Company’s share repurchase program in Note 12 – Shareholders’ Equity below).
Employee Stock Purchase Plan
Under the 1995 Employee Stock Purchase Plan (the “ESPP”) approved in June 1995, the Company is authorized to issue up to 1,000,000 shares of common stock to eligible employees in the Company’s U.S. and Canadian subsidiaries. Under the terms of the ESPP, employees can choose to have a fixed dollar amount or percentage deducted from their bi-weekly compensation to purchase the Company’s common stock and/or elect to purchase shares once per calendar quarter. The purchase price of the stock is 85% of the market value on the exercise date and employees are limited to a maximum purchase of $25,000 in fair market value each calendar year. From the inception of the ESPP through January 31, 2010, the Company has issued 448,902 shares of common stock to the ESPP. All shares purchased under the ESPP must be held for a period of one year.
Retirement Savings Plan
The Company sponsors the Tech Data Corporation 401(k) Savings Plan (“the 401(k) Savings Plan”) for its employees. At the Company’s discretion, participant deferrals are matched monthly in cash, in an amount equal to 50% of the first 6% of participant deferrals and participants are fully vested following four years of qualified service. At January 31, 2010 and 2009, the number of shares of Tech Data common stock held by the Company’s 401(k) Savings Plan totaled 191,195 and 244,427 shares, respectively. Aggregate contributions made by the Company to the 401(k) Savings Plan were $0.1 million, $2.3 million and $2.2 million for fiscal years 2010, 2009 and 2008, respectively. The Company suspended the employer match for the 401(k) during the calendar year December 31, 2009 and subsequently reinstated the employer match effective January 2010.
NOTE 12 — SHAREHOLDERS’ EQUITY
In December 2009, the Company’s Board of Directors authorized a share repurchase program of up to $100.0 million of the Company’s common stock. Through January 31, 2010, the Company has made no repurchases of common stock in connection with this repurchase program.
In June 2008, the Company’s Board of Directors authorized a share repurchase program of up to $100.0 million of the Company’s common stock. During the second and third quarters of fiscal 2009, the Company repurchased 2,912,517 shares at an average of $34.33 per share, for a total cost, including expenses, of $100.0 million in connection with this repurchase program.
In September 2007, the Company’s Board of Directors authorized a share repurchase program of up to $100.0 million of the Company’s common stock. During fiscal 2008, the Company repurchased 2,698,654 shares comprised of 2,698,126 shares purchased in connection with the Company’s share repurchase program and 528 shares purchased outside of the stock repurchase program, at an average of $37.06 per share, for a total cost, including expenses, of $100.0 million.
The Company’s share repurchases were made on the open market through block trades or otherwise and the number of shares purchased and the timing of the purchases were based on working capital requirements, general business conditions and other factors, including alternative investment opportunities. Shares repurchased by the Company are held in treasury for general corporate purposes, including issuances under equity incentive and employee benefit plans.
56
Table of Contents
NOTE 13 — FAIR VALUE OF FINANCIAL INSTRUMENTS
The Company carries its assets and liabilities at fair value and classifies and discloses its assets and liabilities in one of the following three categories: Level 1 – quoted market prices in active markets for identical assets and liabilities; Level 2 – inputs other than quoted market prices included in level 1 above that are observable for the asset or liability, either directly or indirectly; and, Level 3 – unobservable inputs for the asset or liability. A financial instrument’s level within the fair value hierarchy is based on the lowest level of any input that is significant to the fair value measurement.
The Company’s foreign currency forward contracts are measured on a recurring basis based on foreign currency spot rates and forward rates quoted by banks or foreign currency dealers (level 2 criteria) and are marked-to-market each period with gains and losses on these contracts recorded in the Company’s Consolidated Statement of Operations within “net foreign currency exchange (gain) loss” in the period in which their value changes, with the offsetting amount for unsettled positions being included in either other current assets or other current liabilities in the Consolidated Balance Sheet. The fair value of the Company’s foreign currency forward contracts at both January 31, 2010 and 2009 was $6.5 million (see further discussion below in Note 14 – Derivative Instruments).
The Company utilizes life insurance policies to fund certain of the Company’s nonqualified employee benefit plans. The investments contained within the life insurance policies are marked-to-market each period by analyzing the change in the underlying value of the invested assets (level 2 criteria) and the gains and losses are recorded in the Company’s Consolidated Statement of Operations. The related deferred compensation liability is also marked-to-market each period based upon the various investment return alternatives selected by the participants of the nonqualified employee benefit plans (level 2 criteria) and the gains and losses are recorded in the Company’s Consolidated Statement of Operations.
The $350.0 million of convertible senior debentures are carried at cost, less unamortized debt discount. The estimated fair value of these convertible senior debentures was approximately $362.3 million at January 31, 2010, based upon quoted market information (level 1criteria).
The carrying amounts of cash and cash equivalents, accounts receivable, accounts payable and accrued expenses approximate fair value because of the short maturity of these items. The carrying amount of debt outstanding pursuant to revolving debt and similar bank credit agreements approximates fair value as interest rates on these instruments approximate current market rates (level 2 criteria).
NOTE 14 — DERIVATIVE INSTRUMENTS
In the ordinary course of business, the Company is exposed to movements in foreign currency exchange rates. The Company’s foreign currency risk management objective is to protect earnings and cash flows from the impact of exchange rate changes primarily through the use of foreign currency forward contracts to hedge both intercompany and third party loans, accounts receivable and accounts payable. These derivatives are not designated as hedging instruments.
The Company employs established policies and procedures to manage the exposure to fluctuations in the value of foreign currencies. It is the Company’s policy to utilize financial instruments to reduce risks where internal netting cannot be effectively employed. Additionally, the Company does not enter into derivative instruments for speculative or trading purposes.
The Company considers inventory as an economic hedge against foreign currency exposure in accounts payable in certain circumstances. This practice offsets such inventory against corresponding accounts payable denominated in currencies other than the functional currency of the subsidiary buying the inventory, when determining the net exposure to be hedged using traditional forward contracts. Under this strategy, the Company would expect to increase or decrease selling prices for product purchased in foreign currencies based on fluctuations in foreign currency exchange rates affecting the underlying accounts payable. To the extent the Company incurs a foreign currency exchange loss (gain) on the underlying accounts payable denominated in the foreign currency, a corresponding increase (decrease) in gross profit would be expected as the related inventory is sold. This strategy can result in a certain degree of quarterly earnings volatility as the underlying accounts payable is remeasured using the foreign currency exchange rate prevailing at the end of each period, or settlement date if earlier, whereas the corresponding increase (decrease) in gross profit is not realized until the related inventory is sold.
The Company’s foreign currency exposure relates to international transactions in Europe, Canada and Latin America, where the currency collected from customers can be different from the currency used to purchase the product. The Company’s transactions in its foreign operations are denominated primarily in the following currencies: U.S. dollar, Brazilian reals, British pound, Canadian dollar, Chilean peso, Czech koruna, Danish krone, euros, Mexican peso, Norwegian krone, Polish zloty, Swedish krona and Swiss franc.
The notional amount of forward exchange contracts is the amount of foreign currency to be bought or sold at maturity. Notional amounts are indicative of the extent of the Company’s involvement in the various types and uses of derivative financial instruments
57
Table of Contents
and are not a measure of the Company’s exposure to credit or market risks through its use of derivatives. The estimated fair value of derivative financial instruments represents the amount required to enter into similar offsetting contracts with similar remaining maturities based on quoted market prices.
The Company’s derivative financial instruments outstanding at January 31, 2010 and 2009 are as follows:
| January 31, 2010 | January 31, 2009 | |||||||||||
| Notional amounts |
Estimated fair value asset (liability) |
Notional amounts |
Estimated fair value asset (liability) | |||||||||
| (In thousands) | (In thousands) | |||||||||||
| Foreign currency forward contracts |
$ | 1,546,985 | $ | 6,514 | $ | 1,291,121 | $ | 6,466 | ||||
The Company’s foreign currency forward contracts are also discussed in Note13 – Fair Value of Financial Instruments.
NOTE 15 — COMMITMENTS AND CONTINGENCIES
Operating Leases
The Company leases logistics centers, office facilities and certain equipment under noncancelable operating leases, the majority of which expire at various dates through fiscal 2019. Fair value renewal and escalation clauses exist for a substantial portion of the operating leases included above. Rental expense related to continuing operations for all operating leases, including minimum commitments under IT outsourcing agreements, totaled $55.5 million, $59.9 million and $60.6 million in fiscal years 2010, 2009 and 2008, respectively. Future minimum lease payments at January 31, 2010 under all such leases, including minimum commitments under IT outsourcing agreements for succeeding fiscal years and thereafter are as follows (in thousands):
| Fiscal year: |
|||
| 2011 |
$ | 60,607 | |
| 2012 |
41,308 | ||
| 2013 |
35,799 | ||
| 2014 |
29,571 | ||
| 2015 |
24,217 | ||
| Thereafter |
31,210 | ||
| Total payments |
$ | 222,712 | |
Synthetic Lease Facility
The Company has a synthetic lease facility (the “Synthetic Lease”) with a group of financial institutions under which the Company leases certain logistics centers and office facilities from a third-party lessor. During the second quarter of fiscal 2009, the Company renewed its existing Synthetic Lease with a new lease agreement that expires in June 2013. Properties leased under the Synthetic Lease are located in Clearwater and Miami, Florida; Fort Worth, Texas; Fontana, California; Suwanee, Georgia; Swedesboro, New Jersey; and South Bend, Indiana. The Synthetic Lease has been accounted for as an operating lease and rental payments are calculated at the applicable LIBOR rate plus a margin based on the Company’s credit ratings.
During the first four years of the lease term, the Company may, at its option, purchase any combination of the seven properties, at an amount equal to each of the property’s cost, as long as the lease balance does not decrease below a defined amount. During the last year of the lease term, until 180 days prior to the lease expiration, the Company may, at its option, i) purchase a minimum of two of the seven properties, at an amount equal to each of the property’s cost, ii) exercise the option to renew the lease for a minimum of two of the seven properties or iii) exercise the option to remarket a minimum of two of the seven properties and cause a sale of the properties. If the Company elects to remarket the properties, it has guaranteed the lessor a percentage of the cost of each property, in the aggregate amount of approximately $107.4 million (the “residual value”). The Company’s residual value guarantee related to the Synthetic Lease has been recorded at the estimated fair value of the residual guarantee.
The sum of future minimum lease payments under the Synthetic Lease at January 31, 2010, which are included in the future minimum lease payments presented above, was approximately $6.6 million.
The Synthetic Lease contains covenants that must be complied with, similar to the covenants described in certain of the credit facilities discussed in Note 8—Revolving Credit Loans. As of January 31, 2010, the Company was in compliance with all such covenants.
58
Table of Contents
Contingencies
Prior to fiscal 2004, one of the Company’s European subsidiaries was audited in relation to various value-added tax (“VAT”) matters. As a result of those audits, the subsidiary received notices of assessment that allege the subsidiary did not properly collect and remit VAT. It is management’s opinion, based upon the opinion of outside legal counsel, that the Company has valid defenses related to a substantial portion of these assessments. Although the Company is vigorously pursuing administrative and judicial action to challenge the assessments, no assurance can be given as to the ultimate outcome. The resolution of such assessments could be material to the Company’s operating results for any particular period, depending upon the level of income for such period.
The Company is also subject to various other legal proceedings and claims arising in the ordinary course of business. The Company’s management does not expect that the outcome in any of these other legal proceedings, individually or collectively, will have a material adverse effect on the Company’s financial condition, results of operations, or cash flows.
Guarantees
As is customary in the IT industry, to encourage certain customers to purchase products from Tech Data, the Company has arrangements with certain finance companies that provide inventory financing facilities to the Company’s customers. In conjunction with certain of these arrangements, the Company would be required to purchase certain inventory in the event the inventory is repossessed from the customers by the finance companies. As the Company does not have access to information regarding the amount of inventory purchased from the Company still on hand with the customer at any point in time, the Company’s repurchase obligations relating to inventory cannot be reasonably estimated. Repurchases of inventory by the Company under these arrangements have been insignificant to date. The Company believes that, based on historical experience, the likelihood of a material loss pursuant to these inventory repurchase obligations is remote.
The Company provides additional financial guarantees to finance companies on behalf of certain customers. The majority of these guarantees are for an indefinite period of time, where the Company would be required to perform if the customer is in default with the finance company related to purchases made from the Company. The Company reviews the underlying credit for these guarantees on at least an annual basis. As of January 31, 2010 and 2009, the aggregate amount of guarantees under these arrangements totaled $62.3 million and $31.9 million, respectively, of which $40.9 million and $23.1 million, respectively, was outstanding. The Company believes that, based on historical experience, the likelihood of a material loss pursuant to the above guarantees is remote.
NOTE 16 — SEGMENT INFORMATION
Tech Data operates predominately in a single industry segment as a distributor of IT products, logistics management, and other value-added services. While the Company operates primarily in one industry it is managed by its geographic segments, which includes the Americas (including North America and Latin America) and Europe. The Company assesses performance of and makes decisions on how to allocate resources to its operating segments based on multiple factors including current and projected operating income and market opportunities. The Company does not consider stock-based compensation expense in assessing the performance of its operating segments, and therefore the Company is reporting stock-based compensation expense as a separate amount. The accounting policies of the segments are the same as those described in Note 1—Business and Summary of Significant Accounting Policies.
Financial information by geographic segment is as follows:
| Year ended January 31, | ||||||||||||
| 2010 | 2009 | 2008 | ||||||||||
| (In thousands) (As Adjusted - See Note 1) |
(As Adjusted - See Note 1) |
|||||||||||
| Net sales to unaffiliated customers |
||||||||||||
| Americas |
$ | 9,570,088 | $ | 10,609,001 | $ | 11,003,893 | ||||||
| Europe |
12,529,788 | 13,471,483 | 12,419,185 | |||||||||
| Total |
$ | 22,099,876 | $ | 24,080,484 | $ | 23,423,078 | ||||||
| Operating income |
||||||||||||
| Americas |
$ | 142,430 | $ | 157,177 | $ | 170,685 | ||||||
| Europe(1) |
132,631 | 96,972 | 27,956 | |||||||||
| Stock-based compensation expense |
(11,225 | ) | (11,990 | ) | (10,287 | ) | ||||||
| Total |
$ | 263,836 | $ | 242,159 | $ | 188,354 | ||||||
59
Table of Contents
| Year ended January 31, | ||||||||
| 2010 | 2009 | 2008 | ||||||
| (In thousands) (As Adjusted - See Note 1) |
(As Adjusted - See Note 1) | |||||||
| Depreciation and amortization |
||||||||
| Americas |
$ | 16,004 | $ 17,820 | $ | 18,153 | |||
| Europe |
29,950 | 33,414 | 35,728 | |||||
| Total |
$ | 45,954 | $ 51,234 | $ | 53,881 | |||
| Capital expenditures |
||||||||
| Americas |
$ | 17,365 | $ 15,024 | $ | 22,618 | |||
| Europe |
11,500 | 17,523 | 15,741 | |||||
| Total |
$ | 28,865 | $ 32,547 | $ | 38,359 | |||
| Identifiable assets |
||||||||
| Americas |
$ | 2,258,581 | $1,740,099 | $ | 1,715,178 | |||
| Europe |
3,643,506 | 3,282,997 | 3,504,870 | |||||
| Total |
$ | 5,902,087 | $5,023,096 | $ | 5,220,048 | |||
| Goodwill |
||||||||
| Americas |
$ | 2,966 | $ 2,966 | $ | 2,966 | |||
| Europe(2) |
14,053 | 11,644 | — | |||||
| Total |
$ | 17,019 | $ 14,610 | $ | 2,966 | |||
| (1) | For the year ended January 31, 2008, the amounts shown above include $16.1 million of restructuring costs related to the exit of the Company’s logistics center in Germany and changes in estimates of previously recorded restructuring accruals for the 2005 restructuring program and $14.5 million of loss on disposal of subsidiaries related to the closure of operations in the UAE and the sale of the Company’s Israel operations (see also Note 7—Restructuring Programs). |
| (2) | Europe’s goodwill balance as of January 31, 2010 and 2009 is the result of the May 2008 acquisition of certain assets of Scribona, AB (see also Note 5—Acquisitions). |
NOTE 17 — INTERIM FINANCIAL INFORMATION (UNAUDITED)
Interim financial information for fiscal years 2010 and 2009 is as follows.
| Quarter ended | ||||||||||||
| April 30, | July 31, | October 31, | January 31, | |||||||||
| (In thousands, except per share amounts) | ||||||||||||
| Fiscal year 2010(1) |
||||||||||||
| Net sales |
$ | 4,990,959 | $ | 5,183,731 | $ | 5,642,046 | $ | 6,283,140 | ||||
| Gross profit |
$ | 263,334 | $ | 268,884 | $ | 296,574 | $ | 327,922 | ||||
| Consolidated net income |
$ | 31,593 | $ | 35,010 | $ | 43,109 | $ | 71,488 | ||||
| Net income attributable to shareholders of Tech Data Corporation |
$ | 31,765 | $ | 35,157 | $ | 43,142 | $ | 70,091 | ||||
| Net income per share attributable to shareholders of Tech Data Corporation: |
||||||||||||
| Basic |
$ | 0.63 | $ | 0.70 | $ | 0.85 | $ | 1.37 | ||||
| Diluted |
$ | 0.63 | $ | 0.70 | $ | 0.84 | $ | 1.35 | ||||
60
Table of Contents
| Quarter ended | ||||||||||||
| April 30, | July 31, | October 31, | January 31, | |||||||||
| (In thousands, except per share amounts) | ||||||||||||
| (As Adjusted) (2) | ||||||||||||
| Fiscal year 2009 |
||||||||||||
| Net sales |
$ | 6,065,814 | $ | 6,166,021 | $ | 6,136,112 | $ | 5,712,537 | ||||
| Gross profit |
$ | 294,667 | $ | 299,116 | $ | 297,974 | $ | 321,239 | ||||
| Consolidated net income |
$ | 20,091 | $ | 21,311 | $ | 16,565 | $ | 57,489 | ||||
| Net income attributable to shareholders of Tech Data Corporation |
$ | 21,379 | $ | 22,093 | $ | 16,803 | $ | 57,003 | ||||
| Net income per share attributable to shareholders of Tech Data Corporation: |
||||||||||||
| Basic |
$ | 0.40 | $ | 0.42 | $ | 0.33 | $ | 1.14 | ||||
| Diluted |
$ | 0.40 | $ | 0.42 | $ | 0.33 | $ | 1.14 | ||||
| (1) | During the fourth quarter of fiscal 2010, the Company reversed a $5.4 million deferred tax asset valuation allowance which was recorded as an income tax benefit during the period (see also Note 10 — Income Taxes). |
| (2) | As previously discussed in Note 1 — Business and Summary of Significant Accounting Policies, effective February 1, 2009, the Company adopted an accounting standard which required retrospective application related to the accounting treatment of the Company’s convertible senior debentures issued in December 2006. The impact of the retroactive adoption of this accounting standard for each of the first three quarters of fiscal 2009 was included in the Company’s quarterly reports on Form 10Q previously filed during fiscal 2010. The following represents the impact of the retroactive adoption of the accounting standard for the three months ended January 31, 2009: |
| Three months ended January 31, 2009 | Effect of change increase (decrease) |
|||||||||
| As adjusted | As previously reported |
|||||||||
| (In thousands, except per share data) | ||||||||||
| Consolidated Statement of Operations: |
||||||||||
| Interest expense |
$ | 10,882 | $ | 8,370 | $ | 2,512 | ||||
| Income before income taxes |
83,983 | 86,495 | (2,512 | ) | ||||||
| Provision for income taxes |
26,494 | 27,419 | (925 | ) | ||||||
| Consolidated net income |
57,489 | 59,076 | (1,587 | ) | ||||||
| Net income attributable to shareholders of Tech Data Corporation |
57,003 | 58,590 | (1,587 | ) | ||||||
| Net income per common share attributable to shareholders of Tech Data Corporation: |
||||||||||
| Basic |
$ | 1.14 | $ | 1.17 | $ | (0.03 | ) | |||
| Diluted |
$ | 1.14 | $ | 1.17 | $ | (0.03 | ) | |||
61
Table of Contents
| ITEM 9. | Changes in and Disagreements With Accountants on Accounting and Financial Disclosure. |
None.
| ITEM 9A. | Controls and Procedures. |
Evaluation of Disclosure Controls and Procedures
The Company maintains disclosure controls and procedures designed to ensure that information required to be disclosed in reports filed under the Securities Exchange Act of 1934, as amended (the “Exchange Act”), is recorded, processed, summarized and reported within the specified time periods. In designing and evaluating our disclosure controls and procedures, management recognized that disclosure controls and procedures, no matter how well conceived and operated, can provide only reasonable, not absolute, assurance that the objectives of the disclosure controls and procedures are met. Further, the design of a control system must reflect the fact that there are resource constraints, and the benefits of controls must be considered relative to their costs. Because of the inherent limitations in all control systems, no evaluation of controls can provide absolute assurance that all control issues and instances of fraud, if any, within the Company have been detected. These inherent limitations include the realities that judgments in decision-making can be faulty, and that breakdowns can occur because of a simple error or mistake. Additionally, controls can be circumvented by the individual acts of some persons, by collusion of two or more people, or by management override of the controls. The design of any system of controls also is based in part upon certain assumptions about the likelihood of future events, and there can be no assurance that any design will succeed in achieving its stated goals under all potential future conditions. Over time, controls may become inadequate because of changes in conditions, or the degree of compliance with the policies or procedures may deteriorate. Because of the inherent limitations in a cost-effective control system, misstatements due to error or fraud may occur and not be detected.
Tech Data’s management, with the participation of the Company’s Chief Executive Officer (“CEO”) and Chief Financial Officer (“CFO”), has evaluated, the effectiveness of the Company’s disclosure controls and procedures (as defined in Rules 13a-15(e) and 15d-15(e) under the Exchange Act), as of January 31, 2010. Based on that evaluation, the Company’s CEO and CFO concluded that the Company’s disclosure controls and procedures were effective in providing reasonable assurance that the objectives of the disclosure controls and procedures are met as of January 31, 2010.
Management’s Report on Internal Control over Financial Reporting
Management of the Company is responsible for establishing and maintaining adequate internal control over financial reporting as defined in Rule 13a-15(f) under the Exchange Act. The Company’s internal control over financial reporting is designed to provide reasonable assurance regarding the reliability of financial reporting and the preparation of financial statements for external purposes in accordance with generally accepted accounting principles.
Because of its inherent limitations, internal control over financial reporting may not prevent or detect misstatements. Therefore, even those systems determined to be effective can provide only reasonable assurance with respect to financial statement preparation and presentation. Also, projections of any evaluation of the effectiveness to future periods are subject to the risk that controls may become inadequate because of changes in conditions, or that the degree of compliance with the policies or procedures may deteriorate.
Under the supervision and with the participation of management, including our principal executive officer and principal financial officer, we assessed the effectiveness of the Company’s internal control over financial reporting as of January 31, 2010. In making this assessment, management used the criteria set forth by the Committee of Sponsoring Organizations of the Treadway Commission (“COSO”) in Internal Control—Integrated Framework. Based on our assessment, we have concluded that, as of January 31, 2010, the Company’s internal control over financial reporting was effective based on those criteria.
The effectiveness of internal control over financial reporting as of January 31, 2010 has been audited by Ernst & Young, LLP, the independent registered certified public accounting firm who also audited the Company’s consolidated financial statements, as stated in their report below.
Changes in Internal Control Over Financial Reporting
There were no changes in our internal control over financial reporting (as defined in Rules 13a-15(f) and 15d-15(f) under the Exchange Act) identified in connection with management’s evaluation during our last quarter of fiscal 2010 that have materially affected, or are reasonably likely to materially affect, the Company’s internal control over financial reporting.
62
Table of Contents
Report of Independent Registered Certified Public Accounting Firm
The Board of Directors and Shareholders of
Tech Data Corporation
We have audited Tech Data Corporation’s internal control over financial reporting as of January 31, 2010, based on criteria established in Internal Control—Integrated Framework issued by the Committee of Sponsoring Organizations of the Treadway Commission (the COSO criteria). Tech Data Corporation’s management is responsible for maintaining effective internal control over financial reporting, and for its assessment of the effectiveness of internal control over financial reporting included in the accompanying Management’s Report on Internal Control over Financial Reporting. Our responsibility is to express an opinion on the company’s internal control over financial reporting based on our audit.
We conducted our audit in accordance with the standards of the Public Company Accounting Oversight Board (United States). Those standards require that we plan and perform the audit to obtain reasonable assurance about whether effective internal control over financial reporting was maintained in all material respects. Our audit included obtaining an understanding of internal control over financial reporting, assessing the risk that a material weakness exists, testing and evaluating the design and operating effectiveness of internal control based on the assessed risk, and performing such other procedures as we considered necessary in the circumstances. We believe that our audit provides a reasonable basis for our opinion.
A company’s internal control over financial reporting is a process designed to provide reasonable assurance regarding the reliability of financial reporting and the preparation of financial statements for external purposes in accordance with generally accepted accounting principles. A company’s internal control over financial reporting includes those policies and procedures that (1) pertain to the maintenance of records that, in reasonable detail, accurately and fairly reflect the transactions and dispositions of the assets of the company; (2) provide reasonable assurance that transactions are recorded as necessary to permit preparation of financial statements in accordance with generally accepted accounting principles, and that receipts and expenditures of the company are being made only in accordance with authorizations of management and directors of the company; and (3) provide reasonable assurance regarding prevention or timely detection of unauthorized acquisition, use, or disposition of the company’s assets that could have a material effect on the financial statements.
Because of its inherent limitations, internal control over financial reporting may not prevent or detect misstatements. Also, projections of any evaluation of effectiveness to future periods are subject to the risk that controls may become inadequate because of changes in conditions, or that the degree of compliance with the policies or procedures may deteriorate.
In our opinion, Tech Data Corporation maintained, in all material respects, effective internal control over financial reporting as of January 31, 2010, based on the COSO criteria.
We also have audited, in accordance with the standards of the Public Company Accounting Oversight Board (United States), the consolidated balance sheets of Tech Data Corporation and subsidiaries as of January 31, 2010 and 2009, and the related consolidated statements of operations, shareholders’ equity and cash flows for each of the three years in the period ended January 31, 2010, of Tech Data Corporation and subsidiaries and our report dated March 24, 2010, expressed an unqualified opinion thereon.
/s/ Ernst & Young LLP
Tampa, Florida
March 24, 2010
63
Table of Contents
| ITEM 9B. | Other Information |
None.
| ITEM 10. | Directors, Executive Officers and Corporate Governance. |
The information required by Item 10 relating to executive officers of the Company is included under the caption “Executive Officers” of Item 1 of this Form 10-K. The information required by Item 10 relating to Directors and corporate governance disclosures of the Company is incorporated herein by reference to the Company’s definitive proxy statement for the 2010 Annual Meeting of Shareholders (“Proxy Statement). The Proxy Statement for the 2010 Annual Meeting of Shareholders will be filed with the SEC prior to May 31, 2010.
Audit Committee
Tech Data has a separately designated, standing Audit Committee established in accordance with Section 3(a) (58) (A) of the Exchange Act. The members of the Audit Committee are Charles E. Adair, Maximilian Ardelt, Harry J. Harczak, Jr., and John Y. Williams.
Audit Committee Financial Expert
The Board of Directors of Tech Data has determined that Charles E. Adair, Chairman of the Audit Committee, and Harry J. Harczak, Jr. are audit committee financial experts as defined by Item 407(d) (5) (ii) of Regulation S-K under the Exchange Act, and all members of the Audit Committee are independent within the meaning of applicable SEC rule and listing standards.
Code of Ethics
Tech Data has adopted a code of business conduct and ethics for directors, officers (including Tech Data’s principal executive officer, principal financial officer, and principal accounting officer) and employees, known as the Code of Ethics. The Code of Ethics is available, and may be obtained free of charge, on Tech Data’s website at http://www.techdata.com/content/td_ethics/main.aspx. Tech Data intends to provide information required by Item 5.05 of Form 8-K by disclosing any amendment to, or waiver from, a provision of the Code of Ethics that applies to Tech Data’s principal executive officer, principal financial officer, principal accounting officer or controller, or persons performing similar functions on the Company’s website at the web address noted in this section.
| ITEM 11. | Executive Compensation. |
The information required by this item is incorporated herein by reference to the Company’s Proxy Statement.
| ITEM 12. | Security Ownership of Certain Beneficial Owners and Management and Related Stockholder Matters. |
Equity Compensation Plan Information
The number of shares issuable upon exercise of outstanding share-based equity incentives granted to employees and non-employee directors, as well as the number of shares remaining available for future issuance, under our equity compensation and stock purchase plans as of January 31, 2010 are summarized in the following table:
| Plan category |
Number of shares to be issued upon exercise of outstanding share-based incentives |
Weighted average exercise price of outstanding share-based incentives(1) |
Number of shares remaining available for future issuance under equity compensation plans | |||
| Equity compensation plans approved by shareholders for: |
||||||
| Employee equity compensation (2) |
3,485,043 | $29.07 | 3,779,685 | |||
| Employee stock purchase |
— | — | 551,098 | |||
| Non-employee directors’ equity compensation |
50,000 | 34.25 | — | |||
| Total |
3,535,043 | 29.14 | 4,330,783 | |||
| Employee equity compensation plan not approved by shareholders |
327,695 | 42.51 | — | |||
| Total |
3,862,738 | 30.28 | 4,330,783 | |||
| (1) | The calculation of the weighted average exercise price includes restricted stock awards that do not have an exercise price. Excluding the restricted stock awards, the weighted average exercise price of outstanding options and maximum value stock-settled stock appreciation rights (“MV Stock-settled SARs”) would be $33.90 for equity compensation plans approved by security holders, $42.51 for equity compensation plans not approved by shareholders and $34.74 for all equity compensation plans. |
| (2) | The share-based incentives outstanding include 1,673,292 MV Stock-settled SARs at an average exercise price of $31.15. Assuming the maximum cap of $20 is reached, the maximum number of shares that would be issued from the exercise of MV Stock-settled SARs would be approximately 654,000 shares. The total of share-based incentives outstanding also includes 124,849 shares outstanding for non-employee directors. |
| ITEM 13. | Certain Relationships and Related Transactions, and Director Independence. |
The information required by this item is incorporated herein by reference to the Company’s Proxy Statement. However, the information included in such Proxy Statement included under the caption entitled “Report of the Audit Committee” shall not be deemed incorporated by reference in this Form 10-K and shall not otherwise be deemed filed under the Securities Act of 1933, as amended, or under the Exchange Act.
| ITEM 14. | Principal Accountant Fees and Services. |
Information regarding principal accountant fees and services is set forth under the caption “Independent Accounting Firm Fees” in our Proxy Statement, which is incorporated herein by reference to the Company’s definitive proxy statement for the 2010 Annual Meeting of Shareholders. The Proxy Statement for the 2010 Annual Meeting of Shareholders will be filed with the SEC prior to May 31, 2010.
64
Table of Contents
| ITEM 15. | Exhibits, Financial Statement Schedules. |
| (a) | See index to financial statements and schedules included in Item 8. |
| (b) | The exhibit numbers on the following list correspond to the numbers in the exhibit table required pursuant to Item 601 of Regulation S-K. |
| Exhibit |
Description | |||
| 3-N(34) |
— | Amended and Restated Articles of Incorporation of Tech Data Corporation filed on June 23, 2009 with the Secretary of the State of Florida | ||
| 3(ii)(33) |
— | Bylaws of Tech Data Corporation as adopted on March 24, 2009. | ||
| 4-A(15) |
— | Indenture between the Company and JP Morgan Trust Company, National Association, as successor trustees Bank One Trust Company, N.A., dated as of December 10, 2001 | ||
| 10-G(7) |
— | Employee Stock Ownership Plan as amended December 16, 1994 | ||
| 10-Z(4) |
— | 1990 Incentive and Non-Statutory Stock Option Plan as amended | ||
| 10-AA(5) |
— | Non-Statutory Stock Option Grant Form | ||
| 10-BB(5) |
— | Incentive Stock Option Grant Form | ||
| 10-NN(8) |
— | Non-Employee Directors’ 1995 Non-Statutory Stock Option Plan | ||
| 10-OO(8) |
— | 1995 Employee Stock Purchase Plan | ||
| 10-AAa(10) |
— | Transfer and Administration Agreement dated May 19, 2000 | ||
| 10-AAb(10) |
— | Credit Agreement dated as of May 8, 2000 | ||
| 10-AAc(10) |
— | Amended and Restated Participation Agreement dated as of May 8, 2000 | ||
| 10-AAd(10) |
— | Amended and Restated Lease Agreement dated as of May 8, 2000 | ||
| 10-AAe(10) |
— | Amended and Restated Agency Agreement dated as of May 8, 2000 | ||
| 10-AAg(12) |
— | Tech Data Corporation 401(K) Savings Plan dated January 1, 2000 | ||
| 10-AAi(13) |
— | 2000 Non-Qualified Stock Option Plan of Tech Data Corporation | ||
| 10-AAj(13) |
— | 2000 Equity Incentive Plan of Tech Data Corporation | ||
| 10-AAl(17) |
— | Amendment Agreement Number 1 to Credit Agreement dated November 21, 2002 | ||
| 10-AAo(18) |
— | The Amended and Restated Credit Agreement dated May 2, 2003 | ||
| 10-AAq(19) |
— | Second Amended and Restated Participation Agreement dated as of July 31, 2003 | ||
| 10-AAr(19) |
— | Second Amended and Restated Lease Agreement dated as of July 31, 2003 | ||
| 10-AAs(19) |
— | Second Amended and Restated Credit Agreement dated as of July 31, 2003 | ||
| 10-AAt(19) |
— | Trust Agreement Between Tech Data Corporation and Fidelity Management Trust Company, Tech Data Corporation 401(k) Savings Plan Trust, effective August 1, 2003 | ||
65
Table of Contents
| Exhibit |
Description | |||
| 10-AAv(2) |
— | Amendment Agreement Number 2 to Amended and Restated Credit Agreement dated as of January 30, 2004 | ||
| 10-AAw(16) |
— | Amendment to the 2000 Equity Incentive Plan of Tech Data Corporation | ||
| 10-AAx(2) |
— | Amended and Restated Tech Data Corporation 401(K) Savings Plan and Amendments 1-3 | ||
| 10-AAz(11) |
— | Amendment Number 2 to Receivables Purchase and Servicing Agreement dated May 19, 2000 | ||
| 10-AAaa(6) |
— | 2005 Deferred Compensation Plan | ||
| 10-AAbb(9) |
— | Indenture for New 2% Subordinated Debentures between Tech Data and J.P. Morgan Trust Company, National Association and Table of Contents of Indenture, including Cross-Reference Table to the Trust Indenture Act of 1939 and including form of new 2% Subordinated Debenture as an exhibit | ||
| 10-AAbb(3) |
— | Amendment Number 8 to Transfer and Administration Agreement dated as of May 19, 2000 | ||
| 10-AAcc(20) |
— | Executive Severance Plan, effective March 31, 2005 | ||
| 10-AAdd(20) |
— | First Amendment to the Tech Data Corporation 2005 Deferred Compensation Plan, effective January 1, 2005 | ||
| 10-AAee(20) |
— | Executive Incentive Plan – April 2005 | ||
| 10-AAff(20) |
— | Fourth Amendment to the Tech Data Corporation 401(k) Savings Plan, effective March 28, 2005. | ||
| 10-AAgg(20) |
— | Trade Receivables Purchase Facility Agreement between Tech Data Corporation and SunTrust Bank, dated May 26, 2005 | ||
| 10-AAhh(21) |
— | First Amendment to Trade Receivables Purchase Facility Agreement | ||
| 10-AAii(21) |
— | Amendment No. 10 to Transfer and Administration Agreement | ||
| 10-AAjj(23) |
— | Uncommitted Account Receivable Purchase Agreement dated as of January 23, 2006 | ||
| 10-Akk(22)(23) |
— | Master Agreement for the sale and purchase of the Azlan Training Business, dated as of March 7, 2006 | ||
| 10-AAll(24) |
— | Form of Tech Data Corporation 2000 Equity Incentive Plan Notice of Award and Award Agreement | ||
| 10-AAmm(24) |
— | Form of Tech Data Corporation 2000 Equity Incentive Plan Performance Grant in the form of Restricted Stock Units Agreement | ||
| 10-AAnn(24) |
— | Amended and Restated 2000 Equity Incentive Plan of Tech Data Corporation | ||
| 10-AAoo(24) |
— | First Amendment to the Amended and Restated 2000 Equity Incentive Plan of Tech Data Corporation | ||
| 10-AApp(25) |
— | Employment Agreement Between Tech Data Corporation and Robert M. Dutkowsky, dated October 2, 2006 | ||
| 10-AAqq(25) |
— | Form of Amended and Restated 2000 Equity Incentive Plan of Tech Data Corporation Notice of Grant and Grant Agreement for Restricted Stock Units | ||
| 10-AArr(27) |
— | Third Amended and Restated Credit Agreement dated as of March 20, 2007 (including related Amended and Restated Guaranty Agreement and Increditor Agreement) | ||
| 10-AAss(27) |
— | Third Omnibus Amendment dated as of March 20, 2007 | ||
| 10-AAtt(27) |
— | Amendment Number 11 to Transfer and Administration Agreement dated as of March 20, 2007 | ||
66
Table of Contents
| 10-AAuu(27) |
— | Indenture for New 2.75% Convertible Senior Debentures due 2026 between Tech Data and U.S. Bank National Association | ||
| 10-AAvv(28) |
— | Equity Incentive Bonus Plan | ||
| 10-AAxx(28) |
— | Trade Receivables Purchase Agreement | ||
| 10-AAyy(29) |
— | Amendment Number 12 to Transfer and Administration Agreement dated as of December 18, 2007 | ||
| 10-AAzz(30) |
— | First Amendment to Trade Receivables Purchase Agreement. | ||
| 10-BBa(31) |
— | Third Amended and Restated Lease Agreement dated June 27, 2008 | ||
| 10-BBb(31) |
— | Third Amended and Restated Credit Agreement dated June 27, 2008 | ||
| 10-BBc(31) |
— | Third Amended and Restated Participation Agreement dated June 27, 2008 | ||
| 10-BBd(32) |
— | Amendment No. 13 to Transfer and Administration Agreement dated as of October 22, 2008 | ||
| 10-BBe(34) |
— | 2009 Equity Incentive Plan of Tech Data Corporation | ||
| 10-BBf(35) |
— | Amendment Number 14 to Transfer and Administration Agreement dated as of October 16, 2009 | ||
| 10-BBg(1) |
— | Revolving Uncommitted Trade Receivables Purchase Agreement dated January 27, 2010 | ||
| 21-A(1) |
— | Subsidiaries of Registrant | ||
| 23-A(1) |
— | Consent of Ernst & Young LLP | ||
| 24(1) |
— | Power of Attorney (included on signature page) | ||
67
Table of Contents
| Exhibit |
Description | |||
| 31-A(1) |
— | Certification of Chief Executive Officer Pursuant to Exchange Act Rules 13a-14(a) and 15d-14(a), As Adopted Pursuant to Section 302 of the Sarbanes-Oxley Act of 2002 | ||
| 31-B(1) |
— | Certification of Chief Financial Officer Pursuant to Exchange Act Rules 13a-14(a) and 15d-14(a), As Adopted Pursuant to Section 302 of the Sarbanes-Oxley Act of 2002 | ||
| 32-A(1) |
— | Certification of Chief Executive Officer Pursuant to 18 U.S.C. Section 1350, as Adopted Pursuant to Section 906 of the Sarbanes-Oxley Act of 2002 | ||
| 32-B(1) |
— | Certification of Chief Financial Officer Pursuant to 18 U.S.C. Section 1350, as Adopted Pursuant to Section 906 of the Sarbanes-Oxley Act of 2002 | ||
| (1) | Filed herewith. |
| (2) | Incorporated by reference to the Exhibits included in the Company’s Form 10-K dated January 31, 2004, File No. 0-14625. |
| (3) | Incorporated by reference to the Exhibits included in the Company’s Form 8-K dated December 31, 2004, File No. 0-14625. |
| (4) | Incorporated by reference to the Exhibits included in the Company’s Form 10-Q for the quarter ended October 31, 1992, File No. 0-14625. |
| (5) | Incorporated by reference to the Exhibits included in the Company’s Registration Statement on Form S-8, File No. 33-41074. |
| (6) | Incorporated by reference to the Exhibits included in the Company’s Form 8-K dated December 8, 2004, File No. 0-14625. |
| (7) | Incorporated by reference to the Exhibits included in the Company’s Form 10-K for the year ended January 31, 1995, File No. 0-14625. |
| (8) | Incorporated by reference to the Exhibits included in the Company’s Definitive Proxy Statement for the 1995 Annual Meeting of Shareholders, File No. 0-14625. |
| (9) | Incorporated by reference to the Exhibits included in the Company’s Form S-4, File No. 0-14625. |
| (10) | Incorporated by reference to the Exhibits included in the Company’s Form 10-Q for the quarter ended July 31, 2000, File No. 0-14625. |
| (11) | Incorporated by reference to the Exhibits included in the Company’s Form 8-K dated August 27, 2004, File No. 0-14625. |
| (12) | Incorporated by reference to the Exhibits included in the Company’s Registration Statement on Form S-8, File No. 333-93801. |
| (13) | Incorporated by reference to the Exhibits included in the Company’s Registration Statement on Form S-8, File No. 333-59198. |
| (14) | Incorporated by reference to the Exhibits included in the Company’s Form 10-Q for the quarter ended July 31, 2001, File No. 0-14625. |
| (15) | Incorporated by reference to the Exhibits included in the Company’s Registration Statement on Form S-3, File No. 333-76858. |
| (16) | Incorporated by reference to the Exhibits included in the Company’s Definitive Proxy Statement for the 2003 Annual Meeting of Shareholders, File No. 0-14625. |
| (17) | Incorporated by reference to the Exhibits included in the Company’s Form 10-K for the year ended January 31, 2003, File No. 0-14625. |
| (18) | Incorporated by reference to the Exhibits included in the Company’s Form 10-Q for the quarter ended April 30, 2003, File No. 0-14625. |
| (19) | Incorporated by reference to the Exhibits included in the Company’s Form 10-Q for the quarter ended July 31, 2003, File No. 0-14625. |
| (20) | Incorporated by reference to the Exhibits included in the Company’s Form 10-Q for the quarter ended April 30, 2005, File No. 0-14625. |
| (21) | Incorporated by reference to the Exhibits included in the Company’s Form 10-Q for the quarter ended October 31, 2005, File No. 0-14625. |
| (22) | Certain information contained in this exhibit has been omitted and filed separately with the Commission pursuant to a confidential treatment request under 17 C.F.R. Sections 200.80(b)(4), 200.83 and 230.406. |
| (23) | Incorporated by reference to the Exhibits included in the Company’s Form 10-K for the year ended January 31, 2006, File No. 0-14625. |
| (24) | Incorporated by reference to the Exhibits included in the Company’s Form 10-Q for the quarter ended April 30, 2006, File No. 0-14625. |
| (25) | Incorporated by reference to the Exhibits included in the Company’s Form 10-Q for the quarter ended October 31, 2006, File No. 0-14625. |
| (26) | Incorporated by reference to the Exhibits included in the Company’s Form 8-K dated March 20, 2007, File No. 0-14625. |
| (27) | Incorporated by reference to the Exhibits included in the Company’s Form 10-K dated January 31, 2007, File No. 0-14625. |
| (28) | Incorporated by reference to the Exhibits included in the Company’s Form 10-Q dated April 30, 2007, File No. 0-14625. |
| (29) | Incorporated by reference to the Exhibits included in the Company’s Form 10-K dated January 31, 2008, File No. 0-14625. |
| (30) | Incorporated by reference to the Exhibits included in the Company’s Form 10-Q dated April 30, 2008, File No. 0-14625. |
| (31) | Incorporated by reference to the Exhibits included in the Company’s Form 10-Q dated July 31, 2008, File No. 0-14625. |
68
Table of Contents
| (32) | Incorporated by reference to the Exhibits included in the Company’s Form 10-Q dated October 31, 2008, File No. 0-14625. |
| (33) | Incorporated by reference to the Exhibits included in the Company’s Form 10-K dated January 31, 2009, File No. 0-14625. |
| (34) | Incorporated by reference to the Exhibits included in the Company’s Form 10-Q dated July 31, 2009, File No. 0-14625. |
| (35) | Incorporated by reference to the Exhibits included in the Company’s Form 10-K dated October 31, 2009, File No. 0-14625. |
69
Table of Contents
TECH DATA CORPORATION AND SUBSIDIARIES
VALUATION AND QUALIFYING ACCOUNTS
(In thousands)
| Activity | ||||||||||||||||
| Allowance for doubtful accounts receivable and sales returns |
Balance at beginning of period |
Charged to cost and expenses |
Deductions | Other(1) | Balance at end of period | |||||||||||
| January 31, |
||||||||||||||||
| 2010 |
$ | 55,598 | $ | 10,953 | $ | (38,564 | ) | $ | 26,640 | $ | 54,627 | |||||
| 2009 |
64,146 | 15,000 | (29,890 | ) | 6,342 | 55,598 | ||||||||||
| 2008 |
68,967 | 11,200 | (30,175 | ) | 14,154 | 64,146 | ||||||||||
| (1) | “Other” primarily includes recoveries, dispositions and the effect of fluctuations in foreign currency. |
70
Table of Contents
Pursuant to the requirements of Section 13 or 15(d) of the Securities Exchange Act of 1934, the registrant has duly caused this report to be signed on its behalf by the undersigned, thereunto duly authorized on March 24, 2010.
| TECH DATA CORPORATION | ||
| By |
/S/ ROBERT M. DUTKOWSKY | |
| Robert M. Dutkowsky | ||
| Chief Executive Officer | ||
POWER OF ATTORNEY
Each person whose signature to this Annual Report on Form 10-K appears below hereby appoints Jeffery P. Howells and David R. Vetter, or either of them, as his or her attorney-in-fact to sign on his or her behalf individually and in the capacity stated below and to file all amendments and post-effective amendments to this Annual Report on Form 10-K, and any and all instruments or documents filed as a part of or in connection with this Annual Report on Form 10-K or the amendments thereto, and the attorney-in-fact, or either of them, may make such changes and additions to this Annual Report on Form 10-K as the attorney-in-fact, or either of them, may deem necessary or appropriate.
Pursuant to the requirements of the Securities Exchange Act of 1934, this report has been signed below by the following persons on behalf of the registrant and in the capacities and on the dates indicated.
| Signature |
Title |
Date | ||
| /S/ ROBERT M. DUTKOWSKY |
Chief Executive Officer, Director | March 24, 2010 | ||
| Robert M. Dutkowsky | ||||
| /S/ JEFFERY P. HOWELLS |
Executive Vice President and Chief Financial Officer, Director (principal financial officer) |
March 24, 2010 | ||
| Jeffery P. Howells | ||||
| /S/ JOSEPH B. TREPANI |
Senior Vice President and Corporate Controller (principal accounting officer) |
March 24, 2010 | ||
| Joseph B. Trepani | ||||
| /S/ STEVEN A. RAYMUND |
Chairman of the Board of Directors | March 24, 2010 | ||
| Steven A. Raymund | ||||
| /S/ CHARLES E. ADAIR |
Director | March 24, 2010 | ||
| Charles E. Adair | ||||
| /S/ MAXIMILIAN ARDELT |
Director | March 24, 2010 | ||
| Maximilian Ardelt | ||||
| /S/ HARRY J. HARCZAK, JR. |
Director | March 24, 2010 | ||
| Harry J. Harczak, Jr. | ||||
| /S/ KATHY MISUNAS |
Director | March 24, 2010 | ||
| Kathy Misunas | ||||
| /S/ THOMAS I. MORGAN |
Director | March 24, 2010 | ||
| Thomas I. Morgan | ||||
71
Table of Contents
| Signature |
Title |
Date | ||
| /S/ DAVID M. UPTON |
Director | March 24, 2010 | ||
| David M. Upton | ||||
| /S/ JOHN Y. WILLIAMS |
Director | March 24, 2010 | ||
| John Y. Williams | ||||
72