Attached files
| file | filename |
|---|---|
| EX-23 - EXHIBIT 23 - JACOBS ENGINEERING GROUP INC /DE/ | exhibit23final.htm |
| EX-95 - EXHIBIT 95 - JACOBS ENGINEERING GROUP INC /DE/ | exhibit9511.htm |
| EX-32.2 - EXHIBIT 32.2 - JACOBS ENGINEERING GROUP INC /DE/ | exhibit32211.htm |
| EX-32.1 - EXHIBIT 32.1 - JACOBS ENGINEERING GROUP INC /DE/ | exhibit32111.htm |
| EX-31.2 - EXHIBIT 31.2 - JACOBS ENGINEERING GROUP INC /DE/ | exhibit31211.htm |
| EX-31.1 - EXHIBIT 31.1 - JACOBS ENGINEERING GROUP INC /DE/ | exhibit31111.htm |
| EX-21 - EXHIBIT 21 - JACOBS ENGINEERING GROUP INC /DE/ | exhibit21final.htm |
| EX-10.17 - EXHIBIT 10.17 - JACOBS ENGINEERING GROUP INC /DE/ | exhibit1017finalmandel.htm |
UNITED STATES
SECURITIES AND EXCHANGE COMMISSION
Washington, D.C. 20549
_________________________________________________________________
FORM 10-K
ANNUAL REPORT PURSUANT TO
SECTION 13 OR 15(d) OF THE SECURITIES EXCHANGE ACT OF 1934
For the fiscal year ended September 28, 2018 Commission File No. 1-7463
_________________________________________________________________
Jacobs Engineering Group Inc.
Delaware | 95-4081636 | |
State of incorporation | IRS Employer identification number | |
1999 Bryan Street, Suite 1200 Dallas, Texas 75201 | (214) 583-8500 | |
Address of principal executive offices | Telephone number (including area code) | |
Securities registered pursuant to Section 12(b) of the Act:
_________________________________________________________________
Title of Each Class | Name of Each Exchange on Which Registered | |
Common Stock, $1 par value | New York Stock Exchange | |
Securities registered pursuant to Section 12(g) of the Act: None
_________________________________________________________________
Indicate by check-mark if the Registrant is a well-known seasoned issuer, as defined in Rule 405 of the Securities Act: ☒ Yes ☐ No
Indicate by check-mark if the Registrant is not required to file reports pursuant to Section 13 or 15(d) of the Act. ☐ Yes ☒ No
Indicate by check-mark whether the Registrant (1) has filed all reports required to be filed by Section 13 or 15(d) of the Securities Exchange Act of 1934 during the preceding 12 months (or for such shorter period that the Registrant was required to file such reports), and (2) has been subject to such filing requirements for the past 90 days. ☒ Yes ☐ No
Indicate by check-mark whether the Registrant: has submitted electronically every Interactive Data File required to be submitted pursuant to Rule 405 of Regulation S-T (§232.405 of this chapter) during the preceding 12 months (or for such shorter period that the Registrant was required to submit such files). ☒ Yes ☐ No
Indicate by check-mark if disclosure of delinquent filers pursuant to Item 405 of Regulation S-K (§229.405 of this chapter) is not contained herein, and will not be contained, to the best of the Registrant’s knowledge, in definitive proxy or information statements incorporated by reference in Part III of this Form 10-K or any amendment to this Form 10-K. ☒
Indicate by check-mark whether the Registrant is a large accelerated filer, an accelerated filer, a non-accelerated filer or a smaller reporting company. See the definitions of “large accelerated filer”, “accelerated filer” and “smaller reporting company” in Rule 12b-2 of the Exchange Act.
Large accelerated filer | ☒ | Accelerated filer | ☐ | |||
Non-accelerated filer | ☐ | Smaller reporting company | ☐ | |||
Emerging growth company | ☐ | |||||
If an emerging growth company, indicate by check mark if the registrant has elected not to use the extended transition period for complying with any new or revised financial accounting standards provided pursuant to Section 13(a) of the Exchange Act. ☐
Indicate by check-mark whether the Registrant is a shell company (as defined in Rule 12b-2 of the Act) ☐ Yes ☒ No
There were 142,263,898 shares of common stock outstanding as of November 12, 2018. The aggregate market value of the Registrant’s common equity held by non-affiliates was approximately $8.3 billion as of March 30, 2018, based upon the last reported sales price on the New York Stock Exchange on that date.
DOCUMENTS INCORPORATED BY REFERENCE
Portions of the Registrant’s definitive proxy statement to be issued in connection with its 2019 annual meeting of shareholders are incorporated by reference into Part III of this Annual Report on Form 10-K where indicated.
JACOBS ENGINEERING GROUP INC.
Fiscal 2018 Annual Report on Form 10-K
Explanatory Note
On November 20, 2018, Jacobs Engineering Group Inc. (the “Company”) issued a press release announcing its financial results for the fiscal year ended September 28, 2018 and certain other financial information. A copy of the press release was attached to a Form 8-K furnished by the Company to the Securities and Exchange Commission on November 20, 2018. As previously noted by Company management, at the time it issued such press release the Company was continuing to finalize its year end audit processes, including with respect to income taxes. In that regard, the Company’s final 2018 income tax expense also includes approximately $15.0 million in deferred income taxes associated with adjustments with respect to valuation allowances on foreign tax credits associated with the acquisition of the CH2M business that had not been included in the Company’s press release. The impact of these adjustments was, on a U.S. GAAP basis, $(0.10) per share for the fourth quarter and $(0.11) per share for the fiscal year ended September 28, 2018. These revised amounts are included in the results reported in this Form 10-K. These adjustments do not impact the adjusted EPS results for the fourth quarter or the fiscal year ended September 28, 2018 reported in the press release. In connection with these adjustments, the Company’s management identified a material weakness in the Company’s internal control over financial reporting. See Item 9A, "Controls and Procedures" in this Form 10-K.
Page 2
JACOBS ENGINEERING GROUP INC.
Fiscal 2018 Annual Report on Form 10-K
Table of Contents
Item | Page No. | |||||
Item 1. | Page 4 | |||||
Item 1A. | Page 13 | |||||
Item 1B. | Page 31 | |||||
Item 2. | Page 31 | |||||
Item 3. | Page 31 | |||||
Item 4. | Page 31 | |||||
Item 5. | Page 32 | |||||
Item 6. | Page 33 | |||||
Item 7. | Page 34 | |||||
Item 7A. | Page 52 | |||||
Item 8. | Page 52 | |||||
Item 9. | Page 53 | |||||
Item 9A. | Page 53 | |||||
Item 9B. | Page 54 | |||||
Item 10. | Page 55 | |||||
Item 11. | Page 55 | |||||
Item 12. | Page 55 | |||||
Item 13. | Page 56 | |||||
Item 14. | Page 56 | |||||
Item 15. | Page 57 | |||||
Page 62 | ||||||
Page 3
PART I
FORWARD-LOOKING STATEMENTS
In addition to historical information, this Annual Report on Form 10-K contains forward-looking statements within the meaning of the Private Securities Litigation Reform Act of 1995, including, among other things, statements regarding our future operations, financial condition, and business strategies and future economic and industry conditions. Forward-looking statements are statements that do not directly relate to any historical or current fact. When used herein, words such as "expects," "anticipates," "believes," "seeks," "estimates," "plans," "intends," “future,” “will,” “would,” “could,” “can,” “may,” and similar words are intended to identify forward-looking statements. You should not place undue reliance on these forward-looking statements. Although such statements are based on management’s current estimates and expectations and/or currently available competitive, financial, and economic data, forward-looking statements are inherently uncertain and involve risks and uncertainties that could cause our actual results to differ materially from what may be inferred from the forward-looking statements. Factors that could cause or contribute to such differences include, but are not limited to, those listed and discussed in Item 1A— Risk Factors below. We undertake no obligation to release publicly any revisions or updates to any forward-looking statements. We encourage you to read carefully the risk factors described herein and in other documents we file from time to time with the United States Securities and Exchange Commission (the "SEC").
Unless the context otherwise requires, all references herein to "Jacobs" or the "Registrant" are to Jacobs Engineering Group Inc. and its predecessors, and references to the "Company", "we", "us" or "our" are to Jacobs Engineering Group Inc. and its consolidated subsidiaries.
Item 1. | BUSINESS |
General Background Information
We are one of the largest technical professional services firms in the world. We provide a diverse range of technical, professional and construction services to a large number of industrial, commercial and governmental clients.
We focus our services on clients operating in the following sectors:
• | Water; |
• | Environmental; |
• | Transportation; |
• | Programs for various national governments, including aerospace, defense and nuclear programs; |
• | Buildings and advanced facilities (including specialized building for clients operating in the fields of healthcare, education and high technology, governmental complexes, other specialized civic and mission critical buildings, installations and laboratories and retail and commercial buildings); |
• | Infrastructure and telecommunications; |
• | Food and consumer products; |
• | Technology and manufacturing; |
• | Power; |
• | Pulp and paper; |
• | Oil and gas exploration, production and refining; and |
• | Chemicals and polymers, among others. |
Jacobs was founded in 1947 and incorporated as a Delaware corporation in 1987. We are headquartered in Dallas, Texas, USA and provide our services through more than 200 offices located around the globe in North America, South America, Europe, the Middle East, India, Australia, Africa and Asia.
How We Operate
As a broad-based technical professional services firm, we offer a range of services to help our clients maintain a competitive edge in their respective markets. From consulting and feasibility studies to design, engineering, construction, start-up and commissioning and then to operations and maintenance, we customize our services to meet business and project goals. Our
Page 4
global network of professionals work with a multi-office approach in an effort to provide clients with the best, most economical project or program solutions.
We strive to provide client value through continuous improvement in our performance. We regularly monitor our clients' expectations, our project delivery protocols and system, and our operational performance. Tools such as our Jacobs Value Enhancing Practices, Global Standard Operating Procedures, project reviews, the Jacobs System to Ensure Project Success ("JSTEPS") and Safe Plans of Action ("SPAs") provide added value to our clients' projects. They also allow us to create performance improvement actions during the project execution. Through continuous improvement, with our tools and our processes, we believe we can offer our clients superior value when they do business with us.
JacobsValue+ SM ("Value Plus") is an internal tool we use to document and quantify the actual value or savings we provide to our clients and their projects. Some of the benefits achieved through the Value Plus program include lower total installed costs, shorter schedules and reduced life cycle costs. Value Plus is implemented at project initiation: a project goal is created and cost-saving ideas are entered into the Value Plus database. When the Value Plus cycle is complete, the project team and client identify and agree on the unique cost and/or schedule reductions for the project.
The Company’s Strategy
Our strategy is based on three key priorities:
• | Build a High Performance Culture - Reinforce a culture of accountability, inspirational leadership and innovation that will drive long-term outperformance; |
• | Transform the Core - Fundamentally change the way we operate to improve project delivery, sales effectiveness and business excellence; and |
• | Grow Profitably - Execute a balanced strategy focused on organic growth, mergers and acquisitions and active portfolio management to drive profitable growth in the most attractive sectors and geographies. |
Employees and Safety
Our employees are our most important and valuable asset. The prevention of job-related injuries is given top priority. It is the policy of the Company to provide and maintain a safe and healthy working environment and to follow operating practices that safeguard all employees and result in a more efficient operation. BeyondZero® is the name of the global program that promotes our culture of caring and goes beyond efforts to have an incident and injury-free safety performance. We implement a culture of caring where concern for employees' health, safety and welfare extends outside the office, beyond the project site fences and into their homes, cars and all the places where they interact with family, friends and fellow employees. We also have a mental health program that aims to promote positive mental health across our Company.
We strive to present a clear and consistent image of our Company to our clients, employees, shareholders and business partners, regarding how we behave, how we communicate, how we look and most importantly, how our promises to our clients are delivered, anywhere in the world.
We accomplish this foremost through our vision, mission and values, which allow us to behave as one company and unify us worldwide. By keeping our values as a central focus of our Company, we are able to think the same way and arrive at similar conclusions, regardless of our physical location. With respect to our values:
•Our values stand on a foundation of safety and integrity;
•People are the heart of our business;
•Clients are our valued partners;
•Performance excellence is our commitment; and
•Profitable growth is an imperative.
Our Vision statement, “Providing solutions for a more connected sustainable world” underpins our commitment to sustainability. Plan Beyond is how we define and identify our approach to sustainability. Building on BeyondZero and our culture of caring, Plan Beyond helps us to focus on looking beyond our company and how we contribute as a global corporate citizen. Our sustainability activities encompass stakeholders at Jacobs including our clients, our people and wider communities, our supply chain partners and our investors. Our people are empowered to explore, to innovate and to develop solutions that help our clients deliver their sustainability goals. We have the experience and competency to assist our clients with the challenges of climate change, resilience of cities and infrastructure, efficient procurement, resource reuse and recycling, water resource management, energy source management and environmental protection and enhancement.
Page 5
As our Company values espouse, people are the heart of our business. It is the talent of our people that is the key to our contribution to achieving our company vision. By their innovation and determination to embed sustainability into their design and delivery of service, we will contribute significantly to address the challenges facing sustainability through the thousands of clients and their stakeholders, whom we work with every year.
Applying the best, most efficient and effective sustainable solutions for clients worldwide, in all major industries in which our clients operate, allows us to make a significant contribution to a safe and sustainable future. We periodically issue a Sustainability Report that describes many of our efforts and accomplishments regarding sustainability.
With respect to human resources, our goal is to establish an inclusive, diverse workplace that energizes the people who fuel our Company's growth. Although we are a large company with a workforce of approximately 80,000 people in over 40 countries, our employees are unified in their focus on superior value, safety and ethical business practices regardless of the country in which they work and employees frequently move around the globe as they grow their careers.
Growth Strategy
Jacobs has grown significantly since its founding in 1947. Both organic growth and strategic acquisitions play an important part of the Company’s growth strategy. We have acquired and integrated numerous companies over the years that have enhanced our capabilities, geographic reach and offerings.
In terms of organic growth, our relationship-based business model is central to our sustained growth and profitability. We pursue the development of long-term relationships and alliances with our clients. By working with our clients to solve their challenges, we increase our understanding of their overall business needs, as well as the unique technical requirements of their specific projects. This increased understanding enables us to provide superior value to our clients. Our approach provides us with opportunities to market the following services to our clients:
• | Consulting; |
• | System enhancements; |
• | Pre-design phases of large projects, which include master planning, project permitting and project finance options; |
• | Design phase; and |
• | Construction, post-start-up and commissioning phases of a facility, including operations and maintenance services. |
Our relationships with clients also present ongoing opportunities to expand into adjacent sectors. For example, clients operating in the mining and minerals market often have a need for our infrastructure and buildings capabilities. The same is true for clients operating in other sectors.
We market our services to clients in a wide range of public, institutional, process and industrial sectors. We are able to price contracts competitively and enhance overall profitability while delivering additional value to our clients by integrating and bundling our services and providing differentiated solutions. In complex economic times, we believe we have the ability to evolve along with industry cycles worldwide. When opportunities decrease in a particular sector or geography, other opportunities often increase. Because of our focused industry diversity, we believe we are well positioned to address a wide range of opportunities across many sectors and geographies, which helps us grow our business.
The Role of Strategic Transactions in the Development of Our Business
Jacobs pursues acquisitions, divestitures and other transactions to drive long-term value and profitable growth by positioning us in the most attractive sectors and geographies. When we review acquisition targets, we are conscious of the effect the acquisition may have on our client base. We favor acquisitions that are aligned with our growth strategy, which target enhancements of our capabilities and add value to our customers and shareholders. We do this by (i) expanding into a new client sector; (ii) enhancing the range of services we provide existing clients; and/or (iii) accessing new geographic areas in which our clients either already operate or plan to expand. By expanding into new geographic areas and adding to our existing technical and project management capabilities, we strive to position ourselves as a preferred, single-source provider of technical, professional, and construction services to our clients.
See the following brief description of some of our recent key acquisitions:
Page 6
• | On December 15, 2017, we acquired CH2M HILL Companies, Ltd (CH2M) headquartered in Denver, Colorado. CH2M provides international engineering, construction and technical services. |
• | On August 31, 2017, we acquired Blue Canopy, LLC headquartered in Reston, Virginia. Blue Canopy provides data analytics, cybersecurity and application development. |
• | On January 27, 2017, we acquired Aquenta Consulting Pty Ltd. (“Aquenta”) headquartered in Sydney, Australia. Aquenta provides integrated project services. |
• | On April 12, 2016, we acquired The Van Dyke Technology Group, Inc. (“Van Dyke”) headquartered in Columbia, Maryland. Van Dyke provides advanced cybersecurity services and solutions designed to protect sensitive information within classified networks, with a focus on supporting the U.S. Intelligence Community. |
• | On December 7, 2015, we acquired J.L. Patterson & Associates (“JLP”) headquartered in Orange, California. JLP is a consulting and professional services engineering firm specializing in rail planning, environmental permitting, design and construction management. It provides services to numerous public transit agencies and is a major provider of professional consulting services to Class 1 railroads across the U.S. |
In line with our strategy of driving long-term value and profitable growth, on October 21, 2018, Jacobs and WorleyParsons Limited, a company incorporated in Australia (“Buyer”), entered into a Stock and Asset Purchase Agreement pursuant to which Buyer agreed to acquire the Company’s Energy, Chemicals and Resource business (the "ECR Business") for an aggregate purchase price of $3.3 billion. The Transaction is expected to close in the first half of calendar year 2019.
For additional information regarding certain issues related to our acquisition strategy, please refer to Item 1A- Risk Factors below.
Lines of Business
During the second quarter of fiscal 2018, we reorganized our operating and reporting structure around three global lines of business (“LOBs”), which also serve as the Company’s operating segments: (i) Aerospace, Technology, Environmental and Nuclear, (ii) Buildings, Infrastructure and Advanced Facilities, and (iii) Energy, Chemicals and Resources. This reorganization occurred in conjunction with the integration of CH2M into the Company's legacy businesses, and was intended to better serve our global clients, leverage our workforce, help streamline operations and provide enhanced growth opportunities. The Company’s LOB leadership and internal reporting structures report to the Chief Executive Officer, who is also the Chief Operating Decision Maker (“CODM”), and enable the CODM to evaluate the performance of each of these segments and make appropriate resource allocations among each of the segments. The sales function is managed on an LOB basis, and accordingly, the associated cost is embedded in the new segments and reported to the respective LOB presidents. In addition, a portion of the costs of other support functions (e.g., finance, legal, human resources and information technology) is allocated to each LOB using methodologies which, we believe, effectively attribute the cost of these support functions to the revenue generating activities of the Company on a rational basis. The cost of the Company’s cash incentive plan, the Management Incentive Plan (“MIP”) and the expense associated with the Jacobs Engineering Group Inc. 1999 Stock Incentive Plan (“1999 SIP”) have likewise been charged to the LOBs except for those amounts determined to relate to the business as a whole (which amounts remain in other corporate expenses).
Segments
As discussed above, the services we provide fall into the following three lines of business (“LOB”): (i) Aerospace, Technology, Environmental and Nuclear, (ii) Buildings, Infrastructure, and Advanced Facilities and (iii) Energy, Chemicals and Resources which are also the Company’s reportable segments.
For additional information regarding our segments, including information about our financial results by segment and financial results by geography, see Note 17 - Segment Information of Notes to Consolidated Financial Statements beginning on page F-1 of this Annual Report on Form 10-K.
Aerospace, Technology, Environmental and Nuclear (ATEN)
We provide an in-depth range of scientific, engineering, construction, nuclear, environmental and technical support services to the aerospace, defense, technical and automotive industries in several countries. Long-term clients include the Ministry of Defence in the U.K., the U.K. Nuclear Decommissioning Authority, NASA, the U.S. Department of Energy ("DoE"), the U.S. Department of Defense (“DoD”), the U.S. Special Operations Command ("USSOCOM"), the U.S. Intelligence community and the Australian Department of Defence. Specific to NASA, one of our major government customers in the U.S., is our ability to design, build, operate and maintain highly complex facilities relating to space systems, including test and evaluation facilities, launch facilities and support infrastructure. We provide support to all phases of the nuclear life-cycle from initial planning through design, construction, commissioning, operations and decommissioning/decontamination on government sites within the U.S. and Canada
Page 7
and on both government and commercial sites in the U.K. We provide environmental characterization and restoration services to commercial and government customers both in the U.S. and U.K. This includes designing, building and operating high hazard remediation systems including for radiologically contaminated media.
In addition, we design and build aerodynamic, climatic, altitude and acoustic facilities in support of the automotive industry, as well as provide a wide range of services in the telecommunications market.
Our experience in the defense sector includes military systems acquisition management and strategic planning; operations and maintenance of test facilities and ranges; test and evaluation services in computer, laboratory, facility and range environments; test facility computer systems instrumentation and diagnostics; and test facility design and build. We also provide systems engineering and integration of complex weapons and space systems, as well as hardware and software design of complex flight and ground systems.
We have provided advanced technology engineering services to the DoD for more than 50 years, and currently support major defense programs in the U.S. and internationally. We operate and maintain several DoD test centers and provide services and assist in the acquisition and development of systems and equipment for Special Operations Forces, as well as the development of biological, chemical, and nuclear detection and protection systems.
We maintain enterprise information systems for government and commercial clients worldwide, ranging from the operation of complex computational networks to the development and validation of specific software applications. We also support the DoD and the intelligence community in a number of information technology programs, including network design, integration, and support; command and control technology; development and maintenance of databases and customized applications; and cyber security solutions.
Buildings, Infrastructure and Advanced Facilities (BIAF)
We provide services to broad sectors including buildings, water, transportation (roads, rail, aviation and ports) and advanced facilities for life sciences, semiconductors, data centers, consumer products and other advanced manufacturing operations throughout North America, Europe, India, the Middle East, Australia and Asia. Our representative clients include national government departments/agencies in the U.S., Europe, U.K., Australia and Asia, state and local departments of transportation within the U.S. and private industry firms.
Typical projects include providing development/rehabilitation plans for highways, bridges, transit, tunnels, airports, railroads, intermodal facilities and maritime or port projects. Our interdisciplinary teams can work independently or as an extension of the client’s staff. We have experience with alternative financing methods, which have been used in Europe through the privatization of public infrastructure systems.
Our water infrastructure group aids emerging economies, which are investing heavily in water and wastewater systems and governments in North America and Europe, which are addressing the challenges of drought and an aging infrastructure system. We develop or rehabilitate critical water resource systems, water/wastewater conveyance systems and flood defense projects. We provide full life cycle services including engineering design, construction management, design build and operations and maintenance.
We also plan, design and construct buildings for a variety of clients and markets. We believe our global presence and understanding of contracting and delivery demands keep us well positioned to provide professional services worldwide. Our diversified client base encompasses both public and private sectors and relates primarily to institutional, commercial, government and corporate buildings, including projects at many of the world's leading medical and research centers, and universities. We focus our efforts and resources in two areas: where capital-spending initiatives drive demand, and where changes and advances in
technology require innovative, value-adding solutions. We also provide integrated facility management services (sometimes through joint ventures with third parties) for which we assume responsibility for the ongoing operation and maintenance of entire commercial or industrial complexes on behalf of clients.
We have specific capabilities in energy and power, master planning, and commissioning of office headquarters, aviation facilities, mission-critical facilities, municipal and civic buildings, courts and correctional facilities, mixed-use and commercial centers, healthcare and education campuses and recreational complexes. For advanced technology clients, who require highly specialized buildings in the fields of medical research, nano science, biotechnology and laser sciences, we offer total integrated design and construction management solutions. We also have global capabilities in the pharma-bio, data center, government
intelligence, corporate headquarters/interiors and science and technology-based education markets. Our government building projects include large, multi-year programs in the U.S. and Europe supporting various U.S. and U.K. government agencies.
Page 8
We provide our Life Sciences clients single-point consulting, engineering, procurement, construction management and validation project delivery, enabling us to execute capital programs on a single-responsibility basis. Typical projects in the life sciences sector include laboratories, research and development facilities, pilot plants, bulk active pharmaceutical ingredient production facilities, full-scale biotechnology production facilities and tertiary manufacturing facilities. Our manufacturing business areas include the Food & Beverage, Consumer Products and Pulp & Paper markets.
We provide services relating to modular construction, as well as other consulting and strategic planning to help our clients complete capital projects faster and more efficiently.
In addition, we offer services in containment, barrier technology, locally controlled environments, building systems automation and off-the-site design and fabrication of facility modules, as well as vaccine production and purification and aseptic processing.
Energy, Chemicals and Resources (ECR)
We serve the energy, chemicals and resources sectors, including upstream, midstream and downstream oil, gas, refining, chemicals and mining and minerals industries. We provide integrated delivery of complex projects for our Oil and Gas, Refining and Petrochemicals clients. Bridging the upstream, midstream and downstream industries, our services encompass consulting, engineering, procurement, construction, maintenance and project management.
We provide services relating to onshore and offshore oil and gas production facilities, including fixed and floating platforms and subsea tie-backs, as well as full field development solutions, including processing facilities, gathering systems, transmission pipelines and terminals. Our heavy oil experience makes us a leader in upgrading, steam-assisted gravity drainage and in-situ oil sands projects. We have developed modular well pad and central processing facility designs. We also provide fit-for-purpose and standardized designs in the onshore conventional and unconventional space, paying particular attention to water and environmental issues.
In addition, we provide our refining customers with feasibility/economic studies, technology evaluation and conceptual engineering, front end loading (FEED), detailed engineering, procurement, construction, maintenance and commissioning services. We deliver installed engineering, procurement and construction (EPC) solutions as to grass root plants, expansions and revamps of existing units. We have engineering alliances and maintenance programs that span decades with core clients. With the objective of driving our clients’ total installed costs down, we endeavor to leverage emerging market sourcing and high value engineering. Our Comprimo Sulfur Solutions® is a significant technology for gas treatment and sulfur recovery plants around the world.
We provide services to technically complex petrochemical facilities, from new manufacturing complexes to expansions and modifications and management of plant relocations. We have experience with many licensed technologies, integrated basic petrochemicals, commodity and specialty chemicals projects and olefins, aromatics, synthesis gas and their respective derivatives.
Our mining and minerals business targets the non-ferrous and ferrous metal markets, precious metals, energy minerals (uranium, coal, oil sands), and industrial and fertilizer minerals (borates, trona, phosphates and potash). We work with many resource companies undertaking new and existing facility upgrades, process plant and underground and surface material handling and infrastructure developments.
We offer project management, front-end studies, full engineering, procurement and construction management (“EPCM”), and engineering, procurement and construction (“EPC”) capabilities and completions, commissioning and start-up services specializing in new plant construction, brownfield expansions and sustaining capital and maintenance projects. We are also able to deliver value to our mining clients by providing distinctive adjacent large infrastructure capabilities to support their mining operations.
We provide a wide range of services, technology and manufactured equipment through our specialty chemicals group, where we own and license our proprietary technology. Our specialty chemicals areas are focused on sulfuric acid, sulphur, bleaching chemicals for pulp & paper and synthetic chemicals and manufactured equipment.
Our global Field Services unit supports construction and operations and maintenance (“O&M”) across the company and performs our direct hire services.
Our construction activities include providing both construction management services and traditional field construction services to our clients. Historically, our field construction activities focused primarily on those construction projects where we perform much of the related engineering and design work (EPC/EPCM). However, we deliver construction-only projects when we
Page 9
have negotiated pricing and other contract terms we deem acceptable and which result in a fair return for the degree of risk we assume.
In our O&M business, we provide all services required to operate and maintain large, complex facilities on behalf of clients including asset management, direct hire maintenance and operations, complex turn-around planning and execution and small capital programs. We provide key management and support services over all aspects of the operations of a facility, including managing subcontractors and other on-site personnel.
Backlog
Backlog is not a defined measure and our methodology for determining backlog may vary from the methodology used by other companies. Currently, we report a combined backlog number based upon the legacy reporting methodologies used by Jacobs and the acquired business of CH2M prior to the acquisition while we work to harmonize these reporting methodologies as part of the Company's integration activities underway.
We include in backlog the total dollar amount of revenues we expect to record in the future as a result of performing work under contracts that have been awarded to us. Our policy with respect to O&M contracts, however, is to include in backlog the amount of revenues we expect to receive for one succeeding year, regardless of the remaining life of the contract. For national government programs (other than national government O&M contracts, which are subject to the same policy applicable to all other O&M contracts), our policy is to include in backlog the full contract award, whether funded or unfunded, excluding option periods. Because of variations in the nature, size, expected duration, funding commitments and the scope of services required by our contracts, the timing of when backlog will be recognized as revenues can vary greatly between individual contracts.
Consistent with industry practice, substantially all of our contracts are subject to cancellation or termination at the option of the client, including our U.S government work. While management uses all information available to it to determine backlog, at any given time our backlog is subject to changes in the scope of services to be provided as well as increases or decreases in costs relating to the contracts included therein. Backlog is not necessarily an indicator of future revenues.
Because certain contracts (e.g., contracts relating to large EPC projects as well as national government programs) can cause large increases to backlog in the fiscal period in which we recognize the award, and because many of our contracts require us to provide services that span over a number of fiscal quarters (and sometimes over fiscal years), we evaluate our backlog on a year-over-year basis, rather than on a sequential, quarter-over-quarter basis.
The following table summarizes our backlog for the years ended September 28, 2018, September 29, 2017 and September 30, 2016 (in millions):
September 28, 2018 | September 29, 2017 | September 30, 2016 | ||||||||||
Aerospace, Technology, Environmental and Nuclear | $ | 8,857 | $ | 6,358 | $ | 4,472 | ||||||
Buildings, Infrastructure and Advanced Facilities | 11,376 | 6,789 | 7,063 | |||||||||
Energy, Chemicals and Resources | 7,066 | 6,642 | 7,226 | |||||||||
Total | $ | 27,299 | $ | 19,789 | $ | 18,761 | ||||||
For additional information regarding our backlog including those risk factors specific to backlog, please refer to Item 1A - Risk Factors, and Item 7 - Management’s Discussion and Analysis of Financial Condition and Results of Operations below. Subject to the factors discussed in Item 1A - Risk Factors, we estimate that approximately $10 billion, or 36%, of total backlog at September 28, 2018 will be realized as revenues within the next fiscal year.
Significant Customers
The following table sets forth the percentage of total revenues earned directly or indirectly from agencies of the U.S. federal government for each of the last five fiscal years:
2018 | 2017 | 2016 | 2015 | 2014 | ||||
23% | 19% | 21% | 22% | 18% | ||||
Page 10
Given the percentage of total revenue derived directly from the U.S. federal government, the loss of U.S. federal government agencies as customers would have a material adverse effect on the Company. In addition, any or all of our government contracts could be terminated, we could be suspended or debarred from all government contract work, or payment of our costs could be disallowed. Approximately 94% of revenue derived directly from the U.S. federal government is in the ATEN segment. For more information on risks relating to our government contracts, see Item 1A - Risk Factors.
Financial Information About Geographic Areas
Selected financial information regarding the geographic areas in which we operate is included in Note 17 - Segment Information of Notes to Consolidated Financial Statements beginning on page F-1 of this Annual Report on Form 10-K and is incorporated herein by reference. For fiscal 2018, approximately 36% of our revenues were earned from clients outside the United States. Our international operations are subject to a variety of risks, which are described under Item 1A - Risk Factors below.
Contracts
While there is considerable variation in the pricing provisions of the contracts we undertake, our contracts generally fall into two broad categories: cost-reimbursable and fixed-price. The following table sets forth the percentages of total revenues represented by these types of contracts for each of the last five fiscal years:
2018 | 2017 | 2016 | 2015 | 2014 | |||||
Cost-reimbursable | 76% | 81% | 82% | 83% | 83% | ||||
Fixed-price | 24% | 19% | 18% | 17% | 17% | ||||
In accordance with industry practice, most of our contracts (including those with the U.S. federal government) are subject to termination at the discretion of the client, which is discussed in greater detail in Item 1A - Risk Factors. In such situations, our contracts typically provide for reimbursement of costs incurred and payment of fees earned through the date of termination.
When we are directly responsible for engineering, design, procurement and construction of a project or the maintenance of a client’s plant or facility, we reflect the costs of materials, equipment and subcontracts in both revenues and costs. The following table sets forth the approximate amount of such pass-through costs included in revenues for each of the last five fiscal years (in millions of dollars):
2018 | 2017 | 2016 | 2015 | 2014 | ||||||||||||||
$ | 3,058.6 | $ | 2,539.3 | $ | 2,489.9 | $ | 2,602.6 | $ | 2,954.9 | |||||||||
On other projects, where the client elects to pay for such items directly and we have no associated responsibility for such items, these amounts are not reflected in either revenues or costs.
Cost-Reimbursable Contracts
Cost-reimbursable contracts generally provide for reimbursement of costs incurred plus an amount of profit. The profit element may be in the form of a simple mark-up applied to the labor costs incurred or it may be in the form of a fee, or a combination of a mark-up and a fee. The fee element can also take several forms. The fee may be a fixed amount; it may be an amount based on a percentage of the costs incurred; or it may be an incentive fee based on targets, milestones, or performance factors defined in the contract. In general, we prefer cost-reimbursable contracts because we believe the primary reason for awarding a contract to us should be our technical expertise and professional qualifications rather than price.
Fixed-Price Contracts
Fixed-price contracts include both “lump sum bid” contracts and “negotiated fixed-price” contracts. Under lump sum bid contracts, we typically bid against other contractors based on client-furnished specifications. This type of pricing presents certain inherent risks, including the possibility of ambiguities in the specifications received, problems with new technologies, and economic and other changes that may occur over the contract period. Additionally, it is not unusual for lump sum bid contracts to lead to an adversarial relationship with clients, which is contrary to our relationship-based business model. Accordingly, lump sum bid contracts are not our preferred form of contract, and, as such, the Company has rarely entered into individual lump sum bid contracts that are material to its financial results. In contrast, under a negotiated fixed-price contract, we are selected as the contractor first and then we negotiate a price with our client. Negotiated fixed-price contracts frequently exist in single-responsibility arrangements where we perform some portion of the work before negotiating the total price of the project. Thus,
Page 11
although both types of contracts involve a firm price for the client, the lump sum bid contract provides the greater degree of risk to us. However, because of economies that may be realized during the contract term, both negotiated fixed-price and lump sum bid contracts may offer greater profit potential than other types of contracts. The Company carefully manages the risk inherent in these types of contracts. In recent years, most of our fixed-price work has been either negotiated fixed-price contracts or lump sum bid contracts for project services, rather than turnkey construction.
Competition
We compete with a large number of companies across the world. Typically, no single company or companies dominate the market in which we provide services. We compete based on the following factors, among others: price of services, technical capabilities, reputation for quality, safety record, availability of qualified personnel, ability to timely perform work and willingness to accept project-related risk. For more information regarding the competitive conditions in our business, please refer to Item 1A - Risk Factors below.
Employees
At September 28, 2018, we had approximately 74,400 full-time, staff employees (including contract staff). Additionally, as of September 28, 2018, there were approximately 6,400 persons employed in the field on a project basis. The number of field employees varies in relation to the number and size of the maintenance and construction projects in progress at any particular time.
Executive Officers of the Registrant
The information required by Paragraph (a), and Paragraphs (c) through (g) of Item 401 of Regulation S-K (except for information required by Paragraph (e) of that Item to the extent the required information pertains to our executive officers) and Item 405 of Regulation S-K is set forth under the captions “Members of the Board of Directors” and “Section 16(a) Beneficial Ownership Reporting Compliance” in our definitive proxy statement to be filed with the SEC pursuant to Regulation 14A within 120 days after the close of our fiscal year and is incorporated herein by reference.
The following table presents the information required by Paragraph (b) of Item 401 of Regulation S-K.
Name | Age | Position with the Company | Year Joined the Company | ||||
Steven J. Demetriou | 60 | Chairman and Chief Executive Officer | 2015 | ||||
Kevin C. Berryman | 59 | Executive Vice President and Chief Financial Officer | 2014 | ||||
Terence D. Hagen | 54 | Chief Operating Officer | 1987 | ||||
Robert V. Pragada | 50 | Chief Operating Officer | 2016 | ||||
Vinayak R. Pai | 52 | President, Energy, Chemicals and Resources | 2013 | ||||
Joanne Caruso | 58 | Chief Legal and Administration Officer | 2012 | ||||
William B. Allen, Jr. | 54 | Senior Vice President and Chief Accounting Officer | 2016 | ||||
Michael R. Tyler | 62 | Senior Vice President, General Counsel and Chief Compliance Officer | 2013 | ||||
All of the officers listed in the preceding table serve in their respective capacities at the pleasure of the Board of Directors of the Company.
Mr. Demetriou joined the Company in August 2015. Mr. Demetriou served as Chairman and CEO of Aleris Corporation for 14 years, a global downstream aluminum producer based in Cleveland, Ohio. Over the course of his career, he has gained broad experience with companies in a range of industries including metals, specialty chemicals, oil & gas, manufacturing and fertilizers.
Mr. Berryman joined the Company in December 2014. Mr. Berryman served as EVP and CFO for five years at International Flavors and Fragrances Inc., an S&P 500 company and leading global creator of flavors and fragrances used in a wide variety of consumer products. Prior to that, he spent 25 years at Nestlé in a number of finance roles including treasury, mergers & acquisitions, strategic planning and control.
Page 12
Mr. Hagen joined the Company in 1987. Mr. Hagen has worked in a number of the Company’s market sectors in both senior operational and sales roles. Prior to becoming Chief Operating Officer, Mr. Hagen served as President of Aerospace, Technology, Environmental and Nuclear (ATEN) and as Executive Vice President, Global Sales and Marketing.
Mr. Pragada rejoined the Company in February 2016 after serving as President and Chief Executive Officer of The Brock Group since August 2014. From March 2006 to August 2014 Mr. Pragada served in executive and senior management capacities with the Company.
Mr. Pai joined the Company in 2013. Prior to becoming President of Energy, Chemicals and Resources (ECR) in December 2017, Mr. Pai was a Senior Vice President, holding various executive and senior management positions within ECR.
Ms. Caruso joined the Company in 2012. Prior to becoming Chief Legal and Administration Officer, Ms. Caruso was Senior Vice President of Human Resources and previously Senior Vice President, Global Litigation. Prior to joining the Company, Ms. Caruso was a partner in two international law firms, Howrey LLP and Baker & Hostetler LLP.
Mr. Allen joined the Company in October 2016. Mr. Allen served as Vice President, Finance and Principal Accounting Officer at Lyondellbasell Industries, N.V. from 2013 to 2016. Prior to that, he was with Albemarle Corporation, where he served as Vice President, Corporate Controller and Chief Accounting Officer from 2009 to 2013 after serving in CFO roles for their Catalysts and Fine Chemistry businesses from 2005 to 2009.
Mr. Tyler joined the Company in June 2013. He previously served as Executive Vice President, General Counsel and Secretary of Sanmina Corporation, a global electronics manufacturing services provider from April 2007 to June 2013, and Chief Legal and Administrative Officer of Gateway, Inc., a computer hardware company, from January 2004 to April 2007.
Available Information
You may read and copy any materials we file with the SEC at the SEC’s Public Reference Room located at 100 F Street N.E., Washington, D.C. 20549. In order to obtain information about the operation of the Public Reference Room, a person may call the SEC at 1-800-732-0330. The SEC also maintains a site on the Internet that contains reports, proxy and information statements, and other information regarding issuers that file electronically with the SEC. The SEC’s website is http://www.sec.gov. You may also read and download the various reports we file with, or furnish to, the SEC free of charge from our website at www.jacobs.com.
Item 1A. | RISK FACTORS |
We operate in a changing global environment that involves numerous known and unknown risks and uncertainties that could materially adversely affect our business, financial condition and results of operations. The risks described below highlight some of the factors that have affected and could affect us in the future. We may also be affected by unknown risks or risks that we currently think are immaterial. If any such events actually occur, our business, financial condition and results of operations could be materially adversely affected.
Construction and maintenance sites are inherently dangerous workplaces. If we, the owner, or others working at the project site fail to maintain safe work sites, we can be exposed to significant financial losses and reputational harm, as well as civil and criminal liabilities.
Construction and maintenance sites often put our employees and others in close proximity with large pieces of mechanized equipment, moving vehicles, chemical and manufacturing processes and highly regulated materials, in a challenging environment and often in geographically remote locations. If we fail to implement such procedures or if the procedures we implement are ineffective, or if others working at the site fail to implement and follow appropriate safety procedures, our employees and others may become injured, disabled or even lose their lives, the completion or commencement of our projects may be delayed and we may be exposed to litigation or investigations. Unsafe work sites also have the potential to increase employee turnover, increase the cost of a project to our clients and raise our operating and insurance costs. Any of the foregoing could result in financial losses or reputational harm, which could have a material adverse impact on our business, financial condition and results of operations.
In addition, our projects can involve the handling of hazardous and other highly regulated materials, which, if improperly handled or disposed of, could subject us to civil and/or criminal liabilities. We are also subject to regulations dealing with occupational health and safety. Although we maintain functional groups whose primary purpose is to ensure we implement effective health, safety and environmental (“HSE”) work procedures throughout our organization, including construction sites and
Page 13
maintenance sites, the failure to comply with such regulations could subject us to liability. In addition, despite the work of our functional groups, we cannot guarantee the safety of our personnel or that there will be no damage to or loss of our work, equipment or supplies.
Our safety record is critical to our reputation. Many of our clients require that we meet certain safety criteria to be eligible to bid for contracts and many contracts provide for automatic termination or forfeiture of some or all of our contract fees or profit in the event we fail to meet certain measures. Accordingly, if we fail to maintain adequate safety standards, we could suffer reduced profitability or the loss of projects or clients, which could have a material adverse impact on our business, financial condition and results of operations.
Demand for our services is cyclical as the sectors and industries in which our clients operate are impacted by economic downturns, reductions in government or private spending and times of political uncertainty.
We provide technical, professional, construction and O&M services to clients operating in a number of sectors and industries, including oil and gas exploration, production and refining; programs for various national governments, including the U.S. federal government; chemicals and polymers; mining and minerals; pharmaceuticals and biotechnology; infrastructure; buildings; power; water; transportation; and other general industrial and consumer businesses and markets (such as technology and manufacturing; pulp and paper; and food and consumer products). These sectors and industries and the resulting demand for our services have been, and we expect will continue to be, cyclical and subject to significant fluctuations due to a variety of factors beyond our control, including economic conditions and changes in client spending, particularly during periods of economic or political uncertainty.
Uncertain global economic and political conditions may negatively impact our clients’ ability and willingness to fund their projects, including their ability to raise capital and pay, or timely pay, our invoices. They may also cause our clients to reduce their capital expenditures, alter the mix of services purchased, seek more favorable price and other contract terms and otherwise slow their spending on our services. For example, in the public sector, declines in state and local tax revenues as well as other economic declines may result in lower state and local government spending. In addition, under such conditions, many of our competitors may be more inclined to take greater or unusual risks or accept terms and conditions in contracts that we might not deem acceptable. These conditions may reduce the demand for our services, which may have a material adverse impact on our business, financial condition and results of operations.
Additionally, uncertain economic and political conditions may make it difficult for our clients, our vendors, and us to accurately forecast and plan future business activities. For example, recent changes to U.S. policies related to global trade and tariffs have resulted in uncertainty surrounding the future of the global economy as well as retaliatory trade measures implemented by other countries. The increasing cost of steel and aluminum may impact client spending. We cannot predict the outcome of these changing trade policies or other unanticipated political conditions, nor can we predict the timing, strength or duration of any economic recovery or downturn worldwide or in our clients’ markets. In addition, our business has traditionally lagged recoveries in the general economy and, therefore, may not recover as quickly as the economy at large. Weak economic conditions, a failure to obtain expected benefits from any increased infrastructure spending, or a reduction in government spending could have a material adverse impact on our business, financial condition and results of operations. Furthermore, if a significant portion of our clients or projects are concentrated in a specific geographic area or industry, our business may be disproportionately affected by negative trends or economic downturns in those specific geographic areas or industries.
Regardless of economic or market conditions, investment decisions by our customers may vary by location or as a result of other factors like the availability of labor or relative construction cost. Because we are dependent on the timing and funding of new awards, we are therefore vulnerable to changes in our clients’ markets and investment decisions. As a result, our past results have varied and may continue to vary depending upon the demand for future projects in the markets and the locations in which we operate.
Fluctuations in commodity prices may affect our customers’ investment decisions and therefore subject us to risks of cancellation, delays in existing work, or changes in the timing and funding of new awards.
Commodity prices can affect our customers in a number of ways. For example, for those customers that produce commodity products such as oil, gas, copper, or fertilizers, fluctuations in price can have a direct effect on their profitability and cash flow and, therefore, their willingness to continue to invest or make new capital investments. Furthermore, declines in commodity prices can negatively impact our business in regions whose economies are substantially dependent on commodity prices, such as the Middle East. To the extent commodity prices decline or fluctuate and our customers defer new investments or cancel or delay existing projects, the demand for our services decreases, which may have a material adverse impact on our business, financial condition and results of operations.
Page 14
Commodity prices can also strongly affect the costs of projects. Rising commodity prices can negatively impact the potential returns on investments that are planned, as well as those in progress, and result in customers deferring new investments or canceling or delaying existing projects. Cancellations and delays have affected our past results and may continue to do so in significant and unpredictable ways and could have a material adverse impact on our business, financial condition and results of operations.
Our project execution activities may result in liability for faulty services.
If we fail to provide our services in accordance with applicable professional standards or contractual requirements, we could be exposed to significant monetary damages or even criminal violations. Our engineering practice, for example, involves professional judgments regarding the planning, design, development, construction, operations and management of industrial facilities and public infrastructure projects. While we do not generally accept liability for consequential damages in our contracts, and although we have adopted a range of insurance, risk management and risk avoidance programs designed to reduce potential liabilities, a catastrophic event at one of our project sites or completed projects resulting from the services we have performed could result in significant professional or product liability and warranty or other claims against us as well as reputational harm, especially if public safety is impacted. These liabilities could exceed our insurance limits or the fees we generate, may not be covered by insurance at all due to various exclusions in our coverage and could impact our ability to obtain insurance in the future. Further, even where coverage applies, the policies have deductibles, which result in our assumption of exposure for certain amounts with respect to any claim filed against us. In addition, clients or subcontractors who have agreed to indemnify us against any such liabilities or losses might refuse or be unable to pay us. An uninsured claim, either in part or in whole, as well as any claim covered by insurance but subject to a high deductible, if successful and of a material magnitude, could have a material adverse impact on our business, financial condition and results of operations.
Our continued success is dependent upon our ability to hire, retain, and utilize qualified personnel.
The success of our business is dependent upon our ability to hire, retain and utilize qualified personnel, including engineers, architects, designers, craft personnel and corporate management professionals who have the required experience and expertise at a reasonable cost. The market for these and other personnel is competitive. From time to time, it may be difficult to attract and retain qualified individuals with the expertise, and in the timeframe, demanded by our clients, or to replace such personnel when needed in a timely manner. In certain geographic areas, for example, we may not be able to satisfy the demand for our services because of our inability to successfully hire and retain qualified personnel. Furthermore, some of our personnel hold government granted clearance that may be required to obtain government projects. If we were to lose some or all of these personnel, they would be difficult to replace. Loss of the services of, or failure to recruit, qualified technical and management personnel could limit our ability to successfully complete existing projects and compete for new projects.
In addition, in the event that any of our key personnel retire or otherwise leave the Company, we need to have appropriate succession plans in place and to successfully implement such plans, which requires devoting time and resources toward identifying and integrating new personnel into leadership roles and other key positions. If we cannot attract and retain qualified personnel or effectively implement appropriate succession plans, it could have a material adverse impact on our business, financial condition and results of operations.
The cost of providing our services, including the extent to which we utilize our workforce, affects our profitability. For example, the uncertainty of contract award timing can present difficulties in matching our workforce size with our contracts. If an expected contract award is delayed or not received, we could incur costs resulting from excess staff, reductions in staff, or redundancy of facilities that could have a material adverse impact on our business, financial conditions and results of operations.
If we do not have adequate indemnification for our nuclear services, it could adversely affect our business and financial condition.
The Price-Anderson Nuclear Industries Indemnity Act, commonly called the Price-Anderson Act (“PAA”), is a U.S. federal law, which, among other things, regulates radioactive materials and the nuclear energy industry, including liability and compensation in the event of nuclear related incidents. The PAA provides certain protections and indemnification to nuclear energy plant operators and U.S. Department of Energy (“DOE”) contractors. The PAA protections and indemnification apply to us as part of our services to the U.S. nuclear energy industry and DOE for new facilities, maintenance, modification, decontamination and decommissioning of nuclear energy, weapons and research facilities.
We offer similar services in other jurisdictions outside the U.S. For those jurisdictions, varying levels of nuclear liability protection is provided by international treaties, and/or domestic laws, such as the Nuclear Liability and Compensation Act of Canada and the Nuclear Installations Act of the United Kingdom, insurance and/or assets of the nuclear installation operators
Page 15
(some of which are backed by governments) as well as under appropriate enforceable contractual indemnifications and hold-harmless provisions. These protections and indemnifications, however, may not cover all of our liability that could arise in the performance of these services. To the extent the PAA or other protections and indemnifications do not apply to our services, our business could be adversely affected because of the cost of losses associated with liability not covered by the available protections and indemnifications, or by virtue of our loss of business because of these added costs.
We engage in a highly competitive business. If we are unable to compete effectively, we could lose market share and our business and results of operations could be negatively impacted.
We face intense competition to provide technical, professional and construction services to clients. The markets we serve are highly competitive and we compete against a large number of regional, national and multinational companies.
The extent and type of our competition varies by industry, geographic area and project type. For example, with respect to our construction, operations and maintenance services, clients generally award large projects to large contractors, which may give our larger competitors an advantage when bidding for these projects. Conversely, with respect to our engineering, design, architectural and consulting services, low barriers of entry can result in competition with smaller, newer competitors.
Our projects are frequently awarded through a competitive bidding process, which is standard in our industry. We are constantly competing for project awards based on pricing, schedule and the breadth and technical sophistication of our services. Competition can place downward pressure on our contract prices and profit margins, which may force us to accept contractual terms and conditions that are less favorable to us, thereby increasing the risk that, among other things, we may not realize profit margins at the same rates as we have seen in the past or may become responsible for costs or other liabilities we have not accepted in the past. If we are unable to compete effectively, we may experience a loss of market share or reduced profitability or both, which if significant, could have a material adverse impact on our business, financial condition and results of operations.
Our results of operations depend on the award of new contracts and the timing of the performance of these contracts.
Our revenues are derived from new contract awards. Delays in the timing of the awards or cancellations of such projects as a result of economic conditions, material and equipment pricing and availability or other factors could impact our long-term projected results. It is particularly difficult to predict whether or when we will receive large-scale projects as these contracts frequently involve a lengthy and complex bidding and selection process, which is affected by a number of factors, such as market conditions or governmental and environmental approvals. Since a significant portion of our revenues is generated from such projects, our results of operations and cash flows can fluctuate significantly from quarter to quarter depending on the timing of our contract awards and the commencement or progress of work under awarded contracts. Furthermore, many of these contracts are subject to financing contingencies and, as a result, we are subject to the risk that the customer will not be able to secure the necessary financing for the project.
In addition, many of our contracts require us to satisfy specific progress or performance milestones in order to receive payment from the customer. As a result, we may incur significant costs for engineering, materials, components, equipment, labor or subcontractors prior to receipt of payment from a customer.
The uncertainty of our contract award timing can also present difficulties in matching workforce size with contract needs. In some cases, we maintain and bear the cost of a ready workforce that is larger than necessary under existing contracts in anticipation of future workforce needs for expected contract awards. If an expected contract award is delayed or not received, we may incur additional costs resulting from reductions in staff or redundancy of facilities, which could have a material adverse effect on our business, financial condition and results of operations.
The outcome of pending and future claims and litigation could have a material adverse impact on our business, financial condition, and results of operations.
We are a party to claims and litigation in the normal course of business. Since we engage in engineering and construction activities for large facilities and projects where design, construction or systems failures can result in substantial injury or damage to employees or others, we are exposed to substantial claims and litigation and investigations if there is a failure at any such facility or project. Such claims could relate to, among other things, personal injury, loss of life, business interruption, property damage, pollution and environmental damage and be brought by our clients or third parties, such as those who use or reside near our clients’ projects. We can also be exposed to claims if we agreed that a project will achieve certain performance standards or satisfy certain technical requirements and those standards or requirements are not met. In many of our contracts with clients, subcontractors and vendors, we agree to retain or assume potential liabilities for damages, penalties, losses and other exposures relating to projects
Page 16
that could result in claims that greatly exceed the anticipated profits relating to those contracts. In addition, while clients and subcontractors may agree to indemnify us against certain liabilities, such third parties may refuse or be unable to pay us.
With a workforce of approximately 80,000 people globally, we are also party to labor and employment claims in the normal course of business. Such claims could relate to allegations of harassment and discrimination, pay equity, denial of benefits, wage and hour violations, whistleblower protections, concerted protected activity, and other employment protections, and may be pursued on an individual or class action basis depending on applicable laws and regulations. Some of such claims may be insurable, while other such claims may not.
We maintain insurance coverage for various aspects of our business and operations. Our insurance programs have varying coverage limits as well as exclusions for matters such as fraud, and insurance companies may attempt to deny claims for which we seek coverage. In addition, we have elected to retain a portion of losses that may occur through the use of various deductibles, retentions and limits under these programs. As a result, we may be subject to future liability for which we are only partially insured, or completely uninsured.
Although in the past we have been generally able to cover our insurance needs, there can be no assurances that we can secure all necessary or appropriate insurance in the future, or that such insurance can be economically secured. For example, catastrophic events can result in decreased coverage limits, coverage that is more limited, or increased premium costs or higher deductibles. We monitor the financial health of the insurance companies from which we procure insurance, which is one of the factors we take into account when purchasing insurance. Our insurance is purchased from a number of the world's leading providers, often in layered insurance or quota share arrangements. If any of our third party insurers fail, abruptly cancel our coverage or otherwise cannot satisfy their insurance requirements to us, then our overall risk exposure and operational expenses could be increased and our business operations could be interrupted.
In addition, the nature of our business sometimes results in clients, subcontractors and vendors presenting claims to us for, among other things, recovery of costs related to certain projects. Similarly, we occasionally present change orders and claims to our clients, subcontractors and vendors for, among other things, additional costs exceeding the original contract price. If we fail to document properly the nature of our claims and change orders or are otherwise unsuccessful in negotiating reasonable settlements with our clients, subcontractors and vendors, we could incur cost overruns, reduced profits or, in some cases, a loss for a project. Further, these claims can be the subject of lengthy negotiations, arbitration or litigation proceedings, which could result in the investment of significant amounts of working capital pending the resolution of the relevant change orders and claims. A failure to promptly recover on these types of claims could have a material adverse impact on our liquidity and financial results. Additionally, irrespective of how well we document the nature of our claims and change orders, the cost to prosecute and defend claims and change orders can be significant.
Litigation and regulatory proceedings are subject to inherent uncertainties and unfavorable rulings can and do occur. Pending or future claims against us could result in professional liability, product liability, criminal liability, warranty obligations, default under our credit agreements and other liabilities which, to the extent we are not insured against a loss or our insurer fails to provide coverage, could have a material adverse impact on our business, financial condition, and results of operations.
The nature of our contracts, particularly those that are fixed-price, subjects us to risks of cost overruns. We may experience reduced profits or, in some cases, losses if costs increase above budgets or estimates or if the project experiences schedule delays.
For fiscal 2018, approximately 24% of our revenues were earned under fixed-price contracts. Both fixed-price and many cost reimbursable contracts require us to estimate the total cost of the project in advance of our performance. For fixed-price contracts, we may benefit from any cost-savings, but we bear greater risk of paying some, if not all, of any cost overruns. Fixed-price contracts are established in part on partial or incomplete designs, cost and scheduling estimates that are based on a number of assumptions, including those about future economic conditions, commodity and other materials pricing and availability of labor, equipment and materials and other exigencies. If the design or the estimates prove inaccurate or if circumstances change due to, among other things, unanticipated technical problems, difficulties in obtaining permits or approvals, changes in local laws or labor conditions, weather or other delays beyond our control, changes in the costs of equipment or raw materials, our vendors’ or subcontractors’ inability or failure to perform, or changes in general economic conditions, then cost overruns may occur and we could experience reduced profits or, in some cases, a loss for that project. These risks are exacerbated for projects with long-term durations because there is an increased risk that the circumstances on which we based our original estimates will change in a manner that increases costs. If the project is significant, or there are one or more issues that impact multiple projects, costs overruns could have a material adverse impact on our business, financial condition and results of operations.
Page 17
Our contracts that are fundamentally cost reimbursable in nature may also present a risk to the extent the final cost on a project exceeds the amount the customer expected or budgeted. Like fixed-price contracts, the expected cost of cost-reimbursable projects are based in part on partial design and our estimates of the resources and time necessary to perform such contracts. A portion of the fee is often linked to these estimates and the related final cost and schedule objectives, and if for whatever reason these objectives are not met, the project may be less profitable than we expect or even result in losses.
The contracts in our backlog may be adjusted, canceled or suspended by our clients and, therefore, our backlog is not necessarily indicative of our future revenues or earnings. Additionally, even if fully performed, our backlog is not a good indicator of our future gross margins.
Backlog represents the total dollar amount of revenues we expect to record in the future as a result of performing work under contracts that have been awarded to us. As of the end of fiscal 2018, our backlog totaled approximately $27.3 billion. There is no assurance that backlog will actually be realized as revenues in the amounts reported or, if realized, will result in profits. In accordance with industry practice, substantially all of our contracts are subject to cancellation, termination, or suspension at the discretion of the client, including our U.S. government work. In the event of a project cancellation, we would generally have no contractual right to the total revenue reflected in our backlog. Projects can remain in backlog for extended periods of time because of the nature of the project and the timing of the particular services required by the project. The risk of contracts in backlog being canceled or suspended generally increases during periods of widespread economic slowdowns or in response to changes in commodity prices.
The contracts in our backlog are subject to changes in the scope of services to be provided as well as adjustments to the costs relating to the contracts. The revenue for certain contracts included in backlog is based on estimates. Additionally, the way we perform on our individual contracts can affect greatly our gross margins and hence, future profitability.
In some markets, there is a continuing trend towards cost-reimbursable contracts with incentive-fee arrangements. Typically, our incentive fees are based on such things as achievement of target completion dates or target costs, overall safety performance, overall client satisfaction and other performance criteria. If we fail to meet such targets or achieve the expected performance standards, we may receive a lower, or even zero, incentive fee resulting in lower gross margins. Accordingly, there is no assurance that the contracts in backlog, assuming they produce the revenues currently expected, will generate gross margins at the rates we have realized in the past.
Contracts with the U.S. federal government and other governments and their agencies pose additional risks relating to future funding and compliance.
Contracts with the U.S. federal government and other governments and their agencies, which are a significant source of our revenue and profit, are subject to various uncertainties, restrictions, and regulations including oversight audits by various government authorities as well as profit and cost controls, which could result in withholding or delay of payments to us. Government contracts are also exposed to uncertainties associated with funding such as sequestration and budget deficits. Contracts with the U.S. federal government, for example, are subject to the uncertainties of Congressional funding. Governments are typically under no obligation to maintain funding at any specific level, and funds for government programs may even be eliminated. Legislatures typically appropriate funds on a year-by-year basis, while contract performance may take more than one year. As a result, contracts with government agencies may be only partially funded or may be terminated, and we may not realize all of the potential revenue and profit from those contracts.
Our government clients may reduce the scope of or terminate our contracts for convenience or decide not to renew our contracts with little or no prior notice. Since government contracts represent a significant percentage of our revenues (for example, those with the U.S. federal government represented approximately 23% of our total revenue in fiscal 2018), a significant reduction in government funding or the loss of such contracts could have a material adverse impact on our business, financial condition, and results of operations.
Most government contracts are awarded through a rigorous competitive process. The U.S. federal government has increasingly relied upon multiple-year contracts with multiple contractors that generally require those contractors to engage in an additional competitive bidding process for each task order issued under a contract. This process may result in us facing significant additional pricing pressure and uncertainty and incurring additional costs. Moreover, we may not be awarded government contracts because of existing policies designed to protect small businesses and under-represented minorities. Our inability to win new contracts or be awarded work under existing contracts could have a material adverse impact on our business, financial condition and results of operations.
Page 18
In addition, government contracts are subject to specific procurement regulations and a variety of other socio-economic requirements, which affect how we transact business with our clients and, in some instances, impose additional costs on our business operations. For example, for contracts with the U.S. federal government, we must comply with the Federal Acquisition Regulation, the Truth in Negotiations Act, the Cost Accounting Standards, and numerous regulations governing environmental protection and employment practices. Government contracts also contain terms that expose us to heightened levels of risk and potential liability than non-government contracts. This includes, for example, unlimited indemnification obligations.
We also are subject to government audits, investigations, and proceedings. For example, government agencies such as the U.S. Defense Contract Audit Agency routinely review and audit us to determine the adequacy of and our compliance with our internal control systems and policies and whether allowable costs are in accordance with applicable regulations. These audits can result in a determination that a rule or regulation has been violated or that adjustments are necessary to the amount of contract costs we believe are reimbursable by the agencies and the amount of our overhead costs allocated to the agencies.
If we violate a rule or regulation, fail to comply with a contractual or other requirement or do not satisfy an audit, a variety of penalties can be imposed on us including monetary damages and criminal and civil penalties. For example, in so-called “qui tam” actions brought by individuals or the government under the U.S. Federal False Claims Act or under similar state and local laws, treble damages can be awarded. In addition, any or all of our government contracts could be terminated, we could be suspended or debarred from all government contract work, or payment of our costs could be disallowed. The occurrence of any of these actions could harm our reputation and have a material adverse impact on our business, financial condition and results of operations.
Many of our federal government contracts require us to have security clearances, which can be difficult and time consuming to obtain. If our employees or our facilities are unable to obtain or retain the necessary security clearances, our clients could terminate or not renew existing contracts or award us new contracts, which could have a material adverse impact on our business, financial condition and results of operations could be negatively impacted.
Our use of joint ventures and partnerships exposes us to risks and uncertainties, many of which are outside of our control.
As is common in our industry, we perform certain contracts as a member of joint ventures, partnerships, and similar arrangements. This situation exposes us to a number of risks, including the risk that our partners may be unable to fulfill their obligations to us or our clients.
Further, we have limited ability to control the actions of our joint venture partners, including with respect to nonperformance, default, bankruptcy or legal or regulatory compliance. Our partners may be unable or unwilling to provide the required levels of financial support to the partnerships. If these circumstances occur, we may be liable for claims and losses attributable to the partner by operation of law or contract. These circumstances could also lead to disputes and litigation with our partners or clients, all of which could have a material adverse impact on our reputation, business, financial condition and results of operations.
We depend on the management effectiveness of our joint venture partners. Differences in views among the joint venture participants may result in delayed decisions or in failures to agree on major issues, which could materially affect the business and operations of these ventures. In addition, in many of the countries in which we engage in joint ventures, it may be difficult to enforce our contractual rights under the applicable joint venture agreement. If we are not able to enforce our contractual rights, we may not be able to realize the benefits of the joint venture or we may be subject to additional liabilities.
We participate in joint ventures and similar arrangements in which we are not the controlling partner. In these cases, we have limited control over the actions of the joint venture. These joint ventures may not be subject to the same requirements regarding internal controls and internal control over financial reporting that we follow. To the extent the controlling partner makes decisions that negatively impact the joint venture or internal control problems arise within the joint venture, it could have a material adverse impact on our business, financial condition and results of operations.
The failure by a joint venture partner to comply with applicable laws, regulations or client requirements could negatively impact our business and, for government clients, could result in fines, penalties, suspension or even debarment being imposed on us, which could have a material adverse impact on our business, financial condition and results of operations.
We are dependent on third parties to complete many of our contracts.
Third-party subcontractors we hire perform much of the work performed under our contracts. We also rely on third-party equipment manufacturers or suppliers to provide much of the equipment and materials used for projects. If we are unable to hire
Page 19
qualified subcontractors or find qualified equipment manufacturers or suppliers, our ability to successfully complete a project could be impaired. If we are not able to locate qualified third-party subcontractors or the amount we are required to pay for subcontractors or equipment and supplies exceeds what we have estimated, especially in a lump sum or a fixed-price contract, we may suffer losses on these contracts. If a subcontractor, supplier, or manufacturer fails to provide services, supplies or equipment as required under a contract for any reason, we may be required to source these services, equipment or supplies to other third parties on a delayed basis or on less favorable terms, which could impact contract profitability. There is a risk that we may have disputes with our subcontractors relating to, among other things, the quality and timeliness of work performed, customer concerns about the subcontractor, or our failure to extend existing task orders or issue new task orders under a contract. In addition, faulty workmanship, equipment or materials could impact the overall project, resulting in claims against us for failure to meet required project specifications.
In an uncertain or downturn economic environment, third parties may find it difficult to obtain sufficient financing to help fund their operations. The inability to obtain financing could adversely affect a third party’s ability to provide materials, equipment or services which could have a material adverse impact on our business, financial condition, and results of operations. In addition, a failure by a third party subcontractor, supplier or manufacturer to comply with applicable laws, regulations or client requirements could negatively impact our business and, for government clients, could result in fines, penalties, suspension or even debarment being imposed on us, which could have a material adverse impact on our business, financial condition, and results of operations.
Negative conditions in the credit and financial markets and delays in receiving client payments could result in liquidity problems, adversely affecting our cost of borrowing and our business.
Although we finance much of our operations using cash provided by operations, at times we depend on the availability of credit to grow our business and to help fund business acquisitions. Instability in the credit markets in the U.S. or abroad could cause the availability of credit to be relatively difficult or expensive to obtain at competitive rates, on commercially reasonable terms or in sufficient amounts. This situation could make it more difficult or more expensive for us to access funds, refinance our existing indebtedness, enter into agreements for new indebtedness, or obtain funding through the issuance of securities or such additional capital may not be available on terms acceptable to us, or at all. We may also enter into business acquisition agreements that require us to access credit, which if not available at the closing of the acquisition could result in a breach of the acquisition agreement and a resulting claim for damages by the sellers of such business. In addition, market conditions could negatively impact our clients’ ability to fund their projects and, therefore, utilize our services, which could have a material adverse impact on our business, financial condition, and results of operations.
In addition, we are subject to the risk that the counterparties to our credit agreements may go bankrupt if they suffer catastrophic demand on their liquidity that will prevent them from fulfilling their contractual obligations to us. We also routinely enter into contracts with counterparties including vendors, suppliers and subcontractors that may be negatively impacted by events in the credit markets. If those counterparties are unable to perform their obligations to us or our clients, we may be required to provide additional services or make alternate arrangements on less favorable terms with other parties to ensure adequate performance and delivery of services to our clients. These circumstances could also lead to disputes and litigation with our partners or clients, which could have a material adverse impact on our reputation, business, financial condition and results of operations.
Some of our customers, suppliers and subcontractors depend on access to commercial financing and capital markets to fund their operations. Disruptions of the credit or capital markets could adversely affect our clients’ ability to finance projects and could result in contract cancellations or suspensions, project delays and payment delays or defaults by our clients. In addition, clients may be unable to fund new projects, may choose to make fewer capital expenditures or otherwise slow their spending on our services or to seek contract terms more favorable to them. Our government clients may face budget deficits that prohibit them from funding proposed and existing projects or that cause them to exercise their right to terminate our contracts with little or no prior notice. In addition, any financial difficulties suffered by our subcontractors or suppliers could increase our cost or adversely impact project schedules. These disruptions could materially impact our backlog and have a material adverse impact on our business, financial condition and results of operations.
In addition, we typically bill our clients for our services in arrears and are, therefore, subject to our clients delaying or failing to pay our invoices after we have already committed resources to their projects. In weak economic environments, we may experience increased delays and failures due to, among other reasons, our clients’ unwillingness to pay for alleged poor performance or to preserve their own working capital. If one or more clients delays in paying or fails to pay us a significant amount of our outstanding receivables, it could have a material adverse impact on our liquidity, financial condition and results of operations.
Furthermore, our cash balances and short-term investments are maintained in accounts held by major banks and financial institutions located primarily in North America, Europe, South America, Australia and Asia. Some of our accounts hold deposits in
Page 20
amounts that exceed available insurance. Although none of the financial institutions in which we hold our cash and investments have gone into bankruptcy or forced receivership, or have been seized by their governments, there is a risk that such events may occur in the future. If any such events were to occur, we would be at risk of not being able to access our cash, which may result in a temporary liquidity crisis that could impede our ability to fund our operations, which could have a material adverse impact on our business, financial condition and results of operations.
Maintaining adequate bonding and letter of credit capacity is necessary for us to successfully bid on and win some contracts.
In line with industry practice, we are often required to provide performance or payment bonds or letters of credit to our customers. These instruments indemnify the customer should we fail to perform our obligations under the contract. If a bond or a letter of credit is required for a particular project and we are unable to obtain an appropriate bond or letter of credit, we cannot pursue that project. Historically, we have had adequate bonding and letter of credit capacity but, as is typically the case, the issuance of a bond is at the surety’s sole discretion and the issuance of a letter of credit is based on the Company's credit-worthiness. Because of an overall lack of worldwide bonding capacity, we may find it difficult to find sureties who will provide required levels of bonding or such bonding may only be available at significant additional cost. There can be no assurance that our bonding capacity will continue to be available to us on reasonable terms. In addition, future projects may require us to obtain letters of credit that extend beyond the term of our existing credit facilities. Our inability to obtain adequate bonding and, as a result, to bid on new contracts that require such bonding or letter of credit could have a material adverse impact on our business, financial condition, results of operations and cash flows.
There can be no assurance that we will pay dividends on our common stock.
Our Board of Directors initiated a quarterly cash dividend program in fiscal 2017 under which we have paid, and intend to continue paying, regular quarterly dividends. The declaration, amount and timing of such dividends are subject to capital availability and determinations by our Board of Directors that cash dividends are in the best interest of our stockholders and are in compliance with all respective laws and applicable agreements. Our ability to pay dividends will depend upon, among other factors, our cash balances and potential future capital requirements for strategic transactions, including acquisitions, debt service requirements, results of operations, financial condition and other factors that our Board of Directors may deem relevant. A reduction in or elimination of our dividend payments and/or our dividend program could have a material negative effect on our stock price.
Past and future environmental, health, and safety laws could impose significant additional costs and liabilities.
We are subject to a variety of environmental, health, and safety laws and regulations governing, among other things, discharges to air and water, the handling, storage and disposal of hazardous or waste materials and the remediation of contamination associated with the releases of hazardous substances, and human health and safety. These laws and regulations and the risk of attendant litigation can cause significant delays to a project and add significantly to its cost. Violations of these regulations could subject us and our management to civil and criminal penalties and other liabilities.
Various U.S. federal, state, local and foreign environmental laws and regulations may impose liability for property damage and costs of investigation and cleanup of hazardous or toxic substances on property currently or previously owned by us or arising out of our waste management or environmental remediation activities. These laws may impose responsibility and liability without regard to knowledge of or causation of the presence of contaminants. The liability under these laws may be joint and several. We have potential liabilities associated with our past waste management and other activities and with our current and prior ownership of various properties. The discovery of additional contaminants or the imposition of unforeseen clean-up obligations at these or other sites could have a material adverse impact on our financial condition and results of operations.
When we perform our services, our personnel and equipment may be exposed to radioactive and hazardous materials and conditions. We may be subject to liability claims by employees, customers and third parties as a result of such exposures. In addition, we may be subject to fines, penalties or other liabilities arising under environmental or safety laws. A claim, if not covered or only partially covered by insurance, could have a material adverse impact on our results of operations and financial condition.
Health, safety, and environmental laws and regulations and policies are reviewed periodically and any changes thereto could affect us in substantial and unpredictable ways. Such changes could, for example, relax or repeal laws and regulations relating to the environment, which could result in a decline in the demand for our environmental services and, in turn, could negatively impact our revenue. Changes in the environmental laws and regulations, remediation obligations, enforcement actions, stricter interpretations of existing requirements, future discovery of contamination or claims for damages to persons, property, natural resources or the environment could result in material costs and liabilities that we currently do not anticipate. If we fail to
Page 21
comply with any environmental, health, or safety laws or regulations, whether actual or alleged, we could be exposed to fines, penalties or potential litigation liabilities, including costs, settlements and judgments, any of which could adversely affect our business, financial condition and results of operations.
In addition, we and many of our clients operate in highly regulated environments, which may require us or our clients to obtain, and to comply with, federal, state and local government permits and approvals. Any of these permits or approvals may be subject to denial, revocation or modification under various circumstances. Failure to obtain or comply with, or the loss or modification of, the conditions of permits or approvals may subject us to penalties or other liabilities, which could have a material adverse impact on our business, financial condition and result of operations.
If we fail to comply with federal, state, local or foreign governmental requirements, our business may be adversely affected.
We are subject to U.S. federal, state, local and foreign laws and regulations that affect our business. For example, our global operations require importing and exporting goods and technology across international borders which requires full compliance with both export regulatory laws and International Trafficking in Arms Regulations (“ITAR”). Although we have policies and procedures to comply with U.S. and foreign international trade laws, the violation of such laws could subject the Company and its employees to civil or criminal penalties, including substantial monetary fines, or other adverse actions including denial of import or export privileges or debarment from participation in U.S. government contracts, and could damage our reputation and our ability to do business.
Employee, agent or partner misconduct or our overall failure to comply with laws or regulations could weaken our ability to win contracts, which could result in reduced revenues and profits.
Misconduct, fraud, non-compliance with applicable laws and regulations, or other improper activities by one of our employees, agents or partners could have a significant negative impact on our business and reputation. Such misconduct could include the failure to comply with government procurement regulations, regulations regarding the protection of classified information, regulations prohibiting bribery and other corrupt practices, regulations regarding the pricing of labor and other costs in government contracts, regulations on lobbying or similar activities, regulations pertaining to the internal controls over financial reporting, regulations pertaining to export control, environmental laws, employee wages, pay and benefits, and any other applicable laws or regulations. For example, we routinely provide services that may be highly sensitive or that relate to critical national security matters; if a security breach were to occur, our ability to procure future government contracts could be severely limited. The precautions we take to prevent and detect these activities may not be effective and we could face unknown risks or losses. Our failure to comply with applicable laws or regulations, or acts of misconduct, could subject us to fines and penalties, cancellation of contracts, loss of security clearance and suspension or debarment from contracting, which could weaken our ability to win contracts and result in reduced revenues and profits and could have a material adverse impact on our business, financial condition and results of operations.
We could be adversely affected by violations of the U.S. Foreign Corrupt Practices Act and similar worldwide anti-bribery laws.
The U.S. Foreign Corrupt Practices Act (“FCPA”), the U.K. Bribery Act of 2010, and similar anti-bribery laws in other jurisdictions generally prohibit companies and their intermediaries from making improper payments for the purpose of obtaining or retaining business. Our policies mandate compliance with these anti-bribery laws, including the requirements to maintain accurate information and internal controls. We operate in many parts of the world that have experienced governmental corruption to some degree and in certain circumstances; strict compliance with anti-bribery laws may conflict with local customs and practices. Despite our training and compliance programs, there is no assurance that our internal control policies and procedures will protect us from acts committed by our employees or agents. If we are found to be liable for FCPA or other violations (either due to our own acts or our inadvertence, or due to the acts or inadvertence of others), we could suffer from civil and criminal penalties or other sanctions, including contract cancellations or debarment and loss of reputation, any of which could have a material adverse impact on our business, financial condition and results of operations.
The loss of or a significant reduction in business from one or a few customers could have a material adverse impact on us.
A few clients have in the past and may in the future account for a significant portion of our revenue and/or backlog in any one year or over a period of several consecutive years. For example, in fiscal 2018, 2017 and 2016, approximately 23%, 19% and 21%, respectively, of our revenue was earned directly or indirectly from agencies of the U.S. federal government. Although we have long-standing relationships with many of our significant clients, our clients may unilaterally reduce, delay or cancel their contracts at any time. Our loss of or a significant reduction in business from a significant client could have a material adverse impact on our business, financial condition, and results of operations.
Page 22
Our international operations are exposed to additional risks and uncertainties, including unfavorable political developments and weak foreign economies.
For fiscal 2018, approximately 36% of our revenue was earned from clients outside the U.S. Our business is dependent on the continued success of our international operations, and we expect our international operations to continue to account for a significant portion of our total revenues. Our international operations are subject to a variety of risks, including:
• | Recessions and other economic crises in other regions, such as Europe, or specific foreign economies and the impact on our costs of doing business in those countries; |
• | Difficulties in staffing and managing foreign operations, including logistical and communication challenges; |
• | Unexpected changes in foreign government policies and regulatory requirements; |
• | Potential non-compliance with a wide variety of laws and regulations, including anti-corruption, export control and anti-boycott laws and similar non-U.S. laws and regulations; |
• | Potential non-compliance with regulations and evolving industry standards regarding consumer protection and data use and security, including the General Data Protection Regulation approved by the European Union; |
• | Lack of developed legal systems to enforce contractual rights; |
• | Expropriation and nationalization of our assets in a foreign country; |
• | Renegotiation or nullification of our existing contracts; |
• | The adoption of new, and the expansion of existing, trade or other restrictions; |
• | Embargoes, duties, tariffs or other trade restrictions, including sanctions; |
• | Changes in labor conditions; |
• | Acts of war, civil unrest, force majeure, and terrorism; |
• | The ability to finance efficiently our foreign operations; |
• | Social, political, and economic instability; |
• | Expropriation of property; |
• | Changes to tax policy; |
• | Currency exchange rate fluctuations; |
• | Limitations on the ability to repatriate foreign earnings; and |
• | U.S. government policy changes in relation to the foreign countries in which we operate. |
The lack of a well-developed legal system in some of these countries may make it difficult to enforce our contractual rights. In addition, military action, geopolitical shifts or continued unrest, particularly in the Middle East, could impact the supply or pricing of oil, disrupt our operations in the region and elsewhere and increase our security costs. To the extent our international operations are affected by unexpected or adverse economic, political and other conditions, our business, financial condition and results of operations may be adversely affected.
We work in international locations where there are high security risks, which could result in harm to our employees or unanticipated cost.
Some of our services are performed in high-risk locations, where the country or location is subject to political, social or economic risks, or war, terrorism or civil unrest. In those locations where we have employees or operations, we may expend significant efforts and incur substantial security costs to maintain the safety of our personnel. Despite these activities, in these locations, we cannot guarantee the safety of our personnel and we may suffer future losses of employees and subcontractors. Acts of terrorism and threats of armed conflicts in or around various areas in which we operate could limit or disrupt markets and our operations, including disruptions resulting from the evacuation of personnel, cancellation of contracts, or the loss of key employees, contractors or assets.
Foreign exchange risks may affect our ability to realize a profit from certain projects.
Our reported financial condition and results of operations are exposed to the effects (both positive and negative) that fluctuating exchange rates have on the process of translating the financial statements of our international operations, which are denominated in currencies other than the U.S. dollar, into the U.S. dollar. While we generally attempt to denominate our contracts in the currencies of our expenditures, we do enter into contracts that expose us to currency risk, particularly to the extent contract revenue is denominated in a currency different than the contract costs. We attempt to minimize our exposure from currency risks by obtaining escalation provisions for projects in inflationary economies or entering into derivative (hedging) instruments, when
Page 23
there is currency risk exposure that is not naturally mitigated via our contracts. These actions, however, may not always eliminate currency risk exposure. The governments of certain countries have or may in the future impose restrictive exchange controls on local currencies and it may not be possible for us to engage in effective hedging transactions to mitigate the risks associated with fluctuations in a particular currency. Based on fluctuations in currency, the U.S. dollar value of our backlog may from time to time increase or decrease significantly. We may also be exposed to limitations on our ability to reinvest earnings from operations in one country to fund the financing requirements of our operations in other countries.
Our operations may be impacted by the United Kingdom’s proposed exit from the European Union.
In June 2016, the U.K. held a referendum in which voters approved an exit from the E.U., commonly referred to as “Brexit.” As a result of the U.K.’s exit from the E.U., there may be greater restrictions on imports and exports between the U.K. and E.U. countries and increased regulatory complexities. These changes may adversely affect our relationships with our existing and future customers, suppliers, employees, and subcontractors, or otherwise have an adverse effect on our business, financial condition and results of operations. The ongoing negotiations between the U.K. and the E.U. as to the terms upon which the U.K. will exit from the E.U. and the uncertainty as to their future trade agreement continues to create economic uncertainty, which may cause our customers to closely monitor their costs, terminate or reduce the scope of existing contracts, decrease or postpone currently planned contracts, or negotiate for more favorable deal terms, each of which may have a negative impact on our business, financial condition and results of operations.
Our business strategy relies in part on acquisitions to sustain our growth. Acquisitions of other companies present certain risks and uncertainties.
Our business strategy involves growth through, among other things, the acquisition of other companies. Acquiring companies, including CH2M HILL Companies, Ltd., which we acquired in December 2017, presents a number of risks, including:
• | Assumption of liabilities of an acquired business, including liabilities that were unknown at the time the acquisition was negotiated; |
• | Failure of the acquired business to comply with U.S. federal, state, local and foreign laws and regulations and/or contractual requirements with government clients; |
• | Valuation methodologies may not accurately capture the value of the acquired business; |
• | Failure to realize anticipated benefits, such as cost savings, synergies, business opportunities and growth opportunities; |
• | The loss of key customers or suppliers, including as a result of any actual or perceived conflicts of interest; |
• | Difficulties or delays in obtaining regulatory approvals, licenses and permits; |
• | Difficulties relating to combining previously separate entities into a single, integrated, and efficient business; |
• | The effects of diverting management’s attention from day-to-day operations to matters involving the integration of acquired companies; |
• | Potentially substantial transaction costs associated with business combinations; |
• | Potential impairment resulting from the overpayment for an acquisition or post-acquisition deterioration in an acquired business; |
• | Difficulties relating to assimilating the management, personnel, benefits, services, and systems of an acquired business and to assimilating marketing and other operational capabilities; |
• | Difficulties retaining key personnel of an acquired business; |
• | Increased burdens on our staff and on our administrative, internal control and operating systems, which may hinder our legal and regulatory compliance activities; |
• | Difficulties in applying and integrating our system of internal controls to an acquired business; |
• | Increased financial and accounting challenges and complexities in areas such as tax planning, treasury management, financial reporting and internal controls; |
• | The potential requirement for additional equity or debt financing, which may not be available, or if available, may not have favorable terms; and |
• | The risks discussed in this Item 1A. Risk Factors that may relate to the activities of the acquired business prior to the acquisition. |
While we may obtain indemnification rights from the sellers of acquired businesses and/or insurance that could mitigate certain of these risks, such rights may be difficult to enforce, the losses may exceed any dedicated escrow funds and the
Page 24
indemnitors may not have the ability to financially support the indemnity, or the insurance coverage may be unavailable or insufficient to cover all losses.
If our management is unable to successfully integrate acquired companies or implement our growth strategy, our operating results could be harmed. In addition, even if the operations of an acquisition are integrated successfully, we may not realize the full benefits of an acquisition, including the synergies, cost savings, or sales or growth opportunities that we expect. These benefits may not be achieved within the anticipated time frame, or at all. Moreover, we cannot assure that we will continue to successfully expand or that growth or expansion will result in profitability.
In addition, there is no assurance that we will continue to locate suitable acquisition targets or that we will be able to consummate any such transactions on terms and conditions acceptable to us. Existing cash balances and cash flow from operations, together with borrowing capacity under our credit facilities, may be insufficient to make acquisitions. Future acquisitions may require us to obtain additional equity or debt financing, which may not be available on attractive terms, or at all. Acquisitions may also bring us into businesses we have not previously conducted and expose us to additional business risks that are different than those we have traditionally experienced.
In the event we issue stock as consideration for certain acquisitions we may make, we could dilute share ownership.
One method of acquiring companies or otherwise funding our corporate activities is through the issuance of additional equity securities. If we issue additional equity securities, such issuances could have the effect of diluting our earnings per share as well as our existing shareholders’ individual ownership percentages in the Company.
We have identified a material weakness in our internal control over financial reporting which, if not timely remediated, may adversely affect the accuracy and reliability of our financial statements, and our reputation, business and the price of our common stock, as well as lead to a loss of investor confidence in us.
As described under Item 9A. “Controls and Procedures” below, management has concluded that a material weakness in our internal control over financial reporting, specifically regarding the accounting for income taxes in connection with the CH2M business combination, existed as of September 28, 2018 and, accordingly, internal control over financial reporting and our disclosure controls and procedures were not effective as of such date. A material weakness is a deficiency, or a combination of deficiencies, in internal control over financial reporting, such that there is a reasonable possibility that a material misstatement of our annual or interim consolidated financial statements will not be prevented or detected on a timely basis.
We will take immediate action to remediate this material weakness. While we believe the steps described under Item 9A below will improve the effectiveness of our internal control over financial reporting and remediate the identified deficiencies, if our remediation efforts are insufficient to address the material weakness or we identify additional material weaknesses in our internal control over financial reporting in the future, our ability to analyze, record and report financial information accurately, to prepare our financial statements within the time periods specified by the rules and forms of the SEC and to otherwise comply with our reporting obligations under the federal securities laws and our long-term debt agreements will likely be adversely affected. The occurrence of, or failure to remediate, this material weakness and any future material weaknesses in our internal control over financial reporting may adversely affect the accuracy and reliability of our financial statements and have other consequences that could materially and adversely affect our business, including an adverse impact on the market price of our common stock, potential actions or investigations by the SEC or other regulatory authorities, possible defaults under our debt agreements, shareholder lawsuits, a loss of investor confidence and damage to our reputation.
Our quarterly results may fluctuate significantly, which could have a material negative effect on the price of our common stock.
Our quarterly operating results may fluctuate significantly or fall below the expectations of securities analysts, which could have a material adverse impact on the price of our common stock. Fluctuations are caused by a number of factors, including:
• | Legal proceedings, disputes and/or government investigations; |
• | Fluctuations in the spending patterns of our government and commercial customers; |
• | The number and significance of projects executed during a quarter; |
• | Unanticipated changes in contract performance, particularly with contracts that have funding limits; |
• | The timing of resolving change orders, requests for equitable adjustments, and other contract adjustments; |
• | Delays incurred in connection with a project; |
• | Changes in prices of commodities or other supplies; |
• | Changes in foreign currency exchange rates; |
Page 25
• | Weather conditions that delay work at project sites; |
• | The timing of expenses incurred in connection with acquisitions or other corporate initiatives; |
• | The decision by the Board of Directors to begin or cease paying a dividend, and the expectation that if the Company pays dividends, it would declare dividends at the same or higher levels in the future; |
• | Natural disasters or other crises; |
• | Staff levels and utilization rates; |
• | Changes in prices of services offered by our competitors; and |
• | General economic and political conditions. |
Our actual results could differ from the estimates and assumptions used to prepare our financial statements.
In preparing our financial statements, our management is required under U.S. GAAP to make estimates and assumptions as of the date of the financial statements. These estimates and assumptions affect the reported values of assets, liabilities, revenue and expenses and disclosure of contingent assets and liabilities. Areas requiring significant estimates by our management include:
• | Recognition of contract revenue, costs, profit or losses in applying the principles of percentage of completion accounting; |
• | Estimated amounts for expected project losses, warranty costs, contract close-out or other costs; |
• | Recognition of recoveries under contract change orders or claims; |
• | Collectability of billed and unbilled accounts receivable and the need and amount of any allowance for doubtful accounts; |
• | Estimates of other liabilities, including litigation and insurance revenues/reserves and reserves necessary for self-insured risks; |
• | Accruals for estimated liabilities, including litigation reserves; |
• | Valuation of assets acquired, and liabilities, goodwill, and intangible assets assumed, in acquisitions; |
• | Valuation of stock-based compensation; |
• | The determination of liabilities under pension and other post-retirement benefit programs; and |
• | Income tax provisions and related valuation allowances. |
Our actual business and financial results could differ from our estimates of such results, which could have a material adverse impact on our financial condition and results of operations.
An impairment charge on our goodwill could have a material adverse impact on our financial position and results of operations.
Because we have grown in part through acquisitions, goodwill and intangible assets represent a substantial portion of our assets. Under U.S. GAAP, we are required to test goodwill carried in our Consolidated Balance Sheets for possible impairment on an annual basis based upon a fair value approach. As of September 28, 2018, we had $6.10 billion of goodwill, representing 48.3% of our total assets of $12.65 billion. We have chosen to perform our annual impairment reviews of goodwill at the end of the third quarter of our fiscal year. We also are required to test goodwill for impairment between annual tests if events occur or circumstances change that would more likely than not reduce our enterprise fair value below its book value. These events or circumstances could include a significant change in the business climate, including a significant sustained decline in a reporting unit’s market value, legal factors, operating performance indicators, competition, sale or disposition of a significant portion of our business, potential government actions toward our facilities and other factors.
If our market capitalization drops significantly below the amount of net equity recorded on our balance sheet, it might indicate a decline in our fair value and would require us to further evaluate whether our goodwill has been impaired. If the fair value of our reporting units is less than their carrying value, we could be required to record an impairment charge. The amount of any impairment could be significant and could have a material adverse impact on our financial position and results of operations for the period in which the charge is taken. For a further discussion of goodwill impairment testing, please see Item 7- Management’s Discussion and Analysis of Financial Condition and Results of Operations below.
We may be required to contribute additional cash to meet any underfunded benefit obligations associated with retirement and post-retirement benefit plans we manage.
Page 26
We have various employee benefit plan obligations that require us to make contributions to satisfy, over time, our underfunded benefit obligations, which are generally determined by calculating the projected benefit obligations minus the fair value of plan assets. For example, as of September 28, 2018 and September 29, 2017, our defined benefit pension and post-retirement benefit plans were underfunded by $339.3 million and $252.0 million, respectively. See Note 10- Pension and Other Postretirement Benefit Plans in the Notes to Consolidated Financial Statements beginning on page F-1 of this Annual Report on Form 10-K for additional disclosure. In the future, our benefit plan obligations may increase or decrease depending on changes in the levels of interest rates, pension plan asset performance and other factors. If we are required to contribute a significant amount of the deficit for underfunded benefit plans, our cash flows could be materially and adversely affected.
Rising inflation, interest rates, and/or construction costs could reduce the demand for our services as well as decrease our profit on our existing contracts, in particular with respect to our fixed-price contracts.
Rising inflation, interest rates, or construction costs could reduce the demand for our services. In addition, we bear all of the risk of rising inflation with respect to those contracts that are fixed-price. Because a significant portion of our revenues are earned from cost-reimbursable type contracts (approximately 76% during fiscal 2018), the effects of inflation on our financial condition and results of operations over the past few years have been generally minor. However, if we expand our business into markets and geographic areas where fixed-price and lump-sum work is more prevalent, inflation may have a larger impact on our results of operations in the future. Therefore, increases in inflation, interest rates or construction costs could have a material adverse impact on our business, financial condition and results of operations.
We may be affected by market or regulatory responses to climate change.
Growing concerns about climate change may result in the imposition of additional environmental regulations. Legislation, international protocols, regulation or other restrictions on emissions could result in increased compliance costs for us and our clients and have other impacts on our clients, including those who are involved in the exploration, production or refining of fossil fuels, emit greenhouse gases through the combustion of fossil fuels or emit greenhouse gases through the mining, manufacture, utilization or production of materials or goods. Such policy changes could increase the costs of projects for our clients or, in some cases, prevent a project from going forward, thereby potentially reducing the need for our services, which would in turn have a material adverse impact on our business, financial condition and results of operations. However, these changes could also increase the pace of projects, such as carbon capture or storage projects, that could have a positive impact on our business. We cannot predict when or whether any of these various proposals may be enacted or what their effect will be on us or on our customers.
Our effective tax rate may increase or decrease.
We are subject to income taxes in the U.S. and numerous foreign jurisdictions. Significant judgment is required in determining our worldwide provision for income taxes. In the ordinary course of our business, there are many transactions and calculations where the ultimate tax determination is uncertain. We are regularly under audit by tax authorities. Although we believe that our tax estimates and tax positions are reasonable, they could be materially affected by many factors including the final outcome of tax audits and related litigation, the introduction of new tax accounting standards, legislation, regulations and related interpretations, our global mix of earnings, the realizability of deferred tax assets and changes in uncertain tax positions. An increase or decrease in our effective tax rate, or an ultimate determination that the Company owes more taxes than the amounts previously accrued, could have a material adverse impact on our financial condition and results of operations.
Systems and information technology interruption or failure and data security or privacy breaches could adversely impact our ability to operate or expose us to significant financial losses and reputational harm.
We rely heavily on computer, information and communications technology and related systems in order to properly operate our business. From time to time, we experience occasional system interruptions and delays. In the event we are unable to regularly deploy software and hardware, effectively upgrade our systems and network infrastructure and take other steps to maintain or improve the efficiency and efficacy of our systems, the operation of such systems could be interrupted or result in the loss, corruption, or release of data. In addition, our computer and communication systems and operations could be damaged or interrupted by natural disasters, force majeure events, telecommunications failures, power loss, acts of war or terrorism, computer viruses, malicious code, physical or electronic security breaches, intentional or inadvertent user misuse or error or similar events or disruptions. Any of these or other events could cause interruptions, delays, loss of critical and/or sensitive data or similar effects, which could have a material adverse impact on our business, financial condition, protection of intellectual property and results of operations, as well as those of our clients.
Page 27
In addition, we face the threat to our computer systems of unauthorized access, computer hackers, computer viruses, malicious code, ransomware, organized cyber-attacks and other security problems and system disruptions, including possible unauthorized access to and disclosure of our and our clients’ proprietary or classified information.
While we have security measures and technology in place to protect our and our clients’ proprietary or classified information, if these measures fail as a result of a cyber-attack, other third-party action, employee error, malfeasance or otherwise, and someone obtains unauthorized access to our or our clients’ information, our reputation could be damaged, our business may suffer and we could incur significant liability. Because the techniques used to obtain unauthorized access or sabotage systems change frequently and generally are not identified until they are launched against a target, we may be unable to anticipate these techniques or to implement adequate preventative measures. As a result, we may be required to expend significant resources to protect against the threat of system disruptions and security breaches or to alleviate problems caused by these disruptions and breaches. Any of these events could damage our reputation and have a material adverse effect on our business, financial condition, results of operations and cash flows.
In addition, new laws and regulations governing data privacy and the unauthorized disclosure of confidential information, including the European Union General Data Protection Regulation, pose increasingly complex compliance challenges and potentially elevate costs, and any failure to comply with these laws and regulations could result in significant penalties and legal liability.
We continuously evaluate the need to upgrade and/or replace our systems and network infrastructure to protect our computing environment, to stay current on vendor supported products and to improve the efficiency of our systems and for other business reasons. The implementation of new systems and information technology could adversely impact our operations by imposing substantial capital expenditures, demands on management time and risks of delays or difficulties in transitioning to new systems. In addition, our systems implementations may not result in productivity improvements at the levels anticipated. Systems implementation disruption and any other information technology disruption, if not anticipated and appropriately mitigated, could have an adverse effect on our business.
We may not be able to protect our intellectual property or that of our clients.
Our technology and intellectual property provide us, in certain instances, with a competitive advantage. Although we protect our property through registration, licensing, contractual arrangements, security controls and similar mechanisms, we may not be able to successfully preserve our rights and they could be invalidated, circumvented, challenged or become obsolete. Trade secrets are generally difficult to protect. Our employees and contractors are subject to confidentiality obligations, but this protection may be inadequate to deter or prevent misappropriation of our confidential information and/or infringement of our intellectual property. In addition, the laws of some foreign countries in which we operate do not protect intellectual property rights to the same extent as the U.S. If we are unable to protect and maintain our intellectual property rights or if there are any successful intellectual property challenges or infringement proceedings against us, our ability to differentiate our service offerings could be reduced. Litigation to determine the scope of intellectual property rights, even if ultimately successful, could be costly and could divert management’s attention away from other aspects of our business.
We also hold licenses from third parties which may be utilized in our business operations. If we are no longer able to license such technology on commercially reasonable terms or otherwise, our business and financial performance could be adversely affected.
If our intellectual property rights or work processes become obsolete, we may not be able to differentiate our service offerings and some of our competitors may be able to offer more attractive services to our customers. Our competitors may independently attempt to develop or obtain access to technologies that are similar or superior to our technologies.
Our clients or other third parties may also provide us with their technology and intellectual property. There is a risk we may not sufficiently protect our or their information from improper use or dissemination and, as a result, could be subject to claims and litigation and resulting liabilities, loss of contracts or other consequences that could have a material adverse impact on our business, financial condition and results of operations.
Our businesses could be materially and adversely affected by events outside of our control.
Extraordinary or force majeure events beyond our control, such as natural or man-made disasters, could negatively impact our ability to operate. As an example, from time to time we face unexpected severe weather conditions which may result in weather-related delays that are not always reimbursable under a fixed-price contract; evacuation of personnel and curtailment of
Page 28
services; increased labor and material costs in areas resulting from weather-related damage and subsequent increased demand for labor and materials for repairing and rebuilding; inability to deliver materials, equipment and personnel to job sites in accordance with contract schedules; and loss of productivity. We may remain obligated to perform our services after any such natural or man-made event, unless a force majeure clause or other contractual provision provides us with relief from our contractual obligations. If we are not able to react quickly to such events, or if a high concentration of our projects are in a specific geographic region that suffers from a natural or man-made catastrophe, our operations may be significantly affected, which could have a material adverse impact on our operations. In addition, if we cannot complete our contracts on time, we may be subject to potential liability claims by our clients which may reduce our profits.
We are subject to professional standards, duties and statutory obligations on professional reports and opinions we issue, which could subject us to monetary damages.
We issue reports and opinions to clients based on our professional engineering expertise as well as our other professional credentials that subject us to professional standards, duties and obligations regulating the performance of our services. For example, we issue opinions and reports to government clients in connection with securities offerings. If a client or another third party alleges that our report or opinion is incorrect or it is improperly relied upon and we are held responsible, we could be subject to significant monetary damages. In addition, our reports and other work product may need to comply with professional standards, licensing requirements, securities regulations and other laws and rules governing the performance of professional services in the jurisdiction where the services are performed. We could be liable to third parties who use or rely upon our reports and other work product even if we are not contractually bound to those third parties. These events could in turn result in monetary damages and penalties.
Delaware law and our charter documents may impede or discourage a takeover or change of control.
We are a Delaware corporation. Certain anti-takeover provisions of the Delaware general corporation law impose restrictions on the ability of others to acquire control of us. In addition, certain provisions of our charter documents may impede or discourage a takeover. For example:
• | Only our Board of Directors can fill vacancies on the board; |
• | There are various restrictions on the ability of a shareholder to nominate a director for election; and |
• | Our Board of Directors can authorize the issuance of preferred shares. |
These types of provisions, as well as our ability to adopt a shareholder rights agreement in the future, could make it more difficult for a third party to acquire control of us, even if the acquisition would be beneficial to our shareholders. Accordingly, shareholders may be limited in the ability to obtain a premium for their shares.
Risks Relating to the Sale of Our ECR Business
If the sale of our ECR business to WorleyParsons Limited is not completed, we will have incurred substantial expenses without our stockholders realizing the expected benefits.
On October 21, 2018, we entered into a Stock and Asset Purchase Agreement (the “Purchase Agreement”) with WorleyParsons Limited, a company incorporated in Australia (“Buyer”), pursuant to which, subject to the satisfaction or waiver of the conditions therein, we will sell and assign to Buyer our energy, chemicals and resources businesses (the “ECR Business”). Completion of the transaction is subject to closing conditions including, but not limited to, various regulatory approvals. We currently expect that the transaction will be completed during the first half of calendar 2019. It is possible, however, that factors outside of our control including, but not limited to, Buyer’s ability to secure the financing it needs to complete the transaction, could require the parties to complete the transaction at a later time, or not to complete the transaction at all. In the event that the transaction is not consummated for any reason, we will be subject to certain risks, including the costs related to the transaction, such as legal, accounting and advisory fees, which must be paid even if the transaction is not completed. If the transaction is not consummated, the market price of our common stock could decline. We also could be subject to litigation related to any failure to complete the transaction or related to any enforcement proceeding commenced against us to perform our obligations under the Purchase Agreement. Additionally, if the transaction is not consummated, there may not be an alternative party interested in and able to purchase the ECR Business and if an alternative party is identified, such alternative transaction may not result in a comparable aggregate purchase price to what is proposed in this transaction.
We will be subject to business uncertainties and contractual restrictions while the transaction is pending.
Page 29
The pursuit of the transaction and the preparation for the integration of the related assets with Buyer may place a significant burden on management and internal resources. Additionally, our continued success depends, in part, upon our ability to retain the talents and dedication of our employees and employees may decide not to remain with us while the transaction is pending. Any significant diversion of management and employee attention away from ongoing business, loss of employees and difficulties encountered in the transition and integration process could affect our financial results.
In addition, the Purchase Agreement generally requires that we operate the ECR Business in theordinary course of business and restricts us from taking certain actions, including selling any assets of the ECR Business, prior to the consummation of the transaction or termination of the Purchase Agreement without Buyer’s consent. These restrictions may prevent us from pursuing attractive business opportunities that may arise prior to the completion of the transaction. Additionally, as a result of these business uncertainties, our current and potential business partners may decide to delay, defer or cancel entering into new business arrangements with us pending completion or termination of the transaction.
Regulatory approvals, including antitrust approval, necessary for closing the Purchase Agreement may not be received, may take longer than expected or impose conditions that are not presently anticipated.
Before the transaction may be completed, certain approvals or consents must be obtained from the various regulatory authorities in the United States and in certain foreign jurisdictions in which the ECR Business operates, including the expiration or termination of the waiting period applicable under the Hart-Scott-Rodino Antitrust Improvements Act of 1976, as amended (the “HSR Act”), the approvals required pursuant to or in connection with the competition laws of certain foreign jurisdictions in which the ECR Business operates and the receipt of approval from the Committee on Foreign Investment in the United States (“CFIUS”). There can be no assurance as to whether regulatory approvals will be received or the timing of the approvals. Buyer is only required to take commercially reasonable efforts to assist us in obtaining regulatory approvals of the transaction.
Under the Purchase Agreement, we will be responsible for indemnifying Buyer with respect to certain liabilities in a manner that could have a material adverse effect on our financial condition.
We have agreed to indemnify Buyer for damages resulting from or arising out of any liabilities relating to the ECR Business not assumed by Buyer in the transaction and for certain other matters. Significant indemnification claims by Buyer could have a material adverse effect on our financial condition. Any event that results in a right for Buyer to seek indemnity from us under the Purchase Agreement could result in a substantial payment from us to Buyer and could adversely affect our results of operations.
We may be held liable to Buyer if we fail to perform certain services under the transition services agreement, and the performance of such services may negatively impact our business and operations.
We have agreed to enter into a transition services agreement with Buyer in connection with the transaction pursuant to which we will provide Buyer, on an interim, transitional basis, various services, including, but not limited to, executive consultation services, employee benefits administration, human resources and payroll services, tax services, financial and accounting services, information technology services, regulatory services, project management services for certain client contracts, general administrative services and other support services. If we do not satisfactorily perform our obligations under the agreement, we may be required to re-perform such services at no additional cost. In addition, during the transition services period, our management and employees may be required to divert their attention away from our business in order to provide services to Buyer, which could adversely affect our business.
Because the share consideration component of the purchase price is fixed and the market price of Buyer’s ordinary shares and the exchange rate between U.S. and Australian dollars may fluctuate, we cannot be sure of the value of Buyer’s ordinary shares that we will receive on the closing date or at the time we seek to sell the ordinary shares.
Upon completion of the transaction, we will receive 58,197,867 Buyer’s ordinary shares. The number of Buyer’s ordinary shares that we will receive in the transaction is fixed and will not be adjusted for changes in the market price of Buyer’s ordinary shares or for any changes in the exchange rate between U.S. and Australian dollars, which will both likely fluctuate before and after the completion of the transaction. Fluctuations in the value of the Buyer’s ordinary shares could result from changes in their business or the ECR Business’ operations or prospects, regulatory considerations, general market and economic conditions and other factors both within and beyond the control of us or Buyer prior to or following the closing of the transaction. Additionally, under the terms of the Purchase Agreement, the Buyer’s ordinary shares we receive will be subject to a six-month lock-up period following the transaction’s closing during which time we will be unable to sell the ordinary shares and during which time the market price of Buyer’s ordinary shares and the exchange rate between U.S. and Australian dollars will likely fluctuate for the
Page 30
forgoing reasons, which could result in the ordinary shares we receive having a lower value compared to the value of the ordinary shares at the time we entered into the Purchase Agreement.
Item 1B. | UNRESOLVED STAFF COMMENTS |
None.
Item 2. | PROPERTIES |
Our properties consist primarily of office space within general, commercial office buildings located in major cities primarily in the following countries: United States; Argentina; Armenia; Australia; Bahrain; Belgium; Brazil; Canada; Chile; China; Egypt; France; Germany; Greenland; Hong Kong; India; Indonesia; Iraq; Ireland; Italy; Kazakhstan; Korea (Republic of); Malaysia; Mexico; The Netherlands; New Zealand; Oman; Peru; The Philippines; Poland; Qatar; Romania; Russian Federation; Saudi Arabia; Singapore; South Africa; Spain; Sweden; Taiwan (Province of China); Thailand; Trinidad and Tobago; United Arab Emirates; United Kingdom and Vietnam. We also lease smaller offices located in certain other countries. Such space is used for operations (providing technical, professional, and other home office services), sales and administration. Most of our properties are leased. In addition, we have fabrication facilities located in Canada in Pickering, Ontario; St. John, New Brunswick; and Edmonton, Alberta and Lamont, Alberta. The total amount of space used by us for all of our operations is approximately 14.2 million square feet.
Item 3. | LEGAL PROCEEDINGS |
The information required by this Item 3 is included in Note 15 — Contractual Guarantees, Litigation, Investigations and Insurance of Notes to Consolidated Financial Statements beginning on page F-1 of this Annual Report on Form 10-K and is incorporated herein by reference.
Item 4. | MINE SAFETY DISCLOSURE |
Section 1503 of the Dodd-Frank Wall Street Reform and Consumer Protection Act (the “Dodd-Frank Act”) requires domestic mine operators to disclose violations and orders issued under the Federal Mine Safety and Health Act of 1977 (the “Mine Act”) by the federal Mine Safety and Health Administration. Under the Mine Act, an independent contractor, such as Jacobs, that performs services or construction of a mine is included within the definition of a mining operator. We do not act as the owner of any mines.
Information concerning mine safety violations or other regulatory matters required by Section 1503(a) of the Dodd-Frank Act and Item 104 of Regulation S-K is included in Exhibit 95.
Page 31
PART II
Item 5. | MARKET FOR REGISTRANT'S COMMON EQUITY, RELATED STOCKHOLDER MATTERS AND ISSUER PURCHASES OF EQUITY SECURITIES |
Market Information
Jacobs’ common stock is listed on the NYSE and trades under the symbol JEC. We provided to the NYSE, without qualification, the required annual certification of our Chief Executive Officer regarding compliance with the NYSE’s corporate governance listing standards. The following table sets forth the low and high sales prices of a share of our common stock during each of the fiscal quarters presented, based on the NYSE Composite Price History:
Low Sales Price | High Sales Price | |||||||
Fiscal 2018: | ||||||||
First quarter | $ | 57.21 | $ | 69.35 | ||||
Second quarter | $ | 55.42 | $ | 72.18 | ||||
Third quarter | $ | 55.21 | $ | 66.72 | ||||
Fourth quarter | $ | 62.79 | $ | 77.91 | ||||
Fiscal 2017: | ||||||||
First quarter | $ | 49.16 | $ | 63.42 | ||||
Second quarter | $ | 52.39 | $ | 62.20 | ||||
Third quarter | $ | 50.53 | $ | 55.97 | ||||
Fourth quarter | $ | 49.31 | $ | 58.51 | ||||
Shareholders
According to the records of our transfer agent, there were 3,684 shareholders of record as of November 12, 2018.
Share Repurchases
On July 23, 2015, the Board of Directors approved a program to repurchase up to $500.0 million of the Company’s common stock, to expire on July 31, 2018. On July 19, 2018, the Company's Board of Directors authorized the continuation of this share repurchase program for an additional three years, to expire on July 31, 2021. The following table summarizes the activity under this program during fiscal 2018:
Average Price Per Share (1) | Shares Repurchased | Total Shares Retired | |||
$500,000,000 | $60.77 | 49,074 | 49,074 | ||
(1) Includes commissions paid and calculated at the average price per share.
Share repurchases may be executed through various means including, without limitation, open market transactions, privately negotiated transactions or otherwise. The share repurchase program does not obligate the Company to purchase any shares. The authorization for the share repurchase program may be terminated, increased or decreased by the Company’s Board of Directors in its discretion at any time. The timing of share repurchases may depend upon market conditions, other uses of capital, and other factors.
Dividends
On December 1, 2016, the Company announced that the Board of Directors approved the initiation of a cash dividend program. In the fourth fiscal quarter of 2017, the Company declared a dividend of $0.15 per share of the Company’s common stock that was paid in the first fiscal quarter of 2018. In the second, third and fourth fiscal quarters of 2018, the Company declared and paid a dividend of $0.15 per share of the Company’s common stock, for a total of $0.60 per share paid during the year ended September 28, 2018. On September 11, 2018, the Company's Board of Directors declared a dividend of $0.15 per share of the Company's common stock that was paid on October 26, 2018 to shareholders of record on the close of business on September 28, 2018. Future dividend declarations are subject to review and approval by the Company’s Board of Directors.
Page 32
Unregistered Sales of Equity Securities.
None.
Performance Graph
The following graph and table shows the changes over the five-year period ended September 28, 2018 in the value of $100 as of the close of market on September 30, 2013 in (1) the common stock of Jacobs Engineering Group Inc., (2) the Standard & Poor’s 500 Stock Index, and (3) the Dow Jones Heavy Construction Group Index. The values of each investment are based on share price appreciation, with reinvestment of all dividends, provided any were paid. The investments are assumed to have occurred at the beginning of the period presented. The stock performance included in this graph is not necessarily indicative of future stock price performance.
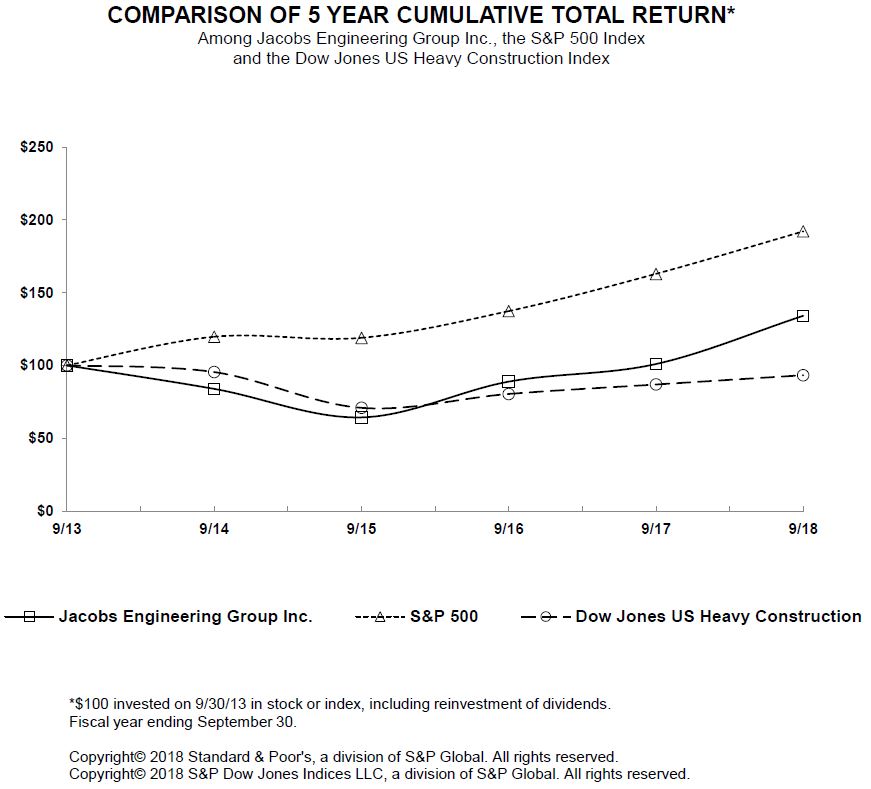
2013 | 2014 | 2015 | 2016 | 2017 | 2018 | ||||||||||||
Jacobs Engineering Group Inc. | 100.00 | 83.91 | 64.33 | 88.90 | 100.99 | 134.11 | |||||||||||
S&P 500 | 100.00 | 119.73 | 119.00 | 137.36 | 162.92 | 192.10 | |||||||||||
Dow Jones US Heavy Construction | 100.00 | 95.45 | 70.89 | 80.42 | 86.92 | 93.30 | |||||||||||
Note: The above information was provided by Research Data Group, Inc.
Item 6. | SELECTED FINANCIAL DATA |
The following table presents selected financial data for each of the last five fiscal years. This selected financial data should be read in conjunction with the Consolidated Financial Statements and related notes beginning on page F-1 of this Annual Report on Form 10-K. Dollar amounts are presented in thousands, except for per share information:
Page 33
2018 (a) | 2017 (b) | 2016 (c) | 2015 (d) | 2014 (e) | |||||||||||||||
Results of Operations: | |||||||||||||||||||
Revenues | $ | 14,984,646 | $ | 10,022,788 | $ | 10,964,157 | $ | 12,114,832 | $ | 12,695,157 | |||||||||
Net earnings attributable to Jacobs | $ | 163,431 | $ | 293,727 | $ | 210,463 | $ | 302,971 | $ | 328,108 | |||||||||
Financial Position: | |||||||||||||||||||
Current ratio | 1.45 to 1 | 1.56 to 1 | 1.61 to 1 | 1.58 to 1 | 1.58 to 1 | ||||||||||||||
Working capital | $ | 1,410,891 | $ | 1,069,953 | $ | 1,081,784 | $ | 1,141,512 | $ | 1,372,332 | |||||||||
Current assets | $ | 4,556,584 | $ | 2,996,180 | $ | 2,864,470 | $ | 3,122,678 | $ | 3,722,178 | |||||||||
Total assets | $ | 12,645,795 | $ | 7,380,859 | $ | 7,360,022 | $ | 7,785,926 | $ | 8,453,659 | |||||||||
Cash | $ | 793,358 | $ | 774,151 | $ | 655,716 | $ | 460,859 | $ | 732,647 | |||||||||
Long-term debt | $ | 2,146,877 | $ | 235,000 | $ | 385,330 | $ | 584,434 | $ | 764,075 | |||||||||
Total Jacobs stockholders’ equity | $ | 5,854,345 | $ | 4,428,352 | $ | 4,265,276 | $ | 4,291,745 | $ | 4,469,255 | |||||||||
Return on average equity | 3.18 | % | 6.76 | % | 4.92 | % | 6.92 | % | 7.56 | % | |||||||||
Backlog: | $ | 27,298,614 | $ | 19,788,613 | $ | 18,760,529 | $ | 18,806,570 | $ | 18,380,034 | |||||||||
Per Share Information: | |||||||||||||||||||
Basic earnings per share | $ | 1.18 | $ | 2.43 | $ | 1.75 | $ | 2.42 | $ | 2.51 | |||||||||
Diluted earnings per share | $ | 1.17 | $ | 2.42 | $ | 1.73 | $ | 2.40 | $ | 2.48 | |||||||||
Stockholders’ equity | $ | 42.21 | $ | 36.78 | $ | 35.26 | $ | 34.85 | $ | 33.92 | |||||||||
Average Number of Shares of Common Stock and Common Stock Equivalents Outstanding (Diluted) | 138,712 | 120,147 | 121,483 | 126,110 | 132,371 | ||||||||||||||
Common Shares Outstanding At Year End | 142,218 | 120,386 | 120,951 | 123,153 | 131,753 | ||||||||||||||
Cash Dividends Declared Per Common Share | $ | 0.60 | $ | 0.60 | $ | — | $ | — | $ | — | |||||||||
(a) | Includes costs of $140.1 million, or $1.01 per diluted share, related to the Company's restructuring and other initiatives during fiscal 2018, which includes $21.0 million in loss related to the sale of the Company's investment in Guimar Engenharia Ltda. Also included in fiscal 2018 are after-tax charges of $60.7 million, or $0.44 per diluted share, in professional fees and related costs associated with the CH2M acquisition and pending ECR sale and $259.2 million, or $1.86 per diluted share, in benefits related to tax reform. |
(b) | Includes costs of $87.9 million, or $0.73 per diluted share, related to the Company's restructuring and other initiatives during fiscal 2017. Also included in the fourth quarter of fiscal 2017 are after-tax charges of $10.6 million, or $0.09 per diluted share, respectively, in professional fees and related costs associated with the CH2M acquisition. |
(c) | Includes costs of $135.6 million, or $1.12 per diluted share, related to the Company's restructuring initiatives during fiscal 2016. Also included in the fourth quarter of fiscal 2016 are (i) a loss on sale of our French subsidiary of $17.1 million or $0.14 per diluted share; and (ii) a non-cash write-off on an equity investment of $10.4 million or $0.09 per diluted share. |
(d) | Includes costs of $107.9 million, or $0.86 per diluted share, related to the Company's restructuring initiatives during fiscal 2015. |
(e) | Includes costs of $109.2 million, or $0.82 per diluted share, related to the Company's restructuring initiatives during fiscal 2014. |
Item 7. | MANAGEMENT'S DISCUSSION AND ANALYSIS OF FINANCIAL CONDITION AND RESULTS OF OPERATIONS |
Critical Accounting Policies and Estimates
In order to better understand the changes that occur to key elements of our financial condition, results of operations and cash flows, a reader of this Management’s Discussion and Analysis of Financial Condition and Results of Operations (“MD&A”) should be aware of the critical accounting policies we apply in preparing our consolidated financial statements.
The consolidated financial statements contained in this report were prepared in accordance with U.S. GAAP. The preparation of our consolidated financial statements and the financial statements of any business performing long-term engineering and construction-type contracts requires management to make certain estimates and judgments that affect both the entity’s results of operations and the carrying values of its assets and liabilities. Although our significant accounting policies are described in Note 2 - Significant Accounting Policies of Notes to Consolidated Financial Statements beginning on page F-1 of this Annual Report on Form 10-K, the following discussion is intended to highlight and describe those accounting policies that are especially critical to the preparation of our consolidated financial statements.
Page 34
Revenue Accounting for Contracts - We recognize revenue earned on our technical professional and field services projects under the percentage-of-completion method described in ASC 605-35, Construction-Type and Production-Type Contracts. In general, we recognize revenues at the time we provide services. Pre-contract costs are generally expensed as incurred, unless they are directly associated with an anticipated contract and recoverability from that contract is probable. Contracts are generally segmented between types of services, such as engineering and construction, and accordingly, gross margin related to each activity is recognized as those separate services are rendered. For multiple contracts with a single customer we account for each contract separately.
The percentage-of-completion method of accounting is applied by comparing contract costs incurred to date to the total estimated costs at completion. Contract losses are provided for in their entirety in the period they become known, without regard to the percentage-of-completion.
Unapproved change orders are included in the contract price to the extent it is probable that such change orders will result in additional contract revenue and the amount of such additional revenue can be reliably estimated. Claims meeting these recognition criteria are included in revenues only to the extent of the related costs incurred.
Certain cost-reimbursable contracts include incentive-fee arrangements. These incentive fees can be based on a variety of factors but the most common are the achievement of target completion dates, target costs, and/or other performance criteria. Failure to meet these targets can result in unrealized incentive fees. We recognize incentive fees based on expected results using the percentage-of-completion method of accounting. As the contract progresses and more information becomes available, the estimate of the anticipated incentive fee that will be earned is revised as necessary. We bill incentive fees based on the terms and conditions of the individual contracts. In certain situations, we are allowed to bill a portion of the incentive fees over the performance period of the contract. In other situations, we are allowed to bill incentive fees only after the target criterion has been achieved. Incentive fees which have been recognized but not billed are included in receivables in the accompanying Consolidated Balance Sheets.
Certain cost-reimbursable contracts with government customers as well as certain commercial clients provide that contract costs are subject to audit and adjustment. In this situation, revenues are recorded at the time services are performed based upon the amounts we expect to realize upon completion of the contracts. In those situations where an audit indicates that we may have billed a client for costs not allowable under the terms of the contract, we estimate the amount of such nonbillable costs and adjust our revenues accordingly.
When we are directly responsible for subcontractor labor or third-party materials and equipment, we reflect the costs of such items in both revenues and costs (and we refer to such costs as “pass-through” costs). On those projects where the client elects to pay for such items directly and we have no associated responsibility for such items, these amounts are not reflected in either revenues or costs.
Joint Ventures - As is common to the industry, we execute certain contracts jointly with third parties through various forms of joint ventures. Although the joint ventures own and hold the contracts with the clients, the services required by the contracts are typically performed by us and our joint venture partners, or by other subcontractors under subcontracting agreements with the joint ventures. Many of these joint ventures are formed for a specific project. The assets of our joint ventures generally consist almost entirely of cash and receivables (representing amounts due from clients), and the liabilities of our joint ventures generally consist almost entirely of amounts due to the joint venture partners (for services provided by the partners to the joint ventures under their individual subcontracts) and other subcontractors. In general, at any given time, the equity of our joint ventures represents the undistributed profits earned on contracts the joint ventures hold with clients. Very few of our joint ventures have employees or third-party debt or credit facilities. The debt held by the joint ventures is non-recourse to the general credit of Jacobs. The assets of a joint venture are restricted for use to the obligations of the particular joint venture and are not available for general operations of the Company. Our risk of loss on these arrangements is usually shared with our partners. The liability of each partner is usually joint and several, which means that each partner may become liable for the entire risk of loss on the project. Furthermore, on some of our projects, the Company has granted guarantees which may encumber both our contracting subsidiary company and the Company for the entire risk of loss on the project. See Note 15- Contractual Guarantees, Litigation, Investigations and Insurance for further discussion.
Many of the joint ventures are deemed to be variable interest entities (“VIE”) because they lack sufficient equity to finance the activities of the joint venture. The Company uses a qualitative approach to determine if the Company is the primary beneficiary of the VIE, which considers factors that indicate a party has the power to direct the activities that most significantly impact the joint venture’s economic performance. These factors include the composition of the governing board, how board decisions are approved, the powers granted to the operational manager(s) and partner that holds that position(s), and to a certain extent, the partner’s economic interest in the joint venture. The Company analyzes each joint venture initially to determine if it should be consolidated or unconsolidated.
Page 35
• | Consolidated if the Company is the primary beneficiary of a VIE, or holds the majority of voting interests of a non-VIE (and no significant participative rights are available to the other partners). |
• | Unconsolidated if the Company is not the primary beneficiary of a VIE, or does not hold the majority of voting interest of a non-VIE. |
Share-Based Payments - We measure the value of services received from employees and directors in exchange for an award of an equity instrument based on the grant-date fair value of the award. The computed value is recognized as a non-cash cost on a straight-line basis over the period the individual provides services, which is typically the vesting period of the award (with the exception of awards containing an internal performance measure which are recognized on a straight-line basis over the vesting period subject to the probability of meeting the performance requirements and adjusted for the number of shares expected to be earned).
Accounting for Pension Plans - The accounting for pension plans requires the use of assumptions and estimates in order to calculate periodic pension cost and the value of the plans’ assets and liabilities. These assumptions include discount rates, investment returns and projected salary increases, among others. The actuarial assumptions used in determining the funded statuses of the plans are provided in Note 10 - Pension and Other Postretirement Benefit Plans of Notes to Consolidated Financial Statements beginning on page F-1 of this Annual Report on Form 10-K.
The expected rates of return on plan assets for fiscal 2019 range from 2.9% to 7.5% and were 3.5% to 8.5% for fiscal 2018. We believe the range of rates selected for fiscal 2019 reflects the long-term returns expected on the plans’ assets, considering recent market conditions, projected rates of inflation, the diversification of the plans’ assets, and the expected real rates of market returns. The discount rates used to compute plan liabilities were changed from a range of 1.3% to 7.0% in fiscal 2017 to a range of 1.3% to 8.1% in fiscal 2018. These assumptions represent the Company’s best estimate of the rates at which its pension obligations could be effectively settled.
Changes in the actuarial assumptions often have a material effect on the values assigned to plan assets and liabilities, and the associated pension expense. For example, if the discount rate used to value the net pension benefit obligation (“PBO”) at September 28, 2018, was higher by 0.5%, the PBO would have been lower at that date by approximately $180.2 million for non-U.S. plans, and by approximately $21.9 million for U.S. plans. If the expected return on plan assets was higher by 1.0%, the net periodic pension cost for fiscal 2018 would be lower by approximately $18.7 million for non-U.S. plans, and by approximately $3.7 million for U.S. plans. Differences between actuarial assumptions and actual performance (i.e., actuarial gains and losses) that are not recognized as a component of net periodic pension cost in the period in which such differences arise are recorded to accumulated other comprehensive income (loss) and are recognized as part of net periodic pension cost in future periods in accordance with U.S. GAAP. Management monitors trends in the marketplace within which our pension plans operate in an effort to assure the fairness of the actuarial assumptions used.
Contractual Guarantees, Litigation, Investigations, and Insurance - In the normal course of business, we make contractual commitments, some of which are supported by separate guarantees; and on occasion we are a party in a litigation or arbitration proceeding. The litigation in which we are involved includes personal injury claims, professional liability claims, and breach of contract claims. In most cases, we are the defendant. Where we provide a separate guarantee, it is strictly in support of the underlying contractual commitment. Guarantees take various forms including surety bonds required by law, or standby letters of credit ("LOC") (also referred to as “bank guarantees”) or corporate guarantees given to induce a party to enter into a contract with a subsidiary. Standby LOCs are also used as security for advance payments or in various other transactions. The guarantees have various expiration dates ranging from an arbitrary date to completion of our work (e.g., engineering only) to completion of the overall project. We maintain insurance coverage for most insurable aspects of our business and operations. Our insurance programs have varying coverage limits depending upon the type of insurance, and include certain conditions and exclusions which insurance companies may raise in response to any claim that the Company brings. We have also elected to retain a portion of losses and liabilities that occur through the use of various deductibles, limits, and retentions under our insurance programs. As a result, we may be subject to a future liability for which we are only partially insured or completely uninsured. We intend to mitigate any such future liability by continuing to exercise prudent business judgment in negotiating the terms and conditions of the contracts which the Company enters with its clients. Our insurers are also subject to business risk and, as a result, one or more of them may be unable to fulfill their insurance obligations due to insolvency or otherwise.
Additionally, as a contractor providing services to the U.S. federal government we are subject to many types of audits, investigations, and claims by, or on behalf of, the government including with respect to contract performance, pricing, cost allocations, procurement practices, labor practices, and socioeconomic obligations. Furthermore, our income, franchise, and similar tax returns and filings are also subject to audit and investigation by the Internal Revenue Service, most states within the U.S., as well as by various government agencies representing jurisdictions outside the U.S.
Page 36
Our Consolidated Balance Sheets include amounts representing our probable estimated liability relating to such claims, guarantees, litigation, audits, and investigations. We perform an analysis to determine the level of reserves to establish for insurance-related claims that are known and have been asserted against us, as well as for insurance-related claims that are believed to have been incurred based on actuarial analysis, but have not yet been reported to our claims administrators as of the respective balance sheet dates. We include any adjustments to such insurance reserves in our consolidated results of operations.
Testing Goodwill for Possible Impairment - The goodwill carried on our Consolidated Balance Sheets is tested annually for possible impairment, and on an interim basis if indicators of possible impairment exist. For purposes of impairment testing, goodwill is assigned to the applicable reporting units based on the current reporting structure. In performing the annual impairment test, we evaluate our goodwill at the reporting unit level. The Company performs the annual goodwill impairment test for the reporting units at the end of the third quarter of our fiscal year. However, during the quarter ended September 28, 2018, the Company voluntarily changed the date of its annual goodwill and indefinite-lived intangible asset impairment testing from the last day of the fiscal third quarter to the first day of the fourth quarter. This voluntary change is expected to result in better alignment of the Company's annual impairment test with the Company’s strategic planning and forecasting process. The voluntary change in accounting principle related to the annual testing date will not delay, accelerate or avoid an impairment charge. It would be impracticable to apply this change retrospectively because retrospective application would require reliance on significant estimates and assumptions with the use of hindsight. Accordingly, this change will only be applied prospectively.
Additionally, during the second quarter of fiscal 2018, we reorganized our operating and reporting structure around three global lines of business (“LOBs”), which also serve as the Company’s operating segments: (i) Aerospace, Technology, Environmental and Nuclear, (ii) Buildings, Infrastructure and Advanced Facilities, and (iii) Energy, Chemicals and Resources. This reorganization occurred in conjunction with the integration of CH2M into the Company's legacy businesses, and was intended to better serve our global clients, leverage our workforce, help streamline operations, and provide enhanced growth opportunities. The Company’s LOB leadership and internal reporting structures report to the Chief Executive Officer, who is also the Chief Operating Decision Maker (“CODM”), and enable the CODM to evaluate the performance of each of these segments and make appropriate resource allocations among each of the segments. For purposes of the Company’s goodwill impairment testing, it has been determined that the Company’s operating segments are also its reporting units based on management’s conclusion that the components comprising each of its operating segments share similar economic characteristics and meet the aggregation criteria for reporting units in accordance with ASC 350, Intangibles-Goodwill and Other.
U.S. GAAP does not prescribe a specific valuation method for estimating the fair value of reporting units. Any valuation technique used to estimate the fair value of a reporting unit requires the use of significant estimates and assumptions, including revenue growth rates, operating margins, discount rates and future market conditions, among others.
We used an income approach to test our goodwill for possible impairment which requires us to make estimates and judgments. Under the income approach, fair value is determined by using the discounted cash flows of our reporting units. The Company’s discount rate reflects a weighted average cost of capital (“WACC”) for a peer group of companies representative of the Company’s respective reporting units. The fair values for each reporting unit exceeded the respective book values ranging from 31% to 132%.
It is possible that changes in market conditions, economy, facts and circumstances, judgments and assumptions used in estimating the fair value could change, resulting in possible impairment of goodwill in the future. The fair values resulting from the valuation techniques used are not necessarily representative of the values we might obtain in a sale of the reporting units to willing third parties.
We have determined that the fair value of our reporting units substantially exceeded their respective carrying values for the Consolidated Balance Sheets presented.
Restructuring and Other Charges
During the fourth fiscal quarter of 2017, the Company implemented certain restructuring and pre-integration plans associated with the closing of its acquisition of CH2M, which occurred on December 15, 2017. The restructuring activities and related costs under these plans were comprised mainly of severance and lease abandonment programs, while the pre-integration activities and costs were mainly related to the engagement of consulting services and internal personnel and other related costs dedicated to the Company’s acquisition integration management efforts.
Following the closing of the CH2M acquisition, these activities have continued into fiscal 2018 and include restructuring activities amounting to approximately $101.7 million in pre-tax charges during the year ended September 28, 2018. Combined with $89.2 million in integration activities for the same period, the total cost of these restructuring and integration activities approximated
Page 37
$190.8 million for the year ended September 28, 2018. These activities are expected to continue through fiscal 2019. These activities are not expected to involve the exit of any service types or client end-markets. Also during fiscal 2018 the Company disposed of its investment in Guimar in order to resolve potential conflicts arising from the CH2M acquisition, which resulted in a loss as discussed below.
During the second fiscal quarter of 2017, the Company entered into strategic business restructuring activities associated with realignment of its Europe, United Kingdom ("U.K.") and Middle East regional operations in our BIAF segment. Pre-tax net charges of $22.6 million were recorded associated mainly with net realizable value write-offs on contract accounts receivable of $16.5 million, with additional charges recorded for statutory redundancy and severance costs of $1.4 million and other liabilities of $4.7 million.
During the second fiscal quarter of 2015, the Company began implementing a series of initiatives intended to improve operational efficiency, reduce costs, and better position itself to drive growth of the business in the future. We refer to these initiatives, in the aggregate, as the “2015 Restructuring”. These activities evolved and developed over time as management identified and evaluated opportunities for changes in the Company’s operations (and related areas of potential cost savings), as economic conditions changed and as the realignment of the Company’s operations into its global LOB structure was implemented. Actions related to the 2015 Restructuring included involuntary terminations, the abandonment of certain leased offices, combining operational organizations, and the colocation of employees into other existing offices. These activities did not involve the exit of any service types or client end-markets. The 2015 Restructuring was completed in fiscal 2017, although cash payments continue to be made under the related accruals recorded in connection with these activities.
Collectively, the above mentioned restructuring activities are referred to as “Restructuring and other charges”.
The following table summarizes the impacts of the Restructuring and other charges (or recoveries, which primarily relate to the reversals of lease abandonment accruals related to previously vacated facilities which are now planned to be utilized) on the Company's reportable segment income by line of business in connection with the CH2M acquisition for the year ended September 28, 2018 and the 2015 Restructuring and realignment of the Company's BIAF Europe, U.K. and Middle East regional operations for the years ended September 29, 2017 and September 30, 2016 (in thousands):
September 28, 2018 | September 29, 2017 | September 30, 2016 | |||||||||
Aerospace, Technology, Environmental and Nuclear | $ | 20,254 | $ | 2,356 | $ | 8,210 | |||||
Buildings, Infrastructure and Advanced Facilities | 56,238 | 47,743 | 24,566 | ||||||||
Energy, Chemicals and Resources | 37,166 | 42,558 | 113,315 | ||||||||
Corporate | 77,148 | 42,781 | 41,816 | ||||||||
Total | $ | 190,806 | $ | 135,438 | $ | 187,907 | |||||
The activity in the Company’s accrual for the Restructuring and other charges for the year ended September 28, 2018 is as follows (in thousands):
Balance at September 29, 2017 | $ | 142,767 | |
CH2M Acquisition Assumed Liabilities | 31,576 | ||
CH2M Charges | 190,806 | ||
Payments & Usage | (189,673 | ) | |
Balance at September 28, 2018 | $ | 175,476 | |
The following table summarizes the Restructuring and other charges by major type of costs in connection with the CH2M acquisition for the year ended September 28, 2018 and the 2015 Restructuring and realignment of the Company's Europe, U.K. and Middle East regional operations for the years ended September 29, 2017 and September 30, 2016 (in thousands):
Page 38
September 28, 2018 | September 29, 2017 | September 30, 2016 | |||||||||
Lease Abandonments | $ | 53,914 | $ | 55,647 | $ | 92,643 | |||||
Involuntary Terminations | 37,063 | 43,667 | 85,599 | ||||||||
Outside Services | 36,308 | 4,236 | 7,398 | ||||||||
Other (1) | 63,521 | 31,888 | 2,267 | ||||||||
Total | $ | 190,806 | $ | 135,438 | $ | 187,907 | |||||
(1) Includes $21.0 million in the fourth quarter of fiscal 2018 relating to the loss on the sale of our Guimar joint venture investment recognized in other income (expense).
Cumulative amounts incurred to date for Restructuring and other charges by each major type of costs as of September 28, 2018 are as follows (in thousands):
Lease Abandonments | $ | 292,773 | |
Involuntary Terminations | 221,642 | ||
Outside Services | 60,677 | ||
Other | 96,252 | ||
Total | $ | 671,344 | |
JACOBS ENGINEERING GROUP INC. AND SUBSIDIARIES
CONSOLIDATED STATEMENTS OF EARNINGS
For the Fiscal Years Ended September 28, 2018, September 29, 2017 and September 30, 2016
(In thousands, except per share information)
September 28, 2018 | September 29, 2017 | September 30, 2016 | |||||||||
Revenues | $ | 14,984,646 | $ | 10,022,788 | $ | 10,964,157 | |||||
Direct cost of contracts | (12,156,276 | ) | (8,250,536 | ) | (9,196,326 | ) | |||||
Gross profit | 2,828,370 | 1,772,252 | 1,767,831 | ||||||||
Selling, general and administrative expenses | (2,180,399 | ) | (1,379,983 | ) | (1,429,233 | ) | |||||
Operating Profit | 647,971 | 392,269 | 338,598 | ||||||||
Other Income (Expense): | |||||||||||
Interest income | 8,984 | 8,748 | 7,848 | ||||||||
Interest expense | (76,760 | ) | (12,035 | ) | (15,260 | ) | |||||
Gain (Loss) on disposal of business and investments | (20,967 | ) | 10,880 | (41,410 | ) | ||||||
Miscellaneous income (expense), net | (4,523 | ) | (6,645 | ) | (3,053 | ) | |||||
Total other (expense) income, net | (93,266 | ) | 948 | (51,875 | ) | ||||||
Earnings Before Taxes | 554,705 | 393,217 | 286,723 | ||||||||
Income Tax Expense | (381,563 | ) | (105,842 | ) | (72,208 | ) | |||||
Net Earnings of the Group | 173,142 | 287,375 | 214,515 | ||||||||
Net (Earnings) Loss Attributable to Noncontrolling Interests | (9,711 | ) | 6,352 | (4,052 | ) | ||||||
Net Earnings Attributable to Jacobs | $ | 163,431 | $ | 293,727 | $ | 210,463 | |||||
Net Earnings Per Share: | |||||||||||
Basic | $ | 1.18 | $ | 2.43 | $ | 1.75 | |||||
Diluted | $ | 1.17 | $ | 2.42 | $ | 1.73 | |||||
2018 Overview
The Company's net earnings for fiscal 2018 were $163.4 million (or $1.17 per diluted share), a decrease of $130.3 million, or 44.4%, from $293.7 million (or $2.42 per diluted share) for the corresponding period last year. Included in the Company’s operating
Page 39
results were $140.1 million (or $1.01 per share) in after tax Restructuring and other charges, $60.7 million in CH2M and ECR transaction costs and $259.2 million in income tax charges associated with the Tax Cuts and Jobs Act (“the Act”) enacted on December 22, 2017. Our fiscal 2017 results included $87.9 million (or $0.72 per share) in after tax charges associated with Restructuring and other charges and $10.6 million in CH2M transaction costs. Income taxes for fiscal 2018 were $381.6 million, an increase of $275.7 million, or 260.5%, from $105.8 million due mainly to the impacts from the provisional remeasurement of the deferred tax items and other impacts from U.S. Tax Reform.
On December 15, 2017, the Company completed the acquisition of CH2M, an international provider of engineering, construction and technical services, by acquiring 100% of the outstanding shares of CH2M common stock and preferred stock. The purpose of the acquisition was to further diversify the Company’s market presence in the water, nuclear and environmental remediation sectors and to further the Company’s growth strategy. The Company paid total consideration of approximately $1.8 billion in cash (excluding $315.2 million of cash acquired) and issued approximately $1.4 billion of Jacobs’ common stock to the former stockholders and certain equity award holders of CH2M.
Backlog at September 28, 2018 was $27.3 billion, up $7.5 billion, from $19.8 billion for the corresponding period last year. New prospects and new sales remain strong and the Company continues to have a positive outlook for many of the industry groups and markets in which our clients operate.
Results of Operations
As previously noted by Company management, the Company was continuing to finalize its year end audit processes, including with respect to income taxes, at the time of its 4th quarter earnings release. In that regard, the Company’s 2018 income tax expense also includes approximately $15.0 million in deferred income taxes associated with final one-time adjustments with respect to valuation allowances on foreign tax credits associated with the acquisition of the CH2M business that had not been included in the Company’s fourth quarter fiscal 2018 earnings release furnished on Form 8-K on November 20, 2018. The impact of these adjustments was $.10 per share for the year ended September 28, 2018.
Fiscal 2018 Compared to Fiscal 2017
Total revenues for the year ended September 28, 2018, were $14.98 billion, an increase of $4.96 billion, or 49.5%, from $10.02 billion for the corresponding period last year. The increase in revenues was due primarily to favorable impacts from the CH2M acquisition, which contributed approximately $3.81 billion in incremental revenues for fiscal 2018. Higher volumes in our legacy ATEN, BIAF and ECR businesses also contributed to the increase.
Pass-through costs included in revenues for the year ended September 28, 2018 were $3.06 billion in comparison to $2.54 billion in the prior year. These year-over-year increases are due primarily to impacts from the CH2M acquisition as well as to pass-through costs in revenues from the ATEN businesses. In general, pass-through costs are more significant on projects that have a higher content of field services activities. Pass-through costs are generally incurred at specific points during the life cycle of a project and are highly dependent on the needs of our individual clients and the nature of the clients’ projects. However, because we have hundreds of projects which start at various times within a fiscal year, the effect of pass-through costs on the level of direct costs of contracts can vary between fiscal years without there being a fundamental or significant change to the underlying business.
Gross profit for the year ended September 28, 2018 was $2.83 billion, up $1.06 billion, or 59.6% from $1.77 billion from the corresponding period in 2017. Our gross profit margins were 18.9% and 17.7% for the years ended September 28, 2018 and September 29, 2017, respectively. The higher volume impacts seen in our ATEN, BIAF and ECR businesses, incremental benefits of the CH2M businesses acquired, and our continuing strategic focus on realigning our portfolio to higher margin businesses and project execution drove improving gross profit and margins for the year over year periods.
Selling, general & administrative expenses for the year ended September 28, 2018 were $2.18 billion, an increase of $800.4 million, or 58.0%, from $1.38 billion for the corresponding period last year. The increase in SG&A expenses is due mainly to incremental SG&A expense from the CH2M businesses acquired of approximately $650.3 million during the 2018 period, which included $99.3 million of restructuring and other charges and deal related costs, as well as higher personnel related costs year over year and charges associated with a legal matter of $15.0 million. Also, unfavorable impacts from foreign exchange (mainly from the stronger Australian Dollar and Indian Rupee) approximated $16.0 million.
Net interest expense for the year ended September 28, 2018 was $67.8 million, an increase of $64.5 million from $3.3 million for the corresponding period last year. The increases in net interest expense as compared to the corresponding periods last year was due primarily to higher levels of average debt balances outstanding related to financing activities for the acquisition of CH2M, which was partially funded with term loan financing of $1.5 billion and revolving credit line borrowings of $850 million.
Page 40
Miscellaneous expense, net for the year ended September 28, 2018 was $4.5 million, a decrease of $2.1 million as compared to $6.6 million for the corresponding period last year. The increases were due primarily to unfavorable year over year impacts from unrealized gains and losses from foreign exchange.
Gain/(Loss) on disposal of business and investments was $(21.0) million and $10.9 million for the years ended September 28, 2018 and September 29, 2017, respectively. The reported loss amounts for fiscal 2018 were associated mainly with the Company's divestiture of its equity investment in the Guimar joint venture. The 2017 gain amount was associated mainly with the Company’s divestiture of its equity investment in Neste Jacobs Oy, a joint venture between the Company and Neste Corporation.
The Company’s consolidated effective income tax rate is generally higher than the U.S. statutory rate of 24.60010276% primarily due to the impacts related to U.S. Tax Reform and the integration of CH2M's tax attributes. The following table reconciles total income tax expense using the statutory U.S. federal income tax rate to the consolidated income tax expense shown in the accompanying Consolidated Statements of Earnings for the years ended September 28, 2018 and September 29, 2017 (dollars in thousands):
For the Years Ended | |||||||||||||
September 28, 2018 | % | September 29, 2017 | % | ||||||||||
Statutory amount | $ | 136,458 | 24.6 | % | $ | 137,626 | 35.0 | % | |||||
State taxes, net of the federal benefit | 7,587 | 1.4 | % | 8,955 | 2.3 | % | |||||||
Exclusion of tax on non-controlling interests | (2,389) | (0.4 | )% | 2,223 | 0.6 | % | |||||||
Foreign: | |||||||||||||
Difference in tax rates of foreign operations | 9,860 | 1.8 | % | (16,987 | ) | (4.3 | )% | ||||||
Benefit from valuation allowance release | (5,105) | (0.9 | )% | (3,085 | ) | (0.8 | )% | ||||||
U.K. tax rate change on deferred tax assets | — | — | — | — | |||||||||
Nontaxable income from foreign affiliate | — | — | (3,280 | ) | (0.8 | )% | |||||||
U.S. tax cost of foreign operations | 6,577 | 1.2 | % | 18,612 | 4.7 | % | |||||||
Tax differential on foreign earnings | 11,332 | 2.0 | % | (4,740 | ) | (1.2 | )% | ||||||
Foreign tax credits | (21,729) | (3.9 | )% | (20,454 | ) | (5.2 | )% | ||||||
Tax Reform | 154,150 | 27.8 | % | — | — | ||||||||
Valuation Allowance | 104,221 | 18.8 | % | — | — | ||||||||
Uncertain tax positions | (1,297) | (0.2 | )% | (5,779 | ) | (1.5 | )% | ||||||
Other items: | |||||||||||||
IRS §179D deduction | (4,520) | (0.8 | )% | (3,351 | ) | (0.8 | )% | ||||||
IRS §199D deduction | — | — | (2,113 | ) | (0.5 | )% | |||||||
Foreign partnership loss | (3,990) | (0.7 | )% | (9,861 | ) | (2.5 | )% | ||||||
Other items - net | 1,740 | 0.3 | % | 3,336 | 0.7 | % | |||||||
Total other items | (6,770) | (1.2 | )% | (11,989 | ) | (3.1 | )% | ||||||
Taxes on income | $ | 381,563 | 68.8 | % | $ | 105,842 | 26.9 | % | |||||
The Company’s consolidated effective income tax rate for the year ended September 28, 2018 increased to 68.788%% from 26.9% in fiscal 2017. Key drivers for this year over year increase include the impacts from the provisional remeasurement of the deferred tax items and other impacts from U.S. Tax Reform.
On December 22, 2017, the Tax Cuts and Jobs Act was enacted in the United States. The Act reduces the top corporate U.S. federal statutory tax rate from 35% to 21% starting on January 1, 2018, resulting in a blended statutory tax rate for fiscal year filers. The Company’s blended federal statutory tax rate for fiscal 2018 is 24.6%. It also requires companies to pay a one-time transition tax on earnings of certain foreign subsidiaries, places limitations and exclusions on varied tax deductions and creates new taxes on certain foreign sourced earnings. The majority of the tax provisions are effective for the first tax year beginning after January 1, 2018, which will be the Company’s taxable year beginning fiscal 2019.
Fiscal 2017 Compared to Fiscal 2016
Page 41
Total revenues for the year ended September 29, 2017, were $10.02 billion, decrease of $941.4 million, or 8.6%, from $10.96 billion for the corresponding period last year. The decrease in revenues was due primarily to lower volumes in the ECR and ATEN LOBs. These lower volumes were driven mainly by lower field services volume, primarily with ECR customers and the timing of project completions versus new project timing.
Pass-through costs included in revenues for the year ended September 29, 2017 were $2.54 billion in comparison to $2.49 billion in line with amounts in the corresponding period last year. In general, pass-through costs are more significant on projects that have a higher content of field services activities. Pass-through costs are generally incurred at specific points during the life cycle of a project and are highly dependent on the needs of our individual clients and the nature of the clients’ projects. However, because we have hundreds of projects which start at various times within a fiscal year, the effect of pass-through costs on the level of direct costs of contracts can vary between fiscal years without there being a fundamental or significant change to the underlying business.
Gross profit for the year ended September 29, 2017 was $1.77 billion, an increase of $4.4 million, or 0.25% from the corresponding period in 2016. Our gross profit margins were 17.7% and 16.1% for the years ended September 29, 2017 and September 30, 2016, respectively. Our continuing strategic focus on realigning our portfolio to higher margin businesses and project execution drove improving gross profit and margins for the year over year periods.
Selling, general & administrative expenses for the year ended September 29, 2017 were $1.38 billion, decrease of $49.2 million, or 3.44%, from $1.43 billion for the corresponding period last year. The decrease in SG&A expenses for the comparative annual periods was due mainly to lower Restructuring and other charges of $75.9 million and related savings from the 2015 Restructuring. These decreases were offset in part by higher year over year spending mainly in personnel related costs and professional service fees, including an additional $17.1 million associated with CH2M professional service fees and integration costs.
Net interest expense for the year ended September 29, 2017 was $3.3 million, a decrease of $4.1 million from $7.4 million for the corresponding period last year. The decrease in interest expense for the year ended September 29, 2017 as compared to the corresponding period last year was due primarily to the reversal of $2.5 million of accrued interest expense related to the statute expiration of a foreign tax reserve as well as higher levels of interest income.
Miscellaneous expense, net for the year ended September 29, 2017 was $6.6 million, an increase as compared to $3.1 million million for the corresponding period last year. This change was due primarily to a reversal in fiscal 2016 of $5.1 million of accrued penalties related to the statute expiration of a foreign tax reserve, which did not recur in fiscal 2017, offset in part by other miscellaneous charges.
Gain (loss) on disposal of business and investments was $10.9 million and $(41.4) million for the years ended September 29, 2017 and September 30, 2016, respectively. The reported amounts for fiscal 2017 were associated mainly with the Company’s divestiture of its equity investment in Neste Jacobs Oy, a joint venture between the Company and Neste Corporation. The $(41.4) million loss on disposal in fiscal 2016 was mainly attributable to the Company’s loss on the sale of our French subsidiary of $24.4 million, and a non-cash write-off on an equity investment of $17.0 million.
The Company’s consolidated effective income tax rate is generally lower than the U.S. statutory rate of 35% primarily due to the impacts of favorable tax rate differences in our foreign operations. The following table reconciles total income tax expense using the statutory U.S. federal income tax rate to the consolidated income tax expense shown in the accompanying Consolidated Statements of Earnings for the years ended September 29, 2017 and September 30, 2016 (dollars in thousands):
Page 42
For the Years Ended | |||||||||||||
September 29, 2017 | % | September 30, 2016 | % | ||||||||||
Statutory amount | $ | 137,626 | 35 | % | $ | 100,353 | 35.0 | % | |||||
State taxes, net of the federal benefit | 8,955 | 2.3 | % | 7,853 | 2.7 | % | |||||||
Exclusion of tax on non-controlling interests | 2,223 | 0.6 | % | (1,418 | ) | (0.5 | )% | ||||||
Foreign: | |||||||||||||
Difference in tax rates of foreign operations | (16,987 | ) | (4.3 | )% | (17,184 | ) | (6.0 | )% | |||||
Benefit from foreign valuation allowance release | (3,085 | ) | (0.8 | )% | (11,182 | ) | (3.9 | )% | |||||
U.K. tax rate change on deferred tax assets | — | — | % | 8,853 | 3.1 | % | |||||||
Nontaxable income from foreign affiliate | (3,280 | ) | (0.8 | )% | — | — | % | ||||||
U.S. tax cost of foreign operations | 18,612 | 4.7 | % | 30,850 | 10.9 | % | |||||||
Tax differential on foreign earnings | (4,740 | ) | (1.2 | )% | 11,337 | 4.1 | % | ||||||
Foreign tax credits | (20,454 | ) | (5.2 | )% | (44,018 | ) | (15.4 | )% | |||||
Uncertain tax positions | (5,779 | ) | (1.5 | )% | 1,449 | 0.5 | % | ||||||
Other items: | |||||||||||||
IRS §179D deduction | (3,351 | ) | (0.8 | )% | (2,153 | ) | (0.8 | )% | |||||
IRS §199D deduction | (2,113 | ) | (0.5 | )% | (2,800 | ) | (1.0 | )% | |||||
Foreign partnership loss | (9,861 | ) | (2.5 | )% | (2,658 | ) | (0.9 | )% | |||||
Other items - net | 3,336 | 0.7 | % | 4,263 | 1.5 | % | |||||||
Total other items | (11,989 | ) | (3.1 | )% | (3,348 | ) | (1.2 | )% | |||||
Taxes on income | $ | 105,842 | 26.9 | % | $ | 72,208 | 25.2 | % | |||||
The Company’s consolidated effective income tax rate for the year ended September 29, 2017 increased to 26.9% from 25.2% for fiscal 2016. Key drivers for this year over year increase include the impacts of lower foreign tax credit benefits and lower benefits from valuation allowance releases on foreign deferred tax assets, partly offset by favorable impacts of U.S. tax cost of foreign operations, the non-recurrence of 2016 tax rate change impacts on deferred income tax assets in the UK and favorable impacts from change in uncertain tax positions.
Page 43
Segment Financial Information
The following tables present total revenues and segment operating profit for each reportable segment (in thousands) and includes a reconciliation of segment operating profit to total U.S. GAAP operating profit by including certain corporate-level expenses and expenses relating to the Restructuring and other charges and transaction costs associated with the CH2M transaction and integration costs and the ECR sale (in thousands). Prior period information has been recast to reflect the current period presentation.
For the Years Ended | |||||||||||
September 28, 2018 | September 29, 2017 | September 30, 2016 | |||||||||
Revenues from External Customers: | |||||||||||
Aerospace, Technology, Environmental and Nuclear | $ | 4,372,008 | $ | 2,464,363 | $ | 2,845,913 | |||||
Buildings, Infrastructure and Advanced Facilities | 6,184,883 | 3,830,697 | 3,419,505 | ||||||||
Energy, Chemicals and Resources | 4,427,755 | 3,727,728 | 4,698,739 | ||||||||
Total | $ | 14,984,646 | $ | 10,022,788 | $ | 10,964,157 | |||||
For the Years Ended | |||||||||||
September 28, 2018 | September 29, 2017 | September 30, 2016 | |||||||||
Segment Operating Profit: | |||||||||||
Aerospace, Technology, Environmental and Nuclear (1) | $ | 311,871 | $ | 200,179 | $ | 215,119 | |||||
Buildings, Infrastructure and Advanced Facilities (2) | 482,277 | 263,679 | 217,412 | ||||||||
Energy, Chemicals and Resources | 218,109 | 161,312 | 153,797 | ||||||||
Total Segment Operating Profit | 1,012,257 | 625,170 | 586,328 | ||||||||
Other Corporate Expenses | (113,702 | ) | (81,595 | ) | (60,100 | ) | |||||
Restructuring and Other Charges | (170,148 | ) | (134,206 | ) | (187,630 | ) | |||||
Transaction Costs | (80,436 | ) | (17,100 | ) | — | ||||||
Total U.S. GAAP Operating Profit | 647,971 | 392,269 | 338,598 | ||||||||
Gain (Loss) on disposal of business and investments | (20,967 | ) | 10,880 | (41,410 | ) | ||||||
Total Other (Expense) Income, net (3) | (72,299 | ) | (9,932 | ) | (10,465 | ) | |||||
Earnings Before Taxes | $ | 554,705 | $ | 393,217 | $ | 286,723 | |||||
(1) | Includes $15.0 million in charges during the year ended September 28, 2018 associated with a legal matter. |
(2) | Excludes $23.8 in restructuring and other charges for the year ended September 29, 2017. See Note 8, Restructuring and Other Charges. |
(3) | Includes amortization of deferred financing fees related to the CH2M acquisition of $1.8 million for the year ended September 28, 2018. Also, includes $1.2 million and $277 thousand of restructuring and other charges for the years ended September 29, 2017 and September 30, 2016, respectively. |
In evaluating the Company’s performance by operating segment, the CODM reviews various metrics and statistical data for each LOB but focuses primarily on revenues and operating profit. As discussed above, segment operating profit includes not only local SG&A expenses but the SG&A expenses of the Company’s support groups that have been allocated to the segments. In addition, the Company attributes each LOB’s specific incentive compensation plan costs to the LOBs. The revenues of certain LOBs are more affected by pass-through revenues than other LOBs. The methods for recognizing revenue, incentive fees, project losses and change orders are consistent among the LOBs.
During the fourth fiscal quarter of 2017, the Company implemented certain restructuring activities (primarily severance related activities) associated with the Company’s acquisition of CH2M. Following the closing of the CH2M acquisition, these activities have continued into fiscal 2018 and include associated charges for professional services, personnel costs, severance and costs associated with co-locating Jacobs and CH2M offices, amounting to approximately $190.8 million in pre-tax charges during fiscal 2018. These activities are expected to continue through 2019. These activities are not expected to involve the exit of any service types or client end-markets.
Transaction costs associated with the CH2M acquisition in the accompanying consolidated statements of earnings for the years ended September 28, 2018 and September 29, 2017 are comprised of the following (in millions):
Page 44
For the Years Ended | |||||||
September 28, 2018 | September 29, 2017 | ||||||
Personnel costs | $ | 50.2 | $ | 2.2 | |||
Professional services and other expenses | 27.5 | 14.9 | |||||
Total | $ | 77.7 | $ | 17.1 | |||
Personnel costs above include change of control payments and related severance costs. In evaluating the Company’s performance by operating segment, the CODM reviews revenues and operating profit. As discussed above, segment operating profit includes not only local SG&A expenses but the SG&A expenses of the Company’s support groups that have been allocated to the segments. In addition, the Company attributes each LOB’s specific incentive compensation plan costs to the LOBs. The revenues of certain LOBs are more affected by pass-through revenues than other LOBs. The methods for recognizing revenue, incentive fees, project losses and change orders are consistent among the LOBs.
Aerospace, Technology, Environmental and Nuclear
For the Years Ended | |||||||||||
September 28, 2018 | September 29, 2017 | September 30, 2016 | |||||||||
Revenue | $ | 4,372,008 | $ | 2,464,363 | $ | 2,845,913 | |||||
Operating Profit | $ | 311,871 | $ | 200,179 | $ | 215,119 | |||||
Fiscal 2018 vs. 2017
Aerospace, Technology, Environmental and Nuclear segment revenues for the year ended September 28, 2018 were $4.37 billion, up $1.91 billion, or 77.4%, from $2.46 billion for the corresponding period last year. The increase in revenues were due in large part to nuclear and environmental revenue resulting from the CH2M acquisition. Also, our revenues were positively impacted by year over year revenue volume growth across our legacy portfolio, highlighted by increased spending by customers in the U.S. government business sector and our nuclear and defense unit in the U.K. Impacts on revenues from favorable foreign currency were approximately $23.8 million for fiscal year 2018.
Operating profit for the segment was $311.9 million for the year ended September 28, 2018, up $111.7 million, or 55.8%, from $200.2 million for the corresponding period last year. In addition to incremental operating profit benefits from the CH2M acquisition, the increase from the prior year was primarily attributable to continued growth in profits from our U.S. governmental business sector and improvements in our nuclear and defense unit in the U.K. and fee income with our U.K. joint venture. SG&A for the ATEN segment increased for fiscal 2018 attributable mainly to incremental SG&A associated with the CH2M acquisition during the fiscal 2018 and additional charges of $15.0 million associated with a legal matter incurred during fiscal 2018.
Fiscal 2017 vs. 2016
Aerospace, Technology, Environmental and Nuclear segment revenues for the year ended September 29, 2017 were $2.46 billion, down $381.6 million, or 13.4%, from $2.85 billion for the corresponding period in 2016. The decrease in revenues was mainly in our U.S. government business sector, where rebid losses and small business award preferences drove the declines. Unfavorable foreign currency impacts of approximately $13.0 million also contributed to this year over year decline. These unfavorable items were partially offset by positive gains from organic growth and improvement in our telecommunications sector, our NASA projects and our projects for the Ministry of Defense in Australia.
Operating profit for the ATEN segment was $200.2 million for the year ended September 29, 2017, down $14.9 million, or 6.9%, from $215.1 million for the year ended September 30, 2016. This decrease in profitability was due primarily to the revenue declines in the U.S. government business sector mentioned above, as well as lower equity income from our U.K. joint venture for the comparative periods mainly associated with year over year declines in project funding.
Buildings, Infrastructure and Advanced Facilities
Page 45
For the Years Ended | |||||||||||
September 28, 2018 | September 29, 2017 | September 30, 2016 | |||||||||
Revenue | $ | 6,184,883 | $ | 3,830,697 | $ | 3,419,505 | |||||
Operating Profit | $ | 482,277 | $ | 263,679 | $ | 217,412 | |||||
Fiscal 2018 vs. 2017
Revenues for the Buildings, Infrastructure and Advanced Facilities segment for the year ended September 28, 2018 were $6.18 billion, up $2.35 billion, or 61.5%, from $3.83 billion for the corresponding period last year. The increase in revenues was due in part to favorable impacts from the CH2M acquisition of approximately $2.22 billion together with revenue increases across all our businesses with strong investment in Life Sciences, Electronics, Water and Transport Infrastructure markets. Impacts on revenues from favorable foreign currency were approximately $59.6 million for fiscal 2018.
Operating profit for the segment for the year ended September 28, 2018 was $482.3 million, an increase of $218.6 million, or 82.9%, from $263.7 million for the comparative period in 2017. The increase in operating profit was in part due to favorable impacts from the CH2M acquisition, together with positive impacts from the higher year over year revenues for the segment. SG&A for the BIAF segment increased for fiscal 2018, with this increase being attributable mainly to incremental SG&A associated with the CH2M acquisition during fiscal 2018.
Fiscal 2017 vs. 2016
Revenues for the Buildings, Infrastructure and Advances Facilities segment for the year ended September 29, 2017 were $3.83 billion, an increase of $411.2 million, or 12.0%, versus $3.42 billion for the corresponding period in 2016. The year over year increases in revenues was due mainly to U.S. client spending level increases in the PMCM market and increased client major capex spending in the Life Sciences business. Year over year impacts on revenues from unfavorable foreign currency were approximately $36.0 million.
Operating profit for the segment for the year ended September 29, 2017 was $263.7 million, up $46.3 million, or 21.3%, compared to $217.4 million for 2016. Excluded from the presented operating profit amounts for the year ending September 29, 2017 were $23.8 million in Restructuring and other charges related to strategic business restructuring activities in our U.K, Middle East and Europe businesses. Increases in profitability for the period in 2017 over 2016 were due mainly to higher revenue from the U.S. PMCM projects and higher levels of professional service and project procurement business in the Life Sciences business, partially offset by charges from a contract settlement of $6.0 million.
Energy, Chemicals and Resources
For the Years Ended | |||||||||||
September 28, 2018 | September 29, 2017 | September 28, 2018 | |||||||||
Revenue | $ | 4,427,755 | $ | 3,727,728 | $ | 4,698,739 | |||||
Operating Profit | $ | 218,109 | $ | 161,312 | $ | 153,797 | |||||
Fiscal 2018 vs. 2017
Energy, Chemicals and Resources revenues for the year ended September 28, 2018 were $4.43 billion, an increase of $700.0 million, or 18.8%, from $3.73 billion for the corresponding period last year. The increase in revenues was due primarily to the ongoing execution of several large petrochemical projects with significant pass-through costs, growth in the construction operations and maintenance market as clients focus on capital efficiency, the continued recovery of mining and minerals market as clients begin the transition from feasibility studies into the investment phase of projects, and the increasing trend among oil producers to drive downstream investments to refining and chemicals. Also, the CH2M acquisition added approximately $284.4 million during fiscal year 2018. Additionally, foreign currency impacts were favorable by approximately $56.4 million for fiscal 2018 versus the corresponding periods of 2017.
Operating profit for the segment for the year ended September 28, 2018 was $218.1 million, an increase of $56.8 million or 35.2% from $161.3 million for the corresponding period last year. The increase in profitability was due to higher revenue and favorable mix across the portfolio. SG&A for the segment was up $77.0 million for fiscal 2018 versus the 2017 periods, due
Page 46
mainly to incremental operating general and administrative expense coming with the CH2M acquisition. Additionally, included in the prior fiscal year was a one-time $9.9 million benefit associated with benefit plan changes in our India operations.
Fiscal 2017 vs. 2016
Energy, Chemicals and Resources revenues for the year ended September 29, 2017 were $3.73 billion, a decrease of $971.0 million, or 20.7%, versus $4.70 billion for the corresponding period in 2016. The decrease in revenues was primarily due to the completion or wind-down of several projects with significant pass-through revenue as well as award delays of large post front-end engineering and design projects, as clients continue to evaluate their capital spending plans as oil prices remained low and weaker market conditions in the Mining and Minerals business. These factors resulted in lower field service revenues compared with the prior year periods, while client investment spending continues primarily on compliance, maintenance and sustaining capital programs. Additionally, foreign currency impacts were unfavorable of approximately $18.0 million on year over year revenue comparisons for fiscal 2017 versus fiscal 2016.
Operating profit for the segment for the year ended September 29, 2017 was $161.3 million, up $7.5 million, or 4.9%, compared to $153.8 million for 2016. Increases in profitability for the period in 2017 over 2016 were due mainly to improved project performance in the Minings & Minerals business and SG&A savings from restructuring efforts and a one-time $9.9 million benefit associated with benefit plan changes in our India operations offset by revenue declines from lower business volumes as mentioned above, offset by revenue declines from lower business volumes mentioned previously.
Other Corporate Expenses
Other corporate expense were $113.7 million, $81.6 million and $60.1 million for the years ended September 28, 2018, September 29, 2017 and September 30, 2016. These increases were due primarily to increased intangible asset amortization relating to the CH2M acquisition, higher professional service fees, personnel related costs, settlement charges associated with certain of the Company's pension plans and higher depreciation associated with increased corporate technology investments, partially offset by savings associated with the 2015 Restructuring program.
Included in other corporate expenses in the above table are costs and expenses which relate to general corporate activities as well as corporate-managed benefit and insurance programs. Such costs and expenses include: (i) those elements of SG&A expenses relating to the business as a whole; (ii) those elements of our incentive compensation plans relating to corporate personnel whose other compensation costs are not allocated to the LOBs; (iii) the amortization of intangible assets acquired as part of business combinations; (iv) the quarterly variances between the Company’s actual costs of certain of its self-insured integrated risk and employee benefit programs and amounts charged to the LOBs; and (v) certain adjustments relating to costs associated with the Company’s international defined benefit pension plans. In addition, other corporate expenses may also include from time to time certain adjustments to contract margins (both positive and negative) associated with projects where it has been determined, in the opinion of management, that such adjustments are not indicative of the performance of the related LOB.
Backlog Information
Backlog is not a defined measure and our methodology for determining backlog may vary from the methodology used by other companies. Currently, we report a combined backlog number based upon the legacy reporting methodologies used by Jacobs and the acquired business of CH2M prior to the acquisition while we work to harmonize these reporting methodologies as part of the Company's integration activities underway.
We include in backlog the total dollar amount of revenues we expect to record in the future as a result of performing work under contracts that have been awarded to us. Our policy with respect to O&M contracts, however, is to include in backlog the amount of revenues we expect to receive for one succeeding year, regardless of the remaining life of the contract. For national government programs (other than national government O&M contracts, which are subject to the same policy applicable to all other O&M contracts), our policy is to include in backlog the full contract award, whether funded or unfunded, excluding option periods. Because of variations in the nature, size, expected duration, funding commitments and the scope of services required by our contracts, the timing of when backlog will be recognized as revenues can vary greatly between individual contracts.
Consistent with industry practice, substantially all of our contracts are subject to cancellation or termination at the option of the client, including our U.S. government work. While management uses all information available to it to determine backlog, at any given time our backlog is subject to changes in the scope of services to be provided as well as increases or decreases in costs relating to the contracts included therein. Backlog is not necessarily an indicator of future revenues.
Page 47
Because certain contracts (e.g., contracts relating to large EPC projects as well as national government programs) can cause large increases to backlog in the fiscal period in which we recognize the award, and because many of our contracts require us to provide services that span over a number of fiscal quarters (and sometimes over fiscal years), we evaluate our backlog on a year-over-year basis, rather than on a sequential, quarter-over-quarter basis.
Please refer to Item 1A- Risk Factors , above, for a discussion of other factors that may cause backlog to ultimately convert into revenues at different amounts.
The following table summarizes our backlog for the years ended September 28, 2018, September 29, 2017 and September 30, 2016 (in millions):
September 28, 2018 | September 29, 2017 | September 30, 2016 | |||||||||
Aerospace, Technology, Environmental and Nuclear | $ | 8,857 | $ | 6,358 | $ | 4,472 | |||||
Buildings, Infrastructure and Advanced Facilities | 11,376 | 6,789 | 7,063 | ||||||||
Energy, Chemicals and Resources | 7,066 | 6,642 | 7,226 | ||||||||
Total | $ | 27,299 | $ | 19,789 | $ | 18,761 | |||||
The increase in backlog in Aerospace, Technology, Environmental and Nuclear for the years presented were primarily the result of new awards from the U.S. federal government and the CH2M acquisition in fiscal year 2018.
The increase in backlog in Buildings, Infrastructure and Advanced Facilities for the years presented were primarily the result of new awards in Australia and the U.S. markets and the CH2M acquisition in fiscal year 2018.
The increase in backlog in Energy, Chemicals and Resources from fiscal year 2017 to 2018 was due to the CH2M acquisition offset in part by work off of projects in the Americas with significant pass-through cost. The decrease seen in from fiscal year 2017 to 2016 was primarily due to the weakness in the upstream market, partly offset by strong performance in chemicals backlog.
Backlog relating to work to be performed either directly or indirectly for the U.S. federal government and its agencies totaled approximately $6.8 billion (or 24.9% of total backlog), $4.6 billion (or 23.2% of total backlog) and $4.8 billion (or 25.4% of total backlog) at September 28, 2018, September 29, 2017 and September 30, 2016, respectively. Most of our federal government contracts require that services be provided beyond one year. In general, these contracts must be funded annually (i.e., the amounts to be spent under the contract must be appropriated by the U.S. Congress to the procuring agency, and then the agency must allot these sums to the specific contracts).
We estimate that approximately $9.9 billion, or 36%, of total backlog at September 28, 2018 will be realized as revenues within the next fiscal year.
Liquidity and Capital Resources
At September 28, 2018, our principal sources of liquidity consisted of $793.4 million in cash and cash equivalents, $1,448.4 million of available borrowing capacity under our $1.6 billion 2014 revolving credit facility (the “Revolving Credit Facility”) and cash flows from operating activities. Additional information regarding the Revolving Credit Facility and the Term Loan Facility is set forth in Note 9 - Borrowings in Notes to Consolidated Financial Statements beginning on page F-1 of this Annual Report on Form 10-K. We finance much of our operations and growth through cash generated by our operations.
On December 15, 2017, the Company completed the acquisition of CH2M HILL Companies, Ltd. (CH2M), an international provider of engineering, construction, and technical services, by acquiring 100% of the outstanding shares of CH2M common stock and preferred stock. The Company paid total consideration of approximately $1.8 billion in cash (excluding $315.2 million in cash acquired) and issued approximately $1.4 billion of Jacobs’ common stock to the former stockholders and certain equity award holders of CH2M. In connection with the acquisition, the Company also assumed CH2M’s revolving credit facility and second lien notes, including a $20.0 million prepayment penalty, which totaled approximately $700.0 million. Immediately following the effective time of the acquisition, the Company repaid CH2M’s revolving credit facility and second lien notes including the related prepayment penalty. The Company financed the cash consideration for the CH2M acquisition, the repayment of CH2M’s outstanding indebtedness and other transaction expenses with a combination of cash on hand and debt financing, which included borrowings under the Term Loan Facility in an aggregate principal amount of $1.5 billion and additional borrowings under the Revolving Credit Facility.
Page 48
At September 28, 2018, our cash and cash equivalents were $793.4 million, an increase of $19.1 million from $774.2 million at September 29, 2017.
This increase was due to cash flows provided by operations of $481.2 million and favorable cash flows from financing activities of $1.1 billion, partly offset by $1.6 billion in cash flows used in investing activities and exchange rate effects on cash of $(26.8) million.
Our cash flow from operations of $481.2 million during fiscal 2018 was comparatively lower than the $574.9 million in cash flow from operations for the corresponding period in fiscal 2017, due mainly to higher levels of working capital (mainly in accounts receivable), lower net earnings attributable to the group, cash used for payments on the opening balance sheet liabilities and post acquisition costs incurred in connection with the CH2M acquisition and payments associated with obligations from Restructuring and other charges.
With respect to the Company’s working capital accounts, the Company’s cash flows from operations are greatly affected by the cost-plus nature of our customer contracts. Because such a high percentage of our revenues are earned on cost-plus type contracts, and due to the significance of revenues relating to pass-through costs, most of the costs we incur are included in invoices we send to clients. Although we continually monitor our accounts receivable, we manage the operating cash flows of the Company by managing the working capital accounts in total, rather than by the individual elements. The primary elements of the Company’s working capital accounts are accounts receivable, accounts payable and billings in excess of cost. Accounts payable consist of obligations to third parties relating primarily to costs incurred for projects which are generally billable to clients. Accounts receivable consist of amounts due from our clients of which a substantial portion are for project-related costs. Billings in excess of cost consist of billings to and payments from our clients for costs yet to be incurred.
This relationship between revenues and costs, and between receivables and payables, is unique to our industry, and facilitates review of our liquidity at the total working capital level.
Our cash used in investing activities for fiscal 2018 of $1.6 billion was comparatively higher than the $236.2 million cash used in investing activities for the corresponding period in fiscal 2017 which was primarily driven by cash used for the CH2M acquisition, net of cash amounts acquired from the acquisition of $315.2 million. Additions to property and equipment were slightly down from the comparative period.
Our cash from financing activities of $1.1 billion for fiscal 2018 resulted mainly from proceeds from borrowings of $5.8 billion, most of which was used in connection with financing of the CH2M acquisition. Repayments of long-term debt of $4.6 billion during first half of fiscal 2018 were up compared to $1.8 billion in fiscal 2017, with this increase due mainly to the payoff of CH2M’s legacy debt balances in connection with the closing of the acquisition. Comparatively lower cash flows from proceeds from issuances of common stock during fiscal 2018 were offset by lower cash outflows for common stock repurchases. The Company paid $86.6 million in dividends, including to noncontrolling interests of $4.6 million, during the year, with $58.8 million in dividends paid in the comparative prior year period.
At September 28, 2018, the Company had approximately $342.9 million in cash and cash equivalents held in the U.S. and $450.5 million held outside of the U.S. (primarily in the U.K., the Eurozone, Chile and India), which is used primarily for funding operations in those regions. Other than the tax cost of repatriating funds to the U.S. (see Note 13- Income Taxes of Notes to Consolidated Financial Statements beginning on page F-1 of this Annual Report on Form 10-K), there are no material impediments to repatriating these funds to the U.S.
The Company had $446.6 million in letters of credit outstanding at September 28, 2018. Of this amount, $2.5 million was issued under the Revolving Credit Facility and $444.1 million was issued under separate, committed and uncommitted letter-of-credit facilities.
On October 21, 2018, Jacobs and WorleyParsons Limited, a company incorporated in Australia (“Buyer”), entered into a Stock and Asset Purchase Agreement pursuant to which Buyer agreed to acquire the Company’s ECR business for a purchase price of $3.3 billion consisting of (i) $2.6 billion in cash plus (ii) ordinary shares of the Buyer equal to $700 million, subject to adjustments for changes in working capital and certain other items (the “Transaction”). The Transaction, which has been approved by the boards of directors of the Company and Buyer, is expected to close in the first half of calendar year 2019.
We believe we have adequate liquidity and capital resources to fund our operations and support our debt service, and also to make discretionary payments such as the payment of dividends and buyback of shares and to support our ongoing acquisition strategy for the next twelve months based on the liquidity provided by our cash and cash equivalents on hand, our borrowing capacity
Page 49
remaining under the Revolving Credit Facility and our continuing cash from operations. We were in compliance with all of our debt covenants at September 28, 2018.
Contractual Obligations
The following table sets forth certain information about our contractual obligations as of September 28, 2018 (in thousands):
Payments Due by Fiscal Period | |||||||||||||||||||
Total | 1 Year or Less | 1 - 3 Years | 3 - 5 Years | More than 5 Years | |||||||||||||||
Debt obligations | $ | 2,151,877 | $ | 941 | $ | 1,650,936 | $ | — | $ | 500,000 | |||||||||
Operating leases (1) | 1,219,521 | 215,375 | 346,009 | 251,605 | 406,532 | ||||||||||||||
Obligations under defined benefit pension plans (2) | 359,074 | 34,150 | 71,404 | 75,753 | 177,767 | ||||||||||||||
Obligations under nonqualified deferred compensation plans (3) | 258,901 | 38,015 | 80,697 | 84,778 | 55,410 | ||||||||||||||
Purchase obligations (4) | 2,693,034 | 2,596,228 | 96,806 | — | — | ||||||||||||||
Interest (5) | 176,080 | 61,302 | 85,158 | 29,620 | — | ||||||||||||||
Total | $ | 6,858,487 | $ | 2,946,011 | $ | 2,331,010 | $ | 441,756 | $ | 1,139,709 | |||||||||
(1) | Assumes the Company will make the end of lease term residual value guarantee payment of $62.4 million in 2025 with respect to the lease of an office building in Houston, Texas. Please refer to Note 14- Commitments and Contingencies and Derivative Financial Instruments of Notes to Consolidated Financial Statements beginning on page F-1 of this Annual Report on Form 10-K. |
(2) | Assumes that future contributions will be consistent with amounts projected to be contributed in fiscal 2018, allowing for certain growth based on rates of inflation and salary increases, but limited to the amount recorded as of September 28, 2018. Actual contributions will depend on a variety of factors, including amounts required by local laws and regulations, and other funding requirements. |
(3) | Assumes that future payments will be consistent with amounts paid in fiscal 2018. Due to the non-qualified nature of the plans, and the fact that benefits are based in part on years of service, the payments included in the schedule were limited to the amount recorded as of September 28, 2018. |
(4) | Represents those liabilities estimated to be under firm contractual commitments as of September 28, 2018; primarily accounts payable, accrued payroll and accrued dividends. |
(5) | Determined based on borrowings outstanding at the end of fiscal 2018 using the interest rates in effect at that time and, for our outstanding long-term debt, concluding with the expiration date of the debt facilities, as defined below. |
Effects of Inflation and Changing Prices
The effects of inflation and changing prices on our business is discussed in Item 1A- Risk Factors , and is incorporated herein by reference.
Off-Balance Sheet Arrangements
We are party to financial instruments with off-balance sheet risk in the form of guarantees not reflected in our balance sheet that arise in the normal course of business. However, such off-balance sheet arrangements are not reasonably likely to have an effect on our financial condition, revenues or expenses, results of operations, liquidity, capital expenditures or resources that are material to investors. See Note 14 - Commitments and Contingencies and Derivative Financial Instruments of Notes to Consolidated Financial Statements beginning on page F-1 of this Annual Report on Form 10-K.
New Accounting Pronouncements
From time to time, the Financial Accounting Standards Board (“FASB”) issues accounting standards updates (each an “ASU”) to its Accounting Standards Codification (“ASC”), which constitutes the primary source of U.S. GAAP. The Company regularly monitors ASUs as they are issued and considers their applicability to its business. All ASUs applicable to the Company are adopted by the due date and in the manner prescribed by the FASB.
Revenue Recognition
In May 2014, the FASB issued ASU No. 2014-09 Revenue from Contracts with Customers. The new guidance provided by ASU 2014-09 is intended to remove inconsistencies and perceived weaknesses in the existing revenue requirements, provide a more robust framework for addressing revenue issues, improve comparability, provide more useful information and simplify the preparation
Page 50
of financial statements. The effective date for ASU 2014-09 is for annual reporting periods beginning after December 15, 2017 and interim periods therein.
The Company’s adoption activities have been performed over three phases: (i) assessment, (ii) design and (iii) implementation. As part of these phases, the Company has identified the following potentially significant differences to date:
Performance Obligations
Under current U.S. GAAP, the Company typically segments contracts that contain multiple services by service type - for instance, engineering, procurement and construction services - for purposes of revenue recognition. Under ASU 2014-09, multiple-service contracts where the Company is responsible for providing a single deliverable (e.g., a constructed asset) will be treated as a single performance obligation for purposes of revenue recognition and thus no longer will be segmented. Typically, this will occur when the company is contracted to perform both engineering and construction on a project. In these circumstances, the timing and pattern of revenue recognition will change. The remainder of the Company's contracts will continue to be treated as having discrete units of account because they either contain only one service or because the Company has determined that the component services in the contract are distinct.
Contract Modifications
In many instances, the Company enters into separate contracts for related services (e.g., engineering and construction) but is held responsible for providing a single deliverable (“Phased Projects”). Under ASU 2014-09, the separate contracts may be required to be combined and treated as a single contract with one performance obligation. This modification or combination of contracts may result in a cumulative catchup adjustment, which will have an immediate impact on the Company’s results of operations in the period the contract combination or modification occurs. In addition, it will change the timing and pattern of revenue recognition after the period the contracts have been combined or modified.
Based on the two noted changes above, the Company has identified selected changes to our systems, processes and internal controls and designed updates for each to meet the standard's revised reporting and disclosure requirements. The Company has also assessed the impact of ASU 2014-09 to the recently acquired CH2M business. We will align CH2M's accounting policies, processes and controls with the policies, processes and controls being implemented across the Company.
The Company will adopt the new standard using the Modified Retrospective application for periods beginning with the first fiscal quarter of 2019. This standard will impact the Company’s Consolidated Financial Statements and will its administrative operations. The impact will depend on the magnitude of the items discussed above. While the Company will continue to evaluate the impact through the implementation phase, we expect a reduction of retained earnings in our consolidated financial statements in the period of adoption due to revenue recognition timing for certain engineering and construction contracts shifting as a result of being accounted for as a single performance obligation. This adjustment will create a corresponding adjustment in the Company's consolidated financial statements to accounts receivable and unbilled receivables and to billings in excess of costs.
Lease Accounting
In February 2016, the FASB issued ASU 2016-02 Leases. ASU 2016-02 requires lessees to recognize assets and liabilities for most leases. ASU 2016-02 is effective for public entity financial statements for annual periods beginning after December 15, 2018, and interim periods within those annual periods. Early adoption is permitted, including adoption in an interim period. The new guidance currently requires a modified retrospective transition approach for leases that exist or are entered into after the beginning of the earliest comparative period in the financial statements. ASU 2016-02 was further clarified and amended within ASU 2017-13, ASU 2018-01, ASU 2018-10 and ASU 2018-11 which included provisions that would provide us with the option to adopt the provisions of the new guidance using a modified retrospective transition approach, without adjusting the comparative periods presented. The Company is evaluating the impact of the new guidance on its consolidated financial statements. This standard could have a significant administrative impact on its operations, and the Company will further assess the impact through its implementation program.
Other Pronouncements
In August 2017, the FASB issued ASU No. 2017-12, Derivatives and Hedging (Topic 815): Targeted Improvements to Accounting for Hedging Activities. ASU 2017-12 provides financial reporting improvements related to hedging relationships to better portray the economic results of an entity’s risk management activities in its financial statements. Additionally, ASU No. 2017-12 makes certain targeted improvements to simplify the application of the hedge accounting guidance. The revised guidance becomes effective for fiscal years beginning after December 15, 2018 with early adoption permitted. The Company is evaluating the impact of
Page 51
the new guidance on its consolidated financial statements. It is not expected that the updated guidance will have a significant impact on the Company’s consolidated financial statements.
ASU 2017-04, Simplifying the Test for Goodwill Impairment, is effective for fiscal years beginning after December 15, 2019 with early adoption permitted. ASU 2017-04 removes the second step of the goodwill impairment test, which requires a hypothetical purchase price allocation. An entity will now recognize a goodwill impairment charge for the amount by which a reporting unit's carrying value exceeds its fair value, not to exceed the amount of goodwill allocated to the reporting unit. Management does not expect the adoption of ASU 2017-04 to have any impact on the Company's financial position, results of operations or cash flows.
In March 2017, the FASB issued ASU No. 2017-07, Compensation- Retirement Benefits (Topic 715): Improving the Presentation of Net Periodic Pension Cost and Net Periodic Postretirement Benefit Cost. This new standard intends to improve the presentation of net periodic pension cost and net periodic postretirement benefit cost. The new standard requires the service cost component of net periodic cost be reported in the same line item(s) as other employee compensation costs and all other components of the net periodic cost be reported in the consolidated statements of earnings and comprehensive income below operating income. ASU 2017-07 is effective for fiscal years beginning after December 15, 2017 for public companies and early adoption is permitted. Management is currently evaluating the impact that the adoption of ASU 2017-07 will have on the Company's financial position, results of operations and cash flows.
Item 7A. | QUANTITATIVE AND QUALITATIVE DISCLOSURES ABOUT MARKET RISK |
We do not enter into derivative financial instruments for trading, speculation or other purposes that would expose the Company to market risk. In the normal course of business, our results of operations are exposed to risks associated with fluctuations in interest rates and currency exchange rates.
Interest Rate Risk
Please see the Note 9- Borrowings in Notes to Consolidated Financial Statements beginning on Page F-1 of this Annual report on Form 10-K, which is incorporated herein by reference, for a discussion of the Revolving Credit Facility, Term Loan Facility and Note Purchase Agreement.
Our Term Loan Facility, Revolving Credit Facility, and certain other debt obligations are subject to variable rate interest which could be adversely affected by an increase in interest rates. As of September 28, 2018, we had an aggregate of $1.65 billion in outstanding borrowings under our Term Loan Facility and our Revolving Credit Facility. Interest on amounts borrowed under these agreements is subject to adjustment based on the Company’s Consolidated Leverage Ratio (as defined in the credit agreements governing the Term Loan Facility and Revolving Credit Facility). Depending on the Company’s Consolidated Leverage Ratio, borrowings under the Term Loan Facility and Revolving Credit Facility bear interest at a Eurocurrency rate plus a margin of between 1.0% and 1.5% or a base rate plus a margin of between 0% and 0.5%. Additionally, if our consolidated leverage ratio exceeds a certain amount, the interest on the Senior Notes may increase by 75 basis points.
For the year ended September 28, 2018, our weighted average floating rate borrowings were approximately $2.0 billion. If floating interest rates had increased by 1.00%, our interest expense for the year ended September 28, 2018 would have increased by approximately $20.4 million.
Foreign Currency Risk
In situations where our operations incur contract costs in currencies other than their functional currency, we attempt to have a portion of the related contract revenues denominated in the same currencies as the costs. In those situations, where revenues and costs are transacted in different currencies, we sometimes enter into foreign exchange contracts in order to limit our exposure to fluctuating foreign currencies. We follow the provisions of ASC No. 815, Derivatives and Hedging in accounting for our derivative contracts. The Company does not currently have exchange rate sensitive instruments that would have a material effect on our consolidated financial statements or results of operations.
Item 8. | FINANCIAL STATEMENTS AND SUPPLEMENTARY DATA |
The information required by this Item 8 is submitted as a separate section beginning on page F-1 of this Annual Report on Form 10-K and is incorporated herein by reference.
Page 52
Item 9. | CHANGES IN AND DISAGREEMENTS WITH ACCOUNTANTS ON ACCOUNTING AND FINANCIAL DISCLOSURE |
None.
Item 9A. | CONTROLS AND PROCEDURES |
Evaluation of Disclosure Controls and Procedures
The Company’s management, with the participation of its Chief Executive Officer and Chief Financial Officer, evaluated the effectiveness of the Company’s disclosure controls and procedures as defined by Rule 13a-15(e) of the Securities Exchange Act of 1934, as amended (the “Exchange Act”) as of September 28, 2018, the end of the period covered by this Annual Report on Form 10-K (the “Evaluation Date”). Based on that evaluation, and as a result of the material weakness in our internal control over financial reporting described below under Management's Annual Report on Internal Control Over Financial Reporting, the Chief Executive Officer and Chief Financial Officer have concluded that the Company’s disclosure controls and procedures (as defined in Rule 13a-15(e) under the Exchange Act) were not functioning effectively as of the Evaluation Date to provide reasonable assurance that the information required to be disclosed by the Company in reports filed or submitted under the Exchange Act is recorded, processed, summarized and reported within the time periods specified in the SEC’s rules and forms and that such information is accumulated and communicated to the Company’s management, including the Chief Executive Officer and Chief Financial Officer, as appropriate to allow timely decisions regarding required disclosure.
As permitted by SEC guidance for newly acquired businesses, management’s assessment of the Company’s disclosure controls and procedures did not include an assessment of those disclosure controls and procedures of CH2M HILL Companies, Ltd. (CH2M) that are subsumed by internal control over financial reporting. CH2M accounted for approximately 42% of total assets as of September 28, 2018, and 25% of revenues and 30% of operating profit for the fiscal year ended on September 28, 2018.
Management’s Annual Report on Internal Control Over Financial Reporting
Management is responsible for establishing and maintaining for the Company adequate internal control over financial reporting, as defined in Rule 13a-15(f) under the Exchange Act. Management, with the participation of its Chief Executive Officer and Chief Financial Officer, has assessed the effectiveness of the Company’s internal control over financial reporting as of the Evaluation Date based on the framework established in “Internal Control—Integrated Framework,” issued by the Committee of Sponsoring Organizations of the Treadway Commission (2013 framework). Based on this assessment and the material weakness identified below, management has concluded that the Company’s internal control over financial reporting as of the Evaluation Date was ineffective. As permitted by SEC guidance for newly acquired businesses, management’s assessment of the Company’s internal control over financial reporting did not include an assessment of internal control over financial reporting of CH2M. CH2M accounted for approximately 42% of total assets as of September 28, 2018, and 25% of revenues and 30% of operating profit for the fiscal year ended on September 28, 2018.
Management has identified the following material weakness as of September 28, 2018: A material weakness related to internal control deficiencies over the accounting for income taxes in connection with a business combination, specifically related to the ineffective design and operating effectiveness of controls over the completeness and accuracy of deferred taxes and the evaluation of the recoverability of deferred taxes associated with the CH2M acquisition.
The material weakness did not result in any material misstatements to the Company’s previously issued financial statements, nor in the financial statements included in this Form 10-K.
The Company's independent registered public accounting firm, Ernst & Young LLP, that audited the Company's consolidated financial statements included in this Annual Report on Form 10-K, also audited the effectiveness of our internal control over financial reporting as of September 28, 2018, as stated in their report included in this Annual Report on Form 10-K.
Remediation Plan
The Company's management is committed to maintaining a strong internal control environment. In response to the identified material weakness, management, with the oversight of the Audit Committee of the Board of Directors, will take comprehensive actions to remediate the material weakness in internal control over financial reporting, including implementing additional specific enhanced control procedures for the review, analysis and reporting of its deferred income tax accounts, including control procedures relating to the recoverability of deferred taxes associated with acquired businesses in a business combination. The Company has commenced its remediation plan, with the goal of remediating this material weakness as soon as possible, subject to the conclusion by management that the enhanced internal control over financial reporting is operating effectively following appropriate testing. The
Page 53
remediation efforts are intended both to address the identified material weakness and to enhance our overall financial control environment. As management continues to evaluate and work to improve the Company's disclosure controls and procedures and internal control over financial reporting, the Company may take additional measures to address these deficiencies or modify certain of the remediation measures described above.
Changes in Internal Control
Subject to the above, there were no changes in the Company’s internal control over financial reporting during the Company’s fiscal quarter ended September 28, 2018 that have materially affected, or are reasonably likely to materially affect, the Company’s internal control over financial reporting.
Limitations on Effectiveness of Controls
The Company’s management, including its Chief Executive Officer and Chief Financial Officer, does not expect that its disclosure controls and procedures or its system of internal control over financial reporting will prevent or detect all errors and all fraud. A control system, no matter how well designed or operated, can provide only reasonable, but not absolute, assurance that the objectives of the system of internal control are met. The design of the Company’s control system reflects the fact that there are resource constraints, and that the benefits of such control systems must be considered relative to their costs. Further, because of the inherent limitations in all control systems, no evaluation of controls can provide absolute assurance that all control failures and instances of fraud, if any, within the Company have been detected. These inherent limitations include the realities that judgments in decision-making can be faulty and that breakdowns can occur because of simple error or mistake. Additionally, controls can be circumvented by the intentional acts of individuals, by collusion of two or more people, or by management override of the controls. The design of any system of controls is also based in part on certain assumptions about the likelihood of future events, and there can be no assurance that the design of any particular control will always succeed in achieving its objective under all potential future conditions.
Item 9B. | OTHER INFORMATION |
None.
Page 54
PART III
Item 10. | DIRECTORS, EXECUTIVE OFFICERS AND CORPORATE GOVERNANCE |
Directors, Executive Officers, Promoters and Control Persons
The information required by Paragraph (a), and Paragraphs (c) through (g) of Item 401 of Regulation S-K (except for information required by Paragraph (e) of that Item to the extent the required information pertains to our executive officers) and Item 405 of Regulation S-K is set forth under the captions “Members of the Board of Directors,” “Corporate Governance” and “Section 16(a) Beneficial Ownership Reporting Compliance” in our definitive proxy statement to be filed with the SEC pursuant to Regulation 14A within 120 days after the close of our fiscal year and is incorporated herein by reference. The information required by Paragraph (b) of Item 401 of Regulation S-K, as well as the information required by Paragraph (e) of that Item to the extent the required information pertains to our executive officers, is set forth in Part I, Item 1 of this Annual Report on Form 10-K under the heading “Executive Officers of the Registrant.”
Code of Ethics
We have adopted a code of ethics for our Chief Executive Officer and senior financial officers; a code of business conduct and ethics for members of our Board of Directors and corporate governance guidelines. The full text of these codes of ethics and corporate governance guidelines are available at our website at www.jacobs.com. In the event we make any amendment to, or grant any waiver from, a provision of the code of ethics that applies to the principal executive officer, principal financial officer or principal accounting officer that requires disclosure under applicable SEC rules, we will disclose such amendment or waiver and the reasons therefor on our website. We will provide any person without charge a copy of any of the aforementioned codes of ethics upon receipt of a written request. Requests should be addressed to: Jacobs Engineering Group Inc., 1999 Bryan Street, Suite 1200, Dallas, Texas 75201, Attention: Corporate Secretary.
Corporate Governance
The information required by Items 407(d)(4) and (d)(5) of Regulation S-K is set forth under the caption “Corporate Governance” in our definitive proxy statement to be filed with the SEC pursuant to Regulation 14A within 120 days after the close of our fiscal year and is incorporated herein by reference.
Item 11. | EXECUTIVE COMPENSATION |
The information required by this Item is set forth under the captions “Corporate Governance,” “Compensation Committee Report,” “Compensation Discussion and Analysis” and “Executive Compensation” in our definitive proxy statement to be filed with the SEC pursuant to Regulation 14A within 120 days after the close of our fiscal year and is incorporated herein by reference.
Item 12. | SECURITY OWNERSHIP OF CERTAIN BENEFICIAL OWNERS AND MANAGEMENT AND RELATED STOCKHOLDER MATTERS |
Securities Authorized for Issuance Under Equity Compensation Plans
The following table presents certain information about our equity compensation plans as of September 28, 2018:
Page 55
Column A | Column B | Column C | |||||||
Plan Category | Number of securities to be issued upon exercise of outstanding options, warrants, and rights | Weighted- average exercise price of outstanding options, warrants, and rights | Number of securities remaining available for future issuance under equity compensation plans (excluding securities reflected in Column A) | ||||||
Equity compensation plans approved by shareholders (a) | 1,766,759 | $ | 45.53 | 5,631,371 | |||||
Equity compensation plans not approved by shareholders | — | — | — | ||||||
Total | 1,766,759 | 45.53 | 5,631,371 | ||||||
(a) | The number in Column A excludes purchase rights accruing under our two, broad-based, shareholder-approved employee stock purchase plans: The Jacobs Engineering Group Inc. 1989 Employee Stock Purchase Plan, as amended and restated (the “1989 ESPP”), and the Global Employee Stock Purchase Plan, as amended and restated (the “GESPP”). These plans give employees the right to purchase shares at an amount and price that are not determinable until the end of the specified purchase periods, which occur monthly. Our shareholders have authorized a total of 32.3 million shares of common stock to be issued through the 1989 ESPP and the GESPP. From the inception of the 1989 ESPP and the GESPP through September 28, 2018, a total of 28.0 million shares have been issued, leaving 4.3 million shares of common stock available for future issuance at that date. |
The information required by Item 403 of Regulation S-K is set forth under the caption “Security Ownership” in our definitive proxy statement to be filed with the SEC pursuant to Regulation 14A within 120 days after the close of our fiscal year and is incorporated herein by reference.
Item 13. | CERTAIN RELATIONSHIPS AND RELATED TRANSACTIONS AND DIRECTOR INDEPENDENCE |
The information required by this Item is set forth under the captions “Members of The Board of Directors,” “Corporate Governance,” and “Certain Relationships and Related Transactions” in our definitive proxy statement to be filed with the SEC pursuant to Regulation 14A within 120 days after the close of our fiscal year and is incorporated herein by reference.
Item 14. | PRINCIPAL ACCOUNTING FEES AND SERVICES |
The information required by this Item is set forth under the captions “Report of the Audit Committee” and “Audit and Non-Audit Fees” in our definitive proxy statement to be filed with the SEC pursuant to Regulation 14A within 120 days after the close of our fiscal year and is incorporated herein by reference.
Page 56
PART IV
EXHIBITS AND FINANCIAL STATEMENTS
Item 15. | EXHIBITS AND FINANCIAL STATEMENT SCHEDULES |
(a) Documents filed as part of this report:
(1) | The Company’s Consolidated Financial Statements at September 28, 2018 and September 29, 2017 and for each of the three years in the period ended September 28, 2018, and the notes thereto, together with the report of the independent auditors on those Consolidated Financial Statements are hereby filed as part of this report, beginning on page F-1. |
(2) | Financial statement schedules – no financial statement schedules are presented as the required information is either not applicable, or is included in the consolidated financial statements or notes thereto. |
(3) | See Exhibit Index below. |
(b) Exhibit Index:
2.1 | |||
2.2 | |||
2.3 | |||
3.1 | |||
3.2 | |||
4.1 | |||
4.2 | |||
4.3 | |||
10.1 | |||
10.2 | |||
Page 57
10.3 | |||
10.4 | |||
10.5 | |||
10.6 | |||
10.7 | |||
10.8 | |||
10.9# | |||
10.10# | |||
10.11# | |||
10.12# | |||
10.13# | |||
10.14# | |||
10.15# | |||
10.16# | |||
10.17†# | |||
Page 58
10.18# | |||
10.19# | |||
10.20# | |||
10.21# | |||
10.22# | |||
10.23# | |||
10.24# | |||
10.25# | |||
10.26# | |||
10.27# | |||
10.28# | |||
10.29# | |||
10.30# | |||
10.31# | |||
10.32# | |||
10.33# | |||
10.34# | |||
Page 59
10.35# | |||
10.36# | |||
10.37# | |||
10.38# | |||
10.39# | |||
10.40# | |||
10.41# | |||
10.42# | |||
10.43# | |||
10.44# | |||
10.45# | |||
10.46# | |||
10.47# | |||
10.48# | |||
10.49# | |||
Page 60
10.50# | |||
10.51# | |||
10.52# | |||
10.53# | |||
10.54# | |||
10.55# | |||
10.56# | |||
10.57# | |||
10.58# | |||
10.59# | |||
10.60# | |||
10.61# | |||
10.62# | |||
10.63# | |||
Page 61
10.64# | |||
10.65# | |||
21† | |||
23† | |||
31.1† | |||
31.2† | |||
32.1† | |||
32.2† | |||
95† | |||
101.INS† | XBRL Instance Document | ||
101.SCH† | XBRL Taxonomy Extension Schema Document | ||
101.CAL† | XBRL Taxonomy Extension Calculation Linkbase Document | ||
101.DEF† | XBRL Taxonomy Extension Definition Linkbase Document | ||
101.LAB† | XBRL Taxonomy Extension Label Linkbase Document | ||
101.PRE† | XBRL Taxonomy Extension Presentation Linkbase Document | ||
† | Being filed herewith. |
# | Management contract or compensatory plan or arrangement. |
SIGNATURES
Pursuant to the requirements of Section 13 or 15(d) of the Securities Exchange Act of 1934, the Registrant has duly caused this report to be signed on its behalf by the undersigned, thereunto duly authorized.
JACOBS ENGINEERING GROUP INC. | ||||||
Dated: | November 21, 2018 | By: | /S/ Steven J. Demetriou | |||
Steven J. Demetriou | ||||||
Chief Executive Officer and Chairman (Principal Executive Officer) | ||||||
Pursuant to the requirements of the Securities Exchange Act of 1934, this report has been signed below by the following persons on behalf of the Registrant and in the capacities and on the dates indicated:
Page 62
Signature | Title | Date | ||
/S/ Steven J. Demetriou | Chairman of the Board and Chief Executive Officer (Principal Executive Officer) | November 21, 2018 | ||
Steven J. Demetriou | ||||
/S/ Joseph R. Bronson | Director | November 21, 2018 | ||
Joseph R. Bronson | ||||
/S/ Juan Jose Suarez Coppel | Director | November 21, 2018 | ||
Juan Jose Suarez Coppel | ||||
/S/ Robert C. Davidson, Jr. | Director | November 21, 2018 | ||
Robert C. Davidson, Jr. | ||||
/S/ Ralph E. Eberhart | Director | November 21, 2018 | ||
Ralph E. Eberhart | ||||
/S/ Dawne S. Hickton | Director | November 21, 2018 | ||
Dawne S. Hickton | ||||
/S/ Linda Fayne Levinson | Director | November 21, 2018 | ||
Linda Fayne Levinson | ||||
/S/ Robert A. McNamara | Director | November 21, 2018 | ||
Robert A. McNamara | ||||
/S/ Peter J. Robertson | Director | November 21, 2018 | ||
Peter J. Robertson | ||||
/S/ Christopher M.T. Thompson | Director | November 21, 2018 | ||
Christopher M.T. Thompson | ||||
/S/ Barry Williams | Director | November 21, 2018 | ||
Barry Williams | ||||
/S/ Kevin C. Berryman | Executive Vice President, Chief Financial Officer (Principal Financial Officer) | November 21, 2018 | ||
Kevin C. Berryman | ||||
/S/ William B. Allen | Senior Vice President and Chief Accounting Officer (Principal Accounting Officer) | November 21, 2018 | ||
William B. Allen | ||||
Page 63
JACOBS ENGINEERING GROUP INC. AND SUBSIDIARIES
CONSOLIDATED FINANCIAL STATEMENTS
WITH REPORTS OF INDEPENDENT REGISTERED PUBLIC ACCOUNTING FIRM
September 28, 2018
F - 1
JACOBS ENGINEERING GROUP INC. AND SUBSIDIARIES
INDEX TO CONSOLIDATED FINANCIAL STATEMENTS
September 28, 2018
F - 2
JACOBS ENGINEERING GROUP INC. AND SUBSIDIARIES
CONSOLIDATED BALANCE SHEETS
(In thousands, except share information)
September 28, 2018 | September 29, 2017 | ||||||
ASSETS | |||||||
Current Assets: | |||||||
Cash and cash equivalents | $ | 793,358 | $ | 774,151 | |||
Receivables | 3,554,930 | 2,102,543 | |||||
Prepaid expenses and other | 208,296 | 119,486 | |||||
Total current assets | 4,556,584 | 2,996,180 | |||||
Property, Equipment and Improvements, net | 457,706 | 349,911 | |||||
Other Noncurrent Assets: | |||||||
Goodwill | 6,103,856 | 3,009,826 | |||||
Intangibles, net | 655,957 | 332,920 | |||||
Miscellaneous | 871,692 | 692,022 | |||||
Total other noncurrent assets | 7,631,505 | 4,034,768 | |||||
$ | 12,645,795 | $ | 7,380,859 | ||||
LIABILITIES AND STOCKHOLDERS’ EQUITY | |||||||
Current Liabilities: | |||||||
Notes payable | $ | 4,954 | $ | 3,071 | |||
Accounts payable | 1,127,671 | 683,605 | |||||
Accrued liabilities | 1,488,629 | 939,687 | |||||
Billings in excess of costs | 524,439 | 299,864 | |||||
Total current liabilities | 3,145,693 | 1,926,227 | |||||
Long-term Debt | 2,146,877 | 235,000 | |||||
Other Deferred Liabilities | 1,408,871 | 732,281 | |||||
Commitments and Contingencies | |||||||
Stockholders’ Equity: | |||||||
Capital stock: | |||||||
Preferred stock, $1 par value, authorized - 1,000,000 shares; issued and outstanding - none | — | — | |||||
Common stock, $1 par value, authorized - 240,000,000 shares; issued and outstanding—142,217,933 shares and 120,385,544 shares as of September 28, 2018 and September 29, 2017, respectively | 142,218 | 120,386 | |||||
Additional paid-in capital | 2,708,839 | 1,239,782 | |||||
Retained earnings | 3,809,991 | 3,721,698 | |||||
Accumulated other comprehensive loss | (806,703 | ) | (653,514 | ) | |||
Total Jacobs stockholders’ equity | 5,854,345 | 4,428,352 | |||||
Noncontrolling interests | 90,009 | 58,999 | |||||
Total Group stockholders’ equity | 5,944,354 | 4,487,351 | |||||
$ | 12,645,795 | $ | 7,380,859 | ||||
See the accompanying Notes to Consolidated Financial Statements.
F - 3
JACOBS ENGINEERING GROUP INC. AND SUBSIDIARIES
CONSOLIDATED STATEMENTS OF EARNINGS
For the Fiscal Years Ended September 28, 2018, September 29, 2017 and September 30, 2016
(In thousands, except per share information)
September 28, 2018 | September 29, 2017 | September 30, 2016 | |||||||||
Revenues | $ | 14,984,646 | $ | 10,022,788 | $ | 10,964,157 | |||||
Direct cost of contracts | (12,156,276 | ) | (8,250,536 | ) | (9,196,326 | ) | |||||
Gross profit | 2,828,370 | 1,772,252 | 1,767,831 | ||||||||
Selling, general and administrative expenses | (2,180,399 | ) | (1,379,983 | ) | (1,429,233 | ) | |||||
Operating Profit | 647,971 | 392,269 | 338,598 | ||||||||
Other Income (Expense): | |||||||||||
Interest income | 8,984 | 8,748 | 7,848 | ||||||||
Interest expense | (76,760 | ) | (12,035 | ) | (15,260 | ) | |||||
Gain (Loss) on disposal of business and investments | (20,967 | ) | 10,880 | (41,410 | ) | ||||||
Miscellaneous income (expense), net | (4,523 | ) | (6,645 | ) | (3,053 | ) | |||||
Total other (expense) income, net | (93,266 | ) | 948 | (51,875 | ) | ||||||
Earnings Before Taxes | 554,705 | 393,217 | 286,723 | ||||||||
Income Tax Expense | (381,563 | ) | (105,842 | ) | (72,208 | ) | |||||
Net Earnings of the Group | 173,142 | 287,375 | 214,515 | ||||||||
Net (Earnings) Loss Attributable to Noncontrolling Interests | (9,711 | ) | 6,352 | (4,052 | ) | ||||||
Net Earnings Attributable to Jacobs | $ | 163,431 | $ | 293,727 | $ | 210,463 | |||||
Net Earnings Per Share: | |||||||||||
Basic | $ | 1.18 | $ | 2.43 | $ | 1.75 | |||||
Diluted | $ | 1.17 | $ | 2.42 | $ | 1.73 | |||||
See the accompanying Notes to Consolidated Financial Statements.
F - 4
JACOBS ENGINEERING GROUP INC. AND SUBSIDIARIES
CONSOLIDATED STATEMENTS OF COMPREHENSIVE INCOME
For the Fiscal Years Ended September 28, 2018, September 29, 2017 and September 30, 2016
(In thousands)
September 28, 2018 | September 29, 2017 | September 30, 2016 | |||||||||
Net Earnings of the Group | $ | 173,142 | $ | 287,375 | $ | 214,515 | |||||
Other Comprehensive Income (Loss): | |||||||||||
Foreign currency translation adjustment | (109,877 | ) | (140,527 | ) | (46,515 | ) | |||||
Gain (loss) on cash flow hedges | 118 | (1,350 | ) | (1,403 | ) | ||||||
Change in pension liabilities | (27,231 | ) | 123,427 | (111,488 | ) | ||||||
Other comprehensive income (loss) before taxes | (136,990 | ) | (18,450 | ) | (159,406 | ) | |||||
Income Tax (Expense) Benefit: | |||||||||||
Cash flow hedges | 859 | (90 | ) | 273 | |||||||
Change in pension liabilities | (17,058 | ) | (24,380 | ) | 13,303 | ||||||
Income Tax (Expense) Benefit: | (16,199 | ) | (24,470 | ) | 13,576 | ||||||
Net other comprehensive income (loss) | (153,189 | ) | (42,920 | ) | (145,830 | ) | |||||
Net Comprehensive Income (Loss) of the Group | 19,953 | 244,455 | 68,685 | ||||||||
Net (Earnings) Loss Attributable to Noncontrolling Interests | (9,711 | ) | 6,352 | (4,052 | ) | ||||||
Net Comprehensive Income (Loss) Attributable to Jacobs | $ | 10,242 | $ | 250,807 | $ | 64,633 | |||||
See the accompanying Notes to Consolidated Financial Statements including the Company's note on
Other Comprehensive Income for a presentation of amounts reclassified to net income during the period.
F - 5
JACOBS ENGINEERING GROUP INC. AND SUBSIDIARIES
CONSOLIDATED STATEMENTS OF STOCKHOLDERS’ EQUITY
For the Fiscal Years Ended September 28, 2018, September 29, 2017 and September 30, 2016
(In thousands)
Common Stock | Additional Paid-in Capital | Retained Earnings | Accumulated Other Comp-rehensive Income (Loss) | Total Jacobs Stock-holders’ Equity | Non-controlling Interests | Total Group Stock-holders’ Equity | |||||||||||||||||||||
Balances at October 2, 2015 | $ | 123,153 | $ | 1,137,144 | $ | 3,496,212 | $ | (464,764 | ) | $ | 4,291,745 | $ | 64,713 | $ | 4,356,458 | ||||||||||||
Net earnings | — | — | 210,463 | — | 210,463 | 4,052 | 214,515 | ||||||||||||||||||||
Foreign currency translation adjustments | — | — | — | (46,516 | ) | (46,516 | ) | — | (46,516 | ) | |||||||||||||||||
Pension liability, net of deferred taxes of $13,303 | — | — | — | (98,185 | ) | (98,185 | ) | — | (98,185 | ) | |||||||||||||||||
Loss on derivatives, net of deferred taxes of $274 | — | — | — | (1,129 | ) | (1,129 | ) | — | (1,129 | ) | |||||||||||||||||
Noncontrolling interest acquired / consolidated | — | (127 | ) | — | — | (127 | ) | (1,150 | ) | (1,277 | ) | ||||||||||||||||
Distributions to noncontrolling interests | — | — | (3,146 | ) | — | (3,146 | ) | (2,709 | ) | (5,855 | ) | ||||||||||||||||
Issuances of equity securities, net of deferred taxes of $3,382 | 1,351 | 72,055 | — | — | 73,406 | — | 73,406 | ||||||||||||||||||||
Repurchases of equity securities | (3,553 | ) | (40,800 | ) | (116,882 | ) | — | (161,235 | ) | — | (161,235 | ) | |||||||||||||||
Balances at September 30, 2016 | $ | 120,951 | $ | 1,168,272 | $ | 3,586,647 | $ | (610,594 | ) | $ | 4,265,276 | $ | 64,906 | $ | 4,330,182 | ||||||||||||
Net earnings | — | — | 293,727 | — | 293,727 | (6,352 | ) | 287,375 | |||||||||||||||||||
Foreign currency translation adjustments | — | — | — | (140,527 | ) | (140,527 | ) | — | (140,527 | ) | |||||||||||||||||
Pension liability, net of deferred taxes of $24,380 | — | — | — | 99,047 | 99,047 | — | 99,047 | ||||||||||||||||||||
Loss on derivatives, net of deferred taxes of $90 | — | — | — | (1,440 | ) | (1,440 | ) | — | (1,440 | ) | |||||||||||||||||
Noncontrolling interest acquired / consolidated | — | — | — | — | — | 445 | 445 | ||||||||||||||||||||
Dividends | — | — | (72,765 | ) | — | (72,765 | ) | — | (72,765 | ) | |||||||||||||||||
Distributions to noncontrolling interests | — | — | (4,559 | ) | — | (4,559 | ) | — | (4,559 | ) | |||||||||||||||||
Issuances of equity securities, net of deferred taxes of $1,015 | 1,468 | 99,117 | — | — | 100,585 | — | 100,585 | ||||||||||||||||||||
Repurchases of equity securities | (2,033 | ) | (27,607 | ) | (81,352 | ) | — | (110,992 | ) | — | (110,992 | ) | |||||||||||||||
Balances at September 29, 2017 | $ | 120,386 | $ | 1,239,782 | $ | 3,721,698 | $ | (653,514 | ) | $ | 4,428,352 | $ | 58,999 | $ | 4,487,351 | ||||||||||||
Net earnings | — | — | 163,431 | — | 163,431 | 9,711 | 173,142 | ||||||||||||||||||||
Foreign currency translation adjustments | — | — | — | (109,877 | ) | (109,877 | ) | — | (109,877 | ) | |||||||||||||||||
Pension liability, net of deferred taxes of $17,058 | — | — | 10,160 | (44,289 | ) | (34,129 | ) | — | (34,129 | ) | |||||||||||||||||
Gain on derivatives, net of deferred taxes of $(859) | — | — | — | 977 | 977 | — | 977 | ||||||||||||||||||||
Noncontrolling interest acquired / consolidated | — | 3,456 | — | — | 3,456 | 33,690 | 37,146 | ||||||||||||||||||||
Dividends | — | — | (85,608 | ) | — | (85,608 | ) | — | (85,608 | ) | |||||||||||||||||
Distributions to noncontrolling interests | — | — | 7,705 | — | 7,705 | (12,391 | ) | (4,686 | ) | ||||||||||||||||||
Stock based compensation | — | 81,196 | (1,954 | ) | — | 79,242 | — | 79,242 | |||||||||||||||||||
Issuances of equity securities | 21,881 | 1,385,316 | (3,420 | ) | — | 1,403,777 | — | 1,403,777 | |||||||||||||||||||
Repurchases of equity securities | (49 | ) | (911 | ) | (2,021 | ) | — | (2,981 | ) | — | (2,981 | ) | |||||||||||||||
Balances at September 28, 2018 | $ | 142,218 | $ | 2,708,839 | $ | 3,809,991 | $ | (806,703 | ) | $ | 5,854,345 | $ | 90,009 | $ | 5,944,354 | ||||||||||||
See the accompanying Notes to Consolidated Financial Statements.
F - 6
JACOBS ENGINEERING GROUP INC. AND SUBSIDIARIES
CONSOLIDATED STATEMENTS OF CASH FLOWS
For the Fiscal Years Ended September 28, 2018, September 29, 2017 and September 30, 2016
(In thousands)
September 28, 2018 | September 29, 2017 | September 30, 2016 | |||||||||
Cash Flows from Operating Activities: | |||||||||||
Net earnings attributable to the Group | $ | 173,142 | $ | 287,375 | $ | 214,515 | |||||
Adjustments to reconcile net earnings to net cash flows provided by operations: | |||||||||||
Depreciation and amortization: | |||||||||||
Property, equipment and improvements | 117,856 | 76,418 | 82,363 | ||||||||
Intangible assets | 80,731 | 46,095 | 47,608 | ||||||||
(Gain) loss on sales of businesses and investments | 20,967 | (10,058 | ) | 41,410 | |||||||
Stock based compensation | 79,242 | 38,764 | 32,370 | ||||||||
Tax deficiency from stock based compensation | — | (2,877 | ) | (377 | ) | ||||||
Equity in earnings of operating ventures, net | (2,639 | ) | (7,788 | ) | (11,892 | ) | |||||
(Gain) Losses on disposals of assets, net | 17,491 | 14,876 | 10,680 | ||||||||
Loss (gain) on pension plan changes | 5,414 | (9,955 | ) | — | |||||||
Deferred income taxes | 288,126 | 36,663 | (27,407 | ) | |||||||
Changes in assets and liabilities, excluding the effects of businesses acquired: | |||||||||||
Receivables | (435,198 | ) | 75,441 | 397,268 | |||||||
Prepaid expenses and other current assets | (19,134 | ) | (23,755 | ) | 17,906 | ||||||
Accounts payable | 183,057 | 153,961 | (44,214 | ) | |||||||
Accrued liabilities | (37,746 | ) | (56,279 | ) | (71,930 | ) | |||||
Billings in excess of costs | 6,268 | (31,976 | ) | 33,347 | |||||||
Income taxes payable | 68,970 | 4,264 | (4,586 | ) | |||||||
Other deferred liabilities | (79,280 | ) | (33,547 | ) | (37,605 | ) | |||||
Other, net | 13,885 | 17,259 | 717 | ||||||||
Net cash (used for) provided by operating activities | 481,152 | 574,881 | 680,173 | ||||||||
Cash Flows Used for Investing Activities: | |||||||||||
Additions to property and equipment | (94,884 | ) | (118,060 | ) | (67,688 | ) | |||||
Disposals of property and equipment | 3,293 | 2,387 | 10,479 | ||||||||
Purchases of intangibles | — | — | (10,027 | ) | |||||||
Distributions of capital from (contributions to) equity investees | (5,416 | ) | 31,701 | (3,403 | ) | ||||||
Acquisitions of businesses, net of cash acquired | (1,488,336 | ) | (150,190 | ) | (49,943 | ) | |||||
Proceeds (payments) related to sales of businesses | 7,736 | (2,036 | ) | (19,039 | ) | ||||||
Net cash used for investing activities | (1,577,607 | ) | (236,198 | ) | (139,621 | ) | |||||
Cash Flows Provided by Financing Activities: | |||||||||||
Proceeds from long-term borrowings | 5,784,355 | 1,694,023 | 1,649,653 | ||||||||
Repayments of long-term borrowings | (4,572,182 | ) | (1,846,797 | ) | (1,840,789 | ) | |||||
Proceeds from short-term borrowings | 712 | 1,347 | 3,040 | ||||||||
Repayments of short-term borrowings | (3,391 | ) | (702 | ) | (14,042 | ) | |||||
Proceeds from issuances of common stock | 53,584 | 62,645 | 43,140 | ||||||||
Common stock repurchases | (2,981 | ) | (97,180 | ) | (152,550 | ) | |||||
Excess tax benefits from stock based compensation | — | 2,877 | 377 | ||||||||
Taxes paid on vested restricted stock | (31,108 | ) | — | — | |||||||
Cash dividends, including to noncontrolling interests | (86,569 | ) | (58,793 | ) | (5,855 | ) | |||||
Net cash provided by (used for) financing activities | 1,142,420 | (242,580 | ) | (317,026 | ) | ||||||
Effect of Exchange Rate Changes | (26,758 | ) | 22,332 | (28,669 | ) | ||||||
Net Increase in Cash and Cash Equivalents | 19,207 | 118,435 | 194,857 | ||||||||
Cash and Cash Equivalents at the Beginning of the Period | 774,151 | 655,716 | 460,859 | ||||||||
Cash and Cash Equivalents at the End of the Period | $ | 793,358 | $ | 774,151 | $ | 655,716 | |||||
See the accompanying Notes to Consolidated Financial Statements.
F - 7
JACOBS ENGINEERING GROUP INC. AND SUBSIDIARIES
NOTES TO CONSOLIDATED FINANCIAL STATEMENTS
1. | Description of Business and Basis of Presentation |
Description of Business
We provide a broad range of technical, professional and construction services including engineering, design and architectural services; construction and construction management services; operations and maintenance services; and process, scientific and systems consulting services. We provide our services through offices and subsidiaries located primarily in North America, South America, Europe, the Middle East, India, Australia, Africa and Asia. We provide our services under cost-reimbursable and fixed-price contracts. The percentage of revenues realized from each of these types of contracts for the fiscal years ended September 28, 2018, September 29, 2017 and September 30, 2016 was as follows:
For the Years Ended | ||||||||
September 28, 2018 | September 29, 2017 | September 30, 2016 | ||||||
Cost-reimbursable | 76 | % | 81 | % | 82 | % | ||
Fixed-price | 24 | % | 19 | % | 18 | % | ||
Basis of Presentation, Definition of Fiscal Year, and Other Matters
The accompanying Consolidated Financial Statements have been prepared in accordance with accounting principles generally accepted in the United States ("U.S. GAAP") and include the accounts of Jacobs Engineering Group Inc. and its subsidiaries and affiliates which it controls. All intercompany accounts and transactions have been eliminated in consolidation.
The Company’s fiscal year ends on the Friday closest to September 30 (determined on the basis of the number of workdays) and, accordingly, an additional week of activity is added every five -to- six years. Fiscal 2015 included an extra week of activity.
During the second quarter of fiscal 2018, we reorganized our operating and reporting structure around three lines of business (“LOBs”). This reorganization occurred in conjunction with the integration of CH2M into the Company's legacy businesses, and was intended to better serve our global clients, leverage our workforce, help streamline operations and provide enhanced growth opportunities. The three global LOBs are as follows: Aerospace, Technology, Environmental and Nuclear ("ATEN"); Buildings, Infrastructure and Advanced Facilities ("BIAF"); and Energy, Chemicals and Resources ("ECR"). Previously, the Company operated its business around four global lines of businesses. For a further discussion of our segment information, please refer to Note 17- Segment Information.
2. | Significant Accounting Policies |
Revenue Accounting for Contracts
We recognize revenue earned on our technical professional and field services projects under the percentage-of-completion method described in ASC 605-35, Construction-Type and Production-Type Contracts. In general, we recognize revenues at the time we provide services. Pre-contract costs are generally expensed as incurred, unless they are directly associated with an anticipated contract and recoverability from that contract is probable. Contracts are generally segmented between types of services, such as engineering and construction, and accordingly, gross margin related to each activity is recognized as those separate services are rendered. For multiple contracts with a single customer we account for each contract separately.
The percentage-of-completion method of accounting is applied by comparing contract costs incurred to date to the total estimated costs at completion. Contract losses are provided for in their entirety in the period they become known, without regard to the percentage-of-completion.
Unapproved change orders are included in the contract price to the extent it is probable that such change orders will result in additional contract revenue and the amount of such additional revenue can be reliably estimated. Claims meeting these recognition criteria are included in revenues only to the extent of the related costs incurred.
Certain cost-reimbursable contracts include incentive-fee arrangements. These incentive fees can be based on a variety of factors but the most common are the achievement of target completion dates, target costs, and/or other performance criteria. Failure to meet these targets can result in unrealized incentive fees. We recognize incentive fees based on expected results using the percentage-of-completion method of accounting. As the contract progresses and more information becomes available, the estimate of the anticipated incentive fee that will be earned is revised as necessary. We bill incentive fees based on the terms and conditions
F - 8
JACOBS ENGINEERING GROUP INC. AND SUBSIDIARIES
NOTES TO CONSOLIDATED FINANCIAL STATEMENTS - (Continued)
of the individual contracts. In certain situations, we are allowed to bill a portion of the incentive fees over the performance period of the contract. In other situations, we are allowed to bill incentive fees only after the target criterion has been achieved. Incentive fees which have been recognized but not billed are included in receivables in the accompanying Consolidated Balance Sheets.
Certain cost-reimbursable contracts with government customers as well as certain commercial clients provide that contract costs are subject to audit and adjustment. In this situation, revenues are recorded at the time services are performed based upon the amounts we expect to realize upon completion of the contracts. In those situations where an audit indicates that we may have billed a client for costs not allowable under the terms of the contract, we estimate the amount of such nonbillable costs and adjust our revenues accordingly.
Direct costs of contracts include all costs incurred in connection with and directly for the benefit of client contracts, including depreciation and amortization relating to assets used in providing the services required by the related projects. The level of direct costs of contracts may fluctuate between reporting periods due to a variety of factors, including the amount of pass-through costs we incur during a period. On those projects where we are responsible for subcontract labor or third-party materials and equipment, we reflect the amounts of such items in both revenues and costs (and we refer to such costs as “pass-through costs”). On other projects where the client elects to pay for such items directly and we have no associated responsibility for such items, these amounts are not considered pass-through costs and are, therefore, not reflected in either revenues or costs. To the extent that we incur a significant amount of pass-through costs in a period, our direct costs of contracts are likely to increase as well.
The following table sets forth pass-through costs included in revenues in the accompanying Consolidated Statements of Earnings (in millions):
For the Years Ended | ||||||||||
September 28, 2018 | September 29, 2017 | September 30, 2016 | ||||||||
$ | 3,058.6 | $ | 2,539.3 | $ | 2,489.9 | |||||
Joint Ventures and VIEs
As is common to the industry, we execute certain contracts jointly with third parties through various forms of joint ventures. Although the joint ventures own and hold the contracts with the clients, the services required by the contracts are typically performed by us and our joint venture partners, or by other subcontractors under subcontracting agreements with the joint ventures. Many of these joint ventures are formed for a specific project. The assets of our joint ventures generally consist almost entirely of cash and receivables (representing amounts due from clients), and the liabilities of our joint ventures generally consist almost entirely of amounts due to the joint venture partners (for services provided by the partners to the joint ventures under their individual subcontracts) and other subcontractors. In general, at any given time, the equity of our joint ventures represents the undistributed profits earned on contracts the joint ventures hold with clients. Very few of our joint ventures have employees or third-party debt or credit facilities. The debt held by the joint ventures is non-recourse to the general credit of Jacobs. The assets of a joint venture are restricted for use to the obligations of the particular joint venture and are not available for general operations of the Company. Our risk of loss on these arrangements is usually shared with our partners. The liability of each partner is usually joint and several, which means that each partner may become liable for the entire risk of loss on the project. Furthermore, on some of our projects, the Company has granted guarantees which may encumber both our contracting subsidiary company and the Company for the entire risk of loss on the project. See Note 15- Contractual Guarantees, Litigation, Investigations and Insurance for further discussion.
Many of the joint ventures are deemed to be variable interest entities (“VIE”) because they lack sufficient equity to finance the activities of the joint venture. The Company uses a qualitative approach to determine if the Company is the primary beneficiary of the VIE, which considers factors that indicate a party has the power to direct the activities that most significantly impact the joint venture’s economic performance. These factors include the composition of the governing board, how board decisions are approved, the powers granted to the operational manager(s) and partner that holds that position(s), and to a certain extent, the partner’s economic interest in the joint venture. The Company analyzes each joint venture initially to determine if it should be consolidated or unconsolidated.
• | Consolidated if the Company is the primary beneficiary of a VIE, or holds the majority of voting interests of a non-VIE (and no significant participative rights are available to the other partners). |
• | Unconsolidated if the Company is not the primary beneficiary of a VIE, or does not hold the majority of voting interest of a non-VIE. |
See Note 7-Joint Ventures and VIEs for further discussion.
F - 9
JACOBS ENGINEERING GROUP INC. AND SUBSIDIARIES
NOTES TO CONSOLIDATED FINANCIAL STATEMENTS - (Continued)
Fair Value Measurements
Certain amounts included in the accompanying consolidated financial statements are presented at “fair value.” Fair value is defined as the price that would be received from selling an asset or paid to transfer a liability in an orderly transaction between market participants as of the date fair value is determined (the “measurement date”). When determining fair value, we consider the principal or most advantageous market in which we would transact, and we consider only those assumptions we believe a typical market participant would consider when pricing an asset or liability. In measuring fair value, we use the following inputs in the order of priority indicated:
Level 1 - Quoted prices in active markets for identical assets or liabilities.
Level 2 - Observable inputs other than quoted prices in active markets included in Level 1, such as (i) quoted prices for similar assets or liabilities; (ii) quoted prices in markets that have insufficient volume or infrequent transactions (e.g., less active markets); and (iii) model-driven valuations in which all significant inputs are observable or can be derived principally from, or corroborated with, observable market data for substantially the full term of the asset or liability.
Level 3 - Unobservable inputs to the valuation methodology that are significant to the fair value measurement.
The net carrying amounts of cash and cash equivalents, trade receivables and payables and notes payable approximate fair value due to the short-term nature of these instruments. See Note 9- Borrowings for a discussion of the fair value of long-term debt.
Certain other assets and liabilities, such as forward contracts and interest rate swap agreements we purchased as cash-flow hedges discussed in Note 14- Commitments and Contingencies and Derivative Financial Instruments are required to be carried in our Consolidated Financial Statements at Fair Value.
The fair value of the Company’s reporting units (used for purposes of determining whether there is an indication of possible impairment of the carrying value of goodwill) is determined using both an income approach and a market approach. Both approaches require us to make certain estimates and judgments. Under the income approach, fair value is determined by using the discounted cash flows of our reporting units. Under the market approach, the fair values of our reporting units are determined by reference to guideline companies that are reasonably comparable to our reporting units; the fair values are estimated based on the valuation multiples of the invested capital associated with the guideline companies. In assessing whether there is an indication that the carrying value of goodwill has been impaired, we utilize the results of both valuation techniques and consider the range of fair values indicated.
With respect to equity-based compensation (i.e., share-based payments), we estimate the fair value of stock options granted to employees and directors using the Black-Scholes option-pricing model. Like all option-pricing models, the Black-Scholes model requires the use of subjective assumptions including (i) the expected volatility of the market price of the underlying stock, and (ii) the expected term of the award, among others. Accordingly, changes in assumptions and any subsequent adjustments to those assumptions can cause different fair values to be assigned to our future stock option awards. For restricted stock awards (including restricted stock units) containing market conditions, compensation expense is based on the fair value of such awards using a Monte Carlo simulation. For restricted stock awards (including restricted stock units) containing service and performance conditions, compensation expense is based on the closing stock price on the date of grant.
The fair values of the assets owned by the various pension plans that the Company sponsors are determined based on the type of asset, consistent with U.S. GAAP. Equity securities are valued by using market observable data such as quoted prices. Publicly traded corporate equity securities are valued at the last reported sale price on the last business day of the year. Securities not traded on the last business day are valued at the last reported bid price. Fixed income investment funds categorized as Level 2 are valued by the trustee using pricing models that use verifiable observable market data (e.g., interest rates and yield curves observable at commonly quoted intervals), bids provided by brokers or dealers, or quoted prices of securities with similar characteristics. Real estate consists primarily of common or collective trusts, with underlying investments in real estate. These investments are valued using the best information available, including quoted market price, market prices for similar assets when available, internal cash flow estimates discounted at an appropriate interest rate, or independent appraisals, as appropriate. Management values insurance contracts and hedge funds using actuarial assumptions and certain values reported by fund managers.
The methodologies described above and elsewhere in these Notes to Consolidated Financial Statements may produce a fair value measure that may not be indicative of net realizable value or reflective of future fair values. Furthermore, while the Company believes its valuation methods are appropriate and consistent with other market participants, the use of different
F - 10
JACOBS ENGINEERING GROUP INC. AND SUBSIDIARIES
NOTES TO CONSOLIDATED FINANCIAL STATEMENTS - (Continued)
methodologies or assumptions to determine the fair value of certain financial instruments could result in a different fair value measurement.
Cash Equivalents
We consider all highly liquid investments with original maturities of less than three months to be cash equivalents. Cash equivalents at September 28, 2018 and September 29, 2017 consisted primarily of money market mutual funds and overnight bank deposits.
Receivables and Billings in Excess of Costs
Receivables include billed receivables, unbilled receivables and retentions receivable. Amounts billed, net consist of amounts invoiced to clients in accordance with the terms of our client contracts and are shown net of an allowance for doubtful accounts. We anticipate that substantially all of such billed amounts will be collected over the next twelve months.
Unbilled receivables and other and retentions receivable generally represent reimbursable costs, profit and amounts earned under contracts in progress, or in some cases completed, as of the respective balance sheet dates. Such amounts become billable according to the contract terms, which usually provide that such amounts become billable upon the passage of time, achievement of certain milestones or completion of the project. We anticipate that substantially all of such unbilled amounts will be billed and collected over the next fiscal year.
Certain contracts allow us to issue invoices to clients in advance of providing services. Billings in excess of costs represent billings to, and cash collected from, clients in advance of work performed. We anticipate that substantially all such amounts will be earned over the next twelve months.
Claims receivable are included in receivables in the accompanying Consolidated Balance Sheets and represent certain costs incurred on contracts to the extent it is probable that such claims will result in additional contract revenue and the amount of such additional revenue can be reliably estimated.
Property, Equipment, and Improvements
Property, equipment and improvements are carried at cost, and are shown net of accumulated depreciation and amortization in the accompanying Consolidated Balance Sheets. Depreciation and amortization is computed primarily by using the straight-line method over the estimated useful lives of the assets. The cost of leasehold improvements is amortized using the straight-line method over the lesser of the estimated useful life of the asset or the remaining term of the related lease. Estimated useful lives range from 20 to 40 years for buildings, from 3 to 10 years for equipment and from 4 to 10 years for leasehold improvements.
Goodwill and Other Intangible Assets
Goodwill represents the excess of the cost of an acquired business over the fair value of the net tangible and intangible assets acquired. Goodwill and intangible assets with indefinite lives are not amortized; instead, on an annual basis we test goodwill and intangible assets with indefinite lives for possible impairment. Intangible assets with finite lives are amortized on a straight-line basis over the useful lives of those assets.
During the quarter ended September 28, 2018, the Company voluntarily changed the date of its annual goodwill and indefinite-lived intangible asset impairment testing from the last day of the fiscal third quarter to the first day of the fourth quarter. This voluntary change is preferable under the circumstances as it results in better alignment with the Company’s strategic planning and forecasting process and provides the Company with additional time to complete its annual impairment testing. The voluntary change in accounting principle related to the annual testing date will not delay, accelerate or avoid an impairment charge. This change is not applied retrospectively as it is impracticable to do so because retrospective application would require application of significant estimates and assumptions with the use of hindsight. Accordingly, the change will be applied prospectively.
Interim testing for impairment is performed if indicators of potential impairment exist. For purposes of impairment testing, goodwill is assigned to the applicable reporting units based on the current reporting structure. We have determined that our operating segments are also our reporting units based on management’s conclusion that the components comprising each of our operating segments share similar economic characteristics and meet the aggregation criteria in accordance with ASC 350.
When testing goodwill for impairment quantitatively, the Company first compares the fair value of each reporting unit with its carrying amount. If the carrying amount of a reporting unit exceeds its fair value, a second step is performed to measure the amount of potential impairment. In the second step, the Company compared the implied fair value of the reporting unit
F - 11
JACOBS ENGINEERING GROUP INC. AND SUBSIDIARIES
NOTES TO CONSOLIDATED FINANCIAL STATEMENTS - (Continued)
goodwill with the carrying amount of the reporting unit's goodwill. If the carrying amount of reporting unit goodwill exceeds the implied fair value of that goodwill, an impairment loss is recognized. During 2018, we completed our annual goodwill impairment test and quantitatively determined that none of our goodwill was impaired. We have determined that the fair value of our reporting units substantially exceeded their respective carrying values for the Consolidated Balance Sheets presented. The range of fair values (both ends of the range) for each reporting unit exceeded the respective book values by 31% to 132%. See Note 6- Goodwill and Intangibles.
Foreign Currencies
In preparing our Consolidated Financial Statements, it is necessary to translate the financial statements of our subsidiaries operating outside the U.S., which are denominated in currencies other than the U.S. dollar, into the U.S. dollar. In accordance with U.S. GAAP, revenues and expenses of operations outside the U.S. are translated into U.S. dollars using weighted-average exchange rates for the applicable periods being translated while the assets and liabilities of operations outside the U.S. are generally translated into U.S. dollars using period-end exchange rates. The net effect of foreign currency translation adjustments is included in stockholders’ equity as a component of accumulated other comprehensive income (loss) in the accompanying Consolidated Balance Sheets.
Share-Based Payments
We measure the value of services received from employees and directors in exchange for an award of an equity instrument based on the grant-date fair value of the award. The computed value is recognized as a non-cash cost on a straight-line basis over the period the individual provides services, which is typically the vesting period of the award with the exception of awards containing an internal performance measure, such as EPS growth and ROIC, which is recognized on a straight-line basis over the vesting period subject to the probability of meeting the performance requirements and adjusted for the number of shares expected to be earned. The cost of these awards is recorded in selling, general and administrative expense in the accompanying Consolidated Statements of Earnings.
During fiscal 2018, the Company adopted ASU No 2016-09, Improvements to Employee Share Based Payment Accounting. As a result, the cash paid by the Company to taxing authorities as a result of withholding shares for the exercise of employee stock awards is classified as financing activity and this change is adopted retrospectively. Additionally, all excess tax benefits related to share-based payments in our provision for income taxes are now classified as an operating activity along with other income taxes in the statement of cash flows and this change is applied prospectively. These items were historically recorded in additional paid-in capital and in financing activities. The amount recognized by the Company in excess tax benefits related to share-based payments in our provision for income taxes for the fiscal year ended September 28, 2018 was not material. Finally, we have elected to begin accounting for share-based compensation award forfeitures when they occur instead of estimating the number of forfeitures expected in accordance with the new guidance. This change in accounting policy for share-based compensation award forfeitures resulted in a $1.8 million cumulative effect of change in accounting principle to retained earnings in the Company’s Consolidated Balance Sheets.
Concentrations of Credit Risk
Our cash balances and cash equivalents are maintained in accounts held by major banks and financial institutions located in North America, South America, Europe, the Middle East, India, Australia, Africa and Asia. In the normal course of business, and consistent with industry practices, we grant credit to our clients without requiring collateral. Concentrations of credit risk is the risk that, if we extend a significant amount of credit to clients in a specific geographic area or industry, we may experience disproportionately high levels of default if those clients are adversely affected by factors particular to their geographic area or industry. Concentrations of credit risk relative to trade receivables are limited due to our diverse client base, which includes the U.S. federal government and multi-national corporations operating in a broad range of industries and geographic areas. Additionally, in order to mitigate credit risk, we continually evaluate the credit worthiness of our major commercial clients.
Use of Estimates and Assumptions
The preparation of financial statements in conformity with U.S. GAAP requires us to employ estimates and make assumptions that affect the reported amounts of certain assets and liabilities; the revenues and expenses reported for the periods covered by the financial statements; and certain amounts disclosed in these Notes to the Consolidated Financial Statements. Although such estimates and assumptions are based on management’s most recent assessment of the underlying facts and circumstances utilizing the most current information available and past experience, actual results could differ significantly from those estimates and assumptions. Our estimates, judgments and assumptions are evaluated periodically and adjusted accordingly.
Earlier in these Notes to Consolidated Financial Statements we discussed three significant accounting policies that rely on the application of estimates and assumptions: revenue recognition for long-term contracts; the process for testing goodwill for
F - 12
JACOBS ENGINEERING GROUP INC. AND SUBSIDIARIES
NOTES TO CONSOLIDATED FINANCIAL STATEMENTS - (Continued)
possible impairment; and the accounting for share-based payments to employees and directors. The following is a discussion of certain other significant accounting policies that rely on the use of estimates:
Accounting for Pensions - We use certain assumptions and estimates in order to calculate periodic pension cost and the value of the assets and liabilities of our pension plans. These assumptions involve discount rates, investment returns and projected salary increases, among others. Changes in the actuarial assumptions may have a material effect on the plans’ liabilities and the projected pension expense.
Accounting for Income Taxes - We determine our consolidated income tax expense using the asset and liability method prescribed by U.S. GAAP. Under this method, deferred tax assets and liabilities are recognized for the temporary differences between the carrying amounts of assets and liabilities for financial reporting purposes and income tax purposes. Such deferred tax assets and liabilities are adjusted, as appropriate, to reflect changes in tax rates expected to be in effect when the temporary differences reverse. If and when we determine that a deferred tax asset will not be realized for its full amount, we will recognize and record a valuation allowance with a corresponding charge to earnings. Judgment is required in determining our provision for income taxes. In the normal course of business, we may engage in numerous transactions every day for which the ultimate tax outcome (including the period in which the transaction will ultimately be included in taxable income or deducted as an expense) is uncertain. Additionally, we file income, franchise, gross receipts and similar tax returns in many jurisdictions. Our tax returns are subject to audit and investigation by the Internal Revenue Service, most states in the U.S., and by various government agencies representing many jurisdictions outside the U.S.
Contractual Guarantees, Litigation, Investigations and Insurance - In the normal course of business we are subject to certain contractual guarantees and litigation. We record in the Consolidated Balance Sheets amounts representing our estimated liability relating to such guarantees, litigation and insurance claims. We perform an analysis to determine the level of reserves to establish for both insurance-related claims that are known and have been asserted against us as well as for insurance-related claims that are believed to have been incurred based on actuarial analysis, but have not yet been reported to our claims administrators as of the respective balance sheet dates. We include any adjustments to such insurance reserves in our Consolidated Statements of Earnings. In addition, as a contractor providing services to various agencies of the U.S. federal government, we are subject to many levels of audits, investigations, and claims by, or on behalf of, the U.S. federal government with respect to contract performance, pricing, costs, cost allocations and procurement practices. We adjust revenues based upon the amounts we expect to realize considering the effects of any client audits or governmental investigations.
Accounting for Business Combinations - U.S. GAAP requires that the purchase price paid for business combinations accounted for using the acquisition method be allocated to the assets and liabilities acquired based on their respective Fair Values. Determining the Fair Value of contract assets and liabilities acquired often requires estimates and judgments regarding, among other things, the estimated cost to complete such contracts. The Company must also make certain estimates and judgments relating to other assets and liabilities acquired as well as any identifiable intangible assets acquired.
During the first fiscal quarter of 2018, the Company acquired CH2M HILL Companies, Ltd. ("CH2M"). During the fourth fiscal quarter of 2017, the Company acquired Blue Canopy LLC. During the second fiscal quarter of 2017, the Company acquired Aquenta Consulting Pty Ltd. During the first fiscal quarter of 2016, the Company acquired J.L. Patterson & Associates. Other than the CH2M acquisition discussed in Note 5- Business Combinations, these acquisitions were not material to the Company’s consolidated results for fiscal 2018, 2017 or 2016.
On May 19, 2017, the Company entered into an agreement with Saudi Aramco to form a 50/50 Saudi Arabia-based joint venture company to provide professional program and construction management (“PMCM”) services for social infrastructure projects throughout Saudi Arabia and across the Middle East and North Africa. The venture commenced start-up operations in fourth quarter fiscal 2017 and initial funding commitments were made from each of the partners for $6.0 million in capital contributions each.
New Accounting Pronouncements
Revenue Recognition
In May 2014, the FASB issued ASU No. 2014-09 Revenue from Contracts with Customers. The new guidance provided by ASU 2014-09 is intended to remove inconsistencies and perceived weaknesses in the existing revenue requirements, provide a more robust framework for addressing revenue issues, improve comparability, provide more useful information and simplify the preparation of financial statements. The effective date for ASU 2014-09 is for annual reporting periods beginning after December 15, 2017 and interim periods therein.
F - 13
JACOBS ENGINEERING GROUP INC. AND SUBSIDIARIES
NOTES TO CONSOLIDATED FINANCIAL STATEMENTS - (Continued)
The Company’s adoption activities have been performed over three phases: (i) assessment, (ii) design and (iii) implementation. As part of these phases, the Company has identified the following, potentially significant differences to date:
Performance Obligations
Under current U.S. GAAP, the Company typically segments contracts that contain multiple services by service type - for instance, engineering, procurement and construction services - for purposes of revenue recognition. Under ASU 2014-09, multiple-service contracts where the Company is responsible for providing a single deliverable (e.g., a constructed asset) will be treated as a single performance obligation for purposes of revenue recognition and thus no longer will be segmented. Typically, this will occur when the company is contracted to perform both engineering and construction on a project. In these circumstances, the timing and pattern of revenue recognition will change. The remainder of the Company's contracts will continue to be treated as having discrete units of account because they either contain only one service or because the Company has determined that the component services in the contract are distinct.
Contract Modifications
In many instances, the Company enters into separate contracts for related services (e.g., engineering and construction) but is held responsible for providing a single deliverable (“Phased Projects”). Under ASU 2014-09, the separate contracts may be required to be combined and treated as a single contract with one performance obligation. This modification or combination of contracts may result in a cumulative catchup adjustment, which will have an immediate impact on the Company’s results of operations in the period the contract combination or modification occurs. In addition, it will change the timing and pattern of revenue recognition after the period the contracts have been combined or modified. Based on the two noted changes above, the Company has identified selected changes to our systems, processes and internal controls and designed updates for each to meet the standard's revised reporting and disclosure requirements.
The Company will adopt the new standard using the Modified Retrospective application for periods beginning with the first fiscal quarter of 2019. This standard will impact the Company’s Consolidated Financial Statements and will its administrative operations. The impact will depend on the magnitude of the items discussed above. While the Company will continue to evaluate the impact through the implementation phase, we expect a reduction of retained earnings in our consolidated financial statements in the period of adoption due to revenue recognition timing for certain engineering and construction contracts shifting as a result of being accounted for as a single performance obligation. This adjustment will create a corresponding adjustment in the Company's consolidated financial statements to accounts receivable and unbilled receivables and to billings in excess of costs.
Lease Accounting
In February 2016, the FASB issued ASU 2016-02 Leases. ASU 2016-02 requires lessees to recognize assets and liabilities for most leases. ASU 2016-02 is effective for public entity financial statements for annual periods beginning after December 15, 2018, and interim periods within those annual periods. Early adoption is permitted, including adoption in an interim period. The new guidance currently requires a modified retrospective transition approach for leases that exist or are entered into after the beginning of the earliest comparative period in the financial statements. ASU 2016-02 was further clarified and amended within ASU 2017-13, ASU 2018-01, ASU 2018-10 and ASU 2018-11 which included provisions that would provide us with the option to adopt the provisions of the new guidance using a modified retrospective transition approach, without adjusting the comparative periods presented. The Company is evaluating the impact of the new guidance on its consolidated financial statements. This standard could have a significant administrative impact on its operations, and the Company will further assess the impact through its implementation program.
Other Pronouncements
In August 2017, the FASB issued ASU No. 2017-12, Derivatives and Hedging (Topic 815): Targeted Improvements to Accounting for Hedging Activities. ASU 2017-12 provides financial reporting improvements related to hedging relationships to better portray the economic results of an entity’s risk management activities in its financial statements. Additionally, ASU No. 2017-12 makes certain targeted improvements to simplify the application of the hedge accounting guidance. The revised guidance becomes effective for fiscal years beginning after December 15, 2018 with early adoption permitted. The Company is evaluating the impact of the new guidance on its consolidated financial statements. It is not expected that the updated guidance will have a significant impact on the Company’s consolidated financial statements.
ASU 2017-04, Simplifying the Test for Goodwill Impairment, is effective for fiscal years beginning after December 15, 2019 with early adoption permitted. ASU 2017-04 removes the second step of the goodwill impairment test, which requires a hypothetical purchase price allocation. An entity will now recognize a goodwill impairment charge for the amount by which a reporting unit's carrying value exceeds its fair value, not to exceed the amount of goodwill allocated. Management does not expect the adoption of ASU 2017-04 to have any impact on the Company's financial position, results of operations or cash flows.
F - 14
JACOBS ENGINEERING GROUP INC. AND SUBSIDIARIES
NOTES TO CONSOLIDATED FINANCIAL STATEMENTS - (Continued)
In March 2017, the FASB issued ASU No. 2017-07, Compensation- Retirement Benefits (Topic 715): Improving the Presentation of Net Periodic Pension Cost and Net Periodic Postretirement Benefit Cost. This new standard intends to improve the presentation of net periodic pension cost and net periodic postretirement benefit cost. The new standard requires the service cost component of net periodic cost be reported in the same line item(s) as other employee compensation costs and all other components of the net periodic cost be reported in the consolidated statements of earnings and comprehensive income below operating income. ASU 2017-7 is effective for fiscal years beginning after December 15, 2017 for public companies and early adoption is permitted. Management is currently evaluating the impact that the adoption of ASU 2017-07 will have on the Company's financial position, results of operations and cash flows.
3. | Employee Stock Purchase and Stock Option Plans |
Broad-Based, Employee Stock Purchase Plans
Under the 1989 ESPP and the GESPP, eligible employees who elect to participate in these plans are granted the right to purchase shares of the common stock of Jacobs at a discount that is limited to 5% of the per-share market value on the day shares are sold to employees. The following table summarizes the stock issuance activity under the 1989 ESPP and the GESPP for the fiscal years ended September 28, 2018, September 29, 2017 and September 30, 2016:
For the Years Ended | |||||||||||
September 28, 2018 | September 29, 2017 | September 30, 2016 | |||||||||
Aggregate Purchase Price Paid for Shares Sold: | |||||||||||
Under the 1989 ESPP | $ | 21,590,858 | $ | 21,084,657 | $ | 23,631,241 | |||||
Under the GESPP | 2,240,609 | 2,105,834 | 2,660,067 | ||||||||
Total | $ | 23,831,467 | $ | 23,190,491 | $ | 26,291,308 | |||||
Aggregate Number of Shares Sold: | |||||||||||
Under the 1989 ESPP | 357,899 | 403,652 | 564,461 | ||||||||
Under the GESPP | 36,405 | 39,648 | 63,196 | ||||||||
Total | 394,304 | 443,300 | 627,657 | ||||||||
On January 19, 2017, the Company’s stockholders approved an increase in the number of shares authorized by 4,350,000 shares for the 1989 ESPP and by 150,000 shares for the GESPP.
At September 28, 2018, there remains 4,187,955 shares reserved for issuance under the 1989 ESPP and 138,575 shares reserved for issuance under the GESPP.
Stock Incentive Plans
We also sponsor the 1999 Stock Incentive Plan, as amended and restated (the "SIP") and the 1999 Outside Director Stock Plan, as amended and restated (the "ODSP"). The 1999 SIP provides for the issuance of incentive stock options, non-qualified stock options, share appreciation rights ("SARs"), restricted stock and restricted stock units to employees. The 1999 ODSP provides for awards of shares of common stock, restricted stock, restricted stock units and grants of non-qualified stock options to our outside (i.e., nonemployee) directors. The following table sets forth certain information about the 1999 Plans:
1999 SIP | 1999 ODSP | Total | ||||||
Number of shares authorized | 29,850,000 | 1,100,000 | 30,950,000 | |||||
Number of remaining shares reserved for issuance at September 28, 2018 | 6,911,375 | 486,755 | 7,398,130 | |||||
Number of shares relating to outstanding stock options at September 28, 2018 | 1,575,634 | 191,125 | 1,766,759 | |||||
Number of shares available for future awards: | ||||||||
At September 28, 2018 | 5,335,741 | 295,630 | 5,631,371 | |||||
At September 29, 2017 | 7,351,946 | 312,412 | 7,664,358 | |||||
Effective September 28, 2012, all grants of shares under the 1999 SIP are issued on a fungible basis. An award other than an option or SAR are granted on a 1.92-to-1.00 basis (“Fungible”). An award of an option or SAR are granted on a 1-to-1 basis (“Not Fungible”).
F - 15
JACOBS ENGINEERING GROUP INC. AND SUBSIDIARIES
NOTES TO CONSOLIDATED FINANCIAL STATEMENTS - (Continued)
The following table presents the fair value of shares (of restricted stock and restricted stock units) vested for the years ended September 28, 2018, September 29, 2017 and September 30, 2016 (in thousands):
For the Years Ended | |||||||||||
September 28, 2018 | September 29, 2017 | September 30, 2016 | |||||||||
Restricted Stock and Restricted Stock Units (service condition) | $ | 64,121 | $ | 34,466 | $ | 17,481 | |||||
Restricted Stock Units (service, market, and performance conditions at target) | 2,626 | 4,183 | 4,336 | ||||||||
Total | $ | 66,747 | $ | 38,649 | $ | 21,817 | |||||
At September 28, 2018, the amount of compensation cost relating to non-vested awards not yet recognized in the financial statements is approximately $93.3 million. The majority of these unrecognized compensation costs will be recognized by the first quarter of fiscal 2020. The weighted average remaining contractual term of options currently exercisable is 4.3 years.
Stock Options
The following table summarizes the stock option activity for the years ended September 28, 2018, September 29, 2017 and September 30, 2016:
Number of Stock Options | Weighted Average Exercise Price | |||||
Outstanding at October 2, 2015 | 4,072,707 | $ | 46.06 | |||
Granted | 460,770 | $ | 42.17 | |||
Exercised | (412,416 | ) | $ | 40.88 | ||
Cancelled or expired | (543,549 | ) | $ | 49.13 | ||
Outstanding at September 30, 2016 | 3,577,512 | $ | 45.69 | |||
Granted | — | $ | — | |||
Exercised | (906,648 | ) | $ | 43.79 | ||
Cancelled or expired | (154,039 | ) | $ | 48.79 | ||
Outstanding at September 29, 2017 | 2,516,825 | $ | 46.19 | |||
Granted | — | $ | — | |||
Exercised | (636,019 | ) | $ | 46.93 | ||
Cancelled or expired | (114,047 | ) | $ | 52.26 | ||
Outstanding at September 28, 2018 | 1,766,759 | $ | 45.53 | |||
Cash received from the exercise of stock options, net of tax remitted, during the year ended September 28, 2018 was $29.8 million.
Stock options outstanding at September 28, 2018 consisted entirely of non-qualified stock options. The following table presents the total intrinsic value of stock options exercised for the fiscal years ended September 28, 2018, September 29, 2017 and September 30, 2016 (in thousands):
For the Years Ended | ||||
September 28, 2018 | September 29, 2017 | September 30, 2016 | ||
$13,931 | $14,713 | $4,149 | ||
The total intrinsic value of stock options exercisable at September 28, 2018 was approximately $47.6 million. The following table presents certain other information regarding our 1999 SIP and 1999 OSDP for the fiscal years ended September 28, 2018,
F - 16
JACOBS ENGINEERING GROUP INC. AND SUBSIDIARIES
NOTES TO CONSOLIDATED FINANCIAL STATEMENTS - (Continued)
September 29, 2017 and September 30, 2016:
September 28, 2018 | September 29, 2017 | September 30, 2016 | |||||||||
At fiscal year end: | |||||||||||
Range of exercise prices for options outstanding | $32.51–$60.43 | $32.51–$80.63 | $32.51–$80.63 | ||||||||
Number of options exercisable | 1,557,900 | 1,992,022 | 2,581,421 | ||||||||
For the fiscal year: | |||||||||||
Range of prices relating to options exercised | $35.93–$61.26 | $37.03–$55.53 | $36.88–$55.00 | ||||||||
Estimated weighted average fair values of options granted | $ | — | $ | — | $ | 12.80 | |||||
The following table presents certain information regarding stock options outstanding and stock options exercisable at September 28, 2018:
September 28, 2018 | |||||||||||||||
Options Outstanding | Options Exercisable | ||||||||||||||
Range of Exercise Prices | Number | Weighted Average Remaining Contractual Life (years) | Weighted Average Price | Number | Weighted Average Exercise Price | ||||||||||
$32.51 - $37.03 | 153,000 | 3.49 | $ | 37.01 | 153,000 | $ | 37.01 | ||||||||
$37.43 - $46.09 | 1,059,647 | 4.87 | $ | 42.69 | 850,788 | $ | 42.74 | ||||||||
$47.11 - $55.13 | 513,237 | 4.48 | $ | 52.74 | 513,237 | $ | 52.74 | ||||||||
$60.08 - $80.63 | 40,875 | 5.25 | $ | 60.33 | 40,875 | $ | 60.33 | ||||||||
1,766,759 | 4.65 | $ | 45.53 | 1,557,900 | $ | 45.93 | |||||||||
The 1999 ODSP and the 1999 SIP allow participants to satisfy the exercise price of stock options by tendering shares of Jacobs common stock that have been owned by the participants for at least six months. Shares so tendered are retired and canceled, and are shown as repurchases of common stock in the accompanying Consolidated Statements of Stockholders’ Equity. The weighted average remaining contractual term of options currently exercisable is 4.30 years.
Restricted Stock
The following table presents the number of shares of restricted stock and restricted stock units issued as common stock under the 1999 SIP for the years ended September 28, 2018, September 29, 2017 and September 30, 2016:
For the Years Ended | ||||||||
September 28, 2018 | September 29, 2017 | September 30, 2016 | ||||||
Restricted stock | — | — | 597,091 | |||||
Restricted stock units (service condition) | 1,087,724 | 496,951 | 183,131 | |||||
Restricted stock units (service, market and performance conditions) | 254,784 | 237,058 | 372,794 | |||||
The amount of restricted stock units issued for awards with performance and market conditions in the above table are issued based on performance against the target amount. The number of shares ultimately issued, which could be greater or less than target, will be based on achieving specific performance conditions related to the awards.
The share amounts in the above tables reflect the Fungible share on a 1.92-to-1.00 basis of restricted stock and restricted stock unit issued.
The following table presents the number and weighted average grant-date fair value of restricted stock and restricted stock units at September 28, 2018:
F - 17
JACOBS ENGINEERING GROUP INC. AND SUBSIDIARIES
NOTES TO CONSOLIDATED FINANCIAL STATEMENTS - (Continued)
Number of unvested Restricted Stock and Restricted Stock Units: | Number of Shares | Weighted Average Grant-Date Fair Value | ||||
Outstanding at September 29, 2017 | 2,514,387 | $ | 49.62 | |||
Granted | 1,364,128 | $ | 65.64 | |||
Vested | (1,209,322 | ) | $ | 55.19 | ||
Cancelled | (339,658 | ) | $ | 49.57 | ||
Outstanding at September 28, 2018 | 2,329,535 | $ | 56.11 | |||
The following table presents the number of shares of restricted stock and restricted stock units canceled and withheld for taxes under the 1999 SIP for the years ended September 28, 2018, September 29, 2017 and September 30, 2016:
For the Years Ended | ||||||||
September 28, 2018 | September 29, 2017 | September 30, 2016 | ||||||
Restricted stock | 284,254 | 365,481 | 512,903 | |||||
Restricted stock units (service condition) | 336,516 | 128,536 | 177,640 | |||||
Restricted stock units (service, market and performance conditions) | 95,063 | 86,742 | 275,933 | |||||
The amount of unvested restricted stock units canceled for awards with service and performance conditions in the above table is based on the service period achieved and performance against the target amount.
The share amounts in the above tables reflect the Fungible share on a 1.92-to-1.00 basis of restricted stock and restricted stock unit issued.
The restrictions attached to restricted stock and restricted stock units generally relate to the recipient’s ability to sell or otherwise transfer the stock or stock units. There are also restrictions that subject the stock and stock units to forfeiture back to the Company until earned by the recipient through continued employment or service.
The following table provides the number of shares of restricted stock and restricted stock units outstanding at September 28, 2018 under the 1999 SIP. Shares granted in the table below are granted on a 1.92-to-1.00 basis (fungible):
September 28, 2018 | ||
Total | ||
Restricted stock | 337,805 | |
Restricted stock units (service condition) | 1,131,200 | |
Restricted stock units (service, market and performance conditions) | 735,438 | |
The following table presents the number of shares of restricted stock and restricted stock units issued under the 1999 ODSP for the years ended September 28, 2018, September 29, 2017 and September 30, 2016:
For the Years Ended | ||||||||
September 28, 2018 | September 29, 2017 | September 30, 2016 | ||||||
Restricted stock units (service condition) | 21,620 | 21,123 | 23,090 | |||||
The following table provides the number of shares of restricted stock and restricted stock units outstanding at September 28, 2018 under the 1999 ODSP:
September 28, 2018 | ||
Restricted stock | 34,000 | |
Restricted stock units (service condition) | 91,092 | |
F - 18
JACOBS ENGINEERING GROUP INC. AND SUBSIDIARIES
NOTES TO CONSOLIDATED FINANCIAL STATEMENTS - (Continued)
All shares granted under the 1999 ODSP are issued on a 1.92-to-1 basis.
Modification
On January 18, 2017, the Company modified time vested outstanding restricted stock units, paid out in stock and cash, specifically to allow participants to be entitled to dividend equivalents during the vesting period on the outstanding RSUs. Dividends will be paid out at the end of the vesting period and are forfeitable before the vesting period concludes. This modification affected 786 employees and resulted in $1.1 million of incremental compensation cost and will be recognized over the remaining vesting period for each grant, since dividends are forfeitable until vesting is achieved.
4. | Earnings Per Share and Certain Related Information |
Basic and Diluted Earnings Per Share
Basic and diluted earnings per share (“EPS”) are computed using the two-class method, which is an earnings allocation method that determines EPS for common shares and participating securities. The undistributed earnings are allocated between common shares and participating securities as if all earnings had been distributed during the period. Participating securities and common shares have equal rights to undistributed earnings. Net earnings used for the purpose of determining basic and diluted EPS is determined by taking net earnings, less earnings available to participating securities.
The following table reconciles the denominator used to compute basic EPS to the denominator used to compute diluted EPS for the years ended September 28, 2018, September 29, 2017 and September 30, 2016 (in thousands):
For the Years Ended | |||||||||||
September 28, 2018 | September 29, 2017 | September 30, 2016 | |||||||||
Numerator for Basic and Diluted EPS: | |||||||||||
Net income | $ | 163,431 | $ | 293,727 | $ | 210,463 | |||||
Net income allocated to participating securities | (788 | ) | (3,077 | ) | — | ||||||
Net income allocated to common stock for EPS calculation | $ | 162,643 | $ | 290,650 | $ | 210,463 | |||||
Denominator for Basic and Diluted EPS: | |||||||||||
Weighted average basic shares | 138,182 | 120,689 | 120,133 | ||||||||
Shares allocated to participating securities | (646 | ) | (1,319 | ) | — | ||||||
Shares used for calculating basic EPS attributable to common stock | 137,536 | 119,370 | 120,133 | ||||||||
Effect of dilutive securities: | |||||||||||
Stock compensation plans | 1,176 | 777 | 1,350 | ||||||||
Shares used for calculating diluted EPS attributable to common stock | 138,712 | 120,147 | 121,483 | ||||||||
Basic EPS | $ | 1.18 | $ | 2.43 | $ | 1.75 | |||||
Diluted EPS | $ | 1.17 | $ | 2.42 | $ | 1.73 | |||||
F - 19
JACOBS ENGINEERING GROUP INC. AND SUBSIDIARIES
NOTES TO CONSOLIDATED FINANCIAL STATEMENTS - (Continued)
Share Repurchases
On July 23, 2015, the Company’s Board of Directors authorized a share repurchase program of up to $500 million of the Company’s common stock, to expire on July 31, 2018. On July 19, 2018, the Company's Board of Directors authorized the continuation of this share repurchase program for an additional three years, to expire on July 31, 2021.
The following table summarizes the activity under this program during fiscal 2018:
Average Price Per Share (1) | Shares Repurchased | Total Shares Retired | ||||
$500,000,000 | $60.77 | 49,074 | 49,074 | |||
(1)Includes commissions paid and calculated at the average price per share since the repurchase program authorization date.
Share repurchases may be executed through various means including, without limitation, open market transactions, privately negotiated transactions or otherwise. The share repurchase program does not obligate the Company to purchase any shares. The authorization for the share repurchase program may be terminated, increased or decreased by the Company’s Board of Directors in its discretion at any time. The timing of share repurchases may depend upon market conditions, other uses of capital, and other factors.
Common and Preferred Stock
Jacobs is authorized to issue two classes of capital stock designated “common stock” and “preferred stock” (each has a par value of $1.00 per share). The preferred stock may be issued in one or more series. The number of shares to be included in a series as well as each series’ designation, relative powers, dividend and other preferences, rights and qualifications, redemption provisions and restrictions are to be fixed by the Company’s Board of Directors at the time each series is issued. Except as may be provided by the Company’s Board of Directors in a preferred stock designation, or otherwise provided for by statute, the holders of shares of common stock have the exclusive right to vote for the election of directors and on all other matters requiring stockholder action. The holders of shares of common stock are entitled to dividends if and when declared by the Company’s Board of Directors from whatever assets are legally available for that purpose.
Dividend Program
In the fourth fiscal quarter of 2017, the Company declared a dividend of $0.15 per share of the Company’s common stock that was paid in the first fiscal quarter of 2018. In the second, third and fourth fiscal quarters of 2018, the Company declared and paid a dividend of $0.15 per share of the Company’s common stock, for a total of $0.60 per share paid during the year ended September 28, 2018. On September 11, 2018, the Company's Board of Directors declared a dividend of $0.15 per share of the Company's common stock that was paid on October 26, 2018 to shareholders of record on the close of business on September 28, 2018. Future dividend declarations are subject to review and approval by the Company’s Board of Directors.
5. | Business Combinations |
On December 15, 2017, the Company completed the acquisition of CH2M HILL Companies, Ltd. (CH2M), an international provider of engineering, construction and technical services, by acquiring 100% of the outstanding shares of CH2M common stock and preferred stock. The purpose of the acquisition was to further diversify the Company’s presence in the water, nuclear and environmental remediation sectors and to further the Company’s profitable growth strategy. The Company paid total consideration of approximately $1.8 billion in cash (excluding $315.2 million of cash acquired) and issued approximately $1.4 billion of Jacobs’ common stock, or 20.7 million shares, to the former stockholders and certain equity award holders of CH2M. In connection with the acquisition, the Company also assumed CH2M’s revolving credit facility and second lien notes, including a $20.0 million prepayment penalty, which totaled approximately $700 million of long-term debt. Immediately following the effective time of the acquisition, the Company repaid CH2M’s revolving credit facility and second lien notes including the related prepayment penalty.
The following summarizes the estimated fair values of CH2M assets acquired and liabilities assumed as of the acquisition date (in millions):
F - 20
JACOBS ENGINEERING GROUP INC. AND SUBSIDIARIES
NOTES TO CONSOLIDATED FINANCIAL STATEMENTS - (Continued)
Assets | |||
Cash and cash equivalents | $ | 315.2 | |
Receivables | 1,124.6 | ||
Prepaid expenses and other | 72.7 | ||
Property, equipment and improvements, net | 175.1 | ||
Goodwill | 3,129.1 | ||
Identifiable intangible assets: | |||
Customer relationships, contracts and backlog | 412.3 | ||
Lease intangible assets | 4.4 | ||
Total identifiable intangible assets | 416.7 | ||
Miscellaneous | 522.9 | ||
Total Assets | $ | 5,756.3 | |
Liabilities | |||
Notes payable | $ | 2.2 | |
Accounts payable | 309.6 | ||
Accrued liabilities | 753.1 | ||
Billings in excess of costs | 260.8 | ||
Identifiable intangible liabilities: | |||
Lease intangible liabilities | 9.6 | ||
Long-term debt | 706.0 | ||
Other deferred liabilities | 653.0 | ||
Total Liabilities | 2,694.3 | ||
Noncontrolling interests | (37.3 | ) | |
Net assets acquired | $ | 3,024.7 | |
The purchase price allocation is based upon preliminary information and is subject to change when additional information is obtained. Goodwill recognized results from a substantial assembled workforce, which does not qualify for separate recognition, as well as expected future synergies from combining operations. None of the goodwill recognized is expected to be deductible for tax purposes. The Company has not completed its final assessment of the fair values of purchased receivables, intangible assets, tax balances, contingent liabilities or acquired contracts. The final purchase price allocation will result in adjustments to certain assets and liabilities, including the residual amount allocated to goodwill. Accrued liabilities and other deferred liabilities include approximately $385.3 million related to provisional estimates related to various legal and other pre-acquisition contingent liabilities accounted for under ASC 450. See Note 15- Contractual Guarantees, Litigation, Investigations and Insurance relating to CH2M contingencies.
Since the initial preliminary estimates reported in the first quarter of 2018, the Company has updated certain provisional amounts reflected in the preliminary purchase price allocation, as summarized in the estimated fair values of CH2M assets acquired and liabilities assumed above. Specifically, the carrying amount of the intangible assets discussed above were decreased by $186.2 million as a result of valuation adjustments. Additionally, the carrying amount of property, equipment and improvements, net decreased by $50.5 million to reflect its estimated fair value, receivables decreased $77.3 million and accrued liabilities and other deferred liabilities increased $364.4 million primarily related to provisional estimates related to various legal and other pre-acquisition contingent liabilities. Further, miscellaneous long-term assets increased $245.5 million largely due to the deferred tax impact of these valuation adjustments. As a result of these adjustments to the initial preliminary purchase price allocation, goodwill has increased $430.3 million. Measurement period adjustments are recognized in the reporting period in which the adjustments are determined and calculated as if the accounting had been completed at the acquisition date.
Customer relationships, contracts and backlog represent the fair value of existing contracts, the underlying customer relationships and backlog of consolidated subsidiaries and have lives ranging from 9 to 11 years (weighted average life of approximately 10 years). Other intangible assets and liabilities primarily consist of the fair value of office leases and have a weighted average life of approximately 10 years.
F - 21
JACOBS ENGINEERING GROUP INC. AND SUBSIDIARIES
NOTES TO CONSOLIDATED FINANCIAL STATEMENTS - (Continued)
Estimated fair value measurements relating to the CH2M acquisition are made using Level 3 inputs including discounted cash flow techniques. Fair value is estimated using inputs primarily from the income approach, which include the use of both the multiple period excess earnings method and the relief from royalties method. The significant assumptions used in estimating fair value include (i) the estimated life the asset will contribute to cash flows, such as attrition rate of customers or remaining contractual terms, (ii) profitability and (iii) the estimated discount rate that reflect the level of risk associated with receiving future cash flows. The estimated fair value of land has been determined using the market approach, which arrives at an indication of value by comparing the site being valued to sites that have been recently acquired in arm’s-length transactions. Personal property assets with an active and identifiable secondary market are valued using the market approach. Buildings and land improvements are valued using the cost approach using a direct cost model built on estimates of replacement cost. Other personal property assets such as furniture, fixtures and equipment are valued using the cost approach which is based on replacement or reproduction costs of the asset less depreciation.
From the acquisition date of December 15, 2017 through the end of September 28, 2018, CH2M contributed approximately $3.8 billion in revenue and $185.9 million in pretax income included in the accompanying consolidated statement of earnings. Included in these results were approximately $99.3 million in pre-tax restructuring and transaction costs.
Transaction costs associated with the CH2M acquisition in the accompanying consolidated statements of earnings for the years ended September 28, 2018 and September 29, 2017 are comprised of the following (in millions):
For the Years Ended | |||||||
September 28, 2018 | September 29, 2017 | ||||||
Personnel costs | $ | 50.2 | $ | 2.2 | |||
Professional services and other expenses | 27.5 | 14.9 | |||||
Total | $ | 77.7 | $ | 17.1 | |||
Personnel costs above include change of control payments and related severance costs.
The following presents summarized unaudited pro forma operating results assuming that the Company had acquired CH2M at October 1, 2016. These pro forma operating results are presented for illustrative purposes only and are not indicative of the operating results that would have been achieved had the related events occurred (in millions):
For the Years Ended | |||||||
September 28, 2018 | September 29, 2017 | ||||||
Revenues | $ | 16,012.4 | $ | 14,612.4 | |||
Net earnings | $ | 196.3 | $ | 264.8 | |||
Net earnings (loss) attributable to Jacobs | $ | 184.5 | $ | 243.6 | |||
Net earnings (loss) attributable to Jacobs per share: | |||||||
Basic earnings (loss) per share | $ | 1.28 | $ | 1.73 | |||
Diluted earnings (loss) per share | $ | 1.27 | $ | 1.72 | |||
Included in the unaudited pro forma operating results are charges relating to transaction expenses, severance expense and other items that are removed from the year ended September 28, 2018 and are reflected in the year ended September 29, 2017 due to the assumed timing of the transaction. Also, income tax expense (benefit) for the twelve month pro forma periods ended September 28, 2018 and September 29, 2017 was $409.7 million and $24.2 million, respectively.
In fiscal 2017, the Company recorded $119.3 million of goodwill in conjunction with the acquisitions of Aquenta Consulting Pty Ltd. and Blue Canopy LLC. The Company has completed its final assessment of the fair values of purchased assets and liabilities of the related companies acquired.
F - 22
JACOBS ENGINEERING GROUP INC. AND SUBSIDIARIES
NOTES TO CONSOLIDATED FINANCIAL STATEMENTS - (Continued)
6. | Goodwill and Intangibles |
As a result of the segment realignment this year, see Note 17- Segment Information, the historical carrying value of goodwill has been allocated to the three remaining reportable segments to present balances on a comparable basis. The roll-forward of goodwill by LOB appearing in the accompanying Consolidated Balance Sheets for the year ended September 28, 2018 was as follows (in millions):
Aerospace, Technology, Environmental and Nuclear | Buildings, Infrastructure and Advanced Facilities | Energy, Chemicals and Resources | Total | ||||||||||||
Balance September 29, 2017 | $ | 1,038 | $ | 1,049 | $ | 923 | $ | 3,010 | |||||||
Acquired | 1,147 | 1,585 | 397 | 3,129 | |||||||||||
Post-Acquisition Adjustments relating to prior year acquisition | 4 | — | — | 4 | |||||||||||
Foreign Exchange Impact | (13 | ) | (14 | ) | (12 | ) | (39 | ) | |||||||
Balance September 28, 2018 | $ | 2,176 | $ | 2,620 | $ | 1,308 | $ | 6,104 | |||||||
During the preparation of our Quarterly Report on Form 10-Q for the first fiscal quarter of 2017, the Company determined that its prior financial statements contained immaterial misstatements related to incorrect translation of the Company’s non-U.S. goodwill balances from local currency to the U.S. Dollar reporting currency. It was determined that the Company had incorrectly used historical translation rates for the U.S. Dollar in place at the time of the Company’s recording of its foreign goodwill balances rather than using current translation rates at each balance sheet date in accordance with U.S. GAAP. The error dated back to the time of our initial reporting of non-U.S. goodwill balances in the late 1990s and affected our historical quarterly and annual reporting periods through the first fiscal quarter of 2017. As a result, goodwill and accumulated other comprehensive income in the Company’s September 30, 2016 consolidated balance sheet (which have not been adjusted) were each overstated by $209.9 million and were corrected in the first fiscal quarter of 2017 foreign currency translation adjustment. Consequently, the correction was a direct component of the overall translation adjustment amount of $140.5 million that was reported for fiscal 2017. These adjustments had no impact on the Company’s Consolidated Statements of Earnings or Cash Flows. Also, other comprehensive income for the year ended September 30, 2016 was overstated by $33.8 million as a result of these misstatements.
The following table provides a roll-forward of the Company’s acquired intangibles in the accompanying Consolidated Balance Sheets for the years ended September 28, 2018 and September 29, 2017 (in thousands):
Customer Relationships, Contracts and Backlog | Developed Technology | Trade Names | Patents | Lease Intangible Assets | Other | Total | ||||||||||||||
Balances, September 30, 2016 | 307,637 | 14,311 | 4,786 | 10,027 | — | 161 | 336,922 | |||||||||||||
Acquisitions | 29,803 | 1,685 | 4,417 | — | — | 35,905 | ||||||||||||||
Amortization | (39,679 | ) | (1,534 | ) | (2,549 | ) | (400 | ) | (50 | ) | (44,212 | ) | ||||||||
Foreign currency translation | 3,707 | — | 45 | 553 | — | 4,305 | ||||||||||||||
Balances, September 29, 2017 | 301,468 | 14,462 | 6,699 | 10,180 | — | 111 | 332,920 | |||||||||||||
Acquisitions | 412,300 | 237 | — | — | 4,415 | — | 416,952 | |||||||||||||
Post-Acquisition Adjustments relating to prior year acquisition | 200 | (1,921 | ) | (1,700 | ) | — | — | — | (3,421 | ) | ||||||||||
Amortization | (75,375 | ) | (1,533 | ) | (2,738 | ) | (410 | ) | (625 | ) | (50 | ) | (80,731 | ) | ||||||
Foreign currency translation | (9,150 | ) | — | (159 | ) | (454 | ) | — | — | (9,763 | ) | |||||||||
Balances, September 28, 2018 | 629,443 | 11,245 | 2,102 | 9,316 | 3,790 | 61 | 655,957 | |||||||||||||
Weighted Average Amortization Period (years) | 9 | 8 | 8 | 24 | 8 | 2 | 9 | |||||||||||||
In addition, we acquired $9.6 million in lease intangible liabilities in connection with the CH2M acquisition, of which $8.7 million remain unamortized at September 28, 2018.
The weighted average amortization period includes the effects of foreign currency translation.
F - 23
JACOBS ENGINEERING GROUP INC. AND SUBSIDIARIES
NOTES TO CONSOLIDATED FINANCIAL STATEMENTS - (Continued)
The following table presents estimated amortization expense of intangible assets for fiscal 2019 and for the succeeding years. The amounts below include preliminary amortization estimates for the CH2M opening balance sheet fair values that are still preliminary and are subject to change.
Fiscal Year | (in millions) | ||
2019 | $ | 86.1 | |
2020 | 83.0 | ||
2021 | 79.4 | ||
2022 | 78.2 | ||
2023 | 77.6 | ||
Thereafter | 242.9 | ||
Total | $ | 647.2 | |
7. | Joint Ventures and VIEs |
For consolidated joint ventures, the entire amount of the services performed and the costs associated with these services, including the services provided by the other joint venture partners, are included in the Company's result of operations. Likewise, the entire amount of each of the assets and liabilities are included in the Company’s consolidated balance sheet. For the consolidated VIEs, the carrying value of assets and liabilities was $199.9 million and $125.6 million, respectively, as of September 28, 2018 and $9.6 million and $8.3 million, respectively as of September 29, 2017. There are no consolidated VIEs that have debt or credit facilities.
Unconsolidated joint ventures are accounted for under the equity method or proportionate consolidation. Proportionate consolidation is used for joint ventures that include unincorporated legal entities and activities of the joint venture are construction-related. For those joint ventures accounted for under proportionate consolidation, only the Company’s pro rata share of assets, liabilities, revenue, and costs are included in the Company’s balance sheet and results of operations. For the proportionate consolidated VIEs, the carrying value of assets and liabilities was $88.6 million and $79.3 million as of September 28, 2018, respectively and $50.3 million and $44.1 million as of September 29, 2017, respectively. For those joint ventures accounted for under the equity method, the Company's investment balances for the joint venture is included in Other Noncurrent Assets: Miscellaneous on the balance sheet and the Company’s pro rata share of net income is included in revenue. In limited cases, there are basis differences between the equity in the joint venture and Jacobs' investment created when Jacobs purchased their share of the joint venture. These basis differences are amortized based on an internal allocation to underlying net assets. As of September 28, 2018, the Company’s equity method investments exceeded its share of venture net assets by $82.8 million. Our investments in equity method joint ventures on the Consolidated Balance Sheets as of September 28, 2018 and September 29, 2017 was a net asset of $219.1 million and $131.4 million, respectively. During the years ended September 28, 2018, September 29, 2017, and September 30, 2016, we recognized income from equity method joint ventures of $55.4 million, $44.7 million, and $51.1 million, respectively.
Summary of financial information of the unconsolidated joint ventures accounted for under the equity method, as derived from their unaudited financial statements, is as follows (in millions):
For the Years Ended | |||||||
September 28, 2018 | September 29, 2017 | ||||||
Current assets | $ | 1,736.0 | $ | 1,385.7 | |||
Non-Current assets | 51.5 | 55.9 | |||||
Total assets | $ | 1,787.5 | $ | 1,441.6 | |||
Current liabilities | $ | 944.9 | $ | 415.8 | |||
Non-current liabilities | 664.1 | 845 | |||||
Total liabilities | 1,609 | 1,260.8 | |||||
Joint ventures' equity | 178.5 | 180.8 | |||||
Total liabilities & joint venture equity | $ | 1,787.5 | $ | 1,441.6 | |||
F - 24
JACOBS ENGINEERING GROUP INC. AND SUBSIDIARIES
NOTES TO CONSOLIDATED FINANCIAL STATEMENTS - (Continued)
For the Years Ended | |||||||||||
September 28, 2018 | September 29, 2017 | September 30, 2016 | |||||||||
Revenue | $ | 3,334.5 | $ | 2,015.6 | $ | 2,199.1 | |||||
Cost of revenue | 3,034.1 | 1,829.5 | 1,998.0 | ||||||||
Gross profit | $ | 300.4 | $ | 186.1 | $ | 201.1 | |||||
Net income | $ | 233.2 | $ | 140 | $ | 136.5 | |||||
Accounts receivable from unconsolidated joint ventures accounted for under the equity method is $13.0 million and $6.3 million as of September 28, 2018 and September 29, 2017, respectively.
In September 2018, the Company sold its 45% share of its equity method investment in the Guimar joint venture in Brazil. The interest was sold to the other partners in the venture. The Company recorded a $21.0 million loss, of which $9.0 million related to the reclassification of foreign currency translation losses accumulated in other comprehensive income.
8. Restructuring and Other Charges
During the fourth fiscal quarter of 2017, the Company implemented certain restructuring and pre-integration plans associated with the pending acquisition of CH2M, which closed on December 15, 2017. The restructuring activities and related costs under these plans were comprised mainly of severance and lease abandonment programs, while the pre-integration activities and costs were mainly related to the engagement of consulting services and internal personnel and other related costs dedicated to the Company’s integration management efforts.
Following the closing of the CH2M acquisition, these activities have continued into fiscal 2018 and include restructuring activities amounting to approximately $101.7 million in pre-tax charges during the year ended September 28, 2018. Combined with $89.2 million in integration activities for the same period, the total cost of these restructuring and integration activities approximated $190.8 million for the year ended September 28, 2018. These activities are expected to continue through fiscal 2019. These activities are not expected to involve the exit of any service types or client end-markets. Also during fiscal 2018 the Company disposed of its investment in Guimar in order to resolve potential conflicts arising from the CH2M acquisition, which resulted in a loss as discussed below.
During the second fiscal quarter of 2017, the Company entered into strategic business restructuring activities associated with realignment of its Europe, United Kingdom ("U.K.") and Middle East regional operations in our BIAF segment. Pre-tax net charges of $22.6 million were recorded associated mainly with net realizable value write-offs on contract accounts receivable of $16.5 million, with additional charges recorded for statutory redundancy and severance costs of $1.4 million and other liabilities of $4.7 million.
During the second fiscal quarter of 2015, the Company began implementing a series of initiatives intended to improve operational efficiency, reduce costs, and better position itself to drive growth of the business in the future. We refer to these initiatives, in the aggregate, as the “2015 Restructuring”. These activities evolved and developed over time as management identified and evaluated opportunities for changes in the Company’s operations (and related areas of potential cost savings), as economic conditions changed and as the realignment of the Company’s operations into its four global LOBs was implemented. Actions related to the 2015 Restructuring included involuntary terminations, the abandonment of certain leased offices, combining operational organizations, and the colocation of employees into other existing offices. These activities did not involve the exit of any service types or client end-markets. The 2015 Restructuring was completed in fiscal 2017, although cash payments continue to be made under the related accruals recorded in connection with these activities.
Collectively, the above mentioned restructuring activities are referred to as “Restructuring and other charges.”
The following table summarizes the impacts of the Restructuring and other charges (or recoveries, which primarily relate to the reversals of lease abandonment accruals related to previously vacated facilities which are now planned to be utilized) by line of business in connection with the CH2M acquisition for the year ended September 28, 2018 and the 2015 Restructuring and realignment of the Company's Europe, U.K. and Middle East regional operations for the year ended September 29, 2017 (in thousands):
F - 25
JACOBS ENGINEERING GROUP INC. AND SUBSIDIARIES
NOTES TO CONSOLIDATED FINANCIAL STATEMENTS - (Continued)
September 28, 2018 | September 29, 2017 | September 30, 2016 | |||||||||
Aerospace, Technology, Environmental and Nuclear | $ | 20,254 | $ | 2,356 | 8,210 | ||||||
Buildings, Infrastructure and Advanced Facilities | 56,238 | 47,743 | 24,566 | ||||||||
Energy, Chemicals and Resources | 37,166 | 42,558 | 113,315 | ||||||||
Corporate | 77,148 | 42,781 | 41,816 | ||||||||
Total | $ | 190,806 | $ | 135,438 | $ | 187,907 | |||||
Restructuring and other charges are primarily reflected in Selling, general and administrative expenses in the accompanying Consolidated Statement of Earnings.
The activity in the Company’s accrual for the Restructuring and other charges for the year ended September 28, 2018 is as follows (in thousands):
Balance at Balance at September 29, 2017 | $ | 142,767 | |
CH2M Acquisition Assumed Liabilities | 31,576 | ||
CH2M Charges | 190,806 | ||
Payments & Usage | (189,673 | ) | |
Balance at September 28, 2018 | $ | 175,476 | |
The following table summarizes the Restructuring and other charges by major type of costs in connection with the CH2M acquisition for the years ended September 28, 2018, and the 2015 Restructuring and realignment of the Company's Europe, U.K. and Middle East regional operations for the years ended September 29, 2017 and September 30, 2016 (in thousands):
September 28, 2018 | September 29, 2017 | September 30, 2016 | |||||||||
Lease Abandonments | $ | 53,914 | $ | 55,647 | $ | 92,643 | |||||
Involuntary Terminations | 37,063 | 43,667 | 85,599 | ||||||||
Outside Services | 36,308 | 4,236 | 7,398 | ||||||||
Other (1) | 63,521 | 31,888 | 2,267 | ||||||||
Total | $ | 190,806 | $ | 135,438 | $ | 187,907 | |||||
(1) Includes $21.0 million in the fourth quarter of fiscal 2018 relating to the loss on the sale of our Guimar joint venture investment recognized in other income (expense).
Cumulative amounts incurred to date for Restructuring and other charges by each major type of cost as of September 28, 2018 are as follows (in thousands):
Lease Abandonments | $ | 292,773 | |
Involuntary Terminations | 221,642 | ||
Outside Services | 60,677 | ||
Other | 96,252 | ||
Total | $ | 671,344 | |
9. Borrowings
Short-Term Credit Arrangements
The Company maintains uncommitted credit arrangements with several banks providingshort-term borrowing capacity and overdraft protection. There were borrowings of $5.0 million outstanding under these short-term credit facilities at a weighted average interest rate of 4.47% at September 28, 2018. There were borrowings of $3.1 million outstanding under these short-term credit facilities at September 29, 2017.
Long-term Debt
F - 26
JACOBS ENGINEERING GROUP INC. AND SUBSIDIARIES
NOTES TO CONSOLIDATED FINANCIAL STATEMENTS - (Continued)
The following table presents certain information regarding the Company’s long-term debt at September 28, 2018 and September 29, 2017 (dollars in thousands):
Interest Rate | Maturity | September 28, 2018 | September 29, 2017 | ||||||||
Revolving Credit Facility | LIBOR + applicable margin (1) | February 2020 | $ | 149,129 | $ | 235,000 | |||||
Term Loan Facility | LIBOR + applicable margin (2) | December 2020 | 1,500,000 | — | |||||||
Fixed-rate notes due: | |||||||||||
Senior Notes, Series A | 4.27% | May 2025 | 190,000 | — | |||||||
Senior Notes, Series B | 4.42% | May 2028 | 180,000 | — | |||||||
Senior Notes, Series C | 4.52% | May 2030 | 130,000 | — | |||||||
Less: Deferred Financing Fees | (4,998 | ) | — | ||||||||
Other | Varies | Varies | 2,746 | — | |||||||
Total Long-term debt, net | $ | 2,146,877 | $ | 235,000 | |||||||
(1) | Depending on the Company’s Consolidated Leverage Ratio (as defined in the credit agreement governing the Revolving Credit Facility), borrowings under the Revolving Credit Facility bear interest at either a eurocurrency rate plus a margin of between 1.0% and 1.5% or a base rate plus a margin of between 0% and 0.5%. The applicable LIBOR rates at September 28, 2018 and September 29, 2017 were approximately 1.38% to 3.47% and 1.0% to 2.23%, respectively. |
(2) | Depending on the Company’s Consolidated Leverage Ratio (as defined in the credit agreement governing the Term Loan Facility), borrowings under the Term Loan Facility bear interest at either a eurocurrency rate plus a margin of between 1.0% and 1.5% or a base rate plus a margin of between 0% and 0.5%. The applicable LIBOR rate at September 28, 2018 was approximately 3.71%. |
On February 7, 2014, Jacobs and certain of its subsidiaries entered into a $1.6 billion long-term unsecured, revolving credit facility (as amended, the “Revolving Credit Facility”) with a syndicate of large U.S. and international banks and financial institutions. The Revolving Credit Facility provides an accordion feature that allows the Company and the lenders to increase the facility amount to $2.1 billion. On September 28, 2017, the Company entered into a Second Amendment to the Revolving Credit Facility, which provides for, among other things, an amendment to certain financial definitions used in the Revolving Credit Facility, including “Consolidated EBITDA” and increases the permitted leverage ratio on a short-term basis in relation to the acquisition of CH2M and future permitted material acquisitions. This Second Amendment was effective upon the consummation of the acquisition of CH2M in December 2017.
The Revolving Credit Facility permits the Company to borrow under two separate tranches in U.S. dollars, certain specified foreign currencies, and any other currency that may be approved in accordance with the terms of the Revolving Credit Facility. The Revolving Credit Facility also provides for a financial letter of credit sub facility of $300 million, permits performance letters of credit, and provides for a $50 million sub facility for swing line loans. Letters of credit are subject to fees based on the Company’s Consolidated Leverage Ratio at the time any such letter of credit is issued. The Company pays a facility fee of between 0.10% and 0.25% per annum depending on the Company’s Consolidated Leverage Ratio. Amounts outstanding under the Revolving Credit Facility may be prepaid at the option of the Company without premium or penalty, subject to customary breakage fees in connection with the prepayment of euro currency loans. Any prepayments made under the Revolving Credit Facility are available for re-borrowing subject to the terms and conditions therein. The Revolving Credit Facility contains affirmative, negative, and financial covenants customary for financings of this type including, among other things, limitations on certain other indebtedness, investments, liens, acquisitions, dispositions, fundamental changes and transactions with affiliates. In addition, the Revolving Credit Facility contains customary events of default. We were in compliance with the covenants under the Revolving Credit Facility at September 28, 2018.
On September 28, 2017, the Company entered into a $1.5 billion unsecured delayed-draw term loan facility (the “Term Loan Facility”) with a syndicate of financial institutions as lenders. We incurred loans under the Term Loan Facility on December 15, 2017 in connection with the closing of the CH2M acquisition in order to pay cash consideration for the acquisition, and to pay fees and expenses related to the acquisition and the Term Loan Facility. Amounts outstanding under the Term Loan Facility may be prepaid at the option of the Company without premium or penalty, subject to customary breakage fees in connection with the prepayment of eurocurrency loans. Any prepayments made under the Term Loan Facility are not available for re-borrowing. The Term Loan Facility contains affirmative, negative and financial covenants customary for financings of this type, including, among other things, limitations on certain other indebtedness, investments, liens, acquisitions, dispositions, fundamental changes and transactions with affiliates. In addition, the Term Loan Facility contains customary events of default. We were in compliance with the covenants under the Term Loan Facility at September 28, 2018.
F - 27
JACOBS ENGINEERING GROUP INC. AND SUBSIDIARIES
NOTES TO CONSOLIDATED FINANCIAL STATEMENTS - (Continued)
On March 12, 2018, Jacobs entered into a note purchase agreement (as amended, the "Note Purchase Agreement") with respect to the issuance and sale in a private placement transaction of $500 million in the aggregate principal amount of the Company’s senior notes in three series (collectively, the “Senior Notes”). The Note Purchase Agreement provides that if the Company's consolidated leverage ratio exceeds a certain amount, the interest on the Senior Notes may increase by 75 basis points. The Senior Notes may be prepaid at any time subject to a make-whole premium. The sale of the Senior Notes closed on May 15, 2018. The Company used the net proceeds from the offering of Senior Notes to repay certain existing indebtedness and for other general corporate purposes. The Note Purchase Agreement contains affirmative, negative and financial covenants customary for financings of this type, including, among other things, covenants to maintain a minimum consolidated net worth and maximum consolidated leverage ratio and limitations on certain other indebtedness, liens, mergers, dispositions and transactions with affiliates. In addition, the Note Purchase Agreement contains customary events of default. We were in compliance with the covenants under the Note Purchase Agreement at September 28, 2018.
In conjunction with the acquisition of CH2M, the Company assumed certain long-term financing that was incurred by CH2M prior to the acquisition. The total balance included in long-term debt as of September 28, 2018 was $2.7 million, which is primarily comprised of equipment financing, bearing interest rates ranging from 0.22% to 3.29% due in monthly installments through September 2021.
We believe the carrying value of the Revolving Credit Facility, the Term Loan Facility and Other debt outstanding approximates fair value based on the interest rates and scheduled maturities applicable to the outstanding borrowings. The fair value of the Senior Notes is estimated to be $491.7 million at September 28, 2018, based on Level 2 inputs. The fair value is determined by discounting future cash flows using interest rates available for issuances with similar terms and average maturities.
The Company has issued $2.5 million in letters of credit under the Revolving Credit Facility, leaving $1.4 billion of available borrowing capacity under the Revolving Credit Facility at September 28, 2018. In addition, the Company had issued $444.1 million under separate, committed and uncommitted letter-of-credit facilities for total issued letters of credit of $446.6 million at September 28, 2018.
The following table presents the amount of interest paid by the Company during September 28, 2018, September 29, 2017 and September 30, 2016 (in thousands):
For the Years Ended | ||||
September 28, 2018 | September 29, 2017 | September 30, 2016 | ||
$68,467 | $12,862 | $13,282 | ||
10. Pension and Other Postretirement Benefit Plans
Company-Only Sponsored Plans
We sponsor various defined benefit pension and other post retirement plans covering employees of certain U.S. and international subsidiaries. The pension plans provide pension benefits that are based on the employee’s compensation and years of service. Our funding policy varies by country and plan according to applicable local funding requirements and plan-specific funding agreements. In connection with the acquisition of CH2M on December 15, 2017, the Company acquired CH2M’s pension plan assets and liabilities, which are reflected in the amounts disclosed for the year ended September 28, 2018 below.
The accounting for pension and other post-retirement benefit plans requires the use of assumptions and estimates in order to calculate periodic benefit cost and the value of the plans’ assets and benefit obligations. These assumptions include discount rates, investment returns, and projected salary increases, among others. The discount rates used in valuing the plans' benefit obligations were determined with reference to high quality corporate and government bonds that are appropriately matched to the duration of each plan's obligations. The expected long-term rate of return on plan assets is generally based on using country-specific simulation models which select a single outcome for expected return based on the target asset allocation. The expected long-term rates of return used in the valuation are the annual average returns generated by these assumptions over a 20-year period for each asset class based on the expected long-term rate of return of the underlying assets.
The following table sets forth the changes in the plans’ combined net benefit obligation (segregated between plans existing within and outside the U.S.) for the years ended September 28, 2018 and September 29, 2017 (in thousands):
F - 28
JACOBS ENGINEERING GROUP INC. AND SUBSIDIARIES
NOTES TO CONSOLIDATED FINANCIAL STATEMENTS - (Continued)
U.S. Plans | Non-U.S. Plans | ||||||||||||||
September 28, 2018 | September 29, 2017 | September 28, 2018 | September 29, 2017 | ||||||||||||
Net benefit obligation at the beginning of the year | $ | 169,942 | $ | 185,664 | $ | 1,306,807 | $ | 1,363,782 | |||||||
Service cost | 4,765 | 1,000 | 8,269 | 7,509 | |||||||||||
Interest cost | 13,778 | 5,757 | 49,324 | 31,205 | |||||||||||
Participants’ contributions | 839 | — | 451 | 250 | |||||||||||
Actuarial (gains)/losses | (30,730 | ) | (9,922 | ) | (43,595 | ) | (142,273 | ) | |||||||
Benefits paid | (27,914 | ) | (14,338 | ) | (75,711 | ) | (40,208 | ) | |||||||
Curtailments/settlements/plan amendments | (9,434 | ) | — | (6,136 | ) | (1,375 | ) | ||||||||
Acquisition of CH2M Plans | 327,156 | — | 924,233 | — | |||||||||||
Effect of exchange rate changes and other, net | — | 1,781 | (14,396 | ) | 87,917 | ||||||||||
Net benefit obligation at the end of the year | $ | 448,402 | $ | 169,942 | $ | 2,149,246 | $ | 1,306,807 | |||||||
The following table sets forth the changes in the combined Fair Value of the plans’ assets (segregated between plans existing within and outside the U.S.) for the years ended September 28, 2018 and September 29, 2017 (in thousands):
U.S. Plans | Non-U.S. Plans | ||||||||||||||
September 28, 2018 | September 29, 2017 | September 28, 2018 | September 29, 2017 | ||||||||||||
Fair value of plan assets at the beginning of the year | $ | 147,788 | $ | 142,464 | $ | 1,076,928 | $ | 1,003,911 | |||||||
Actual return on plan assets | 9,891 | 18,662 | (19,883 | ) | 16,789 | ||||||||||
Employer contributions | 58,097 | 1,000 | 31,556 | 21,005 | |||||||||||
Participants’ contributions | 839 | — | 451 | 250 | |||||||||||
Gross benefits paid | (27,914 | ) | (14,338 | ) | (75,711 | ) | (40,208 | ) | |||||||
Curtailments/settlements/plan amendments | (9,434 | ) | — | (5,496 | ) | (228 | ) | ||||||||
Acquisition of CH2M Plans | 211,562 | — | 869,414 | — | |||||||||||
Effect of exchange rate changes and other, net | — | — | (9,778 | ) | 75,409 | ||||||||||
Fair value of plan assets at the end of the year | $ | 390,829 | $ | 147,788 | $ | 1,867,481 | $ | 1,076,928 | |||||||
During fiscal 2018, the Company incurred combined curtailment and settlement losses on its defined benefit plans of approximately $5.4 million primarily related to its Sverdrup and Ireland pension plans. During fiscal 2017, we curtailed the pension plan in Ireland.
The following table reconciles the combined funded statuses of the plans recognized in the accompanying Consolidated Balance Sheets at September 28, 2018 and September 29, 2017 (segregated between plans existing within and outside the U.S.) (in thousands):
U.S. Plans | Non-U.S. Plans | ||||||||||||||
September 28, 2018 | September 29, 2017 | September 28, 2018 | September 29, 2017 | ||||||||||||
Net benefit obligation at the end of the year | $ | 448,402 | $ | 169,942 | $ | 2,149,246 | $ | 1,306,807 | |||||||
Fair value of plan assets at the end of the year | 390,829 | 147,788 | 1,867,481 | 1,076,928 | |||||||||||
Under funded amount recognized at the end of the year | $ | 57,573 | $ | 22,154 | $ | 281,765 | $ | 229,879 | |||||||
The following table presents the accumulated benefit obligation at September 28, 2018 and September 29, 2017 (segregated between plans existing within and outside the U.S.) (in thousands):
F - 29
JACOBS ENGINEERING GROUP INC. AND SUBSIDIARIES
NOTES TO CONSOLIDATED FINANCIAL STATEMENTS - (Continued)
U.S. Plans | Non-U.S. Plans | ||||||||||||||
September 28, 2018 | September 29, 2017 | September 28, 2018 | September 29, 2017 | ||||||||||||
Accumulated benefit obligation at the end of the year | $ | 447,549 | $ | 169,942 | $ | 2,123,839 | $ | 1,291,600 | |||||||
The following table presents the amounts recognized in the accompanying Consolidated Balance Sheets at September 28, 2018 and September 29, 2017 (segregated between plans existing within and outside the U.S.) (in thousands):
U.S. Plans | Non-U.S. Plans | ||||||||||||||
September 28, 2018 | September 29, 2017 | September 28, 2018 | September 29, 2017 | ||||||||||||
Prepaid benefit cost included in noncurrent assets | $ | — | $ | — | $ | 19,736 | $ | 3,035 | |||||||
Accrued benefit cost included in current liabilities | 2,548 | — | 3,671 | 585 | |||||||||||
Accrued benefit cost included in noncurrent liabilities | 55,025 | 22,154 | 297,830 | 232,329 | |||||||||||
Net amount recognized at the end of the year | $ | 57,573 | $ | 22,154 | $ | 281,765 | $ | 229,879 | |||||||
The following table presents the significant actuarial assumptions used in determining the funded statuses and the following year's benefit cost of the Company’s U.S. plans for the years ended September 28, 2018, September 29, 2017 and September 30, 2016:
For the Years Ended | |||||||
September 28, 2018 | September 29, 2017 | September 30, 2016 | |||||
Discount rates | 3.9% to 4.2% | 3.5 | % | 3.2 | % | ||
Rates of compensation increases | 3.5% | — | % | — | % | ||
Return on Assets | 5.8% to 5.9% | 7.5 | % | 7.4 | % | ||
The following table presents the significant actuarial assumptions used in determining the funded statuses and the following year's benefit cost of the Company’s non-U.S. plans for the years ended September 28, 2018, September 29, 2017 and September 30, 2016:
For the Years Ended | |||||
September 28, 2018 | September 29, 2017 | September 30, 2016 | |||
Discount rates | 1.3% to 8.1% | 1.3% to 7.0% | 0.7% to 7.0% | ||
Rates of compensation increases | 2.5% to 7.5% | 2.5% to 7.5% | 2.5% to 7.5% | ||
Expected long-term rates of return on assets | 2.9% to 7.5% | 3.5% to 8.5% | 3.5% to 8.5% | ||
The following table presents certain amounts relating to our U.S. plans recognized in accumulated other comprehensive (gain) loss at September 28, 2018, September 29, 2017 and September 30, 2016 (in thousands):
September 28, 2018 | September 29, 2017 | September 30, 2016 | |||||||||
Arising during the period: | |||||||||||
Net actuarial (gain) loss | $ | (7,514 | ) | $ | (11,372 | ) | $ | 4,337 | |||
Reclassification adjustments: | |||||||||||
Net actuarial losses | (2,913 | ) | (2,431 | ) | (2,312 | ) | |||||
Total | $ | (10,427 | ) | $ | (13,803 | ) | $ | 2,025 | |||
The following table presents certain amounts relating to our non-U.S. plans recognized in accumulated other comprehensive (gain) loss at September 28, 2018, September 29, 2017 and September 30, 2016 (in thousands):
F - 30
JACOBS ENGINEERING GROUP INC. AND SUBSIDIARIES
NOTES TO CONSOLIDATED FINANCIAL STATEMENTS - (Continued)
September 28, 2018 | September 29, 2017 | September 30, 2016 | |||||||||
Arising during the period: | |||||||||||
Net actuarial (gain) loss | $ | 59,827 | $ | (76,860 | ) | $ | 102,925 | ||||
Prior service cost (benefit) | 215 | 119 | 580 | ||||||||
Total | 60,042 | (76,741 | ) | 103,505 | |||||||
Reclassification adjustments: | |||||||||||
Net actuarial losses | (5,507 | ) | (8,732 | ) | (7,508 | ) | |||||
Prior service cost | 181 | 229 | 163 | ||||||||
Total | (5,326 | ) | (8,503 | ) | (7,345 | ) | |||||
Total | $ | 54,716 | $ | (85,244 | ) | $ | 96,160 | ||||
The following table presents certain amounts relating to our plans recorded in accumulated other comprehensive loss that have not yet been recognized as components of net periodic benefit cost at September 28, 2018 and September 29, 2017 (segregated between U.S. and non-U.S. plans) (in thousands):
U.S. Plans | Non-U.S. Plans | ||||||||||||||
September 28, 2018 | September 29, 2017 | September 28, 2018 | September 29, 2017 | ||||||||||||
Net actuarial loss | $ | 37,255 | $ | 47,681 | $ | 273,312 | $ | 218,752 | |||||||
Prior service cost | — | — | (700 | ) | (855 | ) | |||||||||
Total | $ | 37,255 | $ | 47,681 | $ | 272,612 | $ | 217,897 | |||||||
The following table presents the amount of accumulated comprehensive income that will be amortized against earnings as part of our net periodic benefit cost in fiscal 2019 based on 2018 exchange rates (segregated between U.S. and non-U.S. plans) (in thousands):
U.S. Plans | Non-U.S. Plans | ||||||
Unrecognized net actuarial loss | $ | 2,925 | $ | 8,616 | |||
Unrecognized prior service cost | — | (258 | ) | ||||
Accumulated comprehensive loss to be recorded against earnings | $ | 2,925 | $ | 8,358 | |||
We consider various factors in developing the estimates for the expected, long-term rates of return on plan assets. These factors include the projected, long-term rates of returns on the various types of assets in which the plans invest, as well as historical returns. In general, investment allocations are determined by each plan’s trustees and/or investment committees. The objectives of the plans’ investment policies are to (i) maximize returns while preserving capital; (ii) provide returns sufficient to meet the current and long-term obligations of the plan as the obligations become due; and (iii) maintain a diversified portfolio of assets so as to reduce the risk associated with having a disproportionate amount of the plans’ total assets invested in any one type of asset, issuer or geography. None of our pension plans hold Jacobs common stock directly (although some plans may hold shares indirectly through investments in mutual funds). The plans’ weighted average asset allocations at September 28, 2018 and September 29, 2017 (the measurement dates used in valuing the plans’ assets and liabilities) were as follows:
U.S. Plans | Non-U.S. Pans | ||||||||||
September 28, 2018 | September 29, 2017 | September 28, 2018 | September 29, 2017 | ||||||||
Equity securities | 27 | % | 70 | % | 24 | % | 24 | % | |||
Debt securities | 39 | % | 23 | % | 49 | % | 32 | % | |||
Real estate investments | — | % | — | % | 8 | % | 5 | % | |||
Other | 34 | % | 7 | % | 19 | % | 39 | % | |||
The following table presents the Fair Value of the Company’s Domestic U.S. plan assets at September 28, 2018, segregated by level of Fair Value measurement inputs within the Fair Value hierarchy promulgated by U.S. GAAP (in thousands):
F - 31
JACOBS ENGINEERING GROUP INC. AND SUBSIDIARIES
NOTES TO CONSOLIDATED FINANCIAL STATEMENTS - (Continued)
September 28, 2018 | |||||||||||||||||||
Fair Value, Determined Using Fair Value Measurement Inputs | |||||||||||||||||||
Level 1 | Level 2 | Level 3 | Investments measured at Net Asset Value | Total | |||||||||||||||
U.S. Domestic equities | $ | 13,861 | $ | 63,937 | $ | — | $ | — | $ | 77,798 | |||||||||
Overseas equities | 26,699 | — | — | — | 26,699 | ||||||||||||||
U.S. Domestic bonds | 84,894 | 58,229 | — | — | 143,123 | ||||||||||||||
Overseas bonds | 938 | 9,570 | — | — | 10,508 | ||||||||||||||
Cash and equivalents | 6,631 | — | — | — | 6,631 | ||||||||||||||
Mutual funds | 126,042 | — | — | — | 126,042 | ||||||||||||||
Hedge funds | $ | — | $ | — | $ | — | 28 | 28 | |||||||||||
Total | $ | 259,065 | $ | 131,736 | $ | — | $ | 28 | $ | 390,829 | |||||||||
The following table presents the Fair Value of the Company’s non-U.S. plan assets at September 28, 2018, segregated by level of Fair Value measurement inputs within the Fair Value hierarchy promulgated by U.S. GAAP (in thousands):
September 28, 2018 | |||||||||||||||||||
Fair Value, Determined Using Fair Value Measurement Inputs | |||||||||||||||||||
Level 1 | Level 2 | Level 3 | Investments measured at Net Asset Value | Total | |||||||||||||||
Domestic equities | $ | — | 31,868 | $ | — | 36,642 | $ | 68,510 | |||||||||||
Overseas equities | — | 327,309 | — | 44,675 | 371,984 | ||||||||||||||
Domestic bonds | 252 | 222,282 | — | 1,080 | 223,614 | ||||||||||||||
Overseas bonds | — | 641,966 | — | 60,804 | 702,770 | ||||||||||||||
Cash and equivalents | 33,482 | 7,822 | — | — | 41,304 | ||||||||||||||
Real estate | — | 26,987 | 99,587 | 17,568 | 144,142 | ||||||||||||||
Insurance contracts | — | 4,188 | 95,782 | — | 99,970 | ||||||||||||||
Derivatives | — | (26,656 | ) | — | — | $ | (26,656 | ) | |||||||||||
Hedge funds | — | — | 135,786 | 8,047 | $ | 143,833 | |||||||||||||
Mutual funds | 69 | 97,941 | — | 98,010 | |||||||||||||||
Total | $ | 33,803 | $ | 1,333,707 | $ | 331,155 | $ | 168,816 | $ | 1,867,481 | |||||||||
The following table presents the Fair Value of the Company’s U.S. plan assets at September 29, 2017, segregated by level of Fair Value measurement inputs within the Fair Value hierarchy promulgated by U.S. GAAP (in thousands):
September 29, 2017 | |||||||||||
Fair Value, Determined Using Fair Value Measurement Inputs | |||||||||||
Level 1 | Level 3 | Total | |||||||||
U.S. Domestic equities | $ | 103,760 | $ | — | $ | 103,760 | |||||
U.S. Domestic bonds | 33,404 | — | 33,404 | ||||||||
Cash and equivalents | 4,448 | — | 4,448 | ||||||||
Hedge funds | — | 6,176 | 6,176 | ||||||||
Total | $ | 141,612 | $ | 6,176 | $ | 147,788 | |||||
The following table presents the Fair Value of the Company’s non-U.S. plan assets at September 29, 2017, segregated by level of Fair Value measurement inputs within the Fair Value hierarchy promulgated by U.S. GAAP (in thousands):
F - 32
JACOBS ENGINEERING GROUP INC. AND SUBSIDIARIES
NOTES TO CONSOLIDATED FINANCIAL STATEMENTS - (Continued)
September 29, 2017 | |||||||||||
Fair Value, Determined Using Fair Value Measurement Inputs | |||||||||||
Level 1 | Level 3 | Total | |||||||||
Domestic equities | $ | 30,916 | $ | — | $ | 30,916 | |||||
Overseas equities | 229,205 | — | 229,205 | ||||||||
Domestic bonds | 263,145 | — | 263,145 | ||||||||
Overseas bonds | 77,682 | — | 77,682 | ||||||||
Cash and equivalents | 38,924 | — | 38,924 | ||||||||
Real estate | — | 58,974 | 58,974 | ||||||||
Insurance contracts | — | 74,353 | 74,353 | ||||||||
Other | — | 303,729 | 303,729 | ||||||||
Total | $ | 639,872 | $ | 437,056 | $ | 1,076,928 | |||||
The following table summarizes the changes in the Fair Value of the Company’s U.S. plans’ Level 3 assets for the year ended September 28, 2018 (in thousands):
Hedge Funds | |||
Balance at September 29, 2017 | $ | 6,176 | |
Purchases, sales, and settlements | (6,176 | ) | |
Realized and unrealized gains | — | ||
Balance at September 28, 2018 | $ | — | |
The following table summarizes the changes in the Fair Value of the Company’s non-U.S. Pension Plans’ Level 3 assets for the year ended September 28, 2018 (in thousands):
Real Estate | Insurance Contracts | Hedge Funds | |||||||||
Balance at September 29, 2017 | $ | 58,974 | $ | 74,353 | $ | 303,729 | |||||
Purchases, sales, and settlements | 42,711 | 21,626 | (154,446 | ) | |||||||
Realized and unrealized gains (losses) | (784 | ) | 1,551 | (6,650 | ) | ||||||
Transfers | — | — | — | ||||||||
Effect of exchange rate changes | (1,314 | ) | (1,748 | ) | (6,847 | ) | |||||
Balance at September 28, 2018 | $ | 99,587 | $ | 95,782 | $ | 135,786 | |||||
The following table summarizes the changes in the Fair Value of the Company’s U.S. plans’ Level 3 assets for the year ended September 29, 2017 (in thousands):
Real Estate | Hedge Funds | ||||||
Balance at September 30, 2016 | $ | 3,477 | $ | 5,715 | |||
Purchases | (3,477 | ) | (557 | ) | |||
Realized and unrealized gains | — | 1,018 | |||||
Balance at September 29, 2017 | $ | — | $ | 6,176 | |||
The following table summarizes the changes in the Fair Value of the Company’s non-U.S. plans’ Level 3 assets for the year ended September 29, 2017 (in thousands):
F - 33
JACOBS ENGINEERING GROUP INC. AND SUBSIDIARIES
NOTES TO CONSOLIDATED FINANCIAL STATEMENTS - (Continued)
Real Estate | Insurance Contracts | Hedge Funds | |||||||||
Balance at September 30, 2016 | $ | 55,665 | $ | 39,473 | $ | 272,517 | |||||
Purchases, sales, and settlements | (1,199 | ) | 422 | (9,022 | ) | ||||||
Realized and unrealized gains | 2,642 | (7,572 | ) | 19,662 | |||||||
Transfers | — | 40,031 | 11,758 | ||||||||
Effect of exchange rate changes | 1,866 | 1,999 | 8,814 | ||||||||
Balance at September 29, 2017 | $ | 58,974 | $ | 74,353 | $ | 303,729 | |||||
The following table presents the amount of cash contributions we anticipate making into the plans during fiscal 2019 (in thousands):
U.S. Plans | Non-U.S. Plans | ||||||
Anticipated cash contributions | $ | 2,601 | $ | 31,549 | |||
The following table presents the total benefit payments expected to be paid to plan participants during each of the next five fiscal years, and in total for the five years thereafter (in thousands):
U.S. Plans | Non-U.S. Pans | ||||||
2019 | $ | 31,785 | $ | 70,313 | |||
2020 | 31,270 | 71,337 | |||||
2021 | 31,740 | 74,906 | |||||
2022 | 31,818 | 78,097 | |||||
2023 | 31,857 | 81,569 | |||||
For the periods 2024 through 2028 | 154,755 | 448,246 | |||||
The following table presents the components of net periodic benefit cost for the Company’s U.S. plans recognized in the accompanying Consolidated Statements of Earnings for the years ended September 28, 2018, September 29, 2017 and September 30, 2016 (in thousands):
September 28, 2018 | September 29, 2017 | September 30, 2016 | |||||||||
Service cost | $ | 4,765 | $ | 1,000 | $ | 9,875 | |||||
Interest cost | 13,778 | 5,757 | 16,746 | ||||||||
Expected return on plan assets | (19,663 | ) | (9,942 | ) | (22,368 | ) | |||||
Actuarial loss | 3,845 | 3,985 | 7,512 | ||||||||
Prior service cost | — | — | (176 | ) | |||||||
Net pension cost, before special items | 2,725 | 800 | 11,589 | ||||||||
Contractual expense/Settlement loss | 4,146 | 1,781 | 8,061 | ||||||||
Total net periodic pension cost recognized | $ | 6,871 | $ | 2,581 | $ | 19,650 | |||||
The following table presents the components of net periodic benefit cost for the Company’s Non-U.S. plans recognized in the accompanying Consolidated Statements of Earnings for the years ended September 28, 2018, September 29, 2017 and September 30, 2016 (in thousands):
F - 34
JACOBS ENGINEERING GROUP INC. AND SUBSIDIARIES
NOTES TO CONSOLIDATED FINANCIAL STATEMENTS - (Continued)
September 28, 2018 | September 29, 2017 | September 30, 2016 | |||||||||
Service cost | $ | 8,269 | $ | 7,509 | $ | 14,378 | |||||
Interest cost | 49,324 | 31,205 | 38,892 | ||||||||
Expected return on plan assets | (83,328 | ) | (56,269 | ) | (50,190 | ) | |||||
Actuarial loss | 6,655 | 10,616 | 9,092 | ||||||||
Prior service cost | (257 | ) | (329 | ) | (260 | ) | |||||
Net pension cost, before special items | (19,337 | ) | (7,268 | ) | 11,912 | ||||||
Curtailment expense/Settlement loss | 1,268 | (298 | ) | (7,512 | ) | ||||||
Total net periodic pension (income) cost recognized | $ | (18,069 | ) | $ | (7,566 | ) | $ | 4,400 | |||
During fiscal 2018, the Company incurred combined curtailment and settlement losses on its defined benefit plans primarily related to its Sverdrup and Ireland pension plans. During fiscal 2017, we curtailed the pension plan in Ireland. The fiscal 2016 settlement loss included in the U.S. pension plan net periodic benefit cost table above related to the transfer of a U.S. pension plan to a new service provider. The fiscal 2016 settlement loss included in the Non-U.S. pension plan net periodic benefit cost table above related to the sale of the Company’s French subsidiary.
Multiemployer Plans
In Canada and the U.S., we contribute to various trusteed pension plans covering hourly construction employees under industry-wide agreements. We also contribute to various trusteed plans in Australia and certain countries in Europe covering both hourly and certain salaried employees. Contributions are based on the hours worked by employees covered under these agreements and are charged to direct costs of contracts on a current basis.
The majority of the contributions the Company makes to multiemployer pension plans are outside the U.S. With respect to these multiemployer plans, the Company's liability to fund these plans is generally limited to the contributions we are required to make under collective bargaining agreements.
Based on our review of our multiemployer pension plans under the guidance provided in ASU 2011-09— Compensation-Retirement Benefits-Multiemployer Plans, we have concluded that none of the multiemployer pension plans into which we contribute are individually significant to our Consolidated Financial Statements.
The following table presents the Company’s contributions to these multiemployer plans for the years ended September 28, 2018, September 29, 2017 and September 30, 2016 (in thousands):
September 28, 2018 | September 29, 2017 | September 30, 2016 | |||||||||
Canada | $ | 36,354 | $ | 35,182 | $ | 44,912 | |||||
Europe | $ | 10,677 | $ | 6,212 | $ | 8,771 | |||||
United States | $ | 9,536 | $ | 4,548 | $ | 5,058 | |||||
Contributions to multiemployer pension plans | $ | 56,567 | $ | 45,942 | $ | 58,741 | |||||
Other Benefit Plans
During the second fiscal quarter of 2017, the Company restructured certain employee welfare trust plans benefiting certain of its employees within its India operations by moving these plans under the legal ownership and operation of the Company’s legal entity structure in the region. Historically, the Company structured these plans as separate, stand-alone entities outside of the Company’s consolidated legal entity framework. As a result of these changes, the Company has recorded a one-time, non-cash benefit of $9.9 million reported in selling, general and administrative expense in its Consolidated Statement of Earnings for the year ended September 29, 2017, with corresponding assets in the plans associated with restricted investments of $7.7 million and employee loans receivable of $2.2 million and both recorded in Total other non-current assets in our Consolidated Balance Sheet at September 29, 2017.
11. Savings and Deferred Compensation Plans
Savings Plans
F - 35
JACOBS ENGINEERING GROUP INC. AND SUBSIDIARIES
NOTES TO CONSOLIDATED FINANCIAL STATEMENTS - (Continued)
We sponsor various defined contribution savings plans which allow participants to make voluntary contributions by salary deduction. Such plans cover substantially all of our domestic, nonunion employees in the U.S. and are qualified under Section 401(k) of the U.S. Internal Revenue Code. Similar plans outside the U.S. cover various groups of employees of our international subsidiaries and affiliates. Several of these plans allow the Company to match, on a voluntary basis, a portion of the employee contributions. The following table presents the Company’s contributions to these savings plans for the years ended September 28, 2018, September 29, 2017 and September 30, 2016 (in thousands):
September 28, 2018 | September 29, 2017 | September 30, 2016 | ||||||||
$ | 113,135 | $ | 82,882 | $ | 89,966 | |||||
Deferred Compensation Plans
Our Executive Security Plan, Executive Deferral Plans, Directors Deferral Plan, legacy CH2M Supplemental Executive Retirement and Retention Plan and legacy CH2M Deferred Compensation Plan are non-qualified deferred compensation programs that provide benefits payable to directors, officers, and certain key employees or their designated beneficiaries at specified future dates, upon retirement, or death. The plans are unfunded; therefore, benefits are paid from the general assets of the Company. The following table presents the amount charged to expense for the Company’s deferred compensation plans for the years ended September 28, 2018, September 29, 2017 and September 30, 2016 (in thousands):
September 28, 2018 | September 29, 2017 | September 30, 2016 | ||||||||
$ | 4,445 | $ | 4,368 | $ | 5,792 | |||||
12. | Accumulated Other Comprehensive Income |
The following table presents the Company's roll forward of accumulated income (loss) after-tax for the years ended September 28, 2018 and September 29, 2017 (in thousands):
Change in Pension Liabilities | Foreign Currency Translation Adjustment | Gain/(Loss) on Cash Flow Hedges | Total | ||||||||||||
Balance at September 30, 2016 | $ | (364,625 | ) | $ | (245,613 | ) | $ | (356 | ) | $ | (610,594 | ) | |||
Other comprehensive income (loss) | 88,113 | (140,527 | ) | 834 | (51,580 | ) | |||||||||
Reclassifications from other comprehensive income (loss) | 10,934 | — | (2,274 | ) | 8,660 | ||||||||||
Balance at September 29, 2017 | (265,578 | ) | (386,140 | ) | (1,796 | ) | (653,514 | ) | |||||||
Other comprehensive income (loss) | (52,528 | ) | (119,070 | ) | 618 | (170,980 | ) | ||||||||
Reclassifications from other comprehensive income (loss) | 8,239 | 9,193 | 359 | 17,791 | |||||||||||
Balance at September 28, 2018 | $ | (309,867 | ) | $ | (496,017 | ) | $ | (819 | ) | $ | (806,703 | ) | |||
F - 36
JACOBS ENGINEERING GROUP INC. AND SUBSIDIARIES
NOTES TO CONSOLIDATED FINANCIAL STATEMENTS - (Continued)
13. Income Taxes
The following table presents the components of our consolidated income tax expense for years ended September 28, 2018, September 29, 2017 and September 30, 2016 (in thousands):
For the Years Ended | |||||||||||
September 28, 2018 | September 29, 2017 | September 30, 2016 | |||||||||
Current income tax expense: | |||||||||||
Federal | $ | 34,145 | $ | 29,297 | $ | 36,020 | |||||
State | (597 | ) | 8,535 | 11,336 | |||||||
Foreign | 59,889 | 31,347 | 52,259 | ||||||||
Total current tax expense | 93,437 | 69,179 | 99,615 | ||||||||
Deferred income tax expense (benefit): | |||||||||||
Federal | 252,730 | 29,390 | 6,439 | ||||||||
State | 15,485 | 3,407 | 485 | ||||||||
Foreign | 19,911 | 3,866 | (34,331 | ) | |||||||
Total deferred tax expense (benefit) | 288,126 | 36,663 | (27,407 | ) | |||||||
Consolidated income tax expense | $ | 381,563 | $ | 105,842 | $ | 72,208 | |||||
On December 22, 2017, the Tax Cuts and Jobs Act (the “Act”) was enacted in the United States. The Act reduced the top corporate U.S. federal statutory tax rate from 35% to 21% starting on January 1, 2018, resulting in a blended statutory tax rate for fiscal year filers. It also requires companies to pay a one-time transition tax on earnings of certain foreign subsidiaries, places limitations and exclusions on varied tax deductions and creates new taxes on certain foreign sourced earnings. The majority of the tax provisions, excluding the change in corporate tax rates, are effective for the first tax year beginning after January 1, 2018, which will be the Company’s taxable year beginning fiscal 2019.
Given the significance of the legislation, the SEC staff issued Staff Accounting Bulletin No. 118 (SAB 118), which allows registrants to record provisional amounts during a one year “measurement period” similar to that used when accounting for business combinations. However, the measurement period is deemed to have ended earlier when the registrant has obtained, prepared and analyzed the information necessary to finalize its accounting. During the measurement period, impacts of the law are expected to be recorded at the time a reasonable estimate for all or a portion of the effects can be made, and provisional amounts can be recognized and adjusted as information becomes available, prepared or analyzed.
SAB 118 summarizes a three-step process to be applied at each reporting period to account for and qualitatively disclose: (1) the effects of the change in tax law for which accounting is complete; (2) provisional amounts (or adjustments to provisional amounts) for the effects of the tax law where accounting is not complete, but that a reasonable estimate has been determined; and (3) a reasonable estimate cannot yet be made and therefore taxes are reflected in accordance with law prior to the enactment of the Act.
As of September 28, 2018, the Company has not completed the accounting for the tax effects of the enactment of the Act. However, the Company has made a provisional estimate of the effects of the statutory tax rate reduction impact on our existing deferred tax balances, the tax on global intangible low-taxed income and the one-time transition tax.
The Act calls for a one-time tax on deemed repatriation of foreign earnings. This one-time transition tax is based on the Company's total post-1986 earnings and profits (E&P) of certain of our foreign subsidiaries. The Company has made a revised provisional estimate of the transition tax. Based upon our review of the Company’s historical foreign tax credit position and post-1986 E&P, it is estimated at this time that the Company will incur approximately $14.3 million transition tax expense net of foreign tax credits. The Company is still in the process of completing our calculation of the total post-1986 E&P. The estimate may change when the Company finalizes the calculation of post-1986 foreign E&P previously deferred from U.S. federal taxation and finalizes the amounts held in cash or other specified assets.
The Company has also recorded a provisional expense of $104.2 million after consideration for valuation allowance with respect to certain foreign tax credits as a result of integration impacts.
In the current fiscal year, the Company adopted ASU No 2018-02, Income Statement - Reporting Comprehensive Income (Topic 220): Reclassification of Certain Tax Effects from Accumulated Other Comprehensive Income. The guidance gives entities the option to reclassify to retained earnings tax effects related to items in accumulated other comprehensive income that the FASB refers
F - 37
JACOBS ENGINEERING GROUP INC. AND SUBSIDIARIES
NOTES TO CONSOLIDATED FINANCIAL STATEMENTS - (Continued)
to as having been stranded in accumulated other comprehensive income as a result of tax reform. As a result of adoption of ASU 2018-02, the Company reclassified $10.2 million in accumulated other comprehensive income to retained earnings relating to the current year deferred tax activity for its U.S. pension plans resulting from the Act.
Deferred taxes reflect the tax effects of temporary differences between the amounts recorded as assets and liabilities for financial reporting purposes and the comparable amounts recorded for income tax purposes. Deferred tax assets and liabilities are measured using the enacted tax rates and laws that will be in effect when the differences are expected to reverse.
The following table presents the components of our net deferred tax assets at September 28, 2018 and September 29, 2017 (in thousands):
September 28, 2018 | September 29, 2017 | ||||||
Deferred tax assets: | |||||||
Obligations relating to: | |||||||
Defined benefit pension plans | $ | 30,483 | $ | 52,299 | |||
Other employee benefit plans | 190,548 | 192,299 | |||||
Net Operating Losses | 167,424 | 136,783 | |||||
Foreign Tax Credit | 145,931 | — | |||||
Other Credits | 8,764 | ||||||
Self-insurance programs | — | 489 | |||||
Contract revenues and costs | 130,116 | (18,374 | ) | ||||
Deferred Rent | 5,454 | 25,654 | |||||
Restructuring | 14,515 | 18,258 | |||||
Other | 3,533 | 19,389 | |||||
Valuation Allowance | (264,944 | ) | (58,097 | ) | |||
Gross deferred tax assets | 431,824 | 368,700 | |||||
Deferred tax liabilities: | |||||||
Depreciation and amortization | (206,705 | ) | (176,327 | ) | |||
Self-insurance programs | (3,513 | ) | — | ||||
Unremitted earnings | (79,418 | ) | — | ||||
Other, net | — | (1,438 | ) | ||||
Gross deferred tax liabilities | (289,636 | ) | (177,765 | ) | |||
Net deferred tax assets | $ | 142,188 | $ | 190,935 | |||
We remeasured the U.S. deferred tax assets and liabilities based on the rates at which they are expected to reverse in the future, which is generally 21%. The Company’s provisional remeasurement resulted in a $139.8 million net unfavorable charge to income tax expense for the year ended September 28, 2018. The Company is still analyzing purchase accounting related to CH2M Hill and refining the calculations, which could potentially affect the measurement of these balances or potentially give rise to new deferred tax assets and liabilities.
A valuation allowance is recorded to reduce deferred tax assets to the amount that is more likely than not to be realized based on an assessment of positive and negative evidence, including estimates of future taxable income necessary to realize future deductible amounts. The valuation allowance was $264.9 million at September 28, 2018 and $58.1 million at September 29, 2017.
Net operating loss carry forwards of foreign subsidiaries at September 28, 2018 and September 29, 2017 totaled $662.4 million and $490.9 million, respectively. If unused, foreign net operating losses of $168.1 million will expire between 2019 and 2038. Net operating losses of $494.3 million can be carried forward indefinitely.
The following table presents the income tax benefits realized from the exercise of non-qualified stock options and disqualifying dispositions of stock sold under our employee stock purchase plans for the years ended September 28, 2018, September 29, 2017 and September 30, 2016 (in millions):
F - 38
JACOBS ENGINEERING GROUP INC. AND SUBSIDIARIES
NOTES TO CONSOLIDATED FINANCIAL STATEMENTS - (Continued)
For the Years Ended | ||||||||||
September 28, 2018 | September 29, 2017 | September 30, 2016 | ||||||||
$ | 4.7 | $ | 5.2 | $ | 1.5 | |||||
The Company’s consolidated effective income tax rate is higher than the US statutory rate of 24.6% primarily due to a $139.8 million detriment from the provisional remeasurement of the deferred tax items in the U.S. from the reduction in the U.S. statutory rate, as well as a charge for valuation allowance related to foreign tax credits of $104.2 million. In addition, there was an increase due to the difference in foreign tax rates compared to the new U.S. statutory rate of $9.9 million. The unfavorable charges were partially offset by a $5.7 million benefit related to a federal hurricane credit and $4.5 million benefit related to the Internal Revenue Code section 179D deduction for the design of energy efficient facilities.
The following table reconciles total income tax expense using the statutory U.S. federal income tax rate to the consolidated income tax expense shown in the accompanying Consolidated Statements of Earnings for the years ended September 28, 2018, September 29, 2017 and September 30, 2016 (dollars in thousands):
For the Years Ended | ||||||||||||||||||||
September 28, 2018 | % | September 29, 2017 | % | September 30, 2016 | % | |||||||||||||||
Statutory amount | $ | 136,458 | 24.6 | % | $ | 137,626 | 35.0 | % | $ | 100,353 | 35.0 | % | ||||||||
State taxes, net of the federal benefit | 7,587 | 1.4 | % | 8,955 | 2.3 | % | 7,853 | 2.7 | % | |||||||||||
Exclusion of tax on non-controlling interests | (2,389) | (0.4 | )% | 2,223 | 0.6 | % | (1,418 | ) | (0.5 | )% | ||||||||||
Foreign: | ||||||||||||||||||||
Difference in tax rates of foreign operations | 9,860 | 1.8 | % | (16,987 | ) | (4.3 | )% | (17,184 | ) | (6.0 | )% | |||||||||
Benefit from foreign valuation allowance release | (5,105) | (0.9 | )% | (3,085 | ) | (0.8 | )% | (11,182 | ) | (3.9 | )% | |||||||||
U.K. tax rate change on deferred tax assets | — | — | — | — | % | 8,853 | 3.1 | % | ||||||||||||
Nontaxable income from foreign affiliate | — | — | (3,280 | ) | (0.8 | )% | — | — | ||||||||||||
U.S. tax cost of foreign operations | 6,577 | 1.2 | % | 18,612 | 4.7 | % | 30,850 | 10.9 | % | |||||||||||
Tax differential on foreign earnings | 11,332 | 2.0 | % | (4,740 | ) | (1.2 | )% | 11,337 | 4.1 | % | ||||||||||
Foreign tax credits | (21,729) | (3.9 | )% | (20,454 | ) | (5.2 | )% | (44,018 | ) | (15.4 | )% | |||||||||
Tax Reform | 154,150 | 27.8 | % | — | — | — | — | |||||||||||||
Valuation Allowance | 104,221 | 18.8 | % | — | — | — | — | |||||||||||||
Uncertain tax positions | (1,297) | (0.2 | )% | (5,779 | ) | (1.5 | )% | 1,449 | 0.5 | % | ||||||||||
Other items: | ||||||||||||||||||||
IRS §179D deduction | (4,520) | (0.8 | )% | (3,351 | ) | (0.8 | )% | (2,153 | ) | (0.8 | )% | |||||||||
IRS §199D deduction | — | — | (2,113 | ) | (0.5 | )% | (2,800 | ) | (1.0 | )% | ||||||||||
Foreign partnership income/(loss) | (3,990) | (0.7 | )% | (9,861 | ) | (2.5 | )% | (2,658 | ) | (0.9 | )% | |||||||||
Other items – net | 1,740 | 0.3 | % | 3,336 | 0.7 | % | 4,263 | 1.5 | % | |||||||||||
Total other items | (6,770) | (1.2 | )% | (11,989 | ) | (3.1 | )% | (3,348 | ) | (1.2 | )% | |||||||||
Taxes on income | $ | 381,563 | 68.9 | % | $ | 105,842 | 26.9 | % | $ | 72,208 | 25.2 | % | ||||||||
The Company’s consolidated effective income tax rate for the year ended September 28, 2018 increased to 68.9% from 26.9% for fiscal 2017. Key drivers for this year over year increase include the reduction in the U.S. statutory tax rate causing a detriment for provisional remeasurement of the deferred tax items in the U.S. of $139.8 million, as well as a charge for valuation allowance related to foreign tax credits of $104.2 million. In addition, there was an increase due to the difference in foreign tax rates compared to the new U.S. statutory rate of $26.8 million. These detriments were partially offset by a $4.5 million benefit related to internal revenue service code section 179D, a nonrecurring benefit of $2.8 million related to tax accounting method changes and a $5.7 million federal hurricane credit.
The Company’s consolidated effective income tax rate for the year ended September 29, 2017 increased to 26.9% from 25.2% for fiscal 2016. Key drivers for this year over year increase included the impacts of lower foreign tax credit benefits and lower benefits from valuation allowance releases on foreign deferred tax assets, partly offset by favorable impacts of U.S. tax cost of foreign operations, the non-recurrence of 2016 tax rate change impacts on deferred income tax assets in the UK and favorable impacts from change in uncertain tax positions.
F - 39
JACOBS ENGINEERING GROUP INC. AND SUBSIDIARIES
NOTES TO CONSOLIDATED FINANCIAL STATEMENTS - (Continued)
The following table presents income tax payments made during the years ended September 28, 2018, September 29, 2017 and September 30, 2016 (in millions):
September 28, 2018 | September 29, 2017 | September 30, 2016 | ||||||||
$ | 44.29 | $ | 78.39 | $ | 116.30 | |||||
The following table presents the components of our consolidated earnings before taxes for the years ended September 28, 2018, September 29, 2017 and September 30, 2016 (in thousands):
For the Years Ended | |||||||||||
September 28, 2018 | September 29, 2017 | September 30, 2016 | |||||||||
United States earnings | $ | 282,123 | $ | 232,342 | $ | 206,159 | |||||
Foreign earnings | 272,582 | 160,875 | 80,564 | ||||||||
$ | 554,705 | $ | 393,217 | $ | 286,723 | ||||||
The tax cost, net of applicable credits, have been provided on the undistributed earnings of the Company’s foreign subsidiaries. As of September 28, 2018, the provisional estimate of repatriating earnings to the United States is estimated at $93.0 million. The Company does not assert any earnings to be permanently reinvested.
The Company accounts for unrecognized tax benefits in accordance with ASC Topic 740, Income Taxes. It accounts for interest and penalties on unrecognized tax benefits as interest and penalties (i.e., not as part of income tax expense). The Company’s liability for gross unrecognized tax benefits was $76.7 million and $38.6 million at September 28, 2018 and September 29, 2017, respectively, all of which, if recognized, would affect the Company’s consolidated effective income tax rate. The Company had $56.3 million and $36.6 million in accrued interest and penalties at September 28, 2018 and September 29, 2017, respectively. The Company estimates that, within twelve months, we may realize a decrease in our uncertain tax positions of approximately $6.5 million as a result of concluding various tax audits and closing tax years. As of September 28, 2018, the Company’s U.S. federal income tax returns for tax years 2009 and forward remain subject to examination.
The following table presents the reconciliation of the beginning and ending amount of unrecognized tax benefits for the years ended September 28, 2018, September 29, 2017 and September 30, 2016 (in thousands):
For the Years Ended | |||||||||||
September 28, 2018 | September 29, 2017 | September 30, 2016 | |||||||||
Balance, beginning of year | $ | 38,580 | $ | 44,167 | $ | 42,666 | |||||
Acquisition of CH2M | 137,912 | — | — | ||||||||
Additions based on tax positions related to the current year | 9,780 | 5,900 | 5,670 | ||||||||
Additions for tax positions of prior years | 5,561 | 237 | 367 | ||||||||
Reductions for tax positions of prior years | (8,962 | ) | (4,524 | ) | (2,451 | ) | |||||
Settlement | (3,731 | ) | (7,200 | ) | (2,085 | ) | |||||
Balance, end of year | $ | 179,140 | $ | 38,580 | $ | 44,167 | |||||
On December 15, 2017 the Company completed the acquisition of CH2M. For income tax purposes, the transaction was accounted for as a stock purchase. As a result of the acquisition, the Company adjusted its U.S. GAAP opening balance sheet of CH2M to reflect preliminary estimates of the fair value of the net assets acquired. For income tax purposes, the tax attributes and basis of net assets acquired carryover without any step-up to fair value. The Company has made preliminary estimates and recorded deferred taxes associated with the purchase accounting. It is expected that the Company will make adjustments to the purchase accounting over the relevant measurement period as allowed by ASC 805.
14. | Commitments and Contingencies and Derivative Financial Instruments |
Commitments Under Operating Leases
F - 40
JACOBS ENGINEERING GROUP INC. AND SUBSIDIARIES
NOTES TO CONSOLIDATED FINANCIAL STATEMENTS - (Continued)
We lease certain of our facilities and equipment under operating leases with net aggregate future lease payments at September 28, 2018, payable as follows (in thousands):
In fiscal years, | |||
2019 | $ | 215,375 | |
2020 | 187,228 | ||
2021 | 158,781 | ||
2022 | 135,991 | ||
2023 | 115,614 | ||
Thereafter | 344,120 | ||
1,157,109 | |||
Amounts representing sublease income | (19,443 | ) | |
$ | 1,137,666 | ||
We recognize rent expense, inclusive of landlord concessions and tenant allowances, over the lease term on a straight-line basis. We also recognize rent expense on a straight-line basis for leases containing fixed escalation clauses and rent holidays. Contingent rentals are included in rent expense as incurred. Operating leases relating to many of our major offices generally contain renewal options and provide for additional rental based on escalation in operating expenses and real estate taxes.
The following table presents rent expense and sublease income offsetting the Company’s rent expense for the years ended September 28, 2018, September 29, 2017 and September 30, 2016 (in thousands):
For the Years Ended | |||||||||||
September 28, 2018 | September 29, 2017 | September 30, 2016 | |||||||||
Rent expense | $ | 217,550 | $ | 145,344 | $ | 151,539 | |||||
Sublease income | (5,514 | ) | (7,052 | ) | (7,212 | ) | |||||
Net rent expense | $ | 212,036 | $ | 138,292 | $ | 144,327 | |||||
Synthetic Lease Guarantee
We are party to a synthetic lease agreement involving certain real and personal property located in Houston, Texas that we use in our operations. A synthetic lease is a type of off-balance sheet transaction which provides us with certain tax and other financial benefits. Significant terms of the lease are as follows:
End of lease term | 2025 | ||
End of term purchase option (in thousands) | $ | 76,950 | |
Residual value guarantee (in thousands) | $ | 62,412 | |
The Company refinanced the synthetic lease agreement effective July 28, 2015 with a 10-year term. The new lease agreement continues to gives us the right to request an extension of the lease term. We may also assist the owner in selling the property at the end of the lease term, the proceeds from which would be used to reduce our residual value guarantee. The minimum lease payments required by the lease agreement is included in the above lease payment schedule. We have determined that the estimated Fair Value of the aforementioned financial guarantee was not significant at September 28, 2018.
Derivative Financial Instruments
In situations where our operations incur contract costs in currencies other than their functional currency, we attempt to have a portion of the related contract revenues denominated in the same currencies as the costs. In those situations where revenues and costs are transacted in different currencies, we sometimes enter into foreign exchange contracts in order to limit our exposure to fluctuating foreign currencies. The Company does not currently have exchange rate sensitive instruments that would have a material effect on our consolidated financial statements or results of operations.
Letters of Credit
F - 41
JACOBS ENGINEERING GROUP INC. AND SUBSIDIARIES
NOTES TO CONSOLIDATED FINANCIAL STATEMENTS - (Continued)
At September 28, 2018, the Company had issued and outstanding approximately $446.6 million in LOCs and $870.3 million in surety bonds. Of the outstanding LOC amount, $2.5 million has been issued under the Revolving Credit Facility and $444.1 million are issued under separate, committed and uncommitted letter-of-credit facilities.
15. | Contractual Guarantees, Litigation, Investigations and Insurance |
In the normal course of business, we make contractual commitments some of which are supported by separate guarantees; and on occasion we are a party in a litigation or arbitration proceeding. The litigation or arbitration in which we are involved includes personal injury claims, professional liability claims and breach of contract claims. In most cases, we are the defendant. Where we provide a separate guarantee it is strictly in support of the underlying contractual commitment. Guarantees take various forms including surety bonds required by law, or standby letters of credit ("LOC") (also referred to as “bank guarantees”) or corporate guarantees given to induce a party to enter into a contract with a subsidiary. Standby LOCs are also used as security for advance payments or in various other transactions. The guarantees have various expiration dates ranging from an arbitrary date to completion of our work (e.g., engineering only) to completion of the overall project. See Note 14- Commitments and Contingencies and Derivative Financial Instruments for more information surrounding LOCs and surety bonds.
We maintain insurance coverage for most insurable aspects of our business and operations. Our insurance programs have varying coverage limits depending upon the type of insurance, and include certain conditions and exclusions which insurance companies may raise in response to any claim that the Company brings. We have also elected to retain a portion of losses and liabilities that occur through the use of various deductibles, limits, and retentions under our insurance programs. As a result, we may be subject to a future liability for which we are only partially insured or completely uninsured. We intend to mitigate any such future liability by continuing to exercise prudent business judgment in negotiating the terms and conditions of the contracts which the Company enters with its clients. Our insurers are also subject to business risk and, as a result, one or more of them may be unable to fulfill their insurance obligations due to insolvency or otherwise.
Additionally, as a contractor providing services to the U.S. federal government we are subject to many types of audits, investigations and claims by, or on behalf of, the government including with respect to contract performance, pricing, cost allocations, procurement practices, labor practices and socioeconomic obligations. Furthermore, our income, franchise and similar tax returns and filings are also subject to audit and investigation by the Internal Revenue Service, most states within the U.S., as well as by various government agencies representing jurisdictions outside the U.S.
Our Consolidated Balance Sheets include amounts representing our probable estimated liability relating to such claims, guarantees, litigation, audits and investigations. We perform an analysis to determine the level of reserves to establish for insurance-related claims that are known and have been asserted against us, and for insurance-related claims that are believed to have been incurred based on actuarial analysis, but have not yet been reported to our claims administrators as of the respective balance sheet dates. We include any adjustments to such insurance reserves in our consolidated results of operations. Insurance recoveries are recorded as assets if recovery is probable and estimated liabilities are not reduced by expected insurance recoveries.
The Company believes, after consultation with counsel, that such guarantees, litigation, U.S. government contract-related audits, investigations and claims and income tax audits and investigations should not have a material adverse effect on our consolidated financial statements.
On September 30, 2015, Nui Phao Mining Company Limited (“NPMC”) commenced arbitration proceedings against Jacobs E&C Australia Pty Limited (“Jacobs E&C”). The arbitration is pending in Singapore before the Singapore International Arbitration Centre. In March 2011, Jacobs E&C was engaged by NPMC for the provision of management, design, engineering and procurement services for the Nui Phao mine/mineral processing project in Vietnam. In the Notice of Arbitration and in a subsequently filed Statement of Claim and Supplementary Statement of Claim dated February 1, 2016 and February 26, 2016, respectively, NPMC asserts various causes of action and alleges that the quantum of its claim exceeds $167.0 million. Jacobs has denied liability and is vigorously defending this claim. A three week hearing on the merits concluded on December 15, 2017 and a decision is expected as soon as later this calendar year. The Company does not expect the resolution of this matter to have a material adverse effect on its financial condition, results of operations and/or cash flows.
In 2012, CH2M HILL Australia Pty Limited, a subsidiary of CH2M, entered into a 50/50 integrated joint venture with Australian construction contractor UGL Infrastructure Pty Limited. The joint venture entered into a Consortium Agreement with General Electric and GE Electrical International Inc. The Consortium was awarded a subcontract by JKC Australia LNG Pty Limited for the engineering, procurement, construction and commissioning of a 360 MW Combined Cycle Power Plant for INPEX Operations Australia Pty Limited at Blaydin Point, Darwin, NT, Australia. In January 2017, the Consortium terminated the Subcontract because of JKC’s repudiatory breach and demobilized from the work site. JKC claimed the Consortium abandoned the work and itself
F - 42
JACOBS ENGINEERING GROUP INC. AND SUBSIDIARIES
NOTES TO CONSOLIDATED FINANCIAL STATEMENTS - (Continued)
purported to terminate the Subcontract. The Consortium and JKC are now in dispute over the termination. In August 2017, the Consortium filed an International Chamber of Commerce arbitration against JKC for compensatory damages in the amount of $665.5 million for repudiatory breach or, in the alternative, seeking damages for unresolved contract claims and change orders. JKC has provided a preliminary estimate of the monetary value of its claims in excess of $1.7 billion and has drawn on bonds. This draw on bonds does not impact the Company's ultimate liability. A decision in this matter is not expected before 2020. If the Consortium is found liable, this matter could have a material adverse effect on the Company’s business, financial condition, results of operations and /or cash flows, particularly in the short term. However, the Consortium has denied liability and is vigorously defending these claims and pursuing its affirmative claims against JKC, and based on the information currently available, the Company does not expect the resolution of this matter to have a material adverse effect on the Company’s business, financial condition, results of operations, or cash flows. See Note 5- Business Combinations for further information relating to CH2M contingencies.
F - 43
JACOBS ENGINEERING GROUP INC. AND SUBSIDIARIES
NOTES TO CONSOLIDATED FINANCIAL STATEMENTS - (Continued)
16. | Other Financial Information |
Receivables
The following table presents the components of “Receivables” as shown in the accompanying Consolidated Balance Sheets at September 28, 2018 and September 29, 2017 as well as certain other related information (in thousands):
September 28, 2018 | September 29, 2017 | ||||||
Components of receivables: | |||||||
Amounts billed, net | $ | 1,597,297 | $ | 949,060 | |||
Unbilled receivables and other | 1,933,000 | 1,118,144 | |||||
Retentions receivable | 24,633 | 35,339 | |||||
Total receivables, net | $ | 3,554,930 | $ | 2,102,543 | |||
Other information about receivables: | |||||||
Amounts due from the United States federal government included above, net of advanced billings | $ | 472,846 | $ | 226,236 | |||
Claims receivable | $ | — | $ | 4,600 | |||
Billed receivables, net consist of amounts invoiced to clients in accordance with the terms of the client contracts and are shown net of an allowance for doubtful accounts. We anticipate that substantially all of such billed amounts will be collected over the next twelve months.
Unbilled receivables and retentions receivable represent reimbursable costs and amounts earned and reimbursable under contracts in progress as of the respective balance sheet dates. Such amounts become billable according to the contract terms, which usually consider the passage of time, achievement of certain milestones or completion of the project. We anticipate that substantially all of such unbilled amounts will be billed and collected over the next twelve months.
Claims receivable are included in receivables in the accompanying Consolidated Balance Sheets and represent certain costs incurred on contracts to the extent it is probable that such claims will result in additional contract revenue and the amount of such additional revenue can be reliably estimated.
Property, Equipment and Improvements, Net
The following table presents the components of our property, equipment and improvements, net at September 28, 2018 and September 29, 2017 (in thousands):
September 28, 2018 | September 29, 2017 | ||||||
Land | $ | 19,327 | $ | 17,197 | |||
Buildings | 129,336 | 93,313 | |||||
Equipment | 721,274 | 627,609 | |||||
Leasehold improvements | 268,979 | 220,295 | |||||
Construction in progress | 17,685 | 21,300 | |||||
1,156,601 | 979,714 | ||||||
Accumulated depreciation and amortization | (698,895 | ) | (629,803 | ) | |||
$ | 457,706 | $ | 349,911 | ||||
Miscellaneous Noncurrent Assets
The following table presents the components of “Miscellaneous noncurrent assets” shown in the accompanying Consolidated Balance Sheets at September 28, 2018 and September 29, 2017 (in thousands):
F - 44
JACOBS ENGINEERING GROUP INC. AND SUBSIDIARIES
NOTES TO CONSOLIDATED FINANCIAL STATEMENTS - (Continued)
September 28, 2018 | September 29, 2017 | ||||||
Deferred income taxes | $ | 319,405 | $ | 368,700 | |||
Deferred compensation arrangement investments | 282,974 | 142,522 | |||||
Equity Method Investments | 219,614 | 131,400 | |||||
Notes receivable | 1,274 | 17,839 | |||||
Other | 48,425 | 31,561 | |||||
Total | $ | 871,692 | $ | 692,022 | |||
Deferred compensation arrangement investments are comprised of the cash surrender value of life insurance policies and pooled-investment funds. The fair value of the pooled investment funds is derived using Level 2 inputs.
Accrued Liabilities
The following table presents the components of “Accrued liabilities” shown in the accompanying Consolidated Balance Sheets at September 28, 2018 and September 29, 2017 (in thousands):
September 28, 2018 | September 29, 2017 | ||||||
Accrued payroll and related liabilities | $ | 864,670 | $ | 572,946 | |||
Project-related accruals | 45,349 | 71,815 | |||||
Non project-related accruals | 349,384 | 116,051 | |||||
Insurance liabilities | 64,976 | 67,546 | |||||
Sales and other similar taxes | 83,151 | 32,163 | |||||
Deferred rent | 58,988 | 60,593 | |||||
Dividends payable | 22,111 | 18,573 | |||||
Total | $ | 1,488,629 | $ | 939,687 | |||
Other Deferred Liabilities
The following table presents the components of “Other deferred liabilities” shown in the accompanying Consolidated Balance Sheets at September 28, 2018 and September 29, 2017 (in thousands):
September 28, 2018 | September 29, 2017 | ||||||
Liabilities relating to defined benefit pension and early retirement plans | $ | 352,855 | $ | 254,483 | |||
Liabilities relating to nonqualified deferred compensation arrangements | 238,830 | 114,616 | |||||
Deferred income taxes | 177,217 | 177,765 | |||||
Miscellaneous | 639,969 | 185,417 | |||||
Total | $ | 1,408,871 | $ | 732,281 | |||
17. | Segment Information |
During the second quarter of fiscal 2018, we reorganized our operating and reporting structure around three lines of business (“LOBs”), which also serve as the Company’s operating segments. This reorganization occurred in conjunction with the integration of CH2M into the Company's legacy businesses, and was intended to better serve our global clients, leverage our workforce, help streamline operations and provide enhanced growth opportunities. The three global LOBs are as follows: Aerospace, Technology, Environmental and Nuclear ("ATEN"); Buildings, Infrastructure and Advanced Facilities ("BIAF"); and Energy, Chemicals and Resources ("ECR"). Previously, the Company operated its business around four operating segments: Petroleum & Chemicals, Buildings & Infrastructure, Aerospace & Technology and Industrial. Beginning in the second quarter of fiscal 2018, management no longer views or manages our Industrial line of business as a separate, distinct operating segment. Therefore, the elements of our former Industrial business are now presented within each of the three current operating segments as appropriate. The Company’s LOB leadership and internal reporting structures report to the Chief Executive Officer, who is also the Chief Operating Decision Maker (“CODM”), and enable the CODM to evaluate the performance of each of these segments and make appropriate resource allocations among each of the segments. For purposes of the Company’s goodwill impairment testing, it has been determined that the Company’s operating segments are also its reporting units based on management’s conclusion that the components comprising each of its
F - 45
JACOBS ENGINEERING GROUP INC. AND SUBSIDIARIES
NOTES TO CONSOLIDATED FINANCIAL STATEMENTS - (Continued)
operating segments share similar economic characteristics and meet the aggregation criteria for reporting units in accordance with ASC 350, Intangibles-Goodwill and Other.
Under the new organization, each LOB has a president that reports directly to the CODM. The sales function is managed on an LOB basis, and accordingly, the associated cost is embedded in the new segments and reported to the respective LOB presidents. In addition, a portion of the costs of other support functions (e.g., finance, legal, human resources, and information technology) is allocated to each LOB using methodologies which, we believe, effectively attribute the cost of these support functions to the revenue generating activities of the Company on a rational basis. The cost of the Company’s cash incentive plan, the Management Incentive Plan (“MIP”) and the expense associated with the Jacobs Engineering Group Inc. 1999 SIP have likewise been charged to the LOBs except for those amounts determined to relate to the business as a whole (which amounts remain in other corporate expenses).
Financial information for each LOB is reviewed by the CODM to assess performance and make decisions regarding the allocation of resources. The Company generally does not track assets by LOB, nor does it provide such information to the CODM.
The CODM evaluates the operating performance of our LOBs using segment operating profit, which is defined as margin less “corporate charges” (e.g., the allocated amounts described above). The Company incurs certain Selling, General and Administrative costs (“SG&A”) that relate to its business as a whole which are not allocated to the LOBs.
On December 15, 2017, the Company completed the acquisition of CH2M. For purposes of the Company’s fiscal 2018 segment reporting, the operating financial information of CH2M has been categorized within the Company’s new LOB business structure, with its sales and operating profit results for the time period during which CH2M has been under the ownership of the Company being allocated to the Company’s ATEN, BIAF and ECR lines of business under a transitional business organization structure. The Company has not completed its final assessment of the CH2M purchase price allocation, including the fair value estimates of assets acquired and liabilities assumed.
The following tables present total revenues and segment operating profit for each reportable segment (in thousands) and includes a reconciliation of segment operating profit to total U.S. GAAP operating profit by including certain corporate-level expenses and expenses relating to the Restructuring and other charges and transaction costs associated with the CH2M transaction and integration costs and the ECR sale (in thousands). Prior period information has been recast to reflect the current period presentation.
For the Years Ended | |||||||||||
September 28, 2018 | September 29, 2017 | September 30, 2016 | |||||||||
Revenues from External Customers: | |||||||||||
Aerospace, Technology, Environmental and Nuclear | $ | 4,372,008 | $ | 2,464,363 | $ | 2,845,913 | |||||
Buildings, Infrastructure and Advanced Facilities | 6,184,883 | 3,830,697 | 3,419,505 | ||||||||
Energy, Chemicals and Resources | 4,427,755 | 3,727,728 | 4,698,739 | ||||||||
Total | $ | 14,984,646 | $ | 10,022,788 | $ | 10,964,157 | |||||
For the Years Ended | |||||||||||
September 28, 2018 | September 29, 2017 | September 30, 2016 | |||||||||
Segment Operating Profit: | |||||||||||
Aerospace, Technology, Environmental and Nuclear (1) | $ | 311,871 | $ | 200,179 | $ | 215,119 | |||||
Buildings, Infrastructure and Advanced Facilities (2) | 482,277 | 263,679 | 217,412 | ||||||||
Energy, Chemicals and Resources | 218,109 | 161,312 | 153,797 | ||||||||
Total Segment Operating Profit | 1,012,257 | 625,170 | 586,328 | ||||||||
Other Corporate Expenses | (113,702 | ) | (81,595 | ) | (60,100 | ) | |||||
Restructuring and Other Charges | (170,148 | ) | (134,206 | ) | (187,630 | ) | |||||
Transaction Costs | (80,436 | ) | (17,100 | ) | — | ||||||
Total U.S. GAAP Operating Profit | 647,971 | 392,269 | 338,598 | ||||||||
Gain (Loss) on disposal of business and investments | (20,967 | ) | 10,880 | (41,410 | ) | ||||||
Total Other (Expense) Income, net (3) | (72,299 | ) | (9,932 | ) | (10,465 | ) | |||||
Earnings Before Taxes | $ | 554,705 | $ | 393,217 | $ | 286,723 | |||||
(1) Includes $15.0 million in charges during the year ended September 28, 2018 associated with a legal matter.
F - 46
JACOBS ENGINEERING GROUP INC. AND SUBSIDIARIES
NOTES TO CONSOLIDATED FINANCIAL STATEMENTS - (Continued)
(2) | Excludes $23.8 million in restructuring and other charges for the year ended September 29, 2017. See Note 8, Restructuring and Other Charges. |
(3) | Includes amortization of deferred financing fees related to the CH2M acquisition of $1.8 million for the year ended September 28, 2018. Also, includes $1.2 million and $277 thousand of restructuring and other charges for the years ended September 29, 2017 and September 30, 2016, respectively. |
Included in “other corporate expenses” in the above table are costs and expenses which relate to general corporate activities as well as corporate-managed benefit and insurance programs. Such costs and expenses include: (i) those elements of SG&A expenses relating to the business as a whole; (ii) those elements of the Management Incentive Plan and the 1999 SIP relating to corporate personnel whose other compensation costs are not allocated to the LOBs; (iii) the amortization of intangible assets acquired as part of business combinations; (iv) the quarterly variances between the Company’s actual costs of certain of its self-insured integrated risk and employee benefit programs and amounts charged to the LOBs; and (v) certain adjustments relating to costs associated with the Company’s international defined benefit pension plans. In addition, “other corporate expenses” includes adjustments to contract margins (both positive and negative) associated with projects where it has been determined, in the opinion of management, that such adjustments are not indicative of the performance of the related LOB and therefore should not be attributed to the LOB.
Included in gain (loss) on disposal of business and investments for the year ended September 28, 2018 was a loss on the sale of the Company’s ownership interest in the Company's Guimar Engenharia LTDA ("Guimar") joint venture. Included in gain (loss) on disposal of business and investments for the year ended September 29, 2017 was a gain on the sale of the Company’s ownership interest in the Neste Jacobs joint venture. Included in gain (loss) on disposal of business and investments for the year ended September 30, 2016 was the loss associated with the sale of the Company’s French subsidiary and a non-cash write-off on an equity investment.
We provide a broad range of technical, professional and construction services including engineering, design and architectural services; construction and construction management services; operations and maintenance services; and process, scientific and systems consulting services. We provide our services through offices and subsidiaries located primarily in North America, South America, Europe, the Middle East, India, Australia, Africa and Asia. We provide our services under cost-reimbursable and fixed-price contracts.
The following table presents certain financial information by geographic area (in thousands):
For the Years Ended | |||||||||||
September 28, 2018 | September 29, 2017 | September 30, 2016 | |||||||||
Revenues: | |||||||||||
United States | $ | 9,519,085 | $ | 5,822,843 | $ | 6,247,448 | |||||
Europe | 2,768,739 | 2,262,092 | 2,346,224 | ||||||||
Canada | 863,531 | 590,604 | 927,942 | ||||||||
Asia | 316,339 | 253,167 | 299,952 | ||||||||
India | 211,983 | 165,295 | 187,929 | ||||||||
Australia and New Zealand | 719,566 | 628,945 | 436,670 | ||||||||
South America and Mexico | 159,700 | 73,456 | 125,610 | ||||||||
Middle East and Africa | 425,703 | 226,386 | 392,382 | ||||||||
Total | $ | 14,984,646 | $ | 10,022,788 | $ | 10,964,157 | |||||
Property, equipment and improvements, net: | |||||||||||
United States | $ | 316,633 | $ | 220,416 | $ | 195,392 | |||||
Europe | 59,019 | 46,108 | 37,163 | ||||||||
Canada | 21,559 | 18,435 | 21,464 | ||||||||
Asia | 3,588 | 2,793 | 3,069 | ||||||||
India | 19,446 | 19,191 | 13,350 | ||||||||
Australia and New Zealand | 16,151 | 18,692 | 18,888 | ||||||||
South America and Mexico | 4,562 | 4,619 | 5,621 | ||||||||
Middle East and Africa | 16,748 | 19,657 | 24,726 | ||||||||
Total | $ | 457,706 | $ | 349,911 | $ | 319,673 | |||||
Revenues were earned from unaffiliated clients located primarily within the various and respective geographic areas shown.
F - 47
JACOBS ENGINEERING GROUP INC. AND SUBSIDIARIES
NOTES TO CONSOLIDATED FINANCIAL STATEMENTS - (Continued)
The following table presents the revenues earned directly or indirectly from the U.S. federal government and its agencies, expressed as a percentage of total revenues:
For the Years Ended | ||||
September 28, 2018 | September 29, 2017 | September 30, 2016 | ||
23% | 19% | 21% | ||
18. Selected Quarterly Information — Unaudited
The following table presents selected quarterly financial information. (in thousands, except for per share amounts):
First Quarter | Second Quarter | Third Quarter | Fourth Quarter | Fiscal Year | |||||||||||||||
September 28, 2018 | |||||||||||||||||||
Revenues | $ | 2,750,311 | $ | 3,935,028 | $ | 4,156,663 | $ | 4,142,644 | $ | 14,984,646 | |||||||||
Operating profit (a) | $ | 47,644 | (e) | $ | 146,286 | (e) | $ | 212,729 | (e) | $ | 241,312 | (e) | $ | 647,971 | |||||
Earnings before taxes | $ | 41,916 | $ | 122,167 | $ | 192,783 | $ | 197,839 | $ | 554,705 | |||||||||
Net earnings of the Group | $ | 2,561 | $ | 51,932 | $ | 150,071 | $ | (31,422 | ) | $ | 173,142 | ||||||||
Net earnings attributable to Jacobs | $ | 2,163 | (e) | $ | 48,587 | (e) | $ | 150,222 | (e) | $ | (37,541 | ) | (e) | $ | 163,431 | ||||
Earnings per share: | |||||||||||||||||||
Basic | $ | 0.02 | (e) | $ | 0.34 | (e) | $ | 1.05 | (e) | $ | (0.26 | ) | (e) | $ | 1.18 | ||||
Diluted | $ | 0.02 | (e) | $ | 0.34 | (e) | $ | 1.05 | (e) | $ | (0.26 | ) | (e) | $ | 1.17 | ||||
September 29, 2017 | |||||||||||||||||||
Revenues | $ | 2,551,604 | $ | 2,302,567 | (c) | $ | 2,514,751 | (c) | $ | 2,653,866 | $ | 10,022,788 | |||||||
Operating profit (a) | $ | 88,628 | $ | 68,173 | (c) | $ | 128,475 | (c) | $ | 106,993 | $ | 392,269 | |||||||
Earnings before taxes | $ | 85,880 | $ | 60,491 | $ | 127,396 | $ | 119,450 | $ | 393,217 | |||||||||
Net earnings of the Group | $ | 61,153 | $ | 44,165 | $ | 88,629 | $ | 93,428 | $ | 287,375 | |||||||||
Net earnings attributable to Jacobs | $ | 60,536 | (c) | $ | 50,018 | (c) | $ | 89,032 | (c) | $ | 94,141 | (c)(d) | $ | 293,727 | |||||
Earnings per share: | |||||||||||||||||||
Basic | $ | 0.50 | (c) | $ | 0.41 | (c) | $ | 0.74 | (c) | $ | 0.78 | (c)(d) | $ | 2.43 | |||||
Diluted | $ | 0.50 | (c) | $ | 0.41 | (c) | $ | 0.74 | (c) | $ | 0.78 | (c)(d) | $ | 2.42 | |||||
September 30, 2016 | |||||||||||||||||||
Revenues | $ | 2,847,934 | $ | 2,781,763 | $ | 2,693,873 | $ | 2,640,587 | $ | 10,964,157 | |||||||||
Operating profit (a) | $ | 59,450 | $ | 86,781 | $ | 109,556 | $ | 82,811 | $ | 338,598 | |||||||||
Earnings before taxes | $ | 57,787 | $ | 90,456 | $ | 102,807 | $ | 35,673 | $ | 286,723 | |||||||||
Net earnings of the Group | $ | 50,306 | $ | 63,389 | $ | 70,937 | $ | 29,883 | $ | 214,515 | |||||||||
Net earnings attributable to Jacobs | $ | 46,514 | (b) | $ | 65,250 | (b) | $ | 69,055 | (b) | $ | 29,644 | (b) | $ | 210,463 | |||||
Earnings per share: | |||||||||||||||||||
Basic | $ | 0.38 | (b) | $ | 0.54 | (b) | $ | 0.58 | (b) | $ | 0.25 | (b) | $ | 1.75 | |||||
Diluted | $ | 0.38 | (b) | $ | 0.54 | (b) | $ | 0.57 | (b) | $ | 0.24 | (b) | $ | 1.73 | |||||
(a) | Operating profit represents revenues less (i) direct costs of contracts, and (ii) selling, general and administrative expenses. |
(b) | Includes costs of $48.1 million, or $0.39 per diluted share, in the first quarter of fiscal 2016, $25.7 million or $0.21 per diluted share in the second quarter of fiscal 2016, $25.8 million, or $0.21 per diluted share, in the third quarter, and $36.0 million or $0.3 per diluted share in the fourth quarter of fiscal 2016, in each case, related to the 2015 Restructuring. Also included in the fourth quarter of fiscal 2016 were $17.1 million, or $0.14 per diluted share related to the loss on sale of our French subsidiary; and $10.4 million, or $0.09 per diluted share related to the non-cash write-off on an equity investment. |
(c) | Includes costs of $31.7 million, or $0.18 per diluted share, in the first quarter of fiscal 2017; includes $16.5 million in revenue, $72.2 million in operating profit, $45.2 million in net earnings attributable to Jacobs, or $0.37 per diluted share, in the second quarter of fiscal 2017; includes $1 million in revenue, $10.7 million in operating profit and $6.3 million in net earnings attributable to Jacobs, or $0.05 per diluted share, in the third quarter of fiscal 2017; includes $19.5 million in operating profit, $13.6 million in net earnings attributable to Jacobs, or $0.11 per diluted share, in the fourth quarter of fiscal 2017, in each case, related to restructuring and other charges. |
F - 48
JACOBS ENGINEERING GROUP INC. AND SUBSIDIARIES
NOTES TO CONSOLIDATED FINANCIAL STATEMENTS - (Continued)
(d) | Includes costs of $10.6 million, or $0.09 per diluted share, in the fourth quarter of fiscal 2017 related to professional fees and integration costs for the CH2M acquisition. |
(e) | Includes $87.0 million in operating profit, $94.8 million in net earnings attributable to Jacobs, or $0.75 per diluted share, in the first quarter of fiscal 2018; includes $73.7 million in operating profit, $95.4 million in net earnings attributable to Jacobs, or $0.66 per diluted share, in the second quarter of fiscal 2018; includes $51.3 million in operating profit and $43.9 million in net earnings attributable to Jacobs, or $0.31 per diluted share, in the third quarter of fiscal 2018; includes $38.5 million in operating profit, $225.9 million in net earnings attributable to Jacobs, or $1.57 per diluted share, in the fourth quarter of fiscal 2018, in each case, related to restructuring and other charges, transaction costs and charges relating to U.S. tax reform. During the fourth quarter, the $225.9 million in restructuring and other charges included in net earnings attributable to Jacobs includes $21.0 million related to the loss on the sale of our Guimar joint venture investment. |
19. Subsequent Events
On October 21, 2018, Jacobs and WorleyParsons Limited, a company incorporated in Australia (“Buyer”), entered into a Stock and Asset Purchase Agreement pursuant to which Buyer agreed to acquire the Company’s ECR business for a purchase price of $3.3 billion consisting of (i) $2.6 billion in cash plus (ii) ordinary shares of the Buyer equal to $700 million, subject to adjustments for changes in working capital and certain other items (the “Transaction”). The Transaction, which has been approved by the boards of directors of the Company and Buyer, is expected to close in the first half of calendar year 2019.
The completion of the Transaction is subject to certain customary closing conditions, including, but not limited to, (i) the absence of any law or order prohibiting the consummation of the Transaction, (ii) the expiration or termination of the waiting period (and any extensions thereof) applicable under the Hart-Scott-Rodino Antitrust Improvements Act of 1976, as amended (the “HSR Act”), (iii) the expiration or termination of all applicable waiting periods and the receipt of all applicable approvals required pursuant to or in connection with the competition laws of certain foreign jurisdictions in which the Business operates, (iv) the receipt of approval from the Committee on Foreign Investment in the United States (“CFIUS”), (v) the completion of a certain number of agreed upon steps of the Reorganization (as defined in the Purchase Agreement) and (vi) the transfer of certain owned real property of the Business.
F - 49
REPORT OF INDEPENDENT REGISTERED PUBLIC ACCOUNTING FIRM
To the Stockholders and the Board of Directors of Jacobs Engineering Group Inc.
Opinion on the Financial Statements
We have audited the accompanying consolidated balance sheets of Jacobs Engineering Group Inc. and subsidiaries (the Company) as of September 28, 2018 and September 29, 2017, the related consolidated statements of earnings, comprehensive income, stockholders’ equity, and cash flows for each of the three fiscal years in the period ended September 28, 2018, and the related notes (collectively referred to as the “consolidated financial statements”). In our opinion, the consolidated financial statements present fairly, in all material respects, the financial position of the Company at September 28, 2018 and September 29, 2017, and the consolidated results of its operations and its cash flows for each of the three fiscal years in the period ended September 28, 2018, in conformity with U.S. generally accepted accounting principles.
We also have audited, in accordance with the standards of the Public Company Accounting Oversight Board (United States) (PCAOB), the Company's internal control over financial reporting as of September 28, 2018, based on criteria established in Internal Control-Integrated Framework issued by the Committee of Sponsoring Organizations of the Treadway Commission (2013 framework), and our report dated November 21, 2018 expressed an adverse opinion thereon.
Basis for Opinion
These financial statements are the responsibility of the Company's management. Our responsibility is to express an opinion on the Company’s financial statements based on our audits. We are a public accounting firm registered with the PCAOB and are required to be independent with respect to the Company in accordance with the U.S. federal securities laws and the applicable rules and regulations of the Securities and Exchange Commission and the PCAOB.
We conducted our audits in accordance with the standards of the PCAOB. Those standards require that we plan and perform the audit to obtain reasonable assurance about whether the financial statements are free of material misstatement, whether due to error or fraud. Our audits included performing procedures to assess the risks of material misstatement of the financial statements, whether due to error or fraud, and performing procedures that respond to those risks. Such procedures included examining, on a test basis, evidence regarding the amounts and disclosures in the financial statements. Our audits also included evaluating the accounting principles used and significant estimates made by management, as well as evaluating the overall presentation of the financial statements. We believe that our audits provide a reasonable basis for our opinion.
/s/ Ernst & Young LLP
We have served as the Company’s auditor since 1987.
Dallas, Texas
November 21, 2018
F - 50
REPORT OF INDEPENDENT REGISTERED PUBLIC ACCOUNTING FIRM
To the Stockholders and the Board of Directors of Jacobs Engineering Group Inc.
Opinion on Internal Control over Financial Reporting
We have audited Jacobs Engineering Group Inc. and subsidiaries’ internal control over financial reporting as of September 28, 2018, based on criteria established in Internal Control-Integrated Framework issued by the Committee of Sponsoring Organizations of the Treadway Commission (2013 framework) (the COSO criteria). In our opinion, because of the effect of the material weakness described below based on the achievement of the objectives of the control criteria, Jacobs Engineering Group Inc. and subsidiaries (the Company) has not maintained effective control over financial reporting as of September 28, 2018, based on the COSO criteria.
As indicated in the accompanying Management’s Annual Report on Internal Control Over Financial Reporting, management’s assessment of and conclusion on the effectiveness of internal control over financial reporting did not include the internal controls of the CH2M HILL Companies, Ltd. (CH2M) acquired on December 15, 2017, which is included in the 2018 consolidated financial statements of the Company and constituted 42% of total assets as of September 28, 2018, 25% of revenues and 30% of operating profit for the fiscal year then ended. Our audit of internal control over financial reporting of the Company also did not include an evaluation of the internal control over financial reporting of CH2M.
A material weakness is a deficiency, or combination of deficiencies, in internal control over financial reporting, such that there is a reasonable possibility that a material misstatement of the company’s annual or interim financial statements will not be prevented or detected on a timely basis. The following material weakness has been identified and included in management’s assessment. Management has identified a material weakness in controls related to the Company’s accounting for income taxes in connection with the CH2M business combination.
We also have audited, in accordance with the standards of the Public Company Accounting Oversight Board (United States) (PCAOB), the consolidated balance sheets of the Company as of September 28, 2018 and September 29, 2017, the related consolidated statements of earnings, comprehensive income, stockholders’ equity, and cash flows for each of the three fiscal years in the period ended September 28, 2018, and the related notes. This material weakness was considered in determining the nature, timing and extent of audit tests applied in our audit of the 2018 consolidated financial statements, and this report does not affect our report dated November 21, 2018, which expressed an unqualified opinion thereon.
Basis for Opinion
The Company’s management is responsible for maintaining effective internal control over financial reporting and for its assessment of the effectiveness of internal control over financial reporting included in the accompanying Management’s Annual Report on Internal Control Over Financial Reporting. Our responsibility is to express an opinion on the Company’s internal control over financial reporting based on our audit. We are a public accounting firm registered with the PCAOB and are required to be independent with respect to the Company in accordance with the U.S. federal securities laws and the applicable rules and regulations of the Securities and Exchange Commission and the PCAOB.
We conducted our audit in accordance with the standards of the PCAOB. Those standards require that we plan and perform the audit to obtain reasonable assurance about whether effective internal control over financial reporting was maintained in all material respects.
Our audit included obtaining an understanding of internal control over financial reporting, assessing the risk that a material weakness exists, testing and evaluating the design and operating effectiveness of internal control based on the assessed risk, and performing such other procedures as we considered necessary in the circumstances. We believe that our audit provides a reasonable basis for our opinion.
Definition and Limitations of Internal Control Over Financial Reporting
A company’s internal control over financial reporting is a process designed to provide reasonable assurance regarding the reliability of financial reporting and the preparation of financial statements for external purposes in accordance with generally accepted accounting principles. A company’s internal control over financial reporting includes those policies and procedures that (1) pertain to the maintenance of records that, in reasonable detail, accurately and fairly reflect the transactions and dispositions of the assets of the company; (2) provide reasonable assurance that transactions are recorded as necessary to permit preparation of financial statements in accordance with generally accepted accounting principles, and that receipts and expenditures of the company are being made only in accordance with authorizations
F - 51
of management and directors of the company; and (3) provide reasonable assurance regarding prevention or timely detection of unauthorized acquisition, use, or disposition of the company’s assets that could have a material effect on the financial statements.
Because of its inherent limitations, internal control over financial reporting may not prevent or detect misstatements. Also, projections of any evaluation of effectiveness to future periods are subject to the risk that controls may become inadequate because of changes in conditions, or that the degree of compliance with the policies or procedures may deteriorate.
/s/ Ernst & Young LLP
Dallas, Texas
November 21, 2018
F - 52