Attached files
| file | filename |
|---|---|
| EX-99.1 - EX-99.1 - LANNETT CO INC | a18-39808_1ex99d1.htm |
| 8-K - 8-K - LANNETT CO INC | a18-39808_18k.htm |
FORWARD-LOOKING STATEMENTS Except for historical facts, the statements in this presentation of supplemental information, as well as oral statements or other written statements made or to be made by Lannett Company, Inc. (the “Company”), are forward-looking statements within the meaning of the Private Securities Litigation Reform Act of 1995 and involve risks and uncertainties. For example, the planned product launches, product approvals, anticipated cost savings, growth and future operations, the current or expected market size for its products, the success of current or future product offerings, continued relationships with the Company’s alliance partners, suppliers and customers, the research and development efforts, the Company’s ability to file for and obtain U.S. Food and Drug Administration (FDA) approvals for future products, and the Company’s ability to obtain and maintain necessary licenses and permits, are forward-looking statements. Forward-looking statements are merely the Company’s current prediction of future events. The statements are inherently uncertain and actual results could differ materially from the statements made herein. There is no assurance that the Company will achieve the sales levels that will keep its operations profitable or that FDA filings and approvals will be completed and obtained as anticipated. For a description of additional risks and uncertainties, please refer to the Company’s filings with the Securities and Exchange Commission, including its latest Annual Report on Form 10-K and its latest Quarterly Reports on Form 10-Q. The Company assumes no obligation to update its forward-looking statements to reflect new information and developments. 1

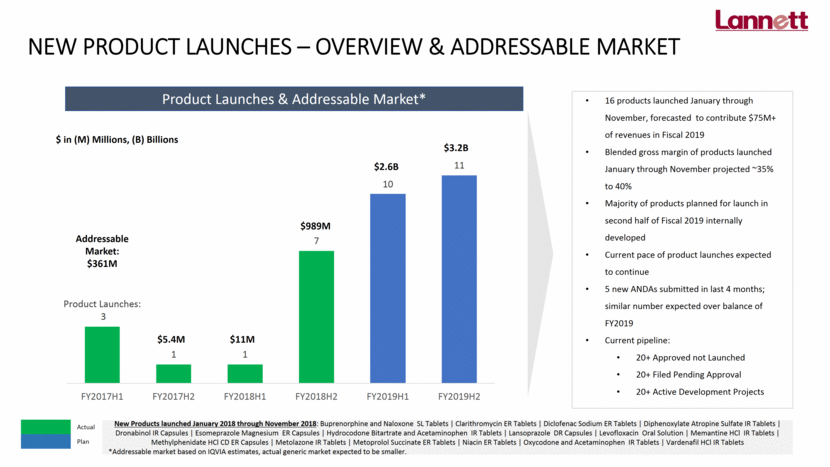
NEW PRODUCT LAUNCHES – OVERVIEW & ADDRESSABLE MARKET 16 products launched January through November, forecasted to contribute $75M+ of revenues in Fiscal 2019 Blended gross margin of products launched January through November projected ~35% to 40% Majority of products planned for launch in second half of Fiscal 2019 internally developed Current pace of product launches expected to continue 5 new ANDAs submitted in last 4 months; similar number expected over balance of FY2019 Current pipeline: 20+ Approved not Launched 20+ Filed Pending Approval 20+ Active Development Projects Addressable Market: $361M $5.4M $11M $989M $2.6B $3.2B Actual Plan Product Launches & Addressable Market* New Products launched January 2018 through November 2018: Buprenorphine and Naloxone SL Tablets Clarithromycin ER Tablets Diclofenac Sodium ER Tablets Diphenoxylate Atropine Sulfate IR Tablets Dronabinol IR Capsules Esomeprazole Magnesium ER Capsules Hydrocodone Bitartrate and Acetaminophen IR Tablets Lansoprazole DR Capsules Levofloxacin Oral Solution Memantine HCl IR Tablets Methylphenidate HCl CD ER Capsules Metolazone IR Tablets Metoprolol Succinate ER Tablets Niacin ER Tablets Oxycodone and Acetaminophen IR Tablets Vardenafil HCl IR Tablets *Addressable market based on IQVIA estimates, actual generic market expected to be smaller. $ in (M) Millions, (B) Billions

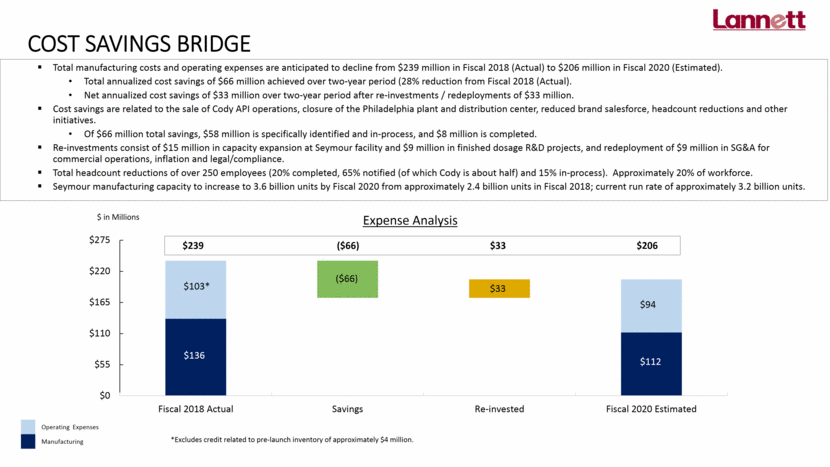
COST SAVINGS BRIDGE Total manufacturing costs and operating expenses are anticipated to decline from $239 million in Fiscal 2018 (Actual) to $206 million in Fiscal 2020 (Estimated). Total annualized cost savings of $66 million achieved over two-year period (28% reduction from Fiscal 2018 (Actual). Net annualized cost savings of $33 million over two-year period after re-investments / redeployments of $33 million. Cost savings are related to the sale of Cody API operations, closure of the Philadelphia plant and distribution center, reduced brand salesforce, headcount reductions and other initiatives. Of $66 million total savings, $58 million is specifically identified and in-process, and $8 million is completed. Re-investments consist of $15 million in capacity expansion at Seymour facility and $9 million in finished dosage R&D projects, and redeployment of $9 million in SG&A for commercial operations, inflation and legal/compliance. Total headcount reductions of over 250 employees (20% completed, 65% notified (of which Cody is about half) and 15% in-process). Approximately 20% of workforce. Seymour manufacturing capacity to increase to 3.6 billion units by Fiscal 2020 from approximately 2.4 billion units in Fiscal 2018; current run rate of approximately 3.2 billion units. $239 ($66) $33 $206 $103* $136 $112 $94 ($66) $33 Operating Expenses Manufacturing *Excludes credit related to pre-launch inventory of approximately $4 million.

