Attached files
| file | filename |
|---|---|
| 8-K - 8-K - INDUS REALTY TRUST, INC. | f8-k.htm |
Exhibit 99.1
| NOVEMBER 2018 1 INVESTOR PRESENTATION |
| 2 Forward-Looking Statements This presentation (the “Presentation”) contains forward-looking statements within the meaning of Section 27A of the Securities Act of 1933, as amended, and Section 21E of the Securities Exchange Act of 1934, as amended. For this purpose, any statements contained in this Presentation that relate to future events or conditions including, without limitation, the statements regarding site work for and construction of additional buildings, Griffin’s plan not to add to its office/flex portfolio, closing of land transactions currently under agreement, acquisition and growth strategy as disclosed herein, growing cash flow and increasing stockholder value, approvals for future developments on Griffin’s land, monetization of land holdings, anticipated impact of the U.S. tax reform, changes in certain expenses, potential impact of increased interest rates on future borrowings, industry prospects, offerings that may be made pursuant to an “at-the-market” equity distribution program and related impact and use of proceeds, or Griffin’s plans, intentions, expectations, or prospective results of operations or financial position, may be deemed to be forward-looking statements. Without limiting the foregoing, the words “believes,” “anticipates,” “plans,” “expects” and similar expressions are intended to identify forward-looking statements. Such forward-looking statements represent management’s current expectations and are inherently uncertain. There are a number of important factors that could materially impact the value of Griffin’s common stock or cause actual results to differ materially from those indicated by such forward-looking statements. Such factors are described in Griffin’s Securities and Exchange Commission filings, including the “Business,” “Risk Factors” and “Forward-Looking Information” sections in Griffin’s Annual Report on Form 10-K for the fiscal year ended November 30, 2017. Although Griffin believes that its plans, intentions and expectations reflected in such forward-looking statements are reasonable, it can give no assurance that such plans, intentions or expectations will be achieved. The projected information disclosed in this Presentation is based on assumptions and estimates that, while considered reasonable by Griffin as of the date hereof, are inherently subject to significant business, economic, competitive and regulatory uncertainties and contingencies, many of which are beyond the control of Griffin and which could cause actual results and events to differ materially from those expressed or implied in the forward- looking statements. Griffin disclaims any obligation to update any forward-looking statements in this Presentation as a result of developments occurring after the date of this Presentation except as required by law. |
| WHO IS GRIFFIN? Griffin acquires, develops, and manages industrial real estate properties in select infill, emerging and regional markets Focus on smaller light industrial/warehouse buildings (100,000 to 400,000 square feet) Converts its undeveloped land into income producing properties Publicly traded since the 1997 spin-off with a corporate history dating back to 1906 Enterprise value of approximately $297 million* * Based on stock price as of October 31, 2018 and balance sheet data as of August 31, 2018. See page 24 for calculation. 3 |
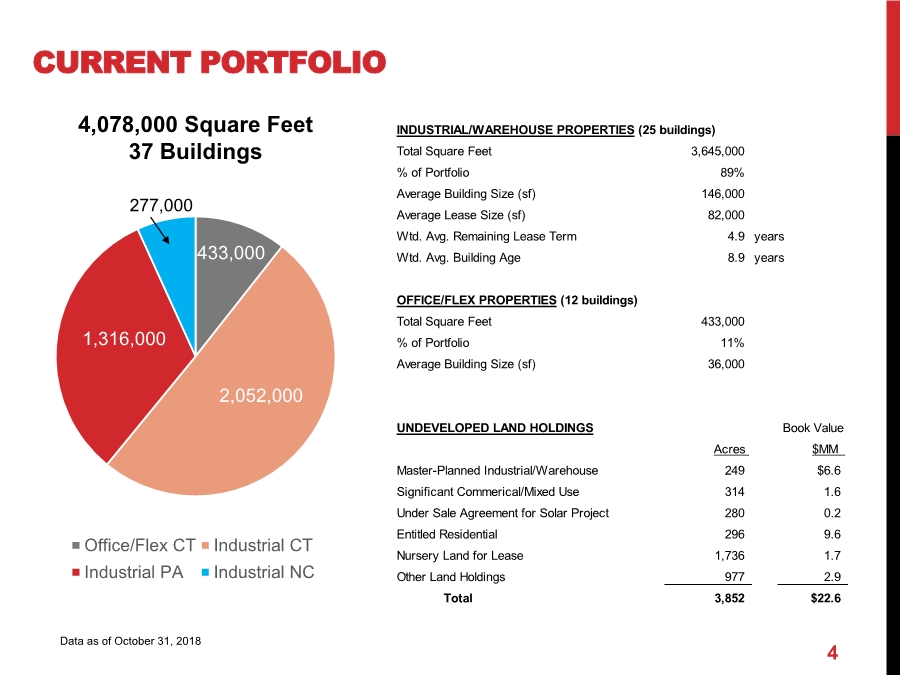
| CURRENT PORTFOLIO 433,000 2,052,000 1,316,000 Office/Flex CT Industrial CT Industrial PA Industrial NC 277,000 4,078,000 Square Feet 37 Buildings Data as of October 31, 2018 4 INDUSTRIAL/WAREHOUSE PROPERTIES (25 buildings) Total Square Feet 3,645,000 % of Portfolio 89% Average Building Size (sf) 146,000 Average Lease Size (sf) 82,000 Wtd. Avg. Remaining Lease Term 4.9 years Wtd. Avg. Building Age 8.9 years OFFICE/FLEX PROPERTIES (12 buildings) Total Square Feet 433,000 % of Portfolio 11% Average Building Size (sf) 36,000 UNDEVELOPED LAND HOLDINGS Book Value Acres $MM Master-Planned Industrial/Warehouse 249 $6.6 Significant Commerical/Mixed Use 314 1.6 Under Sale Agreement for Solar Project 280 0.2 Entitled Residential 296 9.6 Nursery Land for Lease 1,736 1.7 Other Land Holdings 977 2.9 Total 3,852 $22.6 |
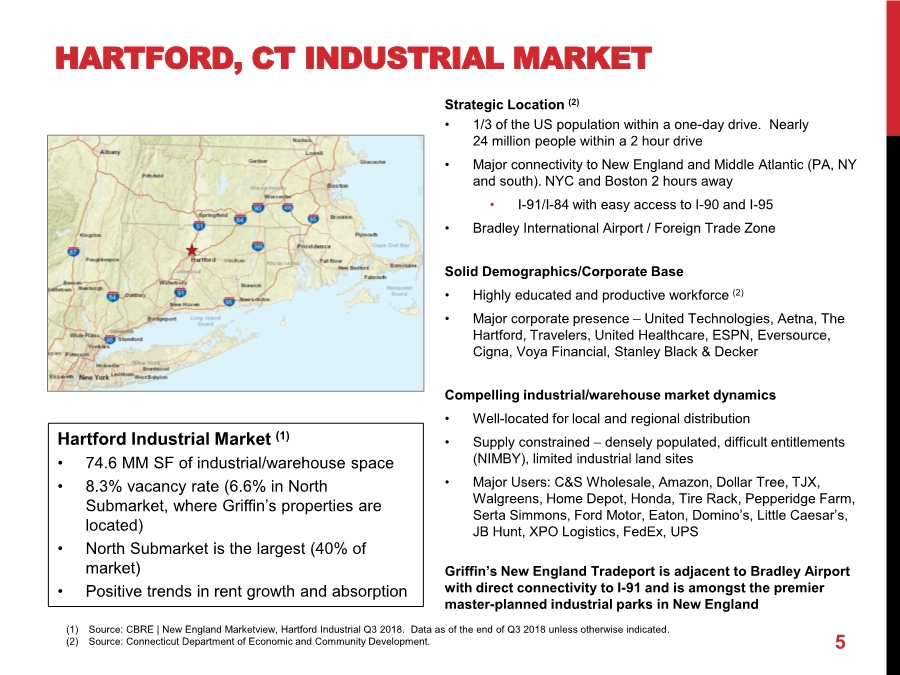
| HARTFORD, CT INDUSTRIAL MARKET 5 Strategic Location (2) • 1/3 of the US population within a one-day drive. Nearly 24 million people within a 2 hour drive • Major connectivity to New England and Middle Atlantic (PA, NY and south). NYC and Boston 2 hours away •I-91/I-84 with easy access to I-90 and I-95 • Bradley International Airport / Foreign Trade Zone Solid Demographics/Corporate Base • Highly educated and productive workforce (2) • Major corporate presence – United Technologies, Aetna, The Hartford, Travelers, United Healthcare, ESPN, Eversource, Cigna, Voya Financial, Stanley Black & Decker Compelling industrial/warehouse market dynamics • Well-located for local and regional distribution • Supply constrained – densely populated, difficult entitlements (NIMBY), limited industrial land sites • Major Users: C&S Wholesale, Amazon, Dollar Tree, TJX, Walgreens, Home Depot, Honda, Tire Rack, Pepperidge Farm, Serta Simmons, Ford Motor, Eaton, Domino’s, Little Caesar’s, JB Hunt, XPO Logistics, FedEx, UPS Griffin’s New England Tradeport is adjacent to Bradley Airport with direct connectivity to I-91 and is amongst the premier master-planned industrial parks in New England Hartford Industrial Market (1) • 74.6 MM SF of industrial/warehouse space • 8.3% vacancy rate (6.6% in North Submarket, where Griffin’s properties are located) • North Submarket is the largest (40% of market) • Positive trends in rent growth and absorption (1) Source: CBRE | New England Marketview, Hartford Industrial Q3 2018. Data as of the end of Q3 2018 unless otherwise indicated. (2) Source: Connecticut Department of Economic and Community Development. |
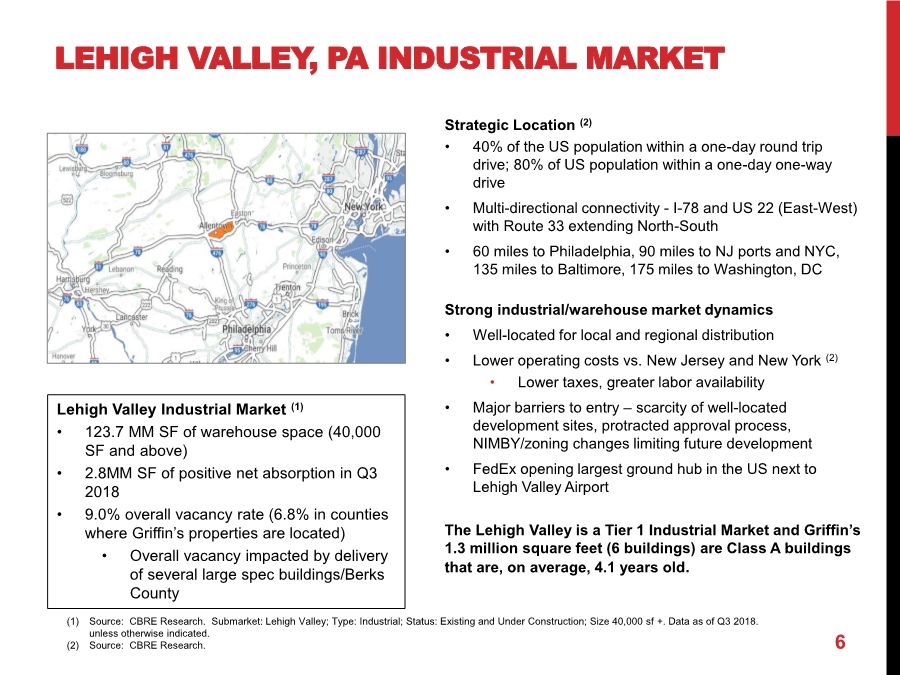
| LEHIGH VALLEY, PA INDUSTRIAL MARKET 6 Strategic Location (2) • 40% of the US population within a one-day round trip drive; 80% of US population within a one-day one-way drive • Multi-directional connectivity -I-78 and US 22 (East-West) with Route 33 extending North-South • 60 miles to Philadelphia, 90 miles to NJ ports and NYC, 135 miles to Baltimore, 175 miles to Washington, DC Strong industrial/warehouse market dynamics • Well-located for local and regional distribution • Lower operating costs vs. New Jersey and New York (2) • Lower taxes, greater labor availability • Major barriers to entry – scarcity of well-located development sites, protracted approval process, NIMBY/zoning changes limiting future development • FedEx opening largest ground hub in the US next to Lehigh Valley Airport The Lehigh Valley is a Tier 1 Industrial Market and Griffin’s 1.3 million square feet (6 buildings) are Class A buildings that are, on average, 4.1 years old. Lehigh Valley Industrial Market (1) • 123.7 MM SF of warehouse space (40,000 SF and above) • 2.8MM SF of positive net absorption in Q3 2018 • 9.0% overall vacancy rate (6.8% in counties where Griffin’s properties are located) • Overall vacancy impacted by delivery of several large spec buildings/Berks County (1) Source: CBRE Research. Submarket: Lehigh Valley; Type: Industrial; Status: Existing and Under Construction; Size 40,000 sf +. Data as of Q3 2018. unless otherwise indicated. (2) Source: CBRE Research. |
| GRIFFIN STRATEGY 7 |
| KEYS TO GROWING CASH FLOW AND INCREASINGSTOCKHOLDERVALUE Maintain high occupancy in existing portfolio Continue development on existing land holdings Sell currently owned land to fund purchases of buildings or land for potential development Focused acquisition strategy Leverage existing infrastructure/G&A 8 |
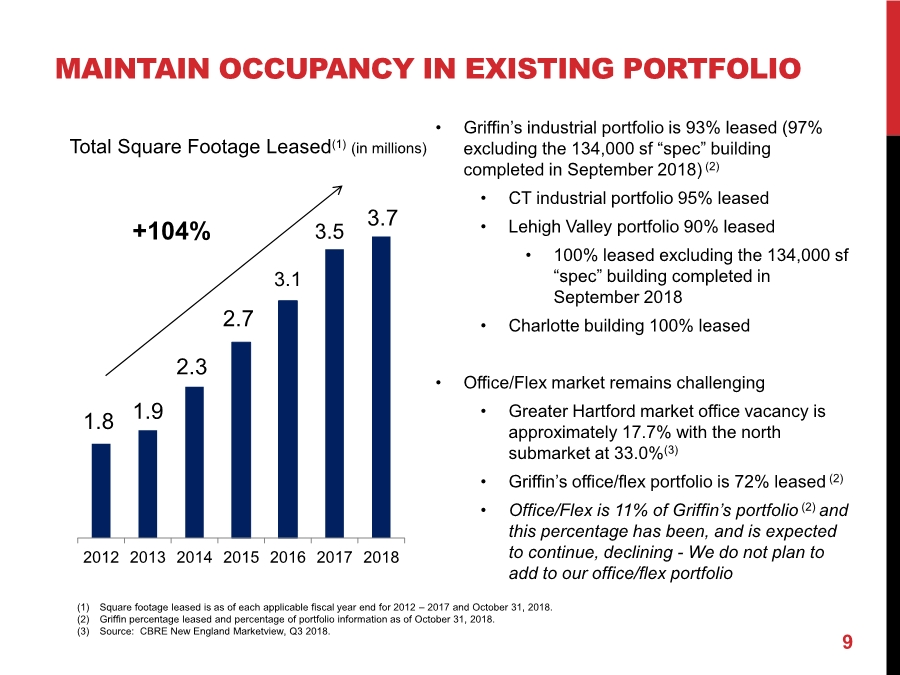
| MAINTAIN OCCUPANCY IN EXISTING PORTFOLIO 1.8 1.9 2.3 2.7 3.1 3.5 3.7 2012 2013 2014 2015 2016 2017 2018 9 Total Square Footage Leased(1) (in millions) (1) Square footage leased is as of each applicable fiscal year end for 2012 – 2017 and October 31, 2018. (2) Griffin percentage leased and percentage of portfolio information as of October 31, 2018. (3) Source: CBRE New England Marketview, Q3 2018. +104% • Griffin’s industrial portfolio is 93% leased (97% excluding the 134,000 sf “spec” building completed in September 2018) (2) • CT industrial portfolio 95% leased • Lehigh Valley portfolio 90% leased • 100% leased excluding the 134,000 sf “spec” building completed in September 2018 • Charlotte building 100% leased • Office/Flex market remains challenging • Greater Hartford market office vacancy is approximately 17.7% with the north submarket at 33.0%(3) • Griffin’s office/flex portfolio is 72% leased (2) • Office/Flex is 11% of Griffin’s portfolio (2) and this percentage has been, and is expected to continue, declining - We do not plan to add to our office/flex portfolio |
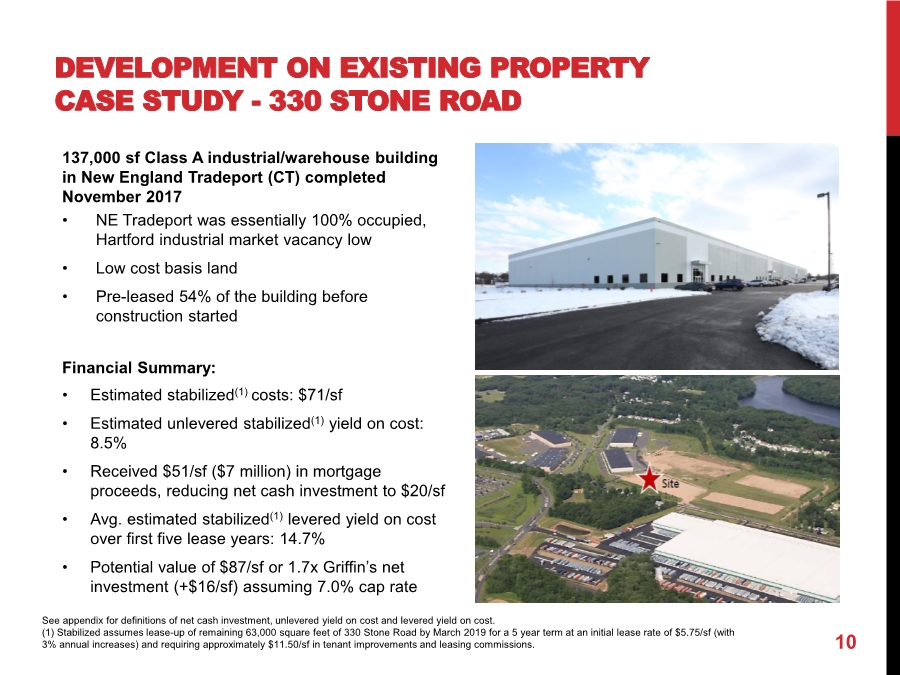
| DEVELOPMENT ON EXISTING PROPERTY CASE STUDY - 330 STONE ROAD 10 137,000 sf Class A industrial/warehouse building in New England Tradeport (CT) completed November 2017 • NE Tradeport was essentially 100% occupied, Hartford industrial market vacancy low • Low cost basis land • Pre-leased 54% of the building before construction started Financial Summary: • Estimated stabilized(1) costs: $71/sf • Estimated unlevered stabilized(1) yield on cost: 8.5% • Received $51/sf ($7 million) in mortgage proceeds, reducing net cash investment to $20/sf • Avg. estimated stabilized(1) levered yield on cost over first five lease years: 14.7% • Potential value of $87/sf or 1.7x Griffin’s net investment (+$16/sf) assuming 7.0% cap rate See appendix for definitions of net cash investment, unlevered yield on cost and levered yield on cost. (1) Stabilized assumes lease-up of remaining 63,000 square feet of 330 Stone Road by March 2019 for a 5 year term at an initial lease rate of $5.75/sf (with 3% annual increases) and requiring approximately $11.50/sf in tenant improvements and leasing commissions. |
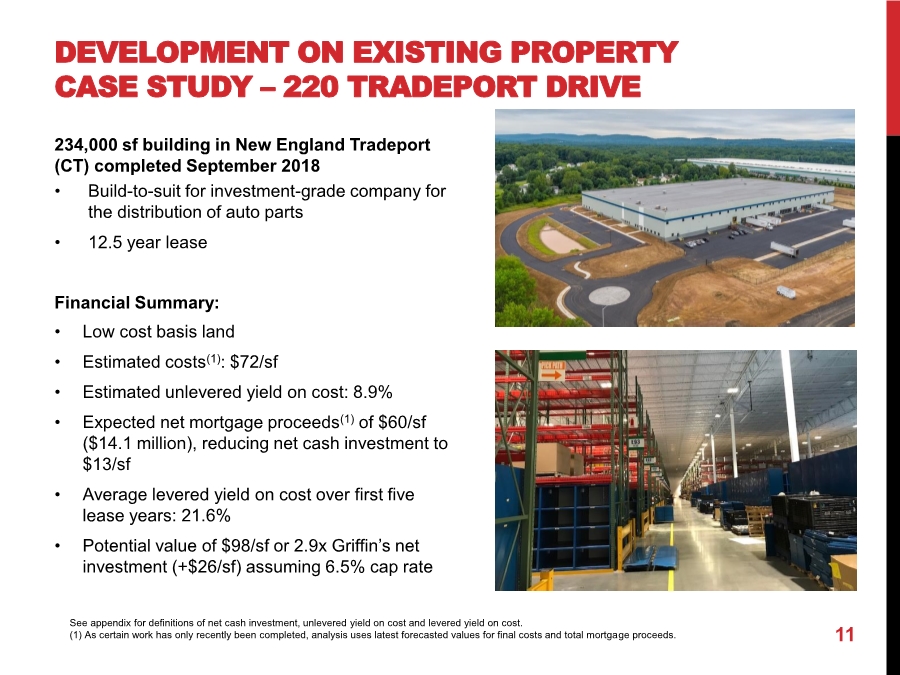
| 11 DEVELOPMENT ON EXISTING PROPERTY CASE STUDY – 220 TRADEPORT DRIVE 234,000 sf building in New England Tradeport (CT) completed September 2018 • Build-to-suit for investment-grade company for the distribution of auto parts • 12.5 year lease Financial Summary: • Low cost basis land • Estimated costs(1): $72/sf • Estimated unlevered yield on cost: 8.9% • Expected net mortgage proceeds(1) of $60/sf ($14.1 million), reducing net cash investment to $13/sf • Average levered yield on cost over first five lease years: 21.6% • Potential value of $98/sf or 2.9x Griffin’s net investment (+$26/sf) assuming 6.5% cap rate See appendix for definitions of net cash investment, unlevered yield on cost and levered yield on cost. (1) As certain work has only recently been completed, analysis uses latest forecasted values for final costs and total mortgage proceeds. |
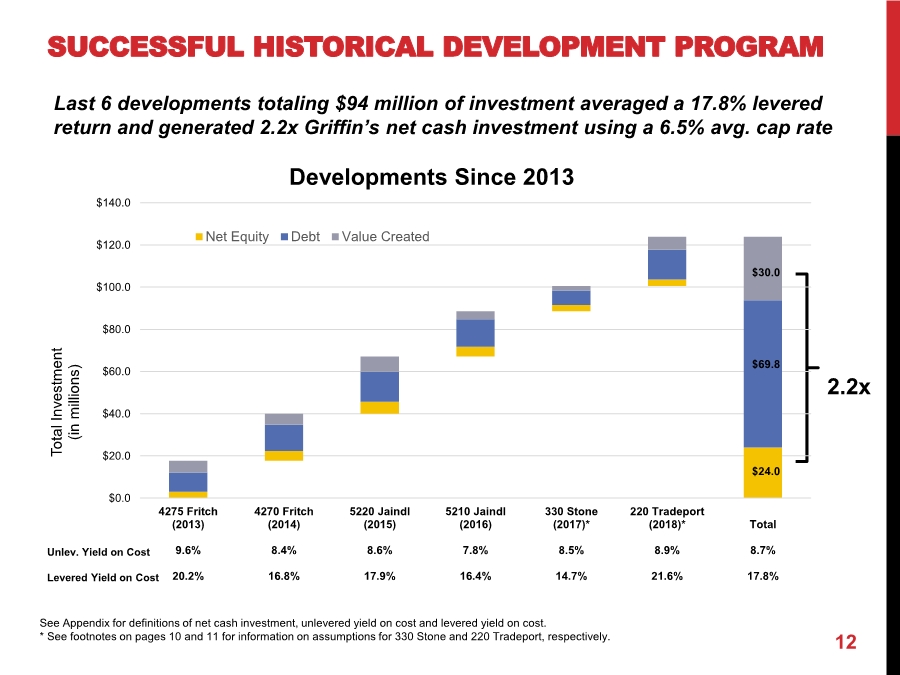
| SUCCESSFUL HISTORICAL DEVELOPMENT PROGRAM 12 Last 6 developments totaling $94 million of investment averaged a 17.8% levered return and generated 2.2x Griffin’s net cash investment using a 6.5% avg. cap rate 2.2x $0.0 $20.0 $40.0 $60.0 $80.0 $100.0 $120.0 $140.0 4275 Fritch (2013) 9.6% 20.2% 4270 Fritch (2014) 8.4% 16.8% 5220 Jaindl (2015) 8.6% 17.9% 5210 Jaindl (2016) 7.8% 16.4% 330 Stone (2017)* 8.5% 14.7% 220 Tradeport (2018)* 8.9% 21.6% Total 8.7% 17.8% Total Investment (in millions) Developments Since 2013 Net Equity Debt Value Created Unlev. Yield on Cost Levered Yield on Cost $30.0 $69.8 $24.0 See Appendix for definitions of net cash investment, unlevered yield on cost and levered yield on cost. * See footnotes on pages 10 and 11 for information on assumptions for 330 Stone and 220 Tradeport, respectively. |
| DEVELOPMENT PIPELINE 13 368,000 SF recently completed and 283,000 SF under construction 234,000 SF Build-to-Suit, New England Tradeport, CT • Lease commenced September 2018 134,000 SF “Spec” Building, Lehigh Valley, PA • Lehigh Valley market vacancy remains low with strong tenant activity and rising rents • Completed fiscal Q4 2018 - Marketing efforts ongoing 283,000 SF “Spec” 2 Building Development, Concord, NC • Closed on $2.6 million land purchase in July 2018 • Charlotte market vacancy remains low with strong absorption • Sitework started in fiscal Q4 2018; expect to complete both buildings in fiscal Q3 2019 Under agreement to purchase additional land sites in the Lehigh Valley and Charlotte Market • Closings on these parcels remain subject to several contingencies and are not expected before middle of 2019 |
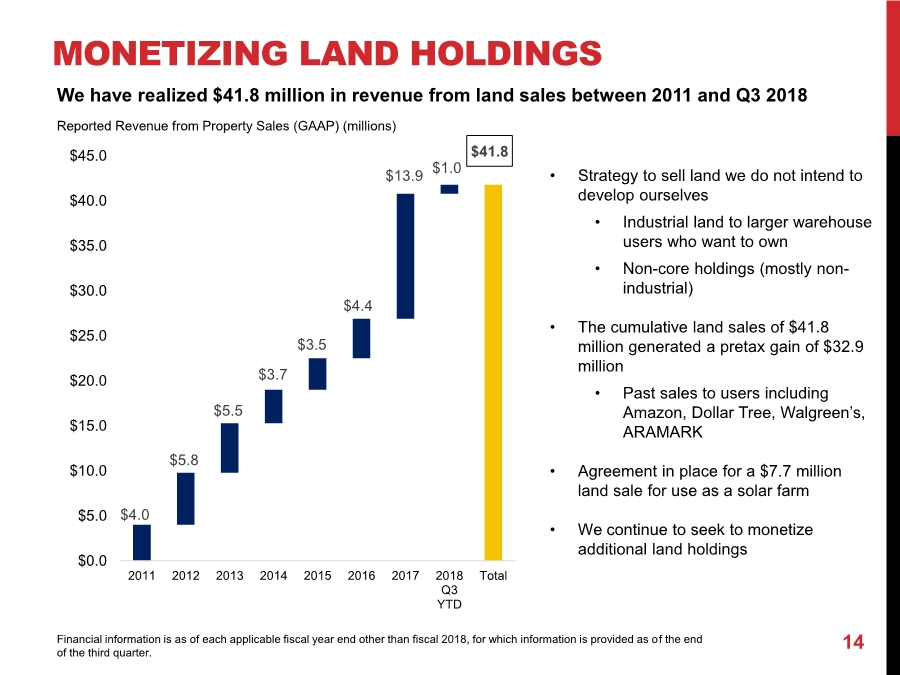
| MONETIZING LAND HOLDINGS 14 Reported Revenue from Property Sales (GAAP) (millions) • Strategy to sell land we do not intend to develop ourselves • Industrial land to larger warehouse users who want to own • Non-core holdings (mostly non- industrial) • The cumulative land sales of $41.8 million generated a pretax gain of $32.9 million • Past sales to users including Amazon, Dollar Tree, Walgreen’s, ARAMARK • Agreement in place for a $7.7 million land sale for use as a solar farm • We continue to seek to monetize additional land holdings $4.0 $5.8 $5.5 $3.7 $3.5 $4.4 $13.9 $1.0 $41.8 $0.0 $5.0 $10.0 $15.0 $20.0 $25.0 $30.0 $35.0 $40.0 $45.0 2011 2012 2013 2014 2015 2016 2017 2018 Q3 YTD Total We have realized $41.8 million in revenue from land sales between 2011 and Q3 2018 Financial information is as of each applicable fiscal year end other than fiscal 2018, for which information is provided as of the end of the third quarter. |
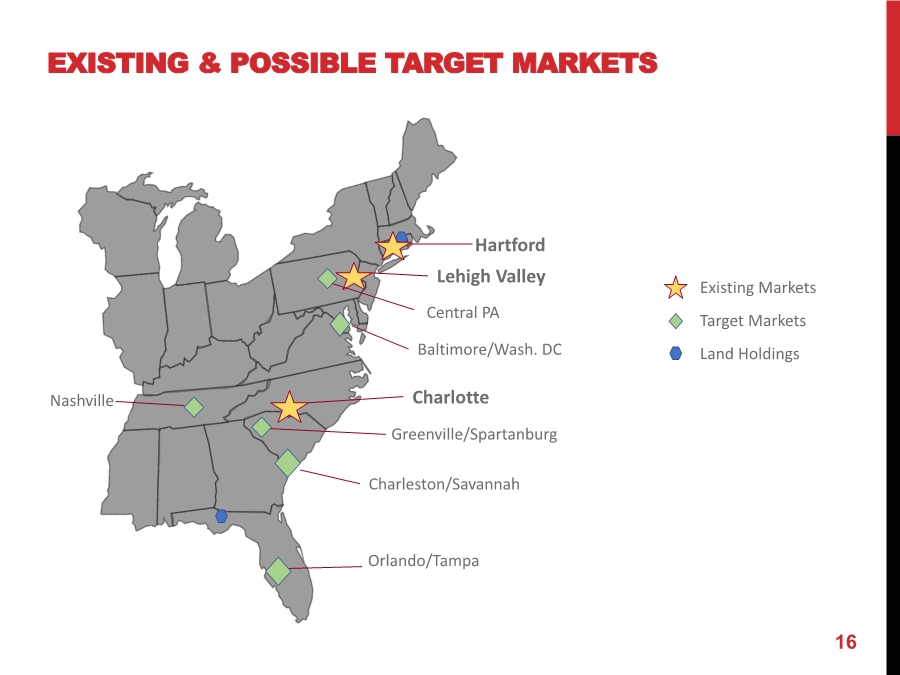
| ACQUISITION/GROWTH STRATEGY 15 Focus on industrial/warehouse buildings between 100,000 and 400,000 square feet – acquire existing buildings or land for development of such buildings • Key locations for national or international companies (regional/super-regional distribution) • Provide last mile of distribution / buildings to service the local population • For smaller tenants, the property may be a tenant’s sole or mission critical location Targeted regional strategy • Achieve critical mass in a handful of targeted markets; • Deep local market knowledge: leads to proprietary deal sourcing/ways to add value • Current focus on the Northeast, Middle Atlantic and Southeast • Markets with large/growing populations, close proximity to key transportation infrastructure (major highways, airports, rail, seaports) and supply constraints/barriers to entry • Examples: Charlotte, Nashville, Orlando, Charleston, Greenville/Spartanburg, Baltimore/Washington DC Types of Assets • Core or Value-Add Opportunities with conservative underwriting and cap rate discipline • Seek to buy at a discount to replacement cost - buy “buildings” (cost/foot) rather than leases • Well-located, functional and flexible assets – appeals to a broad set of users and tenant sizes • Single or multi-tenant, clear heights typically 24 feet and above, modest amount of office • Entitled and raw land to take through approvals; not seeking to land bank for the long term |
| EXISTING & POSSIBLE TARGET MARKETS 16 Hartford Lehigh Valley Charlotte Existing Markets Baltimore/Wash. DC Target Markets Charleston/Savannah Orlando/Tampa Nashville Land Holdings Greenville/Spartanburg Central PA |
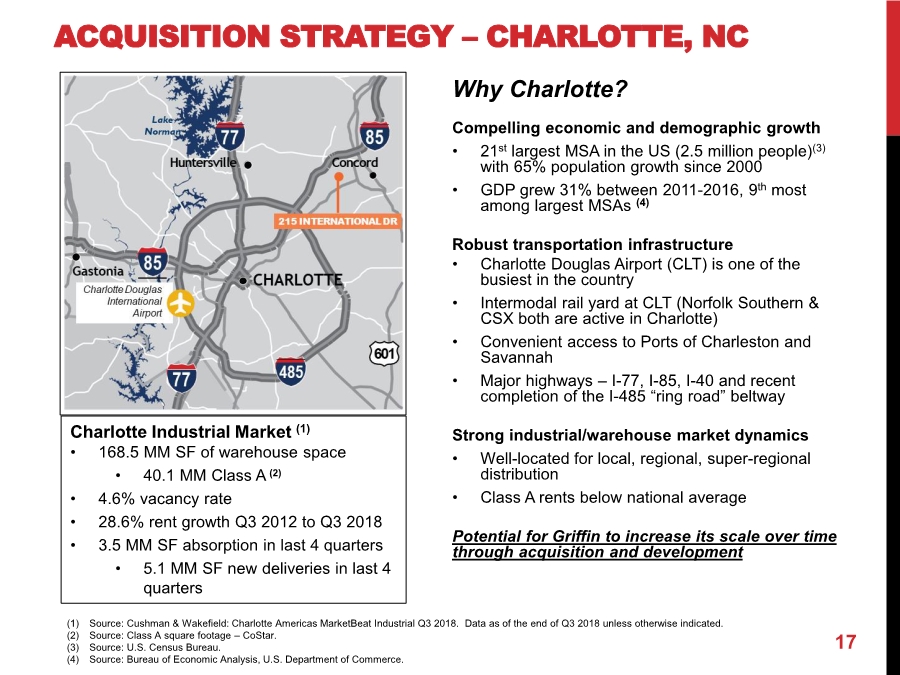
| ACQUISITION STRATEGY – CHARLOTTE, NC 17 Why Charlotte? Compelling economic and demographic growth • 21st largest MSA in the US (2.5 million people)(3) with 65% population growth since 2000 • GDP grew 31% between 2011-2016, 9th most among largest MSAs (4) Robust transportation infrastructure • Charlotte Douglas Airport (CLT) is one of the busiest in the country • Intermodal rail yard at CLT (Norfolk Southern & CSX both are active in Charlotte) • Convenient access to Ports of Charleston and Savannah • Major highways –I-77, I-85, I-40 and recent completion of the I-485 “ring road” beltway Strong industrial/warehouse market dynamics • Well-located for local, regional, super-regional distribution • Class A rents below national average Potential for Griffin to increase its scale over time through acquisition and development Charlotte Industrial Market (1) • 168.5 MM SF of warehouse space • 40.1 MM Class A (2) • 4.6% vacancy rate • 28.6% rent growth Q3 2012 to Q3 2018 • 3.5 MM SF absorption in last 4 quarters • 5.1 MM SF new deliveries in last 4 quarters (1) Source: Cushman & Wakefield: Charlotte Americas MarketBeat Industrial Q3 2018. Data as of the end of Q3 2018 unless otherwise indicated. (2) Source: Class A square footage – CoStar. (3) Source: U.S. Census Bureau. (4) Source: Bureau of Economic Analysis, U.S. Department of Commerce. |
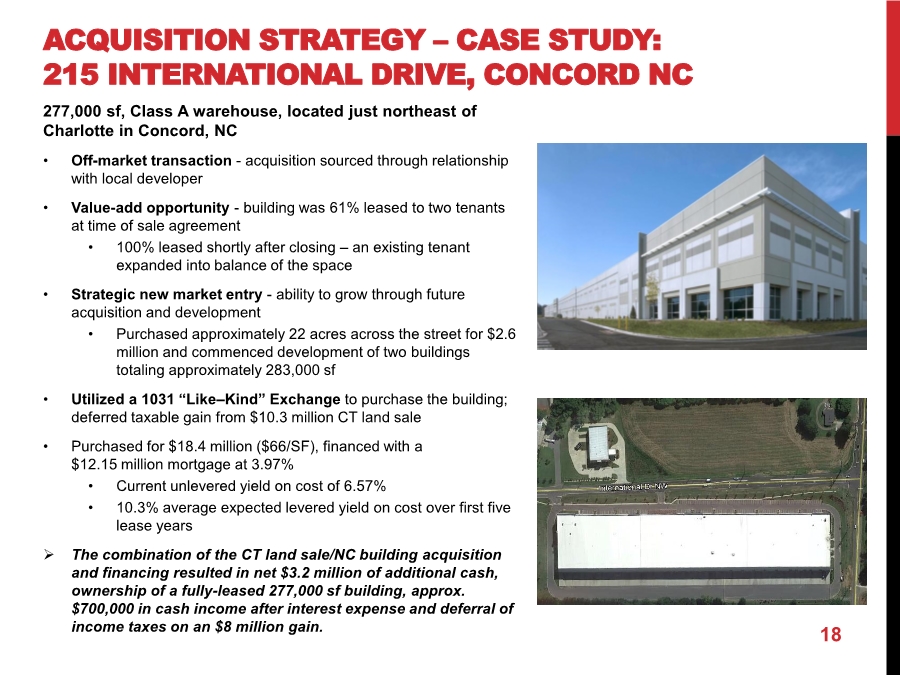
| ACQUISITION STRATEGY – CASE STUDY: 215 INTERNATIONAL DRIVE, CONCORD NC 18 277,000 sf, Class A warehouse, located just northeast of Charlotte in Concord, NC • Off-market transaction - acquisition sourced through relationship with local developer • Value-add opportunity - building was 61% leased to two tenants at time of sale agreement • 100% leased shortly after closing – an existing tenant expanded into balance of the space • Strategic new market entry - ability to grow through future acquisition and development • Purchased approximately 22 acres across the street for $2.6 million and commenced development of two buildings totaling approximately 283,000 sf • Utilized a 1031 “Like–Kind” Exchange to purchase the building; deferred taxable gain from $10.3 million CT land sale • Purchased for $18.4 million ($66/SF), financed with a $12.15 million mortgage at 3.97% • Current unlevered yield on cost of 6.57% • 10.3% average expected levered yield on cost over first five lease years The combination of the CT land sale/NC building acquisition and financing resulted in net $3.2 million of additional cash, ownership of a fully-leased 277,000 sf building, approx. $700,000 in cash income after interest expense and deferral of income taxes on an $8 million gain. |
| FINANCIALS AND VALUATION 19 |
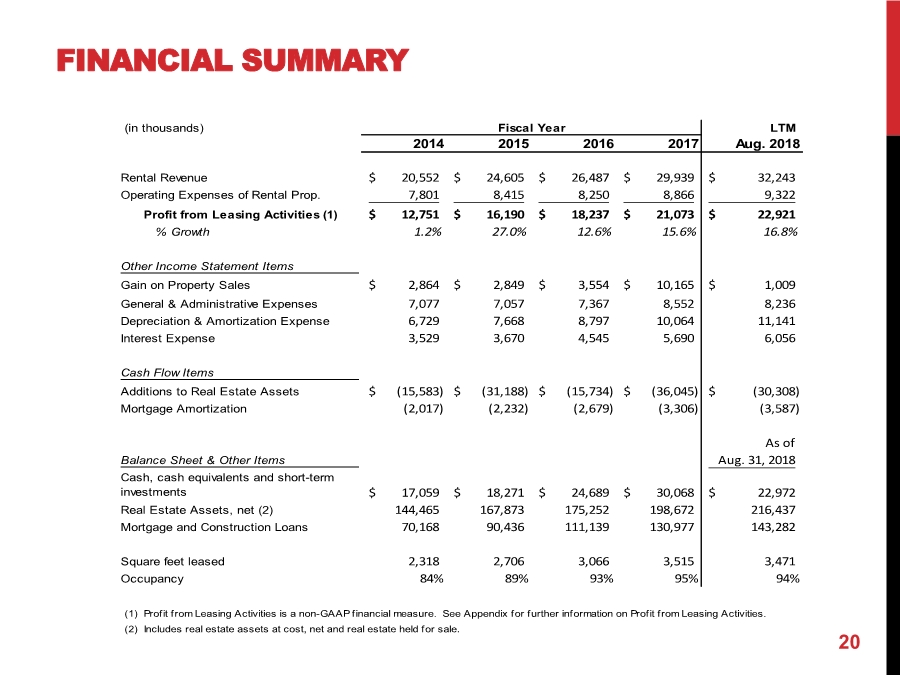
| FINANCIAL SUMMARY 20 (in thousands) LTM 2014 2015 2016 2017 Aug. 2018 Rental Revenue 20,552$ 24,605$ 26,487$ 29,939$ 32,243$ Operating Expenses of Rental Prop. 7,801 8,415 8,250 8,866 9,322 Profit from Leasing Activities (1) 12,751$ 16,190$ 18,237$ 21,073$ 22,921$ % Growth 1.2% 27.0% 12.6% 15.6% 16.8% Other Income Statement Items Gain on Property Sales 2,864$ 2,849$ 3,554$ 10,165$ 1,009$ General & Administrative Expenses 7,077 7,057 7,367 8,552 8,236 Depreciation & Amortization Expense 6,729 7,668 8,797 10,064 11,141 Interest Expense 3,529 3,670 4,545 5,690 6,056 Cash Flow Items Additions to Real Estate Assets (15,583)$ (31,188)$ (15,734)$ (36,045)$ (30,308)$ Mortgage Amortization (2,017) (2,232) (2,679) (3,306) (3,587) As of Balance Sheet & Other Items Aug. 31, 2018 Cash, cash equivalents and short-term investments 17,059$ 18,271$ 24,689$ 30,068$ 22,972$ Real Estate Assets, net (2) 144,465 167,873 175,252 198,672 216,437 Mortgage and Construction Loans 70,168 90,436 111,139 130,977 143,282 Square feet leased 2,318 2,706 3,066 3,515 3,471 Occupancy 84% 89% 93% 95% 94% (1) Profit from Leasing Activities is a non-GAAP financial measure. See Appendix for further information on Profit from Leasing Activities. (2) Includes real estate assets at cost, net and real estate held for sale. Fiscal Year |
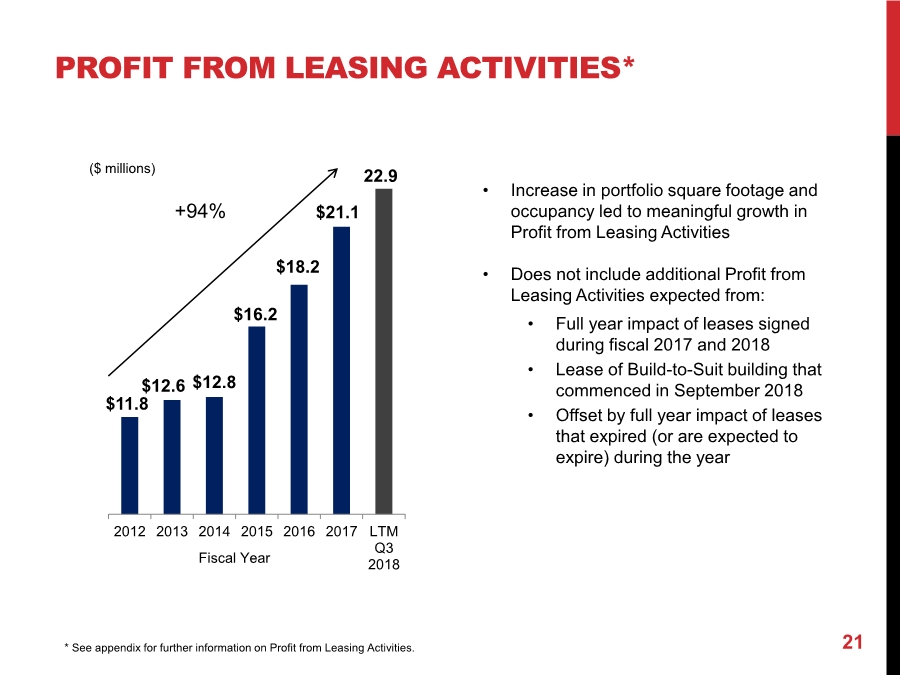
| PROFIT FROM LEASING ACTIVITIES* 21* See appendix for further information on Profit from Leasing Activities. $11.8 $12.6 $12.8 $16.2 $18.2 $21.1 22.9 2012 2013 2014 2015 2016 2017 LTM Q3 2018 +94% • Increase in portfolio square footage and occupancy led to meaningful growth in Profit from Leasing Activities • Does not include additional Profit from Leasing Activities expected from: • Full year impact of leases signed during fiscal 2017 and 2018 • Lease of Build-to-Suit building that commenced in September 2018 • Offset by full year impact of leases that expired (or are expected to expire) during the year ($ millions) Fiscal Year |
| IMPACT OF US TAX REFORM Corporate federal statutory tax rate reduced from 35% to 21% • Griffin typically has not paid federal income taxes (benefit of interest expense and depreciation expense) but if we do generate taxable income in the future, the savings would be material • Reduces tax disadvantage of C-Corp structure versus REIT (0% tax rate) • Though REIT dividends (as a pass-through entity) benefit from a more favorable tax rate vs. C-Corp. dividends • Fiscal 2018 results include a non-cash charge (included in income tax provision) for remeasurement of deferred tax assets at the new tax rate As a real estate company, Griffin can elect to avoid the cap/limitation on the deductibility of interest expense from debt • As an offset, Griffin would lose some benefits of accelerated depreciation Section 1031 Like-Kind Exchanges remain mostly intact Net impact to Griffin’s cash payment of taxes expected to be quite small in the near/medium term. 22 |
| VALUATION CONSIDERATIONS Griffin has generated strong growth in its Profit from Leasing Activities(1) • 16.8% growth for the LTM period ended August 31, 2018 and 15.6% for fiscal 2017 • Given our size, new developments, acquisitions or sizable leases can have a material impact on our profit growth • Profit from Leasing Activities(1) for the LTM period ended August 31, 2018 does not include: • Full year impacts of leases signed in the fiscal 2017 fourth quarter and the impact of the build- to-suit that was completed in the fourth quarter of fiscal 2018 (partially offset by leases that expired, or are expected to expire, during the fiscal year) All of Griffin’s debt outstanding is locked in at or swapped into fixed rates with a weighted average rate of 4.30% as of August 31, 2018 • Eliminates exposure to higher interest expense on current borrowings • Less than $7.7 million (5%) out of $143.3 million outstanding matures before 2025 Rates may have bottomed and future mortgages likely will be above the current average Typical “income” valuation metrics are difficult to apply to Griffin • Undeveloped land accounts for a portion of Griffin’s “value” but contributes to G&A cost • Book Value of undeveloped land is less than $5,900/acre(1) which we believe is well below market (note recent sales transactions and land currently under agreement of sale) • Ability to further leverage G&A 23(1) See appendix for further information on Profit from Leasing Activities and Book Value of Undeveloped Land. |
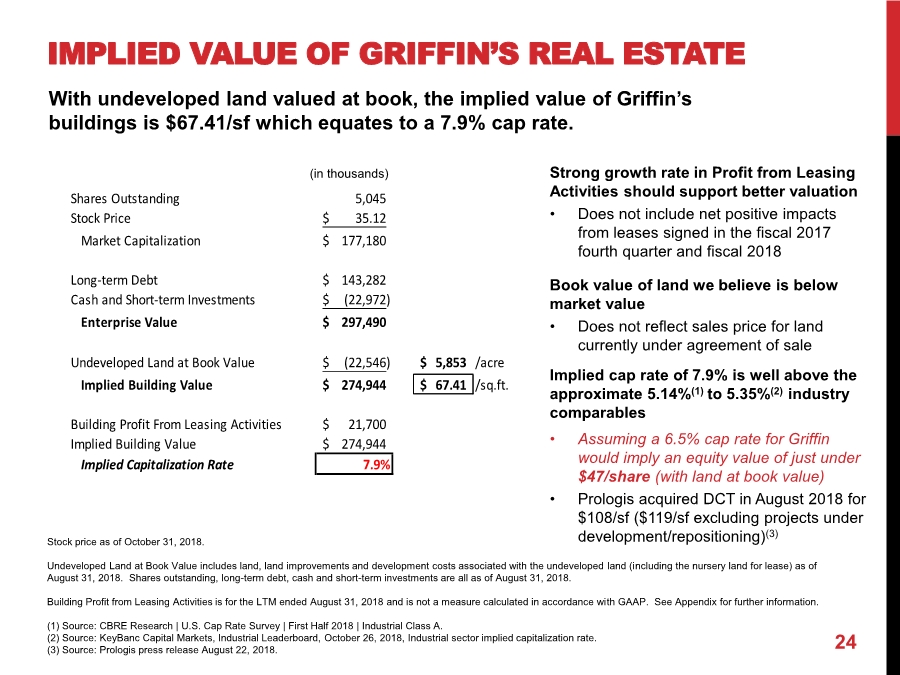
| Strong growth rate in Profit from Leasing Activities should support better valuation • Does not include net positive impacts from leases signed in the fiscal 2017 fourth quarter and fiscal 2018 Book value of land we believe is below market value • Does not reflect sales price for land currently under agreement of sale Implied cap rate of 7.9% is well above the approximate 5.14%(1) to 5.35%(2) industry comparables • Assuming a 6.5% cap rate for Griffin would imply an equity value of just under $47/share (with land at book value) • Prologis acquired DCT in August 2018 for $108/sf ($119/sf excluding projects under development/repositioning)(3) (in thousands) 24 IMPLIED VALUE OF GRIFFIN’S REAL ESTATE Stock price as of October 31, 2018. Undeveloped Land at Book Value includes land, land improvements and development costs associated with the undeveloped land (including the nursery land for lease) as of August 31, 2018. Shares outstanding, long-term debt, cash and short-term investments are all as of August 31, 2018. Building Profit from Leasing Activities is for the LTM ended August 31, 2018 and is not a measure calculated in accordance with GAAP. See Appendix for further information. (1) Source: CBRE Research | U.S. Cap Rate Survey | First Half 2018 | Industrial Class A. (2) Source: KeyBanc Capital Markets, Industrial Leaderboard, October 26, 2018, Industrial sector implied capitalization rate. (3) Source: Prologis press release August 22, 2018. With undeveloped land valued at book, the implied value of Griffin’s buildings is $67.41/sf which equates to a 7.9% cap rate. Shares Outstanding 5,045 Stock Price 35.12$ Market Capitalization 177,180$ Long-term Debt 143,282$ Cash and Short-term Investments (22,972)$ Enterprise Value 297,490$ Undeveloped Land at Book Value (22,546)$ 5,853$ /acre Implied Building Value 274,944$ 67.41$ /sq.ft. Building Profit From Leasing Activities 21,700$ Implied Building Value 274,944$ Implied Capitalization Rate 7.9% |
| WHO IS GRIFFIN? Griffin acquires, develops, and manages industrial real estate properties in select infill, emerging and regional markets Focus on smaller light industrial/warehouse buildings (100,000 to 400,000 square feet) Converts its undeveloped land into income producing properties Publicly traded since the 1997 spin-off with a corporate history dating back to 1906 Enterprise value of approximately $297 million* * Based on stock price as of October 31, 2018 and balance sheet data as of August 31, 2018. See page 24 for calculation. 25 |
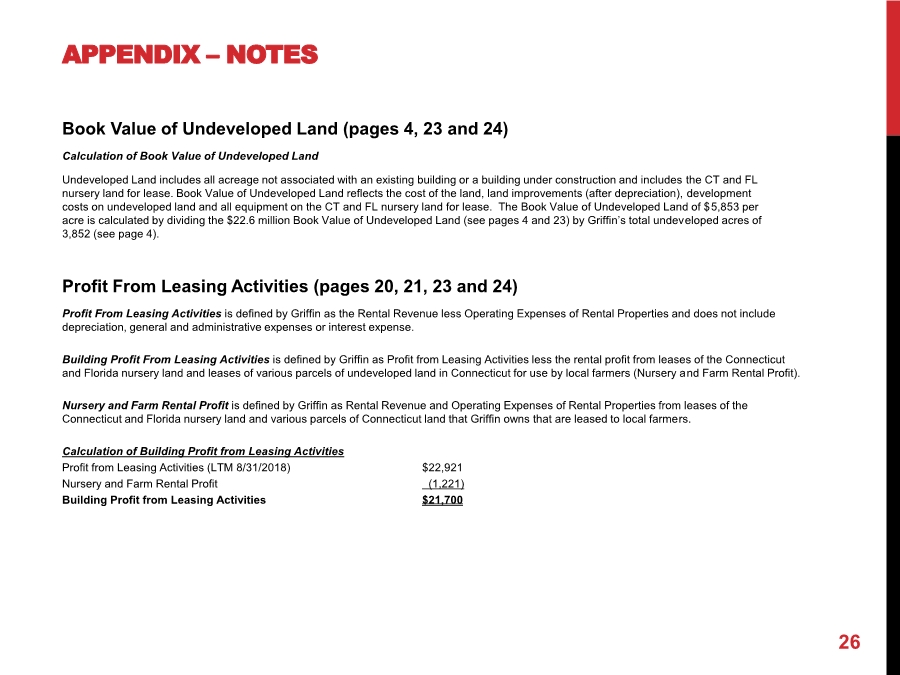
| APPENDIX –NOTES Profit From Leasing Activities (pages 20, 21, 23 and 24) Profit From Leasing Activities is defined by Griffin as the Rental Revenue less Operating Expenses of Rental Properties and does not include depreciation, general and administrative expenses or interest expense. Building Profit From Leasing Activities is defined by Griffin as Profit from Leasing Activities less the rental profit from leases of the Connecticut and Florida nursery land and leases of various parcels of undeveloped land in Connecticut for use by local farmers (Nursery and Farm Rental Profit). Nursery and Farm Rental Profit is defined by Griffin as Rental Revenue and Operating Expenses of Rental Properties from leases of the Connecticut and Florida nursery land and various parcels of Connecticut land that Griffin owns that are leased to local farmers. Calculation of Building Profit from Leasing Activities Profit from Leasing Activities (LTM 8/31/2018) $22,921 Nursery and Farm Rental Profit (1,221) Building Profit from Leasing Activities $21,700 26 Book Value of Undeveloped Land (pages 4, 23 and 24) Calculation of Book Value of Undeveloped Land Undeveloped Land includes all acreage not associated with an existing building or a building under construction and includes the CT and FL nursery land for lease. Book Value of Undeveloped Land reflects the cost of the land, land improvements (after depreciation), development costs on undeveloped land and all equipment on the CT and FL nursery land for lease. The Book Value of Undeveloped Land of $5,853 per acre is calculated by dividing the $22.6 million Book Value of Undeveloped Land (see pages 4 and 23) by Griffin’s total undeveloped acres of 3,852 (see page 4). |
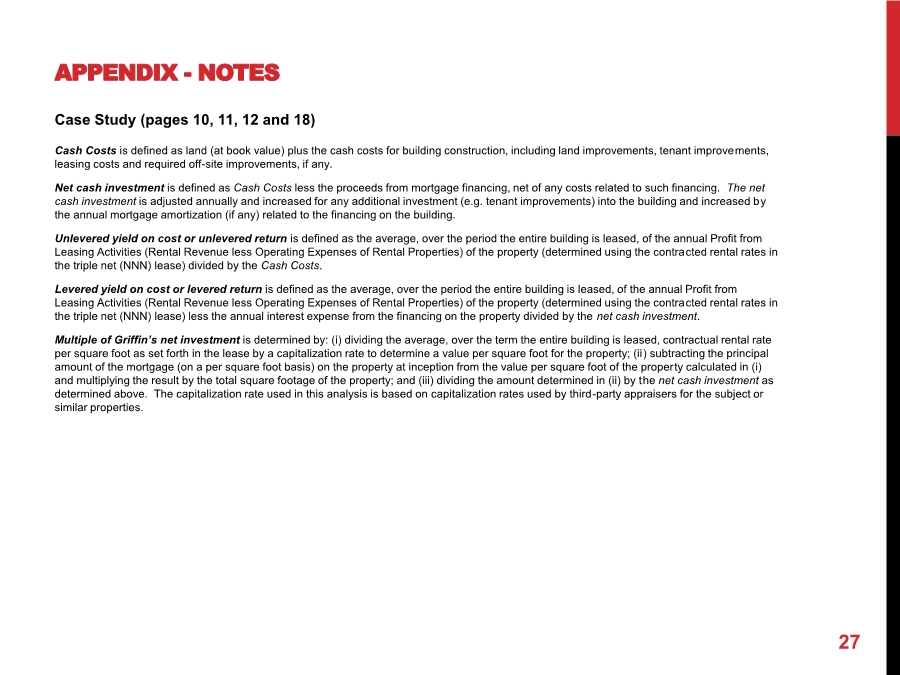
| APPENDIX -NOTES 27 Case Study (pages 10, 11, 12 and 18) Cash Costs is defined as land (at book value) plus the cash costs for building construction, including land improvements, tenant improvements, leasing costs and required off-site improvements, if any. Net cash investment is defined as Cash Costs less the proceeds from mortgage financing, net of any costs related to such financing. The net cash investment is adjusted annually and increased for any additional investment (e.g. tenant improvements) into the building and increased by the annual mortgage amortization (if any) related to the financing on the building. Unlevered yield on cost or unlevered return is defined as the average, over the period the entire building is leased, of the annual Profit from Leasing Activities (Rental Revenue less Operating Expenses of Rental Properties) of the property (determined using the contracted rental rates in the triple net (NNN) lease) divided by the Cash Costs. Levered yield on cost or levered return is defined as the average, over the period the entire building is leased, of the annual Profit from Leasing Activities (Rental Revenue less Operating Expenses of Rental Properties) of the property (determined using the contracted rental rates in the triple net (NNN) lease) less the annual interest expense from the financing on the property divided by the net cash investment. Multiple of Griffin’s net investment is determined by: (i) dividing the average, over the term the entire building is leased, contractual rental rate per square foot as set forth in the lease by a capitalization rate to determine a value per square foot for the property; (ii) subtracting the principal amount of the mortgage (on a per square foot basis) on the property at inception from the value per square foot of the property calculated in (i) and multiplying the result by the total square footage of the property; and (iii) dividing the amount determined in (ii) by the net cash investment as determined above. The capitalization rate used in this analysis is based on capitalization rates used by third-party appraisers for the subject or similar properties. |
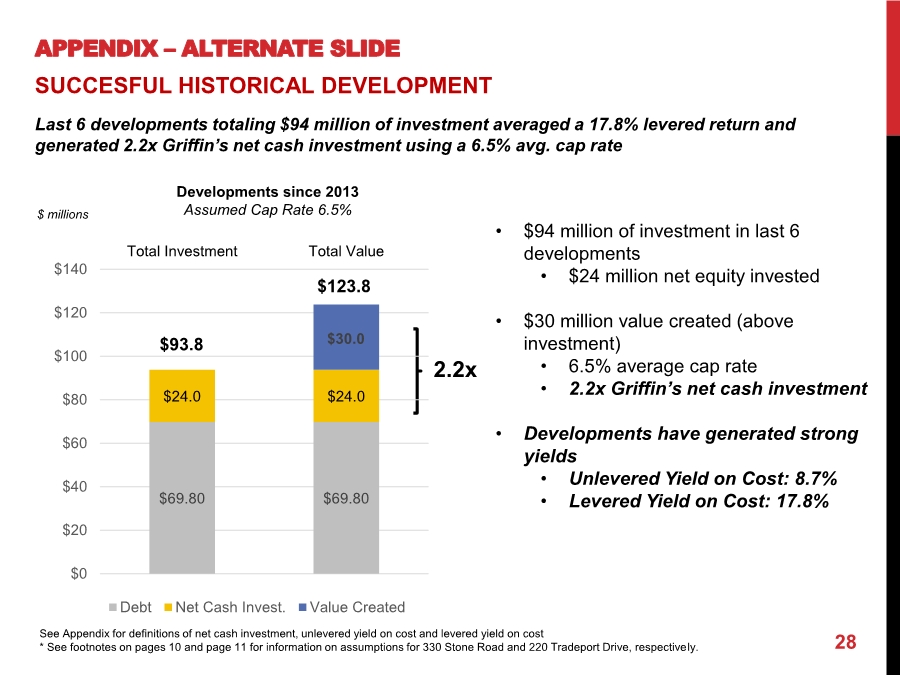
| APPENDIX – ALTERNATE SLIDE 28 SUCCESFUL HISTORICAL DEVELOPMENT Last 6 developments totaling $94 million of investment averaged a 17.8% levered return and generated 2.2x Griffin’s net cash investment using a 6.5% avg. cap rate 2.2x See Appendix for definitions of net cash investment, unlevered yield on cost and levered yield on cost * See footnotes on pages 10 and page 11 for information on assumptions for 330 Stone Road and 220 Tradeport Drive, respectively. $69.80 $69.80 $24.0 $24.0 $30.0 $0 $20 $40 $60 $80 $100 $120 $140 Total Investment Total Value Debt Net Cash Invest. Value Created Developments since 2013 Assumed Cap Rate 6.5%$ millions $93.8 $123.8 • $94 million of investment in last 6 developments • $24 million net equity invested • $30 million value created (above investment) • 6.5% average cap rate • 2.2x Griffin’s net cash investment • Developments have generated strong yields • Unlevered Yield on Cost: 8.7% • Levered Yield on Cost: 17.8% |