Attached files
| file | filename |
|---|---|
| EX-32.2 - CFO CERTIFICATION - SECTION 906 - COHEN & STEERS, INC. | cns10q-63018ex322.htm |
| EX-32.1 - CEO CERTIFICATION - SECTION 906 - COHEN & STEERS, INC. | cns10q-63018ex321.htm |
| EX-31.2 - CFO CERTIFICATION - SECTION 302 - COHEN & STEERS, INC. | cns10q-63018ex312.htm |
| EX-31.1 - CEO CERTIFICATION - SECTION 302 - COHEN & STEERS, INC. | cns10q-63018ex311.htm |
________________________________________________________
UNITED STATES
SECURITIES AND EXCHANGE COMMISSION
WASHINGTON, DC 20549
FORM 10-Q
(Mark One)
x | QUARTERLY REPORT PURSUANT TO SECTION 13 OR 15(d) OF THE SECURITIES EXCHANGE ACT OF 1934 FOR THE QUARTERLY PERIOD ENDED JUNE 30, 2018 |
OR
o | TRANSITION REPORT PURSUANT TO SECTION 13 OR 15(d) OF THE SECURITIES EXCHANGE ACT OF 1934 FOR THE TRANSITION PERIOD FROM TO |
Commission File Number: 001-32236
________________
COHEN & STEERS, INC.
(Exact Name of Registrant as Specified in its Charter)
________________
Delaware | 14-1904657 | |
(State or Other Jurisdiction of Incorporation or Organization) | (I.R.S. Employer Identification No.) | |
280 Park Avenue New York, NY | 10017 | |
(Address of Principal Executive Offices) | (Zip Code) | |
(212) 832-3232
(Registrant’s Telephone Number, Including Area Code)
________________
Indicate by check mark whether the registrant: (1) has filed all reports required to be filed by Section 13 or 15(d) of the Securities Exchange Act of 1934 during the preceding 12 months (or for such shorter period that the registrant was required to file such reports), and (2) has been subject to such filing requirements for the past 90 days. Yes x No o
Indicate by check mark whether the registrant has submitted electronically and posted on its corporate website, if any, every Interactive Data File required to be submitted and posted pursuant to Rule 405 of Regulation S-T (§ 232.405 of this chapter) during the preceding 12 months (or for such shorter period that the registrant was required to submit and post such files). Yes x No o
Indicate by check mark whether the registrant is a large accelerated filer, an accelerated filer, a non-accelerated filer, a smaller reporting company, or an emerging growth company. See the definitions of “large accelerated filer,” “accelerated filer,” “smaller reporting company,” and “emerging growth company” in Rule 12b-2 of the Exchange Act. (Check one):
Large accelerated filer | x | Accelerated filer | o | |||
Smaller reporting company | o | |||||
Non-accelerated filer | o (Do not check if a smaller reporting company) | Emerging growth company | o | |||
If an emerging growth company, indicate by check mark if the registrant has elected not to use the extended transition period for complying with any new or revised financial accounting standards provided pursuant to Section 13(a) of the Exchange Act. o
Indicate by check mark whether the registrant is a shell company (as defined in Rule 12b-2 of the Exchange Act). Yes o No x
The number of shares of the registrant’s common stock, par value $0.01 per share, outstanding as of July 31, 2018 was 46,757,286.
________________________________________________________
COHEN & STEERS, INC. AND SUBSIDIARIES
Form 10-Q
Index
Page | ||
Part I. | Financial Information | |
Item 1. | ||
Item 2. | ||
Item 3. | ||
Item 4. | ||
Part II. | Other Information * | |
Item 1. | ||
Item 1A. | ||
Item 2. | ||
Item 6. | ||
* Items other than those listed above have been omitted because they are not applicable.
Forward-Looking Statements
This report and other documents filed by us contain forward-looking statements within the meaning of Section 27A of the Securities Act of 1933, as amended, and Section 21E of the Securities Exchange Act of 1934, as amended, which reflect management’s current views with respect to, among other things, our operations and financial performance. You can identify these forward-looking statements by the use of words such as “outlook,” “believes,” “expects,” “potential,” “may,” “should,” “seeks,” “predicts,” “intends,” “plans,” “estimates,” “anticipates” or the negative versions of these words or other comparable words. Such forward-looking statements are subject to various risks and uncertainties. Accordingly, there are or will be important factors that could cause actual outcomes or results to differ materially from those indicated in these forward-looking statements. We believe that these factors include, but are not limited to, the risks described in the Risk Factors section of our Annual Report on Form 10-K for the year ended December 31, 2017 (the Form 10-K), which is accessible on the Securities and Exchange Commission’s website at www.sec.gov and on our website at www.cohenandsteers.com. These factors are not exhaustive and should be read in conjunction with the other cautionary statements that are included in this report, the Form 10-K and our other filings with the Securities and Exchange Commission. We undertake no obligation to publicly update or review any forward-looking statement, whether as a result of new information, future developments or otherwise.
PART I—Financial Information
Item 1. Financial Statements
COHEN & STEERS, INC. AND SUBSIDIARIES
CONDENSED CONSOLIDATED STATEMENTS OF FINANCIAL CONDITION (Unaudited)
(in thousands, except share data)
June 30, 2018 | December 31, 2017 | ||||||
ASSETS | |||||||
Cash and cash equivalents | $ | 193,729 | $ | 193,452 | |||
Investments ($414) (1) ($112,521 and $68,101) (2) | 147,668 | 108,106 | |||||
Accounts receivable | 50,586 | 53,854 | |||||
Due from brokers ($8,978 and $5,410) (2) | 11,435 | 6,429 | |||||
Property and equipment—net | 14,571 | 15,040 | |||||
Goodwill and intangible assets—net | 20,028 | 20,379 | |||||
Deferred income tax asset—net | 3,845 | 5,812 | |||||
Other assets ($1,817 and $931) (2) | 8,254 | 7,053 | |||||
Total assets | $ | 450,116 | $ | 410,125 | |||
LIABILITIES AND STOCKHOLDERS’ EQUITY | |||||||
Liabilities: | |||||||
Accrued compensation | $ | 20,737 | $ | 41,370 | |||
Distribution and service fees payable | 6,361 | 6,231 | |||||
Income tax payable | 14,309 | 19,892 | |||||
Due to brokers ($5,480 and $3,203) (2) | 5,475 | 3,282 | |||||
Deferred rent | 5,877 | 5,994 | |||||
Other liabilities and accrued expenses ($310 and $291) (2) | 9,357 | 10,025 | |||||
Total liabilities | 62,116 | 86,794 | |||||
Commitments and contingencies (See Note 11) | |||||||
Redeemable noncontrolling interest | 84,995 | 47,795 | |||||
Stockholders’ equity: | |||||||
Common stock, $0.01 par value; 500,000,000 shares authorized; 51,802,555 and 51,104,593 shares issued at June 30, 2018 and December 31, 2017, respectively | 518 | 511 | |||||
Additional paid-in capital | 584,035 | 570,486 | |||||
Accumulated deficit | (111,333 | ) | (137,972 | ) | |||
Accumulated other comprehensive loss, net of tax | (5,843 | ) | (3,671 | ) | |||
Less: Treasury stock, at cost, 5,049,225 and 4,789,608 shares at June 30, 2018 and December 31, 2017, respectively | (164,372 | ) | (153,818 | ) | |||
Total stockholders’ equity | 303,005 | 275,536 | |||||
Total liabilities and stockholders’ equity | $ | 450,116 | $ | 410,125 | |||
_________________________
(1) | Pledged as collateral attributable to the consolidated balances of the Cohen & Steers Active Commodities Strategy Fund, Inc. at December 31, 2017. |
(2) | Asset and liability amounts in parentheses represent the aggregated balances at June 30, 2018 and December 31, 2017 attributable to variable interest entities consolidated by the Company. Refer to Note 4 for further discussion. |
See notes to condensed consolidated financial statements
1
COHEN & STEERS, INC. AND SUBSIDIARIES
CONDENSED CONSOLIDATED STATEMENTS OF OPERATIONS (Unaudited)
(in thousands, except per share data)
Three Months Ended June 30, | Six Months Ended June 30, | ||||||||||||||
2018 | 2017 (1) | 2018 | 2017 (1) | ||||||||||||
Revenue: | |||||||||||||||
Investment advisory and administration fees | $ | 84,420 | $ | 82,236 | $ | 168,854 | $ | 161,844 | |||||||
Distribution and service fees | 7,257 | 7,663 | 14,657 | 15,059 | |||||||||||
Portfolio consulting and other | 2,733 | 2,815 | 5,363 | 5,552 | |||||||||||
Total revenue | 94,410 | 92,714 | 188,874 | 182,455 | |||||||||||
Expenses: | |||||||||||||||
Employee compensation and benefits | 32,506 | 30,412 | 63,662 | 59,795 | |||||||||||
Distribution and service fees | 12,440 | 13,594 | 25,282 | 26,757 | |||||||||||
General and administrative | 11,972 | 10,328 | 24,157 | 20,884 | |||||||||||
Depreciation and amortization | 1,205 | 1,023 | 2,267 | 2,134 | |||||||||||
Total expenses | 58,123 | 55,357 | 115,368 | 109,570 | |||||||||||
Operating income | 36,287 | 37,357 | 73,506 | 72,885 | |||||||||||
Non-operating income (loss): | |||||||||||||||
Interest and dividend income | 2,886 | 786 | 4,687 | 1,285 | |||||||||||
Gain (loss) from investments—net | (603 | ) | (194 | ) | (5,105 | ) | (175 | ) | |||||||
Other gains (losses)—net | (3,061 | ) | (331 | ) | (559 | ) | (622 | ) | |||||||
Total non-operating income (loss) | (778 | ) | 261 | (977 | ) | 488 | |||||||||
Income before provision for income taxes | 35,509 | 37,618 | 72,529 | 73,373 | |||||||||||
Provision for income taxes | 9,940 | 14,620 | 18,036 | 27,431 | |||||||||||
Net income | 25,569 | 22,998 | 54,493 | 45,942 | |||||||||||
Less: Net (income) loss attributable to redeemable noncontrolling interest | 4,390 | 476 | 3,052 | 517 | |||||||||||
Net income attributable to common stockholders | $ | 29,959 | $ | 23,474 | $ | 57,545 | $ | 46,459 | |||||||
Earnings per share attributable to common stockholders: | |||||||||||||||
Basic | $ | 0.64 | $ | 0.51 | $ | 1.23 | $ | 1.00 | |||||||
Diluted | $ | 0.63 | $ | 0.50 | $ | 1.22 | $ | 0.99 | |||||||
Dividends declared per share | $ | 0.33 | $ | 0.28 | $ | 0.66 | $ | 0.56 | |||||||
Weighted average shares outstanding: | |||||||||||||||
Basic | 46,819 | 46,373 | 46,751 | 46,308 | |||||||||||
Diluted | 47,311 | 46,902 | 47,237 | 46,753 | |||||||||||
_________________________
(1) | Certain amounts have been recast to reflect the Company's adoption of the new revenue recognition accounting standard on January 1, 2018. See Notes 2 and 3 for further discussion of the Company's recently adopted accounting pronouncements and revenue, respectively. |
See notes to condensed consolidated financial statements
2
COHEN & STEERS, INC. AND SUBSIDIARIES
CONDENSED CONSOLIDATED STATEMENTS OF COMPREHENSIVE INCOME (Unaudited)
(in thousands)
Three Months Ended June 30, | Six Months Ended June 30, | ||||||||||||||
2018 | 2017 | 2018 | 2017 | ||||||||||||
Net income | $ | 25,569 | $ | 22,998 | $ | 54,493 | $ | 45,942 | |||||||
Less: Net (income) loss attributable to redeemable noncontrolling interest | 4,390 | 476 | 3,052 | 517 | |||||||||||
Net income attributable to common stockholders | 29,959 | 23,474 | 57,545 | 46,459 | |||||||||||
Other comprehensive income (loss), net of tax: | |||||||||||||||
Foreign currency translation gain (loss) | (1,615 | ) | 887 | (1,077 | ) | 1,374 | |||||||||
Net unrealized gain (loss) from available-for-sale investments (1) | — | (296 | ) | — | 118 | ||||||||||
Reclassification to statements of operations of (gain) loss from available-for-sale investments | — | (83 | ) | — | (118 | ) | |||||||||
Other comprehensive income (loss) | (1,615 | ) | 508 | (1,077 | ) | 1,374 | |||||||||
Total comprehensive income attributable to common stockholders | $ | 28,344 | $ | 23,982 | $ | 56,468 | $ | 47,833 | |||||||
_________________________
(1) | Due to the adoption and application of the amendments to the financial instruments accounting standard on January 1, 2018, realized and unrealized gains (losses) from equity investments at fair value are recognized through earnings rather than through other comprehensive income. See Notes 2 and 4 for further discussion of the Company's recently adopted accounting pronouncements and investments, respectively. |
See notes to condensed consolidated financial statements
3
COHEN & STEERS, INC. AND SUBSIDIARIES
CONDENSED CONSOLIDATED STATEMENTS OF CHANGES IN STOCKHOLDERS’ EQUITY AND
REDEEMABLE NONCONTROLLING INTEREST (Unaudited)
For the Six Months Ended June 30, 2018 and 2017
(in thousands)
Common Stock | Additional Paid-In Capital | Accumulated Deficit | Accumulated Other Comprehensive Income (Loss), Net of Tax | Treasury Stock | Total Stockholders’ Equity | Redeemable Noncontrolling Interest | Shares of Common Stock, Net | ||||||||||||||||||||||||
January 1, 2017 | $ | 504 | $ | 543,829 | $ | (127,957 | ) | $ | (5,885 | ) | $ | (144,677 | ) | $ | 265,814 | $ | 853 | 45,890 | |||||||||||||
Dividends | — | — | (26,798 | ) | — | — | (26,798 | ) | — | — | |||||||||||||||||||||
Issuance of common stock | 7 | 467 | — | — | — | 474 | — | 673 | |||||||||||||||||||||||
Repurchase of common stock | — | — | — | — | (9,072 | ) | (9,072 | ) | — | (263 | ) | ||||||||||||||||||||
Issuance of restricted stock units | — | 1,156 | — | — | — | 1,156 | — | — | |||||||||||||||||||||||
Amortization of restricted stock units—net | — | 11,002 | (285 | ) | — | — | 10,717 | — | — | ||||||||||||||||||||||
Forfeitures of restricted stock units | — | (71 | ) | — | — | — | (71 | ) | — | — | |||||||||||||||||||||
Net income (loss) | — | — | 46,459 | — | — | 46,459 | (517 | ) | — | ||||||||||||||||||||||
Other comprehensive income (loss), net of tax | — | — | — | 1,374 | — | 1,374 | — | — | |||||||||||||||||||||||
Contributions from redeemable noncontrolling interest | — | — | — | — | — | — | 45,132 | — | |||||||||||||||||||||||
Distributions to redeemable noncontrolling interest | — | — | — | — | — | — | (49 | ) | — | ||||||||||||||||||||||
June 30, 2017 | $ | 511 | $ | 556,383 | $ | (108,581 | ) | $ | (4,511 | ) | $ | (153,749 | ) | $ | 290,053 | $ | 45,419 | 46,300 | |||||||||||||
January 1, 2018 | $ | 511 | $ | 570,486 | $ | (137,972 | ) | $ | (3,671 | ) | $ | (153,818 | ) | $ | 275,536 | $ | 47,795 | 46,315 | |||||||||||||
Cumulative-effect adjustment due to the adoption of the new financial instruments accounting standard | — | — | 1,095 | (1,095 | ) | — | — | — | — | ||||||||||||||||||||||
Dividends | — | — | (32,001 | ) | — | — | (32,001 | ) | — | — | |||||||||||||||||||||
Issuance of common stock | 7 | 437 | — | — | — | 444 | — | 698 | |||||||||||||||||||||||
Repurchase of common stock | — | — | — | — | (10,554 | ) | (10,554 | ) | — | (260 | ) | ||||||||||||||||||||
Issuance of restricted stock units | — | 1,434 | — | — | — | 1,434 | — | — | |||||||||||||||||||||||
Amortization of restricted stock units—net | — | 11,686 | — | — | — | 11,686 | — | — | |||||||||||||||||||||||
Forfeitures of restricted stock units | — | (8 | ) | — | — | — | (8 | ) | — | — | |||||||||||||||||||||
Net income (loss) | — | — | 57,545 | — | — | 57,545 | (3,052 | ) | — | ||||||||||||||||||||||
Other comprehensive income (loss), net of tax | — | — | — | (1,077 | ) | — | (1,077 | ) | — | — | |||||||||||||||||||||
Contributions from redeemable noncontrolling interest | — | — | — | — | — | — | 44,490 | — | |||||||||||||||||||||||
Distributions to redeemable noncontrolling interest | — | — | — | — | — | — | (4,238 | ) | — | ||||||||||||||||||||||
June 30, 2018 | $ | 518 | $ | 584,035 | $ | (111,333 | ) | $ | (5,843 | ) | $ | (164,372 | ) | $ | 303,005 | $ | 84,995 | 46,753 | |||||||||||||
See notes to condensed consolidated financial statements
4
COHEN & STEERS, INC. AND SUBSIDIARIES
CONDENSED CONSOLIDATED STATEMENTS OF CASH FLOWS (Unaudited)
(in thousands)
Six Months Ended June 30, | |||||||
2018 | 2017 | ||||||
Cash flows from operating activities: | |||||||
Net income | $ | 54,493 | $ | 45,942 | |||
Adjustments to reconcile net income to net cash provided by (used in) operating activities: | |||||||
Stock-based compensation expense | 11,745 | 10,717 | |||||
Amortization of deferred commissions | 903 | 1,758 | |||||
Depreciation and amortization | 2,267 | 2,134 | |||||
Deferred rent | (117 | ) | (116 | ) | |||
(Gain) loss from investments—net | 5,105 | 175 | |||||
Deferred income taxes | 1,983 | 1,143 | |||||
Foreign currency (gain) loss | (769 | ) | (96 | ) | |||
Changes in operating assets and liabilities: | |||||||
Accounts receivable | 4,037 | (4,251 | ) | ||||
Due from brokers | (5,006 | ) | (12,873 | ) | |||
Deferred commissions | (592 | ) | (952 | ) | |||
Investments within consolidated funds | (42,342 | ) | (60,592 | ) | |||
Other assets | (1,475 | ) | (226 | ) | |||
Accrued compensation | (20,607 | ) | (16,268 | ) | |||
Distribution and service fees payable | 130 | 637 | |||||
Due to brokers | 2,193 | 11,835 | |||||
Income tax payable | (5,583 | ) | (792 | ) | |||
Other liabilities and accrued expenses | (301 | ) | 269 | ||||
Net cash provided by (used in) operating activities | 6,064 | (21,556 | ) | ||||
Cash flows from investing activities: | |||||||
Proceeds from redemptions of equity method investments—net | 26 | — | |||||
Purchases of investments | (7,345 | ) | (12,552 | ) | |||
Proceeds from sales of investments | 4,890 | 19,822 | |||||
Purchases of property and equipment | (1,753 | ) | (1,552 | ) | |||
Net cash provided by (used in) investing activities | (4,182 | ) | 5,718 | ||||
Cash flows from financing activities: | |||||||
Issuance of common stock | 377 | 403 | |||||
Repurchase of common stock | (10,554 | ) | (9,072 | ) | |||
Dividends to stockholders | (30,893 | ) | (25,960 | ) | |||
Distributions to redeemable noncontrolling interest | (4,238 | ) | (49 | ) | |||
Contributions from redeemable noncontrolling interest | 44,490 | 45,132 | |||||
Net cash provided by (used in) financing activities | (818 | ) | 10,454 | ||||
Net increase (decrease) in cash and cash equivalents | 1,064 | (5,384 | ) | ||||
Effect of foreign exchange rate changes on cash and cash equivalents | (787 | ) | 564 | ||||
Cash and cash equivalents, beginning of the period | 193,452 | 183,234 | |||||
Cash and cash equivalents, end of the period | $ | 193,729 | $ | 178,414 | |||
See notes to condensed consolidated financial statements
5
COHEN & STEERS, INC. AND SUBSIDIARIES
CONDENSED CONSOLIDATED STATEMENTS OF CASH FLOWS—(Continued)
(Unaudited)
Supplemental disclosures of cash flow information:
During the six months ended June 30, 2018 and 2017, the Company paid taxes, net of tax refunds, of approximately $21,692,000 and $27,190,000, respectively.
Supplemental disclosures of non-cash investing and financing activities:
In connection with its stock incentive plan, the Company issued fully vested restricted stock units in the amount of approximately $326,000 and $318,000 for the six months ended June 30, 2018 and 2017, respectively. For the six months ended June 30, 2018 and 2017, the Company recorded restricted stock unit dividend equivalents, net of forfeitures, in the amount of approximately $1,108,000 and $838,000, respectively.
During the six months ended June 30, 2018, the Company's proportionate ownership interest in the Cohen & Steers Funds ICAV (ICAV), an Irish alternative investment fund, increased and, as a result, the Company consolidated the assets and liabilities and the results of operations of ICAV.
6
COHEN & STEERS, INC. AND SUBSIDIARIES
NOTES TO CONDENSED CONSOLIDATED FINANCIAL STATEMENTS
(Unaudited)
1. Organization and Description of Business
Cohen & Steers, Inc. (CNS) was organized as a Delaware corporation on March 17, 2004. CNS is the holding company for its direct and indirect subsidiaries, including Cohen & Steers Capital Management, Inc. (CSCM), Cohen & Steers Securities, LLC (CSS), Cohen & Steers Asia Limited (CSAL), Cohen & Steers UK Limited (CSUK) and Cohen & Steers Japan, LLC (collectively, the Company).
The Company is a global investment manager specializing in liquid real assets, including real estate securities, listed infrastructure, commodities and natural resource equities, as well as preferred securities and other income solutions. Founded in 1986, the Company is headquartered in New York City, with offices in London, Hong Kong, Tokyo and Seattle.
2. Basis of Presentation and Significant Accounting Policies
The condensed consolidated financial statements have been prepared in accordance with accounting principles generally accepted in the United States of America (GAAP). The condensed consolidated financial statements set forth herein include the accounts of CNS and its direct and indirect subsidiaries. Intercompany balances and transactions have been eliminated in consolidation.
The condensed consolidated financial statements of the Company included herein are unaudited and have been prepared in accordance with the instructions to Form 10-Q pursuant to the rules and regulations of the Securities and Exchange Commission (SEC). In the opinion of management, all adjustments, consisting of normal recurring adjustments, necessary for a fair presentation of the interim results have been made. The Company’s condensed consolidated financial statements and the related notes should be read together with the consolidated financial statements and the related notes included in the Company’s Annual Report on Form 10-K for the year ended December 31, 2017.
The Company reclassified certain prior period amounts in the condensed consolidated financial statements to conform with the current period presentation.
Recently Adopted Accounting Pronouncements—In May 2017, the Financial Accounting Standards Board (FASB) issued new guidance for modification accounting related to share-based payment transactions in order to provide clarity and to reduce current diversity in practice. This new guidance does not fundamentally change the notion of a modification. Instead, the amendments clarify which changes to the terms or conditions of a share-based payment award require an entity to apply modification accounting. The amendments became effective on January 1, 2018 and required prospective application. The Company's adoption of the new guidance did not have a material effect on its condensed consolidated financial statements and related disclosures.
In August 2016, the FASB amended the current guidance on the classification of certain cash receipts and payments in the statement of cash flows. This guidance is intended to unify the currently diverse presentations and classifications, including debt prepayment or debt extinguishment costs, settlement of zero-coupon debt instruments or other debt instruments with coupon interest rates that are insignificant in relation to the effective interest rate of the borrowing, contingent consideration payments made after a business combination, proceeds from the settlement of insurance claims, proceeds from the settlement of corporate-owned life insurance policies, including bank-owned life insurance policies, distributions received from equity method investees, beneficial interests in securitization transactions, and separately identifiable cash flows and application of the predominance principle. The Company evaluated the eight issues and concluded that only distributions received from equity method investees is applicable to the Company. This amended guidance became effective on January 1, 2018 and was adopted retrospectively. The Company made an accounting policy election to use the Cumulative Earnings Approach when determining whether distributions received from equity method investments should be classified as either operating or investing activities within its condensed consolidated statements of cash flows. The Company's adoption and application of the new guidance did not have a material effect on its condensed consolidated financial statements and related disclosures.
7
COHEN & STEERS, INC. AND SUBSIDIARIES
NOTES TO CONDENSED CONSOLIDATED FINANCIAL STATEMENTS—(Continued)
(Unaudited)
In January 2016, the FASB issued new guidance amending the accounting for equity investments, financial liabilities under the fair value option, and the presentation and disclosure requirements for financial instruments. In addition, the FASB clarified guidance related to the valuation allowance assessment when recognizing deferred tax assets resulting from unrealized losses on available-for-sale debt securities. This new guidance became effective on January 1, 2018 and required the Company to recognize a cumulative-effect adjustment to the beginning retained earnings of approximately $1,095,000, net of tax. Furthermore, changes in the fair value of the Company’s equity investments carried at fair value are now reported through earnings rather than through other comprehensive income. Additionally, due to the required cumulative-effect method of adoption applied, certain disclosures for prior periods have not been recast to conform with the current period presentation. Lastly, upon adoption of the new guidance, the Company reclassified certain investments previously classified as available-for-sale to trading investments or equity investments at fair value. See Notes 4 and 5 for further discussion about the Company's investments.
In May 2014, the FASB issued new guidance which outlined a single comprehensive model for entities to use in accounting for revenue arising from contracts with customers. The core principle of the revenue model is that an entity recognizes revenue to depict the transfer of promised goods or services to customers in an amount that reflects the consideration to which the entity expects to be entitled in exchange for those goods or services. The FASB issued a number of amendments and revisions to the new standard in order to provide more detailed guidance and clarifications. This new guidance became effective on January 1, 2018 and the Company elected to adopt the standard using the retrospective method, which required the recasting of prior period amounts. The adoption of the new standard did not have a material impact on the timing of recognition for the Company's revenue but did affect the presentation of certain revenue and expenses on either a gross or net basis.
The adoption of the new revenue recognition standard resulted in the following changes to the Company's previously reported results for the periods presented (in thousands):
Three Months Ended June 30, 2017 | Six Months Ended June 30, 2017 | ||||||||||||||||||||||
Previously Reported | Net Adjustments Due to New Revenue Standard | Recast | Previously Reported | Net Adjustments Due to New Revenue Standard | Recast | ||||||||||||||||||
Revenue: | |||||||||||||||||||||||
Investment advisory and administration fees | $ | 84,893 | $ | (2,657 | ) | $ | 82,236 | $ | 166,796 | $ | (4,952 | ) | $ | 161,844 | |||||||||
Distribution and service fees | 5,104 | 2,559 | 7,663 | 10,150 | 4,909 | 15,059 | |||||||||||||||||
Total | $ | 89,997 | $ | (98 | ) | $ | 89,899 | $ | 176,946 | $ | (43 | ) | $ | 176,903 | |||||||||
Expenses: | |||||||||||||||||||||||
Distribution and service fees | $ | 10,157 | $ | 2,633 | $ | 12,790 | $ | 19,937 | $ | 5,062 | $ | 24,999 | |||||||||||
General and administrative | 13,059 | (2,731 | ) | 10,328 | 25,989 | (5,105 | ) | 20,884 | |||||||||||||||
Total | $ | 23,216 | $ | (98 | ) | $ | 23,118 | $ | 45,926 | $ | (43 | ) | $ | 45,883 | |||||||||
Accounting Estimates—The preparation of the condensed consolidated financial statements in conformity with GAAP requires management to make certain estimates and assumptions that affect the reported amounts of assets and liabilities and the disclosures of contingent assets and liabilities at the dates of the condensed consolidated financial statements and the reported amounts of revenue and expenses during the reporting periods. Management believes the estimates used in preparing the condensed consolidated financial statements are reasonable and prudent. Actual results could differ from those estimates.
8
COHEN & STEERS, INC. AND SUBSIDIARIES
NOTES TO CONDENSED CONSOLIDATED FINANCIAL STATEMENTS—(Continued)
(Unaudited)
Consolidation of Company-sponsored Funds—Investments in Company-sponsored funds and management fees are evaluated at inception and thereafter, if there is a reconsideration event, in order to determine whether to apply the Variable Interest Entity (VIE) model or the Voting Interest Entity (VOE) model. In performing this analysis, all of the Company’s management fees are presumed to be commensurate and at market and are therefore not considered variable interests.
A VIE is an entity in which either (i) the equity investment at risk is not sufficient to permit the entity to finance its own activities without additional financial support or (ii) the group of holders of the equity investment at risk lack certain characteristics of a controlling financial interest. The primary beneficiary is the entity that has (i) the power to direct the activities of the VIE that most significantly affect its performance, and (ii) the obligation to absorb losses of the entity or the right to receive benefits from the entity that could potentially be significant to the VIE. Investments and redemptions or amendments to the governing documents of the respective entities could affect an entity's status as a VIE or the determination of the primary beneficiary. The Company assesses whether it is the primary beneficiary of any VIEs identified by evaluating its economic interests in the entity held either directly by the Company and its affiliates or indirectly through employees. VIEs for which the Company is deemed to be the primary beneficiary are consolidated.
Investments in Company-sponsored funds that are determined to be VOEs are consolidated when the Company’s ownership interest is greater than 50% of the outstanding voting interests of the fund or when the Company is the general partner of the fund and the limited partners do not have substantive kick-out or participating rights in the fund.
The Company records noncontrolling interests in consolidated funds for which the Company’s ownership is less than 100%.
Cash and Cash Equivalents—Cash and cash equivalents are on deposit with three major financial institutions and consist of short-term, highly-liquid investments, which are readily convertible into cash and have original maturities of three months or less.
Due from/to Brokers—Company-sponsored funds that are consolidated transact with brokers for certain investment activities. The clearing and custody operations for these investment activities are performed pursuant to contractual agreements. The due from/to brokers balance represents cash and cash equivalents balances at brokers/custodians and/or receivables and payables for unsettled securities transactions.
Investments—Management of the Company determines the appropriate classification of its investments at the time of purchase and re-evaluates such determination on an ongoing basis and at each statement of financial condition date. At June 30, 2018, the Company's investments were comprised of equity investments at fair value, trading investments and equity method investments. Realized and unrealized gains and losses on equity investments at fair value, trading investments and equity method investments are recorded in gain (loss) from investments—net in the Company's condensed consolidated statements of operations.
Investments classified as equity method investments represent seed investments in which the Company owns between 20-50% of the outstanding voting interests in the affiliated fund or when it is determined that the Company is able to exercise significant influence but not control over the investments. When using the equity method, the Company recognizes its respective share of the affiliated investee fund net income or loss for the period which is recorded as gain (loss) from investments—net in the Company's condensed consolidated statements of operations. As of June 30, 2018, the Company’s equity method investment consisted of an interest in a Company-sponsored limited partnership which measures its underlying investments at fair value based on quoted market prices or NAV (or its equivalent) as a practical expedient and reports a net asset value on a recurring basis. The carrying amount of this investment approximated its fair value.
From time to time, the affiliated funds consolidated by the Company enter into derivative contracts to gain exposure to the underlying commodities markets or to hedge market and credit risks of the underlying portfolios utilizing options and futures contracts. These instruments are measured at fair value based on their settlement price at the close of trading on the associated commodities exchange or board of trade with gains and losses recorded as gain (loss) from investments—net in the Company's condensed consolidated statements of operations. The fair values of these instruments are recorded in other assets or other liabilities and accrued expenses on the Company's condensed consolidated statements of financial condition.
9
COHEN & STEERS, INC. AND SUBSIDIARIES
NOTES TO CONDENSED CONSOLIDATED FINANCIAL STATEMENTS—(Continued)
(Unaudited)
At June 30, 2018, none of the outstanding derivative contracts were subject to a master netting agreement or other similar arrangement.
Additionally, from time to time, the Company enters into foreign exchange contracts to hedge its currency exposure related to certain client receivables. These instruments are measured at fair value with gains and losses recorded in other gains (losses)—net in the Company’s condensed consolidated statements of operations. The fair values of these contracts are recorded in other assets or other liabilities and accrued expenses on the Company’s condensed consolidated statements of financial condition.
Goodwill and Intangible Assets—Goodwill represents the excess of the cost of the Company’s investment in the net assets of an acquired company over the fair value of the underlying identifiable net assets at the date of acquisition. Goodwill and indefinite-lived intangible assets are not amortized but are tested at least annually for impairment by comparing the fair value to their carrying amounts. Finite-lived intangible assets are amortized over their useful lives and are tested for impairment whenever events or changes in circumstances indicate that the carrying amount may not be recoverable.
Redeemable Noncontrolling Interest—Redeemable noncontrolling interest represents third-party interests in the Company’s consolidated funds. This interest is redeemable at the option of the investors and therefore is not treated as permanent equity. Redeemable noncontrolling interest is remeasured at redemption value which approximates the fair value at each reporting period.
Investment Advisory and Administration Fees—The Company earns revenue by providing asset management services to institutional accounts and to Company-sponsored open-end and closed-end funds. Investment advisory fees are earned pursuant to the terms of investment management agreements and are based on a contractual fee rate applied to the average assets in the portfolio. The Company also earns administration fees from certain Company-sponsored open-end and closed-end funds pursuant to the terms of underlying administration contracts. Administration fees are based on the average assets under management of such funds. Investment advisory and administration fee revenue is recognized when earned and is recorded net of any fund reimbursements. The investment advisory and administration contracts each include a single performance obligation as the services provided are not separately identifiable and, therefore, are accounted for as a series satisfied over time using a time-based method (days elapsed). Additionally, investment advisory and administration fees represent variable consideration, as fees are based on average assets under management which fluctuate due to changes in the financial markets.
Distribution and Service Fee Revenue—Distribution and service fee revenue is based on the average daily net assets of certain share classes of the Company’s sponsored open-end funds distributed by CSS.
Distribution fee agreements include a single performance obligation that is satisfied at a point in time when an investor purchases shares in a Company-sponsored open-end fund. Distribution fees represent variable consideration, as fees are based on average assets under management which fluctuate due to changes in the financial markets. For both the three and six months ended June 30, 2018 and 2017, a portion of the distribution fee revenue recognized in the current period may relate to performance obligations satisfied (or partially satisfied) in prior periods. Service fee agreements include a single performance obligation as the services provided are not separately identifiable and, therefore, are accounted for as a series satisfied over time using a time-based method (days elapsed). Service fees represent variable consideration, as fees are based on average assets under management which fluctuate due to changes in the financial markets.
Portfolio Consulting and Other—The Company earns portfolio consulting and other fees by (i) providing portfolio consulting services in connection with model-based strategy accounts, (ii) earning a licensing fee for the use of the Company's proprietary indexes and (iii) providing portfolio monitoring services related to a number of unit investment trusts. Revenue is earned pursuant to the terms of the underlying contracts and the fee schedules for these relationships vary based on the type of services the Company provides for each relationship. The majority of the Company's revenue from portfolio consulting and other is recognized over time and represents variable consideration, as fees are based on average assets under advisement which fluctuate due to changes in the financial markets. Commission income and contingent deferred sales charge (CDSC) fees, which are earned pursuant to specific transactions such as a purchase or sale of fund shares, are recognized at a point in time.
10
COHEN & STEERS, INC. AND SUBSIDIARIES
NOTES TO CONDENSED CONSOLIDATED FINANCIAL STATEMENTS—(Continued)
(Unaudited)
Distribution and Service Fee Expense—Distribution and service fee expense includes distribution fees, shareholder servicing fees and intermediary assistance payments. Distribution and service fee expense is recorded on an accrual basis.
Distribution fee expense represents payments made to qualified intermediaries for (i) assistance in connection with the distribution of the Company’s sponsored open-end funds’ shares and (ii) for other expenses such as advertising costs and printing and distribution of prospectuses to investors. Such amounts may also be used to pay financial intermediaries for services as specified in the terms of written agreements complying with Rule 12b-1 of the Investment Company Act of 1940 (Rule 12b-1). The Company pays distribution fee expense based on the average daily net assets under management of certain share classes of certain of the funds. Shareholder servicing fee expense represents payments made to qualified intermediaries for shareholder account service and maintenance. These services are provided pursuant to written agreements with such qualified institutions. The Company pays shareholder servicing fee expense generally based on the average assets under management or the number of accounts being serviced. The Company previously recognized certain distribution and service fee revenue and expense on a net basis; however, upon adoption of the new revenue guidance, the Company recognizes such revenue and expense on a gross basis.
Intermediary assistance payments represent payments to qualified intermediaries for activities related to distribution, shareholder servicing and marketing and support of the Company’s sponsored open-end funds and are incremental to those described above. Intermediary assistance payments are generally based on the average assets under management or the number of accounts being serviced.
Stock-based Compensation—The Company recognizes compensation expense for the grant-date fair value of awards of equity instruments to employees. This expense is recognized over the period during which employees are required to provide service. Forfeitures are recorded as incurred.
Income Taxes—The Company records the current and deferred tax consequences of all transactions that have been recognized on its condensed consolidated financial statements in accordance with the provisions of the enacted tax laws. Deferred tax assets are recognized for temporary differences that will result in deductible amounts in future years at tax rates that are expected to apply in those years. Deferred tax liabilities are recognized for temporary differences that will result in taxable income in future years at tax rates that are expected to apply in those years. The Company records a valuation allowance, when necessary, to reduce deferred tax assets to an amount that more likely than not will be realized. The effective tax rate for interim periods represents the Company’s best estimate of the effective tax rate expected to be applied to the full fiscal year.
The calculation of tax liabilities involves dealing with uncertainties in the application of complex tax laws and regulations in a multitude of jurisdictions across the Company's global operations. A tax benefit from an uncertain tax position may be recognized when it is more likely than not that the position will be sustained upon examination, including resolutions of any related appeals or litigation processes, on the basis of the technical merits. The Company records potential interest and penalties related to uncertain tax positions in the provision for income taxes in the condensed consolidated statements of operations.
Currency Translation and Transactions—Assets and liabilities of subsidiaries having non-U.S. dollar functional currencies are translated at exchange rates at the applicable condensed consolidated statement of financial condition date. Revenue and expenses of such subsidiaries are translated at average exchange rates during the period. The gains or losses resulting from translating non-U.S. dollar functional currency into U.S. dollars are included in the Company’s condensed consolidated statements of comprehensive income. The cumulative translation adjustment was $(5,843,000) and $(4,781,000) as of June 30, 2018 and December 31, 2017, respectively. Gains or losses resulting from non-U.S. dollar currency transactions are included in other non-operating income (loss) in the condensed consolidated statements of operations.
Comprehensive Income—The Company reports all changes in comprehensive income on the condensed consolidated statements of comprehensive income. Comprehensive income includes net income or loss attributable to common stockholders and amounts attributable to foreign currency translation gain (loss), net of tax.
11
COHEN & STEERS, INC. AND SUBSIDIARIES
NOTES TO CONDENSED CONSOLIDATED FINANCIAL STATEMENTS—(Continued)
(Unaudited)
Recently Issued Accounting Pronouncements—In February 2018, the FASB issued new guidance allowing entities to reclassify certain tax effects related to the enactment of the Tax Cuts and Jobs Act (the Tax Act) from accumulated other comprehensive income (AOCI) to retained earnings. Prior to the issuance of the new guidance, a portion of the previously recognized deferred tax effects recorded in AOCI was "left stranded" in AOCI as the effect of remeasuring the deferred taxes using the reduced federal corporate income tax rate was required to be recorded through income. The new guidance allows these stranded tax effects to be reclassified from AOCI to retained earnings. The new guidance will be effective on January 1, 2019, with early adoption permitted and is to be applied either in the period of adoption or retrospectively to each period in which the effect of the change in the U.S. federal corporate income tax rate in the Tax Act is recognized. The Company is still assessing which adoption method it will choose but it does not expect either method to have a material effect on its condensed consolidated financial statements and related disclosures.
In August 2017, the FASB issued new guidance amending the accounting for hedging activities. The new guidance (i) expands hedge accounting for nonfinancial and financial risk components and amends measurement methodologies to more closely align hedge accounting with an entity's risk management activities, (ii) decreases the complexity of preparing and understanding hedge results through eliminating the separate measurement and reporting of hedge ineffectiveness, (iii) enhances transparency, comparability and understandability of hedge results through enhanced disclosures and changing the presentation of hedge results to align the effects of the hedging instrument and the hedged item and (iv) reduces the cost and complexity of applying hedge accounting by simplifying the manner in which assessments of hedge effectiveness may be performed. The new guidance will be effective on January 1, 2019, with early adoption permitted. The Company does not expect the adoption of the new guidance to have a material effect on its condensed consolidated financial statements and related disclosures.
In January 2017, the FASB issued guidance to simplify the goodwill impairment test by removing the requirement to perform a hypothetical purchase price allocation. A goodwill impairment will now be the amount by which a reporting unit’s carrying value exceeds its fair value, not to exceed the carrying amount of goodwill. This new guidance will be effective on January 1, 2020. The Company does not expect the adoption of the new guidance to have a material effect on its condensed consolidated financial statements and related disclosures.
In February 2016, the FASB issued guidance introducing a new lease model which requires lessees to recognize leases on-balance sheet and disclose key information about leasing arrangements. The new guidance establishes a right-of-use model (ROU) that requires a lessee to recognize an ROU asset and lease liability on the balance sheet for all leases with a term longer than 12 months. Leases will be classified as finance or operating, with classification affecting the pattern and classification of expense recognition in the income statement. The guidance also requires disclosures by lessees and lessors to enable users of financial statements to assess the amount, timing, and uncertainty of cash flows arising from leases. In July 2018, the FASB issued amendments to the guidance intended to provide supplemental narrow-scope improvements and clarifications. The new guidance, along with the amendments, are effective on January 1, 2019, with early adoption permitted. Furthermore, the Company is allowed the option of applying certain practical expedients and must apply the new guidance using a modified retrospective approach. While the Company is continuing to assess the effect of adoption, it currently believes the most significant change relates to the recognition of new ROU assets and lease liabilities on its condensed consolidated statements of financial condition for its office space and other operating leases. The Company does not expect a significant change in its leasing activity between now and adoption. Lastly, the Company is still assessing which of the available practical expedients it plans to elect upon adoption.
12
COHEN & STEERS, INC. AND SUBSIDIARIES
NOTES TO CONDENSED CONSOLIDATED FINANCIAL STATEMENTS—(Continued)
(Unaudited)
3. Revenue
The following tables summarize revenue recognized from contracts with customers by client domicile and revenue by vehicle for the periods presented (in thousands):
Three Months Ended June 30, | Six Months Ended June 30, | ||||||||||||||
2018 | 2017 | 2018 | 2017 | ||||||||||||
Client domicile: | |||||||||||||||
North America | $ | 80,109 | $ | 76,286 | $ | 159,816 | $ | 149,666 | |||||||
Japan | 8,883 | 10,785 | 17,976 | 21,910 | |||||||||||
Asia excluding Japan | 3,058 | 2,785 | 6,093 | 5,432 | |||||||||||
Europe | 2,360 | 2,858 | 4,989 | 5,447 | |||||||||||
Total | $ | 94,410 | $ | 92,714 | $ | 188,874 | $ | 182,455 | |||||||
Three Months Ended June 30, | Six Months Ended June 30, | ||||||||||||||
2018 | 2017 | 2018 | 2017 | ||||||||||||
Vehicle: | |||||||||||||||
Open-end funds (1) | $ | 47,778 | $ | 45,975 | $ | 95,230 | $ | 89,929 | |||||||
Closed-end funds | 19,133 | 19,512 | 38,310 | 38,392 | |||||||||||
Institutional accounts | 24,766 | 24,412 | 49,971 | 48,582 | |||||||||||
Portfolio consulting and other | 2,733 | 2,815 | 5,363 | 5,552 | |||||||||||
Total | $ | 94,410 | $ | 92,714 | $ | 188,874 | $ | 182,455 | |||||||
________________________
(1) | Included distribution and service fees of $7.3 million and $7.7 million for three months ended June 30, 2018 and 2017, respectively, and $14.7 million and $15.1 million for the six months ended June 30, 2018 and 2017, respectively. |
4. Investments
The following table summarizes the Company’s investments for the periods presented (in thousands):
June 30, 2018 | |||
Equity investments at fair value | $ | 61,396 | |
Trading investments | 86,235 | ||
Equity method investments | 37 | ||
Total investments | $ | 147,668 | |
December 31, 2017 | |||
Trading investments | $ | 74,856 | |
Equity method investments | 6,176 | ||
Available-for-sale investments | 27,074 | ||
Total investments | $ | 108,106 | |
13
COHEN & STEERS, INC. AND SUBSIDIARIES
NOTES TO CONDENSED CONSOLIDATED FINANCIAL STATEMENTS—(Continued)
(Unaudited)
Equity investments at fair value—represents equity investments held within the affiliated funds that the Company consolidates, individual investments held directly for the purposes of establishing performance track records and seed investments in Company-sponsored funds. These investments include equity securities, investment-grade preferred instruments and investments in Company-sponsored open-end funds where the Company has neither control nor the ability to exercise significant influence. Investments in equity securities are measured at fair value generally based on quoted market prices, market prices obtained from independent pricing services engaged by management or as determined by management and approved by the Company's valuation committee.
Trading investments—represents fixed income investments held within the affiliated funds that the Company consolidates and individual fixed income investments held directly for the purposes of establishing performance track records. Fixed income investments are carried at fair value based on quoted market prices or market prices obtained from independent pricing services engaged by management.
Equity method investments—represents an interest in a Company-sponsored limited partnership measured at NAV (or its equivalent) as a practical expedient reported on a recurring basis. The carrying amount of this investment approximated its fair value.
The Company seeded one new fund during the six months ended June 30, 2018 and two new funds during the six months ended June 30, 2017.
The following tables summarize gain (loss) from investments for the periods presented (in thousands):
Three Months Ended June 30, 2018 | Six Months Ended June 30, 2018 | ||||||
Gain (loss) from investments—net (1) | |||||||
Net realized gains (losses) during the period | $ | (322 | ) | $ | (167 | ) | |
Net unrealized gains (losses) during the period on investments still held at the end of the period | (281 | ) | (4,938 | ) | |||
Gain (loss) from investments—net | $ | (603 | ) | $ | (5,105 | ) | |
_________________________
(1) | Included net income (loss) attributable to redeemable noncontrolling interest for the periods presented. |
Three Months Ended June 30, 2017 | Six Months Ended June 30, 2017 | ||||||
Gain (loss) from trading investments—net (1) | $ | 2 | $ | 275 | |||
Equity in earnings (losses) of affiliates—net | (279 | ) | (568 | ) | |||
Gain (loss) from available-for-sale investments—net | 83 | 118 | |||||
Total gain (loss) from investments | $ | (194 | ) | $ | (175 | ) | |
_________________________
(1) | Included net income (loss) attributable to redeemable noncontrolling interest for the periods presented. |
14
COHEN & STEERS, INC. AND SUBSIDIARIES
NOTES TO CONDENSED CONSOLIDATED FINANCIAL STATEMENTS—(Continued)
(Unaudited)
The following tables summarize the condensed consolidated statements of financial condition attributable to the Company's consolidated VIEs, which included the Cohen & Steers SICAV Global Listed Infrastructure Fund (GLI SICAV), the Cohen & Steers Co-Investment Partnership, L.P. (GRP-CIP), the Cohen & Steers SICAV Global Preferred Securities Fund (SICAV Preferred) and the Cohen & Steers SICAV Diversified Real Assets Fund (SICAV RAP) for the periods presented (in thousands):
June 30, 2018 | |||||||||||||||||||
GLI SICAV | GRP-CIP | SICAV Preferred | SICAV RAP | Total | |||||||||||||||
Assets (1) | |||||||||||||||||||
Investments | $ | 5,720 | $ | 743 | $ | 96,288 | $ | 9,770 | $ | 112,521 | |||||||||
Due from brokers | 279 | 173 | 8,264 | 262 | 8,978 | ||||||||||||||
Other assets | 107 | — | 1,612 | 98 | 1,817 | ||||||||||||||
Total assets | $ | 6,106 | $ | 916 | $ | 106,164 | $ | 10,130 | $ | 123,316 | |||||||||
Liabilities (1) | |||||||||||||||||||
Due to brokers | $ | — | $ | — | $ | 5,357 | $ | 123 | $ | 5,480 | |||||||||
Other liabilities and accrued expenses | 72 | 5 | 165 | 68 | 310 | ||||||||||||||
Total liabilities | $ | 72 | $ | 5 | $ | 5,522 | $ | 191 | $ | 5,790 | |||||||||
December 31, 2017 | |||||||||||||||
GLI SICAV | GRP-CIP | SICAV Preferred | Total | ||||||||||||
Assets (1) | |||||||||||||||
Investments | $ | 5,961 | $ | 1,330 | $ | 60,810 | $ | 68,101 | |||||||
Due from brokers | 285 | 202 | 4,923 | 5,410 | |||||||||||
Other assets | 32 | — | 899 | 931 | |||||||||||
Total assets | $ | 6,278 | $ | 1,532 | $ | 66,632 | $ | 74,442 | |||||||
Liabilities (1) | |||||||||||||||
Due to brokers | $ | 35 | $ | — | $ | 3,168 | $ | 3,203 | |||||||
Other liabilities and accrued expenses | 87 | 5 | 199 | 291 | |||||||||||
Total liabilities | $ | 122 | $ | 5 | $ | 3,367 | $ | 3,494 | |||||||
_________________________
(1) | The assets may only be used to settle obligations of each VIE and the liabilities are the sole obligation of each VIE, for which creditors do not have recourse to the general credit of the Company. |
The following is a summary of the cost, gross unrealized gains, gross unrealized losses and fair value of available-for-sale investments for the year ended December 31, 2017 (in thousands):
Cost | Gross Unrealized Gains | Gross Unrealized Losses (1) | Fair Value | ||||||||||||
Common stocks | $ | 6,782 | $ | 639 | $ | (183 | ) | $ | 7,238 | ||||||
Company-sponsored funds | 13,376 | 1,269 | (13 | ) | 14,632 | ||||||||||
Fixed income | 3,966 | 15 | (20 | ) | 3,961 | ||||||||||
Preferred securities | 1,100 | 29 | (5 | ) | 1,124 | ||||||||||
Other | 100 | 19 | — | 119 | |||||||||||
Total available-for-sale investments | $ | 25,324 | $ | 1,971 | $ | (221 | ) | $ | 27,074 | ||||||
_________________________
(1) At December 31, 2017, there were no securities with unrealized losses continuously for a period of more than 12 months.
15
COHEN & STEERS, INC. AND SUBSIDIARIES
NOTES TO CONDENSED CONSOLIDATED FINANCIAL STATEMENTS—(Continued)
(Unaudited)
Available-for-sale investments with a fair value of approximately $6,086,000 at December 31, 2017 were in an unrealized loss position.
At December 31, 2017, unrealized losses on available-for-sale investments were generally caused by changes in market conditions. When evaluating whether an unrealized loss on an available-for-sale investment is other than temporary, the Company reviews such factors as the extent and duration of the loss as well as qualitative and quantitative information about the financial condition and near-term prospects of the issuers. Furthermore, the Company determined that it had the ability and intent to hold the remaining available-for-sale investments for which no other-than-temporary impairment has occurred until a recovery of fair value. Accordingly, impairment of these investments, if any, was considered temporary.
The following table summarizes sales proceeds, gross realized gains and losses from available-for-sale investments for the periods presented (in thousands):
Three Months Ended June 30, 2017 | Six Months Ended June 30, 2017 | ||||||
Proceeds from sales | $ | 13,024 | $ | 19,910 | |||
Gross realized gains | 216 | 314 | |||||
Gross realized losses | (133 | ) | (196 | ) | |||
5. Fair Value
Accounting Standards Codification Topic 820, Fair Value Measurement (ASC 820) specifies a hierarchy of valuation classifications based on whether the inputs to the valuation techniques used in each valuation classification are observable or unobservable. These classifications are summarized in the three broad levels listed below:
• | Level 1—Unadjusted quoted prices for identical instruments in active markets. |
• | Level 2—Quoted prices for similar instruments in active markets; quoted prices for identical or similar instruments in markets that are not active; and model-derived valuations in which all significant inputs and significant value drivers are observable. |
• | Level 3—Valuations derived from valuation techniques in which significant inputs or significant value drivers are unobservable. |
Inputs used to measure fair value might fall in different levels of the fair value hierarchy, in which case the Company defaults to the lowest level input that is significant to the fair value measurement in its entirety. These levels are not necessarily an indication of the risk or liquidity associated with the investments. In determining the appropriate levels, the Company performed a detailed analysis of the assets and liabilities that are subject to ASC 820. Transfers among levels, if any, are recorded at the end of the reporting period. There were no such transfers for the three and six months ended June 30, 2018.
16
COHEN & STEERS, INC. AND SUBSIDIARIES
NOTES TO CONDENSED CONSOLIDATED FINANCIAL STATEMENTS—(Continued)
(Unaudited)
The following table presents fair value measurements as of June 30, 2018 (in thousands):
Level 1 | Level 2 | Level 3 | Investments Measured at NAV | Total | |||||||||||||||
Cash equivalents | $ | 181,725 | $ | — | $ | — | $ | — | $ | 181,725 | |||||||||
Equity investments at fair value | |||||||||||||||||||
Common stocks | $ | 22,903 | $ | — | $ | — | $ | — | $ | 22,903 | |||||||||
Company-sponsored funds | 14,405 | — | — | — | 14,405 | ||||||||||||||
Limited partnership interests | 1,454 | — | — | 743 | 2,197 | ||||||||||||||
Preferred securities | 17,219 | 4,560 | — | — | 21,779 | ||||||||||||||
Other | — | — | — | 112 | 112 | ||||||||||||||
Total | $ | 55,981 | $ | 4,560 | $ | — | $ | 855 | $ | 61,396 | |||||||||
Trading investments | |||||||||||||||||||
Fixed income | $ | — | $ | 86,235 | $ | — | $ | — | $ | 86,235 | |||||||||
Total | $ | — | $ | 86,235 | $ | — | $ | — | $ | 86,235 | |||||||||
Equity method investments | $ | — | $ | — | $ | — | $ | 37 | $ | 37 | |||||||||
Total investments | $ | 55,981 | $ | 90,795 | $ | — | $ | 892 | $ | 147,668 | |||||||||
Derivatives - assets | |||||||||||||||||||
Commodity contracts | $ | 343 | $ | — | $ | — | $ | — | $ | 343 | |||||||||
Foreign exchange contracts | — | 327 | — | — | 327 | ||||||||||||||
Total | $ | 343 | $ | 327 | $ | — | $ | — | $ | 670 | |||||||||
Derivatives - liabilities | |||||||||||||||||||
Commodity contracts | $ | 579 | $ | — | $ | — | $ | — | $ | 579 | |||||||||
Total | $ | 579 | $ | — | $ | — | $ | — | $ | 579 | |||||||||
Cash equivalents were comprised of investments in actively traded U.S. Treasury money market funds measured at NAV.
Equity investments at fair value classified as level 2 were comprised of certain preferred securities with predominately equity-like characteristics whose fair values are generally determined using third-party pricing services. The pricing services may utilize pricing models, and inputs into those models may include reported trades, executable bid and ask prices, broker-dealer quotations, prices or yields of similar securities, benchmark curves and other market information. The pricing services may use a matrix approach, which considers information regarding securities with similar characteristics to determine the valuation for a security.
Trading investments classified as level 2 in the above table were comprised of U.S. Treasury Bills carried at amortized cost, which approximates fair value, corporate debt securities, as well as certain preferred securities with predominately debt-like characteristics. The fair value amounts were generally determined using third-party pricing services. The pricing services may utilize evaluated pricing models that vary by asset class and incorporate available trade, bid and other market information. Since these securities do not trade on a daily basis, the pricing services evaluate pricing applications and apply available information through processes such as yield curves, benchmarking of like securities, sector groupings, and matrix pricing, to prepare evaluations.
17
COHEN & STEERS, INC. AND SUBSIDIARIES
NOTES TO CONDENSED CONSOLIDATED FINANCIAL STATEMENTS—(Continued)
(Unaudited)
Investments measured at NAV were comprised of certain investments measured at fair value using NAV (or its equivalent) as a practical expedient. These investments have not been classified in the fair value hierarchy. The fair value amounts presented in the above table are intended to permit reconciliation of the fair value hierarchy to the amounts presented on the condensed consolidated statement of financial position. These investments were comprised of:
• | Equity investments at fair value - limited partner interests in limited partnership vehicles that invest in non-registered real estate funds and the Company's co-investment in a Cayman trust invested in global listed infrastructure securities, both of which are valued based on the NAVs of the underlying investments. At June 30, 2018, the Company did not have the ability to redeem the interests in the limited partnership vehicles; there were no contractual restrictions on the Company's ability to redeem its interest in the Cayman trust. |
• | Equity method investments - the Company's partnership interest in a Company-sponsored limited partnership that invests in non-registered real estate funds, which approximated its fair value based on the fund's NAV. At June 30, 2018, the Company's ownership in this limited partnership was approximately 0.2%. The Company's risk with respect to this investment is limited to its equity ownership and any uncollected management fees. At June 30, 2018, the Company did not have the ability to redeem this investment. |
The following table presents fair value measurements as of December 31, 2017 (in thousands):
Level 1 | Level 2 | Level 3 | Investments Measured at NAV | Total | |||||||||||||||
Cash equivalents | $ | 173,270 | $ | — | $ | — | $ | — | $ | 173,270 | |||||||||
Trading investments | |||||||||||||||||||
Common stocks | $ | 5,961 | $ | — | $ | — | $ | — | $ | 5,961 | |||||||||
Fixed income | — | 6,755 | — | — | 6,755 | ||||||||||||||
Limited partnership interests | — | — | 605 | 725 | 1,330 | ||||||||||||||
Preferred securities | 7,658 | 53,152 | — | — | 60,810 | ||||||||||||||
Total | $ | 13,619 | $ | 59,907 | $ | 605 | $ | 725 | $ | 74,856 | |||||||||
Equity method investments | $ | — | $ | — | $ | — | $ | 6,176 | $ | 6,176 | |||||||||
Available-for-sale investments | |||||||||||||||||||
Common stocks | $ | 7,238 | $ | — | $ | — | $ | — | $ | 7,238 | |||||||||
Company-sponsored funds | 14,632 | — | — | — | 14,632 | ||||||||||||||
Fixed income | — | 3,961 | — | — | 3,961 | ||||||||||||||
Preferred securities | 999 | 125 | — | — | 1,124 | ||||||||||||||
Other | — | — | — | 119 | 119 | ||||||||||||||
Total | $ | 22,869 | $ | 4,086 | $ | — | $ | 119 | $ | 27,074 | |||||||||
Total investments | $ | 36,488 | $ | 63,993 | $ | 605 | $ | 7,020 | $ | 108,106 | |||||||||
Derivatives - assets | |||||||||||||||||||
Commodity contracts | $ | 487 | $ | — | $ | — | $ | — | $ | 487 | |||||||||
Total | $ | 487 | $ | — | $ | — | $ | — | $ | 487 | |||||||||
Derivatives - liabilities | |||||||||||||||||||
Commodity contracts | $ | 286 | $ | — | $ | — | $ | — | $ | 286 | |||||||||
Foreign exchange contracts | — | 64 | — | — | 64 | ||||||||||||||
Total | $ | 286 | $ | 64 | $ | — | $ | — | $ | 350 | |||||||||
18
COHEN & STEERS, INC. AND SUBSIDIARIES
NOTES TO CONDENSED CONSOLIDATED FINANCIAL STATEMENTS—(Continued)
(Unaudited)
Cash equivalents were comprised of investments in actively traded U.S. Treasury money market funds measured at NAV.
Trading investments in fixed income securities classified as level 2 in the above table were comprised of U.S. Treasury Bills carried at amortized cost, which approximates fair value. Trading investments in preferred securities classified as level 2 were comprised of corporate debt and certain preferred securities. The fair value amounts were generally determined using third-party pricing services. The pricing services may utilize evaluated pricing models that vary by asset class and incorporate available trade, bid and other market information. Since these securities do not trade on a daily basis, the pricing services evaluate pricing applications and apply available information through processes such as yield curves, benchmarking of like securities, sector groupings, and matrix pricing, to prepare evaluations.
Trading investments classified as level 3 in the above table were comprised of a limited partner interest in a limited partnership vehicle that invested in a private equity vehicle that invested directly in real estate which was valued using a contractual selling price.
Available-for-sale investments classified as level 2 in the above table were primarily comprised of corporate bonds and certain preferred securities whose fair values are generally determined using third-party pricing services. The pricing services may utilize pricing models, and inputs into those models may include reported trades, executable bid and ask prices, broker-dealer quotations, prices or yields of similar securities, benchmark curves and other market information. The pricing services may use a matrix approach, which considers information regarding securities with similar characteristics to determine the valuation for a security.
Investments measured at NAV were comprised of certain investments measured at fair value using NAV (or its equivalent) as a practical expedient. These investments have not been classified in the fair value hierarchy. The fair value amounts presented in the above table are intended to permit reconciliation of the fair value hierarchy to the amounts presented on the condensed consolidated statement of financial position. These investments were comprised of:
• | Trading investments - limited partner interests in limited partnership vehicles that invest in non-registered real estate funds, which are valued based on the NAVs of the underlying funds. At December 31, 2017, the Company did not have the ability to redeem these interests. |
• | Equity method investments - the Company's partnership interests in Company-sponsored limited partnerships. One such partnership invests in private equity vehicles that invest directly in real estate and non-registered real estate funds and the Company did not have the ability to redeem this investment. The other partnership invests indirectly in exchange-traded commodity futures contracts and other commodity-related derivatives and the Company had the ability to redeem this investment monthly at NAV with prior written notice of 5 days. |
• | Available-for-sale investments - the Company's co-investment in a Cayman trust invested in global listed infrastructure securities. |
19
COHEN & STEERS, INC. AND SUBSIDIARIES
NOTES TO CONDENSED CONSOLIDATED FINANCIAL STATEMENTS—(Continued)
(Unaudited)
The following table summarizes the changes in level 3 investments measured at fair value on a recurring basis for the periods presented (in thousands):
Three Months Ended June 30, | Six Months Ended June 30, | |||||||||||||||
2018 | 2017 | 2018 | 2017 | |||||||||||||
Trading Investments | ||||||||||||||||
Limited Partnership Interests | ||||||||||||||||
Balance at beginning of the period | $ | — | $ | 1,476 | $ | 605 | $ | 1,196 | ||||||||
Purchases / contributions | — | 114 | — | 138 | ||||||||||||
Sales / distributions | — | — | (598 | ) | — | |||||||||||
Realized gains (losses) | — | — | (68 | ) | — | |||||||||||
Unrealized gains (losses) | — | (128 | ) | (1) | 61 | 128 | (1) | |||||||||
Transfers into (out of) level 3 | — | — | — | — | ||||||||||||
Balance at end of the period | $ | — | $ | 1,462 | $ | — | $ | 1,462 | ||||||||
_________________________
(1) Pertains to unrealized gains (losses) from investments still held at June 30, 2017.
Realized and unrealized gains (losses) in the above table were recorded as gain (loss) from investments—net in the Company's condensed consolidated statements of operations.
Valuation Techniques
In certain instances, debt, equity and preferred securities are valued on the basis of prices from an orderly transaction between market participants provided by reputable broker-dealers or independent pricing services. In determining the value of a particular investment, independent pricing services may use information with respect to transactions in such investments, broker quotes, pricing matrices, market transactions in comparable investments and various relationships between investments. As part of its independent price verification process, the Company generally performs reviews of valuations provided by broker-dealers or independent pricing services. Investments in Company-sponsored funds are valued at their closing price or NAV (or its equivalent) as a practical expedient.
Foreign exchange contracts are valued by interpolating a value using the spot foreign exchange rate and forward points (based on the spot rate and currency rate differentials), which are all inputs that are observable in active markets (level 2).
In the absence of observable market prices, the Company values its investments using valuation methodologies applied on a consistent basis. For some investments, little market activity may exist; management's determination of fair value is then based on the best information available in the circumstances, and may incorporate management's own assumptions and involves a significant degree of judgment, taking into consideration a combination of internal and external factors. Such investments are valued on a quarterly basis, taking into consideration any changes in key inputs and changes in economic and other relevant conditions, and valuation models are updated accordingly. The valuation process also includes a review by the Company's valuation committee which is comprised of senior members from various departments within the Company, including investment management. The valuation committee provides independent oversight of the valuation policies and procedures.
At December 31, 2017, the valuation technique used in the fair value measurement of the Company's level 3 investment, limited partnership interests - direct investment in real estate, of approximately $605,000 was based on a contractual selling price.
20
COHEN & STEERS, INC. AND SUBSIDIARIES
NOTES TO CONDENSED CONSOLIDATED FINANCIAL STATEMENTS—(Continued)
(Unaudited)
6. Derivatives
The following tables summarize the notional and fair value of the derivative financial instruments. The notional amount represents the absolute value amount of all outstanding derivative contracts for the periods presented (in thousands):
June 30, 2018 | |||||||||||||||
Assets | Liabilities | ||||||||||||||
Notional | Fair Value | Notional | Fair Value | ||||||||||||
Commodity contracts | $ | 13,070 | $ | 343 | $ | 4,867 | $ | 579 | |||||||
Foreign exchange contracts | 11,400 | 327 | — | — | |||||||||||
Total derivatives | $ | 24,470 | $ | 670 | $ | 4,867 | $ | 579 | |||||||
December 31, 2017 | |||||||||||||||
Assets | Liabilities | ||||||||||||||
Notional | Fair Value | Notional | Fair Value | ||||||||||||
Commodity contracts | $ | 8,939 | $ | 487 | $ | 6,876 | $ | 286 | |||||||
Foreign exchange contracts | — | — | 12,279 | 64 | |||||||||||
Total derivatives | $ | 8,939 | $ | 487 | $ | 19,155 | $ | 350 | |||||||
Cash included in due from broker on the condensed consolidated statement of financial condition of approximately $1,007,000 at June 30, 2018 was held as collateral for futures contracts. Investments on the condensed consolidated statements of financial condition of approximately $414,000 at December 31, 2017 were held as collateral for futures contracts.
The following table summarizes gains (losses) from derivative financial instruments for the periods presented (in thousands):
Three Months Ended June 30, | Six Months Ended June 30, | ||||||||||||||
2018 | 2017 | 2018 | 2017 | ||||||||||||
Commodity contracts | $ | 27 | $ | (409 | ) | $ | (7 | ) | $ | (856 | ) | ||||
Foreign exchange contracts | 1,237 | (479 | ) | 391 | (1,334 | ) | |||||||||
Total | $ | 1,264 | $ | (888 | ) | $ | 384 | $ | (2,190 | ) | |||||
7. Earnings Per Share
Basic earnings per share is calculated by dividing net income attributable to common stockholders by the weighted average shares outstanding. Diluted earnings per share is calculated using the treasury stock method by dividing net income attributable to common stockholders by the total weighted average shares of common stock outstanding and common stock equivalents. Common stock equivalents are comprised of dilutive potential shares from restricted stock unit awards and are excluded from the computation if their effect is anti-dilutive.
There were no anti-dilutive common stock equivalents for both the three months ended June 30, 2018 and 2017, as well as for the six months ended June 30, 2018. Anti-dilutive common stock equivalents of approximately 9,000 shares were excluded from the computation for the six months ended June 30, 2017.
21
COHEN & STEERS, INC. AND SUBSIDIARIES
NOTES TO CONDENSED CONSOLIDATED FINANCIAL STATEMENTS—(Continued)
(Unaudited)
The following table reconciles income and share data used in the basic and diluted earnings per share computations for the periods presented (in thousands, except per share data):
Three Months Ended June 30, | Six Months Ended June 30, | ||||||||||||||
2018 | 2017 | 2018 | 2017 | ||||||||||||
Net income | $ | 25,569 | $ | 22,998 | $ | 54,493 | $ | 45,942 | |||||||
Less: Net (income) loss attributable to redeemable noncontrolling interest | 4,390 | 476 | 3,052 | 517 | |||||||||||
Net income attributable to common stockholders | $ | 29,959 | $ | 23,474 | $ | 57,545 | $ | 46,459 | |||||||
Basic weighted average shares outstanding | 46,819 | 46,373 | 46,751 | 46,308 | |||||||||||
Dilutive potential shares from restricted stock units | 492 | 529 | 486 | 445 | |||||||||||
Diluted weighted average shares outstanding | 47,311 | 46,902 | 47,237 | 46,753 | |||||||||||
Basic earnings per share attributable to common stockholders | $ | 0.64 | $ | 0.51 | $ | 1.23 | $ | 1.00 | |||||||
Diluted earnings per share attributable to common stockholders | $ | 0.63 | $ | 0.50 | $ | 1.22 | $ | 0.99 | |||||||
8. Income Taxes
The provision for income taxes includes U.S. federal, state, local and foreign taxes. The effective tax rate for the three months ended June 30, 2018 was approximately 24.9%, compared with 38.4% for the three months ended June 30, 2017. The effective tax rate for the three months ended June 30, 2018 differed from the U.S. federal statutory rate of 21% primarily due to state, local and foreign taxes, net of a benefit related to an adjustment to the Company's transition tax liability. The effective tax rate for the three months ended June 30, 2017 differed from the U.S. federal statutory rate of 35% primarily due to state, local and foreign taxes. The effective tax rate for the six months ended June 30, 2018 was approximately 23.9%, compared with 37.1% for the six months ended June 30, 2017. The effective tax rate for the six months ended June 30, 2018 differed from the U.S. federal statutory rate of 21% primarily due to state, local and foreign taxes, net of benefits related to the delivery of restricted stock units and an adjustment to the Company's transition tax liability. The effective tax rate for the six months ended June 30, 2017 differed from the U.S. federal statutory rate of 35% primarily due to state and foreign taxes, partially offset by the release of certain tax reserves.
Deferred income taxes represent the tax effects of the temporary differences between book and tax bases and are measured using enacted tax rates that will be in effect when such items are expected to reverse. The Company's net deferred tax asset was primarily comprised of future income tax deductions attributable to the delivery of unvested restricted stock units. The Company records a valuation allowance, when necessary, to reduce deferred tax assets to an amount that more likely than not will be realized.
In connection with the enactment of the Tax Act, the Company recorded a provisional transition tax at December 31, 2017, which reflected a one-time tax on deemed repatriated accumulated earnings and profits of the Company’s foreign subsidiaries. The transition tax, which is payable over eight years on an interest-free basis, was included as part of income tax payable on the Company's condensed consolidated statements of financial condition at June 30, 2018 and December 31, 2017. Based on refinement of the calculation, the Company adjusted its transition tax liability from $8.4 million at December 31, 2017 to $8.3 million at June 30, 2018. On August 1, 2018, the U.S. Department of the Treasury and the Internal Revenue Service issued proposed regulations related to the calculation of the transition tax liability. Based on the Company’s preliminary assessment of the proposed regulations, it does not expect to make any material adjustments to its transition tax liability. However, this could change once the proposed regulations become finalized.
22
COHEN & STEERS, INC. AND SUBSIDIARIES
NOTES TO CONDENSED CONSOLIDATED FINANCIAL STATEMENTS—(Continued)
(Unaudited)
9. Regulatory Requirements
CSS, a registered broker-dealer in the U.S., is subject to the SEC’s Uniform Net Capital Rule 15c3-1 (the Rule), which requires that broker-dealers maintain a minimum level of net capital, as prescribed by the Rule. At June 30, 2018, CSS had net capital of approximately $3,500,000, which exceeded its requirements by approximately $3,272,000. The Rule also provides that equity capital may not be withdrawn or cash dividends paid if the resulting net capital of a broker-dealer is less than the amount required under the Rule and requires prior notice to the SEC for certain withdrawals of capital.
CSS does not carry customer accounts and is exempt from SEC Rule 15c3-3 pursuant to provisions (k)(1) and (k)(2)(i) of such rule.
CSAL and CSUK are regulated outside the U.S. by the Hong Kong Securities and Futures Commission and the United Kingdom Financial Conduct Authority, respectively. At June 30, 2018, CSAL and CSUK had aggregate regulatory capital of approximately $80,890,000, which exceeded aggregate regulatory capital requirements by approximately $75,732,000.
10. Related Party Transactions
The Company is an investment adviser to, and has administrative agreements with, affiliated funds for which certain employees are officers and/or directors. The following table summarizes the amount of revenue the Company earned from these affiliated funds for the periods presented (in thousands):
Three Months Ended June 30, | Six Months Ended June 30, | ||||||||||||||
2018 | 2017 | 2018 | 2017 | ||||||||||||
Investment advisory and administration fees (1) | $ | 59,590 | $ | 57,914 | $ | 118,894 | $ | 113,442 | |||||||
Distribution and service fees | 7,257 | 7,663 | 14,657 | 15,059 | |||||||||||
Total | $ | 66,847 | $ | 65,577 | $ | 133,551 | $ | 128,501 | |||||||
_________________________
(1) | Investment advisory and administration fees are reflected net of fund reimbursements of approximately $1.6 million and $1.8 million for the three months ended June 30, 2018 and 2017, respectively, and approximately $4.3 million and $4.2 million for the six months ended June 30, 2018 and 2017, respectively. |
The following table summarizes sales proceeds, gross realized gains, gross realized losses and dividend income from investments in Company-sponsored funds for the periods presented (in thousands):
Three Months Ended June 30, | Six Months Ended June 30, | ||||||||||||||
2018 | 2017 | 2018 | 2017 | ||||||||||||
Proceeds from sales | $ | 7,729 | $ | 10,070 | $ | 7,729 | $ | 15,105 | |||||||
Gross realized gains | — | 60 | — | 80 | |||||||||||
Gross realized losses | (4,447 | ) | — | (4,447 | ) | — | |||||||||
Dividend income | 115 | 133 | 267 | 388 | |||||||||||
Included in accounts receivable at June 30, 2018 and December 31, 2017 are receivables due from Company-sponsored funds of approximately $22,141,000 and $23,666,000, respectively.
23
COHEN & STEERS, INC. AND SUBSIDIARIES
NOTES TO CONDENSED CONSOLIDATED FINANCIAL STATEMENTS—(Continued)
(Unaudited)
11. Commitments and Contingencies
Rent expense charged to operations, including escalation charges for real estate and other expenses, totaled approximately $2,920,000 and $2,800,000 for the three months ended June 30, 2018 and 2017, respectively, and approximately $5,886,000 and $5,600,000 for the six months ended June 30, 2018 and 2017, respectively.
From time to time, the Company is involved in legal matters relating to claims arising in the ordinary course of business. At June 30, 2018, there are no matters pending that the Company believes could have a material adverse effect on its condensed consolidated statement of financial position, results of operations or cash flows.
The Company periodically commits to fund a portion of the equity in certain of its sponsored investment products. The Company has committed to co-invest up to $5.1 million alongside Cohen & Steers Global Realty Partners III-TE, L.P. (GRP-TE), a portion of which is made through GRP-TE and the remainder of which is made through Cohen & Steers Co-Investment Partnership, L.P. for up to 12 years through the life of GRP-TE. At June 30, 2018, the Company has funded approximately $3.8 million with respect to this commitment. The actual timing for funding the unfunded portion of this commitment is currently unknown, as the drawdown of the Company’s unfunded commitment is contingent on the timing of drawdowns by the underlying funds in which GRP-TE invests. At June 30, 2018, the unfunded commitment was not recorded on the Company’s condensed consolidated statements of financial condition.
12. Concentration of Credit Risk
The Company’s cash and cash equivalents are principally on deposit with three major financial institutions. The Company is subject to credit risk should these financial institutions be unable to fulfill their obligations.
13. Subsequent Events
The Company has evaluated the need for disclosures and/or adjustments resulting from subsequent events through the date the condensed consolidated financial statements were issued. Other than the items described below and elsewhere in the notes to the financial statements, the Company determined that there were no additional subsequent events that require disclosure and/or adjustment.
On August 2, 2018, the Company declared a quarterly dividend on its common stock in the amount of $0.33 per share. The dividend will be payable on August 30, 2018 to stockholders of record at the close of business on August 16, 2018.
24
Item 2. Management’s Discussion and Analysis of Financial Condition and Results of Operations
Set forth on the following pages is management's discussion and analysis of our financial condition and results of operations for the three and six months ended June 30, 2018 and 2017. Such information should be read in conjunction with our condensed consolidated financial statements and the related notes included herein. The condensed consolidated financial statements of the Company are unaudited. When we use the terms “Cohen & Steers,” the “Company,” “we,” “us,” and “our,” we mean Cohen & Steers, Inc., a Delaware corporation, and its consolidated subsidiaries.
Executive Overview
General
We are a global investment manager specializing in liquid real assets, including real estate securities, listed infrastructure, commodities and natural resource equities, as well as preferred securities and other income solutions. Founded in 1986, we are headquartered in New York City, with offices in London, Hong Kong, Tokyo and Seattle.
Our primary investment strategies include U.S. real estate securities, global/international real estate securities, global listed infrastructure, midstream energy, commodities, real assets multi-strategy, preferred securities, large cap value and global natural resource equities. Our strategies seek to achieve a variety of investment objectives for different risk profiles and are actively managed by specialist teams of investment professionals who employ fundamental-driven research and portfolio management processes. We offer our strategies through a variety of investment vehicles, including U.S. registered funds and other commingled vehicles and separate accounts, including subadvised portfolios for financial institutions and individuals around the world.
Our products and services are marketed through multiple distribution channels. We distribute our U.S. registered funds principally through financial intermediaries, including broker-dealers, registered investment advisers, banks and fund supermarkets. Our funds domiciled in Europe are marketed to individual and institutional investors through financial intermediaries, as well as privately to institutional investors. Our institutional clients include corporate and public defined benefit and defined contribution pension plans, endowment funds and foundations, insurance companies and other financial institutions that access our investment management services directly, through consultants or through other intermediaries.
Our revenue is derived from fees received from our clients, including fees for managing or subadvising client accounts; investment advisory, administration, distribution and service fees received from Company-sponsored open-end and closed-end funds; and fees for portfolio consulting and other services. Our fees are paid in arrears, based on contractually specified percentages of the value of the assets we manage and, in certain cases, investment performance. Our revenue fluctuates with changes in the total value of our assets under management, which may occur as a result of market appreciation and depreciation, addition or termination of client accounts, contributions or withdrawals from client accounts, market conditions, foreign currency fluctuations, or investor subscriptions or redemptions, and is recognized over the period that the assets are managed.
Recent Business Developments
• | In May, we launched the Cohen & Steers Preferred Securities Fund (the “Preferred LP Fund”) a series fund of the Cohen & Steers Series LP that is available to qualified purchasers. The Preferred LP Fund was launched with initial third-party investment commitments of approximately $121 million. |
• | In June, we launched the Cohen & Steers SICAV Diversified Real Assets Fund which provides non-U.S. investors with a turnkey multi-strategy solution providing daily liquidity for gaining strategic exposure to multiple categories of real assets. In connection with the launch of this fund, we made an initial seed investment of $10 million in the fund. |
• | During the second quarter, we seeded a new Midstream Energy MLP Focus strategy, bringing us to a total of seven different seed accounts created for the purpose of establishing or maintaining performance track records. |
25
Assets Under Management
The following table summarizes net flows, market appreciation (depreciation) and distributions of assets under management by investment vehicle for the periods presented (in millions):
Three Months Ended June 30, | Six Months Ended June 30, | ||||||||||||||
2018 | 2017 | 2018 | 2017 | ||||||||||||
Institutional Accounts | |||||||||||||||
Assets under management, beginning of period | $ | 27,438 | $ | 28,935 | $ | 29,396 | $ | 28,659 | |||||||
Inflows | 752 | 1,031 | 1,495 | 1,875 | |||||||||||
Outflows | (714 | ) | (588 | ) | (1,549 | ) | (1,117 | ) | |||||||
Net inflows (outflows) | 38 | 443 | (54 | ) | 758 | ||||||||||
Market appreciation (depreciation) | 1,374 | 881 | 108 | 1,524 | |||||||||||
Distributions | (566 | ) | (849 | ) | (1,166 | ) | (1,660 | ) | |||||||
Transfers | 32 | 47 | 32 | 176 | |||||||||||
Total increase (decrease) | 878 | 522 | (1,080 | ) | 798 | ||||||||||
Assets under management, end of period | $ | 28,316 | $ | 29,457 | $ | 28,316 | $ | 29,457 | |||||||
Average assets under management | $ | 27,412 | $ | 29,219 | $ | 27,596 | $ | 29,120 | |||||||
Open-end Funds | |||||||||||||||
Assets under management, beginning of period | $ | 22,136 | $ | 20,361 | $ | 23,304 | $ | 19,576 | |||||||
Inflows | 2,119 | 2,435 | 4,654 | 4,751 | |||||||||||
Outflows | (1,989 | ) | (1,548 | ) | (4,527 | ) | (3,274 | ) | |||||||
Net inflows (outflows) | 130 | 887 | 127 | 1,477 | |||||||||||
Market appreciation (depreciation) | 906 | 674 | (53 | ) | 1,172 | ||||||||||
Distributions | (313 | ) | (262 | ) | (519 | ) | (436 | ) | |||||||
Transfers | (32 | ) | (47 | ) | (32 | ) | (176 | ) | |||||||
Total increase (decrease) | 691 | 1,252 | (477 | ) | 2,037 | ||||||||||
Assets under management, end of period | $ | 22,827 | $ | 21,613 | $ | 22,827 | $ | 21,613 | |||||||
Average assets under management | $ | 22,340 | $ | 21,093 | $ | 22,320 | $ | 20,610 | |||||||
Closed-end Funds | |||||||||||||||
Assets under management, beginning of period | $ | 8,888 | $ | 9,218 | $ | 9,406 | $ | 8,963 | |||||||
Inflows | 12 | — | 12 | — | |||||||||||
Outflows | — | — | — | — | |||||||||||
Net inflows (outflows) | 12 | — | 12 | — | |||||||||||
Market appreciation (depreciation) | 289 | 271 | (101 | ) | 648 | ||||||||||
Distributions | (128 | ) | (122 | ) | (256 | ) | (244 | ) | |||||||
Total increase (decrease) | 173 | 149 | (345 | ) | 404 | ||||||||||
Assets under management, end of period | $ | 9,061 | $ | 9,367 | $ | 9,061 | $ | 9,367 | |||||||
Average assets under management | $ | 8,965 | $ | 9,345 | $ | 9,028 | $ | 9,248 | |||||||
Total | |||||||||||||||
Assets under management, beginning of period | $ | 58,462 | $ | 58,514 | $ | 62,106 | $ | 57,198 | |||||||
Inflows | 2,883 | 3,466 | 6,161 | 6,626 | |||||||||||
Outflows | (2,703 | ) | (2,136 | ) | (6,076 | ) | (4,391 | ) | |||||||
Net inflows (outflows) | 180 | 1,330 | 85 | 2,235 | |||||||||||
Market appreciation (depreciation) | 2,569 | 1,826 | (46 | ) | 3,344 | ||||||||||
Distributions | (1,007 | ) | (1,233 | ) | (1,941 | ) | (2,340 | ) | |||||||
Total increase (decrease) | 1,742 | 1,923 | (1,902 | ) | 3,239 | ||||||||||
Assets under management, end of period | $ | 60,204 | $ | 60,437 | $ | 60,204 | $ | 60,437 | |||||||
Average assets under management | $ | 58,717 | $ | 59,657 | $ | 58,944 | $ | 58,978 | |||||||
26
The following table summarizes net flows, market appreciation (depreciation) and distributions of assets under management by institutional account type for the periods presented (in millions):
Three Months Ended June 30, | Six Months Ended June 30, | ||||||||||||||
2018 | 2017 | 2018 | 2017 | ||||||||||||
Japan Subadvisory | |||||||||||||||
Assets under management, beginning of period | $ | 9,876 | $ | 13,390 | $ | 11,458 | $ | 13,699 | |||||||
Inflows | 34 | 582 | 103 | 993 | |||||||||||
Outflows | (186 | ) | (253 | ) | (591 | ) | (358 | ) | |||||||
Net inflows (outflows) | (152 | ) | 329 | (488 | ) | 635 | |||||||||
Market appreciation (depreciation) | 691 | 357 | 45 | 553 | |||||||||||
Distributions | (566 | ) | (849 | ) | (1,166 | ) | (1,660 | ) | |||||||
Total increase (decrease) | (27 | ) | (163 | ) | (1,609 | ) | (472 | ) | |||||||
Assets under management, end of period | $ | 9,849 | $ | 13,227 | $ | 9,849 | $ | 13,227 | |||||||
Average assets under management | $ | 9,524 | $ | 13,271 | $ | 9,843 | $ | 13,388 | |||||||
Subadvisory Excluding Japan | |||||||||||||||
Assets under management, beginning of period | $ | 6,348 | $ | 6,128 | $ | 6,597 | $ | 5,892 | |||||||
Inflows | 172 | 168 | 453 | 353 | |||||||||||
Outflows | (432 | ) | (176 | ) | (747 | ) | (319 | ) | |||||||
Net inflows (outflows) | (260 | ) | (8 | ) | (294 | ) | 34 | ||||||||
Market appreciation (depreciation) | 230 | 236 | 15 | 430 | |||||||||||
Total increase (decrease) | (30 | ) | 228 | (279 | ) | 464 | |||||||||
Assets under management, end of period | $ | 6,318 | $ | 6,356 | $ | 6,318 | $ | 6,356 | |||||||
Average assets under management | $ | 6,329 | $ | 6,276 | $ | 6,368 | $ | 6,159 | |||||||
Advisory | |||||||||||||||
Assets under management, beginning of period | $ | 11,214 | $ | 9,417 | $ | 11,341 | $ | 9,068 | |||||||
Inflows | 546 | 281 | 939 | 529 | |||||||||||
Outflows | (96 | ) | (159 | ) | (211 | ) | (440 | ) | |||||||
Net inflows (outflows) | 450 | 122 | 728 | 89 | |||||||||||
Market appreciation (depreciation) | 453 | 288 | 48 | 541 | |||||||||||
Transfers | 32 | 47 | 32 | 176 | |||||||||||
Total increase (decrease) | 935 | 457 | 808 | 806 | |||||||||||
Assets under management, end of period | $ | 12,149 | $ | 9,874 | $ | 12,149 | $ | 9,874 | |||||||
Average assets under management | $ | 11,559 | $ | 9,672 | $ | 11,385 | $ | 9,573 | |||||||
Total Institutional Accounts | |||||||||||||||
Assets under management, beginning of period | $ | 27,438 | $ | 28,935 | $ | 29,396 | $ | 28,659 | |||||||
Inflows | 752 | 1,031 | 1,495 | 1,875 | |||||||||||
Outflows | (714 | ) | (588 | ) | (1,549 | ) | (1,117 | ) | |||||||
Net inflows (outflows) | 38 | 443 | (54 | ) | 758 | ||||||||||
Market appreciation (depreciation) | 1,374 | 881 | 108 | 1,524 | |||||||||||
Distributions | (566 | ) | (849 | ) | (1,166 | ) | (1,660 | ) | |||||||
Transfers | 32 | 47 | 32 | 176 | |||||||||||
Total increase (decrease) | 878 | 522 | (1,080 | ) | 798 | ||||||||||
Assets under management, end of period | $ | 28,316 | $ | 29,457 | $ | 28,316 | $ | 29,457 | |||||||
Average assets under management | $ | 27,412 | $ | 29,219 | $ | 27,596 | $ | 29,120 | |||||||
27
The following table summarizes net flows, market appreciation (depreciation) and distributions of assets under management by investment strategy for the periods presented (in millions):
Three Months Ended June 30, | Six Months Ended June 30, | ||||||||||||||
2018 | 2017 | 2018 | 2017 | ||||||||||||
U.S. Real Estate | |||||||||||||||
Assets under management, beginning of period | $ | 24,705 | $ | 28,719 | $ | 27,580 | $ | 28,927 | |||||||
Inflows | 1,031 | 1,605 | 2,354 | 3,046 | |||||||||||
Outflows | (1,104 | ) | (1,132 | ) | (2,715 | ) | (2,289 | ) | |||||||
Net inflows (outflows) | (73 | ) | 473 | (361 | ) | 757 | |||||||||
Market appreciation (depreciation) | 1,945 | 682 | 187 | 1,080 | |||||||||||
Distributions | (740 | ) | (978 | ) | (1,410 | ) | (1,868 | ) | |||||||
Transfers | — | — | (159 | ) | — | ||||||||||
Total increase (decrease) | 1,132 | 177 | (1,743 | ) | (31 | ) | |||||||||
Assets under management, end of period | $ | 25,837 | $ | 28,896 | $ | 25,837 | $ | 28,896 | |||||||
Average assets under management | $ | 24,726 | $ | 28,898 | $ | 24,959 | $ | 28,921 | |||||||
Preferred Securities | |||||||||||||||
Assets under management, beginning of period | $ | 13,012 | $ | 10,560 | $ | 13,018 | $ | 9,880 | |||||||
Inflows | 1,020 | 1,430 | 2,220 | 2,529 | |||||||||||
Outflows | (939 | ) | (535 | ) | (1,935 | ) | (1,221 | ) | |||||||
Net inflows (outflows) | 81 | 895 | 285 | 1,308 | |||||||||||
Market appreciation (depreciation) | (22 | ) | 420 | (249 | ) | 809 | |||||||||
Distributions | (139 | ) | (126 | ) | (281 | ) | (248 | ) | |||||||
— | — | 159 | — | ||||||||||||
Total increase (decrease) | (80 | ) | 1,189 | (86 | ) | 1,869 | |||||||||
Assets under management, end of period | $ | 12,932 | $ | 11,749 | $ | 12,932 | $ | 11,749 | |||||||
Average assets under management | $ | 12,984 | $ | 11,125 | $ | 12,976 | $ | 10,677 | |||||||
Global/International Real Estate | |||||||||||||||
Assets under management, beginning of period | $ | 10,965 | $ | 9,785 | $ | 11,108 | $ | 9,403 | |||||||
Inflows | 668 | 225 | 1,132 | 614 | |||||||||||
Outflows | (270 | ) | (341 | ) | (557 | ) | (541 | ) | |||||||
Net inflows (outflows) | 398 | (116 | ) | 575 | 73 | ||||||||||
Market appreciation (depreciation) | 364 | 516 | 107 | 750 | |||||||||||
Distributions | (53 | ) | (64 | ) | (116 | ) | (105 | ) | |||||||
Total increase (decrease) | 709 | 336 | 566 | 718 | |||||||||||
Assets under management, end of period | $ | 11,674 | $ | 10,121 | $ | 11,674 | $ | 10,121 | |||||||
Average assets under management | $ | 11,177 | $ | 10,022 | $ | 11,037 | $ | 9,966 | |||||||
Global Listed Infrastructure | |||||||||||||||
Assets under management, beginning of period | $ | 6,758 | $ | 6,204 | $ | 6,932 | $ | 5,697 | |||||||
Inflows | 121 | 121 | 372 | 278 | |||||||||||
Outflows | (137 | ) | (88 | ) | (210 | ) | (129 | ) | |||||||
Net inflows (outflows) | (16 | ) | 33 | 162 | 149 | ||||||||||
Market appreciation (depreciation) | 222 | 202 | (85 | ) | 635 | ||||||||||
Distributions | (55 | ) | (45 | ) | (100 | ) | (87 | ) | |||||||
Total increase (decrease) | 151 | 190 | (23 | ) | 697 | ||||||||||
Assets under management, end of period | $ | 6,909 | $ | 6,394 | $ | 6,909 | $ | 6,394 | |||||||
Average assets under management | $ | 6,845 | $ | 6,347 | $ | 6,854 | $ | 6,139 | |||||||
28
Three Months Ended June 30, | Six Months Ended June 30, | ||||||||||||||
2018 | 2017 | 2018 | 2017 | ||||||||||||
Other | |||||||||||||||
Assets under management, beginning of period | $ | 3,022 | $ | 3,246 | $ | 3,468 | $ | 3,291 | |||||||
Inflows | 43 | 85 | 83 | 159 | |||||||||||
Outflows | (253 | ) | (40 | ) | (659 | ) | (211 | ) | |||||||
Net inflows (outflows) | (210 | ) | 45 | (576 | ) | (52 | ) | ||||||||
Market appreciation (depreciation) | 60 | 6 | (6 | ) | 70 | ||||||||||
Distributions | (20 | ) | (20 | ) | (34 | ) | (32 | ) | |||||||
Total increase (decrease) | (170 | ) | 31 | (616 | ) | (14 | ) | ||||||||
Assets under management, end of period | $ | 2,852 | $ | 3,277 | $ | 2,852 | $ | 3,277 | |||||||
Average assets under management | $ | 2,985 | $ | 3,265 | $ | 3,118 | $ | 3,275 | |||||||
Total | |||||||||||||||
Assets under management, beginning of period | $ | 58,462 | $ | 58,514 | $ | 62,106 | $ | 57,198 | |||||||
Inflows | 2,883 | 3,466 | 6,161 | 6,626 | |||||||||||
Outflows | (2,703 | ) | (2,136 | ) | (6,076 | ) | (4,391 | ) | |||||||
Net inflows (outflows) | 180 | 1,330 | 85 | 2,235 | |||||||||||
Market appreciation (depreciation) | 2,569 | 1,826 | (46 | ) | 3,344 | ||||||||||
Distributions | (1,007 | ) | (1,233 | ) | (1,941 | ) | (2,340 | ) | |||||||
Total increase (decrease) | 1,742 | 1,923 | (1,902 | ) | 3,239 | ||||||||||
Assets under management, end of period | $ | 60,204 | $ | 60,437 | $ | 60,204 | $ | 60,437 | |||||||
Average assets under management | $ | 58,717 | $ | 59,657 | $ | 58,944 | $ | 58,978 | |||||||
29
Investment Performance as of June 30, 2018
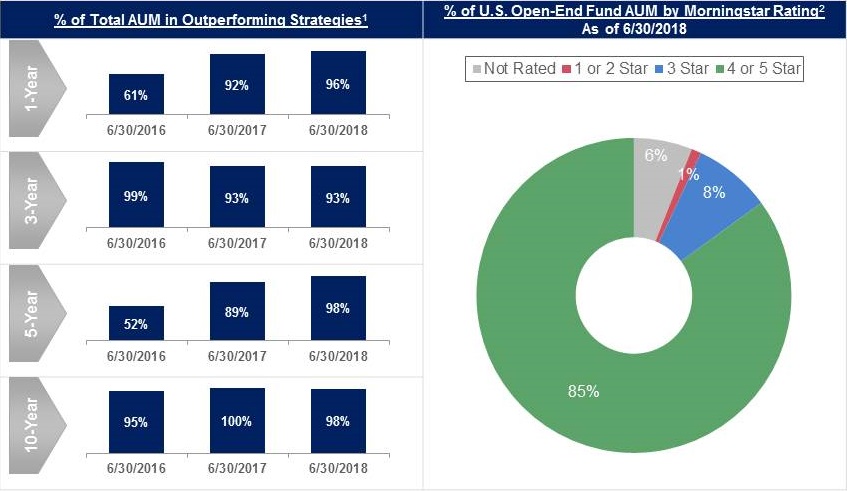
_________________________
(1) | Past performance is no guarantee of future results. Outperformance is determined by annualized investment performance of all accounts in each investment strategy measured gross of fees and net of withholding taxes in comparison to the performance of each account's reference benchmark measured net of withholding taxes, where applicable. This is not investment advice and may not be construed as sales or marketing material for any financial product or service sponsored or provided by Cohen & Steers. |
(2) | © 2018 Morningstar, Inc. All Rights Reserved. The information contained herein: (1) is proprietary to Morningstar and/or its content providers; (2) may not be copied or distributed; and (3) is not warranted to be accurate, complete, or timely. Neither Morningstar nor its content providers are responsible for any damages or losses arising from any use of this information. Morningstar calculates its ratings based on a risk-adjusted return measure that accounts for variation in a fund's monthly performance (including the effects of sales charges, loads, and redemption fees), placing more emphasis on downward variations and rewarding consistent performance. The top 10% of funds in each category receive five stars, the next 22.5% receive four stars, the next 35% receive three stars, the next 22.5% receive two stars and the bottom 10% receive one star. Past performance is no guarantee of future results. Based on independent rating by Morningstar, Inc. of investment performance of each Cohen & Steers-sponsored open-end U.S.-registered mutual fund for all share classes for the overall period at June 30, 2018. Overall Morningstar rating is a weighted average based on the 3-year, 5-year and 10-year Morningstar rating. Each share class is counted as a fraction of one fund within this scale and rated separately, which may cause slight variations in the distribution percentages. This is not investment advice and may not be construed as sales or marketing material for any financial product or service sponsored or provided by Cohen & Steers. |
Overview
Assets under management at June 30, 2018 decreased 0.4% to $60.2 billion from $60.4 billion at June 30, 2017. The decrease was due to distributions of $4.3 billion, partially offset by net inflows of $1.7 billion and market appreciation of $2.4 billion. Net inflows included $1.5 billion into preferred securities. Market appreciation included $1.0 billion from U.S. real estate, $815 million from global/international real estate and $215 million from global listed infrastructure. Distributions included $3.2 billion from U.S. real estate and $573 million from preferred securities.
Average assets under management for the three months ended June 30, 2018 decreased 2% to $58.7 billion from $59.7 billion for the three months ended June 30, 2017. Average assets under management for the six months ended June 30, 2018 decreased 0.1% to $58.9 billion from $59.0 billion for the six months ended June 30, 2017.
30
Institutional accounts
Assets under management in institutional accounts at June 30, 2018, which represented 47% of total assets under management, decreased 4% to $28.3 billion from $29.5 billion at June 30, 2017. The decrease was primarily due to distributions from Japan subadvised accounts of $2.5 billion, partially offset by market appreciation of $1.4 billion. Market appreciation included $665 million from global/international real estate and $438 million from U.S. real estate. Distributions included $2.4 billion from U.S. real estate. Average assets under management for institutional accounts for the three months ended June 30, 2018 decreased 6% to $27.4 billion from $29.2 billion for the three months ended June 30, 2017.
Assets under management in Japan subadvised accounts at June 30, 2018, which represented 35% of institutional assets under management, decreased 26% to $9.8 billion from $13.2 billion at June 30, 2017. The decrease was due to net outflows of $1.3 billion and distributions of $2.5 billion, partially offset by market appreciation of $402 million. Net outflows included $1.3 billion from U.S. real estate. Market appreciation included $248 million from U.S. real estate and $142 million from global/international real estate. Distributions included $2.4 billion from U.S. real estate. Average assets under management for Japan subadvised accounts for the three months ended June 30, 2018 decreased 28% to $9.5 billion from $13.3 billion for the three months ended June 30, 2017.
Assets under management in institutional subadvised accounts excluding Japan at June 30, 2018, which represented 22% of institutional assets under management, decreased 1% to $6.3 billion from $6.4 billion at June 30, 2017. The decrease was due to net outflows of $452 million, partially offset by market appreciation of $413 million. Net outflows included $349 million from commodities (which is included in “Other” in the table above). Market appreciation included $234 million from global/international real estate and $58 million from large cap value (which is included in “Other” in the table above). Average assets under management for institutional subadvised accounts excluding Japan for both the three months ended June 30, 2018 and 2017 were $6.3 billion.
Assets under management in institutional advisory accounts at June 30, 2018, which represented 43% of institutional assets under management, increased 23% to $12.1 billion from $9.9 billion at June 30, 2017. The increase was due to net inflows of $1.6 billion and market appreciation of $634 million. Net inflows included $524 million into global listed infrastructure, $477 million into preferred securities and $349 million into global/international real estate. Market appreciation included $289 million from global/international real estate and $145 million from U.S. real estate. Average assets under management for institutional advisory accounts for the three months ended June 30, 2018 increased 20% to $11.6 billion from $9.7 billion for the three months ended June 30, 2017.
Open-end funds
Assets under management in open-end funds at June 30, 2018, which represented 38% of total assets under management, increased 6% to $22.8 billion from $21.6 billion at June 30, 2017. The increase was due to net inflows of $1.8 billion and market appreciation of $723 million, partially offset by distributions of $1.3 billion. Net inflows included $963 million into preferred securities and $541 million into U.S. real estate. Market appreciation included $496 million from U.S. real estate and $149 million from global/international real estate. Distributions included $709 million from U.S. real estate and $451 million from preferred securities. Average assets under management for open-end funds for the three months ended June 30, 2018 increased 6% to $22.3 billion from $21.1 billion for the three months ended June 30, 2017.
Closed-end funds
Assets under management in closed-end funds at June 30, 2018, which represented 15% of total assets under management, decreased 3% to $9.1 billion from $9.4 billion at June 30, 2017. Distributions of $518 million were partially offset by market appreciation of $200 million. Average assets under management for closed-end funds for the three months ended June 30, 2018 decreased 4% to $9.0 billion from $9.3 billion for the three months ended June 30, 2017.
31
Results of Operations
(in thousands, except per share data and percentages) | Three Months Ended June 30, | Six Months Ended June 30, | |||||||||||||
2018 | 2017 | 2018 | 2017 | ||||||||||||
U.S. GAAP | |||||||||||||||
Revenue (1) | $ | 94,410 | $ | 92,714 | $ | 188,874 | $ | 182,455 | |||||||
Expenses (1) | $ | 58,123 | $ | 55,357 | $ | 115,368 | $ | 109,570 | |||||||
Operating income | $ | 36,287 | $ | 37,357 | $ | 73,506 | $ | 72,885 | |||||||
Non-operating income (loss) | $ | (778 | ) | $ | 261 | $ | (977 | ) | $ | 488 | |||||
Net income attributable to common stockholders (2) | $ | 29,959 | $ | 23,474 | $ | 57,545 | $ | 46,459 | |||||||
Diluted earnings per share | $ | 0.63 | $ | 0.50 | $ | 1.22 | $ | 0.99 | |||||||
Operating margin | 38.4 | % | 40.3 | % | 38.9 | % | 39.9 | % | |||||||
As Adjusted (3) | |||||||||||||||
Net income attributable to common stockholders (2) | $ | 27,865 | $ | 23,415 | $ | 56,874 | $ | 45,331 | |||||||
Diluted earnings per share | $ | 0.59 | $ | 0.50 | $ | 1.20 | $ | 0.97 | |||||||
Operating margin | 38.7 | % | 40.4 | % | 39.6 | % | 40.0 | % | |||||||
_________________________
(1) | The presentation for the three and six months ended June 30, 2017 has been recast to reflect the Company's adoption of the new revenue recognition accounting standard on January 1, 2018. |
(2) | Net income for three and six months ended June 30, 2018 reflected the lower U.S. federal statutory tax rate of 21% due to the Tax Cuts and Jobs Act. |
(3) | The “As Adjusted” amounts represent non-GAAP financial measures. Refer to pages 37-38 for reconciliations to the most directly comparable U.S. GAAP financial measures. |
U.S. GAAP
Three Months Ended June 30, 2018 Compared with Three Months Ended June 30, 2017
Revenue
Revenue for the three months ended June 30, 2018 increased 2% to $94.4 million from $92.7 million for the three months ended June 30, 2017. The increase was primarily attributable to higher investment advisory and administration fees of $2.2 million due to higher average assets under management in open-end funds.
For the three months ended June 30, 2018:
• | Total investment advisory revenue from institutional accounts increased 2% to $24.8 million from $24.4 million for the three months ended June 30, 2017. Total investment advisory revenue compared with average assets under management in institutional accounts implied an annualized effective fee rate of 36.2 bps and 33.5 bps for the three months ended June 30, 2018 and 2017, respectively. The increase in the annualized effective fee rate reflected net outflows from lower fee mandates. |
• | Total investment advisory and administration revenue from open-end funds increased 6% to $40.5 million from $38.3 million for the three months ended June 30, 2017. Total investment advisory and administration revenue compared with average assets under management in open-end funds implied an annualized effective fee rate of 72.8 bps and 72.9 bps for the three months ended June 30, 2018 and 2017, respectively. |
• | Total investment advisory and administration revenue from closed-end funds decreased 2% to $19.1 million from $19.5 million for the three months ended June 30, 2017. Total investment advisory and administration revenue compared with average assets under management in closed-end funds implied an annualized effective fee rate of 85.6 bps and 83.8 bps for the three months ended June 30, 2018 and 2017, respectively. The net increase in the annualized effective fee rate reflected the realignment of administration fee rates across our mutual fund complex which was approved by the mutual fund Board of Directors in June 2017. |
32
Expenses
Expenses for the three months ended June 30, 2018 increased 5% to $58.1 million from $55.4 million for the three months ended June 30, 2017, primarily due to higher employee compensation and benefits of $2.1 million and general and administrative expenses of $1.6 million, partially offset by lower distribution and service fees expense of $1.2 million.
Employee compensation and benefits for the three months ended June 30, 2018 increased 7% to $32.5 million from $30.4 million for the three months ended June 30, 2017, primarily due to higher incentive compensation of approximately $943,000, which included a cumulative adjustment in the second quarter of 2018, higher salaries of approximately $722,000 and amortization of restricted stock units of approximately $624,000, partially offset by lower production compensation of approximately $441,000.
Distribution and service fees expense for the three months ended June 30, 2018 decreased 9% to $12.4 million from $13.6 million for the three months ended June 30, 2017, primarily due to a continued shift in the composition of assets under management into lower cost share classes.
General and administrative expenses for the three months ended June 30, 2018 increased 16% to $12.0 million from $10.3 million for the three months ended June 30, 2017, primarily due to higher recruiting fees of approximately $391,000, research and market data expenses of approximately $324,000, professional fees of approximately $221,000, as well as higher costs associated with hosted conferences of approximately $189,000.
Operating Margin
Operating margin for the three months ended June 30, 2018 decreased to 38.4% from 40.3% for the three months ended June 30, 2017.
Non-operating Income (Loss)
Non-operating loss for the three months ended June 30, 2018 was $778,000, compared with non-operating income of $261,000 for the three months ended June 30, 2017. The change was primarily due to a decline in the results from the Company’s seed investments of $2.5 million, partially offset by foreign currency exchange gains of $953,000 and higher interest on corporate cash balances of $534,000. Non-operating loss for the three months ended June 30, 2018 included net loss attributable to redeemable noncontrolling interest of $4.4 million. Non-operating income for the three months ended June 30, 2017 included net loss attributable to redeemable noncontrolling interest of $476,000 for the three months ended June 30, 2017.
Income Taxes
Income tax expense was $9.9 million for the three months ended June 30, 2018, compared with $14.6 million for the three months ended June 30, 2017. The effective tax rate for the three months ended June 30, 2018 was 24.9%, compared with 38.4% for the three months ended June 30, 2017. The effective tax rate for the three months ended June 30, 2018 differed from the U.S. federal statutory rate of 21% primarily due to state, local and foreign taxes, net of a benefit related to an adjustment to the Company's transition tax liability. The effective tax rate for the three months ended June 30, 2017 differed from the U.S. federal statutory rate of 35% primarily due to state, local and foreign taxes.
Six Months Ended June 30, 2018 Compared with Six Months Ended June 30, 2017
Revenue
Revenue for the six months ended June 30, 2018 increased 4% to $188.9 million from $182.5 million for the six months ended June 30, 2017. The increase was primarily attributable to higher investment advisory and administration fees of $7.0 million due to higher average assets under management in open-end funds.
For the six months ended June 30, 2018:
• | Total investment advisory revenue from institutional accounts increased 3% to $50.0 million from $48.6 million for the six months ended June 30, 2017. Total investment advisory revenue compared with average assets under management in institutional accounts implied an annualized effective fee rate of 36.5 bps and 33.6 bps for the six months ended June 30, 2018 and 2017, respectively. The increase in the annualized effective fee rate reflected net outflows from lower fee mandates. |
33
• | Total investment advisory and administration revenue from open-end funds increased 8% to $80.6 million from $74.9 million for the six months ended June 30, 2017. Total investment advisory and administration revenue compared with average assets under management in open-end funds implied an annualized effective fee rate of 72.8 bps and 73.3 bps for the six months ended June 30, 2018 and 2017, respectively. |
• | Total investment advisory and administration revenue from closed-end funds decreased 0.2% to $38.3 million from $38.4 million for the six months ended June 30, 2017. Total investment advisory and administration revenue compared with average assets under management in closed-end funds implied an annualized effective fee rate of 85.6 bps and 83.7 bps for the six months ended June 30, 2018 and 2017, respectively. The net increase in the annualized effective fee rate reflected the realignment of administration fee rates across our mutual fund complex which was approved by the mutual fund Board of Directors in June 2017. |
Expenses
Expenses for the six months ended June 30, 2018 increased 5% to $115.4 million from $109.6 million for the six months ended June 30, 2017, primarily due to higher employee compensation and benefits of $3.9 million and general and administrative expenses of $3.3 million, partially offset by lower distribution and service fees expense of $1.5 million.
Employee compensation and benefits for the six months ended June 30, 2018 increased 6% to $63.7 million from $59.8 million for the six months ended June 30, 2017, primarily due to higher incentive compensation of approximately $1.6 million and salaries of approximately $1.6 million.
Distribution and service fees expense for the six months ended June 30, 2018 decreased 6% to $25.3 million from $26.8 million for the six months ended June 30, 2017, primarily due to a continued shift in the composition of assets under management into lower cost share classes.
General and administrative expenses for the six months ended June 30, 2018 increased 16% to $24.2 million from $20.9 million for the six months ended June 30, 2017, primarily due to expenses of approximately $871,000 associated
with the evaluation of a potential business transaction that the Company did not pursue in the first quarter of 2018, higher research and market data expenses of approximately $750,000 and recruiting fees of approximately $611,000.
Operating Margin
Operating margin for the six months ended June 30, 2018 decreased to 38.9% from 39.9% for the six months ended June 30, 2017.
Non-operating Income (Loss)
Non-operating loss for the six months ended June 30, 2018 was $1.0 million, compared with non-operating income of $488,000 for the six months ended June 30, 2017. The change was primarily due to a decline in the results from the Company’s seed investments of $3.6 million, partially offset by foreign currency exchange gains of $953,000 and higher interest on corporate cash balances of $997,000. Non-operating loss for the six months ended June 30, 2018 included net loss attributable to redeemable noncontrolling interest of $3.1 million. Non-operating income for the six months ended June 30, 2017 included net loss attributable to redeemable noncontrolling interest of $517,000.
Income Taxes
Income tax expense for the six months ended June 30, 2018 was $18.0 million, compared with $27.4 million for the six months ended June 30, 2017. The effective tax rate for the six months ended June 30, 2018 was 23.9%, compared with 37.1% for the six months ended June 30, 2017. The effective tax rate for the six months ended June 30, 2018 differed from the U.S. federal statutory rate of 21% primarily due to state, local and foreign taxes, net of benefits related to the delivery of restricted stock units and an adjustment to the Company's transition tax liability. The effective tax rate for the six months ended June 30, 2017 differed from the U.S. federal statutory rate of 35% primarily due to state and foreign taxes, partially offset by the release of certain tax reserves.
34
As Adjusted
The term "As Adjusted" is used to identify non-GAAP financial information in the discussion below. Refer to pages 37-38 for reconciliations to the most directly comparable U.S. GAAP financial measures.
Three Months Ended June 30, 2018 Compared with Three Months Ended June 30, 2017
Revenue
Revenue, as adjusted, for the three months ended June 30, 2018 increased 2% to $94.2 million from $92.6 million for the three months ended June 30, 2017.
Revenue, as adjusted, excluded investment advisory and administration fees attributable to the consolidation of certain of the Company's seed investments for all periods presented.
Expenses
Expenses, as adjusted, for the three months ended June 30, 2018 increased 5% to $57.8 million from $55.2 million for the three months ended June 30, 2017.
Expenses, as adjusted, excluded general and administrative expenses attributable to the consolidation of certain of the Company's seed investments for all periods presented.
Operating Margin
Operating margin, as adjusted, for the three months ended June 30, 2018 was 38.7%, compared with 40.4% for the three months ended June 30, 2017.
Non-operating Income (Loss)
Non-operating income, as adjusted, for the three months ended June 30, 2018 was $837,000, compared with $325,000 for the three months ended June 30, 2017.
Non-operating income (loss), as adjusted, excluded amounts attributable to the Company's seed investments for all periods presented and net foreign currency gains associated with U.S. dollar-denominated assets and liabilities held
by certain foreign subsidiaries for the three months ended June 30, 2018.
Income Taxes
The effective tax rate, as adjusted, for the three months ended June 30, 2018, was 25.3%, compared with 38.0% for the three months ended June 30, 2017.
The effective tax rate, as adjusted, excluded the income tax effects related to the delivery of restricted stock units and other non-GAAP adjustments for both the three months ended June 30, 2018 and 2017 as well as the amounts attributable to an adjustment to the Company's transition tax liability for the three months ended June 30, 2018.
Six Months Ended June 30, 2018 Compared with Six Months Ended June 30, 2017
Revenue
Revenue, as adjusted, for the six months ended June 30, 2018 increased 4% to $188.6 million from $182.3 million for the six months ended June 30, 2017.
Revenue, as adjusted, excluded investment advisory and administration fees attributable to the consolidation of certain of the Company's seed investments for all periods presented.
Expenses
Expenses, as adjusted, for the six months ended June 30, 2018 increased 4% to $113.9 million from $109.3 million for the six months ended June 30, 2017.
Expenses, as adjusted, excluded general and administrative expenses attributable to the consolidation of certain of the Company's seed investments for all periods presented, expenses incurred associated with the evaluation of a potential business transaction that the Company did not pursue in the first quarter of 2018 and a refund of foreign withholding taxes recorded during the six months ended June 30, 2017.
35
Operating Margin
Operating margin, as adjusted, for the six months ended June 30, 2018 was 39.6%, compared with 40.0% for the six months ended June 30, 2017.
Non-operating Income (Loss)
Non-operating income, as adjusted, for the six months ended June 30, 2018 was $1.4 million, compared $158,000 for the six months ended June 30, 2017.
Non-operating income (loss), as adjusted, excluded amounts attributable to the Company's seed investments for all periods presented and net foreign currency gains associated with U.S. dollar-denominated assets and liabilities held by certain foreign subsidiaries for the six months ended June 30, 2018.
Income Taxes
The effective tax rate, as adjusted, for the six months ended June 30, 2018, was 25.3%, compared with 38.0% for the six months ended June 30, 2017.
The effective tax rate, as adjusted, excluded the income tax effects related to the delivery of restricted stock units and other non-GAAP adjustments for both the six months ended June 30, 2018 and 2017, the amounts attributable to an adjustment to the Company's transition tax liability for the six months ended June 30, 2018, and the release of certain tax
reserves for the six months ended June 30, 2017.
36
Non-GAAP Reconciliations
Management believes that use of these non-GAAP financial measures enhances the evaluation of our results, as they provide greater transparency into our operating performance. In addition, these non-GAAP financial measures are used to prepare our internal management reports and are used by management in evaluating our business.
While we believe that this non-GAAP financial information is useful in evaluating our results and operating performance, this information should be considered as supplemental in nature and not as a substitute for the related financial information prepared in accordance with U.S. GAAP.
Reconciliation of U.S. GAAP Net Income Attributable to Common Stockholders and U.S. GAAP Earnings per Share to Net Income Attributable to Common Stockholders, As Adjusted, and Earnings per Share, As Adjusted
(in thousands, except per share data) | Three Months Ended June 30, | Six Months Ended June 30, | ||||||||||||||
2018 | 2017 | 2018 | 2017 | |||||||||||||
Net income attributable to common stockholders, U.S. GAAP | $ | 29,959 | $ | 23,474 | $ | 57,545 | $ | 46,459 | ||||||||
Deconsolidation (1) | 485 | (264 | ) | 966 | (576 | ) | ||||||||||
Results from seed investments (2) | (2,154 | ) | (64 | ) | (380 | ) | (132 | ) | ||||||||
General and administrative (3) | — | — | 871 | (68 | ) | |||||||||||
Foreign currency exchange gain (4) | (953 | ) | — | (953 | ) | — | ||||||||||
Tax adjustments (5) | 528 | 269 | (1,175 | ) | (352 | ) | ||||||||||
Net income attributable to common stockholders, as adjusted | $ | 27,865 | $ | 23,415 | $ | 56,874 | $ | 45,331 | ||||||||
Diluted weighted average shares outstanding | 47,311 | 46,902 | 47,237 | 46,753 | ||||||||||||
Diluted earnings per share, U.S. GAAP | $ | 0.63 | $ | 0.50 | $ | 1.22 | $ | 0.99 | ||||||||
Deconsolidation (1) | 0.01 | (0.01 | ) | 0.02 | (0.01 | ) | ||||||||||
Results from seed investments (2) | (0.04 | ) | — | * | (0.01 | ) | — | * | ||||||||
General and administrative (3) | — | — | 0.02 | — | * | |||||||||||
Foreign currency exchange gain (4) | (0.02 | ) | — | (0.02 | ) | — | ||||||||||
Tax adjustments (5) | 0.01 | 0.01 | (0.03 | ) | (0.01 | ) | ||||||||||
Diluted earnings per share, as adjusted | $ | 0.59 | $ | 0.50 | $ | 1.20 | $ | 0.97 | ||||||||
* | Amounts round to less than $0.01 per share. |
(1) | Represents amounts related to the deconsolidation of seed investments in Company-sponsored funds. |
(2) | Represents (i) dividend income and realized (gains) losses on seed investments in Company-sponsored funds, (ii) the Company's proportionate share of the results of operations of seed investments classified as equity method investments, including realized and unrealized (gains) losses, and (iii) realized and unrealized (gains) losses on unconsolidated seed investments. |
(3) | Represents expenses associated with the evaluation of a potential business transaction that the Company did not pursue in the first quarter of 2018 and a refund of foreign withholding taxes in the first quarter of 2017. |
(4) | Represents net foreign currency exchange gains associated with U.S. dollar-denominated assets and liabilities held by certain foreign subsidiaries for the three and six months ended June 30, 2018. Prior period U.S. GAAP amounts have not been recast to conform with the current period presentation as the impact to results was not material. |
(5) | Tax adjustments are summarized in the following table: |
(in thousands) | Three Months Ended June 30, | Six Months Ended June 30, | |||||||||||||
2018 | 2017 | 2018 | 2017 | ||||||||||||
Tax reserves | $ | — | $ | — | $ | — | $ | (700 | ) | ||||||
Transition tax | (123 | ) | — | (123 | ) | — | |||||||||
Other tax-related items | 56 | (25 | ) | (947 | ) | 53 | |||||||||
Tax-effect of non-GAAP adjustments | 595 | 294 | (105 | ) | 295 | ||||||||||
Total tax adjustments | $ | 528 | $ | 269 | $ | (1,175 | ) | $ | (352 | ) | |||||
37
Reconciliation of U.S. GAAP Operating Income and U.S. GAAP Operating Margin to Operating Income, As Adjusted, and Operating Margin, As Adjusted
(in thousands, except per percentages) | Three Months Ended June 30, | Six Months Ended June 30, | |||||||||||||
2018 | 2017 | 2018 | 2017 | ||||||||||||
Revenue, U.S. GAAP (1) | $ | 94,410 | $ | 92,714 | $ | 188,874 | $ | 182,455 | |||||||
Deconsolidation (2) | (194 | ) | (88 | ) | (245 | ) | (154 | ) | |||||||
Revenue, as adjusted | $ | 94,216 | $ | 92,626 | $ | 188,629 | $ | 182,301 | |||||||
Expenses, U.S. GAAP (1) | $ | 58,123 | $ | 55,357 | $ | 115,368 | $ | 109,570 | |||||||
Deconsolidation (2) | (347 | ) | (172 | ) | (598 | ) | (293 | ) | |||||||
General and administrative (3) | — | — | (871 | ) | 68 | ||||||||||
Expenses, as adjusted | $ | 57,776 | $ | 55,185 | $ | 113,899 | $ | 109,345 | |||||||
Operating income, U.S. GAAP | $ | 36,287 | $ | 37,357 | $ | 73,506 | $ | 72,885 | |||||||
Deconsolidation (2) | 153 | 84 | 353 | 139 | |||||||||||
General and administrative (3) | — | — | 871 | (68 | ) | ||||||||||
Operating income, as adjusted | $ | 36,440 | $ | 37,441 | $ | 74,730 | $ | 72,956 | |||||||
Operating margin, U.S. GAAP | 38.4 | % | 40.3 | % | 38.9 | % | 39.9 | % | |||||||
Operating margin, as adjusted | 38.7 | % | 40.4 | % | 39.6 | % | 40.0 | % | |||||||
_________________________
(1) | The presentation for the three and six months ended June 30, 2017 has been recast to reflect the Company's adoption of the new revenue recognition accounting standard on January 1, 2018. |
(2) | Represents amounts related to the deconsolidation of seed investments in Company-sponsored funds. |
(3) | Represents expenses associated with the evaluation of a potential business transaction that the Company decided not to pursue in the first quarter of 2018 and a refund of foreign withholding taxes in the first quarter of 2017. |
Reconciliation of U.S. GAAP Non-operating Income (Loss) to Non-operating Income (Loss), As Adjusted
(in thousands) | Three Months Ended June 30, | Six Months Ended June 30, | |||||||||||||
2018 | 2017 | 2018 | 2017 | ||||||||||||
Non-operating income (loss), U.S. GAAP | $ | (778 | ) | $ | 261 | $ | (977 | ) | $ | 488 | |||||
Deconsolidation (1) | 4,722 | 128 | 3,665 | (198 | ) | ||||||||||
Results from seed investments (2) | (2,154 | ) | (64 | ) | (380 | ) | (132 | ) | |||||||
Foreign currency exchange gain (3) | (953 | ) | — | (953 | ) | — | |||||||||
Non-operating income (loss), as adjusted | $ | 837 | $ | 325 | $ | 1,355 | $ | 158 | |||||||
_________________________
(1) | Represents amounts related to the deconsolidation of seed investments in Company-sponsored funds. |
(2) | Represents (i) dividend income and realized (gains) losses on seed investments in Company-sponsored funds, (ii) the Company's proportionate share of the results of operations of seed investments classified as equity method investments, including realized and unrealized (gains) losses, and (iii) realized and unrealized (gains) losses on unconsolidated seed investments. |
(3) | Represents net foreign currency exchange gains associated with U.S. dollar-denominated assets and liabilities held by certain foreign subsidiaries for the three and six months ended June 30, 2018. Prior period U.S. GAAP amounts have not been recast to conform with the current period presentation as the impact to results was not material. |
38
Changes in Financial Condition, Liquidity and Capital Resources
Our principal objectives are to maintain a capital structure that supports our business strategies and to maintain the appropriate amount of liquidity at all times. Furthermore, we believe that our cash flows generated from operations are more than adequate to fund our present and reasonably foreseeable future commitments for investing and financing activities.
Net Liquid Assets
Our current financial condition is highly liquid, primarily comprising cash and cash equivalents, seed investments and accounts receivable. Liquid assets are reduced by current liabilities (generally defined as obligations due within one year), which include accrued compensation, distribution and service fees payable, income taxes payable, and other liabilities and accrued expenses (together, net liquid assets). The Company does not currently have any debt outstanding.
The following table summarizes net liquid assets for the periods presented:
(in thousands) | June 30, 2018 | December 31, 2017 | |||||
Financial Condition Data: | |||||||
Cash and cash equivalents | $ | 193,729 | $ | 193,452 | |||
Seed investments (1) | 69,067 | 63,416 | |||||
Accounts receivable | 50,586 | 53,854 | |||||
Current liabilities | (43,119 | ) | (69,086 | ) | |||
Net liquid assets | $ | 270,263 | $ | 241,636 | |||
_________________________
(1) | Excludes certain illiquid investments classified as level 3 and investments measured at NAV (or its equivalent) as a practical expedient in accordance with Accounting Standards Codification Topic 820, Fair Value Measurement, which we are contractually prohibited from redeeming. |
Cash and cash equivalents
Cash and cash equivalents are on deposit with three major financial institutions and consist of short-term, highly-liquid investments, which are readily convertible into cash and have original maturities of three months or less.
Seed investments
Seed investments include equity investments at fair value, trading investments and equity method investments. Seed investments are presented net of redeemable noncontrolling interests.
Accounts receivable
Accounts receivable primarily represents investment advisory and administration fees receivable. At June 30, 2018, institutional accounts comprised 51% of total accounts receivable, while open-end and closed-end funds, together, comprised 40% of total accounts receivable. We perform a review of our receivables on an ongoing basis in order to assess collectibility and, based on our analysis at June 30, 2018, there were no past due items related to institutional accounts. Receivables associated with open-end and closed-end funds are generally collected on the first business day of the following month.
Current liabilities
Current liabilities are generally defined as obligations due within one year, which includes accrued compensation, distribution and service fees payable, income taxes payable, and other liabilities and accrued expenses.
Cash flows
Our cash flows generally result from the operating activities of our business, with investment advisory and administration fees being the most significant contributor.
39
The following table summarizes cash flows for the periods presented (in thousands):
Six Months Ended June 30, | |||||||
2018 | 2017 | ||||||
Cash Flow Data: | |||||||
Net cash provided by (used in) operating activities | $ | 6,064 | $ | (21,556 | ) | ||
Net cash provided by (used in) investing activities | (4,182 | ) | 5,718 | ||||
Net cash provided by (used in) financing activities | (818 | ) | 10,454 | ||||
Net increase (decrease) in cash and cash equivalents | 1,064 | (5,384 | ) | ||||
Effect of foreign exchange rate changes on cash and cash equivalents | (787 | ) | 564 | ||||
Cash and cash equivalents, beginning of the period | 193,452 | 183,234 | |||||
Cash and cash equivalents, end of the period | $ | 193,729 | $ | 178,414 | |||
Cash and cash equivalents increased by $1.1 million, excluding the effect of foreign exchange rate changes, during the six months ended June 30, 2018. Net cash provided by operating activities was $6.1 million for the six months ended June 30, 2018. Cash flows from operating activities primarily consist of net income adjusted for certain non-cash items and changes in assets and liabilities. Net cash used in investing activities was $4.2 million, which included $7.3 million of investment purchases, including the seeding of three new track record accounts, partially offset by $4.9 million of proceeds from the sale of investments. Net cash used in financing activities was $818,000, including dividends paid to stockholders of $30.9 million, repurchases of common stock to satisfy employee withholding tax obligations on the vesting and delivery of restricted stock units of $10.6 million and distributions to redeemable noncontrolling interest of $4.2 million, partially offset by contributions from redeemable noncontrolling interest of $44.5 million.
Cash and cash equivalents decreased by $5.4 million, excluding the effect of foreign exchange rate changes, during the six months ended June 30, 2017. Net cash used in operating activities was $21.6 million for the six months ended June 30, 2017. Cash flows from operating activities primarily consist of net income adjusted for certain non-cash items and changes in assets and liabilities. Net cash provided by investing activities was $5.7 million, which included proceeds from sales of available-for-sale investments in the amount of $19.8 million, including $15.0 million from the partial redemption of our seed investment in the Cohen & Steers Low Duration Preferred and Income Fund, Inc., partially offset by purchases of available-for-sale investments in the amount of $12.6 million, including a seed investment of $9.9 million in a track record account for a new real assets multi-strategy portfolio and purchases of property and equipment in the amount of $1.6 million. Net cash of $10.5 million was provided by financing activities, primarily by contributions from redeemable noncontrolling interest of $45.1 million, partially offset by dividends paid to stockholders of $26.0 million and repurchases of common stock to satisfy employee withholding tax obligations on the vesting and delivery of restricted stock units of $9.1 million.
Net Capital Requirements
We continually monitor and evaluate the adequacy of our capital. We have consistently maintained net capital in excess of the regulatory requirements for our broker-dealer, as prescribed by the Securities and Exchange Commission (SEC). At June 30, 2018, we exceeded our minimum regulatory capital requirements by approximately $3.3 million. The SEC's Uniform Net Capital Rule 15c3-1 imposes certain requirements that may have the effect of prohibiting a broker-dealer from distributing or withdrawing capital and requiring prior notice to the SEC for certain withdrawals of capital.
Cohen & Steers Asia Limited (CSAL) and Cohen & Steers UK Limited (CSUK) are regulated outside the U.S. by the Hong Kong Securities and Futures Commission and the United Kingdom Financial Conduct Authority, respectively. At June 30, 2018, CSAL and CSUK exceeded their aggregate minimum regulatory capital requirements by approximately $75.7 million.
We believe that our cash and cash equivalents and cash flows from operations will be more than adequate to meet our anticipated capital requirements and other obligations as they become due.
Dividends
Subject to the approval of our Board of Directors, we anticipate paying dividends. When determining whether to pay a dividend, we take into account general economic and business conditions, our strategic plans, our financial results and
40
condition, contractual, legal and regulatory restrictions on the payment of dividends by us and our subsidiaries and such other factors deemed relevant.
On August 2, 2018, the Board of Directors approved and the Company declared a quarterly dividend on its common stock in the amount of $0.33 per share. The dividend will be payable on August 30, 2018 to the stockholders of record at the close of business on August 16, 2018.
Investment Commitments
We have committed to co-invest up to $5.1 million alongside Cohen & Steers Global Realty Partners III-TE, L.P. (GRP-TE). At June 30, 2018, we have funded approximately $3.8 million of this commitment. Our co-investment alongside GRP-TE is illiquid and is anticipated to be invested for the life of the fund. The timing of the funding of the unfunded portion of our commitment is currently unknown, as the drawdown of our commitment is contingent on the timing of drawdowns by the underlying funds in which GRP-TE invests. The unfunded portion of this commitment was not recorded on our condensed consolidated statements of financial condition at June 30, 2018.
Contractual Obligations and Contingencies
The following table summarizes our contractual obligations at June 30, 2018 (in thousands):
2018 | 2019 | 2020 | 2021 | 2022 | 2023 and after | Total | |||||||||||||||||||||
Operating leases | $ | 7,331 | $ | 14,714 | $ | 13,200 | $ | 11,227 | $ | 10,895 | $ | 11,816 | $ | 69,183 | |||||||||||||
Other liability | 332 | 665 | 665 | 665 | 665 | 4,985 | $ | 7,977 | |||||||||||||||||||
Total | $ | 7,663 | $ | 15,379 | $ | 13,865 | $ | 11,892 | $ | 11,560 | $ | 16,801 | $ | 77,160 | |||||||||||||
Operating Leases
Operating leases consist of noncancelable long-term operating leases for office space, information technology applications, market data and certain office equipment. In July 2018, the Company renewed its lease agreement for office space in Japan. The lease expires July 31, 2021.
Other Liability
Other liability consists of the remaining transition tax liability based on the cumulative undistributed earnings and profits of our foreign subsidiaries in connection with the enactment of the Tax Cuts and Jobs Act in December 2017 (the Tax Act). This tax liability, which is payable over eight years on an interest-free basis, was included as part of income tax payable on our condensed consolidated statement of financial condition at June 30, 2018.
During the three months ended June 30, 2018, the Company decreased the transition tax liability by approximately $123,000 based on further analysis and refinement of the calculation. Furthermore, we believe the calculation is substantially complete and do not anticipate additional changes.
Off-Balance Sheet Arrangements
We do not invest in any off-balance sheet vehicles that provide liquidity, capital resources, market or credit risk support, or engage in any leasing activities that expose us to any liability that is not reflected in our condensed consolidated financial statements.
Critical Accounting Policies and Estimates
A complete discussion of our critical accounting policies is included in Management's Discussion and Analysis of Financial Condition and Results of Operations in our Annual Report on Form 10-K for the year ended December 31, 2017.
Recently Issued Accounting Pronouncements
See discussion of Recently Issued Accounting Pronouncements in Note 2 of the Notes to Condensed Consolidated Financial Statements contained in Part I, Item 1 of this report.
41
Item 3. Quantitative and Qualitative Disclosures About Market Risk
There have been no material changes to our Quantitative and Qualitative Disclosures About Market Risk from those previously reported in our Annual Report on Form 10-K for the year ended December 31, 2017.
Item 4. Controls and Procedures
We maintain disclosure controls and procedures (as that term is defined in Rules 13a-15(e) and 15d-15(e) under the Securities Exchange Act of 1934, as amended (the Exchange Act)), that are designed to ensure that information required to be disclosed in our reports under the Exchange Act is recorded, processed, summarized and reported within the time periods specified in the Securities and Exchange Commission's rules and forms, and that such information is accumulated and communicated to our management, including our Chief Executive Officer and our Chief Financial Officer, as appropriate, to allow timely decisions regarding required disclosures. Any controls and procedures, no matter how well designed and operated, can provide only reasonable assurance of achieving the desired control objectives.
Our management, including our Chief Executive Officer and our Chief Financial Officer, has evaluated the effectiveness of our disclosure controls and procedures (as defined in Rule 13a-15(e) under the Exchange Act) at June 30, 2018. Based on that evaluation and subject to the foregoing, our Chief Executive Officer and our Chief Financial Officer have concluded that our disclosure controls and procedures at June 30, 2018 were effective to accomplish their objectives at a reasonable assurance level.
There has been no change in our internal control over financial reporting that occurred during the three months ended June 30, 2018 that has materially affected, or is reasonably likely to materially affect, our internal control over financial reporting.
42
PART II—Other Information
Item 1. Legal Proceedings
From time to time, we may become involved in legal matters relating to claims arising in the ordinary course of our business. There are currently no such matters pending that we believe could have a material effect on our condensed consolidated results of operations, cash flows or financial condition. In addition, from time to time, we may receive subpoenas or other requests for information from various U.S. federal and state governmental authorities, domestic and international regulatory authorities and third parties in connection with certain industry-wide inquiries or other investigations or legal proceedings. It is our policy to cooperate fully with such requests.
Item 1A. Risk Factors
For a discussion of the potential risks and uncertainties associated with our business, please see Part I, Item 1A of our Annual Report on Form 10-K for the year ended December 31, 2017 (the Form 10-K). There have been no material changes to the risk factors disclosed in Part 1, Item 1A of the Form 10-K.
Item 2. Unregistered Sales of Equity Securities and Use of Proceeds
During the three months ended June 30, 2018, we made the following purchases of our equity securities that are registered pursuant to Section 12(b) of the Securities Exchange Act of 1934.
Period | Total Number of Shares Purchased (1) | Average Price Paid Per Share | Total Number of Shares Purchased as Part of Publicly Announced Plans or Programs | Maximum Number of Shares that May Yet Be Purchased Under the Plans or Programs | ||||||||
April 1 through April 30, 2018 | — | $ | — | — | — | |||||||
May 1 through May 31, 2018 | 123 | $ | 39.58 | — | — | |||||||
June 1 through June 30, 2018 | 224 | $ | 41.71 | — | — | |||||||
Total | 347 | $ | 40.95 | — | — | |||||||
_________________________
(1) | Purchases made to satisfy the income tax withholding obligations of certain employees upon the vesting and delivery of restricted stock units issued under the Company's Amended and Restated Stock Incentive Plan. |
43
Item 6. Exhibits
Any agreements or other documents filed as exhibits to this report are not intended to provide factual information or other disclosure other than with respect to the terms of the agreements or other documents themselves, and should not be relied upon for that purpose. In particular, any representations and warranties made by the Company in these agreements or other documents were made solely within the specific context of the relevant agreement or document and may not describe the actual state of affairs as of the date they were made or at any other time.
Exhibit No. | Description | ||
3.1 | — | ||
3.2 | — | ||
4.1 | — | ||
4.2 | — | ||
31.1 | — | Certification of the Chief Executive Officer pursuant to Section 302 of the Sarbanes-Oxley Act of 2002 (filed herewith) | |
31.2 | — | Certification of the Chief Financial Officer pursuant to Section 302 of the Sarbanes-Oxley Act of 2002 (filed herewith) | |
32.1 | — | Certification of the Chief Executive Officer pursuant to Section 906 of the Sarbanes-Oxley Act of 2002 (furnished herewith) | |
32.2 | — | Certification of the Chief Financial Officer pursuant to Section 906 of the Sarbanes-Oxley Act of 2002 (furnished herewith) | |
101 | — | The following financial statements from the Company’s Quarterly Report on Form 10-Q for the quarter ended June 30, 2018 formatted in XBRL (eXtensible Business Reporting Language): (i) the Condensed Consolidated Statements of Financial Condition (unaudited); (ii) the Condensed Consolidated Statements of Operations (unaudited); (iii) the Condensed Consolidated Statements of Comprehensive Income (unaudited); (iv) the Condensed Consolidated Statements of Changes in Stockholders’ Equity and Redeemable Noncontrolling Interest (unaudited); (v) the Condensed Consolidated Statements of Cash Flows (unaudited); and (vi) the Notes to the Condensed Consolidated Financial Statements. | |
_________________________
(1) | Incorporated by reference to the Company’s Registration Statement on Form S-1 (Registration No. 333-114027), as amended, originally filed with the Securities and Exchange Commission on March 30, 2004. |
(2) | Incorporated by reference to the Company’s Quarterly Report on Form 10-Q (Commission File No. 001-32236) for the quarter ended June 30, 2008. |
(3) | Incorporated by reference to the Company’s Quarterly Report on Form 10-Q (Commission File No. 001-32236) for the quarter ended June 30, 2015. |
44
SIGNATURES
Pursuant to the requirements of the Securities Exchange Act of 1934, the Company has duly caused this report to be signed on its behalf by the undersigned thereunto duly authorized.
Date: | August 8, 2018 | Cohen & Steers, Inc. | ||
/s/ Matthew S. Stadler | ||||
Name: Matthew S. Stadler | ||||
Title: Executive Vice President & Chief Financial Officer | ||||
Date: | August 8, 2018 | Cohen & Steers, Inc. | ||
/s/ Elena Dulik | ||||
Name: Elena Dulik | ||||
Title: Senior Vice President & Chief Accounting Officer | ||||
45