Attached files
| file | filename |
|---|---|
| EX-32.2 - CERTIFICATION OF THE CHIEF FINANCIAL OFFICER PURSUANT TO SECTION 906 - COHEN & STEERS, INC. | cns10k-123117ex322.htm |
| EX-32.1 - CERTIFICATION OF THE CHIEF EXECUTIVE OFFICER PURSUANT TO SECTION 906 - COHEN & STEERS, INC. | cns10k-123117ex321.htm |
| EX-31.2 - CERTIFICATION OF THE CHIEF FINANCIAL OFFICER PURSUANT TO SECTION 302 - COHEN & STEERS, INC. | cns10k-123117ex312.htm |
| EX-31.1 - CERTIFICATION OF THE CHIEF EXECUTIVE OFFICER PURSUANT TO SECTION 302 - COHEN & STEERS, INC. | cns10k-123117ex311.htm |
| EX-23.1 - CONSENT OF DELOITTE & TOUCHE LLP - COHEN & STEERS, INC. | cns10k-123117ex231.htm |
| EX-21.1 - SUBSIDIARIES OF THE REGRISTRANT - COHEN & STEERS, INC. | cns10k-123117ex211.htm |
| EX-10.7 - MANDATORY DEFFERRAL RESTRICTED STOCK UNIT AGREEMENT - COHEN & STEERS, INC. | cns10k-123117ex107.htm |
UNITED STATES SECURITIES AND EXCHANGE COMMISSION
WASHINGTON, D.C. 20549
FORM 10-K
(Mark One)
x ANNUAL REPORT PURSUANT TO SECTION 13 OR 15(d) OF
THE SECURITIES EXCHANGE ACT OF 1934 FOR THE FISCAL YEAR ENDED DECEMBER 31, 2017
OR
¨ TRANSITION REPORT PURSUANT TO SECTION 13 OR 15(d) OF
THE SECURITIES EXCHANGE ACT OF 1934 FOR THE TRANSITION PERIOD FROM TO .
Commission File No. 001-32236
COHEN & STEERS, INC.
(Exact name of registrant as specified in its charter)
Delaware (State or Other Jurisdiction of Incorporation or Organization) | 14-1904657 (I.R.S. Employer Identification No.) |
280 Park Avenue, New York, New York (Address of Principal Executive Offices) | 10017 (Zip Code) |
Registrant’s telephone number, including area code: (212) 832-3232
Securities registered pursuant to Section 12(b) of the Act:
Title of each class | Name of each exchange on which registered |
Common Stock, $.01 par value | New York Stock Exchange |
Securities registered pursuant to Section 12(g) of the Act:
None
Indicate by check mark if the registrant is a well-known seasoned issuer, as defined in Rule 405 of the Securities Act.
Yes ¨ No x
Indicate by check mark if the registrant is not required to file reports pursuant to Section 13 or Section 15(d) of the Act. Yes ¨ No x
Indicate by check mark whether the registrant (1) has filed all reports required to be filed by Section 13 or 15(d) of the Securities Exchange Act of 1934 during the preceding 12 months (or for such shorter period that the registrant was required to file such reports), and (2) has been subject to such filing requirements for the past 90 days. Yes x No ¨
Indicate by check mark whether the registrant has submitted electronically and posted on its corporate website, if any, every Interactive Data File required to be submitted and posted pursuant to Rule 405 of Regulation S-T (§ 232.405 of this chapter) during the preceding 12 months (or for such shorter period that the registrant was required to submit and post such files). Yes x No ¨
Indicate by check mark if disclosure of delinquent filers pursuant to Item 405 of Regulation S-K is not contained herein and will not be contained, to the best of the registrant’s knowledge, in the definitive proxy or information statements incorporated by reference in Part III of this Form 10-K or any amendment to this Form 10-K. x
Indicate by check mark whether the registrant is a large accelerated filer, an accelerated filer, a non-accelerated filer, or a smaller reporting company. See the definitions of “large accelerated filer,” “accelerated filer” and “smaller reporting company” in Rule 12b-2 of the Exchange Act. (Check one):
Large accelerated filer | x | Accelerated filer | o | |||
Smaller reporting company | o | |||||
Non-accelerated filer | o (Do not check if a smaller reporting company) | Emerging growth company | o | |||
If an emerging growth company, indicate by check mark if the registrant has elected not to use the extended transition period for complying with any new or revised financial accounting standards provided pursuant to Section 13(a) of the Exchange Act. ¨
Indicate by check mark whether the registrant is a shell company (as defined in Rule 12b-2 of the Exchange Act.) Yes ¨ No x
The aggregate market value of the voting common stock held by non-affiliates of the Registrant as of June 30, 2017 was approximately $878 million. There is no non-voting common stock of the Registrant outstanding.
As of February 20, 2018, there were 46,738,105 shares of the Registrant’s common stock outstanding.
Documents Incorporated by Reference
Portions of the definitive Proxy Statement of Cohen & Steers, Inc. (the Proxy Statement) to be filed pursuant to Regulation 14A of the general rules and regulations of the Securities Exchange Act of 1934, as amended, for the 2018 annual meeting of stockholders scheduled to be held on May 3, 2018 are incorporated by reference into Part III of this Form 10-K.
COHEN & STEERS, INC. AND SUBSIDIARIES
TABLE OF CONTENTS
Page | ||
Part I | ||
Item 1 | ||
Item 1A | ||
Item 1B | ||
Item 2 | ||
Item 3 | ||
Item 4 | ||
Part II | ||
Item 5 | ||
Item 6 | ||
Item 7 | ||
Item 7A | ||
Item 8 | ||
Item 9 | ||
Item 9A | ||
Item 9B | ||
Part III | ||
Item 10 | ||
Item 11 | ||
Item 12 | ||
Item 13 | ||
Item 14 | ||
Part IV | ||
Item 15 | ||
Item 16 | ||
i
PART I
Item 1. Business
Overview
Cohen & Steers, Inc. (CNS), a Delaware corporation formed on March 17, 2004, is a global investment manager specializing in liquid real assets, including real estate securities, listed infrastructure, commodities and natural resource equities, as well as preferred securities and other income solutions. Headquartered in New York City, with offices in London, Hong Kong, Tokyo and Seattle, we serve institutional and individual investors around the world.
CNS is the holding company for its direct and indirect subsidiaries, including Cohen & Steers Capital Management, Inc. (CSCM), Cohen & Steers Securities, LLC (CSS), Cohen & Steers Asia Limited (CSAL), Cohen & Steers UK Limited (CSUK) and Cohen & Steers Japan, LLC (CSJL). CNS and its subsidiaries are collectively referred to as the Company, we, us or our.
Our revenue is derived from fees received from our clients, including fees for managing or subadvising client accounts; investment advisory, administration, distribution and service fees received from Company-sponsored open-end and closed-end funds; and fees for portfolio consulting and other services. Our fees are paid in arrears, based on contractually specified percentages of the value of the assets we manage and, in certain cases, investment performance. Our revenue fluctuates with changes in the total value of our assets under management, which may occur as a result of investment performance, addition or termination of client accounts, inflows or outflows from client accounts, market conditions, or foreign currency fluctuations and is recognized over the period that the assets are managed.
At December 31, 2017, we managed $62.1 billion in assets—$29.4 billion in institutional accounts, $23.3 billion in open-end funds, and $9.4 billion in closed-end funds. Our assets under management increased 9% from $57.2 billion at December 31, 2016 as a result of net inflows of $3.9 billion and market appreciation of $5.8 billion, partially offset by distributions of $4.7 billion.
Investment Vehicles
We manage three types of investment vehicles: institutional accounts, open-end funds and closed-end funds.
Institutional Accounts
Institutional accounts for which we serve as investment adviser represent portfolios of securities we manage for institutional clients. We manage the assets in each institutional account in accordance with the investment requirements of that client as set forth in such client’s investment management agreement and investment guidelines. The investment management agreements with our institutional account clients are generally terminable at any time. For the years ended December 31, 2017, 2016 and 2015, investment advisory fees from our institutional accounts totaled approximately $101.9 million, $93.2 million and $85.5 million, respectively, and accounted for 29%, 29% and 28%, respectively, of our investment advisory and administration fee revenue.
Subadvisory assets, which represent accounts for which we have been appointed as a subadvisor by the investment manager of that investment vehicle, are included in our institutional account assets. As subadvisor, we are responsible for managing the investments, while the investment adviser oversees our performance as subadvisor; the fund sponsor is responsible for decisions regarding the amount, timing and whether to pay distributions of income from the investment vehicle to its beneficial owners. As of December 31, 2017, approximately $18.1 billion of our institutional account assets were in subadvisory accounts.
Advisory assets, which represent accounts for which we have been appointed as the investment manager, are included in our institutional account assets. As investment adviser, we are responsible to oversee the daily operations and manage the assets in the account while adhering to the specified investment objectives. As of December 31, 2017, approximately $11.3 billion of our institutional account assets were in advisory accounts.
Open-end Funds
The open-end funds for which we serve as investment adviser offer and issue new shares continuously as assets are invested and redeem shares when assets are withdrawn. The share price for purchases and redemptions of shares of each of
1
the open-end funds is determined by each fund’s net asset value, which is calculated at the end of each business day. The net asset value per share is the current value of a fund’s assets less liabilities, divided by the fund’s total shares outstanding.
The investment advisory fees that we receive from the open-end funds for which we serve as investment adviser vary based on each fund’s investment strategy, fees charged by other comparable funds and the market in which the fund is offered. In addition, we receive a separate fee for providing administrative services to certain open-end funds at a rate that is designed to reimburse us for the cost of providing these services. The open-end funds pay us a monthly investment advisory fee and an administration fee, if applicable, based on a contractual fee rate applied to the fund’s average assets under management. For the years ended December 31, 2017, 2016 and 2015, investment advisory and administration fees from open-end funds totaled approximately $165.9 million, $149.9 million and $136.9 million, respectively, and accounted for 48%, 47% and 45%, respectively, of our investment advisory and administration fee revenue.
Our investment advisory and administration agreements with the U.S. registered open-end funds for which we serve as investment adviser are generally terminable upon a vote of a majority of the fund’s board of directors on 60 days’ notice, and each investment advisory agreement, including the fees payable thereunder, is subject to annual approval by a majority of the directors of the fund’s board who are not "interested persons," as defined by the Investment Company Act of 1940 (the Investment Company Act), following the initial two-year term.
Closed-end Funds
The closed-end funds for which we serve as investment adviser are registered investment companies that have issued a fixed number of shares through public offerings. These shares are listed on the New York Stock Exchange and cannot be redeemed by the fund’s shareholders. The trading price of the shares is determined by supply and demand in the marketplace, and, as a result, the shares may trade at a premium or discount to the net asset value of the fund.
The investment advisory fees that we receive from the closed-end funds for which we serve as investment adviser vary based on each fund’s investment strategy, fees charged by other comparable funds and prevailing market conditions at the time each closed-end fund initially offered its shares to the public. In addition, we receive a separate fee for providing administration services to eight of the nine closed-end funds at a rate that is designed to reimburse us for the cost of providing these services. The closed-end funds pay us a monthly investment advisory fee and an administration fee, if applicable, based on a contractual fee rate applied to the fund’s average assets under management. For the years ended December 31, 2017, 2016 and 2015, investment advisory and administration fees from closed-end funds totaled approximately $79.0 million, $76.6 million and $81.4 million, respectively, and accounted for 23%, 24% and 27%, respectively, of our investment advisory and administration fee revenue.
Our investment advisory agreements with each U.S. closed-end fund for which we serve as investment adviser are generally terminable upon a vote of a majority of the fund’s board of directors on 60 days’ notice and are subject to annual approval by a majority of the directors of the fund’s board who are not "interested persons," as defined by the Investment Company Act, following the initial two-year term.
Portfolio Consulting and Other Services
We maintain two proprietary indexes, Cohen & Steers Realty Majors Index (RMP) and Cohen & Steers Global Realty Majors Index (GRM). RMP is the basis for the iShares Cohen & Steers REIT ETF sponsored by BlackRock Institutional Trust Company, N.A. GRM is the basis for Cohen & Steers Global Realty Majors ETF sponsored by ALPS Fund Services, Inc. and iShares Global Real Estate Index ETF sponsored by BlackRock Asset Management Canada Limited. We earn a licensing fee based on a percentage of the funds’ assets for the use of our indexes, which were approximately $3.2 billion as of December 31, 2017. While we receive a fee on these assets, they are not included in our reported assets under management.
We also provide services in connection with model-based strategies accounts. We provide model portfolios of securities that fulfill the investment objective of a specified strategy on a regular basis. As of December 31, 2017, we provided such services to accounts with aggregate assets of $3.4 billion. While we receive a fee on these assets, they are not included in our reported assets under management.
In addition, we provide several services in connection with assets held by unit investment trusts (UITs). A UIT is a registered investment company that holds a portfolio of securities that generally does not change during the life of the UIT (generally two to five years) except that the sponsor of the UIT may sell portfolio securities under certain narrowly defined circumstances. As a portfolio consultant to a number of UITs, we construct a portfolio of securities that we believe is well suited to satisfy the investment objective of the UIT. We also provide ongoing portfolio monitoring services and provide a
2
license to certain firms to use our name in connection with certain of their investment products. At December 31, 2017, we provided such portfolio consulting services to UITs with aggregate assets of approximately $669 million. While we receive a fee on these assets, they are not included in our reported assets under management.
Our fee schedules for these services vary based on the type of services.
Our Investment Strategies
Each of our investment strategies is overseen by a specialist team, each of which is led by a portfolio manager, or a team of portfolio managers, supported by dedicated analysts. These personnel are located in our New York, Seattle, London and Hong Kong offices. Each team executes fundamentally driven, actively managed investment strategies and each has a unique and well-defined process that includes top-down macroeconomic and bottom-up fundamental research and portfolio management elements. These teams are subject to multiple levels of oversight and support from our President and Chief Investment Officer, our Chief Administrative Officer-Investments, our Investment Risk Committee, our Investment Operating Committee and our Legal and Compliance Department. Some of our strategies may involve multiple asset classes and are overseen by investment committees led by senior portfolio managers of our specialist teams.
Below is a summary of our investment strategies:
Real Assets Multi-Strategy invests in a diversified multi-strategy portfolio of listed companies and securities that generally own or are backed by tangible real assets, including real estate securities, global listed infrastructure, commodities and natural resource equities, with the objective of achieving attractive total returns over the long term, while providing diversification and maximizing the potential for real returns in periods of rising inflation and rising interest rates.
U.S. and Global Real Estate Securities invests in a portfolio of common stocks and other securities issued by U.S. and non-U.S. real estate companies, including real estate investment trusts (REITs) and similar REIT-like entities. This strategy draws on the expertise of our integrated global real estate securities investment team. The investment objective is total return with a balance of capital appreciation and income.
Global Listed Infrastructure invests in a diversified portfolio of U.S. and non-U.S. securities issued by infrastructure companies such as utilities, pipelines, toll roads, airports, railroads, marine ports and communications companies located in developed markets with opportunistic allocations to emerging markets. The investment objective is total return with a balance of capital appreciation and income.
MLPs and Midstream Energy invests in a diversified portfolio of companies that own and operate assets in the midstream segment of the energy value chain, where cash flows are generally tied to the transportation, processing and storage of crude oil, natural gas and natural gas liquids in North America. We adhere to a disciplined fundamental, relative value-based approach to investing in midstream energy. We do not invest in upstream, downstream or integrated energy companies. The investment objective is to maximize total return balancing income and capital appreciation.
Global Natural Resource Equities seeks to maximize total return by investing in companies involved in the production, extraction, or processing of commodities and natural resources. Specifically, the strategy invests in energy producers, metals and mining companies and agriculture-based businesses. The investment objective is total return.
Commodities invests in a diversified portfolio of exchange-traded commodity futures contracts and other commodity-related financial derivative instruments. We take a fundamental, research-driven approach to commodities management, while seeking alpha through active trade implementation, which may entail going long, short or employing spread trades. The investment objective is total return.
Preferred Securities invests in a diversified portfolio of preferred and debt securities issued by U.S. and non-U.S. companies. The preferred securities are issued by banks, insurance companies, REITs and other diversified financial institutions as well as utility, energy, pipeline and telecommunications companies. We employ a unified investment process that underlies our traditional total return preferred securities strategy as well as the lower duration capital preservation strategies.
Large Cap Value invests in a diversified portfolio of stocks issued by U.S. large capitalization companies that appear to be undervalued but have good prospects for capital appreciation and dividend growth. The investment objective is total return.
In addition, we offer variations on these strategies that may combine multiple strategies in a single portfolio. Individual portfolios may be customized to comply with client-specific guidelines, benchmarks or risk profiles. Certain portfolios may employ leverage.
3
Our Distribution Network
Our distribution network encompasses the major channels in the asset management industry, including large brokerage firms, registered investment advisers, institutional investors and retirement recordkeepers. The U.S. registered open-end funds for which we serve as investment adviser are available for purchase with and without commissions through full service and discount broker-dealers as well as the significant networks serving financial advisers. Our institutional account clients include corporate and public defined benefit and defined contribution pension plans, endowment funds and foundations, insurance companies and other financial institutions that access our investment management services directly, through consultants or through other intermediaries.
Geographic Information
The table below presents revenue by client domicile for the years ended December 31, 2017, 2016 and 2015 (in thousands):
Year Ended December 31, | |||||||||||
2017 | 2016 | 2015 | |||||||||
North America | $ | 313,408 | $ | 285,896 | $ | 269,766 | |||||
Japan | 42,303 | 43,458 | 41,899 | ||||||||
Asia excluding Japan | 11,496 | 9,852 | 6,624 | ||||||||
Europe | 10,987 | 10,670 | 10,366 | ||||||||
Total | $ | 378,194 | $ | 349,876 | $ | 328,655 | |||||
Competition
We compete with a large number of global and U.S. investment managers, commercial banks, broker-dealers, insurance companies and other financial institutions. Many competing firms are parts of larger financial services companies and attract business through numerous channels, including retail banking, investment banking and underwriting contacts, insurance agencies and broker-dealers.
Our direct competitors in wealth management are other funds and exchange-traded-fund (ETF) sponsors, including large nationally recognized investment management firms that have more diverse product offerings and smaller boutique firms that specialize in particular asset classes. We also compete against managers that will manage separate-account portfolios for high net worth clients. In the institutional channel, we compete against a number of investment managers offering similar products and services, from boutique establishments to major commercial and investment banks.
Performance, price and brand are our principal sources of competition. Prospective clients will typically base their decisions to invest, or continue to invest, with us on our ability to generate returns in excess of a benchmark and the cost of doing so. We are evaluated based on our performance and our fees relative to our competitors. In addition, individual fund shareholders may also base their decision on the ability to access the funds we manage through a particular distribution channel.
As interest in real assets increases, we may face increased competition from other managers that are competing for the same client base that we target and serve. Financial intermediaries that offer our products to their clients may also offer competing products. Many of our competitors have greater brand name recognition and more extensive client bases than we do, which could be to our disadvantage. In addition, our larger competitors have more resources and may have more capacity to expand their product offerings and distribution channels and capture market share through ongoing business relationships and extensive marketing efforts. However, compared to our larger competitors, we may be able to grow our business at a faster rate from a relatively smaller asset base and shift resources in response to changing market conditions more quickly.
Regulation
We are subject to regulation under U.S. federal and state laws, as well as applicable laws in the other jurisdictions in which we do business or offer our products and services. Violation of applicable laws or regulations could result in fines, temporary or permanent prohibition of engagement in certain activities, reputational harm and loss of clients, suspension of personnel or revocation of their regulatory licenses, suspension or termination of investment adviser and/or broker-dealer registrations, or other sanctions and penalties.
CSCM is a registered investment adviser with the U.S. Securities and Exchange Commission (the SEC) and is an approved investment manager with the Luxembourg Commission de Surveillance du Secteur Financier (the CSSF), the Irish
4
Financial Services Regulatory Authority (the IFSRA) and the Korean Financial Services Commission. CSCM has also obtained exemptions from registration that allow it to provide investment management services to institutions in Australia and Canada. CSCM is also a registered commodity trading adviser and a registered commodity pool operator with the Commodities Futures Trading Commission (the CFTC) and is a member of the National Futures Association (the NFA), a futures industry self-regulatory organization. The CFTC and NFA regulate futures contracts, swaps, and various other financial instruments in which certain of the Company’s clients may invest.
CSUK, our UK-based subsidiary, is a registered investment adviser with the SEC and the United Kingdom Financial Conduct Authority and is an approved investment manager with the CSSF. CSUK provides investment management services in several European Union member states pursuant to the Directive on Markets in Financial Instruments repealing Directive 2004/39/EC (MiFID II) and the Regulation on Markets in Financial Instruments (MiFIR). CSUK is subject to the Financial Services and Markets Act 2000, which regulates, among other things, certain liquidity and capital resources requirements. Such requirements may limit our ability to withdraw capital from CSUK. CSUK is also subject to certain pan-European regulations, including MiFID II, the Capital Requirements Directive and the Alternative Investment Fund Managers Directive (AIFMD). MiFID II and MiFIR regulate the provision of investment services throughout the European Economic Area and the Capital Requirements Directive regulates capital requirements. AIFMD regulates the management, administration and marketing of alternative investment funds domiciled in or marketed within the European Union and establishes a regime for the cross-border marketing of those funds.
CSAL, our Hong Kong-based subsidiary, is a registered investment adviser with the SEC and the Hong Kong Securities and Futures Commission (the SFC) and is an approved investment manager with the CSSF and the IFSRA. CSAL is subject to the Securities and Futures Ordinance (the SFO), which regulates, among other things, offers of investments to the public and the licensing of intermediaries. CSAL and its employees conducting any of the regulated activities specified in the SFO are required to be licensed with the SFC and are subject to the rules, codes and guidelines issued by the SFC.
In their capacity as U.S. registered investment advisers, CSCM, CSUK and CSAL are subject to the rules and regulations of the Investment Advisers Act of 1940 (the Advisers Act). The Advisers Act imposes numerous obligations on registered investment advisers, including recordkeeping, operational and marketing requirements, disclosure obligations and prohibitions on fraudulent activities. In addition, our subsidiaries that serve as investment adviser or subadvisor to U.S. registered funds are subject to the Investment Company Act, which imposes additional governance, compliance, reporting and fiduciary obligations.
CSJL, a Delaware limited liability company and subsidiary that operates from a branch office in Tokyo, is a financial instruments operator (investment advisory and agency business) registered with the Financial Services Agency of Japan and the Kanto Local Finance Bureau and is subject to the Financial Instruments and Exchange Act. CSJL supports the marketing, client service and business development activities of the Company.
CSS is a registered broker-dealer regulated by the SEC, the Financial Industry Regulatory Authority and other federal and state agencies. CSS is subject to regulations governing, among other things, sales practices, capital structure, and recordkeeping. CSS is also subject to the SEC’s net capital rule, which specifies minimum net capital levels for registered broker-dealers and is designed to enforce minimum standards regarding the general financial condition and liquidity of broker-dealers. Under certain circumstances, this rule may limit our ability to withdraw capital and receive dividends from CSS.
Because of the global and integrated nature of our business, regulation applicable to an affiliate in one jurisdiction may affect the operation of affiliates in others or require compliance at a group level.
Employees
As of December 31, 2017, we had 303 full-time employees.
Available Information
We file annual, quarterly and current reports, proxy statements and all amendments to these reports and other information with the SEC. We make available free of charge on or through our website at www.cohenandsteers.com our Annual Reports on Form 10-K, Quarterly Reports on Form 10-Q, Current Reports on Form 8-K and all amendments to those reports as soon as reasonably practicable after such reports are electronically filed with or furnished to the SEC.
5
Item 1A. Risk Factors
Risks Related to our Business
A significant portion of our revenue for 2017 was derived from a single institutional client.
As of December 31, 2017, our largest institutional client, Daiwa Asset Management, which holds assets in numerous strategies and in subadvisory and model-based accounts and products, represented approximately 11% of our total revenue for 2017. Approximately 39% of the institutional account assets we managed and approximately 18% of our total assets under management as well as approximately 17% of our assets under advisement were derived from this client. Investor demand for products we subadvise for this client can be affected by, among other things, changes in the distributions paid by those products, the strength of the Japanese yen compared to the currencies in which the assets held in those products are denominated, and the market and regulatory environment in the Japanese mutual fund market. Loss of, or significant withdrawal of assets from, any of these accounts would reduce our revenue and adversely affect our financial condition.
A decline in the absolute or relative performance of real estate securities would have an adverse effect on the assets we manage and our revenue.
As of December 31, 2017, a significant majority of the assets we managed were concentrated in real estate securities. Real estate securities and real property investments owned by the issuers of real estate securities are subject to varying degrees of risk that could affect any returns we realize. Returns on investments in real estate securities depend on the amount of income and capital appreciation or loss realized by the underlying real property. Income and real estate values may be adversely affected by, among other things, the cost of compliance with applicable laws, interest rates, the availability of financing, the creditworthiness of the tenants, and the limited ability of issuers of real estate securities to vary their portfolios promptly in response to changes in market conditions. If the underlying properties do not generate sufficient income to meet operating expenses, the income and the ability of an issuer of real estate securities to pay interest and principal on debt securities or any dividends on common or preferred stocks will be adversely affected. A decline in the performance of real estate securities would have an adverse effect on the assets we manage and reduce the fees we earn and our revenue.
Our growth may be constrained by the size and number of real estate securities issuers, as well as REIT ownership restrictions.
Investments in real estate securities continue to play an important role in our overall business strategy. Our ability to continue to increase our ownership of real estate securities depends, in part, on growth in the size and number of issuers in the real estate securities market, particularly in the U.S. Our ability to increase our ownership may also be constrained by REIT ownership limits, which limit ownership of a REIT’s outstanding capital stock, common stock, and/or preferred stock. Although certain REITs in which we invest have granted us waivers from these ownership limits to allow greater investment, such REITs generally retain the right to revoke or reduce the waiver limits at any time. As a result of these constraints, we have in the past, and may in the future, be prevented from acquiring new or additional real estate securities, which may negatively affect our ability to increase the assets we manage and our revenue.
Seed investments made to support the launch of new strategies and products may expose us to potential losses on invested capital.
Our success is partially dependent on our ability to develop, launch, market and manage new investment strategies and products. New investment strategies and products require an initial cash investment, time and the appropriate resources as well as ongoing marketing and other support including subsidies of operating costs.
From time to time, we may support the launch of new investment strategies and products by making seed investments in those strategies and products. Numerous risks and uncertainties are associated with all stages of the seed investment product life cycle, including investment performance, market risks, shifting client or market preferences, the introduction of competing products and compliance with regulatory requirements. Seed investments in new products utilize capital that would otherwise be available for other corporate purposes and expose us to potential capital losses, against which we do not currently hedge. For the year ended December 31, 2017, we recorded non-operating income from seed investments of $3.9 million, excluding income attributable to redeemable noncontrolling interest, the majority of which was unrealized. For the year ended December 31, 2016, we recorded non-operating income from seed investments of $6.8 million, excluding losses attributable to redeemable noncontrolling interest, the majority of which was unrealized. To the extent we incur losses on our seed investments, our earnings and financial condition may be adversely impacted.
6
Regulations restricting the use of commission credits to pay for research will increase our operating expenses.
On behalf of our clients, we make decisions to buy and sell securities, select broker-dealers to execute trades and negotiate brokerage commission rates. In connection with these transactions, we may receive commission credits to pay for eligible research and services from broker-dealers and other eligible service providers that have the effect of reducing certain expenses. New regulation in the European Union has led the Company to eliminate the use of commission credits to pay for research for accounts managed by CSUK and other accounts subject to MiFID II. This will increase the Company’s operating expenses because we will now pay for research from our own assets. In the future, the Company may also adopt this approach for other accounts depending on market and regulatory developments, which will further increase the Company’s operating expenses.
We face substantial competition in all aspects of our investment management business.
The investment management industry is highly competitive and investment management customers are increasingly fee sensitive. We compete against a large number of investment products and services sold to the public by investment management companies, investment dealers, banks, insurance companies and others, and many institutions we compete with have greater financial resources than us. We compete with these firms on the basis of investment performance, diversity of products, distribution capability, scope and quality of services, reputation and the ability to develop new investment strategies and products to meet the changing needs of investors. In addition, our actively managed investment strategies compete not only against other active strategies, but also against similarly positioned index strategies.
The continuing shift in market demand toward index funds and other passive strategies reduces opportunities for active managers and may accelerate fee compression. In the event that competitors charge lower fees for substantially similar products, we may be forced to compete on the basis of price in order to attract and retain customers. In order to maintain our current fee structure in a competitive environment, we must be able to provide clients with investment returns and service that will encourage them to pay our fees. To the extent that current or potential clients decide to invest in products sponsored by our competitors, the sales of our products as well as our market share, revenue and net income could decline.
The inability to access clients through third-party intermediaries could have a material adverse effect on our business.
In recent years, a significant portion of the growth in the assets we manage has been from assets attributable to the distribution of our products through third-party intermediaries. Our ability to distribute our funds is highly dependent on access to the client bases and product platforms of international, national and regional securities firms, banks, insurance companies, defined contribution plan administrators and other intermediaries, which generally offer competing investment products that could limit the distribution of our products. In addition, our separate account business and subadvisory and model delivery services depend in part on recommendations by consultants, financial planners and other professional advisors, as well as our existing clients.
The structure and terms of the distribution arrangements with intermediaries, including fees or rebates paid by us or our funds to intermediaries to assist with distribution efforts and the ability of our funds to participate in these intermediary platforms, are subject to changes driven by market competition and regulatory developments. Our existing relationships with third-party intermediaries and access to new intermediaries could be adversely affected by recent consolidation within the financial services industry. Consolidation may result in increased distribution costs, a reduction in the number of third parties distributing our investment products or increased competition to access third-party distribution channels. There can be no assurance that we will be able to retain access to these channels. Loss of any of these third-party distribution channels, or changes to their structure and terms, or any reduction in our ability to access clients and investors through existing and new distribution channels, could adversely affect our business.
The growth of our business could be adversely affected if we are unable to manage the costs associated with the expansion of our business.
Our growth strategy continues to involve diversifying our investment management business to include products and services outside of investments in U.S. real estate securities. As part of the implementation of our strategy, we have emphasized the development of broader real assets strategies, including global listed infrastructure, commodities, and natural resource equities, and have expanded our geographical presence outside the U.S. As a result, our fixed costs and other expenses have increased to support the development of new strategies and products and to enhance our infrastructure, including additional office space, increased travel and technology and compliance resources. The success of our business strategy and future growth is contingent upon our ability to continue to support the development and implementation of new strategies and products and our ability to successfully manage multiple offices and navigate legal and regulatory systems both
7
domestically and internationally. In the future, we may not have sufficient resources to adequately support growth in this manner.
Our clients may withdraw or reduce the amount of assets we manage or otherwise change the terms of our relationship which could have an adverse impact on our revenue.
Our institutional clients, and firms with which we have strategic alliances, may terminate their relationship with us, reduce the amount of assets we manage, shift their funds to other types of accounts with different fee structures, or renegotiate the fees we charge them for any number of reasons, including investment performance, redemptions by beneficial owners of funds we manage or subadvise, changes in prevailing interest rates and financial market performance. Certain investors in the funds that we manage hold their shares indirectly through platforms sponsored by financial institutions that have the authority to make investment and asset allocation decisions on behalf of such shareholders. Decisions by investors to redeem assets may require selling investments at a disadvantageous time or price which could negatively affect the value of our assets under management. In a declining market or in conditions of poor relative or absolute performance, the pace of redemptions and withdrawals and the loss of institutional and individual separate account clients could accelerate. The occurrence of any of these events could have a material adverse effect on our revenue.
Limitations on our ability to utilize leverage in the closed-end funds we sponsor could reduce our assets under management and revenue.
Certain of the closed-end funds sponsored by us utilize leverage in the form of bank financing, which in the aggregate amounted to approximately $2.3 billion as of December 31, 2017. To the extent any closed-end fund sponsored by us elects or is required by regulation or the terms of its bank financing to reduce leverage, such fund may need to liquidate its investments. Reducing leverage or liquidating investments during adverse market conditions could reduce the Company’s assets under management and revenue.
We could incur financial losses, reputational harm, and regulatory penalties if we fail to implement effective information security policies and procedures.
We are dependent on the effectiveness of our information security policies and procedures to protect our network and telecommunications systems and the data that reside in or are transmitted through such systems. As part of our normal operations, we maintain and transmit confidential information about our employees and clients’ portfolios as well as proprietary information relating to our business operations. We maintain a system of internal controls designed to provide reasonable assurance that fraudulent activity, including misappropriation of Company assets, fraudulent financial reporting, and unauthorized access to sensitive or confidential information is either prevented or timely detected and remediated. However, our technology systems may still be vulnerable to unauthorized access or may be corrupted by cyber attacks, computer viruses or other malicious software code, or authorized persons could inadvertently or intentionally release confidential or proprietary information. The nature of these threats is constantly evolving and becoming increasingly sophisticated. Although we take precautions to password protect and encrypt our mobile electronic devices, if such devices are stolen, misplaced or left unattended, they may become vulnerable to hacking or other unauthorized use, creating a possible security risk.
Breach or other failure of our technology systems, including those of third parties with whom we do business, could result in the loss of valuable information, liability for stolen assets or information, remediation costs to repair damage caused by the incident, additional security costs to mitigate against future incidents and litigation costs resulting from the incident. Moreover, loss of confidential client information could harm our reputation, result in the termination of contracts by our existing clients and subject us to liability under laws that protect confidential personal data, resulting in increased costs or loss of revenues. In the past, we have not maintained insurance coverage that specifically protected against information security breaches, including cyber breaches, and had minimal coverage under our other insurance policies. To help mitigate against any potential losses in the future, we purchased a cyber security insurance policy covering the period from December 31, 2017 to December 31, 2018 and anticipate renewing the policy for subsequent periods. However, insurance and other safeguards may only partially reimburse us for our losses, if at all, and if a claim is successful and exceeds or is not covered by our insurance policy, we may be required to pay a substantial amount in respect of such successful claim.
Failure to maintain adequate business continuity plans could have a material adverse effect on the Company and its products.
Significant portions of our business operations and those of our critical third-party service providers are concentrated in a few geographic areas, including New York and New Jersey. Critical operations that are geographically concentrated in New York include portfolio management, trading operations, information technology, investment administration, and portfolio
8
accounting services for the Company’s products and services. Should we, or any of our critical service providers, experience a significant local or regional disaster or other significant business disruption, our ability to remain operational will depend in part on the safety and availability of our personnel, our office facilities, and the proper functioning of our network, telecommunication and other related systems and operations. We have backup systems and contingency plans, but we cannot ensure that they will be adequate in all circumstances that could arise or that material interruptions and disruptions will not occur. In addition, we rely to varying degrees on outside vendors for disaster recovery support, and we cannot ensure that these vendors will be able to perform in an adequate and timely manner. Failure by us, or any of our critical service providers, to maintain up to date business continuity plans, including system backup facilities, would impede our ability to operate in the event of a significant business disruption, which could result in financial losses to the Company and our clients and investors.
We could experience loss of client relationships if our reputation is harmed.
Our reputation is important to the success of our business. We believe that the Cohen & Steers brand has been, and continues to be, well received globally both in our industry and with our clients, reflecting the fact that our brand, like our business, is based in part on trust and confidence. Our reputation may be harmed by a number of factors, including, but not limited to, poor investment performance, the dissemination by current or former clients of unfavorable opinions relating to our services, and the imposition of legal or regulatory sanctions or penalties in connection with our business activities. If our reputation is harmed, existing clients and investors may reduce amounts held in, or withdraw entirely from, funds or accounts that we manage, or funds or accounts may terminate their relationship with us. In addition, reputational harm may cause us to lose current employees and we may be unable to attract new ones with similar qualifications or skills which could negatively affect our operations. If we fail to address, or appear to fail to address, successfully and promptly the underlying causes of any reputational harm, we may be unsuccessful in repairing any harm to our reputation and our future business prospects would likely be affected. The loss of client relationships could reduce our assets under management, revenue and earnings.
The failure of a key vendor to fulfill its obligations to the Company could have a material adverse effect on the Company and its products.
We depend on a number of key vendors for various fund administration, fund accounting, custody and transfer agent services, information technology services, market data, and other operational needs. The failure or inability of the Company to provide backup for key services or the failure of any key vendor to fulfill its obligations could lead to operational issues for the Company and certain of its products, which could result in financial losses for the Company and its clients.
Risks Related to our Common Stock
A significant portion of our common stock is owned by our Chairman and our Chief Executive Officer, which may limit the ability of other stockholders to influence the affairs of the Company.
Our Chairman and our Chief Executive Officer beneficially owned approximately 49% of our common stock as of December 31, 2017. As long as our Chairman and our Chief Executive Officer own a significant portion of our common stock, they may have the ability to significantly influence, among other things:
• | the election of the members of our board of directors, thereby controlling the management and affairs of the Company; |
• | the outcome of matters submitted to a vote of our stockholders; and |
• | any unsolicited acquisition of us and, consequently, adversely affect the market price of our common stock or prevent our stockholders from realizing a premium on their shares. |
The interests of our Chairman and our Chief Executive Officer may differ from those of other stockholders in instances where, for example, management compensation is being determined or where an unsolicited acquisition of us could result in a change in our management. The concentration of beneficial ownership in our Chairman and our Chief Executive Officer may limit the ability of our other stockholders to influence the affairs of the Company.
A sale of a substantial number of shares of our common stock may adversely affect the market price of our common stock, and the issuance of additional shares will dilute your percentage ownership in the Company.
A sale of a substantial number of shares of our common stock in the public market, or the perception that such sale may occur, could adversely affect the market price of our common stock. Our Chairman and our Chief Executive Officer, who beneficially owned, in the aggregate, 22,645,719 shares of our common stock as of December 31, 2017, may sell shares of
9
our common stock in the open market, subject to any restrictions imposed by U.S. federal securities laws on sales by affiliates.
In addition, in connection with our initial public offering in 2004, we entered into a Registration Rights Agreement with our Chairman and our Chief Executive Officer and certain of their affiliates which requires us to register under the Securities Act of 1933, as amended, shares of our common stock (and other securities convertible into or exchangeable or exercisable for shares of common stock) held by them under certain circumstances. In August 2015, we filed a Registration Statement on Form S-3, as amended, covering (i) the resale of up to an aggregate of 23,579,791 shares owned by our Chairman and our Chief Executive Officer and certain of their affiliates and (ii) the offer and sale of up to 10,000,000 shares by us to the public. The sale of a substantial number of shares of our common stock may adversely affect the market price of our common stock and any additional shares that we issue will dilute your percentage ownership in the Company.
Anti-takeover provisions in our charter documents and Delaware law may delay or prevent a change in control of us, which could decrease the trading price of our common stock.
Our certificate of incorporation and bylaws and Delaware law contain certain anti-takeover provisions that could have the effect of making it more difficult for a third-party to acquire, or of discouraging a third party from attempting to acquire, control of the Company without negotiating with our board of directors. Such provisions could limit the price that certain investors might be willing to pay in the future for the Company’s common stock. Certain of these provisions allow the Company to issue preferred stock with rights more senior to those of our common stock, impose various procedural and other requirements that could make it more difficult for stockholders to effect certain corporate actions, and set forth rules about how stockholders may present proposals or nominate directors for election at annual meetings.
We believe these provisions protect our stockholders from coercive or other unfair takeover tactics by requiring potential acquirers to negotiate with our board of directors and by providing our board of directors with more time to assess acquisition proposals. However, these provisions apply even if an acquisition proposal may be considered beneficial by some stockholders and could have the effect of delaying or preventing an acquisition. In the event that our board of directors determines that a potential business combination transaction would be beneficial to the Company and its stockholders, such stockholders may elect to sell their shares in the Company and the trading price of our common stock could decrease.
Regulatory and Legal Risks
We may be adversely impacted by legal and regulatory changes in the U.S. and internationally.
We operate in a highly regulated industry and are subject to new regulations and revisions to, and evolving interpretations of, existing regulations in the U.S. and internationally. In recent years, regulators in the U.S. and abroad have increased oversight of the financial industry, which may result in regulation that increases the Company’s cost of conducting its business or limit or change the Company’s current or prospective business. Some of the newly adopted and proposed regulations are focused directly on the investment management industry, while others are more broadly focused, but impact our industry.
In the U.S., the Tax Cuts and Jobs Act (the Tax Act) was enacted on December 22, 2017. The Tax Act, among other things, imposed a one-time tax on deemed repatriated accumulated earnings and profits of our foreign subsidiaries, moved from the current system of worldwide taxation to a territorial system and reduced the statutory corporate tax rate to 21%. As a result of these changes, in the fourth quarter of 2017, the Company recorded a transition tax attributable to the shift in tax regimes and also remeasured its deferred and other tax balances using enacted tax rates that will be in effect when such items are expected to reverse. Furthermore, additional guidance and changes may be issued that may have a direct effect on our financial condition, results of operations and liquidity.
In 2016, the U.S. Department of Labor (DOL) began introducing changes to definitions and rules relating to fiduciaries serving holders of qualified retirement accounts. Full implementation has been delayed, and may be further delayed, during which time additional revisions may be made to the definitions and rules relating to fiduciaries. If adopted as currently proposed, the DOL’s changes may materially impact how advice can be provided to retirement account holders in 401(k) plans, individual retirement accounts and other qualified retirement programs. We may need to modify our interactions or limit distribution to retirement plans. In addition, our revenues and expenses may be adversely affected by the new rule adopted in 2016 by the SEC to address liquidity risk management by registered open-end funds. These rules could limit investment opportunities for certain funds we manage, impact flows, and increase our expenses.
10
Outside the U.S., rules and regulations under MiFID II and MiFIR became effective on January 3, 2018. These have had and will continue to have direct and indirect effects on our operations in the European Economic Area, including increased costs for investment research and increased compliance, disclosure, reporting, and other obligations, which could impact our ability to operate in these markets.
In May 2018, the European Union’s General Data Protection Regulation (GDPR) will become effective. The primary objectives of GDPR are to give citizens control of their personal data and to simplify the regulatory environment for international business by unifying data protection regulation in the European Union. Compliance with the stringent rules under GDPR will require an extensive review of all of our global data processing systems. Failure to comply with GDPR could result in fines up to the higher of 20 million Euros or 4% of annual global revenues.
The decision of the U.K. to exit from the European Union following the June 2016 vote on the matter (referred to as Brexit) may disrupt our business operations, including our reported financial results and the liquidity and value of our investments. Brexit has caused significant geo-political and legal uncertainty and market volatility in the U.K. and elsewhere, which may continue during the Brexit negotiation process. Depending on the outcome of these negotiations, CSUK’s ability to market its services or serve as a distributor of financial products within the European Economic Area, as well as the ability of our EU-domiciled funds to be marketed in the U.K. could be restricted temporarily or in the long term.
Although the full extent of the foregoing regulatory changes is still unclear, they may affect our business operations and increase our operating expenses.
Our involvement in legal proceedings could adversely affect our results of operations and financial condition.
Many aspects of our business involve risks of legal liability. Claims against us may arise in the ordinary course of business, including employment-related claims, and from time to time, we may receive subpoenas or other requests for information from various U.S. and non-U.S. governmental and regulatory authorities and third parties in connection with certain industry-wide, company-specific or other investigations or proceedings. In addition, certain of the funds that the Company manages may become subject to lawsuits, any of which could potentially harm the investment returns of the applicable fund.
We carry insurance in amounts and under terms that we believe are appropriate to cover potential liabilities related to litigation. However, we cannot guarantee that our insurance will cover all liabilities and losses to which we may be exposed, or that our insurance policies will continue to be available at acceptable terms and fees. As our insurance policies are due for renewal, we may need to assume higher deductibles or pay higher premiums, which would increase our expenses and reduce our net income.
The tax treatment of certain of our funds involves the interpretation of complex provisions of U.S. federal income tax law for which no precedent may be available and may be subject to potential legislative, judicial or administrative change and differing interpretations, possibly on a retroactive basis.
The U.S. federal income tax treatment of certain of our funds depends in some instances on determinations of fact and interpretations of complex provisions of U.S. federal income tax law for which no clear precedent or authority may be available. U.S. federal income tax rules are constantly under review by the IRS and the U.S. Department of the Treasury, frequently resulting in revised interpretations of established concepts, statutory changes, revisions to regulations and other modifications and interpretations. Recent and ongoing changes to U.S. federal income tax laws and interpretations thereof could cause us to change our investments and commitments, affect the tax considerations of an investment in us and change the character or treatment of portions of our income. In addition, the Company may be required to make certain assumptions when electing a particular tax treatment. It is possible that the IRS could assert successfully that the assumptions made by us do not satisfy the technical requirements of the Internal Revenue Code and/or Treasury Regulations and could require items of income, gain, deduction, loss or credit, including interest deductions, be adjusted, reallocated or disallowed in a manner that adversely affects us and our clients.
11
Item 1B. Unresolved Staff Comments
The Company has no unresolved SEC staff comments.
Item 2. Properties
Our principal executive office is located in leased office space at 280 Park Avenue, New York, New York. In addition, we have leased office space in London, Hong Kong, Tokyo and Seattle.
Item 3. Legal Proceedings
From time to time, we may become involved in legal matters relating to claims arising in the ordinary course of our business. There are currently no such matters pending that we believe could have a material effect on our consolidated results of operations, cash flows or financial condition. In addition, from time to time, we may receive subpoenas or other requests for information from various U.S. federal and state governmental authorities, domestic and international regulatory authorities and third parties in connection with certain industry-wide inquiries or other investigations or legal proceedings. It is our policy to cooperate fully with such requests.
Item 4. Mine Safety Disclosures
Not applicable.
12
PART II
Item 5. Market for Registrant’s Common Equity, Related Stockholder Matters and Issuer Purchases of Equity Securities
Our common stock is listed on the New York Stock Exchange (NYSE) and is traded under the symbol “CNS”. As of February 20, 2018, there were 20 holders of record of our common stock. Holders of record include institutional and omnibus accounts that hold common stock on behalf of numerous underlying beneficial owners. The closing sale price of our common stock on February 20, 2018 was $40.31 per share.
The following table sets forth, for the periods indicated, the high and low reported sale prices and dividends declared per share for our common stock as reported by the NYSE:
Three Months Ended 2017 | March 31 | June 30 | September 30 | December 31 | |||||||||
High price | $ | 40.39 | $ | 41.93 | $ | 42.99 | $ | 47.82 | |||||
Low price | $ | 33.19 | $ | 38.02 | $ | 36.30 | $ | 39.19 | |||||
Closing price | $ | 39.97 | $ | 40.54 | $ | 39.49 | $ | 47.29 | |||||
Cash dividends declared per share | $ | 0.28 | $ | 0.28 | $ | 0.28 | $ | 1.28 | * | ||||
Three Months Ended 2016 | March 31 | June 30 | September 30 | December 31 | |||||||||
High price | $ | 39.63 | $ | 42.37 | $ | 43.83 | $ | 43.11 | |||||
Low price | $ | 26.72 | $ | 36.74 | $ | 38.56 | $ | 33.16 | |||||
Closing price | $ | 38.92 | $ | 40.44 | $ | 42.75 | $ | 33.60 | |||||
Cash dividends declared per share | $ | 0.26 | $ | 0.26 | $ | 0.26 | $ | 0.76 | * | ||||
* | Includes special dividends declared by the Company in the amount of $1.00 per share on November 8, 2017 and $0.50 per share on November 2, 2016. |
Payment of any dividends to our common stockholders is subject to the discretion of our Board of Directors. When determining whether to pay a dividend, our Board of Directors takes into account such matters as general economic and business conditions, our strategic plans, our financial results and condition, contractual, legal and regulatory restrictions on the payment of dividends by us and our subsidiaries and such other factors that our Board of Directors deems relevant. On February 22, 2018, we declared a quarterly cash dividend on our common stock in the amount of $0.33 per share. As set forth in the table above, we have historically paid quarterly cash dividends.
Issuer Purchases of Equity Securities
During the three months ended December 31, 2017, we did not make any purchases of our equity securities that are registered pursuant to Section 12(b) of the Securities Exchange Act of 1934.
Recent Sales of Unregistered Securities
None.
13
Item 6. Selected Financial Data
The selected consolidated financial data, together with other information presented below, should be read in conjunction with our consolidated financial statements and the notes to those statements and “Management’s Discussion and Analysis of Financial Condition and Results of Operations” included in this Annual Report on Form 10-K.
Selected Consolidated Financial and Other Data
(in thousands, except per share data) | As of and For the Year Ended December 31, | |||||||||||||||||||
2017 | 2016 | 2015 | 2014 | 2013 | ||||||||||||||||
Consolidated Statements of Operations | ||||||||||||||||||||
Total revenue | $ | 378,194 | $ | 349,876 | $ | 328,655 | $ | 313,934 | $ | 297,713 | ||||||||||
Total expenses | 223,448 | 214,365 | 201,106 | 191,993 | 191,371 | (1) | ||||||||||||||
Operating income | 154,746 | 135,511 | 127,549 | 121,941 | 106,342 | |||||||||||||||
Total non-operating income (loss) | 5,654 | 7,892 | (14,805 | ) | (2) | 73 | (1,978 | ) | ||||||||||||
Income before provision for income taxes | 160,400 | 143,403 | 112,744 | 122,014 | 104,364 | |||||||||||||||
Provision for income taxes | 67,914 | 50,593 | 48,407 | 46,280 | 41,109 | |||||||||||||||
Net income | 92,486 | 92,810 | 64,337 | 75,734 | 63,255 | |||||||||||||||
Less: Net (income) loss attributable to redeemable noncontrolling interest | (547 | ) | 126 | 214 | (224 | ) | 4,864 | |||||||||||||
Net income attributable to common stockholders | $ | 91,939 | $ | 92,936 | $ | 64,551 | $ | 75,510 | $ | 68,119 | ||||||||||
Earnings per share attributable to common stockholders | ||||||||||||||||||||
Basic | $ | 1.98 | $ | 2.02 | $ | 1.42 | $ | 1.69 | $ | 1.54 | ||||||||||
Diluted | $ | 1.96 | $ | 2.00 | $ | 1.41 | $ | 1.65 | $ | 1.51 | ||||||||||
Cash dividends declared per share | ||||||||||||||||||||
Quarterly | $ | 1.12 | $ | 1.04 | $ | 1.00 | $ | 0.88 | $ | 0.80 | ||||||||||
Special | $ | 1.00 | $ | 0.50 | $ | 0.50 | $ | 1.00 | $ | 1.00 | ||||||||||
Consolidated Statements of Financial Condition | ||||||||||||||||||||
Cash and cash equivalents | $ | 193,452 | $ | 183,234 | $ | 142,728 | $ | 124,938 | $ | 128,277 | ||||||||||
Trading investments | 74,856 | 12,689 | 37,169 | 9,509 | 15,668 | |||||||||||||||
Equity method investments | 6,176 | 6,459 | 16,974 | 28,550 | 24,724 | |||||||||||||||
Available-for-sale investments | 27,074 | 35,396 | 17,191 | 21,269 | 10,449 | |||||||||||||||
Total assets | 410,125 | 333,728 | 305,322 | 280,721 | 274,926 | |||||||||||||||
Total liabilities | 86,794 | 67,061 | 62,212 | 52,133 | 51,162 | |||||||||||||||
Redeemable noncontrolling interest | 47,795 | 853 | 11,334 | 607 | 207 | |||||||||||||||
Total stockholders’ equity | 275,536 | 265,814 | 231,776 | 227,981 | 223,557 | |||||||||||||||
Other Data (in millions) | ||||||||||||||||||||
Assets under management (AUM) by investment vehicle: | ||||||||||||||||||||
Institutional accounts | $ | 29,396 | $ | 28,659 | $ | 26,105 | $ | 26,201 | $ | 22,926 | ||||||||||
Open-end funds | 23,304 | 19,576 | 17,460 | 17,131 | 14,016 | |||||||||||||||
Closed-end funds | 9,406 | 8,963 | 9,029 | 9,805 | 8,965 | |||||||||||||||
Total AUM | $ | 62,106 | $ | 57,198 | $ | 52,594 | $ | 53,137 | $ | 45,907 | ||||||||||
_________________________
(1) Includes $7.8 million expense associated primarily with the offering of a closed-end fund.
(2) Includes $8.2 million of unrealized losses related to the reclassification of one of the Company’s seed investment from available-for-sale to equity method and a $2.8 million other-than-temporary impairment.
14
Item 7. Management’s Discussion and Analysis of Financial Condition and Results of Operations
This Annual Report on Form 10-K and other documents filed by us contain forward-looking statements within the meaning of Section 27A of the Securities Act of 1933, as amended, and Section 21E of the Securities Exchange Act of 1934, as amended, which reflect management’s current views with respect to, among other things, our operations and financial performance. You can identify these forward-looking statements by the use of words such as “outlook,” “believes,” “expects,” “potential,” “may,” “should,” “seeks,” “predicts,” “intends,” “plans,” “estimates,” “anticipates” or the negative versions of these words or other comparable words. Such forward-looking statements are subject to various risks and uncertainties. Accordingly, there are or will be important factors that could cause actual outcomes or results to differ materially from those indicated in these forward-looking statements. We believe that these factors include, but are not limited to, the risks described in Item 1A. Risk Factors of this Annual Report on Form 10-K. These factors are not exhaustive and should be read in conjunction with the other cautionary statements that are included in this Annual Report on Form 10-K. We undertake no obligation to publicly update or review any forward-looking statement, whether as a result of new information, future developments or otherwise.
Cohen & Steers, Inc. (CNS), a Delaware corporation formed in 2004, and its subsidiaries are collectively referred to as the Company, we, us or our.
Executive Overview
General
We are a global investment manager specializing in liquid real assets, including real estate securities, listed infrastructure, commodities and natural resource equities, as well as preferred securities and other income solutions. Founded in 1986, we are headquartered in New York City, with offices in London, Hong Kong, Tokyo and Seattle.
Our primary investment strategies include U.S. real estate securities, global/international real estate securities, global listed infrastructure, master limited partnerships (MLPs), commodities, real assets multi-strategy, preferred securities, large cap value and global natural resource equities. Our strategies seek to achieve a variety of investment objectives for different risk profiles and are actively managed by specialist teams of investment professionals who employ fundamental-driven research and portfolio management processes. We offer our strategies through a variety of investment vehicles, including U.S. registered funds and other commingled vehicles and separate accounts, including subadvised portfolios for financial institutions and individuals around the world.
Our products and services are marketed through multiple distribution channels. We distribute our U.S. registered funds principally through financial intermediaries, including broker-dealers, registered investment advisers, banks and fund supermarkets. Our funds domiciled in Europe are marketed to individual and institutional investors through financial intermediaries, as well as privately to institutional investors. Our institutional clients include corporate and public defined benefit and defined contribution pension plans, endowment funds and foundations, insurance companies and other financial institutions that access our investment management services directly, through consultants or through other intermediaries.
Our revenue is derived from fees received from our clients, including fees for managing or subadvising client accounts; investment advisory, administration, distribution and service fees received from Company-sponsored open-end and closed-end funds; and fees for portfolio consulting and other services. Our fees are paid in arrears, based on contractually specified percentages of the value of the assets we manage and, in certain cases, investment performance. Our revenue fluctuates with changes in the total value of our assets under management, which may occur as a result of investment performance, addition or termination of client accounts, contributions or withdrawals from client accounts, market conditions, foreign currency fluctuations, or investor subscriptions or redemptions, and is recognized over the period that the assets are managed.
A majority of our revenue, approximately 92%, 91% and 92% for the years ended December 31, 2017, 2016 and 2015, respectively, was derived from investment advisory and administration fees for providing asset management services to institutional accounts as well as open-end funds and closed-end funds sponsored by the Company.
2017 Financial Highlights
Revenue increased 8% to $378.2 million for the year ended December 31, 2017 from $349.9 million for the year ended December 31, 2016. The increase was primarily driven by higher average assets under management in all three investment vehicles—institutional accounts, open-end funds and closed-end funds. Operating income increased 14% to $154.7 million for the year ended December 31, 2017 from $135.5 million for the year ended December 31, 2016. Our operating margin was
15
40.9% for the year ended December 31, 2017, compared with 38.7% for the year ended December 31, 2016. Our effective tax rate was 42.5% for the year ended December 31, 2017, compared with 35.3% for the year ended December 31, 2016.
As of December 31, 2017, assets under management were $62.1 billion, an increase of $4.9 billion, or 9%, from $57.2 billion as of December 31, 2016. The increase was driven by net inflows of $3.9 billion and market appreciation of $5.8 billion, partially offset by distributions of $4.7 billion. Average assets under management were $60.3 billion for the year ended December 31, 2017, an increase of $3.9 billion, or 7% from $56.4 billion for the year ended December 31, 2016. Our overall annual organic growth rate was 7% as of December 31, 2017. The organic growth rate represents the ratio of annual net flows to the beginning assets under management.
Recent Business Developments
• | In January 2018, the Company received three awards for leadership and investment performance from the Asia Asset Management “2018 Best of the Best Performance Awards,” including Best Real Assets House and Performance Awards - Global REITs (3 years) and Global REITs (10 years). These awards recognized the Company’s leadership in real estate and other real assets investments. In addition, Cohen & Steers MLP & Energy Opportunity Fund ended 2017 as the top performing fund in its category and gained a four-star rating from Morningstar. Please refer to the Company’s website for additional disclosure on the Morningstar rating. |
• | Our European business development efforts are beginning to translate into asset flows as evidenced by net inflows into our European real estate SICAV, primarily from a large European financial intermediary that included this fund in their discretionary models during the fourth quarter and increased request for proposal activity in the region. In addition, in February 2018, we were awarded our first institutional account mandate in Germany. |
• | Institutional interest in our preferred securities strategy, global listed infrastructure strategy and global real estate strategy remains strong with institutional accounts in each strategy experiencing net inflows for the year of approximately $558 million, $448 million and $175 million, respectively. |
• | In November, our largest Japanese distribution partner reduced the distribution rate on the second U.S. REIT fund that we subadvise in Japan by 25%. This distribution rate cut followed the 30% reduction in the distribution rate on the other U.S. REIT fund that we subadvise for this partner announced in July 2017. |
• | In January 2018, we were awarded our first MLP focused institutional account mandate which was funded by the client in February 2018. |
16
Assets Under Management
The following table sets forth information about net flows, market appreciation (depreciation) and distributions of assets under management by investment vehicle for the periods presented (in millions):
Year Ended December 31, | |||||||||||
2017 | 2016 | 2015 (1) | |||||||||
Institutional Accounts | |||||||||||
Assets under management, beginning of period | $ | 28,659 | $ | 26,105 | $ | 26,201 | |||||
Inflows | 3,963 | 6,374 | 3,646 | ||||||||
Outflows | (3,267 | ) | (2,414 | ) | (2,379 | ) | |||||
Net inflows (outflows) | 696 | 3,960 | 1,267 | ||||||||
Market appreciation (depreciation) | 2,867 | 1,627 | 863 | ||||||||
Distributions | (3,018 | ) | (3,033 | ) | (2,226 | ) | |||||
Transfers | 192 | — | — | ||||||||
Total increase (decrease) | 737 | 2,554 | (96 | ) | |||||||
Assets under management, end of period | $ | 29,396 | $ | 28,659 | $ | 26,105 | |||||
Average assets under management | $ | 29,346 | $ | 28,085 | $ | 25,884 | |||||
Open-end Funds | |||||||||||
Assets under management, beginning of period | $ | 19,576 | $ | 17,460 | $ | 17,131 | |||||
Inflows | 9,702 | 9,630 | 7,344 | ||||||||
Outflows | (6,541 | ) | (6,831 | ) | (5,901 | ) | |||||
Net inflows (outflows) | 3,161 | 2,799 | 1,443 | ||||||||
Market appreciation (depreciation) | 1,947 | 917 | 560 | ||||||||
Distributions | (1,188 | ) | (1,600 | ) | (1,674 | ) | |||||
Transfers | (192 | ) | — | — | |||||||
Total increase (decrease) | 3,728 | 2,116 | 329 | ||||||||
Assets under management, end of period | $ | 23,304 | $ | 19,576 | $ | 17,460 | |||||
Average assets under management | $ | 21,623 | $ | 19,176 | $ | 17,252 | |||||
Closed-end Funds | |||||||||||
Assets under management, beginning of period | $ | 8,963 | $ | 9,029 | $ | 9,805 | |||||
Inflows | — | — | — | ||||||||
Outflows | — | (88 | ) | (53 | ) | ||||||
Net inflows (outflows) | — | (88 | ) | (53 | ) | ||||||
Market appreciation (depreciation) | 949 | 554 | (206 | ) | |||||||
Distributions | (506 | ) | (532 | ) | (517 | ) | |||||
Total increase (decrease) | 443 | (66 | ) | (776 | ) | ||||||
Assets under management, end of period | $ | 9,406 | $ | 8,963 | $ | 9,029 | |||||
Average assets under management | $ | 9,343 | $ | 9,108 | $ | 9,586 | |||||
Total | |||||||||||
Assets under management, beginning of period | $ | 57,198 | $ | 52,594 | $ | 53,137 | |||||
Inflows | 13,665 | 16,004 | 10,990 | ||||||||
Outflows | (9,808 | ) | (9,333 | ) | (8,333 | ) | |||||
Net inflows (outflows) | 3,857 | 6,671 | 2,657 | ||||||||
Market appreciation (depreciation) | 5,763 | 3,098 | 1,217 | ||||||||
Distributions | (4,712 | ) | (5,165 | ) | (4,417 | ) | |||||
Total increase (decrease) | 4,908 | 4,604 | (543 | ) | |||||||
Assets under management, end of period | $ | 62,106 | $ | 57,198 | $ | 52,594 | |||||
Average assets under management | $ | 60,312 | $ | 56,369 | $ | 52,722 | |||||
_________________________
(1) | December 31, 2015 amounts have been reclassified to show distributions separately and dividend reinvestments as inflows. |
17
The following table sets forth information about net flows, market appreciation (depreciation) and distributions of assets under management by institutional account type for the periods presented (in millions):
Year Ended December 31, | |||||||||||
2017 | 2016 | 2015 (1) | |||||||||
Japan Subadvisory | |||||||||||
Assets under management, beginning of period | $ | 13,699 | $ | 13,112 | $ | 13,377 | |||||
Inflows | 1,411 | 3,305 | 1,859 | ||||||||
Outflows | (1,545 | ) | (503 | ) | (607 | ) | |||||
Net inflows (outflows) | (134 | ) | 2,802 | 1,252 | |||||||
Market appreciation (depreciation) | 911 | 818 | 709 | ||||||||
Distributions | (3,018 | ) | (3,033 | ) | (2,226 | ) | |||||
Total increase (decrease) | (2,241 | ) | 587 | (265 | ) | ||||||
Assets under management, end of period | $ | 11,458 | $ | 13,699 | $ | 13,112 | |||||
Average assets under management | $ | 12,793 | $ | 13,607 | $ | 12,973 | |||||
Subadvisory Excluding Japan | |||||||||||
Assets under management, beginning of period | $ | 5,892 | $ | 5,428 | $ | 5,480 | |||||
Inflows | 730 | 1,030 | 1,034 | ||||||||
Outflows | (854 | ) | (919 | ) | (1,013 | ) | |||||
Net inflows (outflows) | (124 | ) | 111 | 21 | |||||||
Market appreciation (depreciation) | 829 | 353 | (73 | ) | |||||||
Total increase (decrease) | 705 | 464 | (52 | ) | |||||||
Assets under management, end of period | $ | 6,597 | $ | 5,892 | $ | 5,428 | |||||
Average assets under management | $ | 6,273 | $ | 5,961 | $ | 5,537 | |||||
Advisory | |||||||||||
Assets under management, beginning of period | $ | 9,068 | $ | 7,565 | $ | 7,344 | |||||
Inflows | 1,822 | 2,039 | 753 | ||||||||
Outflows | (868 | ) | (992 | ) | (759 | ) | |||||
Net inflows (outflows) | 954 | 1,047 | (6 | ) | |||||||
Market appreciation (depreciation) | 1,127 | 456 | 227 | ||||||||
Transfers | 192 | — | — | ||||||||
Total increase (decrease) | 2,273 | 1,503 | 221 | ||||||||
Assets under management, end of period | $ | 11,341 | $ | 9,068 | $ | 7,565 | |||||
Average assets under management | $ | 10,280 | $ | 8,517 | $ | 7,374 | |||||
Total Institutional Accounts | |||||||||||
Assets under management, beginning of period | $ | 28,659 | $ | 26,105 | $ | 26,201 | |||||
Inflows | 3,963 | 6,374 | 3,646 | ||||||||
Outflows | (3,267 | ) | (2,414 | ) | (2,379 | ) | |||||
Net inflows (outflows) | 696 | 3,960 | 1,267 | ||||||||
Market appreciation (depreciation) | 2,867 | 1,627 | 863 | ||||||||
Distributions | (3,018 | ) | (3,033 | ) | (2,226 | ) | |||||
Transfers | 192 | — | — | ||||||||
Total increase (decrease) | 737 | 2,554 | (96 | ) | |||||||
Assets under management, end of period | $ | 29,396 | $ | 28,659 | $ | 26,105 | |||||
Average assets under management | $ | 29,346 | $ | 28,085 | $ | 25,884 | |||||
_________________________
(1) | December 31, 2015 amounts have been reclassified to show distributions separately and dividend reinvestments as inflows. |
18
The following table sets forth information about net flows, market appreciation (depreciation) and distributions of assets under management by investment strategy for the periods presented (in millions):
Year Ended December 31, | |||||||||||
2017 | 2016 | 2015 (1) | |||||||||
U.S. Real Estate | |||||||||||
Assets under management, beginning of period | $ | 28,927 | $ | 27,814 | $ | 28,357 | |||||
Inflows | 5,703 | 7,821 | 5,410 | ||||||||
Outflows | (5,241 | ) | (4,091 | ) | (3,729 | ) | |||||
Net inflows (outflows) | 462 | 3,730 | 1,681 | ||||||||
Market appreciation (depreciation) | 1,895 | 1,674 | 1,358 | ||||||||
Distributions | (3,694 | ) | (4,164 | ) | (3,582 | ) | |||||
Transfers | (10 | ) | (127 | ) | — | ||||||
Total increase (decrease) | (1,347 | ) | 1,113 | (543 | ) | ||||||
Assets under management, end of period | $ | 27,580 | $ | 28,927 | $ | 27,814 | |||||
Average assets under management | $ | 28,622 | $ | 29,224 | $ | 27,663 | |||||
Preferred Securities | |||||||||||
Assets under management, beginning of period | $ | 9,880 | $ | 7,705 | $ | 6,342 | |||||
Inflows | 5,168 | 4,857 | 3,048 | ||||||||
Outflows | (2,635 | ) | (2,592 | ) | (1,702 | ) | |||||
Net inflows (outflows) | 2,533 | 2,265 | 1,346 | ||||||||
Market appreciation (depreciation) | 1,145 | 365 | 371 | ||||||||
Distributions | (540 | ) | (455 | ) | (354 | ) | |||||
Total increase (decrease) | 3,138 | 2,175 | 1,363 | ||||||||
Assets under management, end of period | $ | 13,018 | $ | 9,880 | $ | 7,705 | |||||
Average assets under management | $ | 11,644 | $ | 9,145 | $ | 6,915 | |||||
Global/International Real Estate | |||||||||||
Assets under management, beginning of period | $ | 9,403 | $ | 9,476 | $ | 10,184 | |||||
Inflows | 1,520 | 1,596 | 1,017 | ||||||||
Outflows | (1,071 | ) | (1,867 | ) | (1,900 | ) | |||||
Net inflows (outflows) | 449 | (271 | ) | (883 | ) | ||||||
Market appreciation (depreciation) | 1,458 | 336 | 389 | ||||||||
Distributions | (212 | ) | (265 | ) | (214 | ) | |||||
Transfers | 10 | 127 | — | ||||||||
Total increase (decrease) | 1,705 | (73 | ) | (708 | ) | ||||||
Assets under management, end of period | $ | 11,108 | $ | 9,403 | $ | 9,476 | |||||
Average assets under management | $ | 10,258 | $ | 9,734 | $ | 9,938 | |||||
Global Listed Infrastructure | |||||||||||
Assets under management, beginning of period | $ | 5,697 | $ | 5,147 | $ | 5,697 | |||||
Inflows | 872 | 732 | 918 | ||||||||
Outflows | (376 | ) | (402 | ) | (608 | ) | |||||
Net inflows (outflows) | 496 | 330 | 310 | ||||||||
Market appreciation (depreciation) | 935 | 428 | (670 | ) | |||||||
Distributions | (196 | ) | (208 | ) | (190 | ) | |||||
Total increase (decrease) | 1,235 | 550 | (550 | ) | |||||||
Assets under management, end of period | $ | 6,932 | $ | 5,697 | $ | 5,147 | |||||
Average assets under management | $ | 6,473 | $ | 5,488 | $ | 5,559 | |||||
_________________________
(1) | December 31, 2015 amounts have been reclassified to show distributions separately and dividend reinvestments as inflows. |
19
Year Ended December 31, | |||||||||||
2017 | 2016 | 2015 (1) | |||||||||
Other | |||||||||||
Assets under management, beginning of period | $ | 3,291 | $ | 2,452 | $ | 2,557 | |||||
Inflows | 402 | 998 | 597 | ||||||||
Outflows | (485 | ) | (381 | ) | (394 | ) | |||||
Net inflows (outflows) | (83 | ) | 617 | 203 | |||||||
Market appreciation (depreciation) | 330 | 295 | (231 | ) | |||||||
Distributions | (70 | ) | (73 | ) | (77 | ) | |||||
Total increase (decrease) | 177 | 839 | (105 | ) | |||||||
Assets under management, end of period | $ | 3,468 | $ | 3,291 | $ | 2,452 | |||||
Average assets under management | $ | 3,315 | $ | 2,778 | $ | 2,647 | |||||
Total | |||||||||||
Assets under management, beginning of period | $ | 57,198 | $ | 52,594 | $ | 53,137 | |||||
Inflows | 13,665 | 16,004 | 10,990 | ||||||||
Outflows | (9,808 | ) | (9,333 | ) | (8,333 | ) | |||||
Net inflows (outflows) | 3,857 | 6,671 | 2,657 | ||||||||
Market appreciation (depreciation) | 5,763 | 3,098 | 1,217 | ||||||||
Distributions | (4,712 | ) | (5,165 | ) | (4,417 | ) | |||||
Total increase (decrease) | 4,908 | 4,604 | (543 | ) | |||||||
Assets under management, end of period | $ | 62,106 | $ | 57,198 | $ | 52,594 | |||||
Average assets under management | $ | 60,312 | $ | 56,369 | $ | 52,722 | |||||
_________________________
(1) | December 31, 2015 amounts have been reclassified to show distributions separately and dividend reinvestments as inflows. |
20
Investment Performance as of December 31, 2017
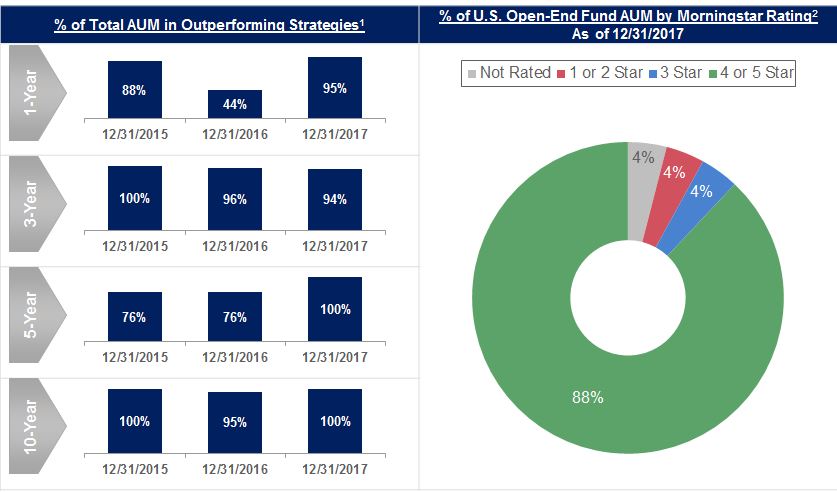
_________________________
(1) | Past performance is no guarantee of future results. Outperformance is determined by annualized investment performance of all accounts in each investment strategy measured gross of fees and net of withholding taxes in comparison to the performance of each account’s reference benchmark measured net of withholding taxes, where applicable. This is not investment advice and may not be construed as sales or marketing material for any financial product or service sponsored or provided by Cohen & Steers. |
(2) | © 2018 Morningstar, Inc. All Rights Reserved. The information contained herein: (1) is proprietary to Morningstar and/or its content providers; (2) may not be copied or distributed; and (3) is not warranted to be accurate, complete, or timely. Neither Morningstar nor its content providers are responsible for any damages or losses arising from any use of this information. Morningstar calculates its ratings based on a risk-adjusted return measure that accounts for variation in a fund’s monthly performance (including the effects of sales charges, loads, and redemption fees), placing more emphasis on downward variations and rewarding consistent performance. The top 10% of funds in each category receive five stars, the next 22.5% receive four stars, the next 35% receive three stars, the next 22.5% receive two stars and the bottom 10% receive one star. Past performance is no guarantee of future results. Based on independent rating by Morningstar, Inc. of investment performance of each Cohen & Steers-sponsored open-end U.S.-registered mutual fund for all share classes for the overall period as of December 31, 2017. Overall Morningstar rating is a weighted average based on the 3-year, 5-year and 10-year Morningstar rating. Each share class is counted as a fraction of one fund within this scale and rated separately, which may cause slight variations in the distribution percentages. This is not investment advice and may not be construed as sales or marketing material for any financial product or service sponsored or provided by Cohen & Steers. |
Overview
Assets under management were $62.1 billion at December 31, 2017, an increase of 9% from $57.2 billion at December 31, 2016 and an increase of 18% from $52.6 billion at December 31, 2015. The increase in assets under management during 2017 was due to net inflows of $3.9 billion and market appreciation of $5.8 billion, partially offset by distributions of $4.7 billion. Net inflows in 2017 included $2.5 billion into preferred securities, $496 million into global listed infrastructure and $462 million into U.S. real estate. Market appreciation in 2017 included $1.9 billion from U.S. real estate, $1.5 billion from global/international real estate, $1.1 billion from preferred securities and $935 million from global listed infrastructure. Distributions in 2017 included $3.7 billion from U.S. real estate and $540 million from preferred securities.
The increase in assets under management during 2016 was due to net inflows of $6.7 billion and market appreciation of $3.1 billion, partially offset by distributions of $5.2 billion. Net inflows in 2016 included $3.7 billion into U.S. real estate and $2.3 billion into preferred securities. Market appreciation in 2016 included $1.7 billion from U.S. real estate, $428 million
21
from global listed infrastructure and $365 million from preferred securities. Distributions in 2016 included $4.2 billion from U.S. real estate.
Average assets under management were $60.3 billion for the year ended December 31, 2017, an increase of 7% from $56.4 billion for the year ended December 31, 2016 and an increase of 14% from $52.7 billion for the year ended December 31, 2015.
Institutional accounts
Assets under management in institutional accounts, which represented 47% of total assets under management, were $29.4 billion at December 31, 2017, compared with $28.7 billion at December 31, 2016 and $26.1 billion at December 31, 2015. The increase in institutional assets under management during 2017 was due to market appreciation of $2.9 billion and net inflows of $696 million, partially offset by distributions of $3.0 billion. Net inflows in 2017 included $558 million into preferred securities and $448 million into global listed infrastructure, partially offset by net outflows of $379 million from U.S. real estate. Market appreciation in 2017 included $1.2 billion from global/international real estate, $863 million from U.S. real estate and $467 million from global listed infrastructure. Distributions in 2017 included $2.8 billion from U.S. real estate.
The increase in institutional assets under management during 2016 was due to net inflows of $4.0 billion and market appreciation of $1.6 billion, partially offset by distributions of $3.0 billion. Net inflows in 2016 included $2.4 billion into U.S. real estate, $775 million into real assets multi-strategy (included in “Other” in the table above) and $428 million into preferred securities. Market appreciation in 2016 included $924 million from U.S. real estate, $306 million from global/international real estate and $167 million from global listed infrastructure. Distributions in 2016 included $3.0 billion from U.S. real estate.
Average assets under management for institutional accounts were $29.3 billion for the year ended December 31, 2017, an increase of 4% from $28.1 billion for the year ended December 31, 2016 and an increase of 13% from $25.9 billion for the year ended December 31, 2015.
Assets under management in Japan subadvised accounts, which represented 39% of institutional assets under management, were $11.5 billion at December 31, 2017, compared with $13.7 billion at December 31, 2016 and $13.1 billion at December 31, 2015. The decrease in Japan subadvised assets under management during 2017 was due to net outflows of $134 million and distributions of $3.0 billion, partially offset by market appreciation of $911 million. Net outflows in 2017 included $63 million from global/international real estate and $27 million from preferred securities. Market appreciation in 2017 included $594 million from U.S. real estate and $254 million from global/international real estate. Distributions in 2017 included $2.8 billion from U.S. real estate.
The increase in Japan subadvised assets under management during 2016 was due to net inflows of $2.8 billion and market appreciation of $818 million, partially offset by distributions of $3.0 billion, all of which were primarily from U.S. real estate.
Average assets under management for Japan subadvised accounts were $12.8 billion for the year ended December 31, 2017, a decrease of 6% from $13.6 billion for the year ended December 31, 2016, and a decrease of 1% from $13.0 billion for the year ended December 31, 2015.
Assets under management in institutional subadvised accounts excluding Japan, which represented 22% of institutional assets under management, were $6.6 billion at December 31, 2017, compared with $5.9 billion at December 31, 2016 and $5.4 billion at December 31, 2015. The increase in institutional subadvised accounts excluding Japan assets under management during 2017 was due to market appreciation of $829 million, partially offset by net outflows of $124 million. Net outflows in 2017 included $227 million from large cap value (which is included in “Other” in the table above), partially offset by net inflows of $178 million from global/international real estate. Market appreciation in 2017 included $434 million from global/international real estate and $221 million from global listed infrastructure.
The increase in institutional subadvised accounts excluding Japan assets under management during 2016 was due to net inflows of $111 million and market appreciation of $353 million. Net inflows in 2016 included $201 million from global/international real estate, and $106 million from global listed infrastructure, partially offset by net outflows of $140 million from U.S. real estate. Market appreciation in 2016 included $91 million from global/international real estate, $77 million from global listed infrastructure, $69 million from large cap value and $63 million from commodities (both of which are included in “Other” in the table above).
22
Average assets under management for institutional subadvised accounts excluding Japan were $6.3 billion for the year ended December 31, 2017, an increase of 5% from $6.0 billion for the year ended December 31, 2016, and an increase of 13% from $5.5 billion for the year ended December 31, 2015.
Assets under management in institutional advised accounts, which represented 39% of institutional assets under management, were $11.3 billion at December 31, 2017, compared with $9.1 billion at December 31, 2016 and $7.6 billion at December 31, 2015. The increase in institutional advised accounts assets under management during 2017 was primarily due to market appreciation of $1.1 billion and net inflows of $1.0 billion. Net inflows in 2017 included $565 million into global listed infrastructure and $559 million into preferred securities, partially offset by net outflows of $281 million from U.S. real estate. Market appreciation included $485 million from global/international real estate, $241 million from global listed infrastructure and $204 million from U.S. real estate.
The increase in assets under management for institutional advised accounts during 2016 was due to net inflows of $1.0 billion and market appreciation of $456 million. Net inflows in 2016 included $775 million into real assets multi-strategy (included in “Other” in the table above) and $321 million into global listed infrastructure. Market appreciation included $265 million from global/international real estate and $79 million from global listed infrastructure.
Average assets under management for institutional advised accounts were $10.3 billion for the year ended December 31, 2017, an increase of 21% from $8.5 billion for the year ended December 31, 2016, and an increase of 39% from $7.4 billion for the year ended December 31, 2015.
Open-end funds
Assets under management in open-end funds, which represented 38% of total assets under management, were $23.3 billion at December 31, 2017, compared with $19.6 billion at December 31, 2016 and $17.5 billion at December 31, 2015. The increase in assets under management in open-end funds during 2017 was primarily due to net inflows of $3.2 billion and market appreciation of $1.9 billion, partially offset by distributions of $1.2 billion. Net inflows in 2017 included $2.0 billion into preferred securities and $842 million into U.S. real estate. Market appreciation in 2017 included $816 million from U.S. real estate and $769 million from preferred securities. Distributions included $679 million from U.S. real estate and $416 million from preferred securities.
The increase in assets under management in open-end funds during 2016 was due to net inflows of $2.8 billion and market appreciation of $917 million, partially offset by distributions of $1.6 billion. Net inflows in 2016 included $1.8 billion into preferred securities and $1.3 billion into U.S. real estate, partially offset by net outflows of $383 million from global/international real estate. Market appreciation in 2016 included $594 million from U.S. real estate and $216 million from preferred securities. Distributions included $1.2 billion from U.S. real estate.
Average assets under management for open-end funds were $21.6 billion for the year ended December 31, 2017, an increase of 13% from $19.2 billion for the year ended December 31, 2016 and an increase of 25% from $17.3 billion for the year ended December 31, 2015.
Closed-end funds
Assets under management in closed-end funds, which represented 15% of total assets under management, were $9.4 billion at December 31, 2017, compared with $9.0 billion at both December 31, 2016 and 2015. The increase in closed-end funds assets under management during 2017 was primarily due to market appreciation of $949 million, partially offset by distributions of $506 million.
Average assets under management for closed-end funds were $9.3 billion for the year ended December 31, 2017, an increase of 3% from $9.1 billion for the year ended December 31, 2016 and a decrease of 3% from $9.6 billion for the year ended December 31, 2015.
23
Results of Operations
(in thousands, except per share data and percentages) | Year Ended December 31, | ||||||||||
2017 | 2016 | 2015 | |||||||||
U.S. GAAP | |||||||||||
Revenue | $ | 378,194 | $ | 349,876 | $ | 328,655 | |||||
Expenses | $ | 223,448 | $ | 214,365 | $ | 201,106 | |||||
Operating income | $ | 154,746 | $ | 135,511 | $ | 127,549 | |||||
Operating margin | 40.9 | % | 38.7 | % | 38.8 | % | |||||
Non-operating income (loss) | $ | 5,654 | $ | 7,892 | $ | (14,805 | ) | ||||
Net income attributable to common stockholders | $ | 91,939 | $ | 92,936 | $ | 64,551 | |||||
Diluted earnings per share | $ | 1.96 | $ | 2.00 | $ | 1.41 | |||||
As Adjusted (1) | |||||||||||
Net income attributable to common stockholders | $ | 97,037 | $ | 86,109 | $ | 78,694 | |||||
Diluted earnings per share | $ | 2.07 | $ | 1.85 | $ | 1.71 | |||||
_________________________
(1) | The “As Adjusted” amounts represent non-GAAP financial measures. Please refer to the “Non-GAAP Reconciliation” on pages 28-29 for a reconciliation to the most directly comparable U.S. GAAP financial measures. |
U.S. GAAP
2017 Compared with 2016
Revenue
Total revenue increased 8% to $378.2 million for the year ended December 31, 2017 from $349.9 million for the year ended December 31, 2016. This increase was primarily attributable to higher investment advisory and administration fees of $27.2 million due to higher average assets under management in all three investment vehicles.
For the year ended December 31, 2017:
• | Total investment advisory fees from institutional accounts increased 9% to $101.9 million from $93.2 million for the year ended December 31, 2016. Total investment advisory fees compared with average assets under management in institutional accounts implied an annual effective fee rate of 34.7 bps and 33.2 bps for the years ended December 31, 2017 and 2016, respectively. |
• | Total investment advisory and administration fees from open-end funds increased 11% to $165.9 million from $149.9 million for the year ended December 31, 2016. Total investment advisory and administration fees compared with average assets under management in open-end funds implied an annual effective fee rate of 76.7 bps and 78.2 bps for the years ended December 31, 2017 and 2016, respectively. |
• | Total investment advisory and administration fees from closed-end funds increased 3% to $79.0 million from $76.6 million for the year ended December 31, 2016. Total investment advisory and administration fees compared with average assets under management in closed-end funds implied an annual effective fee rate of 84.6 bps and 84.1 bps for the years ended December 31, 2017 and 2016, respectively. |
A majority of our revenue, approximately 92% and 91% for the years ended December 31, 2017 and 2016, respectively, was derived from investment advisory and administration fees for providing asset management services to institutional accounts as well as open-end funds and closed-end funds sponsored by the Company.
Expenses
Total operating expenses increased 4% to $223.4 million for the year ended December 31, 2017 from $214.4 million for the year ended December 31, 2016, primarily due to an increase of $8.5 million in employee compensation and benefits.
Employee compensation and benefits increased 7% to $124.1 million for the year ended December 31, 2017 from $115.6 million for the year ended December 31, 2016. This increase was primarily due to higher incentive compensation of approximately $4.7 million and salaries of approximately $3.2 million.
24
Operating Margin
Operating margin for the year ended December 31, 2017 was 40.9%, compared with 38.7% for the year ended December 31, 2016.
Non-operating Income
Non-operating income for the year ended December 31, 2017 was $5.7 million, compared with $7.9 million for the year ended December 31, 2016. The change was primarily due to lower net realized and unrealized gains on our seed investments of approximately $3.0 million and net losses associated with forward currency contracts used to hedge certain non-U.S. dollar investment advisory fees receivable of $973,000, partially offset by an increase in interest and dividend income from our seed investments and corporate cash of approximately $2.2 million. Non-operating income for the year ended December 31, 2017 included net income attributable to redeemable noncontrolling interest of $547,000, compared with net loss attributable to redeemable noncontrolling interest of $126,000 for the year ended December 31, 2016.
Income Taxes
On December 22, 2017, the Tax Cuts and Jobs Act (the Tax Act) was enacted. The Tax Act, among other things, imposed a one-time tax on deemed repatriated accumulated earnings and profits of our foreign subsidiaries, moved from the current system of worldwide taxation to a territorial system and reduced the statutory corporate tax rate to 21%. As a result of these changes, in the fourth quarter of 2017, the Company recorded a transition tax attributable to the shift in tax regimes and also remeasured its deferred and other tax balances using enacted tax rates that will be in effect when such items are expected to reverse.
Income tax expense was $67.9 million for the year ended December 31, 2017, compared with $50.6 million for the year ended December 31, 2016. The effective tax rate for the year ended December 31, 2017 was 42.5%, which differed from the U.S. federal statutory rate primarily due to tax charges of approximately $8.4 million related to a transition tax on the deemed repatriation of foreign earnings and profits and approximately $4.3 million related to the remeasurement of deferred and other tax balances, partially offset by the release of certain tax reserves and other tax-related items aggregating to approximately $4.6 million.
Tax charges in connection with the enactment of the Tax Act discussed above may change due to, among other things, additional guidance that may be issued by the U.S. Department of the Treasury with respect to the Tax Act and revisions to the Company’s assumptions as further information and interpretations become available.
2016 Compared with 2015
Revenue
Total revenue increased 6% to $349.9 million for the year ended December 31, 2016 from $328.7 million for the year ended December 31, 2015. This increase was primarily attributable to higher investment advisory and administration fees of $15.9 million, due to higher average assets under management in institutional accounts and open-end funds.
For the year ended December 31, 2016:
• | Total investment advisory fees from institutional accounts increased 9% to $93.2 million from $85.5 million for the year ended December 31, 2015. Total investment advisory fees compared with average assets under management in institutional accounts implied an annual effective fee rate of 33.2 bps and 33.0 bps for the years ended December 31, 2016 and 2015, respectively. |
• | Total investment advisory and administration fees from open-end funds increased 10% to $149.9 million from $136.9 million for the year ended December 31, 2015. Total investment advisory and administration fees compared with average assets under management in open-end funds implied an annual effective fee rate of 78.2 bps and 79.3 bps for the years ended December 31, 2016 and 2015, respectively. |
• | Total investment advisory and administration fees from closed-end funds decreased 6% to $76.6 million from $81.4 million for the year ended December 31, 2015. Total investment advisory and administration fees compared with average assets under management in closed-end funds implied an annual effective fee rate of 84.1 bps and 84.9 bps for the years ended December 31, 2016 and 2015 respectively. |
A majority of our revenue, approximately 91% and 92% for the years ended December 31, 2016 and 2015, respectively, was derived from investment advisory and administration fees for providing asset management services to institutional accounts as well as open-end funds and closed-end funds sponsored by the Company.
25
Expenses
Total operating expenses increased 7% to $214.4 million for the year ended December 31, 2016 from $201.1 million for the year ended December 31, 2015, primarily due to increases of $7.9 million in employee compensation and benefits and $3.3 million in distribution and service fee expenses.
Employee compensation and benefits increased 7% to $115.6 million for the year ended December 31, 2016 from $107.7 million for the year ended December 31, 2015. This increase was primarily due to increases in incentive compensation of approximately $4.0 million, salaries of approximately $2.9 million, and higher production compensation of approximately $1.4 million, partially offset by lower amortization of restricted stock units of approximately $384,000.
Distribution and service fee expenses increased 9% to $39.6 million for the year ended December 31, 2016 from $36.3 million for the year ended December 31, 2015. The increase was primarily due to higher average assets under management in U.S. no-load open-end funds.
Operating Margin
Operating margin for the year ended December 31, 2016 was 38.7%, compared with 38.8% for the year ended December 31, 2015
Non-operating Income
Non-operating income for the year ended December 31, 2016 was $7.9 million, compared with a non-operating loss of $14.8 million for the year ended December 31, 2015, which included an unrealized non-operating loss of $8.2 million on a seed investment that, due to third-party shareholder redemptions, was reclassified from available-for-sale investments to equity method investments. In addition, non-operating loss for the year ended December 31, 2015 included a $2.8 million other-than-temporary impairment. Non-operating income for the year ended December 31, 2016 included net loss attributable to redeemable noncontrolling interest of $126,000, compared with $214,000 for the year ended December 31, 2015.
Income Taxes
Income tax expense was $50.6 million for the year ended December 31, 2016, compared with $48.4 million for the year ended December 31, 2015. The effective tax rate for the year ended December 31, 2016 was 35.3%, which differed from the U.S. federal statutory rate primarily due to the release of a valuation allowance associated with gains on the Company’s seed investments and other tax-related items. The effective tax rate for the year ended December 31, 2015 was 42.9%.
As Adjusted
The term “As Adjusted” is used to identify non-GAAP financial information in the discussion below. Please refer to the “Non-GAAP Reconciliation” on pages 28-29 for a reconciliation to the most directly comparable U.S. GAAP financial measures.
2017 Compared with 2016
Revenue
Revenue, as adjusted, increased 8% to $378.5 million for the year ended December 31, 2017 from $350.0 million for the year ended December 31, 2016. Revenue, as adjusted, excluded investment advisory and administration fees attributable to the consolidation of our seed investments.
Expenses
Total operating expenses, as adjusted, increased 5% to $223.8 million for the year ended December 31, 2017 from $212.3 million for the year ended December 31, 2016. Total operating expenses, as adjusted, excluded general and administrative expenses attributable to the consolidation of our seed investments, employee compensation and benefits related to the accelerated vesting of certain restricted stock units due to retirements, and refunds of foreign withholding taxes for prior years.
Operating Margin
Operating margin, as adjusted, for the year ended December 31, 2017 was 40.9% compared with 39.3% for the year ended December 31, 2016.
26
Non-operating Income
Non-operating income, as adjusted, for both the years ended December 31, 2017 and 2016 was $1.2 million. Non-operating income, as adjusted, excluded amounts attributable to the consolidation of our seed investments and the results from our equity method and available-for-sale seed investments.
Income Taxes
Income tax expense, as adjusted, for the year ended December 31, 2017 was $58.8 million, compared with $52.8 million for the year ended December 31, 2016. The effective tax rate, as adjusted, for the year ended December 31, 2017 was 37.8%, compared with 38.0% for the year ended December 31, 2016. The effective tax rate, as adjusted, excluded amounts attributable to the Tax Act, the release of certain tax reserves, other tax-related items and the tax effects of other non-GAAP adjustments.
2016 Compared with 2015
Revenue
Revenue, as adjusted, increased 6% to $350.0 million for the year ended December 31, 2016 from $328.8 million for the year ended December 31, 2015. Revenue, as adjusted, excluded investment advisory and administration fees attributable to the consolidation of our seed investments.
Expenses
Total operating expenses, as adjusted, increased 6% to $212.3 million for the year ended December 31, 2016 from $201.1 million for the year ended December 31, 2015. Total operating expenses, as adjusted, excluded general and administrative expenses attributable to the consolidation of our seed investments and employee compensation and benefits related to the accelerated vesting of certain restricted stock units due to retirement.
Operating Margin
Operating margin, as adjusted, for the year ended December 31, 2016 was 39.3% compared with 38.8% for the year ended December 31, 2015.
Non-operating Income
Non-operating income, as adjusted, for the year ended December 31, 2016 was $1.2 million, compared with non-operating loss, as adjusted, of $772,000 for the year ended December 31, 2015. Non-operating income (loss), as adjusted, excluded amounts attributable to the consolidation of our seed investments and the results from our equity method and available-for-sale seed investments.
Income Taxes
Income tax expense, as adjusted, for the year ended December 31, 2016 was $52.8 million, compared with $48.2 million for the year ended December 31, 2015. The effective tax rate, as adjusted, for both the years ended December 31, 2016 and 2015 was 38%. The effective tax rate, as adjusted, excluded the tax effects of other non-GAAP adjustments and other tax-related items.
27
Non-GAAP Reconciliations
Management believes that use of the following non-GAAP financial measures enhances the evaluation of our results, as they provide greater transparency into our operating performance. In addition, these non-GAAP financial measures are used to prepare our internal management reports and are used by management in evaluating our business.
While we believe that this non-GAAP financial information is useful in evaluating our results and operating performance, this information should be considered as supplemental in nature and not as a substitute for the related financial information prepared in accordance with U.S. GAAP.
Reconciliation of U.S. GAAP Net Income Attributable to Common Stockholders and U.S. GAAP Earnings per Share to Net Income Attributable to Common Stockholders, As Adjusted and Earnings per Share, As Adjusted
(in thousands, except per share data) | Year Ended December 31, | |||||||||||
2017 | 2016 | 2015 | ||||||||||
Net income attributable to common stockholders, U.S. GAAP | $ | 91,939 | $ | 92,936 | $ | 64,551 | ||||||
Accelerated vesting of restricted stock units (1) | 522 | 1,945 | — | |||||||||
Deconsolidation (2) | (2,350 | ) | (654 | ) | 2,136 | |||||||
Results from seed investments (3) | (1,124 | ) | (5,934 | ) | 11,833 | |||||||
General and administrative (4) | (1,018 | ) | — | — | ||||||||
Tax adjustments (5) | 9,068 | (2,184 | ) | 174 | ||||||||
Net income attributable to common stockholders, as adjusted | $ | 97,037 | $ | 86,109 | $ | 78,694 | ||||||
Diluted weighted average shares outstanding | 46,979 | 46,432 | 45,897 | |||||||||
Diluted earnings per share, U.S. GAAP | $ | 1.96 | $ | 2.00 | $ | 1.41 | ||||||
Accelerated vesting of restricted stock units (1) | 0.01 | 0.04 | — | |||||||||
Deconsolidation (2) | (0.05 | ) | (0.01 | ) | 0.05 | |||||||
Results from seed investments (3) | (0.02 | ) | (0.13 | ) | 0.25 | |||||||
General and administrative (4) | (0.02 | ) | — | — | ||||||||
Tax adjustments (5) | 0.19 | (0.05 | ) | — | * | |||||||
Diluted earnings per share, as adjusted | $ | 2.07 | $ | 1.85 | $ | 1.71 | ||||||
_________________________
* | Amounts round to less than $0.01 per share. |
(1) | Represents amounts related to the accelerated vesting of certain restricted stock units due to retirements. |
(2) | Represents amounts related to the deconsolidation of seed investments in Company-sponsored funds. |
(3) | Represents dividend income and realized gains (losses) on the Company’s seed investments classified as available-for-sale and the Company’s proportionate share of the results of operations of seed investments classified as equity method investments, including realized and unrealized gains (losses). |
(4) | Represents refund of foreign withholding taxes. |
(5) | Tax adjustments include the following: |
Transition tax | $ | 8,432 | $ | — | $ | — | |||||
Remeasurement of deferred and other tax balances | 4,300 | — | — | ||||||||
Tax reserves | (3,772 | ) | (675 | ) | (234 | ) | |||||
Other tax-related items | (780 | ) | (547 | ) | (26 | ) | |||||
Tax-effect of non-GAAP adjustments | 888 | (962 | ) | 434 | |||||||
Total tax adjustments | $ | 9,068 | $ | (2,184 | ) | $ | 174 | ||||
28
Reconciliation of U.S. GAAP Operating Income and U.S. GAAP Operating Margin to Operating Income, As Adjusted and Operating Margin, As Adjusted
(in thousands, except percentages) | Year Ended December 31, | ||||||||||
2017 | 2016 | 2015 | |||||||||
Revenue, U.S. GAAP | $ | 378,194 | $ | 349,876 | $ | 328,655 | |||||
Deconsolidation (1) | 280 | 147 | 102 | ||||||||
Revenue, as adjusted | $ | 378,474 | $ | 350,023 | $ | 328,757 | |||||
Expenses, U.S. GAAP | $ | 223,448 | $ | 214,365 | $ | 201,106 | |||||
Deconsolidation (1) | (106 | ) | (106 | ) | (48 | ) | |||||
Accelerated vesting of restricted stock units (2) | (522 | ) | (1,945 | ) | — | ||||||
General and administrative (3) | 1,018 | — | — | ||||||||
Expenses, as adjusted | $ | 223,838 | $ | 212,314 | $ | 201,058 | |||||
Operating income, U.S. GAAP | $ | 154,746 | $ | 135,511 | $ | 127,549 | |||||
Deconsolidation (1) | 386 | 253 | 150 | ||||||||
Accelerated vesting of restricted stock units (2) | 522 | 1,945 | — | ||||||||
General and administrative (3) | (1,018 | ) | — | — | |||||||
Operating income, as adjusted | $ | 154,636 | $ | 137,709 | $ | 127,699 | |||||
Operating margin, U.S. GAAP | 40.9 | % | 38.7 | % | 38.8 | % | |||||
Operating margin, as adjusted | 40.9 | % | 39.3 | % | 38.8 | % | |||||
Reconciliation of U.S. GAAP Non-operating Income (Loss) to Non-operating Income (Loss), As Adjusted
(in thousands) | Year Ended December 31, | ||||||||||
2017 | 2016 | 2015 | |||||||||
Non-operating income (loss), U.S. GAAP | $ | 5,654 | $ | 7,892 | $ | (14,805 | ) | ||||
Deconsolidation (1) | (3,283 | ) | (781 | ) | 2,200 | ||||||
Results from seed investments (4) | (1,124 | ) | (5,934 | ) | 11,833 | ||||||
Non-operating income (loss), as adjusted | $ | 1,247 | $ | 1,177 | $ | (772 | ) | ||||
_________________________
(1) | Represents amounts related to the deconsolidation of seed investments in Company-sponsored funds. |
(2) | Represents amounts related to the accelerated vesting of certain restricted stock units due to retirements. |
(3) | Represents refund of foreign withholding taxes. |
(4) | Represents dividend income and realized gains (losses) on the Company’s seed investments classified as available-for-sale and the Company’s proportionate share of the results of operations of seed investments classified as equity method investments, including realized and unrealized gains (losses). |
Changes in Financial Condition, Liquidity and Capital Resources
Our principal objectives are to maintain a capital structure that supports our business strategies and to maintain the appropriate amount of liquidity at all times. Furthermore, we believe that our cash flows generated from operations are more than adequate to fund our present and reasonably foreseeable future commitments for investing and financing activities.
Net Liquid Assets
Our current financial condition is highly liquid and is primarily comprised of cash and cash equivalents, seed investments and accounts receivable. Liquid assets are reduced by current liabilities (generally defined as obligations due within one year), which include accrued compensation, distribution and service fees payable, income taxes payable, and other liabilities and accrued expenses (together, net liquid assets). The Company does not currently have any debt outstanding.
29
The table below summarizes net liquid assets for the periods presented (in thousands):
December 31, 2017 | December 31, 2016 | ||||||
Financial Condition Data: | |||||||
Cash and cash equivalents: | |||||||
Cash and cash equivalents held in the U.S. | $ | 109,075 | $ | 93,395 | |||
Cash and cash equivalents held outside the U.S. | 84,377 | 89,839 | |||||
Total cash and cash equivalents | 193,452 | 183,234 | |||||
Seed investments (1) | 63,416 | 53,079 | |||||
Accounts receivable | 53,854 | 46,288 | |||||
Current liabilities | (69,086 | ) | (60,832 | ) | |||
Net liquid assets | $ | 241,636 | $ | 221,769 | |||
_________________________
(1) | Excludes certain illiquid investments classified as level 3 and investments measured at NAV (or its equivalent) as a practical expedient in accordance with Accounting Standards Codification Topic 820, Fair Value Measurement, which we are contractually prohibited from redeeming. |
Cash and cash equivalents
Cash and cash equivalents are on deposit with three major financial institutions and consist of short-term, highly liquid investments, which are readily convertible into cash and have original maturities of three months or less.
Seed investments
Seed investments include available-for-sale investments, equity method investments and trading investments net of redeemable noncontrolling interests.
Accounts receivable
Accounts receivable primarily represents investment advisory and administration fees receivable. As of December 31, 2017, institutional accounts comprised 51% of total accounts receivable, while open-end and closed-end funds, together, comprised 40% of total accounts receivable. We perform a review of our receivables on an ongoing basis in order to assess collectibility and, based on our analysis as of December 31, 2017, there were no past due items related to institutional accounts. Receivables associated with open-end and closed-end funds are generally collected on the first business day of the following month.
Current liabilities
Current liabilities are generally defined as obligations due within one year, which includes accrued compensation, distribution and service fees payable, income taxes payable, and other liabilities and accrued expenses.
Cash flows
Our cash flows generally result from the operating activities of our business, with investment advisory and administration fees being the most significant contributor.
30
The table below summarizes cash flows for the periods presented (in thousands):
Year Ended December 31, | |||||||||||
2017 | 2016 | 2015 | |||||||||
Cash Flow Data: | |||||||||||
Net cash provided by (used in) operating activities | $ | 64,253 | $ | 114,958 | $ | 89,796 | |||||
Net cash provided by (used in) investing activities | 5,709 | 2,898 | 397 | ||||||||
Net cash provided by (used in) financing activities | (60,423 | ) | (74,542 | ) | (71,109 | ) | |||||
Net increase (decrease) in cash and cash equivalents | 9,539 | 43,314 | 19,084 | ||||||||
Effect of foreign exchange rate changes on cash and cash equivalents | 679 | (2,808 | ) | (1,294 | ) | ||||||
Cash and cash equivalents, beginning of the period | 183,234 | 142,728 | 124,938 | ||||||||
Cash and cash equivalents, end of the period | $ | 193,452 | $ | 183,234 | $ | 142,728 | |||||
We expect that cash flows provided by operating activities will continue to serve as our principal source of working capital in the near future.
In 2017, net cash provided by investing activities was comprised of proceeds from sales of available-for-sale investments of $25.8 million, including $15.1 million from the redemption of our seed investment in the Cohen & Steers Low Duration Preferred and Income Fund, Inc. (LPX), partially offset by purchases of available-for-sale investments of $16.9 million, including a seed investment of $10.0 million in a track record account for a new real assets multi-strategy portfolio and purchases of property and equipment of $3.2 million. Net cash used in financing activities was primarily for dividends paid to stockholders of $98.3 million, which included a special dividend of approximately $46.3 million paid on December 13, 2017 and repurchases of common stock to satisfy employee withholding tax obligations on the vesting and delivery of restricted stock units of $9.1 million, partially offset by contributions from redeemable noncontrolling interest of $46.7 million.
In 2016, net cash provided by investing activities was comprised of proceeds from sales of available-for-sale investments of $20.8 million, including $13.2 million from the redemption of our seed investment in Cohen & Steers Real Assets Fund, Inc., partially offset by purchases of property and equipment of $10.2 million and purchases of available-for-sale investments of $8.1 million. Net cash used in financing activities was primarily for dividends paid to stockholders of $70.8 million, which included a special dividend of approximately $22.9 million paid on December 14, 2016, and repurchases of common stock to satisfy employee withholding tax obligations on the vesting and delivery of restricted stock units of $8.0 million, partially offset by contributions from redeemable noncontrolling interest of $4.0 million.
In 2015, net cash provided by investing activities was comprised of proceeds from sales of available-for-sale investments of $7.3 million and proceeds from redemption of equity method investments of $1.2 million, partially offset by purchases of available-for-sale investments of $5.7 million and purchases of property and equipment of $2.4 million. Net cash used in financing activities was primarily for dividends paid to stockholders of $68.2 million, which included a special dividend of approximately $22.7 million paid on December 16, 2015, and repurchases of common stock to satisfy employee withholding tax obligations on the vesting and delivery of restricted stock units of $19.2 million, partially offset by contributions from redeemable noncontrolling interest of $11.0 million and excess tax benefits associated with the vesting and delivery of restricted stock units of $4.8 million. For the year ended December 31, 2015, we made two new seed investments totaling $20.0 million, including $5.0 million in connection with the launch of the Cohen & Steers SICAV Global Listed Infrastructure Fund and $15.0 million in connection with the launch of LPX.
Net Capital Requirements
We continually monitor and evaluate the adequacy of our capital. We have consistently maintained net capital in excess of the regulatory requirements for our broker-dealer, as prescribed by the Securities and Exchange Commission (SEC). As of December 31, 2017, we exceeded our minimum regulatory capital requirements by approximately $3.3 million. The SEC’s Uniform Net Capital Rule 15c3-1 imposes certain requirements that may have the effect of prohibiting a broker-dealer from distributing or withdrawing capital and requiring prior notice to the SEC for certain withdrawals of capital.
Cohen & Steers Asia Limited (CSAL) and Cohen & Steers UK Limited (CSUK) are regulated outside the U.S. by the Hong Kong Securities and Futures Commission and the United Kingdom Financial Conduct Authority, respectively. At
31
December 31, 2017, CSAL and CSUK exceeded their aggregate minimum regulatory capital requirements by approximately $58.6 million.
We believe that our cash flows from operations will be more than adequate to meet our anticipated capital requirements and other obligations as they become due.
Dividends
Subject to the approval of our Board of Directors, we anticipate paying dividends. When determining whether to pay a dividend, we take into account general economic and business conditions, our strategic plans, our financial results and condition, contractual, legal and regulatory restrictions on the payment of dividends by us and our subsidiaries and such other factors deemed relevant.
On February 22, 2018, the Company declared a quarterly dividend on its common stock in the amount of $0.33 per share. This dividend will be payable on March 22, 2018 to stockholders of record at the close of business on March 8, 2018.
Investment Commitments
We have committed to co-invest up to $5.1 million alongside Cohen & Steers Global Realty Partners III-TE, L.P. (GRP-TE). As of December 31, 2017, we have funded approximately $3.8 million of this commitment. Our co-investment alongside GRP-TE is illiquid and is anticipated to be invested for the life of the fund. The timing of the funding of the unfunded portion of our commitment is currently unknown, as the drawdown of our commitment is contingent on the timing of drawdowns by the underlying funds and co-investments in which GRP-TE invests. The unfunded portion of this commitment was not recorded on our consolidated statements of financial condition as of December 31, 2017.
Contractual Obligations and Contingencies
The following table summarizes our contractual obligations by year of payment as of December 31, 2017 (in thousands):
2018 | 2019 | 2020 | 2021 | 2022 | 2023 and after | Total | |||||||||||||||||||||
Operating leases | $ | 13,897 | $ | 13,473 | $ | 11,966 | $ | 10,863 | $ | 10,863 | $ | 11,828 | $ | 72,890 | |||||||||||||
Other liability | — | 675 | 675 | 675 | 675 | 5,732 | 8,432 | ||||||||||||||||||||
Total | $ | 13,897 | $ | 14,148 | $ | 12,641 | $ | 11,538 | $ | 11,538 | $ | 17,560 | $ | 81,322 | |||||||||||||
Operating Leases
Operating leases consists of our noncancelable long-term operating leases for office space, information technology applications, market data and office equipment.
Other Liability
Other liability consists of the transition tax liability based on the cumulative undistributed earnings and profits of our foreign subsidiaries in connection with the enactment of the Tax Act. This tax liability, which is payable over eight years on an interest-free basis, was recorded as part of income tax payable on our consolidated statement of financial condition as of December 31, 2017.
Contingencies
We had approximately $12.4 million, $7.9 million and $7.3 million of total gross unrecognized tax benefits as of December 31, 2017, 2016 and 2015, respectively. The total amount of net unrecognized tax benefits that, if recognized, would affect the effective tax rate was approximately $9.5 million, $4.9 million and $4.7 million (net of the federal benefit on state issues) as of December 31, 2017, 2016 and 2015, respectively. We accrue interest and penalties related to unrecognized tax benefits in the provision for income taxes. As of December 31, 2017 and 2016, we had accrued interest and penalties related to unrecognized tax benefits of approximately $1.9 million and $2.3 million, respectively. See Note 14 to the consolidated financial statements for additional disclosures related to income taxes.
32
Off-Balance Sheet Arrangements
We do not invest in any off-balance sheet vehicles that provide liquidity, capital resources, market or credit risk support or engage in any leasing activities that expose us to any liability that is not reflected in our consolidated financial statements.
Critical Accounting Policies and Estimates
A thorough understanding of our accounting policies is essential when reviewing our reported results of operations and our financial condition. The preparation of our consolidated financial statements in accordance with accounting principles generally accepted in the United States of America requires us to make certain estimates and assumptions that affect the reported amounts of assets and liabilities and the disclosure of contingent assets and liabilities at the dates of the consolidated financial statements and the reported amounts of revenue and expenses during the reporting periods. Actual results could differ from those estimates.
Our significant accounting policies are disclosed in Note 2 to the consolidated financial statements and should be read in conjunction with the summarized information below. Management considers the following accounting policies critical to an informed review of our consolidated financial statements as they require management to make certain judgments about matters that may be uncertain at the time the policies were applied or the estimates determined.
Consolidation of Company-sponsored Funds
The Company evaluates its investments in Company-sponsored funds at inception and thereafter, if there is a reconsideration event, in order to determine whether to apply the variable interest entity (VIE) model or the voting interest entity (VOE) model. This evaluation involves the use of judgment and analysis on an entity by entity basis. In performing this analysis, we consider the legal structure of the entity, management fees earned by the Company and the nature of the ownership interest and rights of interest holders in the entity, including the Company. If we determine that the entity is a VIE, we must then assess whether the Company absorbs a majority of the VIEs expected variability in which case it is deemed to be the primary beneficiary of the VIE. The Company consolidates VIEs for which it is deemed to be the primary beneficiary. We consolidate VOEs if we own a majority of the voting interest in the entity or when the Company is the general partner of the fund and the limited partners do not have substantive kick-out or participating rights. Amounts attributable to third parties in the funds that we consolidate are recorded in redeemable noncontrolling interest on the consolidated statements of financial condition and net (income) loss attributable to redeemable noncontrolling interest on the consolidated statements of operations.
Investments
Our investments are classified as trading investments, equity method investments or available-for-sale investments at the time of purchase and at the date of each consolidated statement of financial condition. Investments classified as trading investments represent securities held within the Company-sponsored funds that we consolidate. Investments classified as equity method investments represent investments in Company-sponsored funds in which the Company’s ownership is between 20-50% of the outstanding voting interests of the entity or when the Company is able to exercise significant influence but not control over the investments. Investments for which the Company has neither control nor the ability to exercise significant influence are classified as available-for-sale.
Fair Value
The majority of our investments are carried at fair value or amounts that approximate fair value on our consolidated statement of financial condition with the periodic mark-to-market included in accumulated other comprehensive income for available-for-sale investments and directly in earnings for trading investments and equity method investments. Fair value is the price that would be received to sell an asset or transfer a liability in an orderly transaction between market participants at the measurement date. Assets and liabilities reported at fair value are classified and disclosed in a fair value hierarchy based on whether the inputs to the valuation techniques are observable or unobservable. The classification within the hierarchy is determined based on the lowest level of input that is significant to the fair value measurement:
Level 1 - Unadjusted quoted prices for identical instruments in active markets.
Level 2 - Quoted prices for similar instruments in active markets, quoted prices of identical or similar instruments in markets that are not active; and model-derived valuations in which all significant inputs and significant value drivers are observable.
Level 3 - Valuations derived from valuation techniques in which significant inputs or significant value drivers are unobservable.
33
The Company periodically reviews each individual available-for-sale investment that has an unrealized loss to determine if the loss is other-than-temporary. In evaluating whether such losses are other-than-temporary, the Company considers such factors as the extent and duration of the loss, as well as qualitative and quantitative information about the financial condition and near-term prospects of the issuer or fund and the underlying portfolio. If the Company believes that an unrealized loss on an available-for-sale investment is other-than-temporary, the loss will be recognized in the consolidated statement of operations.
Goodwill
Goodwill represents the excess of the cost of our investment in the net assets of an acquired company over the fair value of the underlying identifiable net assets at the date of acquisition. Goodwill is not amortized but is tested annually for impairment and at other times if an event or circumstances occur indicating that it is more likely than not that an impairment has occurred. We estimate the fair value of goodwill using a market approach based on our market capitalization. We determined that the fair value of our goodwill substantially exceeded its carrying value based on the most recent impairment test performed as of November 30, 2017.
Stock-based Compensation
We recognize compensation expense for the grant-date fair value of awards of equity instruments granted to employees. This expense is recognized over the period during which employees are required to provide service and reflects an adjustment for actual forfeitures.
Income Taxes
We operate in numerous states and countries through our subsidiaries and therefore must allocate our income, expenses, and earnings to these taxing jurisdictions taking into account the various laws and regulations in each jurisdiction. Our tax provision represents an estimate of the total liability that we have incurred in these jurisdictions as a result of our operations. Each year we file tax returns in each jurisdiction and settle our tax liabilities which may be subject to audit by the taxing authorities. The determination of our annual provision is subject to judgments and estimates and the actual results may vary from the amounts reported in our consolidated financial statements. Accordingly, we recognize additions to, or reductions of, income tax expense during reporting periods that may pertain to prior period provisions as our estimated liabilities are revised and actual tax returns and audits, if any, are settled. Such adjustments are recognized in the discrete quarterly period in which they are determined.
In addition, we record deferred tax consequences of all transactions that have been recognized in the consolidated financial statements in accordance with the provisions of the enacted tax laws. Deferred tax assets are recognized for temporary differences that will result in deductible amounts in future years. Deferred tax liabilities are recognized for temporary differences that will result in taxable income in future years. We record a valuation allowance, when necessary, to reduce deferred tax assets to an amount that more likely than not will be realized.
The calculation of our tax liabilities involves dealing with uncertainties in the application of complex tax laws and regulations in a multitude of jurisdictions across our global operations. In accordance with Accounting Standards Codification Topic 740, Income Taxes (ASC 740), a tax benefit from an uncertain tax position may be recognized when it is more likely than not that the position will be sustained upon examination, including resolutions of any related appeals or litigation processes, on the basis of the technical merits.
We record unrecognized tax benefits as liabilities in accordance with ASC 740 and adjust these liabilities when our judgment changes as a result of the evaluation of new information not previously available. Because of the complexity of some of these uncertainties, the ultimate resolution may result in a payment that is materially different from our current estimate of the unrecognized tax benefit liabilities. These differences are reflected as increases or decreases in income tax expense in the period in which new information becomes available.
Recently Issued Accounting Pronouncements
See discussion of Recently Issued Accounting Pronouncements in Note 2 of the consolidated financial statements.
34
Item 7A. Quantitative and Qualitative Disclosures About Market Risk
In the normal course of our business, we are exposed to risk as a result of changes in interest and currency rates and securities market and general economic fluctuations, which may have an adverse impact on the value of our investments. At December 31, 2017, we had approximately $74.9 million of trading investments as a result of consolidating CDF, GLI SICAV, GRP-CIP and SICAV Preferred. At December 31, 2017, we had approximately $6.2 million of equity method investments, which represented our equity interests in ACOM and GRP-TE. As of December 31, 2017, we had approximately $27.1 million of available-for-sale investments, which were comprised of approximately $14.6 million invested in our sponsored funds, $7.2 million invested in foreign and domestic common stocks, $4.0 million invested in fixed income securities, $1.1 million invested in preferred securities and $119,000 invested in other investments.
The following table summarizes the effect of a ten percent increase or decrease in equity prices on our investments subject to equity price fluctuation as of December 31, 2017:
Carrying Value | Carrying Value Assuming a 10% Increase | Carrying Value Assuming a 10% Decrease | |||||||||
Trading investments | $ | 74,856 | $ | 82,342 | $ | 67,370 | |||||
Equity method investments | 6,176 | 6,794 | 5,558 | ||||||||
Available-for-sale investments | 27,074 | 29,781 | 24,367 | ||||||||
As of December 31, 2017, the Company had outstanding foreign currency forward contracts to hedge its currency exposure related to certain client receivables with an aggregated notional value of approximately $12.3 million. The Company estimates that a ten percent adverse change in market prices would result in a decrease of approximately $6,400 in the fair value of open foreign currency forward contracts held at December 31, 2017.
A majority of our revenue—approximately 92%, 91% and 92% for the years ended December 31, 2017, 2016 and 2015, respectively—was derived from investment advisory and administration agreements with our clients. Under these agreements, the investment advisory and administration fee we receive is based on the market value of the assets we manage. Accordingly, a decline in the prices of securities generally, and real estate securities in particular, attributable to market conditions including inflation, interest rate changes and a general economic downturn, may cause our revenue and income to decline by causing the value of the assets we manage to decrease, which would result in lower investment advisory and administration fees; or by causing our clients to withdraw funds in favor of investments that they perceive as offering greater opportunity or lower risk or cost, which would also result in lower investment advisory and administration fees.
Market conditions may also preclude us from increasing the assets we manage in closed-end funds. The market conditions for these offerings may not be as favorable in the future, which could adversely impact our ability to grow the assets we manage and realize higher fee revenue associated with such growth. Depending on market conditions, the closed-end funds we manage may increase or decrease their leverage in order to maintain the funds’ target leverage ratios, thereby increasing or decreasing the assets we manage.
As of December 31, 2017, 44% and 21% of the assets we managed were concentrated in U.S. real estate and preferred securities, respectively. A change in interest rates or prolonged economic downturn could have a negative impact on the valuation of real estate and preferred securities in our clients’ portfolios, reduce our revenue, and impact our ability to increase assets in our open-end funds or offer new funds.
35
Item 8. Financial Statements and Supplementary Data
The report of our independent registered public accounting firm and financial statements listed in the accompanying index are included in Item 15 of this Annual Report on Form 10-K. See the Index to Financial Statements on page F-1.
Item 9. Changes in and Disagreements With Accountants on Accounting and Financial Disclosure
There have been no disagreements on accounting and financial disclosure matters.
Item 9A. Controls and Procedures
We maintain disclosure controls and procedures (as that term is defined in Rules 13a-15(e) and 15d-15(e) under the Securities Exchange Act of 1934, as amended (the Exchange Act)) that are designed to ensure that information required to be disclosed in our reports under the Exchange Act is recorded, processed, summarized and reported within the time periods specified in the Securities and Exchange Commission’s rules and forms, and that such information is accumulated and communicated to our management, including our Chief Executive Officer and our Chief Financial Officer, as appropriate, to allow timely decisions regarding required disclosures. Any controls and procedures, no matter how well designed and operated, can provide only reasonable assurance of achieving the desired control objectives.
Our management, including our Chief Executive Officer and our Chief Financial Officer, has evaluated the effectiveness of our disclosure controls and procedures (as defined in Rule 13a-15(e) under the Exchange Act) as of December 31, 2017. Based on that evaluation and subject to the foregoing, our Chief Executive Officer and our Chief Financial Officer have concluded that our disclosure controls and procedures as of December 31, 2017 were effective to accomplish their objectives at a reasonable assurance level.
There has been no change in our internal control over financial reporting that occurred during the three months ended December 31, 2017 that has materially affected, or is reasonably likely to materially affect, our internal control over financial reporting.
Management’s report on internal control over financial reporting is located on page F-2 of this Annual Report on Form 10-K and Deloitte & Touche LLP’s report on the effectiveness of our internal control over financial reporting is located on page F-3.
Item 9B. Other Information
None.
36
PART III
Item 10. Directors, Executive Officers and Corporate Governance
The information regarding directors and executive officers set forth under the headings “Nominee Information” and “Other Executive Officers” of the Proxy Statement is incorporated by reference herein.
The information regarding compliance with Section 16(a) of the Exchange Act set forth under the heading “Section 16(a) Beneficial Ownership Reporting Compliance” in the Proxy Statement is incorporated by reference herein.
The information regarding our Code of Business Conduct and Ethics and committees of our Board of Directors under the headings “Corporate Governance” and “Board Meetings and Committees” in the Proxy Statement is incorporated by reference herein.
Item 11. Executive Compensation
The information contained under the headings “Executive Compensation”, “Board Meetings and Committees” and “Report of the Compensation Committee” of the Proxy Statement is incorporated by reference herein.
Item 12. Security Ownership of Certain Beneficial Owners and Management and Related Stockholder Matters
The information under the headings “Ownership of Cohen & Steers Common Stock” and “Equity Compensation Plan Information” of the Proxy Statement is incorporated by reference herein.
Item 13. Certain Relationships and Related Transactions, and Director Independence
The information under the headings “Certain Relationships and Related Transactions” and “Corporate Governance” of the Proxy Statement is incorporated by reference herein.
Item 14. Principal Accountant Fees and Services
The information regarding our independent registered public accounting firm fees and services set forth under the heading “Ratification of the Appointment of Independent Registered Public Accounting Firm” of the Proxy Statement is incorporated by reference herein.
37
PART IV
Item 15. Exhibits and Financial Statement Schedules
(a) | 1 | Financial Statements Included herein at pages F-1 through F-37. |
2 | Financial Data Schedules All schedules have been omitted because they are not applicable, not required, or the information required is included in the financial statements or notes thereto. | |
3 | Exhibits | |
The agreements and other documents filed as exhibits to this report are not intended to provide factual information or other disclosure other than with respect to the terms of the agreements or other documents themselves, and you should not rely on them for that purpose. In particular, any representations and warranties made by us in these agreements or other documents were made solely within the specific context of the relevant agreement or document and may not describe the actual state of affairs as of the date they were made or at any other time.
38
Exhibit Number | Description | |
3.1 | — | |
3.2 | — | |
4.1 | — | |
4.2 | — | |
10.1 | — | |
10.2 | — | |
10.3 | — | |
10.4 | — | |
10.5 | — | |
10.6 | — | |
10.7 | — | Form of Mandatory Deferral Program Restricted Stock Unit Agreement for the issuance of awards pursuant to the Amended and Restated Cohen & Steers, Inc. Stock Incentive Plan (filed herewith) |
21.1 | — | Subsidiaries of the Company (filed herewith) |
23.1 | — | Consent of Deloitte & Touche LLP (filed herewith) |
24.1 | — | Powers of Attorney (included on signature page hereto) |
31.1 | — | Certification of the Chief Executive Officer pursuant to Section 302 of the Sarbanes-Oxley Act of 2002 (filed herewith) |
31.2 | — | Certification of the Chief Financial Officer pursuant to Section 302 of the Sarbanes-Oxley Act of 2002 (filed herewith) |
32.1 | — | Certification of the Chief Executive Officer pursuant to Section 906 of the Sarbanes-Oxley Act of 2002 (furnished herewith) |
32.2 | — | Certification of the Chief Financial Officer pursuant to Section 906 of the Sarbanes-Oxley Act of 2002 (furnished herewith) |
101 | — | The following financial statements from the Company’s Annual Report on Form 10-K for the year ended December 31, 2017 formatted in XBRL (eXtensible Business Reporting Language): (i) the Consolidated Statements of Financial Condition as of December 31, 2017 and December 31, 2016, (ii) the Consolidated Statements of Operations for the years ended December 31, 2017, 2016 and 2015, (iii) the Consolidated Statements of Comprehensive Income for the years ended December 31, 2017, 2016 and 2015, (iv) the Consolidated Statements of Changes in Stockholders’ Equity and Redeemable Noncontrolling Interest for the years ended December 31, 2017, 2016 and 2015, (v) the Consolidated Statements of Cash Flows for the years ended December 31, 2017, 2016 and 2015, and (vi) the Notes to the Consolidated Financial Statements. |
_________________________
(1) | Incorporated by reference to the Company’s Registration Statement on Form S-1 (Registration No. 333-114027), as amended, originally filed with the Securities and Exchange Commission on March 30, 2004. |
(2) | Incorporated by reference to the Company’s Quarterly Report on Form 10-Q (Commission File No. 001-32236), for the quarter ended June 30, 2008. |
(3) | Incorporated by reference to the Company’s Current Report on Form 8-K (Commission File No. 001-32236), filed on May 13, 2013. |
(4) | Incorporated by reference to the Company’s Quarterly Report on Form 10-Q (Commission File No. 001-32236), for the quarter ended March 31, 2015. |
(5) | Incorporated by reference to the Company’s Annual Report on Form 10-K (Commission File No. 001-32236), for the year ended December 31, 2007. |
(6) | Incorporated by reference to the Company’s Quarterly Report on Form 10-Q (Commission File No. 001-32236) for the quarter ended June 30, 2015. |
(7) | Incorporated by reference to the Company’s Current Report on Form 8-K (Commission File No. 001-32236), filed on May 10, 2017. |
* Denotes compensatory plan.
39
Item 16. Form 10-K Summary
None.
40
SIGNATURES
Pursuant to the requirements of Section 13 or 15(d) of the Securities Exchange Act of 1934, the Company has duly caused this report to be signed on its behalf by the undersigned thereunto duly authorized.
COHEN & STEERS, INC. | ||||
By: | /S/ ROBERT H. STEERS | |||
Robert H. Steers Chief Executive Officer and Director | ||||
February 23, 2018
Each of the officers and directors of Cohen & Steers, Inc. whose signature appears below, in so signing, also makes, constitutes and appoints Robert H. Steers, acting alone, his or her true and lawful attorney-in-fact, with full power and substitution, for him or her in any and all capacities, to execute and cause to be filed with the Securities and Exchange Commission any and all amendments to the Annual Report on Form 10-K, with exhibits thereto and other documents connected therewith and to perform any acts necessary to be done in order to file such documents, and hereby ratifies and confirms all that said attorney-in-fact or his substitute or substitutes may do or cause to be done by virtue hereof.
Pursuant to the requirements of the Securities Exchange Act of 1934, this report has been signed below by the following persons on behalf of the Company and in the capacities and on the dates indicated.
Signature | Title | Date | |
/S/ MARTIN COHEN | |||
Martin Cohen | Chairman and Director | February 23, 2018 | |
/S/ ROBERT H. STEERS | |||
Robert H. Steers | Chief Executive Officer and Director (Principal Executive Officer) | February 23, 2018 | |
/S/ PETER L. RHEIN | |||
Peter L. Rhein | Director | February 23, 2018 | |
/S/ RICHARD P. SIMON | |||
Richard P. Simon | Director | February 23, 2018 | |
/S/ EDMOND D. VILLANI | |||
Edmond D. Villani | Director | February 23, 2018 | |
/s/ FRANK CONNOR | |||
Frank Connor | Director | February 23, 2018 | |
/s/ Reena Aggarwal | |||
Reena Aggarwal | Director | February 23, 2018 | |
/S/ MATTHEW S. STADLER | |||
Matthew S. Stadler | Chief Financial Officer (Principal Financial Officer) | February 23, 2018 | |
/S/ ELENA DULIK | |||
Elena Dulik | Chief Accounting Officer (Principal Accounting Officer) | February 23, 2018 | |
41
TABLE OF CONTENTS
FINANCIAL STATEMENTS
F-1
COHEN & STEERS, INC.
MANAGEMENT’S REPORT ON INTERNAL CONTROL OVER FINANCIAL REPORTING
The management of Cohen & Steers, Inc. (the Company) is responsible for establishing and maintaining adequate internal control over financial reporting. The Company’s internal control system is designed to provide reasonable assurance to the Company’s management and Board of Directors regarding the reliability of financial reporting and the preparation of published financial statements in accordance with accounting principles generally accepted in the United States of America. All internal control systems, no matter how well designed, have inherent limitations. Therefore, even those systems determined to be effective can provide only reasonable assurance with respect to financial statement preparation and presentation.
The Company’s internal control over financial reporting (1) includes policies and procedures that pertain to the maintenance of records that, in reasonable detail, accurately and fairly reflect transactions and dispositions of assets; (2) provides reasonable assurance that transactions are recorded as necessary to permit preparation of financial statements in accordance with accounting principles generally accepted in the United States of America, and that receipts and expenditures are being made only in accordance with authorizations of management and the directors of the Company; (3) and provides reasonable assurance regarding prevention or timely detection of unauthorized acquisition, use or disposition of the Company’s assets that could have a material effect on the Company’s financial statements.
The Company’s management assessed the effectiveness of the Company’s internal control over financial reporting as of December 31, 2017. In making this assessment, it used the criteria set forth by the Committee of Sponsoring Organizations of the Treadway Commission in Internal Control-Integrated Framework (2013). Based on its assessment, our management believes that, as of December 31, 2017, the Company’s internal control over financial reporting is effective based on those criteria.
The Company’s independent registered public accounting firm that audited the accompanying Consolidated Financial Statements has issued an attestation report on the effectiveness of the Company’s internal control over financial reporting. Their report appears on the following page.
February 23, 2018
F-2
REPORT OF INDEPENDENT REGISTERED PUBLIC ACCOUNTING FIRM
To the Board of Directors and Stockholders of Cohen & Steers, Inc. New York, NY
Opinions on the Financial Statements and Internal Control over Financial Reporting
We have audited the accompanying consolidated statements of financial condition of Cohen & Steers, Inc. and subsidiaries (the "Company") as of December 31, 2017 and 2016, and the related consolidated statements of operations, comprehensive income, changes in stockholders’ equity and redeemable noncontrolling interest, and cash flows for each of the three years in the period ended December 31, 2017 and the related notes (collectively referred to as the “financial statements”). We also have audited the Company’s internal control over financial reporting as of December 31, 2017 based on criteria established in Internal Control - Integrated Framework (2013) issued by the Committee of Sponsoring Organizations of the Treadway Commission (COSO).
In our opinion, the consolidated financial statements referred to above present fairly, in all material respects, the financial position of the Company as of December 31, 2017 and 2016, and the results of its operations and its cash flows for each of the three years in the period ended December 31, 2017, in conformity with accounting principles generally accepted in the United States of America. Also, in our opinion, the Company maintained, in all material respects, effective internal control over financial reporting as of December 31,2017, based on the criteria established in Internal Control - Integrated Framework (2013) issued by COSO.
Basis for Opinions
The Company’s management is responsible for these financial statements, for maintaining effective internal control over financial reporting, and for its assessment of the effectiveness of internal control over financial reporting, included in the accompanying Management’s Report on Internal Control over Financial Reporting. Our responsibility is to express an opinion on these financial statements and an opinion on the Company’s internal control over financial reporting based on our audits. We are a public accounting firm registered with the Public Company Accounting Oversight Board (United States) (PCAOB) and are required to be independent with respect to the Company in accordance with the U.S. federal securities laws and the applicable rules and regulations of the Securities and Exchange Commission and the PCAOB.
We conducted our audits in accordance with the standards of the PCOAB. Those standards require that we plan and perform the audit to obtain reasonable assurance about whether the financial statements are free of material misstatement, whether due to error or fraud, and whether effective internal control over financial reporting was maintained in all material respects.
Our audits of the financial statements included performing procedures to assess the risks of material misstatements of the financial statements, whether due to error or fraud, and performing procedures to respond to those risks. Such procedures included examining, on a test basis, evidence regarding the amounts and disclosures in the financial statements. Our audits also included evaluating the accounting principles used and significant estimates made by management, as well as evaluating the overall presentation of the financial statement. Our audit of internal control over financial reporting included obtaining an understanding of internal control over financial reporting, assessing the risk that a material weakness exists, and testing and evaluating the design and operating effectiveness of internal control based on the assessed risk. Our audits also included performing such other procedures as we considered necessary in the circumstances. We believe that our audits provide a reasonable basis for our opinions.
Definition and Limitations of Internal Control over Financial Reporting
A company’s internal control over financial reporting is a process designed to provide reasonable assurance regarding the reliability of financial reporting and the preparation of financial statements for external purposes in accordance with generally accepted accounting principles. A company’s internal control over financial reporting includes those policies and procedures that (1) pertain to the maintenance of records that, in reasonable detail, accurately and fairly reflect the transactions and dispositions of the assets of the company; (2) provide reasonable assurance that transactions are recorded as necessary to permit preparation of financial statements in accordance with generally accepted accounting principles, and that receipts and expenditures of the company are being made only in accordance with authorizations of management and directors of the company; and (3) provide reasonable assurance regarding prevention or timely detection of unauthorized acquisition, use, or disposition of the company’s assets that could have a material effect on the financial statements.
F-3
Because of the inherent limitations, internal control over financial reporting may not prevent or detect misstatements. Also, projections of any evaluation of future periods are subject to the risk that the controls may become inadequate because of changes in conditions, or that the degree of compliance with the policies or procedures may deteriorate.
/s/ DELOITTE & TOUCHE LLP
New York, New York
February 23, 2018
We have served as the Company’s auditor since 2003
F-4
COHEN & STEERS, INC. AND SUBSIDIARIES
CONSOLIDATED STATEMENTS OF FINANCIAL CONDITION
(in thousands, except share data)
December 31, 2017 | December 31, 2016 | ||||||
ASSETS | |||||||
Cash and cash equivalents | $ | 193,452 | $ | 183,234 | |||
Trading investments ($414 and $487) (1) ($68,101 and $6,987) (2) | 74,856 | 12,689 | |||||
Equity method investments | 6,176 | 6,459 | |||||
Available-for-sale investments | 27,074 | 35,396 | |||||
Accounts receivable | 53,854 | 46,288 | |||||
Due from brokers ($5,410 and $475) (2) | 6,429 | 1,579 | |||||
Property and equipment—net | 15,040 | 15,964 | |||||
Goodwill and intangible assets—net | 20,379 | 19,118 | |||||
Deferred income tax asset—net | 5,812 | 5,619 | |||||
Other assets ($931 and $43) (2) | 7,053 | 7,382 | |||||
Total assets | $ | 410,125 | $ | 333,728 | |||
LIABILITIES AND STOCKHOLDERS’ EQUITY | |||||||
Liabilities: | |||||||
Accrued compensation | $ | 41,370 | $ | 35,333 | |||
Distribution and service fees payable | 6,231 | 6,452 | |||||
Income tax payable | 19,892 | 9,375 | |||||
Due to brokers ($3,203 and $0) (2) | 3,282 | — | |||||
Deferred rent | 5,994 | 6,229 | |||||
Other liabilities and accrued expenses ($291 and $75) (2) | 10,025 | 9,672 | |||||
Total liabilities | 86,794 | 67,061 | |||||
Commitments and contingencies (see Note 13) | |||||||
Redeemable noncontrolling interest | 47,795 | 853 | |||||
Stockholders’ equity: | |||||||
Common stock, $0.01 par value; 500,000,000 shares authorized; 51,104,593 and 50,415,152 shares issued at December 31, 2017 and 2016, respectively | 511 | 504 | |||||
Additional paid-in capital | 570,486 | 543,829 | |||||
Accumulated deficit | (137,972 | ) | (127,957 | ) | |||
Accumulated other comprehensive income (loss), net of tax | (3,671 | ) | (5,885 | ) | |||
Less: Treasury stock, at cost, 4,789,608 and 4,524,694 shares at December 31, 2017 and 2016, respectively | (153,818 | ) | (144,677 | ) | |||
Total stockholders’ equity | 275,536 | 265,814 | |||||
Total liabilities and stockholders’ equity | $ | 410,125 | $ | 333,728 | |||
_________________________
(1) | Pledged as collateral attributable to the consolidated balances of Cohen & Steers Active Commodities Strategy Fund, Inc. as of December 31, 2017 and 2016, respectively. |
(2) | Asset and liability amounts in parentheses represent the aggregated balances at December 31, 2017 and 2016 attributable to Cohen & Steers SICAV Global Listed Infrastructure Fund, Cohen & Steers Co-Investment Partnership, L.P. and Cohen & Steers SICAV Global Preferred Securities Fund, which were variable interest entities as of December 31, 2017 and 2016, respectively. |
See notes to consolidated financial statements
F-5
COHEN & STEERS, INC. AND SUBSIDIARIES
CONSOLIDATED STATEMENTS OF OPERATIONS
(in thousands, except per share data)
Year Ended December 31, | |||||||||||
2017 | 2016 | 2015 | |||||||||
Revenue: | |||||||||||
Investment advisory and administration fees | $ | 346,832 | $ | 319,667 | $ | 303,729 | |||||
Distribution and service fees | 20,156 | 19,396 | 16,001 | ||||||||
Portfolio consulting and other | 11,206 | 10,813 | 8,925 | ||||||||
Total revenue | 378,194 | 349,876 | 328,655 | ||||||||
Expenses: | |||||||||||
Employee compensation and benefits | 124,076 | 115,607 | 107,710 | ||||||||
Distribution and service fees | 39,632 | 39,590 | 36,330 | ||||||||
General and administrative | 52,623 | 51,558 | 50,853 | ||||||||
Depreciation and amortization | 7,117 | 7,610 | 6,213 | ||||||||
Total expenses | 223,448 | 214,365 | 201,106 | ||||||||
Operating income | 154,746 | 135,511 | 127,549 | ||||||||
Non-operating income (loss): | |||||||||||
Interest and dividend income | 4,333 | 2,119 | 1,600 | ||||||||
Gain (loss) from trading investments—net | 1,915 | 218 | (2,376 | ) | |||||||
Equity in earnings (losses) of affiliates—net | (242 | ) | 3,324 | (10,378 | ) | ||||||
Gain (loss) from available-for-sale investments—net | 347 | 1,451 | (2,648 | ) | |||||||
Other gains (losses)—net | (699 | ) | 780 | (1,003 | ) | ||||||
Total non-operating income (loss) | 5,654 | 7,892 | (14,805 | ) | |||||||
Income before provision for income taxes | 160,400 | 143,403 | 112,744 | ||||||||
Provision for income taxes | 67,914 | 50,593 | 48,407 | ||||||||
Net income | 92,486 | 92,810 | 64,337 | ||||||||
Less: Net (income) loss attributable to redeemable noncontrolling interest | (547 | ) | 126 | 214 | |||||||
Net income attributable to common stockholders | $ | 91,939 | $ | 92,936 | $ | 64,551 | |||||
Earnings per share attributable to common stockholders: | |||||||||||
Basic | $ | 1.98 | $ | 2.02 | $ | 1.42 | |||||
Diluted | $ | 1.96 | $ | 2.00 | $ | 1.41 | |||||
Weighted average shares outstanding: | |||||||||||
Basic | 46,353 | 45,951 | 45,433 | ||||||||
Diluted | 46,979 | 46,432 | 45,897 | ||||||||
See notes to consolidated financial statements
F-6
COHEN & STEERS, INC. AND SUBSIDIARIES
CONSOLIDATED STATEMENTS OF COMPREHENSIVE INCOME
(in thousands)
Year Ended December 31, | |||||||||||
2017 | 2016 | 2015 | |||||||||
Net income | $ | 92,486 | $ | 92,810 | $ | 64,337 | |||||
Less: Net (income) loss attributable to redeemable noncontrolling interest | (547 | ) | 126 | 214 | |||||||
Net income attributable to common stockholders | 91,939 | 92,936 | 64,551 | ||||||||
Other comprehensive income (loss), net of tax: | |||||||||||
Foreign currency translation income (loss) | 2,064 | (2,937 | ) | (2,462 | ) | ||||||
Net unrealized gain (loss) from available-for-sale investments | 497 | 2,346 | (2,447 | ) | |||||||
Reclassification to statements of operations of realized (gain) loss from available-for-sale investments | (347 | ) | (1,451 | ) | 2,648 | ||||||
Other comprehensive income (loss) | 2,214 | (2,042 | ) | (2,261 | ) | ||||||
Total comprehensive income attributable to common stockholders | $ | 94,153 | $ | 90,894 | $ | 62,290 | |||||
See notes to consolidated financial statements
F-7
COHEN & STEERS, INC. AND SUBSIDIARIES
CONSOLIDATED STATEMENTS OF CHANGES IN STOCKHOLDERS’ EQUITY AND
REDEEMABLE NONCONTROLLING INTEREST
(in thousands)
Common Stock | Additional Paid-In Capital | Accumulated Deficit | Accumulated Other Comprehensive Income (Loss), Net of Tax | Treasury Stock | Total Stockholders’ Equity | Redeemable Noncontrolling Interest | Shares of Common Stock, Net | ||||||||||||||||||||||||
January 1, 2015 | $ | 486 | $ | 489,266 | $ | (142,786 | ) | $ | (1,582 | ) | $ | (117,403 | ) | $ | 227,981 | $ | 607 | 44,793 | |||||||||||||
Dividends ($1.50 per share) | — | — | (69,861 | ) | — | — | (69,861 | ) | — | — | |||||||||||||||||||||
Issuance of common stock | 11 | 623 | — | — | — | 634 | — | 1,097 | |||||||||||||||||||||||
Repurchase of common stock | — | — | — | — | (19,234 | ) | (19,234 | ) | — | (450 | ) | ||||||||||||||||||||
Tax benefits associated with restricted stock units—net | — | 5,262 | — | — | — | 5,262 | — | — | |||||||||||||||||||||||
Issuance of restricted stock units | — | 2,109 | — | — | — | 2,109 | — | — | |||||||||||||||||||||||
Amortization of restricted stock units—net | — | 22,566 | — | — | — | 22,566 | — | — | |||||||||||||||||||||||
Forfeitures of vested restricted stock units | — | 29 | — | — | — | 29 | — | — | |||||||||||||||||||||||
Net income (loss) | — | — | 64,551 | — | — | 64,551 | (214 | ) | — | ||||||||||||||||||||||
Other comprehensive income (loss), net of tax | — | — | — | (2,261 | ) | — | (2,261 | ) | — | — | |||||||||||||||||||||
Distributions to redeemable noncontrolling interest | — | — | — | — | — | — | (10 | ) | — | ||||||||||||||||||||||
Contributions from redeemable noncontrolling interest | — | — | — | — | — | — | 10,951 | — | |||||||||||||||||||||||
December 31, 2015 | $ | 497 | $ | 519,855 | $ | (148,096 | ) | $ | (3,843 | ) | $ | (136,637 | ) | $ | 231,776 | $ | 11,334 | 45,440 | |||||||||||||
Dividends ($1.54 per share) | — | — | (72,797 | ) | — | — | (72,797 | ) | — | — | |||||||||||||||||||||
Issuance of common stock | 7 | 749 | — | — | — | 756 | — | 724 | |||||||||||||||||||||||
Repurchase of common stock | — | — | — | — | (8,040 | ) | (8,040 | ) | — | (274 | ) | ||||||||||||||||||||
Tax benefits associated with restricted stock units—net | — | (758 | ) | — | — | — | (758 | ) | — | — | |||||||||||||||||||||
Issuance of restricted stock units | — | 2,457 | — | — | — | 2,457 | — | — | |||||||||||||||||||||||
Amortization of restricted stock units—net | — | 21,555 | — | — | — | 21,555 | — | — | |||||||||||||||||||||||
Forfeitures of restricted stock units | — | (29 | ) | — | — | — | (29 | ) | — | — | |||||||||||||||||||||
Net income (loss) | — | — | 92,936 | — | — | 92,936 | (126 | ) | — | ||||||||||||||||||||||
Other comprehensive income (loss), net of tax | — | — | — | (2,042 | ) | — | (2,042 | ) | — | — | |||||||||||||||||||||
Distributions to redeemable noncontrolling interest | — | — | — | — | — | — | (342 | ) | — | ||||||||||||||||||||||
Contributions from redeemable noncontrolling interest | — | — | — | — | — | — | 4,023 | — | |||||||||||||||||||||||
Transfer of redeemable noncontrolling interest in consolidated entity | — | — | — | — | — | — | (14,036 | ) | — | ||||||||||||||||||||||
December 31, 2016 | $ | 504 | $ | 543,829 | $ | (127,957 | ) | $ | (5,885 | ) | $ | (144,677 | ) | $ | 265,814 | $ | 853 | 45,890 | |||||||||||||
Dividends ($2.12 per share) | — | — | (101,669 | ) | — | — | (101,669 | ) | — | — | |||||||||||||||||||||
Issuance of common stock | 7 | 741 | — | — | — | 748 | — | 690 | |||||||||||||||||||||||
Repurchase of common stock | — | — | — | — | (9,141 | ) | (9,141 | ) | — | (265 | ) | ||||||||||||||||||||
Issuance of restricted stock units | — | 3,974 | — | — | — | 3,974 | — | — | |||||||||||||||||||||||
Amortization of restricted stock units—net | — | 22,042 | (285 | ) | — | — | 21,757 | — | — | ||||||||||||||||||||||
Forfeitures of restricted stock units | — | (100 | ) | — | — | — | (100 | ) | — | — | |||||||||||||||||||||
Net income (loss) | — | — | 91,939 | — | — | 91,939 | 547 | — | |||||||||||||||||||||||
Other comprehensive income (loss), net of tax | — | — | — | 2,214 | — | 2,214 | — | — | |||||||||||||||||||||||
Distributions to redeemable noncontrolling interest | — | — | — | — | — | — | (263 | ) | — | ||||||||||||||||||||||
Contributions from redeemable noncontrolling interest | — | — | — | — | — | — | 46,658 | — | |||||||||||||||||||||||
December 31, 2017 | $ | 511 | $ | 570,486 | $ | (137,972 | ) | $ | (3,671 | ) | $ | (153,818 | ) | $ | 275,536 | $ | 47,795 | 46,315 | |||||||||||||
See notes to consolidated financial statements
F-8
COHEN & STEERS, INC. AND SUBSIDIARIES
CONSOLIDATED STATEMENTS OF CASH FLOWS
(in thousands)
Year Ended December 31, | |||||||||||
2017 | 2016 | 2015 | |||||||||
Cash flows from operating activities: | |||||||||||
Net income | $ | 92,486 | $ | 92,810 | $ | 64,337 | |||||
Adjustments to reconcile net income to net cash provided by (used in) operating activities: | |||||||||||
Stock compensation expense | 21,769 | 21,649 | 22,686 | ||||||||
Depreciation and amortization | 7,117 | 7,610 | 6,213 | ||||||||
Deferred rent | (235 | ) | (139 | ) | 640 | ||||||
(Gain) loss from trading investments—net | (1,915 | ) | (218 | ) | 2,376 | ||||||
Equity in (earnings) losses of affiliates—net | 242 | (3,324 | ) | 10,378 | |||||||
(Gain) loss from available-for-sale investments—net | (347 | ) | (1,451 | ) | 2,648 | ||||||
Deferred income taxes | (314 | ) | (900 | ) | 7,392 | ||||||
Foreign currency (gain) loss | 47 | 1,684 | (443 | ) | |||||||
Changes in operating assets and liabilities: | |||||||||||
Accounts receivable | (7,613 | ) | (3,413 | ) | (724 | ) | |||||
Due from brokers | (4,850 | ) | (1,261 | ) | (4,299 | ) | |||||
Deferred commissions | (1,894 | ) | (3,909 | ) | (2,572 | ) | |||||
Trading investments | (60,252 | ) | (3,956 | ) | (30,036 | ) | |||||
Other assets | (576 | ) | (1,442 | ) | (1,266 | ) | |||||
Accrued compensation | 6,064 | 4,855 | 2,228 | ||||||||
Distribution and service fees payable | (221 | ) | 260 | (803 | ) | ||||||
Due to broker | 3,282 | 1,771 | 4,364 | ||||||||
Income tax payable | 10,517 | 2,110 | 5,231 | ||||||||
Other liabilities and accrued expenses | 946 | 2,222 | 1,446 | ||||||||
Net cash provided by (used in) operating activities | 64,253 | 114,958 | 89,796 | ||||||||
Cash flows from investing activities: | |||||||||||
Proceeds from redemptions of equity method investments | 41 | 363 | 1,184 | ||||||||
Purchases of available-for-sale investments | (16,901 | ) | (8,096 | ) | (5,663 | ) | |||||
Proceeds from sales of available-for-sale investments | 25,811 | 20,814 | 7,303 | ||||||||
Purchases of property and equipment | (3,242 | ) | (10,183 | ) | (2,427 | ) | |||||
Net cash provided by (used in) investing activities | 5,709 | 2,898 | 397 | ||||||||
Cash flows from financing activities: | |||||||||||
Excess tax benefits associated with restricted stock units | — | — | 4,822 | ||||||||
Issuance of common stock | 636 | 642 | 539 | ||||||||
Repurchase of common stock | (9,141 | ) | (8,040 | ) | (19,234 | ) | |||||
Dividends to stockholders | (98,313 | ) | (70,825 | ) | (68,177 | ) | |||||
Distributions to redeemable noncontrolling interest | (263 | ) | (342 | ) | (10 | ) | |||||
Contributions from redeemable noncontrolling interest | 46,658 | 4,023 | 10,951 | ||||||||
Net cash provided by (used in) financing activities | (60,423 | ) | (74,542 | ) | (71,109 | ) | |||||
Net increase (decrease) in cash and cash equivalents | 9,539 | 43,314 | 19,084 | ||||||||
Effect of foreign exchange rate changes on cash and cash equivalents | 679 | (2,808 | ) | (1,294 | ) | ||||||
Cash and cash equivalents, beginning of the year | 183,234 | 142,728 | 124,938 | ||||||||
Cash and cash equivalents, end of the year | $ | 193,452 | $ | 183,234 | $ | 142,728 | |||||
See notes to consolidated financial statements
F-9
COHEN & STEERS, INC. AND SUBSIDIARIES
CONSOLIDATED STATEMENTS OF CASH FLOWS—(Continued)
Supplemental disclosures of cash flow information:
For the years ended December 31, 2017, 2016 and 2015, the Company paid taxes, net of tax refunds, of approximately $57,726,000, $49,331,000 and $30,885,000, respectively.
Supplemental disclosures of non-cash investing and financing activities:
In connection with its stock incentive plan, the Company issued fully vested restricted stock units in the amount of $618,000, $486,000 and $425,000 for the years ended December 31, 2017, 2016 and 2015, respectively. For the years ended December 31, 2017, 2016 and 2015, the Company recorded restricted stock unit dividend equivalents, net of forfeitures, in the amount of $3,356,000, $1,972,000 and $1,684,000, respectively.
Effective March 1, 2016, the Company’s proportionate ownership interest in Cohen & Steers Low Duration Preferred and Income Fund, Inc. (LPX) decreased and the Company deconsolidated the assets and liabilities of LPX resulting in a non-cash reduction of approximately $14,036,000 from redeemable noncontrolling interest and a non-cash increase of $14,550,000 to equity method investments. Effective October 1, 2016, the Company’s proportionate ownership interest in LPX decreased and the Company recorded a non-cash reclassification of $15,045,000, from equity method investments into available-for-sale investments.
Effective June 1, 2016, the Company’s proportionate ownership interest in Cohen & Steers MLP & Energy Opportunity Fund, Inc. (MLO) decreased and the Company recorded a non-cash reclassification of $12,995,000, from equity method investments into available-for-sale investments.
F-10
COHEN & STEERS, INC. AND SUBSIDIARIES
NOTES TO CONSOLIDATED FINANCIAL STATEMENTS
1. Basis of Presentation
Cohen & Steers, Inc. (CNS) was organized as a Delaware corporation on March 17, 2004. CNS is the holding company for its direct and indirect subsidiaries, including Cohen & Steers Capital Management, Inc. (CSCM), Cohen & Steers Securities, LLC (CSS), Cohen & Steers Asia Limited (CSAL), Cohen & Steers UK Limited (CSUK) and Cohen & Steers Japan, LLC (collectively, the Company).
The Company is a global investment manager specializing in liquid real assets, including real estate securities, listed infrastructure, commodities and natural resource equities, as well as preferred securities and other income solutions. Founded in 1986, the Company is headquartered in New York City, with offices in London, Hong Kong, Tokyo and Seattle.
The consolidated financial statements have been prepared in accordance with accounting principles generally accepted in the United States of America (GAAP). The consolidated financial statements set forth herein include the accounts of CNS and its direct and indirect subsidiaries. Intercompany balances and transactions have been eliminated in consolidation.
2. Summary of Significant Accounting Policies
Recently Adopted Accounting Pronouncements—In March 2016, the Financial Accounting Standards Board (FASB) issued new guidance amending the current accounting for an investment that becomes qualified for the equity method of accounting. The guidance requires that the cost of acquiring an additional interest in the investment, if any, that resulted in it qualifying for the equity method be added to the carrying value of the investment. The equity method will then be applied from that point forward without any retroactive application or adjustment. This new guidance was effective for the Company’s first quarter of 2017. The adoption of this new guidance did not have a material impact on its consolidated financial statements and related disclosures.
In March 2016, the FASB issued new guidance which simplifies several aspects of the accounting for share-based payment transactions, including the accounting for income taxes, excess tax benefits, forfeitures and statutory tax withholding requirements, as well as classification in the statement of cash flows. The Company adopted this guidance on January 1, 2017. As a result, the Company reclassified $285,000 from additional paid-in capital to retained earnings on January 1, 2017. Prospectively beginning January 1, 2017, excess tax benefits or tax deficiencies are now reflected in the consolidated statements of operations as a component of the provision for income taxes. For the year ended December 31, 2017, the Company recognized $49,000 of excess tax benefits. Additionally, the consolidated statements of cash flows now reflect excess tax benefits from share-based payments as an operating activity, rather than a financing activity. Finally, the Company elected to account for forfeitures as they occur, rather than estimate expected forfeitures.
Accounting Estimates—The preparation of the consolidated financial statements in conformity with GAAP requires management to make certain estimates and assumptions that affect the reported amounts of assets and liabilities and the disclosures of contingent assets and liabilities at the dates of the consolidated financial statements and the reported amounts of revenue and expenses during the reporting periods. Management believes the estimates used in preparing the consolidated financial statements are reasonable and prudent. Actual results could differ from those estimates.
Consolidation of Company-sponsored Funds—Investments in Company-sponsored funds and management fees are evaluated at inception and thereafter, if there is a reconsideration event, in order to determine whether to apply the Variable Interest Entity (VIE) model or the Voting Interest Entity (VOE) model. In performing this analysis, all of the Company’s management fees are presumed to be commensurate and at market and are therefore not considered variable interests.
A VIE is an entity in which either (a) the equity investment at risk is not sufficient to permit the entity to finance its own activities without additional financial support or (b) the group of holders of the equity investment at risk lack certain characteristics of a controlling financial interest. The primary beneficiary is the entity that has (a) the power to direct the activities of the VIE that most significantly affect its performance and (b) the obligation to absorb losses of the entity or the right to receive benefits from the entity that could potentially be significant to the VIE. Investments and redemptions or amendments to the governing documents of the respective entities could affect an entity’s status as a VIE or the determination of the primary beneficiary. The Company assesses whether it is the primary beneficiary of any VIEs identified by evaluating
F-11
COHEN & STEERS, INC. AND SUBSIDIARIES
NOTES TO CONSOLIDATED FINANCIAL STATEMENTS—(Continued)
its economic interests in the entity held either directly by the Company and its affiliates or indirectly through employees. VIEs for which the Company is deemed to be the primary beneficiary are consolidated.
Investments in Company-sponsored funds that are determined to be VOEs are consolidated when the Company’s ownership interest is greater than 50% of the outstanding voting interests of the fund or when the Company is the general partner of the fund and the limited partners do not have substantive kick-out or participating rights in the fund.
The Company records noncontrolling interests in consolidated funds for which the Company’s ownership is less than 100%. See Note 4 for further discussion about the Company’s seed investments.
Cash and Cash Equivalents—Cash and cash equivalents are on deposit with three major financial institutions and consist of short-term, highly liquid investments, which are readily convertible into cash and have original maturities of three months or less.
Due from/to Brokers—The Company conducts business, primarily with respect to its consolidated seed investments, with brokers for certain of its investment activities. The clearing and custody operations for these investment activities are performed pursuant to contractual agreements. The due from/to brokers balance represents cash and cash equivalents balances at brokers/custodians and/or receivables and payables for unsettled securities transactions.
Investments—Management of the Company determines the appropriate classification of its investments at the time of purchase and re-evaluates such determination at each statement of financial condition date.
Investments classified as trading represent securities held within the affiliated funds that the Company consolidates and are measured at fair value based on quoted market prices, market prices obtained from independent pricing services engaged by management or as determined by management and approved by the Company’s valuation committee. Unrealized gains and losses are recorded as gain (loss) from trading investments—net in the Company’s consolidated statements of operations.
Investments classified as equity method investments represent seed investments in which the Company owns between 20-50% of the outstanding voting interests in the affiliated fund or when it is determined that the Company is able to exercise significant influence but not control over the investments. When using the equity method, the Company recognizes its respective share of the affiliated investee fund net income or loss for the period which is recorded as equity in earnings (losses) of affiliates—net in the Company’s consolidated statements of operations. As of December 31, 2017, the Company’s equity method investments consisted of interests in affiliated funds measured at fair value based on quoted market prices or NAV (or its equivalent) as a practical expedient and report a net asset value on a recurring basis. The carrying amounts of these investments approximate their fair value.
Investments classified as available-for-sale are comprised of equity securities, fixed income securities, investment-grade preferred instruments and investments in Company-sponsored open-end funds where the Company has neither control nor the ability to exercise significant influence. These investments are carried at fair value based on quoted market prices or market prices obtained from independent pricing services engaged by management, with unrealized gains and losses, net of tax, reported in accumulated other comprehensive income. The Company periodically reviews each individual security position that has an unrealized loss, or impairment, to determine if that impairment is other-than-temporary. If the Company believes an impairment of a security position is other than temporary, based on available quantitative and qualitative information as of the report date, the loss will be recognized as gain (loss) from available-for-sale investments—net in the Company’s consolidated statements of operations.
From time to time, the affiliated funds consolidated by the Company enter into derivative contracts to gain exposure to the underlying commodities markets or to hedge market and credit risks of the underlying portfolios utilizing options, total return swaps, credit default swaps and futures contracts. These instruments are measured at fair value based on their settlement price at the close of trading on the associated commodities exchange or board of trade with gains and losses recorded as gain (loss) from trading investments—net in the Company’s consolidated statements of operations. The fair values of these instruments are recorded in other assets or other liabilities and accrued expenses on the Company’s consolidated statements of financial condition. As of December 31, 2017, none of the outstanding derivative contracts were subject to a master netting agreement or other similar arrangement.
F-12
COHEN & STEERS, INC. AND SUBSIDIARIES
NOTES TO CONSOLIDATED FINANCIAL STATEMENTS—(Continued)
Additionally, from time to time, the Company enters into foreign exchange contracts to hedge its currency exposure related to certain client receivables. These instruments are measured at fair value with gains and losses recorded in other non-operating income (loss) in the Company’s consolidated statements of operations. The fair values of these contracts are recorded in other assets or other liabilities and accrued expenses on the Company’s consolidated statements of financial condition.
Goodwill and Intangible Assets—Goodwill represents the excess of the cost of the Company’s investment in the net assets of an acquired company over the fair value of the underlying identifiable net assets at the date of acquisition. Goodwill and indefinite-lived intangible assets are not amortized but are tested at least annually for impairment by comparing the fair value to their carrying amounts. Finite-lived intangible assets are amortized over their useful lives and are tested for impairment whenever events or changes in circumstances indicate that the carrying amount may not be recoverable. See Note 3 for further discussion about the Company’s goodwill and intangible assets.
Redeemable Noncontrolling Interest—Redeemable noncontrolling interest represents third-party interests in the Company’s consolidated funds. This interest is redeemable at the option of the investors and therefore is not treated as permanent equity. Redeemable noncontrolling interest is recorded at redemption value which approximates the fair value at each reporting period.
Investment Advisory and Administration Fees—The Company earns revenue by providing asset management services to institutional accounts and to Company-sponsored open-end and closed-end funds. Investment advisory fees are earned pursuant to the terms of investment management agreements and are based on a contractual fee rate applied to the assets in the portfolio. The Company also earns administration fees from certain Company-sponsored open-end and closed-end funds pursuant to the terms of underlying administration contracts. Administration fees are based on the average assets under management of such funds. Investment advisory and administration fee revenue is recognized when earned.
Distribution and Service Fee Revenue—Distribution and service fee revenue is based on the average daily net assets of certain share classes of the Company’s sponsored open-end funds distributed by CSS. Distribution and service fee revenue is earned daily and is generally recorded gross of any third-party distribution and service fee expense for applicable share classes.
Distribution and Service Fee Expense—Distribution and service fee expense includes distribution fees, shareholder servicing fees and intermediary assistance payments. Distribution and service fee expense is recorded on an accrual basis.
Distribution fee expense represents payments made to qualified intermediaries for (i) assistance in connection with the distribution of the Company’s sponsored open-end funds’ shares and (ii) for other expenses such as advertising costs and printing and distribution of prospectuses to investors. Such amounts may also be used to pay financial intermediaries for services as specified in the terms of written agreements complying with Rule 12b-1 of the Investment Company Act of 1940 (Rule 12b-1). The Company pays distribution fee expense based on the average daily net assets under management of certain share classes of certain of the funds.
Shareholder servicing fee expense represents payments made to qualified intermediaries for shareholder account service and maintenance. These services are provided pursuant to written agreements with such qualified institutions. The Company pays shareholder serving fee expense generally based on the average assets under management or the number of accounts being serviced.
Intermediary assistance payments represent payments to qualified intermediaries for activities related to distribution, shareholder servicing and marketing and support of Company-sponsored open-end funds and are incremental to those described above. Intermediary assistance payments are generally based on the average assets under management or the number of accounts being serviced.
Portfolio Consulting and Other—The Company earns portfolio consulting and other fees by (i) providing portfolio consulting services in connection with model-based strategy accounts, (ii) earning a licensing fee for the use of the Company’s proprietary indexes and (iii) providing portfolio monitoring services related to a number of unit investment trusts.
F-13
COHEN & STEERS, INC. AND SUBSIDIARIES
NOTES TO CONSOLIDATED FINANCIAL STATEMENTS—(Continued)
This revenue is earned pursuant to the terms of the underlying contract, and the fee schedules for these relationships vary based on the type of services the Company provides for each relationship. This revenue is recognized when earned.
Stock-based Compensation—The Company recognizes compensation expense for the grant-date fair value of awards of equity instruments to employees. This expense is recognized over the period during which employees are required to provide service. Forfeitures are recorded as incurred.
Income Taxes—The Company records the current and deferred tax consequences of all transactions that have been recognized in the consolidated financial statements in accordance with the provisions of the enacted tax laws. Deferred tax assets are recognized for temporary differences that will result in deductible amounts in future years at tax rates that are expected to apply in those years. Deferred tax liabilities are recognized for temporary differences that will result in taxable income in future years at tax rates that are expected to apply in those years. The Company records a valuation allowance, when necessary, to reduce deferred tax assets to an amount that more likely than not will be realized.
The calculation of tax liabilities involves dealing with uncertainties in the application of complex tax laws and regulations in a multitude of jurisdictions across the Company’s global operations. A tax benefit from an uncertain tax position may be recognized when it is more likely than not that the position will be sustained upon examination, including resolution of any related appeals or litigation processes, on the basis of the technical merits. The Company records potential interest and penalties related to uncertain tax positions in the provision for income taxes in the consolidated statements of operations.
Currency Translation and Transactions—Assets and liabilities of subsidiaries having non-U.S. dollar functional currencies are translated at exchange rates at the applicable consolidated statement of financial condition date. Revenue and expenses of such subsidiaries are translated at average exchange rates during the period. The gains or losses resulting from translating non-U.S. dollar functional currency into U.S. dollars are included in the Company’s consolidated statements of comprehensive income. The cumulative translation adjustment was $(4,781,000), $(6,845,000) and $(3,908,000) as of December 31, 2017, 2016 and 2015, respectively. Gains or losses resulting from non-U.S. dollar currency transactions are included in other non-operating income (loss) in the consolidated statements of operations.
Comprehensive Income—The Company reports all changes in comprehensive income in the consolidated statements of comprehensive income. Comprehensive income includes net income or loss attributable to common stockholders, as well as the net of tax amounts attributable to foreign currency translation gain (loss), unrealized gain (loss) from available-for-sale investments and the reclassification of realized gain (loss) from available-for-sale investments to the statements of operations.
Recently Issued Accounting Pronouncements—In February 2018, the FASB issued new guidance allowing entities to reclassify certain tax effects related to the enactment of the Tax Act from accumulated other comprehensive income (AOCI) to retained earnings. Prior to the issuance of the new guidance, a portion of the previously recognized deferred tax effects recorded in AOCI was “left stranded” in AOCI as the effect of remeasuring the deferred taxes using the reduced federal corporate income tax rate was required to be recorded through income. The new guidance allows these stranded tax effects to be reclassified from AOCI to retained earnings. The new guidance will be effective on January 1, 2019, with early adoption permitted and is to be applied either in the period of adoption or retrospectively to each period in which the effect of the change in the U.S. federal corporate income tax rate in the Tax Act is recognized. The Company is still assessing which adoption method it will choose but it does not expect either method to have a material effect on its consolidated financial statements and related disclosures.
In August 2017, the FASB issued new guidance amending the accounting for hedging activities. The new guidance (i) expands hedge accounting for nonfinancial and financial risk components and amends measurement methodologies to more closely align hedge accounting with an entity’s risk management activities, (ii) decreases the complexity of preparing and understanding hedge results through eliminating the separate measurement and reporting of hedge ineffectiveness, (iii) enhances transparency, comparability and understandability of hedge results through enhanced disclosures and changing the presentation of hedge results to align the effects of the hedging instrument and the hedged item and (iv) reduces the cost and complexity of applying hedge accounting by simplifying the manner in which assessments of hedge effectiveness may be
F-14
COHEN & STEERS, INC. AND SUBSIDIARIES
NOTES TO CONSOLIDATED FINANCIAL STATEMENTS—(Continued)
performed. The new guidance will be effective on January 1, 2019, with early adoption permitted. The Company is currently evaluating the potential effect of this new guidance on its consolidated financial statements and related disclosures.
In May 2017, the FASB issued new guidance for modification accounting related to share-based payment transactions in order to provide clarity and to reduce current diversity in practice. This new guidance does not fundamentally change the notion of a modification. Instead, the amendments clarify which changes to the terms or conditions of a share-based payment award require an entity to apply modification accounting. The amendments became effective on January 1, 2018 and must be applied prospectively to any awards modified on or after the adoption date. The adoption of the new guidance did not have a material effect on the Company’s consolidated financial statements and related disclosures.
In January 2017, the FASB issued guidance to simplify the goodwill impairment test by removing the requirement to perform a hypothetical purchase price allocation. A goodwill impairment will now be the amount by which a reporting unit’s carrying value exceeds its fair value, not to exceed the carrying amount of goodwill. This new guidance will be effective on January 1, 2020. The Company does not expect the adoption of the new guidance to have a material effect on its consolidated financial statements and related disclosures.
In August 2016, the FASB amended the current guidance on the classification of certain cash receipts and payments in the statement of cash flows. This guidance is intended to unify the currently diverse presentations and classifications, including debt prepayment or debt extinguishment costs, settlement of zero-coupon debt instruments or other debt instruments with coupon interest rates that are insignificant in relation to the effective interest rate of the borrowing, contingent consideration payments made after a business combination, proceeds from the settlement of insurance claims, proceeds from the settlement of corporate-owned life insurance policies, including bank-owned life insurance policies, distributions received from equity method investees, beneficial interests in securitization transactions, and separately identifiable cash flows and application of the predominance principle. The Company evaluated the eight issues and concluded that only distributions received from equity method investees is applicable to the Company. This amended guidance became effective on January 1, 2018 and was adopted retrospectively. The Company made an accounting policy election to use the Cumulative Earnings Approach when determining whether distributions received from equity method investments should be classified as either operating or investing activities within the Company’s consolidated statements of cash flows.
In February 2016, the FASB issued guidance introducing a new lease model which requires lessees to recognize leases on-balance sheet and disclose key information about leasing arrangements. The new guidance establishes a right-of-use model (ROU) that requires a lessee to recognize an ROU asset and lease liability on the balance sheet for all leases with a term longer than 12 months. Leases will be classified as finance or operating, with classification affecting the pattern and classification of expense recognition in the income statement. The new guidance also requires disclosures by lessees and lessors to enable users of financial statements to assess the amount, timing, and uncertainty of cash flows arising from leases. The new guidance is effective on January 1, 2019, with early adoption permitted. The Company expects to adopt the new guidance on its effective date. A modified retrospective transition approach is required for leases existing at, or entered into after, the beginning of the earliest comparative period presented in the financial statements, with certain practical expedients available. While the Company is continuing to assess the effect of adoption, it currently believes the most significant change relates to the recognition of new ROU assets and lease liabilities on its consolidated statements of financial condition for its office space and other operating leases. The Company does not expect a significant change in its leasing activity between now and adoption. The Company is still assessing which of the available practical expedients it plans to elect upon adoption.
F-15
COHEN & STEERS, INC. AND SUBSIDIARIES
NOTES TO CONSOLIDATED FINANCIAL STATEMENTS—(Continued)
In January 2016, the FASB issued new guidance amending the accounting for equity investments, financial liabilities under the fair value option, and the presentation and disclosure requirements for financial instruments. In addition, the FASB clarified guidance related to the valuation allowance assessment when recognizing deferred tax assets resulting from unrealized losses on available-for-sale debt securities. Upon adoption of this guidance, changes in the fair value of the Company’s available-for-sale equity investments will be reported through earnings rather than through other comprehensive income. This new guidance became effective on January 1, 2018 and required a cumulative-effect adjustment to beginning retained earnings in the amount of approximately $1,323,000, net of tax. Additionally, if the Company had applied the new guidance for the year ended December 31, 2017, approximately $250,000 of net unrealized gains recorded in other comprehensive income would have been recorded in non-operating income (loss) in the Company’s consolidated statement of operations.
In May 2014, the FASB issued new guidance which outlined a single comprehensive model for entities to use in accounting for revenue arising from contracts with customers. The core principle of the revenue model is that an entity recognizes revenue to depict the transfer of promised goods or services to customers in an amount that reflects the consideration to which the entity expects to be entitled in exchange for those goods or services. In March 2016, the FASB issued a revision which clarifies (a) determination of the appropriate unit of account under the revenue standard’s principal versus agent guidance and (b) application of the indicators of whether an entity is a principal or an agent in accordance with the revenue standard’s control principle. In April 2016, the FASB issued an amendment to provide more detailed guidance and examples related to (a) identifying performance obligations and (b) licenses of intellectual property. In May 2016, the FASB amended the standard to clarify the guidance on assessing collectibility, presenting sales taxes, measuring noncash consideration, and certain transition matters. This new guidance became effective for the Company’s first quarter of 2018 and was adopted retrospectively. The adoption of the new standard did not have a material impact on the timing of recognition for the majority of the Company’s revenue but will affect the presentation of certain costs on either a gross or net basis. In addition, the adoption of the new standard will require additional disclosures in 2018.
3. Goodwill and Intangible Assets
The following table summarizes the changes in the Company’s goodwill and intangible assets during the years ended December 31, 2017 and 2016 (in thousands):
Goodwill | Finite-Lived Intangible Assets | Indefinite-Lived Intangible Assets | |||||||||
Balance at January 1, 2016 | $ | 17,975 | $ | 273 | $ | 1,250 | |||||
Currency revaluation | (291 | ) | — | — | |||||||
Amortization | N/A | (89 | ) | N/A | |||||||
Balance at December 31, 2016 | $ | 17,684 | $ | 184 | $ | 1,250 | |||||
Currency revaluation | 1,350 | — | — | ||||||||
Amortization | N/A | (89 | ) | N/A | |||||||
Balance at December 31, 2017 | $ | 19,034 | $ | 95 | $ | 1,250 | |||||
F-16
COHEN & STEERS, INC. AND SUBSIDIARIES
NOTES TO CONSOLIDATED FINANCIAL STATEMENTS—(Continued)
The following table summarizes the Company’s intangible assets at December 31, 2017 and 2016 (in thousands):
Remaining Amortization Period (in months) | Gross Carrying Amount | Accumulated Amortization | Intangible Assets, Net | ||||||||||
2017 | |||||||||||||
Amortized intangible assets: | |||||||||||||
Client relationships | 12 | $ | 1,543 | $ | (1,448 | ) | $ | 95 | |||||
Non-amortized intangible assets: | |||||||||||||
Mutual fund management contracts | — | 1,250 | — | 1,250 | |||||||||
Total | $ | 2,793 | $ | (1,448 | ) | $ | 1,345 | ||||||
2016 | |||||||||||||
Amortized intangible assets: | |||||||||||||
Client relationships | 24 | $ | 1,543 | $ | (1,359 | ) | $ | 184 | |||||
Non-amortized intangible assets: | |||||||||||||
Mutual fund management contracts | — | 1,250 | — | 1,250 | |||||||||
Total | $ | 2,793 | $ | (1,359 | ) | $ | 1,434 | ||||||
Amortization expense related to the intangible assets was approximately $89,000 for each of the years ended December 31, 2017, 2016 and 2015, respectively. The remaining future amortization expense is summarized in the table below (in thousands):
Period Ending December 31, | Remaining Amortization Expense | ||
2018 | $ | 95 | |
4. Investments
The following table summarizes the Company’s investments as of December 31, 2017 and 2016 (in thousands):
December 31, | |||||||
2017 | 2016 | ||||||
Trading investments | $ | 74,856 | $ | 12,689 | |||
Equity method investments | 6,176 | 6,459 | |||||
Available-for-sale investments | 27,074 | 35,396 | |||||
F-17
COHEN & STEERS, INC. AND SUBSIDIARIES
NOTES TO CONSOLIDATED FINANCIAL STATEMENTS—(Continued)
Gain (loss) from seed investments for the years ended December 31, 2017, 2016 and 2015 is summarized in the table below (in thousands):
Year Ended December 31, | |||||||||||
2017 | 2016 | 2015 | |||||||||
Gain (loss) from trading investments—net (1) | $ | 1,915 | $ | 218 | $ | (2,376 | ) | ||||
Equity in earnings (losses) of affiliates—net | (242 | ) | 3,324 | (10,378 | ) | ||||||
Gain (loss) from available-for-sale investments—net | 347 | 1,451 | (2,648 | ) | |||||||
Number of new funds seeded | 2 | — | 2 | ||||||||
_________________________
(1) Includes net income (loss) attributable to redeemable noncontrolling interest for the periods presented.
Voting Interest Entities
The Cohen & Steers Funds ICAV (ICAV), an Irish alternative investment fund (AIF), and the Cohen & Steers Active Commodities Fund (Commodities Sub-Fund), a sub-fund within the ICAV, were launched by the Company in January 2017, and meet the definition of an investment company. The Company is the investment adviser of the Commodities Sub-Fund for which it receives a management fee. The ICAV and the Commodities Sub-Fund are each a VOE and the Company’s ownership interest in the ICAV is less than 20%; therefore, the Company classifies its investment in the Commodities Sub-Fund as an available-for-sale investment.
The Cohen & Steers Low Duration Preferred and Income Fund, Inc. (LPX), launched by the Company in December 2015, is an open-end fund for which the Company is the investment adviser. LPX is a VOE and the Company owned the majority of the outstanding voting interests through February 29, 2016. Accordingly, the underlying assets and liabilities and results of operations of LPX had been included in the Company’s consolidated financial statements with the third-party interests classified as redeemable noncontrolling interest. As a result of additional third-party subscriptions into the fund, effective March 1, 2016, the Company no longer owned the majority of the outstanding voting interest in LPX; however, it was determined that the Company had significant influence over the financial decisions of LPX and therefore classified its investment in LPX using the equity method of accounting. Effective October 1, 2016, the Company’s ownership interest in LPX fell below 20% and the Company no longer had significant influence over LPX. Accordingly, the Company began classifying its investment in LPX as an available-for-sale investment until the second quarter of 2017, when the Company sold its remaining interest in LPX.
The Cohen & Steers Active Commodities Strategy Fund, Inc. (CDF), launched by the Company in May 2014, is an open-end fund for which the Company is the investment adviser. CDF is a VOE and the Company owned the majority of the outstanding voting interests in the fund as of December 31, 2017. Accordingly, the underlying assets and liabilities and results of operations of CDF have been included in the Company’s consolidated financial statements with the third-party interests classified as redeemable noncontrolling interest.
The Cohen & Steers Active Commodities Fund, LP (ACOM), launched by the Company in April 2013, is structured as a partnership. The Company is the investment adviser of ACOM for which it is entitled to receive a management fee. The limited partners of ACOM, unaffiliated with the Company, have the ability to liquidate the fund with a majority vote. As a result, the Company does not have financial control and ACOM is a VOE. The Company’s equity interest in ACOM represents a seed investment to launch the fund, adjusted for the Company’s proportionate share of the fund’s earnings. As of December 31, 2017, the Company’s ownership in ACOM was approximately 12%; however, as the general partner, the Company has significant influence over the financial decisions of ACOM and therefore classifies its investment in ACOM using the equity method of accounting.
F-18
COHEN & STEERS, INC. AND SUBSIDIARIES
NOTES TO CONSOLIDATED FINANCIAL STATEMENTS—(Continued)
The Cohen & Steers MLP & Energy Opportunity Fund, Inc. (MLO), launched by the Company in December 2013, is an open-end fund for which the Company is the investment adviser. MLO is a VOE. Effective November 1, 2014, as a result of its ownership interest, it was determined that the Company had significant influence over the financial decisions of MLO and therefore classified its investment in MLO using the equity method of accounting. Effective June 1, 2016, the Company’s ownership interest in MLO fell below 20% and the Company no longer had significant influence over MLO. Accordingly, the Company began classifying its investment in MLO as an available-for-sale investment.
Cohen & Steers Real Assets Fund, Inc. (RAP), launched by the Company in January 2012, is an open-end fund for which the Company is the investment adviser. RAP is a VOE. The Company classified its investment in RAP as an available-for-sale investment until the fourth quarter of 2016 when the Company sold its remaining interest in RAP.
Variable Interest Entities
The Cohen & Steers SICAV Global Preferred Securities Fund (SICAV Preferred), a Luxembourg-domiciled undertaking for collective investments in transferable securities (UCITS), was launched by the Company in May 2017 and meets the definition of an investment company. The Company is the investment adviser of SICAV Preferred for which it receives a management fee. SICAV Preferred is a VIE and the Company is the primary beneficiary. As of December 31, 2017, the Company’s ownership interest in SICAV Preferred was approximately 26%. Accordingly, the underlying assets and liabilities and results of operations of SICAV Preferred have been included in the Company’s consolidated financial statements with the third-party interests classified as redeemable noncontrolling interest.
The Cohen & Steers SICAV Global Listed Infrastructure Fund (GLI SICAV), a Luxembourg-domiciled UCITS, was launched by the Company in September 2015 and meets the definition of an investment company. The Company is the investment adviser of GLI SICAV for which it receives a management fee. GLI SICAV is a VIE and the Company is the primary beneficiary. As of December 31, 2017, the Company was the only investor in the fund and therefore, the Company would absorb all of the expected losses and residual returns of GLI SICAV. Accordingly, the underlying assets and liabilities and results of operations of GLI SICAV have been included in the Company’s consolidated financial statements.
Cohen & Steers Global Realty Partners III-TE, L.P. (GRP-TE), which had its closing in October 2011, is structured as a partnership. The Company is the general partner and investment adviser of GRP-TE, for which it receives a management fee and is entitled to receive an incentive distribution, if earned. GRP-TE is a VIE and the Company is not the primary beneficiary. The Company’s equity interest in GRP-TE represents a seed investment to launch the fund, adjusted for the Company’s proportionate share of the fund’s earnings. As of December 31, 2017, the Company’s ownership in GRP-TE was approximately 0.2%; however, as the general partner, the Company has significant influence over the financial decisions of GRP-TE and therefore classifies its investment using the equity method of accounting. The Company’s risk with respect to its investment in GRP-TE is limited to its equity ownership and any uncollected management fees.
In conjunction with the launch of GRP-TE, the Company established Cohen & Steers Co-Investment Partnership, L.P. (GRP-CIP), which is used by the Company to fulfill its contractual commitment to co-invest with GRP-TE. See Note 11 for further discussion regarding the Company’s co-investment commitment. GRP-CIP is a VIE and the Company is the primary beneficiary as it owns all of the voting interest in GRP-CIP. Accordingly, the underlying assets and liabilities and results of operations of GRP-CIP have been included in the Company’s consolidated financial statements.
F-19
COHEN & STEERS, INC. AND SUBSIDIARIES
NOTES TO CONSOLIDATED FINANCIAL STATEMENTS—(Continued)
The following table represents the portion of the consolidated statements of financial condition attributable to the consolidated VIEs as of December 31, 2017 and 2016. The assets may only be used to settle obligations of each VIE and the liabilities are the sole obligation of each VIE, for which creditors do not have recourse to the general credit of the Company (in thousands):
December 31, 2017 | December 31, 2016 | ||||||||||||||||||||||||||
GLI SICAV | GRP-CIP | SICAV Preferred | Total | GLI SICAV | GRP-CIP | Total | |||||||||||||||||||||
Assets: | |||||||||||||||||||||||||||
Trading investments | $ | 5,961 | $ | 1,330 | $ | 60,810 | $ | 68,101 | $ | 5,069 | $ | 1,918 | $ | 6,987 | |||||||||||||
Due from broker | 285 | 202 | 4,923 | 5,410 | 181 | 294 | 475 | ||||||||||||||||||||
Other assets | 32 | — | 899 | 931 | 43 | — | 43 | ||||||||||||||||||||
Total assets | $ | 6,278 | $ | 1,532 | $ | 66,632 | $ | 74,442 | $ | 5,293 | $ | 2,212 | $ | 7,505 | |||||||||||||
Liabilities: | |||||||||||||||||||||||||||
Due to broker | $ | 35 | $ | — | $ | 3,168 | $ | 3,203 | $ | — | $ | — | $ | — | |||||||||||||
Other liabilities and accrued expenses | 87 | 5 | 199 | 291 | 70 | 5 | 75 | ||||||||||||||||||||
Total liabilities | $ | 122 | $ | 5 | $ | 3,367 | $ | 3,494 | $ | 70 | $ | 5 | $ | 75 | |||||||||||||
The following table summarizes the fair value of trading investments and equity method investments as of December 31, 2017 and 2016 (in thousands):
December 31, 2017 | December 31, 2016 | ||||||||||||||
Trading Investments | Equity Method Investments | Trading Investments | Equity Method Investments | ||||||||||||
Voting Interest Entities | |||||||||||||||
ACOM | $ | — | $ | 6,115 | $ | — | $ | 6,371 | |||||||
CDF | 6,755 | — | 5,702 | — | |||||||||||
Variable Interest Entities | |||||||||||||||
GLI SICAV | 5,961 | — | 5,069 | — | |||||||||||
GRP-CIP | 1,330 | — | 1,918 | — | |||||||||||
GRP-TE | — | 61 | — | 88 | |||||||||||
SICAV Preferred | 60,810 | — | — | — | |||||||||||
Total | $ | 74,856 | $ | 6,176 | $ | 12,689 | $ | 6,459 | |||||||
F-20
COHEN & STEERS, INC. AND SUBSIDIARIES
NOTES TO CONSOLIDATED FINANCIAL STATEMENTS—(Continued)
Gain (loss) from trading investments—net for the years ended December 31, 2017, 2016 and 2015, which represent realized and unrealized gains and losses recorded by the funds the Company consolidates, are summarized in the table below (in thousands):
Year Ended December 31, | |||||||||||
2017 | 2016 | 2015 | |||||||||
Voting Interest Entities | |||||||||||
CDF | $ | (417 | ) | $ | 839 | $ | (2,167 | ) | |||
LPX | — | (769 | ) | 6 | |||||||
Variable Interest Entities | |||||||||||
GLI SICAV | 904 | 297 | (135 | ) | |||||||
GRP-CIP | 309 | (149 | ) | (80 | ) | ||||||
SICAV Preferred | 1,119 | — | — | ||||||||
Gain (loss) from trading investments—net | $ | 1,915 | $ | 218 | $ | (2,376 | ) | ||||
Equity in earnings (losses) of affiliates—net for the years ended December 31, 2017, 2016 and 2015 are summarized in the table below (in thousands):
Year Ended December 31, | |||||||||||
2017 | 2016 | 2015 | |||||||||
Voting Interest Entities | |||||||||||
ACOM | $ | (256 | ) | $ | 748 | $ | (1,988 | ) | |||
LPX | — | 852 | — | ||||||||
MLO | — | 1,737 | (8,397 | ) | |||||||
Variable Interest Entities | |||||||||||
GRP-TE | 14 | (13 | ) | 7 | |||||||
Equity in earnings (losses) of affiliates—net | $ | (242 | ) | $ | 3,324 | $ | (10,378 | ) | |||
The following tables summarize the cost, gross unrealized gains, gross unrealized losses and fair value of available-for-sale investments as of December 31, 2017 and 2016 (in thousands):
December 31, 2017 | |||||||||||||||
Cost | Gross Unrealized Gains | Gross Unrealized Losses (1) | Fair Value | ||||||||||||
Common stocks | $ | 6,782 | $ | 639 | $ | (183 | ) | $ | 7,238 | ||||||
Company-sponsored funds | 13,376 | 1,269 | (13 | ) | 14,632 | ||||||||||
Fixed income securities | 3,966 | 15 | (20 | ) | 3,961 | ||||||||||
Preferred securities | 1,100 | 29 | (5 | ) | 1,124 | ||||||||||
Other | 100 | 19 | — | 119 | |||||||||||
Total available-for-sale investments | $ | 25,324 | $ | 1,971 | $ | (221 | ) | $ | 27,074 | ||||||
_________________________
(1) At December 31, 2017, there were no securities with material unrealized losses continuously for a period of more than 12 months.
F-21
COHEN & STEERS, INC. AND SUBSIDIARIES
NOTES TO CONSOLIDATED FINANCIAL STATEMENTS—(Continued)
December 31, 2016 | |||||||||||||||
Cost | Gross Unrealized Gains | Gross Unrealized Losses (1) | Fair Value | ||||||||||||
Common stocks | $ | 4,639 | $ | 194 | $ | (325 | ) | $ | 4,508 | ||||||
Company-sponsored funds | 28,232 | 1,755 | (110 | ) | 29,877 | ||||||||||
Preferred securities | 1,020 | 13 | (22 | ) | 1,011 | ||||||||||
Total available-for-sale investments | $ | 33,891 | $ | 1,962 | $ | (457 | ) | $ | 35,396 | ||||||
_________________________
(1) At December 31, 2016, there were no securities with material unrealized losses continuously for a period of more than 12 months.
Available-for-sale investments with a fair value of approximately $6,086,000 and $18,521,000 at December 31, 2017 and 2016, respectively, were in an unrealized loss position.
As of December 31, 2017 and 2016, unrealized losses on available-for-sale investments were generally caused by changes in market conditions. When evaluating whether an unrealized loss on an available-for-sale investment is other than temporary, the Company reviews such factors as the extent and duration of the loss as well as qualitative and quantitative information about the financial condition and near-term prospects of the issuers.
As of December 31, 2017 and 2016, the Company determined that it had the ability and intent to hold the remaining available-for-sale investments for which no other-than-temporary impairment has occurred until a recovery of fair value. Accordingly, impairments of these investments were considered temporary.
Sales proceeds, gross realized gains and gross realized losses from available-for-sale investments for the years ended December 31, 2017, 2016 and 2015 are summarized in the table below (in thousands):
Year Ended December 31, | ||||||||||||
2017 | 2016 | 2015 | ||||||||||
Proceeds from sales | $ | 25,812 | $ | 20,823 | $ | 7,298 | ||||||
Gross realized gains | 714 | 1,879 | 759 | |||||||||
Gross realized losses | (367 | ) | (428 | ) | (3,407 | ) | (1) | |||||
_________________________
(1) Includes other-than-temporary impairment charge of $2,846,000 related to the Company’s seed investment in RAP.
5. Fair Value
Accounting Standards Codification Topic 820, Fair Value Measurement (ASC 820) specifies a hierarchy of valuation classifications based on whether the inputs to the valuation techniques used in each valuation classification are observable or unobservable. These classifications are summarized in the three broad levels listed below:
• | Level 1—Unadjusted quoted prices for identical instruments in active markets. |
• | Level 2—Quoted prices for similar instruments in active markets; quoted prices for identical or similar instruments in markets that are not active; and model-derived valuations in which all significant inputs and significant value drivers are observable. |
• | Level 3—Valuations derived from valuation techniques in which significant inputs or significant value drivers are unobservable. |
Inputs used to measure fair value might fall in different levels of the fair value hierarchy, in which case the Company defaults to the lowest level input that is significant to the fair value measurement in its entirety. These levels are not necessarily an indication of the risk or liquidity associated with the investments. In determining the appropriate levels, the Company performed a detailed analysis of the assets and liabilities that are subject to ASC 820. Transfers among levels, if
F-22
COHEN & STEERS, INC. AND SUBSIDIARIES
NOTES TO CONSOLIDATED FINANCIAL STATEMENTS—(Continued)
any, are recorded as of the beginning of the reporting period. There were no transfers between level 1 and level 2 during the year ended December 31, 2017.
The following table presents fair value measurements as of December 31, 2017 (in thousands):
Level 1 | Level 2 | Level 3 | Investments Measured at NAV (2) | Total | |||||||||||||||
Cash equivalents (1) | $ | 173,270 | $ | — | $ | — | $ | — | $ | 173,270 | |||||||||
Trading investments | |||||||||||||||||||
Common stocks | $ | 5,961 | $ | — | $ | — | $ | — | $ | 5,961 | |||||||||
Fixed income securities | — | 6,755 | — | — | 6,755 | ||||||||||||||
Limited partnership interests | — | — | 605 | 725 | 1,330 | ||||||||||||||
Preferred securities | 7,658 | 53,152 | — | — | 60,810 | ||||||||||||||
Total trading investments | $ | 13,619 | $ | 59,907 | $ | 605 | $ | 725 | $ | 74,856 | |||||||||
Equity method investments | $ | — | $ | — | $ | — | $ | 6,176 | $ | 6,176 | |||||||||
Available-for-sale investments | |||||||||||||||||||
Common stocks | $ | 7,238 | $ | — | $ | — | $ | — | 7,238 | ||||||||||
Company-sponsored funds | 14,632 | — | — | — | 14,632 | ||||||||||||||
Fixed income securities | — | 3,961 | — | — | 3,961 | ||||||||||||||
Preferred securities | 999 | 125 | — | — | 1,124 | ||||||||||||||
Other | — | — | — | 119 | 119 | ||||||||||||||
Total available-for-sale investments | $ | 22,869 | $ | 4,086 | $ | — | $ | 119 | $ | 27,074 | |||||||||
Derivatives - assets | |||||||||||||||||||
Commodity contracts | $ | 487 | $ | — | $ | — | $ | — | $ | 487 | |||||||||
Foreign exchange contracts | — | — | — | — | — | ||||||||||||||
Total derivatives - assets | $ | 487 | $ | — | $ | — | $ | — | $ | 487 | |||||||||
Derivatives - liabilities | |||||||||||||||||||
Commodity contracts | $ | 286 | $ | — | $ | — | $ | — | $ | 286 | |||||||||
Foreign exchange contracts | — | 64 | — | — | 64 | ||||||||||||||
Total derivatives - liabilities | $ | 286 | $ | 64 | $ | — | $ | — | $ | 350 | |||||||||
_________________________
(1) | Comprised of investments in actively traded U.S. Treasury money market funds measured at NAV. |
(2) | Comprised of certain investments measured at fair value using NAV (or its equivalent) as a practical expedient. These investments have not been classified in the fair value hierarchy. The fair value amounts presented in this table are intended to permit reconciliation of the fair value hierarchy to the amounts presented on the consolidated statement of financial position. |
Trading investments in fixed income securities classified as level 2 in the above table were comprised of U.S. Treasury Bills carried at amortized cost, which approximates fair value. Trading investments in preferred securities classified as level 2 were comprised of corporate debt and certain preferred securities. The fair value amounts were generally determined using third-party pricing services. The pricing services may utilize evaluated pricing models that vary by asset class and incorporate available trade, bid and other market information. Since these securities do not trade on a daily basis, the pricing services evaluate pricing applications and apply available information through processes such as yield curves, benchmarking of like securities, sector groupings, and matrix pricing, to prepare evaluations.
Trading investments classified as level 3 in the above table were comprised of limited partnership interests which represent the Company’s co-investments through GRP-CIP in limited partnership vehicles that invest in private equity vehicles that invest directly in real estate which was valued using a contractual selling price.
F-23
COHEN & STEERS, INC. AND SUBSIDIARIES
NOTES TO CONSOLIDATED FINANCIAL STATEMENTS—(Continued)
Trading investments classified as investments measured at NAV (or its equivalent) as a practical expedient in the above table were comprised of limited partnership interests which represent the Company’s co-investments through GRP-CIP in limited partnership vehicles that invest in non-registered real estate funds, which are valued based on the NAVs of the underlying funds. As of December 31, 2017, the Company did not have the ability to redeem these interests.
Equity method investments classified as investments measured at NAV (or its equivalent) as a practical expedient in the above table were comprised of the Company’s partnership interests in ACOM and GRP-TE, which approximate their fair value based on the funds’ NAVs. ACOM invests indirectly in exchange-traded commodity futures contracts and other commodity-related derivatives through an investment in the Commodities Sub-Fund. The Company has the ability to redeem its investment in ACOM monthly at NAV with prior written notice of 5 days and there are no significant restrictions to redemption. GRP-TE invests in non-registered real estate funds and in private equity vehicles that invest directly in real estate. As of December 31, 2017, the Company did not have the ability to redeem its investment in GRP-TE.
Available-for-sale investments classified as level 2 in the above table were primarily comprised of corporate bonds and certain preferred securities whose fair values are generally determined using third-party pricing services. The pricing services may utilize pricing models, and inputs into those models may include reported trades, executable bid and ask prices, broker-dealer quotations, prices or yields of similar securities, benchmark curves and other market information. The pricing services may use a matrix approach, which considers information regarding securities with similar characteristics to determine the valuation for a security.
Available-for-sale investments classified as investments measured at NAV (or its equivalent) as a practical expedient in the above table were comprised of the Company’s co-investment in a Cayman trust invested in global listed infrastructure securities.
The following table presents fair value measurements as of December 31, 2016 (in thousands):
Level 1 | Level 2 | Level 3 | Investments Measured at NAV (2) | Total | |||||||||||||||
Cash equivalents (1) | $ | 140,872 | $ | — | $ | — | $ | — | $ | 140,872 | |||||||||
Trading investments | |||||||||||||||||||
Common stocks | $ | 5,069 | $ | — | $ | — | $ | — | $ | 5,069 | |||||||||
Fixed income securities | — | 5,702 | — | — | 5,702 | ||||||||||||||
Limited partnership interests | — | — | 1,196 | 722 | 1,918 | ||||||||||||||
Total trading investments | $ | 5,069 | $ | 5,702 | $ | 1,196 | $ | 722 | $ | 12,689 | |||||||||
Equity method investments | $ | — | $ | — | $ | — | $ | 6,459 | $ | 6,459 | |||||||||
Available-for-sale investments | |||||||||||||||||||
Common stocks | $ | 4,508 | $ | — | $ | — | $ | — | $ | 4,508 | |||||||||
Company-sponsored funds | 29,877 | — | — | — | 29,877 | ||||||||||||||
Preferred securities | 1,001 | 10 | — | — | 1,011 | ||||||||||||||
Total available-for-sale investments | $ | 35,386 | $ | 10 | $ | — | $ | — | $ | 35,396 | |||||||||
Derivatives - assets | |||||||||||||||||||
Commodity contracts | $ | 343 | $ | — | $ | — | $ | — | $ | 343 | |||||||||
Foreign exchange contracts | — | 1,417 | — | — | 1,417 | ||||||||||||||
Total derivatives - assets | $ | 343 | $ | 1,417 | $ | — | $ | — | $ | 1,760 | |||||||||
Derivatives - liabilities | |||||||||||||||||||
Commodity contracts | $ | 266 | $ | — | $ | — | $ | — | $ | 266 | |||||||||
Total derivatives - liabilities | $ | 266 | $ | — | $ | — | $ | — | $ | 266 | |||||||||
_________________________
(1) | Comprised of investments in actively traded U.S. Treasury money market funds measured at NAV. |
F-24
COHEN & STEERS, INC. AND SUBSIDIARIES
NOTES TO CONSOLIDATED FINANCIAL STATEMENTS—(Continued)
(2) | Comprised of certain investments measured at fair value using NAV (or its equivalent) as a practical expedient. These investments have not been classified in the fair value hierarchy. The fair value amounts presented in this table are intended to permit reconciliation of the fair value hierarchy to the amounts presented on the consolidated statement of financial position. |
Trading investments classified as level 2 in the above table were comprised of U.S. Treasury Bills carried at amortized cost, which approximates fair value.
Trading investments classified as level 3 in the above table were comprised of limited partnership interests which represent the Company’s co-investments through GRP-CIP in limited partnership vehicles that invest in private equity vehicles that invest directly in real estate which are generally valued using a discounted cash flow model.
Trading investments classified as investments measured at NAV (or its equivalent) as a practical expedient in the above table were comprised of limited partnership interests which represent the Company’s co-investments through GRP-CIP in limited partnership vehicles that invest in non-registered real estate funds, which are valued based on the NAVs of the underlying funds. As of December 31, 2016, the Company did not have the ability to redeem these interests.
Equity method investments classified as investments measured at NAV (or its equivalent) as a practical expedient in the above table were comprised of the Company’s partnership interests in ACOM and GRP-TE, which approximate their fair value based on the funds’ NAVs. ACOM invested directly in exchange-traded commodity futures contracts and other commodity-related derivatives. The Company has the ability to redeem its investment in ACOM monthly at NAV with prior written notice of 5 days and there are no significant restrictions to redemption. GRP-TE invests in non-registered real estate funds and in private equity vehicles that invest directly in real estate. As of December 31, 2016, the Company did not have the ability to redeem its investment in GRP-TE.
The following table summarizes the changes in level 3 investments measured at fair value on a recurring basis for the years ended December 31, 2017 and 2016 (in thousands):
Trading Investments | |||
Limited Partnership Interests | |||
Balance at January 1, 2016 | $ | 1,312 | |
Purchases / contributions | 51 | ||
Sales / distributions | (53 | ) | |
Realized gains | — | ||
Unrealized gains (losses) (1) | (114 | ) | |
Transfers into (out of) level 3 | — | ||
Balance at December 31, 2016 | $ | 1,196 | |
Purchases / contributions | 419 | ||
Sales / distributions | (1,291 | ) | |
Realized gains | 162 | ||
Unrealized gains (losses) (1) | 119 | ||
Transfers into (out of) level 3 | — | ||
Balance at December 31, 2017 | $ | 605 | |
_________________________
(1) | Pertains to unrealized gains (losses) from securities held at December 31, 2017 and 2016. |
Realized and unrealized gains (losses) from investments classified as trading investments in the above tables were recorded as gain (loss) from trading investments—net in the Company’s consolidated statements of operations.
F-25
COHEN & STEERS, INC. AND SUBSIDIARIES
NOTES TO CONSOLIDATED FINANCIAL STATEMENTS—(Continued)
Valuation Techniques
In certain instances, debt, equity and preferred securities are valued on the basis of prices from an orderly transaction between market participants provided by reputable broker-dealers or independent pricing services. In determining the value of a particular investment, independent pricing services may use information with respect to transactions in such investments, broker quotes, pricing matrices, market transactions in comparable investments and various relationships between investments. As part of its independent price verification process, the Company generally performs reviews of valuations provided by broker-dealers or independent pricing services. Investments in Company-sponsored funds are valued at their closing price or NAV (or its equivalent) as a practical expedient.
Foreign exchange contracts are valued by interpolating a value using the spot foreign exchange rate and forward points (based on the spot rate and currency rate differentials), which are all inputs that are observable in active markets (level 2).
In the absence of observable market prices, the Company values its investments using valuation methodologies applied on a consistent basis. For some investments, little market activity may exist; management’s determination of fair value is then based on the best information available in the circumstances, and may incorporate management’s own assumptions and involves a significant degree of judgment, taking into consideration a combination of internal and external factors. Such investments are valued on a quarterly basis, taking into consideration any changes in key inputs and changes in economic and other relevant conditions, and valuation models are updated accordingly. The valuation process also includes a review by the Company’s valuation committee which is comprised of senior members from various departments within the Company, including investment management. The valuation committee provides independent oversight of the valuation policies and procedures.
As of December 31, 2017, the valuation technique used in the fair value measurement of the Company’s level 3 investment, limited partnership interests - direct investment in real estate, of approximately $605,000 was based on a contractual selling price.
The valuation techniques and significant unobservable inputs used in the fair value measurement of the following level 3 investments as of December 31, 2016 were:
Fair Value (in thousands) | Fair Value Methodology | Significant Unobservable Inputs | Input / Range | ||||||
Limited partnership interests - direct investments in real estate | $ | 1,196 | Discounted cash flows | Discount rates Exit capitalization rates Market rental rates | 11% - 12.5% 8% - 8.5% $14.00 - 17.00 psf | ||||
Changes in the significant unobservable inputs in the above tables may result in a materially higher or lower fair value measurement.
6. Derivatives
The following tables summarize the notional and fair value of the derivative financial instruments. The notional amount represents the absolute value amount of all outstanding derivative contracts as of December 31, 2017 and 2016 (in thousands):
December 31, 2017 | |||||||||||||||
Assets | Liabilities | ||||||||||||||
Notional | Fair Value | Notional | Fair Value | ||||||||||||
Total foreign exchange contracts | $ | — | $ | — | $ | 12,279 | $ | 64 | |||||||
Total commodity contracts | 8,939 | 487 | 6,876 | 286 | |||||||||||
Total derivatives | $ | 8,939 | $ | 487 | $ | 19,155 | $ | 350 | |||||||
F-26
COHEN & STEERS, INC. AND SUBSIDIARIES
NOTES TO CONSOLIDATED FINANCIAL STATEMENTS—(Continued)
December 31, 2016 | |||||||||||||||
Assets | Liabilities | ||||||||||||||
Notional | Fair Value | Notional | Fair Value | ||||||||||||
Total foreign exchange contracts | $ | 13,839 | $ | 1,417 | $ | — | $ | — | |||||||
Total commodity contracts | 6,538 | 343 | 4,825 | 266 | |||||||||||
Total derivatives | $ | 20,377 | $ | 1,760 | $ | 4,825 | $ | 266 | |||||||
Securities included in trading investments on the consolidated statement of financial condition of approximately $414,000 and $487,000 as of December 31, 2017 and 2016, respectively, were held as collateral for futures contracts.
Gains and losses from derivative financial instruments for the years ended December 31, 2017, 2016 and 2015 are summarized in the table below (in thousands):
Year Ended December 31, | |||||||||||
2017 | 2016 | 2015 | |||||||||
Foreign exchange contracts | $ | (1,481 | ) | $ | 1,626 | $ | (702 | ) | |||
Commodity contracts | (438 | ) | 835 | (2,167 | ) | ||||||
Total derivatives | $ | (1,919 | ) | $ | 2,461 | $ | (2,869 | ) | |||
7. Property and Equipment
The following table summarizes the Company’s property and equipment as of December 31, 2017 and 2016 (in thousands):
December 31, | |||||||
2017 | 2016 | ||||||
Equipment | $ | 7,503 | $ | 6,969 | |||
Furniture and fixtures | 3,598 | 3,505 | |||||
Software | 21,173 | 18,467 | |||||
Leasehold improvements | 16,017 | 16,031 | |||||
Subtotal | 48,291 | 44,972 | |||||
Less: Accumulated depreciation and amortization | (33,251 | ) | (29,008 | ) | |||
Property and equipment, net | $ | 15,040 | $ | 15,964 | |||
Depreciation and amortization expense related to property and equipment was $4,229,000, $4,155,000 and $3,827,000 for the years ended December 31, 2017, 2016 and 2015, respectively.
Depreciation and amortization expense related to property and equipment is recorded using the straight-line method over the estimated useful lives of the related assets which range from 3-7 years. Leasehold improvements are amortized using the straight-line method over the lease term.
8. Earnings Per Share
Basic earnings per share is calculated by dividing net income attributable to common stockholders by the weighted average shares outstanding. Diluted earnings per share is calculated using the treasury stock method by dividing net income attributable to common stockholders by the total weighted average shares of common stock outstanding and common stock equivalents. Common stock equivalents are comprised of dilutive potential shares from restricted stock unit awards and are excluded from the computation if their effect is anti-dilutive.
There were no anti-dilutive common stock equivalents for the year ended December 31, 2017. Anti-dilutive common stock equivalents of approximately 14,000 and 43,000 shares were excluded from the computation for the years ended December 31, 2016 and 2015, respectively.
F-27
COHEN & STEERS, INC. AND SUBSIDIARIES
NOTES TO CONSOLIDATED FINANCIAL STATEMENTS—(Continued)
The following table is a reconciliation of the income and share data used in the basic and diluted earnings per share computations for the years ended December 31, 2017, 2016 and 2015 (in thousands, except per share data):
Year Ended December 31, | |||||||||||
2017 | 2016 | 2015 | |||||||||
Net income | $ | 92,486 | $ | 92,810 | $ | 64,337 | |||||
Less: Net (income) loss attributable to redeemable noncontrolling interest | (547 | ) | 126 | 214 | |||||||
Net income attributable to common stockholders | $ | 91,939 | $ | 92,936 | $ | 64,551 | |||||
Basic weighted average shares outstanding | 46,353 | 45,951 | 45,433 | ||||||||
Dilutive potential shares from restricted stock units | 626 | 481 | 464 | ||||||||
Diluted weighted average shares outstanding | 46,979 | 46,432 | 45,897 | ||||||||
Basic earnings per share attributable to common stockholders | $ | 1.98 | $ | 2.02 | $ | 1.42 | |||||
Diluted earnings per share attributable to common stockholders | $ | 1.96 | $ | 2.00 | $ | 1.41 | |||||
9. Stock-Based Compensation
Amended and Restated Stock Incentive Plan
The Amended and Restated Cohen & Steers, Inc. Stock Incentive Plan (the SIP) provides for the issuance of Restricted Stock Units (RSUs), stock options and other stock-based awards for a period of up to ten years to eligible employees and directors. A total of 20.0 million shares of common stock may be granted under the SIP. At December 31, 2017, RSUs with respect to approximately 14.9 million shares of common stock had been issued under the SIP. Total compensation cost related to unvested RSUs not yet recognized was approximately $36,092,000 at December 31, 2017 and is expected to be recognized over approximately the next three years. In January 2018, the Company granted approximately 0.7 million restricted stock units under the SIP with a grant date fair value of $29,274,000 which vest over a four year period.
Restricted Stock Units
Vested Restricted Stock Unit Grants
The Company granted awards of vested RSUs to the non-management directors of the Company pursuant to the SIP. The directors are entitled to receive delivery of the underlying common stock on the third anniversary of the date of grant. Dividends declared during the delayed delivery period are paid to the directors in cash. From time to time, the Company grants awards of vested RSUs to certain employees pursuant to the SIP. These grants are generally delivered ratably over four years. At December 31, 2017, vested RSUs with respect to approximately 42,000 shares of common stock were outstanding pursuant to these grants. In connection with the grant of these vested RSUs to employees, the Company recorded non-cash stock-based compensation expense of approximately $618,000, $486,000 and $425,000 for the years ended December 31, 2017, 2016 and 2015, respectively.
F-28
COHEN & STEERS, INC. AND SUBSIDIARIES
NOTES TO CONSOLIDATED FINANCIAL STATEMENTS—(Continued)
The following table sets forth activity relating to the Company’s awards of vested RSUs under the SIP to the non-management directors and certain employees (share data in thousands):
Number of Shares | Weighted Average Grant Date Fair Value | |||||
Balance at January 1, 2015 | 28 | $ | 34.93 | |||
Granted | 12 | 35.31 | ||||
Delivered | (10 | ) | 31.86 | |||
Balance at December 31, 2015 | 30 | 36.17 | ||||
Granted | 13 | 37.17 | ||||
Delivered | (9 | ) | 34.02 | |||
Balance at December 31, 2016 | 34 | 37.15 | ||||
Granted | 16 | 38.14 | ||||
Delivered | (8 | ) | 40.03 | |||
Balance at December 31, 2017 | 42 | 36.98 | ||||
Unvested Restricted Stock Unit Grants
The Company grants awards of unvested RSUs to certain employees pursuant to the SIP. The fair value at the date of grant is expensed on a straight-line basis over the applicable service periods. Dividend equivalents are accrued on unvested RSUs for all dividends declared by the Company and are forfeitable until they are delivered. The dividend equivalents will generally vest and be delivered on the fourth anniversary of the original grant date. At December 31, 2017, RSUs with respect to approximately 318,000 shares of common stock were outstanding pursuant to these grants. Amortization expense related to the unearned stock-based compensation, net of forfeitures, was approximately $3,957,000, $4,685,000 and $5,233,000 for the years ended December 31, 2017, 2016 and 2015, respectively.
The following table sets forth activity relating to the Company’s awards of unvested RSUs under the SIP to certain employees (share data in thousands):
Number of Shares | Weighted Average Grant Date Fair Value | |||||
Balance at January 1, 2015 | 690 | $ | 26.72 | |||
Granted | 73 | 41.10 | ||||
Delivered | (461 | ) | 26.95 | |||
Forfeited | (6 | ) | 40.52 | |||
Balance at December 31, 2015 | 296 | 36.36 | ||||
Granted | 159 | 30.31 | ||||
Delivered | (147 | ) | 35.52 | |||
Forfeited | (1 | ) | 42.09 | |||
Balance at December 31, 2016 | 307 | 33.62 | ||||
Granted | 151 | 35.45 | ||||
Delivered | (140 | ) | 34.41 | |||
Balance at December 31, 2017 | 318 | 34.14 | ||||
Incentive Bonus Plans for Employees of the Company
The Company has implemented a program for employees which, based upon compensation levels, automatically allocates a portion of their year-end bonuses in the form of unvested RSUs (Mandatory Program). Dividend equivalents are accrued on unvested RSUs for all dividends declared by the Company and are forfeitable until they are delivered. The RSUs under the Mandatory Program will vest and be delivered ratably over four years and the dividend equivalents will generally
F-29
COHEN & STEERS, INC. AND SUBSIDIARIES
NOTES TO CONSOLIDATED FINANCIAL STATEMENTS—(Continued)
vest and be delivered on the fourth anniversary of the original grant date. The fair value at the date of grant of the RSUs under the Mandatory Program is expensed on a straight-line basis over the vesting period.
As of December 31, 2017, approximately 1,550,000 RSUs under the Mandatory Program including dividend equivalents were outstanding. Amortization expense, net of forfeitures, related to the unearned stock-based compensation under the Mandatory Program, was approximately $17,175,000, $16,847,000 and $17,315,000 for the years ended December 31, 2017, 2016 and 2015, respectively.
The following table sets forth activity relating to the Company’s incentive bonus plans, including dividend equivalents (share data in thousands):
Number of Shares | Weighted Average Grant Date Fair Value | |||||
Balance at January 1, 2015 | 1,454 | $ | 34.04 | |||
Granted | 496 | 41.45 | ||||
Delivered | (607 | ) | 32.69 | |||
Forfeited | (61 | ) | 38.51 | |||
Balance at December 31, 2015 | 1,282 | 37.33 | ||||
Granted | 722 | 30.02 | ||||
Delivered | (548 | ) | 35.86 | |||
Forfeited | (57 | ) | 35.14 | |||
Balance at December 31, 2016 | 1,399 | 34.22 | ||||
Granted | 714 | 35.36 | ||||
Delivered | (523 | ) | 34.80 | |||
Forfeited | (40 | ) | 33.87 | |||
Balance at December 31, 2017 | 1,550 | 34.60 | ||||
Employee Stock Purchase Plan
Pursuant to the Amended and Restated Employee Stock Purchase Plan (ESPP), the Company allows eligible employees, as defined in the ESPP, to purchase common stock at a 15% discount from fair market value with a maximum of $25,000 in annual aggregate purchases by any one individual. The number of shares of common stock authorized for purchase by eligible employees is 600,000. For the years ended December 31, 2017, 2016 and 2015, approximately 18,000, 19,000 and 19,000 shares, respectively, were purchased by eligible employees through the ESPP. For the years ended December 31, 2017, 2016 and 2015, the Company recorded a non-cash stock-based compensation expense of approximately $112,000, $114,000 and $95,000, respectively, which represents the discount on the shares issued pursuant to this plan. The ESPP will terminate upon the earliest to occur of (1) termination of the ESPP by the board of directors or (2) issuance of all of the shares reserved for issuance under the ESPP. The board of directors is authorized to increase the number of shares available for issuance under ESPP.
F-30
COHEN & STEERS, INC. AND SUBSIDIARIES
NOTES TO CONSOLIDATED FINANCIAL STATEMENTS—(Continued)
10. 401(k) and Profit-Sharing Plan
The Company sponsors a profit-sharing plan (the Plan) covering all employees who meet certain age and service requirements. Subject to limitations, the Plan permits participants to defer up to 100% of their eligible compensation pursuant to Section 401(k) of the Internal Revenue Code. Employee contributions are matched by the Company at $0.50 per $1.00 deferred. The Plan also allows the Company to make discretionary contributions, which are integrated with the taxable wage base under the Social Security Act. No discretionary contributions were made for the years ended December 31, 2017, 2016 and 2015.
Forfeitures occur when participants terminate employment before becoming entitled to their full benefits under the Plan. Forfeited amounts are used to reduce the Company’s contributions to the Plan or to pay Plan expenses. Forfeitures for the years ended December 31, 2017, 2016 and 2015 totaled approximately $128,000, $126,000 and $118,000, respectively.
Matching contributions, net of forfeitures, to the Plan for the years ended December 31, 2017, 2016 and 2015 totaled approximately $1,715,000, $1,464,000 and $1,511,000, respectively.
11. Related Party Transactions
The Company is an investment adviser to, and has administration agreements with, affiliated funds for which certain employees are officers and/or directors. The following table sets forth the amount of revenue the Company earned from these affiliated funds for the years ended December 31, 2017, 2016 and 2015 (in thousands):
Year Ended December 31, | |||||||||||
2017 | 2016 | 2015 | |||||||||
Investment advisory and administration fees | $ | 245,232 | $ | 227,184 | $ | 218,942 | |||||
Distribution and service fees | 20,156 | 19,396 | 16,001 | ||||||||
$ | 265,388 | $ | 246,580 | $ | 234,943 | ||||||
Sales proceeds, gross realized gains, gross realized losses and dividend income from available-for-sale investments in Company-sponsored funds for the years ended December 31, 2017, 2016 and 2015 are summarized in the table below (in thousands):
Year Ended December 31, | |||||||||||
2017 | 2016 | 2015 | |||||||||
Proceeds from sales | $ | 15,105 | $ | 13,251 | $ | — | |||||
Gross realized gains | 80 | 1,159 | — | ||||||||
Gross realized losses, including other-than-temporary impairment | — | — | (2,846 | ) | |||||||
Dividend income | 675 | 787 | 250 | ||||||||
The Company has agreements with certain affiliated open-end and closed-end funds to reimburse certain fund expenses. For the years ended December 31, 2017, 2016 and 2015, expenses of approximately $10,403,000, $8,568,000 and $8,676,000, respectively, were incurred by the Company pursuant to these agreements and are included in general and administrative expenses.
Included in accounts receivable at December 31, 2017 and 2016 are receivables due from Company-sponsored funds of approximately $23,666,000 and $20,221,000, respectively.
F-31
COHEN & STEERS, INC. AND SUBSIDIARIES
NOTES TO CONSOLIDATED FINANCIAL STATEMENTS—(Continued)
12. Regulatory Requirements
CSS, a registered broker-dealer in the U.S., is subject to the SEC’s Uniform Net Capital Rule 15c3-1 (the Rule), which requires that broker-dealers maintain a minimum level of net capital, as prescribed by the Rule. As of December 31, 2017, CSS had net capital of approximately $3,530,000, which exceeded its requirements by approximately $3,271,000. The Rule also provides that equity capital may not be withdrawn or cash dividends paid if the resulting net capital of a broker-dealer is less than the amount required under the Rule and requires prior notice to the SEC for certain withdrawals of capital.
CSS does not carry customer accounts and is exempt from SEC Rule 15c3-3 pursuant to provisions (k)(1) and (k)(2)(i) of such rule.
CSAL and CSUK are regulated outside the U.S. by the Hong Kong Securities and Futures Commission and the United Kingdom Financial Conduct Authority, respectively. As of December 31, 2017, CSAL and CSUK had aggregate regulatory capital of approximately $63,235,000, which exceeded aggregate regulatory capital requirements by approximately $58,641,000.
13. Commitments and Contingencies
The Company leases office space under noncancelable operating leases expiring at various dates through March 2024. The Company also leases certain information technology applications, market data and office equipment under noncancelable operating leases expiring at various dates through July 2020. The aggregate minimum future payments under the leases are as follows (in thousands):
Year Ending December 31, | Operating Leases | ||
2018 | $ | 13,897 | |
2019 | 13,473 | ||
2020 | 11,966 | ||
2021 | 10,863 | ||
2022 | 10,863 | ||
Thereafter | 11,828 | ||
$ | 72,890 | ||
Rent expense charged to operations, including escalation charges for real estate taxes and other expenses, totaled approximately $11,811,000, $11,535,000 and $11,215,000 for the years ended December 31, 2017, 2016 and 2015, respectively.
From time to time, the Company is involved in legal matters relating to claims arising in the ordinary course of business. There are currently no such matters pending that the Company believes could have a material adverse effect on its consolidated results of operations, cash flows or financial position.
The Company periodically commits to fund a portion of the equity in certain of its sponsored investment products. The Company has committed to co-invest up to $5.1 million alongside GRP-TE, a portion of which is made through GRP-TE and the remainder of which is made through GRP-CIP for up to 12 years through the life of GRP-TE. As of December 31, 2017, the Company has funded approximately $3.8 million with respect to this commitment. The actual timing for funding the unfunded portion of this commitment is currently unknown, as the drawdown of the Company’s unfunded commitment is contingent on the timing of drawdowns by the underlying funds and co-investments in which GRP-TE invests. The unfunded commitment was not recorded on the Company’s consolidated statements of financial condition as of December 31, 2017.
F-32
COHEN & STEERS, INC. AND SUBSIDIARIES
NOTES TO CONSOLIDATED FINANCIAL STATEMENTS—(Continued)
14. Income Taxes
On December 22, 2017, the Tax Cuts and Jobs Act (the Tax Act) was enacted. The Tax Act, among other things, imposed a one-time tax on deemed repatriated accumulated earnings and profits of the Company’s foreign subsidiaries, moves from the current system of worldwide taxation to a territorial system and reduced the statutory corporate tax rate to 21%. As a result of these changes, in the fourth quarter of 2017, the Company recorded a transition tax attributable to the shift in tax regimes and also remeasured its deferred and other tax balances using enacted tax rates which will be in effect when such items are expected to reverse. Tax charges in connection with the enactment of the Tax Act may change due to, among other things, additional guidance that may be issued by the U.S. Department of the Treasury with respect to the Tax Act and revisions to the Company’s assumptions as further information and interpretations become available.
The provision for income taxes for the years ended December 31, 2017, 2016 and 2015 included U.S. federal, state, local and foreign taxes. The effective tax rate for the year ended December 31, 2017 was approximately 42.5%, which differed from the U.S. federal statutory rate primarily due to tax charges of approximately $8.4 million related to the transition tax on the deemed repatriation of foreign earnings and profits and approximately $4.3 million related to the remeasurement of deferred and other tax balances, partially offset by the release of certain tax reserves and other tax-related items aggregating to approximately $4.6 million. The effective tax rate for the year ended December 31, 2016 was approximately 35.3%, which differed from the U.S. federal statutory rate primarily due to the release of a valuation allowance associated with unrealized gains on the Company’s seed investments. The effective tax rate was approximately 42.9% for the year ended December 31, 2015.
The $8.4 million transition tax liability is payable over eight years starting in March 2019. The table below summarizes the Company’s future commitments:
Year Ending December 31, | Transition Tax Liability | ||
2019 | $ | 675 | |
2020 | 675 | ||
2021 | 675 | ||
2022 | 675 | ||
2023 | 675 | ||
2024 | 1,265 | ||
2025 | 1,686 | ||
2026 | 2,106 | ||
$ | 8,432 | ||
F-33
COHEN & STEERS, INC. AND SUBSIDIARIES
NOTES TO CONSOLIDATED FINANCIAL STATEMENTS—(Continued)
The income before provision for income taxes and provision for income taxes for the years ended December 31, 2017, 2016 and 2015 are as follows (in thousands):
Year Ended December 31, | |||||||||||
2017 | 2016 | 2015 | |||||||||
Income before provision for income taxes - U.S. | $ | 149,338 | $ | 132,882 | $ | 101,007 | |||||
Income before provision for income taxes - Non-U.S. | 11,062 | 10,521 | 11,737 | ||||||||
Total income before provision for income taxes | $ | 160,400 | $ | 143,403 | $ | 112,744 | |||||
Current taxes: | |||||||||||
U.S. federal | $ | 58,082 | $ | 42,056 | $ | 32,065 | |||||
State and local | 8,155 | 7,423 | 6,442 | ||||||||
Non-U.S. | 1,991 | 2,014 | 2,508 | ||||||||
68,228 | 51,493 | 41,015 | |||||||||
Deferred taxes: | |||||||||||
U.S. federal | (428 | ) | (743 | ) | 6,334 | ||||||
State and local | (412 | ) | (86 | ) | 1,273 | ||||||
Non-U.S. | 526 | (71 | ) | (215 | ) | ||||||
(314 | ) | (900 | ) | 7,392 | |||||||
Provision for income taxes | $ | 67,914 | $ | 50,593 | $ | 48,407 | |||||
Deferred income taxes, which have been remeasured to reflect the lower statutory corporate tax rate resulting from the Tax Act, represent the tax effects of the temporary differences between book and tax bases and are measured using enacted tax rates that will be in effect when such items are expected to reverse. The Company records a valuation allowance, when necessary, to reduce deferred tax assets to an amount that more likely than not will be realized.
Significant components of the Company’s net deferred income tax asset at December 31, 2017 and 2016 consist of the following (in thousands):
At December 31, | |||||||
2017 | 2016 | ||||||
Deferred income tax assets (liabilities): | |||||||
Stock-based compensation | $ | 5,437 | $ | 7,797 | |||
Non-deductible realized losses on investments | 1,030 | 2,685 | |||||
Dividend equivalents on unvested restricted stock units | 1,715 | 2,686 | |||||
Net unrealized losses on investments | 2,359 | 4,101 | |||||
Deferred compensation | (1,325 | ) | (4,528 | ) | |||
Deferred rent | 1,488 | 2,407 | |||||
Other | (996 | ) | (2,743 | ) | |||
Subtotal | 9,708 | 12,405 | |||||
Less: valuation allowance | (3,896 | ) | (6,786 | ) | |||
Deferred income tax asset—net | $ | 5,812 | $ | 5,619 | |||
The Company had capital loss carryforwards of approximately $4,181,000 and $6,959,000 for the years ended December 31, 2017 and 2016 which, if unused, will expire in years 2018 to 2021. The valuation allowance on the net deferred income tax asset decreased approximately $2,890,000 during the year ended December 31, 2017.
At December 31, 2017, the Company had approximately $12,406,000 of total gross unrecognized tax benefits. Of this total, approximately $9,532,000 (net of the federal benefit on state issues) represents the amount of unrecognized tax benefits that, if recognized, would favorably affect the Company’s effective tax rate in future periods. The Company believes it is
F-34
COHEN & STEERS, INC. AND SUBSIDIARIES
NOTES TO CONSOLIDATED FINANCIAL STATEMENTS—(Continued)
reasonably possible that it will reduce its unrecognized tax benefits by $1,975,000 within the next twelve months due to the lapse of the statute of limitations on certain positions.
A reconciliation of the beginning and ending amount of gross unrecognized tax benefits is as follows (in thousands):
Liability for Unrecognized Tax Benefits | |||
Gross unrecognized tax benefits balance at January 1, 2015 | $ | 6,346 | |
Addition for tax positions of current year | 1,147 | ||
Addition for tax positions of prior years | 250 | ||
Reduction of tax positions from prior years | (484 | ) | |
Gross unrecognized tax benefits balance at December 31, 2015 | $ | 7,259 | |
Addition for tax positions of current year | 1,437 | ||
Addition for tax positions of prior years | 163 | ||
Reduction of tax positions from prior years | (1,007 | ) | |
Gross unrecognized tax benefits balance at December 31, 2016 | $ | 7,852 | |
Addition for tax positions of current year | 1,724 | ||
Addition for tax positions of prior years | 6,624 | ||
Reduction of tax positions from prior years | (3,794 | ) | |
Gross unrecognized tax benefits balance at December 31, 2017 | $ | 12,406 | |
The Company records potential interest and penalties related to uncertain tax positions in the provision for income taxes. At December 31, 2017 and 2016, the Company had approximately $1,933,000 and $2,250,000, respectively, in potential interest and penalties associated with uncertain tax positions.
The tax years 2011 through 2017 remain open to examination by various taxing jurisdictions.
A reconciliation of the Company’s statutory federal income tax rate and the effective tax rate for the years ended December 31, 2017, 2016 and 2015 is as follows:
Year Ended December 31, | ||||||||
2017 | 2016 | 2015 | ||||||
U.S. statutory tax rate | 35.0 | % | 35.0 | % | 35.0 | % | ||
Tax Act | 8.0 | % | — | % | — | % | ||
State and local income taxes, net of federal income taxes | 3.1 | % | 3.5 | % | 4.3 | % | ||
Non-deductible losses on investments | 0.2 | % | 1.3 | % | 5.2 | % | ||
Reserve adjustments | (1.9 | )% | (0.2 | )% | — | % | ||
Non-taxable gains on investments | (0.2 | )% | (3.0 | )% | — | % | ||
Foreign operations tax differential | (1.4 | )% | (1.1 | )% | (2.1 | )% | ||
Other | (0.3 | )% | (0.2 | )% | 0.5 | % | ||
Effective income tax rate | 42.5 | % | 35.3 | % | 42.9 | % | ||
F-35
COHEN & STEERS, INC. AND SUBSIDIARIES
NOTES TO CONSOLIDATED FINANCIAL STATEMENTS—(Continued)
15. Concentration of Credit Risk
The Company’s cash and cash equivalents are principally on deposit with three major financial institutions. The Company is subject to credit risk should these financial institutions be unable to fulfill their obligations.
The following affiliated funds and third-party institutional separate account subadvisory relationship, which is comprised of multiple accounts, provided 10% or more of the total revenue of the Company (in thousands):
Year Ended December 31, | |||||||||||
2017 | 2016 | 2015 | |||||||||
Cohen & Steers Realty Shares, Inc. (CSR): | |||||||||||
Investment advisory and administration fees | $ | 38,392 | $ | 45,047 | $ | 47,870 | |||||
Percent of total revenue | 10 | % | 13 | % | 15 | % | |||||
Cohen & Steers Preferred Securities and Income Fund, Inc. (CPX): | |||||||||||
Investment advisory and administration fees | $ | 54,523 | $ | 43,797 | $ | 29,212 | |||||
Percent of total revenue | 14 | % | 13 | % | 9 | % | |||||
Daiwa Asset Management: | |||||||||||
Investment advisory fees | $ | 37,756 | $ | 39,377 | $ | 37,653 | |||||
Portfolio consulting and other | 3,035 | 2,930 | 2,793 | ||||||||
Total | $ | 40,791 | $ | 42,307 | $ | 40,446 | |||||
Percent of total revenue | 11 | % | 12 | % | 12 | % | |||||
The table below presents revenue by client domicile for the years ended December 31, 2017, 2016 and 2015 (in thousands):
Year Ended December 31, | |||||||||||
2017 | 2016 | 2015 | |||||||||
North America | $ | 313,408 | $ | 285,896 | $ | 269,766 | |||||
Japan | 42,303 | 43,458 | 41,899 | ||||||||
Asia excluding Japan | 11,496 | 9,852 | 6,624 | ||||||||
Europe | 10,987 | 10,670 | 10,366 | ||||||||
Total | $ | 378,194 | $ | 349,876 | $ | 328,655 | |||||
F-36
COHEN & STEERS, INC. AND SUBSIDIARIES
NOTES TO CONSOLIDATED FINANCIAL STATEMENTS—(Continued)
16. Selected Quarterly Financial Data (unaudited)
The table below presents selected quarterly financial data for 2017 and 2016 (in thousands, except per share data):
Quarter | |||||||||||||||
1st | 2nd | 3rd | 4th | Total | |||||||||||
2017 | |||||||||||||||
Revenue | $ | 89,686 | $ | 92,812 | $ | 96,354 | $ | 99,342 | $ | 378,194 | |||||
Operating income | 35,528 | 37,357 | 40,973 | 40,888 | 154,746 | ||||||||||
Net income attributable to common stockholders | 22,985 | 23,474 | 25,082 | 20,398 | 91,939 | ||||||||||
Earnings per share attributable to common stockholders: | |||||||||||||||
Basic | 0.50 | 0.51 | 0.54 | 0.44 | 1.98 | ||||||||||
Diluted | 0.49 | 0.50 | 0.53 | 0.43 | 1.96 | ||||||||||
Weighted-average shares outstanding: | |||||||||||||||
Basic | 46,243 | 46,373 | 46,386 | 46,407 | 46,353 | ||||||||||
Diluted | 46,603 | 46,902 | 47,047 | 47,300 | 46,979 | ||||||||||
2016 | |||||||||||||||
Revenue | $ | 79,681 | $ | 86,373 | $ | 94,388 | $ | 89,434 | $ | 349,876 | |||||
Operating income | 28,307 | 34,131 | 37,213 | 35,860 | 135,511 | ||||||||||
Net income attributable to common stockholders | 18,083 | 24,808 | 23,877 | 26,168 | 92,936 | ||||||||||
Earnings per share attributable to common stockholders: | |||||||||||||||
Basic | 0.39 | 0.54 | 0.52 | 0.57 | 2.02 | ||||||||||
Diluted | 0.39 | 0.53 | 0.51 | 0.56 | 2.00 | ||||||||||
Weighted-average shares outstanding: | |||||||||||||||
Basic | 45,808 | 45,984 | 45,999 | 46,010 | 45,951 | ||||||||||
Diluted | 46,195 | 46,378 | 46,544 | 46,609 | 46,432 | ||||||||||
17. Subsequent Events
The Company has evaluated the need for disclosures and/or adjustments resulting from subsequent events through the date the consolidated financial statements were issued. Other than the items described below, the Company determined that there were no additional subsequent events that require disclosure and/or adjustment.
On February 22, 2018, CNS declared a quarterly dividend on its common stock in the amount of $0.33 per share. This dividend will be payable on March 22, 2018 to stockholders of record at the close of business on March 8, 2018.
F-37