Attached files
| file | filename |
|---|---|
| EX-99.1 - EARNINGS RELEASE DATED JULY 30 2018 - PGT Innovations, Inc. | ex991q22018.htm |
| 8-K - CURRENT REPORT ON FORM 8-K DATED JULY 30, 2018 - PGT Innovations, Inc. | form8k_07302018.htm |
EXHIBIT 99.2

PGT Innovations Q2 2018 Financial results July 30, 2018

FORWARD LOOKING STATEMENTS Statements in this presentation regarding our business that are not historical facts are “forward-looking statements” that involve risks and uncertainties which could cause actual results to differ materially from those contained in the forward-looking statements. Such forward-looking statements generally can be identified by the use of forward-looking terminology, such as “may,” “expect,” “expectations,” “outlook,” “forecast,” “guidance,” “intend,” “believe,” “could,” “project,” “estimate,” “anticipate,” “should” and similar terminology. These risks and uncertainties include factors such as: unfavorable changes in new home starts and home remodeling trends, especially in the State of Florida, where the substantial portion of our sales are generated;unfavorable changes in the economy in the United States in general and in the State of Florida, where the substantial portion of our sales are generated;increases in our cost of raw materials, including aluminum, glass and vinyl, including, without limitation, due to the implementation of tariffs and other trade-related restrictions;our dependence on a limited number of suppliers for certain of our key materials;increases in our transportation costs;our level of indebtedness;our dependence on our impact-resistant product lines;our ability to successfully integrate businesses we may acquire;product liability and warranty claims brought against us;federal, state and local laws and regulations, including unfavorable changes in local building codes; our dependence on a limited number of manufacturing facilities;the continuing post-storm impact of Hurricane Irma on our customers and markets, demand for our products, and our financial and operational performance related thereto;risks associated with our information technology systems, including cybersecurity-related risks, such as unauthorized intrusions into our systems by “hackers” and theft of data and information from our systems, and,the other risks and uncertainties discussed under “Risk Factors” in our Annual Report on Form 10-K for the year ended December 30, 2017.Statements in this presentation that are forward-looking statements include, without limitation, our expectations regarding: (1) demand for our products going forward, including the demand for our products from homeowners who are preparing for the 2018 and future hurricane seasons; (2) our ability to continue to leverage fixed costs in a favorable manner; (3) the heightened awareness brought by Hurricane Irma and our post-Irma advertising initiatives about the benefits of impact-resistant window and door products; (4) the favorable impact that the increase in our product prices may have on our performance, and our ability to take future price increases to offset further increases in our costs; (5) the Company’s ability to capture a meaningful share of any increased demand for impact-resistant products; and (7) our financial and operational performance for our 2018 fiscal year, including our “Fiscal Year 2018 Outlook” set forth in this presentation. You are cautioned not to place undue reliance on these forward-looking statements, which speak only as of the date of this presentation. Except as required by law, the Company undertakes no obligation to update these forward-looking statements to reflect subsequent events or circumstances from the date of this presentation. 2

Use of Non-GAAP Financial Measures This presentation and the financial schedules include financial measures and terms not calculated in accordance with U.S. generally accepted accounting principles (GAAP). We believe that presentation of non-GAAP measures such as adjusted net income, adjusted net income per share, and adjusted EBITDA provides investors and analysts with an alternative method for assessing our operating results in a manner that enables investors and analysts to more thoroughly evaluate our current performance compared to past performance. We also believe these non-GAAP measures provide investors with a better baseline for assessing our future earnings potential. The non-GAAP measures included in this release are provided to give investors access to types of measures that we use in analyzing our results.Adjusted net income consists of GAAP net income adjusted for the items included in the accompanying reconciliation. Adjusted net income per share consists of GAAP net income per share adjusted for the items included in the accompanying reconciliation. We believe these measures enable investors and analysts to more thoroughly evaluate our current performance as compared to the past performance and provide a better baseline for assessing the Company's future earnings potential. However, these measures do not provide a complete picture of our operations.Adjusted EBITDA consists of net income, adjusted for the items included in the accompanying reconciliation. We believe that adjusted EBITDA provides useful information to investors and analysts about the Company's performance because they eliminate the effects of period-to-period changes in taxes, costs associated with capital investments and interest expense. Adjusted EBITDA does not give effect to the cash the Company must use to service its debt or pay its income taxes and thus does not reflect the actual funds generated from operations or available for capital investments.Our calculations of adjusted net income, adjusted net income per share, and adjusted EBITDA are not necessarily comparable to calculations performed by other companies and reported as similarly titled measures. These non-GAAP measures should be considered in addition to results prepared in accordance with GAAP but should not be considered a substitute for or superior to GAAP measures. Schedules that reconcile adjusted net income, adjusted net income per share, and adjusted EBITDA to GAAP net income are included in the financial schedules accompanying this release. 3
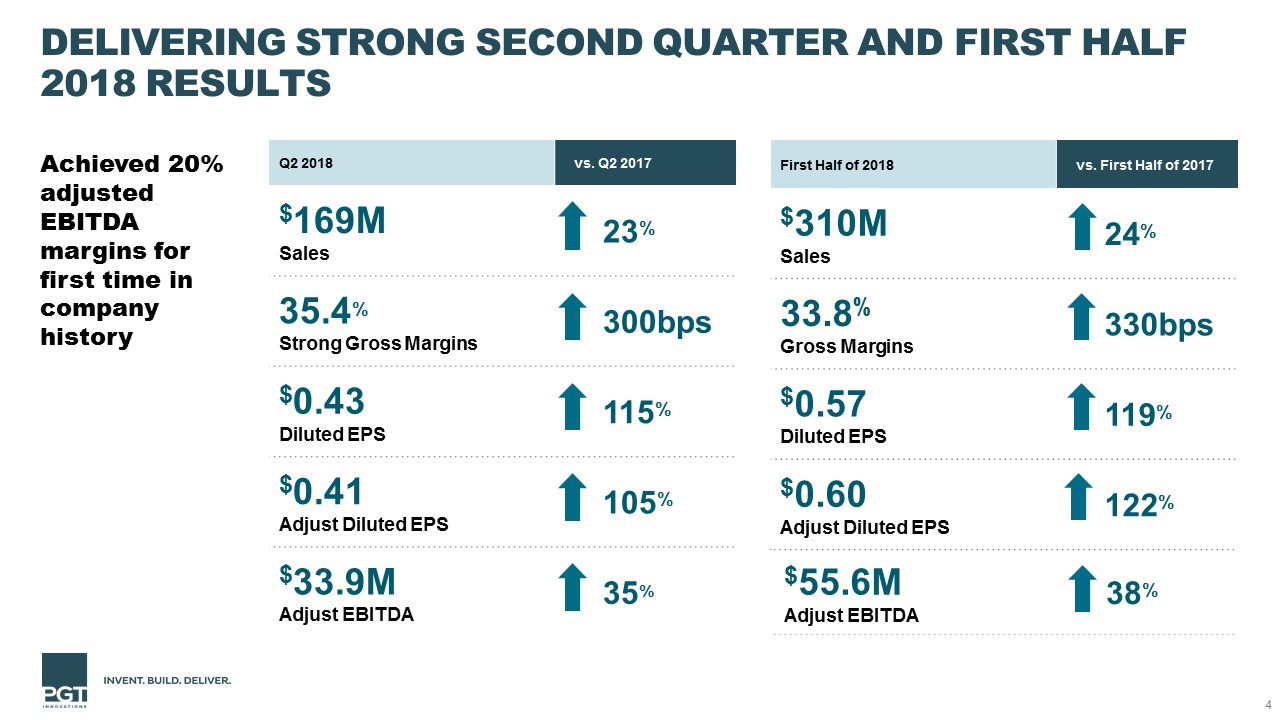
First Half of 2018 vs. First Half of 2017 $310MSales 24% 33.8%Gross Margins 330bps $0.57Diluted EPS 119% $0.60Adjust Diluted EPS 122% Q2 2018 vs. Q2 2017 $169MSales 23% 35.4%Strong Gross Margins 300bps $0.43Diluted EPS 115% $0.41Adjust Diluted EPS 105% $33.9MAdjust EBITDA 35% Delivering Strong Second Quarter AND FIRST HALF 2018 Results 4 Achieved 20% adjusted EBITDA margins for first time in company history $55.6MAdjust EBITDA 38%
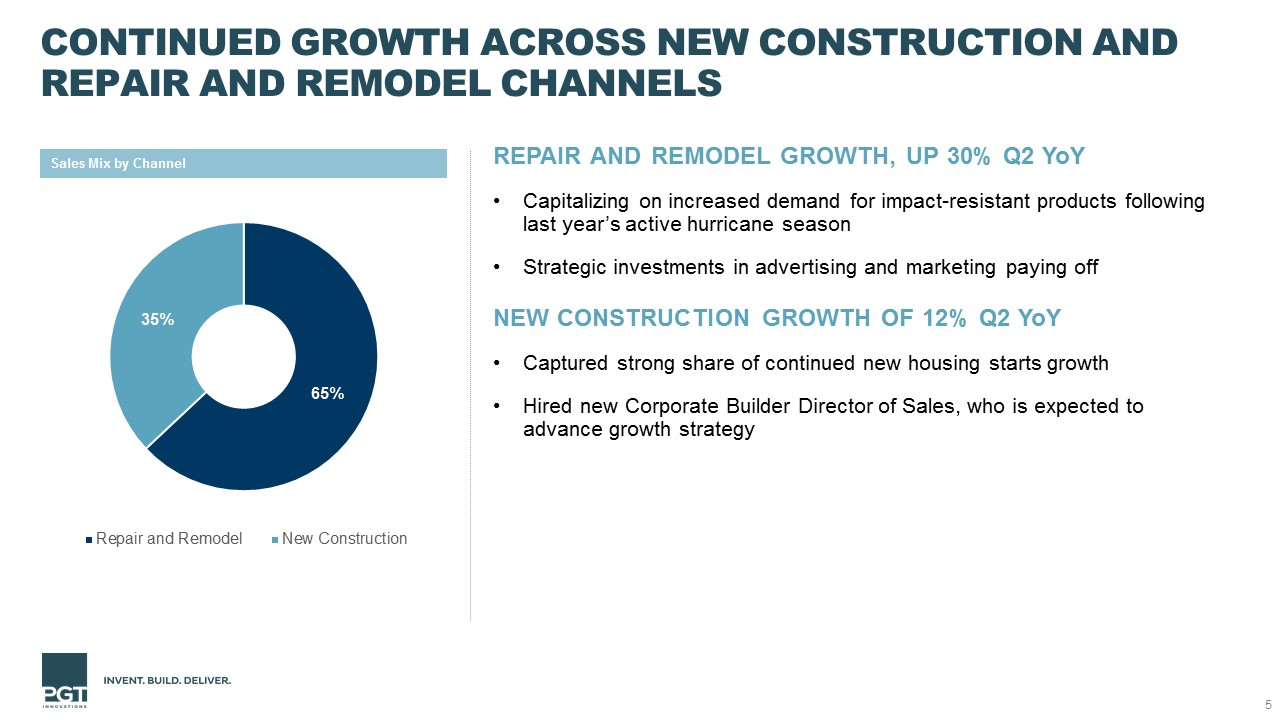
Continued Growth across New Construction and Repair and Remodel Channels 5 REPAIR AND REMODEL GROWTH, UP 30% Q2 YoYCapitalizing on increased demand for impact-resistant products following last year’s active hurricane season Strategic investments in advertising and marketing paying offNEW CONSTRUCTION GROWTH OF 12% Q2 YoYCaptured strong share of continued new housing starts growthHired new Corporate Builder Director of Sales, who is expected to advance growth strategy Sales Mix by Channel
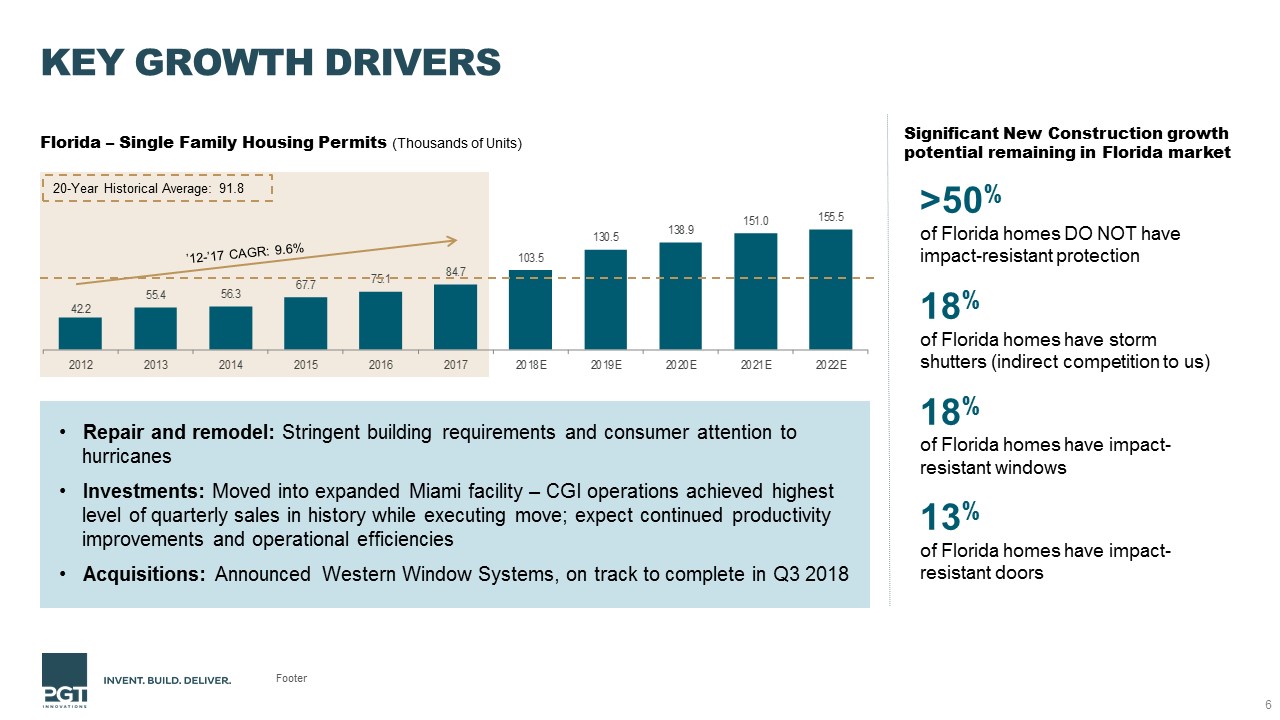
Key Growth Drivers Footer 6 Repair and remodel: Stringent building requirements and consumer attention to hurricanes Investments: Moved into expanded Miami facility – CGI operations achieved highest level of quarterly sales in history while executing move; expect continued productivity improvements and operational efficiencies Acquisitions: Announced Western Window Systems, on track to complete in Q3 2018 Florida – Single Family Housing Permits (Thousands of Units) ’12-’17 CAGR: 9.6% 20-Year Historical Average: 91.8 Significant New Construction growth potential remaining in Florida market >50% of Florida homes DO NOT have impact-resistant protection18% of Florida homes have storm shutters (indirect competition to us) 18% of Florida homes have impact-resistant windows13% of Florida homes have impact-resistant doors

ACQUIRING WESTERN WINDOW SYSTEMS TO CREATE National Leader in Premium Window and Doors 7 PGTI WWS Geographic expansion Immediate accretion to cash EPS and gross and adjusted margins Diversified product portfolioStrengthened brand recognition and leadership via cross-selling opportunities

Executing 4 Strategic Pillars to Create Long-Term Customer and Shareholder Value 8 Putting the customer first to build our brands Attracting talented, hardworking leaders and offering benefits to help our team members succeed Investing in our business and scaling our operations to meet increasing demand Strategically allocating capital generated from our free cash flow to support our growth

Q2 2018 Summary 9
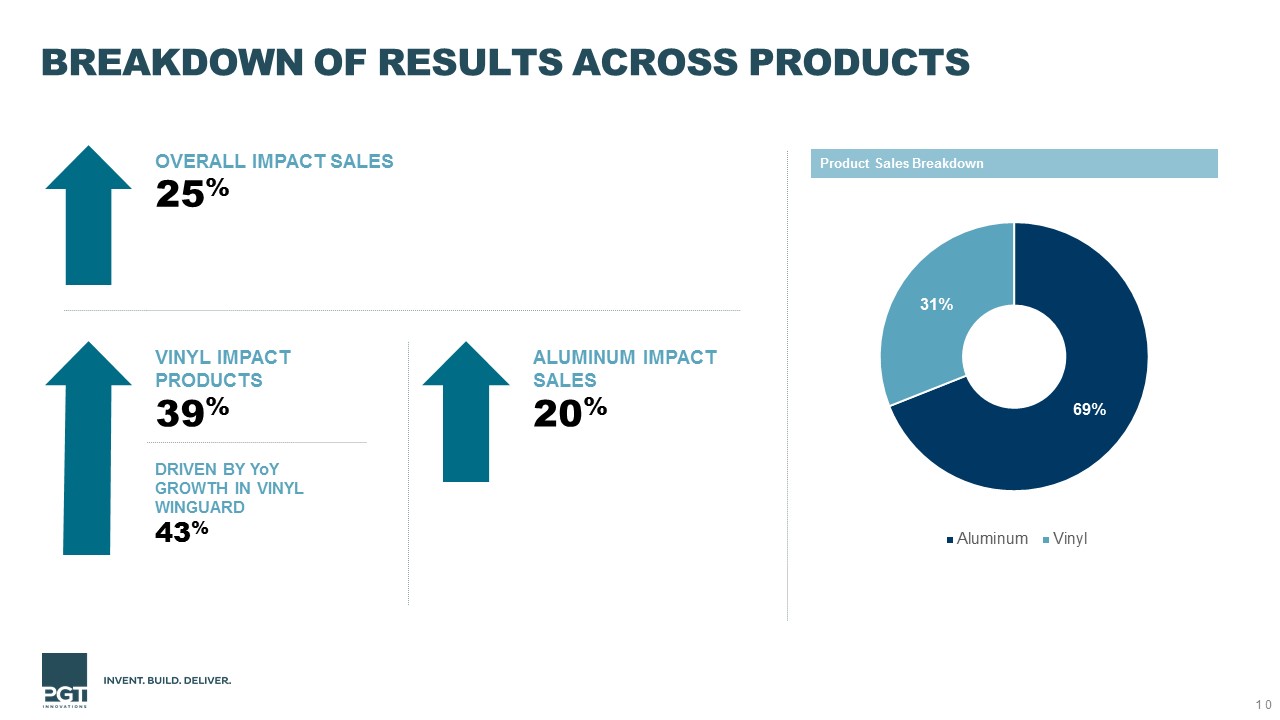
Breakdown of Results across Products 10 Product Sales Breakdown OVERALL IMPACT SALES25% VINYL IMPACT PRODUCTS 39% DRIVEN BY YoY GROWTH IN VINYL WINGUARD43% ALUMINUM IMPACT SALES20%
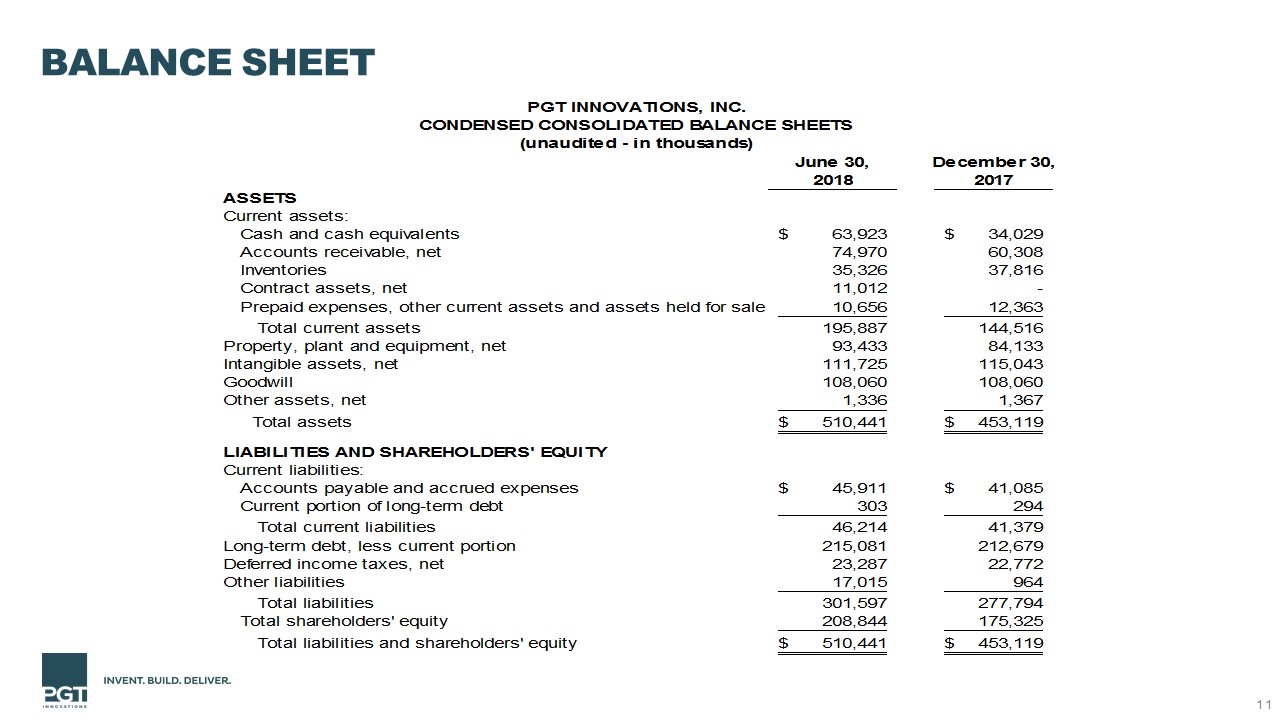
Balance Sheet 11

Increased Full-Year 2018 Guidance to reflect strong first half 2018 performance 12 Expect to finish toward high end of ranges for 2018 YoY % Change Net Sales$580-$600M 13%-17% Adjusted EBITDA$100M-$110M 19%-31% Net Income Per Diluted Share$0.95-$1.10 Free cash flow (2)$62M-$72M Revised FY guidance is for legacy PGTI. Does not include WWS.Free cash flow defined as operating cash flow less capex.