Attached files
| file | filename |
|---|---|
| EX-31.1 - CERTIFICATION - PGT Innovations, Inc. | d263847dex311.htm |
| EX-32.1 - CERTIFICATION - PGT Innovations, Inc. | d263847dex321.htm |
| EX-31.2 - CERTIFICATION - PGT Innovations, Inc. | d263847dex312.htm |
| EX-23.1 - CONSENT OF INDEPENDENT REGISTERED PUBLIC ACCOUNTING FIRM - PGT Innovations, Inc. | d263847dex231.htm |
| EX-21.1 - SUBSIDIARIES - PGT Innovations, Inc. | d263847dex211.htm |
| EXCEL - IDEA: XBRL DOCUMENT - PGT Innovations, Inc. | Financial_Report.xls |
Table of Contents
UNITED STATES
SECURITIES AND EXCHANGE COMMISSION
Washington, D.C. 20549
Form 10-K
| x | ANNUAL REPORT PURSUANT TO SECTION 13 OR 15(d) OF THE SECURITIES EXCHANGE ACT OF 1934 |
For the fiscal year ended December 31, 2011
OR
| ¨ | TRANSITION REPORT PURSUANT TO SECTION 13 OR 15(d) OF THE SECURITIES EXCHANGE ACT OF 1934 |
For the transition period from to
Commission File Number: 000-52059
PGT, Inc.
(Exact name of registrant as specified in its charter)
| Delaware | 20-0634715 | |
| (State or other jurisdiction of incorporation or organization) | (I.R.S. Employer Identification No.) | |
| 1070 Technology Drive North Venice, Florida |
34275 | |
| (Address of principal executive offices) | (Zip Code) | |
Registrant’s telephone number, including area code:
(941) 480-1600
Former name, former address and former fiscal year, if changed since last report: Not applicable
Securities registered pursuant to Section 12(b) of the Act:
| Title of Each Class |
Name of Exchange on Which Registered | |
| Common stock, par value $0.01 per share | NASDAQ Global Market |
Securities registered pursuant to Section 12 (g) of the Act:
None
Indicate by check mark if the registrant is a well-known seasoned issuer, as defined in Rule 405 of the Securities Act. Yes ¨ No x
Indicate by check mark if the registrant is not required to file reports pursuant to Section 13 or Section 15(d) of the Exchange Act. Yes ¨ No x
Indicate by check mark whether the registrant (1) has filed all reports required to be filed by Section 13 or 15(d) of the Securities Exchange Act of 1934 during the preceding 12 months (or for such shorter period that the registrant was required to file such reports), and (2) has been subject to such filing requirements for the past 90 days. Yes x No ¨
Indicate by check mark if disclosure of delinquent filers pursuant to Item 405 of Regulation S-K is not contained herein, and will not be contained, to the best of registrant’s knowledge, in definitive proxy or information statements incorporated by reference in Part III of this Form 10-K or any amendment to this Form 10-K. x
Indicate by check mark whether the registrant is a large accelerated filer, an accelerated filer, a non-accelerated filer, or a smaller reporting company. See definition of “accelerated filer,” “large accelerated filer” and “smaller reporting company” in Rule 12b-2 of the Exchange Act.
| Large accelerated filer | ¨ | Accelerated filer | ¨ | |||
| Non-accelerated filer | x (Do not check if a smaller reporting company) | Smaller reporting company | ¨ | |||
Indicate by check mark whether the registrant is a shell company (as defined by Rule 12b-2 of the Exchange Act). Yes ¨ No x
The aggregate market value of the registrant’s common stock held by non-affiliates of the registrant as of July 1, 2011 was approximately $34,070,286 based on the closing price per share on that date of $1.77 as reported on the NASDAQ Global Market.
The number of shares of the registrant’s common stock, par value $0.01, outstanding as of March 9, 2012 was 53,670,135.
DOCUMENTS INCORPORATED BY REFERENCE
Portions of the Company’s Proxy Statement for the Company’s 2012 Annual Meeting of Stockholders are incorporated by reference into Part III of this Form 10-K.
PGT, INC.
Table of Contents
Table of Contents to Form 10-K
i
Table of Contents
| Item 1. | BUSINESS |
GENERAL DEVELOPMENT OF BUSINESS
Description of the Company
We are the leading U.S. manufacturer and supplier of residential impact-resistant windows and doors and pioneered the U.S. impact-resistant window and door industry. Our impact-resistant products, which are marketed under the WinGuard®, PremierVue ™ and PGT Architectural Systems brand names, combine heavy-duty aluminum or vinyl frames with laminated glass to provide protection from hurricane-force winds and wind-borne debris by maintaining their structural integrity and preventing penetration by impacting objects. Impact-resistant windows and doors satisfy stringent building codes in hurricane-prone coastal states and provide an attractive alternative to shutters and other “active” forms of hurricane protection that require installation and removal before and after each storm. Combining the impact resistance of WinGuard, PremierVue ™ and PGT Architectural Systems with our insulating glass creates energy efficient windows that can significantly reduce cooling and heating costs. We also manufacture non-impact resistant products in both aluminum and vinyl frames including our SpectraGuard ™ line of products. Our current market share in Florida, which is the largest U.S. impact-resistant window and door market, is significantly greater than that of any of our competitors.
The geographic regions in which we currently operate include the Southeastern U.S., Gulf Coast, Coastal mid-Atlantic, the Caribbean, Central America, and Canada. We distribute our products through multiple channels, including over 1,300 window distributors, building supply distributors, window replacement dealers and enclosure contractors. This broad distribution network provides us with the flexibility to meet demand as it shifts between the residential new construction and repair and remodeling end markets.
Our manufacturing facility in North Venice, Florida, produces fully-customized windows and doors. We are vertically integrated with glass tempering and laminating facilities, which provide us with a consistent source of impact-resistant laminated and insulated glass, shorter lead times, and lower costs relative to third-party sourcing.
On December 3, 2010, we announced that our former Salisbury, North Carolina operations would be transferred to Venice, Florida to consolidate our window and door production at our Florida manufacturing facilities. This consolidation was completed during the second quarter of 2011. We believe transitioning to a centralized location has optimized our manufacturing capacity and logistics, positioning us to be a stronger company and focus on growing our share within our core wind-borne debris market areas.
In January 2011, we accepted an offer to sell our former Lexington, North Carolina facility. The sale of this building closed in the second quarter of 2011 at approximately the net book value recorded at that time.
History
Our subsidiary, PGT Industries, Inc., a Florida Corporation, was founded in 1980 as Vinyl Tech, Inc. The PGT brand was established in 1987, and we introduced our WinGuard branded product line in the aftermath of Hurricane Andrew in 1992.
PGT, Inc. is a Delaware corporation formed on December 16, 2003, as JLL Window Holdings, Inc. by an affiliate of JLL Partners, our largest stockholder, in connection with its acquisition of PGT Holding Company on January 29, 2004. On February 15, 2006, we changed our name to PGT, Inc., and on June 27, 2006 we became a publicly listed company on the NASDAQ National Market under the symbol “PGTI”.
FINANCIAL INFORMATION ABOUT INDUSTRY SEGMENTS
We operate as one segment, the manufacture and sale of windows and doors. Additional required information is included in Item 8.
1
Table of Contents
NARRATIVE DESCRIPTION OF BUSINESS
Our Products
We manufacture complete lines of premium, fully customizable aluminum and vinyl windows and doors and porch enclosure products targeting both the residential new construction and repair and remodeling end markets. All of our products carry the PGT brand, and our consumer-oriented products carry an additional, trademarked product name, including WinGuard, Eze-Breeze, SpectraGuard, and, introduced in late 2009, PremierVue.
Window and door products
WinGuard. WinGuard is an impact-resistant product line and combines heavy-duty aluminum or vinyl frames with laminated glass to provide protection from hurricane-force winds and wind-borne debris that satisfy increasingly stringent building codes and primarily target hurricane-prone coastal states in the U.S., as well as the Caribbean and Central America. Combining the impact resistance of WinGuard with our insulating glass creates energy efficient windows that can significantly reduce cooling and heating costs.
PremierVue. Introduced in the Fall of 2009, PremierVue is a complete line of impact-resistant vinyl window and door products that are tailored for the mid- to high-end of the replacement market, primarily targeting single and multi-family homes and low to mid-rise condominiums in Florida and other coastal regions of the Southeastern U.S. Combining structural strength and energy efficiency, these products are designed for flexibility in today’s market, offering both laminated and laminated-insulated impact-resistant glass options. PremierVue’s large test sizes and high design pressures, combined with vinyl’s inherent thermal efficiency, make these products truly unique in the window and door industry.
Aluminum. We offer a complete line of fully customizable, non-impact-resistant aluminum frame windows and doors. These products primarily target regions with warmer climates, where aluminum is often preferred due to its ability to withstand higher structural loads. Adding our insulating glass creates energy efficient windows that can significantly reduce cooling and heating costs.
Vinyl. We offer a complete line of fully customizable, non-impact-resistant vinyl frame windows and doors where the energy-efficient characteristics of vinyl frames are critical. In early 2008, we introduced a new line of energy efficient vinyl windows for new construction with wood-like aesthetics, such as brick-mould frames, wood-like trim detail and simulated divided lights. In early 2009, we added a line of vinyl replacement windows with the same superior energy performance and wood-like detail and branded the product lines as SpectraGuard. These Energy-Star rated windows also met the qualifications for the 30/30 federal tax credit. In 2010 we introduced a SpectraGuard vinyl window line with the same Energy-Star ratings and wood-like aesthetics designed and targeted to meet the needs of the Florida market.
Architectural Systems. Similar to WinGuard, Architectural Systems products are impact-resistant, offering protection from hurricane-force winds and wind-borne debris for mid- and high-rise buildings rather than single family homes.
Eze-Breeze. Eze-Breeze non-glass vertical and horizontal sliding panels for porch enclosures are vinyl-glazed, aluminum-framed products used for enclosing screened-in porches that provide protection from inclement weather. In 2011, we introduced our new cabana door to complement this line of products.
Sales and Marketing
Our sales strategy primarily focuses on attracting and retaining distributors and dealers by consistently providing exceptional customer service, leading product designs and quality, and competitive pricing all using our advanced knowledge of building code requirements and technical expertise.
Our marketing strategy is designed to reinforce the high quality of our products and focuses on both coastal and inland markets. We support our markets through print and web-based advertising, consumer, dealer, and builder promotions, and selling and collateral materials. We also work with our dealers and distributors to educate architects, building officials, consumers and homebuilders on the advantages of using impact-resistant and energy efficient products. We market our products based on quality, building code compliance, outstanding service, shorter lead times, and on-time delivery using our fleet of trucks and trailers.
2
Table of Contents
Our Customers
We have a highly diversified customer base that is comprised of over 1,300 window distributors, building supply distributors, window replacement dealers and enclosure contractors. Our largest customer accounts for approximately 2.0% of net sales and our top ten customers account for approximately 16.3% of net sales. Our sales are comprised of residential new construction and home repair and remodeling end markets, which represented approximately 24% and 76% of our sales, respectively, during 2011. This compares to 25% and 75% in 2010.
We do not supply our products directly to homebuilders but believe demand for our products is also a function of our relationships with a number of national homebuilders, which we believe are strong.
Materials and Supplier Relationships
Our primary manufacturing materials include aluminum and vinyl extrusions, glass, ionoplast, and polyvinyl butyral. Although in many instances we have agreements with our suppliers, these agreements are generally terminable by either party on limited notice. All of our materials are typically readily available from other sources. Aluminum and vinyl extrusions accounted for approximately 43.5% of our material purchases during fiscal year 2011. Sheet glass, which is sourced from two major national suppliers, accounted for approximately 18.7% of our material purchases during fiscal year 2011. Sheet glass that we purchase comes in various sizes, tints, and thermal properties. Polyvinyl butyral and ionoplast, which are both used as inner layer in laminated glass, accounted for approximately 17.1% of our material purchases during fiscal year 2011.
Backlog
As of December 31, 2011, our backlog was $7.8 million compared to $8.2 million at January 1, 2011. Our backlog consists of orders that we have received from customers that have not yet shipped, and we expect that substantially all of our current backlog will be recognized as sales in the first quarter of 2012.
Intellectual Property
We own and have registered trademarks in the United States. In addition, we own several patents and patent applications concerning various aspects of window assembly and related processes. We are not aware of any circumstances that would have a material adverse effect on our ability to use our trademarks and patents. As long as we continue to renew our trademarks when necessary, the trademark protection provided by them is perpetual.
Manufacturing
Our manufacturing facility is located in Florida where we produce fully-customized products. The manufacturing process typically begins in our glass plant where we cut, temper and laminate sheet glass to meet specific requirements of our customers’ orders.
Glass is transported to our window and door assembly lines in a make-to-order sequence where it is combined with an aluminum or vinyl frame. These frames are also fabricated to order, as we start with a piece of extruded material that we cut and shape into a frame that fits our customers’ specifications. After an order has been completed, it is immediately staged for delivery and shipped on our trucking fleet within an average of 48 hours of completion.
Competition
The window and door industry is highly fragmented, and the competitive landscape is based on geographic scope. The competition falls into one of two categories.
Local and Regional Window and Door Manufacturers: This group of competitors consists of numerous local job shops and small manufacturing facilities that tend to focus on selling products to local or regional dealers and wholesalers. Competitors in this group typically lack marketing support and the service levels and quality controls demanded by larger distributors, as well as the ability to offer a full complement of products.
National Window and Door Manufacturers: This group of competitors tends to focus on selling branded products nationally to dealers and wholesalers and has multiple locations.
3
Table of Contents
The principal methods of competition in the window and door industry are the development of long-term relationships with window and door dealers and distributors, and the retention of customers by delivering a full range of high-quality products on time while offering competitive pricing and flexibility in transaction processing. Trade professionals such as contractors, homebuilders, architects and engineers also engage in direct interaction and look to the manufacturer for training and education of product and code. Although some of our competitors may have greater geographic scope and access to greater resources and economies of scale than do we, our leading position in the U.S. impact-resistant window and door market and the award winning designs and high quality of our products position us well to meet the needs of our customers.
Environmental Considerations
Although our business and facilities are subject to federal, state, and local environmental regulation, environmental regulation does not have a material impact on our operations, and we believe that our facilities are in material compliance with such laws and regulations.
Employees
As of February 17, 2012, we employed approximately 1,020 people, none of whom were represented by a union. We believe that we have good relations with our employees.
FINANCIAL INFORMATION ABOUT GEOGRAPHIC AREAS
Our domestic and international net sales for each of the three years ended December 31, 2011, January 1, 2011 and January 2, 2010 are as follows (in thousands):
| Year Ended | ||||||||||||
| December 31, 2011 |
January 1, 2011 |
January 2, 2010 |
||||||||||
| Domestic |
$ | 160.0 | $ | 167.8 | $ | 156.5 | ||||||
| International |
7.3 | 7.9 | 9.5 | |||||||||
|
|
|
|
|
|
|
|||||||
| $ | 167.3 | $ | 175.7 | $ | 166.0 | |||||||
|
|
|
|
|
|
|
|||||||
AVAILABLE INFORMATION
Our Internet address is www.pgtindustries.com. Through our Internet website under “Financial Information” in the Investors section, we make available free of charge, as soon as reasonably practical after such information has been filed with the SEC, our annual report on Form 10-K, quarterly reports on Form 10-Q, current reports on Form 8-K, and amendments to those reports filed pursuant to Section 13(a) or 15(d) of the Securities Exchange Act. Also available through our Internet website under “Corporate Governance” in the Investors section are our Code of Business Conduct and Ethics and our Code of Ethics for Senior Financial Officers. We are not including this or any other information on our website as a part of, nor incorporating it by reference into this Form 10-K, or any of our other SEC filings. The SEC maintains an Internet site that contains our reports, proxy and information statements, and other information that we file electronically with the SEC at www.sec.gov.
We are subject to regional and national economic conditions. The unprecedented decline in the economy in Florida and throughout the United States could continue to negatively affect demand for our products which has had, and which could continue to have, an adverse impact on our sales and results of operations.
The new home construction and repair and remodeling markets have declined. Beginning in the second half of 2006, we saw a significant slowdown in the Florida housing market. This slowdown continued through 2009. Like many building material suppliers in the industry, we have been and will continue to be faced with a challenging operating environment due to this decline in the housing market. Specifically, new single family housing permits in Florida remained at historically low levels in 2011. Beginning in the third quarter of 2008, we began to see a decrease in consumer spending for repair and remodeling projects as credit tightened and many homeowners lost substantial equity in their homes. The resulting decline in new home and repair and remodeling construction levels by our customers has decreased demand for our products which has had, and which could continue to have, an adverse impact on our sales and results of operations.
4
Table of Contents
Current economic and credit market conditions have increased the risk that we may not collect a greater percentage of our receivables. Economic and credit conditions have negatively impacted our bad debt expense which has adversely impacted our results of operations. If these conditions persist, our results of operations may continue to be adversely impacted by bad debts. We monitor our customers’ credit profiles carefully and make changes in our terms when necessary in response to this heightened risk.
We are subject to fluctuations in the prices of our raw materials. We experience significant fluctuations in the cost of our raw materials, including aluminum extrusion, polyvinyl butyral and glass. A variety of factors over which we have no control, including global demand for aluminum, fluctuations in oil prices, speculation in commodities futures and the creation of new laminates or other products based on new technologies impact the cost of raw materials we purchase for the manufacture of our products. While we attempt to minimize our risk from severe price fluctuations by entering into aluminum forward contracts to hedge these fluctuations in the purchase price of aluminum extrusion we use in production, substantial, prolonged upward trends in aluminum prices could significantly increase the cost of the unhedged portions of our aluminum needs and have an adverse impact on our results of operations. We anticipate that these fluctuations will continue in the future. While we have entered into a one-year supply agreement through December 2012 with a major producer of ionoplast inter layer that we believe provides us with a reliable, single source for ionoplast with stable pricing on favorable terms, if one or both parties to the agreement do not satisfy the terms of the agreement, it may be terminated which could result in our inability to obtain ionoplast on commercially reasonable terms having an adverse impact on our results of operations. While historically we have to some extent been able to pass on significant cost increases to our customers, our results between periods may be negatively impacted by a delay between the cost increases and price increases in our products.
We depend on third-party suppliers for our raw materials. Our ability to offer a wide variety of products to our customers depends on receipt of adequate material supplies from manufacturers and other suppliers. Generally, our raw materials and supplies are obtainable from various sources and in sufficient quantities. However, it is possible that our competitors or other suppliers may create laminates or products based on new technologies that are not available to us or are more effective than our products at surviving hurricane-force winds and wind-borne debris or that they may have access to products of a similar quality at lower prices. Although in many instances we have agreements with our suppliers, these agreements are generally terminable by either party on limited notice. Moreover, other than with our suppliers of polyvinyl butyral and aluminum, we do not have long-term contracts with the suppliers of our raw materials.
Transportation costs represent a significant part of our cost structure. Fuel prices began to increase in late 2010, stabilized in 2011, and have shown signs of rising again in the first quarter of 2012. In the present and future, a rapid and prolonged increase in fuel prices may significantly increase our costs and have an adverse impact on our results of operations.
The home building industry and the home repair and remodeling sector are regulated. The homebuilding industry and the home repair and remodeling sector are subject to various local, state, and federal statutes, ordinances, rules, and regulations concerning zoning, building design and safety, construction, and similar matters, including regulations that impose restrictive zoning and density requirements in order to limit the number of homes that can be built within the boundaries of a particular area. Increased regulatory restrictions could limit demand for new homes and home repair and remodeling products and could negatively affect our sales and results of operations.
Our operating results are substantially dependent on sales of our WinGuard branded line of products. A majority of our net sales are, and are expected to continue to be, derived from the sales of our WinGuard branded line of products. Accordingly, our future operating results will depend on the demand for WinGuard products by current and future customers, including additions to this product line that are subsequently introduced. If our competitors release new products that are superior to WinGuard products in performance or price, or if we fail to update WinGuard products with any technological advances that are developed by us or our competitors or introduce new products in a timely manner, demand for our products may decline. A decline in demand for WinGuard products as a result of competition, technological change or other factors could have a material adverse effect on our ability to generate sales, which would negatively affect results of operations.
Changes in building codes could lower the demand for our impact-resistant windows and doors. The market for our impact-resistant windows and doors depends in large part on our ability to satisfy state and local building codes that require protection from wind-borne debris. If the standards in such building codes are raised, we may not be able to meet their requirements, and demand for our products could decline. Conversely, if the standards in such building codes are lowered or are not enforced in certain areas, demand for our impact-resistant products may decrease. Further, if states and regions that are affected by hurricanes but do not currently have such building codes fail to adopt and enforce hurricane protection building codes, our ability to expand our business in such markets may be limited.
5
Table of Contents
Our industry is competitive, and competition may increase as our markets grow or as more states adopt or enforce building codes that require impact-resistant products. The window and door industry is highly competitive. We face significant competition from numerous small, regional producers, as well as certain national producers. Any of these competitors may (i) foresee the course of market development more accurately than do we, (ii) develop products that are superior to our products, (iii) have the ability to produce similar products at a lower cost, or (iv) adapt more quickly to new technologies or evolving customer requirements than do we. Additionally, new competitors may enter our industry, and larger existing competitors may increase their efforts and devote substantially more resources to expand their presence in the impact-resistant market. If we are unable to compete effectively, demand for our products may decline.
In addition, while we are skilled at creating finished impact-resistant and other window and door products, the materials we use can be purchased by any existing or potential competitor. New competitors can enter our industry, and existing competitors may increase their efforts in the impact-resistant market. Furthermore, if the market for impact-resistant windows and doors continues to expand, larger competitors could enter or expand their presence in the market and may be able to compete more effectively. Finally, we may not be able to maintain our costs at a level for us to compete effectively. If we are unable to compete effectively, demand for our products and our profitability may decline.
Our business is currently concentrated in one state. Our business is concentrated geographically in Florida. In fiscal year 2011, approximately 85% of our sales were generated in Florida, a state in which new single family housing permits remain at historically low levels. Our consolidation of operations into a single manufacturing location to optimize our manufacturing capacity and logistics was based, in part, on our belief that a focused approach to growing our share within our core wind-borne debris markets in Florida, from the Gulf Coast to the mid-Atlantic, and certain international markets, will maximize value and return. However, such a focus further concentrates our business, and a continued or prolonged decline in the economy of the state of Florida or of certain coastal regions, a change in state and local building code requirements for hurricane protection, or any other adverse condition in the state or certain coastal regions, could cause a decline in the demand for our products, which could have an adverse impact on our sales and results of operations.
Our level of indebtedness could adversely affect our ability to raise additional capital to fund our operations, limit our ability to react to changes in the economy or our industry, and prevent us from meeting our obligations under our debt instruments. As of December 31, 2011, our indebtedness under our term loan was $45.5 million. All of our debt was at a variable interest rate. In the event that interest rates rise, our interest expense would increase. Based on our debt outstanding at December 31, 2011, of $45.5 million, of which $24.0 million is covered by our interest rate cap, a 1% increase in interest rates above our interest rate floor established in the Credit Agreement would result in approximately $0.2 million of additional interest expense annually.
The level of our debt could have certain consequences, including:
| • | increasing our vulnerability to general economic and industry conditions; |
| • | requiring a substantial portion of our cash flow from operations to be dedicated to the payment of principal and interest on our indebtedness, therefore reducing our ability to use our cash flow to fund our operations, capital expenditures, and future business opportunities; |
| • | exposing us to the risk of increased interest rates because certain of our borrowings, including borrowings under our credit facilities, will be at variable rates of interest; |
| • | limiting our ability to obtain additional financing for working capital, capital expenditures, debt service requirements, acquisitions, and general corporate or other purposes; and |
| • | limiting our ability to adjust to changing market conditions and placing us at a competitive disadvantage compared to our competitors who have less debt. |
We may incur additional indebtedness. We may incur additional indebtedness under our credit facilities, which provide for up to $15 million of revolving credit borrowings. In addition, we and our subsidiary may be able to incur $25 million additional indebtedness in the future. If new debt is added to our current debt levels, the related risks that we now face could intensify.
Our debt instruments contain various covenants that limit our ability to operate our business. Our credit facility contains various provisions that limit our ability to, among other things, transfer or sell assets, including the equity interests of our subsidiary, or use asset sale proceeds; pay dividends or distributions on our capital stock or repurchase our capital stock; make certain restricted payments or investments; create liens to secure debt; enter into transactions with affiliates; merge or consolidate with another company; and engage in unrelated business activities.
6
Table of Contents
In addition, our credit facilities require us to meet specified financial ratios. These covenants may restrict our ability to expand or fully pursue our business strategies. Our ability to comply with these and other provisions of our credit facilities may be affected by changes in our operating and financial performance, changes in general business and economic conditions, adverse regulatory developments, or other events beyond our control. The breach of any of these covenants, including those contained in our credit facilities, could result in a default under our indebtedness, which could cause those and other obligations to become due and payable. If any of our indebtedness is accelerated, we may not be able to repay it.
We may be adversely affected by any disruption in our information technology systems. Our operations are dependent upon our information technology systems, which encompass all of our major business functions. A disruption in our information technology systems for any prolonged period could result in delays in receiving inventory and supplies or filling customer orders and adversely affect our customer service and relationships.
We may be adversely affected by any disruptions to our manufacturing facilities or disruptions to our customer, supplier, or employee base. Any disruption to our facilities resulting from hurricanes and other weather-related events, fire, an act of terrorism, or any other cause could damage a significant portion of our inventory, affect our distribution of products, and materially impair our ability to distribute our products to customers. We could incur significantly higher costs and longer lead times associated with distributing our products to our customers during the time that it takes for us to reopen or replace a damaged facility. In addition, if there are disruptions to our customer and supplier base or to our employees caused by hurricanes, our business could be temporarily adversely affected by higher costs for materials, increased shipping and storage costs, increased labor costs, increased absentee rates, and scheduling issues. Furthermore, some of our direct and indirect suppliers have unionized work forces, and strikes, work stoppages, or slowdowns experienced by these suppliers could result in slowdowns or closures of their facilities. Any interruption in the production or delivery of our supplies could reduce sales of our products and increase our costs.
The nature of our business exposes us to product liability and warranty claims. We are, from time to time, involved in product liability and product warranty claims relating to the products we manufacture and distribute that, if adversely determined, could adversely affect our financial condition, results of operations, and cash flows. In addition, we may be exposed to potential claims arising from the conduct of homebuilders and home remodelers and their sub-contractors. Although we currently maintain what we believe to be suitable and adequate insurance in excess of our self-insured amounts, we may not be able to maintain such insurance on acceptable terms or such insurance may not provide adequate protection against potential liabilities. Product liability claims can be expensive to defend and can divert the attention of management and other personnel for significant periods, regardless of the ultimate outcome. Claims of this nature could also have a negative impact on customer confidence in our products and our company.
We are subject to potential exposure to environmental liabilities and are subject to environmental regulation. We are subject to various federal, state, and local environmental laws, ordinances, and regulations. Although we believe that our facilities are in material compliance with such laws, ordinances, and regulations, as owners and lessees of real property, we can be held liable for the investigation or remediation of contamination on such properties, in some circumstances, without regard to whether we knew of or were responsible for such contamination. Remediation may be required in the future as a result of spills or releases of petroleum products or hazardous substances, the discovery of unknown environmental conditions, or more stringent standards regarding existing residual contamination. More burdensome environmental regulatory requirements may increase our general and administrative costs and may increase the risk that we may incur fines or penalties or be held liable for violations of such regulatory requirements.
We conduct all of our operations through our subsidiary, and rely on payments from our subsidiary to meet all of our obligations. We are a holding company and derive all of our operating income from our subsidiary, PGT Industries, Inc. All of our assets are held by our subsidiary, and we rely on the earnings and cash flows of our subsidiary to meet our debt service obligations. The ability of our subsidiary to make payments to us will depend on its respective operating results and may be restricted by, among other things, the laws of its jurisdiction of organization (which may limit the amount of funds available for distributions to us), the terms of existing and future indebtedness and other agreements of our subsidiary, including our credit facilities, and the covenants of any future outstanding indebtedness we or our subsidiary incur.
We are exposed to risks relating to evaluations of controls required by Section 404 of the Sarbanes-Oxley Act of 2002. We are required to comply with Section 404 of the Sarbanes-Oxley Act of 2002. While we have concluded that at December 31, 2011, we have no material weaknesses in our internal controls over financial reporting, we cannot assure you that we will not have a material weakness in the future. A “material weakness” is a deficiency, or combination of deficiencies, in internal control over financial reporting, such that there is a reasonable possibility that a material misstatement of the Company’s annual or interim financial statements will not be prevented or detected on a timely basis. If we fail to maintain a system of internal controls over financial reporting that meets the requirements of Section 404, we might be subject to sanctions or investigation by regulatory authorities such as the SEC or by the NASDAQ Stock Market LLC. Additionally, failure to comply with Section 404 or the report by us of a material weakness may cause investors to lose confidence in our financial statements and our stock price may be adversely affected. If we fail to remedy any material weakness, our financial statements may be inaccurate, we may not have access to the capital markets, and our stock price may be adversely affected.
7
Table of Contents
The controlling position of an affiliate of JLL Partners limits the ability of our minority stockholders to influence corporate matters. An affiliate of JLL Partners owned 59.8% of our outstanding common stock as of December 31, 2011. Accordingly, such affiliate of JLL Partners has significant influence over our management and affairs and over all matters requiring stockholder approval, including the election of directors and significant corporate transactions, such as a merger or other sale of our company or its assets. This concentration of ownership may have the effect of delaying or preventing a transaction such as a merger, consolidation, or other business combination involving us, or discouraging a potential acquirer from making a tender offer or otherwise attempting to obtain control, even if such a transaction or change of control would benefit minority stockholders. In addition, this concentrated control limits the ability of our minority stockholders to influence corporate matters, and such affiliate of JLL Partners, as a controlling stockholder, could approve certain actions, including a going-private transaction, without approval of minority stockholders, subject to obtaining any required approval of our board of directors for such transaction. As a result, the market price of our common stock could be adversely affected.
The controlling position of an affiliate of JLL Partners exempts us from certain Nasdaq corporate governance requirements. Although we have satisfied all applicable Nasdaq corporate governance rules, for so long as an affiliate of JLL Partners continues to own more than 50% of our outstanding shares, we will continue to avail ourselves of the Nasdaq Listing Rule 5615(c) “controlled company” exemption that applies to companies in which more than 50% of the stockholder voting power is held by an individual, a group, or another company. This rule grants us an exemption from the requirements that we have a majority of independent directors on our board of directors and that we have independent directors determine the compensation of executive officers and the selection of nominees to the board of directors. However, we intend to comply with such requirements in the event that such affiliate of JLL Partners’ ownership falls to or below 50%.
Our directors and officers who are affiliated with JLL Partners do not have any obligation to report corporate opportunities to us. Because some individuals may serve as our directors or officers and as directors, officers, partners, members, managers, or employees of JLL Partners or its affiliates or investment funds and because such affiliates or investment funds may engage in similar lines of business to those in which we engage, our amended and restated certificate of incorporation allocates corporate opportunities between us and JLL Partners and its affiliates and investment funds. Specifically, for so long as JLL Partners and its affiliates and investment funds own at least 15% of our shares of common stock, none of JLL Partners, nor any of its affiliates or investment funds, or their respective directors, officers, partners, members, managers, or employees has any duty to refrain from engaging directly or indirectly in the same or similar business activities or lines of business as do we. In addition, if any of them acquires knowledge of a potential transaction that may be a corporate opportunity for us and for JLL Partners or its affiliates or investment funds, subject to certain exceptions, we will not have any expectancy in such corporate opportunity, and they will not have any obligation to communicate such opportunity to us.
Item 1B. UNRESOLVED STAFF COMMENTS
None.
8
Table of Contents
We have the following properties as of December 31, 2011:
| Manufacturing | Support | Storage | ||||||||||
| (in square feet) | ||||||||||||
| Owned: |
||||||||||||
| Main Plant and Corporate Office, North Venice, FL |
348,000 | 15,000 | — | |||||||||
| Glass tempering and laminating, North Venice, FL |
80,000 | — | — | |||||||||
| Insulated Glass, North Venice, FL |
42,000 | — | — | |||||||||
| PGT Wellness Center, North Venice, FL |
— | 3,600 | — | |||||||||
| Manufacturing Facility Salisbury, NC |
379,000 | 14,000 | — | |||||||||
| Leased: |
||||||||||||
| James Street Storage, Venice, FL |
15,000 | — | — | |||||||||
| Endeavor Court, Nokomis, FL |
— | 2,300 | — | |||||||||
| Endeavor Court, Nokomis, FL |
— | 6,100 | — | |||||||||
| Fleet Maintenance Building, North Venice, FL |
— | 16,000 | — | |||||||||
| Sarasota Warehouse, Bradenton, FL |
— | — | 48,000 | |||||||||
|
|
|
|
|
|
|
|||||||
| 864,000 | 57,000 | 48,000 | ||||||||||
|
|
|
|
|
|
|
|||||||
During 2011, we consolidated our Salisbury, North Carolina facility into our Florida facility. At this time there are no operations at the Salisbury, North Carolina facility, however we are not actively marketing the building for sale.
Our leases listed above expire between January 2014 and January 2016. Each of the leases provides for a fixed annual rent. The leases require us to pay taxes, insurance and common area maintenance expenses associated with the properties.
All of our owned properties secure borrowings under our credit agreement. We believe all of these operating facilities are adequate in capacity and condition to service existing customer needs.
We are involved in various claims and lawsuits incidental to the conduct of our business in the ordinary course. We carry insurance coverage in such amounts in excess of our self-insured retention as we believe to be reasonable under the circumstances and that may or may not cover any or all of our liabilities in respect of claims and lawsuits. We do not believe that the ultimate resolution of these matters will have a material adverse impact on our financial position, cash flows or results of operations.
Item 4. MINE SAFETY DISCLOSURES
Not Applicable
| Item 5. | MARKET FOR REGISTRANT’S COMMON EQUITY, RELATED STOCKHOLDER MATTERS AND ISSUER PURCHASES OF EQUITY SECURITIES |
Our Common Stock is traded on the NASDAQ Global Market ® under the symbol “PGTI”. On March 9, 2012, the closing price of our Common Stock as reported on the NASDAQ Global Market was $1.74. The approximate number of stockholders of record of our Common Stock on that date was 50, although we believe that the number of beneficial owners of our Common Stock is substantially greater.
9
Table of Contents
The table below sets forth the price range of our Common Stock during the periods indicated:
| High | Low | |||||||
| 2011 |
||||||||
|
1st Quarter |
$ | 2.62 | $ | 2.16 | ||||
|
2nd Quarter |
$ | 2.50 | $ | 1.62 | ||||
|
3rd Quarter |
$ | 2.12 | $ | 1.25 | ||||
|
4th Quarter |
$ | 1.44 | $ | 0.98 | ||||
| High | Low | |||||||
| 2010 |
||||||||
|
1st Quarter |
$ | 2.39 | $ | 1.50 | ||||
|
2nd Quarter |
$ | 3.70 | $ | 1.87 | ||||
|
3rd Quarter |
$ | 2.76 | $ | 1.90 | ||||
|
4th Quarter |
$ | 2.70 | $ | 2.02 | ||||
Dividends
We do not pay a regular dividend. Any determination relating to dividend policy will be made at the discretion of our board of directors. The terms of our senior secured credit facility governing our notes currently restrict our ability to pay dividends.
Securities Authorized for Issuance under Equity Compensation Plans
The information required by this item appears in our definitive proxy statement for our annual meeting of stockholders under the caption “Security Ownership of Certain Beneficial Owners and Management” and “Equity Compensation Plan Information,” which information is incorporated herein by reference.
Unregistered Sales of Equity Securities
None.
10
Table of Contents
Performance Graph
The following graphs compare the percentage change in PGT, Inc.’s cumulative total stockholder return on its Common Stock with the cumulative total stockholder return of the Standard & Poor’s Building Products Index and the NASDAQ Composite Index over the period from December 30, 2006 to December 31, 2011.
COMPARISON OF 60 MONTH CUMULATIVE TOTAL RETURN*
AMONG PGT, INC., THE NASDAQ COMPOSITE INDEX,
AND THE S&P BUILDING PRODUCTS INDEX
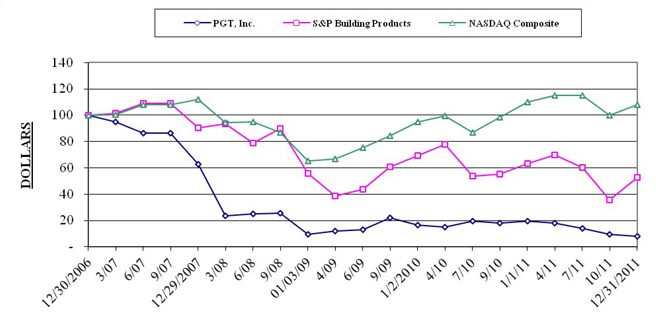
| * | $100 invested on 12/30/2006 in stock or in index-including reinvestment of dividends for 60 months ending December 31, 2011. |
11
Table of Contents
Item 6. SELECTED FINANCIAL DATA
The following table sets forth selected historical consolidated financial information and other data as of and for the periods indicated and have been derived from our audited consolidated financial statements.
All information included in the following tables should be read in conjunction with “Management’s Discussion and Analysis of Financial Condition and Results of Operations” contained in Item 7, and with the consolidated financial statements and related notes in Item 8. All years consisted of 52 weeks except for the year ended January 3, 2009, which consisted of 53 weeks. We do not believe the impact on comparability of results is significant.
| Consolidated Selected Financial Data | Year Ended December 31, |
Year Ended January 1, |
Year Ended January 2, |
Year Ended January 3, |
Year Ended December 29, |
|||||||||||||||
| (in thousands except per share data) |
2011 | 2011 | 2010 | 2009 | 2007 | |||||||||||||||
| Net sales |
$ | 167,276 | $ | 175,741 | $ | 166,000 | $ | 218,556 | $ | 278,394 | ||||||||||
| Cost of sales |
128,171 | 125,615 | 121,821 | 150,633 | 187,920 | |||||||||||||||
|
|
|
|
|
|
|
|
|
|
|
|||||||||||
| Gross margin |
39,105 | 50,126 | 44,179 | 67,923 | 90,474 | |||||||||||||||
| Impairment charges (1) |
5,959 | 5,561 | 742 | 187,748 | 826 | |||||||||||||||
| Selling, general and administrative expenses |
48,619 | 53,879 | 51,703 | 62,753 | 76,473 | |||||||||||||||
|
|
|
|
|
|
|
|
|
|
|
|||||||||||
| (Loss) income from operations |
(15,473 | ) | (9,314 | ) | (8,266 | ) | (182,578 | ) | 13,175 | |||||||||||
| Interest expense |
4,168 | 5,123 | 6,698 | 9,283 | 11,404 | |||||||||||||||
| Gain on sale of assets |
(875 | ) | — | — | — | — | ||||||||||||||
| Other expense (income), net (2) |
456 | (19 | ) | 37 | (40 | ) | 692 | |||||||||||||
|
|
|
|
|
|
|
|
|
|
|
|||||||||||
| (Loss) income before income taxes |
(19,222 | ) | (14,418 | ) | (15,001 | ) | (191,821 | ) | 1,079 | |||||||||||
| Income tax (benefit) expense |
(2,324 | ) | 77 | (5,584 | ) | (28,789 | ) | 456 | ||||||||||||
|
|
|
|
|
|
|
|
|
|
|
|||||||||||
| Net (loss) income |
$ | (16,898 | ) | $ | (14,495 | ) | $ | (9,417 | ) | $ | (163,032 | ) | $ | 623 | ||||||
|
|
|
|
|
|
|
|
|
|
|
|||||||||||
| Net (loss) income per common share: |
||||||||||||||||||||
| Basic |
$ | (0.31 | ) | $ | (0.29 | ) | $ | (0.26 | ) | $ | (5.08 | ) | $ | 0.02 | ||||||
| Diluted |
$ | (0.31 | ) | $ | (0.29 | ) | $ | (0.26 | ) | $ | (5.08 | ) | $ | 0.02 | ||||||
| Weighted average shares outstanding: |
||||||||||||||||||||
| Basic |
53,659 | 50,174 | 36,241 | 32,104 | 29,163 | |||||||||||||||
| Diluted |
53,659 | 50,174 | 36,241 | 32,104 | 30,207 | |||||||||||||||
| Other financial data: |
||||||||||||||||||||
| Depreciation |
$ | 7,590 | $ | 9,180 | $ | 10,435 | $ | 11,518 | $ | 10,418 | ||||||||||
| Amortization |
6,502 | 6,028 | 5,731 | 5,570 | 5,570 | |||||||||||||||
| As Of December 31, 2011 |
As Of January 1, 2011 |
As Of January 2, 2010 |
As Of January 3, 2009 |
As Of December 29, 2007 |
||||||||||||||||
| Balance Sheet data: |
||||||||||||||||||||
| Cash and cash equivalents |
$ | 10,940 | $ | 22,012 | $ | 7,417 | $ | 19,628 | $ | 19,479 | ||||||||||
| Total assets |
142,835 | 169,119 | 173,630 | 200,617 | 407,865 | |||||||||||||||
| Total debt, including current portion |
45,550 | 50,163 | 68,268 | 90,366 | 130,000 | |||||||||||||||
| Shareholders’ equity |
67,362 | 83,042 | 68,209 | 74,185 | 210,472 | |||||||||||||||
| (1) | In 2011 and 2008, amounts relate to intangible asset impairment charges. In 2010, 2009, and 2007, amounts relate to write-down of the value of our Salisbury, North Carolina and Lexington, North Carolina properties, and certain other equipment of the Company. See Notes 2 and 7 in Item 8. |
| (2) | Relates mainly to write-off of deferred financing costs in 2011, and derivative financial instruments in other years. |
12
Table of Contents
Item 7. Management’s Discussion and Analysis of Financial Condition and Results of Operations
Our Management’s Discussion and Analysis of Financial Condition and Results of Operations (“MD&A”) should be read in conjunction with our Consolidated Financial Statements and related Notes included in Item 8. We also advise you read the risk factors in Item 1A. Our MD&A is presented in seven sections:
| • | Executive Overview; |
| • | Results of Operations; |
| • | Liquidity and Capital Resources; |
| • | Disclosures of Contractual Obligations and Commercial Commitments; |
| • | Critical Accounting Estimates; |
| • | Recently Issued Accounting Standards; and |
| • | Forward Outlook |
EXECUTIVE OVERVIEW
Sales and Operations
On February 23, 2012, we issued a press release and on Friday, February 24, 2012, held a conference call to review the results of operations for our fourth quarter and fiscal year ended December 31, 2011. During the call, we also discussed current market conditions and progress made regarding certain of our initiatives. The overview and estimates contained in this report are consistent with those given in our press release and discussed on the call. We are neither updating nor confirming that information.
During 2011, we started and completed the consolidation of our Salisbury, North Carolina facility into our Florida operations. This entailed moving the contents of a 379,000 square foot facility into a fully functioning 470,000 square foot facility, and hiring and training 500 new employees. During the second half of the year we realized savings of approximately $3.0 million, and expect to realize additional savings of $3.0—$3.5 million in the first half of 2012. Accordingly, we are expected to realize $6.0—$6.5 million from consolidation.
We accomplished all this during a year where we focused our sales strategy back to our core market of Florida, and shored up our international sale force, working in an industry that from a residential point of view may have been the most difficult since the recession began. Annually, single family home starts (not including multi-family townhomes, condos, etc) were the lowest in recent history.
Sales in 2011 decreased $8.4 million, or 4.8%, compared to 2010, due mainly to decreased sales in our out of state market, where sales decreased $9.0 million, or 35.3%. The decrease was due mainly to our decision to reduce our efforts in these markets. Our international sales also decreased by $0.6 million, or 7.6%. However our Florida sales, which represent 86% of our total sales, increased $1.2 million, or 0.8%.
By product line, sales in our non-impact line decreased $6.8 million, or 12.8%. This decrease is driven by our Vinyl Non-impact products which decreased $6.3 million, or 33.2%, due almost entirely to reduced efforts out of state, where sales fell $6.2 million, or 83.9%. Sales in our non-impact aluminum line and our EZE-Breeze line were flat year over year. Sales in our impact products decreased $1.6 million, or 1.3%. This decrease was driven by our Architectural System sales which decreased $5.2 million, or 53.2%. Offsetting this decrease was our PremierVue line whose sales increased $3.8 million, or 110%. This increase was partially driven by the launch of our Crystal Award winning vinyl sliding glass door line. The WinGuard line was basically flat year over year.
Looking at 2012 and beyond, the housing industry continues to suffer from negative factors. Both new construction and remodeling activity remain well below past levels and we believe will do so through the first half of 2012. While we have seen indicators suggesting the industry is ready for steady improvement, our continued sluggish economy and high unemployment in our core market of Florida constantly remind us that the timetable for true, sustainable growth remains uncertain at best.
Liquidity and Cash Flow
We began 2007 with net debt of $128.5 million and ended fiscal 2010 with net debt of $28.0 million. During those four years, we reduced our debt by combining internally generated cash of $56.2 million with net proceeds from the 2008 and 2010 rights offerings of $44.3 million. Our net debt increased by $3.5 million during 2011 due to consolidation payments.
On June 23, 2011, we refinanced our long-term debt which would have otherwise become due in February 2012. This debt agreement, a copy of which was filed as part of an 8-K with the SEC on June 23, 2011, among other things, extends the due date of our debt to June 2016 and reduces the interest rate on the debt by 100 basis points (5.75 % initially with the potential for further improvement as leverage decreases).
Acquisition
On December 17, 2010, we exercised our option and acquired the intellectual property assets of Hurricane Window and Door Factory, LLC (“Hurricane”) of Ft. Myers, Florida. With this acquisition, we acquired, among other things, all of the intellectual property underlying our PremierVue line of vinyl impact-resistant windows and doors for the single- and multi-family residential markets. The purchase price was $2.8 million of which $2.6 million was paid at closing, and the remainder was paid during 2011. As of January 1, 2011, $0.2 million is included in accrued liabilities in the accompanying balance sheet. The carrying value of the intangible assets of $1.8 million and $2.8 million, respectively, is included in other intangible assets, net, in the accompanying balance sheets at December 31, 2011, and January 1, 2011. The intangible assets are being amortized on the straight-line basis over their estimated useful lives of approximately 3 years. Amortization expense of $1.0 million and less than $0.1million is included in selling, general and administrative expenses in the accompanying consolidated statements of operations for the years ended December 31, 2011, and January 1, 2011, respectively.
13
Table of Contents
Consolidation and Restructurings
On December 3, 2010, we announced that our Salisbury, North Carolina operations would be transferred to Venice, Florida to consolidate our window and door production at our Florida manufacturing facility. During 2011, we recorded consolidation charges of $4.1 million, which includes $1.3 million of severance expense and $2.8 million of moving expenses. The classification of charges were $3.4 million within cost of goods sold, and the remaining $0.7 million within selling, general and administrative expenses in the accompanying consolidated statement of operations. The total charges recorded through December 31, 2011, for the consolidation are $6.2 million, $2.1 million having been recorded in December 2010, of which approximately less than $0.1 million and $1.8 million are accrued as of December 31, 2011, and January 1, 2011, respectively, and are classified in accounts payable and accrued liabilities within the accompanying condensed consolidated balance sheets. The unpaid severance expense as of December 31, 2011, is expected to be disbursed prior to the end of 2012. (Note 8)
On January 13, 2009, March 10, 2009, September 24, 2009 and November 12, 2009, we announced restructurings as a result of continued analysis of our target markets, internal structure, projected run-rate, and efficiency. As a result of the restructurings, we recorded restructuring charges of $5.4 million in the accompanying consolidated statement of operations for the year ended January 2, 2010, of which $3.1 million is classified within cost of goods sold. The remaining $2.3 million is classified within selling, general and administrative expenses in the accompanying consolidated statement of operations for the year ended January 2, 2010. Of the $5.4 million, $2.6 million was disbursed in the first quarter of 2009.
The following table provides information with respect to the accrual for the severance for the consolidation and restructuring costs:
| Beginning of Year |
Charged to Expense |
Disbursed in Cash |
End of Year |
|||||||||||||
| (in thousands) | ||||||||||||||||
| Year ended December 31, 2011: |
||||||||||||||||
| Consolidation |
$ | 1,812 | $ | 1,286 | $ | (3,083 | ) | $ | 15 | |||||||
|
|
|
|
|
|
|
|
|
|||||||||
| For the year ended December 31, 2011 |
$ | 1,812 | $ | 1,286 | $ | (3,083 | ) | $ | 15 | |||||||
|
|
|
|
|
|
|
|
|
|||||||||
| Year ended January 1, 2011: |
||||||||||||||||
| 2009 Restructuring |
$ | 898 | $ | — | $ | (898 | ) | $ | — | |||||||
| Consolidation |
— | 2,053 | (241 | ) | 1,812 | |||||||||||
|
|
|
|
|
|
|
|
|
|||||||||
| For the year ended January 1, 2011 |
$ | 898 | $ | 2,053 | $ | (1,139 | ) | $ | 1,812 | |||||||
|
|
|
|
|
|
|
|
|
|||||||||
| Year ended January 2, 2010: |
||||||||||||||||
| 2008 Restructuing |
$ | 332 | $ | — | $ | (332 | ) | $ | — | |||||||
| 2009 Restructuring |
— | 5,395 | (4,497 | ) | 898 | |||||||||||
|
|
|
|
|
|
|
|
|
|||||||||
| For the year ended January 2, 2010 |
$ | 332 | $ | 5,395 | $ | (4,829 | ) | $ | 898 | |||||||
|
|
|
|
|
|
|
|
|
|||||||||
14
Table of Contents
Non-GAAP Financial Measures – Items Affecting Comparability
Below is a presentation of EBITDA, a non-GAAP measure, which we believe is useful information for investors (in thousands):
| Year Ended | ||||||||||||
| December 31, 2011 |
January 1, 2011 |
January 2, 2010 |
||||||||||
| Net loss |
$ | (16,898 | ) | $ | (14,495 | ) | $ | (9,417 | ) | |||
| Interest expense |
4,168 | 5,123 | 6,698 | |||||||||
| Income tax (benefit) expense |
(2,324 | ) | 77 | (5,584 | ) | |||||||
| Depreciation |
7,590 | 9,180 | 10,435 | |||||||||
| Amortization |
6,502 | 6,028 | 5,731 | |||||||||
|
|
|
|
|
|
|
|||||||
| EBITDA (1)(2) |
$ | (962 | ) | $ | 5,913 | $ | 7,863 | |||||
|
|
|
|
|
|
|
|||||||
| (1) Includes the impact of the following : |
||||||||||||
| Consolidation/restructuring charges (a) |
$ | (4,106 | ) | $ | (2,053 | ) | $ | (5,395 | ) | |||
| Impairment charges (b) |
(5,959 | ) | (5,561 | ) | (742 | ) | ||||||
| Gain on equipment sales (c ) |
875 | — | — | |||||||||
| Manufacturing inefficienies (d) |
(4,005 | ) | — | — | ||||||||
| Write-off deferred financing costs (e) |
(420 | ) | — | — | ||||||||
| (a) | Represents charges related to consolidation actions taken in 2011and 2010 and restructuring actions taken in 2009. These charges relate primarily to employee separation costs and move related expense. |
| (b) | In 2011 the amount relates to the write-down of the value of our trade names. The 2010 amount represents assets related to the write-down of the Salisbury, North Carolina facility. The 2009 amount represents the write-down of the value of the Lexington, North Carolina facility. |
| (c) | Represents gains related to the sale of equipment previously used in the North Carolina operations. These gains are included in other income for the year ended December 31, 2011. |
| (d) | Represents temporary excess labor and scrap expense incurred as a result of the consolidation actions taken in 2011. The amounts were determined by comparing the manufacturing results during consolidation with normalized pre-consolidation results. These expenses are included in cost of goods sold for the year ended December 31, 2011. |
| (e) | Represents the write off of the remaining unamortized fees associated with our previous financing agreement. These charges are included in other expense for the year ended December 31, 2011. |
| (2) | EBITDA is defined as net income plus interest expense (net of interest income), income taxes, depreciation, and amortization. EBITDA is a measure commonly used in the window and door industry, and we present EBITDA to enhance your understanding of our operating performance. We use EBITDA as one criterion for evaluating our performance relative to that of our peers. We believe that EBITDA is an operating performance measure that provides investors and analysts with a measure of operating results unaffected by differences in capital structures, capital investment cycles, and ages of related assets among otherwise comparable companies. While we believe EBITDA is a useful measure for investors, it is not a measurement presented in accordance with United States generally accepted accounting principles, or GAAP. You should not consider EBITDA in isolation or as a substitute for net income, cash flows from operations, or any other items calculated in accordance with GAAP. |
15
Table of Contents
RESULTS OF OPERATIONS
Analysis of Selected Items from our Consolidated Statements of Operations
| Year Ended | Percent Change | |||||||||||||||||||
| December 31, | January 1, | January 2, | Increase / (Decrease) | |||||||||||||||||
| 2011 | 2011 | 2010 | 2011-2010 | 2010-2009 | ||||||||||||||||
| (in thousands, except per share amounts and percentages) | ||||||||||||||||||||
| Net sales |
$ | 167,276 | $ | 175,741 | $ | 166,000 | (4.8 | %) | 5.9 | % | ||||||||||
| Cost of sales |
128,171 | 125,615 | 121,821 | 2.0 | % | 3.1 | % | |||||||||||||
|
|
|
|
|
|
|
|||||||||||||||
| Gross margin |
39,105 | 50,126 | 44,179 | (22.0 | %) | 13.5 | % | |||||||||||||
| As a percentage of sales |
23.4 | % | 28.5 | % | 26.6 | % | ||||||||||||||
| Impairment charges |
5,959 | 5,561 | 742 | |||||||||||||||||
| SG&A expenses |
48,619 | 53,879 | 51,703 | (9.8 | %) | 4.2 | % | |||||||||||||
|
|
|
|
|
|
|
|||||||||||||||
| SG&A expenses as a percentage of sales |
29.1 | % | 30.7 | % | 31.1 | % | ||||||||||||||
| Loss from operations |
(15,473 | ) | (9,314 | ) | (8,266 | ) | ||||||||||||||
| Interest expense, net |
4,168 | 5,123 | 6,698 | |||||||||||||||||
| Gain on sale of assets |
(875 | ) | — | — | ||||||||||||||||
| Other expense (income), net |
456 | (19 | ) | 37 | ||||||||||||||||
| Income tax (benefit) expense |
(2,324 | ) | 77 | (5,584 | ) | |||||||||||||||
|
|
|
|
|
|
|
|||||||||||||||
| Net loss |
$ | (16,898 | ) | $ | (14,495 | ) | $ | (9,417 | ) | |||||||||||
|
|
|
|
|
|
|
|||||||||||||||
| Net loss per common share: |
||||||||||||||||||||
| Diluted |
$ | (0.31 | ) | $ | (0.29 | ) | $ | (0.26 | ) | |||||||||||
|
|
|
|
|
|
|
|||||||||||||||
2011 Compared with 2010
Net sales
Net sales for 2011 were $167.3 million, an $8.4 million, or 4.8%, decrease in sales from $175.7 million in the prior year.
The following table shows net sales classified by major product category (in millions, except percentages):
| Year Ended | ||||||||||||||||||||
| December 31, 2011 | January 1, 2011 | |||||||||||||||||||
| Sales | % of sales | Sales | % of sales | % change | ||||||||||||||||
| Product category: |
||||||||||||||||||||
| Impact Window and Door Products |
$ | 120.9 | 72.3 | % | $ | 122.5 | 69.7 | % | (1.3 | %) | ||||||||||
| Other Window and Door Products |
46.4 | 27.7 | % | 53.2 | 30.3 | % | (12.8 | %) | ||||||||||||
|
|
|
|
|
|
|
|
|
|||||||||||||
| Total net sales |
$ | 167.3 | 100.0 | % | $ | 175.7 | 100.0 | % | (4.8 | %) | ||||||||||
|
|
|
|
|
|
|
|
|
|||||||||||||
Net sales of our impact window and door products, which includes our WinGuard, Architectural Systems and PremierVue products were $120.9 million in 2011, a decrease of $1.6 million, or 1.3%, from $122.5 million in net sales for the prior year. This decrease was driven mainly by a $5.2 million, or 53.2%, decrease in our Architectural Systems products based on the softness in the market. Also contributing to the decrease are our aluminum WinGuard sales of 0.9%. Offsetting these decreases are increases in our Vinyl WinGuard line of $0.6 million, or 3.8%, and our PremierVue line of $3.8 million, or 110%, both of which benefited by our 2011 launch of our Crystal Award winning sliding glass door, that contributed $1.4 million to this sales increase. Our impact window and door products, especially in our repair and remodeling market, continue to be impacted by the lack of storm activity during the five most recent hurricane seasons in Florida.
16
Table of Contents
Net sales of other window and door products, which includes aluminum and vinyl non-impact, and EZE-Breeze, were $46.4 million in 2011, a decrease of $6.8 million, or 12.8%, from $53.2 million for the prior year. This decrease was mainly due to the $6.3 million, or 33.2%, decrease in vinyl non-impact products, based on our decision to reduce our efforts in certain out of state markets. Also contributing to this decrease is a $1.0 million, or 4.6%, decrease in our aluminum products. EZE-Breeze sales were essentially flat from 2010 to 2011.
Gross margin
Gross margin was $39.1 million in 2011, a decrease of $11.0 million, or 22.0%, from $50.1 million in the prior year. The gross margin percentage was 23.4% in 2011 compared to 28.5% in the prior year. Gross margin included charges of $3.4 million in 2011 and $0.9 million in 2010 related to the consolidation of our North Carolina facility into our Florida facility. Cost of goods sold was also negatively impacted by temporary excess labor and scrap expense of $4.0 million as a result of the consolidation actions taken. This amount was determined by comparing the manufacturing results during consolidation with normalized pre-consolidation results. We returned to pre-consolidation levels during the third quarter of 2011. Adjusting for these charges gross margin was 27.8% and 29.0% in 2011 and 2010 respectively. The 1.2% decrease in adjusted gross margin as a percent of sales is due to lower sales volume and reduced leverage of fixed costs approximately of $4.1 million, or (1.1%), cost increases and other spending increases of $3.3 million, or (0.9%), and $1.8 million of higher than expected material usage, or (0.4%). Offsetting these decreases was a price increase during the first quarter, and a mix shift to more impact product, which carry higher gross margin, which increased gross margin by $3.4 million, or 0.9%, and consolidating savings of $1.3 million, or 0.3%, in 2011.
Impairment charges
We performed our annual assessment of our trade names as of December 31, 2011, which indicated that an impairment was present resulting in a non-cash charge of $6.0 million. In 2010, there was an impairment charge of $5.6 million related primarily to the closing of our Salisbury, North Carolina facility.
Selling, general and administrative expenses
Selling, general and administrative expenses were $48.6 million, a decrease of $5.3 million, or 9.8%, from $53.9 million in the prior year. Selling, general, and administrative expenses includes charges of $0.3 million in 2011 and $1.2 million in 2010 related to the consolidation actions taken in 2010. Excluding these charges selling, general and administrative expenses decreased $4.3 million and as a percentage of sales were 28.9% in 2011 compared to 30.0% in 2010. This decrease was due mainly to a decrease in non-cash stock compensation of $1.8 million and cost savings from the consolidation of $1.7 million.
Interest expense
Interest expense was $4.2 million in 2011, a decrease of $0.9 million from $5.1 million in the prior year. During 2011 we prepaid $4.5 million of debt resulting in a lower average level of debt when compared to 2010. The interest rate on our debt decreased from 6.75% at the end of 2010 to 5.75% at the end of 2011 due to the refinancing of debt which decreased our interest rates in accordance with our tiered interest rate structure.
Gain on sale of assets
In 2011, we sold two non-essential assets from our North Carolina facility for a gain of $0.9 million.
Other expenses (income), net
There was other expense of $0.5 million and less than $0.1 million of other income in 2011 and 2010, respectively. In 2011, the expense related to the write-off of the deferred financing costs from our prior debt and in 2010, the other income relates to effective over-hedges of aluminum.
Income tax (benefit) expense
Our effective combined federal and state tax rate was a benefit of 12.1% and an expense of 0.5% for the years ended December 31, 2011 and January 1, 2011, respectively. The 2011 tax benefit relates to the impairment charge on our trade names and was a deferred benefit. All deferred tax assets created in 2011 were fully reserved with additional valuation allowances. The 0.5% expense in 2010, relates to an adjustment to the provision recorded at the end of 2009 to the tax return as filed. All net deferred tax assets created in 2010 were fully reserved with additional valuation allowances. Excluding the effects of these items, our 2011 and 2010 effective tax rates would have been 38.8% and 35.6% for each year, respectively.
17
Table of Contents
2010 Compared with 2009
Net sales
Net sales for 2010 were $175.7 million, a $9.7 million, or 5.9%, increase in sales from $166.0 million in the prior year.
The following table shows net sales classified by major product category (in millions, except percentages):
| Year Ended | ||||||||||||||||||||
| January 1, 2011 | January 2, 2010 | |||||||||||||||||||
| Sales | % of sales | Sales | % of sales | % change | ||||||||||||||||
| Product category: |
||||||||||||||||||||
| Impact Window and Door Products |
$ | 122.5 | 69.7 | % | $ | 120.3 | 72.5 | % | 1.8 | % | ||||||||||
| Other Window and Door Products |
53.2 | 30.3 | % | 45.7 | 27.5 | % | 16.4 | % | ||||||||||||
|
|
|
|
|
|
|
|
|
|||||||||||||
| Total net sales |
$ | 175.7 | 100.0 | % | $ | 166.0 | 100.0 | % | 5.9 | % | ||||||||||
|
|
|
|
|
|
|
|
|
|||||||||||||
Net sales of impact windows and door products were $122.5 million in 2010, an increase of $2.2 million, or 1.8%, from $120.3 million in net sales for the prior year. The increase in sales of our impact products was driven mainly by an increase in our vinyl WinGuard sales of 20%, and sales of our new PremierVue products introduced in the third quarter of 2009. Offsetting this increase is a decrease in aluminum WinGuard of 2%. WinGuard sales, especially into our repair and remodeling market, continued to be impacted by the lack of storm activity during the four hurricane seasons proceeding December 2010 in Florida.
Net sales of other window and door products were $53.2 million in 2010, an increase of $7.5 million, or 16.4%, from $45.7 million for the prior year. This increase was due mainly to the increase in vinyl non-impact products, including the new products launched in each of the last three years. In total, we had an increase in sales of $7.3 million for those products. One of the aforementioned products is the vinyl non-impact product designed for Florida that was launched in 2010. Sales for that product were $2.6 million during the year.
Gross margin
Gross margin was $50.1 million in 2010, an increase of $5.9 million, or 13.5%, from $44.2 million in the prior year. The gross margin percentage was 28.5% in 2010 compared to 26.6% in the prior year. Cost of goods sold includes charges of $0.9 million in 2010 and $3.1 million in 2009 related to the consolidation actions taken in 2010 and restructuring actions taken in 2009, respectively. Adjusting for these charges, gross margin was 29.0% in 2010 and 28.5% in 2009. The 0.5% increase in adjusted gross margin as a percent of sales is largely due to savings generated from cost saving initiatives (1.3%), the increase in sales allowing us to increase our leverage on fixed costs (1.3%), and a decrease in the cost of aluminum (0.3%). Partially offsetting these increases in gross margin was a shift to non-impact products (2.3%), which carry a contribution margin of approximately 21%. In comparison, our various impact products, both aluminum and vinyl, have contribution margins that range from 40% to 55%.
Impairment charges
In 2010, there was an impairment charge of $5.6 million related primarily to the closing of our Salisbury, North Carolina facility. Impairment charges totaled $0.7 million in 2009 for our Lexington, North Carolina manufacturing facility for which we entered into an agreement to list the property for sale in January 2010 and a contract to sell it in January 2011.
Selling, general and administrative expenses
Selling, general and administrative expenses were $53.9 million, an increase of $2.2 million, or 4.2%, from $51.7 million in the prior year. Selling, general and administrative expenses includes charges of $1.2 million in 2010 and $2.3 million in 2009 related to the consolidation actions taken in 2010 and restructuring actions taken in 2009, respectively. Excluding the charges for consolidation in 2010 and restructuring in 2009, selling, general and administrative expense increased $3.3 million and as a percentage of sales was 30.0% in 2010 compared to 29.8% in 2009. This increase was due mainly to an increase in bonuses of $2.1 million based on achieved targets, non-cash stock compensation of $1.8 million, an increase in commissions of $0.5 million due in part to an increase in sales and an increase in fuel of $0.4 million due to the increase in diesel fuel prices and the increase in sales. Offsetting these partially was a $1.4 million decrease in personnel-related cost due to lower employment levels related to our prior year restructurings.
18
Table of Contents
Interest expense
Interest expense was $5.1 million in 2010, a decrease of $1.6 million from $6.7 million in the prior year. During 2010 we prepaid $18.0 million of debt resulting in a lower average level of debt when compared to 2009. The interest rate on our debt decreased from 7.25% at the end of 2009 to 6.75% at the end of 2010 due to a decrease in our leverage ratio which decreased our interest rates in accordance with our tiered interest rate structure.
Other expense (income), net
There was other income of less than $0.1 million in 2010, and other expense of less than $0.1 million in 2009. In both years, the other (income) expense relates to effective over-hedges of aluminum.
Income tax expense (benefit)
Our effective combined federal and state tax rate was an expense of 0.5% and a benefit of 37.2% for the years ended January 1, 2011 and January 2, 2010, respectively. The 0.5% expense relates to an adjustment to the provision recorded at the end of 2009 to the tax return as filed. All net deferred tax assets created in 2010 were fully reserved with additional valuation allowances. The 37.2% tax rate in 2009 relates primarily to a loss carry-back receivable of approximately $3.7 million related to legislation allowing companies to carry-back 2009 or 2008 losses up to 5 years, as well as an income tax allocation of $1.8 million between current operations and other comprehensive income. All net other deferred tax assets created in 2009 were fully reserved with additional valuation allowances. Excluding the effects of these items, our 2010 and 2009 effective tax rates would have been 35.6% and 34.6% for each year, respectively.
LIQUIDITY AND CAPITAL RESOURCES
Our principal source of liquidity is cash flow generated by operations, supplemented by borrowings under our credit facility. This cash generating capability provides us with financial flexibility in meeting operating and investing needs. Our primary capital requirements are to fund working capital needs, and to meet required debt payments, including debt service payments on our credit facilities and fund capital expenditures.
2010 Rights Offering
On January 29, 2010, the Company filed Amendment No. 1 to the Registration Statement on Form S-1 filed on December 24, 2009 relating to a previously announced offering of rights to purchase 20,382,326 shares of the Company’s common stock with an aggregate value of approximately $30.6 million. The registration statement relating to the rights offering was declared effective by the United States Securities and Exchange Commission on February 10, 2010, and the Company distributed to each holder of record of the Company’s common stock as of close of business on February 8, 2010, at no charge, one (1) non-transferable subscription right for every one and three-quarters (1.75) shares of common stock held by such holder under the basic subscription privilege. Each whole subscription right entitled its holder to purchase one share of PGT’s common stock at the subscription price of $1.50 per share. The rights offering also contained an over-subscription privilege that permitted all basic subscribers to purchase additional shares of the Company’s common stock up to an amount equal to the amount available to each such holder under the basic subscription privilege. Shares issued to each participant in the over-subscription were determined by calculating each subscriber’s percentage of the total shares over-subscribed, multiplied by the number of shares available in the over-subscription privilege. The rights offering expired on March 12, 2010.
The rights offering was 90.0% subscribed resulting in the Company distributing 18,336,368 shares of its common stock, including 15,210,184 shares under the basic subscription privilege and 3,126,184 under the over-subscription privilege, representing a 74.6% basic subscription participation rate. There were requests for 3,126,184 shares under the over-subscription privilege representing an allocation rate of 100% to each over-subscriber. Of the 18,336,368 shares issued, 13,333,332 shares were issued to JLL Partners Fund IV (“JLL”) the Company’s majority shareholder, including 10,719,389 shares issued under the basic subscription privilege and 2,613,943 shares issued under the over-subscription privilege. Prior to the rights offering, JLL held 18,758,934 shares, or 52.6%, of the Company’s outstanding common stock. With the completion of the rights offering, the Company has 54,005,439 total shares of common stock outstanding of which JLL holds 59.4%.
19
Table of Contents
Net proceeds of $27.5 million from the rights offering were used to repay a portion of the outstanding indebtedness under our amended credit agreement in the amount of $15.0 million, and for general corporate purposes in the amount of $12.5 million.
Consolidated Cash Flows
Operating activities. Cash used in operating activities was $1.7 million for 2011 compared to cash provided by operating activities which was $12.3 million for the prior year. In 2010, cash provided by operating activities was up $2.8 million from $9.5 million in 2009. The decrease in cash flows from operations between 2011 and 2010 was due mainly to additional cash paid for the consolidation of approximately $10 million and the impact of the tax refund of $3.7 million received during 2010. The increase in cash flows from operations between 2010 and 2009 is due mainly to the impact of the tax refund of $3.7 million received during 2010, and the increase in cash is consistent with the increase in sales. Offsetting this partially is the increase in disbursements.
| Direct Operating Cash Flows | ||||||||||||
| (in millions) | 2011 | 2010 | 2009 | |||||||||
| Collections from customers |
$ | 169.8 | $ | 178.0 | $ | 170.2 | ||||||
| Other cash collections |
3.4 | 2.6 | 2.8 | |||||||||
| Disbursements to vendors |
(107.8 | ) | (106.5 | ) | (94.7 | ) | ||||||
| Personnel related disbursements |
(64.4 | ) | (61.2 | ) | (63.6 | ) | ||||||
| Debt service costs (interest) |
(2.7 | ) | (4.3 | ) | (6.2 | ) | ||||||
| Other cash activity, net |
— | 3.7 | 1.0 | |||||||||
|
|
|
|
|
|
|
|||||||
| Cash (used in) provided by operations |
$ | (1.7 | ) | $ | 12.3 | $ | 9.5 | |||||
|
|
|
|
|
|
|
|||||||
Other cash activity, net, includes $3.7 million and $1.1 million in federal and state tax refunds in the years ended January 1, 2011 and January 2, 2010, respectively. The majority of other cash collections are from scrap aluminum sales.
Day’s sales outstanding (DSO), which we calculate as accounts receivable divided by average daily sales, was 39 days on December 31, 2011, compared to 42 days on January 1, 2011, and 41 days on January 2, 2010. The decrease in DSO from 2010 to 2011 is the result of improved collection efforts. The increase in DSO from 2009 to 2010 was primarily due to collection issues with three select customers, one of which, amounting to $0.6 million, was fully written off during 2010, as well as the effect on our customer base of the decline in the housing market in Florida and the overall economy.
The gross amount of receivables from the remaining two customers, neither of which is greater than $0.6 million, is $1.0 million as of December 31, 2011, of which $0.9 million is reserved. As of March 9, 2012, payments of less than $0.1 million have been received pursuant to such payment plans.
Inventory on hand as of December 31, 2011, increased $1.1 million as compared to January 1, 2011. Inventory turns for the year ended December 31, 2011, decreased to 10.9 from 11.2 as compared to the year ended January 1, 2011. Inventory turns for the year ended January 1, 2011, decreased to 11.2 from 12.4 as compared to the year ended January 2, 2010. We have increased our inventory to have (i) raw materials required to support new product launches; (ii) an increase in safety stocks on certain items to ensure an adequate supply of availability given a sudden increase in demand and our short lead-times; and (iii) adequate lead times for raw materials purchased from overseas suppliers in bulk supply.
Management monitors and evaluates raw material inventory levels based on the need for each discrete item to fulfill short-term requirements calculated from current order patterns and to provide appropriate safety stock. Because all our products are made-to-order, the Company has only a small amount of finished goods and work in progress inventory. Because of these factors, our inventories are not excessive, and we believe the value of such inventories will be realized.
Investing activities. Cash used in investing activities was $1.8 million for 2011 compared to cash used in investing activities of $6.0 million for 2010. The decrease in cash used in investing activities was due to a decrease in capital spending of $2.4 million for the 2010 purchase of assets related to the Hurricane Window & Door Factory acquisition along with the proceeds from sale of assets for $1.6 million and the impact of net cash used for excess margin returns for settlements of forward contracts related to our aluminum hedging program. This was offset by an increase in other capital purchases of $0.3 million.
20
Table of Contents
Cash used in investing activities was $6.0 million for 2010 compared to cash provided by investing activities of $0.4 million for 2009. The increase in cash used in investing activities was due to an increase in total capital spending, including the 2010 and 2009 purchases of assets related to the Hurricane Window & Door Factory acquisition, of $2.0 million and the impact of net cash used for excess margin returns for settlements of forward contracts related to our aluminum hedging program.
Financing activities. Cash used in financing activities was $7.6 million in 2011. During 2011 we refinanced our debt and reduced the interest rate by 100 basis points. We also prepaid an additional $4.5 million of our long term debt and paid $3.0 million of deferred financing cost related to the refinancing.
Cash provided by financing activities was $8.3 million in 2010. Using cash generated from the 2010 rights offerings, which resulted in $27.3 million in net cash proceeds, we prepaid an additional $15 million of our long term debt in March and another $3.0 million in October, for a total of $18.0 million in debt prepayment in 2010. Payment of deferred financing costs related to the effectiveness of the amendment of our credit agreement totaled $0.9 million.
Cash used in financing activities was $22.1 million in 2009. With cash generated from operations during 2009 and cash on hand we prepaid $8.0 million of our long-term debt in June, $12.0 million in September and another $2.0 million in December, for a total of $22 million in debt prepayments in 2009. In December 2009, we also repaid the $12.0 million of revolver borrowing that occurred in October 2009.
Capital Expenditures. Capital expenditures vary depending on prevailing business factors, including current and anticipated market conditions. For 2011, capital expenditures were $3.5 million, compared to $3.2 million for 2010. We anticipate that cash flows from operations and liquidity from the revolving credit facility will be sufficient to execute our business plans.
Capital Resources. On June 23, 2011, PGT Industries, Inc. entered into a credit agreement (the “Credit Agreement”) with three lenders. The Credit Agreement replaces the Company’s second amended and restated credit agreement, dated as of February 14, 2006 (the “Old Credit Agreement”). The Credit Agreement provides for a $15.0 million revolving credit facility, a $48.0 million term loan facility and an uncommitted incremental facility in an amount of up to $25.0 million. The revolving credit facility commitment and the term loans under the Credit Agreement will mature five years from the date of the execution of the Credit Agreement. As of December 31, 2011, there were $1.5 million of letters of credit outstanding and $13.5 million available on the revolver.
All borrowings under the Credit Agreement bear interest, at our option, at either: (a) a “base rate” equal to the highest of: (i) 0.50% per year above the weighted average of the rates on overnight federal funds transactions with members of the Federal Reserve System, (ii) the annual rate of interest in effect for that day as publicly announced as the “prime rate” and (iii) the one-month “eurodollar rate” (not to be less than 1.25%) or (b) a “Eurodollar base rate” equal to the higher of (i) 1.25% and (ii) (adjusted for reserve requirements, deposit insurance assessment rates and other regulatory costs for Eurodollar liabilities) the rate at which Eurodollar deposits in dollars for the relevant interest period (which will be one, two, three or six months or, subject to availability, nine or twelve months, as selected by us) are offered in the interbank Eurodollar market plus, in each case, a rate dependent on the ratio of our funded debt as compared to our adjusted consolidated EBITDA, ranging from 3.5% to 2.0% per year for borrowings bearing interest at the “base rate” and from 4.5% to 3.0% per year for borrowings bearing interest at the “Eurodollar rate” (such rate added to the “Eurodollar rate,” the “Eurodollar Margin”).
In accordance with the Credit Agreement we will pay quarterly fees on the unused portion of the revolving credit facility at a rate equal to 0.50% as well as a quarterly letter of credit fee at a rate per annum equal to the Eurodollar Margin for revolving loans based on the maximum undrawn face amount of any outstanding letters of credit. We also pay customary transaction charges in connection with any letters of credit. In connection with this refinancing, we wrote-off $0.4 million of deferred financing costs from the Old Credit Agreement, which are classified within other expense (income), net in the consolidated statement of operations for the year ended December 31, 2011.
The Credit Agreement imposes certain restrictions on us, including restrictions on our ability to: incur debt or provide guarantees; grant or suffer to exist liens; sell our assets; pay dividends or make other distributions in respect of capital stock; prepay certain indebtedness, make loans, advances, investments and acquisitions; change our line of business; engage in affiliate transactions; consummate mergers, consolidations or other fundamental transactions; and enter into agreements with negative pledge clauses. Commencing with the fiscal quarter ending on October 1, 2011, the Credit Agreement also requires us to maintain certain minimum interest coverage ratios and maximum leverage ratios, which are tested at the end of each fiscal quarter, and further provides for customary affirmative covenants (including obligations to hedge a portion of our interest rate risk) and events of default. This obligation was fulfilled with an interest rate cap (See Note 11). We believe that we are in compliance with all restrictive financial covenants as of December 31, 2011.
21
Table of Contents
PGT, Inc. has unconditionally guaranteed all loans and other obligations under the Credit Agreement and related documents and such guarantee is secured by a lien on substantially all of the assets of our wholly owned subsidiary, PGT Industries, Inc., subject to certain limitations. PGT, Inc. has no operations or assets independent of its subsidiary.
During 2011, we prepaid $2.5 million on the new Credit Agreement with cash generated from operations and expensed $114 thousand of associated debt issuance costs in connection with the prepayment. This prepayment changed our required repayment schedule; however the final payment of all amounts outstanding (including accrued interest) is still due five years from the date of the execution of the Credit Agreement. See Note 9.
The Old Credit Agreement consisted of a $235.0 million senior secured credit facility (“Terminated Facility”) and a $115.0 million second lien term loan due February 14, 2012, with a syndicate of banks. The Terminated Facility was composed of a $25 million revolving credit facility, having been reduced from $30.0 million as a result of the third amendment discussed below, and initially, a $205 million first lien term loan. The second lien term loan was fully repaid with proceeds from our IPO in 2006. The outstanding balance of the first lien term loan on January 1, 2011 was $50.0 million. During all of 2010, we prepaid $18.0 million of long-term debt with cash generated from operations and from the net proceeds of the rights offering.
On December 24, 2009, we announced that we entered into a third amendment to the Terminated Facility. The amendment, among other things, provided a leverage covenant holiday for 2010, increased the maximum leverage amount for the first quarter of 2011 to 6.25 times (then dropping 0.25X per quarter starting the second quarter until the end of the term), extended the due date on the revolver loan until the end of 2011, increased the applicable rate on any outstanding revolver loan by 25 basis points, and set a base rate floor of 4.25%. The effectiveness of the amendment was conditioned, among other things, on the repayment of at least $17.0 million of the term loan under the Terminated Facility no later than March 31, 2010, of which no more than $2.0 million was permitted to come from cash on hand. In December 2009, we used cash generated from operations to prepay $2.0 million of outstanding borrowings under the Terminated Facility. Using proceeds from the 2010 rights offering, we made an additional prepayment of $15.0 million on March 17, 2010, bringing total prepayments of debt at that time to $17.0 million. Fees paid to the administrative agent and lenders totaled $1.0 million. Such fees were being amortized using the effective interest method over the remaining term of the Terminated Facility. Having made the total required prepayment and having satisfied all other conditions to bring the amendment into effect, the amendment became effective on March 17, 2010.
Under the third amendment, the first lien term loan bore interest at a rate equal to an adjusted LIBOR rate plus a margin ranging from 3.5% per annum to 5.0% per annum or a base rate plus a margin ranging from 2.5% per annum to 4.0% per annum, at our option. The margin in either case is dependent on our leverage ratio. The loans under the Terminated Facility bore interest at a rate equal to an adjusted LIBOR rate plus a margin depending on our leverage ratio ranging from 3.0% per annum to 5.0% per annum or a base rate plus a margin ranging from 2.0% per annum to 4.0% per annum, at our option. The amendment established a floor of 4.25% for base rate loans, and continued the 3.25% floor for adjusted LIBOR established in the previous amendment.
22
Table of Contents
Long-term debt including current portions and excluding capital lease obligations consisted of the following:
| December 31, 2011 |
January 1, 2011 |
|||||||
| (in thousands) | ||||||||
| Tranche A2 term note payable with a payment of $132 due November 14, 2011. A lump sum payment of $49.9 million was due on February 14, 2012. Interest is payable quarterly at LIBOR or the prime rate plus an applicable margin. At January 1, 2011, the average rate was 2.75% plus a margin of 4.00%. |
$ | — | $ | 50,000 | ||||
| Term note payable with a payment of $500 due on March 30, 2013 Quarterly installments of $600 beginning June 29, 2013 through July 4, 2015. Quarterly installments of $900 beginning October 3, 2015 through April 2, 2016. A lump sum payment of $36.9 million is due on June 23, 2016. Interest is payable quarterly at LIBOR or the prime rate plus an applicable margin. At December 31, 2011, the average rate was 1.25% plus a margin of 4.50%. |
45,500 | — | ||||||
|
|
|
|
|
|||||
| $ | 45,500 | $ | 50,000 | |||||
|
|
|
|
|
|||||
DISCLOSURES OF CONTRACTUAL OBLIGATIONS AND COMMERCIAL COMMITMENTS
The following summarizes our contractual obligations as of December 31, 2011 (in thousands):
| Payments Due by Period | ||||||||||||||||||||||||
| Contractual Obligations |
Total | Current | 2-3 Years | 4 Years | 5 Years | Thereafter | ||||||||||||||||||
| Long-term debt and capital leases (1) |
$ | 57,253 | $ | 2,831 | $ | 10,075 | $ | 5,450 | $ | 38,897 | $ | — | ||||||||||||
| Operating leases |
2,495 | 1,401 | 948 | 73 | 73 | — | ||||||||||||||||||
| Supply agreements |
1,135 | 1,135 | — | — | — | — | ||||||||||||||||||
| Equipment purchase commitments |
238 | 238 | — | — | — | — | ||||||||||||||||||
|
|
|
|
|
|
|
|
|
|
|
|
|
|||||||||||||
| Total contractual cash obligations |
$ | 61,121 | $ | 5,605 | $ | 11,023 | $ | 5,523 | $ | 38,970 | $ | — | ||||||||||||
|
|
|
|
|
|
|
|
|
|
|
|
|
|||||||||||||
(1) - Includes estimated future interest expense on our long-term debt assuming the weighted average interest rate of 5.75% as of December 31, 2011 does not change.
The amounts reflected in the table above for operating leases represent future minimum lease payments under non-cancelable operating leases with an initial or remaining term in excess of one year at December 31, 2011. Purchase orders entered into in the ordinary course of business are excluded from the above table. Amounts for which we are liable under purchase orders are reflected on our consolidated balance sheet as accounts payable and accrued liabilities.
We are obligated to purchase certain raw materials used in the production of our products from certain suppliers pursuant to stocking programs. If these programs were cancelled by us, we would be required to pay $1.1 million for various materials.
At December 31, 2011, we had $1.5 million in standby letters of credit related to our worker’s compensation insurance coverage.
CRITICAL ACCOUNTING ESTIMATES
In preparing our consolidated financial statements, we follow U.S. generally accepted accounting principles. These principles require us to make certain estimates and apply judgments that affect our financial position and results of operations.
On a regular basis, we review the accounting policies, assumptions, estimates and judgments to ensure that our financial statements are presented fairly and in accordance with GAAP. However, because future events and their effects cannot be determined with certainty, actual results could differ from our assumptions and estimates, and such difference could be material. Our significant accounting policies are discussed in Item 8, Note 2. The following is a summary of our more significant accounting estimates that require the use of judgment in preparing the financial statements.
23
Table of Contents
| Description |
Judgments and Uncertainties |
Effect if Actual Results Differ from Assumptions | ||
| Long lived assets |
||||
| We review long-lived assets for impairment whenever events or changes in circumstances indicate that the carrying amount of such assets may not be recoverable. Recoverability of assets to be held and used is measured by a comparison of the carrying amount of long-lived assets to future undiscounted net cash flows expected to be generated, based on management estimates.
If such assets are considered to be impaired, the impairment recognized is the amount by which the carrying amount of the assets exceeds the fair value of the assets. Assets to be disposed of are reported at the lower of the carrying amount or fair value less cost to sell, and depreciation is no longer recorded. |
Estimates made by management are subject to change and include such things as how future growth assumptions, operating and capital expenditure requirements, asset useful lives and other factors, affect forecasted cash flows associated with the long-lived assets. Additionally, fair value estimates, if required, can be affected by discount rates and/or estimates of the value of similar assets. | We do not believe there is a reasonable likelihood that there will be a material change in the estimates or assumptions we use to calculate long-lived asset impairment losses. However, if actual results are not consistent with our estimates and assumptions used in estimating future cash flows and asset fair values, we may be exposed to losses that could be material. | ||
|
Allowances for doubtful accounts and notes receivable and related reserves |
||||
|
Losses for allowances for doubtful accounts and notes receivable and related reserves are recognized when they are incurred, which requires us to make our best estimate of probable losses inherent in our receivables. |
We evaluate the allowance for doubtful accounts and notes receivable based on specific identification of troubled balances and historical collection experience adjusted for current conditions such as the economic climate. |
Actual collections can differ from our estimates, requiring adjustments to the allowances. A 10% difference between actual losses and estimated losses derived from the estimated reserve for accounts and notes receivable would impact net loss by approximately $0.2 million. | ||
|
Indefinite lived Intangibles |
||||
|
The impairment evaluation of the carrying amount of intangible assets with indefinite lives (which for us is our trade names) is conducted annually, or more frequently, if events or changes in circumstances indicate that an asset might be impaired. The evaluation is performed by comparing the carrying amount of these assets to their estimated fair values. If the estimated fair value is less than the carrying amount of the intangible asset, then an impairment charge is recorded to reduce the asset to its estimated fair value. The estimated fair value is determined using the relief from royalty method that is based upon the discounted projected cost savings (value) attributable to ownership of our trade names, our only indefinite lived intangible assets. |
In estimating fair value, the method we use requires us to make assumptions, the most material of which are net sales projections attributable to products sold with these trade names, the anticipated royalty rate we would pay if the trade names were not owned (as a percent of net sales), and a weighted average discount rate. These assumptions are subject to change based on changes in the markets in which these products are sold, which impact our projections of future net sales and the assumed royalty rate. Factors affecting the weighted average discount rate include assumed debt to equity ratios, risk-free interest rates and equity returns, each for market participants in our industry.
Our year-end test of trade names, performed as of December 31, 2011, utilized a weighted average royalty rate of 4.0% and a discount rate of 17.0%. Net sales used in the analysis were based on historical experience and a modest growth in future years. |
Actual results can differ from our estimates, requiring adjustments to our assumptions. The result of these changes could result in a material change in our calculation and an impairment in our other intangible assets.
As of December 31, 2011, the estimated fair value of the trade names was $37.4 million, which was below our book value and resulted in us recording a $6.0 million impairment charge on the consolidated statement of operations. We believe our projected sales are reasonable based on, among other things, available information regarding our industry. We also believe the royalty rate is appropriate. The weighted average discount rate is impacted by current financial market trends and will remain dependent on such trends in the future. | ||
24
Table of Contents
| Description |
Judgments and Uncertainties |
Effect if Actual Results Differ from Assumptions | ||
| Warranty |
||||
|
We have warranty obligations with respect to most of our manufactured products. Obligations vary by product components. The reserve for warranties is based on our assessment of the costs that will have to be incurred to satisfy warranty obligations on recorded net sales. |
The reserve is determined after assessing our warranty history and specific identification of our estimated future warranty obligations. |
Changes to actual warranty claims incurred could have a material impact on our estimated warranty obligations. | ||
|
Self Insurance Reserves |
||||
|
We are primarily self-insured for employee health benefits and for years prior to 2010 for workers’ compensation. For 2011 and 2010 we are fully insured with respect to workers’ compensation. |
Our workers’ compensation reserves, for the self-insured periods 2009 and prior are accrued based on third-party actuarial valuations of the expected future liabilities. These reserves are significantly impacted by adverse development on outstanding claims. Health benefits are self-insured by us up to pre-determined stop loss limits. These reserves, including incurred but not reported claims, are based on internal computations. These computations consider our historical claims experience, independent statistics, and trends. |
Changes to actual workers’ compensation or health benefit claims experience and interest rates could have a material impact on our estimated self-insurance reserves. | ||
|
Stock-Based Compensation |
||||
|
We utilize a fair-value based approach for measuring stock-based compensation to recognize the cost of employee services received in exchange for our Company’s equity instruments. We determine the fair value of our stock option awards at the date of grant using the Black-Sholes model.
We record compensation expense over an award’s vesting period based on the award’s fair value at the date of grant. Our awards vest based only on service conditions and compensation expense is recognized on a straight-line basis for each separately vesting portion of an award. |
Option-pricing models and generally accepted valuation techniques require management to make assumptions and to apply judgment to determine the fair value of our awards. These assumptions and judgments include estimating the future volatility of our stock price, expected dividend yield, future employee forfeiture rates and future employee stock option exercise behaviors. Changes in these assumptions can materially affect the fair value estimate.
Stock-based compensation expense is recognized only for those awards that are ultimately expected to vest, and we have applied an estimated forfeiture rate to unvested awards for the purpose of calculating compensation cost. These estimates, based mostly on historical experience, will be revised in future periods if actual forfeitures differ from the estimates. Changes in forfeiture estimates impact compensation cost in the period in which the change in estimate occurs. |
We do not believe there is a reasonable likelihood there will be a material change in the future estimates or assumptions we use to determine stock-based compensation expense.
However, if actual results are not consistent with our estimates or assumptions, we may be exposed to changes in stock-based compensation expense that could be material.
A 10% change in our stock-based compensation expense for the year ended December 31, 2011, would have affected net loss by approximately $0.2 million. |
25
Table of Contents
RECENTLY ISSUED ACCOUNTING STANDARDS
In May 2011, the Financial Accounting Standards Board (FASB) amended its guidance related to fair value measurement and disclosure. The amended guidance generally clarifies existing measurement and disclosure requirements and results in greater consistency between U.S. GAAP and International Financial Reporting Standards (IFRS). The provisions of the amended guidance will be effective for the Company beginning in the first quarter of 2012. The Company does not expect the adoption of the provisions of the amended guidance to have a material impact on its disclosures.
In June 2011, the FASB amended its guidance related to the presentation of other comprehensive income. The amended guidance requires the presentation of other comprehensive income and its components either (1) together with the components of net income in one continuous statement of comprehensive income or (2) as a separate statement immediately following the statement of income with equal prominence. The provisions of the amended guidance will be effective for the Company beginning in the first quarter of 2012 and will be applied retrospectively.
FORWARD OUTLOOK
The following section contains forward-looking statements within the meaning of Section 27A of the Securities Act of 1933, as amended, and Section 21E of the Securities Exchange Act of 1934, as amended. The forward-looking statements are based on the beliefs and assumptions of management, together with information available to us when the statements were made. Future results could differ materially from those included in such forward-looking statements as a result of, among other things, the factors set forth in Item 1A., “Risk Factors” and certain economic and business factors which may be beyond our control. Investors are cautioned that all forward-looking statements involve risks and uncertainties.
Net sales
We closed 2011 with an $8.4 million, or 4.8%, decrease in sales. Our decline was driven by a decrease in our out of state market of $9.2 million or 35.9% versus 2010, due to our reduced efforts out of state. The window industry expects a relatively flat year in 2012, with certain areas seeing slight to moderate improvement and others struggling with foreclosures and short sales.
While we have seen indicators suggesting the industry is ready for improvement we will continue to operate with a more conservative view until stable and predictable growth in the marketplace is achieved.
Gross margin
We believe the following factors, which are not all inclusive, may impact our gross margin in 2012:
| • | Our gross margin percentages are heavily influenced by total sales due to operating leverage of fixed costs as well as product mix of impact and non-impact products and also vinyl frame versus aluminum frame products, as vinyl continues to increase its share of our core market. |
| • | During 2011, we entered into forward contracts for the purchase of approximately 57% of our 2012 aluminum needs at an average price of $0.97 per pound. |
| • | Continuation of our consolidation cost savings that we expect to realize in 2012 will be approximately $1.5 million above what was recognized in 2011. |
Selling, general and administrative expenses
If the cost of diesel fuel continues to increase, our selling, general and administrative costs will increase. In addition, economic and credit conditions may negatively impact our bad debt expense. We continue to monitor our customers’ credit profiles carefully and make changes in our terms where necessary in response to this heightened risk. However, with the consolidation complete we expect to see additional savings of $1.5 - $2.0 million above what was recognized in 2011.
26
Table of Contents
Interest expense
We prepaid $4.5 million in outstanding borrowings during 2011, $2.5 million on the new credit agreement and $2.0 million on the old credit agreement. We believe this decrease in debt levels for the full year of 2012 will result in our paying less interest in 2012 than in 2011.
Liquidity and capital resources
We had $10.9 million of cash on hand as of December 31, 2011. While we are confident in our ability to generate cash flow in this housing market and economy, we may use this cash to pay down debt, invest in marketing activities or for other business purposes. Our credit facility includes a $25 million revolving credit facility of which $23.4 million was available as of March 9, 2012.
Management expects to spend nearly $4.9 million on capital expenditures in 2012, including capital expenditures related to product investments in lines targeted at increasing sales. We expect depreciation to be approximately $5.9 million and amortization to be approximately $6.5 million in 2012. On December 31, 2011, we had outstanding purchase commitments on capital projects of approximately $0.2 million.
Summary
The Florida market continues to present challenges; however, we are poised to meet these challenges. With the completion of the consolidation in Florida, we have now refocused on our core markets. We are confident that the high standards maintained by our people and our excellent products will be the catalyst for us to remain the industry leader in impact resistant windows and doors. We will continue to execute our strategy designed to provide the most benefit to our stockholders, employees and other stakeholders.
| Item 7A. | QUANTITATIVE AND QUALITATIVE DISCLOSURES ABOUT MARKET RISK |
We utilize derivative financial instruments to hedge price movements in our aluminum materials. We are exposed to changes in the price of aluminum as set by the trades on the London Metal Exchange. We have entered into aluminum hedging instruments that settle at various times through the end of 2012 that cover approximately 57% of our anticipated needs during 2012 at an average price of $0.97 per pound. Short-term changes in the cost of aluminum, which can be significant, are sometimes passed on to our customers through price increases, however, there can be no guarantee that we will be able to continue to pass on such price increases to our customers or that price increases will not negatively impact sales volume, thereby adversely impacting operating margins.
For forward contracts for the purchase of aluminum at December 31, 2011, a 10% decrease in the price of aluminum would decrease the fair value of our forward contracts of aluminum by $0.5 million. This calculation utilizes our actual commitment of 5.7 million pounds under contract (to be settled throughout 2012) and the market price of aluminum as of December 31, 2011, which was approximately $0.89 per pound.
On August 8, 2011, we entered into a two year interest rate cap to offset the interest rate fluctuation associated with 50% of our initial outstanding debt. We are exposed to changes in the LIBOR rate, should it increase over our floor established in the Credit Agreement of 1.25%. The cap indexes to quarterly LIBOR with a notional amount of $24.0 million, based on a strike rate of 1.25% payable quarterly, which will effectively fix our LIBOR rate at a maximum of 1.25% for that amount of debt. Changes in the intrinsic value of the cap, are expected to offset the changes in cash flow (changes in interest payments) attributable to fluctuations in interest rates above 1.25%. This interest rate cap was not designated as a hedge, therefore, changes in the fair value and changes in intrinsic value are and will be included in the current period earnings as other expense (income), net in the consolidated statement of operations. Based on our debt outstanding at December 31, 2011, of $45.5 million, of which $24.0 million is covered by our interest rate cap, a 1% increase in interest rates above our interest rate floor established in the Credit Agreement would result in approximately $0.2 million of additional interest expense annually.
27
Table of Contents
| Item 8. | FINANCIAL STATEMENTS AND SUPPLEMENTARY DATA |
INDEX TO CONSOLIDATED FINANCIAL STATEMENTS
| 29 | ||
| 30 | ||
| Consolidated Balance Sheets as of December 31, 2011 and January 1, 2011 |
31 | |
| 32 | ||
| 33 | ||
| 34 | ||
28
Table of Contents
Report of Independent Registered Public Accounting Firm
The Board of Directors and Shareholders of
PGT, Inc.
We have audited the accompanying consolidated balance sheets of PGT, Inc. and subsidiary as of December 31, 2011 and January 1, 2011, and the related consolidated statements of operations, shareholders’ equity, and cash flows for the fiscal years ended December 31, 2011, January 1, 2011 and January 2, 2010. These financial statements are the responsibility of the Company’s management. Our responsibility is to express an opinion on these financial statements based on our audits.
We conducted our audits in accordance with the standards of the Public Company Accounting Oversight Board (United States). Those standards require that we plan and perform the audit to obtain reasonable assurance about whether the financial statements are free of material misstatement. We were not engaged to perform an audit of the Company’s internal control over financial reporting. Our audits included consideration of internal control over financial reporting as a basis for designing audit procedures that are appropriate in the circumstances, but not for the purpose of expressing an opinion on the effectiveness of the Company’s internal control over financial reporting. Accordingly, we express no such opinion. An audit also includes examining, on a test basis, evidence supporting the amounts and disclosures in the financial statements, assessing the accounting principles used and significant estimates made by management, and evaluating the overall financial statement presentation. We believe that our audits provide a reasonable basis for our opinion.
In our opinion, the financial statements referred to above present fairly, in all material respects, the consolidated financial position of PGT, Inc. and subsidiary at December 31, 2011 and January 1, 2011, and the consolidated results of their operations and their cash flows for the fiscal years ended December 31, 2011, January 1, 2011 and January 2, 2010, in conformity with U.S. generally accepted accounting principles.
/s/ ERNST & YOUNG LLP
Certified Public Accountants
Tampa, Florida
March 15, 2012
29
Table of Contents
PGT, INC.
CONSOLIDATED STATEMENTS OF OPERATIONS
(in thousands, except per share amounts)
| Year Ended | ||||||||||||
| December 31, | January 1, | January 2, | ||||||||||
| 2011 | 2011 | 2010 | ||||||||||
| Net sales |
$ | 167,276 | $ | 175,741 | $ | 166,000 | ||||||
| Cost of sales |
128,171 | 125,615 | 121,821 | |||||||||
|
|
|
|
|
|
|
|||||||
| Gross margin |
39,105 | 50,126 | 44,179 | |||||||||
| Impairment charges |
5,959 | 5,561 | 742 | |||||||||
| Selling, general and administrative expenses |
48,619 | 53,879 | 51,703 | |||||||||
|
|
|
|
|
|
|
|||||||
| Loss from operations |
(15,473 | ) | (9,314 | ) | (8,266 | ) | ||||||
| Interest expense, net |
4,168 | 5,123 | 6,698 | |||||||||
| Gain on sale of assets |
(875 | ) | — | — | ||||||||
| Other expense (income), net |
456 | (19 | ) | 37 | ||||||||
|
|
|
|
|
|
|
|||||||
| Loss before income taxes |
(19,222 | ) | (14,418 | ) | (15,001 | ) | ||||||
| Income tax (benefit) expense |
(2,324 | ) | 77 | (5,584 | ) | |||||||
|
|
|
|
|
|
|
|||||||
| Net loss |
$ | (16,898 | ) | $ | (14,495 | ) | $ | (9,417 | ) | |||
|
|
|
|
|
|
|
|||||||
| Net loss income per common share: |
||||||||||||
| Basic and diluted |
$ | (0.31 | ) | $ | (0.29 | ) | $ | (0.26 | ) | |||
|
|
|
|
|
|
|
|||||||
| Weighted average shares outstanding: |
||||||||||||
| Basic and diluted |
53,659 | 50,174 | 36,241 | |||||||||
|
|
|
|
|
|
|
|||||||
The accompanying notes are an integral part of these consolidated financial statements.
30
Table of Contents
PGT, INC.
(in thousands, except per share amounts)
| December 31, | January 1, | |||||||
| 2011 | 2011 | |||||||
| ASSETS |
||||||||
| Current assets: |
||||||||
| Cash and cash equivalents |
$ | 10,940 | $ | 22,012 | ||||
| Accounts receivable, net |
13,830 | 13,687 | ||||||
| Inventories |
11,602 | 10,535 | ||||||
| Prepaid expenses |
871 | 881 | ||||||
| Other current assets |
2,821 | 3,589 | ||||||
| Assets held for sale |
— | 657 | ||||||
| Deferred income taxes, net |
50 | — | ||||||
|
|
|
|
|
|||||
| Total current assets |
40,114 | 51,361 | ||||||
| Property, plant and equipment, net |
48,606 | 52,863 | ||||||
| Other intangible assets, net |
51,830 | 64,291 | ||||||
| Other assets, net |
2,285 | 604 | ||||||
|
|
|
|
|
|||||
| Total assets |
$ | 142,835 | $ | 169,119 | ||||
|
|
|
|
|
|||||
| LIABILITIES AND SHAREHOLDERS’ EQUITY |
||||||||
| Current liabilities: |
||||||||
| Accounts payable |
$ | 5,103 | $ | 4,979 | ||||
| Accrued liabilities |
7,603 | 11,717 | ||||||
| Deferred income taxes |
— | 185 | ||||||
| Current portion of long-term debt and capital lease obligations |
50 | 245 | ||||||
|
|
|
|
|
|||||
| Total current liabilities |
12,756 | 17,126 | ||||||
| Long-term debt and capital lease obligations |
45,500 | 49,918 | ||||||
| Deferred income taxes |
15,041 | 17,130 | ||||||
| Other liabilities |
2,176 | 1,903 | ||||||
|
|
|
|
|
|||||
| Total liabilities |
75,473 | 86,077 | ||||||
|
|
|
|
|
|||||
| Commitments and contingencies (Note 13) |
— | — | ||||||
|
|
|
|
|
|||||
| Shareholders’ equity: |
||||||||
| Preferred stock; par value $.01 per share; 10,000 shares authorized; none outstanding |
— | — | ||||||
| Common stock; par value $.01 per share; 200,000 shares authorized; 53,670 and 53,670 shares issued and 53,659 and 53,654 shares outstanding at December 31, 2011 and January 1, 2011, respectively |
537 | 537 | ||||||
| Additional paid-in-capital |
272,811 | 271,038 | ||||||
| Accumulated other comprehensive loss |
(1,798 | ) | (1,243 | ) | ||||
| Accumulated deficit |
(204,188 | ) | (187,290 | ) | ||||
|
|
|
|
|
|||||
| Total shareholders’ equity |
67,362 | 83,042 | ||||||
|
|
|
|
|
|||||
| Total liabilities and shareholders’ equity |
$ | 142,835 | $ | 169,119 | ||||
|
|
|
|
|
|||||
The accompanying notes are an integral part of these consolidated financial statements.
31
Table of Contents
PGT, INC.
CONSOLIDATED STATEMENTS OF CASH FLOWS
(in thousands)
| Year Ended | ||||||||||||
| December 31, 2011 |
January 1, 2011 |
January 2, 2010 |
||||||||||
| Cash flows from operating activities: |
||||||||||||
| Net loss |
$ | (16,898 | ) | $ | (14,495 | ) | $ | (9,417 | ) | |||
| Adjustments to reconcile net loss to net cash (used in) provided by operating activities: |
||||||||||||
| Depreciation |
7,590 | 9,180 | 10,435 | |||||||||
| Amortization |
6,502 | 6,028 | 5,731 | |||||||||
| Provision for allowances for doubtful accounts |
880 | 1,678 | 1,722 | |||||||||
| Stock-based compensation |
1,773 | 2,286 | 518 | |||||||||
| Amortization and write-offs of deferred financing costs |
1,233 | 773 | 561 | |||||||||
| Derivative financial instruments |
37 | — | — | |||||||||
| Deferred income taxes |
(2,324 | ) | — | (1,813 | ) | |||||||
| Impairment charges |
5,959 | 5,561 | 742 | |||||||||
| (Gain) loss on disposal of assets |
(996 | ) | (5 | ) | 98 | |||||||
| Change in operating assets and liabilities: |
||||||||||||
| Accounts receivable |
(1,560 | ) | (2,754 | ) | 3,011 | |||||||
| Inventories |
(1,068 | ) | (661 | ) | (351 | ) | ||||||
| Prepaid expenses and other current assets |
367 | 4,562 | (2,973 | ) | ||||||||
| Accounts payable and accrued liabilities |
(3,167 | ) | 188 | 1,240 | ||||||||
|
|
|
|
|
|
|
|||||||
| Net cash (used in)/provided by operating activities |
(1,672 | ) | 12,341 | 9,504 | ||||||||
|
|
|
|
|
|
|
|||||||
| Cash flows from investing activities: |
||||||||||||
| Purchases of property, plant and equipment |
(3,496 | ) | (3,197 | ) | (2,330 | ) | ||||||
| Acquisition of intangible assets |
(200 | ) | (2,597 | ) | — | |||||||
| Acquisition of business |
— | — | (1,452 | ) | ||||||||
| Net change in margin account for derivative financial instruments |
250 | (250 | ) | 4,098 | ||||||||
| Proceeds from sales of equipment |
1,672 | 46 | 79 | |||||||||
|
|
|
|
|
|
|
|||||||
| Net cash (used in)/provided by investing activities |
(1,774 | ) | (5,998 | ) | 395 | |||||||
|
|
|
|
|
|
|
|||||||
| Cash flows from financing activities: |
||||||||||||
| Payments of long-term debt |
(52,500 | ) | (18,000 | ) | (22,000 | ) | ||||||
| Proceeds from issuance of long-term debt |
48,000 | — | — | |||||||||
| Payments of financing costs |
(3,013 | ) | (897 | ) | — | |||||||
| Payments of capital leases |
(113 | ) | (105 | ) | (98 | ) | ||||||
| Purchases of treasury stock |
— | (3 | ) | (6 | ) | |||||||
| Adjustment to and net proceeds from issuance of common stock |
— | 27,257 | (6 | ) | ||||||||
|
|
|
|
|
|
|
|||||||
| Net cash (used in)/provided by financing activities |
(7,626 | ) | 8,252 | (22,110 | ) | |||||||
|
|
|
|
|
|
|
|||||||
| Net (decrease)/increase in cash and cash equivalents |
(11,072 | ) | 14,595 | (12,211 | ) | |||||||
| Cash and cash equivalents at beginning of period |
22,012 | 7,417 | 19,628 | |||||||||
|
|
|
|
|
|
|
|||||||
| Cash and cash equivalents at end of period |
$ | 10,940 | $ | 22,012 | $ | 7,417 | ||||||
|
|
|
|
|
|
|
|||||||
| Supplemental cash flow information: |
||||||||||||
| Interest paid |
$ | 2,411 | $ | 3,991 | $ | 6,224 | ||||||
|
|
|
|
|
|
|
|||||||
| Income taxes refunded |
$ | — | $ | (3,662 | ) | $ | (1,062 | ) | ||||
|
|
|
|
|
|
|
|||||||
The accompanying notes are an integral part of these consolidated financial statements.
32
Table of Contents
PGT, INC.
CONSOLIDATED STATEMENTS OF SHAREHOLDERS’ EQUITY
(in thousands except share amounts)
| Common stock | Additional Paid-in Capital Net of Treasury |
Accumulated | Accumulated Other Comprehensive |
|||||||||||||||||||||
| Shares | Amount | Stock | Deficit | Loss | Total | |||||||||||||||||||
| Balance at January 3, 2009 |
35,197,349 | $ | 352 | $ | 241,177 | $ | (163,378 | ) | $ | (3,966 | ) | $ | 74,185 | |||||||||||
| Vesting of restricted stock |
108,694 | 1 | (1 | ) | — | — | — | |||||||||||||||||
| Acquisition of treasury stock |
(3,339 | ) | — | (6 | ) | — | — | (6 | ) | |||||||||||||||
| Stock-based compensation |
— | — | 518 | — | — | 518 | ||||||||||||||||||
| Rights offering costs |
— | — | (6 | ) | — | — | (6 | ) | ||||||||||||||||
| Comprehensive loss, net of tax effect: |
||||||||||||||||||||||||
| Change related to aluminum forward contracts |
— | — | — | — | 2,935 | 2,935 | ||||||||||||||||||
| Net loss |
— | — | — | (9,417 | ) | — | (9,417 | ) | ||||||||||||||||
|
|
|
|||||||||||||||||||||||
| Total comprehensive loss |
— | — | — | — | — | (6,482 | ) | |||||||||||||||||
|
|
|
|
|
|
|
|
|
|
|
|
|
|||||||||||||
| Balance at January 2, 2010 |
35,302,704 | $ | 353 | $ | 241,682 | $ | (172,795 | ) | $ | (1,031 | ) | $ | 68,209 | |||||||||||
| Vesting of restricted stock |
16,554 | 1 | (1 | ) | — | — | — | |||||||||||||||||
| Acquisition of treasury stock |
(1,130 | ) | — | (3 | ) | — | — | (3 | ) | |||||||||||||||
| Stock-based compensation |
— | — | 2,286 | — | — | 2,286 | ||||||||||||||||||
| Rights offering |
18,336,368 | 183 | 27,321 | — | — | 27,504 | ||||||||||||||||||
| Rights offering costs |
— | — | (247 | ) | — | — | (247 | ) | ||||||||||||||||
| Comprehensive income, net of tax effect: |
||||||||||||||||||||||||
| Change related to aluminum forward contracts |
— | — | — | — | (212 | ) | (212 | ) | ||||||||||||||||
| Net loss |
— | — | — | (14,495 | ) | — | (14,495 | ) | ||||||||||||||||
|
|
|
|||||||||||||||||||||||
| Total comprehensive loss |
— | — | — | — | — | (14,707 | ) | |||||||||||||||||
|
|
|
|
|
|
|
|
|
|
|
|
|
|||||||||||||
| Balance at January 1, 2011 |
53,654,496 | $ | 537 | $ | 271,038 | $ | (187,290 | ) | $ | (1,243 | ) | $ | 83,042 | |||||||||||
| Vesting of restricted stock |
5,000 | — | — | — | — | — | ||||||||||||||||||
| Stock-based compensation |
— | — | 1,773 | — | — | 1,773 | ||||||||||||||||||
| Comprehensive income, net of tax effect: |
||||||||||||||||||||||||
| Change related to aluminum forward contracts |
— | — | — | — | (555 | ) | (555 | ) | ||||||||||||||||
| Net loss |
— | — | — | (16,898 | ) | — | (16,898 | ) | ||||||||||||||||
|
|
|
|||||||||||||||||||||||
| Total comprehensive loss |
— | — | — | — | — | (17,453 | ) | |||||||||||||||||
|
|
|
|
|
|
|
|
|
|
|
|
|
|||||||||||||
| Balance at December 31, 2011 |
53,659,496 | $ | 537 | $ | 272,811 | $ | (204,188 | ) | $ | (1,798 | ) | $ | 67,362 | |||||||||||
|
|
|
|
|
|
|
|
|
|
|
|
|
|||||||||||||
The accompanying notes are an integral part of these consolidated financial statements.
33
Table of Contents
NOTES TO CONSOLIDATED FINANCIAL STATEMENTS
| 1. | Description of Business |
PGT, Inc. (“PGTI” or the “Company”) is a leading manufacturer of impact-resistant aluminum and vinyl-framed windows and doors and offers a broad range of fully customizable window and door products. The majority of our sales are to customers in the state of Florida; however, we also sell products in over 40 states, the Caribbean and in South and Central America. Products are sold through an authorized dealer and distributor network.
We were incorporated in the state of Delaware on December 16, 2003, as JLL Window Holdings, Inc. On January 29, 2004, we acquired 100% of the outstanding stock of PGT Holding Company, based in North Venice, Florida. On February 15, 2006, our Company was renamed PGT, Inc. We have one manufacturing operation and one glass tempering and laminating plant in North Venice. During the first half of 2011, we consolidated our North Carolina operations into our Florida plant. See Note 4, Consolidation and Restructurings.
All references to PGTI or our Company apply to the consolidated financial statements of PGT, Inc. unless otherwise noted.
| 2. | Summary of Significant Accounting Policies |
Basis of Presentation
The accompanying consolidated financial statements have been prepared in accordance with accounting principles generally accepted in the U.S. (“GAAP”). In June 2009, the FASB announced that the FASB accounting Standard Codification (“Codification”) was the new source of GAAP recognized by the FASB for nongovernmental entities.
Reclassifications
Certain prior year amounts have been reclassified in the accompanying financial statements to conform with current year classifications.
We have revised the classification of certain warranty related product costs previously recorded in selling, general and administrative expenses, on the consolidated statements of operations to cost of sales to more appropriately reflect their nature. The prior period revisions include $0.2 million and $0.2 million for the years ended January 1, 2011 and January 2, 2010, respectively. These revisions also impact prior period disclosures in the warranty section of this footnote and Note 20—Unaudited Quarterly Financial Data. Additionally, we have revised expenses, settlements, and beginning and ending period accruals in the warranty table to include additional warranty activity. The effect of these changes to the footnote was to increase expenses by $0.9 million and $0.8 million, increase settlements by $0.7 million and $0.8 million, increase the beginning accrual by $0.2 million and $0.3 million and increase the ending accrual by $0.2 million and $0.2 million for the years ended January 1, 2011, and January 2, 2010, respectively. Management believes the changes are immaterial.
Fiscal period
Our fiscal year consists of 52 or 53 weeks ending on the Saturday nearest December 31 of the related year. The periods ended December 31, 2011, January 1, 2011 and January 2, 2010 consisted of 52 weeks.
Principles of consolidation
The consolidated financial statements present the results of the operations, financial position and cash flows of PGTI and its wholly owned subsidiary. All significant intercompany accounts and transactions have been eliminated in consolidation.
Segment information
We operate as one operating segment, the manufacture and sale of windows and doors.
Use of estimates
The preparation of financial statements in conformity with U.S. generally accepted accounting principles requires management to make estimates and assumptions that affect the reported amounts of assets and liabilities and disclosure of contingent assets and liabilities at the date of the financial statements, and the reported amounts of revenues and expenses during the reporting period. Critical accounting estimates involved in applying our accounting policies are those that require management to make assumptions about matters that are uncertain at the time the accounting estimate is made and those for which different estimates reasonably could have been used for the current period. Critical accounting estimates are also those which are reasonably likely to change from period to period and would have a material impact on the presentation of PGTI’s financial condition, changes in financial condition or results of operations. Actual results could materially differ from those estimates.
34
Table of Contents
Revenue recognition
We recognize sales when all of the following criteria have been met: a valid customer order with a fixed price has been received; the product has been delivered and accepted by the customer; and collectability is reasonably assured. All sales recognized are net of allowances for discounts and estimated credits, which are estimated using historical experience. We record provisions against gross revenues for estimated credits in the period when the related revenue is recorded. These estimates are based on factors that include, but are not limited to, analysis of credit memorandum activity.
Cost of sales
Cost of sales represents costs directly related to the production of our products. Primary costs include raw materials, direct labor, and manufacturing overhead. Manufacturing overhead and related expenses primarily include salaries, wages, employee benefits, utilities, maintenance, engineering and property taxes.
In the first quarter of 2009, we entered into a contract to continue manufacturing windows and doors for a large multi-story condominium project in Southeast Florida. At the time the contract was executed, the initial project was approximately 35% complete. We recorded an estimated loss on this contract of $0.9 million in the first quarter of 2009 in cost of goods sold. The project was completed during the second quarter of 2011. There were no significant changes to our original estimate of the loss on this project. As of December 31, 2011, there was no open liability for this project. The corresponding liability as of January 1, 2011 was $0.2 million and is shown in accrued liabilities on the accompanying consolidated balance sheets. In connection with this project, we received a credit against the purchase of materials in the amount of $0.8 million from an aluminum supplier which was also recorded in cost of goods sold in the first quarter of 2009. As of December 31, 2011, all credits were received.
Cost of sales was also impacted by consolidation and restructuring charges recorded over the past three years. See Note 4, Consolidations and Restructurings.
Shipping and handling costs
Shipping and handling costs incurred in the purchase of materials used in the manufacturing process are included in cost of sales. Costs relating to shipping and handling of our finished products are included in selling, general and administrative expenses and total $11.6 million, $12.8 million, and $13.0 million for the years ended December 31, 2011, January 1, 2011, and January 2, 2010, respectively.
Advertising
We expense advertising costs as incurred. Advertising expense included in selling, general and administrative expenses was $0.7 million, $0.2 million and $0.3 million for the years ended December 31, 2011, January 1, 2011, and January 2, 2010, respectively.
Research and development costs
We expense research and development costs as incurred. Research and development costs included in manufacturing overhead expenses were $1.4 million, $1.1 million and $1.4 million for the years ended December 31, 2011, January 1, 2011, and January 2, 2010, respectively.
Cash and cash equivalents
Cash and cash equivalents consist of cash on hand or highly liquid investments with an original maturity date of three months or less.
35
Table of Contents
Accounts and notes receivable and allowance for doubtful accounts
We extend credit to qualified dealers and distributors, generally on a non-collateralized basis. Accounts receivable and notes receivable are recorded at their gross receivable amount, reduced by an allowance for doubtful accounts that results in the receivable being recorded at its net realizable value. The allowance for doubtful accounts is based on management’s assessments of the amount which may become uncollectable in the future and is determined through consideration of the company write-off history, specific identification of uncollectable accounts based in part on the customer’s past due balance (based on contractual terms), and consideration of prevailing economic and industry conditions. Uncollectable accounts are written off after repeated attempts to collect from the customer have been unsuccessful.
| December 31, 2011 |
January 1, 2011 |
|||||||
| (in thousands) | ||||||||
| Accounts receivable |
$ | 14,513 | $ | 15,132 | ||||
| Less: Allowance for doubtful accounts |
(683 | ) | (1,445 | ) | ||||
|
|
|
|
|
|||||
| $ | 13,830 | $ | 13,687 | |||||
|
|
|
|
|
|||||
| Allowance for Doubtful Accounts |
Balance at Beginning of Period |
Costs and expenses |
Deductions(1) | Balance at End of Period |
||||||||||||
| (in thousands) | ||||||||||||||||
| Year ended December 31, 2011 |
$ | 1,445 | $ | 728 | $ | (1,490 | ) | $ | 683 | |||||||
| Year ended January 1, 2011 |
$ | 1,465 | $ | 1,129 | $ | (1,149 | ) | $ | 1,445 | |||||||
| Year ended January 2, 2010 |
$ | 1,224 | $ | 1,332 | $ | (1,091 | ) | $ | 1,465 | |||||||
| (1) | Represents uncollectible accounts charged against the allowance for doubtful accounts, net of recoveries. |
As of December 31, 2011, January 1, 2011, and January 2, 2010, there were $0.9 million, $1.5 million and $1.0 million of trade notes receivable, respectively, for which there was an allowance of $0.8 million, $1.0 million and $0.5 million, respectively, included in other current assets and other assets in the accompanying consolidated balance sheets.
Self-insurance reserves
We are primarily self-insured for employee health benefits and for years prior to 2010 for workers’ compensation. Our workers’ compensation reserves are accrued based on third-party actuarial valuations of the expected future liabilities. Health benefits are self-insured by us up to pre-determined stop loss limits. These reserves, including incurred but not reported claims, are based on internal computations. These computations consider our historical claims experience, independent statistics, and trends. Changes to actual workers’ compensation or health benefit claims incurred and interest rates could have a material impact on our estimated self-insurance reserves. For 2010 and 2011 we are fully insured with respect to workers’ compensation.
Warranty expense
We have warranty obligations with respect to most of our manufactured products. Warranty periods, which vary by product components, generally range from 1 to 10 years, although the warranty period for a limited number of specifically identified components in certain applications is a lifetime. However, the majority of the products sold have warranties on components which range from 1 to 3 years. The reserve for warranties is based on management’s assessment of the cost per service call and the number of service calls expected to be incurred to satisfy warranty obligations on recorded net sales. The reserve is determined after assessing Company history and through specific identification. Expected future obligations are discounted to a current value using a risk-free rate for obligations with similar maturities. The following provides information with respect to our warranty accrual.
36
Table of Contents
| Accrued Warranty |
Beginning of Period |
Charged to Expense |
Adjustments | Settlements | End of Period |
|||||||||||||||
| (in thousands) | ||||||||||||||||||||
| Year ended December 31, 2011 |
$ | 4,326 | $ | 3,346 | $ | 188 | $ | (3,454 | ) | $ | 4,406 | |||||||||
| Year ended January 1, 2011 |
$ | 4,233 | $ | 3,514 | $ | (66 | ) | $ | (3,355 | ) | $ | 4,326 | ||||||||
| Year ended January 2, 2010 |
$ | 4,566 | $ | 3,320 | $ | (189 | ) | $ | (3,464 | ) | $ | 4,233 | ||||||||
The accrual for warranty is included in accrued liabilities and other liabilities on the consolidated balance sheets as of December 31, 2011 and January 1, 2011. The portion of warranty expense related to the issuance of product is $1.1 million, $0.9 million, and $0.9 million and is included in cost of sales on the consolidated statements of operations for the years ended December 31, 2011, January 1, 2011, and January 2, 2010, respectively. The portion related to servicing warranty claims including costs of the service department personnel is included in selling, general and administrative expenses on the consolidated statements of operations, and is $2.5 million, $2.5 million, and $2.2 million, respectively, for the years ended December 31, 2011, January 1, 2011, and January 2, 2010.
Inventories
Inventories consist principally of raw materials purchased for the manufacture of our products. We have limited finished goods inventory as all products are custom, made-to-order products. Finished goods inventory costs include direct materials, direct labor, and overhead. All inventories are stated at the lower of cost (first-in, first-out method) or market. The reserve for obsolescence is based on management’s assessment of the amount of inventory that may become obsolete in the future and is determined through Company history, specific identification and consideration of prevailing economic and industry conditions.
Inventories consist of the following:
| December 31, 2011 |
January 1, 2011 |
|||||||
| (in thousands) | ||||||||
| Raw materials |
$ | 10,543 | $ | 9,273 | ||||
| Work in progress |
335 | 293 | ||||||
| Finished goods |
724 | 969 | ||||||
|
|
|
|
|
|||||
| $ | 11,602 | $ | 10,535 | |||||
|
|
|
|
|
|||||
Property, plant and equipment
Property, plant and equipment are recorded at cost and depreciated using the straight-line method over the estimated useful lives of the related assets. Depreciable assets are assigned estimated lives as follows:
| Building and improvements |
5 to 40 years | |||
| Furniture and equipment |
3 to 10 years | |||
| Vehicles |
3 to 10 years | |||
| Computer Software |
3 years |
Maintenance and repair expenditures are charged to expense as incurred.
Long-lived assets
We review long-lived assets for impairment whenever events or changes in circumstances indicate that the carrying amount of such assets may not be recoverable. Recoverability of assets to be held and used is measured by a comparison of the carrying amount of long-lived assets to future undiscounted net cash flows expected to be generated. If such assets are considered to be impaired, the impairment recognized is the amount by which the carrying amount of the assets exceeds the fair value of the assets. Assets to be disposed of are reported at the lower of the carrying amount or fair value less cost to sell, and depreciation is no longer recorded.
In December 2009, we recorded an impairment charge of $0.7 million to adjust the carrying value of the Lexington, North Carolina facility to reflect a decline in the market value for this property. In January 2011 we accepted an offer to sell the property. The purchase price less estimated closing cost resulted in an additional impairment of less than $0.1 million. The sale of this building closed in the second quarter of 2011.
37
Table of Contents
At January 1, 2011, we determined the fair value of the Lexington property based on the agreed upon sale price for this property. We categorize this property as being fair valued using Level 2 inputs at January 1, 2011. This facility is included in the accompanying balance sheets as of January 1, 2011 under assets held for sale.
On December 3, 2010, we announced that our Salisbury, North Carolina operations would be transferred to Venice, Florida to consolidate our window and door production at our Florida manufacturing facilities. The consolidation was completed during the second quarter of 2011. This plant closing was determined to be a triggering event since it was a significant adverse change in the assets’ use. At January 1, 2011, we determined the fair value of the Salisbury property by obtaining an appraisal of the value of the property. The appraisal was performed by an independent third party appraiser and the value was estimated using relevant comparable sales of similar properties as well as using other income based approaches. We categorize this property as being fair valued using Level 2 inputs at January 1, 2011. We recorded impairment charges of $4.6 million to adjust the carrying value of the Salisbury property to its estimate fair value of $5.5 million as of January 1, 2011, and will continue to depreciate it over its original useful life until such time that the future plans for the Salisbury property are determined.
As part of the North Carolina consolidation we also reviewed the furniture and fixtures and machinery and equipment for impairment. As a result, we recorded an impairment charge of $0.9 million to write-off the value of certain personal property that was abandoned as of January 1, 2011.
| Fair Value Measurements at Reporting
Date of Asset (Liability) Using: |
||||||||||||||||
| Description |
January 1, 2011 |
Quoted Prices in Active Markets (Level 1) |
Significant Other Observable Inputs (Level 2) |
Significant Unobservable Inputs (Level 3) |
||||||||||||
| (in thousands) | ||||||||||||||||
| Salisbury Property |
$ | 5,500 | $ | — | $ | 5,500 | $ | — | ||||||||
| Lexington Property |
657 | — | 657 | — | ||||||||||||
|
|
|
|
|
|
|
|
|
|||||||||
| $ | 6,157 | $ | — | $ | 6,157 | $ | — | |||||||||
|
|
|
|
|
|
|
|
|
|||||||||
At December 31, 2011, we obtained an updated appraisal of the Salisbury property and determined no further impairments are warranted. Additionally, we compared the undiscounted cash flows associated with the carrying value of our other long-lived assets and determined no impairment was necessary to be recorded.
Computer software
We capitalize costs associated with software developed or obtained for internal use when both the preliminary project stage is completed and it is probable that computer software being developed will be completed and placed in service. Capitalized costs include:
(i) external direct costs of materials and services consumed in developing or obtaining computer software,
(ii) payroll and other related costs for employees who are directly associated with and who devote time to the software project, and
(iii) interest costs incurred, when material, while developing internal-use software.
Capitalization of such costs ceases no later than the point at which the project is substantially complete and ready for its intended purpose.
Capitalized software as of December 31, 2011 and January 1, 2011 was $13.5 million and $12.3 million, respectively. Accumulated depreciation of capitalized software was $11.8 million and $11.0 million as of December 31, 2011 and January 1 2011, respectively.
38
Table of Contents
Depreciation expense for capitalized software was $0.9 million, $1.0 million and $1.1 million for the years ended December 31, 2011, January 1, 2011, and January 2, 2010, respectively.
We review the carrying value of software and development costs for impairment in accordance with our policy pertaining to the impairment of long-lived assets.
Goodwill
Our policy, for goodwill in the future should any be recorded, is to evaluate impairment of goodwill annually, or more frequently, if events or changes in circumstances indicate that an asset might be impaired. The annual goodwill impairment test is a two-step process. First, we will determine whether the carrying value of our Company exceeds fair value determined using a discounted cash flow model, which might indicate that goodwill may be impaired. Second, if we determine that goodwill may be impaired, we will compare the implied fair value of the goodwill determined by allocating our single reporting unit’s fair value to all of its assets and liabilities other than goodwill (including any unrecognized intangible assets) to its carrying amount to determine if there is an impairment loss.
Other intangibles
Other intangible assets consist of trade names, customer-related and intellectual intangible assets. The useful lives of trade names were determined to be indefinite and, therefore, these assets are not being amortized. Customer-related intangible assets are being amortized over their estimated useful lives of ten years. Intellectual intangible assets are being amortized over their estimated useful lives of three years. The impairment evaluation of intangible assets with indefinite lives is conducted annually, or more frequently, if events or changes in circumstances indicate that an asset might be impaired. The evaluation is performed by comparing the carrying amount of these assets to their estimated fair value.
If the estimated fair value is less than the carrying amount of the indefinite-lived intangible assets, then an impairment charge is recorded to reduce the asset to its estimated fair value. The estimated fair value is generally determined on the basis of discounted future projected cost savings attributable to ownership of the intangible assets with indefinite lives which, for us, are our trade names. See Note 7.
The assumptions used in the estimate of fair value are generally consistent with past performance and are also consistent with the projections and assumptions that are used in our current operating plans. Such assumptions are subject to change as a result of changing economic and competitive conditions.
The determination of fair value used in that assessment is highly sensitive to differences between estimated and actual cash flows and changes in the related discount rate used to evaluate fair value. Estimated cash flows are sensitive to changes in the Florida housing market and changes in the economy among other things.
Deferred financing costs
Deferred financing costs are amortized using the effective interest method over the life of the debt instrument to which they relate. Unamortized deferred financing costs, included in other current assets on the accompanying consolidated balance sheets, totaled $0.6 million and $0.7 million at December 31, 2011, and January 1, 2011, respectively. Unamortized deferred financing costs, included in other assets, net, on the accompanying consolidated balance sheets totaled $2.0 million and $0.1 million at December 31, 2011, and January 1, 2011, respectively.
On June 23, 2011, we refinanced our long-term debt incurring $3.0 million of deferred financing costs to be amortized over the credit agreement life. Also, in connection with this refinancing, we wrote off $0.4 million of deferred financing costs from the old credit agreement, which is classified within other expense (income), net in the consolidated statement of operations for the year ended December 31, 2011. In the year ended January 1, 2011, an additional $0.9 million of financing costs were deferred and were being amortized related to an amendment of our credit facility.
Amortization of deferred financing costs is included in interest expense in the accompanying consolidated statements of operations. There was $0.8 million of amortization for the year ended December 31, 2011, $0.8 million for the year ended January 1, 2011 and $0.6 million for the year ended January 2, 2010. These amounts include write-offs of deferred financing costs related to the prepayments of portions of our long-term debt (Note 9) in the amounts of $0.1 million, $0.1 million and $0.2 million, for the years ended December 31, 2011, January 1, 2011 and January 2, 2010, respectively. Accumulated amortization of debt issuance costs are $0.4 million, related to the new debt, at the end of December 31, 2011.
39
Table of Contents
Estimated amortization of deferred financing costs is as follows for future fiscal years:
| (in thousands) | ||||
| 2012 |
$ | 603 | ||
| 2013 |
594 | |||
| 2014 |
581 | |||
| 2015 |
546 | |||
| 2016 |
246 | |||
|
|
|
|||
| Total |
$ | 2,570 | ||
|
|
|
|||
Derivative financial instruments
We utilize certain derivative instruments, from time to time, including forward contracts and interest rate swaps and caps to manage variability in cash flow associated with commodity market price risk exposure in the aluminum market and interest rates. We do not enter into derivatives for speculative purposes. Additional information with regard to derivative instruments is contained in Note 11.
We account for derivative instruments in accordance with the guidance under the Derivatives and Hedging topic of the Codification which requires us to recognize all of our derivative instruments as either assets or liabilities in the consolidated balance sheet at fair value. The accounting for changes in the fair value (i.e., gains or losses) of a derivative instrument depends on whether it has been designated and qualifies as part of a hedging relationship based on its effectiveness in hedging against the exposure and further, on the type of hedging relationship. For those derivative instruments that are designated and qualify as hedging instruments, we must designate the hedging instrument, based upon the exposure being hedged, as a fair value hedge or a cash flow hedge.
Our forward contracts are designated and accounted for as cash flow hedges (i.e., hedging the exposure to variability in expected future cash flows that is attributable to a particular risk). The Derivatives and Hedging topic of the Codification provides that the effective portion of the gain or loss on a derivative instrument designated and qualifying as a cash flow hedging instrument be reported as a component of other comprehensive income and be reclassified into earnings in the same line item in the income statement as the hedged item in the same period or periods during which the transaction affects earnings. The ineffective portion of the gain or loss on these derivative instruments, if any, is recognized in other income/expense in current earnings during the period of change.
For derivative instruments not designated as hedging instruments, the gain or loss is recognized in other income/expense in current earnings during the period of change. When a cash flow hedge is terminated, if the forecasted hedged transaction is still probable of occurrence, amounts previously recorded in other comprehensive income remain in other comprehensive income and are recognized in earnings in the period in which the hedged transaction affects earnings.
As of December 31, 2011, we did not have cash on deposit with our commodities broker related to funding of margin calls on open forward contracts for the purchase of aluminum. The net liability position of $254 thousand on December 31, 2011 is included in accrued liabilities in the accompanying consolidated balance sheet as it relates to open contracts with scheduled prompt dates in 2012.
As of January 1, 2011, we were in a net asset position of approximately $550 thousand on our forward contracts for the purchase of aluminum, including approximately $250 thousand cash on deposit with our commodities broker. The net asset position on January 1, 2011 is included in other current assets in the accompanying consolidated balance sheet as it relates to open contracts with scheduled prompt dates in 2011.
For statement of cash flows presentation, we present net cash receipts from and payments to the margin account as investing activities.
Also during 2011, as part of our debt requirements we entered into a two year interest cap to offset the interest rate fluctuation associated with 50% of our initial outstanding debt. This interest rate cap was not designated as a hedge, therefore, changes in the fair value and changes in intrinsic value are and will be included in the current period earnings as other expense (income), net in the consolidated statement of operations. At December 31, 2011, the fair value of our interest rate cap was in an asset position of $28 thousand. `
40
Table of Contents
Financial instruments
Our financial instruments, not including derivative financial instruments discussed in Note 11, include cash, accounts and notes receivable, and accounts payable whose carrying amounts approximate their fair values due to their short-term nature. Our financial instruments also include long-term debt. The fair value of our current long-term debt is based on debt with similar terms and characteristics and was approximately $45.5 million as of December 31, 2011 compared to the carrying value of $45.5 million. Based on bid prices, the fair value of our long term debt as of January 1, 2011, was approximately $48 million compared to a carrying value of $50 million.
Concentrations of credit risk
Financial instruments, which potentially subject us to concentrations of credit risk, consist principally of cash and cash equivalents and trade accounts receivable. Accounts receivable are due primarily from companies in the construction industry located in Florida and the eastern half of the United States. Credit is extended based on an evaluation of the customer’s financial condition and credit history, and generally collateral is not required.
We maintain our cash with a single financial institution. The balance exceeds federally insured limits. At December 31, 2011 and January 1, 2011, such balance exceeded the insured limit by $10.8 million and $21.1 million, respectively.
Comprehensive loss
Comprehensive loss is reported on the consolidated statements of shareholders’ equity and accumulated other comprehensive loss is reported on the consolidated balance sheets and the statement of shareholders’ equity.
Gains and losses on cash flow hedges, to the extent effective, are included in other comprehensive loss. Reclassification adjustments reflecting such gains and losses are ratably recorded in income in the same period as the hedged items affect earnings. Additional information with regard to accounting policies associated with derivative instruments is contained in Note 11.
Stock compensation
We use a fair-value based approach for measuring stock-based compensation and, therefore, record compensation expense over an award’s vesting period based on the award’s fair value at the date of grant. Our Company’s awards vest based only on service conditions and compensation expense is recognized on a straight-line basis for each separately vesting portion of an award. Stock-based compensation expense is recognized only for those awards that are ultimately expected to vest, and we have applied an estimated forfeiture rate to unvested awards for the purpose of calculating compensation cost. These estimates will be revised in future periods if actual forfeitures differ from the estimates. Changes in forfeiture estimates impact compensation cost in the period in which the change in estimate occurs. We recorded compensation expense for stock based awards of $1.8 million before tax, or $0.03 per diluted share after-tax effect, $2.3 million before income tax, or $0.04 per diluted share after-tax effect, and $0.5 million before income tax, or $0.01 per diluted share after-tax effect, in the years ended December 31, 2011, January 1, 2011, and January 2, 2010, respectively.
Income and other taxes
We account for income taxes utilizing the liability method. Deferred income taxes are recorded to reflect consequences on future years of differences between financial reporting and the tax basis of assets and liabilities measured using the enacted statutory tax rates and tax laws applicable to the periods in which differences are expected to affect taxable earnings. We have no material liability for unrecognized tax benefits. However, should we accrue for such liabilities, when and if they arise in the future, we will recognize interest and penalties associated with uncertain tax positions as part of our income tax provision.
Sales taxes collected from customers have been recorded on a net basis.
41
Table of Contents
Net loss per common share
We present basic and diluted earnings per share. Basic earnings per share is computed using the weighted average number of common shares outstanding during the period. Diluted earnings per share is computed using the weighted average number of common shares outstanding during the period, plus the dilutive effect of common stock equivalents. We follow the “two class” method of accounting for earnings per share due to the fact that our unvested restricted stock awards are participating securities.
Our weighted average shares outstanding excludes underlying options of 5.5 million, 4.4 million and 1.4 million for the years ended December 31, 2011, January 1, 2011, and January 2, 2010, respectively, because their effects were anti-dilutive.
The 2010 rights offering closed with shares of stock being issued at a price lower than the fair value of the stock, which created a bonus element similar in nature to a stock dividend. Accordingly, weighted average basic and diluted shares outstanding prior to the 2010 rights offering were restated to show the number of common shares outstanding immediately prior to the rights offering multiplied by the following factor: (fair value per share immediately prior to the exercise of the rights)/(theoretical ex-rights fair value per share). Theoretical ex-rights fair value per share was computed by adding the aggregate fair value of the shares immediately prior to the exercise of the rights to the proceeds expected from the exercise of the rights and dividing by the number of shares outstanding after the exercise of the rights.
Basic and diluted earnings per share for the year ended January 2, 2010, was reduced by $0.01, as a result of the bonus element in the 2010 rights offering.
The table below presents the calculation of basic and diluted earnings per share, including a reconciliation of weighted average common shares:
| Year Ended | ||||||||||||
| December 31, | January 1, | January 2, | ||||||||||
| (in thousands, except per share amounts) | 2011 | 2011 | 2010 | |||||||||
| Numerator: |
||||||||||||
| Net loss |
$ | (16,898 | ) | $ | (14,495 | ) | $ | (9,417 | ) | |||
|
|
|
|
|
|
|
|||||||
| Denominator: |
||||||||||||
| Weighted-average common shares—Basic |
53,659 | 50,174 | 36,241 | |||||||||
| Add: Dilutive effect of stock compensation plans |
— | — | — | |||||||||
|
|
|
|
|
|
|
|||||||
| Weighted-average common shares—Diluted |
53,659 | 50,174 | 36,241 | |||||||||
|
|
|
|
|
|
|
|||||||
| Net loss per common share: |
||||||||||||
| Basic |
$ | (0.31 | ) | $ | (0.29 | ) | $ | (0.26 | ) | |||
|
|
|
|
|
|
|
|||||||
| Diluted |
$ | (0.31 | ) | $ | (0.29 | ) | $ | (0.26 | ) | |||
|
|
|
|
|
|
|
|||||||
| 3. | Recently Issued Accounting Pronouncements |
In May 2011, the Financial Accounting Standards Board (FASB) amended its guidance related to fair value measurement and disclosure. The amended guidance generally clarifies existing measurement and disclosure requirements and results in greater consistency between U.S. GAAP and International Financial Reporting Standards (IFRS). The provisions of the amended guidance will be effective for the Company beginning in the first quarter of 2012. The Company does not expect the adoption of the provisions of the amended guidance to have a material impact on its disclosures.
In June 2011, the FASB amended its guidance related to the presentation of other comprehensive income. The amended guidance requires the presentation of other comprehensive income and its components either (1) together with the components of net income in one continuous statement of comprehensive income or (2) as a separate statement immediately following the statement of income with equal prominence. The provisions of the amended guidance will be effective for the Company beginning in the first quarter of 2012 and will be applied retrospectively.
| 4. | Consolidation and Restructurings |
On December 3, 2010, we announced that our Salisbury, North Carolina operations would be transferred to Venice, Florida to consolidate our window and door production at our Florida plant. We recorded consolidation charges of $4.1 million, which includes $1.3 million of severance expense and $2.8 million of moving expenses. The classification of charges were $3.4 million within cost of goods sold, and the remaining $0.7 million within selling, general and administrative expenses in the accompanying consolidated statement of operations. The total charges recorded through December 31, 2011 for the consolidation are $6.2 million, $2.1 million having been recorded in December 2010, of which approximately less than $0.1 million and $1.8 million are accrued as of December 31, 2011 and January 1, 2011, respectively, and are classified in accounts payable and accrued liabilities within the accompanying condensed consolidated balance sheets. The unpaid severance expense as of December 31, 2011 is expected to be disbursed prior to the end of 2012. (Note 8)
42
Table of Contents
On January 13, 2009, March 10, 2009, September 24, 2009 and November 12, 2009, we announced restructurings as a result of continued analysis of our target markets, internal structure, projected run-rate, and efficiency. As a result of the restructurings, we recorded restructuring charges of $5.4 million in the accompanying consolidated statement of operations for the year ended January 2, 2010, of which $3.1 million is classified within cost of goods sold. The remaining $2.3 million is classified within selling, general and administrative expenses in the accompanying consolidated statement of operations for the year ended January 2, 2010. Of the $5.4 million, $2.6 million was disbursed in the first quarter of 2009. The remaining $0.9 million is classified within accrued liabilities in the accompanying consolidated balance sheet as of January 2, 2010.
The following table provides information with respect to the accrual for the severance for the consolidation and restructuring costs:
| (in thousands) | Beginning of Year |
Charged to Expense |
Disbursed in Cash |
End of Year |
||||||||||||
| Year ended December 31, 2011: |
||||||||||||||||
| Consolidation |
$ | 1,812 | $ | 1,286 | $ | (3,083 | ) | $ | 15 | |||||||
|
|
|
|
|
|
|
|
|
|||||||||
| For the year ended December 31, 2011 |
$ | 1,812 | $ | 1,286 | $ | (3,083 | ) | $ | 15 | |||||||
|
|
|
|
|
|
|
|
|
|||||||||
| Year ended January 1, 2011: |
||||||||||||||||
| 2009 Restructuring |
$ | 898 | $ | — | $ | (898 | ) | $ | — | |||||||
| Consolidation |
— | 2,053 | (241 | ) | 1,812 | |||||||||||
|
|
|
|
|
|
|
|
|
|||||||||
| For the year ended January 1, 2011 |
$ | 898 | $ | 2,053 | $ | (1,139 | ) | $ | 1,812 | |||||||
|
|
|
|
|
|
|
|
|
|||||||||
| Year ended January 2, 2010: |
||||||||||||||||
| 2008 Restructuing |
$ | 332 | $ | — | $ | (332 | ) | $ | — | |||||||
| 2009 Restructuring |
— | 5,395 | (4,497 | ) | 898 | |||||||||||
|
|
|
|
|
|
|
|
|
|||||||||
| For the year ended January 2, 2010 |
$ | 332 | $ | 5,395 | $ | (4,829 | ) | $ | 898 | |||||||
|
|
|
|
|
|
|
|
|
|||||||||
| 5. | Property, Plant and Equipment |
The following table presents the composition of property, plant and equipment as of:
| December 31, | January 1, | |||||||
| 2011 | 2011 | |||||||
| (in thousands) | ||||||||
| Land |
$ | 5,368 | $ | 5,170 | ||||
| Buildings and improvements |
41,318 | 41,141 | ||||||
| Machinery and equipment |
47,095 | 50,056 | ||||||
| Vehicles |
5,847 | 5,674 | ||||||
| Software |
13,518 | 12,250 | ||||||
| Construction in progress |
531 | 953 | ||||||
|
|
|
|
|
|||||
| 113,677 | 115,244 | |||||||
| Less accumulated depreciation |
(65,071 | ) | (62,381 | ) | ||||
|
|
|
|
|
|||||
| $ | 48,606 | $ | 52,863 | |||||
|
|
|
|
|
|||||
January 1, 2011 includes a reclassification of $1.6 million from building and improvements to land to correspond with current year presentation.
43
Table of Contents
| 6. | Acquisition |
Pursuant to an asset purchase agreement by and between Hurricane Window and Door Factory, LLC (“Hurricane”) of Ft. Myers, Florida, and our operating subsidiary, PGT Industries, Inc., effective on August 14, 2009, we acquired certain operating assets of Hurricane for approximately $1.5 million in cash.
The purchase price paid was allocated to the assets acquired based on their estimated fair value on August 14, 2009. The assets acquired included Hurricane’s inventory, comprised almost entirely of raw materials, and property and equipment, primarily comprised of machinery and other manufacturing equipment. We also acquired the right to use Hurricane’s design technology and other intellectual property through the end of 2010 and the option to purchase such design technology and other intellectual property at any time through the end of 2010. The allocation of the $1.5 million cash purchase price to the fair value of the assets acquired as of the August 14, 2009 acquisition date is as follows:
| (in thousands) | Fair Values | |||
| Inventory |
$ | 254 | ||
| Property and equipment |
623 | |||
| Identifiable intangibles |
575 | |||
|
|
|
|||
| Net assets acquired |
1,452 | |||
| Purchase price |
1,452 | |||
|
|
|
|||
| Goodwill |
$ | — | ||
|
|
|
|||
The value of inventory was established based on the current purchase prices of identical materials available from Hurricane’s existing vendors. The value of property and equipment was established based on Hurricane’s net carrying values which we determined to approximate fair value due to, among other things, their having been in service for less than one year. We engaged a third-party valuation specialist to assist us in estimating the fair value of the identifiable intangible assets consisting of the right to use Hurricane’s design technology and the related purchase option. The fair value of the identifiable intangible assets was estimated using an income approach based on projections provided by management. The carrying value of the intangible assets is less than $0.1 million at January 1, 2011. The intangible assets were amortized on the straight-line basis over their estimated lives of approximately 1.4 years through the end of 2010. Amortization expense of less than $0.1 million and $0.4 million, respectively, is included in selling, general and administrative expenses in the accompanying consolidated statements of operations for the years ended December 31, 2011 and January 1, 2011. Hurricane’s operating results prior to the acquisition were insignificant.
On December 17, 2010, we exercised our option and acquired the intellectual property assets of Hurricane. With this acquisition, we acquired, among other things, all of the intellectual property underlying our PremierVue line of vinyl impact-resistant windows and doors for the single- and multi-family residential markets. The purchase price was $2.8 million of which $2.6 million was paid at closing, and the remainder was paid during 2011. As of January 1, 2011 $0.2 million is included in accrued liabilities in the accompanying balance sheet. The carrying value of the intangible assets of $1.8 million and $2.8 million, respectively, are included in other intangible assets, net, in the accompanying balance sheets at December 31, 2011 and January 1, 2011. The intangible assets are being amortized on the straight-line basis over their estimated useful lives of approximately 3 years. Amortization expense of $1.0 million and less than $0.1 million is included in selling, general and administrative expenses in the accompanying consolidated statements of operations for the years ended December 31, 2011 and January 1, 2011, respectively.
44
Table of Contents
| 7. | Other Intangible Assets |
Other intangible assets are as follows as of:
| December 31, | January 1, | Useful Life | ||||||||||
| 2011 | 2011 | (in years) | ||||||||||
| (in thousands) | ||||||||||||
| Other Intangible Assets |
||||||||||||
| Trade names |
$ | 38,441 | $ | 44,400 | indefinite | |||||||
|
|
|
|
|
|||||||||
| Customer relationships |
55,700 | 55,700 | 10 | |||||||||
| Less: Accumulated amortization |
(44,131 | ) | (38,562 | ) | ||||||||
|
|
|
|
|
|||||||||
| Subtotal |
11,569 | 17,138 | ||||||||||
|
|
|
|
|
|||||||||
| Hurricane technology |
575 | 575 | 1.4 | |||||||||
| Less: Accumulated amortization |
(575 | ) | (575 | ) | ||||||||
|
|
|
|
|
|||||||||
| Subtotal |
— | — | ||||||||||
|
|
|
|
|
|||||||||
| Hurricane intellectual assets |
2,797 | 2,797 | 3 | |||||||||
| Less: Accumulated amortization |
(977 | ) | (44 | ) | ||||||||
|
|
|
|
|
|||||||||
| 1,820 | 2,753 | |||||||||||
|
|
|
|
|
|||||||||
| Other intangible assets, net |
$ | 51,830 | $ | 64,291 | ||||||||
|
|
|
|
|
|||||||||
Indefinite Lived Intangible Asset
The impairment evaluation of the carrying amount of intangible assets with indefinite lives is conducted annually, or more frequently, if events or changes in circumstances indicate that an asset might be impaired. The evaluation is performed by comparing the carrying amount of these assets to their estimated fair value. If the estimated fair value is less than the carrying amount of the intangible assets, then an impairment charge is recorded to reduce the asset to its estimated fair value. The estimated fair value is determined using the relief from royalty method that is based upon the discounted projected cost savings (value) attributable to ownership of our trade names, our only indefinite lived intangible assets. We categorize these trade names as being valued using Level 3 inputs.
In estimating fair value, the method we use requires us to make assumptions, the most material of which are net sales projections attributable to products sold with these trade names, the anticipated royalty rate we would pay if the trade names were not owned (as a percent of net sales), and a weighted average discount rate. These assumptions are subject to change based on changes in the markets in which these products are sold, which impact our projections of future net sales and the assumed royalty rate. Factors affecting the weighted average discount rate include assumed debt to equity ratios, risk-free interest rates and equity returns, each for market participants in our industry.
Our year-end test of trade names performed as of December 31, 2011 utilized net sales, which reflected the negative factors affecting the industry including; continued high unemployment, depressed housing market conditions, especially in our core market of Florida, and include modest growth in future years, a weighted average royalty rate of 4.0% and a discount rate of 17.0%. As of December 31, 2011, the estimated fair value of the trade names based on this calculation was $37.4 million, which resulted in a $6.0 million impairment charge. We believe our projected sales are reasonable based on available information regarding our industry. We also believe the royalty rate is appropriate and could improve over time based on market trends and information, including that which is set forth above. The discount rate was based on current financial market trends and will remain dependent on such trends in the future.
Amortizable Intangible Assets
As a result of the impairment indicators described above, we tested our amortizable intangible assets, which are our customer relationships and Hurricane intellectual assets, for impairment by comparing the estimated future undiscounted net cash flows expected to be generated by the asset group containing these assets to their carrying values and determined that there was no impairment for the year ended December 31, 2011. No impairment testing was performed during the year ended January 1, 2011, due to the fact that there were no triggering events.
45
Table of Contents
Estimated amortization of our customer relationships and Hurricane intellectual assets is as follows for future fiscal years:
| (in thousands) | ||||
| 2012 |
$ | 6,502 | ||
| 2013 |
6,459 | |||
| 2014 |
428 | |||
|
|
|
|||
| Total |
$ | 13,389 | ||
|
|
|
|||
| 8. | Accrued Liabilities |
Accrued liabilities consisted of the following:
| December 31, | January 1, | |||||||
| 2011 | 2011 | |||||||
| (in thousands) | ||||||||
| Accrued payroll and benefits |
$ | 1,582 | $ | 4,777 | ||||
| Accrued warranty |
2,793 | 2,540 | ||||||
| Accrued consolidation/restructuring costs |
15 | 1,812 | ||||||
| Provision for loss contract |
— | 215 | ||||||
| Accrued health claims insurance payable |
542 | 779 | ||||||
| Accrued interest |
708 | — | ||||||
| Accrued property tax |
819 | 695 | ||||||
| Aluminum forward contracts |
254 | — | ||||||
| Other |
890 | 899 | ||||||
|
|
|
|
|
|||||
| $ | 7,603 | $ | 11,717 | |||||
|
|
|
|
|
|||||
Other accrued liabilities are comprised primarily of unearned revenue related to customer deposits, state sales taxes and customer rebates.
| 9. | Long-Term Debt |
Long-term debt consists of the following:
| December 31, | January 1, | |||||||
| 2011 | 2011 | |||||||
| (in thousands) | ||||||||
| Tranche A2 term note payable with a payment of $132 due November 14, 2011. A lump sum payment of $49.9 million was due on February 14, 2012. Interest is payable quarterly at LIBOR or the rate plus an applicable margin. At January 1, 2011, the average rate was 2.75% plus a margin of 4.00%. |
$ | — | $ | 50,000 | ||||
| Term note payable with a payment of $500 due on March 30, 2013 Quarterly installments of $600 beginning June 29, 2013 through July 4, 2015. Quarterly installments of $900 beginning October 3, 2015 through April 2, 2016. A lump sum payment of $36.9 million is due on June 23, 2016. Interest is payable quarterly at LIBOR or the prime rate plus an applicable margin. At December 31, 2011, the average rate was 1.25% plus a margin of 4.50%. |
45,500 | — | ||||||
| Obligations under capital leases |
50 | 163 | ||||||
|
|
|
|
|
|||||
| Less current portion of long-term debt and capital leases |
45,550 | 50,163 | ||||||
| (50 | ) | (245 | ) | |||||
|
|
|
|
|
|||||
| $ | 45,500 | $ | 49,918 | |||||
|
|
|
|
|
|||||
46
Table of Contents
On June 23, 2011, PGT Industries, Inc. entered into a credit agreement (the “Credit Agreement”) with three lenders. The Credit Agreement replaces the Company’s second amended and restated credit agreement, dated as of February 14, 2006 (the “Old Credit Agreement”). The Credit Agreement provides for a $15.0 million revolving credit facility, a $48.0 million term loan facility and an uncommitted incremental facility in an amount of up to $25.0 million. The revolving credit facility commitment and the term loans under the Credit Agreement will mature five years from the date of the execution of the Credit Agreement. As of December 31, 2011, there were $1.5 million of letters of credit outstanding and $13.5 million available on the revolver.
All borrowings under the Credit Agreement bear interest, at our option, at either: (a) a “base rate” equal to the highest of: (i) 0.50% per year above the weighted average of the rates on overnight federal funds transactions with members of the Federal Reserve System, (ii) the annual rate of interest in effect for that day as publicly announced as the “prime rate” and (iii) the one-month “eurodollar rate” (not to be less than 1.25%) or (b) a “Eurodollar base rate” equal to the higher of (i) 1.25% and (ii) (adjusted for reserve requirements, deposit insurance assessment rates and other regulatory costs for Eurodollar liabilities) the rate at which Eurodollar deposits in dollars for the relevant interest period (which will be one, two, three or six months or, subject to availability, nine or twelve months, as selected by us) are offered in the interbank Eurodollar market plus, in each case, a rate dependent on the ratio of our funded debt as compared to our adjusted consolidated EBITDA, ranging from 3.5% to 2.0% per year for borrowings bearing interest at the “base rate” and from 4.5% to 3.0% per year for borrowings bearing interest at the “Eurodollar rate” (such rate added to the “Eurodollar rate,” the “Eurodollar Margin”).
In accordance with the Credit Agreement we will pay quarterly fees on the unused portion of the revolving credit facility at a rate equal to 0.50% as well as a quarterly letter of credit fee at a rate per annum equal to the Eurodollar Margin for revolving loans based on the maximum undrawn face amount of any outstanding letters of credit. We also pay customary transaction charges in connection with any letters of credit. In connection with this refinancing, we wrote-off $0.4 million of deferred financing costs from the Old Credit Agreement, which are classified within other expense (income), net in the consolidated statement of operations for the year ended December 31, 2011.
The Credit Agreement imposes certain restrictions on us, including restrictions on our ability to: incur debt or provide guarantees; grant or suffer to exist liens; sell our assets; pay dividends or make other distributions in respect of capital stock; prepay certain indebtedness, make loans, advances, investments and acquisitions; change our line of business; engage in affiliate transactions; consummate mergers, consolidations or other fundamental transactions; and enter into agreements with negative pledge clauses. Commencing with the fiscal quarter ending on October 1, 2011, the Credit Agreement also requires us to maintain certain minimum interest coverage ratios and maximum leverage ratios, which are tested at the end of each fiscal quarter, and further provides for customary affirmative covenants (including obligations to hedge a portion of our interest rate risk) and events of default. This obligation was fulfilled with an interest rate cap (See Note 11). We believe that we are in compliance with all restrictive financial covenants as of December 31, 2011.
PGT, Inc. has unconditionally guaranteed all loans and other obligations under the Credit Agreement and related documents and such guarantee is secured by a lien on substantially all of the assets of our wholly owned subsidiary, PGT Industries, Inc., subject to certain limitations. PGT, Inc. has no operations or assets independent of its subsidiary.
During 2011, we prepaid $2.5 million on the new Credit Agreement with cash generated from operations and expensed $114 thousand of associated debt issuance costs. This prepayment changed our required repayment schedule; however the final payment of all amounts outstanding (including accrued interest) is still due five years from the date of the execution of the Credit Agreement.
As of December 31, 2011, the contractual future maturities of long-term debt and capital leases outstanding as of December 31, 2011 are as follows (in thousands):
| 2012 |
$ | 50 | ||
| 2013 |
2,300 | |||
| 2014 |
2,400 | |||
| 2015 |
3,000 | |||
| 2016 |
37,800 | |||
|
|
|
|||
| Total |
$ | 45,550 | ||
|
|
|
47
Table of Contents
The Old Credit Agreement consisted of a $235.0 million senior secured credit facility (“Terminated Facility”) and a $115.0 million second lien term loan due February 14, 2012, with a syndicate of banks. The Terminated Facility was composed of a $25 million revolving credit facility, having been reduced from $30.0 million as a result of the third amendment discussed below, and initially, a $205 million first lien term loan. The second lien term loan was fully repaid with proceeds from our IPO in 2006. The outstanding balance of the first lien term loan on January 1, 2011 was $50.0 million. During all of 2010, we prepaid $18.0 million of long-term debt with cash generated from operations and from the net proceeds of the rights offering.
On December 24, 2009, we announced that we entered into a third amendment to the Terminated Facility. The amendment, among other things, provided a leverage covenant holiday for 2010, increased the maximum leverage amount for the first quarter of 2011 to 6.25 times (then dropping 0.25X per quarter starting the second quarter until the end of the term), extended the due date on the revolver loan until the end of 2011, increased the applicable rate on any outstanding revolver loan by 25 basis points, and set a base rate floor of 4.25%. The effectiveness of the amendment was conditioned, among other things, on the repayment of at least $17.0 million of the term loan under the Terminated Facility no later than March 31, 2010, of which no more than $2.0 million was permitted to come from cash on hand. In December 2009, the Company used cash generated from operations to prepay $2.0 million of outstanding borrowings under the Terminated Facility. Using proceeds from the 2010 rights offering, the Company made an additional prepayment of $15.0 million on March 17, 2010, bringing total prepayments of debt at that time to $17.0 million. Fees paid to the administrative agent and lenders totaled $1.0 million. Such fees were being amortized using the effective interest method over the remaining term of the Terminated Facility. Having made the total required prepayment and having satisfied all other conditions to bring the amendment into effect, the amendment became effective on March 17, 2010.
Under the third amendment, the first lien term loan bore interest at a rate equal to an adjusted LIBOR rate plus a margin ranging from 3.5% per annum to 5.0% per annum or a base rate plus a margin ranging from 2.5% per annum to 4.0% per annum, at our option. The margin in either case is dependent on our leverage ratio. The loans under the Terminated Facility bore interest at a rate equal to an adjusted LIBOR rate plus a margin depending on our leverage ratio ranging from 3.0% per annum to 5.0% per annum or a base rate plus a margin ranging from 2.0% per annum to 4.0% per annum, at our option. The amendment established a floor of 4.25% for base rate loans, and continued the 3.25% floor for adjusted LIBOR established in the previous amendment.
| 10. | Interest Expense |
Interest expense, net consisted of the following (in thousands):
| Year Ended | ||||||||||||
| December 31, | January 1, | January 2, | ||||||||||
| 2011 | 2011 | 2010 | ||||||||||
| Long-term debt |
$ | 3,040 | $ | 4,031 | $ | 5,780 | ||||||
| Debt fees |
410 | 422 | 475 | |||||||||
| Amortization of deferred financing costs |
813 | 773 | 561 | |||||||||
| Interest income |
(59 | ) | (72 | ) | (53 | ) | ||||||
|
|
|
|
|
|
|
|||||||
| Interest expense |
4,204 | 5,154 | 6,763 | |||||||||
| Capitalized interest |
(36 | ) | (31 | ) | (65 | ) | ||||||
|
|
|
|
|
|
|
|||||||
| Interest expense, net |
$ | 4,168 | $ | 5,123 | $ | 6,698 | ||||||
|
|
|
|
|
|
|
|||||||
| 11. | Derivatives |
Aluminum Forward Contracts
We enter into aluminum forward contracts to hedge the fluctuations in the purchase price of aluminum extrusion we use in production. Our contracts are designated as cash flow hedges since they are highly effective in offsetting changes in the cash flows attributable to forecasted purchases of aluminum.
Guidance under the Financial Instruments topic of the Codification requires us to record our hedge contracts at fair value and consider our credit risk for contracts in a liability position, and our counter-party’s credit risk for contracts in an asset position, in determining fair value. We assess our counter-party’s risk of non-performance when measuring the fair value of financial instruments in an asset position by evaluating their financial position, including cash on hand, as well as their credit ratings. We assess our risk of non-performance when measuring the fair value of our financial instruments in a liability position by evaluating our credit ratings, our current liquidity including cash on hand and availability under our revolving credit facility as compared to the maturities of the financial liabilities. In addition, we entered into a master netting arrangement (MNA) with our commodities broker that provides for, among other things, the close-out netting of exchange-traded transactions in the event of the insolvency of either party to the MNA.
48
Table of Contents
We net cash collateral from payments of margin calls on deposit with our commodities broker against the liability position of open contracts for the purchase of aluminum on a first-in, first-out basis. For statement of cash flows presentation, we present net cash receipts from and payments to the margin account as investing activities.
We maintain a $2.0 million line of credit with our commodities broker to cover the liability position of open contracts for the purchase of aluminum in the event that the price of aluminum falls. Should the price of aluminum fall to a level which causes our liability for open aluminum contracts to exceed $2.0 million, we are required to fund daily margin calls to cover the excess.
As of December 31, 2011, the fair value of our aluminum forward contracts was in a net liability position of approximately $254 thousand. We had 30 outstanding forward contracts for the purchase of 5.7 million pounds of aluminum at an average price of $0.97 per pound with maturity dates of between less than one month and 12 months through December 2012. We assessed the risk of non-performance of the Company on these contracts and recorded an immaterial adjustment to fair value as of December 31, 2011.
As of January 1, 2011, the fair value of our aluminum forward contracts was in a net asset position of approximately $0.6 million including $0.3 million of cash on deposit with our commodities broker. We had 18 outstanding forward contracts for the purchase of 2.6 million pounds of aluminum at an average price of $1.00 per pound with maturity dates of between less than one month and 12 months through December 2011. We assessed the risk of non-performance of the counter-party to these contracts and recorded an immaterial adjustment to fair value as of January 1, 2011.
As of January 1, 2011, we had entered into six zero cost collars with a ceiling of $2,700 per metric ton and a concurrent floor at $2,295 per metric ton that hedged 10% of our 2011 anticipated needs. Should prices fall within the range upon settlement, there is no cost to the collars. If aluminum is above $2,700 per metric ton we would be able to purchase at $2,700 per ton. If aluminum is below $2,295 per metric ton we would be required to purchase at $2,295 per metric ton. As of January 1, 2011 aluminum was priced between our ceiling and floor and the net fair value was insignificant. During 2011, these collars expired and no further collars were entered into as of December 31, 2011.
Interest Rate Contract
On August 8, 2011, we entered into a two year interest rate cap to hedge interest rate increases associated with 50% of our initial outstanding debt. We are exposed to changes in the LIBOR rate, should it increase over our floor established in the Credit Agreement of 1.25%. The cap indexes to quarterly LIBOR with a notional amount of $24,000,000, based on a strike rate of 1.25% payable quarterly, which will effectively cap our LIBOR rate at a maximum of 1.25% for that amount of debt. Changes in the intrinsic value of the cap are expected to offset the changes in cash flow (changes in interest payments) attributable to fluctuations in interest rates above 1.25%. This interest rate cap was not designated as a hedge, therefore, changes in the fair value and changes in intrinsic value are and will be included in the current period earnings as other expense (income), net in the consolidated statement of operations. At December 31, 2011, the fair value of our interest rate cap was in an asset position of $28 thousand.
49
Table of Contents
The fair value of our aluminum hedges and interest rate cap are classified in the accompanying consolidated balance sheets as follows (in thousands):
| December 31, | January 1, | |||||||||
| 2011 | 2011 | |||||||||
| Derivatives in a net asset (liability) position |
Balance Sheet Location |
|||||||||
| Hedging instruments: |
||||||||||
| Aluminum forward contracts |
Other Current Assets | $ | — | $ | 300 | |||||
| Cash on deposit related to payments of margin calls |
Other Current Assets | — | 250 | |||||||
| Interest rate cap |
Other Current Assets | 28 | — | |||||||
| Aluminum forward contracts |
Acccrued Liabilities | (254 | ) | — | ||||||
|
|
|
|
|
|||||||
| Total hedging instruments |
$ | (226 | ) | $ | 550 | |||||
|
|
|
|
|
|||||||
Aluminum forward contracts identical to those held by us trade on the London Metal Exchange (“LME”). The LME provides a transparent forum and is the world’s largest center for the trading of futures contracts for non-ferrous metals. The prices are used by the metals industry worldwide as the basis for contracts for the movement of physical material throughout the production cycle. Based on this high degree of volume and liquidity in the LME, the valuation price at any measurement date for contracts with identical terms as to prompt date, trade date and trade price as those we hold at any time we believe represents a contract’s exit price to be used for purposes of determining fair value. We categorize these aluminum forward contracts as being valued using Level 2 inputs.
Interest rate cap contracts identical to that held by us are sold by financial institutions. The valuation price at any measurement date for a contract with identical terms, exercise price, the expiration date, the settlement date, and notional quantities, as the one we hold, is used for determining the fair value. We categorize this cap as being valued using Level 2 inputs.
| Quoted | Significant | Significant | ||||||||||||||
| Prices in | Other Observable | Unobservable | ||||||||||||||
| December 31, | Active Markets | Inputs | Inputs | |||||||||||||
| Description |
2011 | (Level 1) | (Level 2) | (Level 3) | ||||||||||||
| (in thousands) | ||||||||||||||||
| Forward contracts for aluminum |
$ | (254 | ) | $ | — | $ | (254 | ) | $ | — | ||||||
| Interest rate cap |
28 | — | 28 | — | ||||||||||||
|
|
|
|
|
|
|
|
|
|||||||||
| Derivative financial instruments |
$ | (226 | ) | |||||||||||||
|
|
|
|||||||||||||||
| Quoted | Significant | Significant | ||||||||||||||
| Prices in | Other Observable | Unobservable | ||||||||||||||
| January 1, | Active Markets | Inputs | Inputs | |||||||||||||
| Description |
2011 | (Level 1) | (Level 2) | (Level 3) | ||||||||||||
| (in thousands) | ||||||||||||||||
| Forward contracts for aluminum |
$ | 300 | $ | — | $ | 300 | $ | — | ||||||||
|
|
|
|
|
|
|
|||||||||||
| Cash on deposit related to payments of margin calls |
250 | |||||||||||||||
|
|
|
|||||||||||||||
| Derivative financial instruments |
$ | 550 | ||||||||||||||
|
|
|
|||||||||||||||
Our aluminum hedges qualify as highly effective for reporting purposes. For the years ended December 31, 2011, January 1, 2011, and January 2, 2010, the ineffective portion of the hedging instruments was not significant. Effectiveness of aluminum forward contracts is determined by comparing the change in the fair value of the forward contract to the change in the expected cash to be paid for the hedged item. At December 31, 2011, these contracts were designated as effective. The effective portion of the gain or loss on our aluminum forward contracts is reported as a component of other comprehensive loss and is reclassified into earnings in the same line item in the income statement as the hedged item in the same period or periods during which the transaction affects earnings. For the years ended December 31, 2011, January 1, 2011, and January 2, 2010, no amounts were reclassified to earnings because it was probable that the original forecasted transaction would not occur. The ending accumulated balance for the aluminum forward contracts included in accumulated other comprehensive income, net of tax, is ($0.3) million as of December 31, 2011.
50
Table of Contents
The following represents the gains (losses) on derivative financial instruments for the years ended December 31, 2011, January 1, 2011, and January 2, 2010 and their classifications within the accompanying consolidated financial statements (in thousands):
| Derivatives in Cash Flow Hedging Relationships | ||||||||||||||||||||||||||
| Amount of Gain or (Loss) Recognized in OCI on Derivatives (Effective Portion) |
Location of Gain or |
Amount of Gain or (Loss) Reclassified from Accumulated OCI into Income (Effective Portion) |
||||||||||||||||||||||||
| Year Ended | Year Ended | |||||||||||||||||||||||||
| December 31, | January 1, | January 2, | December 31, | January 1, | January 2, | |||||||||||||||||||||
| 2011 | 2011 | 2010 | 2011 | 2011 | 2010 | |||||||||||||||||||||
| Aluminum contracts |
$ | (220 | ) | $ | 38 | $ | 1,373 | Cost of sales | $ | 335 | $ | 231 | $ | (3,338 | ) | |||||||||||
| Derivatives in Cash Flow Hedging Relationships | ||||||||||||||||||||
| Location of Gain or (Loss) |
Amount of Gain or (Loss) Recognized in Income on Derivatives (Ineffective Portion) |
|||||||||||||||||||
| Year Ended | ||||||||||||||||||||
| December 31, | January 1, | January 2, | ||||||||||||||||||
| 2011 | 2011 | 2010 | ||||||||||||||||||
| Aluminum contracts |
Other income or other expense | $ | — | $ | 19 | $ | (37 | ) | ||||||||||||
| 12. | Income Taxes |
We consider all income sources, including other comprehensive income, in determining the amount of tax benefit allocated to continuing operations (the “Income Tax Allocation”). Accordingly, for the year ended January 2, 2010, we recorded an income tax benefit of $5.6 million, including a non-cash income tax benefit of $1.8 million on the loss from continuing operations, with an offsetting non-cash income tax expense of $1.8 million on other comprehensive income. Our overall tax provision was not impacted by this tax allocation.
The components of income tax (benefit) expense are as follows (in thousands):
| Year Ended | ||||||||||||
| December 31, | January 1, | January 2, | ||||||||||
| 2011 | 2011 | 2010 | ||||||||||
| Current: |
||||||||||||
| Federal |
$ | — | $ | 77 | $ | (3,739 | ) | |||||
| State |
— | — | (32 | ) | ||||||||
|
|
|
|
|
|
|
|||||||
| — | 77 | (3,771 | ) | |||||||||
|
|
|
|
|
|
|
|||||||
| Deferred: |
||||||||||||
| Federal |
(2,086 | ) | — | (1,527 | ) | |||||||
| State |
(238 | ) | — | (286 | ) | |||||||
|
|
|
|
|
|
|
|||||||
| (2,324 | ) | — | (1,813 | ) | ||||||||
|
|
|
|
|
|
|
|||||||
| Income tax (benefit) expense |
$ | (2,324 | ) | $ | 77 | $ | (5,584 | ) | ||||
|
|
|
|
|
|
|
|||||||
51
Table of Contents
A reconciliation of the statutory federal income tax rate to our effective rate is provided below:
| Year Ended | ||||||||||||
| December 31, | January 1, | January 2, | ||||||||||
| 2011 | 2011 | 2010 | ||||||||||
| Statutory federal income tax rate |
35.0 | % | 35.0 | % | 35.0 | % | ||||||
| State income taxes, net of federal income tax benefit |
4.0 | % | 4.0 | % | 4.0 | % | ||||||
| Income tax allocation |
— | — | 12.1 | % | ||||||||
| Other |
(0.2 | %) | (0.4 | %) | (2.7 | %) | ||||||
| Non-deductible expenses |
— | (0.3 | %) | (2.0 | %) | |||||||
| State tax credits |
— | (2.7 | %) | 0.3 | % | |||||||
| Valuation allowance on deferred tax assets |
(26.7 | %) | (36.1 | %) | (9.5 | %) | ||||||
|
|
|
|
|
|
|
|||||||
| 12.1 | % | (0.5 | %) | 37.2 | % | |||||||
|
|
|
|
|
|
|
|||||||
Our effective combined federal and state tax rate was 12.1%, (0.5%), and 37.2% for the years ended December 31, 2011, January 1, 2011, and January 2, 2010, respectively. The year ended December 31, 2011, 12.1% tax rate relates to the deferred tax impact on the impairment charge related to our trade names. Deferred tax liabilities related to our trade names are not available to be used to offset deferred tax assets when estimating the valuation allowance. All deferred tax assets created in 2011 were fully reserved with additional valuation allowances. The (0.5%) tax rate for year ended January 1, 2011, results from the difference between the provision recorded as of January 2, 2010 and the actual carry-back filed in 2010. The 37.2% tax rate in 2009 relates primarily to a loss carry-back receivable of approximately $3.7 million related to legislation allowing companies to carry-back 2009 or 2008 losses up to 5 years, as well as an income tax allocation of $1.8 million between current operations and other comprehensive income. Excluding the effects of these items, our 2011, 2010, and 2009 effective tax rates would have been 38.8%, 35.6%, and 34.6% for each year, respectively.
Deferred income taxes reflect the net tax effects of temporary difference between the carrying amount of assets and liabilities for financial reporting purposes and the amounts used for income tax purposes. Significant components of our net deferred tax liability are as follows as of:
| December 31, | January 1, | |||||||
| 2011 | 2011 | |||||||
| (in thousands) | ||||||||
| Deferred tax assets: |
||||||||
| Goodwill |
$ | 8,353 | $ | 10,441 | ||||
| State and federal net operating loss carryforwards |
12,741 | 5,115 | ||||||
| Accrued warranty |
1,635 | 1,600 | ||||||
| Compensation expense |
2,336 | 1,647 | ||||||
| Allowance for doubtful accounts |
308 | 685 | ||||||
| Obsolete inventory |
554 | 747 | ||||||
| AMT tax credits |
287 | 287 | ||||||
| Other accruals |
549 | 1,075 | ||||||
| Derivative financial instruments |
99 | — | ||||||
| Valuation allowance |
(16,289 | ) | (10,968 | ) | ||||
|
|
|
|
|
|||||
| Total deferred tax assets |
$ | 10,573 | $ | 10,629 | ||||
|
|
|
|
|
|||||
| Deferred tax liabilities: |
||||||||
| Other indefinite lived intangible assets |
$ | 14,991 | $ | 17,315 | ||||
| Amortizable intangible assets |
4,008 | 6,466 | ||||||
| Property, plant and equipment |
6,565 | 4,046 | ||||||
| Derivative financial instruments |
— | 117 | ||||||
|
|
|
|
|
|||||
| Total deferred tax liabilities |
$ | 25,564 | $ | 27,944 | ||||
|
|
|
|
|
|||||
52
Table of Contents
The amount of goodwill deductible for tax purposes was $63.8 million at the time of the 2004 acquisition, of which, $21.4 million and $26.8 million was unamortized as of December 31, 2011 and January 1, 2011, respectively.
The following table shows the current and noncurrent deferred tax assets (liabilities), recorded on our consolidated balance sheets:
| December 31, | January 1, | |||||||
| 2011 | 2011 | |||||||
| (in thousands) | ||||||||
| Current deferred tax assets (liabilities), net |
$ | 50 | $ | (185 | ) | |||
| Noncurrent deferred tax liabilities, net |
(15,041 | ) | (17,130 | ) | ||||
|
|
|
|
|
|||||
| Total deferred tax liabilities, net |
$ | (14,991 | ) | $ | (17,315 | ) | ||
|
|
|
|
|
|||||
In 2008, we established a valuation allowance with respect to the net deferred tax assets, excluding the $17.3 million deferred tax liability related to trade names. Driven by the goodwill and other intangible impairment charges, our cumulative losses over the last three fiscal years, in addition to the significant downturn in our primary industry of home construction, led us to conclude that sufficient negative evidence exists that it is deemed more likely than not future taxable income will not be sufficient to realize the related income tax benefits. We also established a valuation allowance for net deferred tax assets created in 2011, 2010, and 2009.
As of December 31, 2011, we recognized a $2.3 million deferred tax benefit from the impairment of our trade name. The remaining deferred tax liability related to trade names is $15.0 million as of December 31, 2011.
We estimate that we have $31.4 million of federal net operating loss carryforwards and $55.2 million of state operating loss carryforwards expiring at various dates through 2031.
We have not recognized any material liability for unrecognized tax benefits however, should we accrue for such liabilities when and if they arise in the future we will recognize interest and penalties associated with uncertain tax positions as part of our income tax provision. The Internal Revenue Service is currently auditing tax years 2005, 2008, and 2009. We expect no material adjustments to come from the audit.
| 13. | Commitments and Contingencies |
We lease production equipment, vehicles, computer equipment, storage units and office equipment under operating leases expiring at various times through 2016. Lease expense was $1.7 million, $2.3 million, and $2.5 million for the years ended December 31, January 1, 2011 and January 2, 2010, respectively. Future minimum lease commitments for non-cancelable operating leases are as follows at December 31, 2011 (in thousands):
| 2012 |
$ | 1,401 | ||
| 2013 |
653 | |||
| 2014 |
295 | |||
| 2015 |
73 | |||
| 2016 |
73 | |||
|
|
|
|||
| Total |
$ | 2,495 | ||
|
|
|
Through the terms of certain of our leases, we have the option to purchase the leased equipment for cash in an amount equal to its then fair market value plus all applicable taxes.
We are obligated to purchase certain raw materials used in the production of our products from certain suppliers pursuant to stocking programs. If these programs were cancelled by us, we would be required to pay $1.1 million for various materials. During the years ended December 31, 2011, January 1, 2011, and January 2, 2010, we made purchases under these programs totaling $62.9 million, $63.0 million, and $55.6 million, respectively.
At December 31, 2011, we had $1.5 million in standby letters of credit related to our worker’s compensation insurance coverage and commitments to purchase equipment of $0.2 million.
53
Table of Contents
We are a party to various legal proceedings in the ordinary course of business. Although the ultimate disposition of those proceedings cannot be predicted with certainty, management believes the outcome of any claim that is pending or threatened, either individually or on a combined basis, will not have a materially adverse effect on our operations, financial position or cash flows.
| 14. | Employee Benefit Plans |
We have a 401(k) plan covering substantially all employees 18 years of age or older who have at least three months of service. Employees may contribute up to 100% of their annual compensation subject to Internal Revenue Code maximum limitations. Through the end of 2007, we agreed to make matching contributions of 100% of the employee’s contribution up to 3% of the employee’s salary. Effective the first day of our 2008 fiscal year, we suspended the matching contributions portion of the 401(k) plan until such time that management of the Company having the authority to do so determined to reinstate some or all of the matching contribution. For the years ended December 31, 2011, January 1, 2011, and January 2, 2010 there was no company matching contribution. Company contributions and earnings thereon vest at the rate of 20% per year of service with us when at least 1,000 hours are worked within the Plan year. We recognized no expense for the years ended December 31, 2011, January 1, 2011, and January 2, 2010.
| 15. | Related Parties |
In the ordinary course of business, we sell windows to Builders FirstSource, Inc., a company controlled by affiliates of JLL Partners, Inc. One of our directors, Floyd F. Sherman, is the president, chief executive officer, and a director of Builders FirstSource, Inc and another, Brett Milgrim, is also a director. In addition, Paul S. Levy who is affiliated with JLL Partners, Inc., and is a director of Builders FirstSource, Inc. Total net sales to Builders FirstSource, Inc. were $3.7 million, $2.8 million and $3.1 million for the years ended December 31, 2011, January 1, 2011 and January 2, 2010, respectively. As of December 31, 2011, and January 1, 2011 there was $0.6 million and $0.3 million due from Builders FirstSource, Inc. included in accounts receivable in the accompanying consolidated balance sheets.
| 16. | Shareholders’ Equity |
2010 Rights Offering
On January 29, 2010, the Company filed Amendment No. 1 to the Registration Statement on Form S-1 filed on December 24, 2009 relating to a previously announced offering of rights to purchase 20,382,326 shares of the Company’s common stock with an aggregate value of approximately $30.6 million. The registration statement relating to the rights offering was declared effective by the United States Securities and Exchange Commission on February 10, 2010, and the Company distributed to each holder of record of the Company’s common stock as of close of business on February 8, 2010, at no charge, one (1) non-transferable subscription right for every one and three-quarters (1.75) shares of common stock held by such holder under the basic subscription privilege. Each whole subscription right entitled its holder to purchase one share of PGT’s common stock at the subscription price of $1.50 per share. The rights offering also contained an over-subscription privilege that permitted all basic subscribers to purchase additional shares of the Company’s common stock up to an amount equal to the amount available to each such holder under the basic subscription privilege. Shares issued to each participant in the over-subscription were determined by calculating each subscriber’s percentage of the total shares over-subscribed, multiplied by the number of shares available in the over-subscription privilege. The rights offering expired on March 12, 2010.
The rights offering was 90.0% subscribed resulting in the Company distributing 18,336,368 shares of its common stock, including 15,210,184 shares under the basic subscription privilege and 3,126,184 under the over-subscription privilege, representing a 74.6% basic subscription participation rate. There were requests for 3,126,184 shares under the over-subscription privilege representing an allocation rate of 100% to each over-subscriber. Of the 18,336,368 shares issued, 13,333,332 shares were issued to JLL Partners Fund IV (“JLL”) the Company’s majority shareholder, including 10,719,389 shares issued under the basic subscription privilege and 2,613,943 shares issued under the over-subscription privilege. Prior to the rights offering, JLL held 18,758,934 shares, or 52.6%, of the Company’s outstanding common stock. With the completion of the rights offering, the Company has 54,005,439 total shares of common stock outstanding of which JLL holds 59.4%.
Net proceeds of $27.5 million from the rights offering were used to repay a portion of the outstanding indebtedness under our amended credit agreement in the amount of $15.0 million, and for general corporate purposes in the amount of $12.5 million.
54
Table of Contents
| 17. | Employee Stock Based Compensation |
Rollover Plan
In conjunction with the acquisition of PGT Holding Company, we rolled over 2.9 million option shares belonging to option holders of the acquired entity. These options have a ten year term and are fully vested, and include exercise prices of either $0.38 or $1.51 per share.
2004 Plan
On January 29, 2004, we adopted the JLL Window Holdings, Inc. 2004 Stock Incentive Plan (the “2004 Plan”), whereby stock-based awards may be granted by the Board of Directors (the Board) to officers, key employees, consultants and advisers of ours.
In conjunction with the 2004 Plan we granted option shares at various times in 2004 and 2005 at an exercise price of $8.64 per share. These options have a ten-year life and fully vest after five years. No options or restricted share awards were granted under the 2004 Plan during 2009, 2010 or 2011. There were 1,064,389, 1,965,888 and 1,965,888 shares available for grant under the 2004 Plan at January 2, 2010, January 1, 2011, and December 31, 2011, respectively.
2006 Plan
On June 5, 2006, we adopted the 2006 Equity Incentive Plan (the “2006 Plan”) whereby equity-based awards may be granted by the Board to eligible non-employee directors, selected officers and other employees, advisors and consultants of ours.
On April 6, 2010, our stockholders approved, among other things, three items approved and recommended by our Board of Directors in March 2010 as follows: the PGT, Inc. Amended and Restated 2006 Equity Incentive Plan (the “Amended and Restated 2006 Equity Incentive Plan”); an Equity Exchange; and a stock option exchange to eligible employees (“Issuer Tender Offer”). The Board of Directors of the Company determined that, as a result of economic conditions which adversely affected the Company and the industry in which it competes, the options held by certain employees had exercise prices that were significantly above the current market price of the Company’s common stock and that the grants of replacement options would help retain and provide additional incentive to certain employees and better align their interests with those of the Company’s stockholders.
Amended and Restated 2006 Equity Incentive Plan
The Amended and Restated 2006 Equity Incentive Plan amends the plan to, among other things:
| • | increase the number of shares of common stock available for grant there under, from 3,000,000 to 7,000,000, |
| • | set forth 1,500,000 as the maximum number of shares that may be made subject to awards in any calendar year to any “covered employee” (within the meaning of Section 162(m) of the Internal Revenue Code), and |
| • | allow the Company to offer to its employees the opportunity to tender certain outstanding equity awards for cancellation in exchange for the issuance of replacement stock options. |
2010 Equity Exchange
The Equity Exchange offered to exchange certain outstanding equity awards granted under our equity plans to eight employees of the Company, including each of our named executive officers (the “designated employees”), for options to be granted under the Amended and Restated Equity Incentive 2006 Plan with a new term, new vesting schedule, and new exercise price. All eight employees accepted this offer.
The equity awards that the designated employees submitted for cancellation in the Equity Exchange included 621,778 options to purchase common stock with exercise prices that ranged from $3.09 to $8.64, and 314,175 shares of unvested restricted stock. As of April 6, 2010, the options subject to the Equity Exchange had an aggregate value of $0.3 million, calculated using the Black-Scholes Method of option pricing. The total amount of new stock options issued on April 6, 2010, under this exchange was 3,692,433. These options vest over five years with one-fifth vesting on each of the anniversary dates beginning April 6, 2011, and have an exercise price of $2.00, based on the NASDAQ market price of the underlying common stock on the close of business on April 5, 2010. Stock compensation expense for these options is being recorded based on the incremental compensation cost as calculated by the excess of the fair value of modified award over the fair value of the cancelled award immediately before the cancellation and reissue.
55
Table of Contents
2010 Issuer Tender Offer
The Issuer Tender Offer provided an opportunity to exchange certain outstanding equity awards granted under our equity plans to seventeen employees of the Company for options to be granted under the Amended and Restated 2006 Plan with a new term, new vesting schedule, and new exercise price. All eligible employees accepted this offer.
The options subject to the Issuer Tender Offer covered an aggregate of 409,143 shares of common stock including shares described in “the Repricing” below, and had an aggregate value of $0.2 million calculated using the Black-Scholes option pricing model. The total amount of new stock options issued on April 6, 2010, pursuant to the Issuer Tender Offer was 409,143. These options vest over five years with one-fifth vesting on each of the anniversary dates beginning April 6, 2011, and have an exercise price of $2.00, based on the NASDAQ market price of the underlying common stock on the close of business on April 5, 2010. Stock compensation expense for these options is being recorded based on the incremental compensation cost as calculated by the excess of the fair value of modified award over the fair value of the cancelled award immediately before the cancellation and reissue.
New Issuances
During 2011, we issued 35,000 options to certain non-executive employees of the Company. These options vest at various time periods through 2016 and have a weighted average exercise price of $2.21 based on the NASDAQ market price of the underlying common stock on the close of business on the day the options were granted.
In April 2010, we issued 1,401,376 options to certain directors and non-executive employees of the Company. These options vest at various time periods through April 2015 and have a weighted average exercise price of $1.99 based on the NASDAQ market price of the underlying common stock on the close of business on the day the options were granted.
2008 Repricing
On March 6, 2008, the Board of Directors of the Company approved, subject to stockholder approval, the cancellation and termination of the option agreements of seven employees of the Company, and the grant of replacement options under our 2006 Equity Incentive Plan.
The Board of Directors of the Company determined that, as a result of economic conditions which adversely affected the Company and the industry in which it competes, the options held by certain employees had exercise prices that were significantly above the current market price of the Company’s common stock and that the grants of replacement options would help retain and provide additional incentive to certain employees and align their interests with those of the Company’s stockholders.
Stock options originally granted to purchase 317,374 shares of our common stock, with an exercise price that ranged from $10.15 to $14.00 per share, were cancelled and replaced with options to purchase an equal number of shares, at an exercise price of $3.09 per share, which was the closing price on the NASDAQ Global Market of the Company’s common stock on March 5, 2008, the day before the date on which the Board of Directors of the Company granted the replacement options and the designated employees executed the replacement option agreements. The replacement options were exercisable with respect to one third of the shares (rounded to the nearest whole share) on each of the first, second, and third anniversaries of March 6, 2008. Stock compensation expense for these options is being recorded based on the incremental compensation cost as calculated by the excess of the fair value of modified award over the fair value of the cancelled award immediately before the cancellation and reissue.
In conjunction with the 2006 Plan we issued option shares at various exercise prices per share ranging from $0.92 to $4.00, as well as restricted stock awards. There were 1,092,310, 1,127,310, and 1,989,774 shares available for grant under the 2006 Plan at December 31, 2011, January 1, 2011, and January 2, 2010, respectively.
The compensation cost that was charged against income for stock compensation plans was $1.8 million, $2.3 million, and $0.5 million, respectively, for the years ended December 31, 2011, January 1, 2011, and January 2, 2010 and is included in selling, general and administrative expenses in the accompanying consolidated statements of operations. There was no income tax benefit recognized for share-based compensation for the years ended January 2, 2010, January 1, 2011 and December 31, 2011 as a result of the valuation allowance on deferred taxes. We currently expect to satisfy share-based awards with registered shares available to be issued.
56
Table of Contents
The fair value of each stock option grant was estimated on the date of grant using a Black-Scholes option-pricing model with the following weighted-average assumptions used for grants under the 2006 Plan in the following years:
2011: dividend yield of 0%, expected volatility of 70.74%, risk-free interest rate of 2.2%, and expected life of 5 years.
2010: dividend yield of 0%, expected volatility of 75.0%, risk-free interest rate of 2.7%, and expected life of 5 years.
2009: dividend yield of 0%, expected volatility of 73.2%, risk-free interest rate of 1.7%, and expected life of 5 years.
The expected life of options granted represents the period of time that options granted are expected to be outstanding and was determined based on historical experience. The expected volatility is based on the Company’s common stock. The risk-free rate for periods within the contractual term of the options is based on U.S. Treasury yield for instruments with a maturity equal to the life of the option in effect at the time of grant.
Stock Options
A summary of the status of our stock options as of December 31, 2011 is presented below:
| Number of | Weighted Average | Weighted Average | ||||||||||
| Shares | Exercise Price | Remaining Life | ||||||||||
| Outstanding at January 1, 2011 |
6,630,708 | $ | 1.90 | |||||||||
| Granted |
35,000 | $ | 2.21 | |||||||||
| Exercised |
— | $ | — | |||||||||
| Forfeited/Expired |
— | $ | — | |||||||||
|
|
|
|||||||||||
| Outstanding at December 31, 2011 |
6,665,708 | $ | 1.90 | 7.2 Years | ||||||||
|
|
|
|||||||||||
| Exercisable at December 31, 2011 |
2,496,228 | $ | 1.77 | 5.7 Years | ||||||||
Options granted in 2011 have a 10-year contractual life and vest on a straight-line basis over a weighted average of 5.0 years.
The following table summarizes information about employee stock options outstanding at December 31, 2011 (dollars in thousands, except per share amounts):
| Exercise |
Remaining Contractual Life |
Outstanding | Outstanding Intrinsic Value |
Exercisable | Exercisable Intrinsic Value |
|||||||||||||
| $0.38 | 2.1 Years | 75,596 | $ | 49 | 75,596 | $ | 49 | |||||||||||
| $1.51 | 2.1 Years | 790,742 | — | 790,742 | — | |||||||||||||
| $8.64 | 2.4 Years | 22,510 | — | 22,510 | — | |||||||||||||
| $0.92 | 4.1 Years | 284,711 | 31 | 189,808 | 21 | |||||||||||||
| $1.60-$2.31 | 8.2 Years | 5,492,149 | — | 1,417,572 | — | |||||||||||||
|
|
|
|
|
|
|
|
|
|||||||||||
| 6,665,708 | $ | 80 | 2,496,228 | $ | 70 | |||||||||||||
|
|
|
|
|
|
|
|
|
|||||||||||
57
Table of Contents
The weighted-average fair value of options granted during the fiscal years ended December 31, 2011, January 1, 2011, and January 2, 2010, was $2.21, $1.25, and $0.56, respectively. The aggregate intrinsic value of options outstanding and of options exercisable as of December 31, 2011 was $0.1 million and $0.1 million, respectively. The aggregate intrinsic value of options outstanding and of options exercisable as of January 1, 2011 was $3.8 million and $1.2 million, respectively. The aggregate intrinsic value of options outstanding and of options exercisable as of January 2, 2010 was $0.9 million and $0.6 million, respectively. The total fair value of options vested during the fiscal years ended December 31, 2011, January 1, 2011, and January 2, 2010, was less than $0.1 million, $0.4 million and $0.5 million, respectively.
For the fiscal years ended December 31, 2011, January 1, 2011, and January 2, 2010, there were no exercises of stock options and therefore no proceeds received or tax benefits recognized.
As of December 31, 2011, there was $1.7 million of total unrecognized compensation cost related to non-vested stock option compensation arrangements granted which is expected to be recognized in earnings straight-line over a weighted-average period of 2.2 years.
Non-Vested (Restricted) Share Awards
During the years ended December 31, 2011 and January 1, 2011 no non-vested share awards were granted.
A summary of the status of non-vested share awards as of December 31, 2011 and changes during the year then ended are presented below:
| Number of Shares |
Weighted Average Fair Value |
|||||||
| Outstanding at January 1, 2011 |
15,639 | $ | 1.85 | |||||
| Granted |
— | $ | — | |||||
| Vested |
(5,000 | ) | $ | 3.83 | ||||
| Forfeited/Expired |
— | $ | — | |||||
|
|
|
|||||||
| Outstanding at December 31, 2011 |
10,639 | $ | 0.92 | |||||
|
|
|
|||||||
All of the remaining non-vested share awards granted in 2009 vest at the end of three years. As of December 31, 2011, there was less than $5 thousand of total unrecognized compensation cost related to non-vested share awards. That cost is expected to be recognized in earnings in the first quarter of 2012.
58
Table of Contents
| 18. | Accumulated Other Comprehensive Loss |
The following table shows the components of accumulated other comprehensive loss for fiscal 2011, 2010 and 2009:
| Aluminum | ||||||||||||
| Forward | Valuation | |||||||||||
| (in thousands) | Contracts | Allowance | Total | |||||||||
| Balance at January 3, 2009 |
$ | (2,584 | ) | $ | (1,382 | ) | $ | (3,966 | ) | |||
| Changes in fair value |
1,373 | — | 1,373 | |||||||||
| Reclassification to earnings |
3,375 | — | 3,375 | |||||||||
| Tax effect |
(1,852 | ) | 1,852 | — | ||||||||
| Income tax allocation |
(1,813 | ) | — | (1,813 | ) | |||||||
|
|
|
|
|
|
|
|||||||
| Balance at January 2, 2010 |
(1,501 | ) | 470 | (1,031 | ) | |||||||
| Changes in fair value |
38 | — | 38 | |||||||||
| Reclassification to earnings |
(250 | ) | — | (250 | ) | |||||||
| Tax effect |
82 | (82 | ) | — | ||||||||
|
|
|
|
|
|
|
|||||||
| Balance at January 1, 2011 |
(1,631 | ) | 388 | (1,243 | ) | |||||||
| Changes in fair value |
(220 | ) | — | (220 | ) | |||||||
| Reclassification to earnings |
(335 | ) | — | (335 | ) | |||||||
| Tax effect |
216 | (216 | ) | — | ||||||||
|
|
|
|
|
|
|
|||||||
| Balance at December 31, 2011 |
$ | (1,970 | ) | $ | 172 | $ | (1,798 | ) | ||||
|
|
|
|
|
|
|
|||||||
| 19. | Sales by Product Group |
The FASB has issued guidance under the Segment Reporting topic of the Codification which requires us to disclose certain information about our operating segments. Operating segments are defined as components of an enterprise with separate financial information which are evaluated regularly by the chief operating decision maker and are used in resource allocation and performance assessments.
We operate as a single business that manufactures windows and doors. Our chief operating decision maker evaluates performance by reviewing a few major categories of product sales and then considering costs on a total company basis.
Sales by product group are as follows:
| Years Ended | ||||||||||||
| December 31, | January 1, | January 2, | ||||||||||
| (in millions) | 2011 | 2011 | 2010 | |||||||||
| Product category: |
||||||||||||
| Impact Window and Door Products |
$ | 120.9 | $ | 122.5 | $ | 120.3 | ||||||
| Other Window and Door Products |
46.4 | 53.2 | 45.7 | |||||||||
|
|
|
|
|
|
|
|||||||
| Total net sales |
$ | 167.3 | $ | 175.7 | $ | 166.0 | ||||||
|
|
|
|
|
|
|
|||||||
59
Table of Contents
| 20. | Unaudited Quarterly Financial Data |
The following tables summarize the consolidated quarterly results of operations for 2011 and 2010 (in thousands, except per share amounts):
| 2011 | ||||||||||||||||
| First Quarter |
Second Quarter |
Third Quarter |
Fourth Quarter |
|||||||||||||
| Net sales |
$ | 40,644 | $ | 45,171 | $ | 45,751 | $ | 35,709 | ||||||||
| Gross profit |
8,257 | 8,977 | 12,915 | 8,956 | ||||||||||||
| Net (loss) income |
(5,789 | ) | (5,037 | ) | 241 | (6,313 | ) | |||||||||
| Net (loss) income per share – basic |
$ | (0.11 | ) | $ | (0.09 | ) | $ | 0.00 | $ | (0.12 | ) | |||||
| Net (loss) income per share – diluted |
$ | (0.11 | ) | $ | (0.09 | ) | $ | 0.00 | $ | (0.12 | ) | |||||
| Items included in the determination of net (loss) income that may affect comparability, before tax effect: |
||||||||||||||||
| Consolidation/restructuring charges |
$ | (2,632 | ) | $ | (1,367 | ) | $ | (107 | ) | $ | — | |||||
| Impairment charges |
— | — | — | (5,959 | ) | |||||||||||
| Gain on equipment sales |
— | — | — | 875 | ||||||||||||
| Manufacturing inefficienies |
— | (3,371 | ) | (634 | ) | — | ||||||||||
| Write-off deferred financing costs |
— | (420 | ) | — | — | |||||||||||
| 2010 | ||||||||||||||||
| First Quarter |
Second Quarter |
Third Quarter |
Fourth Quarter |
|||||||||||||
| Net sales |
$ | 40,515 | $ | 49,006 | $ | 47,179 | $ | 39,041 | ||||||||
| Gross profit |
11,257 | 15,182 | 14,539 | 9,148 | ||||||||||||
| Net (loss) income |
(2,060 | ) | 1 | (207 | ) | (12,229 | ) | |||||||||
| Net (loss) income per share – basic |
$ | (0.05 | ) | $ | 0.00 | $ | (0.00 | ) | $ | (0.23 | ) | |||||
| Net (loss) income per share – diluted |
$ | (0.05 | ) | $ | 0.00 | $ | (0.00 | ) | $ | (0.23 | ) | |||||
| Items included in the determination of net (loss) income that may affect comparability, before tax effect: |
||||||||||||||||
| Impairment charge |
$ | — | $ | — | $ | — | $ | (5,561 | ) | |||||||
| Consolidation charge |
— | — | — | (2,053 | ) | |||||||||||
Earnings per share is computed independently for each of the quarters presented; therefore, the sum of the quarterly earnings per share may not equal the annual earnings per share. Each of our fiscal quarters above consists of 13 weeks and ended on the last Saturday of the period.
During the fourth quarter of 2011, we increased net sales by $0.3 million for an immaterial error affecting certain prior periods. In addition, in the third quarter of 2011, we increased selling, general and administrative expenses by $0.3 million for an immaterial error affecting certain prior periods. These errors do not have material impact on the unaudited quarterly financial data. Gross profit amounts above reflect the reclassification described in Note 2.
| 21. | Collaborative Arrangement |
In view of the risks and costs associated with developing new products and our desire to expand our markets by providing quality unitized curtain wall solutions to the commercial building industry, we entered into a collaborative arrangement with another company with extensive experience in sales, marketing, engineering and project management of unitized curtain wall solutions and in which costs, revenues and risks are shared. During the third quarter of 2009, this arrangement was terminated. We were not the principal participant in this arrangement. Our obligation under this arrangement was to provide manufacturing expertise, including providing the operating entity with labor for assembly and fabrication of the unitized curtain wall units. We earned revenues and incurred costs of sales and expenses from this activity based on the number of hours of labor provided in the production of materials used in the arrangement. We also recorded a percentage of the joint operating activity’s profit or loss into revenue based on our percentage interest in the arrangement, which was insignificant in 2009. Each collaborator’s interest was 50 percent.
60
Table of Contents
The following table illustrates the income statement classification and amounts attributable to transactions arising from the collaborative arrangements between participants for each period presented (in thousands):
| Twelve Months Ended | ||||||||||||
| December 31, | January 1, | January 2, | ||||||||||
| 2011 | 2011 | 2010 | ||||||||||
| Net sales |
$ | — | $ | — | $ | 1,449 | ||||||
| Cost of sales |
— | — | (1,093 | ) | ||||||||
| Selling, general and administrative |
— | — | (215 | ) | ||||||||
In November 2007, the EITF issued guidance under the Broad Transactions – Collaborative Arrangements topic of the Codification. This guidance is effective for financial statements issued for fiscal years beginning after December 15, 2008, and interim periods within those fiscal years, and must be applied retrospectively to all prior periods presented for all collaborative arrangements existing as of the effective date. This Issue requires that participants in a collaborative arrangement report costs incurred and revenues generated on a gross or net basis and in the appropriate line items in each company’s financial statements. This guidance also requires disclosure of the nature and purpose of the participant’s collaborative arrangements, the participant’s rights and obligations under these arrangements, the accounting policy for collaborative arrangements, the income statement classification and amounts attributable to transactions arising from collaboration arrangements between participants, and the disclosure related to individually significant collaborative arrangements. We adopted the guidance in the first quarter of 2009.
61
Table of Contents
| Item 9. | CHANGES IN AND DISAGREEMENTS WITH ACCOUNTANTS ON ACCOUNTING AND FINANCIAL DISCLOSURE |
None.
| Item 9A. | CONTROLS AND PROCEDURES |
Disclosure Controls and Procedures
Our management, under the supervision and with the participation of our principal executive officer and principal financial officer, evaluated the effectiveness of our disclosure controls and procedures pursuant to Rule 13a-15 promulgated under the Exchange Act as of December 31, 2011. Our disclosure controls and procedures are designed to ensure that information required to be disclosed by us in the reports that we file or submit under the Exchange Act is recorded, processed, summarized, and reported, within the time periods specified in the rules and forms of the SEC. These disclosure controls and procedures include, among other things, controls and procedures designed to ensure that information required to be disclosed by us in the reports that we file under the Exchange Act is accumulated and communicated to our management, including our principal executive officer and principal financial officer, as appropriate to allow timely decisions regarding required disclosure. In designing and evaluating the disclosure controls and procedures, our management recognizes that any controls and procedures, no matter how well designed and operated, can provide only reasonable assurance of achieving the desired control objectives. In addition, management is required to apply its judgment in evaluating the benefits of possible disclosure controls and procedures relative to their costs to implement and maintain.
Based on management’s evaluation, our principal executive officer and principal financial officer concluded that, as of December 31, 2011, our disclosure controls and procedures are effective to ensure that information required to be disclosed by us in reports that we file or submit under the Exchange Act is recorded, processed, summarized, and reported within the time periods specified in SEC rules and forms and that such information is accumulated and communicated to our management, including our principal executive officer and principal financial officer, as appropriate, to allow timely decisions regarding required disclosure.
Internal Control over Financial Reporting
a. Management’s annual report on internal control over financial reporting.
Internal control over financial reporting (as defined in Rules 13a-15(f) and 15d-15(f) under the Exchange Act) refers to the process designed by, or under the supervision of, our Chief Executive Officer and Chief Financial Officer, and effected by our board of directors, management and other personnel, to provide reasonable assurance regarding the reliability of financial reporting and the preparation of financial statements for external purposes in accordance with generally accepted accounting principles. Management is responsible for establishing and maintaining adequate internal control over our financial reporting.
We have evaluated the effectiveness of our internal control over financial reporting as of December 31, 2011. The evaluation was performed using the internal control evaluation framework developed by the Committee of Sponsoring Organizations of the Treadway Commission. Based on such evaluation, management concluded that, as of such date, our internal control over financial reporting was effective.
b. Attestation report of the registered public accounting firm.
This annual report does not include an attestation report of the Company’s independent registered public accounting firm regarding internal control over financial reporting. Management’s report was not subject to attestation by our independent registered public accounting firm pursuant to the rules of the Securities and Exchange Commission that permit the Company, as a non-accelerated filer, to provide only management’s report in this annual report.
c. Changes in internal control over financial reporting
There has been no change in our internal control over financial reporting during our most recent fiscal quarter that has materially affected, or is reasonably likely to materially affect, our internal control over financial reporting.
62
Table of Contents
None.
Item 10. DIRECTORS, EXECUTIVE OFFICERS AND CORPORATE GOVERNANCE
Executive Officers and Significant Employees of the Registrant
| Name |
Age | Position | ||
| Rodney Hershberger | 55 | President, Chief Executive Officer, and Director | ||
| Jeffrey T. Jackson | 46 | Executive Vice President and Chief Financial Officer | ||
| Mario Ferrucci III | 48 | Vice President and General Counsel | ||
| David McCutcheon | 46 | Vice President - Logistics | ||
| Deborah L. LaPinska | 50 | Vice President - Customer Relations | ||
| Monte Burns | 52 | Vice President - Glass Operations |
Rodney Hershberger, President, Chief Executive Officer, and Director. Mr. Hershberger, a co-founder of PGT Industries, Inc., has served our Company for over 30 years. Mr. Hershberger was named President and Director in 2004 and became our Chief Executive Officer in March 2005. In 2003, Mr. Hershberger became executive vice president and chief operating officer and oversaw our Company’s Florida and North Carolina operations, sales, marketing, and engineering groups. Previously, Mr. Hershberger led the manufacturing, transportation, and logistics operations in Florida and served as vice president of customer service.
Jeffrey T. Jackson, Executive Vice President and Chief Financial Officer. Mr. Jackson joined our Company as Chief Financial Officer and Treasurer in November 2005, and his current responsibilities include all aspects of financial reporting, accounting and internal controls, cash management, human resources, operations, and the business planning process. Before joining our Company, Mr. Jackson spent two years as Vice President, Corporate Controller for The Hershey Company. From 1999 to 2004, Mr. Jackson was Senior Vice President, Chief Financial Officer for Mrs. Smith’s Bakeries, LLC, a division of Flowers Foods, Inc. Mr. Jackson has over eighteen years of increasing responsibility in various executive management roles with various companies, including Division Chief Financial Officer, Vice President Corporate Controller, and Senior Vice President of Operations. Mr. Jackson holds a B.B.A. from the University of West Georgia and is a Certified Public Accountant in the State of Georgia and the State of California.
Mario Ferrucci III, Vice President – General Counsel. Mr. Ferrucci joined our Company in April 2006 as Vice President and Corporate Counsel, and his current responsibilities include all aspects of the Company’s legal and compliance affairs, information systems, manufacturing quality, engineering, and the strategic planning process. From 2001 to 2006, Mr. Ferrucci practiced law with the law firm of Skadden, Arps, Slate, Meagher & Flom LLP. Mr. Ferrucci holds a B.A. from Colby College, an M.A.A.B.T. from the University of Connecticut and a J.D. from Widener School of Law.
David McCutcheon, Vice President — Glass Operations. Mr. McCutcheon joined our Company in 1997 and was appointed Vice President in 2001. His current responsibilities include all aspects of our warehouse, logistics and transportation operations. Previously, Mr. McCutcheon worked for ten years for General Motors in management positions in manufacturing operations and manufacturing engineering. Mr. McCutcheon holds a B.S.E.E. from Purdue University and an M.B.A. from The Ohio State University.
Deborah L. LaPinska, Vice President —Customer Relations. Ms. LaPinska joined our Company in 1991and was appointed Vice President in 2003. To ensure Customer Intimacy remains a core competency and competitive differentiator of PGT, Ms. LaPinska is directly responsible for managing consistent and meaningful relationships with PGT’s customers. Previously, she served as Vice President – Sales and Marketing. Ms. LaPinska holds a B.A. in business management from Eckerd College.
Monte Burns, Vice President – Glass Operations. Mr. Burns joined our Company in August 1981 and was appointed Vice President in 2009. His current responsibilities include all aspects of our glass operations. Previously, Mr. Burns was responsible for all aspects of the Company’s North Carolina Operations.
63
Table of Contents
Additional information required by this item appears in our definitive proxy statement for our annual meeting of stockholders under the captions “Proposal 1 — Election of Directors,” “Information Regarding the Board and its Committees,” “Corporate Governance — Director Nomination Process,” “Corporate Governance — Code of Business Conduct and Ethics,” “Section 16(a) Beneficial Ownership Reporting Compliance,” and “Executive Officers of the Registrant,” which information is incorporated herein by reference to Item 10 of this Annual Report on Form 10-K.
Code of Business Conduct and Ethics
PGT, Inc. and its subsidiary endeavor to do business according to the highest ethical and legal standards, complying with both the letter and spirit of the law. Our board of directors has approved a Code of Business Conduct and Ethics that applies to our directors, officers (including our principal executive officer, principal financial officer and controller) and employees. Our Code of Business Conduct and Ethics is administered by a Compliance Committee made up of representatives from our legal, human resources and accounting departments.
Our employees are encouraged to report any suspected violations of laws, regulations and the Code of Business Conduct and Ethics, and all unethical business practices. We provide continuously monitored hotlines for anonymous reporting by employees.
Our board of directors has also approved a Supplemental Code of Ethics for the chief executive officer, president, and senior financial officers of PGT, Inc., which is administered by our general counsel.
Both of these policies can be found on the governance section of our corporate website at: http://pgtinc.com.
Stockholders may request a free copy of these policies by contacting the Corporate Secretary, PGT, Inc., 1070 Technology Drive, North Venice, Florida, 34275, United States of America.
In addition, within five business days of:
| • | Any amendment to a provision of our Code of Business Conduct and Ethics or our Supplemental Code of Ethics that applies to our chief executive officer, our chief financial officer; or |
| • | The grant of any waiver, including an implicit waiver, from a provision of one of these policies to one of these officers that relates to one or more of the items set forth in Item 406(b) of Regulation S-K. |
We will provide information regarding any such amendment or waiver (including the nature of any waiver, the name of the person to whom the waiver was granted and the date of the waiver) on our Web site at the Internet address above, and such information will be available on our Web site for at least a 12-month period. In addition, we will disclose any amendments and waivers to our Code of Business Conduct and Ethics or our Supplemental Code of Ethics as required by the listing standards of the NASDAQ Global Market.
64
Table of Contents
| Item 11. | EXECUTIVE COMPENSATION |
The information required by this item appears in our definitive proxy statement for our annual meeting of stockholders under the captions “Executive Compensation,” “Employment Agreements”, and “Change in Control Agreements,” “Information Regarding the Board and its Committees — Information on the Compensation of Directors,” “Compensation Committee Report,” and “Compensation Committee Interlocks and Insider Participation,” which information is incorporated herein by reference.
| Item 12. | SECURITY OWNERSHIP OF CERTAIN BENEFICIAL OWNERS AND MANAGEMENT AND RELATED STOCKHOLDER MATTERS |
The information required by this item appears in our definitive proxy statement for our annual meeting of stockholders under the caption “Security Ownership of Certain Beneficial Owners and Management” and “Equity Compensation Plan Information,” which information is incorporated herein by reference.
| Item 13. | CERTAIN RELATIONSHIPS AND RELATED TRANSACTIONS, AND DIRECTOR INDEPENDENCE |
The information required by this item appears in our definitive proxy statement for our annual meeting of stockholders under the caption “Certain Relationships and Related Transactions,” which information is incorporated herein by reference.
| Item 14. | PRINCIPAL ACCOUNTANT FEES AND SERVICES |
The information required by this item appears in our definitive proxy statement for our annual meeting of stockholders under the caption “Audit Committee Report — Fees Paid to the Principal Accountant,” which information is incorporated herein by reference.
| Item 15. | EXHIBITS, FINANCIAL STATEMENT SCHEDULES |
(a) (1) See the index to consolidated financial statements and schedule provided in Item 8 for a list of the financial statements filed as part of this report.
(2) Financial statement schedules are omitted because they are either not applicable or not material.
(3) The following documents are filed, furnished or incorporated by reference as exhibits to this report as required by Item 601 of Regulation S-K.
65
Table of Contents
| Exhibit Number |
Description | |
|
|
| |
| 3.1 | Amended and Restated Certificate of Incorporation of PGT, Inc. (incorporated herein by reference to Exhibit 3.1 to the Company’s Annual Report on Form 10-K filed with the Securities and Exchange Commission on March 18, 2010, Registration No. 000-52059) | |
| 3.2 | Amended and Restated By-Laws of PGT, Inc. (incorporated herein by reference to Exhibit 3.2 to the Company’s Annual Report on Form 10-K filed with the Securities and Exchange Commission on March 18, 2010, Registration No. 000-52059) | |
| 4.1 | Form of Specimen Certificate (incorporated herein by reference to Exhibit 4.1 to Amendment No. 2 to the Registration Statement of the Company on Form S-1, filed with the Securities and Exchange Commission on May 26, 2006, Registration No. 333-132365) | |
| 4.2 | Amended and Restated Security Holders’ Agreement, by and among PGT, Inc., JLL Partners Fund IV, L.P., and the stockholders named therein, dated as of June 27, 2006 (incorporated herein by reference to Exhibit 4.2 to the Company’s Quarterly Report on Form 10-Q, filed with the Securities and Exchange Commission on August 11, 2006, Registration No. 000-52059) | |
| 4.3 | PGT Savings Plan (incorporated herein by reference to Exhibit 4.5 to the Company’s Form S-8 Registration Statement, filed with the Securities and Exchange Commission on October 15, 2007, Registration No. 000-52059) | |
| 10.1 | Credit Agreement between PGT, Inc., PGT Industries, Inc., General Electric Capital Corporation, as administrative agent, collateral agent, swing line lender, L/C issuer and lender, GE Capital Markets, Inc. and SunTrust Robinson Humphrey, Inc. as joint lead arrangers and bookrunners, and SunTrust Bank, as syndication agent, L/C issuer, and lender, and the other lender named therein, dated as of June 23, 2011 (incorporated herein by reference to Exhibit 10.1 to Current Report on Form 8-K dated June 23, 2011 filed with the Securities and Exchange Commission on June 23, 2011, Registration No. 000-52059. | |
| 10.2 | Supply Agreement, executed on February 13, 2012, by and between PPG Industries, Inc. and PGT Industries, Inc. (incorporated herein by reference to Exhibit 10.1 to Current Report on Form 8-K dated February 13, 2012, filed with the Securities and Exchange Commission on February 17, 2012, Registration No. 000-52059). | |
| 10.3 | Sales Contract, executed on December 1, 2011, by and between E. I. du Pont de Nemours and Company, through its Packaging and Industrial Polymers business, and PGT Industries, Inc. (incorporated herein by reference to Exhibit 10.1 to Current Report on Form 8-K dated December 1, 2011, filed with the Securities and Exchange Commission on December 6, 2011, Registration No. 000-52059). | |
| 10.5 | PGT, Inc. 2004 Stock Incentive Plan, as amended (incorporated herein by reference to Exhibit 10.5 to Amendment No. 1 to the Registration Statement of the Company on Form S-1, filed with the Securities and Exchange Commission on April 21, 2006, Registration No. 333-132365) | |
| 10.6 | Form of PGT, Inc. 2004 Stock Incentive Plan Stock Option Agreement (incorporated herein by reference to Exhibit 10.6 to Amendment No. 1 to the Registration Statement of the Company on Form S-1, filed with the Securities and Exchange Commission on April 21, 2006, Registration No. 333-132365) | |
| 10.7 | PGT, Inc. Amended and Restated 2006 Equity Incentive Plan (incorporated herein by reference to Exhibit 10.7 to the Company’s Annual Report on Form 10-K filed with the Securities and Exchange Commission on March 18, 2010, Registration No. 000-52059) | |
| 10.8 | Form of PGT, Inc. 2006 Equity Incentive Plan Non-qualified Stock Option Agreement (incorporated herein by reference to Exhibit 10.8 to Amendment No. 3 to the Registration Statement of the Company on Form S-1, filed with the Securities and Exchange Commission on June 8, 2006, Registration No. 333-132365) | |
| 10.9 | Form of Employment Agreement, dated February 20, 2009, between PGT Industries, Inc. and, individually, Rodney Hershberger, Jeffery T. Jackson, Mario Ferrucci III, Deborah L. LaPinska, Monte Burns, and David B. McCutcheon (incorporated herein by reference to Exhibit 10.1 to Current Report on Form 8-K dated February 20, 2009, filed with the Securities and Exchange Commission on February 26, 2009, Registration No. 000-52059) | |
66
Table of Contents
| 10.10 | Form of Director Indemnification Agreement (incorporated herein by reference to Exhibit 10.17 to Amendment No. 3 to the Registration Statement of the Company on Form S-1, filed with the Securities and Exchange Commission on June 8, 2006, Registration No. 333-132365) | |
| 10.11 | Form of PGT, Inc. Rollover Stock Option Agreement (incorporated herein by reference to Exhibit 10.18 to Amendment No. 1 to the Registration Statement of the Company on Form S-1, filed with the Securities and Exchange Commission on April 21, 2006, Registration No. 333-132365) | |
| 10.12 | Market Alliance Agreement between PGT Industries, Inc. and E.I. du Pont de Nemours and Company, dated February 27, 2009, with portions omitted pursuant to a request for confidential treatment (incorporated herein by reference to Exhibit 10.1 to Current Report on Form 8-K dated February 27, 2009, filed with the Securities and Exchange Commission on March 5, 2009, Registration No. 000-52059) | |
| 10.13 | Form of PGT, Inc. 2006 Management Incentive Plan (incorporated herein by reference to Exhibit 10.23 to Amendment No. 3 to the Registration Statement of the Company on Form S-1, filed with the Securities and Exchange Commission on June 8, 2006, Registration No. 333-132365) | |
| 10.14 | Form of PGT, Inc. 2006 Equity Incentive Plan Restricted Stock Award Agreement (incorporated herein by reference to Exhibit 10.24 to Amendment No. 3 to the Registration Statement of the Company on Form S-1, filed with the Securities and Exchange Commission on June 8, 2006, Registration No. 333-132365) | |
| 10.15 | Form of PGT, Inc. 2006 Equity Incentive Plan Restricted Stock Unit Award Agreement (incorporated herein by reference to Exhibit 10.25 to Amendment No. 3 to the Registration Statement of the Company on Form S-1, filed with the Securities and Exchange Commission on June 8, 2006, Registration No. 333-132365) | |
| 10.16 | Form of PGT, Inc. 2006 Equity Incentive Plan Incentive Stock Option Agreement (incorporated herein by reference to Exhibit 10.26 to Amendment No. 3 to the Registration Statement of the Company on Form S-1, filed with the Securities and Exchange Commission on June 8, 2006, Registration No. 333-132365 | |
| 10.17 | Form of PGT, Inc. 2006 Equity Incentive Plan Replacement Non-Qualified Stock Option Agreement (incorporated herein by reference to Exhibit 10.17 to the Company’s Annual Report on Form 10-K filed with the Securities and Exchange Commission on March 18, 2010, Registration No. 000-52059) | |
| 21.1* | List of Subsidiaries | |
| 23.1* | Consent of Ernst & Young LLP, Independent Registered Public Accounting Firm | |
| 24.1* | Power of Attorney (included on the signature page of this Annual Report on Form 10-K) | |
| 31.1* | Certification of chief executive officer pursuant to Section 302 of the Sarbanes-Oxley Act of 2002 | |
| 31.2* | Certification of chief financial officer pursuant to Section 302 of the Sarbanes-Oxley Act of 2002 | |
| 32.1** | Certification of chief executive officer and chief financial officer pursuant to 18 U.S.C. Section 1350, as adopted pursuant to Section 906 of the Sarbanes-Oxley Act of 2002 | |
| 101.INS | XBRL Instance Document** | |
| 101.SCH | XBRL Taxonomy Extension Schema** | |
| 101.CAL | XBRL Taxonomy Extension Calculation Linkbase** | |
| 101.DEF | XBRL Taxonomy Extension Definition Linkbase** | |
| 101.LAB | XBRL Taxonomy Extension Label Linkbase** | |
| 101.PRE | XBRL Taxonomy Extension Presentation Linkbase** | |
| * | Filed herewith. |
| ** | Furnished herewith. |
67
Table of Contents
SIGNATURES
Pursuant to the requirements of Section 13 or 15(d) of the Exchange Act, the registrant has duly caused this report to be signed on its behalf by the undersigned thereunto duly authorized.
| PGT, INC. (Registrant) | ||||||
| Date: March 15, 2012 | /s/ RODNEY HERSHBERGER | |||||
| Rodney Hershberger | ||||||
| President and Chief Executive Officer | ||||||
| Date: March 15, 2012 | /s/ JEFFREY T. JACKSON | |||||
| Jeffrey T. Jackson | ||||||
| Executive Vice President and Chief Financial Officer | ||||||
The undersigned hereby constitute and appoint Mario Ferrucci, III and his substitutes our true and lawful attorneys-in-fact with full power to execute in our name and behalf in the capacities indicated below any and all amendments to this report and to file the same, with all exhibits thereto and other documents in connection therewith, with the Securities and Exchange Commission, and hereby ratify and confirm all that such attorney-in-fact or his substitutes shall lawfully do or cause to be done by virtue thereof. Pursuant to the requirements of the Exchange Act, this report has been signed below by the following persons on behalf of the registrant and in the capacities and on the dates indicated.
| Signature |
Title |
Date | ||
| /s/ RODNEY HERSHBERGER | President and Chief Executive Officer | March 15, 2012 | ||
| Rodney Hershberger | (Principal Executive Officer and Director) | |||
| /s/ JEFFREY T. JACKSON | Executive Vice President and Chief Financial Officer | March 15, 2012 | ||
| Jeffrey T. Jackson | (Principal Financial and Accounting Officer) | |||
| /s/ PAUL S. LEVY | Chairman and Director | March 15, 2012 | ||
| Paul S. Levy | ||||
| /s/ ALEXANDER R. CASTALDI | Director | March 15, 2012 | ||
| Alexander R. Castaldi | ||||
| /s/ RICHARD D. FEINTUCH | Director | March 15, 2012 | ||
| Richard D. Feintuch | ||||
| /s/ M. JOSEPH MCHUGH | Director | March 15, 2012 | ||
| M. Joseph McHugh | ||||
| /s/ FLOYD F. SHERMAN | Director | March 15, 2012 | ||
| Floyd F. Sherman | ||||
| /s/ RANDY L. WHITE | Director | March 15, 2012 | ||
| Randy L. White | ||||
| /s/ BRETT N. MILGRIM | Director | March 15, 2012 | ||
| Brett N. Milgrim | ||||
| /s/ WILLIAM J. MORGAN | Director | March 15, 2012 | ||
| William J. Morgan | ||||
| /s/ DANIEL AGROSKIN | Director | March 15, 2012 | ||
| Daniel Agroskin | ||||
68
Table of Contents
| APPENDIX
RECONCILIATION OF NON-GAAP FINANCIAL MEASURES TO THEIR GAAP EQUIVALENTS (unaudited - in thousands, except per share amounts) |
||||||||||||
| Year Ended | ||||||||||||
| Decenber 31, | January 1, | January 2, | ||||||||||
| 2011 | 2011 | 2010 | ||||||||||
| Reconciliation to EBITDA and Adjusted EBITDA: (1) |
||||||||||||
| Net (loss) |
$ | (16,898 | ) | $ | (14,495 | ) | $ | (9,417 | ) | |||
| Reconciling items: |
||||||||||||
| Depreciation and amortization expense |
14,092 | 15,208 | 16,166 | |||||||||
| Interest expense |
4,168 | 5,123 | 6,698 | |||||||||
| Income tax (benefit) expense |
(2,324 | ) | 77 | (5,584 | ) | |||||||
|
|
|
|
|
|
|
|||||||
| EBITDA |
(962 | ) | 5,913 | 7,863 | ||||||||
| Intangible impairment charges (2) |
5,959 | — | — | |||||||||
| Asset impairment charges (3) |
— | 5,561 | 742 | |||||||||
| Consolidation charge (4) |
4,106 | 2,053 | 5,395 | |||||||||
| Gain on Equipment Sales (5) |
(875 | ) | — | — | ||||||||
| Manufacturing inefficiencies (6) |
4,005 | — | — | |||||||||
| Write off deferred financing costs (7) |
420 | — | — | |||||||||
|
|
|
|
|
|
|
|||||||
| Adjusted EBITDA |
$ | 12,653 | $ | 13,527 | $ | 14,000 | ||||||
|
|
|
|
|
|
|
|||||||
| Adjusted EBITDA as percentage of net sales |
7.6 | % | 7.7 | % | 8.4 | % | ||||||
|
|
|
|
|
|
|
|||||||
| (1) | This Appendix above includes financial measures and terms not calculated in accordance with generally accepted accounting principles in the United States (GAAP). We believe that presentation of non-GAAP measures such as EBITDA and adjusted EBITDA provides investors and analysts with an alternative method for assessing our operating results in a manner that enables investors and analysts to more thoroughly evaluate our current performance compared to past performance. We also believe these non-GAAP measures provide investors with a better baseline for assessing our future earnings potential. The non-GAAP measures included in this appendix are provided to give investors access to types of measures that we use in analyzing our results. |
EBITDA consists of GAAP net loss adjusted for the items included in the accompanying reconciliation. Adjusted EBITDA consists of EBITDA adjusted for the items included in the accompanying reconciliation. We believe that EBITDA and adjusted EBITDA provide useful information to investors and analysts about the company’s performance because they eliminate the effects of period to period changes in taxes, costs associated with capital investments and interest expense. EBITDA and adjusted EBITDA do not give effect to the cash the company must use to service its debt or pay its income taxes and thus do not reflect the funds generated from operations or actually available for capital investments.
Our calculations of EBITDA and adjusted EBITDA are not necessarily comparable to calculations performed by other companies and reported as similarly titled measures. These non-GAAP measures should be considered in addition to results prepared in accordance with GAAP, but should not be considered a substitute for or superior to GAAP measures.
| (2) | The Company completed its annual impairment tests in the fourth quarter of 2011, which resulted in additional impairment charges totaling $6.0 million related to trade names. |
| (3) | Represents the write-down of the value of certain fixed assets of the Company. |
| (4) | Represents charges and credits related to consolidation actions taken in 2011 and 2010. These charges relate primarily to employee separation costs and move related expenses. Of the $4.1 million in consolidation charges in the year ended December 31, 2011, $3.4 million is included in cost of goods sold and $0.7 million is included in selling, general and administrative expenses. Of the consolidation charges taken in 2010, $0.9 million was recorded in costs of goods sold and $1.2 million was recorded in selling, general, and administrative expenses |
| (5) | Represents gains related to the sale of equipment previously used in North Carolina operations. These gains are included in other income for the fourth quarter and year ended December 31, 2011. |
| (6) | Represents temporary excess labor and scrap expense incurred as a result of the consolidation actions taken in 2011. The amounts were determined by comparing the manufacturing results with normalized pre-consolidation results. These charges are included in cost of goods sold for the year ended December 31, 2011. |
| (7) | Represents the write-off of the remaining unamortized fees associated with our previous financing agreement. These charges are included in other expense for the year ended December 31, 2011. |
-1-