Attached files
| file | filename |
|---|---|
| EX-32.2 - EX-32.2 - PGT Innovations, Inc. | d451998dex322.htm |
| EX-32.1 - EX-32.1 - PGT Innovations, Inc. | d451998dex321.htm |
| EX-31.2 - EX-31.2 - PGT Innovations, Inc. | d451998dex312.htm |
| EX-31.1 - EX-31.1 - PGT Innovations, Inc. | d451998dex311.htm |
| EX-23.1 - EX-23.1 - PGT Innovations, Inc. | d451998dex231.htm |
| EX-21.1 - EX-21.1 - PGT Innovations, Inc. | d451998dex211.htm |
| EX-10.17 - EX-10.17 - PGT Innovations, Inc. | d451998dex1017.htm |
Table of Contents
UNITED STATES
SECURITIES AND EXCHANGE COMMISSION
Washington, D.C. 20549
Form 10-K
| ☒ | ANNUAL REPORT PURSUANT TO SECTION 13 OR 15(d) OF THE SECURITIES EXCHANGE ACT OF 1934 |
For the fiscal year ended December 30, 2017
OR
| ☐ | TRANSITION REPORT PURSUANT TO SECTION 13 OR 15(d) OF THE SECURITIES EXCHANGE ACT OF 1934 |
For the transition period from to
Commission File Number: 001-37971
PGT Innovations, Inc.
(Exact name of registrant as specified in its charter)
| Delaware | 20-0634715 | |
| (State or other jurisdiction of incorporation or organization) |
(I.R.S. Employer Identification No.) | |
| 1070 Technology Drive North Venice, Florida |
34275 | |
| (Address of principal executive offices) | (Zip Code) | |
Registrant’s telephone number, including area code:
(941) 480-1600
Former name, former address and former fiscal year, if changed since last report: PGT, Inc.
Securities registered pursuant to Section 12(b) of the Act:
| Title of Each Class |
Name of Exchange on Which Registered | |
| Common stock, par value $0.01 per share | New York Stock Exchange, Inc. |
Securities registered pursuant to Section 12 (g) of the Act: None
Indicate by check mark if the registrant is a well-known seasoned issuer, as defined in Rule 405 of the Securities Act. Yes ☐ No ☒
Indicate by check mark if the registrant is not required to file reports pursuant to Section 13 or Section 15(d) of the Exchange Act. Yes ☐ No ☒
Indicate by check mark whether the registrant (1) has filed all reports required to be filed by Section 13 or 15(d) of the Securities Exchange Act of 1934 during the preceding 12 months (or for such shorter period that the registrant was required to file such reports), and (2) has been subject to such filing requirements for the past 90 days. Yes ☒ No ☐
Indicate by check mark whether the registrant has submitted electronically and posted on its corporate Web site, if any, every Interactive Data File required to be submitted and posted pursuant to Rule 405 of Regulation S-T (§ 232.405 of this chapter) during the preceding 12 months (or for such shorter period that the registrant was required to submit and post such files). Yes ☒ No ☐
Indicate by check mark if disclosure of delinquent filers pursuant to Item 405 of Regulation S-K (§ 229.405 of this chapter) is not contained herein, and will not be contained, to the best of registrant’s knowledge, in definitive proxy or information statements incorporated by reference in Part III of this Form 10-K or any amendment to this Form 10-K. ☐
Indicate by check mark whether the registrant is a large accelerated filer, an accelerated filer, a non-accelerated filer, a smaller reporting company or emerging growth company. See definition of “accelerated filer,” “large accelerated filer,” “smaller reporting company,” and “emerging growth company” in Rule 12b-2 of the Exchange Act.
| Large accelerated filer | ☐ | Accelerated filer | ☒ | |||
| Non-accelerated filer | ☐ (Do not check if a smaller reporting company) | Smaller reporting company | ☐ | |||
| Emerging growth company |
☐ | |||||
If an emerging growth company, indicate by check mark if the registrant has elected not to use the extended transition period for complying with any new or revised financial accounting standards provided pursuant to Section 13(a) of the Exchange Act Yes ☐ No ☐
Indicate by check mark whether the registrant is a shell company (as defined by Rule 12b-2 of the Exchange Act). Yes ☐ No ☒
The aggregate market value of the registrant’s common stock held by non-affiliates of the registrant as of June 30, 2017 was approximately $617,744,602 based on the closing price per share on that date of $12.80 as reported on the New York Stock Exchange.
The number of shares of the registrant’s common stock, par value $0.01, outstanding as of February 28, 2018, was 49,805,711.
DOCUMENTS INCORPORATED BY REFERENCE
Portions of the Company’s Proxy Statement for the Company’s 2018 Annual Meeting of Stockholders are incorporated by reference into Part III of this Form 10-K. The Company’s Proxy Statement will be filed with the Securities and Exchange Commission pursuant to Regulation 14A.
Table of Contents
PGT Innovations, Inc.
Table of Contents to Form 10-K
| Page | ||||||
| PART I | ||||||
| Item 1. |
4 | |||||
| Item 1A. |
9 | |||||
| Item 1B. |
14 | |||||
| Item 2. |
15 | |||||
| Item 3. |
15 | |||||
| Item 4. |
16 | |||||
| PART II | ||||||
| Item 5. |
16 | |||||
| Item 6. |
18 | |||||
| Item 7. |
Management’s Discussion and Analysis of Financial Condition and Results of Operations |
19 | ||||
| Item 7A. |
36 | |||||
| Item 8. |
36 | |||||
| Item 9. |
Changes in and Disagreements with Accountants on Accounting and Financial Disclosure |
68 | ||||
| Item 9A. |
68 | |||||
| Item 9B. |
70 | |||||
| PART III | ||||||
| Item 10. |
70 | |||||
| Item 11. |
70 | |||||
| Item 12. |
Security Ownership of Certain Beneficial Owners and Management and Related Stockholder Matters |
70 | ||||
| Item 13. |
Certain Relationships and Related Transactions, and Director Independence |
70 | ||||
| Item 14. |
70 | |||||
| PART IV | ||||||
| Item 15. |
71 | |||||
| Item 16. |
73 | |||||
| Subsidiaries |
||||||
| Consent of KPMG LLP |
||||||
| Written Statement Pursuant to Section 302 |
||||||
| Written Statement Pursuant to Section 302 |
||||||
| Written Statement Pursuant to Section 906 |
||||||
| Written Statement Pursuant to Section 906 |
||||||
- 2 -
Table of Contents
CAUTIONARY NOTE REGARDING FORWARD LOOKING STATEMENTS
From time to time, we have made or will make forward-looking statements within the meaning of Section 21E of the Exchange Act. For those statements we claim the protection of the safe harbor provisions for forward-looking statements contained in such section. Forward-looking statements are not statements of historical facts but are based on management’s current beliefs, assumptions and expectations regarding our future performance, taking into account the information currently available to management. Forward-looking statements usually can be identified by the use of words such as “goal”, “objective”, “plan”, “expect”, “anticipate”, “intend”, “project”, “believe”, “estimate”, “may”, “could”, or other words of similar meaning. Forward-looking statements provide our current expectations or forecasts of future events, results, circumstances or aspirations. Our disclosures in this Annual Report on Form 10-K (this “Report”) contain forward-looking statements within the meaning of the Private Securities Litigation Reform Act of 1995. We may also make forward-looking statements in our other documents filed or furnished with the Securities and Exchange Commission and in oral presentations. Forward-looking statements are based on assumptions and by their nature are subject to risks and uncertainties, many of which are outside of our control. Our actual results may differ materially from those set forth in our forward-looking statements. There is no assurance that any list of risks and uncertainties or risk factors is complete. Factors that could cause actual results to differ materially from those described in our forward-looking statements include, but are not limited to:
| • | unfavorable changes in new home starts and home remodeling trends, especially in Florida, where the substantial portion of our sales are generated; |
| • | unfavorable changes in the economy in the U.S. in general and in Florida, where the substantial portion of our sales are generated; |
| • | increases in our raw material prices, including aluminum, glass and vinyl; |
| • | our dependence on a limited number of suppliers for certain of our key materials; |
| • | our ability to successfully integrate businesses we may acquire, or that any business we acquire may not perform as we expected at the time we acquired it; |
| • | the relocation of our CGI production facility, expected to commence beginning in late March 2018, being delayed due to permitting or construction delays, and once completed, there being complications and difficulties that result in the newly constructed production facility not operating as planned; |
| • | our level of indebtedness |
| • | our dependence on our impact-resistant product lines; |
| • | product liability and warranty claims brought against us; |
| • | federal, state and local laws and regulations, including unfavorable changes in local building codes; |
| • | our dependence on our limited number of geographically concentrated manufacturing facilities; and |
| • | the other risks and uncertainties discussed under “Risk Factors” in Part I. Item 1A. herein. |
Statements in this Report that are forward-looking statements include, without limitation, our expectations regarding: (1) demand for our products going forward; (2) the benefits expected from the heightened awareness of impact resistant window and door products resulting from Hurricane Irma and our post-Irma advertising; (3) the Company’s ability to capture a meaningful share of any increased demand for impact-resistant products; (4) our financial and operational performance for our 2018 fiscal year (5) new housing starts and housing market conditions in 2018 and beyond, especially with respect to the State of Florida; (6) the breadth and innovativeness of our product offerings, and their attractiveness to consumers; and (7) the ability of our management team and employees to execute our strategy. You are cautioned not to place undue reliance on these forward-looking statements, which speak only as of the date of this Report. Except as required by law, we undertake no obligation to update these forward-looking statements to reflect subsequent events or circumstances after the date of this Report.
- 3 -
Table of Contents
| Item 1. | BUSINESS |
GENERAL DEVELOPMENT OF BUSINESS
Description of the Company
On December 14, 2016, we announced the unveiling of our new name, PGT Innovations, Inc. (PGTI), formerly PGT, Inc. The name change is part of our strategy to bring together under a single identity our three, go-to-market brands serving the luxury, premium and mass custom impact-resistant window and door markets. We believe our products are the most technologically advanced impact-resistant window and door products in the industry, which we pioneered. We believe bringing together our three brands, PGT® Custom Windows & Doors, CGI®, and WinDoor®, under the umbrella of the PGT Innovations, Inc. name has further solidified our position as the leading manufacturer and supplier of residential impact-resistant windows and doors in the United States (the “U.S.”).
Our PGT Custom Windows & Doors’ impact-resistant products, which are marketed under the WinGuard® brand name, combine heavy-duty aluminum or vinyl frames with laminated glass to provide protection from hurricane-force winds and wind-borne debris by maintaining their structural integrity and substantially reducing the likelihood of penetration by impacting objects. Impact-resistant windows and doors satisfy stringent building codes in hurricane-prone coastal states and provide an attractive alternative to shutters and other “active” forms of hurricane protection that require installation and removal before and after each storm. Combining the impact resistance of WinGuard with our insulating glass creates energy efficient windows that can significantly reduce cooling and heating costs. We also manufacture non-impact resistant products in both aluminum and vinyl frames. Our current market share in Florida, which is the largest U.S. impact-resistant window and door market, is greater than that of any of our competitors.
On September 22, 2014, we completed the acquisition of CGI Windows and Doors Holdings, Inc. (“CGI”) which became a wholly-owned subsidiary of the Company. CGI was established in 1992 and has built a reputation for designing and manufacturing quality impact-resistant products that meet or exceed the stringent Miami-Dade County impact standards. We believe CGI is a leading innovator in product craftsmanship, strength and style, and that its brands are recognized and respected by the architectural community. CGI product lines include the Estate Collection, Sentinel by CGI, Estate Entrances, Commercial Series and Targa by CGI. On July 25, 2016, the Company created CGI Commercial, Inc. (“CGIC”) for the purpose of acquiring the operations of US Impact Systems, Inc. (“USI”), an established fabricator of storefront window and door products doing business primarily in the Miami area. CGIC, under the CGI brand, is the entity we use to market and sell our commercial storefront system products.
On February 16, 2016, we completed the acquisition of WinDoor, Incorporated (“WinDoor”), a provider of high-performance, impact-resistant windows and doors for high-end resorts, luxury high-rise condominiums, hotels and custom residential homes. WinDoor is now a wholly-owned subsidiary of the Company. At its manufacturing and administrative facilities in Orlando, Florida, WinDoor manufactures high-end, high-quality aluminum and thermally-broken aluminum products, featuring sliding glass doors, terrace doors, and windows.
At our manufacturing facilities in North Venice, Orlando, and Miami, Florida, where collectively we have approximately 2,700 employees, we produce fully-customized windows and doors for the luxury, premium and mass-custom markets, and have glass insulating, tempering and laminating facilities, which provide us with a more consistent source of impact-resistant laminated and insulated glass, shorter lead times, and lower costs relative to third-party sourcing.
The geographic regions in which we currently conduct business include the Southeastern U.S., Gulf Coast, Coastal mid-Atlantic, the Caribbean, Central America, and Canada. We distribute our products through multiple channels, including approximately 1,300 window distributors, building supply distributors, window replacement dealers and enclosure contractors. This broad distribution network provides us with the flexibility to meet demand as it shifts between the residential new construction and repair and remodeling end markets.
History
Our subsidiary, PGT Industries, Inc., a Florida Corporation, was founded in 1980 as Vinyl Tech, Inc. The PGT brand was established in 1987, and we introduced our WinGuard branded product line in the aftermath of Hurricane Andrew in 1992. CGI
- 4 -
Table of Contents
became a wholly-owned subsidiary of PGT Industries, Inc. on September 22, 2014. WinDoor became a wholly-owned subsidiary of PGT Industries, Inc. on February 16, 2016. CGIC became a wholly-owned subsidiary of CGI on August 31, 2016.
PGT Innovations, Inc. is a Delaware corporation. We were formed on December 16, 2003 as PGT, Inc. On June 27, 2006, we became a publicly listed company on the NASDAQ Global Market (NASDAQ) under the symbol “PGTI”. We changed our name to PGT Innovations, Inc., which we announced on December 14, 2016. Effective on December 28, 2016, the listing of the Company’s common stock was transferred to the New York Stock Exchange (NYSE) and our common stock began trading on the NYSE under our existing ticker symbol of “PGTI”.
FINANCIAL INFORMATION ABOUT INDUSTRY SEGMENTS
We operate as one segment, the manufacture and sale of windows and doors. Additional required information is included in Item 8.
NARRATIVE DESCRIPTION OF BUSINESS
Our Products
We manufacture complete lines of high-end, luxury, premium, and mass-custom fully customizable aluminum and vinyl windows and doors and porch enclosure products targeting both the residential new construction and repair and remodeling end markets. All our products carry one of our three brand names, and our consumer-oriented products carry an additional, trademarked product name. PGT’s products carry the PGT® Custom Windows & Doors brand and carry the trademarked product names of WinGuard, WinGuard Vinyl, EnergyVue, and Eze-Breeze. CGI’s products carry the CGI® brand and carry the trademarked product names of Estate Collection, Sentinel by CGI, Estate Entrances, Commercial Series and Targa by CGI. Also, under CGI, CGIC sells the Company’s commercial storefront system. WinDoor’s products carry the WinDoor® brand and carry various product names, including its 3000 and 4000 Series aluminum windows, its 6000, 7000 and 8000 Series aluminum sliding glass doors, and its 9000 Series thermally broken windows and doors.
PGT Custom Windows & Doors
WinGuard. WinGuard is an impact-resistant product line that combines heavy-duty aluminum or vinyl frames with laminated glass to provide protection from hurricane-force winds and wind-borne debris and satisfies increasingly stringent building codes. Our marketing and sales of the WinGuard product line is primarily targeted to hurricane-prone coastal states in the U.S., as well as the Caribbean and Central America. Combining the impact resistance of WinGuard with insulating glass creates energy efficient windows that can significantly reduce cooling and heating costs. Our WinGuard Vinyl line of windows and doors is designed to offer some of the highest design pressures available on impact-resistant windows and doors, in a modern profile, with larger sizes that satisfy the most stringent hurricane codes in the country. It protects against flying debris, intruders, outside noise and UV rays.
EnergyVue. EnergyVue is our non-impact vinyl window featuring energy-efficient insulating glass and multi-chambered frames that meet or exceed ENERGY STAR® standards in all climate zones to help consumers save on energy costs. Its new design has a refined modern profile and robust construction and is offered in larger sizes and higher design pressures, multiple frame colors, and a variety of hardware finishes, glass tints, grid styles and patterns. We announced the launch of EnergyVue in the first quarter of 2015.
Aluminum. We offer a complete line of fully customizable, non-impact-resistant aluminum frame windows and doors. These products primarily target regions with warmer climates, where aluminum is often preferred due to its ability to withstand higher structural loads. Adding insulating glass creates energy-efficient windows that can significantly reduce cooling and heating costs.
Eze-Breeze. Eze-Breeze non-glass vertical and horizontal sliding panels for porch enclosures are vinyl-glazed, aluminum-framed products used for enclosing screened-in porches that provide protection from inclement weather. This line was completed with the addition of a cabana door.
CGI
Estate Collection. Our Estate Collection of windows and doors is CGI’s premium aluminum impact-resistant product line. These windows and doors can be found in high-end homes, resorts and hotels, and in schools and office buildings. Our Estate
- 5 -
Table of Contents
Collection combines protection against hurricane force damage with architectural-grade quality, handcrafted details and modern engineering. These windows and doors protect and insulate against hurricane winds and wind-driven debris, and offer UV protection. Estate’s aluminum frames are thicker than many of our competitors’ frames, making it a preferable choice for consumers in coastal areas prone to hurricanes.
Sentinel. Sentinel is a complete line of aluminum impact-resistant windows and doors from CGI that provides quality craftsmanship, energy efficiency and durability at a lower price point than our Estate Collection. Sentinel windows and doors are designed and manufactured with the objectives of enhancing home aesthetics, while delivering protection from hurricane winds and wind-borne debris. Sentinel is custom manufactured to exact sizes within our wide range of design parameters, therefore, reducing on-site construction costs. In addition, Sentinel’s frame depth is designed for both new construction and replacement applications, resulting in faster, less intrusive installations.
Targa. Targa is CGI’s line of vinyl, energy-efficient, impact-resistant windows designed specifically to exceed the Florida impact codes, which are the most stringent impact standards in the U.S. Targa windows are designed with the objective of enhancing the aesthetics of a home, are relatively low maintenance, with long-term durability, and environmental compatibility.
Commercial Storefront System. Our Commercial Storefront window system and entry doors are engineered to provide a flexible yet economical solution for a variety of applications. Our system is designed with the goal of providing easy fabrication and assembly, while also reducing installation time and challenges.
WinDoor
Aluminum Doors and Windows. WinDoor produces a wide array of high-end, luxury aluminum doors and windows, including impact and non-impact sliding glass doors and terrace doors, fixed picture windows, single hung windows, and horizontal rolling windows. All of WinDoor’s aluminum windows are available in impact and non-impact versions and meet or exceed ENERGY STAR® standards in all climate zones.
Thermally Broken Doors and Windows. WinDoor produces a variety of aluminum thermally broken doors and windows. WinDoor’s thermally broken products provide the strength of aluminum with the energy ratings usually seen in only vinyl products. All of WinDoor’s thermally broken products are available in multiple shapes and sizes, have earned high performance ratings on impact and non-impact certifications, and meet or exceed ENERGY STAR® standards in all climate zones.
Sales and Marketing
Our sales strategy primarily focuses on attracting and retaining distributors and dealers with an expectation of consistently providing exceptional customer service, leading product designs and quality, and competitive pricing all using our advanced knowledge of building code requirements and technical expertise.
Our marketing strategy is designed to reinforce the quality of our products and focuses on both coastal and inland markets. We support our customers through print and web-based advertising, consumer, dealer, and builder promotions, and selling and collateral materials. We also work with our dealers and distributors to educate architects, building officials, consumers and homebuilders on the advantages of using impact-resistant and energy-efficient products. We market our products based on our expectations of quality, building code compliance, outstanding service, shorter lead times, and on-time delivery using our fleet of trucks and trailers.
Our Customers
We have a highly diversified base of approximately 1,300 window distributors, building supply distributors, window replacement dealers and enclosure contractors. Our largest customer accounts for approximately 5% of net sales and our top ten customers account for approximately 23% of net sales. Our sales are driven by residential new construction and home repair and remodeling end markets, which represented approximately 39% and 61% of our sales, respectively, during 2017. This compares to 42% and 58%, respectively, in 2016.
We do not supply our products directly to homebuilders but believe demand for our products is also a function of our strong relationships with certain national homebuilders.
- 6 -
Table of Contents
Materials and Supplier Relationships
Our primary manufacturing materials include aluminum and vinyl extrusions, glass, ionoplast, and polyvinyl butyral. Although in many instances we have agreements with our suppliers, these agreements are generally terminable by either party on limited notice. While most of our materials are typically available from other sources, transitioning to alternative sources would require us to complete testing and certifications related to impact-resistance and for the alternative source of supply to create the customized equipment and tooling necessary to provide the materials and components to us. Therefore, our goal is to develop and maintain lasting relationships with our materials suppliers.
Aluminum and vinyl extrusions accounted for approximately 39% of our material purchases during 2017. Sheet glass, which is sourced from two major national suppliers, accounted for approximately 11% of our material purchases during 2017. Sheet glass that we purchase comes in various sizes, tints, and thermal properties. From the sheet glass purchased, we produce some of our own laminated glass needs. However, in 2017 and 2016 due to some temporary capacity constraints, we purchased some of our laminated glass needs. This finished laminated glass made up approximately 18% of our material purchases in 2017. Polyvinyl butyral and ionoplast, which are both used as inner layer in laminated glass, accounted for approximately 10% of our material purchases during 2017.
On September 22, 2017, we entered into an Asset Purchase Agreement (APA) with Cardinal LG Company (Cardinal) for the sale to Cardinal of certain manufacturing equipment we used in processing glass components for PGT-branded doors for a cash purchase price of $28 million. Contemporaneously with entering into the APA, we entered into a seven-year supply agreement (SA) with Cardinal for Cardinal to supply us with glass components for PGT-branded doors. The Company determined to sell these assets and enter into the SA to allow us to heighten our focus in our core areas of window and door manufacturing and, at the same time, strengthen our supply chain for high-quality door glass from a supplier with whom we have been doing business for many years.
Backlog
As of December 30, 2017, our backlog was $51.3 million. As of December 31, 2016, our backlog was $40.6 million. Our backlog consists of orders that we have received from customers that have not yet shipped, and we expect that a significant portion of our current backlog will be recognized as sales in the first quarter of 2018, due in part to our lead times which range from one to five weeks. WinDoor’s current lead times are approximately twelve weeks, substantially higher than is typical for this brand. WinDoor’s lead times have been negatively impacted by having to adjust to changes in leadership, systems and glass suppliers, all of which have caused operating disruptions which have affected its performance. We expect those operating disruptions to be resolved during 2018, with WinDoor’s lead times returning to a normal level contemporaneously.
Intellectual Property
We own and have registered trademarks in the United States. In addition, we own several patents and patent applications concerning various aspects of window assembly and related processes. We are not aware of any circumstances that would have a material adverse effect on our ability to use our trademarks and patents. If we continue to renew our trademarks when necessary, the trademark protection provided by them is perpetual.
Manufacturing
Our manufacturing facilities are in Florida where we produce customized products. The manufacturing process typically begins in our glass plant where we cut, temper, laminate, and insulate sheet glass to meet specific requirements of our customers’ orders.
Glass is transported to our window and door assembly lines in a make-to-order sequence where it is combined with an aluminum or vinyl frame. These frames are also fabricated to order. We start with a piece of extruded material which is cut and shaped into a frame that fits the customers’ specifications. Once complete, product is immediately staged for delivery and generally shipped on our trucking fleet within 48 hours of completion.
Competition
The window and door industry is highly fragmented, and the competitive landscape is based on geographic scope. The competition falls into the following categories.
Local and Regional Window and Door Manufacturers: This group of competitors consists of numerous local job shops and small manufacturing facilities that tend to focus on selling products to local or regional dealers and wholesalers. Competitors in this group
- 7 -
Table of Contents
typically lack marketing support and the service levels and quality controls demanded by larger customers, as well as the ability to offer a full complement of products.
National Window and Door Manufacturers: This group of competitors tends to focus on selling branded products nationally to dealers and wholesalers and has multiple locations.
International Window and Door Manufacturers: This group of competitors consists of non-U.S. companies that have created entities and established manufacturing operations within Florida and have an increasing presence in the South Florida region as suppliers of windows and doors, primarily for high-rise buildings.
Active Protection: This group of competitors consists of manufactures that produce shutters and plywood, both of which are used to actively protect openings. Our impact windows and doors represent passive protection, meaning, once installed, no activity is required to protect a home from storm related hazards.
The principal methods of competition in the window and door industry are the development of long-term relationships with window and door dealers and distributors, and the retention of customers by delivering a full range of high-quality products in a timely manner, while offering competitive pricing and flexibility in transaction processing. Trade professionals such as contractors, homebuilders, architects and engineers also engage in direct interaction with manufacturers and look to the manufacturer for training and education related to products and codes. We believe our leading position in the U.S. impact-resistant window and door market, and the award-winning designs and quality of our products, position us well to meet the needs of our customers.
Environmental Considerations
Although our business and facilities are subject to federal, state, and local environmental regulation, environmental regulation does not have a material impact on our operations, and we believe that our facilities are in material compliance with such laws and regulations.
Employees
As of the end of 2017, we employed approximately 2,700 people, none of whom were represented by a collective bargaining unit. We believe we have good relations with our employees.
FINANCIAL INFORMATION ABOUT GEOGRAPHIC AREAS
Our domestic and international net sales for each of the years ended December 30, 2017, December 31, 2016, and January 2, 2016, are as follows (in millions):
| Year Ended | ||||||||||||
| December 30, | December 31, | January 2, | ||||||||||
| 2017 | 2016 | 2016 | ||||||||||
| Domestic (1) |
$ | 495.7 | $ | 442.7 | $ | 371.0 | ||||||
| International |
15.4 | 15.9 | 18.8 | |||||||||
|
|
|
|
|
|
|
|||||||
| Total net sales |
$ | 511.1 | $ | 458.6 | $ | 389.8 | ||||||
|
|
|
|
|
|
|
|||||||
| (1) | Includes sales of $460.4 million in 2017, $414.4 million in 2016, and $344.5 million in the state of Florida. |
AVAILABLE INFORMATION
Our Internet address is www.pgtinnovations.com. Through our Internet website under “Financial Information” in the Investors section, we make available free of charge, as soon as reasonably practical after such information has been filed with the SEC, our annual report on Form 10-K, quarterly reports on Form 10-Q, current reports on Form 8-K, and amendments to those reports filed pursuant to Section 13(a) or 15(d) of the Securities Exchange Act. Also available through our Internet website under “Corporate Governance” in the Investors section is our Code of Business Conduct and Ethics. We are not including this or any other information on our website as a part of, nor incorporating it by reference into this Form 10-K, or any of our other SEC filings. The SEC maintains an Internet site that contains our reports, proxy and information statements, and other information that we file electronically with the SEC at www.sec.gov.
- 8 -
Table of Contents
| Item 1A. | RISK FACTORS |
We are subject to regional and national economic conditions. The economy in Florida and throughout the United States could negatively impact demand for our products as it has in the past, and macroeconomic forces such as employment rates and the availability of credit could have an adverse effect on our sales and results of operations.
New home construction while improving, remains below average. Also repair and remodeling markets are subject to many economic factors. Accordingly, either market could decline and lower the demand for, and the pricing of, our products, which could adversely affect our results. The window and door industry is subject to the cyclical market pressures of the larger new construction and repair and remodeling markets. In turn, these changes may be affected by adverse changes in economic conditions such as demographic trends, employment levels, interest rates, and consumer confidence. A decline in the economic environment or new home construction could negatively impact our sales and earnings.
Economic and credit market conditions impact our ability to collect receivables. Economic and credit conditions can negatively impact our bad debt expense, which can adversely impact our results of operations. If economic and credit conditions deteriorate, our results of operations may be adversely impacted by bad debts.
We are subject to fluctuations in the prices of our raw materials. We experience significant fluctuations in the cost of our raw materials, including aluminum extrusion, vinyl extrusion, polyvinyl butyral and glass. A variety of factors over which we have no control, including global demand for aluminum, fluctuations in oil prices, speculation in commodities futures and the creation of new laminates or other products based on new technologies impact the cost of raw materials which we purchase for the manufacture of our products. These factors may also magnify the impact of economic cycles on our business. While we attempt to minimize our risk from severe price fluctuations by entering into aluminum forward contracts to hedge these fluctuations in the purchase price of aluminum extrusion we use in production, substantial, prolonged upward trends in aluminum prices could significantly increase the cost of the unhedged portions of our aluminum needs and have an adverse impact on our results of operations. We anticipate that these fluctuations will continue in the future. Additionally, on March 1, 2018, the current U.S. Presidential administration indicated that it was considering options to curb imports of foreign steel and aluminum, including the possibilities of imposing tariffs on steel and aluminum, and limiting the amounts of steel and aluminum coming into the United States. These actions could have a negative impact on prices our suppliers pay for their materials, which they could attempt to pass-on to us.
While we have entered into supply agreements with major producers of our primary raw materials that we believe provide us with reliable sources for certain of our raw materials with stable pricing on favorable terms, if one or both parties to the agreements do not satisfy the terms of the agreements, they may be terminated which could result in our inability to obtain certain raw materials on commercially reasonable terms having an adverse impact on our results of operations. While historically we have to some extent been able to pass on significant cost increases to our customers, our results between periods may be negatively impacted by a delay between the cost increases and price increases in our products.
We rely on a limited number of outside suppliers for certain key components and materials. We obtain a significant portion of our key raw materials, such as glass, aluminum and vinyl components, from a few key suppliers. If any of these suppliers is unable to meet its obligations under present or any future supply agreements, we may be forced to pay higher prices to obtain the necessary raw materials and may suffer a significant interruption in our ability to manufacture our products. Any interruption of supply or any price increase of raw materials could have a material adverse effect on our business and results of operations. If we are required to obtain an alternate source for these materials or components, we may not be able to obtain pricing on as favorable terms or on terms comparable to our competitors. Additionally, we may be forced to pay additional transportation costs or to invest in capital projects or costly product redesigns and perform costly new product certification testing with respect to our impact-resistant products, in connection with moving to any alternate source of supply. A vendor may also choose, subject to existing contracts, to modify its relationship due to general economic concerns or concerns relating to the vendor or us, at any time. Any significant change in the terms that we have with our key suppliers could materially adversely affect our financial condition and liquidity, as could significant additional requirements from our suppliers that we provide them additional security in the form of prepayments or with letters of credit.
Sales fluctuations to and changes in our relationships with key customers could have a material adverse effect on our financial condition, liquidity or results of operations. Some of our business lines and markets are dependent on a few key customers, including dealers. We generally do not enter into written or long-term agreements with our customers. The loss, reduction, or fluctuation of sales to one of these major customers, or any adverse change in our business relationship with any one or more of them, could have a material adverse effect on our financial condition, liquidity or results of operations.
- 9 -
Table of Contents
Our operating results are substantially dependent on sales of our branded impact-resistant products. A majority of our net sales are, and are expected to continue to be, derived from the sales of our branded impact-resistant products. Accordingly, our future operating results will depend on the demand for our impact-resistant products by current and future customers, including additions to this product line that are subsequently introduced. If our competitors release new products that are superior to our impact-resistant products in performance or price, or if we fail to update our impact-resistant products with any technological advances that are developed by us or our competitors or introduce new products in a timely manner, demand for our products may decline. A decline in demand for our impact-resistant products as a result of competition, technological change or other factors could have a material adverse effect on our ability to generate sales, which would negatively affect results of operations.
Changes in building codes could lower the demand for our impact-resistant windows and doors. The market for our impact-resistant windows and doors depends in large part on our ability to satisfy state and local building codes that require protection from wind-borne debris. If the standards in such building codes are raised, we may not be able to meet their requirements, and demand for our products could decline. Conversely, if the standards in such building codes are lowered or are not enforced in certain areas, demand for our impact-resistant products may decrease. Further, if states and regions that are affected by hurricanes but do not currently have such building codes fail to adopt and enforce hurricane protection building codes, our ability to expand our business in such markets may be limited.
Our business is geographically concentrated in Florida. Focusing operations into manufacturing locations in Florida optimizes manufacturing efficiencies and logistics, and we believe that a focused approach to growing our share within our core wind-borne debris markets in Florida, from the Gulf Coast to the mid-Atlantic, and certain international markets, will maximize value and return. However, such a focus further concentrates our business, and another prolonged decline in the economy of the state of Florida or of certain coastal regions, a change in state and local building code requirements for hurricane protection, or any other adverse condition in the state or certain coastal regions, could cause a decline in the demand for our products, which could have an adverse impact on our sales and results of operations.
Our contemplated CGI Plant relocation may not be as effective as we anticipate, and we may fail to realize the expected cost savings and increased production capacity and efficiencies. As part of our efforts to increase our production capacity, flexibility and efficiencies, we have entered into a long-term lease for a new manufacturing facility in Hialeah, Florida to house our production of products currently made at CGI’s existing facilities. We expect to begin moving equipment into the new facility in late-March 2018, with production scheduled to begin in the new facility in early- to mid-April 2018. However, due to risks attendant with new construction and new production facilities, we may not achieve the cost savings, increased production capacity or other benefits that we would anticipate from moving manufacturing operations to a larger, newer and more efficient facility.
In particular, unforeseen construction and permitting delays may negatively impact our scheduled move and could cause us to incur additional costs as we wait for the facility to be operational. Furthermore, we must transport certain large and complex equipment, which could be delayed or damaged in transit, causing us to experience delay or incur additional costs. Even if we successfully move our manufacturing operations, there is no assurance that the cost savings and efficiencies and improved production capacity we anticipate will be achieved, particularly if we are unable to successfully start-up, commission and integrate the relocated manufacturing operations, or we experience unforeseen or contingent liabilities of the relocated manufacturing operations. In addition, at the new facility, we must train our workforce to manage and use new production techniques and equipment layouts, and operate the equipment in the new setting, creating the potential for further delays, additional costs and potential quality control issues. As a result, we may face difficulties in implementing and maintaining consistent production standards, volumes, controls, procedures, policies and information systems. As the facility ramps up production, we may be unable to obtain certain necessary or desirable customer or other certifications if we experience significant quality control issues.
Such delays, costs and challenges attendant with new construction and new production facilities and techniques could result in the distraction of management and general business disruption, costly delays, product quality issues or even supply shortages, any of which could adversely affect our operational and financial results and our reputation with our customers.
We rely on third party transportation, which subjects us to risks and costs that we cannot control, and which risks and costs may materially adversely affect our operations. We rely on third party trucking companies to transport raw materials to the manufacturing facilities used by each of our businesses and, to a small degree, to ship finished products to customers. These transport operations are subject to various hazards and risks, including extreme weather conditions, work stoppages and operating hazards, as well as interstate transportation regulations. In addition, the methods of transportation we utilize may be subject to additional, more stringent and more costly regulations in the future. If we are delayed or unable to ship finished products or unable to obtain raw materials as a result of any such new regulations or public policy changes related to transportation safety, or these transportation companies fail to operate properly, or if there were significant changes in the cost of these services due to new or additional regulations, or otherwise, we may
- 10 -
Table of Contents
not be able to arrange efficient alternatives and timely means to obtain raw materials or ship goods, which could result in a material adverse effect on our revenues and costs of operations. Transportation costs represent a significant part of our cost structure. If our transportation costs increased substantially, due to prolonged increases in fuel prices or otherwise, we may not be able to control them or pass the increased costs onto customers, and our profitability would be negatively impacted.
The home building industry and the home repair and remodeling sector are regulated. The homebuilding industry and the home repair and remodeling sector are subject to various local, state, and federal statutes, ordinances, rules, and regulations concerning zoning, building design and safety, construction, and similar matters, including regulations that impose restrictive zoning and density requirements in order to limit the number of homes that can be built within the boundaries of a particular area. Increased regulatory restrictions could limit demand for new homes and home repair and remodeling products and could negatively affect our sales and results of operations.
The industry in which we compete is highly competitive. The window and door industry is highly competitive. We face significant competition from numerous small, regional producers, as well as certain national producers. Any of these competitors may (i) foresee the course of market development more accurately than do we, (ii) develop products that are superior to our products, (iii) have the ability to produce similar products at a lower cost or compete more aggressively in pricing, or (iv) adapt more quickly to new technologies or evolving customer requirements than do we. Additionally, some of the competitors of our businesses are larger and have greater financial and other resources and less debt than us. Accordingly, these competitors may be better able to withstand changes in conditions within the industries and markets in which we operate and may have significantly greater operating and financial flexibility than we have. Moreover, barriers to entry are low in most product lines and new competitors may enter our industry, especially if the market for impact-resistant windows and doors continues to expand. An increase in competition from other window and door building products manufacturers or alternative building materials could cause us to lose customers and lead to decreases in net sales and profitability. To the extent we lose customers in the renovation and remodeling markets, we would likely have to market more to the new home construction market, which historically has experienced more significant fluctuations in demand.
We have incurred additional indebtedness and may incur additional indebtedness in the future. We have incurred additional indebtedness under our credit facilities as a result of increasing our borrowing levels to fund acquisitions, and to provide for up to $40 million of revolving credit borrowings. We and our subsidiaries may incur additional indebtedness in the future to fund additional acquisitions and/or to borrow under our revolving credit facility to fund working capital needs. If new debt is added to our current debt levels, certain risks which we currently do not consider significant could intensify.
Our level of indebtedness could adversely affect our ability to operate our business. Our level of indebtedness could have important consequences on our business. For example, it could, among other things:
| • | require us to dedicate a portion of our cash flow from operations to payments on our debt, reducing the amount of cash flow available for other purposes, such as capital expenditures, acquisitions, dividends and working capital; |
| • | limit our flexibility in planning for, or reacting to, changes in our business and the industries in which we operate; |
| • | place us at a disadvantage compared to our competitors that have less debt and, thus, may have greater flexibility to use their cash flows to pursue business opportunities that may improve their businesses and financial performance; |
| • | increase our cost of borrowing; and |
| • | limit the amount of additional debt we could borrow. |
In addition, our current debt instruments contain various covenants that limit our ability to operate our business. Our credit facility contains various provisions that limit our ability to, among other things, transfer or sell assets, including the equity interests of our subsidiaries, or use asset sale proceeds; pay dividends or distributions on our capital stock, make certain restricted payments or investments; create liens to secure debt; enter into transactions with affiliates; merge or consolidate with another company; and engage in unrelated business activities.
Under certain circumstances and depending on the degree of borrowing we may elect to incur under the revolving credit portion of our credit facility, our credit facility requires us to maintain a net leverage ratio, as defined in our credit facility, below certain maximums which decrease over time. Our ability to comply with the requirements of this maximum net leverage ratio, as well as other provisions of our credit facility, may be affected by changes in our operating and financial performance, changes in general business and economic conditions, adverse regulatory developments, or other events beyond our control. The breach of this maximum net leverage ratio requirement, could result in a default under our indebtedness, which could cause it and other obligations to become immediately due and payable. If any of our indebtedness is accelerated, we may not be able to repay it.
- 11 -
Table of Contents
We may be adversely affected by any disruption in our information technology systems or by unauthorized intrusions or “hacking” into those systems and theft of information from them, or other cybersecurity-related incidents. Our operations are dependent upon our information technology systems, which encompass all of our major business functions. A disruption in our information technology systems for any prolonged period could result in delays in receiving inventory and supplies or filling customer orders and adversely affect our customer service and relationships. Various third parties, including computer hackers, who are continually becoming more aggressive and sophisticated, may attempt to penetrate our network security and, if successful, misappropriate confidential customer, employee and/or supplier information. In addition, one of our employees, contractors or other third parties with whom we do business may attempt to circumvent our security measures in order to obtain such information, or inadvertently cause a breach involving such information. While we have implemented systems and processes to protect against unauthorized access to or use of secured data and to prevent data loss and theft, there is no guarantee that these procedures are adequate to safeguard against all data security breaches or misuse of the data. The regulatory environment related to information security, data collection and use, and privacy is increasingly rigorous, with new and frequently changing requirements, and compliance with those requirements could result in additional costs. These costs associated with information security, such as increased investment in technology, the costs of compliance with privacy laws, and costs incurred to prevent or remediate information security breaches, could be substantial and adversely impact our business. A significant compromise of sensitive employee, customer or supplier information in our possession could result in legal damages and regulatory penalties. In addition, the costs of defending such actions or remediating breaches could be material. Security breaches could also harm our reputation with our customers and retail partners, potentially leading to decreased revenues, and with federal and state government agencies and bodies.
We depend on hiring an adequate number of hourly employees to operate our business and are subject to government regulations concerning these and our other employees, including wage and hour regulations. Our workforce is comprised primarily of employees who work on an hourly basis. To grow our operations and meet the needs and expectations of our customers, we must attract, train, and retain a large number of hourly associates, while at the same time controlling labor costs. These positions have historically had high turnover rates, which can lead to increased training, retention and other costs. In certain areas where we operate, there is significant competition for employees. The lack of availability of an adequate number of hourly employees, or our inability to attract and retain them, or an increase in wages and benefits to current employees could adversely affect our business, results of operations, cash flows and financial condition. We are subject to applicable rules and regulations relating to our relationship with our employees, including wage and hour regulations, health benefits, unemployment and payroll taxes, overtime and working conditions and immigration status. Accordingly, federal, state or local legislated increases in the minimum wage, as well as increases in additional labor cost components such as employee benefit costs, workers’ compensation insurance rates, compliance costs and fines, would increase our labor costs, which could have a material adverse effect on our business, prospects, results of operations and financial condition.
We may be adversely affected by any disruptions to our manufacturing facilities or disruptions to our customer, supplier, or employee base. Our manufacturing and operating facilities are located in Florida, which is a hurricane-sensitive area. Any disruption to our facilities resulting from hurricanes and other weather-related events, fire, an act of terrorism, or any other cause could damage a significant portion of our inventory, affect our distribution of products, and materially impair our ability to distribute our products to customers. We could incur significantly higher costs and longer lead times associated with distributing our products to our customers during the time that it takes for us to reopen or replace a damaged facility. In addition, if there are disruptions to our customer and supplier base or to our employees caused by hurricanes, our business could be temporarily adversely affected by higher costs for materials, increased shipping and storage costs, increased labor costs, increased absentee rates, and scheduling issues. Furthermore, some of our direct and indirect suppliers have unionized work forces, and strikes, work stoppages, or slowdowns experienced by these suppliers could result in slowdowns or closures of their facilities. Any interruption in the production or delivery of our supplies could reduce sales of our products and increase our costs.
The nature of our business exposes us to product liability and warranty claims. We are, from time to time, involved in product liability and product warranty claims relating to the products we manufacture and distribute that, if adversely determined, could adversely affect our financial condition, results of operations, and cash flows. In addition, we may be exposed to potential claims arising from the conduct of homebuilders and home remodelers and their sub-contractors. Although we currently maintain what we believe to be suitable and adequate insurance in excess of our self-insured amounts, we may not be able to maintain such insurance on acceptable terms or such insurance may not provide adequate protection against potential liabilities. Product liability claims can be expensive to defend and can divert the attention of management and other personnel for significant periods, regardless of the ultimate outcome. Claims of this nature could also have a negative impact on customer confidence in our products and our company.
We are subject to potential exposure to environmental liabilities and are subject to environmental regulation. We are subject to various federal, state, and local environmental laws, ordinances, and regulations. Although we believe that our facilities are in material compliance with such laws, ordinances, and regulations, as owners and lessees of real property, we can be held liable for the
- 12 -
Table of Contents
investigation or remediation of contamination on such properties, in some circumstances, without regard to whether we knew of or were responsible for such contamination. Remediation may be required in the future as a result of spills or releases of petroleum products or hazardous substances, the discovery of unknown environmental conditions, or more stringent standards regarding existing residual contamination. More burdensome environmental regulatory requirements may increase our general and administrative costs and may increase the risk that we may incur fines or penalties or be held liable for violations of such regulatory requirements.
We conduct all of our operations through our subsidiaries and rely on payments from our subsidiaries to meet all of our obligations. We are a holding company and derive all of our operating income from our subsidiary, PGT Industries, Inc., and its subsidiaries, CGI Windows and Doors, Inc., and WinDoor, Incorporated. All of our assets are held by our subsidiaries, and we rely on the earnings and cash flows of our subsidiaries to meet our obligations. The ability of our subsidiaries to make payments to us will depend on their respective operating results and may be restricted by, among other things, the laws of their jurisdictions of organization (which may limit the amount of funds available for distributions to us), the terms of existing and future indebtedness and other agreements of our subsidiaries, including our credit facilities, and the covenants of any future outstanding indebtedness we or our subsidiaries incur.
We are exposed to risks relating to evaluations of controls required by Section 404 of the Sarbanes-Oxley Act of 2002. We are required to comply with Section 404 of the Sarbanes-Oxley Act of 2002. While we have concluded that at December 30, 2017, we have no material weaknesses in our internal control over financial reporting, we cannot assure you that we will not have a material weakness in the future. A “material weakness” is a deficiency, or combination of deficiencies, in internal control over financial reporting, such that there is a reasonable possibility that a material misstatement of the Company’s annual or interim financial statements will not be prevented or detected on a timely basis. If we fail to maintain our internal control over financial reporting that meets the requirements of Section 404, we might be subject to sanctions or investigation by regulatory authorities such as the SEC or by the New York Stock Exchange. Additionally, failure to comply with Section 404 or the report by us of a material weakness may cause investors to lose confidence in our financial statements and our stock price may be adversely affected. If we fail to remedy any material weakness, our financial statements may be inaccurate, we may not have access to the capital markets, and our stock price may be adversely affected.
We may be adversely impacted by the loss of sales or market share from being unable to keep up with demand. We are currently experiencing growth through higher sales volume and growth in market share. To meet the increased demand, we have been hiring and training new employees for direct and indirect support and adding to our glass capacity. However, should we be unable to find and retain quality employees to meet demand, or should there be disruptions to the increase in capacity, we may be unable to keep up with our higher sales demand. If our lag time on delivery falls behind, or we are unable to meet customer timing demands, we could lose market share to competitors.
We made significant acquisitions late in the third quarter of 2014, and again in February 2016 of companies that sell products similar to PGT’s own impact-resistant line of products in PGT’s primary market of Florida. Late in the third quarter of 2014, we acquired CGI Windows and Doors, Inc. CGI produces the Estate, Sentinel and Targa lines of impact-resistant branded products which are very similar to our WinGuard line of impact-resistant branded products. In February 2016, we acquired WinDoor. WinDoor produces impact-resistant windows and sliding glass and terrace doors, similar to PGT and CGI. Nearly all of CGI’s and WinDoor’s sales are in Florida, PGT’s primary market. We believe that adding CGI’s and WinDoor’s branded products and presence in Florida to PGT’s already successful, established line of branded products in Florida will benefit PGT through higher sales and market share. However, no assurances can be given that the combination of these three lines of branded products within a single company will not result in dilution of these brands, resulting in loss of market share and demand for these products.
We may evaluate and engage in asset dispositions, acquisitions, joint ventures and other transactions that may impact our results of operations, and we may not achieve the expected results from these transactions. From time to time, and subject to the agreements governing our existing debt or otherwise, we may enter into agreements to and engage in business combinations, purchases of assets or contractual arrangements or joint ventures, including in geographical areas outside the state of Florida, with which we do not have the level of familiarity that we have with the Florida market. In addition, some of those business acquisitions or combinations could involve a seller whose products may be different from the types of products we currently sell, and they could be products that are sold to different types of customers. Subject to the agreements governing our existing debt or otherwise, some of these transactions may be financed with our additional borrowings. The integration of any business we may acquire may be disruptive to us and may result in a significant diversion of management attention and operational resources. Additionally, we may suffer a loss of key employees, customers or suppliers, loss of revenues, increases in costs or other difficulties. If the expected efficiencies and synergies from any such transactions are not fully realized, our results of operations could be adversely affected, because of the costs associated with such transactions or otherwise. Other transactions may advance future cash flows from some of our businesses, thereby yielding increased short-term liquidity, but consequently resulting in lower cash flows from these operations over the longer
- 13 -
Table of Contents
term. In addition, if the goodwill, indefinite-lived intangible assets, or other intangible assets that we have acquired or may acquire in the future are determined to be impaired, we may be required to record a non-cash charge to earnings during the period in which the impairment is determined, which could be significant. The failure to realize the expected long-term benefits of any one or more of these transactions could have a material adverse effect on our financial condition or results of operations.
| Item 1B. | UNRESOLVED STAFF COMMENTS |
None.
- 14 -
Table of Contents
| Item 2. | PROPERTIES |
We have the following properties as of December 30, 2017:
| Manufacturing | Support | Storage | ||||||||||
| (in square feet) | ||||||||||||
| Owned: |
||||||||||||
| Main plant and corporate office, North Venice, FL |
348,000 | 15,000 | — | |||||||||
| Glass tempering and laminating, North Venice, FL |
80,000 | — | — | |||||||||
| Glass processing facility, North Venice, FL |
96,000 | — | — | |||||||||
| Insulated glass building, North Venice, FL |
42,000 | — | — | |||||||||
| PGT Wellness Center, North Venice, FL |
— | 3,600 | — | |||||||||
| Leased: |
||||||||||||
| James Street storage, Venice, FL |
— | — | 15,000 | |||||||||
| Center Court, Venice, FL |
19,600 | 15,400 | — | |||||||||
| Endeavor Court, Nokomis, FL |
— | 2,300 | — | |||||||||
| Endeavor Court, Nokomis, FL |
— | 6,100 | — | |||||||||
| Technology Park, Nokomis, FL |
— | — | 1,800 | |||||||||
| Sarasota warehouse, Bradenton, FL |
— | — | 48,000 | |||||||||
| Plant and administrative offices, Miami, FL (CGI) |
90,000 | 17,000 | — | |||||||||
| Light manufacturing and storage, Doral, FL (CGI) |
5,000 | — | 30,000 | |||||||||
| Plant and administrative offices, Orlando, FL (WinDoor) |
300,000 | 20,000 | — | |||||||||
| Plant and administrative offices, Miami, FL (CGIC) |
60,000 | 20,000 | — | |||||||||
|
|
|
|
|
|
|
|||||||
| Total square feet |
1,040,600 | 99,400 | 94,800 | |||||||||
|
|
|
|
|
|
|
|||||||
On August 31, 2016, we acquired USI under CGIC. CGIC manufactures our commercial storefront systems products from its approximately 80,000 square foot manufacturing and administrative facility in Miami, Florida. This facility is leased by CGIC through the end of 2018.
We expect to combine the operations of CGI into a new 300,000 square foot leased facility. This new facility is in Hialeah, Florida, and construction is nearly completed. The existing facility lease of CGI was scheduled to expire at the end of 2017 but was extended until the end of March 2018.
On February 16, 2016, we acquired WinDoor. WinDoor manufactures impact-resistant windows and doors from its approximately 320,000 square foot manufacturing and administrative facility in Orlando, Florida. This facility is leased by WinDoor, and it has adequate space for WinDoor’s current level of operating activity, as well as additional room for growth and expansion, if needed. This lease expires in February 2021.
We also own three parcels of undeveloped land in North Venice, Florida, available for any future construction needs we may have.
Our leases discussed above expire between March 2018 and February 2021. The lease for the new 300,000 square foot facility in Hialeah, Florida runs from early 2018 to late 2027. Each of the leases provides for a fixed annual rent. The leases require us to pay taxes, insurance and common area maintenance expenses associated with the properties.
All of our owned properties secure borrowings under our credit agreement. All of these operating facilities are adequate in capacity and condition to service existing customer needs.
| Item 3. | LEGAL PROCEEDINGS |
We are involved in various claims and lawsuits incidental to the conduct of our business in the ordinary course. We carry insurance coverage in such amounts in excess of our self-insured retention as we believe to be reasonable under the circumstances and that may or may not cover any or all of our liabilities in respect of claims and lawsuits. We do not expect that the ultimate resolution of these matters will have a material adverse impact on our financial position, cash flows or results of operations.
- 15 -
Table of Contents
| Item 4. | MINE SAFETY DISCLOSURES |
Not Applicable
| Item 5. | MARKET FOR REGISTRANT’S COMMON EQUITY, RELATED STOCKHOLDER MATTERS AND ISSUER PURCHASES OF EQUITY SECURITIES |
Effective on December 28, 2016, our Common Stock began trading on the New York Stock Exchange under its then existing symbol of “PGTI”. Prior to this change, our Common Stock traded on the NASDAQ Global Market ® under the symbol “PGTI”. On March 9, 2018, the closing price of our Common Stock was $19.40 as reported on the New York Stock Exchange. The approximate number of stockholders of record of our Common Stock on that date was 60, although we believe that the number of beneficial owners of our Common Stock is substantially greater.
The table below sets forth the price range of our Common Stock during the periods indicated:
| High | Low | |||||||
| 2017 |
||||||||
| 1st Quarter |
$ | 12.30 | $ | 10.00 | ||||
| 2nd Quarter |
$ | 13.05 | $ | 10.05 | ||||
| 3rd Quarter |
$ | 14.98 | $ | 12.25 | ||||
| 4th Quarter |
$ | 17.05 | $ | 13.05 | ||||
| High | Low | |||||||
| 2016 |
||||||||
| 1st Quarter |
$ | 11.76 | $ | 8.69 | ||||
| 2nd Quarter |
$ | 11.24 | $ | 9.38 | ||||
| 3rd Quarter |
$ | 12.49 | $ | 10.20 | ||||
| 4th Quarter |
$ | 12.15 | $ | 9.50 | ||||
Dividends
We do not pay a regular dividend. Any determination relating to dividend policy will be made at the discretion of our Board of Directors. The terms of our credit facility currently restrict our ability to pay dividends.
Securities Authorized for Issuance under Equity Compensation Plans
The information required by this item appears in our definitive proxy statement for our annual meeting of stockholders under the caption “Security Ownership of Certain Beneficial Owners and Management” and “Equity Compensation Plan Information,” which information is incorporated herein by reference.
Unregistered Sales of Equity Securities
None.
Issuer Purchases of Equity Securities
None.
- 16 -
Table of Contents
Performance Graph
The following graphs compare the percentage change in PGT Innovations, Inc.’s cumulative total stockholder return on its Common Stock with the cumulative total stockholder return of the NYSE Composite Index, the SPDR S&P Homebuilders ETF, and the Standard & Poor’s Building Products Index over the period from January 1, 2013, to December 31, 2017.
COMPARISON OF 60 MONTH CUMULATIVE TOTAL RETURN
AMONG PGT INNOVATIONS, INC., THE NYSE COMPOSITE INDEX, THE SPDR S&P
HOMEBUILDERS ETF AND THE S&P 500 BUILDING PRODUCTS INDEX
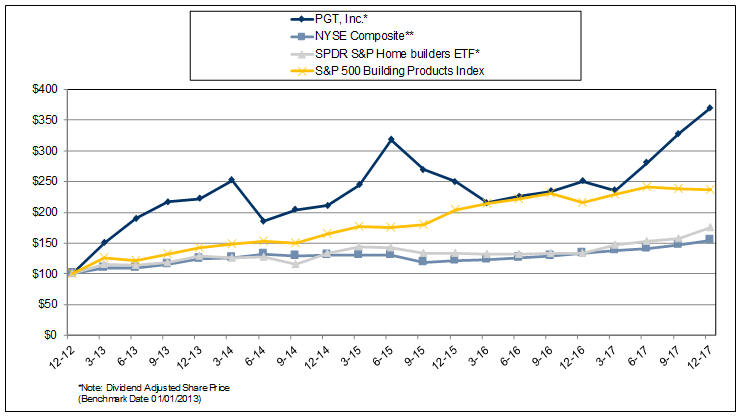
| * | Graph shows returns generated as if $100 were invested on January 1, 2013 for 60 months ending December 31, 2017, in PGTI stock or in the SPDR S&P Homebuilders EFT Fund, which is an exchange-traded fund that seeks to replicate the performance of the S&P Homebuilders Select Industry Index. |
| ** | The Company’s common stock currently trades on the NYSE. As such, the 5-year return comparison is to the NYSE Composite Index. However, prior to December 28, 2016, the Company’s common stock traded on the NASDAQ Global Market. |
- 17 -
Table of Contents
| Item 6. | SELECTED FINANCIAL DATA |
The following table sets forth selected historical consolidated financial information and other data as of and for the periods indicated and have been derived from our audited consolidated financial statements.
All information included in the following tables should be read in conjunction with “Management’s Discussion and Analysis of Financial Condition and Results of Operations” contained in Item 7, and with the consolidated financial statements and related notes in Item 8. All years presented consisted of 52 weeks, except for the year ended January 3, 2015, which consisted of 53 weeks.
| Selected Consolidated Financial Data (in thousands except per share data) |
Year Ended December 30, 2017 |
Year Ended December 31, 2016 |
Year Ended January 2, 2016 |
Year Ended January 3, 2015 |
Year Ended December 28, 2013 |
|||||||||||||||
| Net sales |
$ | 511,081 | $ | 458,550 | $ | 389,810 | $ | 306,388 | $ | 239,303 | ||||||||||
| Cost of sales |
352,097 | 318,452 | 270,678 | 213,596 | 159,169 | |||||||||||||||
|
|
|
|
|
|
|
|
|
|
|
|||||||||||
| Gross profit |
158,984 | 140,098 | 119,132 | 92,792 | 80,134 | |||||||||||||||
| Selling, general and administrative expenses |
98,803 | 83,995 | 68,190 | 56,377 | 54,594 | |||||||||||||||
| Fair value adjustment to contingent consideration (1) |
— | (3,000 | ) | — | — | — | ||||||||||||||
| Gain on sale of assets held (2) |
— | — | — | — | (2,195 | ) | ||||||||||||||
|
|
|
|
|
|
|
|
|
|
|
|||||||||||
| Income from operations |
60,181 | 59,103 | 50,942 | 36,415 | 27,735 | |||||||||||||||
| Interest expense |
20,279 | 20,125 | 11,705 | 5,960 | 3,520 | |||||||||||||||
| Debt extinguishment costs |
— | 3,431 | — | 2,625 | 333 | |||||||||||||||
| Other expense, net (3) |
— | — | 388 | 1,750 | 437 | |||||||||||||||
|
|
|
|
|
|
|
|
|
|
|
|||||||||||
| Income before income taxes |
39,902 | 35,547 | 38,849 | 26,080 | 23,445 | |||||||||||||||
| Income tax expense (benefit) |
63 | 11,800 | 15,297 | 9,675 | (3,374 | ) | ||||||||||||||
|
|
|
|
|
|
|
|
|
|
|
|||||||||||
| Net income |
$ | 39,839 | $ | 23,747 | $ | 23,552 | $ | 16,405 | $ | 26,819 | ||||||||||
|
|
|
|
|
|
|
|
|
|
|
|||||||||||
| Net income per common share: |
||||||||||||||||||||
| Basic |
$ | 0.80 | $ | 0.49 | $ | 0.49 | $ | 0.35 | $ | 0.55 | ||||||||||
| Diluted |
$ | 0.77 | $ | 0.47 | $ | 0.47 | $ | 0.33 | $ | 0.51 | ||||||||||
| Weighted average shares outstanding: |
||||||||||||||||||||
| Basic |
49,522 | 48,856 | 48,272 | 47,376 | 48,881 | |||||||||||||||
| Diluted |
51,728 | 50,579 | 50,368 | 49,777 | 52,211 | |||||||||||||||
| Other financial data: |
||||||||||||||||||||
| Depreciation |
$ | 13,051 | $ | 9,577 | $ | 7,008 | $ | 4,534 | $ | 4,622 | ||||||||||
| Amortization |
6,477 | 6,096 | 3,413 | 1,446 | 6,458 | |||||||||||||||
| As Of December 30, 2017 |
As Of December 31, 2016 (4) |
As Of January 2, 2016 |
As Of January 3, 2015 (4) |
As Of December 28, 2013 |
||||||||||||||||
| Balance Sheet data: |
||||||||||||||||||||
| Cash and cash equivalents |
$ | 34,029 | $ | 39,210 | $ | 61,493 | $ | 42,469 | $ | 30,204 | ||||||||||
| Total assets |
453,119 | 436,648 | 344,028 | 304,587 | 151,800 | |||||||||||||||
| Total debt, including current portion |
212,973 | 247,873 | 190,767 | 191,752 | 75,186 | |||||||||||||||
| Shareholders’ equity |
175,325 | 132,852 | 106,961 | 73,976 | 49,075 | |||||||||||||||
| (1) | Relates to reversal of liability for contingent consideration. See Note 4 under “Acquisition of WinDoor, Inc.”, in Item 8. |
| (2) | Relates to the sale of the Salisbury, NC facility. The net selling price of the facility was approximately $7.5 million and the carrying value of the asset at the time of sale was $5.3 million. |
| (3) | Other expense, net, includes fair value adjustments on derivative financial instruments. |
| (4) | In February 2016, we acquired WinDoor. In September 2014, we acquired CGI. See Note 4 in Item 8. |
- 18 -
Table of Contents
| Item 7. | MANAGEMENT’S DISCUSSION AND ANALYSIS OF FINACIAL CONDITION AND RESULTS OF OPERATIONS |
Our Management’s Discussion and Analysis of Financial Condition and Results of Operations (“MD&A”) should be read in conjunction with our Consolidated Financial Statements and related Notes included in Item 8. We also advise you to read the risk factors in Item 1A. Our MD&A is presented in eight sections:
| • | Executive Overview; |
| • | The Tax Cuts and Jobs Act of 2017; |
| • | Results of Operations; |
| • | Liquidity and Capital Resources; |
| • | Disclosures of Contractual Obligations and Commercial Commitments; |
| • | Critical Accounting Estimates; |
| • | Recently Issued Accounting Standards; and |
| • | Forward Outlook |
EXECUTIVE OVERVIEW
Sales and Operations
Our sales grew to $511.1 million in our 2017 fiscal year, an 11.5% increase when compared to 2016. This increase resulted from increases in sales of our aluminum and vinyl impact-resistant products, which grew by 9.5% and 24.4%, respectively. Driving these results were increases in the sales of our vinyl WinGuard impact-resistant products of 29.7%, and an increase of 5.8% in sales of our aluminum WinGuard products, both as compared to 2016. Since 2014, our vinyl WinGuard products have grown at a compound annual rate of nearly 35 percent. The growth in the sales of our vinyl impact products highlights the shift in our markets towards more energy efficient products and our ability to design attractive and innovative windows and doors to meet those needs. Our sales in 2017 benefitted from a strong fourth quarter, following the unfavorable impact of Hurricane Irma on our financial performance in the third quarter of 2017. We believe our strong fourth quarter performance was due, in part, to the heightened awareness of impact-resistant products as the result of Hurricane Irma, which hit our primary markets in mid-September 2017, and our increased advertising following Hurricane Irma. Our annual sales to the repair and remodel market increased by $44.1 million, or 16.5%, in 2017, as compared to 2016, while new construction sales increased $8.4 million, or 4.4%. By region, our annual sales in Florida increased $46.0 million, or 11.1%, for 2017 compared to 2016, and sales in our out-of-state markets increased $7.0 million, or 24.7%.
Gross profit was $159.0 million for our 2017 fiscal year, which increased 13.5% when compared to 2016. Our gross profit increased primarily due to higher sales volume, but also benefitted from improvements in operational performance, which generated increased efficiencies, and a decrease in scrap rates. Our gross profit also benefitted from product mix and price increases we announced during 2017. However, we saw a return to inflationary conditions in the second half of 2017, including in the cost of aluminum and glass, two of our main materials. For example, the per-pound market cash price of aluminum increased from $0.87 at the beginning of 2017 to $1.11 at the end of the year and $1.12 as of the date of this filing. We increased prices for our products during 2017 to cover these cost increases, but in the future, we may not always be able to offset cost increases we incur by increasing our selling prices.
Selling, general and administrative expenses were $98.8 million for our 2017 fiscal year, which increased $14.8 million compared to 2016. Higher personnel-related costs were the main driver of this increase, including higher incentive-compensation- related costs due to our improved performance. Several other factors contributed to this increase, including higher distribution costs on our higher sales level, as well as costs associated with disruptions to our distribution processes caused by Hurricane Irma, the cost of community outreach activities we undertook to assist those impacted by Irma, and increased advertising costs in the fourth quarter, to promote further awareness of the benefits of our impact-resistant products. Selling, general and administrative expenses also were impacted by the cost of our participation in the 2017 NAHB International Homebuilders Show in Orlando in January 2017, where we unveiled several new products. We expect to continue to invest in a heightened level of advertising in 2018 to further promote, in the post-Irma environment, the benefits of our impact-resistant products. There was also an increase in depreciation expense during 2017 that contributed to the increase in selling, general and administrative expenses as compared to last year.
- 19 -
Table of Contents
Interest expense increased slightly in 2017 compared to 2016. During 2017, we made a total of $40 million in voluntary prepayments of debt, which resulted in non-cash write-offs of deferred lenders fees and discount totaling $1.9 million as additional interest expense. These charges offset the savings generated over prior year from our debt repricing we completed in February 2017, which resulted in a one percentage-point decrease in the margin portion of the interest rate, and lower debt levels from previous prepayments.
Our net income was $39.8 million, an increase of $16.1 million when compared to 2016’s net income of $23.7 million. Our net income benefitted from improved performance, but also from the recognition of the effects of the Tax Cuts and Jobs Act, further described below. In December 2017, we revalued our ending net deferred tax liabilities at December 30, 2017 and recognized a $12.4 million tax benefit in the consolidated statement of operations for the year ended December 30, 2017.
Liquidity and Cash Flow
During 2017, we generated $49.0 million in cash flow from operations, an increase of $2.6 million over last year, which was used to make voluntary prepayments of debt of $40 million, as well as fund working capital needs, and for capital expenditures of $17.8 million. Free cash flow for 2017 was $34 million. Our free cash flow in 2017 benefitted from temporary relief on estimated tax payments given to those Florida businesses affected by Hurricane Irma. Therefore, in January 2018, we made an estimated Federal income tax payment of $9 million relating to the fourth quarter of 2017 estimated payment which was not required to be made until the end of January 2018.
We have consistently executed on our strategy to de-lever after acquisitions as shown by our net debt to adjusted EBITDA ratio at the end of 2017 of 2.2 times, down 35 percent from early 2016. We ended 2017 with solid liquidity, including cash on hand of $34.0 million, down just $5.2 million from the end of 2016. We intend to continue our focus on maintaining a strong consolidated balance sheet that should give us flexibility to make further investments and fund future needs.
On September 22, 2017, we entered into an Asset Purchase Agreement (APA) with Cardinal LG Company (Cardinal) for the sale to Cardinal of certain manufacturing equipment we used in processing glass components for PGT-branded doors for a cash purchase price of $28 million. The APA provided for the transfer of the assets from the Company to Cardinal in two phases, with the first date being in 2017, and the second date in the first quarter of 2018, on or about March 1, 2018. Under the APA, the cash purchase price of $28 million is to be paid by Cardinal to the Company in three separate payments of $3 million on or about the time of the first transfer of the assets to Cardinal, $10 million on or about January 15, 2018, and $15 million at or about the time of the second transfer of assets to Cardinal. On November 1, 2017, Cardinal paid us $3.0 million in cash pursuant to the APA. We expect to receive the remaining $25.0 million in cash proceeds under the APA during the first half of 2018, which we will use to pay-down borrowings under the 2016 Credit Agreement.
THE TAX CUTS AND JOBS ACT OF 2017 (THE ACT)
On December 22, 2017, the President of the United States signed into law the Act. The Act includes significant changes to the U.S. corporate income tax system, including a Federal corporate rate reduction from 35% to 21%, effective January 1, 2018, limitations on the deductibility of interest expense and executive compensation, the elimination of the Section 199 domestic production activities deduction, and further restricting the deductibility of certain already restricted expenses.
The Company uses the asset and liability method of accounting for income taxes. Under this method, deferred tax assets and liabilities are recognized for the future tax consequences attributable to differences between the financial statement carrying amounts of existing assets and liabilities and their respective tax basis. Deferred tax assets and liabilities are measured using enacted tax rates expected to apply to taxable income in the years in which those temporary differences are expected to reverse. As a result of the reduction in the U.S. corporate income tax rate from 35% to 21% under the Act, the Company revalued its ending net deferred tax liabilities at December 30, 2017 and recognized a $12.4 million tax benefit in the Company’s consolidated statement of operations for the year ended December 30, 2017.
The Company has recognized the tax impacts related to the revaluation of deferred tax assets and liabilities and included these amounts in its consolidated financial statements for the year ended December 30, 2017. The ultimate impact may differ from these amounts, possibly materially, due to, among other things, additional analysis, changes in interpretations and assumptions the Company has made, additional regulatory guidance that may be issued, and actions the Company may take as a result of the Act.
- 20 -
Table of Contents
We believe that several of these changes will have impacts on our effective tax rate in 2018, as well as our liquidity. We expect our effective tax rate to benefit from the reduction of the Federal corporate income tax rate, but that our effective tax rate in 2018 will be negatively impacted by the repeal of the Section 199 domestic production activities deduction. At this time, the Company does not believe that the limitations on the deductions for interest expense and executive compensation will impact our effective tax rate. However, we are continuing to evaluate the possible impacts on the Company of the Act and will reflect our expectations of the impact to the Company as a result of the Act in our estimate of our 2018 annual effective tax rate in interim periods in 2018.
RESULTS OF OPERATIONS
Analysis of Selected Items from our Consolidated Statements of Operations
| Year Ended | ||||||||||||||||||||
| December 30, 2017 |
December 31, 2016 |
January 2, 2016 |
Percent Change | |||||||||||||||||
| 2017-2016 | 2016-2015 | |||||||||||||||||||
| (in thousands, except per share amounts) | ||||||||||||||||||||
| Net sales |
$ | 511,081 | $ | 458,550 | $ | 389,810 | 11.5 | % | 17.6 | % | ||||||||||
| Cost of sales |
352,097 | 318,452 | 270,678 | 10.6 | % | 17.6 | % | |||||||||||||
|
|
|
|
|
|
|
|||||||||||||||
| Gross profit |
158,984 | 140,098 | 119,132 | 13.5 | % | 17.6 | % | |||||||||||||
| Gross margin |
31.1 | % | 30.6 | % | 30.6 | % | ||||||||||||||
| SG&A expenses |
98,803 | 83,995 | 68,190 | 17.6 | % | 23.2 | % | |||||||||||||
| SG&A expenses as a percentage of net sales |
19.3 | % | 18.3 | % | 17.5 | % | ||||||||||||||
| Fair value adjustment to contingent consideration |
— | (3,000 | ) | — | ||||||||||||||||
|
|
|
|
|
|
|
|||||||||||||||
| Income from operations |
60,181 | 59,103 | 50,942 | |||||||||||||||||
| Interest expense, net |
20,279 | 20,125 | 11,705 | |||||||||||||||||
| Debt extinguishment costs |
— | 3,431 | — | |||||||||||||||||
| Other expenses, net |
— | — | 388 | |||||||||||||||||
| Income tax expense |
63 | 11,800 | 15,297 | |||||||||||||||||
|
|
|
|
|
|
|
|||||||||||||||
| Net income |
$ | 39,839 | $ | 23,747 | $ | 23,552 | ||||||||||||||
|
|
|
|
|
|
|
|||||||||||||||
| Net income per common share: |
||||||||||||||||||||
| Basic |
$ | 0.80 | $ | 0.49 | $ | 0.49 | ||||||||||||||
|
|
|
|
|
|
|
|||||||||||||||
| Diluted |
$ | 0.77 | $ | 0.47 | $ | 0.47 | ||||||||||||||
|
|
|
|
|
|
|
|||||||||||||||
2017 Compared with 2016
Net sales
Net sales for 2017 were $511.1 million, a $52.5 million, or 11.5%, increase in sales, from $458.6 million in the prior year.
The following table shows net sales classified by major product category (in millions, except percentages):
| Year Ended | ||||||||||||||||||||
| December 30, 2017 | December 31, 2016 | |||||||||||||||||||
| Sales | % of sales | Sales | % of sales | % change | ||||||||||||||||
| Product category: |
||||||||||||||||||||
| Impact-resistant window and door products |
$ | 433.4 | 84.8 | % | $ | 381.6 | 83.2 | % | 13.6 | % | ||||||||||
| Non-impact window and door products |
77.7 | 15.2 | % | 77.0 | 16.8 | % | 0.9 | % | ||||||||||||
|
|
|
|
|
|
|
|
|
|||||||||||||
| Total net sales |
$ | 511.1 | 100.0 | % | $ | 458.6 | 100.0 | % | 11.5 | % | ||||||||||
|
|
|
|
|
|
|
|
|
|||||||||||||
Net sales of our impact window and door products, which include our PGT WinGuard products, as well as all of CGI’s products and the substantial majority of WinDoor’s products, were $433.4 million in 2017, an increase of $51.8 million, or 13.6%, driven by an increase in sales of our WinGuard products, primarily our vinyl WinGuard products. Included in sales of our impact-resistant window and door products for 2017 were $304.4 million of aluminum impact sales, an increase of $26.5 million, or 9.5%, and $129.0 million of vinyl impact sales, an increase of $25.3 million, or 24.4%.
- 21 -
Table of Contents
Sales of our non-impact window and door products increased by $0.7 million, or 0.9%. Included in sales of our non-impact window and door products were $24.9 million of aluminum non-impact sales, a decrease of $2.0 million, or 7.5%, and $52.8 million of vinyl non-impact sales, an increase of $2.7 million, or 5.4%.
Gross profit and gross margin
Gross profit was $159.0 million in 2017, an increase of $18.9 million, or 13.5%, from $140.1 million in the prior year. The gross margin percentage was 31.1% in 2017, compared to 30.6% in the prior year, a percentage-point increase of 0.5%. Adjusting for costs relating to Hurricane Irma, WinDoor leadership and glass supply-chain transition costs, and costs relating to the start-up of our Thermal Plastic Spacer system line incurred in January and February, totaling $2.1 million in 2017, and product line termination costs and costs relating to the start-up of our Thermal Plastic Spacer system line incurred totaling $1.6 million in 2016, the gross margin percentage was 31.5% in 2017, compared to 30.9% in 2016, a percentage-point increase of 0.6%. Gross margin was positively impacted by several factors, including improvements in scrap rates and production efficiencies at our PGT and CGI facilities, and a favorable change in product mix, each of which benefitted gross margin by 0.6%, from price increases announced during 2017, which benefitted gross margin by 0.5%, and a favorable impact on higher sales volume, which benefitted gross margin by 0.3%. These improvements were partially offset by decreases resulting from higher material costs, primarily due to the increase in aluminum prices during 2017, which decreased gross margin by 0.7%, higher depreciation, decreasing margin by 0.6%, and due to WinDoor, which negatively impacted gross margin by 0.1%.
Selling, general and administrative expenses
Selling, general and administrative expenses for 2017 were $98.8 million, an increase of $14.8 million, or 17.6%, from $84.0 million in the prior year. As a percentage of net sales, these costs were 19.3% in 2017, an increase of 1.0% from 18.3% in 2016. Contributing to the increase was a $2.5 million increase in selling and distribution costs as the result of an increase in volume, and due to distribution disruptions caused by Hurricane Irma, as well as increased spending for advertising following Hurricane Irma. There were also increases in personnel-related costs of $6.6 million primarily due to higher accrued incentive costs as a result of the Company’s improved performance. Also contributing to the increase were $1.0 million of costs from our attendance at and participation in the National Association of Home Builders’ International Builders Show in Orlando, Florida in January 2017, $0.9 million in higher depreciation expense on higher recent capital spending, and due to higher bank credit card fees of $0.6 million due to higher credit card collections. Selling, general and administrative expenses also increased due to costs relating to our community outreach activities which we undertook to assist those affected by Irma. The remaining increase in selling, general and administrative expenses is related to an increase in the level of administrative activities.
We record warranty costs as a selling expense within selling, general and administrative expenses. Our warranty expense, as a percentage of sales, decreased during 2017, with an average rate of 2.09%, as compared to an average rate of 2.41% during 2016. The decrease in warranty expense as a percentage of sales was primarily the result of our workforce becoming more seasoned through experience and training. We expect that, as our team members continue to gain in experience, and are exposed to improved training initiatives we have implemented, and as we realize the quality-related benefits of our new thermal plastic spacer (TPS) system, an innovative technology for production of insulated glass, our warranty expense, as a percentage of sales, will further decline. We expect that our warranty risk profile has improved due to the SA we entered into with Cardinal in September 2017, pursuant to which the glass components we purchase from Cardinal are warrantied by Cardinal and, thus, any warranty costs for those glass components will be borne by Cardinal.
Interest expense
Interest expense was $20.3 million in 2017, an increase of $0.2 million from $20.1 million in the prior year. During 2017, we made a total of $40 million voluntary prepayments of borrowings under our 2016 Credit Agreement, which resulted in non-cash write-offs of deferred lenders fees and discount of $1.9 million, classified as interest expense in the accompanying consolidated statement of operations for the year ended December 30, 2017. These charges offset the savings generated over prior year from our debt repricing we completed in February 2017, which resulted in a one percentage-point decrease in the margin portion of the interest rate, and lower debt levels from previous prepayments. Additionally, we saw increases in LIBOR during 2017, which increased the weighted average interest rate we paid during 2017 since the beginning of the year.
- 22 -
Table of Contents
Income tax expense
Our income tax expense was $63 thousand for 2017, representing an effective tax rate of 0.2%. This compares to income tax expense of $11.8 million for 2016, representing an effective tax rate of 33.2%. Income tax expense in 2017, includes a $12.4 million tax benefit due to the revaluation of our ending net deferred tax liabilities at December 30, 2017 as the result of the Act, Income tax expense in 2017 also includes excess tax benefits totaling $1.8 million. We adopted ASU 2016-09 effective on January 1, 2017. As a result, excess tax benefits resulting from the exercise of stock options and lapse of restriction on stock awards are now recognized as a discrete item in tax expense, where previously such tax effects had been recognized in additional paid-in-capital. Income tax expense in 2017 also benefitted from tax credits totaling $0.4 million, including estimated federal income tax credits recognized related to our research and development efforts for 2017, and state incentive tax credits.
Income tax expense in 2016, benefitted from tax credits totaling $1.2 million, including federal income tax credits recognized related to our research and development efforts for tax years 2012 through 2016, and state incentive tax credits.
Excluding the effects of these discrete items in income tax expense, our effective tax rate in 2017 would have been 36.8%, compared to 36.5% in 2016, slightly lower than our combined statutory federal and state tax rate of 38.8%, primarily as the result of the section 199 domestic manufacturing deduction in both years.
2016 Compared with 2015
Net sales
Net sales for 2016 were $458.6 million, a $68.8 million, or 17.6%, increase in sales, from $389.8 million in the prior year.
The following table shows net sales classified by major product category (in millions, except percentages):
| Year Ended | ||||||||||||||||||||
| December 31, 2016 | January 2, 2016 | |||||||||||||||||||
| Sales | % of sales | Sales | % of sales | % change | ||||||||||||||||
| Product category: |
||||||||||||||||||||
| Impact-resistant window and door products |
$ | 381.6 | 83.2 | % | $ | 319.2 | 81.9 | % | 19.6 | % | ||||||||||
| Non-impact window and door products |
77.0 | 16.8 | % | 70.6 | 18.1 | % | 8.9 | % | ||||||||||||
|
|
|
|
|
|
|
|
|
|||||||||||||
| Total net sales |
$ | 458.6 | 100.0 | % | $ | 389.8 | 100.0 | % | 17.6 | % | ||||||||||
|
|
|
|
|
|
|
|
|
|||||||||||||
Net sales of our impact window and door products, which include our PGT WinGuard products, as well as all of CGI’s products and the substantial majority of WinDoor’s products, were $381.6 million in 2016, an increase of $62.4 million, or 19.6%, driven by an increase in sales of our WinGuard products, primarily our vinyl WinGuard products, and also the inclusion of WinDoor’s impact sales of $37.0 million during the post-acquisition period in 2016. Included in sales of our impact-resistant window and door products were $277.9 million of aluminum impact sales, an increase of $30.4 million, or 12.3%, and $103.7 million of vinyl impact sales, an increase of $32.0 million, or 44.6%.
Sales of our non-impact window and door products increased by $6.4 million, or 8.9%, including $1.2 million from WinDoor. Included in sales of our non-impact window and door products were $26.9 million of aluminum non-impact sales, a decrease of $0.1 million, or 0.6%, and $50.1 million of vinyl non-impact sales, an increase of $6.5 million, or 14.8%.
Gross profit and gross margin
Gross profit was $140.1 million in 2016, an increase of $21.0 million, or 17.6%, from $119.1 million in the prior year. The gross margin percentage was 30.6% in 2016, unchanged compared to the prior year. Adjusting for costs relating to product line relocations and terminations, and installation of our two new TPS system glass lines in 2016 totaling $1.6 million, and costs related to our ERP systems conversion, new product launch costs, and glass line installation in 2015 totaling $5.1 million, gross margin was 30.9% in 2016, compared to 31.9% in 2015, respectively, representing a decrease of 1.0%. Gross margin was positively impacted by several factors, including the addition of WinDoor, which benefitted gross margin by 0.3%, lower aluminum prices, which benefitted gross margin by 0.3%, and price increases during 2016, which benefitted gross margin by 0.2%. These improvements were offset by decreases as the result of higher overhead costs as we continued to maintain support costs at WinDoor and CGI during the luxury market softness in 2016 in anticipation of the expected return of the high-end market, resulting in a margin decrease of 0.6%, product mix, which decreased gross margin by 0.5%, higher depreciation, decreasing margin by 0.5%, and scrap and inefficiencies, having a 0.2% impact.
- 23 -
Table of Contents
Selling, general and administrative expenses
Selling, general and administrative expenses were $84.0 million, an increase of $15.8 million, or 23.2%, from $68.2 million in the prior year. As a percentage of net sales, these costs were 18.3%, an increase of 0.8% from 17.5% from fiscal year 2015. Selling, general, and administrative expenses includes $7.8 million related to WinDoor. Excluding WinDoor, selling, general and administrative costs increased $8.0 million. Contributing to the increase was a $4.8 million increase in selling and distribution costs as the result of an increase in volume, which is partially offset by a $0.2 million decrease in fuel costs due to a lower average price of gasoline. There were also increases in personnel-related costs of $2.6 million due to an increase in the Company’s 401K contribution for 2016, compared to 2015, and due to higher indirect labor costs on higher volume, bank credit card fees of $0.5 million due to higher credit card collections, and of $1.2 million related to higher acquisition-related costs incurred in 2016, as compared to 2015 during which there was no acquisition activity. These increases were partially offset by decreases in marketing costs, and other general and administrative costs totaling approximately $1.1 million.
We record warranty costs as a selling expense within selling, general and administrative expenses. Our warranty expense, as a percentage of sales, increased during our 2016 fiscal year, with an average rate of 2.41%, as compared to an average rate of 2.12% for fiscal year 2015. The increases in warranty expense were the result of a significant increase in the number of new manufacturing employees we have hired to support our growth over the recent past. Those employees did not have the level of experience and training as our more seasoned employees. We expect that, as those relatively newer employees gain more experience over time and are exposed to improved training initiatives we have implemented, combined with the use of our new thermal plastic spacer system, an innovative technology for the production of insulated glass, warranty expense, as a percentage of sales, will decline from current levels.
Fair Value Adjustment to Contingent Consideration
The stock purchase agreement for the acquisition of WinDoor provided for the potential for an earn-out contingency payment to sellers had WinDoor achieved a certain level of sales in the calendar year ended December 31, 2016. The potential undiscounted amount of all future payments that could be required to be paid under the contingent earn-out consideration arrangement was between $0 and $3.0 million. We had recorded an earn-out contingency liability of $3.0 million on the closing date, which represented its then estimated fair value using undiscounted cash flows, based on probability adjusted level of revenues with a range whose minimum was $51.0 million. Based on revised estimates using actual sales through the end of the 2016 third quarter, we concluded the probability was remote that WinDoor’s actual sales for 2016 would reach the $46.0 million minimum level required for the minimum payment of $2.7 million possible under the earn-out contingency arrangement and, therefore, determined that the entire initial estimated fair value of $3.0 million should be reversed.
Interest expense
Interest expense was $20.1 million in 2016, an increase of $8.4 million from $11.7 million in the prior year. During 2016, concurrent with the acquisition of WinDoor in the middle of the first quarter of 2016, we refinanced our then existing credit agreement into the 2016 Credit Agreement, a $270.0 million senior secured credit facility, which increased our outstanding debt balance to $270.0 million, from $197.5 million at the end of 2015. The increase in interest expense was due primarily to the increase in outstanding debt under the new credit facility and resulting increase in average outstanding debt balance during 2016, compared to 2015, as well as an increase in the stated rate under the 2016 Credit Agreement. Interest expense is also being affected by higher amortization of deferred financing costs and discount. We accelerated the amortization of lenders fees and discount of $0.2 million relating to the term-loan portion of the 2016 Credit Agreement as the result of the voluntary prepayment of $4.0 million we made on September 30, 2016, which is included in interest expense in the accompanying consolidated statement of operations for the year ended December 31, 2016.
Effective on February 17, 2017, we repriced the term loan portion of the 2016 Credit Agreement, which resulted in a one percentage-point decrease in the stated rate.
Debt Extinguishment Costs
Debt extinguishment costs were $3.4 million in 2016. These costs related to the write-off of deferred financing costs and debt discount in connection with entering into the 2016 Credit Agreement effective on February 16, 2016, which resulted in certain then existing lenders exiting the facility, and certain continuing lenders being considered debt extinguishments in the refinancing. This resulted in the write-offs of portions of the deferred financing costs and original issue discount allocated to these lenders.
- 24 -
Table of Contents
Other expenses, net
Other expenses, net, were $0.4 million in 2015. Other expenses relate entirely to the ineffective portion of our aluminum hedging activities.
Income tax expense
Our income tax expense was $11.8 million for 2016, representing an effective tax rate of 33.2%. Income tax expense in 2016, benefitted from tax credits totaling $1.2 million, including federal income tax credits recognized related to our research and development efforts for tax years 2012 through 2016, and state incentive tax credits.
Income tax expense in 2015 includes a $1.6 million discrete item of income tax expense representing income tax expense previously classified within accumulated other comprehensive losses, relating to the intraperiod income taxes on our effective aluminum hedges, which we reversed in the second quarter of 2015 as the result of the culmination of our remaining cash flow hedges. Income tax expense in 2015 also includes the beneficial effect of $0.8 million, net of federal effect, from a Florida jobs credit we received as the result of our increased employment levels.
Excluding the effects of these discrete items in income tax expense, our effective tax rate in 2016 would have been 36.5%, compared to 37.3% in 2015, slightly lower than our combined statutory federal and state tax rate of 38.8%, primarily as the result of the section 199 domestic manufacturing deduction in both years.
LIQUIDITY AND CAPITAL RESOURCES
Our principal source of liquidity is cash flow generated by operations, supplemented by borrowings under our credit facility. This cash generating capability provides us with financial flexibility in meeting operating and investing needs. Our primary capital requirements are to fund working capital needs, and to meet required debt payments, including debt service payments on our credit facilities and fund capital expenditures.
Consolidated Cash Flows
Operating activities. Cash provided by operating activities was $49.0 million for 2017, compared to $46.4 million for 2016.
The increase in cash flows from operations of $2.6 million in 2017 was primarily due to an increase of $42.5 million in collections from customers as the result of increased sales. This increase in collections was partially offset by an increase in payments to vendors of $34.6 million as the result of higher procurements of inventory due to increased sales, an increase in personnel related disbursements of $8.8 million due to the higher level of employees during 2017, compared to 2016 to support the increase in demand for our products, and an increase in debt service costs of $0.3 million, primarily as the result of an increase in LIBOR during 2017, partially offset by lower debt levels from voluntary debt prepayments made during 2017, and a one percentage-point decrease in our margin from the February 2017 refinancing. Also, in 2017 compared to last year, net tax payments decreased $2.2 million, A federal and state income tax liability of $6.5 million was included in accrued liabilities in the accompanying consolidated balance sheet at December 30, 2017, primarily as the result of our ability to defer our fourth quarter 2017 estimated payment due to the extension of time to January 2018 to make that payment pursuant to the IRS extension of time for companies affected by Hurricane Irma. Other collections of cash and other cash activity, net, increased by $1.6 million.
The increase in cash flows from operations of $13.9 million in 2016 was primarily due to an increase of $73.9 million in collections from customers as the result of increased sales. This increase in collections was partially offset by an increase in payments to vendors of $46.5 million as the result of higher procurements of inventory due to increased sales, an increase in personnel related disbursements of $14.0 million due to the higher level of employees during 2016, compared to 2015 to support the increase in demand for our products, and an increase in debt service costs of $4.5 million due to the higher level of debt as the result of the refinancing and acquisition of WinDoor. The refinancing also resulted in a higher stated interest rate, increasing the rate on the term loan portion of our borrowings to 6.75% under the 2016 Credit Agreement, from 5.25% under the 2014 Credit Agreement. However, in February 2017, we repriced this facility resulting in a one-percentage point decrease in the margin. Also, in 2016 compared to 2015, net tax payments decreased $4.6 million, and other collections of cash and other cash activity, net, increased by $0.4 million. A federal income tax receivable of $2.6 million was included in other current assets on the accompanying consolidated balance sheet at December 31, 2016. The overpayment of estimated income taxes in 2016 was due in part to the unanticipated benefit of research and development activities credits of approximately $1.0 million, as well as lower actual pre-tax book income than used in our estimate of taxable income for the year.
- 25 -
Table of Contents
Direct cash flows from operations for 2017, 2016, and 2015 are presented below:
| Direct Operating Cash Flows | ||||||||||||
| (in millions) | 2017 | 2016 | 2015 | |||||||||
| Collections from customers |
$ | 507.2 | $ | 464.7 | $ | 390.8 | ||||||
| Other collections of cash |
5.2 | 3.8 | 3.6 | |||||||||
| Disbursements to vendors |
(312.5 | ) | (277.9 | ) | (231.4 | ) | ||||||
| Personnel related disbursements |
(134.7 | ) | (125.9 | ) | (111.9 | ) | ||||||
| Debt service costs |
(16.3 | ) | (16.0 | ) | (11.5 | ) | ||||||
| Income tax payments, net |
— | (2.2 | ) | (6.8 | ) | |||||||
| Other cash activity, net |
0.1 | (0.1 | ) | (0.3 | ) | |||||||
|
|
|
|
|
|
|
|||||||
| Cash from operations |
$ | 49.0 | $ | 46.4 | $ | 32.5 | ||||||
|
|
|
|
|
|
|
|||||||
The majority of other collections of cash are from scrap aluminum sales.
Day’s sales outstanding (DSO), which we calculate as accounts receivable divided by average daily sales, was 38 days on December 30, 2017, compared to 33 days on December 31, 2016, and 36 days on January 2, 2016. The increase in DSO’s in 2017 from 2016 was due to negatively impacted by Irma, which caused disruptions to our customers’ invoice-payment activities resulting in an increase in our average accounts receivable, as well as due to higher DSO’s at WinDoor, whose customers have generally been extending payments. The decrease in DSO’s in 2016 from 2015 was due to a reduction in larger, longer-payment termed projects at CGI.
Inventory on hand as of December 30, 2017, was $37.8 million, an increase of $7.3 million from December 30, 2016. The increase was due primarily to our decision to hold higher levels of raw materials as we continued to respond to the increase in demand for our products in the fourth quarter of 2017, which has carried over into the first quarter of 2018. Inventory on hand as of December 31, 2016, was $30.5 million, an increase of $7.5 million from January 2, 2016. The increase was due primarily to the acquisitions of WinDoor and US Impact Systems, which included combined inventories of $7.3 million. Our inventory consists principally of raw materials purchased for the manufacture of our products and limited finished goods inventory as all products are custom, made-to-order products. Our inventory levels are more closely aligned with our number of product offerings rather than our level of sales. We have maintained our inventory level to have (i) raw materials required to support new product launches; (ii) a sufficient level of safety stock on certain items to ensure an adequate supply of material in the event of a sudden increase in demand and given our short lead-times; and (iii) adequate lead times for raw materials purchased from overseas suppliers in bulk supply. Inventory turns for the year ended December 30, 2017, was 10.3 times, lower than 11.9 times for the year ended January 2, 2016. This decrease reflects our improved performance during 2017, as well as improvements in inventory management. Inventory turns for the year ended December 31, 2016, was 11.9 times, which decreased slightly from 12.6 times for the year ended January 2, 2016. On average, we turn our inventories approximately once per month.
Management monitors and evaluates raw material inventory levels based on the need for each discrete item to fulfill short-term requirements calculated from current order patterns and to provide appropriate safety stock. Because all our products are made-to-order, we have only a small amount of finished goods and work in progress inventory. Due to these factors, we believe our inventories are not excessive, and we expect the value of such inventories will be realized.
Investing activities. Cash used in investing activities was $14.7 million in 2017, compared to $119.0 million in 2016, a decrease in cash used of $104.3 million. We used $101.3 million of cash to acquire businesses in 2016, whereas in 2017 we had no acquisitions. Also, in 2017, we used cash of $17.8 million for capital expenditures, compared to $17.7 million in 2016, an increase of $0.1 million in cash used. Finally, in 2017, we received proceeds of $3.1 million from the sales of property, plant and equipment, which includes $3.0 million in cash proceeds received from Cardinal in November 2017 relating to the terms of the APA, pursuant to which we sold certain door glass manufacturing assets to Cardinal. Cash proceeds from sales of property, plant and equipment in 2016 were insignificant.
Cash used in investing activities was $119.0 million in 2016, compared to $17.4 million in 2015, an increase in cash used of $101.6 million. We used $101.3 million of cash to acquire businesses in 2016, whereas in 2015 we had no acquisitions. Also, in 2016, we used cash of $17.7 million for capital expenditures, compared to $17.4 million in 2015, an increase of $0.3 million in cash used.
Financing activities. Cash used by financing activities was $39.5 million in 2017, compared with cash provided of $50.3 million in 2016, a decrease in cash provided of $89.8 million. Cash used for repayments of long-term debt in 2017 was $40.1 million, including voluntary prepayments of borrowings under the 2016 Credit Agreement totaling $40.0 million made during 2017, compared
- 26 -
Table of Contents
to $203.5 million in 2016, a decrease in cash used of $163.4 million. The February 2016 refinancing resulted in $261.0 million in net proceeds from the issuance of long-term debt. In addition, we made payments of financing costs of $7.2 million related to the 2016 refinancing. Purchases of treasury stock were $0.3 million in 2017, versus $2.8 million in 2016, a decrease in cash used of $2.5 million. Proceeds from the exercises of stock options were nearly $0.1 million lower, and there was a decrease in excess tax benefits from option exercises of $1.9 million as a result of our adoption of ASU 2016-09, which eliminated the offsetting classifications of excess tax benefits as both operating and financing cash flows.
Cash provided by financing activities was $50.3 million in 2016, compared with just over $3.9 million in 2015, an increase of $46.4 million. Cash used for repayments of long-term debt in 2016 was $203.5 million, compared to just $2.0 million in 2015, an increase in cash used of $201.5 million. Cash used for payments of long-term debt of $203.5 million in 2016 was the result of the February 2016 refinancing and contemporaneous pay-down of $197.5 million of our then existing credit facility. Since the refinancing, $2.0 million has been repaid as scheduled debt repayments in 2016, compared to $2.0 million in 2015. In addition, we made a voluntary prepayment of $4.0 million on September 30, 2016.
The February 2016 refinancing resulted in $261.0 million in net proceeds from the issuance of long-term debt. In addition, we made payments of financing costs of $7.2 million related to the 2016 refinancing. Purchases of treasury stock were $2.8 million in 2016, versus just $44 thousand in 2015, an increase in cash used of $2.8 million. Proceeds from the exercises of stock options were $1.2 million lower in 2016, compared to 2015, and there was a decrease in excess tax benefits from option exercises of $1.9 million.
Capital Expenditures. Capital expenditures vary depending on prevailing business factors, including current and anticipated market conditions. In 2017, we continued to invest in our long-term future by spending $17.8 million for capital expenditures, primarily representing equipment purchases for the various glass processing lines in our glass processing facility. In 2016, we spent $17.7 million on capital expenditures as we continued to equip our glass processing facility, including the additions of two then new TPS system glass lines. Management expects to spend between $18 million and $20 million for capital expenditures in 2018, including the buildout improvements we expect to make to our new, leased facility in Miami, Florida in early 2018. Our capital expenditure program is geared towards making investments in capital assets targeted at increasing both gross sales and margins, but also includes capital expenditures for maintenance capital.
Capital Resources and Debt Covenants
2016 Credit Agreement
On February 16, 2016, we entered into the 2016 Credit Agreement, among us, the lending institutions identified in the 2016 Credit Agreement, and Deutsche Bank AG New York Branch, as Administrative Agent and Collateral Agent. The 2016 Credit Agreement establishes new senior secured credit facilities in an aggregate amount of $310.0 million, consisting of a $270.0 million Term B term loan facility maturing in February 2022 that will amortize on a basis of 1% annually during the six-year term, and a $40.0 million revolving credit facility maturing in February 2021 that includes a swing line facility and a letter of credit facility. Our obligations under the 2016 Credit Agreement are secured by substantially all of our assets as well as our direct and indirect subsidiaries’ assets. As of December 30, 2017, there were $0.2 million of letters of credit outstanding and $39.8 million available on the revolver.
Interest on all loans under the 2016 Credit Agreement is payable either quarterly or at the expiration of any LIBOR interest period applicable thereto. Borrowings under the term loans and the revolving credit facility accrue interest at a rate equal to, at our option, LIBOR (with a floor of 100 basis points in respect of the term loan), or a base rate (with a floor of 200 basis points in respect of the term loan) plus an applicable margin. During 2016, the applicable margin was 575 basis points in the case of LIBOR and 475 basis points in the case of the base rate. However, due to our repricing of this facility in February 2017, these rates have been decreased to 475 basis points in the case of LIBOR and 375 basis points in the case of the base rate. We pay quarterly fees on the unused portion of the revolving credit facility equal to 50 basis points per annum as well as a quarterly letter of credit fee at 575 basis points per annum plus a 12.5 basis point facing fee per annum on the face amount of any outstanding letters of credit.
The face value of the 2016 Credit Agreement at the time of issuance was $270.0 million of which $2.0 million has been repaid as scheduled debt repayments through December 31, 2016. In addition, we made a voluntary prepayment of $4.0 million on September 30, 2016, using internally generated cash on hand. During 2017, we made additional voluntary prepayments totaling $40.0 million. We elected to apply the prepayments against upcoming required principal repayments in direct order of maturity, as permitted under the 2016 Credit Agreement, resulting in no required repayments of principal until the maturity of the facility in February 2022. As of December 30, 2017, the face value of debt outstanding under the 2016 Credit Agreement was $224.0 million, and accrued interest was $1.0 million.
- 27 -
Table of Contents
The Company incurred third-party fees and costs totaling $1.5 million, and additional lender fees and discount of $14.6 million in the February 2016 refinancing. As a result of the voluntary prepayments of debt discussed above, we accelerated the amortization of lenders fees and discount relating to the term-loan portion of the 2016 Credit Agreement of $0.2 million in 2016, and of $1.9 million in 2017, which are included in interest expense in the accompanying consolidated statement of operations for the years ended December 31, 2016, and December 30, 2017, respectively.
The activity relating to third-party fees and costs, lender fees and discount for the year ended December 30, 2017, are as follows. All debt-related fees, costs and original issue discount are classified as a reduction of the carrying value of long-term debt:
| (in thousands) | Total | |||
| At beginning of year |
$ | 16,102 | ||
| Amortization expense through February 17, 2017 |
(359 | ) | ||
|
|
|
|||
| At time of refinancing |
15,743 | |||
| Less: Amortization expense after repricing |
(2,394 | ) | ||
| Less: Accelerated amortization relating to debt prepayment |
(1,889 | ) | ||
|
|
|
|||
| At end of year |
$ | 11,460 | ||
|
|
|
|||
Estimated amortization expense relating to third-party fees and costs, lender fees and discount for the years indicated, as of December 30, 2017, is as follows:
| (in thousands) | Total | |||
| 2018 |
$ | 2,583 | ||
| 2019 |
2,754 | |||
| 2020 |
2,996 | |||
| 2021 |
2,775 | |||
| 2022 |
352 | |||
|
|
|
|||
| Total |
$ | 11,460 | ||
|
|
|
|||
As a result of voluntary prepayments of $4.0 million in 2016, and $40.0 million in 2017, as previously mentioned, our next scheduled repayment is not until the maturity of the facility in February 2022. The contractual future maturities of long-term debt outstanding, including other debt relating to our software license financing arrangement, as of December 30, 2017, are as follows (at face value):
| (in thousands) | Total | |||
| 2018 |
$ | 294 | ||
| 2019 |
164 | |||
| 2020 |
— | |||
| 2021 |
— | |||
| 2022 |
223,975 | |||
|
|
|
|||
| Total |
$ | 224,433 | ||
|
|
|
|||
The 2016 Credit Agreement contains a springing financial covenant, if we draw in excess of twenty percent (20%) of the revolving facility, which requires us to maintain a maximum total net leverage ratio (based on the ratio of total debt for borrowed money to EBITDA, each as defined in the 2016 Credit Agreement), and is tested quarterly based on the last four fiscal quarters and is set at levels as described in the 2016 Credit Agreement. As of December 30, 2017, no test is required as we have not exceeded 20% of our revolving capacity. During 2016, the maximum permitted total net leverage ratio as stated in the 2016 Credit agreement is 4.50:1. We believe that our total net leverage ratio is in compliance with the 2016 Credit Agreement, and that we are in compliance with all covenants.
The 2016 Credit Agreement also contains a number of affirmative and restrictive covenants, including limitations on the incurrence of additional debt, liens on property, acquisitions and investments, loans and guarantees, mergers, consolidations, liquidations and dissolutions, asset sales, dividends and other payments in respect of our capital stock, prepayments of certain debt and transactions with affiliates. The 2016 Credit Agreement also contains customary events of default. Upon the occurrence of an event of default, the amounts outstanding under the 2016 Credit Agreement may be accelerated and may become immediately due and payable. As of December 30, 2017, we were in compliance with all affirmative and restrictive covenants.
- 28 -
Table of Contents
Long-term debt consists of the following:
| December 30, | December 31, | |||||||
| 2017 | 2016 | |||||||
| (in thousands) | ||||||||
| Term loan payable with a payment of $0.675 million due quarterly. A lump sum payment of $253.8 million due on February 15, 2022. Interest payable quarterly at LIBOR or the prime plus an applicable margin. At December 30, 2017, the average rate is 1.46% plus a margin of 4.75%. At December 31, 2016, the average rate was 1.00% plus a margin of 5.75%. (1) |
$ | 223,975 | $ | 263,975 | ||||
| Other debt (2) |
458 | — | ||||||
| Fees, costs and original issue discount (3) |
(11,460 | ) | (16,102 | ) | ||||
|
|
|
|
|
|||||
| 212,973 | 247,873 | |||||||
| Less current portion of long-term debt (2) |
(294 | ) | — | |||||
|
|
|
|
|
|||||
| Long-term debt, less current portion |
$ | 212,679 | $ | 247,873 | ||||
|
|
|
|
|
|||||
| (1) | Effective on February 17, 2017, the Company amended and repriced this term loan. Terms of the repriced facility include a one percentage-point reduction in the stated interest rate, to LIBOR of 1.00% plus a margin of 4.75%. The amended term loan facility has quarterly payments of principal of $0.675 million, with a lump sum payment of $253.8 million due February 15, 2022, each of which remained unchanged from the prior facility. |
| (2) | In July 2017, we entered into a two-year financing arrangement for the purchase of an enterprise-wide software license relating to office productivity software. This financing arrangement requires 24 monthly payments of $26 thousand each. We estimated the value of this financing arrangement to be $590 thousand, using an imputed annual interest rate of 6.00%, which approximates our borrowing rate under the 2016 Credit Agreement, a Level 3 input. |
| (3) | Fees, costs and original issue discount – represents third-party fees, lender fees, other debt-related costs, and original issue discount, recorded as a reduction of the carrying value of the debt pursuant to ASU 2015-03, and is amortized over the life of the debt instrument. |
DISCLOSURES OF CONTRACTUAL OBLIGATIONS AND COMMERCIAL COMMITMENTS
The following summarizes our contractual obligations as of December 30, 2017 (in thousands):
| Payments Due by Period | ||||||||||||||||||||
| Contractual Obligations |
Total | Current | 2-3 Years | 4-5 Years | Thereafter | |||||||||||||||
| Long-term debt (1) |
$ | 282,044 | $ | 14,063 | $ | 28,127 | $ | 239,854 | $ | — | ||||||||||
| Operating leases |
31,591 | 4,884 | 8,501 | 5,065 | 13,141 | |||||||||||||||
| Supply agreements |
6,126 | 6,126 | — | — | — | |||||||||||||||
| Tenant improvement commitments |
1,754 | 1,754 | — | — | — | |||||||||||||||
| Equipment purchase commitments |
1,237 | 1,237 | — | — | — | |||||||||||||||
|
|
|
|
|
|
|
|
|
|
|
|||||||||||
| Total contractual cash obligations |
$ | 322,752 | $ | 28,064 | $ | 36,628 | $ | 244,920 | $ | 13,141 | ||||||||||
|
|
|
|
|
|
|
|
|
|
|
|||||||||||
| (1) | - Includes estimated future interest expense on our long-term debt at a weighted-average interest rate of 6.21% as of December 30, 2017, which includes a weighted-average base rate of 1.46% and a margin of 4.75%. |
The amounts reflected in the table above for operating leases represent future minimum lease payments under non-cancelable operating leases with an initial or remaining term in excess of one year at December 30, 2017. Purchase orders entered into in the ordinary course of business are excluded from the above table. Amounts for which we are liable are reflected on our consolidated balance sheet as accounts payable and accrued liabilities.
We are obligated to purchase certain raw materials used in the production of our products from certain suppliers pursuant to stocking programs. If all of these programs were cancelled by us, as of December 30, 2017, we would be required to pay $6.1 million for various materials.
- 29 -
Table of Contents
At December 30, 2017, we had a commitment to make tenant improvements relating to our new, leased facility in Miami, Florida, of $1.8 million.
At December 30, 2017, we had $0.2 million in standby letters of credit related to our worker’s compensation insurance coverage, and commitments to purchase equipment of $1.2 million.
CRITICAL ACCOUNTING ESTIMATES
In preparing our consolidated financial statements, we follow U.S. generally accepted accounting principles. These principles require us to make certain estimates and apply judgments that affect our financial position and results of operations.
On a regular basis, we review the accounting policies, assumptions, estimates and judgments to ensure that our consolidated financial statements are presented fairly and in accordance with GAAP. However, because future events and their effects cannot be determined with certainty, actual results could differ from our assumptions and estimates, and such difference could be material. Our significant accounting policies are discussed in Item 8, Note 2. The following is a summary of our more significant accounting estimates that require the use of judgment in preparing the financial statements.
| Description |
Judgments and Uncertainties |
Effect if Actual Results Differ from Assumptions | ||
| Indefinite Lived Intangibles |
||||
| The impairment evaluation of the carrying amount of intangible assets with indefinite lives (which for us is our trade names) is conducted annually, or more frequently, if events or changes in circumstances indicate that an asset might be impaired. We have the option of performing a qualitative assessment of impairment to determine whether any further quantitative testing for impairment is necessary. If we elect to bypass the qualitative assessment or if we determine, based on qualitative factors, that it is more likely than not that the fair value of our trade names is less than the carrying amount, an evaluation is performed by comparing the carrying amount of these assets to their estimated fair values. If the estimated fair value is less than the carrying amount of the intangible asset, then an impairment charge is recorded to reduce the asset to its estimated fair value. The estimated fair value is determined using the relief from royalty method that is based upon the discounted projected cost savings (value) attributable to ownership of our trade names, our only indefinite lived intangible assets. | In estimating fair value, the method we use requires us to make assumptions, the most material of which are sales projections attributable to products sold with these trade names, the anticipated royalty rate we would pay if the trade names were not owned (as a percent of sales), and a weighted average discount rate. These assumptions are subject to change based on changes in the markets in which these products are sold, which impact our projections of future sales and the assumed royalty rate. Factors affecting the weighted average discount rate include assumed debt to equity ratios, risk-free interest rates and equity returns, each for market participants in our industry.
We completed a qualitative assessment of our indefinite-lived intangible assets (trade names) on the first day of our fourth quarter of 2017. This qualitative assessment included an evaluation of relevant events and circumstances that existed at the date of our assessment. Those events and circumstances included conditions specific to our trade names, such as the inputs that would be used to calculate their fair values, as well as events and circumstances related to the trade names, such as the industry in which we use the trade names, our competitive environment, the availability and costs of its raw materials and labor, the financial performance of our Company, and factors |
Actual results can differ from our estimates, requiring adjustments to our assumptions. The result of these changes could result in a material change in our calculation and an impairment of our trade names.
If our WinDoor brand does not perform to the levels expected in this most recent quantitative assessment of fair value, the WinDoor trade name is at a higher degree of risk for future impairment. | ||
- 30 -
Table of Contents
| Description |
Judgments and Uncertainties |
Effect if Actual Results Differ from Assumptions | ||
| related to the markets in which our Company operates. We also considered that, for our PGT and CGI trade names, no new impairment indicators were identified since the date of our prior assessments, which was a quantitative assessment for the PGT trade names and a qualitative assessment for the CGI trade name. Based on that assessment, we concluded that it is more likely than not that our PGT and CGI tradenames are not impaired.
In evaluating our WinDoor trade name as of the first day of the fourth quarter of 2017, we elected to bypass the qualitative assessment and perform a quantitative assessment.
The following table highlights the sensitivities of the WinDoor trade name as of December 30, 2017 (in thousands): |
| WinDoor | ||||
| Tradename | ||||
| Carrying value |
$ | 18,400 | ||
|
|
|
|||
| Approximate amount that a one percentage-point increase in the discount rate and a 5% decrease in cash flows would cause the carrying value to exceed the fair value and trigger an impairment |
$ | 2,600 | ||
|
|
|
|||
RECENTLY ISSUED ACCOUNTING STANDARDS
In August 2017, the FASB issued ASU 2017-12, “Derivatives and Hedging (Topic 815): Targeted Improvements to Accounting for Hedging Activities.” The amendments under ASU 2017-12 refine and expand hedge accounting requirements for both financial (e.g., interest rate) and commodity risks. Its provisions create more transparency around how economic results are presented, both on the face of the financial statements and in the footnotes. It also makes certain targeted improvements to simplify the application of hedge accounting guidance. ASU 2017-12 becomes effective for us in the first quarter of 2019. We may early-adopt the provisions of ASU 2017-12, but we do not expect the adoption of this guidance to have a significant effect on the Company’s consolidated financial statements.
In February 2017, the FASB issued ASU 2017-05, “Other Income - Gain and Losses from the Derecognition of Nonfinancial Assets.” ASU 2017-05 clarifies the scope of Subtopic 610-20, Other Income - Gains and Losses from the Derecognition of Nonfinancial Assets and adds guidance for partial sales of nonfinancial assets. Subtopic 610-20, which was issued in May 2014 as a part of ASU 2014-09, provides guidance for recognizing gains and losses from the transfer of nonfinancial assets in contracts with non-customers. This update is effective at the same time as the amendments in ASU 2014-09, therefore, for our fiscal year beginning after December 15, 2017, and may be applied either under a full- or modified-retrospective basis. We do not expect the adoption of this guidance to have a significant effect on the Company’s consolidated financial statements.
- 31 -
Table of Contents
In January 2017, the FASB issued ASU 2017-01, “Business Combinations (Topic 805) – Clarifying the Definition of a Business.” ASU 2017-01 affects all companies and other reporting organizations that must determine whether they have acquired or sold a business. The definition of a business affects many areas of accounting including acquisitions, disposals, goodwill, and consolidation. The amendments are intended to help companies and other organizations evaluate whether transactions should be accounted for as acquisitions (or disposals) of assets or businesses. ASU 2017-01 provides a more robust framework to use in determining when a set of assets and activities is a business. It also provides more consistency in applying the guidance, reduces the costs of application, and makes the definition of a business more operable. This update is effective for our fiscal year beginning after December 15, 2017, including interim periods therein. We do not expect adoption of this guidance to have a significant effect on the Company’s consolidated financial statements.
In August 2016, the FASB issued ASU 2016-15, “Statement of Cash Flows (Topic 230): Classification of Certain Cash Receipts and Cash Payments (a consensus of the Emerging Issues Task Force).” ASU 2016-15 reduces diversity in practice in how certain transactions are classified in the statement of cash flows. The new standard will become effective for the Company beginning with the first quarter of 2018, with early adoption permitted. We do not expect the adoption of this guidance to have a material impact on the Company’s consolidated financial statements.
In June 2016, the FASB issued ASU 2016-13, “Financial Instruments—Credit Losses (Topic 326): Measurement of Credit Losses on Financial Instruments”. ASU 2016-13 amends the impairment model to utilize an expected loss methodology in place of the currently used incurred loss methodology, which will result in the timely recognition of losses. This update is effective for our fiscal year beginning after December 15, 2019, including interim periods within those fiscal years. ASU 2016-13 also applies to employee benefit plan accounting, with an effective date of fiscal years beginning after December 15, 2020, and interim periods within those fiscal years. We are currently assessing the impact that adopting this new accounting standard will have on our consolidated financial statements, footnote disclosures and employee benefit plan accounting.
In February 2016, the Financial Accounting Standards Board (FASB) issued Accounting Standards Update (ASU) No. 2016-02, “Leases (Topic 842)”. This guidance supersedes the existing guidance for lease accounting, Leases (Topic 840). ASU 2016-02 requires lessees to recognize leases on their balance sheets, and leaves lessor accounting largely unchanged. The amendments in this ASU are effective for fiscal years beginning after December 15, 2018, and interim periods within those fiscal years. Early application is permitted for all entities. ASU 2016-02 requires a modified retrospective approach for all leases existing at, or entered into after, the date of initial application, with an option to elect to use certain transition relief. The Company is currently evaluating the impact of this new standard on its consolidated financial statements.
Adoption of ASU 2014-09, “Revenue from Contracts with Customers”
In May 2014, the FASB issued ASU 2014-09, “Revenue from Contracts with Customers.” ASU 2014-09 replaces the existing accounting standards for revenue recognition with a single comprehensive five-step model. The core principle is to recognize revenue upon the transfer of goods or services to customers at an amount that reflects the consideration expected to be received. The FASB also issued ASU 2015-14, “Deferral of Effective Date.” ASU 2015-14 deferred the effective date for the new guidance until the annual reporting period beginning after December 15, 2017, and interim periods within those annual periods. The standard permits the use of either the full-retrospective (restating all years presented in the Company’s financial statements) or modified-retrospective (recording the impact of adoption as an adjustment to retained earnings at the beginning of the year of adoption) transition methods. Since its issuance, the FASB has also amended several aspects of the new guidance, including; ASU 2016-08, “Revenue from Contracts with Customers (Topic 606): Principal versus Agent Considerations (Reporting Revenue Gross versus Net)”; which clarifies the Topic 606 guidance on principal versus agent considerations, ASU 2016-10, “Revenue from Contracts with Customers (Topic 606) – Identifying Performance Obligations and Licensing”, which clarifies identification of a performance obligation and addresses revenue recognition associated with the licensing of intellectual property, ASU 2016-12, “Revenue from Contracts with Customers (Topic 606), Narrow Scope Improvements and Practical Expedients”, which clarifies assessment of collectability criterion, non-cash consideration and other technical corrections, and ASU 2016-20, “Technical Corrections and Improvements to Topic 606, Revenue from Contracts with Customers”, which is the result of the FASB Board decision to issue a separate Update for technical corrections and improvements. The Company will adopt the provisions of this new accounting standard at the beginning of fiscal year 2018, using the modified-retrospective method.
The Company completed its preliminary assessment of the impact of its upcoming adoption of ASU 2014-09 on its consolidated financial statements. The Company recognizes revenue currently under existing GAAP, which is a model based on the transfer of the risks and rewards of ownership. Predominantly, for the Company, this has been at the point in time that possession of goods has
- 32 -
Table of Contents
transferred to the customer upon delivery. The model for recognizing revenue will change under ASU 2014-09, to one based on the transfer of control of the product to the customer. Under ASU 2014-09, revenue is recognized when an entity satisfies its obligation by transferring control of the goods or services to the customer, and transfer of possession of the product is not required in order for transfer of control of the product to the customer to have occurred.
We believe that the Company meets the criteria for recognizing revenue over time as the Company’s performance (i.e. creation of a good or service for the customer) does not create an asset with an alternative use, and the Company has an enforceable right to payment for performance completed to-date. ASU 2014-09 states that, when evaluating whether the goods or services have an alternative use, an entity should consider the level of customization of the goods or services. A high level of customization is a strong indicator that the goods or services do not have an alternative use and, therefore, revenue would be recognized over time as an entity performs.
The Company is a manufacturer of fully-customized windows and doors, and manufactures products based on design specifications, measurements, colors, finishes, framing materials, glass-types, and other options selected by the customer at the point in time an order is received from the customer. The Company’s assessment is that its finished goods have no alternative use, as that term is defined in ASU 2014-09, and that control of the product passes to the customer no later than completion of the manufacturing of each or all of the products in an order, but before delivery of the products to the customer. Additionally, the Company has an enforceable right to payment at the time an order is received and accepted at the agreed-upon sales prices contained in our agreements with our customers for all manufacturing efforts expended by the Company on behalf of its customers.
Based on this assessment, the Company will be required to change its method of recognizing revenue, to one of recognizing revenue over time as products are manufactured, but no later than completion of the manufacturing process, from its current method of recognizing revenue upon delivery of the product to the customer. The Company is continuing to evaluate its manufacturing processes to assess at what point the products have no alternative use and the recognition of revenue should begin. However, because revenue will have been recognized on at least all products for which manufacturing has been completed, upon adoption of ASU 2014-09, inventories on its consolidated balance sheets will no longer include finished goods. While the Company will recognize revenue at an earlier point under ASU 2014-09, such effect may not materially affect its consolidated statements of operations post-adoption as such effects will exist at both the beginning and end of fiscal periods after the initial transition.
ASU 2014-09 also requires entities, primarily in the manufacturing segment, to make policy elections relating to shipping and handling charges. Entities may elect to treat shipping and handling as a separate performance activity and recognize revenue from shipping and handling as performance occurs. Conversely, entities may also elect to treat shipping and handling as a fulfillment activity, which will require shipping and handling costs for undelivered products to be accrued to match this cost with the revenue previously recognized over time. The Company currently recognizes shipping and handling costs as a fulfillment activity and has determined to continue to treat such costs as a fulfillment activity.
ASU 2014-09 also provides for a practical expedient which permits expensing of costs to obtain a contract when the expected amortization period is one year or less, which typically results in expensing commissions paid to employees. We expect to continue to expense sales commissions paid to employees as sales are recognized, as the expected amortization period is less than one year.
Upon adoption, we expect a net decrease to the opening balance of accumulated deficit of between approximately $1.3 million and $1.7 million related to revenues of between $6.7 million and $8.7 million, net of related costs including estimated accruals for warranty costs, shipping and handling costs and sales commissions, that would have been earned over time versus at a point in time.
- 33 -
Table of Contents
FORWARD OUTLOOK
Net sales
Looking ahead into 2018, we believe Florida’s economic factors that impact our business currently are favorable. Housing starts are growing steadily but are still below what we believe the Florida market can support. Moody’s forecast for 2018 suggests single-family housing starts in Florida may be over 109,000, after finishing 2017 at nearly 86,000, a forecasted 28% increase. However, we believe the increase in single-family housing starts in Florida in 2018, compared to 2017, will be closer to the 10% increase seen in 2017, as compared to 2016. This is still below the level of starts we believe Florida’s run-rate is capable of supporting. In 2017, Florida continued to solidify its position as the third largest state in the U.S., and we expect the combination of continued population expansion, job creation, declining unemployment, growth in the housing market, rational home pricing and historically low interest rates to be factors in driving our future growth. However, if interest rates increase meaningfully in 2018, as some economists are predicting, those rate increases could have a negative impact on our sales into both the new construction and repair and remodeling markets, and thus, unfavorably impact our profitability. Although home-builder confidence finished 2017 at a record level, as measured by the National Association of Home Builder’s confidence index finishing at 74 points, we expect the continuation of the tightness in the labor pool for subcontractors and other construction labor, Company labor, and employees for our dealer base to continue into 2018, which may limit the degree to which we are able to grow our sales in 2018.
We finished 2017 with an increase in demand in the fourth quarter, which we believe is due primarily to heightened awareness of the benefits of our impact-resistant products caused by Hurricane Irma and our related marketing and advertising investments. Feedback from our customers has been that our advertising strategy helped drive consumers into their places of business asking specifically for our products. We plan to continue our marketing efforts and expect this will continue to help drive sales growth for us in 2018.
Taking all of the factors described above into account, we expect 2018 full-year sales to range between $550 million and $575 million, representing an increase of between 8% and 13%, as compared to 2017. We expect sales at this level will generate consolidated adjusted EBITDA of between, $95 million and $105 million, representing an increase from 2017 of between 10% and 22%. Beginning in 2018, the Company is updating its reporting of adjusted EBITDA to exclude non-cash stock-based compensation expense. The adjusted EBITDA amounts and percentage increases given above reflect this change. We are targeting adjusted net income per diluted share in 2018 of between $0.81 to $0.98, which assumes 52 million weighted-average diluted shares outstanding. We are targeting free cash flow of between $59 million and $67 million, which includes $25 million of cash proceeds to be received from finalizing the sale of certain glass processing assets to Cardinal that we will use to further pay-down debt.
Gross profit and gross margin
We believe the following factors, which are not all inclusive, may impact our gross profit and gross margin in 2018:
| • | Our gross margin percentages are influenced by total sales due to operating leverage of fixed costs, and also by product mix. We expect to continue to grow revenues organically, due in part to increased sales of our relatively newer vinyl product lines, which have a higher margin than our previous vinyl products, and through capturing market share. We believe these factors will result in benefit to gross profit and gross margin during 2018. |
| • | During 2017, our gross profit and gross margin percentage increased in part due to lower scrap rates and higher efficiencies due to improved operating performance. Our focus in 2018 will be to continue to sustain and strive to further improve our scrap rate performance and operating efficiencies, to further improve our margins. |
| • | In September 2017, we entered into a supply agreement with Cardinal Glass Industries under which Cardinal will supply to us glass components for our PGT-branded doors. We believe this arrangement will allow us to leverage Cardinal’s industry-leading capabilities and quality-control and enable us to focus on our core area of window and door manufacturing, which we believe will result in improved quality of our products and lower manufacturing rework and warranty costs, thereby contributing to improved margins. |
| • | Gross profit and gross margin in 2017 were negatively impacted by certain costs related to operating inefficiencies at our WinDoor location, due to changes in WinDoor’s senior leadership, systems and glass suppliers. We took these actions in 2017 with the objective of creating an environment for sustainable growth and improved performance, but they caused some expected and unexpected production and shipment disruptions. We believe the changes will ultimately result in a stronger WinDoor brand, but we expect them to continue to unfavorably impact margin results in the first half of 2018. |
| • | Aluminum prices, which can fluctuate significantly, began to increase meaningfully in the second half of 2017, and have continued to do so in early 2018. Additionally, in early March 2018, President Trump indicated his administration is |
- 34 -
Table of Contents
| considering options to curb imports of foreign steel and aluminum, including imposing tariffs on steel and aluminum, and limiting the amounts of steel and aluminum coming into the United States. These actions could have a further unfavorable impact to the prices we ultimately pay for the aluminum and steel components of our products. We currently are covered through hedging arrangements for approximately 43 percent of our estimated aluminum requirements for the remainder of 2018, at an average delivered price of $1.08 per pound. However, as mentioned above, we have seen an increase in our cost of aluminum, and the current delivered cash price is approximately $1.12 per pound. We expect to increase prices of certain of our products during 2018, if necessary, to attempt to offset increases in materials costs, including aluminum. However, if the increase in the cash price of aluminum exceeds our ability to increase product prices charged to our customers, our gross profit and gross margin will be unfavorably impacted. |
| • | Our gross profit and gross margin are also influenced by costs of material and labor. Portions of our labor force have become more tenured and, therefore, material and labor costs have begun to normalize as efficiencies are achieved. However, the strong jobs environment in Florida has resulted in a contraction in the labor pool, which has caused construction labor market pressure on the Company. We expect the tight construction labor market to continue during 2018. |
Selling, general and administrative expenses (SG&A)
This expense category will be affected by approximately $1.0 million of first-quarter 2018 marketing-related expenses we invested in the roll-out of new products at the 2018 NAHB Homebuilders Show in January 2018. We also expect our SG&A expenses to be impacted by the continuation of increased advertising spending in the first half of 2018. We expect to leverage fixed SG&A on anticipated higher sales in 2018, compared to 2017, and to continue to look for areas within SG&A to drive more efficiencies.
Depreciation and Amortization
We expect depreciation and amortization will be approximately $20.0 million in 2018.
Interest expense
Effective on February 27, 2017, we repriced the term loan portion of the 2016 Credit Agreement, which reduced the margin component of its interest rate by one full percentage-point, to 4.75%, resulting in a stated interest rate of 5.75%. Additionally, we made a total of $40.0 million in voluntary prepayments of borrowings under the 2016 Credit Agreement, which will result in a lower level of average debt in 2018, compared to 2017. However, after the repricing, LIBOR increased several times in 2017, and could increase during 2018. Based on our weighted-average interest rate of 6.21% as of December 30, 2017, we believe interest expense on our long-term debt will be approximately $18.0 million in 2018, including an estimated $2.6 million of non-cash amortization of deferred financing costs.
Income tax expense
We expect to continue to be profitable in 2018, and thus, that we will incur income tax expense at a combined Federal and state effective rate of approximately 26%. This rate is based on the lower overall corporate income tax rate of 21% as the result of the Act, plus a blended statutory state rate.
Liquidity and capital resources
We had $34.0 million of cash on hand as of December 30, 2017. During 2018, we expect to continue to generate sufficient cash from operations to service the interest requirements on our debt, cover our operating expenses, and spend between $18 million and $20 million for capital expenditures, including the buildout improvements we expect to make to our new, leased facility in Miami, Florida in early 2018. Because of the voluntary prepayments of debt we have made since the inception of the 2016 Credit Agreement totaling $44.0 million, we have no further mandatory required payments remaining until the maturity of the facility in February 2022, but expect to continue making voluntary prepayments as our cash generation and other relevant factors permit. However, no assurances can be given that cash from operations will be sufficient for some or all these purposes.
On November 1, 2017, Cardinal paid us $3.0 million in cash pursuant to the APA, under which we sold certain door glass manufacturing equipment to Cardinal. We expect to receive the remaining $25.0 million in cash proceeds under the APA during the first half of 2018, which we will use to pay-down borrowings under the 2016 Credit Agreement.
- 35 -
Table of Contents
| Item 7A. | QUANTITATIVE AND QUALITATIVE DISCLOSURES ABOUT MARKET RISK |
Based on our debt outstanding at December 30, 2017, of $224.0 million, a 1% increase in interest rates would result in approximately $2.2 million of additional interest expense annually. As of December 30, 2017, the weighted-average interest rate on our outstanding debt was 6.21%.
| Item 8. | FINANCIAL STATEMENTS AND SUPPLEMENTARY DATA |
INDEX TO CONSOLIDATED FINANCIAL STATEMENTS
| Report of Independent Registered Public Accounting Firm – KPMG LLP |
37 | |||
| 38 | ||||
| 39 | ||||
| Consolidated Balance Sheets as of December 30, 2017, and December 31, 2016 |
40 | |||
| 41 | ||||
| 42 | ||||
| 43 | ||||
- 36 -
Table of Contents
Report of Independent Registered Public Accounting Firm
To the Stockholders and Board of Directors
PGT Innovations, Inc.:
Opinion on the Consolidated Financial Statements
We have audited the accompanying consolidated balance sheets of PGT Innovations, Inc. and subsidiaries (the “Company”) as of December 30, 2017 and December 31, 2016, the related consolidated statements of operations, comprehensive income, shareholders’ equity, and cash flows for each of the years in the three-year period ended December 30, 2017 and the related notes and financial statement schedule II (collectively, the “consolidated financial statements”). In our opinion, the consolidated financial statements present fairly, in all material respects, the financial position of the Company as of December 30, 2017 and December 31, 2016, and the results of its operations and its cash flows for each of the years in the three-year period ended December 30, 2017, in conformity with U.S. generally accepted accounting principles.
We also have audited, in accordance with the standards of the Public Company Accounting Oversight Board (United States) (“PCAOB”), the Company’s internal control over financial reporting as of December 31, 2017, based on criteria established in Internal Control – Integrated Framework (2013) issued by the Committee of Sponsoring Organizations of the Treadway Commission, and our report dated March 14, 2018 expressed an unqualified opinion on the effectiveness of the Company’s internal control over financial reporting.
Basis for Opinion
These consolidated financial statements are the responsibility of the Company’s management. Our responsibility is to express an opinion on these consolidated financial statements based on our audits. We are a public accounting firm registered with the PCAOB and are required to be independent with respect to the Company in accordance with the U.S. federal securities laws and the applicable rules and regulations of the Securities and Exchange Commission and the PCAOB.
We conducted our audits in accordance with the standards of the PCAOB. Those standards require that we plan and perform the audit to obtain reasonable assurance about whether the consolidated financial statements are free of material misstatement, whether due to error or fraud. Our audits included performing procedures to assess the risks of material misstatement of the consolidated financial statements, whether due to error or fraud, and performing procedures that respond to those risks. Such procedures included examining, on a test basis, evidence regarding the amounts and disclosures in the consolidated financial statements. Our audits also included evaluating the accounting principles used and significant estimates made by management, as well as evaluating the overall presentation of the consolidated financial statements. We believe that our audits provide a reasonable basis for our opinion.
/s/ KPMG LLP
We have served as the Company’s auditor since 2014.
Tampa, Florida
March 14, 2018
Certified Public Accountants
- 37 -
Table of Contents
CONSOLIDATED STATEMENTS OF OPERATIONS
(in thousands, except per share amounts)
| Year Ended | ||||||||||||
| December 30, | December 31, | January 2, | ||||||||||
| 2017 | 2016 | 2016 | ||||||||||
| Net sales |
$ | 511,081 | $ | 458,550 | $ | 389,810 | ||||||
| Cost of sales |
352,097 | 318,452 | 270,678 | |||||||||
|
|
|
|
|
|
|
|||||||
| Gross profit |
158,984 | 140,098 | 119,132 | |||||||||
| Selling, general and administrative expenses |
98,803 | 83,995 | 68,190 | |||||||||
| Fair value adjustment to contingent consideration |
— | (3,000 | ) | — | ||||||||
|
|
|
|
|
|
|
|||||||
| Income from operations |
60,181 | 59,103 | 50,942 | |||||||||
| Interest expense, net |
20,279 | 20,125 | 11,705 | |||||||||
| Debt extinguishment costs |
— | 3,431 | — | |||||||||
| Other expense, net |
— | — | 388 | |||||||||
|
|
|
|
|
|
|
|||||||
| Income before income taxes |
39,902 | 35,547 | 38,849 | |||||||||
| Income tax expense |
63 | 11,800 | 15,297 | |||||||||
|
|
|
|
|
|
|
|||||||
| Net income |
$ | 39,839 | $ | 23,747 | $ | 23,552 | ||||||
|
|
|
|
|
|
|
|||||||
| Net income per common share: |
||||||||||||
| Basic |
$ | 0.80 | $ | 0.49 | $ | 0.49 | ||||||
|
|
|
|
|
|
|
|||||||
| Diluted |
$ | 0.77 | $ | 0.47 | $ | 0.47 | ||||||
|
|
|
|
|
|
|
|||||||
| Weighted average shares outstanding: |
||||||||||||
| Basic |
49,522 | 48,856 | 48,272 | |||||||||
|
|
|
|
|
|
|
|||||||
| Diluted |
51,728 | 50,579 | 50,368 | |||||||||
|
|
|
|
|
|
|
|||||||
The accompanying notes are an integral part of these consolidated financial statements.
- 38 -
Table of Contents
CONSOLIDATED STATEMENTS OF COMPREHENSIVE INCOME
(in thousands)
| Year Ended | ||||||||||||
| December 30, | December 31, | January 2, | ||||||||||
| 2017 | 2016 | 2016 | ||||||||||
| Net income |
$ | 39,839 | $ | 23,747 | $ | 23,552 | ||||||
|
|
|
|
|
|
|
|||||||
| Other comprehensive income before tax |
||||||||||||
| Change in fair value of derivatives |
— | — | — | |||||||||
| Reclassification to earnings |
— | — | 126 | |||||||||
|
|
|
|
|
|
|
|||||||
| Other comprehensive income before tax |
— | — | 126 | |||||||||
| Income tax expense related to components of other comprehensive income |
— | — | 50 | |||||||||
| Reversal of income tax allocation |
— | — | (1,595 | ) | ||||||||
|
|
|
|
|
|
|
|||||||
| Other comprehensive income, net of tax |
— | — | 1,671 | |||||||||
|
|
|
|
|
|
|
|||||||
| Comprehensive income |
$ | 39,839 | $ | 23,747 | $ | 25,223 | ||||||
|
|
|
|
|
|
|
|||||||
The accompanying notes are an integral part of these consolidated financial statements.
- 39 -
Table of Contents
CONSOLIDATED BALANCE SHEETS
(in thousands, except per share amounts)
| December 30, | December 31, | |||||||
| 2017 | 2016 | |||||||
| ASSETS |
||||||||
| Current assets: |
||||||||
| Cash and cash equivalents |
$ | 34,029 | $ | 39,210 | ||||
| Accounts receivable, net |
60,308 | 41,646 | ||||||
| Inventories |
37,816 | 30,511 | ||||||
| Prepaid expenses |
2,490 | 2,645 | ||||||
| Other current assets |
9,873 | 8,365 | ||||||
|
|
|
|
|
|||||
| Total current assets |
144,516 | 122,377 | ||||||
| Property, plant and equipment, net |
84,133 | 84,209 | ||||||
| Trade names and other intangible assets, net |
115,043 | 120,930 | ||||||
| Goodwill |
108,060 | 108,060 | ||||||
| Other assets, net |
1,367 | 1,072 | ||||||
|
|
|
|
|
|||||
| Total assets |
$ | 453,119 | $ | 436,648 | ||||
|
|
|
|
|
|||||
| LIABILITIES AND SHAREHOLDERS’ EQUITY |
||||||||
| Current liabilities: |
||||||||
| Accounts payable |
$ | 12,911 | $ | 7,894 | ||||
| Accrued liabilities |
28,174 | 14,909 | ||||||
| Current portion of long-term debt |
294 | — | ||||||
|
|
|
|
|
|||||
| Total current liabilities |
41,379 | 22,803 | ||||||
| Long-term debt, less current portion |
212,679 | 247,873 | ||||||
| Deferred income taxes |
22,772 | 31,838 | ||||||
| Other liabilities |
964 | 1,282 | ||||||
|
|
|
|
|
|||||
| Total liabilities |
277,794 | 303,796 | ||||||
|
|
|
|
|
|||||
| Shareholders’ equity: |
||||||||
| Preferred stock; par value $.01 per share; 10,000 shares authorized; none outstanding |
— | — | ||||||
| Common stock; par value $.01 per share; 200,000 shares authorized; 52,486 and 51,887 shares issued and 49,805 and 49,176 shares outstanding at December 30, 2017 and December 31, 2016, respectively |
525 | 519 | ||||||
| Additional paid-in-capital |
252,275 | 249,647 | ||||||
| Accumulated deficit |
(64,716 | ) | (104,555 | ) | ||||
|
|
|
|
|
|||||
| Shareholders’ equity |
188,084 | 145,611 | ||||||
| Less: Treasury stock at cost |
(12,759 | ) | (12,759 | ) | ||||
|
|
|
|
|
|||||
| Total shareholders’ equity |
175,325 | 132,852 | ||||||
|
|
|
|
|
|||||
| Total liabilities and shareholders’ equity |
$ | 453,119 | $ | 436,648 | ||||
|
|
|
|
|
|||||
The accompanying notes are an integral part of these consolidated financial statements.
- 40 -
Table of Contents
CONSOLIDATED STATEMENTS OF CASH FLOWS
(in thousands)
| Year Ended | ||||||||||||
| December 30, | December 31, | January 2, | ||||||||||
| 2017 | 2016 | 2016 | ||||||||||
| Cash flows from operating activities: |
||||||||||||
| Net income |
$ | 39,839 | $ | 23,747 | $ | 23,552 | ||||||
| Adjustments to reconcile net income to net cash provided by operating activities: |
||||||||||||
| Depreciation |
13,051 | 9,577 | 7,008 | |||||||||
| Amortization |
6,477 | 6,096 | 3,413 | |||||||||
| Provision for (recovery on) allowance for doubtful accounts |
576 | 81 | (131 | ) | ||||||||
| Stock-based compensation |
1,948 | 1,769 | 1,774 | |||||||||
| Amortization and write-offs of deferred financing costs |
4,642 | 6,779 | 1,014 | |||||||||
| Derivative financial instruments |
— | — | 126 | |||||||||
| Deferred income taxes |
(9,066 | ) | 6,277 | 5,993 | ||||||||
| Excess tax benefits on stock-based compensation |
— | (1,872 | ) | (3,840 | ) | |||||||
| Fair value adjustment to contingent consideration |
— | (3,000 | ) | — | ||||||||
| (Gain) loss on disposal of assets |
(452 | ) | (45 | ) | 10 | |||||||
| Amortization of advance vendor consideration |
(628 | ) | — | — | ||||||||
| Change in operating assets and liabilities (net of the effects of the acquisitions): |
||||||||||||
| Accounts receivable |
(17,922 | ) | (7,069 | ) | (7,263 | ) | ||||||
| Inventories |
(7,305 | ) | (152 | ) | (3,083 | ) | ||||||
| Prepaid expenses and other current assets |
(1,024 | ) | 2,215 | (1,786 | ) | |||||||
| Accounts payable and accrued liabilities |
18,889 | 1,962 | 5,669 | |||||||||
|
|
|
|
|
|
|
|||||||
| Net cash provided by operating activities |
49,025 | 46,365 | 32,456 | |||||||||
|
|
|
|
|
|
|
|||||||
| Cash flows from investing activities: |
||||||||||||
| Purchases of property, plant and equipment |
(17,818 | ) | (17,694 | ) | (17,391 | ) | ||||||
| Business acquisitions |
— | (101,338 | ) | — | ||||||||
| Proceeds from disposals of assets |
3,089 | 45 | — | |||||||||
|
|
|
|
|
|
|
|||||||
| Net cash used in investing activities |
(14,729 | ) | (118,987 | ) | (17,391 | ) | ||||||
|
|
|
|
|
|
|
|||||||
| Cash flows from financing activities: |
||||||||||||
| Payments of long-term debt |
(40,132 | ) | (203,525 | ) | (2,000 | ) | ||||||
| Proceeds from issuance of long-term debt |
— | 261,030 | — | |||||||||
| Payments of financing costs |
— | (7,178 | ) | — | ||||||||
| Purchases and retirements of treasury stock |
(284 | ) | (2,847 | ) | (44 | ) | ||||||
| Proceeds from exercise of stock options |
941 | 981 | 2,192 | |||||||||
| Proceeds from issuance of common stock under ESPP |
29 | 36 | — | |||||||||
| Excess tax benefits on stock-based compensation |
— | 1,872 | 3,840 | |||||||||
| Other |
(31 | ) | (30 | ) | (29 | ) | ||||||
|
|
|
|
|
|
|
|||||||
| Net cash (used in) provided by financing activities |
(39,477 | ) | 50,339 | 3,959 | ||||||||
|
|
|
|
|
|
|
|||||||
| Net (decrease) increase in cash and cash equivalents |
(5,181 | ) | (22,283 | ) | 19,024 | |||||||
| Cash and cash equivalents at beginning of year |
39,210 | 61,493 | 42,469 | |||||||||
|
|
|
|
|
|
|
|||||||
| Cash and cash equivalents at end of year |
$ | 34,029 | $ | 39,210 | $ | 61,493 | ||||||
|
|
|
|
|
|
|
|||||||
| Supplemental cash flow information: |
||||||||||||
| Interest paid |
$ | 16,329 | $ | 16,015 | $ | 11,502 | ||||||
|
|
|
|
|
|
|
|||||||
| Income tax payments, net of refunds |
$ | 46 | $ | 2,231 | $ | 6,808 | ||||||
|
|
|
|
|
|
|
|||||||
| Non-cash activity: |
||||||||||||
| Financed purchase of software license |
$ | 590 | $ | — | $ | — | ||||||
|
|
|
|
|
|
|
|||||||
| Contingent consideration reversed out of accrued liabilities |
$ | — | $ | 3,000 | $ | — | ||||||
|
|
|
|
|
|
|
|||||||
| Portion of USI purchase price held-back by PGTI |
$ | — | $ | 85 | $ | — | ||||||
|
|
|
|
|
|
|
|||||||
| Property, plant and equipment additions in accounts payable |
$ | 111 | $ | 251 | $ | 723 | ||||||
|
|
|
|
|
|
|
|||||||
The accompanying notes are an integral part of these consolidated financial statements.
- 41 -
Table of Contents
CONSOLIDATED STATEMENTS OF SHAREHOLDERS’ EQUITY
(in thousands except share amounts)
| Accumulated | ||||||||||||||||||||||||||||
| Common stock | Additional | Other | ||||||||||||||||||||||||||
| Shares | Paid-in | Comprehensive | Accumulated | Treasury | ||||||||||||||||||||||||
| Outstanding | Amount | Capital | Loss | Deficit | Stock | Total | ||||||||||||||||||||||
| Balance at January 3, 2015 |
47,707,270 | $ | 498 | $ | 238,229 | $ | (1,671 | ) | $ | (152,009 | ) | $ | (11,071 | ) | $ | 73,976 | ||||||||||||
| Grants of restricted stock |
— | 3 | (3 | ) | — | — | — | — | ||||||||||||||||||||
| Vesting of restricted stock |
69,161 | — | — | — | — | — | — | |||||||||||||||||||||
| Purchases of treasury stock |
(3,746 | ) | — | — | — | — | (44 | ) | (44 | ) | ||||||||||||||||||
| Retirement of treasury stock |
— | — | (1,078 | ) | — | — | 1,078 | — | ||||||||||||||||||||
| Stock-based compensation |
— | — | 1,774 | — | — | — | 1,774 | |||||||||||||||||||||
| Exercise of stock options |
1,033,750 | 10 | 2,182 | — | — | — | 2,192 | |||||||||||||||||||||
| Tax benefit on exercised stock options |
— | — | 3,840 | — | — | — | 3,840 | |||||||||||||||||||||
| Comprehensive income, net of tax effect |
— | — | — | 1,671 | — | — | 1,671 | |||||||||||||||||||||
| Net income |
— | — | — | — | 23,552 | — | 23,552 | |||||||||||||||||||||
|
|
|
|
|
|
|
|
|
|
|
|
|
|
|
|||||||||||||||
| Balance at January 2, 2016 |
48,806,435 | $ | 511 | $ | 244,944 | $ | — | $ | (128,457 | ) | $ | (10,037 | ) | $ | 106,961 | |||||||||||||
| Grants of restricted stock |
— | 3 | (3 | ) | — | — | — | — | ||||||||||||||||||||
| Vesting of restricted stock |
128,590 | — | — | — | — | — | — | |||||||||||||||||||||
| Forfeitures of restricted stock |
— | (1 | ) | 1 | — | — | — | — | ||||||||||||||||||||
| Purchases of treasury stock |
(299,988 | ) | — | — | — | — | (2,847 | ) | (2,847 | ) | ||||||||||||||||||
| Retirement of treasury stock |
— | — | (125 | ) | — | — | 125 | — | ||||||||||||||||||||
| Stock-based compensation |
— | — | 1,769 | — | — | — | 1,769 | |||||||||||||||||||||
| Exercise of stock options |
537,364 | 6 | 975 | — | — | — | 981 | |||||||||||||||||||||
| Common stock issued under ESPP |
3,748 | — | 36 | — | — | — | 36 | |||||||||||||||||||||
| Tax benefit on exercised stock options |
— | — | 1,872 | — | — | — | 1,872 | |||||||||||||||||||||
| Net income |
— | — | — | — | 23,747 | — | 23,747 | |||||||||||||||||||||
|
|
|
|
|
|
|
|
|
|
|
|
|
|
|
|||||||||||||||
| Balance at December 31, 2016 - previously reported |
49,176,149 | $ | 519 | $ | 249,469 | $ | — | $ | (104,710 | ) | $ | (12,759 | ) | $ | 132,519 | |||||||||||||
| Cumulative effect of change in accounting for forfeitures relating to equity awards, net of tax effect |
— | — | 178 | — | (109 | ) | — | 69 | ||||||||||||||||||||
| Cumulative effect of change in accounting for unrecognized excess tax benefits |
— | — | — | — | 264 | — | 264 | |||||||||||||||||||||
|
|
|
|
|
|
|
|
|
|
|
|
|
|
|
|||||||||||||||
| Balance at December 31, 2016 - as adjusted |
49,176,149 | $ | 519 | $ | 249,647 | $ | — | $ | (104,555 | ) | $ | (12,759 | ) | $ | 132,852 | |||||||||||||
| Grants of restricted stock |
— | 3 | (3 | ) | — | — | — | — | ||||||||||||||||||||
| Vesting of restricted stock |
179,679 | — | — | — | — | — | — | |||||||||||||||||||||
| Forfeitures of restricted stock |
— | (1 | ) | 1 | — | — | — | — | ||||||||||||||||||||
| Purchases of treasury stock |
(23,826 | ) | — | — | — | — | (284 | ) | (284 | ) | ||||||||||||||||||
| Retirement of treasury stock |
— | — | (284 | ) | — | — | 284 | — | ||||||||||||||||||||
| Stock-based compensation |
— | — | 1,948 | — | — | — | 1,948 | |||||||||||||||||||||
| Exercise of stock options |
470,622 | 4 | 937 | — | — | — | 941 | |||||||||||||||||||||
| Common stock issued under ESPP |
2,714 | — | 29 | — | — | — | 29 | |||||||||||||||||||||
| Net income |
— | — | — | — | 39,839 | — | 39,839 | |||||||||||||||||||||
|
|
|
|
|
|
|
|
|
|
|
|
|
|
|
|||||||||||||||
| Balance at December 30, 2017 |
49,805,338 | $ | 525 | $ | 252,275 | $ | — | $ | (64,716 | ) | $ | (12,759 | ) | $ | 175,325 | |||||||||||||
|
|
|
|
|
|
|
|
|
|
|
|
|
|
|
|||||||||||||||
The accompanying notes are an integral part of these consolidated financial statements.
- 42 -
Table of Contents
NOTES TO CONSOLIDATED FINANCIAL STATEMENTS
1. Description of Business
PGT Innovations, Inc. (“PGTI”, “we,” or the “Company”), formerly named PGT, Inc., is a leading manufacturer of impact-resistant aluminum and vinyl-framed windows and doors and offers a broad range of fully customizable window and door products. The majority of our sales are to customers in the state of Florida; however, we also sell products in many other states, the Caribbean, Canada, Australia, and in South and Central America. Products are sold through an authorized dealer and distributor network. See Note 4 for a discussion of recent acquisition and asset disposal activities we have undertaken.
We were incorporated in the state of Delaware on December 16, 2003, as JLL Window Holdings, Inc., with primary operations in North Venice, Florida. On February 15, 2006, our Company was renamed PGT, Inc. On December 14, 2016, we announced that we changed our name to PGT Innovations, Inc. and, effective on December 28, 2016, the listing of our common stock was transferred to the New York Stock Exchange (NYSE) from the NASDAQ Global Market (NASDAQ), and began trading on the NYSE under its existing ticker symbol of “PGTI”. We have four manufacturing operations in Florida, with one in North Venice, two in the greater Miami area, and one in Orlando. Additionally, we have two glass tempering and laminating plants and one insulation glass plant, all located in North Venice.
All references to PGTI or our Company apply to the consolidated financial statements of PGT Innovations, Inc. unless otherwise noted.
2. Summary of Significant Accounting Policies
Basis of Presentation
The accompanying consolidated financial statements have been prepared in accordance with U.S. generally accepted accounting principles (“GAAP”).
Fiscal period
Our fiscal year consists of 52 or 53 weeks ending on the Saturday nearest December 31 of the related year. The years ended December 30, 2017, December 31, 2016, and January 2, 2016, consisted of 52 weeks.
Principles of consolidation
The consolidated financial statements present the results of the operations, financial position and cash flows of PGTI, and its subsidiaries. All significant intercompany accounts and transactions have been eliminated in consolidation.
Segment information
We operate as one operating segment, the manufacture and sale of windows and doors.
Use of estimates
The preparation of financial statements in conformity with GAAP requires management to make estimates and assumptions that affect the reported amounts of assets and liabilities and disclosure of contingent assets and liabilities at the date of the financial statements, and the reported amounts of revenues and expenses during the reporting period. Actual results could materially differ from those estimates.
Revenue recognition
We recognize sales when all of the following criteria have been met: a valid customer order with a fixed price has been received; the product has been delivered; and collectability is reasonably assured. All sales recognized are net of allowances for discounts and estimated credits, which are estimated using historical experience. We record provisions against gross revenues for estimated credits in the period when the related revenue is recorded. These estimates are based on factors that include, but are not limited to, analysis of credit memorandum activity.
- 43 -
Table of Contents
Cost of sales
Cost of sales represents costs directly related to the production of our products. Primary costs include raw materials, direct labor, and manufacturing overhead, which consist of salaries, wages, employee benefits, utilities, maintenance, engineering and property taxes.
Shipping and handling costs
Shipping and handling costs incurred in the purchase of materials used in the manufacturing process are included in cost of sales. Costs relating to shipping and handling of our finished products are included in selling, general and administrative expenses and totaled $20.6 million, $18.3 million and $15.4 million for the years ended December 30, 2017, December 31, 2016, and January 2, 2016, respectively.
Advertising
We expense advertising costs as incurred. Advertising expense, which is included in selling, general and administrative expenses, was $1.3 million, $0.2 million and $0.3 million for the years ended December 30, 2017, December 31, 2016, and January 2, 2016, respectively.
Research and development costs
We expense research and development costs as incurred. Research and development costs included in cost of sales were $1.4 million, $1.7 million and $2.0 million for the years ended December 30, 2017, December 31, 2016, and January 2, 2016, respectively.
Cash and cash equivalents
Cash and cash equivalents consist of cash on hand or highly liquid investments with an original maturity date of three months or less when purchased.
Accounts receivable, net
In the ordinary course of business, we extend credit to qualified dealers and distributors, generally on a non-collateralized basis. The Company maintains an allowance for doubtful accounts which is based on management’s assessments of the amount which may become uncollectible in the future and is determined through consideration of our write-off history, specific identification of uncollectible accounts based in part on the customer’s past due balance (based on contractual terms), and consideration of prevailing economic and industry conditions. Uncollectible accounts are written off after repeated attempts to collect from the customer have been unsuccessful.
| December 30, | December 31, | |||||||
| 2017 | 2016 | |||||||
| (in thousands) | ||||||||
| Accounts receivable |
$ | 61,272 | $ | 42,045 | ||||
| Less: Allowance for doubtful accounts |
(964 | ) | (399 | ) | ||||
|
|
|
|
|
|||||
| Accounts receivable, net |
$ | 60,308 | $ | 41,646 | ||||
|
|
|
|
|
|||||
- 44 -
Table of Contents
Self-insurance reserves
We are primarily self-insured for employee health benefits and for years prior to 2010 for workers’ compensation claims. Provisions for losses under these programs are recorded based on the Company’s estimates of the aggregate liabilities for the claims incurred. Accruals for healthcare claims and workers’ compensation are included in accrued liabilities in the accompanying consolidated balance sheets.
Warranty expense
We have warranty obligations with respect to most of our manufactured products. Warranty periods, which vary by product components, generally range from 1 to 10 years, although the warranty period for a limited number of specifically identified components in certain applications is a lifetime. However, the majority of the products sold have warranties on components which range from 1 to 3 years. The Company has recorded a reserve for estimated warranty and related costs based on historical experience and periodically adjusts these provisions to reflect actual experience. Expected future obligations are discounted to a current value using a risk-free rate for obligations with similar maturities.
During 2017, we recorded warranty expense at an average rate of 2.09% of sales. This rate is lower than the average rate of 2.41% of sales accrued in 2016. We assess the adequacy of our warranty accrual on a quarterly basis, and adjust the previous amounts recorded, if necessary, to reflect the change in estimate of the future costs of claims yet to be serviced. The following provides information with respect to our warranty accrual.
| Accrued Warranty |
Beginning of Period |
Acquired | Charged to Expense |
Adjustments | Settlements | End of Period |
||||||||||||||||||
| (in thousands) | ||||||||||||||||||||||||
| Year ended December 30, 2017 |
$ | 5,569 | $ | — | $ | 10,675 | $ | (212 | ) | $ | (10,646 | ) | $ | 5,386 | ||||||||||
| Year ended December 31, 2016 |
$ | 4,237 | $ | 274 | $ | 11,064 | $ | 754 | $ | (10,760 | ) | $ | 5,569 | |||||||||||
| Year ended January 2, 2016 |
$ | 3,302 | $ | — | $ | 8,256 | $ | 332 | $ | (7,653 | ) | $ | 4,237 | |||||||||||
The accrual for warranty is included in accrued liabilities and other liabilities, depending on estimated settlement date, in the consolidated balance sheets as of December 30, 2017 and December 31, 2016. The portion of warranty expense related to the issuance of product of $4.8 million, $6.8 million and $4.8 million is included in cost of sales in the consolidated statements of operations for the years ended December 30, 2017, December 31, 2016, and January 2, 2016, respectively. The portion related to servicing warranty claims including costs of the service department personnel is included in selling, general and administrative expenses in the consolidated statements of operations, and is $5.7 million, $5.0 million and $3.8 million, respectively, for the years ended December 30, 2017, December 31, 2016, and January 2, 2016.
Inventories
Inventories consist principally of raw materials purchased for the manufacture of our products. We have limited finished goods inventory as all products are custom, made-to-order products. All inventories are stated at the lower of cost (first-in, first-out method) or net realizable value. The reserve for obsolescence is based on management’s assessment of the amount of inventory that may become obsolete in the future and is determined through Company history, specific identification and consideration of prevailing economic and industry conditions. Inventories consist of the following:
| December 30, | December 31, | |||||||
| 2017 | 2016 | |||||||
| (in thousands) | ||||||||
| Raw materials |
$ | 30,139 | $ | 24,946 | ||||
| Work in progress |
2,506 | 2,521 | ||||||
| Finished goods |
5,171 | 3,044 | ||||||
|
|
|
|
|
|||||
| Inventories |
$ | 37,816 | $ | 30,511 | ||||
|
|
|
|
|
|||||
- 45 -
Table of Contents
Property, plant and equipment
Property, plant and equipment are recorded at cost and depreciated using the straight-line method over the estimated useful lives of the related assets. Depreciable assets are assigned estimated lives as follows:
| Building and improvements |
5 to 40 years | |
| Leasehold improvements |
Shorter of lease term or estimated useful life | |
| Furniture and equipment |
3 to 10 years | |
| Vehicles |
5 to 10 years | |
| Computer software |
3 years |
Maintenance and repair expenditures are charged to expense as incurred.
Long-lived assets
We review long-lived assets for impairment whenever events or changes in circumstances indicate that the carrying amount of such assets may not be recoverable. Recoverability of assets to be held and used is measured by a comparison of the carrying amount of long-lived assets to future undiscounted net cash flows expected to be generated. If such assets are considered to be impaired, the impairment recognized is the amount by which the carrying amount of the assets exceeds the fair value of the assets. Assets to be disposed of are reported at the lower of the carrying amount or fair value less cost to sell, and depreciation is no longer recorded.
Computer software
We capitalize costs associated with software developed or obtained for internal use when both the preliminary project stage is complete and it is probable that computer software being developed will be completed and placed in service. Capitalized costs include:
| (i) | external direct costs of materials and services consumed in developing or obtaining computer software, |
| (ii) | payroll and other related costs for employees who are directly associated with and who devote time to the software project, and |
| (iii) | interest costs incurred, when material, while developing internal-use software. |
Capitalization of such costs ceases no later than the point at which the project is substantially complete and ready for its intended purpose.
Capitalized software as of December 30, 2017, and December 31, 2016, was $20.0 million and $16.6 million, respectively. Accumulated depreciation of capitalized software was $16.9 million and $15.4 million as of December 30, 2017, and December 31, 2016, respectively.
Amortization expense for capitalized software was $1.5 million, $0.9 million, and $1.1 million for the years ended December 30, 2017, December 31, 2016, and January 2, 2016, respectively.
We review the carrying value of capitalized software and development costs for impairment in accordance with our policy pertaining to the impairment of long-lived assets.
Goodwill
Goodwill represents the excess of the consideration paid in a business combination over the fair value of the identifiable net assets acquired. We test goodwill for impairment at the reporting unit level at least annually or whenever events or circumstances indicate that the carrying value of goodwill may not be recoverable from future cash flows. Our annual test for impairment is done on the first date of our fiscal fourth quarter. We consider various qualitative factors, including macroeconomic and industry conditions, financial performance of the Company and changes in the stock price of the Company to determine whether it is necessary to perform a quantitative test for goodwill impairment. If we believe, as a result of our qualitative assessment, that it is more likely than not that the fair value of a reporting unit is less than its carrying amount, the quantitative impairment test is required. Under the quantitative test, goodwill is tested under a two-step method for impairment at a level of reporting referred to as a reporting unit. Step one of the quantitative analysis involves identifying potential impairment by comparing the fair value of each reporting unit with its carrying amount and, if applicable, step two involves estimation of the impairment loss, which is the amount of excess of carrying amount of goodwill over the implied fair value of the reporting unit goodwill. For all periods presented, based on a qualitative assessment, we concluded that a quantitative two-step assessment was not required to be performed.
- 46 -
Table of Contents
Trade names
The Company has indefinite-lived intangible assets in the form of trade names. The impairment evaluation of the carrying amount of our trade names is conducted annually, or more frequently, if events or changes in circumstances indicate that they might be impaired. We have the option of performing a qualitative assessment of impairment to determine whether any further quantitative testing for impairment is necessary. If we elect to bypass the qualitative assessment or if we determine, based on qualitative factors, that it is more likely than not that the fair value of our trade names is less than the carrying amount, an evaluation is performed by comparing their carrying amount to their estimated fair values. If the estimated fair value is less than the carrying amount of the trade name, then an impairment charge is recorded to reduce the carrying value to its estimated fair value. The estimated fair value is determined using the relief from royalty method that is based upon the discounted projected cost savings (value) attributable to ownership of our trade names, our only indefinite lived intangible assets. For all periods presented, based on a qualitative assessment, we concluded that a quantitative two-step assessment was not required to be performed for our PGT and CGI trade names.
In evaluating our WinDoor trade name as of the first day of the fourth quarter of 2017, we elected to bypass the qualitative assessment and perform a quantitative assessment. Based on this quantitative assessment, we concluded that no impairment was indicated as of the measurement date.
Derivative financial instruments
We utilize certain derivative instruments, from time to time, including forward contracts and interest rate swaps and caps to manage variability in cash flow associated with commodity market price risk exposure in the aluminum market and interest rates. We do not enter into derivatives for speculative purposes. As of December 30, 2017, and December 31, 2016, we did not have any open forward contracts for the purchase of aluminum, or any interest rate caps or swaps. Additional information with regards to derivative instruments is contained in Note 9.
Concentrations of credit risk
Financial instruments, which potentially subject us to concentrations of credit risk, consist principally of cash and cash equivalents and trade accounts receivable. Accounts receivable are due primarily from dealers and distributors of building materials, and other companies in the construction industry, primarily located in Florida. Credit is extended based on an evaluation of the customer’s financial condition and credit history, and generally collateral is not required. The Company maintains an allowance for potential credit losses on trade receivables.
We maintain our cash with several financial institutions, the balance of which exceeds federally insured limits. At December 30, 2017, and December 31, 2016, our cash balance exceeded the insured limit by $32.3 million and $37.5 million, respectively.
Comprehensive income
The Company reports comprehensive income, defined as the total of net income and other comprehensive income, which is composed of all other non-owner changes in equity, and the components thereof, in its consolidated statements of comprehensive income.
The components of other comprehensive income relate to gains and losses on cash flow hedges, to the extent effective. Reclassification adjustments reflecting such gains and losses are recorded as income in the same period as the hedged items affect earnings. There were no components of comprehensive income for 2017 or 2016.
Stock-based compensation
We use a fair-value based approach for measuring stock-based compensation and record compensation expense over an award’s vesting period based on the award’s fair value at the date of grant. Our Company’s awards vest based on service conditions and compensation expense is recognized on a straight-line basis for each separately vesting portion of an award. Stock-based compensation expense is recognized only for those awards that ultimately vest.
Income and Sales Taxes
We account for income taxes utilizing the liability method. Deferred income taxes are recorded to reflect consequences on future years of differences between financial reporting and the tax basis of assets and liabilities measured using the enacted statutory tax
- 47 -
Table of Contents
rates and tax laws applicable to the periods in which differences are expected to affect taxable earnings. We have no liability for unrecognized tax benefits. However, should we accrue for such liabilities, when and if they arise in the future, we will recognize interest and penalties associated with uncertain tax positions as part of our income tax provision. Refer to Note 11 for additional information regarding the Company’s income taxes.
Sales taxes collected from customers have been recorded on a net basis.
Net income per common share
Basic earnings per share is computed using the weighted average number of common shares outstanding during the period. Diluted earnings per share is computed using the weighted average number of common shares outstanding during the period, plus the dilutive effect of common stock equivalents using the treasury stock method.
Our weighted average shares outstanding excludes underlying securities of 19 thousand, 20 thousand, and 66 thousand for the years ended December 30, 2017, December 31, 2016, and January 2, 2016, respectively, because their effects were anti-dilutive.
The table below presents the calculation of basic and diluted earnings per share, including a reconciliation of weighted average common shares:
| Year Ended | ||||||||||||
| December 30, | December 31, | January 2, | ||||||||||
| 2017 | 2016 | 2016 | ||||||||||
| (in thousands, except per share amounts) | ||||||||||||
| Numerator: |
||||||||||||
| Net income |
$ | 39,839 | $ | 23,747 | $ | 23,552 | ||||||
|
|
|
|
|
|
|
|||||||
| Denominator: |
||||||||||||
| Weighted-average common shares—Basic |
49,522 | 48,856 | 48,272 | |||||||||
| Add: Dilutive effect of stock compensation plans |
2,206 | 1,723 | 2,096 | |||||||||
|
|
|
|
|
|
|
|||||||
| Weighted-average common shares—Diluted |
51,728 | 50,579 | 50,368 | |||||||||
|
|
|
|
|
|
|
|||||||
| Net income per common share: |
||||||||||||
| Basic |
$ | 0.80 | $ | 0.49 | $ | 0.49 | ||||||
|
|
|
|
|
|
|
|||||||
| Diluted |
$ | 0.77 | $ | 0.47 | $ | 0.47 | ||||||
|
|
|
|
|
|
|
|||||||
3. Recent Accounting Pronouncements
Accounting Pronouncements Recently Adopted
In January 2017, the FASB issued ASU 2017-04, “Intangibles—Goodwill and Other (Topic 350): Simplifying the Test for Goodwill Impairment.” ASU 2017-04 simplifies the subsequent measurement of goodwill by eliminating “Step 2” from the goodwill impairment test. The amendment also eliminates the requirement for any reporting unit with a zero or negative carrying amount to perform a qualitative assessment. An entity still has the option to perform the qualitative assessment for a reporting unit to determine if the quantitative impairment test is necessary. This update is effective for our fiscal year beginning after December 15, 2019 and shall be adopted prospectively. Early adoption is permitted for interim or annual goodwill impairment tests performed on testing dates after January 1, 2017. The Company elected to adopt this standard as of January 1, 2017. The application of this standard did not have any impact on the Company’s financial position, results of operations or cash flows.
In March 2016, the Financial Accounting Standards Board (“FASB”) issued Accounting Standards Update (“ASU”) No. 2016-09, “Compensation—Stock Compensation, Improvements to Employee Share-Based Payment Accounting (Topic 718)”. This update is intended to provide simplification of the accounting for share-based payment transactions, including the accounting for income taxes, forfeitures, and statutory tax withholding requirements, as well as classification in the statement of cash flows. We adopted this update effective for our fiscal year beginning January 1, 2017. Impacts of the adoption of ASU 2016-09 are as follows:
| • | ASU 2016-09 requires employers to make a policy election as to whether they will continue to use previous generally accepted accounting principles, which required employers to recognize stock-based compensation expense on grants of equity awards net of an estimate of the amount that will be forfeited, or to recognize forfeitures on an actual basis in the period they occur. We have elected to change our method of accounting for forfeitures, from one of estimating forfeitures, |
- 48 -
Table of Contents
| to recognizing forfeitures on an actual basis in the period they occur, adopted on a modified-retrospective basis. This resulted in an adjustment to increase accumulated deficit for previously unrecognized stock compensation expense of approximately $109 thousand as of December 31, 2016, net of deferred tax effect of $69 thousand, with an offsetting increase in additional paid-in capital of approximately $178 thousand. |
| • | ASU 2016-09 requires that employee taxes paid when an employer withholds shares for tax-withholding purposes be reported as a financing activity. The Company withholds shares of its common stock from employees to satisfy the employee’s tax withholding obligations in connection with the exercise of stock options and lapse of restrictions on stock awards, which are then immediately retired. We previously included these cash flows in financing activities, therefore, there was no impact upon adoption. |
| • | ASU 2016-09 requires that excess tax benefits resulting from the exercise of stock options and lapse of restriction on stock awards be recognized as a discrete item in tax expense, where previously such tax effects had been recognized in additional paid-in-capital. See Note 11 for a discussion of the impacts of the adoption of ASU 2016-09 on the Company’s income tax expense for the year ended December 30, 2017. |
| • | ASU 2016-09 requires previously unrecognized excess tax benefits to be recognized on a modified-retrospective basis, which results from taking a deduction for tax benefits relating to stock-based compensation that does not result in a reduction in taxes payable. Upon adoption, we recorded an adjustment to decrease the accumulated deficit for excess tax benefits that had not yet been recognized of approximately $264 thousand as of December 31, 2016, with an offsetting reduction in our net deferred tax liability resulting from the recognition of previously unrecorded deferred tax assets for tax credits in the state of Florida. |
| • | ASU 2016-09 requires excess tax benefits to be presented as an operating activity on the statement of cash flows, either prospectively or on a full-retrospective basis, rather than as previously required as a financing activity. We have elected to present excess tax benefits in the operating section of the statement of cash flows on a prospective basis. |
The effects on the Company’s consolidated balance sheet as of December 31, 2016, relating to the adoption of ASU 2016-09 is as follows (in thousands):
| Previously | After | |||||||
| Reported | Adoption | |||||||
| Deferred income taxes |
$ | 32,171 | $ | 31,838 | ||||
|
|
|
|
|
|||||
| Total liabilities |
$ | 304,129 | $ | 303,796 | ||||
|
|
|
|
|
|||||
| Additional paid-in-capital |
$ | 249,469 | $ | 249,647 | ||||
|
|
|
|
|
|||||
| Accumulated deficit |
$ | (104,710 | ) | $ | (104,555 | ) | ||
|
|
|
|
|
|||||
| Shareholders’ equity |
$ | 145,278 | $ | 145,611 | ||||
|
|
|
|
|
|||||
| Total shareholders’ equity |
$ | 132,519 | $ | 132,852 | ||||
|
|
|
|
|
|||||
In July 2015, the FASB issued ASU No. 2015-11, “Inventory (Topic 330) – Simplifying the Measurement of Inventory”. This guidance changed the subsequent measurement of inventory, excluding inventory accounted for under LIFO or the retail inventory method, to be at lower of cost and net realizable value. Topic 330, Inventory, previously required an entity to measure inventory at the lower of cost or market. Market could have been replacement cost, net realizable value, or net realizable value less an approximately normal profit margin. Under this ASU, an entity measures inventory within its scope at the lower of cost and net realizable value. Net realizable value is the estimated selling prices in the ordinary course of business, less reasonably predictable costs of completion, disposal, and transportation. ASU 2015-11 was effective for us as of January 1, 2017. We prospectively adopted ASU 2015-11 effective on January 1, 2017. The adoption of ASU 2015-11 had no impact on our consolidated financial statements.
Accounting Pronouncements Recently Issued, Not Yet Adopted
In August 2017, the FASB issued ASU 2017-12, “Derivatives and Hedging (Topic 815): Targeted Improvements to Accounting for Hedging Activities.” The amendments under ASU 2017-12 refine and expand hedge accounting requirements for both financial (e.g., interest rate) and commodity risks. Its provisions create more transparency around how economic results are presented, both on the face of the financial statements and in the footnotes. It also makes certain targeted improvements to simplify the application of hedge accounting guidance. ASU 2017-12 becomes effective for us in the first quarter of 2019. Early application is permitted in any interim period, with the effect of adoption reflected as of the beginning of the fiscal year of adoption. We currently are not engaged in any derivative or hedging activities, but would apply the provisions of ASU 2017-12 upon our adoption of this guidance, or when it becomes effective.
- 49 -
Table of Contents
In February 2017, the FASB issued ASU 2017-05, “Other Income - Gain and Losses from the Derecognition of Nonfinancial Assets.” ASU 2017-05 clarifies the scope of Subtopic 610-20, Other Income - Gains and Losses from the Derecognition of Nonfinancial Assets and adds guidance for partial sales of nonfinancial assets. Subtopic 610-20, which was issued in May 2014 as a part of ASU 2014-09, provides guidance for recognizing gains and losses from the transfer of nonfinancial assets in contracts with non-customers. This update is effective at the same time as the amendments in ASU 2014-09, therefore, for our fiscal year beginning after December 15, 2017, and may be applied either under a full- or modified-retrospective basis. We do not expect the adoption of this guidance to have a significant effect on the Company’s consolidated financial statements.
In January 2017, the FASB issued ASU 2017-01, “Business Combinations (Topic 805) – Clarifying the Definition of a Business.” ASU 2017-01 affects all companies and other reporting organizations that must determine whether they have acquired or sold a business. The definition of a business affects many areas of accounting including acquisitions, disposals, goodwill, and consolidation. The amendments are intended to help companies and other organizations evaluate whether transactions should be accounted for as acquisitions (or disposals) of assets or businesses. ASU 2017-01 provides a more robust framework to use in determining when a set of assets and activities is a business. It also provides more consistency in applying the guidance, reduces the costs of application, and makes the definition of a business more operable. This update is effective for our fiscal year beginning after December 15, 2017, including interim periods therein. We do not expect adoption of this guidance to have a significant effect on the Company’s consolidated financial statements.
In August 2016, the FASB issued ASU 2016-15, “Statement of Cash Flows (Topic 230): Classification of Certain Cash Receipts and Cash Payments (a consensus of the Emerging Issues Task Force).” ASU 2016-15 reduces diversity in practice in how certain transactions are classified in the statement of cash flows. The new standard will become effective for the Company beginning with the first quarter of 2018, with early adoption permitted. We do not expect the adoption of this guidance to have a material impact on the Company’s consolidated financial statements.
In June 2016, the FASB issued ASU 2016-13, “Financial Instruments - Credit Losses (Topic 326): Measurement of Credit Losses on Financial Instruments”. ASU 2016-13 amends the impairment model to utilize an expected loss methodology in place of the currently used incurred loss methodology, which will result in the timely recognition of losses. This update is effective for our fiscal year beginning after December 15, 2019, including interim periods within those fiscal years. ASU 2016-13 also applies to employee benefit plan accounting, with an effective date of fiscal years beginning after December 15, 2020, and interim periods within those fiscal years. We are currently assessing the impact that adopting this new accounting standard will have on our consolidated financial statements, footnote disclosures and employee benefit plan accounting.
In February 2016, the Financial Accounting Standards Board (FASB) issued Accounting Standards Update (ASU) No. 2016-02, “Leases (Topic 842)”. This guidance supersedes the existing guidance for lease accounting, Leases (Topic 840). ASU 2016-02 requires lessees to recognize leases on their balance sheets, and leaves lessor accounting largely unchanged. The amendments in this ASU are effective for fiscal years beginning after December 15, 2018 and interim periods within those fiscal years. Early application is permitted for all entities. ASU 2016-02 requires a modified retrospective approach for all leases existing at, or entered into after, the date of initial application, with an option to elect to use certain transition relief. The Company is currently evaluating the impact of this new standard on its consolidated financial statements.
In May 2014, the FASB issued ASU 2014-09, “Revenue from Contracts with Customers.” ASU 2014-09 replaces the existing accounting standards for revenue recognition with a single comprehensive five-step model. The core principle is to recognize revenue upon the transfer of goods or services to customers at an amount that reflects the consideration expected to be received. The FASB also issued ASU 2015-14, “Deferral of Effective Date.” ASU 2015-14 deferred the effective date for the new guidance until the annual reporting period beginning after December 15, 2017, and interim periods within those annual periods. The standard permits the use of either the full-retrospective (restating all years presented in the Company’s financial statements) or modified-retrospective (recording the impact of adoption as an adjustment to retained earnings at the beginning of the year of adoption) transition methods. Since its issuance, the FASB has also amended several aspects of the new guidance, including; ASU 2016-08, “Revenue from Contracts with Customers (Topic 606): Principal versus Agent Considerations (Reporting Revenue Gross versus Net)”; which clarifies the Topic 606 guidance on principal versus agent considerations, ASU 2016-10, “Revenue from Contracts with Customers (Topic 606) – Identifying Performance Obligations and Licensing”, which clarifies identification of a performance obligation and addresses revenue recognition associated with the licensing of intellectual property, ASU 2016-12, “Revenue from Contracts with Customers (Topic 606), Narrow Scope Improvements and Practical Expedients”, which clarifies assessment of collectability criterion, non-cash consideration and other technical corrections, and ASU 2016-20, “Technical Corrections and Improvements to Topic 606, Revenue from Contracts with Customers”, which is the result of the FASB Board decision to issue a separate Update for technical corrections and improvements. The Company will adopt the provisions of this new accounting standard at the beginning of fiscal year 2018, using the modified-retrospective method.
- 50 -
Table of Contents
The Company completed its preliminary assessment of the impact of its upcoming adoption of ASU 2014-09 on its consolidated financial statements. The Company recognizes revenue currently under existing GAAP, which is a model based on the transfer of the risks and rewards of ownership. Predominantly, for the Company, this has been at the point in time that possession of goods has transferred to the customer upon delivery. The model for recognizing revenue will change under ASU 2014-09, to one based on the transfer of control of the product to the customer. Under ASU 2014-09, revenue is recognized when an entity satisfies its obligation by transferring control of the goods or services to the customer, and transfer of possession of the product is not required in order for transfer of control of the product to the customer to have occurred.
We believe that the Company meets the criteria for recognizing revenue over time as the Company’s performance (i.e. creation of a good or service for the customer) does not create an asset with an alternative use, and the Company has an enforceable right to payment for performance completed to-date. ASU 2014-09 states that, when evaluating whether the goods or services have an alternative use, an entity should consider the level of customization of the goods or services. A high level of customization is a strong indicator that the goods or services do not have an alternative use and, therefore, revenue would be recognized over time as an entity performs.
The Company is a manufacturer of fully-customized windows and doors, and manufactures products based on design specifications, measurements, colors, finishes, framing materials, glass-types, and other options selected by the customer at the point in time an order is received from the customer. The Company’s assessment is that its finished goods have no alternative use, as that term is defined in ASU 2014-09, and that control of the product passes to the customer no later than completion of the manufacturing of each or all of the products in an order, but before delivery of the products to the customer. Additionally, the Company has an enforceable right to payment at the time an order is received and accepted at the agreed-upon sales prices contained in our agreements with our customers for all manufacturing efforts expended by the Company on behalf of its customers.
Based on this assessment, the Company will be required to change its method of recognizing revenue, to one of recognizing revenue over time as products are manufactured, but no later than completion of the manufacturing process, from its current method of recognizing revenue upon delivery of the product to the customer. The Company is continuing to evaluate its manufacturing processes to assess at what point the products have no alternative use and the recognition of revenue should begin. However, because revenue will have been recognized on at least all products for which manufacturing has been completed, upon adoption of ASU 2014-09, inventories on its consolidated balance sheets will no longer include finished goods. While the Company will recognize revenue at an earlier point under ASU 2014-09, such effect may not materially affect its consolidated statements of operations post-adoption as such effects will exist at both the beginning and end of fiscal periods after the initial transition.
ASU 2014-09 also requires entities, primarily in the manufacturing segment, to make policy elections relating to shipping and handling charges. Entities may elect to treat shipping and handling as a separate performance activity and recognize revenue from shipping and handling as performance occurs. Conversely, entities may also elect to treat shipping and handling as a fulfillment activity, which will require shipping and handling costs for undelivered products to be accrued to match this cost with the revenue previously recognized over time. The Company currently recognizes shipping and handling costs as a fulfillment activity and has determined to continue to treat such costs as a fulfillment activity.
ASU 2014-09 also provides for a practical expedient which permits expensing of costs to obtain a contract when the expected amortization period is one year or less, which typically results in expensing commissions paid to employees. We expect to continue to expense sales commissions paid to employees as sales are recognized, as the expected amortization period is less than one year.
Upon adoption, we expect a net decrease to the opening balance of accumulated deficit of between approximately $1.3 million and $1.7 million related to revenues of between $6.7 million and $8.7 million, net of related costs including estimated accruals for warranty costs, shipping and handling costs and sales commissions, that would have been earned over time versus at a point in time.
4. Recent Transaction, Including Sale of Assets and Acquisitions
Sale of Door Glass Processing Assets
On September 22, 2017, we entered into an Asset Purchase Agreement (APA) with Cardinal LG Company (Cardinal) for the sale to Cardinal of certain manufacturing equipment we used in processing glass components for PGT-branded doors for a cash purchase price of $28 million. Contemporaneously with entering into the APA, we entered into a seven-year supply agreement (SA) with Cardinal for Cardinal to supply us with glass components for PGT-branded doors. The Company determined to sell these assets and enter the SA to allow us to heighten our focus in our core areas of window and door manufacturing and, at the same time, strengthen our supply chain for high-quality door glass from a supplier with whom we have been doing business for many years.
- 51 -
Table of Contents
The Company has determined that, although the APA and SA are separate agreements, they were negotiated contemporaneously. Therefore, the Company has concluded that the $28 million of proceeds under the APA should be bifurcated between the sale of the door glass manufacturing assets, and as payment received from a vendor for the Company’s agreement to buy glass components for PGT-branded doors from Cardinal under the SA. The bifurcation of the proceeds in excess of the fair value of the assets acquired would be allocated to the SA and recognized as a reduction of cost of sales as the glass components are recognized by PGTI. Based on the established fair market value of the assets sold, as determined by an independent appraisal, approximately $7.7 million will be allocated to the sale of the assets, and the remaining $20.3 million represents consideration received from our vendor related to the agreement to buy door glass for PGT-branded doors from Cardinal, and that amount will be deferred and amortized to income over the 7-year term of the SA.
At the time we ceased using these assets in production and they became available for immediate sale, their net book value was $4.7 million, and they were reclassified from property, plant and equipment, to assets held for sale within other current assets.
The APA provided for the transfer of the assets from the Company to Cardinal in two phases, with the first date being in late 2017, and the second date in early 2018, on or about March 1, 2018, or such other date as the Company and Cardinal agree to use. Under the APA, the cash purchase price of $28 million is to be paid by Cardinal to the Company in three separate payments of $3 million on or about the time of the first transfer of the assets to Cardinal, $10 million on or about January 15, 2018, and $15 million at or about the time of the second transfer of assets to Cardinal.
On November 1, 2017, Cardinal paid us $3.0 million in cash pursuant to the APA. On December 15, 2018, machinery and equipment classified as assets held for sale with net book value of $1.5 million, and fair value of $1.9 million was transferred to Cardinal and their equipment riggers. At that time, we recorded a gain on disposal of assets of $363 thousand in the accompanying consolidated statement of operations for the year ended December 30, 2017. The remaining machinery and equipment to be transferred to Cardinal in 2018 with a net book value of $3.2 million and fair value of $5.8 million, is classified within other current assets in the accompanying consolidated balance sheet at December 30, 2017.
The SA provides that the Company will purchase, and Cardinal will supply, all the Company’s requirements for certain glass components used in PGT-branded doors through the end of 2024. The terms of the manufacture by Cardinal and purchase by the Company of such glass components as to purchase orders, forecasts of purchases, pricing, invoicing, delivery and payment terms and other terms, are all as described in the SA. Early in the fourth quarter of 2017, we began purchasing and receiving glass components from Cardinal under the SA. Accordingly, we began amortizing the advance consideration received from our vendor initially allocated to the SA, and recognized $628 thousand of such gain amortization, classified as a reduction to cost of sales in the accompanying consolidated statement of operations for the year ended December 30, 2017.
WinDoor, Inc.
On February 16, 2016 (“closing date”), we completed the acquisition of WinDoor, which became a wholly-owned subsidiary of PGT Industries, Inc. The fair value of consideration transferred in the acquisition was $102.6 million, including the then estimated fair value of contingent consideration of $3.0 million, which has been allocated to the net assets acquired and liabilities assumed as of the acquisition date, in accordance with ASC 805, “Business Combinations”. The cash portion of the acquisition was financed with borrowings under the 2016 Credit Agreement, and with $43.5 million of cash on hand.
The fair value of assets acquired and liabilities assumed as of the closing date, were as follows (in thousands):
| Final Allocation | ||||
| Accounts and notes receivable |
$ | 3,882 | ||
| Inventories |
6,778 | |||
| Prepaid expenses |
246 | |||
| Property and equipment |
5,029 | |||
| Intangible assets |
47,100 | |||
| Goodwill |
41,856 | |||
| Accounts payable and accrued liabilities |
(2,320 | ) | ||
|
|
|
|||
| Purchase price |
$ | 102,571 | ||
|
|
|
|||
| Consideration: |
||||
| Cash |
$ | 99,571 | ||
| Contingent consideration |
3,000 | |||
|
|
|
|||
| Total fair value of consideration |
$ | 102,571 | ||
|
|
|
|||
- 52 -
Table of Contents
The fair value of working capital related items, such as accounts receivable, inventories, prepaids, and accounts payable and accrued liabilities, approximated their book values at the date of acquisition. Valuations of the intangible assets (See Note 7) were valued using income and royalty relief approaches based on projections provided by management, which we consider to be Level 3 inputs.
Acquisition costs totaling $0.9 million are included in selling, general, and administrative expenses on the consolidated statement of operations for the year ended December 31, 2016, and relate to legal expenses, representations and warranties insurance, diligence, and accounting services.
The remaining consideration, after identified intangible assets and the net assets and liabilities recorded at fair value, was determined to be $41.9 million, of which $38.9 million is expected to be deductible for tax purposes. Goodwill represents the increased value of the combined entity through additional sales channel opportunities as well as operational efficiencies.
The stock purchase agreement for the acquisition of WinDoor (“SPA”) provided for the potential for an earn-out contingency payment to sellers had WinDoor achieved a certain level of sales in the calendar year ended December 31, 2016. The potential undiscounted amount of all future payments that could be required to be paid under the contingent earn-out consideration arrangement was between $0 and $3.0 million. We had recorded an earn-out contingency liability of $3.0 million on the closing date, which represented its then estimated fair value using undiscounted cash flows, based on probability adjusted level of revenues with a range whose minimum was $51.0 million. Based on revised estimates using actual sales through the end of the 2016 third quarter, we concluded the probability was remote that WinDoor’s actual sales for 2016 would reach the $46.0 million minimum level required for the minimum payment of $2.7 million possible under the earn-out contingency arrangement and, therefore, determined that the entire initial estimated fair value of $3.0 million should be reversed. For tax purposes, contingent consideration does not become part of tax goodwill until paid. As such, the amount of goodwill deductible for tax purposes is $3.0 million less than the amount recorded for book purposes.
The SPA had a post-closing working capital calculation whereby we were required to prepare, and deliver to the sellers, a final statement of purchase price, including our calculation of the amount we find net working capital actually to have been as of the closing date. During the third quarter of 2016, the Company and the sellers reached agreement on the calculation of net working capital, which resulted in a payment of $0.7 million to the Company from sellers, resulting in a decrease in the purchase price which we recorded as a reduction in goodwill.
The following unaudited pro forma financial information assumes the acquisition had occurred at the beginning of the earliest period presented that does not include WinDoor’s actual results for the entire period. Pro forma results have been prepared by adjusting our historical results to include the results of WinDoor adjusted for the following: amortization expense related to the intangible assets arising from the acquisition and interest expense to reflect the 2016 Credit Agreement entered into in connection with the acquisition. The unaudited pro forma results below do not necessarily reflect the results of operations that would have resulted had the acquisition been completed at the beginning of the earliest periods presented, nor does it indicate the results of operations in future periods. The unaudited pro forma results do not include the impact of synergies, nor any potential impacts on current or future market conditions which could alter the following unaudited pro forma results.
| Year Ended | ||||||||
| December 31, | January 2, | |||||||
| Pro Forma Results (unaudited) | 2016 | 2016 | ||||||
| (in thousands, except per share amounts) | ||||||||
| Net sales |
$ | 461,011 | $ | 430,626 | ||||
|
|
|
|
|
|||||
| Net income |
$ | 22,402 | $ | 17,912 | ||||
|
|
|
|
|
|||||
| Net income per common share: |
||||||||
| Basic |
$ | 0.46 | $ | 0.37 | ||||
|
|
|
|
|
|||||
| Diluted |
$ | 0.44 | $ | 0.36 | ||||
|
|
|
|
|
|||||
- 53 -
Table of Contents
US Impact Systems, Inc.
On August 31, 2016, CGIC, a wholly-owned subsidiary of CGI, and the Company, entered into an asset purchase agreement with US Impact Systems, Inc. (USI) and its stockholders whereby CGIC purchased the operations and certain assets of, and assumed certain liabilities of USI. USI was an established fabricator of storefront window and door products. The fair value of the consideration transferred in the acquisition was $1.9 million, which was allocated to current and other assets totaling $1.8 million and amortizable intangible assets totaling $0.6 million, and goodwill of $0.6 million, less the assumption of accounts payable and accrued liabilities with estimated fair values totaling $1.2 million, in accordance with ASC 805, “Business Combinations”. This transaction did not have a significant impact on our financial position or operating results for 2016.
5. Property, Plant and Equipment
The following table presents the composition of property, plant and equipment as of:
| December 30, | December 31, | |||||||
| 2017 | 2016 | |||||||
| (in thousands) | ||||||||
| Land |
$ | 6,298 | $ | 6,298 | ||||
| Buildings and improvements |
53,703 | 51,681 | ||||||
| Machinery and equipment |
79,015 | 79,421 | ||||||
| Vehicles |
12,914 | 11,415 | ||||||
| Software |
19,989 | 16,640 | ||||||
| Construction in progress |
7,347 | 6,319 | ||||||
|
|
|
|
|
|||||
| Property, plant and equipment |
179,266 | 171,774 | ||||||
| Less: Accumulated depreciation |
(95,133 | ) | (87,565 | ) | ||||
|
|
|
|
|
|||||
| Property, plant and equipment, net |
$ | 84,133 | $ | 84,209 | ||||
|
|
|
|
|
|||||
In 2017, property, plant and equipment with net book value of $4.7 million were transferred to assets held for sale related to the sale of machinery and equipment to Cardinal. See note 4.
6. Goodwill, Trade Names and Other Intangible Assets
Trade names and other intangible assets are as follows as of:
| Initial | ||||||||||||
| December 30, | December 31, | Useful Life | ||||||||||
| 2017 | 2016 | (in years) | ||||||||||
| (in thousands) | ||||||||||||
| Goodwill |
$ | 108,060 | $ | 108,060 | indefinite | |||||||
|
|
|
|
|
|||||||||
| Other intangible assets: |
||||||||||||
| Trade names |
$ | 75,841 | $ | 75,841 | indefinite | |||||||
|
|
|
|
|
|||||||||
| Customer relationships |
106,647 | 106,647 | 3-10 | |||||||||
| Developed technology |
3,000 | 3,000 | 9-10 | |||||||||
| Non-compete agreement |
1,668 | 1,668 | 2-5 | |||||||||
| Software license |
590 | — | 2 | |||||||||
| Less: Accumulated amortization |
(72,703 | ) | (66,226 | ) | ||||||||
|
|
|
|
|
|||||||||
| Subtotal |
39,202 | 45,089 | ||||||||||
|
|
|
|
|
|||||||||
| Other intangible assets, net |
$ | 115,043 | $ | 120,930 | ||||||||
|
|
|
|
|
|||||||||
Amortizable Intangible Assets
We test amortizable intangible assets for impairment when indicators of impairment exist. No impairment was recorded for any period presented.
- 54 -
Table of Contents
Estimated amortization of our customer relationships, developed technology and non-compete agreement intangible assets is as follows for future fiscal years:
| (in thousands) | Total | |||
| 2018 |
$ | 6,635 | ||
| 2019 |
6,430 | |||
| 2020 |
6,278 | |||
| 2021 |
5,974 | |||
| 2022 |
5,116 | |||
| Thereafter |
8,769 | |||
|
|
|
|||
| Total |
$ | 39,202 | ||
|
|
|
|||
7. Accrued Liabilities
Accrued liabilities consisted of the following as of:
| December 30, | December 31, | |||||||
| 2017 | 2016 | |||||||
| Accrued liabilities | (in thousands) | |||||||
| Accrued payroll and benefits |
$ | 8,700 | $ | 4,384 | ||||
| Accrued federal and state income taxes |
6,497 | — | ||||||
| Accrued warranty |
4,443 | 4,494 | ||||||
| Customer deposits |
3,540 | 2,176 | ||||||
| Accrued interest |
1,029 | 1,660 | ||||||
| Accrued health claims insurance payable |
806 | 668 | ||||||
| Net advance vendor consideration |
517 | — | ||||||
| Other |
2,642 | 1,527 | ||||||
|
|
|
|
|
|||||
| Accrued liabilities |
$ | 28,174 | $ | 14,909 | ||||
|
|
|
|
|
|||||
Other accrued liabilities are comprised primarily of state sales taxes and customer rebates. See Note 4 for a discussion of the net advance vendor consideration relating to Cardinal Glass Industries as of December 30, 2017.
8. Long-Term Debt
Long-term debt consists of the following:
| December 30, | December 31, | |||||||
| 2017 | 2016 | |||||||
| (in thousands) | ||||||||
| Term loan payable with a payment of $0.675 million due quarterly. A lump sum payment of $253.8 million due on February 15, 2022. Interest payable quarterly at LIBOR or the prime plus an applicable margin. At December 30, 2017, the average rate is 1.46% plus a margin of 4.75%. At December 31, 2016, the average rate was 1.00% plus a margin of 5.75%. |
$ | 223,975 | $ | 263,975 | ||||
| Other debt |
458 | — | ||||||
| Fees, costs and original issue discount (1) |
(11,460 | ) | (16,102 | ) | ||||
|
|
|
|
|
|||||
| 212,973 | 247,873 | |||||||
| Less current portion of long-term debt |
(294 | ) | — | |||||
|
|
|
|
|
|||||
| Long-term debt, less current portion |
$ | 212,679 | $ | 247,873 | ||||
|
|
|
|
|
|||||
| (1) | Fees, costs and original issue discount represents third-party fees, lender fees, other debt-related costs, and original issue discount, recorded as a reduction of the carrying value of the debt, and is being amortized over the life of the debt instrument under the effective interest method. |
- 55 -
Table of Contents
2016 Credit Agreement
On February 16, 2016, we entered into the 2016 Credit Agreement, among us, the lending institutions identified in the 2016 Credit Agreement, and Deutsche Bank AG New York Branch, as Administrative Agent and Collateral Agent. The 2016 Credit Agreement establishes new senior secured credit facilities in an aggregate amount of $310.0 million, consisting of a $270.0 million Term B term loan facility maturing in February 2022 that will amortize on a basis of 1% annually during the six-year term, and a $40.0 million revolving credit facility maturing in February 2021 that includes a swing line facility and a letter of credit facility. Our obligations under the 2016 Credit Agreement are secured by substantially all of our assets as well as our direct and indirect subsidiaries’ assets. As of December 30, 2017, there were $0.2 million of letters of credit outstanding and $39.8 million available on the revolver.
Interest on all loans under the 2016 Credit Agreement is payable either quarterly or at the expiration of any LIBOR interest period applicable thereto. Borrowings under the term loans and the revolving credit facility accrue interest at a rate equal to, at our option, LIBOR (with a floor of 100 basis points in respect of the term loan), or a base rate (with a floor of 200 basis points in respect of the term loan) plus an applicable margin. The applicable margin was 575 basis points in the case of LIBOR and 475 basis points in the case of the base rate. However, due to our repricing of this facility in February 2017, these rates have been decreased to 475 basis points in the case of LIBOR and 375 basis points in the case of the base rate. We pay quarterly fees on the unused portion of the revolving credit facility equal to 50 basis points per annum as well as a quarterly letter of credit fee at 575 basis points per annum plus a 12.5 basis point facing fee per annum on the face amount of any outstanding letters of credit.
The face value of the 2016 Credit Agreement at the time of issuance was $270.0 million of which $2.0 million has been repaid as scheduled debt repayments through December 31, 2016. In addition, we made a voluntary prepayment of $4.0 million on September 30, 2016, using internally generated cash on hand. During 2017, we made additional voluntary prepayments totaling $40.0 million. We elected to apply the prepayment against upcoming required principal repayments in direct order of maturity, as permitted under the 2016 Credit Agreement, resulting in no required repayments of principal until the maturity of the facility in February 2022. As of December 30, 2017, the face value of debt outstanding under the 2016 Credit Agreement was $224.0 million, and accrued interest was $1.0 million.
The Company incurred third-party fees and costs totaling $1.5 million, and additional lender fees and discount of $14.6 million in the February 2016 refinancing. As a result of the voluntary prepayments of debt discussed above, we accelerated the amortization of lenders fees and discount relating to the term-loan portion of the 2016 Credit Agreement of $0.2 million in 2016, and of $1.9 million in 2017, which are included in interest expense in the accompanying consolidated statement of operations for the years ended December 31, 2016, and December 30, 2017, respectively.
All debt-related fees, costs and original issue discount, including those related to the revolving credit portion of the facility, is classified as a reduction of the carrying value of long-term debt. The activity relating to third-party fees and costs, lender fees and discount for the year ended December 30, 2017, are as follows:
| (in thousands) | Total | |||
| At beginning of year |
$ | 16,102 | ||
| Amortization expense through February 17, 2017 |
(359 | ) | ||
|
|
|
|||
| At time of refinancing |
15,743 | |||
| Less: Amortization expense after repricing |
(2,394 | ) | ||
| Less: Accelerated amortization relating to debt prepayment |
(1,889 | ) | ||
|
|
|
|||
| At end of year |
$ | 11,460 | ||
|
|
|
|||
Estimated amortization expense relating to third-party fees and costs, lender fees and discount for the years indicated, as of December 30, 2017, is as follows:
| (in thousands) | Total | |||
| 2018 |
$ | 2,583 | ||
| 2019 |
2,754 | |||
| 2020 |
2,996 | |||
| 2021 |
2,775 | |||
| 2022 |
352 | |||
|
|
|
|||
| Total |
$ | 11,460 | ||
|
|
|
|||
- 56 -
Table of Contents
As a result of voluntary prepayments of $4.0 million in 2016, and $40.0 million in 2017, as previously mentioned, our next scheduled repayment is not until the maturity of the facility in February 2022. The contractual future maturities of long-term debt outstanding, including other debt relating to our software license financing arrangement, as of December 30, 2017, are as follows (at face value):
| (in thousands) | Total | |||
| 2018 |
$ | 294 | ||
| 2019 |
164 | |||
| 2020 |
— | |||
| 2021 |
— | |||
| 2022 |
223,975 | |||
|
|
|
|||
| Total |
$ | 224,433 | ||
|
|
|
|||
The 2016 Credit Agreement contains a springing financial covenant. If we draw in excess of twenty percent (20%) of the revolving facility, which requires us to maintain a maximum total net leverage ratio (based on the ratio of total debt for borrowed money to EBITDA, each as defined in the 2016 Credit Agreement), and is tested quarterly based on the last four fiscal quarters and is set at levels as described in the 2016 Credit Agreement. As of December 30, 2017, no test is required as we have not exceeded 20% of our revolving capacity.
The 2016 Credit Agreement also contains a number of affirmative and restrictive covenants, including limitations on the incurrence of additional debt, liens on property, acquisitions and investments, loans and guarantees, mergers, consolidations, liquidations and dissolutions, asset sales, dividends and other payments in respect of our capital stock, prepayments of certain debt and transactions with affiliates. The 2016 Credit Agreement also contains customary events of default. Upon the occurrence of an event of default, the amounts outstanding under the 2016 Credit Agreement may be accelerated and may become immediately due and payable.
Other Debt
In July 2017, we entered into a two-year financing arrangement for the purchase of an enterprise-wide software license relating to office productivity software. This financing arrangement requires 24 monthly payments of $26 thousand each. We estimated the value of this financing arrangement to be $590 thousand, using an imputed annual interest rate of 6.00%, which approximates our borrowing rate under the 2016 Credit Agreement, a Level 3 input. At December 30, 2017, there was $458 thousand outstanding under this financing arrangement.
Interest Expense, Net
Interest expense, net consisted of the following:
| Year Ended | ||||||||||||
| December 30, | December 31, | January 2, | ||||||||||
| 2017 | 2016 | 2016 | ||||||||||
| (in thousands) | ||||||||||||
| Long-term debt |
$ | 15,644 | $ | 17,351 | $ | 10,562 | ||||||
| Debt fees |
290 | 296 | 269 | |||||||||
| Amortization and write-offs of deferred finncing costs and debt discount |
4,642 | 2,721 | 1,014 | |||||||||
| Interest income |
(236 | ) | (105 | ) | (70 | ) | ||||||
|
|
|
|
|
|
|
|||||||
| Interest expense |
20,340 | 20,263 | 11,775 | |||||||||
| Capitalized interest |
(61 | ) | (138 | ) | (70 | ) | ||||||
|
|
|
|
|
|
|
|||||||
| Interest expense, net |
$ | 20,279 | $ | 20,125 | $ | 11,705 | ||||||
|
|
|
|
|
|
|
|||||||
- 57 -
Table of Contents
9. Derivatives
Aluminum Forward Contracts
From time to time we use aluminum forward contracts to hedge the fluctuations in the purchase price of aluminum extrusions we use in production. These contracts are initially designated as cash flow hedges since they are believed to be highly effective in offsetting changes in the cash flows attributable to forecasted purchases of aluminum. However, in 2014, we designated all of our then existing aluminum hedges as ineffective. The change in value of those aluminum forward contracts was recognized in other expense, net, on the consolidated statement of operations for the year ended January 2, 2016 and totaled $0.4 million.
There were no derivative financial instruments or related activity during the year ended December 30, 2017, or December 31, 2016. The following represents the gains (losses) on derivative financial instruments for the year ended January 2, 2016, and their classifications within the accompanying consolidated financial statements (in thousands):
| Derivatives in Cash Flow Hedging Relationships | ||||||||||||
| Amount of Gain or (Loss) Recognized in OCI on Derivatives (Effective Portion) |
Location of Gain or (Loss) Reclassified from Accumulated OCI into Income (Effective Portion) |
Amount of Loss Reclassified from Accumulated OCI into Income (Effective Portion) |
||||||||||
| Year Ended | Year Ended | |||||||||||
| January 2, | January 2, | |||||||||||
| 2016 | 2016 | |||||||||||
| Aluminum contracts |
$ | 126 | Cost of sales | $ | — | |||||||
| Location of Gain or (Loss) Recognized in Income on Derivatives (Ineffective Portion) |
Amount of Gain or (Loss) Recognized in Income on Derivatives (Ineffective Portion) |
|||||||
| Year Ended | ||||||||
| January 2, | ||||||||
| 2016 | ||||||||
| Aluminum contracts |
Other expense, net | ($ | 388 | ) | ||||
- 58 -
Table of Contents
10. Fair Value
Fair value is defined as the price that would be received to sell an asset or paid to transfer a liability in an orderly transaction between market participants. A three-tier fair value hierarchy is used to prioritize the inputs used in measuring fair value. The hierarchy gives the highest priority to unadjusted quoted market prices in active markets for identical assets or liabilities and the lowest priority to unobservable inputs. A financial instrument’s level within the fair value hierarchy is based on the lowest level of any input that is significant to the fair value measurement. The three levels of the fair value hierarchy are as follows:
Level 1 Unadjusted quoted prices in active markets that are accessible at the measurement date for identical, unrestricted assets or liabilities.
Level 2 Inputs other than quoted prices included in Level 1 that are observable for the asset or liability, either directly or indirectly.
Level 3 Prices or valuations that require inputs that are both significant to the fair value measurement and unobservable.
The accounting guidance concerning fair value allows us to elect to measure financial instruments at fair value and report the changes in fair value through earnings. This election can only be made at certain specified dates and is irrevocable once made. We do not have a policy regarding specific assets or liabilities to elect to measure at fair value, but rather we make the election on an instrument-by-instrument basis as they are acquired or incurred.
During 2017, 2016, or 2015, we did not make any transfers between Level 1, Level 2 or Level 3 financial assets. We conduct reviews on a quarterly basis to verify pricing, assess liquidity, and determine if significant inputs have changed that would impact the fair value hierarchy disclosure.
Fair Value of Financial Instruments
Our financial instruments, not including derivative financial instruments, include cash, accounts and notes receivable, and accounts payable, and accrued liabilities whose carrying amounts approximate their fair values due to their short-term nature. Our financial instruments also include long-term debt. The fair value of our long-term debt is based on debt with similar terms and characteristics and was approximately $227.3 million as of December 30, 2017, compared to a principal outstanding value of $224.0 million, and $264.6 million as of December 31, 2016, compared to a principal outstanding value of $264.0 million.
11. Income Taxes
Income Tax Expense
We consider all income sources, including other comprehensive income, in determining the amount of tax expense allocated to continuing operations.
The components of income tax expense are as follows (in thousands):
| Year Ended | ||||||||||||
| December 30, | December 31, | January 2, | ||||||||||
| 2017 | 2016 | 2016 | ||||||||||
| Current: |
||||||||||||
| Federal |
$ | 8,063 | $ | 4,602 | $ | 8,861 | ||||||
| State |
1,066 | 921 | 443 | |||||||||
|
|
|
|
|
|
|
|||||||
| 9,129 | 5,523 | 9,304 | ||||||||||
|
|
|
|
|
|
|
|||||||
| Deferred: |
||||||||||||
| Federal |
(10,010 | ) | 5,371 | 4,893 | ||||||||
| State |
944 | 906 | 1,100 | |||||||||
|
|
|
|
|
|
|
|||||||
| (9,066 | ) | 6,277 | 5,993 | |||||||||
|
|
|
|
|
|
|
|||||||
| Income tax expense |
$ | 63 | $ | 11,800 | $ | 15,297 | ||||||
|
|
|
|
|
|
|
|||||||
- 59 -
Table of Contents
The aggregate amount of income taxes included in the consolidated statements of operations and consolidated statements of shareholders’ equity are as follows (in thousands):
| Year Ended | ||||||||||||
| December 30, | December 31, | January 2, | ||||||||||
| 2017 | 2016 | 2016 | ||||||||||
| Consolidated statements of income: |
||||||||||||
| Income tax expense relating to continuing operations |
$ | 63 | $ | 11,800 | $ | 15,297 | ||||||
| Consolidated statements of shareholders’ equity: |
||||||||||||
| Reversal of intraperiod tax allocation |
$ | — | $ | — | $ | (1,595 | ) | |||||
| Income tax expense relating to derivative financial instruments |
$ | — | $ | — | $ | 50 | ||||||
| Income tax benefit relating to share-based compensation |
$ | — | $ | (1,872 | ) | $ | (3,840 | ) | ||||
The reversal of intra-period income tax allocation of $1.6 million in the year ended January 2, 2016 represents income tax expense previously classified within accumulated other comprehensive losses, relating to the intra-period income taxes on our effective aluminum hedges, which we reversed in the second quarter of 2015 as the result of the culmination of our remaining cash flow hedges.
Reconciliation Of The Statutory Rate To The Effective Rate
A reconciliation of the statutory federal income tax rate to our effective rate is provided below:
| Year Ended | ||||||||||||
| December 30, | December 31, | January 2, | ||||||||||
| 2017 | 2016 | 2016 | ||||||||||
| Statutory federal income tax rate |
35.0 | % | 35.0 | % | 35.0 | % | ||||||
| State income taxes, net of federal income tax benefit |
3.8 | % | 3.8 | % | 3.8 | % | ||||||
| Change in net deferred tax liability related to U.S. tax reform |
(31.1 | )% | — | — | ||||||||
| Excess stock-based compensation tax benefits |
(4.6 | )% | — | — | ||||||||
| Domestic manufacturing deduction |
(2.5 | )% | (1.8 | )% | (2.2 | )% | ||||||
| Research activities credits |
(0.2 | )% | (2.8 | )% | — | |||||||
| Florida jobs creation incentive credits |
(0.5 | )% | (0.6 | )% | (2.0 | )% | ||||||
| Change in valuation allowance on deferred tax assets |
— | (0.2 | )% | 0.3 | % | |||||||
| Non-deductible expenses |
0.5 | % | 0.2 | % | 0.2 | % | ||||||
| Reversal of intraperiod tax allocation |
— | — | 4.1 | % | ||||||||
| Other |
(0.2 | )% | (0.4 | )% | 0.2 | % | ||||||
|
|
|
|
|
|
|
|||||||
| 0.2 | % | 33.2 | % | 39.4 | % | |||||||
|
|
|
|
|
|
|
|||||||
- 60 -
Table of Contents
Deferred Income Taxes
Deferred income taxes reflect the net tax effects of temporary differences between the carrying amount of assets and liabilities for financial reporting purposes and the amounts used for income tax purposes. Significant components of our net deferred tax liability are as follows:
| December 30, | December 31, | |||||||
| 2017 | 2016 | |||||||
| (in thousands) | ||||||||
| Deferred tax assets: |
||||||||
| State and federal net operating loss carryforwards |
$ | 965 | $ | 2,000 | ||||
| Stock-based compensation expense |
1,663 | 2,979 | ||||||
| Accrued warranty |
1,378 | 2,149 | ||||||
| Obsolete inventory and UNICAP adjustment |
412 | 503 | ||||||
| Other deferrals and accruals, net |
691 | 899 | ||||||
| Allowance for doubtful accounts |
292 | 195 | ||||||
| Acquisition costs |
306 | 537 | ||||||
| Other |
132 | — | ||||||
|
|
|
|
|
|||||
| Total deferred tax assets |
5,839 | 9,262 | ||||||
|
|
|
|
|
|||||
| Deferred tax liabilities: |
||||||||
| Trade names and other intangible assets, net |
(16,749 | ) | (26,007 | ) | ||||
| Property, plant and equipment |
(8,056 | ) | (10,492 | ) | ||||
| Goodwill |
(3,099 | ) | (3,193 | ) | ||||
| Deferred financing costs |
(659 | ) | (1,241 | ) | ||||
| Prepaid expenses |
(48 | ) | (167 | ) | ||||
|
|
|
|
|
|||||
| Total deferred tax liabilities |
(28,611 | ) | (41,100 | ) | ||||
|
|
|
|
|
|||||
| Total deferred tax liabilities, net |
$ | (22,772 | ) | $ | (31,838 | ) | ||
|
|
|
|
|
|||||
We acquired goodwill deductible for tax purposes in the CGI acquisition as the transaction was treated as an acquisition of stock for tax purposes. At the date of the acquisition, the amount of goodwill deductible for tax purposes from the CGI acquisition was $9.3 million. At the time of the acquisition, this goodwill was the same amount for both book and tax purposes and, therefore, no deferred tax asset or liability was recognized. As we amortize this goodwill for tax purposes over its remaining life, which was approximately 7.4 years at the time of the acquisition, we will recognize a deferred tax liability. The unamortized amount of this goodwill was $5.2 million and $6.5 million at December 30, 2017, and December 31, 2016, respectively.
We have goodwill deductible for tax purposes in the WinDoor acquisition as the transaction was treated as an acquisition of stock treated as a step-up acquisition of assets and assumption of liabilities pursuant to our election under section 338(h)(10) of the Internal Revenue Code. We expect to be able to deduct goodwill for tax purposes of $38.9 million from the WinDoor transaction. The unamortized amount of this goodwill was $33.9 million and $36.5 million at December 30, 2017, and December 31, 2016, respectively.
Also, acquisition costs totaling $0.9 million included in selling, general, and administrative expenses on the consolidated statement of operations for the year ended December 31, 2016, and relating to legal expenses, representations and warranties insurance, diligence, and accounting services, are being deferred and amortized for tax purposes over the same period as tax deductible goodwill.
We have goodwill deductible for tax purposes in the USI acquisition as the transaction was treated as an acquisition of assets and assumption of liabilities for both book and tax purposes. We expect to be able to deduct goodwill for tax purposes of $0.6 million from the USI transaction. The unamortized amount of this goodwill was $0.5 million and $0.6 million at December 30, 2017, and December 31, 2016, respectively.
We estimate that we have $1.0 million of tax-affected state operating loss carryforwards, as of December 30, 2017, expiring at various dates through 2027.
We adopted ASU 2016-09 effective on January 1, 2017. As a result, excess tax benefits resulting from the exercise of stock options and lapse of restriction on stock awards are now recognized as a discrete item in tax expense, where previously such tax
- 61 -
Table of Contents
effects had been recognized in additional paid-in-capital. Income tax expense in the year ended December 30, 2017, includes excess tax benefits totaling $1.8 million. Prior to the adoption of ASU 2016-09 at the beginning of 2017, concurrent with the full utilization of all of our regular net operating loss carry-forwards during 2013, for the years ended December 31, 2016, and January 2, 2016, we recognized $1.9 million and $3.8 million, respectively, of excess tax benefits (ETBs) in additional paid-in capital. Our prior policy with regard to providing for income tax expense when ETBs are utilized was to follow the “with-and-without” approach as described in ASC 740-20 and ASC 718 and include in the measurement the indirect effects of the excess tax deduction.
At January 2, 2016, we provided for a valuation allowance against net operating losses of approximately $0.2 million that we have to carryforward in North Carolina as we concluded it is not more likely than not that we will realize the full benefit of the net operating losses before expiration. During the year ended December 31, 2016, we reduced this valuation allowance by approximately $0.1 million to reflect an increase in our estimate of net operating losses we will be able to realize in North Carolina. For financial reporting purposes, we classified this valuation allowance as a reduction of state and federal net operating loss carryforwards in the above table shown above. We have no other valuation allowances on deferred tax assets at December 30, 2017, or December 31, 2016, as management’s assessment of our ability to realize our deferred tax assets is that it is more likely than not that we will generate sufficient future taxable income to realize all of our deferred tax assets.
Open Tax Years
The tax years 2011 to 2017 remain open for examination by the IRS due to the statute of limitations and net operating losses utilized in prior tax years.
The Tax Cuts And Jobs Act of 2017 (the Act)
On December 22, 2017, the President of the United States signed into law the Act. The Act includes significant changes to the U.S. corporate income tax system, including a Federal corporate rate reduction from 35% to 21%, effective January 1, 2018, limitations on the deductibility of interest expense and executive compensation, the elimination of the Section 199 domestic production activities deduction, and further restricting the deductibility of certain already restricted expenses.
The Company uses the asset and liability method of accounting for income taxes. Under this method, deferred tax assets and liabilities are recognized for the future tax consequences attributable to differences between the financial statement carrying amounts of existing assets and liabilities and their respective tax basis. Deferred tax assets and liabilities are measured using enacted tax rates expected to apply to taxable income in the years in which those temporary differences are expected to reverse. As a result of the reduction in the U.S. corporate income tax rate from 35% to 21% under the Act, the Company revalued its ending net deferred tax liabilities at December 30, 2017 and recognized a $12.4 million tax benefit in the Company’s consolidated statement of operations for the year ended December 30, 2017.
12. Commitments and Contingencies
Leases
We lease certain of our manufacturing facilities under operating leases. We also lease production equipment, vehicles, computer equipment, storage units and office equipment under operating leases. Our operating leases expire at various times through 2021. Lease expense was $4.7 million, $4.2 million and $2.3 million for the years ended December 30, 2017, December 31, 2016, and January 2, 2016, respectively. Future minimum lease commitments for non-cancelable operating leases are as follows at December 30, 2017 (in thousands):
| 2018 |
$ | 4,884 | ||
| 2019 |
4,454 | |||
| 2020 |
4,047 | |||
| 2021 |
2,570 | |||
| 2022 |
2,495 | |||
| Thereafter |
13,141 | |||
|
|
|
|||
| Total |
$ | 31,591 | ||
|
|
|
Through the terms of certain of our leases, we have the option to purchase the leased equipment for cash in an amount equal to its then fair market value plus all applicable taxes.
- 62 -
Table of Contents
Purchase Commitments
We are obligated to purchase certain raw materials used in the production of our products from certain suppliers pursuant to stocking programs. If these programs were cancelled by us, as of December 30, 2017, we would be required to pay $6.1 million for various materials. During the years ended December 30, 2017, December 31, 2016, and January 2, 2016, we made purchases under these programs totaling $175.7 million, $132.8 million and $122.0 million, respectively.
At December 30, 2017, we had a commitment to make tenant improvements relating to our new, leased facility in Miami, Florida, of $1.8 million.
At December 30, 2017, we had $0.2 million in standby letters of credit related to our workers’ compensation insurance coverage, and commitments to purchase equipment of $1.2 million.
Legal Proceedings
We are a party to various legal proceedings in the ordinary course of business. Although the ultimate disposition of those proceedings cannot be predicted with certainty, management believes the outcome of any claim that is pending or threatened, either individually or on a combined basis, will not have a materially adverse effect on our operations, financial position or cash flows.
13. Employee Benefit Plans
We have a 401(k) plan covering substantially all employees 18 years of age or older who have at least three months of service. Employees may contribute up to 100% of their annual compensation subject to Internal Revenue Code maximum limitations. We currently make matching contributions based on our operating results. During the years ended December 30, 2017, December 31, 2016, and January 2, 2016, there was a matching contribution of up to 3%, in each year made at various times during the year. Company contributions and earnings thereon vest at the rate of 20% per year of service with us when at least 1,000 hours are worked within the Plan year. We recognized expenses for such employer matching of $1.8 million, $1.9 million and $0.7 million for the years ended December 30, 2017, December 31, 2016, and January 2, 2016, respectively.
14. Related Parties
In the ordinary course of business, we sell windows to Builders FirstSource, Inc. Two of our directors, Floyd F. Sherman, and Brett Milgrim, are directors of Builders FirstSource, Inc. Total net sales to Builders FirstSource, Inc. were $13.8 million, $12.8 million and $7.9 million for the years ended December 30, 2017, December 31, 2016, and January 2, 2016, respectively. As of December 30, 2017, and December 31, 2016, there was $2.2 million and $1.7 million due from Builders FirstSource, Inc. included in accounts receivable in the accompanying consolidated balance sheets.
15. Shareholders’ Equity
During 2017, the Company purchased 23,826 shares at a total cost of approximately $0.3 million, and immediately retired, from employees to satisfy tax withholding obligations in connection with the vesting of restricted stock awards. Those shares were immediately retired.
During 2016, we repurchased 299,988 shares of our common stock at a total cost of $2.8 million, including 288,183 at a total cost of $2.7 million under the plan approved by our Board of Directors discussed below, and purchased 11,805 shares at a total cost of approximately $0.1 million from employees to satisfy tax withholding obligations in connection with the vesting of restricted stock awards. Those 11,805 shares were immediately retired.
On October 28, 2015, the Board of Directors authorized and approved a share repurchase program of up to $20 million. Any repurchases will be made in open market or privately negotiated transactions, subject to market conditions, applicable legal requirements, our 2016 Credit Agreement, and other relevant factors. We do not intend to repurchase any shares from directors, officers, or other affiliates. The program does not obligate us to acquire any specific number of shares. The timing, manner, price and amount of repurchases will be determined at the Company’s discretion, and the program may be suspended, terminated or modified at any time for any reason. In the future, we may make opportunistic repurchases of our common stock as we see fit.
- 63 -
Table of Contents
16. Employee Stock-Based Compensation
2014 Plan
On March 28, 2014, we adopted the 2014 Omnibus Equity Incentive Plan (the “2014 Plan”) whereby equity-based awards may be granted by the Board to eligible non-employee directors, selected officers and other employees, advisors and consultants of ours. On May 7, 2014, our stockholders approved the 2014 Plan.
2014 Omnibus Equity Incentive Plan
| • | total number of shares of common stock available for grant thereunder, 1,500,000, |
| • | sets forth the types of awards eligible under the plan, including issuances of options, share appreciation rights, restricted shares, restricted share units, share bonuses, other share-based awards and cash awards, and |
| • | set forth 1,500,000 as the maximum number of shares that may be made subject to awards in any calendar year to any “covered employee” (within the meaning of Section 162(m) of the Internal Revenue Code). |
There were 827,142 shares available for grant under the 2014 Plan at December 30, 2017.
2006 Plan
On June 5, 2006, we adopted the 2006 Equity Incentive Plan (the “2006 Plan”) under which equity-based awards could be granted by the Board to eligible non-employee directors, selected officers and other employees, advisors and consultants of ours. On April 6, 2010, our stockholders approved the PGT Innovations, Inc. (formerly PGT, Inc.) Amended and Restated 2006 Equity Incentive Plan (the “Amended and Restated 2006 Equity Incentive Plan”). With the adoption of the 2014 Plan effective on March 28, 2014, no further shares will be granted and, therefore, no shares are available under the Amended and Restated 2006 Equity Incentive Plan.
New Issuances
During 2017, we issued a total of 291,173 shares of restricted stock awards to certain directors, executives and non-executive employees of the Company, all from the 2014 Plan. The restrictions on these awards lapse at various time periods through 2019 and had a weighted average fair value on the dates of the grants of $10.47 as described below.
On March 3, 2017, we issued 251,474 shares of restricted stock to certain executive and non-executive employees of the Company. The final number of shares awarded under the issuance on March 3, 2017, is subject to adjustment based on the performance of the Company for the 2017 fiscal year and will become final after December 30, 2017. The performance criteria, as defined in the share awards, provided for a graded awarding of shares based on the percentage by which the Company meets earnings before interest and taxes, as defined, in our 2017 business plan. The percentages, ranging from less than 80% to greater than 120%, provide for the awarding of shares ranging from 0% to 150% of the target amount and only related to half of the initial March 3, 2017, issuance of 251,474 shares, or 125,737 shares. The final award is also affected by forfeitures upon the termination of a grantee’s employment with the Company. The remaining 125,737 shares from the March 3, 2017, issuance were not subject to adjustment based on any performance or other criteria. The grant date fair value of the March 3, 2017, award was $10.20 per share.
On May 19, 2017, we issued a total of 34,699 shares of restricted stock awards to the seven board members of the Company as the non-cash portion of their annual compensation for participation on the Company’s Board of Directors. The restrictions on these awards lapse in one year, and have a weighted average fair value on date of grant of $11.60 based on the New York Stock Exchange market price of the common stock on the close of business on the day the awards were granted.
The compensation cost that was charged against income for stock compensation plans was $1.9 million, $1.9 million and $1.8 million, respectively, for the years ended December 30, 2017, December 31, 2016, and January 2, 2016, and is included in selling, general and administrative expenses in the accompanying consolidated statements of operations. See Notes 3 and 11 for a discussion of our adoption of ASU 2016-09, and excess income tax benefits for the three years ended December 30, 2017.
- 64 -
Table of Contents
Stock Options
A summary of the status of our stock options as of December 30, 2017, and changes during the year then ended, is presented below:
| Number of Shares |
Weighted Average Exercise Price |
Weighted Average Life |
||||||||||
| Outstanding at December 31, 2016 |
2,624,950 | $ | 2.08 | |||||||||
| Exercised |
(470,622 | ) | $ | 2.00 | ||||||||
|
|
|
|||||||||||
| Outstanding at December 30, 2017 |
2,154,328 | $ | 2.09 | 2.4 | ||||||||
|
|
|
|||||||||||
| Exercisable at December 30, 2017 |
2,146,328 | $ | 2.06 | 2.4 | ||||||||
|
|
|
|||||||||||
The following table summarizes information about employee stock options outstanding at December 30, 2017, (dollars in thousands, except share and per share amounts):
| Exercise Price |
Remaining Contractual Life |
Outstanding | Outstanding Intrinsic Value |
Exercisable | Exercisable Intrinsic Value |
|||||||||||||||
| $1.98-$2.31 |
2.2 Years | 2,134,328 | $ | 31,688 | 2,134,328 | $ | 31,688 | |||||||||||||
| $11.81 |
6.2 Years | 20,000 | 101 | 12,000 | 60 | |||||||||||||||
|
|
|
|
|
|
|
|
|
|||||||||||||
| 2,154,328 | $31,789 | 2,146,328 | $31,748 | |||||||||||||||||
|
|
|
|
|
|
|
|
|
|||||||||||||
The aggregate intrinsic value of options outstanding and of options exercisable as of December 31, 2016, was $24.6 million and $24.6 million, respectively. The aggregate intrinsic value of options outstanding and of options exercisable as of January 2, 2016, was $29.7 million and $29.5 million, respectively. The total grant date fair value of options vested during the years ended December 30, 2017, December 31, 2016, and January 2, 2016, was $29 thousand, $32 thousand and $1.2 million, respectively.
For the year ended December 30, 2017, we received approximately $0.9 million in proceeds from the exercise of 470,622 options for which we recognized $1.8 million in excess tax benefits as a discrete item of income tax expense. The aggregate intrinsic value of stock options exercised during the year ended December 31, 2017, was $5.1 million. For the year ended December 31, 2016, we received approximately $1.0 million in proceeds from the exercise of 537,364 options for which we recognized $1.9 million in excess tax benefits through additional paid in capital. The aggregate intrinsic value of stock options exercised during the year ended December 31, 2016, was $5.1 million. For the year ended January 2, 2016, we received $2.2 million in proceeds from the exercise of 1,033,750 options for which we recognized $3.8 million in excess tax benefits through additional paid in capital. The aggregate intrinsic value of stock options exercised during the year ended January 2, 2016, was $10.8 million.
Restricted Share Awards
There were 291,173 restricted share awards granted in the year ended December 30, 2017, which will vest at various time periods through 2020.
- 65 -
Table of Contents
A summary of the status of restricted share awards as of December 30, 2017, and changes during the year then ended, are presented below:
| Number of Shares |
Weighted Average Fair Value |
|||||||
| Outstanding at December 31, 2016 |
426,302 | $ | 10.05 | |||||
| Granted |
291,173 | $ | 10.47 | |||||
| Vested |
(179,679 | ) | $ | 10.60 | ||||
| Forfeited/Performance adjustment |
(141,682 | ) | $ | 9.40 | ||||
|
|
|
|||||||
| Outstanding at December 30, 2017 |
396,114 | $ | 10.35 | |||||
|
|
|
|||||||
As of December 30, 2017, the remaining compensation cost related to non-vested share awards was $1.6 million which is expected to be recognized in earnings using an accelerated method resulting in higher levels of compensation costs occurring in earlier periods over a weighted average period of 1.4 years.
17. Accumulated Other Comprehensive Loss
There was no activity within accumulated other comprehensive income during the years ended December 30, 2017, or December 31, 2016. The following table shows the components of accumulated other comprehensive loss for the year ended January 2, 2016:
| Aluminum | ||||
| Forward | ||||
| (in thousands) | Contracts | |||
| Balance at January 3, 2015 |
$ | (1,671 | ) | |
|
|
|
|||
| Other comprehensive income before reclassification |
126 | |||
| Tax effect |
(50 | ) | ||
| Reclassification of income tax allocation |
1,595 | |||
|
|
|
|||
| Net current-period other comprehensive income |
1,671 | |||
|
|
|
|||
| Balance at January 2, 2016 |
$ | — | ||
|
|
|
|||
There was no reclassification activity from accumulated other comprehensive income (loss) during the years ended December 30, 2017, or December 31, 2016. The follow table shows reclassifications out of accumulated other comprehensive loss for the year ended January 2, 2016:
| Amounts Reclassified From Accumulated Other Comprehensive Income (Loss) | ||||||||
| Affected Line Item in Statement Where Net Income is Presented |
||||||||
| Year Ended | ||||||||
| January 2, | ||||||||
| 2016 | ||||||||
| (in thousands) |
||||||||
| Aluminum forward contracts |
$ | 126 | Cost of sales | |||||
| Tax effect |
(50 | ) | Tax expense | |||||
| Income tax allocation |
1,595 | Tax expense | ||||||
18. Sales by Product Group
The FASB has issued guidance under ASC 280, Segment Reporting topic of the Codification which requires us to disclose certain information about our operating segments. Operating segments are defined as components of an enterprise with separate financial information which are evaluated regularly by the chief operating decision maker and are used in resource allocation and performance assessments.
- 66 -
Table of Contents
We operate as a single operating segment that manufactures windows and doors. Our chief operating decision maker evaluates performance by reviewing a few major categories of product sales and then considering costs on a total company basis. Sales by product group are as follows:
| Year Ended | ||||||||||||
| December 30, | December 31, | January 2, | ||||||||||
| (in millions) | 2017 | 2016 | 2016 | |||||||||
| Product category: |
||||||||||||
| Impact-resistant window and door products |
$ | 433.4 | $ | 381.6 | $ | 319.2 | ||||||
| Non-impact window and door products |
77.7 | 77.0 | 70.6 | |||||||||
|
|
|
|
|
|
|
|||||||
| Total net sales (1) |
$ | 511.1 | $ | 458.6 | $ | 389.8 | ||||||
|
|
|
|
|
|
|
|||||||
| (1) | Includes sales of $460.4 million in 2017, $414.4 million in 2016, and $344.5 million in the state of Florida. |
19. Unaudited Quarterly Financial Data
The following tables summarize the consolidated quarterly results of operations for the years ended December 30, 2017, and December 30, 2016 (in thousands, except per share amounts):
| Year Ended December 30, 2017 | ||||||||||||||||
| First Quarter |
Second Quarter |
Third Quarter |
Fourth Quarter |
|||||||||||||
| Net sales |
$ | 112,721 | $ | 137,384 | $ | 126,876 | $ | 134,100 | ||||||||
| Gross profit |
31,739 | 44,553 | 39,748 | 42,944 | ||||||||||||
| Net income |
2,999 | 10,255 | 6,292 | 20,293 | ||||||||||||
| Net income per share – basic |
$ | 0.06 | $ | 0.21 | $ | 0.13 | $ | 0.41 | ||||||||
| Net income per share – diluted |
$ | 0.06 | $ | 0.20 | $ | 0.12 | $ | 0.39 | ||||||||
| Year Ended December 31, 2016 | ||||||||||||||||
| First Quarter |
Second Quarter |
Third Quarter |
Fourth Quarter |
|||||||||||||
| Net sales |
$ | 100,206 | $ | 119,033 | $ | 129,807 | $ | 109,504 | ||||||||
| Gross profit |
29,983 | 37,470 | 41,086 | 31,559 | ||||||||||||
| Net income |
1,479 | 7,350 | 10,796 | 4,122 | ||||||||||||
| Net income per share – basic |
$ | 0.03 | $ | 0.15 | $ | 0.22 | $ | 0.08 | ||||||||
| Net income per share – diluted |
$ | 0.03 | $ | 0.15 | $ | 0.21 | $ | 0.08 | ||||||||
Earnings per share are computed independently for each of the quarters presented; therefore, the sum of the quarterly earnings per share may not equal the annual earnings per share. Each of our fiscal quarters above consists of 13 weeks.
- 67 -
Table of Contents
| Item 9. | CHANGES IN AND DISAGREEMENTS WITH ACCOUNTANTS ON ACCOUNTING AND FINANCIAL DISCLOSURE |
None.
| Item 9A. | CONTROLS AND PROCEDURES |
Disclosure Controls and Procedures
Our management, under the supervision and with the participation of our principal executive officer and principal financial officer, evaluated the effectiveness of our disclosure controls and procedures (as defined in Rules 13a-15(e) and 15d-15(c) of the Securities and Exchange Act of 1934, as amended, or the Exchange Act) as of December 30, 2017. Our disclosure controls and procedures are designed to ensure that information required to be disclosed by us in the reports that we file or submit under the Exchange Act is recorded, processed, summarized, and reported, within the time periods specified in the rules and forms of the SEC. These disclosure controls and procedures include, among other things, controls and procedures designed to ensure that information required to be disclosed by us in the reports that we file under the Exchange Act is accumulated and communicated to our management, including our principal executive officer and principal financial officer, as appropriate, to allow timely decisions regarding required disclosure. In designing and evaluating the disclosure controls and procedures, our management recognizes that any controls and procedures, no matter how well designed and operated, can provide only reasonable assurance of achieving the desired control objectives. In addition, management is required to apply its judgment in evaluating the benefits of possible disclosure controls and procedures relative to their costs to implement and maintain.
Based on management’s evaluation, our principal executive officer and principal financial officer concluded that, as of December 30, 2017, our disclosure controls and procedures are effective to ensure that information required to be disclosed by us in reports that we file or submit under the Exchange Act is recorded, processed, summarized, and reported within the time periods specified in SEC rules and forms and that such information is accumulated and communicated to our management, including our principal executive officer and principal financial officer, as appropriate, to allow timely decisions regarding required disclosure.
Internal Control over Financial Reporting
Management’s annual report on internal control over financial reporting.
Internal control over financial reporting (as defined in Rules 13a-15(f) and 15d-15(f) under the Exchange Act) refers to the process designed by, or under the supervision of, our Chief Executive Officer and Chief Financial Officer, and effected by our board of directors, management and other personnel, to provide reasonable assurance regarding the reliability of financial reporting and the preparation of financial statements for external purposes in accordance with generally accepted accounting principles. Management is responsible for establishing and maintaining adequate internal control over our financial reporting.
We have evaluated the effectiveness of our internal control over financial reporting as of December 30, 2017. The evaluation was performed based on criteria established in Internal Control – Integrated Framework (2013) issued by the Committee of Sponsoring Organizations of the Treadway Commission. Based on such evaluation, management concluded that, as of such date, our internal control over financial reporting is effective.
The effectiveness of the Company’s internal control over financial reporting as of December 30, 2017, has been audited by KPMG LLP, an independent registered public accounting firm, which also audited the Company’s Consolidated Financial Statements for the year ended December 30, 2017. KPMG LLP’s report on internal control over financial reporting is set forth below.
Changes in Internal Control over Financial Reporting
There have been no changes in our internal control over financial reporting for the quarter ended December 30, 2017, identified in connection with the evaluation described above that have materially affected, or are reasonably likely to materially affect, our internal control over financial reporting.
b. Attestation report of the registered public accounting firm.
- 68 -
Table of Contents
Report of Independent Registered Public Accounting Firm
To the Stockholders and Board of Directors
PGT Innovations, Inc.:
Opinion on Internal Control Over Financial Reporting
We have audited PGT Innovations, Inc. and subsidiaries’ (the “Company”) internal control over financial reporting as of December 30, 2017, based on criteria established in Internal Control – Integrated Framework (2013) issued by the Committee of Sponsoring Organizations of the Treadway Commission. In our opinion, the Company maintained, in all material respects, effective internal control over financial reporting as of December 30, 2017, based on criteria established in Internal Control – Integrated Framework (2013) issued by the Committee of Sponsoring Organizations of the Treadway Commission.
We also have audited, in accordance with the standards of the Public Company Accounting Oversight Board (United States) (“PCAOB”), the consolidated balance sheets of the Company as of December 30, 2017 and December 31, 2016, the related consolidated statements of operations, comprehensive income, shareholders’ equity, and cash flows for each of the years in the three-year period ended December 30, 2017, and the related notes and financial statement schedule II (collectively, the “consolidated financial statements”), and our report dated March 14, 2018 expressed an unqualified opinion on those consolidated financial statements.
Basis for Opinion
The Company’s management is responsible for maintaining effective internal control over financial reporting and for its assessment of the effectiveness of internal control over financial reporting, included in the accompanying Management’s annual report on internal control over financial reporting included in item 9A. Our responsibility is to express an opinion on the Company’s internal control over financial reporting based on our audit. We are a public accounting firm registered with the PCAOB and are required to be independent with respect to the Company in accordance with the U.S. federal securities laws and the applicable rules and regulations of the Securities and Exchange Commission and the PCAOB.
We conducted our audit in accordance with the standards of the PCAOB. Those standards require that we plan and perform the audit to obtain reasonable assurance about whether effective internal control over financial reporting was maintained in all material respects. Our audit of internal control over financial reporting included obtaining an understanding of internal control over financial reporting, assessing the risk that a material weakness exists, and testing and evaluating the design and operating effectiveness of internal control based on the assessed risk. Our audit also included performing such other procedures as we considered necessary in the circumstances. We believe that our audit provides a reasonable basis for our opinion.
Definition and Limitations of Internal Control Over Financial Reporting
A company’s internal control over financial reporting is a process designed to provide reasonable assurance regarding the reliability of financial reporting and the preparation of financial statements for external purposes in accordance with generally accepted accounting principles. A company’s internal control over financial reporting includes those policies and procedures that (1) pertain to the maintenance of records that, in reasonable detail, accurately and fairly reflect the transactions and dispositions of the assets of the company; (2) provide reasonable assurance that transactions are recorded as necessary to permit preparation of financial statements in accordance with generally accepted accounting principles, and that receipts and expenditures of the company are being made only in accordance with authorizations of management and directors of the company; and (3) provide reasonable assurance regarding prevention or timely detection of unauthorized acquisition, use, or disposition of the company’s assets that could have a material effect on the financial statements.
Because of its inherent limitations, internal control over financial reporting may not prevent or detect misstatements. Also, projections of any evaluation of effectiveness to future periods are subject to the risk that controls may become inadequate because of changes in conditions, or that the degree of compliance with the policies or procedures may deteriorate.
/s/ KPMG LLP
Tampa, Florida
March 14, 2018
Certified Public Accountants
- 69 -
Table of Contents
| Item 9B. | OTHER INFORMATION |
None.
| Item 10. | DIRECTORS, EXECUTIVE OFFICERS AND CORPORATE GOVERNANCE |
Executive Officers
The information required by this item with respect to our executive officers is set forth in our 2018 Proxy Statement under the caption “Governance of the Company” and is incorporated herein by reference.
Directors
The information required by this item with respect to our board of directors and committees thereof is set forth in our 2018 Proxy Statement under the caption “Governance of the Company” and is incorporated herein by reference.
Section 16(a) Beneficial Ownership Reporting Compliance
The information required by this item with respect to Section 16(a) beneficial ownership reporting compliance is set forth in our 2017 Proxy Statement under the caption “Compliance with Section 16(a) of the Securities Exchange Act of 1934” and is incorporated herein by reference.
| Item 11. | EXECUTIVE COMPENSATION |
The information required by this item appears in our definitive proxy statement for our annual meeting of stockholders under the captions “Executive Compensation,” “Employment Agreements”, and “Change in Control Agreements,” “Information Regarding the Board and its Committees — Information on the Compensation of Directors,” “Compensation Committee Report,” and “Compensation Committee Interlocks and Insider Participation,” which information is incorporated herein by reference.
| Item 12. | SECURITY OWNERSHIP OF CERTAIN BENEFICIAL OWNERS AND MANAGEMENT AND RELATED STOCKHOLDER MATTERS |
The information required by this item appears in our definitive proxy statement for our annual meeting of stockholders under the caption “Security Ownership of Certain Beneficial Owners and Management” and “Equity Compensation Plan Information,” which information is incorporated herein by reference.
| Item 13. | CERTAIN RELATIONSHIPS AND RELATED TRANSACTIONS, AND DIRECTOR INDEPENDENCE |
The information required by this item appears in our definitive proxy statement for our annual meeting of stockholders under the caption “Certain Relationships and Related Transactions,” which information is incorporated herein by reference.
| Item 14. | PRINCIPAL ACCOUNTANT FEES AND SERVICES |
The information required by this item appears in our definitive proxy statement for our annual meeting of stockholders under the caption “Audit Committee Report — Fees Paid to the Principal Accountant,” which information is incorporated herein by reference.
- 70 -
Table of Contents
| Item 15. | EXHIBITS, FINANCIAL STATEMENT SCHEDULES |
(a)(1) See the index to consolidated financial statements and schedule provided in Item 8 for a list of the financial statements filed as part of this report.
(2) Schedule II – Valuation and Qualifying Accounts
| Balance at | Balance at | |||||||||||||||||||
| Beginning | Added in | Costs and | End of | |||||||||||||||||
| Allowance for Doubtful Accounts |
of Period | Acquisition | expenses | Deductions (1) | Period | |||||||||||||||
| (in thousands) | ||||||||||||||||||||
| Year ended December 30, 2017 |
$ | 399 | $ | — | $ | 673 | $ | (108 | ) | $ | 964 | |||||||||
| Year ended December 31, 2016 |
$ | 336 | $ | 159 | $ | 67 | $ | (163 | ) | $ | 399 | |||||||||
| Year ended January 2, 2016 |
$ | 306 | $ | — | $ | 43 | $ | (13 | ) | $ | 336 | |||||||||
| (1) | Represents uncollectible accounts charged against the allowance for doubtful accounts, net of recoveries. |
| (3) | The following documents are filed, furnished or incorporated by reference as exhibits to this report as required by Item 601 of Regulation S-K |
- 71 -
Table of Contents
- 72 -
Table of Contents
| * | Filed herewith. |
| Item 16. | 10-K SUMMARY |
None.
- 73 -
Table of Contents
Pursuant to the requirements of Section 13 or 15(d) of the Exchange Act, the registrant has duly caused this report to be signed on its behalf by the undersigned thereunto duly authorized.
| PGT INNOVATIONS, INC. | ||
| (Registrant) | ||
| Date: March 14, 2018 | /s/ Jeffrey Jackson | |
| Jeffrey Jackson | ||
| President and Chief Executive Officer | ||
| Date: March 14, 2018 | /s/ Bradley West | |
| Bradley West | ||
| Senior Vice President and Chief Financial Officer | ||
The undersigned hereby constitute and appoint Todd King and his substitutes our true and lawful attorneys-in-fact with full power to execute in our name and behalf in the capacities indicated below any and all amendments to this report and to file the same, with all exhibits thereto and other documents in connection therewith, with the Securities and Exchange Commission, and hereby ratify and confirm all that such attorney-in-fact or his substitutes shall lawfully do or cause to be done by virtue thereof. Pursuant to the requirements of the Exchange Act, this report has been signed below by the following persons on behalf of the registrant and in the capacities and on the dates indicated.
| Signature |
Title |
Date | ||
| /s/ Rodney Hershberger |
Chairman of the Board of Directors | March 14, 2018 | ||
| Rodney Hershberger | ||||
| /s/ Jeffrey T. Jackson |
President and Chief Executive Officer (Principal Executive Officer and Director |
March 14, 2018 | ||
| Jeffrey T. Jackson | ||||
| /s/ Bradley West |
Senior Vice President and Chief Financial Officer (Principal Financial and Accounting Officer) | March 14, 2018 | ||
| Bradley West | ||||
| /s/ Alexander R. Castaldi |
Director | March 14, 2018 | ||
| Alexander R. Castaldi | ||||
| /s/ Richard D. Feintuch |
Director | March 14, 2018 | ||
| Richard D. Feintuch | ||||
| /s/ M. Joseph McHugh |
Director | March 14, 2018 | ||
| M. Joseph McHugh | ||||
| /s/ Floyd F. Sherman |
Director | March 14, 2018 | ||
| Floyd F. Sherman | ||||
| /s/ Brett N. Milgrim |
Director | March 14, 2018 | ||
| Brett N. Milgrim | ||||
| /s/ William J. Morgan |
Director | March 14, 2018 | ||
| William J. Morgan | ||||
| /s/ Sheree L. Bargabos |
Director | March 14, 2018 | ||
| Sheree L. Bargabos | ||||
- 74 -