Attached files
| file | filename |
|---|---|
| EX-99.1 - EX-99.1 - BLACKSTONE MORTGAGE TRUST, INC. | d550625dex991.htm |
| 8-K - 8-K - BLACKSTONE MORTGAGE TRUST, INC. | d550625d8k.htm |
 Blackstone Mortgage Trust, Inc. July 24, 2018 Second Quarter 2018 Results Exhibit 99.2 |
 Blackstone Mortgage Trust 1 7.6% Dividend Yield (c) 63% Loan-to-Value (d) 15% Portfolio Growth in 1H’18 BXMT Highlights Blackstone Real Estate platform drives significant growth 100% performing loan portfolio generates current cash income Stable assets financed with long- term, match-funded liabilities Portfolio positioned for yield and value protection in changing rate environment Information included in this presentation is as of or for the period ended June 30, 2018, unless otherwise indicated.
(a) Excluding loans acquired as part of the GE transaction in 2Q’15 (b) See Appendix for a definition and reconciliation to GAAP net income (c) Based on annualized dividend and BXMT closing price as of July 23, 2018 (d) Reflects LTV as of the date loans were originated or acquired by BXMT (e) Changes in interest rates and credit spreads may affect our net interest income from loans and other investments. Reflects impact on net
income, net of incentive fees. See Appendix for important
disclosures. $0.62
2Q Dividend
$12.8B
Senior Loan Portfolio
95%
Floating Rate
+$0.24
Earnings Impact per 1%
Increase in LIBOR
(e)
$3.9B
2Q Originations
Record quarterly originations
(a)
of $3.9 billion; GAAP EPS of $0.66 and Core EPS
(b)
of $0.83
Growth
Income
Stability
Protection |
 Blackstone Mortgage Trust 2 Loan Originations Loan Originations Record origination volume (c) of $3.9 billion; net fundings of $779 million Closed largest single origination, a $1.8 billion office construction loan in Hudson Yards, Manhattan Earnings & Dividends Earnings & Dividends EPS of $0.66 and Core Earnings (a) per share of $0.83, of which $0.10 was prepayment income on a San Francisco office loan and $0.06 was from the GE reserve reversal (b) Increased book value per share by $0.13 to $27.08; paid $0.62 per share dividend Second Quarter 2018 Results Portfolio Composition Portfolio Composition Capitalization Capitalization Interest Rates Interest Rates Growth of 15% in 1H’18 resulting in a $12.8 billion portfolio of senior loans (d) 100% performing portfolio with a weighted average origination LTV (e) of 63% Financed $3.5 billion of loans in 1H’18 at an average rate of L+1.68% Issued 3.3 million shares at $32.13 through the ATM program; generating $104 million of proceeds and increasing book value per share (a) See Appendix for a definition and reconciliation to GAAP net income (b) In June 2018, it was determined that repayment of the remaining loans in the GE portfolio deferral pool was substantially assured. As
such, the $8.7 million of deferred purchase discount, which has
been previously recognized in GAAP net income, was realized in Core Earnings during the three months ended June 30, 2018. (c) Excluding loans acquired as part of the GE transaction in 2Q’15 (d) Includes $489 million of Non-Consolidated Senior Interests; see Appendix for definition
(e) Reflects LTV as of the date loans were originated or acquired by BXMT 95% of the portfolio is floating rate Floating rate assets and matched liabilities support book value and earnings stability |
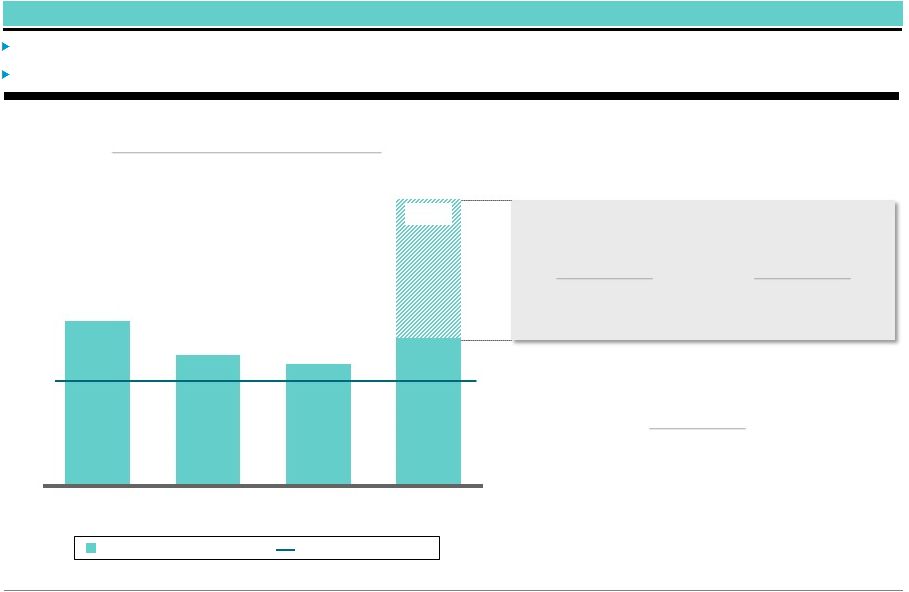 Blackstone Mortgage Trust 3 Dividends per Share Earnings & Dividends Earnings & Dividends 2Q GAAP earnings of $0.66 per share and Core Earnings (a) of $0.83 per share $0.62 per share dividend equates to a 7.6% dividend yield (b) (a) See Appendix for a definition and reconciliation to GAAP net income (b) Based on annualized dividend and BXMT closing price as of July 23, 2018 (c) GAAP EPS was $0.61, $0.59, $0.56 and $0.66 as of 3Q’17, 4Q’17, 1Q’18 and 2Q’18, respectively
$0.62
Quarterly
Dividend
113%
TTM Dividend Coverage
Dividend Coverage
(c)
$0.83
$0.10
SF Office Prepayment Fee
Early Repayment from
Property Sale
$0.06
GE Reserve Reversal
0% Realized Losses in GE
Portfolio
$0.69
$0.65
$0.64
$0.67
$0.16
3Q'17
4Q'17
1Q'18
2Q'18
Core Earnings per Share |
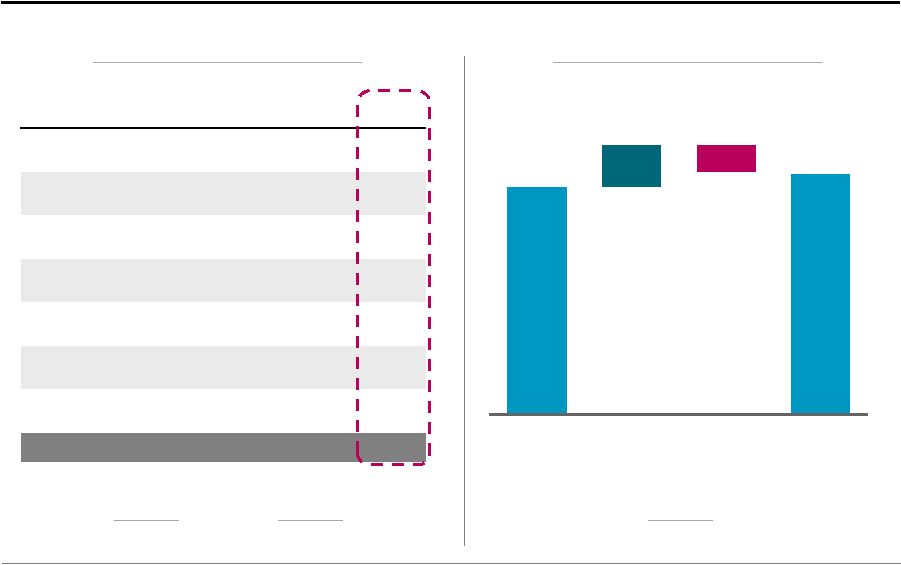
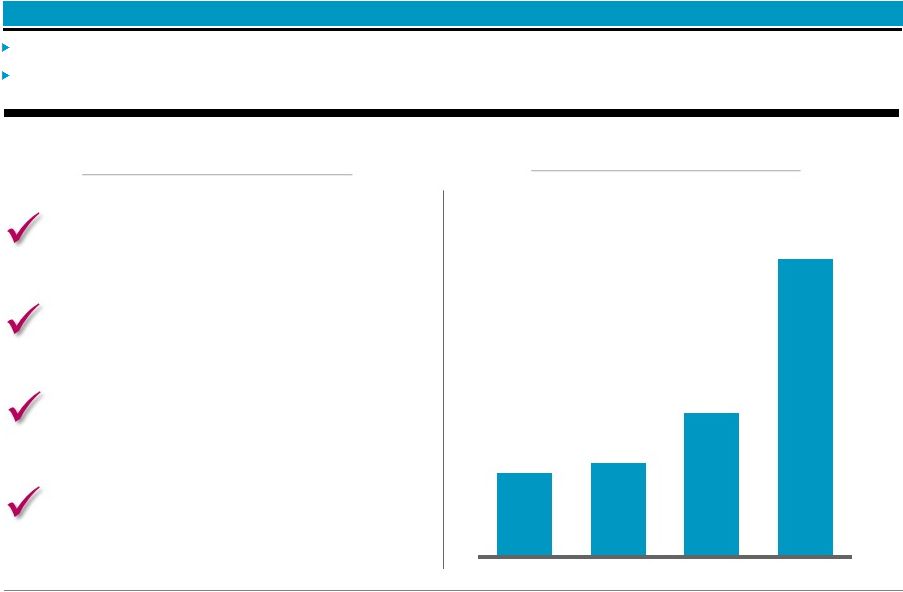 Blackstone Mortgage Trust 4 Loan Originations Loan Originations Origination volume of $3.9 billion, (a) totaling $5.8 billion 1H’18 and up $3.3 billion from 1H’17 BXMT’s scale and reach provides differentiated access to large loans, which generally have superior asset quality, sponsorship, and credit profile ($ in billions) Quarterly Origination Volume $3.9 100% senior loans 100% floating rate Strong sponsorship, core markets 2Q Origination Highlights Weighted average LTV (b) of 54% (a) Includes loans originated and acquired during the quarter (b) Reflects LTV as of the date loans were originated or acquired by BXMT $3.9 $1.1 $1.2 $1.9 3Q'17 4Q'17 1Q'18 2Q'18 |
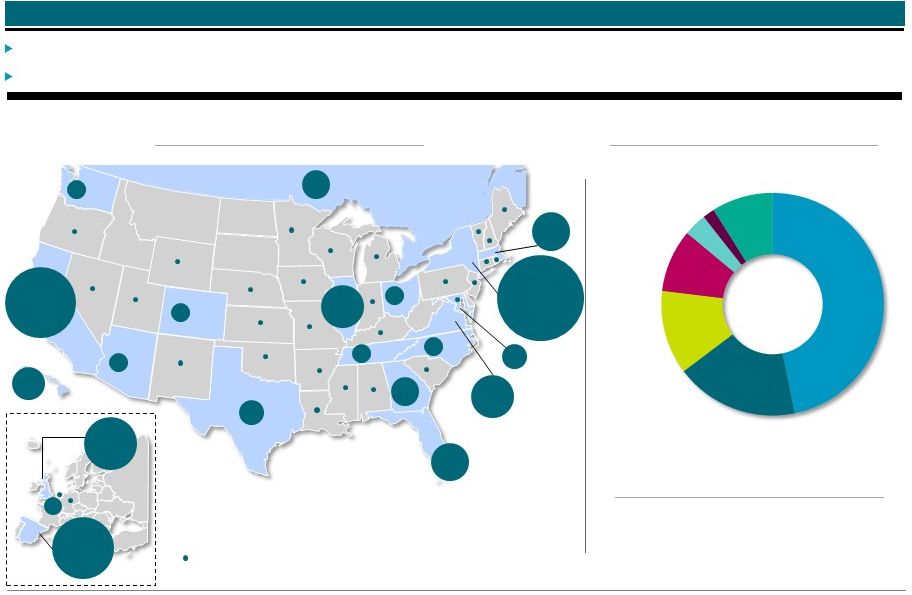 Blackstone Mortgage Trust 5 Spanish Assets Retail Portfolio Composition $12.8 billion portfolio (107 senior loans) secured by institutional quality real estate with 56% of loans in gateway markets Over 77% of the portfolio is secured by office, multifamily and hotel properties; retail declined to 3% from 7% in 1Q Office Hotel Other Multi Major Market Focus (a) Collateral Diversification (a) (a) Includes $489 million of Non-Consolidated Senior Interests; see Appendix for definition
(b) Reflects LTV as of the date loans were originated or acquired by BXMT Weighted Average LTV (b) 63% $12.8B portfolio Condo BE 1% UK 7% ES 9% CA 15% FL 4% AZ 1% WA 1% DC 2% CAN 3% HI 4% VA 6% NY 28% IL 6% TX 2% CO 1% NC 1% OH 1% TN 1% GA 3% MA 4% 47% 18% 12% 9% 3% 2% 9% States that comprise less than 1% of total loan portfolio |
 Blackstone Mortgage Trust 6 $24.67 $27.08 Re-IPO 2Q'13 2Q'18 Capitalization Total asset-level financing capacity of $12.3 billion was 69% utilized at quarter-end Raised $104 million of equity through ATM program at $32.13 per share, contributing to 10% growth in BVPS since re-IPO Book Value Per Share Growth (a) Includes $153 million of loan participations sold and $489 million of Non-Consolidated Senior Interests, which result from non-recourse sales of senior loan interests in loans BXMT originates. BXMT’s net investments in these loans are reflected in the form of mezzanine or other subordinate loans on BXMT’s balance
sheet. (b)
Represents (i) total outstanding secured debt agreements and convertible notes,
less cash, to (ii) total equity Credit
Facilities
11 Credit Providers
Corporate
Debt
Convertible Notes and
Secured Facility
Corporate Obligations
Senior Loan
Interests
(a)
$7.0
$0.8
$0.6
$7.8
Securitized
Debt
$1.3
CLO and Single Asset
Securitization
($ in billions)
2.6x
Debt-to-Equity
Ratio
(b)
Senior Syndications
Financing
(Outstanding Balance)
+10% |
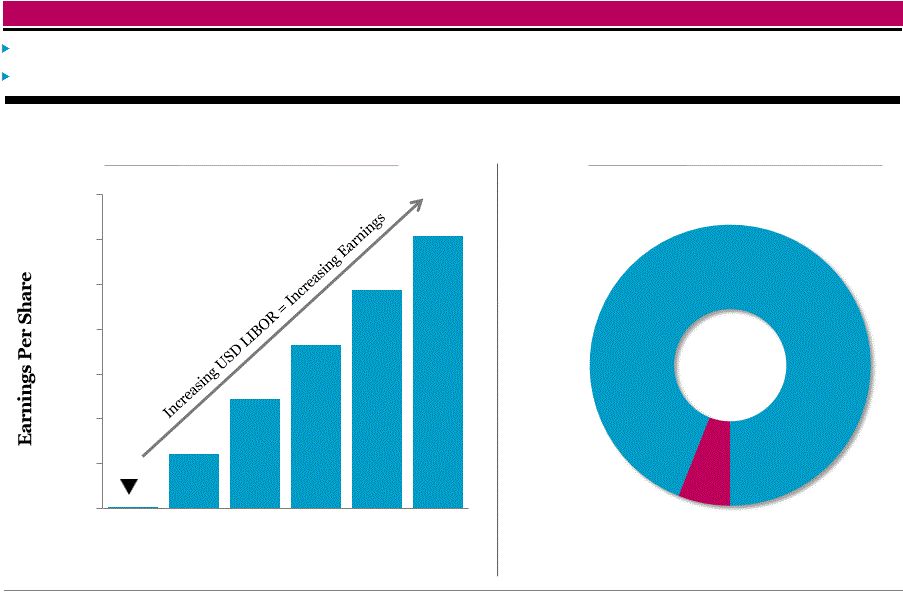 Blackstone Mortgage Trust 7 Interest Rates 95% of the portfolio is floating rate A 1.0% increase in USD LIBOR would increase earnings per share by $0.24 per annum (a) (a) Changes in interest rates and credit spreads may affect our net interest income from loans and other investments. Reflects impact on net
income, net of incentive fees. See Appendix for important
disclosures. Earnings
Sensitivity
to
USD
LIBOR
(a)
(Annual Dollars of Earnings per Share)
Portfolio Fixed vs. Floating
(% of Total Loan Exposure)
$0.70
2.09%
2.59%
3.09%
3.59%
4.09%
4.59%
$0.00
$0.10
$0.20
$0.30
$0.40
$0.50
$0.60
Floating
Fixed
95%
5%
USD LIBOR |
 Appendix |
 Blackstone Mortgage Trust 9 GAAP Net Income Adjustments Core Earnings Interest Income 191.5 $ 8.7 $ 200.2 $ Interest Expense (87.7) 0.6 (87.1)
Management and
Incentive Fees
(22.4)
—
(22.4)
General and Administrative
Expenses
(2.1)
—
(2.1)
Non-Cash
Compensation
(6.8)
6.8
—
Realized Foreign Currency
Gain, net
(a)
—
2.0
2.0
Net Income attributable to
Non-controlling Interests
(0.2)
—
(0.2)
Total
72.3
$
18.1
$
90.4
$
1Q'18 Loans Outstanding Fundings Repayments 2Q'18 Loans Outstanding Appendix – Second Quarter 2018 Operating Results & Net Funding $779 million (c) Net Fundings Net Funding ($ in billions) Operating Results ($ in millions) $12.1 $2.2 $(1.4) $12.8 (a) Primarily represents the forward points earned on our foreign currency forward contracts, which reflect the interest rate differentials
between the applicable base rate for our foreign currency
investments and USD LIBOR. These forward contracts effectively convert the rate exposure to USD LIBOR, resulting in additional interest income earned in U.S. dollar terms. These amounts are not included in GAAP net income, but rather as a component of Other Comprehensive Income in our consolidated financial
statements. (b)
Includes $996 million and $489 million of Non-Consolidated Senior Interests
as of March 31, 2018 and June 30, 2018, respectively; see Appendix for definition (c) Excludes the impact of changes in foreign currency rates and hedges for non-USD loans
$0.83
Core Earnings per Share
$0.66
Net Income per Share
(b) (b) |
 Blackstone Mortgage Trust 10 (a) Date loan was originated or acquired by BXMT, and the LTV as of such date
(b) In certain instances, loans are financed through the non-recourse sale of a senior loan interest that is not included in the
consolidated financial statements. As of June 30, 2018, three loans
in the portfolio have been financed with an aggregate $489 million of Non-Consolidated Senior Interests, which are included in the table above. (c) Maximum maturity assumes all extension options are exercised; however, floating rate loans generally may be repaid prior to their final
maturity without penalty (d)
Consists of both floating and fixed rates. Coupon and all-in yield assume
applicable floating benchmark rates for weighted-average calculation. Loan Portfolio Details ($ in millions) Origination Total Principal Net Book Maximum Property Loan Per Origination Loan Type Date (a) Loan (b) Balance (b) Value Maturity (c) Location Type SQFT / Unit / Key LTV (a) Loan 1 Senior loan 3/22/2018 $ 1,168 $ 1,168 $ 1,160 L + 3.15 % L + 3.40 % 3/15/2023 Diversified - Spain Spanish Assets n/a 71 % Loan 2 Senior loan 5/11/2017 753 675 672 L + 3.40 % L + 3.60 % 6/10/2023 Northern Virginia Office 330 / sqft 62 % Loan 3 Senior loan 5/30/2018 518 518 512 L + 2.75 % L + 2.99 % 6/9/2025 Diversified - US Hotel 12,857 / key 43 % Loan 4 Senior loan (b) 8/6/2015 488 488 89 4.49 % 5.82 % 10/29/2022 Diversified - EUR Other n/a 71 % Loan 5 Senior loan 5/1/2015 355 335 334 L + 2.85 % L + 3.02 % 5/1/2023 New York Office 425 / sqft 68 % Loan 6 Senior loan 2/13/2018 330 307 306 L + 3.42 % L + 3.54 % 3/9/2023 New York Multi 742,643 / unit 62 % Loan 7 Senior loan 1/7/2015 315 301 301 L + 3.50 % L + 3.71 % 1/9/2021 New York Office 258 / sqft 53 % Loan 8 Senior loan 3/31/2017 258 242 240 L + 4.15 % L + 4.54 % 4/9/2022 Maui Hotel 318,182 / key 75 % Loan 9 Senior loan 12/22/2017 225 225 223 L + 2.80 % L + 3.16 % 1/9/2023 Chicago Multi 326,087 / unit 65 % Loan 10 Senior loan 8/3/2016 276 221 220 L + 4.66 % L + 5.24 % 8/9/2021 New York Office 304 / sqft 57 % Loan 11 Senior loan 5/9/2018 219 219 217 L + 3.00 % L + 3.24 % 5/9/2023 New York Industrial 62 / sqft 70 % Loan 12 Senior loan 6/23/2015 221 214 214 L + 3.65 % L + 4.01 % 5/8/2022 Washington DC Office 240 / sqft 72 % Loan 13 Senior loan 6/4/2015 206 206 208 L + 4.19 % L + 4.37 % 5/20/2021 Diversified - CAN Hotel 43,468 / key 54 % Loan 14 Senior loan 1/26/2017 288 200 198 L + 5.50 % L + 5.99 % 2/9/2022 Boston Office 773 / sqft 42 % Loan 15 Senior loan 4/15/2016 225 200 198 L + 3.25 % L + 3.84 % 4/9/2023 New York Office 186 / sqft 40 % Loans 16 - 107 Senior loans Various 10,009 7,275 7,123 5.79 % (d) 6.14 % (d) Various Various Various Various 63 % Total/Wtd. avg. $ 15,854 $ 12,793 $ 12,215 5.43 % 5.81 % 4.1 yrs 63 % Cash All-in Coupon Yield |
 Blackstone Mortgage Trust 11 June 30, 2018 December 31, 2017 Assets Cash and cash equivalents 107,057 $
69,654 $
Restricted Cash
— 32,864
Loans receivable, net
12,214,565 10,056,732 Other assets
60,725 99,575
Total assets 12,382,347 $
10,258,825 $
Liabilities and equity
Secured debt agreements, net
7,022,500 $
5,273,855 $
Loan participations sold, net
152,855 80,415
Securitized debt obligations, net
1,283,311 1,282,412 Convertible notes, net
779,416 563,911
Other
liabilities 115,603
140,826 Total liabilities
9,353,685 7,341,419 Commitments and contingencies
— —
Equity Class A common stock, $0.01 par value 1,114 1,079
Additional paid-in capital 3,624,767 3,506,861 Accumulated other comprehensive loss
(32,136) (29,706)
Accumulated deficit
(570,265) (567,168)
Total Blackstone
Mortgage Trust, Inc. stockholders' equity 3,023,480
2,911,066
Non-controlling
interests 5,182
6,340 Total equity
3,028,662 2,917,406 Total liabilities and equity
12,382,347 $
10,258,825 $
Consolidated Balance Sheets
($ in thousands, except per share data) |
 Blackstone Mortgage Trust 12 Consolidated Statements of Operations ($ in thousands, except per share data) Three Months Ended June 30, Six Months Ended June 30, 2018 2017 2018 2017 Income from loans and other investments Interest and related income 191,479 $ 126,825 $ 346,904 $ 245,341 $ Less: Interest and related expenses 87,733 54,352 157,722 101,026 Income from loans and other investments, net 103,746 72,473 189,182 144,315 Other expenses Management and incentive fees 22,388 14,393 37,880 27,314 General and administrative expenses 8,747 7,373 17,454 14,800 Total other expenses 31,135 21,766 55,334 42,114 Income before income taxes 72,611 50,707 133,848 102,201 Income tax provision 104 94 224 183 Net income 72,507 $
50,613 $
133,624 $ 102,018 $ Net income attributable to non-controlling interests (195) — (353) — Net income attributable to Blackstone Mortgage Trust, Inc. 72,312 $
50,613 $
133,271 $ 102,018 $ Per share information (basic and diluted) Weighted-average shares of common stock outstanding 109,069,078 95,005,873 108,735,193 94,999,664 Net income per share of common stock 0.66 $
0.53 $
1.23 $
1.07 $
|
 Blackstone Mortgage Trust 13 Per Share Calculations (a) Represents net income attributable to Blackstone Mortgage Trust, Inc. (b) Historically, we have deferred in Core Earnings the accretion of purchase discount attributable to a certain pool of GE portfolio loans
acquired in May 2015, until repayment in full of the remaining
loans in the pool was substantially assured. During the three months ended June 30, 2018, it was determined that repayment of the remaining loans in the deferral pool was substantially assured. As such, the $8.7 million of deferred purchase discount, which has been previously recognized in GAAP net income,
was realized in Core Earnings during the three months ended June
30, 2018. (c)
Primarily represents the forward points earned on our foreign currency forward
contracts, which reflect the interest rate differentials between the applicable base rate for our foreign currency investments and USD LIBOR. These forward contracts effectively convert the rate exposure to USD LIBOR, resulting in additional
interest income earned in U.S. dollar terms. These amounts are not
included in GAAP net income, but rather as a component of Other Comprehensive Income in our consolidated financial statements. (Amounts in thousands, except per share data) Earnings per Share Book Value per Share Core Earnings Reconciliation Three Months Ended June 30, 2018 March 31, 2018 Net income (a) 72,312 $
60,958 $
GE purchase discount accretion adjustment
(b) 8,723 (17) Non-cash compensation expense 6,778 6,976 Realized foreign currency gain, net (c) 1,998 854 Other items 565 534 Core Earnings 90,376 $
69,305 $
Weighted-average shares outstanding, basic and
diluted 109,069
108,398 Core Earnings per share, basic and diluted 0.83 $
0.64
$
Three Months Ended June 30, 2018 March 31, 2018 3,023,480 $
2,921,213 $
Shares Class A common stock 111,442 108,194 Deferred stock units 213 205 Total outstanding 111,655 108,399 Book value per share 27.08 $
26.95
$
Three Months Ended
June 30, 2018 March 31, 2018 Net income (a) 72,312 $
60,958 $
Weighted-average shares outstanding, basic and
diluted 109,069
108,398 Earnings per share, basic and diluted 0.66 $
0.56
$
Stockholders’ equity |
 Blackstone Mortgage Trust 14 Reconciliation of Net Income to Core Earnings (a) Represents net income attributable to Blackstone Mortgage Trust, Inc. (b) Historically, we have deferred in Core Earnings the accretion of purchase discount attributable to a certain pool of GE portfolio loans
acquired in May 2015, until repayment in full of the remaining
loans in the pool was substantially assured. During the three months ended June 30, 2018, it was determined that repayment of the remaining loans in the deferral pool was substantially assured. As such, the $8.7 million of deferred purchase discount, which has been previously recognized in GAAP net income,
was realized in Core Earnings during the three months ended June
30, 2018. (c)
Primarily represents the forward points earned on our foreign currency forward contracts, which reflect the interest rate differentials between the applicable base rate for our foreign currency investments and USD LIBOR. These forward contracts effectively convert the rate exposure to USD LIBOR, resulting in additional
interest income earned in U.S. dollar terms. These amounts are not
included in GAAP net income, but rather as a component of Other Comprehensive Income in our consolidated financial statements. (Amounts in thousands, except per share data) June 30, 2018 Mar 31, 2018 Dec 31, 2017 Sep 30, 2017 Net income (a) 72,312 $ 60,958 $ 57,891 $ 57,722 $ GE purchase discount accretion adjustment (b) 8,723 (17) (483) (138) Non-cash compensation expense 6,778 6,976 6,221 5,944 Realized foreign currency gain, net (c) 1,998 854 355 1,035 Other items 565 534 519 575 Core Earnings 90,376 $ 69,305 $ 64,503 $ 65,138 $ Weighted-average shares outstanding, basic and diluted 109,069 108,398 98,811 95,013 Net income per share, basic and diluted 0.66 $ 0.56 $ 0.59 $ 0.61 $ Core Earnings per share, basic and diluted 0.83 $ 0.64 $ 0.65 $ 0.69 $ Three Months Ended |
 Blackstone Mortgage Trust 15 Definitions Core Earnings: Blackstone Mortgage Trust, Inc. (“BXMT”) discloses Core Earnings in this presentation. Core Earnings is a financial measure that is calculated and presented on the basis of methodologies other than in accordance with generally accepted accounting principles in the United States of America (“GAAP”). Core Earnings is an adjusted measure that helps BXMT evaluate its performance excluding the effects of certain transactions and GAAP adjustments that it believes are not necessarily indicative of its current loan origination portfolio and operations. Although according to its management agreement BXMT calculates the incentive and base management fees due to its Manager using Core Earnings before incentive fees expense, BXMT reports Core Earnings after incentive fees expense, as BXMT believes this is a more meaningful presentation of the economic performance of its class A common stock. Core Earnings is defined as GAAP net income (loss), including realized gains and losses not otherwise included in GAAP net income (loss), and excluding (i) net income (loss) attributable to the CT Legacy Portfolio, (ii) non-cash equity compensation expense, (iii) depreciation and amortization, (iv) unrealized gains (losses), and (v) certain non-cash items. Core Earnings may also be adjusted from time to time to exclude one-time events pursuant to changes in GAAP and certain other non-cash charges as determined by BXMT’s manager, subject to approval by a majority of its independent directors. Core Earnings does not represent net income or cash generated from operating activities and should not be considered as an alternative to GAAP net income, or an indication of BXMT’s GAAP cash flows from operations, a measure of BXMT’s liquidity, or an indication of funds available for its cash needs. In addition, BXMT’s methodology for calculating Core Earnings may differ from the methodologies employed by other companies to calculate the same or similar supplemental performance measures, and accordingly, its reported Core Earnings may not be comparable to the Core Earnings reported by other companies. Non-Consolidated Senior Interests: Senior interests in loans originated and syndicated to third parties. These non-recourse loan participations, which are excluded from the GAAP balance sheet, constitute additional financing capacity and are included in discussions of the loan portfolio. Earnings Sensitivity to LIBOR: Reflects the impact on net income, net of incentive fees, assuming no changes in credit spreads, portfolio composition, or asset performance. Assumes no change in general and administrative expenses, management fees, or other non-interest expenses relative to those incurred for the quarter ended June 30, 2018. |
 Blackstone Mortgage Trust 16 Forward-Looking Statements This presentation may contain forward-looking statements within the meaning of Section 27A of the Securities Act of 1933, as amended, and Section 21E of the Securities Exchange Act of 1934, as amended, which reflect BXMT’s current views with respect to, among other things, its operations and financial performance. You can identify these forward-looking statements by the use of words such as “outlook,” “indicator,” “believes,” “expects,” “potential,” “continues,” “may,” “will,” “should,” “seeks,” “predicts,” “intends,” “plans,” “estimates,” “anticipates” or the negative version of these words or other comparable words. Such forward- looking statements are subject to various risks and uncertainties. Accordingly, there are or will be important factors that could cause actual outcomes or results to differ materially from those indicated in these statements. BXMT believes these factors include but are not limited to those described under the section entitled “Risk Factors” in its Annual Report on Form 10-K for the fiscal year ended December 31, 2017, as such factors may be updated from time to time in its periodic filings with the Securities and Exchange Commission (“SEC”) which are accessible on the SEC’s website at www.sec.gov. These factors should not be construed as exhaustive and should be read in conjunction with the other cautionary statements that are included in this presentation and in the filings. BXMT assumes no obligation to update or supplement forward-looking statements that become untrue because of subsequent events or circumstances. |