Attached files
| file | filename |
|---|---|
| EX-99.1 - PRESS RELEASE - Simulations Plus, Inc. | simulations_8k-ex9901.htm |
| 8-K - CURRENT REPORT - Simulations Plus, Inc. | simulations_8k.htm |
Exhibit 99.2

(NASDAQ:SLP) Investor Conference Call July 10, 2018

2 With the exception of historical information, the matters discussed in this presentation are forward - looking statements that involve a number of risks and uncertainties . The actual results of the Company could differ significantly from those statements . Factors that could cause or contribute to such differences include, but are not limited to : continuing demand for the Company’s products, competitive factors, the Company’s ability to finance future growth, the Company’s ability to produce and market new products in a timely fashion, the Company’s ability to continue to attract and retain skilled personnel, and the Company’s ability to sustain or improve current levels of productivity . Further information on the Company’s risk factors is contained in the Company’s quarterly and annual reports and filed with the Securities and Exchange Commission . Safe Harbor Statement
3 Highlights Walter S. Woltosz, Chairman Shawn O’Connor, CEO

4 • Introduction of Newly Hired CEO - Shawn O’Connor • Walt Woltosz to remain as Chairman Overview
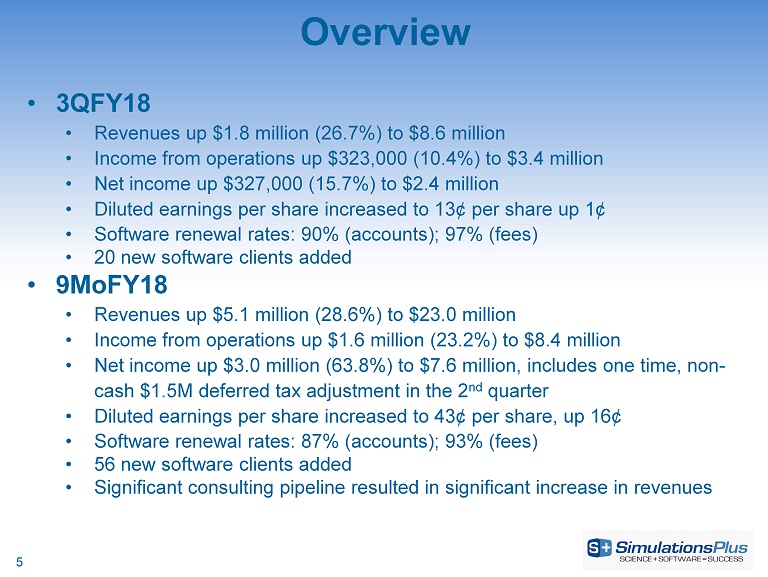
5 • 3QFY18 • Revenues up $1.8 million (26.7%) to $8.6 million • Income from operations up $323,000 (10.4%) to $3.4 million • Net income up $327,000 (15.7%) to $2.4 million • Diluted earnings per share increased to 13¢ per share up 1¢ • Software renewal rates: 90% (accounts); 97% (fees) • 20 new software clients added • 9MoFY18 • Revenues up $5.1 million (28.6%) to $23.0 million • Income from operations up $1.6 million (23.2%) to $8.4 million • Net income up $3.0 million (63.8%) to $7.6 million, includes one time, non - cash $1.5M deferred tax adjustment in the 2 nd quarter • Diluted earnings per share increased to 43¢ per share, up 16¢ • Software renewal rates: 87% (accounts); 93% (fees) • 56 new software clients added • Significant consulting pipeline resulted in significant increase in revenues Overview
6 Financial Overview John Kneisel Chief Financial Officer

7 Income Statement: 3QFY18 Versus 3QFY17 (in millions) Lancaster Buffalo North Carolina (ACQ. 6/01/17) 3QFY18 3QFY17 Diff % chg Net sales $ 5.7 $ 1.9 $ 1.0 $ 8.6 $ 6.7 $ 1.8 26.7% Gross profit 4.9 1.1 0.5 6.5 5.3 1.2 23.1% Gross profit margin 86.6% 57.5% 54.2% 76.3% 78.6% - 2.2% - 2.9% SG&A $ 1.5 $ 0.7 $ 0.4 $ 2.6 $ 2.0 $ 0.6 33.1% R&D 0.3 0.0 0.2 0.5 0.3 0.3 100.4% Total operating expenses 1.9 0.7 0.5 3.1 2.2 0.9 40.9% Income from operations 3.0 0.4 0.0 3.4 3.1 0.3 10.5% Other income (expense) (0.0) 0.0 0.0 (0.0) (0.0) (0.0) 160.0% Income before income taxes 3.0 0.4 0.0 3.4 3.1 0.3 10.1% Net income $ 2.1 $ 0.3 $ 0.0 $ 2.4 $ 2.1 $ 0.3 15.7% Diluted earnings per share (in dollars) $ 0.13 $ 0.12 $ 0.02 13.7% EBITDA $ 3.4 $ 0.5 $ 0.2 $ 4.1 $ 3.6 $ 0.5 13.5%

8 Income Statement: 9MoFY18 Vs. 9MoFY17 (in millions) Lancaster Buffalo North Carolina (ACQ. 6/01/17) 9mo FY18 9mo FY17 Diff % chg Net sales $ 14.2 $ 5.7 $ 3.0 $ 23.0 $ 17.9 $ 5.1 28.6% Gross profit 11.9 3.3 1.8 17.1 13.5 3.6 26.4% Gross profit margin 82.0% 58.4% 64.2% 73.3% 74.0% - 0.7% - 1.0% SG&A $ 4.3 $ 2.0 $ 1.0 $ 7.4 $ 5.8 $ 1.6 27.5% R&D 1.1 0.1 0.2 1.4 1.0 0.4 42.1% Total operating expenses 5.4 2.1 1.2 8.7 6.7 2.0 29.6% Income from operations 6.6 1.2 0.6 8.4 6.8 1.6 23.2% Other income (expense) (0.1) 0.0 0.0 (0.1) 0.0 (0.1) - 626.3% Income before income taxes 6.5 1.2 0.6 8.3 6.8 1.5 21.4% Net income $ 6.3 $ 0.9 $ 0.4 $ 7.6 $ 4.6 $ 3.0 63.8% Diluted earnings per share (in dollars) $ 0.43 $ 0.27 $ 0.16 60.2% EBITDA $ 7.7 $ 1.5 $ 1.1 $ 10.3 $ 8.4 $ 1.9 23.0%
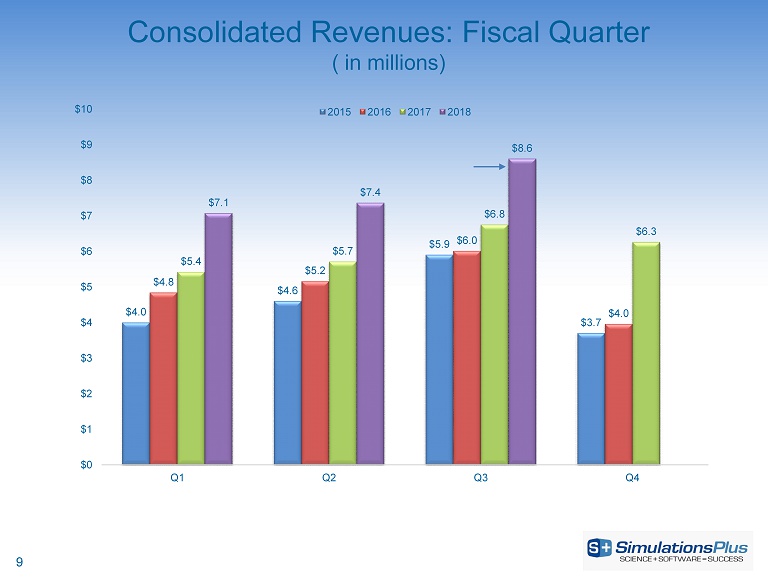
9 Consolidated Revenues: Fiscal Quarter ( in millions) $4.0 $4.6 $5.9 $3.7 $4.8 $5.2 $6.0 $4.0 $5.4 $5.7 $6.8 $6.3 $7.1 $7.4 $8.6 $0 $1 $2 $3 $4 $5 $6 $7 $8 $9 $10 Q1 Q2 Q3 Q4 2015 2016 2017 2018

10 Consolidated Income from Operations by Fiscal Quarter (in millions) $0.7 $1.5 $2.9 $0.8 $1.7 $1.7 $2.8 $1.0 $1.9 $1.8 $3.1 $1.4 $2.6 $2.4 $3.4 $0.0 $0.5 $1.0 $1.5 $2.0 $2.5 $3.0 $3.5 $4.0 Q1 Q2 Q3 Q4 2015 2016 2017 2018 Note: 2Q18 $0.08 tax benefit of deferred tax adjustment
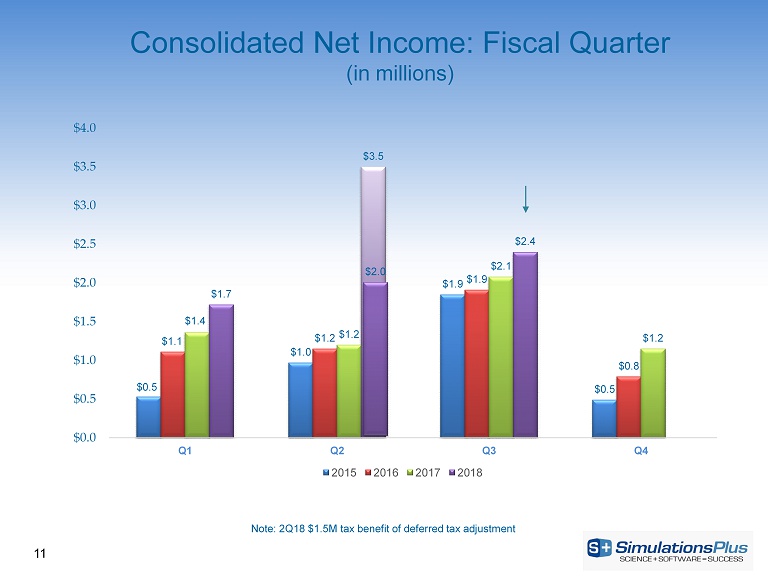
$0.5 $1.0 $1.9 $0.5 $1.1 $1.2 $1.9 $0.8 $1.4 $1.2 $2.1 $1.2 $1.7 $3.5 $2.4 $0.0 $0.5 $1.0 $1.5 $2.0 $2.5 $3.0 $3.5 $4.0 Q1 Q2 Q3 Q4 2015 2016 2017 2018 $2.0 11 Note: 2Q18 $1.5M tax benefit of deferred tax adjustment Consolidated Net Income: Fiscal Quarter (in millions)

12 Consolidated Diluted Earnings Per Share $0.03 $0.06 $0.11 $0.03 $0.06 $0.07 $0.11 $0.05 $0.08 $0.07 $0.12 $0.06 $0.10 $0.19 $0.13 $0.00 $0.02 $0.04 $0.06 $0.08 $0.10 $0.12 $0.14 $0.16 $0.18 $0.20 Q1 Q2 Q3 Q4 FY15 FY16 FY17 FY18 $0.11 Note: 2Q18 $0.08 tax benefit of deferred tax adjustment
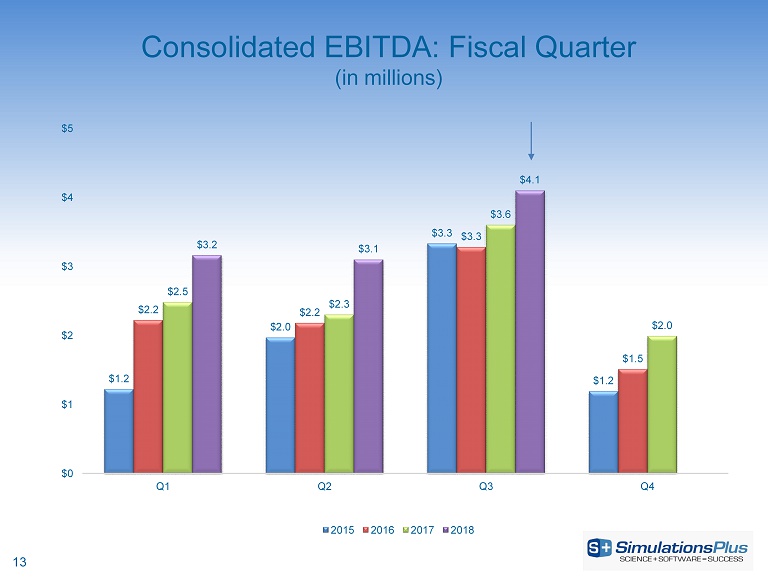
13 Consolidated EBITDA: Fiscal Quarter (in millions) $1.2 $2.0 $3.3 $1.2 $2.2 $2.2 $3.3 $1.5 $2.5 $2.3 $3.6 $2.0 $3.2 $3.1 $4.1 $0 $1 $2 $3 $4 $5 Q1 Q2 Q3 Q4 2015 2016 2017 2018

14 Cash Position Remains Excellent (in millions) Over $25 million cash paid out over last four FYs $0.8 $0.8 $0.8 $0.8 $0.8 $0.8 $0.9 $0.9 $0.9 $0.9 $0.9 $0.9 $0.9 $0.9 $0.9 $1.0 $1.0 $1.0 $2.5 $2.1 $0.8 $0.7 $0.8 $1.0 $5.0 $11.0 $7.8 $8.6 $5.8 $6.1 $6.4 $8.6 $7.2 $7.1 $8.8 $8.0 $8.8 $7.4 $8.2 $6.2 $7.0 $7.5 $7.2 $9.9 Dividend Paid Acquisitions Cash on Hand Cash paid to TSRL Cash paid for Cognigen Final cash paid for Cognigen Cash paid for DILIsym (some from Q2 and Q3) Cash paid to TSRL Cash paid to TSRL Final cash paid to TSRL
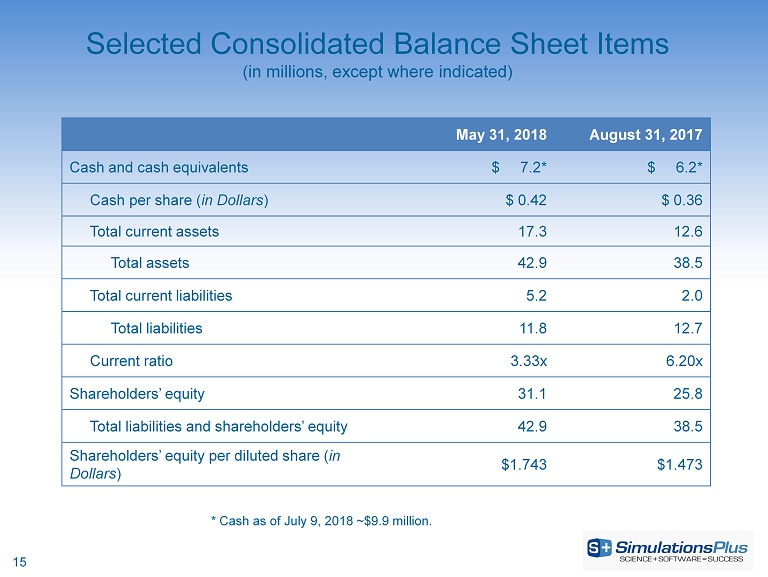
15 Selected Consolidated Balance Sheet Items (in millions, except where indicated) May 31, 2018 August 31, 2017 Cash and cash equivalents $ 7.2* $ 6.2* Cash per share ( in Dollars ) $ 0.42 $ 0.36 Total current assets 17.3 12.6 Total assets 42.9 38.5 Total current liabilities 5.2 2.0 Total liabilities 11.8 12.7 Current ratio 3.33x 6.20x Shareholders’ equity 31.1 25.8 Total liabilities and shareholders’ equity 42.9 38.5 Shareholders’ equity per diluted share ( in Dollars ) $1.743 $1.473 * Cash as of July 9, 2018 ~$9.9 million.

16 Lancaster Division Walt Woltosz Chairman
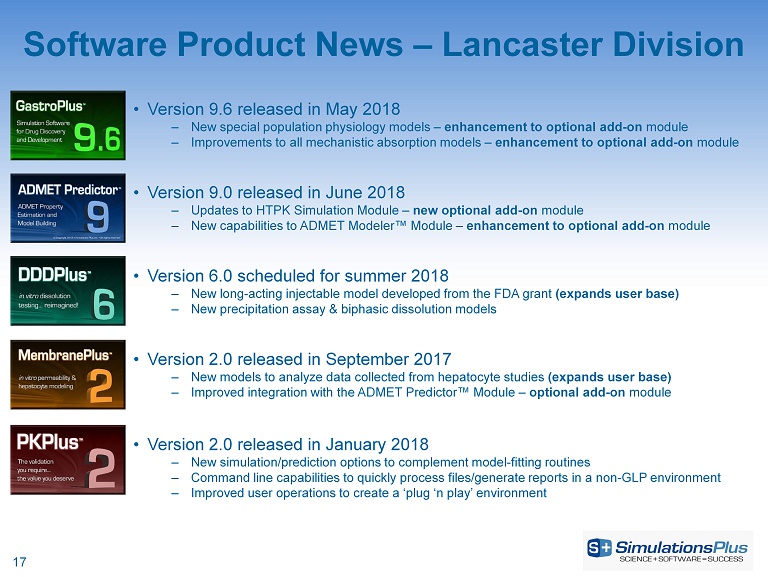
17 • Version 9.6 released in May 2018 ‒ New special population physiology models – enhancement to optional add - on module ‒ Improvements to all mechanistic absorption models – enhancement to optional add - on module • Version 9.0 released in June 2018 ‒ Updates to HTPK Simulation Module – new optional add - on module ‒ New capabilities to ADMET Modeler™ Module – enhancement to optional add - on module Software Product News – Lancaster Division • Version 6.0 scheduled for summer 2018 ‒ New long - acting injectable model developed from the FDA grant (expands user base) ‒ New precipitation assay & biphasic dissolution models • Version 2.0 released in September 2017 ‒ New models to analyze data collected from hepatocyte studies (expands user base) ‒ Improved integration with the ADMET Predictor™ Module – optional add - on module • Version 2.0 released in January 2018 ‒ New simulation/prediction options to complement model - fitting routines ‒ Command line capabilities to quickly process files/generate reports in a non - GLP environment ‒ Improved user operations to create a ‘plug ‘n play’ environment
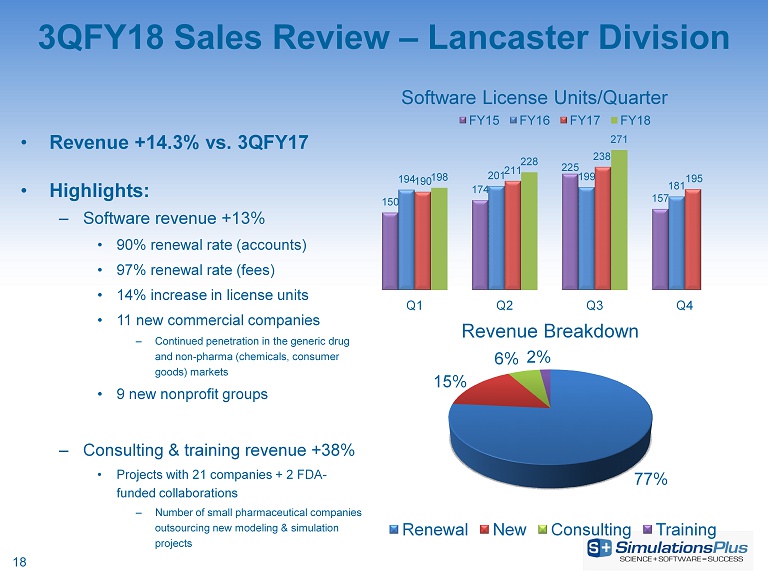
3QFY18 Sales Review – Lancaster Division • Revenue +14.3% vs. 3QFY17 • Highlights: – Software revenue +13% • 90% renewal rate (accounts) • 97% renewal rate (fees) • 14% increase in license units • 11 new commercial companies – Continued penetration in the generic drug and non - pharma (chemicals, consumer goods) markets • 9 new nonprofit groups – Consulting & training revenue +38% • Projects with 21 companies + 2 FDA - funded collaborations – Number of small pharmaceutical companies outsourcing new modeling & simulation projects 77% 15% 6% 2% Revenue Breakdown Renewal New Consulting Training 150 174 225 157 194 201 199 181 190 211 238 195 198 228 271 Q1 Q2 Q3 Q4 Software License Units/Quarter FY15 FY16 FY17 FY18 18

9MoFY18 Sales Review – Lancaster Division • Revenue +12.3% vs. 9MoFY17 • Highlights: – Software revenue +8% • 87% renewal rate (accounts) • 93% renewal rate (fees) • 9% increase in license units • 30 new commercial companies • 26 new nonprofit groups – Expansion of licenses at the US and China FDA – Consulting & training revenue +63% • Projects with 35 companies + 2 FDA - funded collaborations 74% 14% 10% 2% Revenue Breakdown Renewal New Consulting Training 150 174 225 157 194 201 199 181 190 211 238 195 198 228 271 Q1 Q2 Q3 Q4 Software License Units/Quarter FY15 FY16 FY17 FY18 19

9MoFY18 Revenue – by Region Europe 29% North America 43% Asia 27% South America <1% Japan = 60% India = 20% China = 16% Korea = <1% 20

3QFY18 Marketing Activities Website Content • Increased production of video content for promotional/branding purposes • Increased focus on SEO performance • Continued migration of content from different division sites to main Simulations Plus domain Workshops and Conferences • PBPK workshops held in San Diego, Frankfurt, and Shanghai • Hosted 7 onsite trainings at individual companies • Attended 16 scientific conferences/workshops; delivered 16 poster/podium presentations Strategic Digital Marketing Initiatives • Hosted 3 webinars on modeling & simulation applications • Continued with active social media campaigns – Twitter/LinkedIn/YouTube followers have increased 22% vs. May 2017 – GastroPlus User Group membership increased 6% vs. May 2017 21

22 Earnings Call Update July 10, 2018 Walter S. Woltosz, Chairman

23 Cognigen Status Report Pharmacometric Services • In FY2018 relationships with 26 companies on 43 drugs, 72 projects – 3 new companies in FY2018 – 34 new projects in FY2018 – 27 projects expanded scope in FY2018 – 4 projects with reduced scope – 41 outstanding proposals with 28 different companies • In FY2018 presented 15 posters, and 6 peer - reviewed publications – Working on 15 publications and 4 conference abstracts • Most common therapeutic area is oncology, followed by neurology, endocrinology, and infectious disease – ~45% of projects result directly in regulatory interaction.
24 • Increased Marketing and Sales activities • Ongoing recruitment of new scientific talent • Pharmacometric services continue to expand ‒ Healthy pipeline of new projects, including global health initiative projects ‒ Bridging global regulatory filings ‒ Embedded client partner opportunities from first - in - human to commercialization of new medicines • Cross - selling opportunities with Simulations Plus and DILIsym ‒ Creating broader spectrum business models with clients ‒ Expanding scientific synergies among company scientists • KIWI™ Pharmacometric Communication Platform design and deployment accelerating Cognigen Summary

25 Drug - Induced Liver Injury and Liver Diseases Brett A. Howell, President DILIsym Services, Research Triangle Park, NC

DILIsym Services, Inc. – Our Vision 26 • DILIsym Services, Inc. offers comprehensive program services: – DILIsym software licensing, training, development (DILI - sim Initiative) – DILIsym and NAFLDsym simulation consulting projects – Consulting and data interpretation – in vitro assay experimental design and management “Our vision is safer, effective, more affordable medicines for patients through modeling and simulation.” DILIsym ®

DILIsym Services Fiscal 2018 Q3 Sales Review • DILIsym software consulting projects – 13 active DILIsym consulting projects during fiscal Q3 – DILIsym software is focused on helping companies predict drug - induced liver injury probability for drugs and drug candidates – Involve data management and analysis components • NAFLDsym consulting projects – 2 active consulting projects during fiscal Q3 – One significant NAFLDsym consulting project, which is allowing for great enhancements of the software’s capabilities for future consulting – NAFLDsym software is focused on helping companies evaluate targets for nonalcoholic fatty liver disease and nonalcoholic steatohepatitis (NASH) • DILIsym software licensing – 9 active consortium contracts, which is the vehicle used for DILIsym licensing – Focused on adding new science and features to DILIsym including adaptive immune components, new simulated populations, and advanced integration with GastroPlus – FDA has now acquired licenses 27 25% 61% 14% Q3 DSS Revenue Source Breakdown DILIsym Software DILIsym Projects NAFLDsym Projects

DILIsym Services Software Product News • DILIsym version 8A now in development; due out in January of 2019 • Voting ballot has been sent to DILI - sim consortium members for their input on future DILIsym development items (1 vote per member company) • DILIsym refactoring (recoding) in progress for improved use and tighter integration with GastroPlus™ and ADMET Predictor™ • NAFLDsym development continues through large pharma company sponsorships – Addition of fibrosis and inflammation pathways and additional simulated patients – Available towards end of 2018 for internal consulting use • Government grant proposal for development of software focused on drug - induced kidney injury was submitted; awaiting final funding decision 28 DILIsym ®

DILIsym Services Marketing and Event Updates • DILIsym Services was a key sponsor of the NASH Summit in Boston in April of 2018 – showcased NAFLDsym capabilities • Abstracts submitted to multiple Fall 2018 scientific meetings – American Conference on Pharmacometrics in October ( ACoP ) – The Liver Meeting in November – AAPS PharmSci 360 in November • Two Fall 2018 DILIsym workshops offered – Research Triangle Park, NC in September – San Diego, CA in October 29

DILIsym Services Summary • Active development across multiple products for expanded applications, including possible kidney injury product • Looking for growth in the NAFLD/NASH area due to large upgrades to NAFLDsym platform due to be completed by end of 2018 • Continuing to work with Simulations Plus Lancaster and Cognigen on integrative marketing and other synergies 30
31 Final Summary Walter S. Woltosz, Chairman Shawn O’Connor, CEO

32 • New CEO - Shawn O’Connor • Walt Woltosz to remain as Chairman • 3QFY18 • Revenues up $1.8 million (26.7%) to $8.6 million • Income from operations up $323,000 (10.4%) to $3.4 million • Net income up $327,000 (15.7%) to $2.4 million • 9MoFY18 • Revenues up $5.1 million (28.6%) to $23.0 million • Income from operations up $1.6 million (23.2%) to $8.4 million • Net income up $3.0 million (63.8%) to $7.6 million, includes one time, non - cash $1.5M deferred tax adjustment in the 2 nd quarter • Diluted earnings per share increased to 43¢ per share, up 16¢ • Board declares $0.06/share quarterly dividend payable August 2, 2018 • California, Buffalo, and North Carolina divisions all performing well • Expected synergies being realized • Addressing regulatory agency focus on applying PBPK modeling in clinical pharmacology & safety research • New guidance documents issued by FDA and EMA helping drive interest • We believe Simulations Plus continues to lead the trend toward greater use of modeling and simulation in research & development Summary
33 Thank you! http://www.simulations - plus.com https://www.linkedin.com/company/95827/ https://www.linkedin.com/company/46152/