Attached files
| file | filename |
|---|---|
| 8-K - FORM 8-K - EAGLE FINANCIAL SERVICES INC | d590983d8k.htm |
Annual Shareholder Meeting May 15, 2018 Exhibit 99.1
The Company makes forward-looking statements that are subject to risks and uncertainties. These forward-looking statements include statements regarding profitability, liquidity, adequacy of capital, the allowance for loan losses, interest rate sensitivity, market risk, growth strategy, and financial and other goals. The words, “believes,” “expects,” “may,” “will,” “should,” “projects,” “contemplates,” “anticipates,” “forecasts,” “intends,” or other similar words or terms are intended to identify forward-looking statements. These forward-looking statements are subject to significant uncertainties. Because of these uncertainties, actual future results may be materially different from the results indicated by these forward-looking statements. In addition, past results of operations do not necessarily indicate future results. The following presentation should be read in conjunction with the consolidated financial statements and related notes and risk factors included in the Company’s Form 10-K for the year ended December 31, 2017 and other reports filed with the Securities and Exchange Commission. Forward Looking Statements
Key Value Drivers Key Management Expertise Location in High Growth Markets Profitability at or Above Many Peers Strong Net Interest Margin Quality Asset Generation Strong Core Deposits Solid Fee Income Strong Capital Base The Company’s key values allow it to remain committed to its primary strategy of organic growth and independence.
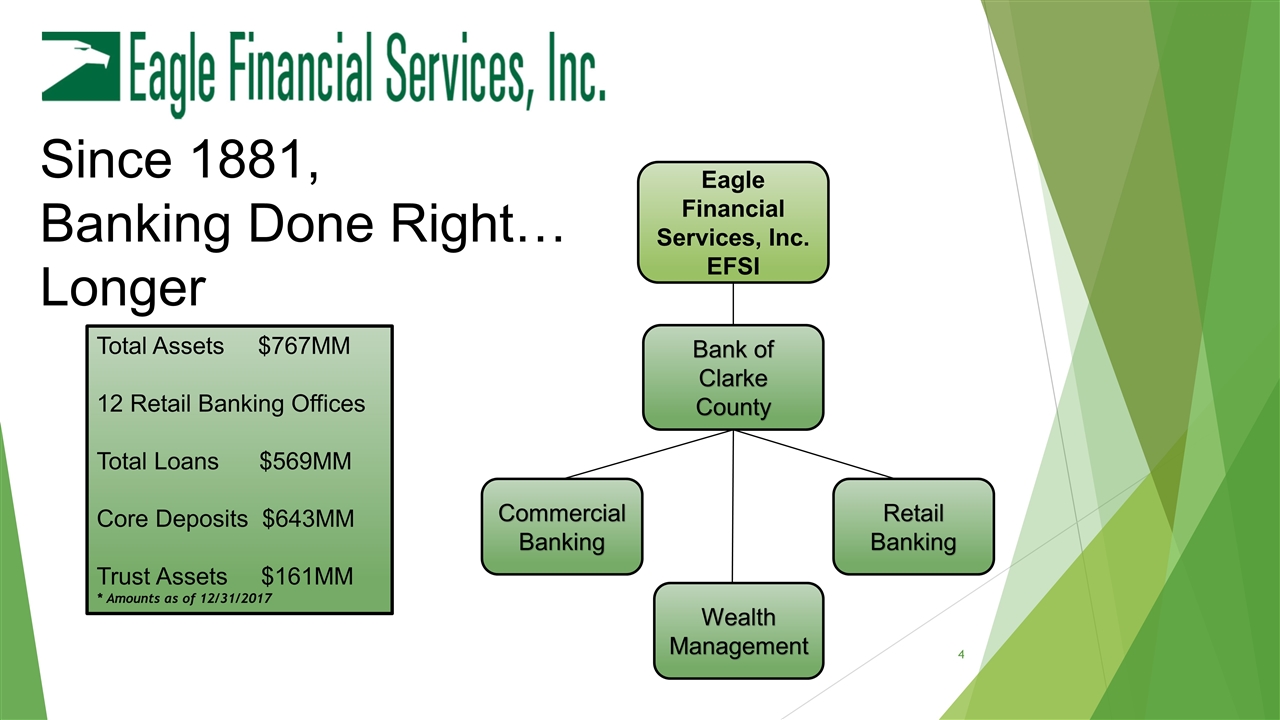
Since 1881, Banking Done Right… Longer Total Assets $767MM 12 Retail Banking Offices Total Loans $569MM Core Deposits $643MM Trust Assets $161MM * Amounts as of 12/31/2017 Eagle Financial Services, Inc. EFSI Bank of Clarke County Commercial Banking Wealth Management Retail Banking
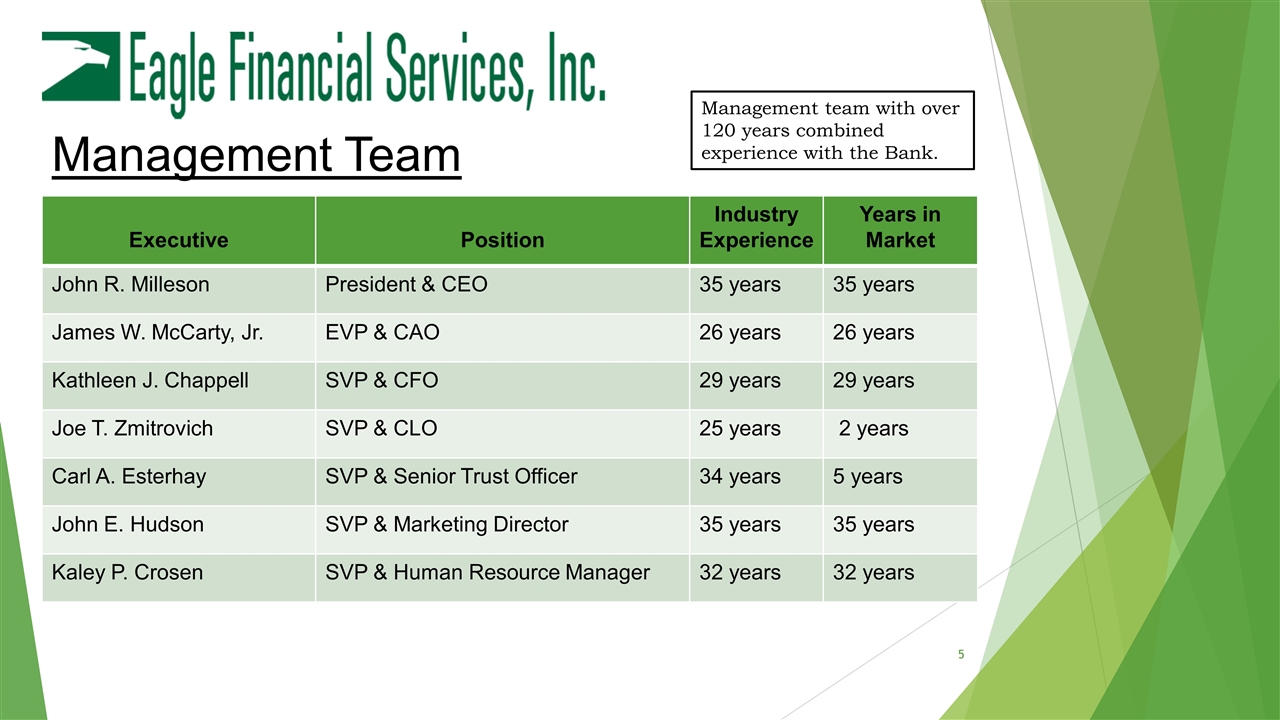
Management Team Executive Position Industry Experience Years in Market John R. Milleson President & CEO 35 years 35 years James W. McCarty, Jr. EVP & CAO 26 years 26 years Kathleen J. Chappell SVP & CFO 29 years 29 years Joe T. Zmitrovich SVP & CLO 25 years 2 years Carl A. Esterhay SVP & Senior Trust Officer 34 years 5 years John E. Hudson SVP & Marketing Director 35 years 35 years Kaley P. Crosen SVP & Human Resource Manager 32 years 32 years Management team with over 120 years combined experience with the Bank.
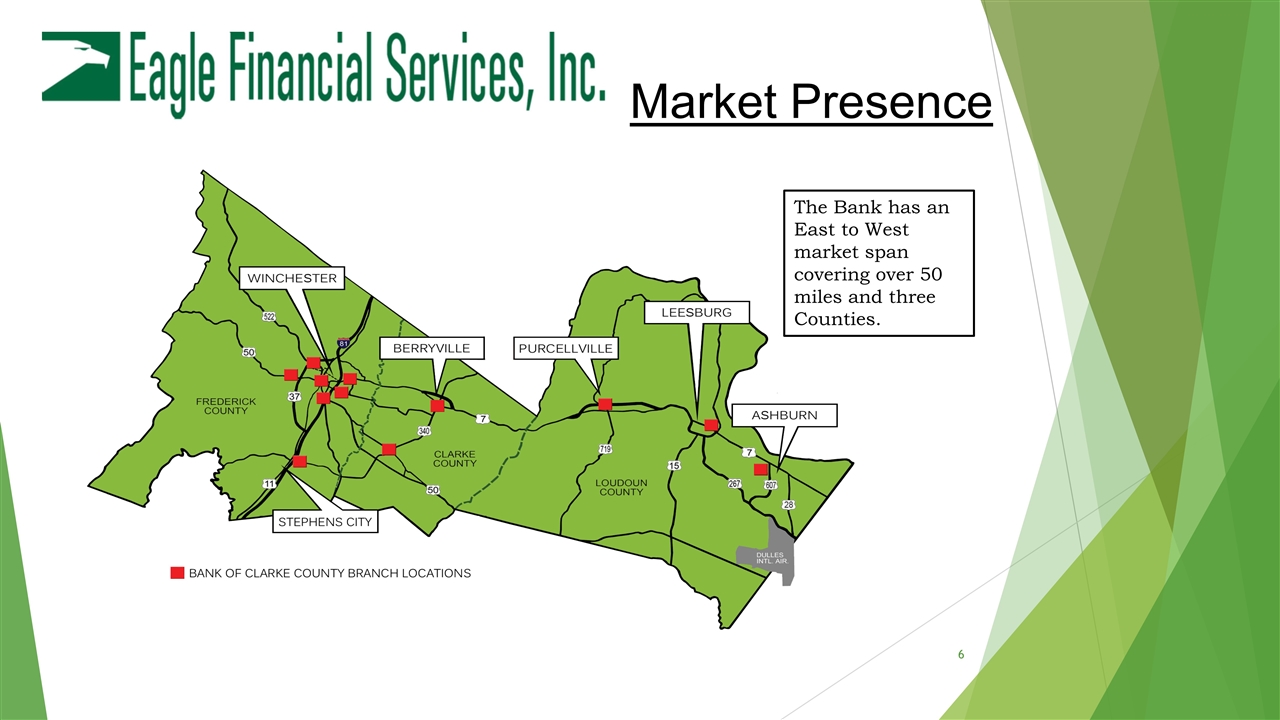
Market Presence The Bank has an East to West market span covering over 50 miles and three Counties.
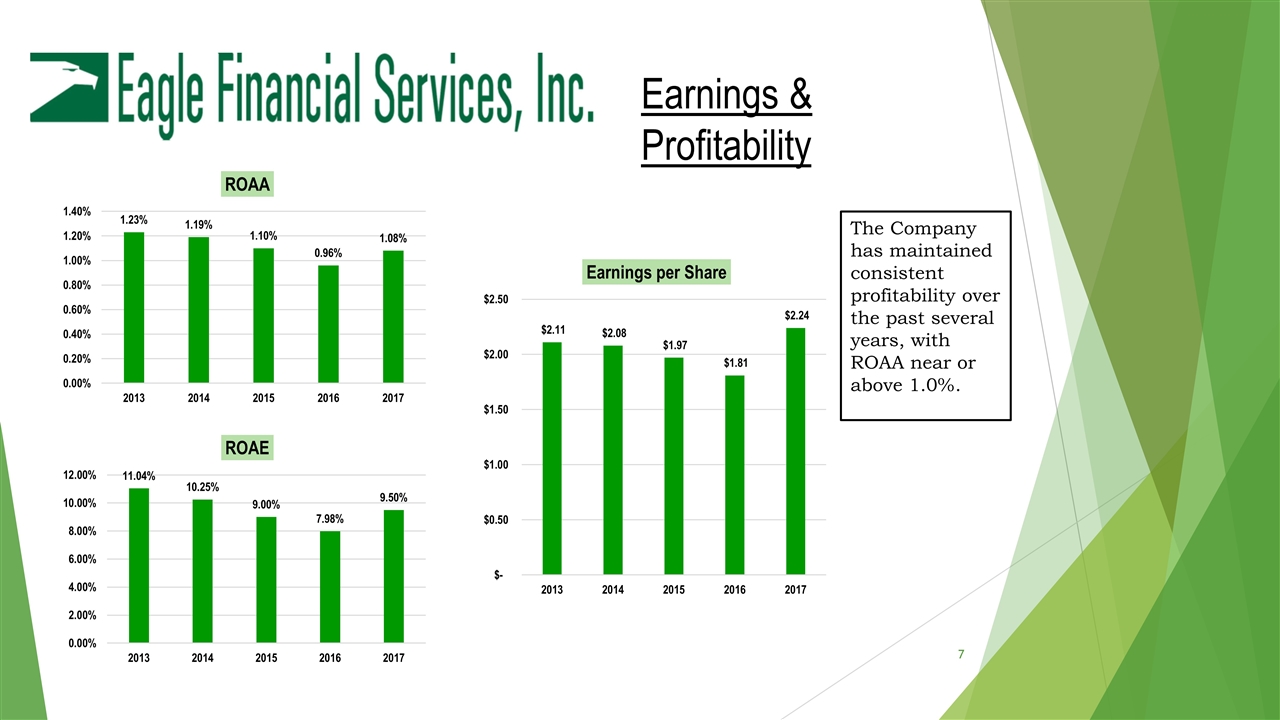
Earnings & Profitability The Company has maintained consistent profitability over the past several years, with ROAA near or above 1.0%.
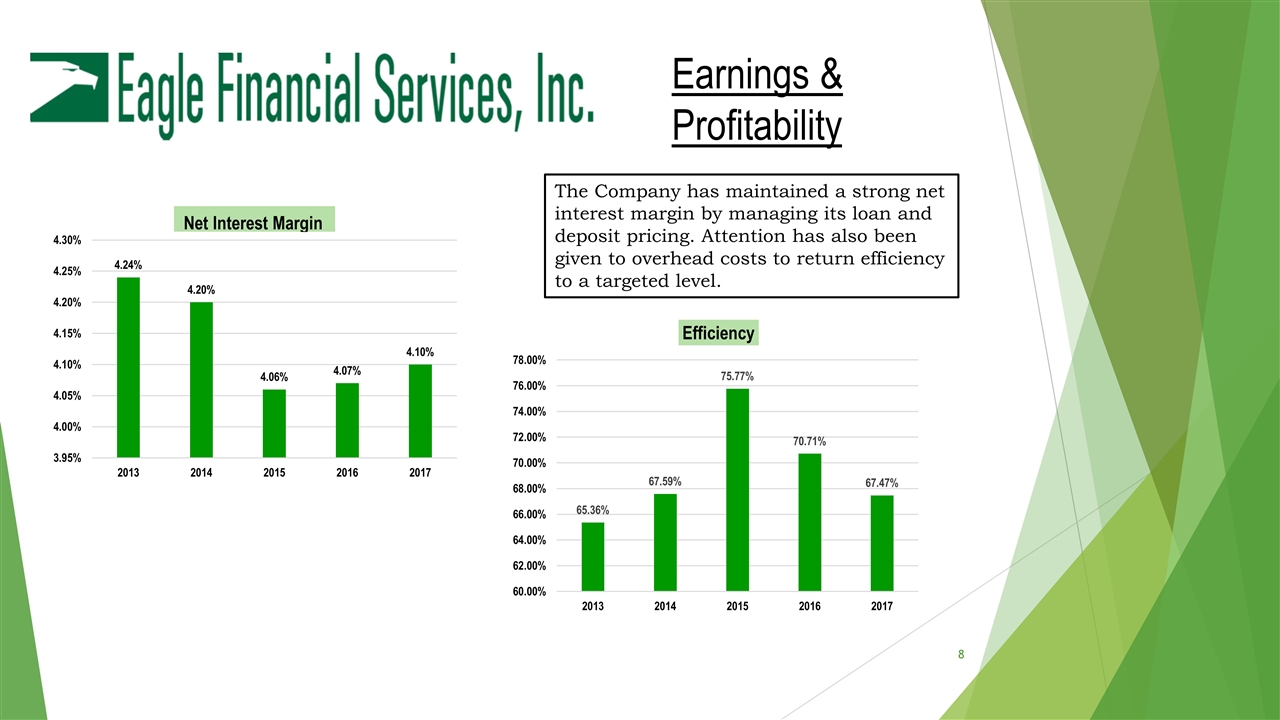
The Company has maintained a strong net interest margin by managing its loan and deposit pricing. Attention has also been given to overhead costs to return efficiency to a targeted level. Earnings & Profitability
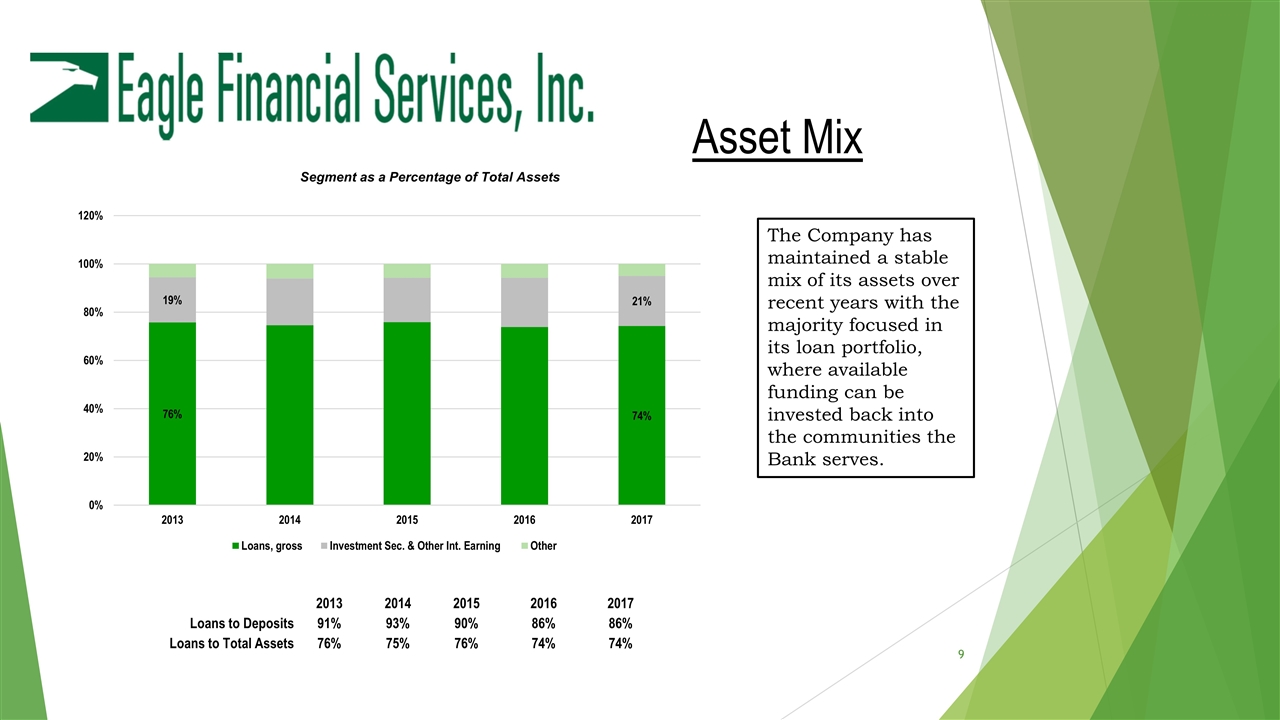
Asset Mix Segment as a Percentage of Total Assets 2013 2014 2015 2016 2017 Loans to Deposits 91% 93% 90% 86% 86% Loans to Total Assets 76% 75% 76% 74% 74% The Company has maintained a stable mix of its assets over recent years with the majority focused in its loan portfolio, where available funding can be invested back into the communities the Bank serves.
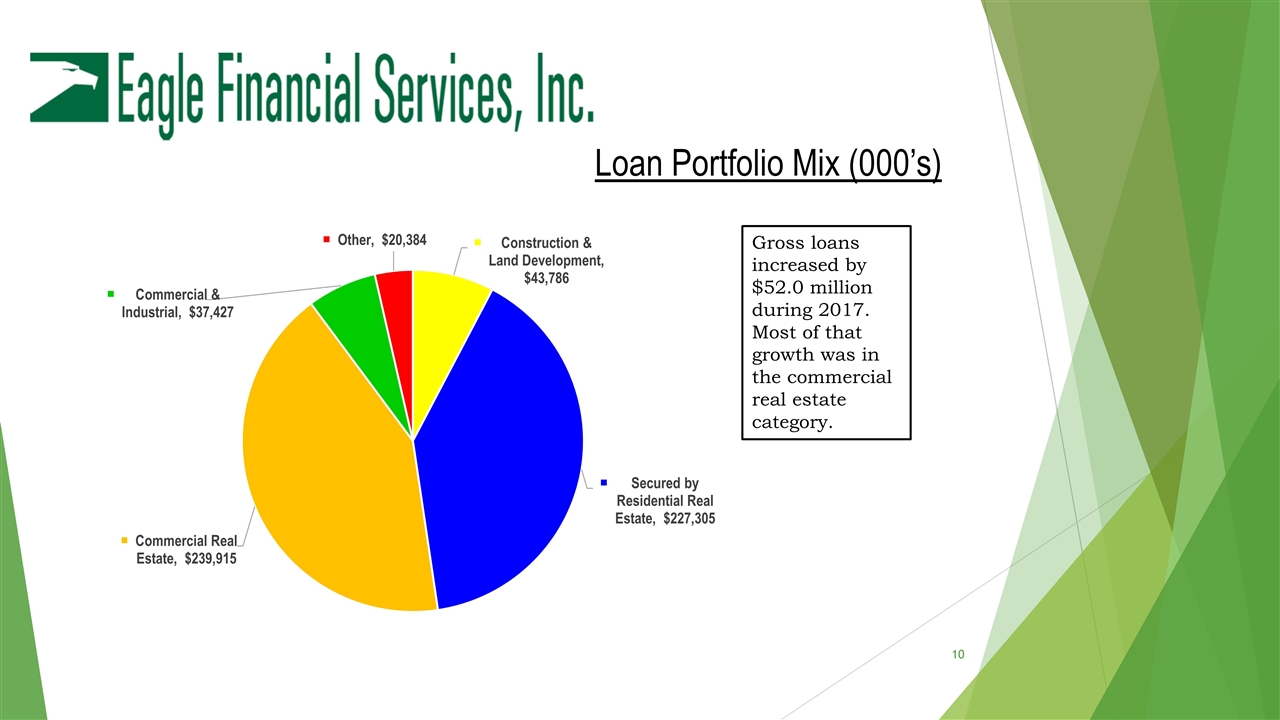
Loan Portfolio Mix (000’s) Gross loans increased by $52.0 million during 2017. Most of that growth was in the commercial real estate category.
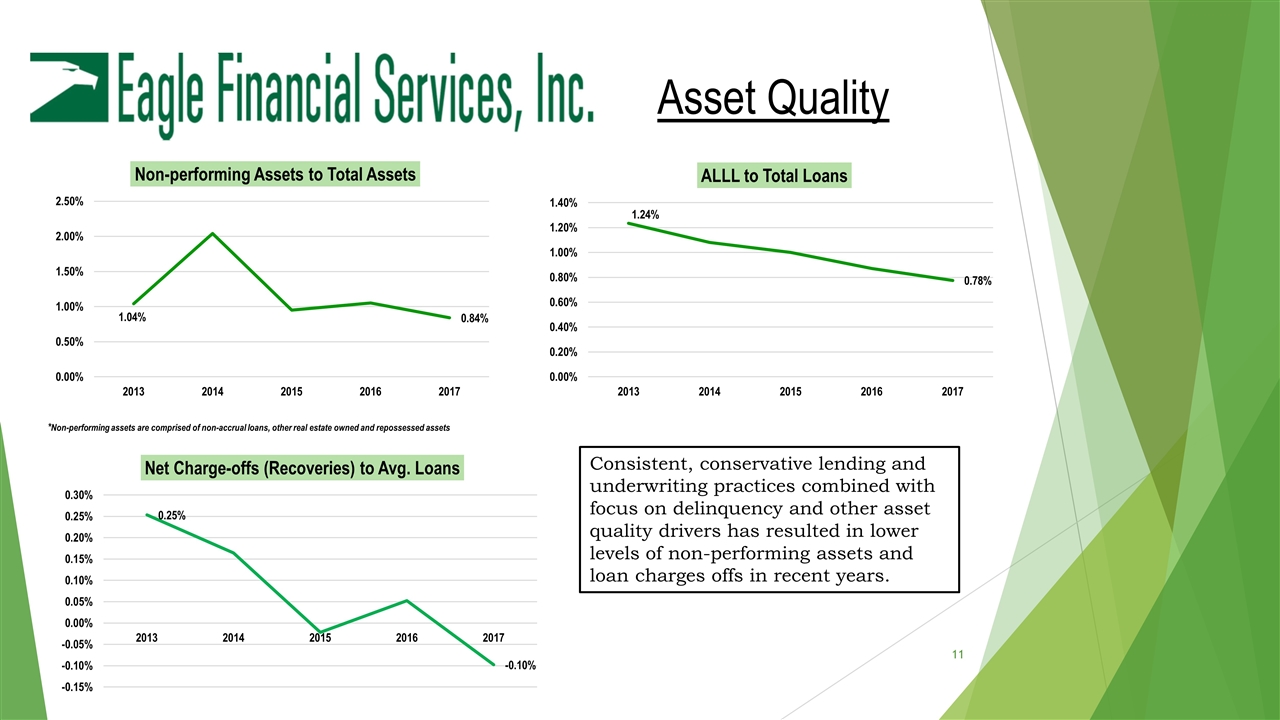
Asset Quality *Non-performing assets are comprised of non-accrual loans, other real estate owned and repossessed assets Consistent, conservative lending and underwriting practices combined with focus on delinquency and other asset quality drivers has resulted in lower levels of non-performing assets and loan charges offs in recent years.
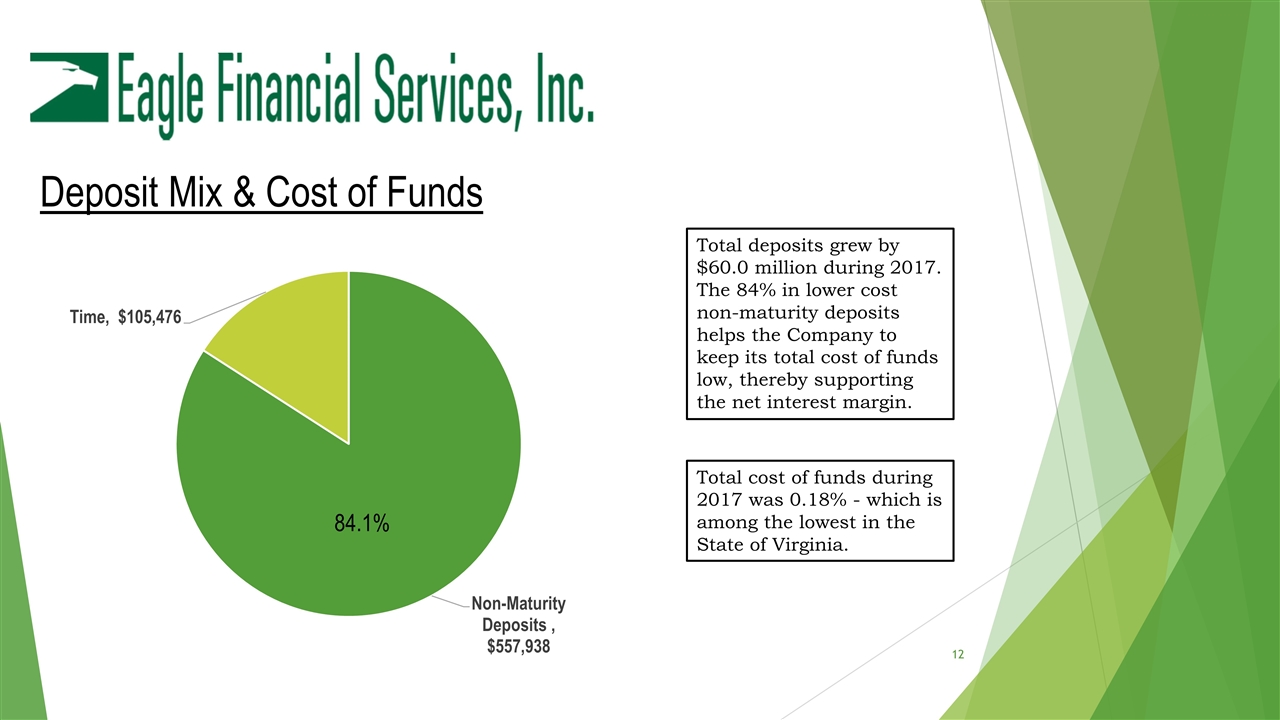
Deposit Mix & Cost of Funds Total cost of funds during 2017 was 0.18% - which is among the lowest in the State of Virginia. Total deposits grew by $60.0 million during 2017. The 84% in lower cost non-maturity deposits helps the Company to keep its total cost of funds low, thereby supporting the net interest margin. 84.1%
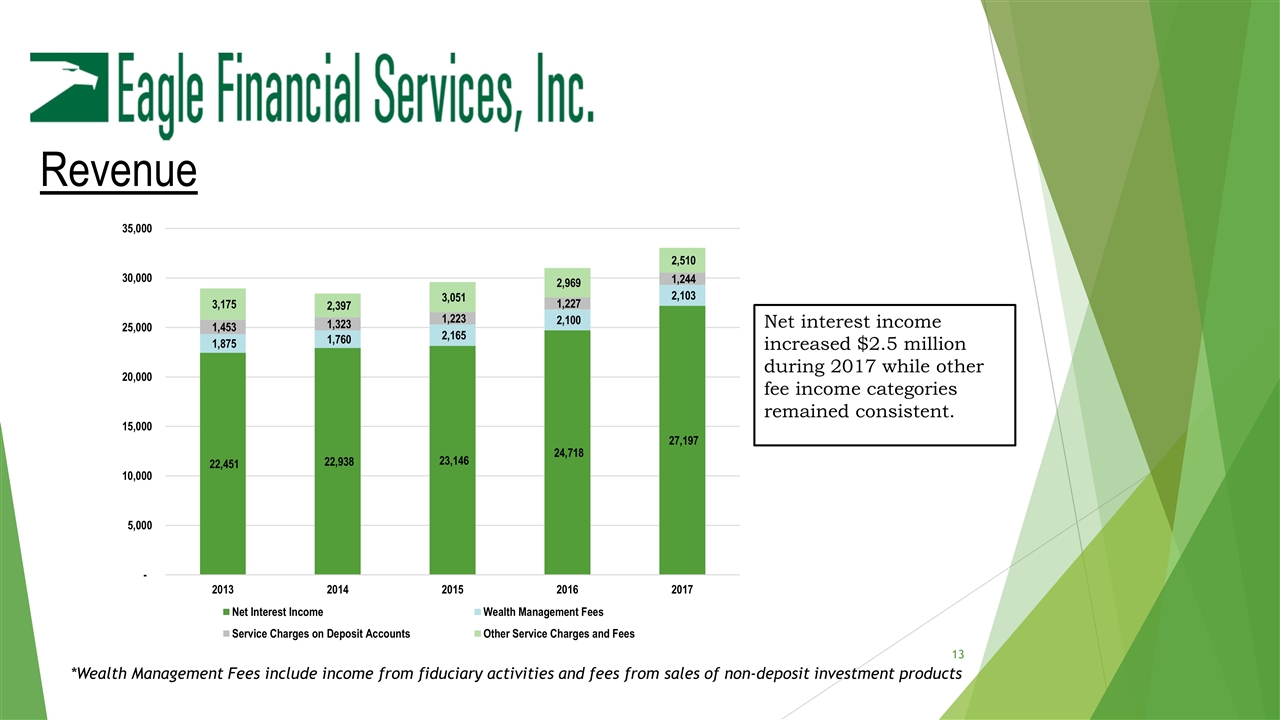
Revenue Net interest income increased $2.5 million during 2017 while other fee income categories remained consistent. *Wealth Management Fees include income from fiduciary activities and fees from sales of non-deposit investment products
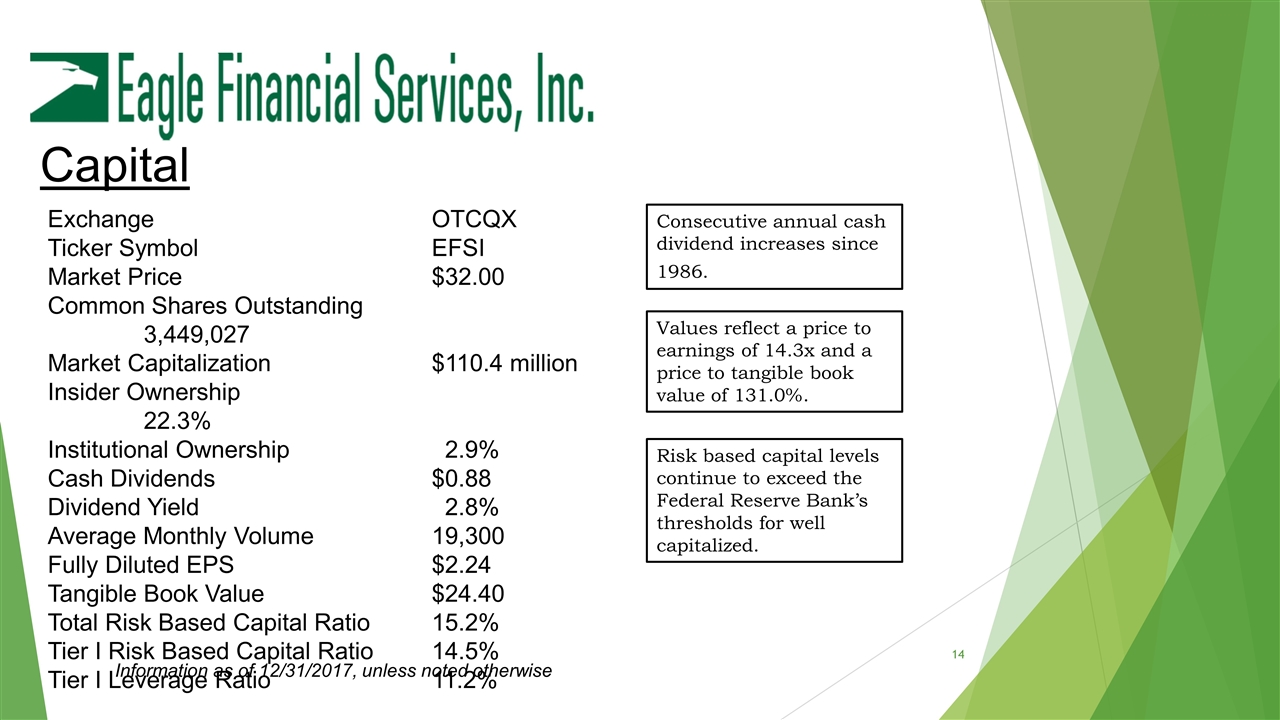
Exchange OTCQX Ticker SymbolEFSI Market Price $32.00 Common Shares Outstanding3,449,027 Market Capitalization$110.4 million Insider Ownership22.3% Institutional Ownership 2.9% Cash Dividends$0.88 Dividend Yield 2.8% Average Monthly Volume19,300 Fully Diluted EPS $2.24 Tangible Book Value$24.40 Total Risk Based Capital Ratio 15.2% Tier I Risk Based Capital Ratio14.5% Tier I Leverage Ratio11.2% Capital Information as of 12/31/2017, unless noted otherwise Consecutive annual cash dividend increases since 1986. Values reflect a price to earnings of 14.3x and a price to tangible book value of 131.0%. Risk based capital levels continue to exceed the Federal Reserve Bank’s thresholds for well capitalized.
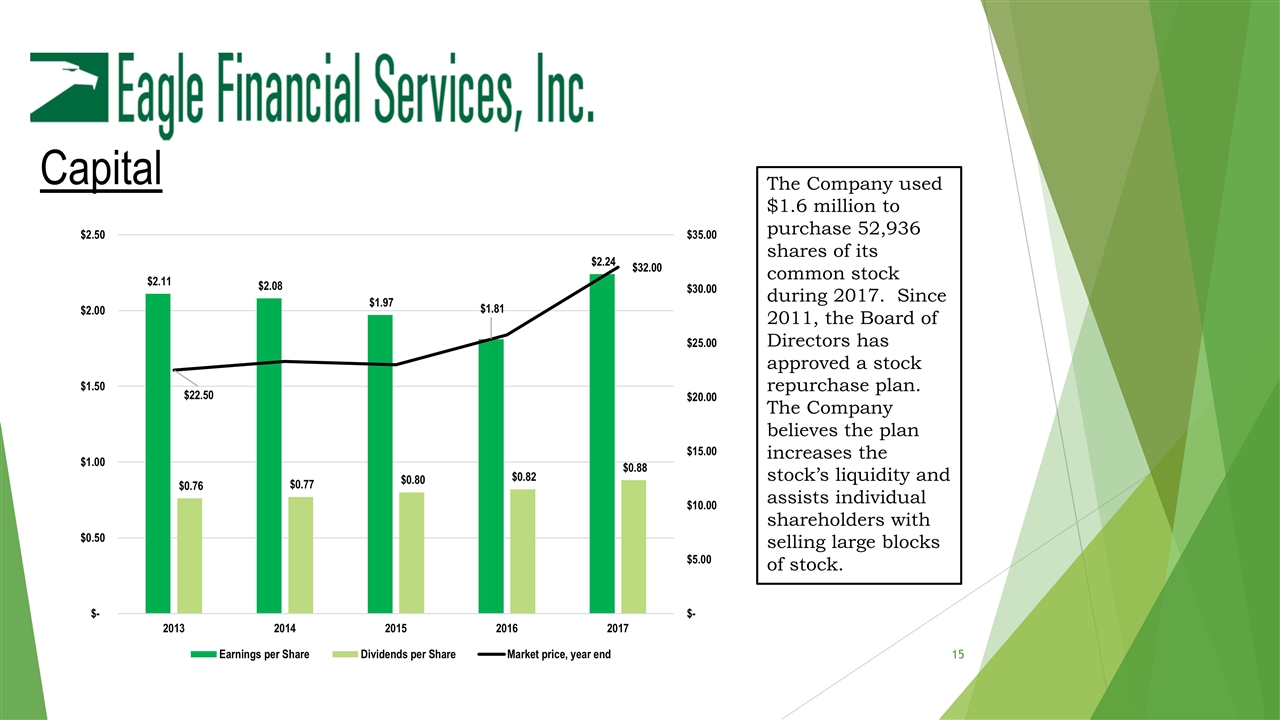
Capital The Company used $1.6 million to purchase 52,936 shares of its common stock during 2017. Since 2011, the Board of Directors has approved a stock repurchase plan. The Company believes the plan increases the stock’s liquidity and assists individual shareholders with selling large blocks of stock.
Contacts John R. Milleson President & CEO jmilleson@bankofclarke.com 540-955-5247 Jim McCarty EVP & CAO jmccarty@bankofclarke.com 540-955-5237 Kate J. Chappell SVP & CFO kchappell@bankofclarke.com 540-955-5226
