Attached files
| file | filename |
|---|---|
| 8-K - 8-K - INDUS REALTY TRUST, INC. | grif-20180515x8k.htm |
Exhibit 99.1
|
|
may 2018 1 AnnuaL Meeting Presentation |
|
|
2 Forward-Looking Statements This presentation (the “Presentation”) contains forward-looking statements within the meaning of Section 27A of the Securities Act of 1933, as amended, and Section 21E of the Securities Exchange Act of 1934, as amended. For this purpose, any statements contained in this Presentation that relate to future events or conditions including, without limitation, the statements regarding site work for and construction of additional buildings, closing of land transactions currently under agreement, acquisition and growth strategy as disclosed herein, growing cash flow and increasing stockholder value, approvals for future developments on Griffin’s land, monetization of land holdings, anticipated impact of the U.S. tax reform, changes in certain expenses, potential impact of increased interest rates on future borrowings, industry prospects, offerings that may be made pursuant to an “at-the-market” equity distribution program and related impact and use of proceeds, or Griffin’s plans, expectations, or prospective results of operations or financial position, may be deemed to be forward-looking statements. Without limiting the foregoing, the words “believes,” “anticipates,” “plans,” “expects” and similar expressions are intended to identify forward-looking statements. Such forward-looking statements represent management’s current expectations and are inherently uncertain. There are a number of important factors that could materially impact the value of Griffin’s common stock or cause actual results to differ materially from those indicated by such forward-looking statements. Such factors are described in Griffin’s Securities and Exchange Commission filings, including the “Business,” “Risk Factors” and “Forward-Looking Information” sections in Griffin’s Annual Report on Form 10-K for the fiscal year ended November 30, 2017. Although Griffin believes that its plans, intentions and expectations reflected in such forward-looking statements are reasonable, it can give no assurance that such plans, intentions or expectations will be achieved. The projected information disclosed in this Presentation is based on assumptions and estimates that, while considered reasonable by Griffin as of the date hereof, are inherently subject to significant business, economic, competitive and regulatory uncertainties and contingencies, many of which are beyond the control of Griffin and which could cause actual results and events to differ materially from those expressed or implied in the forward-looking statements. Griffin disclaims any obligation to update any forward-looking statements in this Presentation as a result of developments occurring after the date of this Presentation except as required by law. |
|
|
WHO IS GRIFFIN? Griffin acquires, develops, and manages industrial real estate properties in select infill, emerging and regional markets Focus on smaller light industrial/warehouse buildings (100,000 to 400,000 square feet) Converts its undeveloped land into income producing properties Publicly traded since the 1997 spin-off with a corporate history dating back to 1906 Enterprise value of approximately $292 million* * Based on stock price as of May 4, 2018 and balance sheet data as of February 28, 2018. See page 23 for calculation. 3 |
|
|
current Portfolio 3,710,000 Square Feet 35 Buildings Data as of February 28, 2018 4 INDUSTRIAL/WAREHOUSE PROPERTIES (23 buildings) Total Square Feet 3,277,000 % of Portfolio 88% Average Building Size (sf) 142,000 Average Lease Size (sf) 80,000 Wtd. Avg. Remaining Lease Term 4.7 years Wtd. Avg. Building Age 9.9 years Under Construction (2 buildings) (sf) 368,000 FLEX/OFFICE PROPERTIES (12 buildings) Total Square Feet 433,000 % of Portfolio 12% Average Building Size (sf) 36,000 UNDEVELOPED LAND HOLDINGS Book Value Acres $MM Master-Planned Industrial 227 $5.1 Significant Commerical/Mixed Use 314 1.6 Under Sale Agreement for Solar Project 280 0.2 Entitled Residential 296 9.6 Leased to Nursery Operators 1,736 1.8 Other Land Holdings 1,026 2.9 Total 3,879 $21.2 |
|
|
GRIFFIN STRATEGY 5 |
|
|
KEYS TO GROWING CASH FLOW AND increasING StockHOLDER VALUE Maintain high occupancy in existing portfolio Continue development on existing land holdings Sell currently owned land to fund purchases of buildings or land for potential development Focused acquisition strategy Leverage existing infrastructure/G&A 6 |
|
|
maintain occupancy in existing portfolio 7 Square Footage Leased (in millions) Square footage leased is as of each applicable fiscal year end. Source: CBRE New England Marketview, Q4 2017 Griffin percentage leased information as of February 28, 2018. Source: CBRE Market Snapshot Lehigh Valley PA Industrial, Q4 2017 +93% 74% 79% 84% 89% 93% 95% Occupancy Griffin’s industrial portfolio is 98% leased(2) Greater Hartford industrial market vacancy is 8.8%(1) with the north sub-market at 6.3%(1) Key distribution market to access NE population CT/New England continues to be land constrained. Griffin’s CT industrial portfolio is 96% leased(2) Lehigh Valley industrial market vacancy remains low at approximately 6.9%(3) Considered top tier industrial market Griffin’s Lehigh Valley portfolio is 100% leased (2) Office market remains challenging with the Greater Hartford office vacancy at approximately 17.9%(1) with the north submarket at 30.9%(1) Griffin’s office portfolio is 74% leased (2) Office is 12% of Griffin’s portfolio (2) and this percentage is expected to decline |
|
|
Development on existing property Case Study - 330 Stone Road 8 137,000 sf building in NE Tradeport (CT) completed November 2017 NE Tradeport was essentially 100% occupied, Hartford industrial market vacancy low Low cost basis land Pre-leased 54% of the building before construction started Financial Summary: Estimated stabilized(1) costs: $71/sf Estimated unlevered stabilized(1) yield on cost: 8.6% Received $51/sf ($7 million) in mortgage proceeds, reducing net cash investment to $20/sf Avg. estimated stabilized(1) levered yield on cost over first five lease years: 14.8% Potential value of $87/sf or 1.7x Griffin’s net investment (+$16/sf) assuming 7.0% cap rate See appendix for definitions of net cash investment, unlevered yield on cost and levered yield on cost (1) Stabilized assumes lease-up of remaining 63,000 square feet of 330 Stone Road by August 2018 for a 5 year term at an initial lease rate of $5.85/sf (with 3% annual increases) and requiring approximately $10.50/sf in tenant improvements and leasing commissions. |
|
|
Successful historical development program 9 Last 5 developments totaling $77 million of investment averaged a 17.3% levered return and generated 2.1x Griffin’s net cash investment using a 6.6% avg. cap rate 2.1x $20.9 $55.7 $24.0 $0.0 $20.0 $40.0 $60.0 $80.0 $100.0 $120.0 4275 Fritch (2013) 9.6% 20.2% 4270 Fritch (2014) 8.4% 16.8% 5220 Jaindl (2015) 8.6% 17.9% 5210 Jaindl (2016) 7.8% 16.4% 330 Stone (2017)* 8.6% 14.8% Total 8.7% 17.3% Total Investment (in millions) Developments Since 2013 Net Equity Debt Value Created Unlev . Yield on Cost Levered Yield on Cost |
|
|
Development pipeline 10 234,000SF Build-to-Suit, NE Tradeport, CT (under construction) 12.5 year lease with investment-grade tenant $13.8+ million construction to permanent loan at 4.51%, 15 year term Net cash investment less than $3 million or approximately $12/sf, helped by low cost basis land Completion expected fiscal Q4 2018 134,000SF “Spec” Building, Lehigh Valley, PA (under construction) Lehigh Valley market vacancy remains low with strong tenant activity and rising rents Expected completion fiscal Q3 2018 – marketing efforts just beginning 283,000SF “Spec” 2 Building Development, Concord, NC (approvals expected soon) Expect to close on $2.6 million land purchase shortly after approvals received Charlotte market vacancy remains low with strong absorption Expect to commence sitework on first building in 2nd half of fiscal 2018 368,000sf under construction and expect approvals for 283,000sf for future development located in all three of Griffin’s current markets |
|
|
Monetizing Land Holdings 11 Reported Revenue from Property Sales (GAAP) (millions) The cumulative land sales of $40.7 million generated a pretax gain of $32 million $13.9 million in land sales in 2017 Largest sale of $10.25 million to leading specialty grocer Agreement in place for a $7.7 million land sale for use as a solar farm Buyer received approvals which are currently being contested We continue to seek to monetize additional land holdings $0.9 million sale in April 2018 (agricultural land) Industrial land to warehouse users who want to own Non-industrial land We have realized $40.7 million in revenue from land sales since 2011 Financial information is as of each applicable fiscal year end. |
|
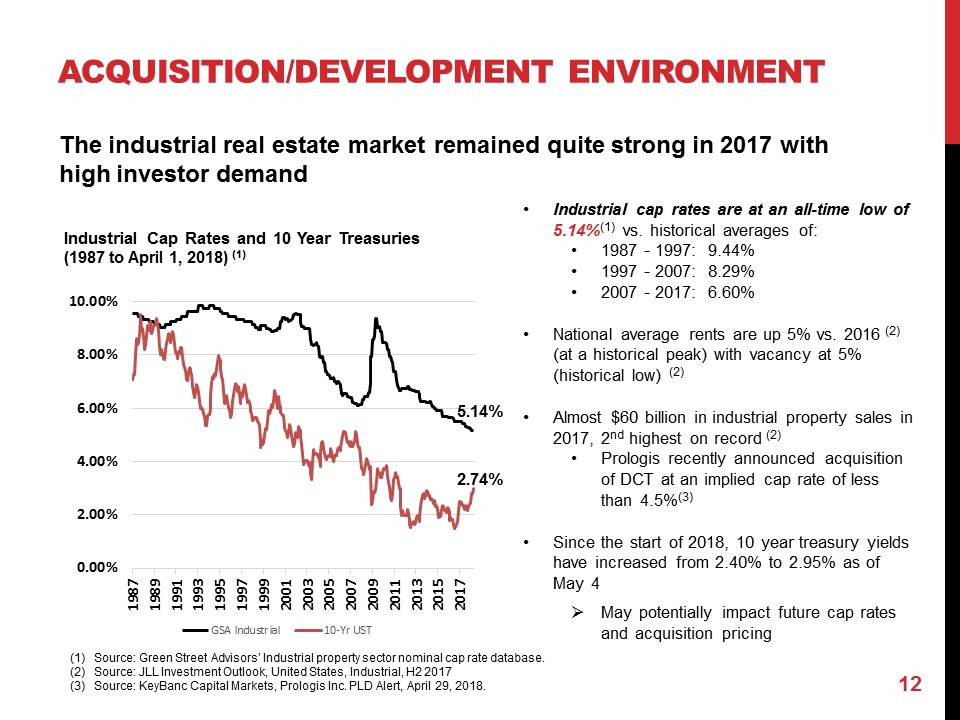
acquisition/development Environment The industrial real estate market remained quite strong in 2017 with high investor demand Industrial Cap Rates and 10 Year Treasuries (1987 to April 1, 2018) (1) " Industrial cap rates are at an all-time low of 5.14%(1) vs. historical averages of:" 1987 - 1997: 9.44%" 1997 - 2007: 8.29%" 2007 - 2017: 6.60%" National average rents are up 5% vs. 2016 (2) (at a historical peak) with vacancy at 5% (historical low) (2)" Almost $60 billion in industrial property sales in 2017, 2nd highest on record (2)" Prologis recently announced acquisition of DCT at an implied cap rate of less than 4.5%(3)" Since the start of 2018, 10 year treasury yields have increased from 2.40% to 2.95% as of May 4" May potentially impact future cap rates and acquisition pricing(1) Source: Green Street Advisors’ Industrial property sector nominal cap rate database.(2) Source: JLL Investment Outlook, United States, Industrial, H2 2017(3) Source: KeyBanc Capital Markets, Prologis Inc. PLD Alert, April 29, 2018.1987 1987 1991 1993 1995 1997 1999 2001 2003 2005 2007 2009 2011 2013 2015 2017 10.00% 8.00% 6.00% 4.00% 2.00% 0.00% GSA Industrial 10-Yr UST |
|
|
ACQUISITION/GROWTH STRATEGY Acquire industrial/warehouse buildings between 100,000 and 400,000 square feet Key locations for national or international companies (regional/super-regional distribution) Provide last mile of distribution for users that cannot be accommodated by big box For smaller tenants, the property may be a tenant’s sole or mission critical location Targeted regional strategy Achieve critical mass in a handful of targeted markets; Deep local market knowledge: leads to proprietary deal sourcing/ways to add value Current focus on the Northeast, Middle Atlantic and Southeast Markets with large/growing populations, close proximity to key transportation infrastructure (major highways, airports, rail, seaports) and supply constraints/barriers to entry Examples: Charlotte, Nashville, Orlando, Charleston, Greenville/Spartanburg, Baltimore/Washington DC Types of Assets Core or Value-Add Opportunities with conservative underwriting and cap rate discipline Seek to buy at a discount to replacement cost - buy “buildings” (cost/foot) rather than leases Well-located, functional and flexible assets – appeals to a broad set of users and tenant sizes Single or multi-tenant, clear heights typically 24 feet and above, modest amount of office Acquisitions of Land Seek entitled and raw land to take through approvals for industrial/warehouse development Not seeking to land bank for the long term but rather buy parcels for nearer term development 13 |
|
|
Existing & possible Target markets 14 Hartford Lehigh Valley Charlotte Existing Markets Baltimore/Wash. DC Target Markets Charleston/Savannah Orlando/Tampa Nashville Land Holdings Greenville/Spartanburg Central PA |
|
|
Acquisition strategy – charlotte, nc 15 Why Charlotte? Compelling economic and demographic growth 21st largest MSA in the US (2.5 million people)(3) with 65% population growth since 2000 GDP grew 31% between 2011-2016, 9th most among largest MSAs (4) Robust transportation infrastructure Charlotte Douglas Airport (CLT) is one of the busiest in the country Intermodal rail yard at CLT (Norfolk Southern & CSX both are active in Charlotte) Convenient access to Ports of Charleston and Savannah Major highways – I-77, I-85, I-40 and recent completion of the I-485 “ring road” beltway Strong industrial/warehouse market dynamics Well-located for local, regional, super-regional distribution Class A rents below national average Potential for Griffin to increase its scale over time through acquisition and development Charlotte Industrial Market (1) 164.1MM SF of warehouse space 37.4MM Class A (2) 4.4% vacancy rate 26.5% rent growth 3Q 2012 to 4Q 2017 3.0MM SF absorption in 2017 3.5MM SF new deliveries in 2017 Source: Cushman & Wakefield: Charlotte Americas MarketBeat Industrial Q4 2017. Data as of the end of Q4 2017 unless otherwise indicated. Source: Class A square footage - CoStar Source: U.S. Census Bureau Source: Bureau of Economic Analysis, U.S. Department of Commerce |
|
|
277,000 sf, Class A warehouse, located just northeast of Charlotte in Concord, NC Off-market transaction - acquisition sourced through relationship with local developer Value-add opportunity - building was 61% leased at time of sale agreement to 2 tenants 100% leased shortly after closing - existing tenant expanded into balance of the space Strategic new market entry - ability to grow through future acquisition and development Under agreement to purchase approximately 22 acres across the street for $2.6 million with plans to build approx. 283,500 sf in two buildings Utilized a 1031 “Like–Kind” Exchange to purchase the building; deferred taxable gain from $10.3 million CT land sale Purchased for $18.4 million ($66/SF), financed with a $12.15 million mortgage at 3.97% Current unlevered yield on cost of 6.57% 10.3% average expected levered yield on cost over first five lease years The combination of the CT land sale/NC building acquisition and financing resulted in net $3.2 million of additional cash, ownership of a fully-leased 277,000 sf building, approx. $700,000 in cash income after interest expense and deferral of income taxes on an $8 million gain. Acquisition strategy – case Study: 215 International Drive, concord NC 16 |
|
|
FINANCIALS AND Valuation 17 |
|
|
Financial summary 18 (in thousands) 2014 2015 2016 2017 LTM Feb 2018 Rental Revenue 20,552 $ 24,605 $ 26,487 $ 29,939 $ 31,140 $ Operating Expenses of Rental Prop. 7,801 8,415 8,250 8,866 9,058 Profit from Leasing Activities (1) 12,751 $ 16,190 $ 18,237 $ 21,073 $ 22,082 $ % Growth 1.2% 27.0% 12.6% 15.6% 21.2% Other Income Statement Items Gain on Property Sales 2,864 $ 2,849 $ 3,554 $ 10,165 $ 10,201 $ General & Administrative Expenses 7,077 7,057 7,367 8,552 8,459 Depreciation & Amortization Expense 6,729 7,668 8,797 10,064 10,532 Interest Expense 3,529 3,670 4,545 5,690 5,909 Cash Flow Items Additions to Real Estate Assets (15,583) $ (31,188) $ (15,734) $ (36,045) $ (36,082) $ Mortgage Amortization (2,017) (2,232) (2,679) (3,306) (3,393) Balance Sheet & Other Items Cash & Equivalents 17,059 $ 18,271 $ 24,689 $ 30,068 $ 33,260 $ Real Estate Assets, net (2) 144,465 167,873 175,252 198,672 198,425 Mortgage Loans 70,168 90,436 111,139 130,977 137,119 Square feet leased 2,318 2,706 3,066 3,515 3,526 Occupancy 84% 89% 93% 95% 95% (1) Profit from Leasing Activities is a non-GAAP financial measure. See Appendix for further information on Profit from Leasing Activities. (2) Includes real estate assets at cost, net and real estate held for sale. Fiscal Year |
|
|
profit from Leasing activities* 19 * See appendix for further information on Profit from Leasing Activities. Increase in portfolio square footage led to meaningful growth in Profit from Leasing Activities Does not include additional Profit from Leasing Activities expected from Full year impact of leases signed during fiscal 2017 Full year impact of fiscal 2017 acquisition in NC Lease of Build-to-Suit building currently under construction Offset by full year impact of leases that expired (or expected to expire) during the year 74% 79% 84% 89% 93% 95% 95% Occupancy ($ millions) Fiscal Year $11.8 $12.6 $12.8 $16.2 $18.2 $21.1 $22.1 2012 2013 2014 2015 2016 2017 LTM Q1 2018 +79% |
|
|
G&A expenses 20 Salaries/benefits is the largest expense but this includes “operating” personnel SVP’s in-house leasing representation reduces commissions to third parties VP of Construction’s expense would be capitalized if third party Certain expense items have revenue offsets (e.g. farm lease revenues vs. holding costs of undeveloped land) Deferred comp plan typically causes largest yearly G&A variations G&A expenses are not expected to increase materially as rental revenue grows Griffin G&A Breakdown – 3 year average (FY 2015-2017) Bar chart reflects 3 year average (fiscal 2015 through fiscal 2017) of various components of Griffin’s General and Administrative expenses. (1) Other includes capital based/franchise taxes, insurance expense, certain occupancy expenses, marketing and other general expenses. $7.7 million |
|
|
Impact of US Tax Reform Corporate federal statutory tax rate reduced from 35% to 21% Griffin typically has not paid federal income taxes (benefit of interest expense and depreciation expense) but if we do generate taxable income in the future, the savings would be material Reduces tax disadvantage of C-Corp structure versus REIT (0% tax rate) Though REIT dividends (as a pass-through entity) benefit from a more favorable tax rate vs. C-Corp. dividends Fiscal 2018 results include a non-cash charge (included in income tax provision) for remeasurement of deferred tax assets at the new tax rate As a real estate company, Griffin can elect to avoid the cap/limitation on the deductibility of interest expense from debt As an offset, Griffin would lose some benefits of accelerated depreciation Section 1031 Like-Kind Exchanges remain mostly intact Net impact to Griffin’s cash payment of taxes expected to be quite small in the near/medium term. 21 |
|
|
Valuation considerations Griffin has generated strong growth in its Profit from Leasing Activities(1) 21.2% growth for the LTM period ended February 28, 2018 and 15.6% for fiscal 2017 Given our size, new developments, acquisitions or sizable leases can have a material impact on our profit growth Profit from Leasing Activities(1) for the LTM period ended February 28, 2018 does not include: Full year impacts of leases signed during fiscal 2017 and the acquisition in NC in June 2017, impact of the build-to-suit currently under development (partially offset by leases that expired, or expected to expire, during the fiscal year) All of Griffin’s debt outstanding is locked in at or swapped into fixed rates with a weighted average rate of 4.29% as of February 28, 2018 Eliminates exposure to higher interest expense on current borrowings Less than $7.8 million (6%) out of $137.1 million outstanding matures before 2025 Rates may have bottomed and future mortgages likely will be above the current average Typical “income” valuation metrics are difficult to apply to Griffin Undeveloped land accounts for a portion of Griffin’s “value” but contributes to G&A cost Ability to further leverage G&A Balance sheet reflects book value of assets not market value Book Value of Buildings(1) is approx. $46.56 per square foot, well below estimated market 22 (1) See appendix for further information on Profit from Leasing Activities and Book Value of Buildings. |
|
|
Strong growth rate in Profit from Leasing Activities should support better valuation Does not include net positive impacts from leases signed in second half of 2017 and early 2018 Book value of land we believe is below market value Does not reflect sales price for land currently under agreement of sale Implied cap rate of 7.7% is well above the approximate 5.15%(1) to 5.24%(2) industry comparables Assuming a 6.5% cap rate for Griffin would imply an equity value of over $47/share (with land at book value) Prologis to acquire DCT at an implied value above $107/sf and below a 4.5% cap rate(3) (in thousands) 23 Implied value of Griffin’s real estate Stock price as of May 4, 2018. Undeveloped Land at Book Value includes land, land improvements and development costs associated with the undeveloped land (including the land leased to nursery operators) as of February 28, 2018. Shares outstanding, long-term debt and cash are all as of February 28, 2018. Building Profit from Leasing Activities is for the LTM ended February 28, 2018 and is not a measure calculated in accordance with GAAP. See Appendix for further information. (1) Source: Green Street Advisors’ property sector nominal cap rate database. (2) Source: KeyBanc Capital Markets, Industrial Leaderboard, May 4, 2018, Industrial sector implied capitalization rate. (3) Source: KeyBanc Capital Markets, Prologis Inc. PLD Alert, April 29, 2018. With undeveloped land valued at book, the implied value of Griffin’s buildings is $73/sf which equates to a 7.7% cap rate. Shares Outstanding 5,001 Stock Price $ 37.59 Market Capitalization $ 187,988 Long-Term Debt $ 137,119 Cash $ (33,260) Enterprise Value $ 291,847 Undeveloped Land at Book Value $ (21,190) $ 5,463 /acre Implied Building Value $ 270,657 $ 72.95 /sq.ft. Building Profit From Leasing Activities $ 20,829 Implied Building Value $ 270,657 Implied Capitalization Rate 7.7% |
|
|
ATM Facility Griffin initiated a $30 million “at-the-market” equity distribution program under its $50 million universal shelf offering Intended to add financial flexibility and ready access to capital when and if needed Proceeds to be used for acquisitions, debt repayment or other corporate purposes ATM facility is effective for 3 years and can be renewed Shares may be issued as needed and in required amounts Compared to a “traditional” secondary offering, the ATM reduces the impact of potential dilution (shares not issued all at once, no “excess cash” raised) and cost (lower underwriting fees) ATM may benefit Griffin through Broadening of the investor base by providing more shares available for sale Potentially increasing the liquidity in our stock trading over time As of February 28, 2018 we had $33.3 million in cash and do not expect to issue securities under the ATM program in the near term 24 |
|
|
2017 Year In review WHAT WE DID WELL Continued to grow profit from leasing activities with a strong run-rate Accelerated growth in our portfolio – from 3.3 million sf to 3.7 million sf 4.1 million sf including 2 buildings under construction, a 23.7% increase since the start of fiscal 2017 Entered a new market, Charlotte, utilizing land sale proceeds in a 1031 Exchange Monetized land holdings – received approximately $13.9 million from land sales and have agreements in place for additional sales Continued our development pipeline - approximately 283,000 square feet in Charlotte Continued to grow our capital available for acquisitions and development – mortgage proceeds and access through the ATM program Increased the annual dividend 33%, from $0.30 to $0.40 per share Stock price up 24.9% since last year’s annual meeting ($30.10 on 5/8/17) 25 |
|
|
2017 Year In review WHERE WE WANT TO IMPROVE/AREAS OF CONCERN Increase the rate of investment in acquisitions and development Find more opportunities with acceptable cash on cash returns Continue to selectively expand into other geographic markets Impact of rising interest rates – will make mortgage financings more expensive and dampen levered returns Uncertainty may create more opportunities/benefit of having excess cash and access to capital (revolver, ATM facility) Inflation – construction costs have been trending upward - need to watch rent growth and expectations Office/Flex portfolio in CT is currently 74% leased and market remains very competitive with high vacancy Will continue to work to improve the performance of our existing properties but will not add to this portfolio Continued soft interest in our residential developments Valuation gap (implied cap rate and NAV) with peers and desire to expand our shareholder base 26 |
|
|
WHO IS GRIFFIN? Griffin acquires, develops, and manages industrial real estate properties in select infill, emerging and regional markets Focus on smaller light industrial and warehouse buildings (100,000 to 400,000 square feet) Converts its undeveloped land into income producing real estate properties Publicly traded since 1997 spin-off with corporate history dating back to 1906 Enterprise value of approximately $292 million* * Based on stock price as of May 4, 2018 and balance sheet data as of February 28, 2018. See page 23 for calculation. 27 |
|
|
Appendix – NOTES Profit From Leasing Activities (pages 18, 19, 22 and 23) Profit From Leasing Activities is defined by Griffin as the Rental Revenues less Operating Expenses of Rental Properties and does not include depreciation, general and administrative expenses or interest expense. Building Profit From Leasing Activities is defined by Griffin as Profit from Leasing Activities less the rental profit from leases of the Connecticut and Florida nurseries and leases of various parcels of undeveloped land in Connecticut for use by local farmers (Nursery and Farm Rental Profit). Nursery and Farm Rental Profit is defined by Griffin as Rental Revenues and Operating Expenses of Rental Properties from leases of the Connecticut and Florida nurseries and various parcels of Connecticut land that Griffin owns that are leased to local farmers. Calculation of Building Profit from Leasing Activities Profit from Leasing Activities (LTM 2/28/2018) $22,082 CT and FL Nurseries and Farm Rental Profit (1,253) Building Profit from Leasing Activities $20,829 28 Book Value of Buildings and Book Value of Undeveloped Land (pages 4, 22 and 23) Calculation of Book Value of Undeveloped Land Undeveloped Land includes all acreage not associated with an existing building or a building under construction and includes the CT and FL nurseries. Book Value of Undeveloped Land reflects the cost of the land, land improvements (after depreciation), development costs on undeveloped land and all equipment on the CT and FL nurseries. The Book Value of Undeveloped Land per acre of $5,463 is calculated by dividing the $21.2 million Book Value of Undeveloped Land (see pages 4 and 23) by Griffin’s total undeveloped acres of 3,879 (see page 4). Calculation of Book Value of Buildings: Book Value of Buildings reflects the sum of $172.7 million for the net book value (after depreciation) of land, land improvements, buildings, building improvements and tenant improvements for Griffin’s buildings as of February 28, 2018. The Book Value of Buildings of $46.56 per square foot is calculated by dividing the Book Value of Buildings totaling $172.7 million by the 3.7 million square feet of buildings in Griffin’s portfolio. |
|
|
Appendix - NOTES 29 Case Study (pages 8, 9 and 16) Cash Costs is defined as land (at book value) plus the cash costs for building construction, including land improvements, tenant improvements, leasing costs and required off-site improvements, if any. Net cash investment is defined as Cash Costs less the proceeds from mortgage financing, net of any costs related to such financing. The net cash investment is adjusted annually and increased for any additional investment (e.g. tenant improvements) into the building and increased by the annual mortgage amortization (if any) related to the financing on the building. Unlevered yield on cost or unlevered return is defined as the average, over the period the entire building is leased, of the annual Profit from Leasing Activities (Rental Revenues less Operating Expenses of Rental Properties) of the property (determined using the contracted rental rates in the triple net (NNN) lease) divided by the Cash Costs. Levered yield on cost or levered return is defined as the average, over the period the entire building is leased, of the annual Profit from Leasing Activities (Rental Revenues less Operating Expenses of Rental Properties) of the property (determined using the contracted rental rates in the triple net (NNN) lease) less the annual interest expense from the financing on the property divided by the net cash investment. Multiple of Griffin’s net investment is determined by: (i) dividing the average, over the term the entire building is leased, contractual rental rate per square foot as set forth in the lease by a capitalization rate to determine a value per square foot for the property; (ii) subtracting the principal amount of the mortgage (on a per square foot basis) on the property at inception from the value per square foot of the property calculated in (i) and multiplying the result by the total square footage of the property; and (iii) dividing the amount determined in (ii) by the net cash investment as determined above. The capitalization rate used in this analysis is based on capitalization rates used by third-party appraisers for the subject or similar properties. |