Attached files
| file | filename |
|---|---|
| EX-32.2 - CERTIFICATION CHIEF FINANCIAL OFFICER PURSUANT TO 18 U.S.C. SECTION 1350, AS ADO - Carbon Energy Corp | ex32_2.htm |
| EX-32.1 - CERTIFICATION OF CHIEF EXECUTIVE OFFICER PURSUANT TO 18 U.S.C. SECTION 1350, AS - Carbon Energy Corp | ex32_1.htm |
| EX-31.2 - RULE 13A-14(A)/15D-14(A) - CERTIFICATION OF CHIEF FINANCIAL OFFICER. - Carbon Energy Corp | ex31_2.htm |
| EX-31.1 - RULE 13A-14(A)/15D-14(A) - CERTIFICATION OF CHIEF EXECUTIVE OFFICER. - Carbon Energy Corp | ex31_1.htm |
| EX-2.4 - AMENDMENT NO. 3 PURCHASE AND SALE AGREEMENT - Carbon Energy Corp | f10q0318ex2-4_carbonnatural.htm |
| EX-2.3 - AMENDMENT NO. 2 PURCHASE AND SALE AGREEMENT - Carbon Energy Corp | f10q0318ex2-3_carbonnatural.htm |
| EX-2.2 - AMENDMENT NO. 1 PURCHASE AND SALE AGREEMENT - Carbon Energy Corp | f10q0318ex2-2_carbonnatural.htm |
| EX-2.1 - PURCHASE AND SALE AGREEMENT - Carbon Energy Corp | f10q0318ex2-1_carbonnatural.htm |
UNITED STATES
SECURITIES AND EXCHANGE COMMISSION
Washington, D.C. 20549
FORM 10-Q
☒ Quarterly report pursuant to section 13 or 15(d) of the Securities Exchange Act of 1934
For the quarter ended March 31, 2018
or
☐ Transition report pursuant to section 13 or 15(d) of the Securities Exchange Act of 1934
For the transition period from ___________ to ____________
Commission File Number: 000-02040
| CARBON NATURAL GAS COMPANY |
| (Exact name of registrant as specified in its charter) |
| Delaware | 26-0818050 | |
| (State or other jurisdiction of | (I.R.S. Employer | |
| incorporation or organization) | Identification No.) | |
| 1700 Broadway, Suite 1170, Denver, CO | 80290 | |
| (Address of principal executive offices) | (Zip Code) |
Registrant's telephone number, including area code: (720) 407-7043
| (Former name, address and fiscal year, if changed since last report) |
Indicate by check mark whether the registrant (1) has filed all reports required to be filed by Section 13 or 15(d) of the Securities Exchange Act of 1934 during the preceding 12 months (or for such shorter period that the Company was required to file such reports), and (2) has been subject to such filing requirements for the past 90 days.
YES ☒ NO ☐
Indicate by check mark whether the registrant has submitted electronically and posted on its corporate Web site, if any, every Interactive Data File required to be submitted and posted pursuant to rule 405 of Regulations S-T (§232.405 of this chapter) during the preceding 12 months (or for such shorter period that the registrant was required to submit and post such files).
YES ☒ NO ☐
Indicate by check mark whether the registrant is a large accelerated filer, an accelerated filer, a non-accelerated filer, or a smaller reporting company. See definitions of “large accelerated filer,” “accelerated filer”, “smaller reporting company” and “emerging growth company” in Rule 12b-2 of the Exchange Act.
| Large accelerated filer | ☐ | Smaller reporting company | ☒ | ||
| Accelerated filer | ☐ | Emerging growth company | ☐ | ||
| Non-accelerated filer | ☐ | (Do not check if a smaller reporting company) |
If an emerging growth company, indicate by check mark if the registrant has elected not to use the extended transition period for complying with any new or revised financial accounting standards pursuant to Section 13(a) of the Exchange Act. ☐
Indicate by check mark whether the registrant is a shell company (as defined in Rule 12b-2 of the Exchange Act).
YES ☐ NO ☒
Indicate the number of shares outstanding of each of the issuer's classes of common stock, as of the latest practicable date.
At May 14, 2017, there were 7,700,619 issued and outstanding shares of the Company’s common stock, $0.01 par value.
Carbon Natural Gas Company
TABLE OF CONTENTS
| Part I – FINANCIAL INFORMATION | |
| Item 1. Consolidated Financial Statements | 1 |
| Consolidated Balance Sheets (unaudited) | 1 |
| Consolidated Statements of Operations (unaudited) | 2 |
| Consolidated Statements of Stockholders’ Equity (unaudited) | 3 |
| Consolidated Statements of Cash Flows (unaudited) | 4 |
| Notes to the Consolidated Financial Statements (unaudited) | 5 |
| Item 2. Management’s Discussion and Analysis of Financial Condition and Results of Operations | 32 |
| Item 4. Controls and Procedures | 44 |
| Part II – OTHER INFORMATION | |
| Item 2. Unregistered Sales of Equity Securities and Use of Proceeds | 45 |
| Item 6. Exhibits | 45 |
PART I. FINANCIAL INFORMATION
ITEM 1. Financial Statements
CARBON NATURAL GAS COMPANY
Consolidated Balance Sheets
| March 31, | December 31, | |||||||
| (in thousands) | 2018 | 2017 | ||||||
| (Unaudited) | ||||||||
| ASSETS | ||||||||
| Current assets: | ||||||||
| Cash and cash equivalents | $ | 4,114 | $ | 1,650 | ||||
| Accounts receivable: | ||||||||
| Revenue | 3,522 | 2,206 | ||||||
| Joint interest billings and other | 2,137 | 349 | ||||||
| Insurance receivable (Note 2) | 2,834 | 802 | ||||||
| Due from related parties | 571 | 2,075 | ||||||
| Other | 280 | - | ||||||
| Commodity derivative asset | - | 215 | ||||||
| Prepaid expense, deposits and other current assets | 2,058 | 783 | ||||||
| Total current assets | 15,516 | 8,080 | ||||||
| Property and equipment (Note 4) | ||||||||
| Oil and gas properties, full cost method of accounting: | ||||||||
| Proved, net | 89,956 | 34,178 | ||||||
| Unproved | 3,505 | 1,947 | ||||||
| Other property and equipment, net | 1,631 | 737 | ||||||
| Total property and equipment, net | 95,092 | 36,862 | ||||||
| Investments in affiliates (Note 6) | 12,850 | 14,267 | ||||||
| Other long-term assets | 1,777 | 800 | ||||||
| Total assets | $ | 125,235 | $ | 60,009 | ||||
| LIABILITIES AND STOCKHOLDERS’ EQUITY | ||||||||
| Current liabilities: | ||||||||
| Accounts payable and accrued liabilities (Note 11) | $ | 18,566 | $ | 11,218 | ||||
| Firm transportation contract obligations (Note 14) | 123 | 127 | ||||||
| Commodity derivative liability (Note 13) | 1,769 | - | ||||||
| Total current liabilities | 20,458 | 11,345 | ||||||
| Non-current liabilities: | ||||||||
| Firm transportation contract obligations (Note 14) | 107 | 134 | ||||||
| Production and property taxes payable | 550 | 520 | ||||||
| Warrant liability (Note 12) | - | 2,017 | ||||||
| Asset retirement obligations (Note 5) | 10,032 | 7,357 | ||||||
| Credit facility (Note 7) | 23,223 | 22,140 | ||||||
| Credit facility-related party (Note 7) | 21,922 | - | ||||||
| Commodity derivative non-current liability (Note 13) | 910 | - | ||||||
| Total non-current liabilities | 56,744 | 32,168 | ||||||
| Commitments (Note 14) | ||||||||
| Stockholders’ equity: | ||||||||
| Preferred stock, $0.01 par value; authorized 1,000,000 shares, no shares issued and outstanding at March 31, 2018 and December 31, 2017 | - | - | ||||||
| Common stock, $0.01 par value; authorized 10,000,000 shares, 7,572,048 and 6,005,633 shares issued and outstanding at March 31, 2018 and December 31, 2017, respectively | 76 | 60 | ||||||
| Additional paid-in capital | 69,208 | 58,813 | ||||||
| Accumulated deficit | (40,649 | ) | (44,218 | ) | ||||
| Total Carbon stockholders’ equity | 28,635 | 14,655 | ||||||
| Non-controlling interests | 19,398 | 1,841 | ||||||
| Total stockholders’ equity | 48,033 | 16,496 | ||||||
| Total liabilities and stockholders’ equity | $ | 125,235 | $ | 60,009 | ||||
See accompanying notes to Consolidated Financial Statements.
| 1 |
CARBON NATURAL GAS COMPANY
Consolidated Statements of Operations
(Unaudited)
| Three Months Ended March 31, | ||||||||
| (in thousands, except per share amounts) | 2018 | 2017 | ||||||
| Revenue: | ||||||||
| Natural gas sales | $ | 3,939 | $ | 3,994 | ||||
| Natural gas liquid sales | 163 | - | ||||||
| Oil sales | 2,983 | 1,046 | ||||||
| Commodity derivative (loss) gain | (626 | ) | 2,144 | |||||
| Other income | 14 | 9 | ||||||
| Total revenue | 6,473 | 7,193 | ||||||
| Expenses: | ||||||||
| Lease operating expenses | 2,087 | 1,205 | ||||||
| Transportation and gathering costs | 855 | 489 | ||||||
| Production and property taxes | 433 | 412 | ||||||
| General and administrative | 2,948 | 1,745 | ||||||
| General and administrative - related party reimbursement | (1,116 | ) | (75 | ) | ||||
| Depreciation, depletion and amortization | 1,492 | 573 | ||||||
| Accretion of asset retirement obligations | 141 | 78 | ||||||
| Total expenses | 6,840 | 4,427 | ||||||
| Operating (loss) income | (367 | ) | 2,766 | |||||
| Other income (expense): | ||||||||
| Interest expense | (1,002 | ) | (267 | ) | ||||
| Warrant derivative gain | 225 | 830 | ||||||
| Gain on derecognized equity investment in affiliate – Carbon California | 5,391 | - | ||||||
| Investment in affiliates | 437 | 7 | ||||||
| Total other income (expense) | 5,051 | 570 | ||||||
| Income before income taxes | 4,684 | 3,336 | ||||||
| Provision for income taxes | - | - | ||||||
| Net income before non-controlling interests | 4,684 | 3,336 | ||||||
| Net income attributable to non-controlling interests | 1,115 | 44 | ||||||
| Net income attributable to controlling interest | $ | 3,569 | $ | 3,292 | ||||
| Net income per common share: | ||||||||
| Basic | $ | 0.51 | $ | 0.60 | ||||
| Diluted | $ | 0.46 | $ | 0.40 | ||||
| Weighted average common shares outstanding: | ||||||||
| Basic | 6,996 | 5,487 | ||||||
| Diluted | 7,226 | 6,255 | ||||||
See accompanying notes to Consolidated Financial Statements.
| 2 |
CARBON NATURAL GAS COMPANY
Consolidated Statements of Stockholders’ Equity
(Unaudited)
(in thousands)
| Additional | Non- | Total | ||||||||||||||||||||||
| Common Stock | Paid-in | Controlling | Accumulated | Stockholders’ | ||||||||||||||||||||
| Shares | Amount | Capital | Interests | Deficit | Equity | |||||||||||||||||||
| Balances, December 31, 2017 | 6,006 | $ | 60 | $ | 58,813 | $ | 1,841 | $ | (44,218 | ) | $ | 16,496 | ||||||||||||
| Stock based compensation | 38 | 1 | 292 | - | - | 293 | ||||||||||||||||||
| CCC Warrant Exercise - Share Issuance | 1,528 | 15 | 8,311 | 16,466 | - | 24,792 | ||||||||||||||||||
| CCC Warrant Exercise - liability extinguishment | - | - | 1,792 | - | - | 1,792 | ||||||||||||||||||
| Non-controlling interest distributions, net | - | - | - | (24 | ) | - | (24 | ) | ||||||||||||||||
| Net income | - | - | - | 1,115 | 3,569 | 4,684 | ||||||||||||||||||
| Balances, March 31, 2018 | 7,572 | $ | 76 | $ | 69,208 | $ | 19,398 | $ | (40,649 | ) | $ | 48,033 | ||||||||||||
See accompanying notes to Consolidated Financial Statements.
| 3 |
CARBON NATURAL GAS COMPANY
Consolidated Statements of Cash Flows
(Unaudited)
| Three Months Ended | ||||||||
| March 31, | ||||||||
| (in thousands) | 2018 | 2017 | ||||||
| Cash flows from operating activities: | ||||||||
| Net income | $ | 4,684 | $ | 3,336 | ||||
| Items not involving cash: | ||||||||
| Depreciation, depletion and amortization | 1,492 | 573 | ||||||
| Accretion of asset retirement obligations | 141 | 78 | ||||||
| Unrealized commodity derivative (gain) loss | 249 | (2,167 | ) | |||||
| Warrant derivative gain | (225 | ) | (830 | ) | ||||
| Stock-based compensation expense | 292 | 319 | ||||||
| Equity investment (income)loss | (437 | ) | (7 | ) | ||||
| Gain on derecognized equity investment in affiliate – Carbon California | (5,391 | ) | - | |||||
| Amortization of debt issuance costs | 89 | - | ||||||
| Other | - | (36 | ) | |||||
| Net change in: | ||||||||
| Accounts receivable | (1,611 | ) | 1,268 | |||||
| Prepaid expenses, deposits and other current assets | 448 | (67 | ) | |||||
| Accounts payable, accrued liabilities, firm transportation contract obligations, and other long-term obligations | 364 | (1,573 | ) | |||||
| Net cash provided by operating activities | 95 | 894 | ||||||
| Cash flows from investing activities: | ||||||||
| Development and acquisition of properties and equipment | (874 | ) | (396 | ) | ||||
| Cash received- Carbon California Acquisition | 275 | - | ||||||
| Other long-term assets | - | (3 | ) | |||||
| Net cash (used in) investing activities | (599 | ) | (399 | ) | ||||
| Cash flows from financing activities: | ||||||||
| Proceeds from credit facility | 3,000 | 300 | ||||||
| Payments on credit facility | (8 | ) | (1,000 | ) | ||||
| Distributions to non-controlling interests | (24 | ) | (23 | ) | ||||
| Net cash provided by (used in) financing activities | 2,968 | (723 | ) | |||||
| Net increase (decrease) in cash and cash equivalents | 2,464 | (228 | ) | |||||
| Cash and cash equivalents, beginning of period | 1,650 | 858 | ||||||
| Cash and cash equivalents, end of period | $ | 4,114 | $ | 630 | ||||
See accompanying notes to Consolidated Financial Statements.
| 4 |
CARBON NATURAL GAS COMPANY
Notes to Consolidated Financial Statements
(Unaudited)
Note 1 – Organization
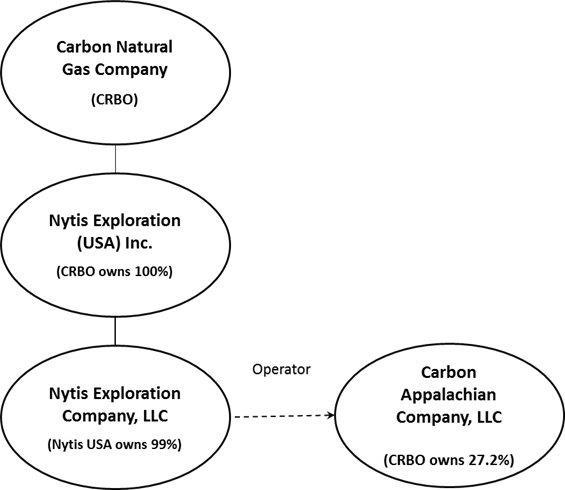
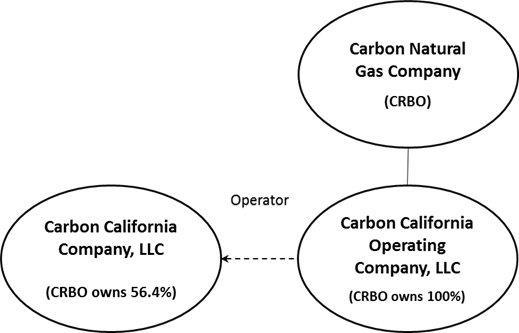
Carbon Natural Gas Company and its subsidiaries (referred to herein as “we”, “us”, or “Carbon” ) is an independent oil and gas company engaged in the exploration, development and production of oil and natural gas in the United States. The Company’s business is comprised of the assets and properties of Nytis Exploration (USA) Inc. (“Nytis USA”) and its subsidiary Nytis Exploration Company LLC (“Nytis LLC”) which conducts the Company’s operations in the Appalachian and Illinois Basins, in addition to its subsidiaries, Carbon California Operating Company, LLC and Carbon California Company, LLC which conducts the Company’s operations in California as well as our equity investment in Carbon Appalachian Company, LLC (“Carbon Appalachia”).
Appalachian and Illinois Basin Operations
In the Appalachian and Illinois Basins, Nytis LLC and Carbon Appalachia conducts our operations. The following illustrates this relationship as of March 31, 2018.
| 5 |
Ventura Basin Operations
In California, Carbon California Operating Company, LLC (“CCOC”) conducts Carbon California Company, LLC’s (“Carbon California”) operations. On February 1, 2018, an entity managed by Yorktown Partners, LLC (“Yorktown”) exercised a warrant it held to purchase shares of our common stock at an exercise price of $7.20 per share (the “California Warrant”), resulting in the issuance of 1,527,778 shares of our common stock. In exchange, we received Yorktown’s Class A Units of Carbon California representing approximately 46.96% of the then outstanding Class A Units of Carbon California (a profits interest of approximately 38.59%). After giving effect to the exercise on February 1, 2018, we own 56.4% of the voting and profits interests of Carbon California and Prudential Capital Energy Partners, L.P. (“Prudential”) owns 43.6%. Yorktown owns 68.6% of the outstanding shares of our common stock as of May 14, 2018, assuming the conversion of the preferred stock (described herein) to 625,000 shares of our common stock. As of February 1, 2018, we consolidate Carbon California for financial reporting purposes.
| 6 |
Note 2 – Summary of Significant Accounting Policies
Basis of Presentation
The accompanying unaudited condensed consolidated financial statements have been prepared in accordance with accounting principles generally accepted in the United States (“GAAP”) for interim financial information. Accordingly, they do not include all the information and footnotes required by GAAP for complete financial statements. In the opinion of management, the accompanying unaudited condensed consolidated financial statements include all adjustments (consisting of normal and recurring accruals) considered necessary to present fairly our financial position as of March 31, 2018, and our results of operations and cash flows for the three months ended March 31, 2018 and 2017. Operating results for the three months ended March 31, 2018, are not necessarily indicative of the results that may be expected for the full year because of the impact of fluctuations in prices received for oil and natural gas, natural production declines, the uncertainty of exploration and development drilling results and other factors. The unaudited condensed consolidated financial statements and related notes included in this Quarterly Report on Form 10-Q should be read in conjunction with our consolidated financial statements and related notes included in our Annual Report on Form 10-K for the year ended December 31, 2017. Except as disclosed herein, there have been no material changes to the information disclosed in the notes to the consolidated financial statements included in our 2017 Annual Report on Form 10-K.
Principles of Consolidation
The unaudited condensed consolidated financial statements include the accounts of Carbon, CCOC, Carbon California and Nytis USA and its consolidated subsidiary, Nytis LLC. Carbon owns 100% of Nytis USA and CCOC. Nytis USA owns approximately 99% of Nytis LLC. Carbon owns 56.4% of Carbon California.
Nytis LLC also holds an interest in 64 oil and gas partnerships. For partnerships where we have a controlling interest, the partnerships are consolidated. We are currently consolidating, on a pro-rata basis, 47 partnerships. In these instances, we reflect the non-controlling ownership interest in partnerships and subsidiaries as non-controlling interests on our unaudited consolidated statements of operations and reflect the non-controlling ownership interests in the net assets of the partnerships as non-controlling interests within stockholders’ equity on our unaudited consolidated balance sheet. All significant intercompany accounts and transactions have been eliminated.
In accordance with established practice in the oil and gas industry our unaudited condensed consolidated financial statements also include our pro-rata share of assets, liabilities, income, lease operating costs and general and administrative expenses of the oil and gas partnerships in which we have a non-controlling interest.
Non-majority owned investments that do not meet the criteria for pro-rata consolidation are accounted for using the equity method when we have the ability to significantly influence the operating decisions of the investee. When we do not have the ability to significantly influence the operating decisions of an investee, the cost method is used. All transactions, if any, with investees have been eliminated in the accompanying unaudited condensed consolidated financial statements.
Effective February 1, 2018, Yorktown exercised the California Warrant, which resulted in us acquiring Yorktown’s ownership interest in Carbon California in exchange for shares of our common stock. Following the closing of the Seneca Acquisition on May 1, 2018 (see note 16), our ownership decreased to 53.92% of the voting and profits interests of Carbon California, and Prudential owns the remainder.
Insurance Receivable
Insurance receivable is comprised of an insurance receivable for the loss of property as a result of wildfires that impacted Carbon California in December 2017. The Company filed claims with its insurance provider and is in receipt of partial funds associated with the claims as of March 31, 2018. Therefore, the Company has determined the receivable is collectible and is included in insurance receivable on the unaudited consolidated balance sheets.
| 7 |
Investments in Affiliates
Investments in non-consolidated affiliates are accounted for under either the cost or equity method of accounting, as appropriate. The cost method of accounting is generally used for investments in affiliates in which we have has less than 20% of the voting interests of a corporate affiliate or less than a 3% to 5% interest of a partnership or limited liability company and do not have significant influence. Investments in non-consolidated affiliates, accounted for using the cost method of accounting, are recorded at cost and impairment assessments for each investment are made annually to determine if a decline in the fair value of the investment, other than temporary, has occurred. A permanent impairment is recognized if a decline in the fair value occurs.
If we hold between 20% and 50% of the voting interest in non-consolidated corporate affiliates or generally greater than a 3% to 5% interest of a partnership or limited liability company and can exert significant influence or control (e.g., through our influence with a seat on the board of directors or management of operations), the equity method of accounting is generally used to account for the investment. Equity method investments will increase or decrease by our share of the affiliate’s profits or losses and such profits or losses are recognized in our unaudited consolidated statements of operations. For our equity method investment in Carbon Appalachia, we use the hypothetical liquidation at book value method to recognize our share of the affiliate’s profits or losses. We review equity method investments for impairment whenever events or changes in circumstances indicate that an other than temporary decline in value has occurred.
Related Party Transactions
Management Reimbursements
In our role as manager of Carbon California and Carbon Appalachia, we receive management reimbursements. We received approximately $753,000 and $50,000 for the three months ended March 31, 2018, and for the one month ended January 31, 2018, from Carbon Appalachia and Carbon California, respectively. These reimbursements are included in general and administrative – related party reimbursement on our unaudited consolidated statements of operations. Effective February 1, 2018, the management reimbursements received from Carbon California are eliminated at consolidation. This elimination includes $100,000 for the period February 1, 2018, through March 31, 2018.
In addition to the management reimbursements, approximately $299,000 and $14,000 in general and administrative expenses were reimbursed for the three months ended March 31, 2018, and for the one month ended January 31, 2018, by Carbon Appalachia and Carbon California, respectively. The elimination of Carbon California in consolidation includes approximately $28,000 for the period February 1, 2018, through March 31, 2018.
Operating Reimbursements
In our role as operator of Carbon California and Carbon Appalachia, we receive reimbursements of operating expenses. These expenses are recorded directly to receivable – related party on our unaudited consolidated balance sheets and are therefore not included in our operating expenses on our unaudited consolidated statements of operations.
| 8 |
Use of Estimates
The preparation of financial statements in conformity with GAAP requires management to makes estimates and assumptions that affect the amounts reported in the financial statements and accompanying notes. There have been no changes in our critical accounting estimates from those that were disclosed in the 2017 Annual Report on Form 10-K. Actual results could differ from these estimates.
Earnings (Loss) Per Common Share
Basic earnings per common share is computed by dividing the net income (loss) attributable to common stockholders for the period by the weighted average number of common shares outstanding during the period. The shares of restricted common stock granted to our officers, directors and employees are included in the computation of basic net income per share only after the shares become fully vested. Diluted earnings per common share includes both the vested and unvested shares of restricted stock and the potential dilution that could occur upon exercise of warrants to acquire common stock computed using the treasury stock method, which assumes that the increase in the number of shares is reduced by the number of shares which could have been repurchased by us with the proceeds from the exercise of warrants (which were assumed to have been made at the average market price of the common shares during the reporting period).
The following table sets forth the calculation of basic and diluted income per share:
| Three months ended March 31, | ||||||||
| (in thousands except per share amounts) | 2018 | 2017 | ||||||
| Net income | $ | 3,569 | $ | 3,292 | ||||
| Less: warrant derivative gain | (225 | ) | (830 | ) | ||||
| Diluted net income | 3,344 | 2,462 | ||||||
| Basic weighted-average common shares outstanding during the period | 6,996 | 5,487 | ||||||
| Add dilutive effects of warrants and non-vested shares of restricted stock | 230 | 738 | ||||||
| Diluted weighted-average common shares outstanding during the period | 7,226 | 6,225 | ||||||
| Basic net income per common share | $ | 0.51 | $ | 0.60 | ||||
| Diluted net income per common share | $ | 0.46 | $ | 0.40 | ||||
| 9 |
Recently Adopted Accounting Pronouncement
In May 2014, the Financial Accounting Standards Board ("FASB") issued Accounting Standard Update ("ASU") 2014-09, Revenue from Contracts with Customers (Topic 606) (“ASU 2014-09”), which establishes a comprehensive new revenue recognition standard designed to depict the transfer of goods or services to a customer in an amount that reflects the consideration the entity expects to receive in exchange for those goods or services. In March 2016, the FASB released certain implementation guidance through ASU 2016-08 (collectively with ASU 2014-09, the "Revenue ASUs") to clarify principal versus agent considerations. The Revenue ASUs allow for the use of either the full or modified retrospective transition method, and the standard will be effective for annual reporting periods beginning after December 15, 2017 including interim periods within that period, with early adoption permitted for annual reporting periods beginning after December 15, 2016. We adopted the guidance using the modified retrospective method with the effective date of January 1, 2018. We did not record a cumulative-effect adjustment to the opening balance of retained earnings as no adjustment was necessary. The adoption of the Revenue ASUs did not impact net income or cash flows. See note 10 for the new disclosures required by the Revenue ASUs.
Recently Issued Accounting Pronouncements
In February 2016, the FASB issued ASU No. 2016-02, Leases (“ASU 2016-02”). The objective of this ASU is to increase transparency and comparability among organizations by recognizing lease assets and liabilities on the balance sheet and disclosing key information about leasing arrangements. ASU 2016-02 is effective for fiscal years, and interim periods within those fiscal years, beginning after December 15, 2018 and should be applied using a modified retrospective approach. Early adoption is permitted. The Company is currently evaluating the impact on its financial statements of adopting ASU 2016-02.
In March 2018, the FASB issued ASU No. 2018-05, Amendments to SEC Paragraphs Pursuant to SEC Staff Accounting Bulletin No. 118 (“ASU 2018-05”). The objective of this ASU is to codify the guidance provided by Staff Accounting Bulletin No. 118 regarding the accounting for the income tax effects of the Tax Cuts and Jobs Act (the “TCJA”) passed by Congress in December 2017 if such accounting is not complete by the time a company issues its financial statements that include the reporting period in which the TCJA was enacted. ASU 2018-05 was effective upon addition to the FASB Codification in March 2018.
Note 3 – Acquisitions and Divestitures
Acquisition of Majority Control of Carbon California
Carbon California was formed in 2016 by us and entities managed by Yorktown and Prudential to acquire producing assets in the Ventura Basin of California.
In connection with the entry into the limited liability company agreement of Carbon California, we received Class B Units and issued to Yorktown a warrant (“the California Warrant”). The exercise price for the California Warrant was payable exclusively with Class A Units of Carbon California held by Yorktown and the number of shares of our common stock for which the California Warrant was exercisable was determined, as of the time of exercise, by dividing (a) the aggregate unreturned capital of Yorktown’s Class A Units of Carbon California by (b) the exercise price. The California Warrant had a term of seven years and included certain standard registration rights with respect to the shares of our common stock issuable upon exercise of the California Warrant.
The issuance of the Class B Units and the California Warrant were in contemplation of each other, and under non-monetary related party guidance, we accounted for the California Warrant, at issuance, based on the fair value of the California Warrant as of the date of grant (February 15, 2017) and recorded a long-term warrant liability with an associated offset to Additional Paid in Capital (“APIC”). Future changes to the fair value of the California Warrant are recognized in earnings. We accounted for the fair value of the Class B Units at their estimated fair value at the date of grant, which became our investment in Carbon California with an offsetting entry to APIC. Additionally, we accounted for our 17.81% profits interest in Carbon California as an equity method investment until January 31, 2018.
| 10 |
On February 1, 2018, Yorktown exercised the California Warrant resulting in the issuance of 1,527,778 shares of our common stock in exchange for Yorktown’s Class A Units of Carbon California representing approximately 46.96% of the outstanding Class A Units of Carbon California (a profits interest of approximately 38.59%). After giving effect to the exercise on February 1, 2018, we owned 56.4% of the voting and profits interests of Carbon California.
The exercise of the California Warrant and the acquisition of the additional ownership interest is accounted for as a step acquisition in which we obtained control in accordance with ASC 805, Business Combinations (“ASC 805”) (referred to herein as the “Carbon California Acquisition”). We recognized 100% of the identifiable assets acquired, liabilities assumed and the non-controlling interest at their respective fair value as of the date of the acquisition. We exchanged 1,527,778 common shares at a fair value of approximately $8.3 million ($5.45 per share), for 11,000 Class A Units of Carbon California, representing a 38.59% ownership interest in Carbon California. We followed the fair value method to allocate the consideration transferred to the identifiable net assets acquired and non-controlling interest (“NCI”) on a preliminary basis as follows:
| Amount (in thousands) |
||||
| Fair value of Carbon common shares transferred as consideration | $ | 8,326 | ||
| Fair value of NCI | 16,466 | |||
| Fair value of previously held interest | 7,244 | |||
| Fair value of business acquired | $ | 32,036 | ||
| Assets acquired and liabilities assumed | ||||
|
Amount (in thousands) |
||||
| Cash | $ | 275 | ||
| Accounts receivable: | ||||
| Joint interest billings and other | 690 | |||
| Receivable - related party | 1,610 | |||
| Prepaid expense, deposits, and other current assets | 1,723 | |||
| Oil and gas properties: | ||||
| Proved | 56,477 | |||
| Unproved | 1,495 | |||
| Other property and equipment, net | 877 | |||
| Other long-term assets | 475 | |||
| Accounts payable and accrued liabilities | (6,054 | ) | ||
| Commodity derivative liability – short-term | (916 | ) | ||
| Commodity derivative liability – long-term | (1,729 | ) | ||
| Asset retirement obligations – short-term | (384 | ) | ||
| Asset retirement obligations – long-term | (2,537 | ) | ||
| Notes, related party, net | (8,874 | ) | ||
| Revolver, related party | (11,000 | ) | ||
| Notes payable | (92 | ) | ||
| Total net assets acquired | $ | 32,036 | ||
The preliminary fair value of the assets acquired and liabilities assumed were determined using various valuation techniques, including an income approach. The fair value measurements were primarily based on significant inputs that are not directly observable in the market and are considered Level 3 under the fair value measurements and disclosure framework.
On the date of the acquisition, we derecognized our equity investment in Carbon California and recognized a gain of approximately $5.4 million based on the fair value of our previously held interest compared to its carrying value.
For assets and liabilities accounted for as business combinations, including the Carbon California Acquisition, to determine the fair value of the assets acquired, the Company primarily used the income approach and made market assumptions as to projections of estimated quantities of oil and natural gas reserves, future production rates, future commodity prices including price differentials as of the date of closing, future operating and development costs, a market participant weighted average cost of capital, and the condition of vehicles and equipment. The determination of the fair value of the accounts payable and accrued liabilities assumed required significant judgement, including estimates relating to production assets.
| 11 |
Consolidation of Carbon California Unaudited Pro Forma Results of Operations
Below are unaudited consolidated results of operations for the quarters ended March 31, 2018 and 2017 as though the Carbon California Acquisition had been completed as of January 1, 2017. The Carbon California Acquisition closed February 1, 2018, and accordingly, the Company’s unaudited consolidated statements of operations for the quarter ended March 31, 2018, includes the results of operations for the period February 1, 2018, through March 31, 2018.
| Unaudited Pro Forma Consolidated Results | ||||||||
| For Three Months Ended March 31, | ||||||||
| (in thousands, except per share amounts) | 2018 | 2017 | ||||||
| Revenue | $ | 6,672 | $ | 8,232 | ||||
| Net income before non-controlling interests | 3,543 | 444 | ||||||
| Net income attributable to non-controlling interests | 1,115 | 44 | ||||||
| Net income attributable to controlling interests | $ | 2,428 | $ | 400 | ||||
| Net income per share (basic) | $ | 0.35 | $ | 0.07 | ||||
| Net income (loss) per share (diluted) | $ | 0.30 | $ | (0.07 | ) | |||
Note 4 – Property and Equipment
Net property and equipment as of March 31, 2018 and December 31, 2017, consists of the following:
| (in thousands) | March 31, 2018 | December 31, 2017 | ||||||
| Oil and gas properties: | ||||||||
| Proved oil and gas properties | $ | 173,242 | $ | 114,893 | ||||
| Unproved properties not subject to depletion | 3,505 | 1,947 | ||||||
| Accumulated depreciation, depletion, amortization and impairment | (83,286 | ) | (80,715 | ) | ||||
| Net oil and gas properties | 93,461 | 36,125 | ||||||
| Furniture and fixtures, computer hardware and software, and other equipment | 2,955 | 1,758 | ||||||
| Accumulated depreciation and amortization | (1,324 | ) | (1,021 | ) | ||||
| Net other property and equipment | 1,631 | 737 | ||||||
| Total net property and equipment | $ | 95,092 | $ | 36,862 | ||||
| 12 |
We had approximately $3.5 million and $1.9 million, at March 31, 2018 and December 31, 2017, respectively, of unproved oil and gas properties not subject to depletion. At March 31, 2018 and December 31, 2017, our unproved properties consist principally of leasehold acquisition costs in the following areas:
| (in thousands) | March 31, 2018 | December 31, 2017 | ||||||
| Ventura Basin | $ | 1,495 | $ | - | ||||
| Illinois Basin: | ||||||||
| Indiana | 430 | 432 | ||||||
| Illinois | 151 | 136 | ||||||
| Appalachian Basin: | ||||||||
| Kentucky | 918 | 915 | ||||||
| Ohio | 65 | 66 | ||||||
| West Virginia | 446 | 398 | ||||||
| Total unproved properties not subject to depletion | $ | 3,505 | $ | 1,947 | ||||
During the three months ended March 31, 2018 and 2017, there were no expiring leasehold costs that were reclassified into proved property. The excluded properties are assessed for impairment at least annually. Subject to industry conditions, evaluations of most of these properties and the inclusion of their costs in amortized capital costs is expected to be completed within five years.
We capitalized overhead applicable to acquisition, development and exploration activities of approximately $71,000 and $75,000 for the three months ended March 31, 2018 and 2017, respectively.
Depletion expense related to oil and gas properties for the three months ended March 31, 2018 and 2017, was approximately $1.3 million and $533,000, or $0.76 and $0.41 per Mcfe, respectively. Depreciation expense related to furniture and fixtures, computer hardware and software, and other equipment for the three months ended March 31, 2018 and 2017, was approximately $149,000 and $40,000, respectively.
Note 5 – Asset Retirement Obligation
Our asset retirement obligations (“ARO”) relate to future costs associated with the plugging and abandonment of oil and gas wells, removal of equipment and facilities from leased acreage and returning such land to its original condition. The fair value of a liability for an ARO is recorded in the period in which it is incurred or acquired, and the cost of such liability is recorded as an increase in the carrying amount of the related long-lived asset by the same amount. The liability is accreted each period and the capitalized cost is depleted on a units-of-production basis as part of the full cost pool. Revisions to estimated AROs result in adjustments to the related capitalized asset and corresponding liability.
The estimated ARO liability is based on estimated economic lives, estimates as to the cost to abandon the wells in the future, and federal and state regulatory requirements. The liability is discounted using a credit-adjusted risk-free rate estimated at the time the liability is incurred or acquired or increased as a result of a reassessment of expected cash flows and assumptions inherent in the estimation of the liability. Upward revisions to the liability could occur due to changes in estimated abandonment costs or well economic lives, or if federal or state regulators enact new requirements regarding the abandonment of wells. AROs are valued utilizing Level 3 fair value measurement inputs (see note 12).
| 13 |
The following table is a reconciliation of the ARO:
| Three Months Ended March 31, | ||||||||
| (in thousands) | 2018 | 2017 | ||||||
| Balance at beginning of period | $ | 7,737 | $ | 5,120 | ||||
| Accretion expense | 141 | 78 | ||||||
| Additions from Carbon California Company, LLC | 2,921 | - | ||||||
| Additions during period | - | 3 | ||||||
| 10,799 | 5,201 | |||||||
| Less: ARO recognized as a current liability | (767 | ) | (124 | ) | ||||
| Balance at end of period | $ | 10,032 | $ | 5,077 | ||||
Note 6 – Investments in Affiliates
Carbon California
Carbon California was formed in 2016 by us and entities managed by Yorktown and Prudential to acquire producing assets in the Ventura Basin in California. On February 15, 2017, we, Yorktown and Prudential entered into a limited liability company agreement (the “Carbon California LLC Agreement”) of Carbon California, a Delaware limited liability company.
Prior to February 1, 2018, we held 17.81% of the voting and profits interests, Yorktown held 38.59% of the voting and profits interests and Prudential held 43.59% of the voting and profits interests in Carbon California. On February 1, 2018, Yorktown exercised the California Warrant, pursuant to which Yorktown obtained additional shares of common stock in us in exchange for the transfer and assignment by Yorktown of all its rights in Carbon California. Following the exercise of the California Warrant by Yorktown, we owned 56.4% of the voting and profits interests, and Prudential held the remainder of the interests, in Carbon California. We consolidate Carbon California for financial reporting purposes.
On February 15, 2017, Carbon California (i) issued and sold Class A Units to Yorktown and Prudential for an aggregate cash consideration of $22.0 million, (ii) entered into a Note Purchase Agreement (the “Note Purchase Agreement”) with Prudential Legacy Insurance Company of New Jersey and Prudential Insurance Company of America for the issuance and sale of up to $25.0 million of Senior Secured Revolving Notes (the “Senior Revolving Notes”) due February 15, 2022 and (iii) entered into a Securities Purchase Agreement (the “Securities Purchase Agreement”) with Prudential for the issuance and sale of $10.0 million of Senior Subordinated Notes (the “Subordinated Notes”) due February 15, 2024. We are not a guarantor of the Senior Revolving Notes or the Subordinate Notes which are held by Carbon California.
The closing of the Note Purchase Agreement and the Securities Purchase Agreement on February 15, 2017, resulted in the sale and issuance by Carbon California of (i) Senior Revolving Notes in the principal amount of $10.0 million and (ii) Subordinated Notes in the original principal amount of $10.0 million. The maximum principal amount available under the Senior Revolving Notes is based upon the borrowing base attributable to Carbon California’s proved oil and gas reserves which is to be determined at least semi-annually. As of March 31, 2018, the borrowing base was $15.0 million, of which $13.0 million was outstanding. On May 1, 2018, the borrowing base increased to $41.0 million (see note 16).
Net proceeds from the offering transaction were used by Carbon California to complete the acquisitions of oil and gas assets in the Ventura Basin of California, which acquisitions also closed on February 15, 2017. The remainder of the net proceeds were used to fund field development projects, to fund a future complementary acquisition and for general working capital purposes of Carbon California.
| 14 |
For the period February 15, 2017 (inception) through January 31, 2018, based on our 17.8% interest in Carbon California, our ability to appoint a member to the board of directors and our role of manager of Carbon California, we accounted for our investment in Carbon California under the equity method of accounting as we believed we exerted significant influence. We used the Hypothetical Liquidation at Book Value (“HLBV”) to determine our share of profits or losses in Carbon California and adjusted the carrying value of our investment accordingly. The HLBV is a balance-sheet approach that calculates the amount each member of Carbon California would have received if Carbon California were liquidated at book value at the end of each measurement period. The change in the allocated amount to each member during the period represents the income or loss allocated to that member. In the event of liquidation of Carbon California, to the extent that Carbon California has net income, available proceeds are first distributed to members holding Class A and Class B units and any remaining proceeds are then distributed to members holding Class A units. For the period February 15, 2017 (inception) through January 31, 2018, Carbon California incurred a net loss of which our share (as a holder of Class B Units for that period) was zero.
In connection with our entry into the Carbon California LLC Agreement, we received the aforementioned Class B Units and issued to Yorktown the California Warrant. The exercise price for the California Warrant was payable exclusively with Class A Units of Carbon California held by Yorktown and the number of shares of our common stock for which the California Warrant was exercisable was determined, as of the time of exercise, by dividing (a) the aggregate unreturned capital of Yorktown’s Class A Units of Carbon California by (b) the exercise price. The California Warrant had a term of seven years and included certain standard registration rights with respect to the shares of our common stock issuable upon exercise of the California Warrant. On February 1, 2018, Yorktown exercised the California Warrant. As a result of the warrant exercise, Carbon holds 11,000 Class A Units of Carbon California and all of the Class B units, resulting in an aggregate Sharing Percentage of 56.4%. Effective February 1, 2018, the Company consolidates Carbon California in its unaudited condensed consolidated financial statements.
Carbon Appalachia
Carbon Appalachia was formed in 2016 by us, Yorktown and entities managed by Old Ironsides Energy LLC (“Old Ironsides”) to acquire producing assets in the Appalachian Basin in Kentucky, Tennessee, Virginia and West Virginia.
Outlined below is a summary of i) our contributions, ii) our resulting percentage of Class A unit ownership and iii) our overall resulting Sharing Percentage of Carbon Appalachia after giving effect to the Class C Unit ownership. Holders of units within each class of units participate in profit or losses and distributions according to their proportionate share of each class of units (“Sharing Percentage”). Each contribution and its use are described in detail following the table.
| Timing | Capital Contribution | Resulting Class A Units (%) | Resulting Sharing % | |||||||
| April 2017 | $0.24 million | 2.00 | % | 2.98 | % | |||||
| August 2017 | $3.71 million | 15.20 | % | 16.04 | % | |||||
| September 2017 | $2.92 million | 18.55 | % | 19.37 | % | |||||
| November 2017 | Warrant exercise | 26.50 | % | 27.24 | % | |||||
On April 3, 2017, we, Yorktown and Old Ironsides, entered in to a limited liability company agreement (the “Carbon Appalachia LLC Agreement”), with an initial equity commitment of $100.0 million, of which $37.0 million has been contributed as of March 31, 2018.
Pursuant to the Carbon Appalachia LLC Agreement, we acquired a 2.0% interest in Carbon Appalachia for $240,000 of Class A Units associated with our initial equity commitment of $2.0 million. We also have the ability to earn up to an additional 14.7% of Carbon Appalachia distributions (represented by Class B Units) after certain return thresholds to the holders of Class A Units are met. The Class B Units were acquired for no cash consideration.
| 15 |
In addition, we acquired a 1.0% interest represented by Class C Units which were obtained in connection with the contribution to Carbon Appalachia of a portion of our working interest in undeveloped properties in Tennessee. If Carbon Appalachia agrees to drill horizontal Chattanooga Shale wells on these properties, it will pay 100% of the cost of drilling and completion of the first 20 wells to earn a 75% working interest in such properties. We, through our subsidiary, Nytis LLC, will retain a 25% working interest in the properties. There was no activity associated with these properties in 2017 nor in the first quarter of 2018.
In 2017, Carbon Appalachia Enterprises, LLC, formerly known as Carbon Tennessee Company, LLC (“CAE”), a subsidiary of Carbon Appalachia, entered into a 4-year $100.0 million (with $1.5 million sublimit for letters of credit) senior secured asset-based revolving credit facility with LegacyTexas Bank with an initial borrowing base of $10.0 million (the “CAE Credit Facility”).
The CAE Credit Facility borrowing base was adjusted for acquisitions completed in 2017. Most recently, on April 30, 2018, CAE Credit Facility was amended, which increased the borrowing base to $70.0 million with redeterminations as of April 1 and October 1 each year. As of March 31, 2018, there was approximately $38.0 million outstanding under the CAE Credit Facility.
The CAE Credit Facility is guaranteed by each of CAE’s existing and future direct or indirect subsidiaries (subject to certain exceptions). CAE’s obligations and those of CAE’s subsidiary guarantors under the CAE Credit Facility are secured by essentially all of CAE’s tangible and intangible personal and real property (subject to certain exclusions).
Interest is payable quarterly and accrues on borrowings under the CAE Credit Facility at a rate per annum equal to either (i) the base rate plus an applicable margin between 0.00% and 1.00% or (ii) the Adjusted LIBOR rate plus an applicable margin between 3.00% and 4.00% at our option. The actual margin percentage is dependent on the CAE Credit Facility utilization percentage. CAE is obligated to pay certain fees and expenses in connection with the CAE Credit Facility, including a commitment fee for any unused amounts of 0.50%.
The CAE Credit Facility contains affirmative and negative covenants that, among other things, limit CAE’s ability to (i) incur additional debt; (ii) incur additional liens; (iii) sell, transfer or dispose of assets; (iv) merge or consolidate, wind-up, dissolve or liquidate; (v) make dividends and distributions on, or repurchases of, equity; (vi) make certain investments; (vii) enter into certain transactions with our affiliates; (viii) enter into sales-leaseback transactions; (ix) make optional or voluntary payments of debt; (x) change the nature of our business; (xi) change our fiscal year to make changes to the accounting treatment or reporting practices; (xii) amend constituent documents; and (xiii) enter into certain hedging transactions.
The affirmative and negative covenants are subject to various exceptions, including basket amounts and acceptable transaction levels. In addition, the CAE Credit Facility requires CAE’s compliance, on a consolidated basis, with (i) a maximum Debt/EBITDA ratio of 3.5 to 1.0 and (ii) a minimum current ratio of 1.0 to 1.0.
CAE may at any time repay the loans under the CAE Credit Facility, in whole or in part, without penalty. CAE must pay down borrowings under the CAE Credit Facility or provide mortgages of additional oil and natural gas properties to the extent that outstanding loans and letters of credit exceed the borrowing base.
In connection with our entry into the Carbon Appalachia LLC Agreement, and Carbon Appalachia engaging in certain transactions during 2017, we received the aforementioned Class B Units and issued to Yorktown awarrant to purchase approximately 408,000 shares of our common stock at an exercise price of $7.20 per share (the “Appalachia Warrant”). The Appalachia Warrant was payable exclusively with Class A Units of Carbon Appalachia held by Yorktown and the number of shares of our common stock for which the Appalachia Warrant was exercisable was determined, as of the time of exercise, by dividing (a) the aggregate unreturned capital of Yorktown’s Class A Units of Carbon Appalachia plus a required 10% internal rate of return by (b) the exercise price.
| 16 |
On November 1, 2017, Yorktown exercised the Appalachia Warrant, resulting in the issuance of approximately 432,000 shares of our common stock in exchange for Class A Units representing approximately 7.95% of then outstanding Class A Units of Carbon Appalachia. We accounted for the exercise through extinguishment of the warrant liability associated with the Appalachia Warrant of approximately $1.9 million and the receipt of Yorktown’s Class A Units as an increase to investment in affiliates in the amount of approximately $2.9 million. After giving effect to the exercise, we own 26.5% of Carbon Appalachia’s outstanding Class A Units along with 100% of its Class C Units.
The issuance of the Class B Units and the Appalachia Warrant were in contemplation of each other, and under non-monetary related party guidance, we accounted for the Appalachia Warrant, at issuance, based on the fair value of the Appalachia Warrant as of the date of grant (April 3, 2017) and recorded a warrant liability with an associated offset to APIC. Future changes to the fair value of the Appalachia Warrant are recognized in earnings. We accounted for the fair value of the Class B Units at their estimated fair value at the date of grant, which became our investment in Carbon Appalachia with an offsetting entry to APIC.
As of the grant date of the Appalachia Warrant, we estimated that the fair market value of the Appalachia Warrant was approximately $1.3 million, and the fair value of the Class B Units was approximately $924,000. The difference in the fair value of the Appalachia Warrant from the grant date though its exercise on November 1, 2017, was approximately $619,000 and was recognized in warrant derivative gain in our consolidated statements of operations for the year ended December 31, 2017.
Based on our 27.24% combined Class A and Class C interest (and our ability as of March 31, 2018 to earn up to an additional 14.7%) in Carbon Appalachia, our ability to appoint a member to the board of directors and our role of manager of Carbon Appalachia, we are accounting for our investment in Carbon Appalachia under the equity method of accounting as we believe we exert significant influence. We use the HLBV to determine our share of profits or losses in Carbon Appalachia and adjust the carrying value of our investment accordingly. Our investment in Carbon Appalachia is represented by our Class A and C interests, which we acquired by contributing approximately $6.9 million in cash and unevaluated property. In the event of liquidation of Carbon Appalachia, available proceeds are first distributed to members holding Class C Units then to holders of Class A Units until their contributed capital is recovered with an internal rate of return of 10%. Any additional distributions would then be shared between holders of Class A, Class B and Class C Units. For the three months ended March 31, 2018, Carbon Appalachia earned net income, of which our share is approximately $413,000. The ability of Carbon Appalachia to make distributions to its owners, including us, is dependent upon the terms of its credit facilities, which currently prohibit distributions unless agreed to by the lender.
As of March 31, 2018, Carbon Appalachia is in compliance with all CAE Credit Facility covenants.
The following table sets forth, selected historical unaudited financial data for Carbon Appalachia.
| (in thousands) | As of March 31, 2018 | |||
| Current assets | $ | 21,452 | ||
| Total oil and gas properties, net | $ | 83,404 | ||
| Current liabilities | $ | 17,086 | ||
| Non-current liabilities | $ | 58,730 | ||
| Total members’ equity | $ | 42,506 | ||
| (in thousands) | Three months ended March 31, 2018 | |||
| Revenues | $ | 25,743 | ||
| Operating expenses | 23,534 | |||
| Income from operations | 2,208 | |||
| Net income | 1,526 | |||
Investments in Affiliates
During the three months ended March 31, 2018 and 2017, we recorded total equity method income of approximately $437,000 and $7,000, respectively. Additionally, on February 1, 2018, as a result of the Carbon California Acquisition, we derecognized our equity investment in Carbon California and recognized a gain of approximately $5.4 million based on the fair value of our previously held interest compared to its carrying value.
| 17 |
Note 7 – Credit Facilities
Our Credit Facility
In 2016, we entered into a 4-year $100.0 million senior secured asset-based revolving credit facility with LegacyTexas Bank. LegacyTexas Bank is the initial lender and acts as administrative agent.
The credit facility has a maximum availability of $100.0 million (with a $500,000 sublimit for letters of credit), which availability is subject to the amount of the borrowing base. The initial borrowing base established under the credit facility was $17.0 million. The borrowing base is subject to semi-annual redeterminations in March and September. On March 30, 2018, the borrowing base was increased from $23.0 to $25.0 million, of which approximately $23.2 million was outstanding as of March 31, 2018. Our effective interest rate as of March 31, 2018 was 7.59%.
The credit facility is guaranteed by each of our existing and future subsidiaries (subject to certain exceptions). Our obligations and those of our subsidiary guarantors under the credit facility are secured by essentially all of our tangible and intangible personal and real property (subject to certain exclusions).
Interest is payable quarterly and accrues on borrowings under the credit facility at a rate per annum equal to either (i) the base rate plus an applicable margin between 0.50% and 1.50% or (ii) the Adjusted LIBOR rate plus an applicable margin between 3.50% and 4.50% at our option. The actual margin percentage is dependent on the credit facility utilization percentage. We are obligated to pay certain fees and expenses in connection with the credit facility, including a commitment fee for any unused amounts of 0.50%.
The credit facility contains affirmative and negative covenants that, among other things, limit our ability to (i) incur additional debt; (ii) incur additional liens; (iii) sell, transfer or dispose of assets; (iv) merge or consolidate, wind-up, dissolve or liquidate; (v) make dividends and distributions on, or repurchases of, equity; (vi) make certain investments; (vii) enter into certain transactions with our affiliates; (viii) enter into sales-leaseback transactions; (ix) make optional or voluntary payments of debt; (x) change the nature of our business; (xi) change our fiscal year to make changes to the accounting treatment or reporting practices; (xii) amend constituent documents; and (xiii) enter into certain hedging transactions.
The affirmative and negative covenants are subject to various exceptions, including basket amounts and acceptable transaction levels. In addition, the credit facility requires our compliance, on a consolidated basis, with (i) a maximum Debt/EBITDA ratio of 3.5 to 1.0 and (ii) a minimum current ratio of 1.0 to 1.0.
On March 27, 2018, the credit facility was amended to revise the calculation of the Leverage Ratio from a Debt/EBITDA ratio to a Net Debt/Adjusted EBITDA ratio, reset the testing period used in the determination of Adjusted EBITDA, eliminated the minimum current ratio and substituted alternative liquidity requirements, including maximum allowed current liabilities in relation to current assets, a minimum cash balance requirement of $750,000 and maximum aged trade payable requirements. As of March 31, 2018, we were in compliance with our financial covenants.
We may at any time repay the loans under the credit facility, in whole or in part, without penalty. We must pay down borrowings under the credit facility or provide mortgages of additional oil and natural gas properties to the extent that outstanding loan and letters of credit exceed the borrowing base.
As required under the terms of the credit facility, we entered into derivative contracts with fixed pricing for a certain percentage of our production. We are a party to an ISDA Master Agreement with BP Energy Company that established standard terms for the derivative contracts and an inter-creditor agreement with LegacyTexas Bank and BP Energy Company whereby any credit exposure related to the derivative contracts entered into by the Company and BP Energy Company is secured by the collateral and backed by the guarantees supporting the credit facility.
| 18 |
Carbon California – Credit Facilities
Effective as of February 1, 2018, our ownership in Carbon California increased to 56.4% due to the exercise of the California Warrant. As a result, we consolidate Carbon California for financial reporting purposes.
The table below details the notes payable outstanding for Carbon California as of March 31, 2018 (in thousands):
| Revolver, related party, due February 15, 2022 | $ | 13,000 | ||
| Notes, related party, due February 15, 2024 | $ | 10,000 | ||
| Total gross notes payable | 23,000 | |||
| Less: Deferred notes costs | (154 | ) | ||
| Less: Notes discount | (924 | ) | ||
| Total net notes payable | $ | 21,922 |
Carbon California- Revolver, Related Party
On February 15, 2017, Carbon California entered into a revolver agreement with Prudential Legacy Insurance Company of New Jersey and Prudential Insurance Company of America for the issuance and sale of up to $25.0 million due February 15, 2022 (the “Revolver”). Carbon California may elect to incur interest at either (i) 5.0% plus the London interbank offered rate (“LIBOR”) or (ii) 4.00% plus Prime Rate (which is defined as the interest rate published daily by JPMorgan Chase Bank, N.A.). As of March 31, 2018, the Revolver’s effective borrowing rate was 8.29%. In addition, the Revolver includes a commitment fee for any unused amounts at 0.50% as well as an annual administrative fee of $75,000, payable on February 15 each year.
The maximum principal amount available under the Revolver is based upon the borrowing base attributable to Carbon California’s proved oil and gas reserves, which is to be determined at least semi-annually. As of March 31, 2018, the Revolver has a borrowing base of $15.0 million, of which $13.0 million is outstanding. On May 1, 2018, the borrowing base increased to $41.0 million (see note 16).
The Revolver is secured by all the assets of Carbon California. The Revolver requires Carbon California, as of January 1 and July of each year, to hedge its anticipate proved developed products production at such time for year one, two and three at a rate of 75%, 65% and 50%, respectively. Carbon California may make principal payments in minimum installments of $500,000. Distributions to equity members are generally restricted.
Carbon California incurred fees directly associated with the issuance of the Revolver and amortizes these fees over the life of the Revolver. The current portion of these fees are included in prepaid expense and deposits and the long-term portion is included in other long-term assets for a combined value of $706,000. During the three months ended March 31, 2018 and 2017, Carbon California amortized fees of $29,000 and $14,000, respectively.
The Revolver agreement requires Carbon California to maintain certain financial and non-financial covenants which include the following ratios: total leverage ratio, senior leverage ratio, interest coverage ratio, current ratio, and other qualitative covenants as defined in the Revolver agreement. As of March 31, 2018, Carbon California was in breach of its covenants; however, Carbon California obtained a waiver for the March 31, 2018 measurement period.
Carbon California Notes
On February 15, 2017, Carbon California entered into an agreement with Prudential Capital Energy Partners, L.P. for the issuance and sale of $10.0 million of unsecured notes (the “Carbon California Notes”) due February 15, 2024, bearing interest of 12% per annum.
| 19 |
Prudential received an additional 1,425 Class A units, representing 5% of total sharing percentage, for the issuance of the Carbon California Notes. Carbon California valued this unit issuance based on the relative fair value by valuing the units at $1,000 per unit and aggregating the amount with the outstanding Carbon California Notes of $10.0 million. The Company then allocated the non-cash value of the units of approximately $1.25 million, which was recorded as a discount to the Carbon California Notes. As of March 31, 2018, Carbon California had an outstanding discount of $923,000, which is presented net of the Carbon California Notes within Credit facility-related party on the unaudited consolidated balance sheets.
The Carbon California Notes require Carbon California, as of January 1 and July 1 of each year, to hedge its anticipated production at such time for year one, two and three at a rate of 67.5%, 58.5% and 45%, respectively.
Prepayment of the Carbon California Notes is currently not available. After February 15, 2019, prepayment is allowed at 100%, subject to a 3.0% fee of outstanding principal. Prepayment is not subject to such fee after February 17, 2020. Distributions to equity members are generally restricted.
The Carbon California Notes agreement requires Carbon California to maintain certain financial and non-financial covenants, which include the following ratios: total leverage ratio, senior leverage ratio, interest coverage ratio, asset coverage ratio, current ratio, and other qualitative covenants as defined in the Revolver agreement. As of March 31, 2018, Carbon California was in breach of financial covenants; however, Carbon California obtained a waiver for March 31, 2018 measurement period.
On May 1, 2018, in connection with the Seneca acquisition, the Revolver and Carbon California Notes Agreement were amended. See note 16.
| 20 |
Note 8 – Income Taxes
We recognize deferred income tax assets and liabilities for the estimated future tax consequences attributable to temporary differences between the financial statement carrying amounts of existing assets and liabilities and their respective tax bases. We have net operating loss carryforwards available in certain jurisdictions to reduce future taxable income. Future tax benefits for net operating loss carryforwards are recognized to the extent that realization of these benefits is considered more likely than not. To the extent that available evidence raises doubt about the realization of a deferred income tax asset, a valuation allowance is established.
At March 31, 2018, we have established a full valuation allowance against the balance of net deferred tax assets.
Note 9 – Stockholders’ Equity
Authorized and Issued Capital Stock
Effective March 15, 2017, and pursuant to a reverse stock split approved by the stockholders and Board of Directors, each 20 shares of issued and outstanding common stock became one share of common stock and no fractional shares were issued. References to the number of shares and price per share give retroactive effect to the reverse stock split for all periods presented.
As of March 31, 2018, we had 10.0 million shares of common stock authorized with a par value of $0.01 per share, of which approximately 7.6 million were issued and outstanding, and 1.0 million shares of preferred stock authorized with a par value of $0.01 per share. On April 6, 2018, the Company entered into a preferred stock purchase agreement with Yorktown for a private placement of 50,000 shares of the Company’s Series B Convertible Preferred Stock for $5.0 million. During the three months ended March 31, 2018, the increase in our issued and outstanding common stock is primarily due to a) Yorktown’s exercise of the California Warrant (see note 3), resulting in the issuance of approximately 1.5 million shares of our common stock in exchange for Class A Units in Carbon California representing approximately 46.96% of the then outstanding Class A Units, in addition to b) restricted stock that vested during the quarter.
Carbon Stock Incentive Plans
We have two stock plans, the Carbon 2011 Stock Incentive Plan and the Carbon 2015 Stock Incentive Plan (collectively the “Carbon Plans”). The Carbon Plans were approved by our shareholders and in the aggregate provide for the issuance of approximately 1.1 million shares of common stock to our officers, directors, employees or consultants eligible to receive the awards under the Carbon Plans.
The Carbon Plans provide for the granting of incentive stock options, non-qualified stock options, restricted stock awards, performance awards and phantom stock awards, or a combination of the foregoing, as to employees, officers, directors or consultants, provided that only employees may be granted incentive stock options and directors may only be granted restricted stock awards and phantom stock awards.
Restricted Stock
As of March 31, 2018, approximately 548,000 shares of restricted stock have been granted under the terms of the Carbon Plans. Restricted stock awards for employees vest ratably over a three-year service period or cliff vest at the end of a three-year service period. For non-employee directors, the awards vest upon the earlier of a change in control of us or the date their membership on the Board of Directors is terminated other than for cause. We recognize compensation expense for these restricted stock grants based on the grant date fair value of the shares, amortized ratably over three years for employee awards (based on the required service period for vesting) and seven years for non-employee director awards (based on a market survey of the average tenure of directors among U.S. public companies). For restricted stock granted between 2014 and 2017, we recognized compensation expense based on the grant date fair value of the shares, utilizing an enterprise value approach, using valuation metrics primarily based on multiples of cash flow from operations, production and reserves. For restricted stock and performance units granted in 2013, we utilized the closing price of our stock on the date of grant to recognize compensation expense. During the three months ended March 31, 2018, 38,637 restricted stock units vested.
| 21 |
Compensation costs recognized for these restricted stock grants were approximately $158,000 and $188,000 for the three months ended March 31, 2018 and 2017, respectively. As of March 31, 2018, there was approximately $957,000 of unrecognized compensation costs related to these restricted stock grants which we expect to be recognized over the next six years.
Restricted Performance Units
As of March 31, 2018, approximately 461,000 shares of performance units have been granted under the terms of the Carbon Plans. Performance units represent a contractual right to receive one share of our common stock subject to the terms and conditions of the agreements, including the achievement of certain performance measures relative to a defined peer group or the growth of certain performance measures over a defined period of time as well as, in some cases, continued service requirements.
We account for the performance units granted during 2014 through 2017 at their fair value determined at the date of grant, which were $11.80, $8.00, $5.40 and $7.20 per share, respectively. The final measurement of compensation cost will be based on the number of performance units that ultimately vest. At March 31, 2018, we estimated that none of the performance units granted in 2016 and 2017 would vest, and, accordingly, no compensation cost has been recorded for these performance units. During 2016, we estimated that it was probable that the performance units granted in 2014 and 2015 would vest and therefore compensation costs of approximately $135,000 and $132,000 related to these performance units were recognized for the three months ended March 31, 2018 and 2017, respectively. As of March 31, 2018, compensation costs related to the performance units granted in 2014 and 2015 have been fully recognized. As of March 31, 2018, if change in control and other performance provisions pursuant to the terms and conditions of these award agreements are met in full, the estimated unrecognized compensation cost related to the performance units granted in 2012, 2016 and 2017 would be approximately $1.9 million.
Note 10 – Revenue Recognition
Revenue from Contracts with Customers
We recognize revenue when it satisfies a performance obligation by transferring control over a product to a customer. Revenue is measured based on the consideration we expect to receive in exchange for those products. Revenues from contracts with customers are recorded on the unaudited consolidated statements of operations based on the type of product being sold.
Performance Obligations and Significant Judgments
We sell oil and natural gas products in the United States through a single reportable segment. We primarily sell products within two regions of the United States: Appalachia and Illinois Basins and the Ventura Basin. We enter into contracts that generally include one type of distinct product in variable quantities and priced based on a specific index related to the type of product. Most of our contract pricing provisions are tied to a market index, with certain adjustments based on, among other factors, whether a well delivers to a gathering or transmission line, quality of the oil or natural gas, and prevailing supply and demand conditions.
The oil and natural gas is typically sold in an unprocessed state to processors and other third parties for processing and sale to customers. We recognize revenue at a point in time when control of the oil or natural gas passes to the customer. For oil sales, control is typically transferred to the customer upon receipt at the wellhead or a contractually agreed upon delivery point. Under our natural gas contracts with processors, control transfers upon delivery at the wellhead or the inlet of the processing entity’s system. For our other natural gas contracts, control transfers upon delivery to the inlet or to a contractually agreed upon delivery point. In the cases where we sell to a processor, we have determined that we are the principal in the arrangement and the processors are our customers. We recognize the revenue in these contracts based on the net proceeds received from the processor.
| 22 |
Transfer of control drives the presentation of transportation and gathering costs within the accompanying unaudited consolidated statements of operations. Transportation and gathering costs incurred prior to control transfer are recorded within the transportation and gathering expense line item on the accompanying unaudited consolidated statements of operations, while transportation and gathering costs incurred subsequent to control transfer are recorded as a reduction to the related revenue.
A portion of our product sales are short-term in nature. For those contracts, we use the practical expedient in ASC 606-10-50-14 exempting us from disclosure of the transaction price allocated to remaining performance obligations if the performance obligation is part of a contract that has an original expected duration of one year or less.
For our product sales that have a contract term greater than one year, we have utilized the practical expedient in ASC 606-10-50-14(a) which states we are not required to disclose the transaction price allocated to remaining performance obligations if the variable consideration is allocated entirely to an unsatisfied performance obligation. Under these sales contracts, each unit of product represents a separate performance obligation; therefore, future volumes are unsatisfied and disclosure of the transaction price allocated to remaining performance obligations is not required. We have no unsatisfied performance obligations at the end of each reporting period.
We do not believe that significant judgments are required with respect to the determination of the transaction price, including any variable consideration identified. There is a low level of uncertainty due to the precision of measurement and use of index-based pricing with predictable differentials. Additionally, any variable consideration identified is not constrained.
Disaggregation of Revenues
In the following table, revenue for the three months ended March 31, 2018, is disaggregated by primary region within the United States and major product line. As noted above, we operate as one reportable segment.
| (in thousands) | ||||||||||||
| Type | Appalachia and Illinois Basin | Ventura Basin | Total | |||||||||
| Natural gas sales | $ | 3,805 | $ | 134 | $ | 3,939 | ||||||
| Natural gas liquids sales | - | 163 | 163 | |||||||||
| Oil sales | 247 | 2,736 | 2,983 | |||||||||
| Total revenue | $ | 4,052 | $ | 3,033 | $ | 7,085 | ||||||
Contract Balances
Under our product sales contracts, we invoice customers once our performance obligations have been satisfied, at which point payment is unconditional. Accordingly, our product sales contracts do not typically give rise to contract assets or liabilities under ASC 606.
Prior Period Performance Obligations
We record revenue in the month production is delivered to the purchaser, but settlement statements may not be received until 30 to 90 days after the month of production. As such, we estimate the production delivered and the related pricing. Any differences between our initial estimates and actuals are recorded in the month payment is received from the customer. These differences have not historically been material. For the three months ended March 31, 2018, revenue recognized in the reporting period related to prior period performance obligations is immaterial.
The estimated revenue is recorded within Accounts receivable - Revenue on the unaudited consolidated balance sheets.
| 23 |
Note 11 – Accounts Payable and Accrued Liabilities
Accounts payable and accrued liabilities consist of the following:
| March 31, 2018 | December 31, 2017 | |||||||
| Accounts payable | $ | 5,374 | $ | 3,274 | ||||
| Oil and gas revenue suspense | 2,032 | 1,776 | ||||||
| Gathering and transportation payables | 807 | 497 | ||||||
| Production taxes payable | 654 | 214 | ||||||
| Drilling advances received from joint venture partner | 1,359 | 245 | ||||||
| Accrued lease operating expenses | 1,650 | 684 | ||||||
| Accrued ad valorem taxes-current | 1,099 | 1,054 | ||||||
| Accrued general and administrative expenses | 2,794 | 2,473 | ||||||
| Accrued asset retirement obligation-current | 767 | 380 | ||||||
| Accrued interest | 663 | 247 | ||||||
| Other liabilities | 1,367 | 374 | ||||||
| Total accounts payable and accrued liabilities | $ | 18,566 | $ | 11,218 | ||||
Note 12 – Fair Value Measurements
Authoritative guidance defines fair value as the price that would be received to sell an asset or paid to transfer a liability (an exit price) in an orderly transaction between market participants at the measurement date. The guidance establishes a hierarchy for inputs used in measuring fair value that maximizes the use of observable inputs and minimizes the use of unobservable inputs by requiring that the most observable inputs be used when available. Observable inputs are inputs that market participants would use in pricing the asset or liability developed based on market data obtained from sources independent of us. Unobservable inputs are inputs that reflect our assumptions of what market participants would use in pricing the asset or liability developed based on the best information available in the circumstances. The hierarchy is broken down into three levels based on the reliability of the inputs as follows:
| Level 1: | Quoted prices are available in active markets for identical assets or liabilities; |
| Level 2: | Quoted prices in active markets for similar assets or liabilities that are observable for the asset or liability; or |
| Level 3: | Unobservable pricing inputs that are generally less observable from objective sources, such as discounted cash flow models or valuations. |
Financial assets and liabilities are classified based on the lowest level of input that is significant to the fair value measurement. Our policy is to recognize transfers in and/or out of fair value hierarchy as of the end of the reporting period for which the event or change in circumstances caused the transfer. We have consistently applied the valuation techniques discussed below for all periods presented.
| 24 |
The following table presents our financial assets and liabilities that were accounted for at fair value on a recurring basis by level within the fair value hierarchy:
| (in thousands) | Fair Value Measurements Using | |||||||||||||||
| Level 1 | Level 2 | Level 3 | Total | |||||||||||||
| March 31, 2018 | ||||||||||||||||
| Liabilities | ||||||||||||||||
| Commodity derivatives | $ | - | $ | 2,679 | $ | - | $ | 2,679 | ||||||||
December 31, 2017 | ||||||||||||||||
| Asset: | ||||||||||||||||
| Commodity derivatives | $ | - | $ | 225 | $ | - | $ | 225 | ||||||||
| Liabilities | ||||||||||||||||
| Warrant derivative liability | $ | - | $ | - | $ | 2,017 | $ | 2,017 | ||||||||
Commodity Derivative
As of March 31, 2018, our commodity derivative financial instruments are comprised of natural gas and oil swaps. The fair values of these agreements are determined under an income valuation technique. The valuation model requires a variety of inputs, including contractual terms, published forward prices, volatilities for options and discount rates, as appropriate. Our estimates of fair value of derivatives include consideration of the counterparty’s credit worthiness, our credit worthiness and the time value of money. The consideration of these factors results in an estimated exit-price for each derivative asset or liability under a market place participant’s view. All the significant inputs are observable, either directly or indirectly; therefore, our derivative instruments are included within the Level 2 fair value hierarchy. The counterparty for all our outstanding commodity derivative financial instruments as of March 31, 2018, is BP Energy Company.
Warrant Derivative
A third-party valuation specialist was utilized to determine the fair value our California Warrant. The warrant is designated as Level 3. We review the valuations, including the related model inputs and assumptions, and analyze changes in fair value measurements between periods. We corroborate such inputs, calculations and fair value changes using various methodologies, and review unobservable inputs for reasonableness utilizing relevant information from other published sources.
We estimated the fair value of the California Warrant on February 15, 2017, the grant date of the warrant, to be approximately $5.8 million, using a call option pricing model with the following assumptions: a seven-year term, exercise price of $7.20, volatility rate of 41.8% and a risk-free rate of 2.3%. As we will receive Class A units in Carbon California in the event the holder exercises the California Warrant, we also considered the fair value of the Class A units in its valuation. We utilized the same measurement as of December 31, 2017 for January 31, 2018, using a Monte Carlo valuation model which utilized unobservable inputs including the percentage return on our shares at various timelines, the percentage return on the privately-held Carbon California Class A units at various timelines, an exercise price of $7.20, volatility rate of 45%, a risk-free rate of 2.1% and an estimated remaining term of 6.4 years. As of December 31, 2017, the fair value of the California Warrant was approximately $2.0 million. On February 1, 2018, Yorktown exercised a warrant it held to purchase shares of our common stock at an exercise price of $7.20 per share (the “California Warrant”), resulting in the issuance of 1,527,778 shares of our common stock. In exchange, we received Yorktown’s Class A Units of Carbon California representing approximately 46.96% of the outstanding Class A Units of Carbon California and a profits interest of approximately 38.59%.
| 25 |
The following table summarizes the changes in fair value of our financial instruments classified as Level 3 in the fair value hierarchy:
| (in thousands) | Total | |||
| Balance, December 31, 2017 | $ | 2,017 | ||
| Warrant derivative gain for the period January 1- January 31, 2018 | (225 | ) | ||
| CCC Warrant Exercise - liability extinguishment | (1,792 | ) | ||
| Balance, March 31, 2018 | $ | - | ||
Assets and Liabilities Measured and Recorded at Fair Value on a Non-Recurring Basis
The fair value of each of the following assets and liabilities measured and recorded at fair value on a non-recurring basis are based on unobservable pricing inputs and therefore, are included within the Level 3 fair value hierarchy.
We use the income valuation technique to estimate the fair value of asset retirement obligations using the amounts and timing of expected future dismantlement costs, credit-adjusted risk-free rates and time value of money. During the three months ended March 31, 2018 and 2017, we recorded approximately $5.6 million and $3,000, in additions to asset retirement obligations, respectively. Additions during the three months ended March 31, 2018, primarily related to the Carbon California Acquisition. See note 3 for additional information.
The exercise of the California Warrant and the acquisition of the additional ownership interest in Carbon California on February 1, 2018, is accounted for as a step acquisition in which we obtained control in accordance with ASC 805, Business Combinations (“ASC 805”). We consolidate the results of Carbon California into our unaudited condensed consolidated financial statements from the date of the Carbon California Acquisition forward. The Carbon California Acquisition was accounted for as a business combination, and the identifiable assets acquired, and liabilities assumed, were recorded at their estimated fair value at the date of acquisition. We have completed our preliminary valuation to determine the fair value of the identifiable assets acquired and liabilities assumed. The fair value of the assets acquired was determined using various valuation techniques, including an income approach. The fair value measurements were primarily based on significant inputs that are not directly observable in the market and are considered Level 3 under the fair value measurements and disclosure framework. See note 3 for additional information.
We assume, at times, certain firm transportation contracts as part of our acquisitions of oil and natural gas properties. The fair value of the firm transportation obligations was determined based upon the contractual obligations assumed by us and discounted based upon our effective borrowing rate. These contractual obligations are being amortized monthly as we pay these firm transportation obligations in the future.
| 26 |
Asset Retirement Obligation
The fair value of our asset retirement obligation liability is recorded in the period in which it is incurred or assumed by taking into account the cost of abandoning oil and gas wells ranging from $20,000 to $30,000, which is based on industry expectations for similar work; the estimated timing of reclamation ranging from one to 75 years based on estimates from reserve engineers; an inflation rate of 1.92%; and a credit adjusted risk-free rate of 7.24%, which takes into account our credit risk and the time value of money. Given the unobservable nature of the inputs, the initial measurement of the asset retirement obligation liability is deemed to use Level 3 inputs (see note 3). During the three months ended March 31, 2018, we recorded additions to asset retirement obligations of approximately $3.1 million, primarily due to the Carbon California Acquisition. Carbon California estimates the fair value of asset retirement obligations using the amounts and timing of expected future dismantlement costs, credit-adjusted risk-free rates and time value of money. Carbon California’s asset retirement obligation is calculated upon assumption by taking into account the cost of abandoning oil and gas wells based on industry expectations for similar work, the economic lives of its properties between 1-49 years; an inflation rate of 2.03%; and a credit adjusted risk-free rate of 8.09%,
Class B Units
We received Class B Units from Carbon California and Carbon Appalachia as part of the entry into the Carbon California LLC and Carbon Appalachia LLC agreements. We estimated the fair value of the Class B units, in each case, by utilizing the assistance of third-party valuation specialists. The fair values were based upon enterprise values derived from inputs including estimated future production rates, future commodity prices including price differentials as of the dates of closing, future operating and development costs and comparable market participants.
Note 13 – Physical Delivery Contracts and Gas Derivatives
We historically have used commodity-based derivative contracts to manage exposures to commodity price on certain of our oil and natural gas production. We do not hold or issue derivative financial instruments for speculative or trading purposes. We also have entered into fixed price delivery contracts to effectively provide commodity price hedges. Because these contracts are not expected to be net cash settled, they are considered to be normal sales contracts and not derivatives. Therefore, these contracts are not recorded at fair value in the unaudited condensed consolidated financial statements.
Pursuant to the terms of our credit facility and Carbon California Note and Revolver Agreements, we have entered into swap and collar derivative agreements to hedge certain of our oil and natural gas production through 2021. As of March 31, 2018, these derivative agreements consisted of the following:
Our Physical Delivery Contracts and Gas Derivatives
| Natural Gas Swaps | Natural Gas Collars | Oil Swaps | ||||||||||||||||||||||
| Weighted | Weighted | Weighted | ||||||||||||||||||||||
| Average | Average Price | Average | ||||||||||||||||||||||
| Year | MMBtu | Price (a) | MMBtu | Range (a) | Bbl | Price (b) | ||||||||||||||||||
| 2018 | 2,610,000 | $ | 3.00 | - | - | 52,000 | $ | 53.51 | ||||||||||||||||
| 2019 | 2,596,000 | $ | 2.86 | - | - | 48,000 | $ | 53.76 | ||||||||||||||||
| (a) | NYMEX Henry Hub Natural Gas futures contract for the respective period. |
| (b) | NYMEX Light Sweet Crude West Texas Intermediate futures contract for the respective period. |
| 27 |
Carbon California Physical Delivery Contracts and Gas Derivatives
| Natural Gas Swaps | Natural Gas Collars | Oil Swaps | ||||||||||||||||||||||||||||||
| Weighted | Weighted | Weighted | Weighted | |||||||||||||||||||||||||||||
| Average | Average Price | WTI | Average | Brent | Average | |||||||||||||||||||||||||||
| Year | MMBtu | Price (a) | MMBtu | Range (a) | Bbl | Price (b) | Bbl | Price (c) | ||||||||||||||||||||||||
| 2018 | 270,000 | $ | 3.03 | - | - | 123,649 | $ | 53.10 | 20,000 | $ | 67.20 | |||||||||||||||||||||
| 2019 | - | $ | - | 360,000 | $2.60 - $3.03 | 139,797 | $ | 51.96 | - | $ | - | |||||||||||||||||||||
| 2020 | - | $ | - | - | - | 73,147 | $ | 50.12 | 24,000 | $ | 59.70 | |||||||||||||||||||||
| (a) | NYMEX Henry Hub Natural Gas futures contract for the respective period. |
| (b) | NYMEX Light Sweet Crude West Texas Intermediate futures contract for the respective period. |
| (c) | Brent for the respective period. |
For our swap instruments, we receive a fixed price for the hedged commodity and pay a floating price to the counterparty. The fixed-price payment and the floating-price payment are netted, resulting in a net amount due to or from the counterparty.
Costless collars are designed to establish floor and ceiling prices on anticipated future oil and gas production. The ceiling establishes a maximum price that we will receive for the volumes under contract, while the floor establishes a minimum price.
The following table summarizes the fair value of the derivatives recorded in the unaudited consolidated balance sheets (see note 12). These derivative instruments are not designated as cash flow hedging instruments for accounting purposes:
| (in thousands) | ||||||||
| March 31, 2018 | December 31, 2017 | |||||||
| Commodity derivative contracts: | ||||||||
| Commodity derivative asset | $ | - | $ | 215 | ||||
| Other long-term assets | $ | - | $ | 10 | ||||
| Commodity derivative liabilities | $ | 1,769 | $ | - | ||||
| Commodity derivative liabilities, non-current | $ | 910 | $ | - | ||||
The table below summarizes the commodity settlements and unrealized gains and losses related to our derivative instruments. These commodity settlements and unrealized gains and losses are recorded and included in commodity derivative gain or loss in the accompanying unaudited consolidated statements of operations.
| (in thousands) | For the three months ended March 31, | |||||||
| 2018 | 2017 | |||||||
| Commodity derivative contracts: | ||||||||
| Settlement loss | $ | (377 | ) | $ | (23 | ) | ||
| Unrealized (loss) gain | (249 | ) | 2,167 | |||||
| Total settlement and unrealized (loss) gain, net | $ | (626 | ) | $ | 2,144 | |||
Commodity derivative settlement gains and losses are included in cash flows from operating activities in our unaudited consolidated statements of cash flows.
| 28 |
The counterparty in all our derivative instruments is BP Energy Company. We and Carbon California have entered into an International Swaps and Derivatives Association (“ISDA”) Master Agreements with BP Energy Company that establishes standard terms for the derivative contracts and an inter-creditor agreements whereby any credit exposure related to the derivative contracts entered into by us and BP Energy Company is secured by the collateral and backed by the guarantees supporting the credit facility.
We and Carbon California net our derivative instrument fair value amounts executed with BP Energy Company pursuant to the ISDA master agreement, which provides for the net settlement over the term of the contracts and in the event of default or termination of the contracts. The following table summarizes the location and fair value amounts of all derivative instruments in the unaudited consolidated balance sheets, as well as the gross recognized derivative assets, liabilities and amounts offset in the unaudited consolidated balance sheets as of March 31, 2018.
| Net | ||||||||||||||
| Gross | Recognized | |||||||||||||
| Recognized | Gross | Fair Value | ||||||||||||
| Assets/ | Amounts | Assets/ | ||||||||||||
| Balance Sheet Classification | Liabilities | Offset | Liabilities | |||||||||||
| Commodity derivative assets: | Commodity derivative | $ | 531 | $ | (531 | ) | $ | - | ||||||
| Other long-term assets | 338 | (338 | ) | - | ||||||||||
| Total derivative assets | $ | 869 | $ | (869 | ) | $ | - | |||||||
| Commodity derivative liabilities: | ||||||||||||||
| Commodity derivative | $ | (2,300 | ) | $ | 531 | $ | (1,769 | ) | ||||||
| Commodity derivative: non-current | (1,248 | ) | 338 | (910 | ) | |||||||||
| Total derivative liabilities | $ | (3,548 | ) | $ | 869 | $ | (2,679 | ) | ||||||
The following table summarizes the location and fair value amounts of all derivative instruments in the consolidated balance sheets, as well as the gross recognized derivative assets, liabilities and amounts offset in the consolidated balance sheets as of December 31, 2017.
| Net | ||||||||||||||
| Gross | Recognized | |||||||||||||
| Recognized | Gross | Fair Value | ||||||||||||
| Assets/ | Amounts | Assets/ | ||||||||||||
| Balance Sheet Classification | Liabilities | Offset | Liabilities | |||||||||||
| Commodity derivative assets: | Commodity derivative | $ | 624 | $ | (409 | ) | $ | 215 | ||||||
| Other long-term assets | 250 | (240 | ) | 10 | ||||||||||
| Total derivative assets | $ | 874 | $ | (649 | ) | $ | 225 | |||||||
| Commodity derivative liabilities: | ||||||||||||||
| Commodity derivative | $ | (409 | ) | $ | 409 | $ | - | |||||||
| Commodity derivative: non-current | (240 | ) | 240 | - | ||||||||||
| Total derivative liabilities | $ | (649 | ) | $ | 649 | $ | - | |||||||
Due to the volatility of oil and natural gas prices, the estimated fair values of our derivatives are subject to large fluctuations from period to period.
| 29 |
Note 14 – Commitments
We have entered into employment agreements with certain of our executives and officers. The term of the agreements generally ranges from one to two years and provides for renewal provisions in one-year increments thereafter. The agreements provide for, among other items, severance and continuation of benefit payments upon termination of employment or certain change of control events.
We have entered into long-term firm transportation contracts to ensure the transport for certain of our gas production to purchasers. Firm transportation volumes and the related demand charges for the remaining term of these contracts at March 31, 2018 are summarized in the table below.
| Period | Dekatherms per day | Demand Charges | ||||||
| Apr 2018 - Apr 2018 | 5,530 | $ | 0.20 - $0.65 | |||||
| May 2018 - Mar 2020 | 3,230 | $ | 0.20 - $0.62 | |||||
| Apr 2020 – May 2020 | 2,150 | $ | 0.20 | |||||
| Jun 2020 – May 2036 | 1,000 | $ | 0.20 | |||||
A liability of approximately $230,000 related to firm transportation contracts assumed in the EXCO Acquisition in 2016, which represents the remaining commitment, is reflected on our unaudited consolidated balance sheets as of March 31, 2018. The fair value of these firm transportation obligations was determined based upon the contractual obligations assumed by us and discounted based upon our effective borrowing rate. These contractual obligations are being amortized monthly as we pay these firm transportation obligations in the future.
Capital Commitment
In our participation as a Class A member of Carbon Appalachia we made a capital commitment of $23.6 million, of which we have contributed $6.9 million as of March 31, 2018.
As of March 31, 2018, we had no capital commitments associated with Carbon California.
During March 2018, management became aware that one of our field employees had been misappropriating funds from our suspended revenue accounts, or suspense accounts, over a period of several years. Promptly following the discovery of the misappropriation, we terminated the employee and engaged an external forensic specialist to lead an investigation to determine the extent and impact on our financial statements. That investigation revealed that the employee’s ability to misappropriate funds from the suspense accounts was eliminated in 2017 when we moved our revenue accounting function to our Denver office and instituted our current set of revenue accounting practices and internal controls. As a result, the employee no longer had access to the suspense accounts.
The discovery of the misappropriation was made in March 2018 when the employee attempted to misappropriate funds from a different source. This attempt was identified under our current internal controls.
The investigation is still ongoing, but based on the results so far, we have recorded a provision at March 31, 2018, to reflect the estimated loss of suspended revenue. Depending upon the results of the investigation, which we are seeking to conclude as soon as reasonably practicable, we may determine that the estimate should be increased or decreased. Furthermore, we will no longer be using printed manual checks for payments. Revenue and other checks will require approval from more than one individual and we are evaluating our segregation of duties, specifically related to the cash disbursement process, and will adjust where possible to strengthen the system of internal control. We have determined that this event constituted a significant deficiency, but not a material weakness.
| 30 |
Note 15 – Supplemental Cash Flow Disclosure
Supplemental cash flow disclosures are presented below:
| Three Months Ended March 31, |
||||||||
| (in thousands) | 2018 | 2017 | ||||||
| Cash paid during the period for: | ||||||||
| Interest | $ | 336 | $ | 216 | ||||
| Non-cash transactions: | ||||||||
| Increase in asset retirement obligations | $ | - | $ | 3 | ||||
| Decrease in accounts payable and accrued liabilities included in oil and gas properties | $ | (71) | $ | (8 | ) | |||
| Non-cash acquisition of Carbon California interests (see note 3) | $ | (18,906 | ) | $ | - | |||
| Carbon California Acquisition on February 1, 2018(see note 3) | $ | 17,114 | $ | - | ||||
| Exercise of warrant derivative(see note 3) | $ | (1,792 | ) | $ | - | |||
Note 16 – Subsequent Events
Seneca Acquisition
On May 1, 2018, through our subsidiary Carbon California, we completed the acquisition of oil and gas producing properties and related facilities located in the Ventura Basin of California for approximately $43.0 million, subject to normal and customary post-closing adjustments (“Seneca Acquisition”). The Seneca Acquisition was funded through the combination of funds used from the Carbon California Revolver and Carbon California Notes, and the issuance of an additional 10,000 Class A units for $11.0 million and sale of an additional $3.0 million of Senior Subordinated Notes. Following the closing of the Seneca Acquisition and the resultant issuance of Class A Units on May 1, 2018, our ownership decreased to 53.92% of the voting and profits interests of Carbon California.
Carbon California Notes and Carbon California Revolver, related party
On May 1, 2018, Carbon California (i) entered into an amendment to the Carbon California Revolver to increase the borrowing base available to $41.0 million and permit the consummation of the Seneca Acquisition; (ii) entered into a securities purchase agreement with Prudential Capital Energy Partners, L.P. for (a) the issuance and sale of $3.0 million of Senior Subordinated Notes due February 15, 2024 and (b) the issuance of 585 Class A Units of Carbon California as partial consideration for the Subordinated Notes; and (iii) issued (a) an additional 5,000 Class A Units of Carbon California to Prudential Capital Energy Partners, L.P in exchange for a $5.0 million capital contribution and (b) an additional 5,000 Class A Units of Carbon California to us in exchange for a $5.0 million capital contribution.
Preferred Stock
On April 6, 2018, we entered into a preferred stock purchase agreement with Yorktown, for a private placement of 50,000 shares of the Company’s Series B Convertible Preferred Stock for proceeds of $5.0 million. These proceeds were used to fund our contribution to Carbon California for the Seneca Acquisition.
Old Ironsides Membership Interest Purchase Agreement
On May 4, 2018, we entered into a Membership Interest Purchase Agreement (the “MIPA”) with Old Ironsides. Old Ironsides owns 73.5%, and we own the remaining 26.5%, of the issued and outstanding Class A Units of Carbon Appalachia. We also own all of the Class B and Class C units of Carbon Appalachia. Pursuant to the MIPA, we will acquire all of Old Ironsides’ membership interests of Carbon Appalachia. Following the closing of the transaction, we will own 100% of the issued and outstanding ownership interests in Carbon Appalachia, and Carbon Appalachia will become a wholly-owned subsidiary.
Subject to the terms and conditions of the MIPA, the Company will pay Old Ironsides, approximately $57.0 million at closing, subject to adjustment in accordance with the MIPA.
The MIPA contains termination rights for us and Old Ironsides, including, among others, if the closing of the transaction has not occurred on or before September 1, 2018 (a date that is 120 days after execution of the MIPA). The MIPA may also be terminated by mutual written consent of us and Old Ironsides.
Carbon Appalachia Borrowing Base Increase
On April 30, 2018, CAE Credit Facility was amended, resulting in an increase in the borrowing base to $70.0 million. As of March 31, 2018, there was approximately $38.0 million outstanding under the CAE Credit Facility.
| 31 |
ITEM 1A. Risk Factors
The following statements highlight risk factors that may affect our financial condition and results of operations. These are not intended to be an exhaustive discussion for all such risks, and the statements below must be read together with the risk factors discussed in our 2017 Annual Report on Form 10-K and in our other filings with the SEC.
There can be no assurance that the Old Ironsides Buyout will be consummated in the anticipated timeframe, on the terms previously disclosed, or at all.
As described in our Current Report on Form 8-K filed on May 4, 2018, we signed a purchase agreement to acquire all of Old Ironsides’ interest in Carbon Appalachia for $58 million. The consummation of the Old Ironsides Buyout is subject to certain closing conditions. In addition, the purchase agreement contains termination rights for each of Carbon and Old Ironsides if the closing of the Old Ironsides Buyout has not occurred on or before September 1, 2018. There can be no assurances that the Old Ironsides Buyout will be consummated in the anticipated timeframe, on the terms previously disclosed, or at all. Our stock price could be negatively impacted if we fail to complete the Old Ironsides Buyout.
ITEM 2. Management’s Discussion and Analysis of Financial Condition and Results of Operations
The following discussion includes forward-looking statements about our business, financial condition and results of operations, including discussions about management’s expectations for our business. These statements represent projections, beliefs and expectations based on current circumstances and conditions, and you should not construe these statements either as assurances of performance or as promises of a given course of action. Instead, various known and unknown factors may cause our actual performance and management’s actions to vary, and the results of these variances may be both material and adverse. A description of material factors known to us that may cause our results to vary, or may cause management to deviate from its current plans and expectations, is set forth under “Risk Factors.” The following discussion should be read in conjunction with “Forward-Looking Statements,” “Risk Factors” and our unaudited condensed consolidated financial statements, including the notes thereto appearing elsewhere in this Quarterly Report on Form 10-Q and the information included or incorporated by reference in the Company’s 2017 Annual Report on Form 10-K.
Overview
Carbon Natural Gas Company, a Delaware corporation formed in 2007, is an independent oil and natural gas company engaged in the acquisition, exploration, development and production of oil, natural gas and natural gas liquids properties located in the United States. We currently develop and operate oil and gas properties in the Appalachian Basin in Kentucky, Ohio, Tennessee, Virginia and West Virginia; the Ventura Basin in California; and the Illinois Basin in Illinois and Indiana through our majority-owned subsidiaries. We focus on conventional and unconventional reservoirs, including shale, tight sands and coalbed methane. Our executive offices are in Denver, Colorado and we maintain offices in Lexington, Kentucky, and Santa Paula, California.
We also develop and operate oil and gas properties in the Appalachian Basin in Kentucky, Tennessee, Virginia and West Virginia through our investment in Carbon Appalachia.
At March 31, 2018, our proved developed reserves and our interest in our equity investee’s proved developed reserves were comprised of 32% oil and natural gas liquids (“NGL”), and 68% natural gas. Our current capital expenditure program is focused on the acquisition and development of oil and natural gas properties in areas where we currently operate. We believe that our asset and lease position, combined with our low operating expense structure and technical expertise, provides us with a portfolio of opportunities for the development of our oil and natural gas properties. Our growth plan is centered on acquiring, developing, optimizing and maintaining a portfolio of low risk, long-lived oil and natural gas properties that provide stable cash flows and attractive risk adjusted rates of return.
| 32 |
Factors That Significantly Affect Our Financial Condition and Results of Operations
Our revenue, profitability and future growth rate depend on many factors which are beyond our control, including but not limited to, economic, political and regulatory developments and competition from other industry participants. Our financial results are sensitive to fluctuations in oil and natural gas prices. Oil and gas prices historically have been volatile and may fluctuate widely in the future due to a variety of factors, including but not limited to, prevailing economic conditions, supply and demand of hydrocarbons in the marketplace, actions by speculators, and geopolitical events such as wars or natural disasters. The following table highlights the quarterly average of NYMEX oil and natural gas prices for the last eight calendar quarters:
| 2016 | 2017 | 2018 | ||||||||||||||||||||||||||||||
| Q2 | Q3 | Q4 | Q1 | Q2 | Q3 | Q4 | Q1 | |||||||||||||||||||||||||
| Oil (Bbl) | $ | 45.60 | $ | 44.94 | $ | 49.33 | $ | 51.86 | $ | 48.29 | $ | 48.19 | $ | 55.39 | $ | 62.89 | ||||||||||||||||
| Natural Gas (MMBtu) | $ | 1.98 | $ | 2.93 | $ | 2.98 | $ | 3.07 | $ | 3.09 | $ | 2.89 | $ | 2.87 | $ | 3.13 | ||||||||||||||||
Low oil, natural gas liquids, and natural gas prices may decrease our revenues, may reduce the amount of oil, natural gas, and natural gas liquids that we can produce economically and potentially lower our oil, natural gas liquids, and natural gas reserves. Our estimated proved reserves and our interest in our equity investee’s estimated proved reserves may decrease if the economic life of the underlying producing wells is shortened as a result of lower oil and natural gas prices. A substantial or extended decline in oil or natural gas prices may result in future impairments of our proved reserves and our equity investee’s proved reserves and may materially and adversely affect our future business, financial condition, cash flows, results of operations or liquidity. Lower oil and natural gas prices may also reduce the amount of borrowing base under our bank credit facility and the Carbon California Revolver Agreement, which is determined at the discretion of our lenders and may make it more difficult to comply with the covenants and other restrictions under these agreements.
| 33 |
We use the full cost method of accounting for our oil and gas properties and perform a ceiling test quarterly. The ceiling calculation utilizes a rolling 12-month average commodity price. We did not recognize an impairment in 2017 or for the first quarter of 2018.
Future write downs or impairments, if any, are difficult to predict and will depend not only on commodity prices, but also other factors that include, but are not limited to, incremental proved reserves that may be added each period, revisions to previous reserve estimates, capital expenditures and operating costs. There are numerous uncertainties inherent in the estimation of proved reserves and accounting for oil and natural gas properties in subsequent periods.
We use commodity derivative instruments, such as swaps and costless collars, to manage and reduce price volatility and other market risks associated with our production. These arrangements are structured to reduce our exposure to commodity price decreases, but they can also limit the benefit we might otherwise receive from commodity price increases.
Impairment charges do not affect cash flows from operating activities but do adversely affect net income and stockholders’ equity. An extended decline in oil or natural gas prices may materially and adversely affect our future business, financial condition, cash flows and liquidity.
Future property acquisitions or dispositions could have a material impact on our financial condition and results of operations by increasing or decreasing our reserves, production and revenues as well as expenses and future capital expenditures. We currently anticipate that we would finance any future acquisitions with available borrowings under our credit facility Carbon California Revolver Agreement, sales of properties or the issuance of additional equity or debt.
Operational Highlights
During the end of 2017 and first quarter of 2018, NYMEX oil prices increased substantially, from $55.39 to $62.89, Carbon California’s is utilizing the revenues from our sales to perform scheduled maintenance and recompletion projects. Based on expected future prices for oil and the increased rate of return on oil projects, we will deploy capital primarily to oil drilling and recompletion work in the Appalachia and Ventura basins.
During 2017 and 2018, we concentrated our efforts on the acquisition and enhancement of producing properties through the EXCO Acquisition and acquisitions consummated by Carbon California and Carbon Appalachia. Our and our equity investee’s field development activities have consisted principally of oil-related remediation, return to production and recompletion projects in California and the optimization and streamlining of our natural gas gathering and compression facilities in Appalachia to provide more efficient and lower cost operations and greater flexibility in moving our production to markets with more favorable pricing. Since closing these acquisitions, we have focused on the reduction of operating expenses, optimization of natural gas gathering and compression facilities and the identification of development project opportunities. In addition, since 2010, we have drilled 56 horizontal wells in a Berea sandstone oil formation located in Eastern Kentucky. We have enhanced our well performance, improved well drilling and completion performance, including reduced drilling days, increased horizontal lateral length, decreased cost per frac stage and reduced days from spud to first production. In addition, we have established an infrastructure of oil and natural gas gathering and water handling and disposal facilities which will benefit the economics of future drilling.
As of March 31, 2018, we owned working interests in 3,500 gross wells (3,200 net) and royalty interests located in Kentucky, Ohio, Tennessee, West Virginia, and California and had leasehold positions in approximately 191,000 net developed acres and approximately 229,000 net undeveloped acres. Approximately 41% of the undeveloped acreage is held by production and of the remaining undeveloped acreage, approximately 47% have lease terms of greater than five years remaining in the primary term or contractual extension periods.
| 34 |
As of March 31, 2018, Carbon Appalachia owned working interests in 5,200 gross wells (4,800 net) located in Kentucky, Tennessee, Virginia and West Virginia, and had leasehold positions in approximately 850,000 net developed acres and approximately 377,000 net undeveloped acres. Approximately 16% of the undeveloped acreage is held by production and of the remaining undeveloped acreage, approximately 88% have lease terms of greater than five years remaining in the primary term or contractual extension periods. As described below, as of March 31, 2018, our proportionate share in Carbon Appalachia was 27.24%.
Our oil and natural gas assets and those of our equity investee contain an inventory of multi-year proved developed non-producing properties with multiple potential future drilling locations which will provide significant drilling and completion opportunities from multiple proven formations when oil and natural gas commodity prices make such opportunities economical.
Recent Developments and Factors Affecting Comparability
We are continually evaluating producing property and land acquisition opportunities in our operating areas and our equity investee’s operating area which would expand our or our equity investee’s operations and provide attractive risk adjusted rates of return on invested capital. The drilling of additional oil and natural gas wells is contingent on our expectation of future oil and natural gas prices.
Consolidation of Carbon California
On February 1, 2018, Yorktown exercised a warrant it held to purchase shares of our common stock at an exercise price of $7.20 per share (the “California Warrant”), resulting in the issuance of 1,527,778 shares of our common stock in exchange for Yorktown’s Class A Units of Carbon California representing approximately 46.96% of the outstanding Class A Units of Carbon California and a profits interest of approximately 38.59%. After giving effect to the exercise on February 1, 2018, we own 56.4% of the voting and profits interests of Carbon California. As of February 1, 2018, we consolidate Carbon California for financial reporting purposes.
Closing of the Seneca Acquisition
In October 2017, Carbon California signed a Purchase and Sale Agreement to acquire 309 operated and 1 non-operated oil wells covering approximately 5,700 gross acres (5,500 net), and fee interests in and to certain lands, situated in the Ventura Basin, together with associated pipelines, facilities, equipment and other property rights for a purchase price of $43.0 million, subject to customary and standard purchase price adjustments, from Seneca Resources Corporation (the “Seneca Acquisition”). We contributed $5.0 million to Carbon California to fund our portion of the purchase price. The remainder was funded by the other equity member and debt. We raised our $5.0 million through the issuance of 50,000 shares of Series B Convertible Preferred Stock to Yorktown. The Seneca Acquisition closed on May 1, 2018 with an effective date as of October 1, 2017.
Preferred Stock Issuance to Yorktown
In connection with the closing of the Seneca Acquisition, we raised $5.0 million through the issuance of 50,000 shares of Series B Convertible Preferred Stock (the “Preferred Stock”), to Yorktown.
Principal Components of Our Cost Structure
| ● | Lease operating expenses. These are costs incurred to bring oil and natural gas out of the ground and to market, together with the costs incurred to maintain our producing properties. Such costs include maintenance, repairs and workover expenses related to our oil and natural gas properties. |
| ● | Transportation and gathering costs. Transportation and gathering costs are incurred to bring oil and natural gas to market. Gathering refers to using groups of small pipelines to move the oil and natural gas from several wells into a major pipeline, or in case of oil, into a tank battery. |
| 35 |
| ● | Production and property taxes. Production taxes consist of severance and property taxes and are paid on oil and natural gas produced based on a percentage of market prices or at fixed rates established by federal, state or local taxing authorities. |
| ● | Depreciation, amortization and impairment. We use the full cost method of accounting for oil and gas properties. All costs incidental to the acquisition, exploration and development of oil and gas properties, including costs of undeveloped leasehold, dry holes and leasehold equipment, are capitalized. We perform a quarterly ceiling test. The full cost ceiling test is a limitation on capitalized costs prescribed by the SEC. The ceiling test is not a fair value-based measurement; rather, it is a standardized mathematical calculation that compares the net capitalized costs of our full cost pool to estimated discounted cash flows. Should the net capitalized cost exceed the sum of the estimated discounted cash flows, a ceiling test write-down would be recognized to the extent of the excess. |
We perform our ceiling tests based on average first-of-the-month prices during the twelve-month period prior to the reporting date. For the quarter ended March 31, 2018, we did not incur a ceiling test impairment.
| ● | Depletion. Depletion is calculated using capitalized costs in the full cost pool, including estimated asset retirement costs and estimated future expenditures to be incurred in developing proved reserves, net of estimated salvage values and depleted based on a unit-of-production method. |
| ● | General and administrative expense. These costs include payroll and benefits for our corporate staff, non-cash stock-based compensation, costs of maintaining our offices, costs of managing our production, development and acquisition operations, franchise taxes, audit, tax, legal and other professional fees and legal compliance. Certain of these costs are recovered as management reimbursements in place with Carbon California and Carbon Appalachia. |
| ● | Interest expense. We finance a portion of our working capital requirements for drilling and completion activities and acquisitions with borrowings under our credit facilities. As a result, we incur interest expense that is affected by both fluctuations in interest rates and our financing decisions. |
| ● | Income tax expense. We are subject to state and federal income taxes but typically have not been in a tax paying position for regular federal income taxes, primarily due to the current deductibility of intangible drilling costs (“IDC”) and net operating loss (“NOL”) carryforwards. We pay alternative minimum tax, state income or franchise taxes where IDC or NOL deductions do not exceed taxable income or where state income or franchise taxes are determined on another basis. |
On December 22, 2017, the Tax Cut and Jobs Act (“TCJA”) was enacted. The TCJA significantly changes the U.S. corporate tax law by, among other things, lowering the U.S. corporate income tax rate from 35% to 21% beginning in January 2018. FASB ASC Topic 740, Income Taxes, requires companies to recognize the impact of the changes in tax law in the period of enactment.
Amounts recorded during the quarter ended March 31, 2018, related to the TCJA principally relate to the reduction in the U.S. corporate income tax rate to 21%, which resulted in (i) income tax expense of approximately $6.0 million from the revaluation of our deferred tax assets and liabilities as of the date of enactment which was subject to a reduction and (ii) an income tax benefit totaling $74,000 related to a reduction in our existing valuation allowances relating to refundable Alternative Minimum Tax credits. Reasonable estimates were made based on our analysis of the remeasurement of our deferred tax assets and liabilities and valuation allowances under tax reform. These provisional amounts may be adjusted in future periods if additional information is obtained or further clarification and guidance is issued by regulatory authorities regarding the application of the law.
Other provisions of the TCJA that may impact income taxes include (i) a limitation on the current deductibility of net interest expense in excess of 30% of adjusted taxable income, (ii) a limitation on the usage of NOLs generated after 2017 to 80% of taxable income, (iii) the inclusion of performance-based compensation in determining the excessive compensation limitation, and (iv) the unlimited carryforward of NOLs.
| 36 |
Results of Operations
Three Months Ended March 31, 2018 Compared to Three Months Ended March 31, 2017
The following discussion and analysis relates to items that have affected our results of operations for the three months ended March 31, 2018 and 2017. The following table sets forth for the periods presented our selected historical unaudited consolidated statements of operations and production data and does not include results of operations from Carbon Appalachia.
| Three Months Ended | ||||||||||||||
| March 31, | Percent | |||||||||||||
| (in thousands except production and per unit data) | 2018 | 2017 | Change | |||||||||||
| Revenue: | ||||||||||||||
| Natural gas sales | $ | 3,939 | $ | 3,994 | 1 | % | ||||||||
| Natural gas liquids sales | 163 | - | * | |||||||||||
| Oil sales | 2,983 | 1,046 | 185 | % | ||||||||||
| Commodity derivative (loss) gain | (626 | ) | 2,144 | (129 | %) | |||||||||
| Other income | 14 | 9 | 56 | % | ||||||||||
| Total revenues | 6,473 | 7,193 | (10 | %) | ||||||||||
| Expenses: | ||||||||||||||
| Lease operating expenses | 2,087 | 1,205 | 73 | % | ||||||||||
| Transportation costs | 855 | 489 | 75 | % | ||||||||||
| Production and property taxes | 433 | 412 | 5 | % | ||||||||||
| General and administrative | 2,948 | 1,745 | 69 | % | ||||||||||
| General and administrative – related party reimbursement | (1,116 | ) | (75 | ) | 1388 | % | ||||||||
| Depreciation, depletion and amortization | 1,492 | 573 | 160 | % | ||||||||||
| Accretion of asset retirement obligations | 141 | 78 | 81 | % | ||||||||||
| Total expenses | 6,840 | 4,427 | 55 | % | ||||||||||
| Operating income (loss) | $ | (367 | ) | $ | 2,766 | (113 | %) | |||||||
| Other income and (expense): | ||||||||||||||
| Interest expense | (1,002 | ) | (267 | ) | 275 | % | ||||||||
| Warrant derivative gain | 225 | 830 | (73 | %) | ||||||||||
| Gain on derecognized equity investment in affiliate – Carbon California | 5,391 | - | * | |||||||||||
| Equity investment income (loss) | 437 | 7 | 614 | % | ||||||||||
| Total other income (expense) | $ | 5,051 | $ | 570 | 739 | % | ||||||||
| Production data: | ||||||||||||||
| Natural gas (Mcf) | 1,323,092 | 1,160,907 | 14 | % | ||||||||||
| Oil (Bbl) | 47,103 | 20,654 | 128 | % | ||||||||||
| Natural gas liquids (Bbl) | 4,502 | - | * | |||||||||||
| Combined (Mcfe) | 1,632,722 | 1,284,831 | 33 | % | ||||||||||
| Average prices before effects of hedges: | ||||||||||||||
| Natural gas (per Mcf) | $ | 2.98 | $ | 3.44 | (13 | %) | ||||||||
| Oil (per Bbl) | $ | 57.80 | $ | 50.65 | 14 | % | ||||||||
| Natural Gas Liquids (per Bbl) | $ | 35.30 | - | * | ||||||||||
| Combined (per Mcfe) | $ | 4.34 | $ | 3.92 | 11 | % | ||||||||
| Average prices after effects of hedges**: | ||||||||||||||
| Natural gas (per Mcf) | $ | 2.98 | $ | 4.71 | (37 | %) | ||||||||
| Oil and (per Bbl) | $ | 50.39 | $ | 83.12 | (39 | %) | ||||||||
| Natural Gas Liquids (per Bbl) | $ | 35.30 | $ | - | * | |||||||||
| Combined (per Mcfe) | $ | 4.11 | $ | 5.59 | (26 | %) | ||||||||
| Average costs (per Mcfe): | ||||||||||||||
| Lease operating expenses | $ | 1.28 | $ | 0.94 | 36 | % | ||||||||
| Transportation costs | $ | 0.52 | $ | 0.37 | 41 | % | ||||||||
| Production and property taxes | $ | 0.27 | $ | 0.32 | (16 | %) | ||||||||
| Cash-based general and administrative expense, net of related party reimbursement | $ | 1.58 | $ | 1.05 | 50 | % | ||||||||
| Depreciation, depletion and amortization | $ | 0.91 | $ | 0.45 | 102 | % | ||||||||
| * | Not meaningful or applicable |
| ** | Includes settled and unrealized commodity derivative gains and losses. |
| 37 |
Oil, natural gas, natural gas liquids sales- Revenues from sales of oil and natural gas increased 41% to approximately $7.1 million for the three months ended March 31, 2018 from approximately $5.0 million for the three months ended March 31, 2017. This increase was primarily due to the consolidation of Carbon California on February 1, 2018 which contributed approximately $2.3 million in oil, natural gas liquids, and natural gas sales.
Commodity derivative gains and losses- To achieve more predictable cash flows and to reduce our exposure to downward price fluctuations, we enter into derivative contracts using fixed price swap contracts and costless collars. Because we do not designate these derivatives as cash flow hedges, they do not receive hedge accounting treatment and all mark-to-market gains or losses, as well as settlement gains or losses on the derivative instruments, are currently recognized in our results of operations. The unrealized gains and losses represent the changes in the fair value of these contracts as oil and natural gas futures prices fluctuate relative to the fixed price we will receive from these contracts. For the three months ended March 31, 2018 and 2017, we had commodity derivative losses of approximately $626,000 and gains of approximately $2.1 million, respectively.
Lease operating expenses- Lease operating expenses for the three months ended March 31, 2018 increased 73% compared to the three months ended March 31, 2017. This increase is primarily attributed to the consolidation of Carbon California properties. On a per Mcfe basis, lease operating expenses increased from $0.94 per Mcfe for the three months ended March 31, 2017 to $1.28 per Mcfe for the three months ended March 31, 2018. This increase was primarily attributed to the consolidation of Carbon California which is comprised of oil properties and have higher lease operating expenses per unit of production compared to Carbon’s Appalachian based production which is primarily comprised of natural gas properties.
Transportation costs- Transportation costs for the three months ended March 31, 2018 increased 75% compared to the three months ended March 31, 2017. This increase is attributed to an increase in production as a result of the consolidation of Carbon California which occurred on February 1, 2018. On a per Mcfe basis, these expenses increased from $0.37 per Mcfe for the three months ended March 31, 2017 to $0.52 per Mcfe for the three months ended March 31, 2018. The increase on a per Mcfe basis is primarily due to higher transportation and processing costs per unit for the Carbon California properties as compared to our Appalachia properties.
Production and property taxes- Production and property taxes increased from approximately $412,000 for the three months ended March 31, 2017 to approximately $433,000 for the three months ended March 31, 2018. This increase is primarily attributable to the consolidation Carbon California as of February 1, 2018 partially offset by a credit for ad valorem taxes on the Company’s Appalachia properties recorded in the first quarter of 2018. Production and property taxes were $0.27 and $0.32 per Mcfe for the three months ended March 31, 2018 and 2017, respectively. Ad valorem tax rates, which can fluctuate by year, are determined by individual counties where we have production and are assessed on our sales one or two years in arrears depending on the location of the production.
Depreciation, depletion and amortization (DD&A)- DD&A increased from approximately $573,000 for the three months ended March 31, 2017 to approximately $1.5 million for the three months ended March 31, 2018 primarily due to an increase in oil and natural gas production. On a per Mcfe basis, DD&A increased from $0.45 per Mcfe for the three months ended March 31, 2017 to $0.91 per Mcfe for the three months ended March 31, 2018. The increase in depletion rate is primarily attributable to the consolidation of Carbon California in the first quarter of 2018 which increased the Company’s blended depletion rate.
| 38 |
General and administrative expenses- Cash-based general and administrative expenses increased from approximately $1.3 million for the three months ended March 31, 2017 to approximately $1.5 million for the three months ended March 31, 2018. This increase is primarily attributed to the consolidation of Carbon California on February 1, 2018. Non-cash stock-based compensation and other general and administrative expenses for the three months ended March 31, 2018 and 2017 are summarized in the following table:
| General and administrative expenses | Three Months Ended March 31, | |||||||||||
| (in thousands) | Increase/ | |||||||||||
| 2018 | 2017 | (Decrease) | ||||||||||
| Stock-based compensation | $ | 292 | $ | 319 | $ | (27 | ) | |||||
| Other general and administrative expenses | 2,656 | 1,426 | 1,230 | |||||||||
| General and administrative - related party reimbursement | (1,116 | ) | (75 | ) | (1,041 | ) | ||||||
| General and administrative expense, net | $ | 1,832 | $ | 1,670 | $ | 162 | ||||||
Interest expense- Interest expense increased from approximately $267,000 for the three months ended March 31, 2017 to approximately $1.0 million for the three months ended March 31, 2018, primarily due the consolidation of Carbon California on February 1, 2018, higher interest rates on our Credit Facility and higher debt balances on our Credit Facility for the three months ended March 31, 2018 compared to the same period in 2017.
Carbon Appalachia
The following table sets forth selected historical unaudited consolidated statements of operations and production data for Carbon Appalachia.
| (in thousands) | As of March 31, 2018 | |||
| Current assets | $ | 21,452 | ||
| Total oil and gas properties, net | $ | 83,404 | ||
| Current liabilities | $ | 17,086 | ||
| Non-current liabilities | $ | 58,730 | ||
| Total members’ equity | $ | 42,506 | ||
| (in thousands) | Three months ended March 31, 2018 | |||
| Revenues | $ | 25,743 | ||
| Operating expenses | 23,534 | |||
| Income from operations | 2,208 | |||
| Net income | 1,526 | |||
Liquidity and Capital Resources
Our exploration, development and acquisition activities may require us to make significant operating and capital expenditures. Historically, we have used cash flow from operations and our credit facilities as our primary sources of liquidity and on occasion, we have engaged in the sale of assets. Changes in the market prices for oil and natural gas directly impact our level of cash flow generated from operations. The prices we receive for our production are determined by prevailing market conditions and greatly influence our revenue, cash flow, profitability, access to capital and future rate of growth. We employ a commodity hedging strategy in an attempt to moderate the effects of commodity price fluctuations on our cash flow.
We historically have used commodity-based derivative contracts to manage exposures to commodity price on certain of our oil and natural gas production. We do not hold or issue derivative financial instruments for speculative or trading purposes. We also have entered into fixed price delivery contracts to effectively provide commodity price hedges. Because these contracts are not expected to be net cash settled, they are considered to be normal sales contracts and not derivatives. Therefore, these contracts are not recorded at fair value in the condensed consolidated financial statements.
| 39 |
Pursuant to the terms of our credit facility and Carbon California Note and Revolver Agreements, we have entered into swap and collar derivative agreements to hedge certain of our oil and natural gas production through 2020. As of March 31, 2018, these derivative agreements consisted of the following:
Our Physical Delivery Contracts and Gas Derivatives
| Natural Gas Swaps | Natural Gas Collars | Oil Swaps | ||||||||||||||||||||||
| Weighted | Weighted | Weighted | ||||||||||||||||||||||
| Average | Average Price | Average | ||||||||||||||||||||||
| Year | MMBtu | Price (a) | MMBtu | Range (a) | Bbl | Price (b) | ||||||||||||||||||
| 2018 | 2,610,000 | $ | 3.00 | - | - | 52,000 | $ | 53.51 | ||||||||||||||||
| 2019 | 2,596,000 | $ | 2.86 | - | - | 48,000 | $ | 53.76 | ||||||||||||||||
| (a) | NYMEX Henry Hub Natural Gas futures contract for the respective period. |
| (b) | NYMEX Light Sweet Crude West Texas Intermediate futures contract for the respective period. |
Carbon California Physical Delivery Contracts and Gas Derivatives
| Natural Gas Swaps | Natural Gas Collars | Oil Swaps | ||||||||||||||||||||||||||||||
| Weighted | Weighted | Weighted | Weighted | |||||||||||||||||||||||||||||
| Average | Average Price | WTI | Average | Brent | Average | |||||||||||||||||||||||||||
| Year | MMBtu | Price (a) | MMBtu | Range (a) | Bbl | Price (b) | Bbl | Price (c) | ||||||||||||||||||||||||
| 2018 | 270,000 | $ | 3.03 | - | - | 123,649 | $ | 53.10 | 20,000 | $ | 67.20 | |||||||||||||||||||||
| 2019 | - | $ | - | 360,000 | $2.60 - $3.03 | 139,797 | $ | 51.96 | - | $ | - | |||||||||||||||||||||
| 2020 | - | $ | - | - | - | 73,147 | $ | 50.12 | 24,000 | $ | 59.70 | |||||||||||||||||||||
| (a) | NYMEX Henry Hub Natural Gas futures contract for the respective period. |
| (b) | NYMEX Light Sweet Crude West Texas Intermediate futures contract for the respective period. | |
| (c) | Brent for the respective period. |
For our swap instruments, we receive a fixed price for the hedged commodity and pay a floating price to the counterparty. The fixed-price payment and the floating-price payment are netted, resulting in a net amount due to or from the counterparty.
Costless collars are designed to establish floor and ceiling prices on anticipated future oil and gas production. The ceiling establishes a maximum price that we will receive for the volumes under contract, while the floor establishes a minimum price.
This hedge program mitigates uncertainty regarding cash flow that we will receive with respect to a portion of our expected production through 2020. Future hedging activities may result in reduced income or even financial losses to us. See “Risk Factors—We have entered into natural gas and oil derivative contracts and may in the future enter into additional commodity derivative contracts for a portion of our production, which may result in future cash payments or prevent us from receiving the full benefit of increases in commodity prices,” in our Annual Report on Form 10-K for further details of the risks associated with our hedging activities. In the future, we may determine to increase or decrease our hedging positions.
We have derivative contracts with BP Energy Company pursuant to ISDA Master Agreements. BP Energy Company is currently our only derivative contract counterparty.
Management Reimbursements
In our role as manager of Carbon California and Carbon Appalachia, we receive management reimbursements. We received approximately $753,000 and $50,000 for the three months ended March 31, 2018, and for the one month ended January 31, 2018, from Carbon Appalachia and Carbon California, respectively. These reimbursements are included in general and administrative – related party reimbursement on our unaudited consolidated statements of operations. Effective February 1, 2018, the management reimbursements received from Carbon California are eliminated at consolidation. This elimination includes $100,000 for the period February 1, 2018, through March 31, 2018.
In addition to the management reimbursements, approximately $299,000 and $14,000 in general and administrative expenses were reimbursed for the three months ended March 31, 2018, and for the one month ended January 31, 2018, by Carbon Appalachia and Carbon California, respectively. The elimination of Carbon California in consolidation includes approximately $28,000 for the period February 1, 2018, through March 31, 2018.
Operating Reimbursements
In our role as operator of Carbon Appalachia, we receive reimbursements of operating expenses. These expenses are recorded directly to receivable – related party on our unaudited consolidated balance sheets and therefore included in our operating expenses on our unaudited consolidated statement of operations.
Historically, the primary source of liquidity has been our credit facilities (described below). We may use other sources of capital, including the issuance of debt or equity securities, to fund acquisitions or maintain our financial flexibility.
Historically, the primary source of liquidity has been our credit facilities (described below). We may use other sources of capital, including the issuance of debt or equity securities, to fund acquisitions or maintain our financial flexibility.
| 40 |
If low commodity prices continue, we may continue to defer our planned capital expenditures. We believe that our financial flexibility to adjust our spending levels will provide us with sufficient liquidity to meet our financial obligations should economic conditions deteriorate. See “Risk Factors” in our Annual Report on Form 10-K for a discussion of the risks and uncertainties that affect our business and financial and operating results.
Bank Credit Facility
Our Credit Facility
In 2016, we entered into a 4-year $100.0 million senior secured asset-based revolving credit facility with LegacyTexas Bank. LegacyTexas Bank is the initial lender and acts as administrative agent.
The credit facility has a maximum availability of $100.0 million (with a $500,000 sublimit for letters of credit), which availability is subject to the amount of the borrowing base. The borrowing base is subject to semi-annual redeterminations in March and September. On March 28, 2018, the borrowing base was increased to $25.0 million, of which approximately $23.2 million was drawn as of March 31, 2018. Our effective interest rate as of March 31, 2018 was 7.59%.
On March 27, 2018, the credit facility was amended to revise the calculation of the Leverage Ratio from a Debt/EBITDA ratio to a Net Debt/Adjusted EBITDA ratio, reset the testing period used in the determination of Adjusted EBITDA, eliminated the minimum current ratio and substituted alternative liquidity requirements, including maximum allowed current liabilities in relation to current assets, a minimum cash balance requirement of $750,000 and maximum aged trade payable requirements. As of March 31, 2018, we were in compliance with our financial covenants.
Carbon California Notes
On February 15, 2017, Carbon California entered into an agreement with Prudential Capital Energy Partners, L.P. for the issuance and sale of $10.0 million of unsecured notes due February 15, 2024, bearing interest of 12% per annum (“Carbon California Notes”).
The Carbon California Notes require Carbon California, as of January 1 and July 1 of each year, to hedge its anticipated production at such time for year one, two and three at a rate of 67.5%, 58.5% and 45%, respectively.
The Carbon California Notes agreement requires Carbon California to maintain certain financial and non-financial covenants, which include the following ratios: total leverage ratio, senior leverage ratio, interest coverage ratio, asset coverage ratio, current ratio, and other qualitative covenants as defined in the Revolver agreement. As of March 31, 2018, Carbon California was in breach of financial covenants; however, Carbon California obtained a waiver for March 31, 2018, measurement period.
On May 1, 2018, Carbon California entered into a securities purchase agreement with Prudential for (a) the issuance and sale of $3.0 million of Senior Subordinated Notes due February 15, 2024 and (b) the issuance of 585 Class A units of Carbon California as partial consideration for the Subordinated Notes; and (iii) issued (a) an additional 5,000 Class A units of Carbon California to Prudential in exchange for a $5.0 million capital contribution and (b) an additional 5,000 Class A units of Carbon California to us in exchange for a $5.0 million capital contribution.
Carbon California- Revolver, Related Party
On February 15, 2017, Carbon California entered into a revolver agreement with Prudential Legacy Insurance Company of New Jersey and Prudential Insurance Company of America with an initial borrowing base of $15 million and $13.0 million outstanding as of March 31, 2018. (the “Revolver”). Carbon California may elect to incur interest at either (i) 5.0% plus the London interbank offered rate (“LIBOR”) or (ii) 4.00% plus Prime Rate (which is defined as the interest rate published daily by JPMorgan Chase Bank, N.A.). As of March 31, 2018, the Revolver’s effective borrowing rate was 8.29%. In addition, the Revolver includes a commitment fee for any unused amounts at 0.50% as well as an annual administrative fee of $75,000, payable on February 15 each year.
The Revolver agreement requires Carbon California to maintain certain financial and non-financial covenants which include the following ratios: total leverage ratio, senior leverage ratio, interest coverage ratio, current ratio, and other qualitative covenants as defined in the Revolver agreement. As of March 31, 2018, Carbon California was in breach of its covenants; however, Carbon California obtained a waiver for the March 31, 2018, measurement period.
On May 1, 2018, Carbon California (i) entered into an amendment to the Carbon California Revolver to increase the borrowing base available to $41.0 million and permit the consummation of the Seneca Acquisition.
Carbon Appalachia’s Credit Facility
In 2017, Carbon Appalachia Enterprises, LLC, formerly known as Carbon Tennessee Company, LLC (“CAE”), a subsidiary of Carbon Appalachia, entered into a 4-year $100.0 million senior secured asset-based revolving credit facility with LegacyTexas Bank with an initial borrowing base of $10.0 million (the “CAE Credit Facility”).
The CAE Credit Facility borrowing base was adjusted for acquisitions completed in 2017. Most recently, on April 30, 2018, CAE amended the CAE Credit Facility, which increased the borrowing base to $70.0 million with redeterminations as of April 1 and October 1 each year. As of March 31, 2018, there was approximately $38.0 million outstanding under the CAE Credit Facility.
On April 30, 2018, CAE Credit Facility was amended, resulting in an increase in the borrowing base to $ 70.0 million. As of March 31, 2018, there was approximately $38.0 million outstanding under the CAE Credit Facility.
Sources and Uses of Cash
Our primary sources of liquidity and capital resources are operating cash flow and borrowings under our credit facilities. Our primary uses of funds are expenditures for acquisition, exploration and development activities, leasehold and property acquisitions, other capital expenditures and debt service.
Low prices for our oil and natural gas production may adversely impact our operating cash flow and amount of cash available for development activities.
| 41 |
The following table presents net cash provided by or used in operating, investing and financing activities for the three months ended March 31, 2018 and 2017.
| Three Months Ended | ||||||||
| March 31, | ||||||||
| (in thousands) | 2018 | 2017 | ||||||
| Net cash provided by operating activities | $ | 95 | $ | 894 | ||||
| Net cash used in investing activities | $ | (599 | ) | $ | (399 | ) | ||
| Net cash provided by (used in) financing activities | $ | 2,968 | $ | (723 | ) | |||
Net cash provided by or used in operating activities is primarily affected by production volumes and commodity prices, net of the effects of settlements of our derivative contracts, and changes in working capital. Operating cash flows decreased approximately $799,000 for the three months ended March 31, 2018 as compared to the same period in 2017. The decrease was primarily due to an increase in working capital and increased cash interest payments.
Net cash provided by or used in investing activities is primarily comprised of the acquisition, exploration and development of oil and natural gas properties, net of dispositions of oil and natural gas properties in addition to expenditures to fund our equity investment in Carbon Appalachia. Net cash used in investing activities increased approximately $200,000 for the three months ended March 31, 2018 as compared to the same period in 2017. We increased our capital expenditures for the development of properties and equipment in the three months ended March 31, 2018.
The increase in cash provided by financing cash flows of approximately $ 3.7 million for the three months ended March 31, 2018 as compared to the three months ended March 31, 2017 was primarily due to $3.0 million in proceeds from borrowings under our credit facilities and $1.0 million in payments on our credit facility for the three months ended March 31, 2017.
Capital Expenditures
Capital expenditures for the three months ended March 31, 2018 and 2017 are summarized in the following table:
| Three Months Ended March 31, | ||||||||
| (in thousands) | 2018 | 2017 | ||||||
| Unevaluated property acquisitions | $ | - | $ | - | ||||
| Drilling and development | 706 | 330 | ||||||
| Other | 167 | 66 | ||||||
| Total capital expenditures | $ | 873 | $ | 396 | ||||
Capital expenditures presented in the table above represent cash used for capital expenditures.
Due to low commodity prices in recent years, we have focused on the optimization and streamlining of our natural gas gathering and compression facilities and marketing arrangements to provide greater flexibility in moving production to markets with more favorable pricing. Other factors impacting the level of our capital expenditures include the cost and availability of oil field services, general economic and market conditions and weather disruptions.
Off-Balance Sheet Arrangements
From time-to-time, we enter into off-balance sheet arrangements and transactions that can give rise to off-balance sheet obligations. As of March 31, 2018, the off-balance sheet arrangements and transactions that we entered into included (i) operating lease agreements ,(ii) contractual obligations for which the ultimate settlement amounts are not fixed and determinable, such as natural gas transportation contracts, and (iii) oil and natural gas physical delivery contracts that are not expected to be net cash settled and are considered to be normal sales contracts and not derivatives. We do not believe that any of these arrangements are reasonably likely to materially affect our liquidity or availability of, or requirements for, capital resources.
| 42 |
Critical Accounting Policies, Estimates, Judgments, and Assumptions
Our critical accounting policies and estimates are set forth in “Part II. Item 7. Management’s Discussion and Analysis of Financial Condition and Results of Operations—Critical Accounting Policies, Estimates, Judgments, and Assumptions” in our 2017 Annual Report on Form 10-K. As of March 31, 2018, there have been no significant changes to our critical accounting policies and estimates since our 2017 Annual Report was filed other than those noted below.
Forward Looking Statements
The information in this Quarterly Report on Form 10-Q includes “forward-looking statements” within the meaning of Section 27A of the Securities Act of 1933, as amended, and Section 21E of the Securities Exchange Act of 1934, as amended. Forward-looking statements are statements other than statements of historical or present facts, that address activities, events, outcomes, and other matters that the Company plans, expects, intends, assumes, believes, budgets, predicts, forecasts, projects, estimates, or anticipates (and other similar expressions) will, should, or may occur in the future. Generally, the words “expects,” “anticipates,” “targets,” “goals,” “projects,” “intends,” “plans,” “believes,” “seeks,” “estimates,” “may,” “will,” “could,” “should,” “future,” “potential,” “continue,” variations of such words, and similar expressions identify forward-looking statements. These forward-looking statements are based on our current expectations and assumptions about future events and are based on currently available information as to the outcome and timing of future events.
These forward-looking statements appear in a number of places in this report and include statements with respect to, among other things:
| ● | estimates of our oil, natural gas liquids, and natural gas reserves; |
| ● | estimates of our future oil, natural gas liquids, and natural gas production, including estimates of any increases or decreases in our production; |
| ● | our future financial condition and results of operations and acquisitions; |
| ● | our future revenues, cash flows, and expenses; |
| ● | our access to capital and our anticipated liquidity; |
| ● | our future business strategy and other plans and objectives for future operations; |
| ● | our outlook on oil, natural gas liquids, and natural gas prices; |
| ● | the amount, nature, and timing of future capital expenditures, including future development costs; |
| ● | our ability to access the capital markets to fund capital and other expenditures; |
| ● | our assessment of our counterparty risk and the ability of our counterparties to perform their future obligations; and |
| ● | the impact of federal, state and local political, regulatory, and environmental developments in the United States of America |
| 43 |
We believe the expectations and forecasts reflected in our forward-looking statements are reasonable, but we can give no assurance that they will prove to be correct. We caution you that these forward-looking statements can be affected by inaccurate assumptions and are subject to all the risks and uncertainties, most of which are difficult to predict and many of which are beyond our control, incident to the exploration for and development, production, and sale of oil, natural gas liquids and natural gas. When considering forward-looking statements, you should keep in mind the risk factors and other cautionary statements described under the heading “Risk Factors” included in our 2017 Annual Report on Form 10-K.
Should one or more of the risks or uncertainties described above or elsewhere in this Form 10-Q occur, or should underlying assumptions prove incorrect, our actual results and plans could differ materially from those expressed in any forward-looking statements.
We caution you not to place undue reliance on these forward-looking statements, which speak only as of the date of this report, and we undertake no obligation to update this information to reflect events or circumstances after the filing of this report with the SEC, except as required by law. All forward-looking statements, expressed or implied, included in this Quarterly Report on Form 10-Q and attributable to us are expressly qualified in their entirety by this cautionary statement. This cautionary statement should also be considered in connection with any subsequent written or oral forward-looking statements that we may make or persons acting on our behalf may issue.
ITEM 3. Quantitative and Qualitative Disclosures About Market Risk
As a smaller reporting company, we are not required to provide the information otherwise required by this item.
ITEM 4. Controls and Procedures
Evaluation of disclosure controls and procedures.
We have established disclosure controls and procedures to ensure that material information relating to us and our consolidated subsidiaries is made known to the officers who certify our financial reports and the Board of Directors.
Our Chief Executive Officer, Patrick R. McDonald, and our Chief Financial Officer, Kevin D. Struzeski, evaluated the effectiveness of our disclosure controls and procedures, as defined in Rules 13a-15(e) and 15d-15(e) under the Exchange Act, as of the end of the period covered by this Quarterly Report on Form 10-Q (the “Evaluation Date”). Based on this evaluation, they believe that as of the Evaluation Date our disclosure controls and procedures were effective to ensure that information required to be disclosed by us in the reports we file or submit under the Exchange Act (i) is recorded, processed, summarized, and reported within the time periods specified in the SEC’s rules and forms; and (ii) is accumulated and communicated to our management, including the Chief Executive Officer and Chief Financial Officer, as appropriate, to allow timely decisions regarding required disclosures.
Changes in internal control over financial reporting. There were no changes in our internal control over financial reporting during the quarter ended March 31, 2018 that materially affected, or are reasonably likely to materially affect, our internal control over financial reporting.
| 44 |
PART II. OTHER INFORMATION
ITEM 1. Legal Proceedings
We are subject to legal claims and proceedings in the ordinary course of our business. Management believes that should the controversies be resolved against us, none of the current pending proceedings would have a material adverse effect on us.
ITEM 2. Unregistered Sales of Equity Securities and Use of Proceeds
All sales of unregistered equity securities that occurred during the period covered by this report, and through May 15, 2018, have been previously reported on a Current Report on Form 8-K.
ITEM 6. Exhibits
| * | Filed herewith |
| † | Not considered to be “filed” for purposes of Section 18 of the Securities Exchange Act of 1934 or otherwise subject to the liabilities of that section |
| 45 |
Pursuant to the requirements of the Securities Exchange Act of 1934, the registrant has duly caused this report to be signed on its behalf by the undersigned thereunto duly authorized.
| CARBON NATURAL GAS COMPANY | ||
| (Registrant) | ||
| Date: May 15, 2018 | By: | /s/ Patrick R. McDonald |
| PATRICK R. MCDONALD, | ||
| Chief Executive Officer | ||
| Date: May 15, 2018 | By: | /s/ Kevin D. Struzeski |
| KEVIN D. STRUZESKI | ||
| Chief Financial Officer | ||
46