Attached files
| file | filename |
|---|---|
| EX-99.1 - EX-99.1 - Yellow Corp | d581264dex991.htm |
| 8-K - 8-K - Yellow Corp | d581264d8k.htm |
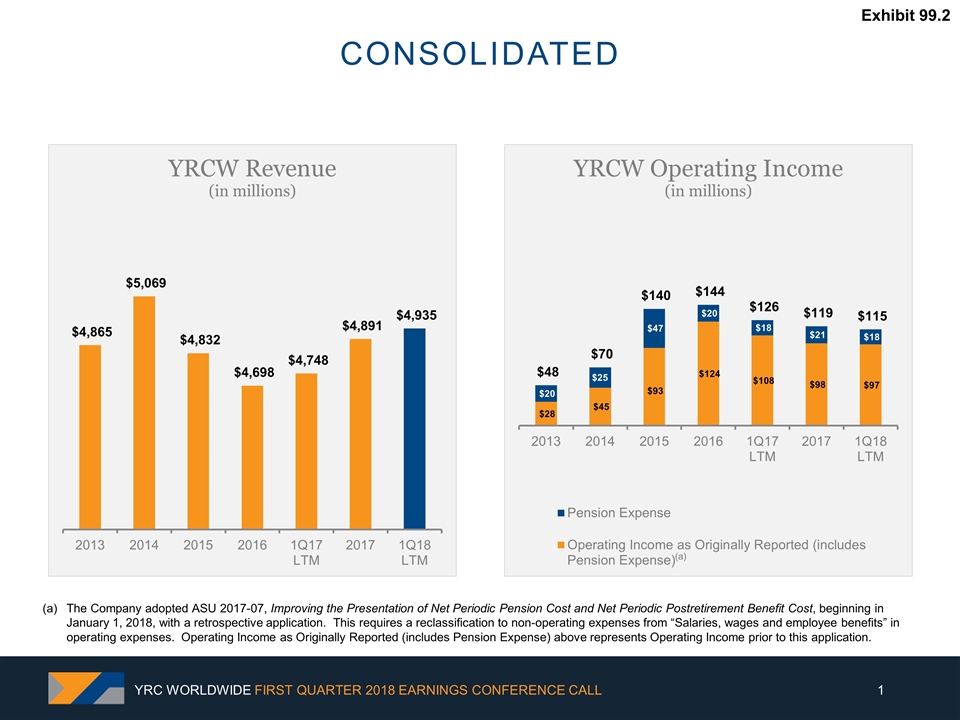
YRC WORLDWIDE FIRST QUARTER 2018 EARNINGS CONFERENCE CALL Consolidated (a) The Company adopted ASU 2017-07, Improving the Presentation of Net Periodic Pension Cost and Net Periodic Postretirement Benefit Cost, beginning in January 1, 2018, with a retrospective application. This requires a reclassification to non-operating expenses from “Salaries, wages and employee benefits” in operating expenses. Operating Income as Originally Reported (includes Pension Expense) above represents Operating Income prior to this application. Exhibit 99.2
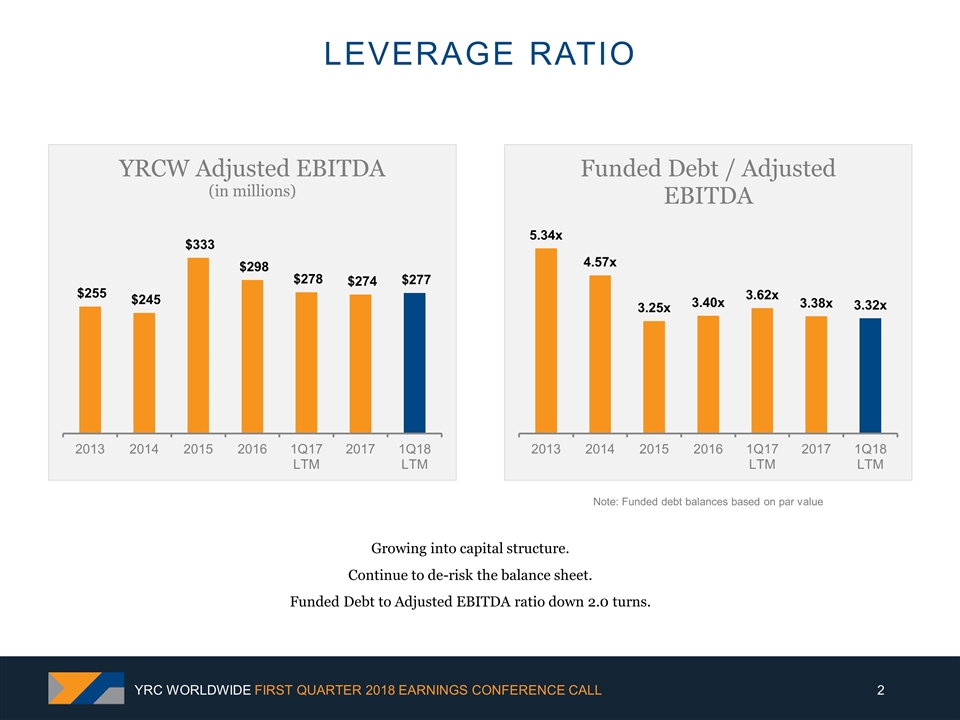
Growing into capital structure. Continue to de-risk the balance sheet. Funded Debt to Adjusted EBITDA ratio down 2.0 turns. Note: Funded debt balances based on par value Leverage ratio YRC WORLDWIDE FIRST QUARTER 2018 EARNINGS CONFERENCE CALL
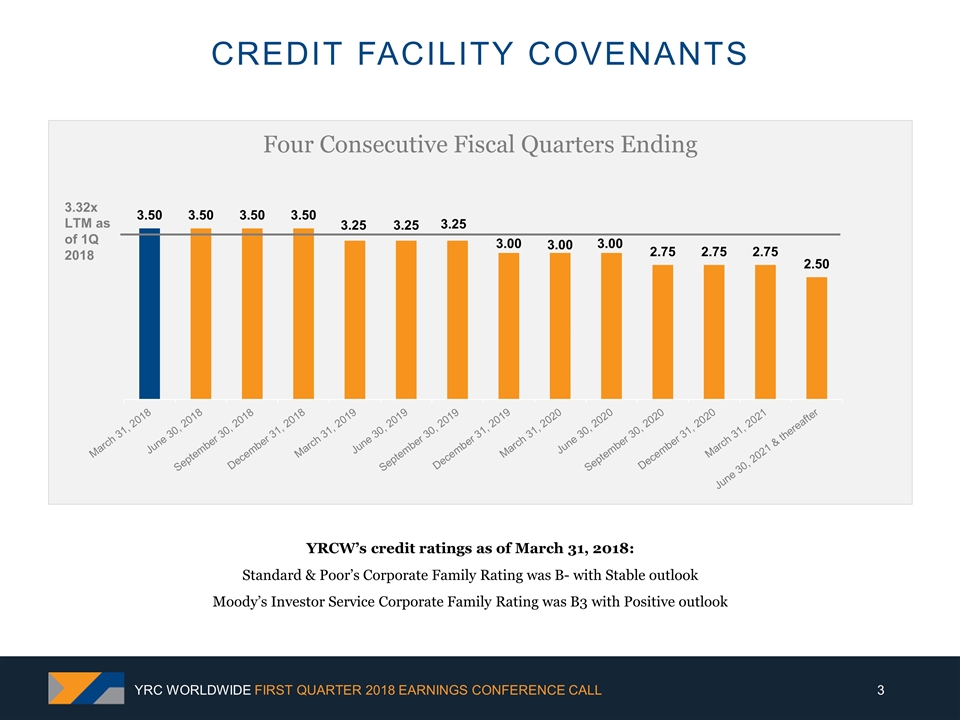
YRCW’s credit ratings as of March 31, 2018: Standard & Poor’s Corporate Family Rating was B- with Stable outlook Moody’s Investor Service Corporate Family Rating was B3 with Positive outlook 3.32x LTM as of 1Q 2018 Credit facility covenants YRC WORLDWIDE FIRST QUARTER 2018 EARNINGS CONFERENCE CALL
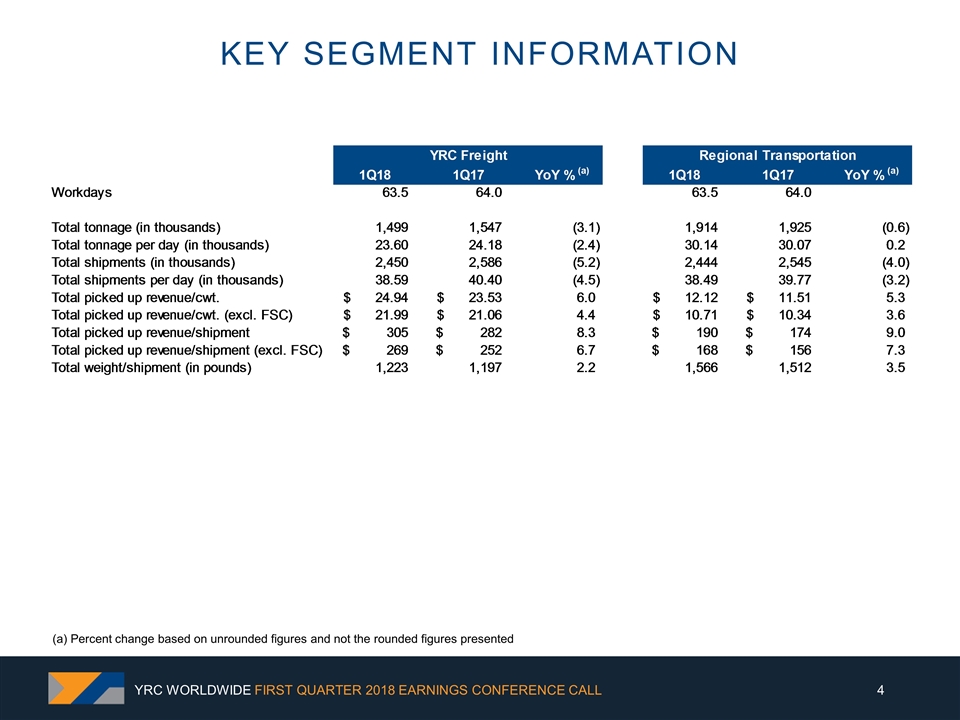
Key Segment Information (a) Percent change based on unrounded figures and not the rounded figures presented YRC WORLDWIDE FIRST QUARTER 2018 EARNINGS CONFERENCE CALL
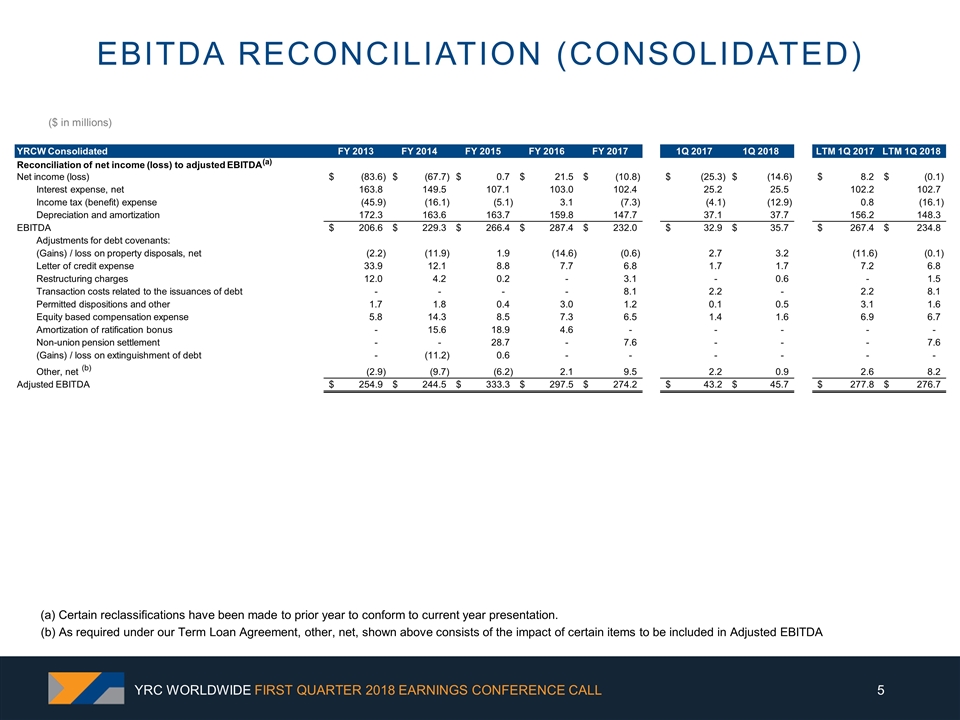
(b) As required under our Term Loan Agreement, other, net, shown above consists of the impact of certain items to be included in Adjusted EBITDA ($ in millions) Ebitda reconciliation (consolidated) YRC WORLDWIDE FIRST QUARTER 2018 EARNINGS CONFERENCE CALL YRCW Consolidated FY 2013 FY 2014 FY 2015 FY 2016 FY 2017 1Q 2017 1Q 2018 LTM 1Q 2017 LTM 1Q 2018 Reconciliation of net income (loss) to adjusted EBITDA Net income (loss) (83.6) $ (67.7) $ 0.7 $ 21.5 $ (10.8) $ (25.3) $ (14.6) $ 8.2 $ (0.1) $ Interest expense, net 163.8 149.5 107.1 103.0 102.4 25.2 25.5 102.2 102.7 Income tax (benefit) expense (45.9) (16.1) (5.1) 3.1 (7.3) (4.1) (12.9) 0.8 (16.1) Depreciation and amortization 172.3 163.6 163.7 159.8 147.7 37.1 37.7 156.2 148.3 EBITDA 206.6 $ 229.3 $ 266.4 $ 287.4 $ 232.0 $ 32.9 $ 35.7 $ 267.4 $ 234.8 $ Adjustments for debt covenants: (Gains) / loss on property disposals, net (2.2) (11.9) 1.9 (14.6) (0.6) 2.7 3.2 (11.6) (0.1) Letter of credit expense 33.9 12.1 8.8 7.7 6.8 1.7 1.7 7.2 6.8 Restructuring charges 12.0 4.2 0.2 - 3.1 - 0.6 - 1.5 Transaction costs related to the issuances of debt - - - - 8.1 2.2 - 2.2 8.1 Permitted dispositions and other 1.7 1.8 0.4 3.0 1.2 0.1 0.5 3.1 1.6 Equity based compensation expense 5.8 14.3 8.5 7.3 6.5 1.4 1.6 6.9 6.7 Amortization of ratification bonus - 15.6 18.9 4.6 - - - - - Non-union pension settlement - - 28.7 - 7.6 - - - 7.6 (Gains) / loss on extinguishment of debt - (11.2) 0.6 - - - - - - Other, net (b) (2.9) (9.7) (6.2) 2.1 9.5 2.2 0.9 2.6 8.2 Adjusted EBITDA 254.9 $ 244.5 $ 333.3 $ 297.5 $ 274.2 $ 43.2 $ 45.7 $ 277.8 $ 276.7 $ (a) (a) Certain reclassifications have been made to prior year to conform to current year presentation.
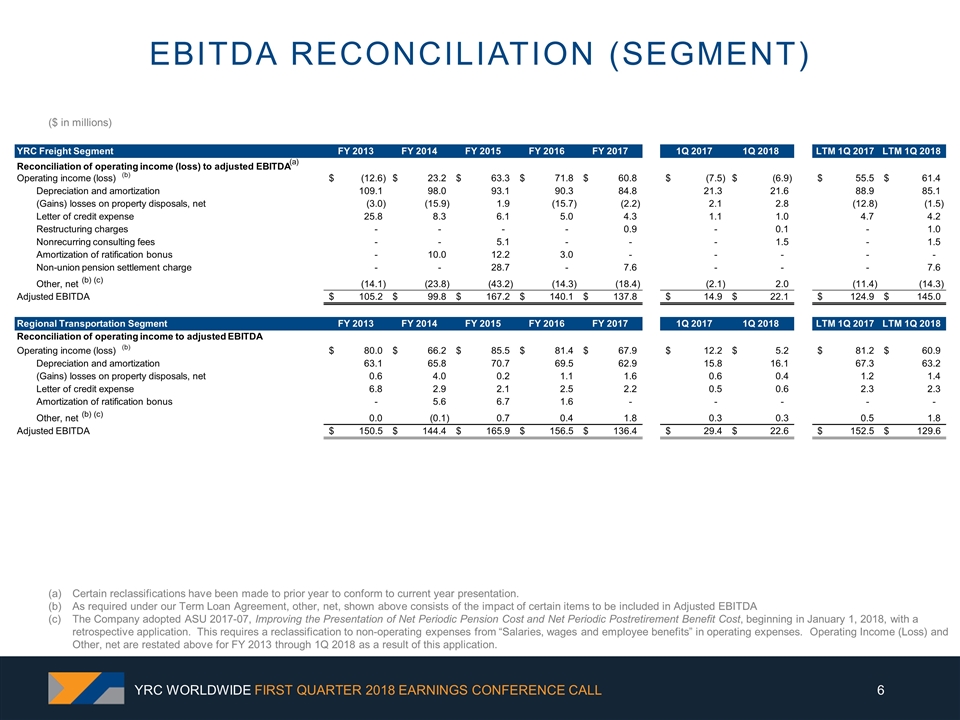
Certain reclassifications have been made to prior year to conform to current year presentation. As required under our Term Loan Agreement, other, net, shown above consists of the impact of certain items to be included in Adjusted EBITDA The Company adopted ASU 2017-07, Improving the Presentation of Net Periodic Pension Cost and Net Periodic Postretirement Benefit Cost, beginning in January 1, 2018, with a retrospective application. This requires a reclassification to non-operating expenses from “Salaries, wages and employee benefits” in operating expenses. Operating Income (Loss) and Other, net are restated above for FY 2013 through 1Q 2018 as a result of this application. ($ in millions) EBitda reconciliation (segment) YRC WORLDWIDE FIRST QUARTER 2018 EARNINGS CONFERENCE CALL YRC Freight Segment FY 2013 FY 2014 FY 2015 FY 2016 FY 2017 1Q 2017 1Q 2018 LTM 1Q 2017 LTM 1Q 2018 Reconciliation of operating income (loss) to adjusted EBITDA Operating income (loss) (b) (12.6) $ 23.2 $ 63.3 $ 71.8 $ 60.8 $ (7.5) $ (6.9) $ 55.5 $ 61.4 $ Depreciation and amortization 109.1 98.0 93.1 90.3 84.8 21.3 21.6 88.9 85.1 (Gains) losses on property disposals, net (3.0) (15.9) 1.9 (15.7) (2.2) 2.1 2.8 (12.8) (1.5) Letter of credit expense 25.8 8.3 6.1 5.0 4.3 1.1 1.0 4.7 4.2 Restructuring charges - - - - 0.9 - 0.1 - 1.0 Nonrecurring consulting fees - - 5.1 - - - 1.5 - 1.5 Amortization of ratification bonus - 10.0 12.2 3.0 - - - - - Non-union pension settlement charge - - 28.7 - 7.6 - - - 7.6 Other, net (b) (c) (14.1) (23.8) (43.2) (14.3) (18.4) (2.1) 2.0 (11.4) (14.3) Adjusted EBITDA 105.2 $ 99.8 $ 167.2 $ 140.1 $ 137.8 $ 14.9 $ 22.1 $ 124.9 $ 145.0 $ Regional Transportation Segment FY 2013 FY 2014 FY 2015 FY 2016 FY 2017 1Q 2017 1Q 2018 LTM 1Q 2017 LTM 1Q 2018 Reconciliation of operating income to adjusted EBITDA Operating income (loss) (b) 80.0 $ 66.2 $ 85.5 $ 81.4 $ 67.9 $ 12.2 $ 5.2 $ 81.2 $ 60.9 $ Depreciation and amortization 63.1 65.8 70.7 69.5 62.9 15.8 16.1 67.3 63.2 (Gains) losses on property disposals, net 0.6 4.0 0.2 1.1 1.6 0.6 0.4 1.2 1.4 Letter of credit expense 6.8 2.9 2.1 2.5 2.2 0.5 0.6 2.3 2.3 Amortization of ratification bonus - 5.6 6.7 1.6 - - - - - Other, net (b) (c) 0.0 (0.1) 0.7 0.4 1.8 0.3 0.3 0.5 1.8 Adjusted EBITDA 150.5 $ 144.4 $ 165.9 $ 156.5 $ 136.4 $ 29.4 $ 22.6 $ 152.5 $ 129.6 $ (a)
