Attached files
| file | filename |
|---|---|
| EX-31.2 - EX-31.2 - PetroShare Corp. | prhr-20171231ex312ca7792.htm |
| EX-99.1 - EX-99.1 - PetroShare Corp. | prhr-20171231ex991af4aec.htm |
| EX-32.1 - EX-32.1 - PetroShare Corp. | prhr-20171231ex32171c3b0.htm |
| EX-31.1 - EX-31.1 - PetroShare Corp. | prhr-20171231ex3110b20f0.htm |
| EX-23.1 - EX-23.1 - PetroShare Corp. | prhr-20171231ex231aa0f52.htm |
| EX-3.2 - EX-3.2 - PetroShare Corp. | prhr-20171231ex32e07e1d4.htm |
UNITED STATES
SECURITIES AND EXCHANGE COMMISSION
Washington, D.C. 20549
FORM 10‑K
|
☒ |
ANNUAL REPORT PURSUANT TO SECTION 13 OR 15(d) OF THE SECURITIES EXCHANGE ACT OF 1934 |
|
For the fiscal year ended: December 31, 2017 |
|
|
or |
|
|
☐ |
TRANSITION REPORT PURSUANT TO SECTION 13 OR 15(d) OF THE SECURITIES EXCHANGE ACT OF 1934 |
|
For the transition period from to |
|
Commission File Number 001‑37943

PETROSHARE CORP.
(Exact name of registrant as specified in its charter)
|
Colorado |
46‑1454523 |
9635 Maroon Circle, Suite 400
Englewood, Colorado 80112
(Address of principal executive offices) (Zip Code)
Registrant’s telephone number including area code: (303) 500‑1160
Securities registered pursuant to Section 12(b) of the Act: None
Securities registered pursuant to Section 12(g) of the Act: None
Indicate by check mark if the registrant is a well‑known seasoned issuer, as defined in Rule 405 of the Securities Act. Yes ☐ No ☒
Indicate by check mark if the registrant is not required to file reports pursuant to Section 13 or Section 15(d) of the Act. Yes☒ No ☐
Indicate by check mark whether the registrant (1) has filed all reports required to be filed by Section 13 or 15(d) of the Securities Exchange Act of 1934 during the preceding 12 months (or for such shorter period that the registrant was required to file such reports), and (2) has been subject to such filing requirements for the past 90 days. Yes ☐ No ☒
Indicate by check mark whether the registrant has submitted electronically and posted on its corporate Website, if any, every Interactive Data File required to be submitted and posted pursuant to Rule 405 of Regulation S‑T (§203.405 of this chapter) during the preceding 12 months (or for such shorter period that the registrant was required to submit and post such files). Yes ☒ No ☐
Indicate by check mark if disclosure of delinquent filers pursuant to Item 405 of Regulation S‑K (§229.405) is not contained herein, and will not be contained, to the best of the registrant’s knowledge, in definitive proxy or information statements incorporated by reference into Part III of this Form 10‑K or any amendment to this Form 10‑K. ☒
Indicate by check mark whether the registrant is a large accelerated filer, an accelerated filer, a non‑accelerated filer, a smaller reporting company or emerging growth company. See the definitions of “large accelerated filer,” “accelerated filer,” “smaller reporting company” and emerging growth company in Rule 12b‑2 of the Exchange Act.
|
Large accelerated filer ☐ |
Accelerated filer ☐ |
|
Non-accelerated filer ☐ (Do not check if a smaller reporting company) |
Smaller reporting company ⌧ |
|
|
Emerging growth company ⌧ |
If an emerging growth company, indicate by check mark if the registrant has elected not to use the extended transition period for complying with any new or revised financial accounting standards provided pursuant to Section 13(a) of the Exchange Act. ⌧
Indicate by check mark whether the registrant is a shell company (as defined in Rule 12b‑2 of the Act). Yes ☐ No ☒
As of June 30, 2017, the last business day of the registrant’s most recently completed second fiscal quarter, there were 13,142,637 shares outstanding and held by non‑affiliates of the registrant. The aggregate market value of those shares, based on the closing price of the Company’s common stock on the OTCQB on June 30, 2017, was $22,999,615.
On March 28, 2018, there were 27,788,802 shares of the Company’s common stock outstanding.
Documents incorporated by reference: None
ANNUAL REPORT ON FORM 10‑K
TABLE OF CONTENTS
ADDITIONAL INFORMATION
Descriptions of agreements or other documents in this report are intended as summaries and are not necessarily complete. Please refer to the agreements or other documents filed or incorporated herein by reference as exhibits. Please see the Exhibit Index at the end of this report for a complete list of those exhibits.
Cautionary Language Regarding Forward-Looking Statements
Please see Cautionary Language Regarding Forward‑Looking Statements on page 28 of this report for important information contained herein.
Glossary
Please see page 42 for a glossary of certain terms used in this report.
ITEMS 1. AND 2. BUSINESS AND PROPERTIES
Our History and Organization
PetroShare Corp. (“we,” “our,” “us” or the “Company”) is an independent oil and gas company incorporated under the laws of the State of Colorado on September 4, 2012 to investigate, acquire and develop crude oil and natural gas properties in the Rocky Mountain or mid-continent portion of the United States. Since 2016, our operational focus has been in the Wattenberg Field in the Denver-Julesburg Basin, or DJ Basin, in northeast Colorado. We believe the Wattenberg Field is one of the premier, liquids-rich oil and natural gas resource plays in the United States. It contains hydrocarbon-bearing deposits in several formations, including the Niobrara and Codell. The area has produced oil and natural gas since the 1970s and benefits from an established infrastructure and seasoned service providers.
All of our properties are located in Colorado. As of March 28, 2018, we had an interest in 94 gross (31.8 net) productive wells plus 11 gross (1.3 net) wells in the final stages of completion and 33,681 gross (9,770 net) acres of oil and gas properties. As of December 31, 2017, we were producing hydrocarbons at the rate of approximately 785 BOE/D. At December 31, 2017, we had an estimated 1,534.1 MBOE of proved developed reserves and 6,310.8 MBOE of proved undeveloped reserves.
Our strategy to date has been to focus on acquiring and developing crude oil and natural gas properties in those areas we consider as geo‑mechanical sweet spots, including the southern‑Wattenberg area of the DJ Basin, which we refer to as the Southern Core area. We elected to concentrate on the Southern Core due to the high quality of hydrocarbon‑bearing rock and the production from other, nearby wells. The Southern Core area contains the Niobrara and Codell geologic formations, which tend to yield oil‑weighted production that remains economic in lower commodity price environments.
During 2017, we drilled our first operated wells, located on our Shook Pad in northwest Adams County, for which we expect to initiate completion activities beginning in April 2018. In addition to the 14 wells on the Shook Pad operated by the Company, all of the other horizontal wells in which we have an interest as of March 28, 2018 are operated by independent third-parties. We maintain less than a 50% interest in all of these wells as we seek to diversify risk and minimize capital exposure to development, drilling and completion costs. In any drilling, we expect that our retained working interest will be determined based upon factors such as, level of interest ownership, well costs and geologic and engineering risk. See Item 7. Management’s Discussion and Analysis of Financial Condition and Results of Operations for more information.
Our executive and administrative offices are currently located at 9635 Maroon Circle, Suite 400, Englewood, Colorado 80112 and we maintain a website at www.petrosharecorp.com. We commenced filing reports under the Securities Exchange Act of 1934, as amended, or the Exchange Act, in February 2015, when we completed our initial public offering. You may access and read our public filings through the U.S. Securities and Exchange Commission’s, or the SEC’s, website at www.sec.gov and on our website.
Our Competitive Strengths
We believe we are well‑positioned to capitalize on current conditions in the oil and natural gas industry as a result of the following competitive strengths, in addition to the location of our properties.
1
Our Management
Our Chief Executive Officer, Stephen Foley, has over 16 years of experience as a real estate developer in Colorado, with an extensive background in surface development, including in the areas in which we have acquired acreage. Our President, Frederick Witsell, and Chief Operating Officer, William Lloyd, bring a long history and knowledge of basins in Colorado and depth of experience in the industry to our company. Mr. Witsell has over 37 years of experience in several facets of the oil and gas industry, including prospect development, conventional and horizontal drilling and completion operations, project management, gathering and compression systems and marketing and risk management. Mr. Lloyd also has over 37 years of experience in the industry, serving in engineering, management and senior leadership capacities. In addition to their experience, these individuals bring valuable relationships with other recognized industry participants which have, and we believe will continue to, provide opportunities to our company.
Our Strategic Partnerships
Through relationships cultivated by our executive officers, we have formalized agreements with business partners that have, and we believe will continue to, contribute significantly to our growth. Our relationships with real estate developers and other stakeholders in and around our focus areas, continue to yield leasing and surface access opportunities.
In May 2015, in connection with a credit agreement, we entered into a participation agreement with Providence Energy Operators, LLC (“PEO”). PEO is an affiliate of Providence Energy Corp., a privately‑held multi‑million dollar acquirer of oil and gas properties throughout the United States, and which currently owns and/or manages over two million net acres in 37 states with royalty or working interests in over 10,000 wells. As discussed elsewhere in this report, an affiliate of PEO is a major participant in our principal lender group through which we currently maintain a $25.0 million term credit facility, and PEO is the beneficial owner of 11.7% of our common stock currently outstanding. PEO and related entities could beneficially own up to 37% of our common stock after exercising certain conversion rights. The participation agreement grants PEO the option to acquire up to a 45% interest and participate in any oil and gas development on acreage we obtain within an area of mutual interest (AMI) near our Southern Core area. To date, PEO has exercised its option under the participation agreement or otherwise participated or agreed to participate in all of our acreage acquisitions.
We believe our relationship with PEO is instrumental to our success. In addition to providing funding for our acquisition and development strategy, the relationship provides us access to PEO’s oil and gas expertise. We believe our relationship with PEO is strong, as evidenced by its participation in our acreage acquisitions, our borrowing arrangement, and its holdings in our common stock.
Liquids-Weighted Reserves
Our net proved reserves at December 31, 2017 were comprised of approximately 67% oil and NGLs (collectively, liquids). Given the current commodity price environment and resulting disparity between oil and natural gas prices on a BOE basis, we believe our high percentage of liquid reserves and drilling program focused on oil-weighted projects, compared to our overall reserve base, is a key strength.
Multi-Year Drilling Inventory Targeting the Niobrara and Codell Formations
We believe nearby operator horizontal drilling activity and well results in and around our acreage have significantly mitigated the geologic risk in our drilling program. Our Todd Creek Farms and South Brighton prospects are located in an area where drilling results and the liquids-weighted nature of the assets allow for generating accretive returns even in a low commodity price environment. To date, we have identified up to 237 gross horizontal drilling
2
locations (up to 15.5 net wells) in our Todd Creek Farms and South Brighton Focus Areas which we are in the process of increasing our interests through acreage swaps and lease purchases. As of December 31, 2017, 94 of these locations have been designated proved undeveloped reserves by our third-party reserve engineer. We believe our multi-year drilling portfolio provides the potential for near-term growth in our production and reserves and highlights the long-term resource potential across our asset base.
Recent Developments
As discussed in more detail below, we drilled and cased 14 wells on our operated Shook pad during 2017. In March 2018, following successful negotiations to obtain access to gathering and pipeline facilities, we entered into an agreement to fracture treat all the wells on the Shook pad. The wells on the Shook pad targeted all three benches of the Niobrara plus the Codell sandstone formations. Pressure pumping equipment is scheduled to be on location on April 1, 2018 with all completion activities and production facilities expected to be finalized by mid-May. Subject to completion of the gathering pipeline by an independent third party, we expect these wells to be on full production by June 2018.
Non‑Operated Drilling Participation
Beginning in 2016 and continuing into 2017, we participated in the drilling and completion of 17 gross (2.9 net) horizontal wells in the Southern Core as a non-operator. All of these wells are being operated by operators with an established track record in the Wattenberg Field. Of the 17 gross wells, three were put in production in late 2016 and the 14 Jacobucci mid-range lateral wells were put on production in February and March 2017. Our participation in these wells provided us with the first significant revenue in our history, providing the vast majority of our fiscal 2017 revenue of $11.1 million.
We are also currently participating as a non-operator in 22 Codell and Niobrara horizontal wells in which we have a working interest ranging from 3.4% to 18.6%. These non-op horizontal wells are in various stage of flowback and clean-up after fracture stimulation or have been drilled and cased and are waiting on fracture treatment and final completion activities.
Credit Facility
In December 2017, we completed the first closing of $5.0 million of what ultimately became a $25.0 million Credit Facility, all of which was used to reduce our accounts payable or accrued liabilities. On February 1, 2018, we finalized a credit agreement with Providence Wattenberg Ltd., a Texas limited partnership and affiliate of PEO, and 5NR Wattenberg, LLC, a Texas limited liability company (collectively, the “Lenders”) pursuant to which the Lenders loaned us $25.0 million under a term credit facility. This facility allowed us to partially or fully repay certain lines of credit and extend a line of credit that was to mature in December 2017. The remaining capital is earmarked for pipeline construction, drilling and completion activities and additional working capital.
Capital Raises
During 2017, we completed two financings which provided approximately a net $11.8 million of working capital. In the two private financings, completed in January and October 2017, we sold convertible promissory notes with warrants, the proceeds of which allowed us to continue our drilling and other development activities during the year.
3
Oil and Gas Properties
DJ Basin and Wattenberg (Southern Core Area)
Our area of focus, the Southern Core area, is located within the Wattenberg Field, which is a part of the DJ Basin. Discovered in 1970, and historically a gas field, the Wattenberg Field, which covers more than 2,000 square miles, now produces both crude oil and natural gas primarily from the Niobrara and Codell formations. The DJ Basin generally extends from the Denver metropolitan area throughout northeast Colorado into parts of Wyoming, Nebraska, and Kansas. The majority of the DJ Basin lies in Weld County, but reaches into Adams, Arapahoe, Boulder, Broomfield, Denver, and Larimer Counties.
The Southern Core area covers areas in northwest Adams County and southwest Weld County. The Southern Core area saw significant development through vertical drilling in the preceding decades, but modern horizontal drilling is relatively new for the area. The “northern core Wattenberg,” located south of Greeley in west‑central Weld County, has been the primary focus of oil and gas producers for the past seven years. We believe the Southern Core area provides us compelling economics in even lower price environments.
The following map depicts our properties in the Southern Core
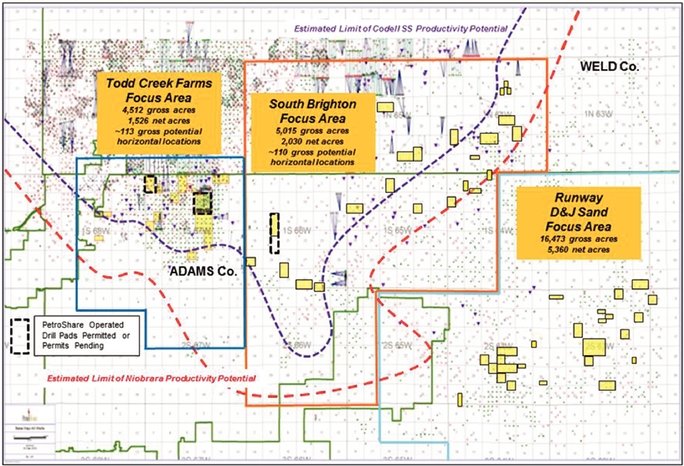
4
We currently possess an inventory of approximately 237 gross potential horizontal drilling locations within our Southern Core area including over 200 locations that are fully permitted or in the permitting stages. The remaining locations are potential infill wells located in and around current drilling spacing units established under applicable industry rules. We have not included certain of these potential horizontal drilling locations in our proved undeveloped or probable reserves because we have not yet established a development plan for those locations in accordance with SEC rules.
Todd Creek Farms
Within our Southern Core focus area, our primary prospect is Todd Creek Farms, which is located in northwest Adams County, Colorado. Our Shook pad, on which we have drilled and cased 14 wells, is located in the Todd Creek focus area. We have also permitted eights wells on the Corcillius pad located with this focus area, but we have no immediate plans in 2018 to commence drilling those wells.
Our working interest in the Shook pad wells averages approximately 42%. Since the final well was cased in August 2017, we have been negotiating pipeline and gathering access, and have identified and reached agreement with a suitable third party. Assuming completion of the pipeline and gathering line, and completion of fracture activities scheduled to commence in April 2018, we expect these 14 wells to be fully producing by June 2018, adding significantly to our revenue.
Our most significant non‑operated interest in the Todd Creek Farms focus areas is the Jacobucci pad. In connection with an acquisition in April 2016, we acquired the seller’s right to participate in this 14 mid‑range well program. Our working interest in these wells ranges from 8% to 27%, resulting in a net of 2.9 wells to our interest. These wells were completed in February and March 2017 and have been producing since that time. These wells provided the majority of our cash flow during 2017.
South Brighton
Our South Brighton Focus Area is east of our Todd Creek Farms prospect and sits in northern Adams County and southern Weld County. We acquired the majority of this acreage in 2016. We have leaseholds encompassing 5,807 (2,235 net) acres in the South Brighton Focus Area.
During 2017 and early 2018, we have assembled drill spacing units and made application for 100 gross extended length (2 mile) horizontal wells as the operator targeting the Niobrara and the Codell formations. Of that amount, eight pending permits are for our Brighton Lakes Pad.
Runway
Our Runway prospect area is east of Todd Creek Farms and South Brighton and lies principally within Adams County, Colorado east of the Denver International Airport. We have leaseholds encompassing 20,117 gross (5,240 net) acres in the Runway prospect.
Buck Peak
We divested of our interest in the Buck Peak prospect, located in Western Colorado in Moffat County, during 2017 and no longer hold any leaseholds in this area.
5
Productive Wells
The following table sets forth the number of productive oil and natural gas wells in which we owned a working interest as of March 28, 2018:
|
|
|
Productive Wells(1)(2) |
||||||||||
|
|
|
Crude Oil |
|
Natural Gas |
|
Total |
||||||
|
Location |
|
Gross |
|
Net |
|
Gross |
|
Net |
|
Gross |
|
Net |
|
Southern Core |
|
57 |
|
16 |
|
37 |
|
16 |
|
94 |
|
32 |
|
Total productive wells |
|
57 |
|
16 |
|
37 |
|
16 |
|
94 |
|
32 |
|
(1) |
Includes a total of 21 gross wells (2.9 net) in which we are participating as a non-operator. |
|
(2) |
Includes up to 33 gross wells that are currently or periodically shut-in. |
Developed and Undeveloped Acreage
The following table shows our developed and undeveloped acreage as of March 28, 2018:
|
|
|
|
|
|
|
Acreage |
|
|
|
|
||
|
|
|
Developed |
|
Undeveloped(1) |
|
Total |
||||||
|
Location |
|
Gross |
|
Net |
|
Gross |
|
Net |
|
Gross |
|
Net |
|
Todd Creek Farms |
|
2,570 |
|
990 |
|
1,351 |
|
425 |
|
3,921 |
|
1,415 |
|
South Brighton |
|
4,529 |
|
1,783 |
|
1,278 |
|
452 |
|
5,807 |
|
2,235 |
|
Northern Wattenberg |
|
80 |
|
32 |
|
3,756 |
|
848 |
|
3,836 |
|
880 |
|
Runway |
|
12,284 |
|
4,402 |
|
7,833 |
|
838 |
|
20,117 |
|
5,240 |
|
Total acreage |
|
19,463 |
|
7,207 |
|
14,218 |
|
2,563 |
|
33,681 |
|
9,770 |
Following industry standard, we generally acquire oil and gas leases without warranty of title, except as to claims made by, through, or under the transferor. Accordingly, we conduct due diligence as to title prior to acquiring properties, but we cannot guarantee that there will not be losses resulting from title defects. We obtain drilling title opinions and perform any necessary curative work prior to commencing drilling operations. We believe the leasehold title to our properties is good and defensible in accordance with industry standards, subject to such exceptions that, in our opinion, are not so material as to detract from the use or value of our properties. Title to our properties generally carry encumbrances, such as royalties, overriding royalties, contractual obligations, liens, easements, and other matters that commonly affect real property, all of which are customary in the oil and gas industry. We intend to acquire additional leases by lease sale, farm‑in, or purchase.
Leases that are held by production generally remain in force so long as the well on the particular lease is producing or capable of producing. Leased acres that are not held by production may require annual rental payments to maintain the lease until the expiration of the lease or the time oil or gas is produced from one or more wells drilled on the leased acreage. At the time the well begins producing or is capable of producing, the lease is considered to be held by production. Unless production is established within the area covering our undeveloped acreage, the leases for such acreage eventually will expire. Our leases which are not held by production are scheduled to expire, including potential extensions, from 2018 until 2022. If our leases expire in an area we intend to explore, we or our working interest
6
partners will have to negotiate the price and terms of lease renewals with the lessors. The cost to renew such leases may increase significantly and we may not be able to renew the lease on commercially reasonable terms, or at all
The following table shows the calendar years during which our leases not currently held by production will expire unless a productive oil or gas well is drilled:
|
Leased Acres |
|
Expiration of |
||
|
Gross |
|
Net |
|
Lease |
|
80 |
|
20 |
|
2018 |
|
4,378 |
|
1,153 |
|
2019 |
|
8,317 |
|
1,074 |
|
2020 |
|
1,123 |
|
156 |
|
2021 |
|
320 |
|
160 |
|
2022 |
Drilling Results
The following table sets forth information with respect to the number of wells either drilled by us or in which we participated as a non‑operator during the three years ended December 31, 2017. The information should not be considered indicative of future performance, nor should it be assumed that there is necessarily any correlation between the number of productive wells drilled, quantities of reserves found or economic value.
|
|
|
For the Year Ended December 31, |
||||||||||
|
|
|
2017(1) |
|
2016(2) |
|
2015 |
||||||
|
|
|
Gross |
|
Net |
|
Gross |
|
Net |
|
Gross |
|
Net |
|
Development Wells |
|
|
|
|
|
|
|
|
|
|
|
|
|
Productive |
|
36 |
|
7.6 |
|
17.0 |
|
2.9 |
|
— |
|
— |
|
Dry |
|
— |
|
— |
|
— |
|
— |
|
— |
|
— |
|
Exploratory Wells |
|
|
|
|
|
|
|
|
|
|
|
|
|
Productive |
|
— |
|
— |
|
— |
|
— |
|
— |
|
— |
|
Dry |
|
— |
|
— |
|
— |
|
— |
|
— |
|
— |
|
Total Wells |
|
|
|
|
|
|
|
|
|
|
|
|
|
Productive |
|
36 |
|
7.6 |
|
17.0 |
|
2.9 |
|
— |
|
— |
|
Dry |
|
— |
|
— |
|
— |
|
— |
|
— |
|
— |
|
(1) |
Includes 22 non-operated wells. |
|
(2) |
All non-operated wells. |
7
Sales Data
The following table shows the net sales volumes, average sales prices, and average production costs for the periods presented:
|
|
|
Year Ended December 31, |
||||
|
|
|
2017 |
|
2016 |
|
2015 |
|
Sales volumes |
|
|
|
|
|
|
|
Oil (Bbls) |
|
188,529 |
|
4,903 |
|
37 |
|
Gas (Mcf) |
|
549,846 |
|
26,059 |
|
— |
|
NGLs (Bbls) |
|
50,111 |
|
1,511 |
|
— |
|
BOE |
|
330,281 |
|
10,756 |
|
37 |
|
Average sales price |
|
|
|
|
|
|
|
Oil (per Bbl) |
$ |
46.25 |
$ |
48.91 |
$ |
36.29 |
|
Gas (per Mcf) |
$ |
2.78 |
$ |
2.62 |
$ |
— |
|
NGLs (per Bbl) |
$ |
17.20 |
$ |
16.55 |
$ |
— |
|
BOE |
$ |
33.63 |
$ |
30.97 |
$ |
36.29 |
|
Average production cost per BOE |
$ |
5.19 |
$ |
19.21 |
$ |
871.82 |
Oil, Natural Gas and NGL Data
Proved Reserves
Estimation of Proved Reserves
Under SEC rules, proved reserves are those quantities of oil, natural gas and NGL, which, by analysis of geoscience and engineering data, can be estimated with reasonable certainty to be economically producible—from a given date forward, from known reservoirs and under existing economic conditions, operating methods and government regulations—prior to the time at which contracts providing the right to operate expire, unless evidence indicates that renewal is reasonably certain, regardless of whether deterministic or probabilistic methods are used for the estimation. If deterministic methods are used, the SEC has defined reasonable certainty for proved reserves as a “high degree of confidence that the quantities will be recovered.” All of our proved reserves as of December 31, 2017 and 2016 were estimated using a deterministic method. The estimation of reserves involves two distinct determinations. The first determination results in the estimation of the quantities of recoverable oil and natural gas and the second determination results in the estimation of the uncertainty associated with those estimated quantities in accordance with the definitions established under SEC rules. The process of estimating the quantities of recoverable oil, natural gas and NGL reserves relies on the use of certain generally accepted analytical procedures. These analytical procedures fall into four broad categories or methods: (1) production performance‑based methods; (2) material balance‑based methods; (3) volumetric‑based methods; and (4) analogy. These methods may be used singularly or in combination by the reserve evaluator in the process of estimating the quantities of reserves. Reserves for proved developed producing wells were estimated using production performance methods for the vast majority of properties. Certain new producing properties with very little production history were forecast using a combination of production performance and analogy to similar production, both of which are considered to provide a relatively high degree of accuracy. Non‑producing reserve estimates, for developed and undeveloped properties, were forecast using either volumetric or analogy methods, or a combination of both. These methods provide a relatively high degree of accuracy for predicting proved developed non‑producing and proved undeveloped reserves for our properties, due to the mature nature of the properties targeted for development and an abundance of subsurface control data.
8
To estimate economically recoverable proved reserves and related future net cash flows Cawley Gillespie & Associates, Inc. (“Cawley Gillespie”) considered many factors and assumptions, including the use of reservoir parameters derived from geological and engineering data which cannot be measured directly, economic criteria based on current costs and the SEC pricing requirements and forecasts of future production rates.
Under SEC rules, reasonable certainty can be established using techniques that have been proven effective by actual production from projects in the same reservoir or an analogous reservoir or by other evidence using reliable technology that establishes reasonable certainty. Reliable technology is a grouping of one or more technologies (including computational methods) that has been field tested and has been demonstrated to provide reasonably certain results with consistency and repeatability in the formation being evaluated or in an analogous formation. To establish reasonable certainty with respect to our estimated proved reserves, the technologies and economic data used in the estimation of our proved reserves have been demonstrated to yield results with consistency and repeatability, and include production and well test data, downhole completion information, geologic data, electrical logs, radioactivity logs, core analyses, historical well cost and operating expense data.
Summary of Oil, Natural Gas and NGL Reserves
The table below presents summary information with respect to the estimates of our net proved oil and gas reserves at December 31, 2017, all of which are located in Colorado, based on a reserve report prepared by Cawley Gillespie.
|
|
|
|
|
|
|
Natural Gas |
|
|
|
|
|
Crude Oil |
|
Natural Gas |
|
Liquids |
|
|
|
(MBbls) |
(MMcf) |
(MBbls) |
MBOE |
|||||
|
Proved Developed Producing |
|
254.8 |
|
2,500.0 |
|
187.4 |
|
858.9 |
|
Proved Developed Non‑Producing |
|
266.5 |
|
1,252.4 |
|
200.0 |
|
675.2 |
|
Proved Undeveloped Reserves |
|
2,502.8 |
|
11,666.9 |
|
1,863.5 |
|
6,310.8 |
|
Total Proved Reserves |
|
3,024.1 |
|
15,419.3 |
|
2,250.9 |
|
7,844.9 |
At December 31, 2017, we had estimated total proved reserves of 7,844.9 MBOE, consisting of 3,024.1 MBbls of crude oil, 15,419.3 MMcf of natural gas, and 2,250.9 MBbls of natural gas liquids. Our proved reserves include only those amounts that we reasonably expect to recover in the future from known oil and gas reservoirs under existing economic and operating conditions, at current prices and costs, under existing regulatory practices, and with existing technology and anticipated capital resources. Accordingly, any changes in prices, operating and development costs, regulations, technology, or other factors could significantly increase or decrease estimates of our proved reserves. Estimates of volumes of proved reserves are presented in MBbls for crude oil and MMcf for natural gas at the official temperature and pressure basis of the areas in which the gas reserves are located.
Proved Undeveloped Reserves
At December 31, 2017, we had 6,310.8 MBOE of proved undeveloped reserves. We have included in our proved undeveloped reserves only those locations for which we have established a development plan and believe we can drill and complete within five years of the date of this report considering our existing and anticipated capital resources. We also have included certain non‑operated properties the operator of which has informed of us of planned development within the next five years and in which we have plans to participate.
9
The table below presents summary information with respect to the changes in our proved undeveloped reserves for the year ended December 31, 2017:
|
|
|
Total (MBOE) |
|
|
Total proved undeveloped reserves: |
|
|
|
|
Beginning of year |
|
|
5,567.8 |
|
Revisions of previous estimates |
|
|
35.8 |
|
Additions from discoveries, extensions and infill |
|
|
2,168.2 |
|
Sales of reserves |
|
|
— |
|
Purchases of minerals in place |
|
|
— |
|
Removed for five-year rule |
|
|
— |
|
Conversions to proved developed |
|
|
(1,461.0) |
|
End of year |
|
|
6,310.8 |
Independent Reserve Engineers
Our proved reserves estimate as of December 31, 2017, shown herein, has been independently prepared by Cawley Gillespie, which was founded in 1961 and performs consulting petroleum engineering services under Texas Board of Professional Engineers Registration No. F‑693. Zane Meekins was the technical person within Cawley Gillespie primarily responsible for preparing the estimates shown herein. Mr. Meekins has been practicing consulting petroleum engineering at Cawley Gillespie since 1989. Mr. Meekins is a Registered Professional Engineer in the State of Texas (License No. 71055) and has approximately 31 years of practical experience in petroleum engineering, with approximately 29 years in the estimation and evaluation of reserves. He graduated from Texas A&M University in 1987 with a B.S. in Petroleum Engineering. Mr. Meekins meets or exceeds the education, training, and experience requirements set forth in the Standards Pertaining to the Estimating and Auditing of Oil and Gas Reserves Information promulgated by the Society of Petroleum Engineers.
The report of Cawley Gillespie, dated March 7, 2018, which contains further discussions of the reserve estimates and evaluations prepared by Cawley Gillespie, as well as the qualifications of Cawley Gillespie’s technical personnel responsible for overseeing such estimates and evaluations, is attached as Exhibit 99.1 to this report.
Internal Controls Over Reserve Estimation Process
Our President, Frederick J. Witsell, and our Chief Operating Officer, William B. Lloyd, work closely with our independent reserve engineers to ensure the integrity, accuracy and timeliness of data furnished to our independent reserve engineers in their reserve estimation process and are the technical persons within our company primarily responsible for overseeing the preparation of our reserve estimates. Each of Mr. Witsell and Mr. Lloyd has over 37 years of industry experience. Both have evaluated numerous properties throughout the United States with an emphasis on Colorado oil and natural gas production, as well as conventional and unconventional reservoirs, operations, reservoir development and property evaluation. Mr. Witsell holds a B.S. in Geology, an M.B.A. in Energy Management, and is an active member in the Society of Petroleum Engineers, American Association of Petroleum Geologists, and the Rocky Mountain Association of Geologists. Mr. Lloyd holds a B.S. in Petroleum Engineering.
During relevant time periods, Mr. Witsell and Mr. Lloyd meet with representatives of our independent reserve engineers to review properties and discuss methods and assumptions used in preparation of the proved reserve estimates. We do not have a formal committee specifically designated to review our reserve reporting and our reserve estimation process. A preliminary copy of the reserve report was reviewed by Mr. Witsell with representatives of our independent reserve engineers and internal technical staff.
10
Regulatory Environment
The production and sale of oil and gas is subject to various federal, state, and local governmental regulations, which may be changed from time to time in response to economic or political conditions. Matters subject to regulation include discharge permits for drilling operations, drilling bonds, reports concerning operations, the spacing of wells, noise, unitization and pooling of properties, setbacks, the location and reclamation of piping, taxation and environmental protection. Many laws and regulations govern the location of wells, the method of drilling, casing and completing wells, the plugging and abandoning of wells, the restoration of properties upon which wells are drilled, temporary storage tank operations, air emissions from flaring, compression, the construction and use of access roads, and the disposal of fluids used in connection with operations. From time to time, regulatory agencies have imposed price controls and limitations on production by restricting the rate of flow of oil and gas wells below actual production capacity in order to conserve supplies of oil and gas. Changes in these regulations could have a material adverse effect on our company.
The failure to comply with any such laws and regulations can result in substantial penalties. In addition, the effect of all these laws and regulations may limit the amount of oil and gas we can produce from our wells and may limit the number of wells or the locations at which we can drill. Although we believe we are in substantial compliance with current applicable laws and regulations relating to our oil and natural gas operations, we are unable to predict the future cost or impact of complying with such laws and regulations because such laws and regulations are frequently amended or reinterpreted.
As an oil and gas operator, we are responsible for obtaining all permits and government permission necessary to drill the wells and develop our interests. We must obtain permits for any new well sites and wells that are drilled.
In February 2014, the Colorado Department of Public Health and Environment’s Air Quality Control Commission, or AQCC, finalized regulations imposing stringent new requirements relating to air emissions from oil and gas facilities in Colorado. The new rules impose significantly more stringent control, monitoring, recordkeeping, and reporting requirements than those required under comparable federal rules. In addition, as part of the rule, the AQCC approved the direct regulation of hydrocarbon (i.e., methane) emissions from the Colorado oil and gas sector.
On January 25, 2016, the Colorado Oil and Gas Conservation Commission, or COGCC, approved new rules enhancing local government participation in locating and planning for large scale oil and gas operations. The COGCC defined large scale facilities as (i) any location that proposes eight new horizontal, directional, or vertical wells, or (ii) cumulative hydrocarbon storage capacity of 4,000 Bbls or more, which are located within an urban mitigation area as defined by COGCC rules. The new COGCC rules also include additional notice and consultation requirements for operators when planning such large-scale facilities. As of December 31, 2017, only one non-operated multi-well horizontal drilling units would be subject to these new large-scale facilities regulations.
We currently own or lease numerous properties that have been used for the exploration and production of crude oil and natural gas for many years. If hydrocarbons or other wastes have been disposed of or released on or under the properties that we own or lease or on or under locations where such wastes have been taken for disposal by us or prior owners or operators of such properties, we could be subject to liability under the Comprehensive Environmental Response, Compensation and Liability Act, or CERCLA, the Federal Resource Conservation and Recovery Act, or RCRA and analogous state laws, as well as state laws governing the management of crude oil and natural gas wastes. CERCLA and similar state laws impose liability, without regard to fault or the legality of the original conduct, on certain classes of persons that are considered to have contributed to the release of a “hazardous substance” into the environment. These persons include the owner or operator of the disposal site or sites where the release occurred and companies that disposed of, transported, or arranged for the disposal of the hazardous substances found at the site. Persons who are or were responsible for release of hazardous substances under CERCLA may be subject to full liability for the costs of cleaning up the hazardous substances that have been released into the environment or remediation to prevent future
11
contamination and for damages to natural resources. Under state laws, it is not uncommon for neighboring landowners and other third parties to file claims for personal injury and property damage allegedly caused by the hazardous substances released into the environment.
In March 2017, the Colorado Court of Appeals held that Colorado oil and gas regulations require the COGCC to grant permits for new oil wells on the condition that requisite levels of environmental and public safety are met based on a determination by an independent third party. The Court of Appeals’ holding invalidates the COGCC’s prior balancing inquiry, which weighed interests in oil and gas development against environmental and public safety factors. The case has been remanded to the lower court for further findings. It remains unclear what impact this holding will have on the oil and gas industry.
Hydraulic Fracturing
We operate primarily in the Wattenberg Field of the DJ Basin where the rock formations are typically tight, and it is a common practice to utilize hydraulic fracturing to allow for or increase hydrocarbon production. Hydraulic fracturing involves the process of injecting substances such as water, sand and additives (some proprietary) under pressure into a targeted subsurface formation to create pores and fractures, thus creating a passageway for the release of oil and gas. Hydraulic fracturing is a technique that we intend to employ extensively in future wells that we may drill and complete.
We expect to outsource all hydraulic fracturing services to service providers with significant experience, and which we deem to be competent and responsible. Our service providers supply all personnel, equipment, and materials needed to perform each stimulation, including the chemical mixtures that might be injected into our wells. We require our service companies to carry insurance covering incidents that could occur in connection with their activities. In addition to the drilling permit that we are required to obtain and the notice of intent that we provide the appropriate regulatory authorities, our service providers are responsible for obtaining any regulatory permits necessary for them to perform their services in the relevant geographic location. We have not had any incidents, citations, or lawsuits relating to any environmental issues resulting from hydraulic fracturing, and we are not presently aware of any such matters.
In recent years, environmental opposition to hydraulic fracturing has increased, and various governmental and regulatory authorities have adopted or are considering new requirements for this process. To the extent that these requirements increase our costs or restrict our development activities, our business and prospects may be adversely affected.
The United States Environmental Protection Area, or EPA has asserted that the Safe Drinking Water Act (“SDWA”) applies to hydraulic fracturing involving diesel fuel, and in February 2014, it issued final guidance on this subject. The guidance defines the term “diesel fuel,” describes the permitting requirements that apply under SDWA for the underground injection of diesel fuel in hydraulic fracturing and makes recommendations for permit writers. Although the guidance applies only in those states, excluding Colorado, where the EPA directly implements the Underground Injection Control Class II program, it could encourage state regulatory authorities to adopt permitting and other requirements for hydraulic fracturing. In addition, from time to time, Congress has considered legislation that would provide for broader federal regulation of hydraulic fracturing under the SDWA. If such legislation were enacted, hydraulic fracturing operations could be required to meet additional federal permitting and financial assurance requirements, adhere to certain construction specifications, fulfill monitoring, reporting, and recordkeeping obligations, and provide for additional public disclosure of the chemicals used in the fracturing process.
The EPA is also conducting a nationwide study into the effects of hydraulic fracturing on drinking water. In June 2015, the EPA released a draft assessment of the potential impacts to drinking water resources from hydraulic fracturing for public comment and peer review. The assessment concluded that while there are mechanisms by which
12
hydraulic fracturing can impact drinking water resources, there was no evidence that these mechanisms have led to widespread, systemic impacts on drinking water resources in the United States. The EPA’s science advisory board subsequently questioned several elements and conclusions in the EPA’s draft assessment. In December 2016, the EPA released the final report on impacts from hydraulic fracturing activities on drinking water, concluding that hydraulic fracturing activities can impact drinking water resources under some circumstances and identified some factors that could influence these impacts.
Federal agencies have also adopted or are considering additional regulation of hydraulic fracturing. On March 26, 2016, the U.S. Occupational Safety and Health Administration (“OSHA”) issued a final rule, with effective dates of 2018 and 2021 for the hydraulic fracturing industry, which imposes stricter standards for worker exposure to silica, including worker exposure to sand in hydraulic fracturing. In May 2014, the EPA issued an advance notice of proposed rulemaking under the Toxic Substances Control Act (“TSCA”) to obtain data on chemical substances and mixtures used in hydraulic fracturing. In March 2015, the Bureau of Land Management (“BLM”) issued a new rule regulating hydraulic fracturing activities involving federal and tribal lands and minerals, including requirements for chemical disclosure, wellbore integrity and handling of flowback and produced water.
In Colorado, the primary regulator is the COGCC, which has adopted regulations regarding chemical disclosure, pressure monitoring, prior agency notice, emission reduction practices, and offset well setbacks with respect to hydraulic fracturing operations and may in the future adopt additional requirements for this purpose. As part of these requirements, operators must report all chemicals used in hydraulically fracturing a well to a publicly searchable registry website developed and maintained by the Ground Water Protection Council and the Interstate Oil and Gas Compact Commission.
Apart from these ongoing federal and state initiatives, local governments are adopting new requirements and restrictions on hydraulic fracturing and other oil and gas operations. Some local governments in Colorado, for instance, have amended their land use regulations to impose new requirements on oil and gas development, while other local governments have entered memoranda of agreement with oil and gas producers to accomplish the same objective. Beyond that, during the past few years, a total of five Colorado cities have passed initiatives temporarily or permanently prohibiting hydraulic fracturing. Since that time, however, local district courts have struck down the ordinances for certain of those Colorado cities, and such decisions were upheld by the Colorado Supreme Court in May 2016. Nevertheless, there is a continued risk that cities will adopt local ordinances that seek to regulate the time, place, and manner of hydraulic fracturing activities and oil and gas operations within their respective jurisdictions.
During 2014, opponents of hydraulic fracturing also sought statewide ballot initiatives that would have restricted oil and gas development in Colorado by, among other things, significantly increasing the setback between oil and natural gas wells and occupied buildings. These initiatives were withdrawn from the November 2014 ballot in return for the creation of a task force to craft recommendations for minimizing land use conflicts over the location of oil and natural gas facilities.
During 2016, opponents of hydraulic fracturing again advanced various options for ballot initiatives restricting oil and gas development in Colorado. Proponents of two such initiatives attempted to qualify the initiatives to appear on the ballot for the November 2016 election. One would have amended the Colorado constitution to impose a minimum distance of 2,500 feet between wells and any occupied structures or “areas of special concern.” If implemented, this proposal would have made the vast majority of the surface area of the state ineligible for drilling, including substantially all of our planned future drilling locations. The second proposal would have amended the state constitution to give local governmental authorities the ability to regulate, or to ban, oil and gas exploration, development, and production activities within their boundaries notwithstanding state rules and approvals to the contrary. If implemented, this proposal could have resulted in us becoming subject to onerous, and possibly inconsistent, regulations that vary from jurisdiction to jurisdiction, or to outright bans on our activities in various jurisdictions. Neither of these proposals ultimately appeared
13
on the ballot. However, similar proposals may be made in the future. Because all of our operations and reserves are located in Colorado, the risks we face with respect to such future proposals are greater than those of our competitors with more geographically diverse operations. Although we cannot predict the outcome of future ballot initiatives, statutes, or regulatory developments, such developments could materially impact our results of operations, production, and reserves.
Adams County USR Process
On March 22, 2016, the Adams County Board of County Commissioners approved amendments to the county’s oil and gas regulatory process, which ended a temporary drilling moratorium previously imposed. The new regulations include an enhanced administrative review process for operators that share a Memorandum of Understanding, or MOU, with Adams County, including a site‑specific review of any oil and gas permit application. The regulations also require compliance with the USR approval process for oil and gas facilities governed by an MOU between the operator and Adams County. This approval process includes increased notice and filing requirements. The USR process is designed to consist of a six‑week administrative review of the application by the county and appropriate agencies. The application can be approved, approved with conditions, denied or referred to the Board of County Commissioners for a public hearing. If denied, the applicant can appeal to the Board of County Commissioners.
In March 2016, we submitted a USR application for our Shook pad to Adams County, which was approved by the county in September 2016. The above newly‑enacted regulations in Adams County and any additional regulations that may result in the future may delay or prevent our drilling activities and increase our costs of development and production and limit the quantity of oil and gas that we can economically produce.
Joint Operating Agreements
We are registered with the COGCC as an operator of oil and natural gas wells and properties in the State of Colorado and have posted the appropriate bonds to support our activities. We have entered into operating agreements with our working interest partners that stipulate, among other things, that each partner is responsible for paying its proportionate share of costs and expenses in connection with the wells we operate. As operator, we are an independent contractor not subject to the control or direction of our other working interest partners except as to the type of operation to be undertaken as provided in the operating agreement. Further, we are responsible for hiring employees or contractors to conduct operations, taking custody of funds for the account of all working interest partners, keeping books and records relating to operations, and filing operational notices, reports or applications required to be filed with governmental bodies having jurisdiction over operations. Our liability to the other working interest partners for losses sustained or liabilities incurred are limited to losses incurred as a result of our gross negligence or willful misconduct.
Competition
We encounter significant competition from numerous other oil and gas companies in all areas of operations, including drilling and marketing oil and natural gas; obtaining desirable oil and natural gas leases; obtaining drilling, pumping and other services; attracting and retaining qualified employees; and obtaining capital. International developments may influence other companies to increase their domestic crude oil and natural gas exploration. Competition among companies for favorable prospects can be expected to continue and we anticipate that the cost of acquiring properties will increase in the future. Most of our competitors possess larger staffs and greater financial resources than we do, which may enable them to identify and acquire desirable producing properties and drilling prospects more economically and to attract more capital. Our ability to acquire additional properties and to explore for oil and natural gas prospects in the future depends upon our ability to conduct our operations, raise capital, evaluate and select suitable properties, and consummate transactions in this highly competitive environment.
14
The oil and gas industry is characterized by rapid and significant technological advancements and introduction of new products and services using new technologies. If one or more of the technologies we use now or in the future become obsolete or if we are unable to use the most advanced commercially available technology, our business, financial condition, results of operations and cash flows could be materially adversely affected.
Market for Our Products
Currently, all of our produced oil and gas is sold under a variety of month-to-month contracts with local marketing companies. We have no long‑term marketing contract commitments at this time. The availability of a ready market for our oil and gas depends upon numerous factors beyond our control, including the extent of domestic production and importation of oil and gas, the relative status of the domestic and international economies, the proximity of our properties to gas pipeline systems, the capacity of those systems, the marketing of other competitive fuels, fluctuations in seasonal demand, and governmental regulation of production, refining, transportation, and pricing of oil, gas, and other fuels.
Employees
We currently have 12 employees, including our Chief Executive Officer, President, Chief Operating Officer, and Chief Financial Officer. We also engage a number of independent contractors and consultants to supplement the services of our employees, including land services, geologic mapping, reservoir and facilities engineers, drilling contractors, attorneys, and accountants.
Company Facilities
Our executive and administrative offices are currently located at 9635 Maroon Circle, Suite 400, Englewood, Colorado 80112, where we lease approximately 5,282 square feet at a rate of $10,894 per month.
This report, including Management’s Discussion and Analysis of Financial Condition and Results of Operations, contains forward‑looking statements that may be affected by several risk factors. The following information summarizes the material risks known to us as of the date of filing this report:
Risks Relating To Our Company
Since we are a new business with a limited operating history, investors have no basis to evaluate our ability to operate profitability.
We were incorporated in September 2012 and our activities to date have been limited to organizational efforts, raising capital, developing our business plan, assembling an initial lease inventory, participating as a non‑operator in several drilling programs and limited drilling efforts. We face all of the risks commonly encountered by other new businesses, including the lack of an established operating history, need for additional capital and personnel, and competition. Our business may not be successful, or we may never operate profitably. We may not be able to effectively manage the demands required of a new business in our industry, such that we may be unable to successfully implement our business plan or achieve profitability.
15
As described in the notes to our consolidated financial statements, there is substantial doubt about our ability to continue as a going concern and we are dependent on receipt of additional capital to fund our obligations and to continue development of our business plan.
The uncertainty regarding our ability to continue as a going concern is based on our substantial near-term liabilities, limited revenue and cash flow and negative working capital, among other things which existed as of December 31, 2017. At December 31, 2017, we had a cash balance of approximately $0.7 million and other current assets of approximately $2.7 million. In June 2018, we are obligated to repay approximately $2.1 million in principal plus accrued interest on our supplemental line of credit and we are obligated to pay approximately $9.6 million in principal plus accrued interest on our outstanding convertible promissory notes in December 2018. We also will incur additional expenses related to our operated drilling program on our Shook pad during the second and third quarters of this year. We had net losses, including non-cash charges, of approximately $10.8 million and $4.5 million during the years ended December 31, 2017 and 2016, respectively.
Our ability to continue as a going concern depends on the success of our current drilling efforts, future exploration and development efforts, our ability to generate revenue sufficient to cover our costs and expenses and receipt of additional capital. In addition to funds required for the satisfaction of existing obligations and development of our existing acreage, we will require capital to acquire and develop additional acreage as well as pay our administrative expenses, including salary and rent. In the event we are unable to obtain adequate funding from our ongoing drilling efforts, both operated and non-operated, and through the sale of debt or equity securities, we may have to delay, reduce or eliminate certain of our planned operations, reduce overall overhead expense, or divest assets. This in turn may have an adverse effect on our ability to realize the value of our assets. If we are unable to continue as a going concern, you may lose all or part of your investment.
Our use of debt financing could have a material adverse effect on our financial condition.
We are subject to the risks normally associated with debt financing, including the risk that our cash flow will be insufficient to meet required principal and interest payments and the long‑term risk that we will be unable to refinance our existing indebtedness, or that the terms of such refinancing will not be as favorable as the terms of existing indebtedness. If our debt cannot be paid, refinanced or extended, we may be required to divest our assets or file for bankruptcy. Further, if prevailing interest rates or other factors at the time of a refinancing result in higher interest rates or other restrictive financial covenants, then such refinancing would adversely affect our cash flow and funds available for operation and development of our assets and properties.
We are also subject to financial covenants under our existing debt instruments. These covenants generally require us to satisfy certain financial ratios related to our oil and gas reserves and debt to earnings, and prohibit us without the lenders’ consent from, among other things, incurring additional indebtedness or making loans to any third party, other than trade debt incurred in the ordinary course of business or selling, leasing, or otherwise disposing of any material amount of assets. Failure to comply with these covenants could result in a default which, if we were unable to obtain a waiver from our lenders, could accelerate our repayment obligations under the lines of credit and thereby have a material adverse impact on our liquidity, financial condition, and ability to remain in business. We would also likely be unable to borrow any further amounts under our other debt instruments, which could adversely affect our ability to fund operations.
We are highly leveraged and any default by us may cause us to forfeit all or a portion of our properties.
As of December 31, 2017, we had outstanding debt in excess of $23.1 million, approximately $18.1 million of which is due 2018. If we are unable to repay any of this debt on a timely basis, we may be forced to forfeit all or a portion of our properties.
16
Of the total debt outstanding at December 31, 2017, approximately $13.6 million is secured by liens on our property. Of that amount, $2.1 million under the supplemental line of credit is due in June 2018. All of our convertible notes, approximately $9.6 million are due in December 2018. Our ability to repay our supplemental line of credit and convertible notes payable is dependent on our ability to generate sufficient revenue from operations or obtain cash from other sources. If we are unable to repay the short-term indebtedness or default under our other indebtedness, the lenders may foreclose on our assets. As a result, we may not be able to develop as much property as we presently expect.
Our estimates of oil and gas reserves involve inherent uncertainty, which could materially affect the quantity and value of our reported reserves and our financial condition.
There are numerous uncertainties inherent in estimating quantities of proved oil and gas reserves and cash flows attributable to such unconventional resource reserves, including factors beyond our reserve engineers’ control. Reserve engineering is a subjective process of estimating underground accumulations of oil and gas that cannot be measured in an exact manner. The accuracy of an estimate of quantities of reserves, or of cash flows attributable to such reserves, is a function of the available data, assumptions regarding future oil and gas prices, expenditures for future development and exploration activities, engineering and geological interpretations and judgment. In addition, accurately estimating reserves in unconventional resources such as the shale and tight sand formations, of the Niobrara and Codell, can be even more difficult than estimating reserves in more traditional hydrocarbon‑bearing formations given the complexities of the projected decline curves and economics of unconventional oil and gas resource wells.
As such, investors should not place undue reliance on these estimates contained in this report. Reserves and future cash flows may be subject to material downward or upward revisions, based upon production history, development and exploration activities and prices of oil and gas. In addition, different reserve engineers may make different estimates of reserves and cash flows based on the same available data. Due to our smaller volume of reserves compared to our competitors, revisions in reserve estimates and future cash flows have a greater chance of being material to us.
Oil and gas wells are depleting assets and our failure or inability to reinvest in additional wells will lead to reduced production.
Our ability to invest additional amounts in new wells and additional acreage is a function of the availability of capital. If we are unable to obtain that capital in amounts sufficient to allow for additional investment, our existing and contemplated production will eventually diminish. This may lead to a drop in the price of our stock, and investors may lose all or part of their investment.
Our Southern Core area assets may be less valuable to us than expected.
We have made several oil and gas acquisitions in the Southern Core area since January 1, 2016. Much of the acreage is within our Southern Core focus areas, while the remainder of the acreage is located in outlying areas of Adams, Weld and Broomfield Counties and is prospective for formations other than the Niobrara and Codell. The value of our Southern Core area assets is based in large part on our ability to develop the properties and increase proven and probable reserves. This, in turn, requires us to make accurate estimates of our capital needs to implement and continue a development program for those properties, to obtain that capital and to successfully drill the wells. We may not be able to obtain the capital necessary to develop these properties or our development efforts may not be successful. If we are unable to obtain the necessary capital or successfully develop these properties, the price of our stock may decline, and investors may lose some of their investment.
17
We have limited control over activities on properties we do not operate.
Our ability to exercise influence over the operations of the properties which we do not operate, or their associated costs, is limited. Our dependence on the operators and other working interest owners of these projects and any future projects, our limited ability to influence operations and associated costs or control the risks, and our access to required capital could materially and adversely affect the realization of our targeted returns on capital in drilling or acquisition activities. The success and timing of our drilling and development activities on properties operated by others therefore depends upon a number of factors, including:
|
· |
timing and amount of capital expenditures; |
|
· |
the operator’s expertise and financial resources; |
|
· |
the rate of production of reserves, if any; |
|
· |
approval of other participants in drilling wells; and |
|
· |
selection of technology. |
As a result, our ability to exercise influence over the operations of some of our current or future properties is and may be limited.
The due diligence undertaken by us in connection with recent acquisitions may not have revealed all relevant considerations or liabilities related to those assets, which could have a material adverse effect on our financial condition or results of operations.
The due diligence undertaken by us in connection with the acquisition of our properties may not have revealed all relevant facts that may be necessary to evaluate such acquisitions. The information provided to us in connection with our diligence may have been incomplete or inaccurate. As part of the diligence process, we have also made subjective judgments regarding the results of operations and prospects of the assets. If the due diligence investigations have failed to correctly identify material issues and liabilities that may be present, such as title defects or environmental problems, we may incur substantial impairment charges or other losses in the future. In addition, we may be subject to significant, previously undisclosed liabilities that were not identified during the due diligence processes and which may have a material adverse effect on our financial condition or results of operations.
We have granted PEO and its affiliate the option to participate in certain of our acreage acquisitions.
On May 13, 2015, we entered into a participation agreement with PEO which has been amended on two subsequent occasions. Under the terms of the original participation agreement, we assigned an undivided 50% interest to our right, title and interest in and to our then existing leases in our Todd Creek Farms prospect and granted PEO the right to acquire up to 50% of other acquisitions within an area of mutual interest, or AMI. The Participation Agreement was subsequently amended to provide an option to another affiliate of PEO, potentially reducing our retained interest in any properties to 45%. The AMI covers all of our Southern Core area and part of our other properties. To date, PEO has exercised its option to participate in all of our acreage acquisitions.
We have limited management and staff and are dependent upon partnering arrangements and third‑party service providers.
We currently have 12 employees, including our Chief Executive Officer, President, Chief Financial Officer and Chief Operating Officer. The loss of any of these individuals would have an adverse effect on our business, as we have
18
very limited personnel. We leverage the services of other independent consultants and contractors to perform various professional services, including engineering, oil and gas well planning and supervision, and land, legal, environmental and tax services. We also pursue alliances with partners in the areas of geological and geophysical services and prospect generation, evaluation and prospect leasing. Our dependence on third‑party consultants and service providers create a number of risks, including but not limited to:
|
· |
the possibility that such third parties may not be available to us as and when needed; and |
|
· |
the risk that we may not be able to properly control the timing and quality of work conducted with respect to its projects. |
If we experience significant delays in obtaining the services of such third parties or they perform poorly, our results of operations and stock price could be materially adversely affected.
Competition in the oil and natural gas industry is intense and many of our competitors have resources that are substantially greater than ours.
Our industry is intensely competitive, and we compete with other companies that have greater resources. Many of these companies not only explore for and produce oil, natural gas and NGLs, but also purchase and transport hydrocarbons, carry on refining operations and market petroleum and other products on a regional, national or worldwide basis. These companies are able to attract more capital and pay more for productive properties and exploratory prospects or define, evaluate, bid for and purchase a greater number of properties and prospects than we can. Our ability to acquire additional properties and to discover reserves in the future will be dependent upon our ability to raise capital and evaluate and select suitable properties and to consummate transactions in a highly competitive environment. In addition, larger companies have a greater ability to continue exploration activities during periods of low commodity prices. Larger competitors are also able to absorb the burden of present and future federal, state, local and other laws and regulations more easily than we can, which could adversely affect our competitive position. These factors could adversely affect the success of our operations and our profitability.
We are concentrated in one geographic area, which increases our exposure to many of the risks enumerated herein.
Operating in a concentrated area increases the potential impact that many of the risks stated herein may have upon our ability to perform. For example, we have greater exposure to regulatory actions impacting Colorado, natural disasters in the geographic area, competition for equipment, services and materials available in the area and access to infrastructure and markets. In addition, the effect of fluctuations on supply and demand may become more pronounced within specific geographic oil and gas producing areas such as the DJ Basin, which may cause these conditions to occur with greater frequency or magnify the effect of these conditions. Due to the concentrated nature of our portfolio of properties, a number of our properties could experience any of the same conditions at the same time, resulting in a relatively greater impact on our results of operations than they might have on other companies that have a more diversified portfolio of properties. Such delays or interruptions could have a material adverse effect on our financial condition and results of operations.
Our ability to sell any production and/or receive market prices for our production may be adversely affected by a lack of transportation, capacity constraints and interruptions.
The marketability of any production from any of our properties depends in part upon the availability, proximity and capacity of third‑party refineries, natural gas gathering systems and processing facilities. We expect to deliver much of the oil and natural gas produced from our properties through pipelines that we do not own. The availability of delivery capacity in these pipelines is in part dependent on the market price for oil and natural gas, as higher prices will attract
19
additional production, which in turn will take up capacity in these systems. The lack of availability or capacity of these systems and facilities could reduce the price offered for any production or result in the shut‑in of producing wells or the delay or discontinuance of development plans for properties.
We are not required to obtain an opinion from our independent registered public accounting firm on the effectiveness of our internal controls over financial reporting under Section 404(b) of the Sarbanes‑Oxley Act of 2002 until we are no longer an emerging growth company.
For so long as we remain an emerging growth company as defined in the JOBS Act, we intend to take advantage of certain exemptions from various reporting requirements that are applicable to public companies that are not emerging growth companies, including, but not limited to, not being required to obtain the auditor attestation of our assessment of our internal controls. Once we are no longer an emerging growth company or, if prior to such date, we opt to no longer take advantage of the applicable exemption, we will be required to include an opinion from our independent registered public accounting firm on the effectiveness of our internal controls over financial reporting. We will remain an “emerging growth company” until the earliest to occur of (1) the last day of the fiscal year during which our total annual revenues equal or exceed $1.0 billion (subject to adjustment for inflation), (2) the last day of the fiscal year during which occurs the fifth anniversary of our initial public offering, (3) the date on which we have, during the previous three‑year period, issued more than $1.0 billion in non‑convertible debt, or (4) the date on which we are deemed a “large accelerated filer” under the Securities Exchange Act of 1934, as amended, or the Exchange Act. Once we are no longer an emerging growth company, compliance with Section 404(b) will be costly.
Colorado law and our Articles of Incorporation may protect our directors from certain types of lawsuits at the expense of the shareholders.
The laws of the State of Colorado provide that directors of a corporation shall not be liable to the corporation or its shareholders for monetary damages for all but limited types of conduct. Our Articles of Incorporation permit us to indemnify our directors and officers against all damages incurred in connection with our business to the fullest extent provided or allowed by law. The exculpation provisions may have the effect of preventing shareholders from recovering damages against our directors caused by their negligence, poor judgment or other circumstances.
Risks Relating to the Energy Production and/or Distribution Industry
Oil and natural gas exploration and development are affected by fluctuations in oil and natural gas prices, and low prices could have a material adverse effect on the future of our business.
In addition to our efforts to raise capital, our future success will depend largely on the prices received for any oil or natural gas production. Prices received also will affect the amount of future cash flow available for capital expenditures and may affect the ability to raise additional capital. Lower prices affect the amount of oil and natural gas that can be commercially produced from reserves either discovered or acquired. Lower prices may also make it uneconomical to drill in certain areas.
The prices for oil and natural gas have been volatile since 2014, with a high over $100.00 per barrel in June 2014 and to lows below $30.00 per barrel in 2016 based on West Texas Intermediate (WTI) Crude Oil, as quoted on NYMEX. Prices for natural gas have also been volatile. On March 27, 2018, the price of WTI was $65.25 per barrel and Henry Hub Natural gas was $2.69 per MMBtu.
Our revenue, results of operation, cash flows, liquidity and reserve estimates depend to a large part on the price
of oil and gas. Factors that can cause price fluctuations include:
|
· |
the level of consumer product demand; |
20
|
· |
the domestic and foreign supply of oil and natural gas; |
|
· |
consumer perception and the availability of alternative energy sources; |
|
· |
refinery capacity; |
|
· |
domestic and foreign governmental regulations; |
|
· |
actions by other producers, including the Organization of the Petroleum Exporting Countries (OPEC); |
|
· |
political and ethnic conflicts in oil and natural gas producing regions; |
|
· |
the price of foreign imports; and |
|
· |
overall economic conditions. |
If we do not hedge our exposure to reductions in oil and natural gas prices, we may be subject to significant reductions in price. Alternatively, we may use oil and natural gas price hedging contracts, which involve credit risk and may limit future revenues from price increases and result in significant fluctuations in our profitability.
We may use hedging transactions with respect to a portion of our oil and natural gas production to achieve more predictable cash flow and to reduce our exposure to price fluctuations. While the use of hedging transactions limits the downside risk of price declines, their use also may limit future revenues from price increases. Hedging transactions also involve the risk that the counterparty may be unable to satisfy its obligations. Alternatively, in the event that we choose not to hedge, our exposure to reductions in oil and natural gas prices by purchasing futures and by using other hedging strategies, we may be subject to significant reduction in prices which could have a material negative impact on our profitability.
We identified locations scheduled to be drilled over several years, making them susceptible to uncertainties that could materially alter the occurrence or timing of their drilling.
Our management team has identified drilling locations in our operating areas scheduled over a multi‑year period. Our ability to drill and develop these locations depends on a number of factors, including the availability of equipment and capital, approval by regulators, seasonal conditions, oil and natural gas prices, assessment of risks, costs and drilling results. The final determination on whether to drill any of these locations will be dependent upon the factors described elsewhere in this report as well as, to some degree, the results of our drilling activities with respect to our established drilling locations. Due to these uncertainties, we do not know if the drilling locations we have identified will be drilled within our expected timeframe or at all. Our actual drilling activities may be materially different from our current expectations, which could adversely affect our business, financial condition and results of operations.
We may face difficulties in securing and operating under authorizations and permits to drill, complete or operate our wells.
Oil and gas exploration in the United States has drawn intense scrutiny from environmental and community interest groups, regulatory agencies and other governmental entities. As a result, we may face significant opposition to, or increased regulation of, our operations that may make it difficult or impossible to obtain permits and other needed authorizations to drill, complete or operate, result in operational delays, or otherwise make oil and gas exploration more costly or difficult than in other countries.
21
The unavailability or high cost of drilling rigs, equipment, supplies, personnel and oilfield services could adversely affect our ability to execute exploration and development plans within the established budget and on a timely basis.
Shortages or the high cost of drilling rigs, equipment, supplies, personnel or oilfield services could delay or adversely affect development and exploration operations or cause us to incur significant expenditures that are not provided for in our capital budget, which could have a material adverse effect on our business, financial condition or results of operations. Increased drilling or completion costs may not be fully offset by increases in the price received for oil and gas.
Our operations are subject to health, safety and environmental laws and regulations which may expose us to significant costs and liabilities and which may not be covered by insurance.
Our oil and natural gas exploration is subject to stringent and complex federal, state and local laws and regulations governing health and safety aspects of our operations, the discharge of materials into the environment and the protection of the environment. These laws and regulations impose on our operations numerous requirements, including the obligation to obtain a permit before conducting drilling activities; restrictions on the types, quantities and concentration of materials that may be released into the environment; limitations or prohibitions of drilling activities on certain lands lying within wilderness, wetlands and other protected areas; specific health and safety criteria to protect workers; and the responsibility for cleaning up any pollution resulting from operations. Numerous governmental authorities such as the EPA and analogous state agencies have the power to enforce compliance with these laws and regulations and the permits issued under them, oftentimes requiring difficult and costly actions. Failure to comply with these laws and regulations may result in the assessment of administrative, civil or criminal penalties; the imposition of investigatory or remedial obligations; the issuance of injunctions limiting or preventing some or all of our proposed operations; and delays in granting permits or cancellation of leases.
Under certain environmental laws and regulations, we may be liable regardless of whether we were at fault for the full cost of removing or remediating contamination, even when multiple parties contributed to the release and the contaminants were released in compliance with all applicable laws. In addition, accidental spills or releases on our properties may expose us to significant liabilities that could have a material adverse effect on our financial condition or results of operations and which may not be covered by insurance. Aside from government agencies, the owners of properties where our wells are located, the operators of facilities where our petroleum hydrocarbons or wastes are expected to be taken for reclamation or disposal and other private parties may be able to sue us to enforce compliance with environmental laws and regulations, collect penalties for violations or obtain damages for any related personal injury or property damage. Some sites are located near current or former third‑party oil and natural gas operations or facilities, and there is a risk that contamination has migrated from those sites to ours. Changes in environmental laws and regulations occur frequently, and any changes that result in more stringent or costly material handling, emission, waste management or cleanup requirements could require us to make significant expenditures to attain and maintain compliance or may otherwise have a material adverse effect on our own results of operations, competitive position or financial condition. We may not be able to recover some or any of these costs from insurance.
Federal, state, and local legislative and regulatory initiatives relating to oil and gas production, including hydraulic fracturing, as well as government reviews of such activities, could result in increased costs, additional operating restrictions or delays, and adversely affect our production and/or ability to book future reserves.
Hydraulic fracturing involves the injection of water, sand or other proppants, and chemical additives under pressure into a targeted subsurface formation. The water and pressure create fractures in the rock formations, which are held open by the proppant, enabling the oil or natural gas to flow to the wellbore. The process is typically regulated by state oil and natural gas commissions; however, the EPA asserted federal regulatory authority over certain hydraulic‑fracturing activities involving diesel fuel under the Safe Drinking Water Act. In addition, the COGCC has
22
adopted (and other states have adopted or are considering adopting) regulations that impose more stringent permitting, disclosure and well construction requirements on hydraulic fracturing operations. Further, on February 23, 2014, Colorado’s Air Quality Control Commission fully adopted EPA’s Standards of Performance for Crude Oil and Natural Gas Production, Transmission, and Distribution; adopted corresponding revisions to its emissions reporting and permitting framework; and adopted complimentary oil and gas control measures. These regulations will affect our operations, increase our costs of exploration and production and limit the quantity of oil and natural gas that we can economically produce to the extent that we use hydraulic fracturing.
Effective March 22, 2016, Adams County adopted new amendments to the county’s oil and gas regulatory process. The new regulations include an enhanced administrative review process, which may increase our costs or delay our drilling program.
In the event that additional regulations or legal restrictions at the federal, state or local level are adopted related to oil and gas production, hydraulic fracturing or other development activities in the areas in which we currently or in the future plan to operate, we may incur additional costs to comply with such requirements that may be significant in nature, and also could become subject to additional permitting and siting requirements and cause us to experience added delays or curtailment in the pursuit of exploration, development, or production activities. Furthermore, these additional costs may put us at a competitive disadvantage compared to larger companies in the industry which can spread such additional costs over a greater number of wells and larger operating staff.
Legislative and regulatory initiatives related to global warming and climate change could have an adverse effect on our operations and the demand for oil and natural gas.
In December 2009, the EPA determined that emissions of carbon dioxide, methane and other “greenhouse gases,” or GHG, present an endangerment to public health and the environment because emissions of such gases are, according to the EPA, contributing to warming of the earth’s atmosphere and other climatic changes. Based on these findings, the EPA has begun adopting and implementing regulations to restrict emissions of greenhouse gases under existing provisions of the Clean Air Act. The EPA recently adopted two sets of rules regulating greenhouse gas emissions under the Clean Air Act, one of which requires a reduction in emissions of greenhouse gases from motor vehicles and the other of which regulates emissions of greenhouse gases from certain large stationary sources. The EPA has also adopted rules requiring the reporting of greenhouse gas emissions from specified large greenhouse gas emission sources in the United States on an annual basis, including petroleum refineries, as well as certain onshore oil and natural gas production facilities.
On March 10, 2016, the EPA announced that it is moving towards issuing performance standards for methane emissions from existing oil and gas sources. The agency said that it will “begin with a formal process (i.e., an Information Collection Request) to require companies operating existing oil and gas sources to provide information to assist in the development of comprehensive regulations to reduce methane emissions.” On May 12, 2016, the EPA issued regulations (effective August 2, 2016) that build on the existing New Source Performance Standards, or the NSPS OOOO, promulgated by the EPA in 2012, as amended in 2013 and 2014. The regulations directly regulate methane and volatile organic compound, or VOC, emissions from various types of new and modified oil and gas sources. Some of those sources are already regulated under NSPS OOOO, while others, like hydraulically fractured oil wells, pneumatic pumps, and certain equipment and components at gas well sites and compressor stations, will be covered for the first time.
In addition, the U.S. Congress has from time to time considered adopting legislation to reduce GHG emissions and almost one‑half of the states have already taken legal measures to reduce GHG emissions, primarily through the planned development of GHG emission inventories and/or regional GHG cap and trade programs. Most of these GHG cap and trade programs work by requiring major sources of emissions, such as electric power plants, or major producers
23
of fuels, such as refineries and gas processing plants, to acquire and surrender emission allowances. The number of allowances available for purchase is reduced each year in an effort to achieve the overall GHG emission reduction goal.
The adoption of legislation or regulatory programs to reduce GHG emissions could require us to incur increased operating costs, such as costs to purchase and operate emissions control systems, to acquire emissions allowances or comply with new regulatory or reporting requirements. Any such legislation or regulatory programs could also increase the cost of consuming, and thereby reduce demand for, the oil, natural gas liquids, and natural gas we produce. Consequently, legislation and regulatory programs to reduce GHG emissions could have an adverse effect on our business, financial condition and results of operations. Finally, it should be noted that some scientists have concluded that increasing concentrations of GHG in the Earth’s atmosphere may produce climate changes that have significant physical effects, such as increased frequency and severity of storms, droughts, and floods and other climatic events. If any such effects were to occur, they could have an adverse effect on our financial condition and results of operations.
We may not be able to keep pace with technological developments in the industry.
The oil and natural gas industry is characterized by rapid and significant technological advancements and introductions of new products and services using new technologies. As others use or develop new technologies, we may be placed at a competitive disadvantage or competitive pressures may force us to implement those new technologies at substantial costs. In addition, other oil and natural gas companies may have greater financial, technical, and personnel resources that allow them to enjoy technological advantages and may in the future allow them to implement new technologies before we are in a position to do so. We may not be able to respond to these competitive pressures and implement new technologies on a timely basis or at an acceptable cost. If one or more of the technologies used now or in the future were to become obsolete or if we are unable to use the most advanced commercially available technology, the business, financial condition, and results of operations could be materially adversely affected.
We may incur losses as a result of title deficiencies.
We own working and revenue interests in oil and natural gas leasehold interests. The existence of a material title deficiency can render a lease worthless and can adversely affect our results of operations and financial condition. Title insurance covering mineral leaseholds is not generally available and, in many instances, we forego the expense of retaining lawyers to examine the title to the mineral interest to be placed under lease or already placed under lease until the drilling block is assembled and ready to be drilled. As is customary in our industry, we rely upon the judgment of oil and natural gas lease brokers, in‑house landmen or independent landmen who perform the field work in examining records in the appropriate governmental offices and abstract facilities before attempting to acquire or place under lease a specific mineral interest. We do not always perform curative work to correct deficiencies in the marketability of the title to us. In cases involving serious title problems, the amount paid for affected oil and natural gas leases can be lost, and the target area can become undrillable. We may be subject to litigation from time to time as a result of title issues.
The oil and natural gas business involves many operating risks that can cause substantial losses.
The oil and natural gas business involves a variety of operating risks, including:
|
· |
fires; |
|
· |
explosions; |
|
· |
blow‑outs and surface cratering; |
|
· |
uncontrollable flows of underground natural gas, oil or formation water; |
24
|
· |
natural disasters; |
|
· |
pipe and cement failures; |
|
· |
casing collapses; |
|
· |
embedded oilfield drilling and service tools; |
|
· |
abnormal pressure formations; and |
|
· |
environmental hazards such as natural gas leaks, oil spills, pipeline ruptures or discharges of toxic gases. |
If any of these events occur, we could incur substantial losses as a result of:
|
· |
injury or loss of life; |
|
· |
severe damage to and destruction of property, natural resources or equipment; |
|
· |
pollution and other environmental damage; |
|
· |
clean‑up responsibilities; |
|
· |
regulatory investigation and penalties; |
|
· |
suspension of our operations; or |
|
· |
repairs necessary to resume operations. |
If we were to experience any of these problems, it could affect well bores, gathering systems and processing facilities, any one of which could adversely affect our ability to conduct operations. We may be affected by any of these events more than larger companies, since we have limited working capital. We currently have general liability insurance with a combined single limit per occurrence of not less than $1.0 million for bodily injury and property damage and a combined occurrence limit of $2.0 million, an excess umbrella liability policy for up to $5.0 million, and control of well insurance with limits of $5.0 million for any one occurrence. For other risks, however, we may not obtain insurance if we believe the cost of available insurance is excessive relative to the risks presented. In addition, pollution and environmental risks generally are not fully insurable. If a significant accident or other event occurs and is not fully covered by insurance, it could adversely affect operations and/or our financial condition. Moreover, we may not be able to maintain adequate insurance in the future at rates considered reasonable.
Risks Related to Our Common Stock
The price of our common stock may be volatile or may decline and you may have difficulty reselling any shares of our common stock.
Our common stock currently trades on the OTCQB Marketplace with very limited daily trading volume. The market price of our common stock may fluctuate significantly in response to numerous factors, many of which are beyond our control, including:
|
· |
the limited trading market in our common stock; |
25
|
· |
commodity prices in general, and the price of oil in particular; |
|
· |
the success of our development efforts; |
|
· |
our ability to successfully implement our business plan; |
|
· |
failure to meet our revenue or profit goals or operating budget; |
|
· |
decline in demand for our common stock; |
|
· |
sales of additional amounts of common stock; |
|
· |
downward revisions in securities analysts’ estimates or changes in general market conditions; |
|
· |
investor perception of our industry or our prospects; and |
|
· |
general economic trends. |
In addition, stock markets have experienced extreme price and volume fluctuations and the market prices of securities have been highly volatile. These fluctuations are often unrelated to operating performance and may adversely affect the market price of our common stock. As a result, investors may be unable to resell their shares at a fair price.
The sale of a substantial number of shares of our common stock may cause the price of our common stock to decline.
Substantially all of our outstanding common stock is currently available for resale under applicable securities laws. In addition, we have a significant amount of common stock that can be issued under outstanding warrant, options or convertible debt, and we are obligated to register that common stock for resale. Our common stock is currently thinly‑traded and it is likely that market sales of large amounts of common stock (or the potential for those sales even if they do not actually occur) could cause the market price of our common stock to decline, which may make it difficult to sell our common stock in the future at a time and price which we deem reasonable or appropriate and may also cause investors to lose all or a part of their investment.
A small number of existing shareholders own a significant amount of our common stock, which could limit your ability to influence the outcome of any shareholder vote.
Our executive officers, directors, and certain beneficial owners would own approximately 70% of our common stock after exercising certain conversion elections as of the date of this report. Under our Articles of Incorporation and Colorado law, the vote of a majority of the shares outstanding is required to approve certain shareholder action, such as the approval of a merger or share exchange. As a result, these individuals will strongly influence the outcome of shareholder votes on these matters for the foreseeable future, including votes concerning the election of directors, amendments to our Articles of Incorporation or proposed mergers or other significant corporate transactions. We have no existing agreements or plans for mergers or other corporate transactions that would require a shareholder vote at this time. However, shareholders should be aware that they may have limited ability to influence the outcome of any vote in the future.
Since our common stock is not presently nor expected to be listed on a national securities exchange, trading in our shares will likely be subject to rules governing “penny stocks,” which will impair trading activity in our shares.
Our common stock is currently subject to rules adopted by the SEC regulating broker‑dealer practices in connection with transactions in penny stocks. Those disclosure rules applicable to penny stocks require a broker‑dealer,
26
prior to a transaction in a penny stock not otherwise exempt from the rules, to deliver a standardized disclosure document required by the SEC. These rules also require a cooling off period before the transaction can be finalized.
In addition, FINRA rules require that in recommending an investment to a customer, a broker‑dealer must have reasonable grounds for believing that the investment is suitable for that customer. Prior to recommending speculative low-priced securities to their non‑institutional customers, broker‑dealers must make reasonable efforts to obtain information about the customer’s financial status, tax status, investment objectives and other information. Under interpretations of these rules, FINRA believes that there is a high probability that speculative low-priced securities will not be suitable for at least some customers. FINRA requirements make it more difficult for broker‑dealers to recommend that their customers buy our common stock, which may limit the ability to buy and sell our stock and have an adverse effect on the market value for our shares. Many brokers may be unwilling to engage in transactions in our common stock because of the added disclosure requirements and applicable FINRA requirements, thereby making it more difficult for stockholders to dispose of their shares.
Any reverse split of our common stock may adversely affect our shareholders.
In October 2017, our shareholders granted the Board of Directors the discretion to implement a reverse split of our common stock if the Board deems it advisable to do so. We do not intend to amend our Articles of Incorporation in connection with a reverse split to reduce the number of authorized shares of common stock. Accordingly, any reverse split would have the practical effect of an increased number of authorized shares of common stock being available for issuance. The resulting increase could have a number of effects on our shareholders depending on the exact nature and circumstances of any actual issuances of authorized but unissued shares. The practical increase in available authorized shares for issuance could have an anti-takeover effect, in that additional shares could be issued (within the limits imposed by applicable law) in one or more transactions that could make a change in control or takeover of our company more difficult. There is no assurance that the implementation of a reverse split would have the desired effect of raising the price of our stock.
If we are unable to implement and maintain effective internal control over financial reporting in the future, investors may lose confidence in the accuracy and completeness of our financial reports and the market price of our common stock may decline.
As a public company, we are required to maintain internal control over financial reporting and to report any material weaknesses in such internal control. Further, we are required to report any changes in internal controls on a quarterly basis. In addition, we are required to furnish a report by management on the effectiveness of internal control over financial reporting pursuant to Section 404 of the Sarbanes‑Oxley Act of 2002. If we identify material weaknesses in our internal control over financial reporting or are unable to assert that our internal control over financial reporting is effective, investors may lose confidence in the accuracy and completeness of our financial reports and the market price of the common stock could be negatively affected. A weakness in internal control could also result in a restatement of our consolidated financial statements, which could have a material adverse effect on the trading price of our stock.
Issuance of our stock in the future could dilute existing shareholders and adversely affect the market price of our common stock.
We have the authority to issue up to 110,000,000 shares of stock, including 100,000,000 shares of common stock and 10,000,000 shares of preferred stock, and to issue options and warrants to purchase shares of our common stock. We are authorized to issue significant amounts of common stock in the future, subject only to the discretion of our Board. These future issuances could be at values substantially below the price paid for our common stock by investors. In addition, we could issue large blocks of our stock to fend off unwanted tender offers or hostile takeovers without
27
further shareholder approval. Because the trading volume of our common stock is relatively low, the issuance of our stock may have a disproportionately large impact on its price compared to larger companies.
The issuance of preferred stock in the future could adversely affect the rights of the holders of our common stock.
An issuance of preferred stock could result in a class of outstanding securities that would have preferences with respect to voting rights and dividends and in liquidation over the common stock and could, upon conversion or otherwise, have all of the rights of our common stock. Our Board of Directors’ authority to issue preferred stock could discourage potential takeover attempts or could delay or prevent a change in control through merger, tender offer, proxy contest or otherwise by making these attempts more difficult or costly to achieve.
We have never paid dividends on our common stock and we do not anticipate paying any in the foreseeable future.
We have not paid dividends on our common stock to date, and we may not be in a position to pay dividends for the foreseeable future. Our ability to pay dividends will depend on our ability to successfully develop our business plan and generate revenue from operations. Further, our initial earnings, if any, will likely be retained to finance our operations. Any future dividends will depend upon our earnings, our then‑existing financial requirements and other factors, and will be at the discretion of our Board of Directors.
CAUTIONARY NOTE REGARDING FORWARD LOOKING STATEMENTS
In this report, references to “PetroShare,” the “Company,” “we,” “us,” and “our” refer to PetroShare Corp., the Registrant.
The words “anticipates,” “believes,” “estimates,” “expects,” “intends,” “may,” “plans,” “will,” “would,” and similar words or expressions are intended to identify forward‑looking statements, although not all forward‑looking statements contain these identifying words. Forward‑looking statements and information are necessarily based upon a number of estimates and assumptions that, while considered reasonable by management, are inherently subject to significant business, economic and competitive uncertainties, risks and contingencies, and there can be no assurance that such statements and information will prove to be accurate. Therefore, actual results and future events could differ materially from those anticipated in such statements and information. We caution you not to put undue reliance on these statements, which speak only as of the date of this report. Further, the information contained in this document or incorporated herein by reference is a statement of our present intention and is based on present facts and assumptions, and may change at any time and without notice, based on changes in such facts or assumptions. Readers should not place undue reliance on forward‑looking statements.
The important factors that could affect the accuracy of forward‑looking statements and prevent us from achieving our stated goals and objectives include, but are not limited to:
|
· |
changes in the general economy affecting the disposable income of the public; |
|
· |
changes in environmental law, including federal, state and local legislation; |
|
· |
changes in drilling requirements imposed by state or local laws or regulations; |
|
· |
terrorist activities within and outside the United States; |
|
· |
technological changes in the crude oil and natural gas industry; |
|
· |
acts and omissions of third parties over which we have no control; |
28
|
· |
inflation and the costs of goods or services used in our operation; |
|
· |
access and availability of materials, equipment, supplies, labor and supervision, power, and water; |
|
· |
interpretation of drill hole results and the uncertainty of reserve estimates; |
|
· |
the availability of sufficient pipeline and other transportation facilities to carry our production and the impact of these facilities on price; |
|
· |
the level of demand for the production of crude oil and natural gas; |
|
· |
changes in our business strategy; |
|
· |
potential failure to achieve production from development drilling projects; and |
|
· |
capital expenditures. |
Those factors discussed above and elsewhere in this report are difficult to predict and expressly qualify all subsequent oral and written forward‑looking statements attributable to us or persons acting on our behalf. In light of these risks, uncertainties and assumptions, the forward‑looking events discussed may not occur. We do not have any intention or obligation to update forward‑looking statements included in this report after the date of this report, except as required by law. The preceding outlines some of the risks and uncertainties that may affect our forward‑looking statements.
ITEM 1B. UNRESOLVED STAFF COMMENTS
None.
From time to time, we may become involved in litigation relating to claims arising out of our operations in the normal course of business. No legal proceedings, government actions, administrative actions, investigations, or claims are currently pending against us or our officers and directors in which we are adverse.
ITEM 4. MINE SAFETY DISCLOSURES
Not applicable.
29
ITEM 5. MARKET FOR REGISTRANT’S COMMON EQUITY, RELATED STOCKHOLDER MATTERS AND ISSUER PURCHASES OF EQUITY SECURITIES
Market Information
Since November 23, 2015, our common stock has been quoted on the OTCQB of OTCLink under the symbol “PRHR.” Prior to that date, there was no trading market for our common stock.
The table below sets forth the high and low sales prices for our common stock on the OTCQB from November 23, 2015 to December 31, 2017. The prices in the table represent prices between dealers and do not include adjustments for retail mark‑up, mark‑down, or commission, and may not represent actual transactions.
|
Period |
|
High |
|
Low |
||
|
Fiscal Year Ended December 31, 2015 |
|
|
|
|
|
|
|
Fourth Quarter (from November 23, 2015) |
|
$ |
3.50 |
|
$ |
1.10 |
|
Fiscal Year Ended December 31, 2016 |
|
|
|
|
|
|
|
First Quarter |
|
$ |
1.77 |
|
$ |
0.60 |
|
Second Quarter |
|
|
1.98 |
|
|
0.66 |
|
Third Quarter |
|
|
1.65 |
|
|
1.20 |
|
Fourth Quarter |
|
|
2.00 |
|
|
1.30 |
|
Fiscal Year Ended December 31, 2017 |
|
|
|
|
|
|
|
First Quarter |
|
$ |
1.90 |
|
$ |
1.67 |
|
Second Quarter |
|
|
2.00 |
|
|
1.75 |
|
Third Quarter |
|
|
1.85 |
|
|
1.51 |
|
Fourth Quarter |
|
|
1.51 |
|
|
1.20 |
On March 27, 2018, the high and low sales price of our common stock on the OTCQB were $1.14 and $1.01, respectively.
Because our common stock is thinly traded and is not listed on a national securities exchange, the price for our common stock may be highly volatile and may bear no relationship to our actual financial condition or results of operations. Factors that we discuss in this report, including the many risks associated with our stock, may have a significant impact on the market price of our common stock. The market for our common stock will be affected by the offer and sale of our common stock by existing securities holders.
Holders of our Common Stock
As of March 27, 2018, we have outstanding 27,788,802 shares of common stock and approximately 169 holders of record of our common stock.
Transfer Agent
We have appointed Corporate Stock Transfer, Inc. of Denver, Colorado to be our transfer agent. Its address is 3200 Cherry Creek Drive South, #430, Denver, Colorado 80209 and its telephone number is 303‑282‑4800.
30
Penny Stock Rules
Due to the price of our common stock, as well as the fact that our stock is not listed on a national securities exchange, our stock is characterized as a “penny stock” under applicable securities regulations. As a result, we are subject to rules adopted by the SEC and FINRA regulating broker‑dealer practices in connection with transactions in penny stocks. The broker or dealer proposing to effect a transaction in a penny stock must furnish the customer with a document containing information prescribed by rule and obtain from the customer an executed acknowledgment of receipt of that document. Also, because of the relatively low trading price of our common stock, many brokerage firms may be unwilling to effect transaction in our common stock.
The broker or dealer must also provide the customer with pricing information regarding the security prior to the transaction and with the written confirmation of the transaction. The broker or dealer must also disclose the aggregate amount of any compensation received or receivable by him in connection with such transaction prior to consummating the transaction and with the written confirmation of the trade. The broker or dealer must also send an account statement to each customer for which he has executed a transaction in a penny stock each month in which such security is held for the customer’s account. The existence of these rules may have an adverse effect on the price of our stock, and the willingness of certain brokers to effect transactions in our stock.
Dividend Policy
We have never declared or paid dividends on our common stock and we do not expect to pay any in the near future. Payment of future dividends, if any, will be at the discretion of our Board of Directors after taking into account various factors, including the terms of any credit arrangements, our financial condition, operating results, current and anticipated cash needs and plans for expansion. Any earnings in the foreseeable future likely will be reinvested into our company. At the present time, we are not party to any agreement that would limit our ability to pay dividends.
Recent Sales of Unregistered Securities
In addition to those sales of unregistered securities we previously disclosed on reports we have filed with the SEC, we have issued the following securities in transactions that were not registered under the Securities Act during the fourth quarter of 2016:
The first of the foregoing transactions was completed pursuant to the exemption from registration provided by Section 4(a)(2) of the Securities Act. In that transaction, we did not engage in any general solicitation or advertising and we offered the securities to a limited number of persons with whom we had pre‑existing relationships. We exercised reasonable care to ensure that the purchasers of securities were not underwriters within the meaning of the Securities Act, including making reasonable inquiry prior to accepting any subscription, making written disclosure regarding the restricted nature of the securities and placing a legend on the certificates representing the shares. Stop transfer restrictions were placed with our transfer agent and a restrictive legend was placed on the certificate in connection with these offerings. In addition, the shares were issued exclusively to what the Company reasonably believed were accredited investors as defined in Rule 501 of the Securities Act.
31
|
· |
In the second transaction, we relied on the exemption provided by Rule 506(b) of Regulation D adopted under the Securities Act. We exchanged the common stock exclusively with holders of our convertible notes, each of which we reasonably believed to be an accredited investor. All of the certificates representing the shares were embossed with a legend restricting transfer, and stop transfer restrictions were placed with the Company’s transfer agent. |
For additional information regarding the sale of unregistered securities in the fourth quarter of 2016, please see Item 7, Management’s Discussion and Analysis of Financial Condition and Results of Operations.
ITEM 6. SELECTED FINANCIAL DATA
Not required for smaller reporting companies.
32
ITEM 7. MANAGEMENT’S DISCUSSION AND ANALYSIS OF FINANCIAL CONDITION AND RESULTS OF OPERATIONS
Overview
The following discussion summarizes our plan of operation as of March 28, 2018 for the next twelve months and the related anticipated capital expenditures. It also analyzes (i) our financial condition at December 31, 2017 and compares it to December 31, 2016, and (ii) our results of operations for the years ended December 31, 2017 and 2016. The following discussion and analysis should be read in conjunction with the accompanying consolidated financial statements and related notes and with the understanding that the actual future results may be materially different from what we currently expect.
We were organized on September 4, 2012 under the laws of the State of Colorado to investigate, acquire and develop crude oil and natural gas properties in the Rocky Mountain and mid‑continent region of the United States. Following the acquisition of oil and gas properties in 2016 and our participation in several drilling programs as a non‑operator, we have an interest in 94 gross (31.8 net) producing oil and gas wells located in the Southern Core of the Wattenberg Field. We possess a lease inventory covering a total of approximately 33,681 gross (9,770 net) acres, the majority of which is in the Southern Core. After assignment to our working interest partners, we have approximately 3,650 net acres in the Southern Core, which we are in the process of developing.
As an oil and natural gas exploration and production Company, our revenue, results of operation, cash flow from operations, reserve values, access to capital and future rate of growth are influenced by the prevailing prices of oil and natural gas. Changes in prices can affect, both positively and negatively, our financial condition, liquidity, ability to obtain financing, operating results, and the amount of oil and natural gas that we choose to produce. Prevailing prices for such commodities fluctuate in response to changes in supply and demand and a variety of additional factors beyond our control, such as global, political and economic conditions. Inherently, the price received for oil and natural gas production is unpredictable, and such volatility is expected. All of our production is sold at market prices and, therefore, the amount of revenue that we realize, as well as our estimates of future revenues, is to a large extent determined by factors beyond our control.
Under the terms of the participation agreements covering our prospects and operating agreements with other third-party operators, we are required to pay our proportionate share of the costs of any wells in which we participate. In exchange, we are entitled to a proportionate share of the revenue, net of related expenses. Accordingly, the ultimate success of our business plan depends on our ability to generate sufficient cash flow from the sale of produced crude oil and natural gas from our interest in the leases to pay our overhead and costs of future acquisitions and development.
We cannot fully determine what impact the volatility in crude oil and natural gas prices may have on our ongoing operations and future operations if such volatility continues into the future. Our decision on whether to drill and complete wells is based on both the prevailing commodity prices and the cost to drill such wells. Our ability to acquire financing and/or properties, drill wells, identify working interest and/or industry partners may all be negatively impacted by downward fluctuations in the price of oil and gas.
Going Concern
As described in the notes to our consolidated financial statements and the independent accountant’s report accompanying those consolidated financial statements, there is substantial doubt about our ability to continue as a going concern. The uncertainty is based on our substantial current liabilities, negative working capital, accumulated deficit and limited cash flow, among other things, which existed as of December 31, 2017. We are dependent on improving cash flow and obtaining funding from the sale of debt or equity to continue as a going concern.
33
As discussed in more detail under Liquidity and Capital Resources below, we had negative working capital of $17.8 million at December 31, 2017, including $2.1 million of a revolving credit facility that matures in June 2018 and $9.6 million of convertible notes that mature at December 31, 2018. If we are unable to generate sufficient cash flow from our operations to repay this debt, as well as pay our other ongoing obligations, we may be forced to curtail our operations or sell properties. We are not permitted to use the proceeds from the credit facility that we finalized in February 2018 to repay this debt. Please see Note 2 to our consolidated financial statements, “- Going Concern Assessment,” for additional information regarding this qualification.
Plan of Operation and Expected Capital Expenditures
Our plan of operation for the next twelve months is to complete the 14 Shook pad wells and participate in additional non-operated wells to the extent that our working capital permits. If we are successful in raising additional capital by means of an equity offering in 2018, we may pursue another operated drilling program. Our goal is to increase the price of our common stock by selective deployment of capital in what we believe to be an attractive area in a premier oil and gas field.
Operated Properties
In 2017, we drilled and cased 14 standard‑range lateral wells on our Shook pad, located in Section 3 of Township 1 South, Range 67 West, Adams County and part of our Todd Creek Farms prospect. The Shook pad is our first operated program in the Wattenberg Field. Our working interest in the Shook pad wells averages approximately 42%.
Since the final well was cased in August 2017, we have been negotiating pipeline and gathering access, and have identified and reached agreement with a third-party. We have budgeted $13.8 million to fracture stimulate and otherwise complete these wells. Assuming timely completion of the pipeline and gathering line, and completion of fracture activities scheduled to commence in April 2018, we expect these 14 wells to be fully producing by June 2018, adding significantly to our revenue. We also intend to monitor the production from the vertical wells we acquired during 2016 in order to determine whether production rates could be improved through work‑overs or by other means.
Non‑Operated Properties
In addition to the 17 gross (2.9 net) non-operated wells in which we participated and which were producing at December 31, 2017, we are participating in 22 gross (1.70 net) new wells in 2018. These include 11 wells on the Marcus pad and eight on the Ocho pad, and three on the B-Farms pad all operated by Great Western Oil & Gas Company and located in our Todd Creek Farms prospect. At the end of 2017, the Company has participated in an additional four non-operated extended length horizontal wells on the Ocho pad in which we have an approximate 3.35% working interest. Those four wells had been drilled and completed but experienced limited production while waiting on new pipeline facilities. As of March 28, 2018, these wells are on full production into the new pipeline.
We expect to pay the future costs associated with our operated and non‑operated properties through existing cash, cash flow from new wells in which we have participated, and proceeds from the term credit facility that we complete in February 2018. While we do not control the drilling and completion schedules of any wells in which we are a non‑operator, we currently expect to begin receiving revenue from our Marcus pad and Ocho pad non‑operated properties in the second or third quarter of 2018.
As discussed in more detail under “Liquidity and Capital Resources” below, remaining proceeds from our term credit facility provides us $11.2 million. Accordingly, our ability to continue acquiring acreage and to further develop
34
the acreage in which we currently have any interest is dependent on our ability to raise more capital. To achieve that objective, we expect to pursue additional equity offerings in 2018.
Results of Operations for the Year Ended December 31, 2017 Compared to December 31, 2016
The following provides selected operating results and averages for the years ended December 31, 2017 and 2016:
|
|
|
For the year ended |
||||
|
|
|
December 31, |
||||
|
|
|
2017 |
|
2016 |
||
|
Revenue |
|
|
|
|
|
|
|
Crude Oil |
|
$ |
8,719,793 |
|
$ |
239,810 |
|
Natural Gas |
|
|
1,525,833 |
|
|
68,304 |
|
NGLs |
|
|
861,948 |
|
|
25,002 |
|
Total revenue |
|
$ |
11,107,574 |
|
$ |
333,116 |
|
Total operating expense(1) |
|
$ |
1,715,616 |
|
$ |
206,622 |
|
Depletion, depreciation and amortization expense |
|
$ |
2,836,891 |
|
$ |
65,033 |
|
Interest income (expense) |
|
$ |
(9,293,782) |
|
$ |
(323,170) |
|
General and administrative expense |
|
$ |
6,205,412 |
|
$ |
4,022,969 |
|
Net (loss) |
|
$ |
(10,847,379) |
|
$ |
(4,481,272) |
|
Sales volume(2)(3) |
|
|
|
|
|
|
|
Crude Oil (Bbls) |
|
|
188,529 |
|
|
4,903 |
|
Natural Gas (Mcfs) |
|
|
549,846 |
|
|
26,059 |
|
NGLs (Bbls) |
|
|
50,111 |
|
|
1,511 |
|
BOE |
|
|
330,281 |
|
|
10,756 |
|
Average sales price(4) |
|
|
|
|
|
|
|
Crude Oil (per Bbl) |
|
$ |
46.25 |
|
$ |
48.91 |
|
Natural Gas (per Mcf) |
|
$ |
2.78 |
|
$ |
2.62 |
|
NGLs (per Bbl) |
|
$ |
17.20 |
|
$ |
16.55 |
|
BOE |
|
$ |
33.63 |
|
$ |
30.97 |
|
Average per BOE |
|
|
|
|
|
|
|
Operating expense |
|
$ |
5.19 |
|
$ |
19.21 |
|
Depletion, depreciation and amortization expense |
|
$ |
8.59 |
|
$ |
6.05 |
|
(1) |
Overall lifting cost (oil and gas production costs, including production taxes). |
|
(2) |
Estimates are inherent in reported volumes to coincide with revenue accruals as a result of the timing of sales information reporting by third-party operators. |
|
(3) |
Sales volumes are based upon crude oil, natural gas and NGL’s sold or accrued during the period and differ from crude oil, natural gas and NGL’s produced during the period. |
|
(4) |
Averages calculated based upon non‑rounded figures. |
Overview: Fiscal 2017 was our first year of meaningful revenue, as we realized revenue from the non-operated horizontal wells in which we participated. However, for the year, we realized a net loss of $10.8 million, including non-cash charges, or $0.46 per share, compared to a net loss of $4.5 million, or $0.21 per share, for the year ended December 31, 2016.
35
The significant increase in net loss of $6.3 million for the year ended December 31, 2017 resulted primarily from a significant increase in interest expense, depletion, depreciation and amortization and other non-cash expenses and including increases in our general and administrative expenses due to increased staffing requirements. We expect to continue operating at a net loss until cash flow from the wells in which we have an interest is sufficient to cover operating costs, interest expenses, general and administrative and other expenses.
Revenues: Crude oil, natural gas and NGL sales revenue increased $10.8 million, for the year ended December 31, 2017, to $11.1 million from $0.3 million for the year ended December 31, 2016, attributable to increased production volume from 2016. Crude oil, natural gas and NGL sales volumes increased 319,525 BOE for the year ended December 31, 2017 compared to the year ended December 31, 2016. The increase, in turn, was primarily the result of production from the completion of 14 non-operated wells during 2017 in which we have an average net revenue interest of 12.9%. Our production in 2016 was solely from crude oil, natural gas and NGLs produced from vertical wells that we acquired during 2016 and the completion of three non-operated wells that were put on production in the fourth quarter of 2016. For the year ended December 31, 2017, our average oil sales price was $46.25 per Bbl compared to $48.91 per Bbl for the year ended December 31, 2016, due to lower average oil spot prices through most of 2017 compared to 2016; our average natural gas sales price was $2.78 per Mcf compared to $2.62 for the year ended December 31, 2016; and our average NGLs sales price was $17.20 per Bbl compared to $16.55 for the year ended December 31, 2016. The increase in the average price per BOE of $2.66, or 8.6%, results primarily from a change in our product sales mix to include natural gas and NGL at blended higher sales prices, offset by lower average crude oil prices during the year ended December 31, 2017.
Operating Expense: Operating expense is comprised of the following items:
|
|
|
Year ended |
||||
|
|
|
December 31, |
||||
|
|
|
2017 |
|
2016 |
||
|
Lease operating costs |
|
$ |
722,799 |
|
$ |
167,638 |
|
Production taxes |
|
|
742,787 |
|
|
38,634 |
|
Transportation and other costs |
|
|
250,030 |
|
|
350 |
|
Total |
|
$ |
1,715,616 |
|
$ |
206,622 |
Total operating expense increased in 2017 commensurate with increased production. This reflects our participation in the horizontal wells in 2017, while 2016 primarily reflects the operations of legacy vertical wells.
Lease operating costs, or LOE, per BOE was $2.19 for the year ended December 31, 2017, compared to $15.59 for the year ended December 31, 2016. As a percent of crude oil, natural gas and NGL sales revenue, routine LOE was 6.5% for the year ended December 31, 2017, compared to 50.3% for the year ended December 31, 2016. Production taxes for the year ended December 31, 2017 amounted to $0.7 million as compared to $38,634 for the year ended December 31, 2016.
Overall operating costs (crude oil, natural gas and NGL operating costs, including production taxes) per BOE was $5.19 for the year ended December 31, 2017, compared to $19.21 for the year ended December 31, 2016.
Depletion, depreciation and amortization expense: Depletion, depreciation and amortization increased $2.7 million to $2.8 million for the year ended December 31, 2017, from $0.1 million for the year ended December 31, 2016. The increase was the result of increased production volumes related to wells acquired and non‑operated wells coming online during the 2017 period, partially offset by an increase in our reserves.
36
Interest income (expense): During 2017, we recognized interest expense of $9.3 million compared to $0.3 million in the year ended December 31, 2016. The interest expense recognized in the current period relates to advances on our two lines of credit, our convertible notes, our new credit facility entered in December 2017, and the amortization of debt discounts. During the year ended December 31, 2016, interest expense primarily relates to advances on our two lines of credit.
General and administrative expenses: We incurred general and administrative expenses of $6.2 million during the year ended December 31, 2017, an increase of $2.2 million over 2016, or 54%. This increase is primarily attributable to an increase of $1.3 million in salary and wage expense, employee benefits and stock-based compensation, and increases of $0.9 million in professional fees, board of director fees, filing fees and investor relations expense associated with being a public company required to file reports with the SEC. In 2016, we incurred general and administrative expenses of $4.0 million. The 2016 activity is primarily attributable to stock-based compensation expense of $1.4 million, salary and wage expenses related to the payment of bonuses and the addition of new employees of $0.7 million and costs of $1.0 million incurred in connection with an abandoned public offering in the fourth quarter of 2016.
LIQUIDITY AND CAPITAL RESOURCES
Overview
In 2017, we continued to suffer from a shortage of capital and liquidity. Historically, we have relied on sales of our equity securities, borrowing and advances from our working interest partners to fund operations. In 2017, our need for additional capital became more acute, as we hoped to accelerate the pace of development of our properties, including commencing our first operated drilling program. However, the state of the equity markets for junior exploration and production companies in 2017 forced us to rely on other avenues for funding during the year.
2017 Financings
We explored numerous options for both debt and equity financing during the year and ultimately completed three financings. In January 2017, we completed a private placement of convertible notes that we commenced in December 2016 that netted us $9.0 million in total after fees and expenses. We sold those notes as part of units that included warrants to purchase our common stock at a price of $3.00 per share.
In October 2017, we completed another placement of convertible notes, which we refer to as the Series B Convertible Notes, also sold as units with additional warrants to purchase our common stock. We netted $4.7 million from this offering. As part of this offering, holders of the original convertible notes that were issued in late 2016 and early 2017 were offered the right to convert their original notes in an amount equal to two times the amount of their investment in Series B Notes into common stock at a reduced conversion price of $1.10 per share. As a result of that offer, $5.2 million of original notes were converted into common stock, improving our working capital.
In December 2017, we completed the first closing of what ultimately became a $25.0 million term credit loan from an affiliate of our working interest partner and the beneficial owner of our common stock. Prior to year-end, we received $5.0 million of this financing, all of which was used to reduce our accounts payable or accrued liabilities. The remainder was received in February 2018. The facility matures in its entirety in February 2020. As part of the second closing in 2018, we repaid the entire amount of the original line of credit from PEO of $5.0 million plus accrued interest and $1.5 million of principal plus accrued interest on our supplemental line of credit with an affiliate of PEO, further improving our working capital.
The amount we invest in development, drilling, and leasing activities depends on, among other factors, opportunities presented to us, the results of drilling to date and the success of any fundraising efforts. The most
37
significant of our future capital requirements include (i) costs to drill or participate in additional wells; (ii) costs to acquire additional acreage that we may identify in the Southern Core area or other areas; (iii) approximately $0.6 million per month for salaries and other corporate overhead; and (iv) legal and accounting fees associated with our status as a public company required to file reports with the SEC. We anticipate funding these projected capital requirements with cash on hand, revenue from operations, and proceeds from the sale of debt or equity, the success of which cannot be assured.
Working Capital
As of December 31, 2017, we had negative working capital of $17.8 million, comprised of current assets of $3.4 million and current liabilities of $21.2 million. Working capital decreased by $11.7 million from December 31, 2016, primarily due to additional short-term borrowings. Our working capital improved subsequent to the end of the fiscal year when we closed the second tranche of the term credit agreement. At that time, we repaid $7.5 million in current debt and accrued interest and netted $11.2 million after expenses to be used for development of our properties and other working capital.
Cash Flows
Year Ended December 31, 2017 Compared to December 31, 2016
Operating Activities
Net cash provided by operating activities during the year ended December 31, 2017 was $10.4 million, compared to cash used of $2.7 million during the year ended December 31, 2016, representing an improvement of $13.1 million. The increased net loss in 2017 was more than offset by increases in depletion, depreciation and amortization, accretion of the debt discount associated with the issuance of the convertible notes and a loss on the conversion of notes, each of which was a non-cash expense; and an increase in accounts payable, among other items.
Investing Activities
Cash used in investing activities in 2017 nearly doubled from the prior year, from $10.8 million in 2016 to $20.4 million during the year ended December 31, 2017. During 2017, we spent $17.1 million on drilling and other development activities on our properties and $3.2 million on acquisitions. This compares to $7.7 million spent on acquisitions and $3.0 million for our share of the development of our properties during 2016.
Financing Activities
During 2017, we received a total of $11.8 million, net, from the sale of units consisting of convertible notes and warrants. Offsetting that cash received, we repaid $3.6 million under the supplemental line of credit.
Financing activities in 2016 consisted primarily of borrowings under our two lines of credit and the sale of debt in a private placement. A planned underwritten public offering of our common stock was abandoned in the fourth quarter of the year due to market conditions.
During the year ended December 31, 2016, we borrowed $3.9 million on the initial line of credit from PEO and $7.1 million on the supplemental line of credit. We also received gross offering proceeds of $1.7 million from the sale of units in a private placement. We received an additional $0.1 million in a private placement of common stock in January 2016.
38
Off‑Balance Sheet Arrangements
We have no material off‑balance sheet transactions, arrangements, or obligations.
Critical Accounting Policies
Use of Estimates in the Preparation of Consolidated Financial Statements
The discussion and analysis of our financial condition and results of operations is based upon our consolidated financial statements, which have been prepared in accordance with accounting principles generally accepted in the United States (“US GAAP”). The preparation of these consolidated financial statements requires management to make estimates and judgments that affect the reported amounts of assets, liabilities, revenues and expenses. Our significant accounting policies are described in Note 2 of the Notes to Consolidated Financial Statements included as part of this Form 10‑K. We have identified below the policies that are of particular importance to the portrayal of our financial position and results of operations and which require the application of significant judgment by management. We analyze our estimates, including those related to oil and gas reserve estimates, on a periodic basis and base our estimates on historical experience, independent third-party reservoir engineers and various other assumptions that management believes to be reasonable under the circumstances. Actual results may differ from these estimates under different assumptions or conditions. We believe the following critical accounting policies affect our more significant judgments and estimates used in the preparation of our consolidated financial statements:
Successful Efforts Method of Accounting
Our application of the successful efforts method of accounting for our oil and gas exploration and production activities requires judgments as to whether particular wells are developmental or exploratory, since exploratory costs and the costs related to exploratory wells that are determined to not have proved reserves must be expensed whereas developmental costs are capitalized. The results from a drilling operation can take considerable time to analyze, and the determination that commercial reserves have been discovered requires both judgment and application of industry experience. Wells may be completed that are assumed to be productive and actually deliver oil and natural gas in quantities insufficient to be economic, which may result in the abandonment of the wells at a later date. On occasion, wells are drilled which have targeted geologic structures that are both developmental and exploratory in nature, and in such instances an allocation of costs is required to properly account for the results. The evaluation of natural gas and oil leasehold acquisition costs included in unproved properties requires management’s judgment of exploratory costs related to drilling activity in a given area. Drilling activities in an area by other companies may also effectively condemn leasehold positions.
Oil and Gas Reserves
Our estimates of proved reserves are based on the quantities of oil, natural gas and NGLs, which, by analysis of geoscience and engineering data, can be estimated with reasonable certainty to be economically producible from a given date forward from known reservoirs under existing economic conditions, operating methods and government regulations prior to the time at which contracts providing the right to operate expire, unless evidence indicates that renewal is reasonably certain, regardless of whether deterministic or probabilistic methods are used for the estimation. Our independent petroleum engineers, Cawley Gillespie, prepare a reserve and economic evaluation of all of our properties on a well‑by‑well basis. The accuracy of reserve estimates is a function of the:
|
· |
quality and quantity of available data; |
|
· |
interpretation of that data; |
39
|
· |
accuracy of various mandated economic assumptions; and |
|
· |
judgment of the independent reserve engineer. |
One of the most significant estimates we make is the estimate of oil, natural gas and NGL reserves. Oil, natural gas and NGL reserve estimates require significant judgments in the evaluation of all available geological, geophysical, engineering and economic data. The data for a given area may change substantially over time as a result of numerous factors including, but not limited to, additional development activity, production history, projected future production, economic assumptions relating to commodity prices, operating expenses, severance and other taxes, capital expenditures and remediation costs and these estimates are inherently uncertain. For example, if estimates of proved reserves decline, our depletion, depreciation and amortization (DD&A) rate will increase, resulting in an increase in net loss. A decline in estimates of proved reserves could also cause us to perform an impairment analysis to determine if the carrying amount of oil and gas properties exceeds fair value and could result in an impairment charge, which would increase our loss. We cannot predict what reserve revisions may be required in future periods.
The recent significant decline in oil, natural gas and NGL prices increases the uncertainty as to the impact of commodity prices on our estimated proved reserves. We are unable to predict future commodity prices with any greater precision than the futures market. A prolonged period of depressed commodity prices may have a significant impact on the value and volumetric quantities of our proved reserve portfolio, assuming no other changes to our development plans or costs.
Depletion, Depreciation, Amortization and Accretion.
Our DD&A rate is dependent upon our estimates of total proved and proved developed reserves, which incorporate various assumptions and future projections. If our estimates of total proved or proved developed reserves decline, the rate at which we record DD&A expense increases, which in turn increases our net loss. Such a decline in reserves may result from lower commodity prices or other changes to reserve estimates, as discussed above, and we are unable to predict changes in reserve quantity estimates as such quantities are dependent on the success of our exploration and development program, as well as future economic conditions.
Impairment of Proved Oil and Gas Properties
Proved oil and gas properties are reviewed for impairment annually or when events and circumstances indicate a possible decline in the recoverability of the carrying amount of such property. We estimate the expected future cash flows of our oil and gas properties and compare these undiscounted cash flows to the carrying amount of the oil and gas properties to determine if the carrying amount is recoverable. If the carrying amount exceeds the estimated undiscounted future cash flows, we will write down the carrying amount of the oil and gas properties to fair value. The factors used to determine fair value include, but are not limited to, estimates of reserves, future commodity prices, future production estimates, estimated future capital expenditures, estimated future operating costs, and discount rates commensurate with the risk associated with realizing the projected cash flows. Impairment expense for proved oil and gas properties is reported in impairment of long lived assets in the consolidated statements of operations, which increases accumulated depletion, depreciation and amortization.
Our impairment analyses require us to apply judgment in identifying impairment indicators and estimating future cash flows of our oil and gas properties. If actual results are not consistent with our assumptions and estimates or our assumptions and estimates change due to new information, we may be exposed to an impairment charge.
40
Impairment of Unproved Oil and Gas Properties
Unproved oil and gas properties consist of costs to acquire unevaluated leases as well as costs to acquire unproved reserves. We evaluate significant unproved oil and gas properties for impairment based on remaining lease term, drilling results, reservoir performance, seismic interpretation or future plans to develop acreage. When successful wells are drilled on undeveloped leaseholds, unproved property costs are reclassified to proved properties and depleted on a unit‑of‑production basis. Impairment expense and lease extension payments for unproved properties is reported in exploration expenses in the statements of operations.
Asset Retirement Obligations
Our asset retirement obligations (“ARO”) consist of estimated future costs associated with the plugging and abandonment of oil, natural gas and NGL wells, removal of equipment and facilities from leased acreage and land restoration in accordance with applicable local, state and federal laws, and applicable lease terms. The fair value of an ARO liability is required to be recognized in the period in which it is incurred, with the associated asset retirement cost capitalized as part of the carrying cost of the oil and gas asset. The recognition of an ARO requires management to make numerous assumptions regarding such factors as the estimated probabilities, amounts and timing of settlements; the credit‑adjusted risk‑free discount rate to be used; and inflation rates. In periods subsequent to the initial measurement of the ARO, we must recognize period‑to‑period changes in the liability resulting from the passage of time and revisions to either the timing or the amount of the original estimate of undiscounted cash flows. Increases in the ARO liability due to the passage of time impact net income as accretion expense. The related capitalized cost, including revisions thereto, is charged to expense through DD&A over the life of the oil and gas property.
Stock-Based Compensation
We currently utilize a standard option pricing model (i.e., Black‑Scholes) to measure the fair value of stock options granted to employees and directors. The determination of the fair value of stock‑based awards at the grant date requires judgment in developing assumptions, which involve a number of variables. These variables include, but are not limited to, the expected stock price volatility over the term of the awards, the expected dividend yield and the expected stock option exercise behavior.
Our computation of expected volatility is based on a combination of historical and market‑based implied volatility. The volatility rate was derived by examining historical stock price behavior and assessing management’s expectations of stock price behavior during the term of the option. The term of the options was derived based on the “simplified method” calculation. The simplified method allows companies that do not have sufficient historical experience to provide a reasonable basis for an estimate to instead estimate the expected term of a “plain vanilla” option by averaging the time to vesting and the full term of the option. (“Plain vanilla” options are options with the following characteristics: (1) the options are granted at‑the‑money; (2) exercisability is conditional only upon performing service through the vesting date; (3) if an employee terminates service prior to vesting, the employee would forfeit the options; (4) if an employee terminates service after vesting, the employee would have a limited time to exercise the options (typically 30 to 90 days); and (5) the options are nontransferable and non‑hedgeable.) The Company periodically evaluates the applicability of using the simplified method with respect to the characteristics noted above to estimate the expected term of our options and will continue to do so as our business continues to evolve. If any of the assumptions used in the Black‑Scholes model change significantly, stock-based compensation expense may differ materially in the future from that recorded in the current period.
Pursuant to Financial Accounting Standards Board (“FASB”) Accounting Standards Update (“ASU”) No. 2014-15, Presentation of Financial Statements – Going Concern the Company has assessed its ability to continue as a going concern for a period of one year from the date of the issuance of these consolidated financial statements.
41
Substantial doubt about an entity’s ability to continue as a going concern exists when relevant conditions and events, considered in the aggregate, indicate that it is probable that the entity will be unable to meet its obligations as they become due within one year from the consolidated financial statement issuance date. As shown in the accompanying consolidated financial statements, the Company incurred a net loss of $10.8 million during the year ended December 31, 2017, and as of that date, the Company's current liabilities exceeded its current assets by $10.8 million, the Company had a cash balance of $0.7 million and other current assets of $2.7 million.
Going Concern Assessment
As of December 31, 2017, the Company had insufficient working capital and revenues from operations to meet its maturing debt obligations and other liabilities incurred and to be incurred in connection with the Company’s development activities. The Company will also need to generate sufficient cash flow from operations and sell equity or debt to fund further drilling and acquisition activity. If sufficient cash flow and additional financing is not available, the Company may be compelled to reduce the scope of its business activities and/or sell a portion of the Company’s interests in its oil and gas properties. This, in turn, may have an adverse effect on the Company’s ability to realize the value of its assets. These factors raise substantial doubt about the Company’s ability to continue as a going concern.
Management has evaluated these conditions and determined that a reduction in the working capital deficit subsequent to December 31, 2017 as a result of a new term Credit Facility coupled with anticipated increased revenues from the Company’s non-operated and operated properties, may allow the Company to meet its maturing debt and interest obligations. However, to continue to execute its business plan, additional capital will be required. As part of the analysis, the Company considered selective participation in certain non-operated drilling programs based on availability of working capital and the timing of production-related cash flows.
The Company’s consolidated financial statements do not include any adjustments related to the realization of the carrying value of assets or the amounts and classification of liabilities that might be necessary should the Company be unable to continue in existence.
Recent Accounting Pronouncements
Please refer to Recent Accounting Pronouncements in Note 2—Basis of Presentation and Significant Accounting Policies in Part II, Item 8 of this report.
Unless otherwise indicated in this report, natural gas volumes are stated at the legal pressure base of the state or geographic area in which the reserves are located at 60 degrees Fahrenheit. Crude oil and natural gas equivalents are determined using the ratio of six Mcf of natural gas to one barrel of crude oil, condensate or natural gas liquids.
The following are abbreviations and definitions of terms commonly used in the oil and natural gas industry and within this prospectus:
“Bbl”—Barrel or 42 US gallons liquid volume.
“MBbls”—One thousand Bbls.
“BOE”—One barrel of crude oil equivalent, which combines Bbls of oil, Bbls of natural gas liquids, and Mcf of natural gas by converting each six Mcf of natural gas to one Bbl of oil.
42
“MBOE”—One thousand BOE.
“BOE/D”—Barrels of oil equivalent per day.
“Condensate”—A mixture of hydrocarbons that exists in the gaseous phase at original reservoir temperature and pressure, but that, when produced, is in the liquid phase at surface pressure and temperature.
“Developed acreage”—The number of acres that are allocated or assignable to producing wells or wells capable of production.
“Development well”—A well drilled within the proved area of a crude oil or natural gas reservoir to the depth of stratigraphic horizon (rock layer or formation) noted to be productive for the purpose of extracting proved crude oil or natural gas reserves.
“Exploratory well”—A well drilled to find and produce crude oil or natural gas in an unproved area, to find a new reservoir in a field previously found to be producing crude oil or natural gas in another reservoir, or to extend a known reservoir.
“Field”—An area consisting of either a single reservoir or multiple reservoirs, all grouped on or related to the same individual geological structural feature and/or stratigraphic condition.
“Gross acres”—The number of acres in which the Company owns a gross working interest.
“Gross well”—A well in which the Company owns a working interest.
“Leases”—Full or partial rights in mineral interests authorizing the leaseholder to drill for, produce and sell oil and natural gas in exchange for any or all of rental, bonus and royalty payments. Leases are generally acquired from private landowners (fee leases) and from federal and state governments on acreage held by them.
“Mcf”—One thousand cubic feet of natural gas.
“MMcf”—One thousand Mcf.
“MMBtu”—One million British thermal units—a measure of the amount of energy required to raise the temperature of a one‑pound mass of water one-degree Fahrenheit at sea level.
“Net acres” or “Net wells”—The sum of the fractional working interests owned in gross acres or wells, as the case may be, expressed as whole numbers and fractions thereof.
“NGL”—Means natural gas liquids.
“Operator”—The individual or company responsible to the working interest owners for the exploration, development and production of an oil or natural gas well or lease.
“Producing well”—A well that is currently producing crude oil, natural gas, or liquids.
“Productive well”—A producing well or a well mechanically capable of production.
“Prospect”—A location where hydrocarbons such as crude oil and natural gas are believed to be present in quantities which are economically feasible to produce.
43
“Proved developed reserves”—Reserves that can be expected to be recovered through existing wells with existing equipment and operating methods. Additional crude oil and natural gas expected to be obtained through the application of fluid injection or other improved recovery techniques for supplementing the natural forces and mechanisms of primary recovery are included in “proved developed reserves” only after testing by a pilot project or after the operation of an installed program has confirmed through production response that increased recovery will be achieved.
“Proved reserves”—Proved crude oil and natural gas reserves are those quantities of crude oil and natural gas, which, by analysis of geoscience and engineering data, can be estimated with reasonable certainty to be economically producible—from a given date forward, from known reservoirs, and under existing economic conditions, operating methods, and government regulations—prior to the time at which contracts providing the right to operate expire, unless evidence indicates that renewal is reasonably certain, regardless of whether deterministic or probabilistic methods are used for the estimation. The project to extract the hydrocarbons must have commenced or the operator must be reasonably certain that it will commence the project within a reasonable time.
“Proved undeveloped reserves”—Proved crude oil and natural gas reserves that are expected to be recovered from new wells on undrilled acreage or from existing wells where a relatively major expenditure is required for development. Reserves on undrilled acreage are limited to those drilling units offsetting productive units that are reasonably certain of production when drilled. Proved reserves for other undrilled units are claimed only where it can be demonstrated with certainty that there is continuity of production from the existing productive formation. Estimates for proved undeveloped reserves are not attributed to any acreage for which an application of fluid injection or other improved recovery technique is contemplated unless such techniques have been proven effective by actual tests in the area and in the same reservoir.
“Reservoir”—A porous and permeable underground formation containing a natural accumulation of producible crude oil and/or natural gas that is confined by impermeable rock or water barriers and is separate from other reservoirs.
“Resources”—Quantities of crude oil and natural gas estimated to exist in naturally occurring accumulations. A portion of the resources may be estimated to be recoverable, and another portion may be considered to be unrecoverable. Resources include both discovered and undiscovered accumulations.
“Revenue interest”—The amount or percentage of revenue/proceeds derived from a producing well that the owner is entitled to receive.
“Section”—640 acres.
“Shut‑in”—A well which is capable of producing but is not presently producing.
“Spacing” or “Spacing Unit”—The distance between wells producing from the same reservoir. Spacing is often expressed in terms of acres, e.g., 40‑acre spacing, and is often established by regulatory agencies.
“Standardized measure”—The present value of estimated future cash inflows from proved natural gas and crude oil reserves, less future development and production costs and future income tax expenses, using prices and costs as of the date of estimation without future escalation, without giving effect to hedging activities, non‑property related expenses such as general and administrative expenses, debt service and depletion, depreciation and amortization and discounted using an annual discount rate of 10% to reflect timing of future cash flows.
“Undeveloped acreage”—Leased acres on which wells have not been drilled or completed to a point that would permit the production of economic quantities of crude oil and natural gas, regardless of whether or not such acreage
44
contains proved reserves. Undeveloped acreage includes net acres under the bit until a productive well is established in the spacing unit.
“Unproved property”—A property or part of a property with no proved reserves.
“Working interest”—The amount or percentage of costs that an owner is required to pay of drilling and production expenses. It also gives the owners, in the aggregate, the right to drill, produce and conduct operating activities on the property and to share in any revenue from the production.
“Workover”—Operations on a producing well to restore or increase production.
ITEM 7A. QUANTITATIVE AND QUALITATIVE DISCLOSURES ABOUT MARKET RISK
Not required for smaller reporting companies.
45
ITEM 8. CONSOLIDATED FINANCIAL STATEMENTS AND SUPPLEMENTARY DATA
INDEX TO CONSOLIDATED FINANCIAL STATEMENTS
|
|
Page |
| 47 | |
|
Consolidated Balance Sheet as of December 31, 2017 and Balance Sheet as of December 31, 2016 |
49 |
| 50 | |
| 51 | |
| 52 | |
| 53 |
46
REPORT OF INDEPENDENT REGISTERED PUBLIC ACCOUNTING FIRM
To the Board of Directors and Shareholders
PetroShare Corp.
We have audited the accompanying balance sheet of PetroShare Corp. as of December 31, 2016 and the related statement of operations, shareholders' equity, and cash flows for the years then ended. These financial statements are the responsibility of the Company's management. Our responsibility is to express an opinion on these financial statements based on our audits.
We conducted our audits in accordance with the standards of the Public Company Accounting Oversight Board (United States). Those standards require that we plan and perform the audit to obtain reasonable assurance about whether the financial statements are free of material misstatement. The Company is not required to have, nor were we engaged to perform, an audit of its internal control over financial reporting. Our audits included consideration of internal control over financial reporting as a basis for designing audit procedures that are appropriate in the circumstances, but not for the purpose of expressing an opinion on the effectiveness of the Company’s internal control over financial reporting. Accordingly, we express no such opinion. An audit also includes examining, on a test basis, evidence supporting the amounts and disclosures in the financial statements, assessing the accounting principles used and significant estimates made by management, as well as evaluating the overall financial statement presentation. We believe that our audits provide a reasonable basis for our opinion.
In our opinion, the financial statements referred to above present fairly, in all material respects, the financial position of PetroShare Corp. as of December 31, 2016, and the results of its operations and its cash flows for the years then ended, in conformity with U.S. generally accepted accounting principles.
|
/s/ SingerLewak LLP |
|
|
SingerLewak LLP |
|
|
Denver, Colorado March 31, 2017 |
|
47
Report of Independent Registered Public Accounting Firm
To the Shareholders and the Board of Directors
PetroShare Corp.
Englewood, Colorado
Opinion on the Consolidated Financial Statements
We have audited the accompanying consolidated balance sheet of PetroShare Corp. (the "Company") as of December 31, 2017, the related consolidated statements of operations, shareholders' equity, and cash flows, for the year then ended, and the related notes (collectively referred to as the "consolidated financial statements"). In our opinion, the consolidated financial statements present fairly, in all material respects, the financial position of the Company as of December 31, 2017, and the results of its operations and its cash flows for the year then ended, in conformity with accounting principles generally accepted in the United States of America.
Going Concern
The accompanying consolidated financial statements have been prepared assuming that the entity will continue as a going concern. As discussed in Note 2 to the consolidated financial statements, the entity has suffered recurring losses from operations and has a net capital deficiency that raises substantial doubt about its ability to continue as a going concern. Management's plans in regard to these matters are also described in Note 2. The consolidated financial statements do not include any adjustments that might result from the outcome of this uncertainty.
Basis for Opinion
These consolidated financial statements are the responsibility of the Company's management. Our responsibility is to express an opinion on the Company's consolidated financial statements based on our audit. We are a public accounting firm registered with the Public Company Accounting Oversight Board (United States) ("PCAOB") and are required to be independent with respect to the Company in accordance with the U.S. federal securities laws and the applicable rules and regulations of the Securities and Exchange Commission and the PCAOB.
We conducted our audit in accordance with the standards of the PCAOB. Those standards require that we plan and perform the audit to obtain reasonable assurance about whether the consolidated financial statements are free of material misstatement, whether due to error or fraud. PetroShare Corp. is not required to have, nor were we engaged to perform, an audit of its internal control over financial reporting. As part of our audit we are required to obtain an understanding of internal control over financial reporting but not for the purpose expressing an opinion on the effectiveness of the entity’s internal control over financial reporting. Accordingly, we express no such opinion.
Our audit included performing procedures to assess the risks of material misstatement of the consolidated financial statements, whether due to error or fraud, and performing procedures that respond to those risks. Such procedures included examining, on a test basis, evidence regarding the amounts and disclosures in the consolidated financial statements. Our audit also included evaluating the accounting principles used and significant estimates made by management, as well as evaluating the overall presentation of the consolidated financial statements. We believe that our audit provides a reasonable basis for our opinion.
|
/s/ Eide Bailly LLP |
|
|
Eide Bailly LLP |
|
We have served as the Company's auditor since 2017.
Denver, Colorado
March 28, 2018
48
PetroShare Corp.
December 31,
|
|
|
2017 |
|
2016 |
||
|
|
|
|
|
(see Note 14) |
||
|
ASSETS |
|
|
|
|
|
|
|
Current assets: |
|
|
|
|
|
|
|
Cash |
|
$ |
713,924 |
|
$ |
2,449,412 |
|
Accounts receivable - joint interest billing |
|
|
828,583 |
|
|
240,450 |
|
Accounts receivable - joint interest billing - related party |
|
|
204,730 |
|
|
286,226 |
|
Accounts receivable - crude oil, natural gas and NGL sales |
|
|
1,412,612 |
|
|
179,236 |
|
Accounts receivable - other |
|
|
— |
|
|
27,876 |
|
Prepaid expenses and other assets |
|
|
26,795 |
|
|
1,178,081 |
|
Deferred financing fee, net |
|
|
251,389 |
|
|
— |
|
Total current assets |
|
|
3,438,033 |
|
|
4,361,281 |
|
Crude oil and natural gas properties - using successful efforts method: |
|
|
|
|
|
|
|
Proved crude oil and natural gas properties |
|
|
22,144,366 |
|
|
8,132,881 |
|
Unproved crude oil and natural gas properties |
|
|
1,919,335 |
|
|
4,092,550 |
|
Wells in progress |
|
|
9,858,262 |
|
|
2,168,092 |
|
Less: accumulated depletion, depreciation and amortization |
|
|
(2,849,374) |
|
|
(783,320) |
|
Crude oil and natural gas properties, net |
|
|
31,072,589 |
|
|
13,610,203 |
|
Property, plant and equipment, net |
|
|
168,411 |
|
|
39,542 |
|
Other assets |
|
|
233,871 |
|
|
15,758 |
|
TOTAL ASSETS |
|
$ |
34,912,904 |
|
$ |
18,026,784 |
|
LIABILITIES & SHAREHOLDERS’ EQUITY |
|
|
|
|
|
|
|
Current liabilities: |
|
|
|
|
|
|
|
Accounts payable and accrued liabilities |
|
$ |
4,140,352 |
|
$ |
3,009,106 |
|
Accounts payable and accrued liabilities - related party |
|
|
589,496 |
|
|
— |
|
Oil and gas revenue distributions payable |
|
|
148,103 |
|
|
144,526 |
|
Drilling advances - related party |
|
|
680,248 |
|
|
234,452 |
|
Asset retirement obligation |
|
|
288,784 |
|
|
— |
|
Line of credit - related party |
|
|
5,000,000 |
|
|
— |
|
Supplemental line of credit |
|
|
3,552,500 |
|
|
7,088,698 |
|
Convertible notes payable, net |
|
|
6,831,897 |
|
|
— |
|
Total current liabilities |
|
|
21,231,380 |
|
|
10,476,782 |
|
Long-term liabilities |
|
|
|
|
|
|
|
Line of credit - related party |
|
|
— |
|
|
5,000,000 |
|
Credit facility, net |
|
|
4,896,565 |
|
|
— |
|
Convertible notes payable, net |
|
|
— |
|
|
5,308 |
|
Other long-term liabilities |
|
|
67,265 |
|
|
23,128 |
|
Asset retirement obligation |
|
|
834,660 |
|
|
945,419 |
|
Total liabilities |
|
|
27,029,870 |
|
|
16,450,637 |
|
|
|
|
|
|
|
|
|
Shareholders’ equity: |
|
|
|
|
|
|
|
Preferred stock, $0.01 par value, 10,000,000 shares authorized, none issued or outstanding |
|
|
— |
|
|
— |
|
Common stock, $0.001 par value, 100,000,000 shares authorized, 27,718,802 and 21,964,282 shares issued and outstanding, respectively |
|
|
27,719 |
|
|
21,964 |
|
Additional paid-in capital |
|
|
28,553,736 |
|
|
11,405,225 |
|
Accumulated deficit |
|
|
(20,698,421) |
|
|
(9,851,042) |
|
Total Shareholders’ Equity |
|
|
7,883,034 |
|
|
1,576,147 |
|
TOTAL LIABILITIES & SHAREHOLDERS’ EQUITY |
|
$ |
34,912,904 |
|
$ |
18,026,784 |
The accompanying notes are an integral part of these consolidated financial statements.
49
PetroShare Corp.
Consolidated Statements of Operations
For the years ended December 31,
|
|
|
|
|
2017 |
|
2016 |
||
|
|
|
|
|
|
|
|
|
(see Note 14) |
|
REVENUE: |
|
|
|
|
|
|
|
|
|
Crude oil sales |
|
|
|
$ |
8,719,793 |
|
$ |
239,810 |
|
Natural gas sales |
|
|
|
|
1,525,833 |
|
|
68,304 |
|
NGL sales |
|
|
|
|
861,948 |
|
|
25,002 |
|
Total revenue |
|
|
|
|
11,107,574 |
|
|
333,116 |
|
COSTS AND EXPENSES: |
|
|
|
|
|
|
|
|
|
Lease operating expense |
|
|
|
|
722,799 |
|
|
167,988 |
|
Production taxes, gathering and marketing |
|
|
|
|
992,817 |
|
|
38,634 |
|
Exploration costs |
|
|
|
|
61,693 |
|
|
19,259 |
|
Depletion, depreciation and amortization |
|
|
|
|
2,836,891 |
|
|
65,033 |
|
Accretion expense |
|
|
|
|
99,682 |
|
|
30,483 |
|
Plugging expense |
|
|
|
|
9,608 |
|
|
31,122 |
|
Loss on impairment of proved crude oil and natural gas properties |
|
|
|
|
— |
|
|
116,303 |
|
General and administrative expense |
|
|
|
|
6,205,412 |
|
|
4,022,969 |
|
Total costs and expenses |
|
|
|
|
10,928,902 |
|
|
4,491,791 |
|
Operating income (loss) |
|
|
|
|
178,672 |
|
|
(4,158,675) |
|
OTHER INCOME (EXPENSE): |
|
|
|
|
|
|
|
|
|
Other income |
|
|
|
|
39,381 |
|
|
573 |
|
Interest expense |
|
|
|
|
(9,293,782) |
|
|
(323,170) |
|
Loss on conversion of notes payable |
|
|
|
|
(1,771,650) |
|
|
— |
|
Total other (expense) |
|
|
|
|
(11,026,051) |
|
|
(322,597) |
|
Net (loss) |
|
|
|
$ |
(10,847,379) |
|
$ |
(4,481,272) |
|
Net (loss) per share: |
|
|
|
|
|
|
|
|
|
Basic and diluted |
|
|
|
$ |
(0.46) |
|
$ |
(0.21) |
|
Weighted average number of shares outstanding: |
|
|
|
|
|
|
|
|
|
Basic and diluted |
|
|
|
|
23,530,583 |
|
|
21,828,853 |
The accompanying notes are an integral part of these consolidated financial statements.
50
PetroShare Corp.
Consolidated Statements of Changes in Shareholders’ Equity
For the years ended December 31, 2017 and 2016
|
|
|
|
|
|
|
|
Additional |
|
Accumulated |
|
|
|
||
|
|
|
Common Stock |
|
Paid-In |
|
Earnings/ |
|
|
|
|||||
|
|
|
Shares |
|
Amount |
|
Capital |
|
(Deficit) |
|
Total |
||||
|
Balance at December 31, 2015 |
|
21,633,191 |
|
$ |
21,633 |
|
$ |
8,124,443 |
|
$ |
(5,369,770) |
|
$ |
2,776,306 |
|
Issuance of common stock for cash at $1.00 per share |
|
95,000 |
|
|
95 |
|
|
94,905 |
|
|
— |
|
|
95,000 |
|
Issuance of common stock in connection with consulting agreements |
|
141,666 |
|
|
142 |
|
|
173,774 |
|
|
— |
|
|
173,916 |
|
Issuance of common stock for services |
|
50,000 |
|
|
50 |
|
|
50,455 |
|
|
— |
|
|
50,505 |
|
Issuance of common stock for lease acquisition |
|
14,425 |
|
|
14 |
|
|
26,672 |
|
|
— |
|
|
26,686 |
|
Issuance of common stock for property acquisition |
|
30,000 |
|
|
30 |
|
|
56,670 |
|
|
— |
|
|
56,700 |
|
Stock-based compensation |
|
— |
|
|
— |
|
|
1,140,967 |
|
|
— |
|
|
1,140,967 |
|
Common stock warrants issued in connection with private placement (revised - Note 14) |
|
— |
|
|
— |
|
|
1,033,586 |
|
|
— |
|
|
1,033,586 |
|
Beneficial conversion feature on convertible notes |
|
— |
|
|
— |
|
|
703,753 |
|
|
— |
|
|
703,753 |
|
Net (loss) (revised - Note 14) |
|
— |
|
|
— |
|
|
— |
|
|
(4,481,272) |
|
|
(4,481,272) |
|
Balance at December 31, 2016 (revised - Note 14) |
|
21,964,282 |
|
$ |
21,964 |
|
$ |
11,405,225 |
|
$ |
(9,851,042) |
|
$ |
1,576,147 |
|
Issuance of common stock in connection with conversion of convertible notes payable |
|
4,814,265 |
|
|
4,814 |
|
|
7,062,528 |
|
|
— |
|
|
7,067,342 |
|
Issuance of common stock for lease acquisition |
|
470,555 |
|
|
471 |
|
|
846,529 |
|
|
— |
|
|
847,000 |
|
Issuance of common stock for loan extension |
|
250,000 |
|
|
250 |
|
|
387,250 |
|
|
— |
|
|
387,500 |
|
Issuance of restricted shares |
|
219,700 |
|
|
220 |
|
|
155,111 |
|
|
— |
|
|
155,331 |
|
Beneficial conversion feature on convertible notes payable |
|
— |
|
|
— |
|
|
4,329,365 |
|
|
— |
|
|
4,329,365 |
|
Warrants issued in connection with convertible notes payable |
|
— |
|
|
— |
|
|
2,978,796 |
|
|
— |
|
|
2,978,796 |
|
Stock-based compensation |
|
— |
|
|
— |
|
|
1,388,932 |
|
|
— |
|
|
1,388,932 |
|
Net (loss) |
|
— |
|
|
— |
|
|
— |
|
|
(10,847,379) |
|
|
(10,847,379) |
|
Balance at December 31, 2017 |
|
27,718,802 |
|
$ |
27,719 |
|
$ |
28,553,736 |
|
$ |
(20,698,421) |
|
$ |
7,883,034 |
The accompanying notes are an integral part of these consolidated financial statements.
51
PetroShare Corp.
Consolidated Statements of Cash Flows
For the years ended December 31,
|
|
|
2017 |
|
2016 |
||
|
|
|
|
|
|
|
(see Note 14) |
|
Cash flows from operating activities: |
|
|
|
|
|
|
|
Net (loss) |
|
$ |
(10,847,379) |
|
$ |
(4,481,272) |
|
Adjustments to reconcile net (loss) to net cash provided by (used in) operating activities: |
|
|
|
|
|
|
|
Depletion, depreciation and amortization |
|
|
2,836,891 |
|
|
65,033 |
|
Deferred rental liability |
|
|
6,526 |
|
|
— |
|
Accretion of asset retirement obligation |
|
|
99,682 |
|
|
30,483 |
|
Accretion of debt discounts and deferred financing fee |
|
|
7,666,313 |
|
|
17,253 |
|
Loss on conversion of notes payable |
|
|
1,771,650 |
|
|
— |
|
Stock-based compensation |
|
|
1,544,261 |
|
|
1,365,388 |
|
Impairment of proved crude oil and natural gas properties |
|
|
— |
|
|
116,303 |
|
Changes in operating assets and liabilities: |
|
|
|
|
|
|
|
Accounts receivable - joint interest billing |
|
|
(588,132) |
|
|
144,168 |
|
Accounts receivable - joint interest billing - related party |
|
|
81,495 |
|
|
(286,226) |
|
Accounts receivable - crude oil, natural gas and NGL sales |
|
|
(1,233,376) |
|
|
(179,236) |
|
Accounts receivable - other |
|
|
— |
|
|
(27,876) |
|
Prepaid expenses and other assets |
|
|
961,048 |
|
|
(1,160,314) |
|
Accounts payable and accrued liabilities |
|
|
7,053,693 |
|
|
1,338,274 |
|
Accounts payable and accrued liabilities- related party |
|
|
589,496 |
|
|
— |
|
Accounts payable - oil and gas revenue distributions payable |
|
|
3,578 |
|
|
143,577 |
|
Drilling advances - related party |
|
|
445,796 |
|
|
234,452 |
|
Net cash provided by (used in) operating activities |
|
|
10,391,542 |
|
|
(2,679,993) |
|
Cash flows from investing activities: |
|
|
|
|
|
|
|
Additions of property, plant and equipment |
|
|
(91,186) |
|
|
(43,485) |
|
Development of crude oil and natural gas properties |
|
|
(17,052,313) |
|
|
(3,038,339) |
|
Acquisitions of crude oil and natural gas properties - business combinations |
|
|
— |
|
|
(4,820,742) |
|
Acquisitions of unproved crude oil and natural gas properties |
|
|
(3,202,380) |
|
|
(2,854,475) |
|
Net cash (used in) investing activities |
|
|
(20,345,879) |
|
|
(10,757,041) |
|
Cash flows from financing activities: |
|
|
|
|
|
|
|
Long-term debt - advances on initial line of credit |
|
|
— |
|
|
3,937,815 |
|
Repayment of supplemental line of credit |
|
|
(3,552,500) |
|
|
— |
|
Borrowings under supplemental line of credit |
|
|
— |
|
|
7,105,000 |
|
Convertible notes issued for cash |
|
|
11,771,349 |
|
|
1,737,340 |
|
Common stock issued for cash (net of offering costs) |
|
|
— |
|
|
95,000 |
|
Net cash provided by financing activities |
|
|
8,218,849 |
|
|
12,875,155 |
|
Cash: |
|
|
|
|
|
|
|
Net (decrease) in cash |
|
|
(1,735,488) |
|
|
(561,879) |
|
Cash, beginning of period |
|
|
2,449,412 |
|
|
3,011,291 |
|
Cash, end of period |
|
$ |
713,924 |
|
$ |
2,449,412 |
|
Supplemental cash flow disclosure: |
|
|
|
|
|
|
|
Cash paid for interest |
|
$ |
640,410 |
|
$ |
— |
|
Non-cash investing and financing activities: |
|
|
|
|
|
|
|
Acquisition of crude oil and natural gas properties - business combinations |
|
$ |
— |
|
$ |
973,604 |
|
Accrued development costs of crude oil and natural gas properties |
|
$ |
1,719,481 |
|
$ |
— |
|
Addition of property, plant and equipment through tenant improvement allowance |
|
$ |
84,460 |
|
$ |
— |
|
Beneficial conversion feature in connection with convertible notes payable |
|
$ |
4,329,365 |
|
$ |
— |
|
Issuance of common stock warrants in connection with convertible notes payable |
|
$ |
2,978,796 |
|
$ |
191,692 |
|
Issuance of common stock in connection with conversion of notes payable and accrued interest |
|
$ |
7,067,342 |
|
$ |
— |
|
Conversion of notes payable and accrued interest to common stock |
|
$ |
5,295,692 |
|
$ |
— |
|
Issuance of common stock in connection with lease acquisitions |
|
$ |
847,000 |
|
$ |
26,686 |
|
Issuance of common stock for property acquisition |
|
$ |
— |
|
$ |
56,700 |
|
Issuance of common stock in connection with deferred financing fee |
|
$ |
387,500 |
|
$ |
— |
|
Accounts payable paid with credit facility borrowing |
|
$ |
4,895,128 |
|
$ |
— |
|
Financing fee paid through credit facility borrowing |
|
$ |
104,871 |
|
$ |
— |
|
Revisions and other non-cash changes to asset retirement obligation |
|
$ |
127,826 |
|
$ |
— |
|
Forgiveness of accounts payable in connection with the sale of proven oil and gas properties |
|
$ |
4,683 |
|
$ |
— |
The accompanying notes are an integral part of these consolidated financial statements.
52
PetroShare Corp.
NOTES TO CONSOLIDATED FINANCIAL STATEMENTS
December 31, 2017 and 2016
NOTE 1 – ORGANIZATION AND NATURE OF BUSINESS
PetroShare Corp. (“PetroShare” or the “Company”) is a corporation organized under the laws of the State of Colorado on September 4, 2012 to investigate, acquire and develop crude oil and natural gas properties in the Rocky Mountain or mid-continent portion of the United States. Since inception, the Company has focused on financing activities and the acquisition, exploration and development of crude oil and natural gas prospects, and is currently focused in the Denver-Julesburg Basin, or DJ Basin, in northeast Colorado.
NOTE 2 - SUMMARY OF SIGNIFICANT ACCOUNTING POLICIES AND BASIS OF PRESENTATION
Principles of Consolidation
The consolidated financial statements include the accounts and balances of the Company and its wholly-owned subsidiary, CFW Resources, LLC, a Colorado limited liability company, and have been prepared in accordance with accounting principles generally accepted in the United States (“GAAP”).
Business Combinations
The Company accounts for the acquisition of oil and gas properties, that are not commonly controlled, based on the requirements of the Financial Accounting Standards Board (“FASB”) Accounting Standards Codification (“ASC”) Topic 805, Business Combinations, which requires an acquiring entity to recognize the assets acquired and liabilities assumed at fair value under the acquisition method of accounting, provided such assets and liabilities qualify for acquisition accounting under the standard. The Company accounts for certain property acquisitions of proved developed oil and gas property as business combinations.
Use of Estimates
The preparation of consolidated financial statements in conformity with US GAAP requires management to make estimates and assumptions that affect the reported amounts of assets and liabilities and disclosure of contingent assets and liabilities at the date of the consolidated financial statements and the reported amounts of revenues and expenses during the reporting period.
Estimated quantities of crude oil, natural gas and natural gas liquids reserves are the most significant of the Company’s estimates. All reserve data included in these consolidated financial statements are based on estimates. Reservoir engineering is a subjective process of estimating underground accumulations of crude oil, natural gas and natural gas liquids. There are numerous uncertainties inherent in estimating quantities of proved crude oil, natural gas and natural gas liquids reserves. The accuracy of any reserve estimate is a function of the quality of available data and of engineering and geological interpretation and judgment. As a result, reserve estimates may be different from the quantities of crude oil, natural gas and natural gas liquids that are ultimately recovered.
Other items subject to estimates and assumptions include, but are not limited to, the carrying amounts of property, plant and equipment, asset retirement obligations, valuation allowances for deferred income tax assets and valuation assumptions related to the Company’s stock-based compensation. Management evaluates estimates and assumptions on an ongoing basis using historical experience and other factors, including the current economic and commodity price environment. The volatility of commodity prices results in increased uncertainty inherent in such estimates and assumptions. See Note 17, Unaudited Crude Oil and Natural Gas Reserves Information.
53
PetroShare Corp.
NOTES TO CONSOLIDATED FINANCIAL STATEMENTS
December 31, 2017 and 2016
Loss Per Common Share
Basic and diluted loss per share attributable to PetroShare shareholders is computed by dividing net loss by the weighted average number of common shares outstanding during the period. The Company excluded potentially dilutive securities as shown below, as the effect of their inclusion would be considered anti-dilutive.
Potentially dilutive securities at December 31, 2017 and 2016 are as follows:
|
|
|
December 31, |
|
December 31, |
|
|
|
2017 |
|
2016 |
|
Exercisable stock options |
|
4,347,500 |
|
3,010,000 |
|
Warrants issued to underwriter |
|
255,600 |
|
255,600 |
|
Warrants issued to convertible note holders |
|
6,666,600 |
|
1,294,987 |
|
Warrants issued to placement agent - convertible note offering |
|
666,600 |
|
129,526 |
|
Shares underlying convertible notes |
|
6,372,066 |
|
1,295,067 |
|
Total |
|
18,308,366 |
|
5,985,180 |
Cash
The Company’s bank accounts periodically exceed federally insured limits. The Company maintains its deposits with high quality financial institutions and, accordingly, believes its credit risk exposure associated with cash is minimal.
Revenue Recognition
The Company recognizes revenue from the sale of crude oil, natural gas and NGLs when production is delivered to, and title has transferred to, the purchaser and to the extent the selling price is reasonably determinable. In general, settlements for hydrocarbon sales may occur after the month in which the oil, natural gas or other hydrocarbon products were produced. The Company may estimate and accrue for the value of these sales using information available to it at the time its consolidated financial statements are generated. Differences are reflected in the accounting period that payments are received from the purchaser.
Accounts Receivable – Crude oil, natural gas and NGLs
Accounts receivable – Crude oil, natural gas and NGLs consists of amounts receivable from sales from the Company’s well interests. Management continually monitors accounts receivable for collectability.
Accounts Receivable – Joint interest billing
Accounts receivable – Joint interest billing consists primarily of joint interest billings, which are recorded at the invoiced and to-be-invoiced amounts. Collateral is not required for such receivables, nor is interest charged on past due balances. Joint interest billing receivables are collateralized by the pro rata revenue attributable to the joint interest holders and further by the interest itself.
54
PetroShare Corp.
NOTES TO CONSOLIDATED FINANCIAL STATEMENTS
December 31, 2017 and 2016
Allowance for doubtful accounts
The Company recognizes an allowance for losses on accounts receivable in an amount equal to the estimated probable losses net of recoveries. The allowance is based on an analysis of historical bad debt experience, current receivables aging, and expected future write-offs, as well as an assessment of specific identifiable customer accounts considered at risk or uncollectible. The expense associated with the allowance for doubtful accounts is recognized as other expense. We have not recorded an allowance for doubtful accounts as of December 31, 2017 and 2016, respectively.
Deferred Equity Issuance Costs
The Company defers as other current assets the direct incremental costs of raising capital through equity offerings until such time as the offering is completed. At the time of the offering completion, the costs are charged against the capital raised. Should the offering be terminated, deferred offering costs are charged to operations during the period in which the offering is terminated.
Capitalized Interest Costs
The Company has capitalized certain interest costs related to unproved properties that the Company is currently preparing for their intended use. The interest costs that have been capitalized to oil and gas properties total $0.3 million and $nil for the years ended December 31, 2017 and 2016, respectively.
Concentration of Credit Risk and Major Customers
The Company is exposed to credit risk in the event of nonpayment by counterparties, a significant portion of which are concentrated in energy related industries. The creditworthiness of customers and other counterparties is subject to regular review.
The Company does not believe the loss of any single purchaser of its production would materially impact its operating results, as crude oil, natural gas, and NGLs are products with well-established markets and numerous purchasers in the Company’s operating regions. The Company had the following major customers, which accounted for 10 percent or more of its total crude oil, natural gas, and NGL production revenue for at least one of the periods presented:
|
|
|
For the Years Ended December 31, |
||||
|
|
|
2017 |
|
2016 |
||
|
Great Western Operating Company |
|
22 |
% |
|
43 |
% |
|
Kerr-McGee Oil and Gas Onshore |
|
4 |
% |
|
23 |
% |
|
Ward Petroleum |
|
2 |
% |
|
20 |
% |
|
DCP Midstream |
|
1 |
% |
|
11 |
% |
|
PDC Energy, Inc. |
|
71 |
% |
|
0 |
% |
|
|
|
The Company maintains its primary bank accounts with a large, multinational bank that has branch locations in the Company’s areas of operations. The Company’s policy is to diversify its concentration of cash and cash equivalent investments among multiple institutions and investment products to limit the amount of credit exposure to any single institution or investment.
55
PetroShare Corp.
NOTES TO CONSOLIDATED FINANCIAL STATEMENTS
December 31, 2017 and 2016
Crude Oil and Natural Gas Properties
Proved
The Company follows the successful efforts method of accounting for its crude oil and natural gas properties. Under this method of accounting, all property acquisition costs and development costs are capitalized when incurred and depleted on a units-of-production basis over the remaining life of proved reserves and proved developed reserves, respectively. Costs of drilling exploratory wells are initially capitalized but are charged to expense if the well is determined to be unsuccessful.
The Company assesses its proved crude oil and natural gas properties for impairment whenever events or circumstances indicate that the carrying value of the assets may not be recoverable. The impairment test compares estimated undiscounted future net cash flows to the assets’ net book value. If the net capitalized costs exceed estimated future net cash flows, then the cost of the property is written down to fair value. Fair value for crude oil and natural gas properties is generally determined based on estimated discounted future net cash flows. Impairment expense for proved properties is reported in exploration and impairment expense.
The net carrying values of retired, sold or abandoned properties that constitute less than a complete unit of depreciable property are charged or credited, net of proceeds, to accumulated depletion, depreciation and amortization unless doing so significantly affects the unit-of-production amortization rate, in which case a gain or loss is recognized in the statement of operations. Gains or losses from the disposal of complete units of depreciable property are recognized in operations.
Unproved
Unproved properties consist of costs to acquire undeveloped leases as well as costs to acquire unproved reserves. Undeveloped lease costs and unproved reserve acquisitions are capitalized, and individually insignificant unproved properties are amortized on a composite basis, based on past success, past experience and average lease-term lives. The Company evaluates significant unproved properties for impairment based on remaining lease term, drilling results, reservoir performance, seismic interpretation or future plans to develop acreage. When successful wells are drilled on undeveloped leaseholds, unproved property costs are reclassified as proved properties and depleted on a units-of-production basis. Impairment expense for unproved properties is reported in exploration and impairment expense.
Exploratory
Geological and geophysical costs, including exploratory seismic studies, and the costs of carrying and retaining unproved acreage are expensed as incurred. Costs of seismic studies that are utilized in development drilling within an area of proved reserves are capitalized as development costs. Amounts of seismic costs capitalized are based on only those blocks of data used in determining development well locations. To the extent that a seismic project covers areas of both developmental and exploratory drilling, those seismic costs are proportionately allocated between development costs and exploration expense.
Costs of drilling exploratory wells are initially capitalized, pending determination of whether the well contains proved reserves. If an exploratory well does not contain proved reserves, the costs of drilling the well and other associated costs are charged to expense. Costs incurred for exploratory wells that contain reserves, which cannot yet be classified as proved, continue to be capitalized if (a) the well has found a sufficient quantity of reserves to justify completion as a producing well, and (b) the Company is making sufficient progress assessing the reserves and the economic and operating viability of the project. If either condition is not met, or if the Company obtains information that
56
PetroShare Corp.
NOTES TO CONSOLIDATED FINANCIAL STATEMENTS
December 31, 2017 and 2016
raises substantial doubt about the economic or operational viability of the project, the exploratory well costs, net of any salvage value, are expensed.
Property, Plant and Equipment
Property, plant and equipment are stated at cost, less accumulated depreciation. Depreciation is computed using straight-line methods over the estimated useful lives of the related assets. Expenditures for renewals and betterments which increase the estimated useful life or capacity of the asset are capitalized; expenditures for repairs and maintenance are expensed as incurred.
Asset Impairment
Proved crude oil and natural gas properties are reviewed for impairment on a field-by-field basis each quarter, or when events and circumstances indicate a possible decline in the recoverability of the carrying value of such field. The estimated future undiscounted cash flows expected in connection with the field are compared to the carrying amount of the field to determine if the carrying amount is recoverable. If the carrying amount of the field exceeds its estimated undiscounted future cash flows, the carrying amount of the field is reduced to its estimated fair value. Due to the unavailability of relevant comparable market data, a discounted cash flow method is used to determine the fair value of proved properties. The discounted cash flow method utilizes the most recent third-party reserve estimation report and estimates future cash flows based on management’s estimates of future crude oil and natural gas production, commodity prices based on commodity futures price strips, operating and development costs, and a risk-adjusted discount rate.
Depletion, Depreciation and Amortization
Depletion, depreciation and amortization of capitalized drilling and development costs of producing crude oil and natural gas properties, including related support equipment and facilities, are computed using the units-of-production method on a field basis based on total estimated proved developed crude oil and natural gas reserves. Amortization of producing leaseholds is based on the units-of-production method using total estimated proved reserves. In arriving at rates under the units-of-production method, the quantities of recoverable crude oil and natural gas reserves are established based on estimates made by the Company and independent reserve engineers. Upon sale or retirement of properties, the cost and related accumulated depletion, depreciation and amortization are eliminated from the accounts and the resulting gain or loss, if any, is recognized. Units-of-production rates are revised whenever there is an indication of a need, but at least in conjunction with annual reserve reports. Revisions are accounted for prospectively as changes in accounting estimates.
Drilling Advances - Related Party
The Company’s drilling advances consist of cash provided to the Company from its joint interest partners for planned drilling activities. Advances are applied against the joint interest partners’ share of expenses incurred.
Prepaid Drilling Costs
Prepaid drilling costs consist of cash payments made by the Company to the operators of oil and gas properties and other third-party service providers.
Income Taxes
The Company recognizes deferred tax assets and liabilities based on differences between the financial reporting and tax bases of assets and liabilities using the enacted tax rates that are expected to be in effect when the differences are expected to be recovered. The Company provides a valuation allowance for deferred tax assets for which it does not
57
PetroShare Corp.
NOTES TO CONSOLIDATED FINANCIAL STATEMENTS
December 31, 2017 and 2016
consider realization of such assets to be more likely than not. The Company complies with authoritative accounting guidance regarding uncertain tax provisions. The entire amount of unrecognized tax benefit reported by the Company would affect its effective tax rate if recognized. Interest expense in the accompanying statements of operations includes a negligible amount associated with income taxes. The Company does not expect a significant change to the recorded unrecognized tax benefits in 2018.
Asset Retirement Obligation
Asset retirement obligations associated with tangible long-lived assets are accounted for in accordance with Accounting Standards Codification (“ASC”) 410, “Accounting for Asset Retirement Obligations.” The estimated fair value of the future costs associated with dismantlement, abandonment and restoration of crude oil and natural gas properties is recorded generally upon the completion of a well. The net estimated costs are discounted to present values using a credit-adjusted risk-free interest rate over the estimated economic life of the crude oil and natural gas properties. Such costs are capitalized as part of the related asset. The asset is depleted on the units-of-production method. The liability is periodically adjusted to reflect: (1) new liabilities incurred; (2) liabilities settled during the period; (3) accretion expense; and (4) revisions to estimated future cash flow requirements.
Stock-Based Compensation
The Company uses the Black-Scholes option-pricing model to determine the fair-value of stock-based awards in accordance with ASC 718, “Compensation.” The option-pricing model requires the input of highly subjective assumptions, including the option’s expected life, the price volatility of the underlying stock, and the estimated dividend yield of the underlying stock. The expected term of outstanding stock-based awards represents the period that stock-based awards are expected to be outstanding and is determined based on the contractual terms of the stock-based awards, vesting schedules and expectations of future employee behavior as influenced by changes to the terms of its stock-based awards. As there was insufficient historical data available to ascertain a forfeiture rate for these awards, the plain vanilla method was applied in calculating the expected term of the options. The Company’s common stock has limited historical trading data, and as a result the expected stock price volatility is based on the historical volatility of a group of publicly-traded companies that share similar operating metrics and histories. The Company has never paid dividends on its common stock and does not intend to do so in the foreseeable future, and as such, the expected dividend yield is zero.
Loans and Borrowings
Borrowings are recognized initially at fair value, net of financing costs incurred, and subsequently measured at amortized cost. Any difference between the amounts originally received and the redemption value of the debt is recognized in the consolidated statement of operations over the period to maturity using the effective interest method.
Fair Value of Financial Instruments
Fair value accounting, as prescribed in ASC Section 825, “Financial Instruments,” utilizes a fair value hierarchy that prioritizes the inputs to valuation techniques used to measure fair value. The hierarchy gives the highest priority to unadjusted quoted prices in active markets for identical assets and liabilities (Level 1 measurements) and the lowest priority to unobservable inputs (Level 3 measurements). The three levels of the fair value hierarchy are described below:
Level 1Unadjusted quoted prices in active markets that are accessible at the measurement date for identical, unrestricted assets or liabilities;
Level 2Quoted prices in markets that are not active, or inputs that are observable, either directly or indirectly, for substantially the full term of the asset or liability; and
58
PetroShare Corp.
NOTES TO CONSOLIDATED FINANCIAL STATEMENTS
December 31, 2017 and 2016
Level 3Prices or valuation techniques that require inputs that are both significant to the fair value measurement and unobservable (supported by little or no market activity).
Going Concern Assessment
Pursuant to Accounting Standards Update (“ASU”) 2014-15, Presentation of Financial Statements – Going Concern the Company has assessed its ability to continue as a going concern for a period of one year from the date of the issuance of these consolidated financial statements. Substantial doubt about an entity’s ability to continue as a going concern exists when relevant conditions and events, considered in the aggregate, indicate that it is probable that the entity will be unable to meet its obligations as they become due within one year from the consolidated financial statement issuance date. As shown in the accompanying consolidated financial statements, the Company incurred a net loss of $10.8 million during the year ended December 31, 2017, and as of that date, the Company's current liabilities exceeded its current assets by $17.8 million, the Company had a cash balance of $0.7 million and other current assets of $2.7 million.
As of December 31, 2017, the Company had insufficient working capital and revenues from operations to meet its maturing debt obligations and other liabilities incurred and to be incurred in connection with the Company’s development activities. The Company will also need to generate sufficient cash flow from operations and sell equity or debt to fund further drilling and acquisition activity. If sufficient cash flow and additional financing is not available, the Company may be compelled to reduce the scope of its business activities and/or sell a portion of the Company’s interests in its oil and gas properties. This, in turn, may have an adverse effect on the Company’s ability to realize the value of its assets. These factors raise substantial doubt about the Company’s ability to continue as a going concern.
Management has evaluated these conditions and determined that a reduction in the working capital deficit subsequent to December 31, 2017 as a result of a new term Credit Facility (Note 6) coupled with anticipated increased revenues from the Company’s non-operated and operated properties, may allow the Company to meet its maturing debt and interest obligations. However, to continue to execute its business plan, additional capital will be required. As part of the analysis, the Company considered selective participation in certain non-operated drilling programs based on availability of working capital and the timing of production-related cash flows.
The Company’s consolidated financial statements do not include any adjustments related to the realization of the carrying value of assets or the amounts and classification of liabilities that might be necessary should the Company be unable to continue in existence.
Recently Issued Accounting Pronouncements
In February 2016, the FASB issued ASU No. 2016-02, Leases (Topic 842) (“ASU 2016-02”), which requires lessees to recognize a right-of-use asset and a lease liability for virtually all leases currently classified as operating leases. The Company is currently analyzing the impact this standard will have on the Company’s leases, including non-cancelable leases, drilling rigs, pipeline gathering, transportation, gas processing, and other existing arrangements. Further, the Company is evaluating current accounting policies, applicable systems, controls, and processes to support the potential recognition and disclosure changes resulting from ASU 2016-02. Based upon the Company’s initial assessment, ASU 2016-02 is expected to result in an increase in assets and liabilities recorded. The Company will adopt ASU 2016-02 using a modified retrospective method on the effective date of January 1, 2019. In January 2018, the FASB issued ASU No. 2018-01, Leases (Topic 842): Land Easement Practical Expedient for Transition to Topic 842 (“ASU 2018-01”). ASU 2018-01 provides an optional transitional practical expedient which allows entities to exclude from evaluation land easements that exist or expired before adoption of ASU 2016-02. The Company is currently evaluating this practical expedient and will adopt ASU 2018-01 at the same time as ASU 2016-02.
59
PetroShare Corp.
NOTES TO CONSOLIDATED FINANCIAL STATEMENTS
December 31, 2017 and 2016
In January 2017, the FASB issued ASU No. 2017-01, Business Combinations (Topic 805): Clarifying the Definition of a Business (“ASU 2017-01”). ASU 2017-01 clarifies the definition of a business with the objective of adding guidance to assist entities with evaluating whether transactions should be accounted for as acquisitions (or disposals) of assets or businesses. The Company has determined that the adoption of ASU 2017-01 on the effective date of January 1, 2018, using a prospective method, does not impact the Company’s current consolidated financial statements or disclosures. However, the clarified definition of a business will be applied by the Company to future transactions.
In February 2018, the FASB issued ASU No. 2018-02, Income Statement–Reporting Comprehensive Income (Topic 220): Reclassification of Certain Tax Effects from Accumulated Other Comprehensive Income (“ASU 2018-02”). ASU 2018-02 permits entities to reclassify tax effects stranded in accumulated other comprehensive income (loss) to retained earnings as a result of the 2017 Tax Act. ASU 2018-02, is to be applied either in the period of adoption or retrospectively to each period (or periods) in which the effect of the change in the United States federal corporate income tax rate in the 2017 Tax Act is recognized. The guidance is effective for annual periods, and interim periods within those annual periods, beginning after December 15, 2018. Early adoption is permitted as outlined in ASU 2018-02. The Company is currently evaluating the provisions of this guidance and assessing the potential impact on the Company’s consolidated financial statements and disclosures.
In May 2014, the FASB issued ASU 2014-09, “Revenue from Contracts with Customers (Topic 606)” (“ASU 2014-09”), which establishes a comprehensive new revenue recognition standard designed to depict the transfer of goods or services to a customer in an amount that reflects the consideration the entity expects to receive in exchange for those goods or services. In doing so, companies may need to use more judgment and make more estimates than under current revenue recognition guidance. In March 2016, the FASB released certain implementation guidance through ASU 2016‑08 (collectively with ASU 2014-09, the "Revenue ASUs") to clarify principal versus agent considerations. The Revenue ASUs allow for the use of either the full or modified retrospective transition method, and the standard will be effective for annual reporting periods beginning after December 15, 2017 including interim periods within that period, with early adoption permitted for annual reporting periods beginning after December 15, 2016. Currently, the
Company has not identified any contracts that would require a change from the entitlements method, historically used for certain domestic crude oil and natural gas sales, to the sales method of accounting. The Company plans to adopt the guidance using the modified retrospective method on the effective date of January 1, 2018. The Company has determined that the adoption of, ASU 2014-09, does not impact the Company’s current consolidated financial statements or disclosures.
There are no other ASUs applicable to the Company that would have a material effect on the Company’s consolidated financial statements and related disclosures that have been issued but not yet adopted by the Company as of December 31, 2017, and through the filing of this report.
NOTE 3 - ACQUISITIONS
PDC Acquisition
On June 30, 2016, the Company completed the acquisition of certain oil and gas assets from PDC Energy, Inc. ("PDC"), including leases covering approximately 3,652 gross (1,410 net) acres of lands located in Adams County, Colorado and PDC's interest in 35 producing wells ("PDC assets"). Simultaneous with the closing, the Company's working interest partner exercised its option under a participation agreement (the "Participation Agreement") and acquired 50% of the Company's interest in the PDC assets. The acquisition was effective April 1, 2016.
60
PetroShare Corp.
NOTES TO CONSOLIDATED FINANCIAL STATEMENTS
December 31, 2017 and 2016
Following a final proration of costs and revenues from the operation of the PDC assets and the Company's working interest partner's exercise of its option under the Participation Agreement, the Company's net purchase price for the PDC assets was $2.3 million. A final allocation of the purchase price was prepared using, among other things, an internally prepared reserve analysis. The following table summarizes the consideration transferred, fair value of assets acquired, and liabilities assumed:
|
|
|
December 31, |
|
|
|
|
2016 |
|
|
Consideration: |
|
|
|
|
Cash |
|
|
2,260,890 |
|
Total consideration |
|
$ |
2,260,890 |
|
|
|
|
|
|
Fair Value of Liabilities Assumed: |
|
|
|
|
Current liabilities |
|
|
93,225 |
|
Asset retirement obligations |
|
|
542,611 |
|
Total consideration plus liabilities assumed |
|
$ |
2,896,726 |
|
|
|
|
|
|
Fair Value of Assets Acquired: |
|
|
|
|
Proved crude oil and gas properties |
|
|
2,473,082 |
|
Unproved crude oil and gas properties |
|
|
423,644 |
|
Amount attributable to assets acquired |
|
$ |
2,896,726 |
In accordance with FASB Topic ASC 805, the following table presents the unaudited pro forma combined results of operations for the years ended December 31, 2016, and 2015 (unaudited), as if the PDC assets acquisition had occurred on January 1, 2015. The unaudited pro forma results reflect significant pro forma adjustments related to depletion, depreciation and amortization expense, accretion expense and costs directly attributable to the acquisition, and operating costs incurred as a result of the assets acquired. The pro forma results do not include any cost savings or other synergies that may result from the acquisition or any estimated costs that have been or will be incurred by the Company to integrate the properties acquired. The pro forma results are not necessarily indicative of what actually would have occurred if the acquisition had been completed as of the beginning of the period, nor are they necessarily indicative of future results.
|
|
|
Year Ended December 31, |
||||
|
|
|
2016 |
|
2015 |
||
|
Crude oil and natural gas revenues |
|
$ |
466,138 |
|
$ |
423,653 |
|
Net income (loss) |
|
$ |
(4,498,325) |
|
$ |
(1,439,823) |
|
Net income (loss) per common share basic and diluted |
|
$ |
(0.21) |
|
$ |
(0.08) |
Crimson Acquisition
On December 22, 2016, the Company completed the acquisition of certain oil and gas assets from Crimson Exploration Operating, Inc. (“Crimson”), including leases covering approximately 15,514 gross (5,609 net) acres of lands located mostly in Adams and Weld Counties, Colorado and Crimson’s interest in 32 producing wells (“Crimson assets”). Simultaneous with the closing, the Company’s working interest partner acquired 50% of the Company’s interest in the Crimson assets. The acquisition was effective December 1, 2016.
Following a reconciliation of certain suspense and inventory accounts, the Company’s net purchase price for the Crimson assets was $2.5 million.
61
PetroShare Corp.
NOTES TO CONSOLIDATED FINANCIAL STATEMENTS
December 31, 2017 and 2016
An Allocation of the purchase price was prepared using, among other things, an internally-prepared reserve analysis. The following table summarizes the consideration transferred, fair value of assets acquired, and liabilities assumed:
|
|
|
December 31, |
|
|
|
|
2016 |
|
|
Consideration: |
|
|
|
|
Cash |
|
|
2,559,852 |
|
Total consideration |
|
$ |
2,559,852 |
|
|
|
|
|
|
Fair Value of Liabilities Assumed: |
|
|
|
|
Current liabilities |
|
|
13,938 |
|
Asset retirement obligations |
|
|
337,468 |
|
Total consideration plus liabilities assumed |
|
$ |
2,911,258 |
|
|
|
|
|
|
Fair Value of Assets Acquired: |
|
|
|
|
Current assets |
|
|
20,907 |
|
Proved crude oil and gas properties |
|
|
899,591 |
|
Unproved crude oil and gas properties |
|
|
1,990,760 |
|
Amount attributable to assets acquired |
|
$ |
2,911,258 |
In accordance with FASB Topic ASC 805, the following table presents the unaudited pro forma combined results of operations for the years ended December 31, 2016, and 2015 (unaudited), as if the Crimson assets acquisition had occurred on January 1, 2015. The unaudited pro forma results reflect significant pro forma adjustments related to depletion expense, accretion expense and costs directly attributable to the acquisition, and operating costs incurred as a result of the assets acquired. The pro forma results do not include any cost savings or other synergies that may result from the acquisition or any estimated costs that have been or will be incurred by the Company to integrate the properties acquired. The pro forma results are not necessarily indicative of what actually would have occurred if the acquisition had been completed as of the beginning of the period, nor are they necessarily indicative of future results.
|
|
|
Year Ended December 31, |
||||
|
|
|
2016 |
|
2015 |
||
|
Crude oil and natural gas revenues |
|
$ |
595,074 |
|
$ |
237,035 |
|
Net income (loss) |
|
$ |
(4,437,877) |
|
$ |
(1,551,850) |
|
Net income (loss) per common share basic and diluted |
|
$ |
(0.20) |
|
$ |
(0.09) |
NOTE 4 – PROPERTY, PLANT AND EQUIPMENT
Property, plant and equipment balances were comprised of furniture, fixtures, and equipment and are shown below:
|
|
|
December 31, |
||||
|
|
|
2017 |
|
2016 |
||
|
Property, plant and equipment |
|
$ |
223,517 |
|
$ |
47,870 |
|
Accumulated depreciation |
|
|
(55,106) |
|
|
(8,328) |
|
Total |
|
$ |
168,411 |
|
$ |
39,542 |
62
PetroShare Corp.
NOTES TO CONSOLIDATED FINANCIAL STATEMENTS
December 31, 2017 and 2016
Depreciation expense recorded for the years ended December 31, 2017 and 2016 amounted to $46,778 and $5,772, respectively.
NOTE 5 – CRUDE OIL AND NATURAL GAS PROPERTIES
The Company’s crude oil and natural gas properties are located entirely within the United States. The net capitalized costs related to the Company’s crude oil and natural gas producing activities were as follows:
|
|
|
As of December 31, |
|||||||||
|
|
|
2017 |
|
2016 |
|||||||
|
Proved oil and gas properties |
|
$ |
22,144,366 |
|
$ |
8,132,881 |
|||||
|
Unproved oil and gas properties (1) |
|
|
1,919,335 |
|
|
4,092,550 |
|||||
|
Wells in progress (2) |
|
|
9,858,262 |
|
|
2,168,092 |
|||||
|
Total capitalized costs |
|
|
33,921,963 |
|
|
14,393,523 |
|||||
|
Accumulated depletion, depreciation and amortization |
|
|
(2,849,374) |
|
|
(783,320) |
|||||
|
Net capitalized costs |
|
$ |
31,072,589 |
|
$ |
13,610,203 |
|||||
|
(1) |
Unproved oil and gas properties represent unevaluated costs the Company excludes from the amortization base until proved reserves are established or impairment is determined. |
|
(2) |
Costs from wells in progress are excluded from the amortization base until production commences. |
Costs Incurred in Crude Oil and Natural Gas Activities. Costs incurred in connection with the Company’s crude oil and natural gas acquisition, exploration and development activities for each of the periods are shown below:
|
|
|
December 31, |
||||
|
|
|
2017 |
|
2016 |
||
|
Exploration costs |
|
$ |
61,693 |
|
$ |
2,700 |
|
Development costs |
|
|
18,771,794 |
|
|
3,038,339 |
|
Acquisition of properties |
|
|
|
|
|
|
|
Proved |
|
|
— |
|
|
3,630,195 |
|
Unproved |
|
|
4,049,380 |
|
|
4,045,022 |
|
Total |
|
$ |
22,882,867 |
|
$ |
10,716,256 |
During the years ended December 31, 2017 and 2016, depletion, depreciation and amortization expense was $2.8 million and $0.1 million, respectively.
2017 Activity
Significant acquisitions during 2017 included the following:
On April 3, 2017, the Company completed an acquisition of oil and gas leases covering approximately 5,874 gross (1,462 net) acres in Adams and Weld Counties, Colorado. The seller reserved to itself all rights in the leases that exist below 50 feet above the top of the uppermost J Sand formation for those lands located in Township 7 North, Range 63 West in Weld County, Colorado. The acquisition was effective January 1, 2017. The net purchase price to the Company’s retained interest in the assets, following the Company’s working interest partner’s 50% participation in the transaction and a reduction in purchase price due to title defects, was $1.3 million. The Company paid $0.5 million of the Company’s net purchase price in cash, and $0.8 million was paid through the issuance of 450,000 shares of the Company’s common stock valued at $1.80 per share.
63
PetroShare Corp.
NOTES TO CONSOLIDATED FINANCIAL STATEMENTS
December 31, 2017 and 2016
On April 21, 2017, the Company acquired a 9.37% royalty interest covering approximately 145 net acres located in Adams County, Colorado for a net purchase price of $0.6 million following the Company’s working interest partner’s 50% participation in the transaction. The acquisition was effective April 1, 2017. In connection with the acquisition, the Company paid a finders’ fee of 20,555 shares of common stock valued at $1.80 per share to a lease broker.
On May 9, 2017, the Company acquired 200 gross (70 net) acres in Adams County, Colorado for a net purchase price of $0.4 million following the Company’s working interest partner’s 50% participation in the transaction. The transaction was effective April 1, 2017.
On September 15, 2017, the Company completed a purchase of additional oil and gas leases covering approximately 400 gross (200 net) acres. The gross purchase price was $0.4 million, or $0.2 million to the Company’s retained interest following the Company’s working interest partner’s 50% participation in the transaction. The location of the acreage is contiguous with that of the acreage acquired in the April 3, 2017 transaction described above.
2016 Activity
Significant acquisitions during 2016 included the following:
On March 10, 2016, the Company acquired certain surface rights and easements on lands located in Township 1 South, Range 67 West in its Todd Creek Farms prospect in exchange for $0.2 million in cash. The surface rights and easements allow the Company to access its Shook pad wells.
On March 31, 2016, the Company acquired oil and gas assets on land adjacent to the Company’s Todd Creek Farms prospect, including approximately 160 net acres and a 50% working interest in one well following an assignment to the Company’s working interest partner pursuant to the Participation Agreement. The Company’s net cost for the foregoing assets was $0.6 million.
On April 14, 2016, the Company acquired oil and gas leases in the Todd Creek Farms prospect covering approximately 189 net acres. The Company’s net cost for the leases was $0.3 million.
In connection with obtaining its supplemental line of credit (Note 6), the Company assigned Providence Energy Partners III, LP (“PEP III”) 10% of the Company’s working interest in 278 gross (170 net) net acres in the Wattenberg Field including the Company’s interest in the Jacobucci wells.
On October 14, 2016, the Company completed the acquisition of additional royalty interests in 10 Jacobucci pad wells located on its Todd Creek Farms prospect. The Company’s net cost for the royalty interests was $1.6 million.
64
PetroShare Corp.
NOTES TO CONSOLIDATED FINANCIAL STATEMENTS
December 31, 2017 and 2016
NOTE 6 – DEBT
The following table presents account balances and activity for our various debt instruments as of December 31:
|
|
|
Initial |
|
Supplemental |
|
Convertible |
|
Convertible |
|
|
|
||||
|
|
|
Line of |
|
Line of |
|
Notes |
|
Notes |
|
Credit |
|||||
|
|
|
Credit |
|
Credit |
|
Series A |
|
Series B |
|
Facility |
|||||
|
December 31, 2015 Principal Balance |
|
$ |
(1,062,185) |
|
$ |
- |
|
$ |
- |
|
$ |
- |
|
$ |
- |
|
Principal |
|
|
|
|
|
|
|
|
|
|
|
|
|
|
|
|
Borrowings |
|
|
(3,937,815) |
|
|
(7,105,000) |
|
|
(1,942,600) |
|
|
- |
|
|
- |
|
Repayments |
|
|
- |
|
|
- |
|
|
- |
|
|
- |
|
|
- |
|
Conversions |
|
|
- |
|
|
- |
|
|
- |
|
|
- |
|
|
- |
|
|
|
|
|
|
|
|
|
|
|
|
|
|
|
|
|
|
Beginning Balance - Unamortized Debt Issuance Costs - Original Issuer Discount |
|
|
- |
|
|
- |
|
|
- |
|
|
- |
|
|
- |
|
Additions |
|
|
- |
|
|
- |
|
|
205,260 |
|
|
- |
|
|
- |
|
Accretion |
|
|
- |
|
|
- |
|
|
(557) |
|
|
- |
|
|
- |
|
Ending - Unamortized Debt Issuance Costs - Original Issuer Discount |
|
|
- |
|
|
- |
|
|
204,703 |
|
|
- |
|
|
- |
|
|
|
|
|
|
|
|
|
|
|
|
|
|
|
|
|
|
Beginning Balance - Unamortized Debt Issuance Costs - Beneficial Conversion Feature |
|
|
- |
|
|
- |
|
|
- |
|
|
- |
|
|
- |
|
Additions |
|
|
- |
|
|
- |
|
|
1,033,585 |
|
|
- |
|
|
- |
|
Accretion |
|
|
- |
|
|
- |
|
|
(2,823) |
|
|
- |
|
|
- |
|
Ending - Unamortized Debt Issuance Costs - Beneficial Conversion Feature |
|
|
- |
|
|
- |
|
|
1,030,762 |
|
|
- |
|
|
- |
|
|
|
|
|
|
|
|
|
|
|
|
|
|
|
|
|
|
Beginning Balance - Unamortized Debt Issuance Costs - Warrant Discount |
|
|
- |
|
|
- |
|
|
- |
|
|
- |
|
|
- |
|
Additions |
|
|
- |
|
|
- |
|
|
703,753 |
|
|
- |
|
|
- |
|
Accretion |
|
|
- |
|
|
- |
|
|
(1,926) |
|
|
- |
|
|
- |
|
Ending - Unamortized Debt Issuance Costs - Warrant Discount |
|
|
- |
|
|
- |
|
|
701,827 |
|
|
- |
|
|
- |
|
|
|
|
|
|
|
|
|
|
|
|
|
|
|
|
|
|
December 31, 2016 Principal Balance |
|
$ |
(5,000,000) |
|
$ |
(7,105,000) |
|
$ |
(1,942,600) |
|
$ |
- |
|
$ |
- |
|
December 31, 2016, Total, net |
|
$ |
(5,000,000) |
|
$ |
(7,105,000) |
|
$ |
(5,308) |
|
$ |
- |
|
$ |
- |
|
Principal |
|
|
|
|
|
|
|
|
|
|
|
|
|
|
|
|
Borrowings |
|
|
- |
|
|
- |
|
|
(8,057,400) |
|
|
(4,724,900) |
|
|
(5,000,000) |
|
Repayments |
|
|
- |
|
|
(3,552,500) |
|
|
- |
|
|
- |
|
|
- |
|
Conversions |
|
|
- |
|
|
- |
|
|
5,166,800 |
|
|
- |
|
|
- |
|
|
|
|
|
|
|
|
|
|
|
|
|
|
|
|
|
|
Beginning Balance - Unamortized Debt Issuance Costs - Original Issuer Discount |
|
|
- |
|
|
- |
|
|
204,703 |
|
|
- |
|
|
- |
|
Additions |
|
|
- |
|
|
- |
|
|
804,750 |
|
|
205,211 |
|
|
104,871 |
|
Accretion |
|
|
- |
|
|
- |
|
|
(742,944) |
|
|
(36,887) |
|
|
(1,436) |
|
Ending - Unamortized Debt Issuance Costs - Original Issuer Discount |
|
|
- |
|
|
- |
|
|
266,509 |
|
|
168,324 |
|
|
103,435 |
|
|
|
|
|
|
|
|
|
|
|
|
|
|
|
|
|
|
Beginning Balance - Unamortized Debt Issuance Costs - Beneficial Conversion Feature |
|
|
- |
|
|
- |
|
|
1,030,762 |
|
|
- |
|
|
- |
|
Additions |
|
|
- |
|
|
- |
|
|
4,272,867 |
|
|
56,500 |
|
|
- |
|
Accretion |
|
|
- |
|
|
- |
|
|
(3,978,881) |
|
|
(11,959) |
|
|
- |
|
Ending - Unamortized Debt Issuance Costs - Beneficial Conversion Feature |
|
|
- |
|
|
- |
|
|
1,324,748 |
|
|
44,541 |
|
|
- |
|
|
|
|
|
|
|
|
|
|
|
|
|
|
|
|
|
|
Beginning Balance - Unamortized Debt Issuance Costs - Warrant Discount |
|
|
- |
|
|
- |
|
|
701,827 |
|
|
- |
|
|
- |
|
Additions |
|
|
- |
|
|
- |
|
|
2,978,791 |
|
|
- |
|
|
- |
|
Accretion |
|
|
- |
|
|
- |
|
|
(2,758,537) |
|
|
- |
|
|
- |
|
Ending - Unamortized Debt Issuance Costs - Warrant Discount |
|
|
- |
|
|
- |
|
|
922,081 |
|
|
- |
|
|
- |
|
|
|
|
|
|
|
|
|
|
|
|
|
|
|
|
|
|
|
|
|
|
|
|
|
|
|
|
|
|
|
|
|
|
|
December 31, 2017, Principal Balance |
|
$ |
(5,000,000) |
|
$ |
(3,552,500) |
|
$ |
(4,833,200) |
|
$ |
(4,724,900) |
|
$ |
(5,000,000) |
|
December 31, 2017, Total, net |
|
$ |
(5,000,000) |
|
$ |
(3,552,500) |
|
$ |
(2,319,862) |
|
$ |
(4,512,035) |
|
$ |
(4,896,565) |
65
PetroShare Corp.
NOTES TO CONSOLIDATED FINANCIAL STATEMENTS
December 31, 2017 and 2016
On May 13, 2015, the Company entered into a revolving line of credit facility agreement (“Initial Line of Credit”) with PEO which provided the Company with a revolving line of credit of up to $5.0 million, maturing June 30, 2018.
PEO is the beneficial owner of approximately 11.7% of the Company’s outstanding common stock. The initial interest rate of 8% per year on the initial line of credit was increased twice in connection with other transactions involving the parties, the first time in September 2017 to 10% per year and the second time in December 2017 to 15% per year. The initial line of credit was repaid in full in February 2018, together with accrued interest of $0.6 million, as part of another financing.
Supplemental Line of Credit
On October 13, 2016, the Company entered into a revolving line of credit facility agreement (the “Supplemental Line of Credit”) with Providence Energy Partners, III, LP (“PEP III”) under which the Company was originally entitled to borrow up to $10.0 million. PEP III is an affiliate of PEO by virtue of having some common management personnel. Interest on the Supplemental Line of Credit initially accrued at the rate of 8% per year and the line matured on April 13, 2017.
The Supplemental Line of Credit was amended on March 30, 2017, pursuant to which the Company agreed not to borrow additional amounts against the line and to repay $3.6 million in outstanding principal not later than April 13, 2017, in exchange for PEP III extending the maturity date of the Supplemental Line of Credit until June 13, 2017. On April 12, 2017, the Company paid $3.6 million in accordance with the amendment.
On June 8, 2017, the Company entered into a letter agreement (“PEP III Agreement”) with PEP III and PEO, pursuant to which PEP III again agreed to modify the Supplemental Line of Credit. The PEP III Agreement further extended the maturity date of the Supplemental Line of Credit from June 13, 2017 until December 27, 2017 and increased the interest rate on the supplemental line from 8% to 10%, effective June 8, 2017. The Company and PEO also agreed to amend the participation agreement between the Company and PEO, in order to expand the area of mutual interest (“AMI”) and to grant PEP III an option to participate under the Participation Agreement. As amended, the Participation Agreement provides PEO the option to acquire up to a 45% interest and, so long as the Supplemental Line of Credit remained outstanding, PEP III the option to acquire up to a 10% interest in, and participate in, any oil and gas development on acreage acquired by the Company within the expanded AMI.
As described more fully below, on December 21, 2017, the interest rate on the Supplemental Line of Credit was increased from 10% to 15%, and on February 1, 2018, concurrent with the closing of another credit facility, a principal payment in the amount of $1.5 million plus accrued interest of $0.5 million was made on the Supplemental Line of Credit.
Convertible Notes
On December 30, 2016, January 20, 2017 and January 30, 2017, the Company completed the private placement of units consisting of convertible promissory notes (“Convertible Notes”) with an aggregate face value of $10.0 million and common stock purchase warrants. The Convertible Notes are unsecured, bear interest at 10% per year and are due and payable on December 31, 2018. At the option of the holders of the Convertible Notes, the principal amount of the Convertible Notes, and any accrued but unpaid interest, are convertible into shares of the Company's common stock at a conversion price of $1.50 per share.
66
PetroShare Corp.
NOTES TO CONSOLIDATED FINANCIAL STATEMENTS
December 31, 2017 and 2016
The Company received net proceeds of approximately $9.0 million from the private placement, after placement agent fees and other associated expenses.
On October 16, 2017, in connection with the sales of Series B Unsecured Convertible Promissory Notes (“Series B Notes”) as described more fully below, $5.2 million in principal of the Convertible Notes and $0.1 million in accrued interest was converted into 4,814,265 shares of common stock at a conversion rate of $1.10 per share. The Company has recorded a loss on conversion of $1.8 million in connection with the reduction of the initial contractual conversion rate.
In accordance with ASC 470, Debt, the proceeds from the sale of the Convertible Notes was allocated between the conversion feature embedded in the Convertible Notes and the warrants attached to the notes based on the fair values of the debt instrument without the warrants, and of the warrants themselves, at the time of issuance. The fair value of the beneficial conversion feature has been recorded as a reduction of the carrying value of the Convertible Notes and is being amortized to interest expense using the effective interest method over the term of the Convertible Notes. The fair value of the warrants has been recorded as a reduction to the carrying value of the Convertible Notes and is being amortized to interest expense using the effective interest method over the term of the Convertible Notes. The fair value of the warrants issued to the placement agent in connection with the offering of $1.0 million has been recorded as a charge to additional paid-in capital.
Series B Convertible Notes
In September and October 2017, the Company sold Series B Notes in the principal amount of $4.7 million. The Series B Notes are unsecured, bear interest at 15% per year, and are due and payable on December 31, 2018. At the option of the holders, the principal amount of the Series B Notes and any accrued but unpaid interest are convertible into shares of the Company's common stock at a conversion price of $1.50 per share. The Company netted $4.5 million from the sale of the Series B Notes after expenses.
In accordance with ASC 470, the fair value of the beneficial conversion feature of $56,500 has been recorded as a reduction of the carrying value of the Series B Notes and is being amortized to interest expense using the effective interest method over the term of the Series B Notes.
Secured Credit Facility
On December 21, 2017, the Company entered into a letter agreement (“Letter Agreement”) with Providence Energy Ltd. (“PEC”), and Fifth Partners, LLC (“Fifth,” and together with PEC, the “Lenders”) pursuant to which the Company borrowed $5.0 million from PEC (“Initial Funding”). PEC is an affiliate of PEO by virtue of common management. In connection with the Initial Funding, the Company and the Lenders agreed to negotiate a second credit facility of $20.0 million (“Second Funding”), which was completed on February 1, 2018.
Interest on the outstanding principal balance of the Initial Funding accrued at the three-month LIBOR plus 14%, or 15.7%. As of December 31, 2017, accrued interest payable related to the Initial Funding amounted $21,801. In connection with the Initial Funding, the Company recorded debt issuance costs in the amount of $0.1 million and incurred interest expense in the amount of $1,437 related to the accretion of these costs.
67
PetroShare Corp.
NOTES TO CONSOLIDATED FINANCIAL STATEMENTS
December 31, 2017 and 2016
NOTE 7 – ASSET RETIREMENT OBLIGATION
For the purpose of determining the fair value of the asset retirement obligation incurred during the year ended December 31, 2017, the Company assumed an inflation rate of 2.0%, an estimated average asset life of 29.9 years, and a credit-adjusted risk-free interest rate of 11.26% to 14.0%. For the year ended December 31, 2016, the Company assumed an inflation rate of 2.0%, an estimated average life of 13.2 years, and a credit-adjusted risk-free rate of 9.48% to 10.73%.
The following reconciles the value of the asset retirement obligation for the periods presented:
|
|
|
December 31, |
||||
|
|
|
2017 |
|
2016 |
||
|
Asset retirement obligation, beginning of period |
|
$ |
945,419 |
|
$ |
34,776 |
|
Liabilities settled (1) |
|
|
(50,163) |
|
|
1,990 |
|
Liabilities incurred |
|
|
91,999 |
|
|
878,170 |
|
Revisions in estimated liabilities |
|
|
36,507 |
|
|
— |
|
Accretion |
|
|
99,682 |
|
|
30,483 |
|
Asset retirement obligation, end of period |
|
$ |
1,123,444 |
|
$ |
945,419 |
_________________________
|
(1) |
Reflects liabilities settled through plugging and abandonment activities and divestitures of properties. |
Accretion expense recorded for the year ended December 31, 2017 and 2016 was $0.1 million and $30,483, respectively.
NOTE 8 - ACCOUNTS PAYABLE AND ACCRUED LIABILITIES
Accounts payable and accrued liabilities were comprised of the following amounts:
|
|
|
December 31, |
|
||||
|
|
|
2017 |
|
2016 |
|
||
|
Trade payables and accrued liabilities |
|
$ |
1,544,112 |
|
$ |
2,416,551 |
|
|
Accrued interest payable |
|
|
876,455 |
|
|
302,477 |
|
|
Liabilities incurred in connection with acquisition of crude oil and natural gas properties |
|
|
1,719,785 |
|
|
290,078 |
|
|
Total |
|
$ |
4,140,352 |
|
$ |
3,009,106 |
|
NOTE 9 - SHAREHOLDERS’ EQUITY
Common Stock
As of December 31, 2017 and 2016, the Company had 100,000,000 shares of common stock authorized with a par value of $0.001 per share. As of December 31, 2017 and 2016, the Company had 27,718,802 and 21,964,282 shares issued and outstanding, respectively.
Activity for the year ended December 31, 2017 included the following:
|
· |
On October 16, 2017, the Company issued 4,814,265 shares of common stock valued at $1.38 in conversion of $5.2 million of Convertible Notes and $0.1 million in accrued interest (Note 6); |
|
· |
On September 23, 2017, the Company issued 250,000 shares of common stock valued at $1.55 to PEO in connection with the execution of a Letter Agreement; |
68
PetroShare Corp.
NOTES TO CONSOLIDATED FINANCIAL STATEMENTS
December 31, 2017 and 2016
|
· |
On various dates, in connection with the execution of four employment agreements (Note 13) and the employment of additional employees, the Company issued 219,700 shares of restricted stock. The shares are subject to certain vesting restrictions, but all 219,700 shares have full voting rights and are eligible to receive dividends during the vesting period; and |
|
· |
On April 3, 2017, the Company issued 470,555 shares valued at $1.80 per share in connection with the acquisitions of oil and gas assets. |
Activity for the year ended December 31, 2016 included the following:
|
· |
In January 2016, the Company sold 95,000 shares of common stock at $1.00 per share to one accredited investor pursuant to a private placement of its common stock; |
|
· |
On April 8, 2016, the Company issued 50,000 shares of common stock valued at $0.73 per share to an investor relations company in connection with the certain services to be provided pursuant to an investor relations agreement; |
|
· |
On May 4, 2016, the Company issued an aggregate of 50,000 shares of common stock valued at $1.01 per share to two of the Company's directors in connection with their appointment to the Board (Note 10); |
|
· |
On July 5, 2016, the Company issued 25,000 shares of common stock valued at $1.60 per share to a director in connection with his appointment to the Board (Note 10); |
|
· |
On July 22, 2016, the Company issued 8,333 shares of common stock valued at $1.65 per share and on August 22, 2016 the Company issued 8,333 shares of common stock valued at $1.40 per share, each to an investor relations company in connection with certain services to be provided to the Company; |
|
· |
On August 30, 2016, the Company issued 50,000 shares of common stock valued at $1.44 per share to an investor relations company in connection with a termination agreement; |
|
· |
On November 11, 2016, the Company issued 14,425 shares of common stock valued at $1.85 per share to an individual in connection with the consideration and acquisition of the certain oil and gas leases; and |
|
· |
On December 5, 2016, the Company issued 30,000 shares of common stock valued at $1.89 per share in connection with the exchange of interests in certain oil and gas assets in Buck Peak prospect. |
Preferred Stock
As of December 31, 2017 and 2016, the Company had 10,000,000 shares of preferred stock authorized with a par value of $0.01 per share. As of December 31, 2017 and 2016, there were no shares of preferred stock issued or outstanding.
69
PetroShare Corp.
NOTES TO CONSOLIDATED FINANCIAL STATEMENTS
December 31, 2017 and 2016
Warrants
The table below summarizes warrants outstanding as of December 31, 2017:
|
|
|
Shares Underlying |
|
Exercise Price |
|
|
|
|
|
|
Outstanding Warrants |
|
Per Share |
|
Expiration Date |
|
|
Underwriter warrants |
|
255,600 |
|
$ |
1.25 |
|
11/12/2020 |
|
Investor warrants |
|
6,666,600 |
|
$ |
3.00 |
|
12/31/2019 |
|
Placement agent warrants |
|
666,600 |
|
$ |
1.50 |
|
12/31/2021 |
|
Total |
|
7,588,800 |
|
|
|
|
|
Activity for the year ended December 31, 2017:
|
· |
On January 20, 2017 and January 30, 2017, the Company issued 537,260 warrants exercisable at $1.50 per share and expiring on December 31, 2021 in connection with a private placement (Note 6); and |
|
· |
On January 20, 2017 and January 30, 2017, the Company issued 5,371,579 warrants exercisable at $3.00 per share and expiring on December 31, 2019, also in connection with the private placement (Note 6). |
Activity for the year ended December 31, 2016:
|
· |
On December 30, 2016, the Company issued 129,516 warrants exercisable at $1.50 per share and expiring on December 31, 2021 in connection with the closing of the first round of the Company’s private placement (Note 6); and |
|
· |
On December 30, 2016, the Company issued 1,294,987 warrants exercisable at $3.00 per share and expiring on December 31, 2019 in connection with the closing of the first round of the Company’s private placement (Note 6). |
NOTE 10 – STOCK-BASED COMPENSATION
On August 18, 2016, the Company's Board of Directors adopted the Amended and Restated PetroShare Corp. Equity Incentive Plan (the "Plan"), which replaced and restated the Company's original equity incentive plan. The Plan terminates by its terms on August 17, 2026. Among other things, the Plan increased the number of shares of common stock reserved for issuance thereunder from 5,000,000 to 10,000,000 shares. The Company's shareholders approved the Plan at the Company's annual meeting of shareholders on September 8, 2016.
During the year ended December 31, 2017, the Board of Directors granted non-qualified options to employees, directors and consultants of the Company under the Plan to acquire 422,000 shares of common stock.
70
PetroShare Corp.
NOTES TO CONSOLIDATED FINANCIAL STATEMENTS
December 31, 2017 and 2016
A summary of activity under the Plan for the years ended December 31, 2017 and 2016 is as follows:
|
|
|
|
|
|
Weighted |
|
Remaining |
|
|
|
|
|
|
Average |
|
Contractual |
|
|
|
Number of |
|
|
Exercise |
|
Term |
|
|
|
Shares |
|
Price |
|
(Years) |
|
|
Outstanding, December 31, 2015 |
|
2,275,000 |
|
$ |
0.33 |
|
6.50 |
|
Exercisable, December 31, 2015 |
|
2,200,000 |
|
$ |
0.30 |
|
6.72 |
|
Granted |
|
2,400,000 |
|
$ |
1.16 |
|
5.34 |
|
Exercised |
|
— |
|
|
— |
|
— |
|
Forfeited |
|
— |
|
|
— |
|
— |
|
Outstanding, December 31, 2016 |
|
4,675,000 |
|
$ |
0.76 |
|
5.39 |
|
Exercisable, December 31, 2016 |
|
3,010,000 |
|
$ |
0.54 |
|
5.97 |
|
Granted |
|
422,000 |
|
$ |
1.86 |
|
5.69 |
|
Exercised |
|
— |
|
|
— |
|
— |
|
Forfeited |
|
(100,000) |
|
|
— |
|
— |
|
Outstanding, December 31, 2017 |
|
4,997,000 |
|
$ |
0.85 |
|
4.44 |
|
Exercisable, December 31, 2017 |
|
4,347,500 |
|
$ |
0.74 |
|
4.48 |
The fair value of each stock-based award was estimated on the date of the grant using the Black-Scholes pricing model that incorporates key assumptions including volatility of the Company’s stock, dividend yield and risk-free interest rates. As the Company’s common stock has limited historical trading data, the expected stock price volatility is based primarily on the historical volatility of a group of publicly-traded companies that share similar operating metrics and histories. The expected term of the awards represents the period of time that management anticipates awards will be outstanding. As there was insufficient historical data available to ascertain a forfeiture rate, the plain vanilla method was applied in calculating the expected term of the options. The risk-free rates for the periods within the contractual life of the options are based on the US Treasury bond rate in effect at the time of the grant for bonds with maturity dates at the expected term of the options. The Company has never paid dividends on its common stock and currently does not intend to do so, and as such, the expected dividend yield is zero. Compensation expense related to stock options was recorded net of estimated forfeitures, which for options remaining at December 31, 2017, the Company expects no additional forfeitures.
The table below summarizes assumptions utilized in the Black-Scholes pricing model for the years ended 2017 and 2016:
|
|
|
December 31, |
|
December 31, |
|
|
|
2017 |
|
2016 |
|
Expected option term—years |
|
2.5 - 3.25 |
|
1.5 - 2.5 |
|
Risk-free interest rate |
|
1.75% - 1.93% |
|
0.94% - 1.31% |
|
Expected dividend yield |
|
— |
|
— |
|
Volatility |
|
162% - 169% |
|
142% - 214% |
|
Forfeited |
|
— |
|
— |
During the years ended December 31, 2017 and 2016, the Company recorded stock-based compensation related to options of $1.4 million, and $1.1 million, respectively. Unvested stock-based option compensation at December 31, 2017 amounted to $0.6 million.
71
PetroShare Corp.
NOTES TO CONSOLIDATED FINANCIAL STATEMENTS
December 31, 2017 and 2016
NOTE 11 – PROVISION FOR INCOME TAXES
Deferred taxes are provided on a liability method whereby deferred tax assets are recognized for deductible temporary differences and operating loss and tax credit carry-forwards and deferred tax liabilities are recognized for taxable temporary differences. Temporary differences are the differences between the reported amounts of assets and liabilities and their tax basis. Deferred tax assets are reduced by a valuation allowance when, in the opinion of management, it is more likely than not that some portion or all of the deferred tax assets will not be realized. Deferred tax assets and liabilities are adjusted for the effects of changes in tax laws and rates on the date of enactment.
The Company has analyzed filing positions in all of the federal and state jurisdictions where it is required to file income tax returns, as well as all open tax years in these jurisdictions. No uncertain tax positions have been identified as of December 31, 2017.
The Company is in a position of cumulative reporting losses for the current and preceding reporting periods. The volatility of energy prices is not readily determinable by management. At this date, this fact pattern does not allow the Company to project sufficient sources of future taxable income to offset tax loss carry-forwards and net deferred tax assets. Under these circumstances, it is management's opinion that the realization of these tax attributes does not reach the "more likely than not criteria" under ASC 740, "Income Taxes." As a result, the Company's deferred tax assets as of December 31, 2017 and 2016 are subject to a full valuation allowance.
Net deferred tax assets and liabilities consist of the following components as of December 31, 2017 and 2016:
|
|
|
Year Ended December 31, |
||||
|
|
|
2017 |
|
2016 |
||
|
Deferred tax assets - current: |
|
|
|
|
|
|
|
Exploration costs |
|
$ |
— |
|
$ |
— |
|
Deferred tax assets - noncurrent: |
|
|
|
|
|
|
|
NOL carryover |
|
|
2,109,423 |
|
|
4,287,567 |
|
Stock based compensation |
|
|
727,631 |
|
|
576,808 |
|
Asset retirement obligation |
|
|
277,015 |
|
|
350,333 |
|
Charitable contribution |
|
|
814 |
|
|
— |
|
Total deferred tax assets |
|
|
3,114,883 |
|
|
5,214,708 |
|
|
|
|
|
|
|
|
|
Deferred tax liabilities - current: |
|
|
|
|
|
|
|
Property and equipment |
|
|
(15,251) |
|
|
(1,990) |
|
Impairment, intangible drilling costs and other exploration costs capitalized |
|
|
(935,482) |
|
|
(1,796,102) |
|
Debt discount - Beneficial conversion feature |
|
|
(337,518) |
|
|
— |
|
Total deferred tax liabilities |
|
|
(1,288,251) |
|
|
(1,798,092) |
|
Net deferred tax assets |
|
|
1,826,632 |
|
|
3,416,616 |
|
Valuation allowance |
|
|
(1,826,632) |
|
|
(3,416,616) |
|
Net deferred tax assets |
|
$ |
— |
|
$ |
— |
72
PetroShare Corp.
NOTES TO CONSOLIDATED FINANCIAL STATEMENTS
December 31, 2017 and 2016
The income tax provision differs from the amount of income tax determined by applying the US federal tax rate to the pretax loss from continuing operations for the years ended December 31, 2017 and 2016 due to the following:
|
|
|
Year Ended December 31, |
||||
|
|
|
2017 |
|
2016 |
||
|
Tax at statutory federal rate |
|
$ |
(3,688,109) |
|
$ |
(1,520,524) |
|
Permanent difference |
|
|
2,258,353 |
|
|
2,378 |
|
State taxes, net of federal |
|
|
(331,474) |
|
|
(136,847) |
|
Depletion, depreciation, amortization and impairment |
|
|
— |
|
|
— |
|
Change in valuation allowance |
|
|
396,256 |
|
|
938,026 |
|
Effect of the Tax Cuts and Jobs Act |
|
|
918,446 |
|
|
|
|
Other |
|
|
446,528 |
|
|
716,967 |
|
Provision (benefit) for income taxes |
|
$ |
— |
|
$ |
— |
At December 31, 2017, the Company had net operating loss carry-forwards of approximately $8.6 million that may be offset against future taxable income from the years 2018 through 2037.
Due to the change in ownership provisions of the Tax Reform Act of 1986, net operating loss carry-forwards for federal income tax reporting purposes are subject to annual limitations. Should a change in ownership occur, net operating loss carry-forwards may be limited as to use in future years.
The Company files income tax returns in the US federal jurisdiction and in the State of Colorado. The Company is currently subject to US federal, state and local income tax examinations by tax authorities since inception of the Company.
ASC 740 requires the recognition of the tax effects of the of the Act for annual periods that include December 22, 2017. At December 31, 2017, the Company has made reasonable estimates of the effects on its existing deferred tax balances. The Company has remeasured certain federal deferred tax assets and liabilities based upon the rates at which they are expected to reverse in the future, which is generally 21 percent. The provisional amount recognized related to the remeasurement of its federal deferred tax balance was approximately $0.9 million, which was subject to a valuation allowance at December 31, 2017.
The Company will continue to analyze the Tax Act and future IRS regulations, refine its calculations and gain a more thorough understanding of how individual states are implementing this new law. This further analysis could potentially affect the measurement of deferred tax balances or potentially give rise to new deferred tax amounts.
NOTE 12 – RELATED PARTIES
Providence
Initial Line of Credit
|
· |
At December 31, 2017 and 2016, the Company had drawn $5.0 million and $5.0 million on the initial line of credit and had accrued interest in the amount of $0.5 million and $0.3 million, respectively. |
|
· |
On September 23, 2017, the Company issued 250,000 shares of common stock valued at $1.55 to PEO in connection with the execution of a letter agreement and extension of a loan (Notes 6 and 9). The Company recorded interest expense in the amount of $0.1 million as related to the accretion of this debt discount. As of December 31, 2017, the unaccreted portion of the discount amounted to $0.3 million. |
73
PetroShare Corp.
NOTES TO CONSOLIDATED FINANCIAL STATEMENTS
December 31, 2017 and 2016
Credit Facility
|
· |
Related to the execution of a Letter Agreement pursuant to the Initial Funding of a Credit Facility on December 21, 2017 (Note 6), the Company drew $5.0 million on the facility resulting in a liability to a PEO-affiliated entity in the amount of $5.0 million in principal and $21,801 in accrued interest as of December 31, 2017. PEO beneficially owns approximately 11.7% of the Company’s common stock. |
Operations
|
· |
At December 31, 2017, the Company has recorded a net $0.2 million in Accounts receivable – joint interest billing – related party. This amount relates to amounts billed to PEO related to its participation in the Company’s operated Shook drilling program and PEO’s ownership interest in the vertical wells that the Company operates. |
|
· |
At December 31, 2017, the Company has recorded $0.7 million in drilling advances – related party. This amount relates to unapplied cash advances received from PEO in connection with the Company’s operated Shook drilling program. |
Convertible Notes
In January 2017, the Company sold Series A Notes to a total of four employees and directors who collectively purchased Series A Notes in the aggregate principal amount of $0.2 million (Note 6), on the same terms and conditions as the other purchasers.
On October 16, 2017, ten of the Company’s officers and directors converted Series A Notes in the aggregate principal amount of $0.7 million and accrued interest of $20,670 into 691,516 shares of common stock at $1.10 per share. (Notes 6 and 9)
Ten employees, officers and directors of the Company received cash interest payments for interest of $0.1 million related to Series A and Series B notes during the year ended December 31, 2017.
Series B Convertible Notes
In September and October 2017, the Company sold Series B Notes to ten of the Company’s officers and directors who collectively purchased $0.6 million in aggregate principal amount (Note 6), on the same terms and conditions as the other purchasers, with the exception that the Company did not pay commissions on these sales.
74
PetroShare Corp.
NOTES TO CONSOLIDATED FINANCIAL STATEMENTS
December 31, 2017 and 2016
NOTE 13 – COMMITMENTS AND CONTINGENCIES
Operating Leases and Agreements
The Company leases its office facilities under a four-year non-cancelable operating lease agreement expiring in March 2021. The following is a schedule by year of future minimum rental payments required under the operating lease agreement:
|
Year ending December 31, |
|
Amount |
|
|
2018 |
|
$ |
129,738 |
|
2019 |
|
|
133,698 |
|
2020 |
|
|
137,658 |
|
2021 |
|
|
34,662 |
|
2022 |
|
|
— |
|
Total |
|
$ |
435,756 |
Lease expense totaled $0.1 million and $34,651 for the years ended December 31, 2017 and December 31, 2016, respectively.
Employment Agreements
2017
On April 1, 2017, the Company entered an employment agreement with its Manager of Production and Completion Operations. The agreement provides for a base salary of $130,000 per year, an initial term expiring on March 31, 2018 with an automatic renewal for successive one-year periods unless terminated in accordance with its terms, and provisions for termination and payment of severance under various circumstances. In connection with the execution of the agreement, the employee was granted 50,000 shares of restricted stock and an option to purchase up to 200,000 shares of common stock at an exercise price of $1.83 per share.
On April 1, 2017, the Company entered into an employment agreement with its Executive Vice President for Capital Markets and Investor Relations. The agreement provides for a base salary of $156,000 per year, an initial term expiring on December 31, 2018 with an automatic renewal for successive one-year periods unless terminated in accordance with its terms, and provisions for termination and payment of severance under various circumstances. In
connection with the execution of the agreement, the employee was granted 66,700 shares of restricted stock and the vesting of 200,000 previously issued stock options were accelerated.
On June 1, 2017, the Company entered into an employment agreement with its Senior Landman. The agreement provides for a base salary of $130,000 per year, an initial term expiring on May 31, 2018 with an automatic renewal for successive one-month periods unless terminated in accordance with its terms, and provisions for termination. In connection with the execution of the agreement, the employee was granted 50,000 shares of restricted stock and an option to purchase 200,000 shares of common stock at $1.89 per share.
On June 1, 2017, the Company entered into an employment agreement with its Chief Financial Officer. The agreement provides for a base salary of $150,000 per year, an initial term expiring on December 31, 2018 with an automatic renewal for successive one-year periods unless terminated in accordance with its terms, and provisions for termination and payment of severance under various circumstances. In connection with the execution of the agreement, the employee was granted 50,000 shares of restricted stock.
75
PetroShare Corp.
NOTES TO CONSOLIDATED FINANCIAL STATEMENTS
December 31, 2017 and 2016
2016
On February 25, 2016, the Board of Directors approved a form of amended and restated executive employment in order to provide uniform terms of employment for the Company’s executive officers. Effective March 1, 2016, the Company entered into an amended and restated employment agreement with each Stephen J. Foley and Fredrick J. Witsell. Pursuant to the amended and restated employment agreements, Messrs. Foley and Witsell are compensated by the Company at the rate of $13,000 per month, or $156,000 per year. The Company also executed an executive agreement with William B. Lloyd, Chief Operating Officer, pursuant to which, as amended, Mr. Lloyd is compensated at the rate of $13,000 per month, or $156,000 per year. For each of the foregoing executives, the employment agreements provide for an initial term expiring on December 31, 2018 with an automatic renewal for successive one-year periods unless terminated in accordance with its terms and provisions for termination and payment of severance under various circumstances.
On April 15, 2016, the Company entered into an executive employment agreement with William R. Givan, Vice President, Land, pursuant to which Mr. Givan is compensated at the rate of $10,833.33 per month, or $130,000 per year. Mr. Givan’s employment agreement provides for an initial term expiring on April 14, 2017 with an automatic renewal for successive one-year periods unless terminated in accordance with its terms and provisions for termination and payment of severance under various circumstances.
NOTE 14 – REVISION OF PRIOR PERIOD FINANCIAL STATEMENTS
In connection with the preparation of its financial statements for the quarter ended March 31, 2017, the Company identified an error related to the manner in which it accounted for the fair value of convertible promissory notes and warrants issued in a private placement during December 2016 (Note 6). Specifically, the Company was required to apply the guidance of FASB ASC 470, and more specifically, ASC 470 20 25 2 and ASC 470 20 25 3. On the balance sheet at December 31, 2016, the Company recorded the face value of convertible notes payable issued in connection with the private placement under liabilities, discounted by (i) the value of the original issue discount and (ii) the value of the warrants issued to the placement agent. The Company did not, however, discount the value of the convertible notes by the fair value of the warrants issued to individual investors.
In accordance with Staff Accounting Bulletin (“SAB”) No. 99, Materiality, and SAB No. 108, Considering the Effects of Prior Year Misstatements when Quantifying Misstatements in Current Year Financial Statements, the Company evaluated the error and determined that the related impact was not material to the Company’s results of operations or financial position for any prior annual or interim period. Accordingly, the Company corrected these errors for the year ended December 31, 2016 by revising the financial statements beginning in the period ended March 31, 2017. Periods not presented herein will be revised, as applicable, in future filings.
76
PetroShare Corp.
NOTES TO CONSOLIDATED FINANCIAL STATEMENTS
December 31, 2017 and 2016
The following tables present the revisions to the balance sheet as of, and the statement of operations for the year ended, December 31, 2016:
Balance Sheet
|
|
|
As of December 31, 2016 |
|||||||
|
|
|
As Reported |
|
Adjustments |
|
As Revised |
|||
|
Convertible notes payable, net |
|
$ |
814,989 |
|
$ |
(809,681) |
|
$ |
5,308 |
|
Total Liabilities |
|
$ |
17,260,318 |
|
$ |
(809,681) |
|
$ |
16,450,637 |
|
Shareholders’ Equity |
|
|
|
|
|
|
|
|
|
|
Additional paid-in capital |
|
$ |
10,593,324 |
|
$ |
811,901 |
|
$ |
11,405,225 |
|
Accumulated deficit |
|
|
(9,848,822) |
|
|
(2,220) |
|
|
(9,851,042) |
|
Total Shareholders’ Equity |
|
$ |
766,466 |
|
$ |
809,681 |
|
$ |
1,576,147 |
|
Total Liabilities and Shareholders’ Equity |
|
$ |
18,026,784 |
|
$ |
— |
|
$ |
18,026,784 |
Statement of Operations
|
|
|
Year Ended |
|
|
|
|
December 31, 2016 |
|
|
Net (loss), as reported |
|
$ |
(4,479,052) |
|
Adjustments: |
|
|
|
|
Previously reported accretion of debt discount (conversion feature and warrants) (interest expense) |
|
|
2,529 |
|
Corrected accretion of debt discount (interest expense) |
|
|
4,749 |
|
Total adjustment |
|
|
(2,220) |
|
Net (loss), as revised |
|
$ |
(4,481,272) |
|
Net (loss) per share, as reported |
|
$ |
(0.21) |
|
Net (loss) per share, as revised |
|
$ |
(0.21) |
NOTE 15 – RESTATEMENT OF PRIOR PERIOD CONDENSED CONSOLIDATED FINANCIAL STATEMENTS
In connection with the preparation of its consolidated financial statements for the year ended December 31, 2017, the Company identified a mathematical error related to the calculation of the depletion, depreciation and amortization of oil and gas properties as recorded during the periods ended March 31, 2017, June 30, 2017 and September 30, 2017. The issue resulted from the application of an incorrect conversion factor when evaluating NGL volumes. The impact of the correction of this issue has been recorded during the quarter ended December 31, 2017.
In accordance with Staff Accounting Bulletin (“SAB”) No. 99, Materiality, the Company evaluated the error and determined that the related impact was not material to the Company’s results of operations or financial position for any prior interim period. Accordingly, the Company has corrected these errors in total for the year ended December 31, 2017 by revising the consolidated financial statements. Periods presented herein will be revised, as applicable, in future filings.
77
PetroShare Corp.
NOTES TO CONSOLIDATED FINANCIAL STATEMENTS
December 31, 2017 and 2016
The following tables present the restatements to the consolidated balance sheets as of, and the consolidated statements of operations for the periods presented:
Consolidated Balance Sheets
|
|
|
As of March 31, 2017 |
|||||||
|
|
|
As Reported |
|
Adjustments |
|
As Restated |
|||
|
Crude oil and natural gas properties, net: |
|
|
|
|
|
|
|
|
|
|
Accumulated depletion, depreciation and amortization |
|
$ |
(1,229,486) |
|
$ |
115,254 |
|
$ |
(1,114,232) |
|
Crude oil and natural gas properties, net |
|
$ |
20,510,001 |
|
$ |
115,254 |
|
$ |
20,625,255 |
|
Total assets |
|
$ |
28,739,336 |
|
$ |
115,254 |
|
$ |
28,854,590 |
|
Shareholders’ equity: |
|
|
|
|
|
|
|
|
|
|
Accumulated deficit |
|
$ |
(11,990,181) |
|
$ |
115,254 |
|
$ |
(11,874,927) |
|
Total shareholders’ equity |
|
$ |
6,756,017 |
|
$ |
115,254 |
|
$ |
6,871,271 |
|
Total liabilities and shareholders’ equity |
|
$ |
28,739,336 |
|
$ |
115,254 |
|
$ |
28,854,590 |
|
|
|
|
|
|
|
|
|
|
|
|
|
|
As of June 30, 2017 |
|||||||
|
|
|
As Reported |
|
Adjustments |
|
As Restated |
|||
|
Crude oil and natural gas properties, net: |
|
|
|
|
|
|
|
|
|
|
Accumulated depletion, depreciation and amortization |
|
$ |
(2,765,660) |
|
$ |
549,096 |
|
$ |
(2,216,564) |
|
Crude oil and natural gas properties, net |
|
$ |
24,958,027 |
|
$ |
549,096 |
|
$ |
25,507,123 |
|
Total assets |
|
$ |
35,682,868 |
|
$ |
549,096 |
|
$ |
36,231,964 |
|
Shareholders’ equity: |
|
|
|
|
|
|
|
|
|
|
Accumulated deficit |
|
$ |
(12,723,650) |
|
$ |
549,096 |
|
$ |
(12,174,554) |
|
Total shareholders’ equity |
|
$ |
7,532,947 |
|
$ |
549,096 |
|
$ |
8,082,043 |
|
Total liabilities and shareholders’ equity |
|
$ |
35,682,868 |
|
$ |
549,096 |
|
$ |
36,231,964 |
|
|
|
|
|
|
|
|
|
|
|
|
|
|
As of September 30, 2017 |
|||||||
|
|
|
As Reported |
|
Adjustments |
|
As Restated |
|||
|
Crude oil and natural gas properties, net: |
|
|
|
|
|
|
|
|
|
|
Accumulated depletion, depreciation and amortization |
|
$ |
(3,918,935) |
|
$ |
865,697 |
|
$ |
(3,053,238) |
|
Crude oil and natural gas properties, net |
|
$ |
28,698,193 |
|
$ |
865,697 |
|
$ |
29,563,890 |
|
Total assets |
|
$ |
32,918,686 |
|
$ |
865,697 |
|
$ |
33,784,383 |
|
Shareholders’ equity: |
|
|
|
|
|
|
|
|
|
|
Accumulated deficit |
|
$ |
(14,754,722) |
|
$ |
865,697 |
|
$ |
(13,889,025) |
|
Total shareholders’ equity |
|
$ |
6,343,080 |
|
$ |
865,697 |
|
$ |
7,208,777 |
|
Total liabilities and shareholders’ equity |
|
$ |
32,918,686 |
|
$ |
865,697 |
|
$ |
33,784,383 |
Consolidated Statements of Operations
|
|
|
Three months ended |
|
Three months ended |
|
Six months ended |
|
Three months ended |
|
Nine months ended |
|||||
|
|
|
March 31, 2017 |
|
June 30, 2017 |
|
June 30, 2017 |
|
September 30, 2017 |
|
September 30, 2017 |
|||||
|
Net (loss), as reported |
|
$ |
(2,139,139) |
|
$ |
(733,469) |
|
$ |
(2,872,608) |
|
$ |
(2,031,072) |
|
$ |
(4,903,680) |
|
Adjustments: |
|
|
|
|
|
|
|
|
|
|
|
|
|
|
|
|
Previously reported depletion, depreciation and amortization |
|
$ |
(446,166) |
|
$ |
(1,536,174) |
|
$ |
(1,982,341) |
|
$ |
(1,153,273) |
|
$ |
(3,135,614) |
|
Total adjustment |
|
|
115,254 |
|
|
433,842 |
|
|
549,096 |
|
|
316,600 |
|
|
865,696 |
78
PetroShare Corp.
NOTES TO CONSOLIDATED FINANCIAL STATEMENTS
December 31, 2017 and 2016
|
Corrected depletion, depreciation and amortization |
|
|
(330,912) |
|
|
(1,102,332) |
|
|
(1,433,245) |
|
|
(836,673) |
|
|
(2,269,918) |
|
Net (loss), as restated |
|
$ |
(2,023,885) |
|
$ |
(299,627) |
|
$ |
(2,323,512) |
|
$ |
(1,714,472) |
|
$ |
(4,037,984) |
|
Net (loss) per share, as reported |
|
$ |
(0.10) |
|
$ |
(0.03) |
|
$ |
(0.13) |
|
$ |
(0.09) |
|
$ |
(0.22) |
|
Net (loss) per share, as restated |
|
$ |
(0.09) |
|
$ |
(0.01) |
|
$ |
(0.10) |
|
$ |
(0.08) |
|
$ |
(0.18) |
NOTE 16 – SUBSEQUENT EVENTS
On February 1, 2018, the Company entered into a Secured Term Credit Agreement (“Credit Agreement”) with Providence Wattenberg, LP and 5NR Wattenberg, LLC (the “Secured Lenders”). Each of Providence and 5NR are affiliates of the Lenders under the Letter Agreement.
Under the Credit Agreement, the Secured Lenders agreed to loan the Company a total of $25.0 million (the “Loan”), including the $5.0 million previously advanced pursuant to the Letter Agreement. Interest on the outstanding principal balance of the Loan accrues at the rate of 14% per year plus the greater of three-month LIBOR or 1%, but in no event to exceed 17%. Interest payments are due monthly beginning March 1, 2018. Repayment of the Loan is secured by a lien on all of the Company’s assets, which is equal in priority to the lien securing the remaining indebtedness owed to PEP III. All principal and accrued interest under the Credit Agreement is due February 1, 2020 (“Maturity Date”).
At any time, the Lenders may convert 20% of the outstanding principal of the Loan into common stock of the Company at a price of $1.15 per share and the remaining principal at a price of $1.55 per share. The Company also granted to the Lenders:
a warrant entitling the Lenders to purchase in the aggregate 1,500,000 shares of common stock at a price of $0.01 per share, exercisable until the Maturity Date; and
|
· |
an option to purchase up to 50% of any securities offered by the Company in any private or public offering until December 31, 2018, and 25% of any securities offered thereafter; and |
an option to purchase up to $25.0 million of the Company’s common stock at a 10% discount from the 30-day volume-weighted average trading price of the common stock at the time the option is exercised, but in no event less than $1.85 per share, which the option will become exercisable on the Maturity Date and expire on February 1, 2021; and
registration rights in connection with the common stock that may be issued upon exercise of the foregoing rights.
The Company also agreed to certain affirmative and negative covenants in connection with the Loan, including the obligation to appoint up to three persons to the Company’s Board of Directors, two of whom would be designated by Providence and one by 5NR, and at least one of whom shall qualify as independent under the rules of the NYSE American.
NOTE 17 – UNAUDITED CRUDE OIL AND NATURAL GAS RESERVES INFORMATION
The reserves at December 31, 2017, presented below, were prepared by the independent engineering firm Cawley, Gillespie & Associates Inc. All reserves are located within the DJ Basin. Proved oil, natural gas and NGL reserves are the estimated quantities of oil, natural gas and NGLs which geological and engineering data demonstrate, with reasonable certainty, to be recoverable in future years from known reservoirs under economic and operating
79
PetroShare Corp.
NOTES TO CONSOLIDATED FINANCIAL STATEMENTS
December 31, 2017 and 2016
conditions (i.e., prices and costs) existing at the time the estimate is made. Proved developed oil, natural gas and NGL reserves are proved reserves that can be expected to be recovered through existing wells and equipment in place and under operating methods being utilized at the time the estimates were made. A variety of methodologies are used to determine the proved reserve estimates. The principal methodologies employed are decline curve analysis, advance production type curve matching, petro physics/log analysis and analogy. Some combination of these methods is used to determine reserve estimates in substantially all of the Company’s fields. The Company emphasizes that reserve estimates are inherently imprecise and that estimates of new discoveries and undeveloped locations are more imprecise than estimates of established proved producing oil and gas properties. Accordingly, these estimates are expected to change as future information becomes available.
80
PetroShare Corp.
NOTES TO CONSOLIDATED FINANCIAL STATEMENTS
December 31, 2017 and 2016
Analysis of Changes in Proved Reserves. Estimated quantities of proved developed reserves (all of which are located within the United States), as well as the changes in proved developed reserves during the periods indicated, are presented in the following tables:
|
|
|
|
|
Natural |
|
|
|
|
|
|
|
Oil |
|
Gas |
|
NGL’s |
|
Total |
|
|
|
(Bbls) |
|
(Mcf) |
|
(Bbls) |
|
(BOE) |
|
Proved Reserves: |
|
|
|
|
|
|
|
|
|
Balance as of December 31, 2014 |
|
159 |
|
— |
|
— |
|
159 |
|
Revisions of previous estimates |
|
(122) |
|
— |
|
— |
|
(122) |
|
Extensions and discoveries |
|
— |
|
— |
|
— |
|
— |
|
Sales of reserves in place |
|
— |
|
— |
|
— |
|
— |
|
Improved recovery |
|
— |
|
— |
|
— |
|
— |
|
Purchase of reserves |
|
— |
|
— |
|
— |
|
— |
|
Production |
|
(37) |
|
— |
|
— |
|
(37) |
|
Balance as of December 31, 2015 |
|
— |
|
— |
|
— |
|
— |
|
Revisions of previous estimates |
|
— |
|
— |
|
— |
|
— |
|
Extensions and discoveries |
|
2,710,437 |
|
10,498,397 |
|
1,570,454 |
|
6,030,624 |
|
Sales of reserves in place |
|
— |
|
— |
|
— |
|
— |
|
Improved recovery |
|
— |
|
— |
|
— |
|
— |
|
Purchase of reserves |
|
55,669 |
|
1,020,516 |
|
62,244 |
|
287,999 |
|
Production |
|
(4,902) |
|
(26,058) |
|
(1,510) |
|
(10,755) |
|
|
|
|
|
|
|
|
|
|
|
Balance as of December 31, 2016 |
|
2,761,204 |
|
11,492,855 |
|
1,631,188 |
|
6,307,868 |
|
Revisions of previous estimates |
|
(388,211) |
|
292,477 |
|
38,668 |
|
(300,797) |
|
Extensions and discoveries |
|
839,738 |
|
4,183,757 |
|
631,149 |
|
2,168,180 |
|
Sales of reserves in place |
|
— |
|
— |
|
— |
|
— |
|
Improved recovery |
|
— |
|
— |
|
— |
|
— |
|
Purchase of reserves |
|
— |
|
— |
|
— |
|
— |
|
Production |
|
(188,529) |
|
(549,846) |
|
(50,111) |
|
(330,281) |
|
Balance as of December 31, 2017 |
|
3,024,202 |
|
15,419,243 |
|
2,250,894 |
|
7,844,970 |
|
|
|
|
|
|
|
|
|
|
|
Proved Developed Reserves, included above |
|
|
|
|
|
|
|
|
|
Balance as of December 31, 2015 |
|
— |
|
— |
|
— |
|
— |
|
Balance as of December 31, 2016 |
|
260,284 |
|
1,788,895 |
|
181,655 |
|
740,088 |
|
Balance as of December 31, 2017 |
|
521,354 |
|
3,752,330 |
|
387,430 |
|
1,534,172 |
|
|
|
|
|
|
|
|
|
|
|
Proved Undeveloped Reserves, included above |
|
|
|
|
|
|
|
|
|
Balance as of December 31, 2015 |
|
— |
|
— |
|
— |
|
— |
|
Balance as of December 31, 2016 |
|
2,500,920 |
|
9,703,960 |
|
1,449,533 |
|
5,567,780 |
|
Balance as of December 31, 2017 |
|
2,502,847 |
|
11,666,911 |
|
1,863,465 |
|
6,310,797 |
The values for the 2017 oil, natural gas and NGL reserves are based on the twelve-month arithmetic average of the first day of the month prices for the period from January through December 31, 2017. The unweighted arithmetic average first-day-of-the-month prices for the prior twelve months was $51.34 per barrel (West Texas Intermediate price) for crude oil and NGLs and $2.98 per MMBtu (Henry Hub price) for natural gas. All prices are then further adjusted for transportation, quality and basis differentials. The average resulting price used as of December 31, 2017 was $45.03 per barrel for oil, $1.71 per Mcf for natural gas and $20.42 per barrel for NGLs.
81
PetroShare Corp.
NOTES TO CONSOLIDATED FINANCIAL STATEMENTS
December 31, 2017 and 2016
The values for the 2016 oil, natural gas and NGL reserves are based on the twelve-month arithmetic average of the first day of the month prices for the period from January through December 31, 2016. The unweighted arithmetic average first-day-of-the-month prices for the prior twelve months was $42.75 per barrel (West Texas Intermediate price) for crude oil and NGLs and $2.48 per MMBtu (Henry Hub price) for natural gas. All prices are then further adjusted for transportation, quality and basis differentials. The average resulting price used as of December 31, 2016 was $34.09 per barrel for oil, $2.69 per Mcf for natural gas and $14.44 per barrel for NGLs.
The Company did not assign a value to its proved reserves as of December 31, 2015 due to immaterial quantity estimates and a volatile price environment.
For the year ended December 31, 2017, the Company reported extensions and discoveries of 2,168,180 BOE primarily as result of the conversion of 18 PUD locations in the Todd Creek Farms prospect area during 2017 coupled with the addition of new PUD locations due to economic field extensions adjacent to Company leases. The Company reported downward revisions of previous estimates of 300,797 BOE primarily related to the removal of uneconomic PUD locations.
For the year ended December 31, 2016, the Company reported extensions and discoveries of 6,030,624 BOE as a result of drilling and completion activities during 2016. Additionally, during 2016 the Company purchased reserves of 287,999 BOE.
Standardized Measure of Estimated Discounted Future Net Cash Flows to Proved Oil and Natural Gas Reserves (in thousands):
The Company follows the guidelines prescribed in ASC 932, Extractive Activities-Oil and Gas for computing a standardized measure of future net cash flows and changes therein relating to estimated proved reserves. The following summarizes the policies used in the preparation of the accompanying oil, natural gas and NGL reserve disclosures, standardized measures of discounted future net cash flows from proved oil, natural gas and NGL reserves and the reconciliations of standardized measures from year to year.
The information is based on estimates of proved reserves attributable to the Company’s interest in oil and gas properties as of December 31 of the years presented. These estimates were prepared by Cawley Gillespie & Associates, Inc., independent petroleum engineers.
The standardized measure of discounted future net cash flows from production of proved reserves was developed as follows: (1) estimates are made of quantities of proved reserves and future periods during which they are expected to be produced based on year-end economic conditions; (2) the estimated future cash flows are compiled by applying the twelve-month average of the first-day-of-the-month prices of crude oil and natural gas relating to the Company’s proved reserves to the year-end quantities of those reserves; (3) the future cash flows are reduced by estimated production costs, costs to develop and produce the proved reserves and abandonment costs, all based on year-end economic conditions, plus Company overhead incurred; and (4) future net cash flows are discounted to present value by applying a discount rate of 10%.
The assumptions used to compute the standardized measure are those prescribed by the FASB and the SEC. These assumptions do not necessarily reflect the Company’s expectations of actual revenues to be derived from those reserves, nor their present value. The limitations inherent in the reserve quantity estimation process, as discussed previously, are equally applicable to the standardized measure computations, since these reserve quantity estimates are the basis for the valuation process. The Company emphasizes that reserve estimates are inherently imprecise and that estimates of new discoveries and undeveloped locations are more imprecise than estimates of established proved producing oil and gas properties. The standardized measure of discounted future net cash flows does not purport, nor should it be interpreted, to present the fair value of the Company’s oil and natural gas reserves. An estimate of fair value
82
PetroShare Corp.
NOTES TO CONSOLIDATED FINANCIAL STATEMENTS
December 31, 2017 and 2016
would also take into account, among other things, the recovery of reserves not presently classified as proved, anticipated future changes in prices and costs and a discount factor more representative of the time value of money and the risks inherent in reserve estimates.
The following are the principal sources of change in the standardized measure (in thousands):
|
|
|
For the years ended December 31, |
|||||||
|
|
|
2017 |
|
2016 |
|
2015 |
|||
|
|
|
|
|
|
|
|
|
|
|
|
Future cash inflows |
|
$ |
208,459 |
|
$ |
148,596 |
|
$ |
5 |
|
Future cash outflows: |
|
|
|
|
|
|
|
|
|
|
Production cost |
|
|
(48,929) |
|
|
(35,038) |
|
|
(3) |
|
Development cost |
|
|
(58,784) |
|
|
(37,667) |
|
|
— |
|
Future income tax |
|
|
(16,006) |
|
|
(5,802) |
|
|
— |
|
Future net cash flows |
|
|
84,740 |
|
|
70,089 |
|
|
2 |
|
|
|
|
|
|
|
|
|
|
|
|
Adjustment to discount future annual net cash flows at 10% |
|
|
(35,054) |
|
|
(29,925) |
|
|
(2) |
|
|
|
|
|
|
|
|
|
|
|
|
Standardized measure of discounted future net cash flows |
|
$ |
49,686 |
|
$ |
40,164 |
|
$ |
— |
The following summary sets forth the Company’s future net cash flows relating to proved oil, natural gas and NGL reserves based on the standardized measure prescribed in ASC 932, Extractive Activities-Oil and Gas (in thousands):
Changes in Standardized Measure of Estimated Discounted Future Net Cash Flows
|
|
|
For the years ended December 31, |
|
|||||||
|
|
|
2017 |
|
2016 |
|
2015 |
|
|||
|
Standardized measure, beginning of year |
|
$ |
40,164 |
|
$ |
— |
|
$ |
5 |
|
|
Sales of oil and gas, net of production cost |
|
|
(9,392) |
|
|
(126) |
|
|
(3) |
|
|
Net change in sales prices, net of production cost |
|
|
10,263 |
|
|
489 |
|
|
— |
|
|
Discoveries, extensions and improved recoveries |
|
|
11,979 |
|
|
76,445 |
|
|
— |
|
|
Change in future development costs |
|
|
(4,050) |
|
|
(37,667) |
|
|
— |
|
|
Development costs incurred during the period that reduced future development cost |
|
|
1,144 |
|
|
— |
|
|
— |
|
|
Sales of reserves in place |
|
|
— |
|
|
— |
|
|
— |
|
|
Revisions of quantity estimates |
|
|
(559) |
|
|
— |
|
|
(2) |
|
|
Accretion of discount |
|
|
4,275 |
|
|
130 |
|
|
— |
|
|
Net change in income tax |
|
|
(6,810) |
|
|
(2,587) |
|
|
— |
|
|
Purchase of reserves |
|
|
— |
|
|
6,021 |
|
|
— |
|
|
Changes in timing of rates of production |
|
|
2,672 |
|
|
(2,541) |
|
|
— |
|
|
|
|
|
|
|
|
|
|
|
|
|
|
Standardized measure, end of year |
|
$ |
49,686 |
|
$ |
40,164 |
|
$ |
— |
|
83
ITEM 9. CHANGES IN AND DISAGREEMENTS WITH ACCOUNTANTS ON ACCOUNTING AND FINANCIAL DISCLOSURE
The change in our independent registered accountants was disclosed in a Current Report on Form 8‑K dated June 13, 2017 and filed with the SEC on June 16, 2017. No other information is required by this Item.
ITEM 9A. CONTROLS AND PROCEDURES
Management's Report on Internal Control over Financial Reporting
Management is responsible for establishing and maintaining adequate internal control over financial reporting and for the assessment of the effectiveness of internal control over financial reporting as defined in Rules 13a-15(f) and 15d-15(f) under the Securities Exchange Act of 1934, as amended. Management assessed the effectiveness of our internal control over financial reporting as of December 31, 2017, based on the framework set forth by the Committee of Sponsoring Organizations of the Treadway Commission (“COSO”) in Internal Control-Integrated Framework (2013) (“Framework”). Based on this assessment, management concluded that our internal control over financial reporting as of December 31, 2017, was effective with the exception of the material weakness described below. A material weakness is a deficiency, or combination of deficiencies, in internal control over financial reporting, such that there is reasonable possibility that a material misstatement in our annual or interim consolidated financial statements will not be prevented or detected on a timely basis.
During the quarters ended March 31, 2017, June 30, 2017 and September 30, 2017, we did not maintain effective controls over the accounting for depletion, depreciation and amortization expense. Specifically, the process level controls over the calculation of depletion, depreciation and amortization expense failed to detect a mathematical error in the calculation of the expense for those periods. Management’s review of the depletion, depreciation and amortization calculation and related accounts was not designed or operating at a sufficient level of precision during those periods to identify these misstatements. A reasonable possibility existed that this control deficiency could result in misstatements of the aforementioned accounts and disclosures that could result in a material misstatement to the consolidated financial statements that would not be prevented or detected in a timely manner. Accordingly, we have determined that these control deficiencies, in the aggregate, constituted a material weakness.
These deficiencies resulted in the overstatement of depletion, depreciation and amortization expense recorded and an understatement of the related oil and gas properties. This error was identified by management and was corrected prior to the issuance of our consolidated financial statements as of and for the year ended December 31, 2017. We therefore believe that the material weakness that existed at December 31, 2017 was remediated prior to the issuance of our December 31, 2017 financial statements.
Changes in Internal Control Over Financial Reporting
The changes described below were made to the Company’s internal control over financial reporting during the quarter ended December 31, 2017 and in the subsequent period that have materially affected, or are reasonably likely to materially affect, the Company’s internal control over financial reporting.
In connection with the evaluation of internal control over financial reporting as of December 31, 2017, the Company identified that a material weakness in internal control over financial reporting existed relating to the effective design and operating effectiveness of controls over the calculation of depletion, depreciation and amortization expense;
To address these material weaknesses in the Company’s internal control over financial reporting, the Company implemented the following:
|
· |
We designed and implemented additional controls around the review of depletion, depreciation and amortization. |
84
|
· |
We engaged a new independent contractor to assist in the design and implementation of our closing process controls that includes additional closing checklists for depletion, depreciation and amortization and other key areas related to the financial statement closing process. |
The Company has completed the documentation and testing of the design and operating effectiveness of the corrective actions described above and has concluded that the material weaknesses related to the calculation of depletion, deprecation and amortization expense that existed as of December 31, 2017 was remediated prior to issuance of the consolidated financial statements for the year ended December 31, 2017.
There were no changes in our internal control over financial reporting during our last fiscal quarter ended December 31, 2017 that materially affected, or are reasonably likely to materially affect, our internal control over financial reporting, except as noted above.
Inherent Limitations Over Internal Controls
Internal control over financial reporting cannot provide absolute assurance of achieving financial reporting objectives because of its inherent limitations, including the possibility of human error and circumvention by collusion or overriding of controls. Accordingly, even an effective internal control system may not prevent or detect material misstatements on a timely basis. Also, projections of any evaluation of effectiveness to future periods are subject to the risk that controls may become inadequate because of changes in conditions or that the degree of compliance with the policies or procedures may deteriorate.
Not applicable.
85
ITEM 10. DIRECTORS, EXECUTIVE OFFICERS AND CORPORATE GOVERNANCE
Identification of Directors and Executive Officers
Our executive officers and directors as of March 28, 2018 and their respective ages, positions, and biographical information are set forth below:
|
|
|
|
|
|
|
Board or Executive |
|
|
|
|
|
|
|
Officer Position |
|
Name |
|
Age |
|
Positions With the Company |
|
Held Since |
|
Bill M. Conrad |
|
61 |
|
Chairman of the Board of Directors |
|
November 2012 |
|
Stephen J. Foley |
|
64 |
|
Chief Executive Officer and Director |
|
November 2012 |
|
Frederick J. Witsell |
|
59 |
|
President and Director |
|
November 2012 |
|
Paul D. Maniscalco |
|
48 |
|
Chief Financial Officer |
|
January 2016 |
|
William B. Lloyd |
|
59 |
|
Chief Operating Officer |
|
January 2016 |
|
Scott C. Chandler |
|
56 |
|
Director |
|
May 2016 |
|
James H. Sinclair |
|
55 |
|
Director |
|
May 2016 |
|
Douglas R. Harris |
|
64 |
|
Director |
|
July 2016 |
Each of our directors is serving a term which expires at the next annual meeting of our shareholders and until his successor is elected and qualified or until he resigns or is removed.
The following information summarizes the business experience of each of our officers and directors for at least the last five years:
Bill M. Conrad, Chairman. Mr. Conrad has served as Chairman of our Board of Directors since our inception. He is presently an independent consultant, providing financial management services. From January 1990 until December 2012, Mr. Conrad served as the Vice-President, Chief Financial Officer and Director of MCM Capital Management, Inc., or MCM, a privately-held financial and management consulting firm. MCM assisted other companies in developing and implementing their business plans and capital formation strategies. In that capacity, Mr. Conrad participated in the organization or development of a number of companies in industries as diverse as oil and gas, real estate, and technology. From 2006 to the present, Mr. Conrad has served as a director of Gold Resource Corporation (NYSE MKT: GORO), a publicly traded gold and silver mining and exploration company, and since 2014 has served as Chairman of the Board. From May 2005 to March 2016, Mr. Conrad served as a director of Synergy Resources Corporation (NYSE MKT: SYRG), a publicly traded oil and gas exploration and production company. Mr. Conrad’s extensive experience as a director of other extraction companies gives him valuable insight into the growth and development of our company. For these reasons, we believe Mr. Conrad is qualified to serve as a director of our company.
Stephen J. Foley, Chief Executive Officer and Director. Mr. Foley has served as our Chief Executive Officer since our inception. Prior to entering private business, Mr. Foley had a successful professional football career as a safety with the Denver Broncos football organization of the National Football League where he played for 11 seasons, from 1976 to 1986. In 1991, Mr. Foley founded and continues to serve as the president of FSI Development Inc., a privately-held construction and development company engaged in residential development and construction. In 2000, he founded and continues to serve as a managing member of FS Land, LLC, a privately-held real estate development company. From August 2011 to the present, he has served as Vice President, Secretary and Director of KBW Enterprises, Inc., an oil and gas servicing company. He holds a B.S. in Business Administration from Tulane University and serves on the Board of Denver Street Schools. Mr. Foley has extensive knowledge of our operations and of developing companies. For these reasons, we believe Mr. Foley is qualified to serve as a director of our company.
Frederick J. Witsell, President and Director. Mr. Witsell became our President in November 2012 and assumed the role of Secretary in August 2013. Mr. Witsell has over 37 years of experience in several facets of the oil and gas industry, including prospect development, conventional and horizontal drilling and completion operations, project management, gathering and compression systems, and marketing and risk management. From July 2011 to
86
September 2012, Mr. Witsell served as the owner and General Manager of Premier Energy Supply, LLC, a consulting service firm in the oil and gas industry. From 2010 to 2011, Mr. Witsell served as Vice-President and General Manager of Monroe Gas Storage, an affiliate of High Sierra Energy Partners, and led the organization’s projects and eventual divestiture in 2011. From 1999 to 2003, he was with Markwest Hydrocarbons (NYSE: MPLX) in the capacity of Vice-President of the Rocky Mountain Business Unit and responsible for the growth through capital programs and financial performance of the company’s oil and gas operations in the United States and Canada. Mr. Witsell led the acquisition and eventual divestiture process of Markwest oil and gas assets. Prior to 1999 and at various times between 2003 and 2010 and in 2012, Mr. Witsell also served as an executive and co-founder of a series of small, privately-funded oil and gas companies with properties in North Dakota, Wyoming, Utah and Colorado. He was responsible for the growth and execution of capital programs, utilizing modern horizontal / directional drilling and completion technologies. He led the divestiture of these oil and gas companies. Mr. Witsell has a B.A. in Geology from Colorado College, an M.B.A. in Energy Management from the University of Denver, and is a member of Society of Petroleum Engineers, the American Association of Petroleum Geologists and the Rocky Mountain Association of Geologists. Our Board of Directors believes that Mr. Witsell is well qualified to serve as a director and executive officer of the company as a result of his extensive oil and gas industry experience including in areas of executive management and operations developed by serving as an executive officer of other oil and gas companies throughout his career. Mr. Witsell brings years of hands-on experience with oil and natural gas companies in many capacities and across multiple basins. For these reasons, we believe Mr. Witsell is qualified to serve as a director of our company.
Paul D. Maniscalco, Chief Financial Officer. Mr. Maniscalco became our Chief Financial Officer in January 2016. Mr. Maniscalco has been a principal with SJM Holdings, Inc., d/b/a SJM Accounting, Inc., an accounting and business advisory services firm headquartered in Englewood, Colorado, since 2008. From 2012 until 2014, Mr. Maniscalco served as interim Chief Financial Officer of Earthstone Energy Inc. (NYSE MKT: ESTE), a company engaged in the oil and gas industry. From 2010 until 2011, Mr. Maniscalco served as the interim Chief Financial Officer of GeoPetro Resources Company, a company engaged in the oil and gas industry with securities formerly traded on AMEX and currently traded on OTC Pink of OTCMarkets. Prior to joining SJM Accounting, Inc., Mr. Maniscalco was a senior manager for several accounting firms. Mr. Maniscalco holds a B.B.A. in Accounting and a B.H.S. in Healthcare Administration, each from Florida Atlantic University.
William B. Lloyd, Chief Operating Officer. Mr. Lloyd became our Chief Operating Officer in January 2016. Mr. Lloyd has over 37 years of experience in the oil and gas industry, serving in engineering, management, and senior leadership capacities. Prior to joining the Company, from 2007 until 2015, Mr. Lloyd served as the Senior Vice President of Operations for Cirque Resources L.P. (“Cirque”), a company engaged in the oil and gas industry. From 2006 until 2007, Mr. Lloyd served as the Western Region Drilling Manager for El Paso Exploration Company, which has oil and gas exploration and drilling operations in the Uintah Basin, Powder River Basin, and the Raton Basin. From 2002 until 2006, Mr. Lloyd served as Operations Director for ConocoPhillips Norway, during which time Mr. Lloyd managed well operations on multiple fixed platforms and exploratory drilling operations. Mr. Lloyd holds a Bachelor of Science in Petroleum Engineering from Montana Tech of the University of Montana.
Scott C. Chandler, Director. Mr. Chandler joined our Board of Directors in May 2016. Mr. Chandler has over 25 years of senior executive level management experience. He is the founder and owner of Franklin Court Partners, Inc., or FCP, an entity that provides management and financial consulting services in connection with developing business plans, securing financing and restructuring, a position he has held since 2002. Prior to founding FCP, Mr. Chandler was a founder, Chief Financial Officer and Senior Vice President for Rhythms Netconnections, Inc. (former NASDAQ: RTHM), a formerly publicly-traded corporation, where he served from 1998 to 2001. Mr. Chandler was a member of the senior management team that led this national provider of DSL networking and services prior to the sale of a majority of its assets to MCI Worldcom. From 1996 to 1998, Mr. Chandler served as President and Chief Executive Officer of C-COR Incorporated, or C-COR, a publicly-traded corporation and pioneer in the cable television industry and leading supplier of broadband telecommunications equipment. The common stock of C-COR was traded on the NASDAQ Global Market until the company was merged in late 2007. Prior to C-COR, Mr. Chandler held a number of positions at US WEST. Mr. Chandler’s business career began with Arthur Andersen & Co. as a Senior Consultant/Accountant. He earned an M.B.A. from the Wharton School of Business at the University of Pennsylvania and a B.A. from Whitworth University. Mr. Chandler currently serves as a member of the board of directors of several privately-held and non-profit entities and has in the past served as a member of several public company boards, such as Cimetrix Incorporated (OTCMKTS: CMXX), Tollgrade Communications Inc. (NASDAQ: TLGD), and Paradyne Networks Inc. (NASDAQ:
87
PDYN). He has been determined to be an audit committee financial expert under applicable rules of the Securities and Exchange Commission, or the SEC. Mr. Chandler’s extensive audit and SEC reporting experience will give him valuable insight into our financial reporting and internal control and risk control procedures. For these reasons, we believe Mr. Chandler is qualified to serve as a director of our company.
James H. Sinclair, Director. Mr. Sinclair joined our Board of Directors in May 2016. Mr. Sinclair has over 31 years of experience in exploration, development, acquisitions and divestitures in the oil and gas industry. Since joining our board, Mr. Sinclair has served as a consultant to PEC E&P, LLC, which is the managing member of Providence, immediately prior to which he served as PEC’s Chief Operating Officer, a position he held since April 2014. PEC invests primarily in non-operated oil and gas properties in the United States. In his role as a consultant to PEC, Mr. Sinclair assists with the identification, analysis, and recommendation of oil and gas investment opportunities. In 2010, Mr. Sinclair co-founded Petro Harvester O&G, LLC, an oil and gas production company, where he served as President and Chief Operating Officer until 2012. From 1993 until 2008, Mr. Sinclair served as the Exploration Manager, District Manager of Mississippi, Director of Acquisitions, and Vice President of Exploration and Geosciences of Denbury Resources Inc. (NYSE: DNR), a publicly traded exploration and production company with operations primarily in the Gulf Coast area and offshore Gulf of Mexico. Mr. Sinclair received a B.S. in Geoscience from Northeast Louisiana University. Mr. Sinclair has significant experience in the management and financing of oil and gas companies. For these reasons, we believe Mr. Sinclair is qualified to serve as a director of our company.
Douglas R. Harris, Director. Mr. Harris joined our Board of Directors in July 2016. Mr. Harris has over 38 years of experience in the oil and gas industry. In March 2015, he founded and currently serves as the Chief Operating Officer of Axia Energy II, LLC, a company that identifies and develops oil and gas prospects throughout the United States. From 2009 to 2015, Mr. Harris served as co-founder and Chief Operating Officer of Axia Energy I, LLC, also a company that identifies and develops oil and gas prospects throughout the United States. Prior to that, he served as the co-founder and Vice President of Operations for Orion Energy Partners, Inc., a position he held from 2004 to 2009, and the Vice President and General Manager of the Denver Division of Tom Brown Inc., a position he held from 2001 to 2004. From 1986 to 2001, Mr. Harris served in numerous positions for Burlington Resources Inc., culminating as the Vice President of Production Operations in its Calgary, Alberta offices. He serves on the board of directors of a number of privately-held companies. Mr. Harris holds a B.S. in Civil Engineering from New Mexico State University. For these reasons, we believe Mr. Harris is qualified to serve as a director of our company.
Code of Ethics
On March 1, 2016, our Board of Directors adopted a code of ethics, a copy of which is available on our website at www.petrosharecorp.com. We believe that the code of ethics is reasonably designed to deter wrongdoing and promote honest and ethical conduct; provide full, fair, accurate, timely and understandable disclosure in public reports; comply with applicable laws; ensure prompt internal reporting of code violations; and provide accountability for adherence to the code.
Director Independence
Our Board of Directors has determined that Bill M. Conrad, Scott C. Chandler, James H. Sinclair, and Douglas R. Harris each qualify as “independent” in accordance with Section 803(A) of the NYSE American Company Guide. During the review, our Board of Directors considered relationships and transactions during 2017 and during the past three fiscal years between each director or any member of his immediate family, on the one hand, and our company and our affiliates, on the other hand. The purpose of this review was to determine whether any such relationships or transactions were inconsistent with a determination that the director is independent. The only compensation or remuneration that we provide to Messrs. Conrad, Chandler, Sinclair, or Harris during their tenures as a director is compensation as a non-employee director. None of Messrs. Conrad, Chandler, Sinclair, or Harris, nor any members of their families, have participated in any transaction with us that would disqualify him as an “independent” director under the standard described above. Stephen J. Foley and Frederick J. Witsell do not qualify as “independent” because they are executive officers.
88
Board Committees
Audit Committee. Messrs. Conrad, Chandler, and Harris serve as members of our audit committee and Mr. Chandler serves as the Chairman of the audit committee. The Board has determined that Messrs. Conrad, Chandler, and Harris are each “independent” in accordance with the NYSE MKT definition of independence, that Mr. Chandler is a “financial expert,” as defined by SEC regulations, and each has the related financial management expertise within the meaning of the NYSE MKT rules.
The primary purpose of the audit committee is to act on behalf of our Board of Directors in its oversight of all material aspects of our accounting and financial reporting processes, internal controls, and audit function, including our compliance with Section 404 of the Sarbanes-Oxley Act of 2002. Pursuant to its charter, our audit committee reviews on an on-going basis for potential conflicts of interest, and approves if appropriate, all of our related party transactions. For purposes of the audit committee charter, related party transactions means those transaction required to be disclosed pursuant to SEC regulations. In addition, the audit committee reviews, acts on, and reports to our Board of Directors with respect to various auditing and accounting matters, including the selection of our independent registered public accounting firm, the scope of annual audits, fees to be paid to our independent registered public accounting firm, the performance of our independent registered public accounting firm, our accounting practices, and our internal controls and legal compliance functions. The audit committee also reviews, prior to publication, our reports to the SEC on Forms 10‑K and 10‑Q. The audit committee operates pursuant to a written charter, which is available on our website, www.petrosharecorp.com. The charter describes the nature and scope of responsibilities of the audit committee.
The Audit Committee’s policy is to pre-approve all audit and non-audit services provided by the independent registered public accounting firm. These services may include audit services, audit-related services, tax services and other services. The independent auditors are required to periodically report to the Audit Committee regarding the extent of services provided by the independent registered public accounting firm in accordance with such pre-approval.
Compensation Committee. We do not currently have a compensation committee. Under a policy adopted by our Board, the compensation of our Chief Executive Officer and all other executive officers will be determined by a majority of our independent directors. Executive officers who also serve on our Board of Directors do not vote on matters pertaining to their own personal compensation. Although we may form a compensation committee in the future, there is no assurance as to when or whether we will do so.
Nominating and Corporate Governance Committee. We do not currently have a nominating and corporate governance committee. Board of Directors nominations are selected by a majority of our independent directors.
Section 16(a) Beneficial Ownership Reporting Compliance
Since we do not have a class of securities registered under the Securities Exchange Act of 1934, as amended (the “Exchange Act”), and have never registered a class of securities under the Exchange Act, none of our officers, directors or beneficial owners of our common stock are required to file reports under Section 16 of the Exchange Act.
89
ITEM 11. EXECUTIVE COMPENSATION
Compensation to Officers of the Company
Our “named executive officers” include our chief executive officer, our chief financial officer and the two most highly compensated executive officers during 2017 other than the CEO and CFO. The following table contains compensation data for our named executive officers for the fiscal years ended December 31, 2017 and 2016:
Summary Compensation Table
|
|
|
|
|
|
|
|
|
|
|
Stock |
|
Option |
|
All Other |
|
|
|
|||
|
Name and Principal Position |
|
Year |
|
Salary |
|
Bonus |
|
Awards(1) |
|
Awards(2) |
|
Compensation |
|
Total |
||||||
|
Stephen J. Foley |
|
2017 |
|
$ |
156,000 |
|
$ |
50,000 |
|
$ |
— |
|
$ |
— |
|
$ |
— |
|
$ |
206,000 |
|
Chief Executive Officer |
|
2016 |
|
$ |
155,250 |
|
$ |
— |
|
$ |
— |
|
$ |
— |
|
$ |
16,506 |
|
$ |
171,756 |
|
Frederick J. Witsell |
|
2017 |
|
$ |
156,000 |
|
$ |
50,000 |
|
$ |
— |
|
$ |
— |
|
$ |
— |
|
$ |
206,000 |
|
President |
|
2016 |
|
$ |
155,250 |
|
$ |
— |
|
$ |
— |
|
$ |
— |
|
$ |
7,623 |
|
$ |
162,873 |
|
Paul D. Maniscalco |
|
2017 |
|
$ |
161,733 |
|
$ |
25,000 |
|
$ |
27,573 |
|
$ |
— |
|
$ |
— |
|
$ |
214,306 |
|
Chief Financial Officer |
|
2016 |
|
$ |
88,242 |
|
$ |
— |
|
$ |
— |
|
$ |
— |
|
$ |
— |
|
$ |
88,242 |
|
William B. Lloyd |
|
2017 |
|
$ |
156,000 |
|
$ |
50,000 |
|
$ |
— |
|
$ |
— |
|
$ |
— |
|
$ |
206,000 |
|
Chief Operating Officer |
|
2016 |
|
$ |
155,250 |
|
$ |
— |
|
$ |
— |
|
$ |
607,670 |
|
$ |
21,654 |
|
$ |
784,574 |
(1)Calculated in accordance with the Black-Scholes option pricing model. Please see Note 10 to the consolidated financial statements included in this report for a description of certain assumptions made in conjunction with the valuation of these awards.
(2)Calculated in accordance with the Black-Scholes option pricing model. Please see Note 10 to the consolidated financial statements included in this report for a description of certain assumptions made in conjunction with the valuation of these awards.
Effective March 1, 2016, we entered into an amended and restated employment agreement with each Stephen J. Foley and Fredrick J. Witsell. Pursuant to the amended and restated employment agreements, Messrs. Foley and Witsell are each compensated by us at the rate of $13,000 per month, or $156,000 per year. We entered into an executive employment agreement with William B. Lloyd, Chief Operating Officer, effective January 1, 2016 and amended on March 1, 2016 pursuant to which Mr. Lloyd is compensated at the rate of $13,000 per month, or $156,000 per year. For each of the foregoing executives, the employment agreements provide for an initial term expiring on December 31, 2018 with an automatic renewal for successive one-year periods unless terminated in accordance with its terms and provisions for termination and payment of severance under various circumstances.
On June 1, 2017, we entered into an executive employment agreement with our Chief Financial Officer Paul D. Maniscalco. The agreement provides for a base salary of $150,000 per year, an initial term expiring on December 31, 2018 with an automatic renewal for successive one-year periods unless terminated in accordance with its terms and provisions for termination and payment of severance under various circumstances.
90
Outstanding Equity Awards at Year End
The following table sets forth outstanding stock option awards held by our named executive officers as of December 31, 2017:
|
|
|
Option awards |
||||||||
|
|
|
|
|
|
|
Number of |
|
|
|
|
|
|
|
|
|
|
|
securities |
|
|
|
|
|
|
|
Number of securities |
|
Number of securities |
|
underlying |
|
|
|
|
|
|
|
underlying |
|
underlying |
|
unexercised |
|
Option |
|
|
|
|
|
unexercised options |
|
unexercised options |
|
unearned |
|
exercise |
|
Option |
|
Name |
|
(#) exercisable |
|
(#) unexercisable |
|
options (#) |
|
price ($) |
|
expiration date |
|
Stephen J. Foley |
|
500,000 |
|
— |
|
— |
|
0.25 |
|
12/15/2022 |
|
Frederick J. Witsell |
|
1,000,000 |
|
— |
|
— |
|
0.25 |
|
12/15/2022 |
|
Paul D. Maniscalco |
|
250,000 |
|
— |
|
— |
|
1.00 |
|
1/1/2019 |
|
William B. Lloyd |
|
125,000 |
|
— |
|
— |
|
1.00 |
|
7/21/2018 |
|
William B. Lloyd |
|
875,000 |
|
— |
|
— |
|
1.00 |
|
12/31/2022 |
Director Compensation
Bill M. Conrad, the Chairman of our Board of Directors, is paid a director’s fee in the amount of $10,000 per month. Scott C. Chandler, as the chair of the audit committee, is paid a director’s fee in the amount of $9,000 per quarter. James H. Sinclair and Douglas R. Harris are each are paid a director’s fee in the amount of $6,000 per quarter. Messrs. Foley and Witsell are not compensated in their capacities as directors. We do, however, reimburse all of our directors for reasonable and necessary expenses incurred by them in that capacity.
We will review our compensation arrangements periodically in the future and may change our compensation policies as our business needs dictate and our resources permit.
The following table sets forth with respect to the directors, compensation information inclusive of equity awards and payments made during the year ended December 31, 2017 in the director’s capacity as such:
|
|
|
|
|
Fees Earned |
|
|
|
|
|
|
|
|
|
|
|
|
|
or Paid in |
|
Stock |
|
Option |
|
All Other |
|
|
|
Name |
|
Year |
|
Cash ($) |
|
Awards ($) |
|
Awards ($) |
|
Compensation ($) |
|
Total ($) |
|
Bill M. Conrad |
|
2017 |
|
120,000 |
|
— |
|
— |
|
50,000 |
|
170,000 |
|
Stephen J. Foley |
|
2017 |
|
— |
|
— |
|
— |
|
— |
|
— |
|
Frederick J. Witsell |
|
2017 |
|
— |
|
— |
|
— |
|
— |
|
— |
|
Scott C. Chandler |
|
2017 |
|
30,000 |
|
— |
|
— |
|
12,000 |
|
42,000 |
|
Douglas R. Harris |
|
2017 |
|
29,000 |
|
— |
|
— |
|
12,000 |
|
41,000 |
|
James H. Sinclair |
|
2017 |
|
29,000 |
|
— |
|
— |
|
12,000 |
|
41,000 |
ITEM 12. SECURITY OWNERSHIP OF CERTAIN BENEFICIAL OWNERS AND MANAGEMENT AND RELATED STOCKHOLDER MATTERS
Beneficial Ownership
As of March 28, 2018, there were a total of 27,788,802 shares of our common stock outstanding, our only class of voting securities currently outstanding. The following table describes the ownership of our voting securities as of March 28, 2018 by: (i) each of our named executive officers and directors; (ii) all of our officers and directors as a group; and (iii) each shareholder known us to own beneficially more than 5% of our common stock. Unless otherwise stated, the address of each of the individuals is our address, 9635 Maroon Circle, Suite 400, Englewood, Colorado 80112.
91
In calculating the percentage ownership for each shareholder, we assumed that any options, warrants, or convertible promissory notes owned by an individual and exercisable or convertible within 60 days are exercised or converted, but not the options, warrants, or convertible promissory notes owned by any other individual.
|
|
|
Shares Beneficially Owned |
||
|
Name and Address of Beneficial Owner |
|
Number |
|
Percentage (%) |
|
Bill M. Conrad(1) |
|
2,265,833 |
(2) |
8.0 |
|
Stephen J. Foley(1) |
|
2,207,733 |
(2) |
7.8 |
|
Frederick J. Witsell(1) |
|
3,851,667 |
(3) |
13.3 |
|
Paul D. Maniscalco(1) |
|
360,000 |
(4) |
1.1 |
|
William B. Lloyd(1) |
|
1,199,999 |
(5) |
4.2 |
|
Scott C. Chandler(1) |
|
205,000 |
(6) |
* |
|
James H. Sinclair(1)(9) |
|
183,333 |
(7) |
* |
|
Douglas R. Harris(1) |
|
149,999 |
(8) |
* |
|
Providence Energy Operators, LLC(10) |
|
3,250,000 |
|
11.7 |
|
Providence Wattenberg, LP (11) |
|
9,375,526 |
(12) |
25.2 |
|
All officers and directors as a group (8 persons) |
|
10,423,564 |
(13) |
32.7 |
*Less than one percent.
|
(1) |
Officer or director of PetroShare. |
|
(2) |
Includes 500,000 shares of common stock underlying options which are currently exercisable, 66,666 shares underlying warrants that are currently exercisable and 66,667 shares of common stock which may be currently issued upon conversion of notes. |
|
(3) |
Includes 1,000,000 shares of common stock underlying options which are presently exercisable, 56,667 shares underlying warrants that are currently exercisable and 45,000 shares of common stock which may be currently issued upon conversion of notes. |
|
(4) |
Includes 250,000 shares of common stock underlying options which are presently exercisable, 33,333 shares underlying warrants that are currently exercisable and 26,667 shares of common stock which may be currently issued upon conversion of notes. |
|
(5) |
Includes 1,000,000 shares of common stock underlying options which are presently exercisable, 66,666 shares underlying warrants that are currently exercisable and 33,333 shares of common stock which may be currently issued upon conversion of notes. |
|
(6) |
Includes 25,000 shares of common stock underlying options which are presently exercisable, 16,667 shares underlying warrants that are currently exercisable and 8,333 shares of common stock which may be currently issued upon conversion of notes. |
|
(8) |
Includes 25,000 shares of common stock underlying options which are presently exercisable, 66,666 shares underlying warrants that are currently exercisable and 33,333 shares of common stock which may be currently issued upon conversion of notes. |
|
(9) |
James H. Sinclair disclaims any beneficial ownership of shares of common stock owned by Providence Energy Operators, LLC, or Providence. |
92
|
(10) |
PEC E&P, LLC, a Texas limited liability company whose address is 16400 Dallas Parkway, Dallas, Texas, 75248, (i) is the manager of Providence Energy Operators, LLC, (ii) has voting and investment control of the securities owned by Providence Energy Operators, LLC, and (iii) should not be considered a beneficial owner of the shares of common stock owned by the reporting person. |
|
(11) |
Providence Wattenberg GP, LLC, a Texas limited liability company, whose address is 16400 Dallas Parkway, Dallas, Texas, 75248, (i) is the general partner of Providence Wattenberg, LP, (ii) has management and investment control of the securities onwed by Providence Wattenberg, LP, and (iii) should be considered a beneficial owner of any securities owned or held by Providence Wattenberg, LP. |
|
(12) |
Includes (i) 750,000 shares issuable upon exercise of warrants that are currently exercisable, and (ii) 8,625,526 shares that may be issued upon conversion of outstanding indebtedness, which indebtedness is currently convertible. |
|
(13) |
Includes 3,325,000 shares of common stock underlying options which are presently exercisable, 439,997 shares underlying warrants that are currently exercisable and 346,667 shares of common stock which may be currently issued upon conversion of notes. |
93
ITEM 13. CERTAIN RELATIONSHIPS AND RELATED TRANSACTIONS, AND DIRECTOR INDEPENDENCE
The following includes a summary of transactions, during our last two fiscal years, to which we have been a party, in which the amount involved in the transaction exceeded $120,000 or one percent of the average of our total assets at fiscal year-end for the last two fiscal years, and in which any of our directors, executive officers or, to our knowledge, beneficial owners of more than 5% of our capital stock or any member of the immediate family of any of the foregoing persons had or will have a direct or indirect material interest, other than equity and other compensation, termination, change in control and other arrangements which are described under “Director Compensation” and “Executive Compensation.”
Providence Energy Operators, LLC
Initial Line of Credit
|
· |
At December 31, 2017 and 2016, we had drawn $5.0 million on the initial line of credit from Providence Energy Operators, LLC (“PEO”), the beneficial owner of more than 5% of our common stock, and had accrued interest in the amount of $0.5 million and $0.3 million, respectively at those dates, owing to that entity. |
|
· |
On September 23, 2017, we issued 250,000 shares of common stock valued at $1.55 to PEO in connection with the extension of that loan. |
Credit Facility
|
· |
Related to the execution of a Letter Agreement on December 21, 2017, we borrowed $5.0 million from a PEO – affiliated entity and had accrued $21,801 in interest to that entity as of December 31, 2017. In part consideration for the loan, we agreed to issue warrants to the PEO-affiliated entity and another lender to purchase 1,500,000 shares of our common stock exercisable for $0.01 per share. |
Operations
|
· |
During the year ended December 31, 2017, we billed PEO $5.7 million in connection with drilling activity on the leases in which PEO participates. This amount relates to amounts billed to PEO in connection with its participation in our operated Shook drilling program and PEO’s ownership interest in the vertical wells that we operate. |
94
Convertible Notes
During December 2016 and January 2017, we completed a private placement of 200 units at an offering price of $50,000 per unit. Certain of the units were purchased by our directors and officers in the following amounts and on the following dates on the same terms and conditions as independent third parties:
|
|
|
Number of Unit |
|
|
|
Name of Beneficial Owner |
|
Purchased |
|
Issuance Date |
|
Bill M. Conrad |
|
2.0 |
|
December 30, 2016 |
|
Stephen J. Foley |
|
2.0 |
|
December 30, 2016 |
|
Frederick J. Witsell |
|
1.7 |
|
January 20, 2017 |
|
Paul D. Maniscalco |
|
1.0 |
|
December 30, 2016 |
|
William B. Lloyd |
|
2.0 |
|
December 30, 2016 |
|
William R. Givan |
|
1.0 |
|
December 30, 2016 |
|
Jon B. Kruljac |
|
2.2 |
|
January 20, 2017 |
|
Scott C. Chandler |
|
0.5 |
|
January 20, 2017 |
|
Douglas R. Harris |
|
2.0 |
|
December 30, 2016 |
|
James H. Sinclair |
|
2.0 |
|
December 30, 2016 |
On October 16, 2017, all of the officers and directors listed above converted Series A Notes in the aggregate principal amount of $0.7 million and accrued interest of $20,670 into 691,516 shares of common stock at a conversion rate of $1.10 per share. Those same officers and directors received cash interest payments for interest of $0.1 million related to Series A and Series B notes during the year ended December 31, 2017.
Series B Convertible Notes
In September and October 2017, we sold Series B Notes to the same officers and directors who collectively purchased $0.6 million in aggregate principal amount, on the same terms and conditions as the other purchasers, with the exception that we did not pay commissions on these sales.
ITEM 14. PRINCIPAL ACCOUNTING FEES AND SERVICES
Audit Fees and Services
For the fiscal year ended December 31, 2017, professional services were performed by Eide Bailly LLP, and for the fiscal year ended December 31, 2016, professional services were performed by SingerLewak LLP. The aggregate fees for the fiscal years ended December 31, 2017 and 2016 were as follows:
|
|
|
2017 |
|
2016 |
||
|
Audit Fees |
|
$ |
68,897 |
|
$ |
97,830 |
|
Audit-Related Fees |
|
|
— |
|
|
128,495 |
|
Tax Fees |
|
|
4,500 |
|
|
5,900 |
|
All Other Fees |
|
|
— |
|
|
— |
|
Total |
|
$ |
73,397 |
|
$ |
232,225 |
The Audit Committee’s policy is to pre-approve all audit and non-audit services provided by the independent registered public accounting firm. These services may include audit services, audit-related services, tax services and other services. The independent auditors are required to periodically report to the Audit Committee regarding the extent of services provided by the independent registered public accounting firm in accordance with such pre-approval.
During the year ended December 31, 2017, the Audit Committee approved, in advance, all audit and non-audit services to be provided by Eide Bailly LLP. The Audit Committee has determined that the non-audit services rendered by Eide Bailly LLP during fiscal years 2017 and 2016 were compatible with maintaining the independence of the respective independent registered public accounting firms.
95
ITEM 15. EXHIBITS AND CONSOLIDATED FINANCIAL STATEMENTS SCHEDULES
(a)(1) Consolidated Financial Statements:
See Item 8 of this report for a list of consolidated financial statements.
(a)(3) Exhibits required by Item 601 of Regulation S-K
The following exhibits are filed or incorporated by reference in this report:
EXHIBIT INDEX
|
|
|
|
|
Incorporated by Reference |
|
|
|||||||||||
|
Exhibit |
|
Exhibit Description |
|
Form |
|
File No. |
|
Exhibit |
|
Filing Date |
|
Filed |
|||||
| 2.1 |
|
Letter Agreement between the Company and Phyllis Dowell, dated October 5, 2016 |
|
8‑K |
|
333198881 |
|
2.1 |
|
October 12, 2016 |
|
|
|||||
| 2.2 |
|
|
8‑K |
|
00137943 |
|
2.1 |
|
November 28, 2016 |
|
|
||||||
| 2.3 |
|
|
8‑K |
|
00137943 |
|
2.1 |
|
February 28, 2017 |
|
|
||||||
| 3.1 |
|
Articles of Incorporation as filed with the Colorado Secretary of State on September 4, 2012 |
|
S‑1 |
|
333198881 |
|
3.1 |
|
September 22, 2014 |
|
|
|||||
| 3.2 |
|
|
|
|
|
|
|
|
|
|
X |
||||||
| 3.3 |
|
|
S‑1 |
|
333198881 |
|
3.2 |
|
September 22, 2014 |
|
|
||||||
| 4.1 |
|
|
S‑1 |
|
333198881 |
|
4.1 |
|
November 5, 2014 |
|
|
||||||
| 4.2 |
|
|
S‑1 |
|
333198881 |
|
4.2 |
|
August 27, 2015 |
|
|
||||||
| 4.3 |
|
|
8‑K |
|
00137943 |
|
4.1 |
|
February 3, 2017 |
|
|
||||||
| 4.4 |
|
|
8‑K |
|
00137943 |
|
4.2 |
|
February 3, 2017 |
|
|
||||||
| 10.1 |
|
Amended and Restated PetroShare Corp. Equity Incentive Plan dated August 18, 2016 |
|
8‑K |
|
333198881 |
|
10.1 |
|
September 13, 2016 |
|
|
|||||
| 10.2 |
|
|
S‑1 |
|
333198881 |
|
10.2 |
|
September 22, 2014 |
|
|
||||||
| 10.3 |
|
|
8‑K |
|
333198881 |
|
10.2 |
|
March 1, 2016 |
|
|
||||||
| 10.4 |
|
|
S-1 |
|
333-218096 |
|
10.4 |
|
May 19, 2017 |
|
|
||||||
| 10.5 |
|
|
S-1 |
|
333-218096 |
|
10.5 |
|
May 19, 2017 |
|
|
||||||
| 10.6 |
|
Executive Employment Agreement between the Company and Paul D. Maniscalco effective June 1, 2017 |
|
8-K |
|
001-37943 |
|
10.1 |
|
June 2, 2017 |
|
|
|||||
96
| 10.7 |
|
Executive Employment Agreement between the Company and William B. Lloyd, effective January 1, 2016 |
|
8‑K |
|
333198881 |
|
10.3 |
|
March 1, 2016 |
|
|
|||||
| 10.8 |
|
|
S‑1 |
|
333198881 |
|
10.9 |
|
September 22, 2014 |
|
|
||||||
| 10.9 |
|
Agreement for Services dated November 12, 2014 between the Company and Kingdom Resources, LLC |
|
8‑K |
|
333198881 |
|
10.1 |
|
March 5, 2015 |
|
|
|||||
| 10.10 |
|
|
10‑Q |
|
333198881 |
|
10.1 |
|
May 15, 2015 |
|
|
||||||
| 10.11 |
|
Promissory Note dated May 13, 2015 for the benefit of Providence. |
|
10‑Q |
|
333198881 |
|
10.2 |
|
May 15, 2015 |
|
|
|||||
| 10.12 |
|
|
10‑Q |
|
333198881 |
|
10.4 |
|
May 15, 2015 |
|
|
||||||
| 10.13 |
|
|
8‑K |
|
333198881 |
|
10.1 |
|
September 8, 2015 |
|
|
||||||
| 10.14 |
|
|
8‑K |
|
333198881 |
|
10.1 |
|
March 1, 2016 |
|
|
||||||
| 10.15 |
|
|
8‑K |
|
333198881 |
|
10.1 |
|
April 6, 2016 |
|
|
||||||
| 10.16 |
|
Letter Agreement between the Company and The Equinox Group LLC, executed April 14, 2016 |
|
8‑K |
|
333198881 |
|
10.1 |
|
April 19, 2016 |
|
|
|||||
| 10.17 |
|
Purchase and Sale Agreement between the Company and PDC Energy, Inc., dated May 27, 2016 |
|
8‑K |
|
333198881 |
|
10.1 |
|
June 3, 2016 |
|
|
|||||
| 10.18 |
|
|
8‑K |
|
333198881 |
|
10.1 |
|
October 18, 2016 |
|
|
||||||
| 10.19 |
|
Letter Agreement, dated March 30, 2017, between the Company and Providence Energy Partners III, LP |
|
10-K |
|
001-37943 |
|
10.1 |
|
March 31, 2017 |
|
|
|||||
| 10.20 |
|
|
8‑K |
|
00137943 |
|
10.1 |
|
February 3, 2017 |
|
|
||||||
| 10.21 |
|
Placement Agent Agreement by and between the Company and GVC Capital LLC, dated December 29, 2016 |
|
8‑K |
|
00137943 |
|
10.2 |
|
February 3, 2017 |
|
|
|||||
| 10.22 |
|
|
8‑K |
|
00137943 |
|
10.3 |
|
February 3, 2017 |
|
|
||||||
| 10.23 |
|
|
S-1 |
|
333-218096 |
|
10.26 |
|
May 19, 2017 |
|
|
||||||
| 10.24 |
|
|
8-K |
|
001-37943 |
|
10.1 |
|
June 9, 2017 |
|
|
||||||
| 10.25 |
|
|
10-Q |
|
001-37943 |
|
10.1 |
|
November 14, 2017 |
|
|
||||||
| 10.26 |
|
|
10-Q |
|
001-37943 |
|
10.2 |
|
November 14, 2017 |
|
|
||||||
97
| 10.27 |
|
|
10-Q |
|
001-37943 |
|
10.3 |
|
November 14, 2017 |
|
|
||||||
| 10.28 |
|
Placement Agent Agreement between the Company and GVC Capital LLC dated September 11, 2017 |
|
10-Q |
|
001-37943 |
|
10.4 |
|
November 14, 2017 |
|
|
|||||
| 10.29 |
|
|
10-Q |
|
001-37943 |
|
10.5 |
|
November 14, 2017 |
|
|
||||||
| 10.30 |
|
|
8-K |
|
001-37943 |
|
10.1 |
|
February 7, 2018 |
|
|
||||||
| 10.31 |
|
|
8-K |
|
001-37943 |
|
10.2 |
|
February 7, 2018 |
|
|
||||||
| 10.32 |
|
First Amendment to Amended and Restated Participation Agreement, dated February 1, 2018 |
|
8-K |
|
001-37943 |
|
10.3 |
|
February 7, 2018 |
|
|
|||||
| 10.33 |
|
|
8-K |
|
001-37943 |
|
10.4 |
|
February 7, 2018 |
|
|
||||||
| 14.1 |
|
|
8‑K |
|
333198881 |
|
14.1 |
|
March 1, 2016 |
|
|
||||||
| 16.1 |
|
Letter from StarkSchenkein, LLP to the U.S. Securities and Exchange Commission, dated May 6, 2015 |
|
8‑K |
|
333198881 |
|
16.1 |
|
May 7, 2015 |
|
|
|||||
| 16.2 |
|
Letter from SingerLewak to the Securities and Exchange Commission, date June 16, 2017 |
|
8-K |
|
00137943 |
|
16.1 |
|
June 16, 2017 |
|
|
|||||
| 23.1 |
|
|
|
|
|
|
|
|
|
|
X |
||||||
| 31.1 |
|
|
|
|
|
|
|
|
|
|
X |
||||||
| 31.2 |
|
|
|
|
|
|
|
|
|
|
X |
||||||
| 32.1 |
|
Section 1350 Certifications of Chief Executive Officer and Chief Financial Officer |
|
|
|
|
|
|
|
|
|
X |
|||||
| 99.1 |
|
|
|
|
|
|
|
|
|
|
X |
||||||
|
101.INS |
|
XBRL Instance Document |
|
|
|
|
|
|
|
|
|
X |
|||||
|
101.SCH |
|
XBRL Schema Document |
|
|
|
|
|
|
|
|
|
X |
|||||
|
101.CAL |
|
XBRL Calculation Linkbase Document |
|
|
|
|
|
|
|
|
|
X |
|||||
|
101.DEF |
|
XBRL Definition Linkbase Document |
|
|
|
|
|
|
|
|
|
X |
|||||
|
101.LAB |
|
XBRL Label Linkbase Document |
|
|
|
|
|
|
|
|
|
X |
|||||
|
101.PRE |
|
XBRL Presentation Linkbase Document |
|
|
|
|
|
|
|
|
|
X |
|||||
None.
98
SIGNATURES
Pursuant to the requirements of Section 13 or 15(d) of the Securities Exchange Act of 1934, the registrant has caused this report to be signed on its behalf by the undersigned thereunto duly authorized.
|
|
PETROSHARE CORP. |
|
|
|
|
|
|
|
By: |
/s/ STEPHEN J. FOLEY |
|
Date: March 28, 2018 |
|
Stephen J. Foley, Chief Executive Officer |
In accordance with the Securities Exchange Act of 1934, this report has been signed below by the following persons on behalf of the Company and in the capacities and on the dates indicated.
|
/s/ STEPHEN J. FOLEY |
|
Director and Chief Executive Officer |
|
March 28, 2018 |
|
Stephen J. Foley |
|
(Principal Executive Officer) |
|
|
|
|
|
|
|
|
|
/s/ PAUL D. MANISCALCO |
|
Chief Financial Officer |
|
March 28, 2018 |
|
Paul D. Maniscalco |
|
(Principal Financial and Principal Accounting Officer) |
|
|
|
|
|
|
|
|
|
/s/ BILL M. CONRAD |
|
Chairman of the Board of Directors |
|
March 28, 2018 |
|
Bill M. Conrad |
|
|
|
|
|
|
|
|
|
|
|
/s/ FREDERICK J. WITSELL |
|
Director and President |
|
March 28, 2018 |
|
Frederick J. Witsell |
|
|
|
|
|
|
|
|
|
|
|
/s/ SCOTT C. CHANDLER |
|
Director |
|
March 28, 2018 |
|
Scott C. Chandler |
|
|
|
|
|
|
|
|
|
|
|
/s/ DOUGLAS R. HARRIS |
|
Director |
|
March 28, 2018 |
|
Douglas R. Harris |
|
|
|
|
|
|
|
|
|
|
|
/s/ JAMES H. SINCLAIR |
|
Director |
|
March 28, 2018 |
|
James H. Sinclair |
|
|
|
|
Supplemental Information to be Furnished With Reports Filed Pursuant to Section 15(d) of the Act by Registrants Which Have Not Registered Securities Pursuant to Section 12 of the Act
No annual report, proxy statement, form of proxy, or other proxy soliciting material has been sent to the registrant’s security holders. The registrant undertakes to furnish to the Commission any annual report or proxy material which it delivers to security holders in connection with an annual meeting.
99