Attached files
| file | filename |
|---|---|
| EX-32.2 - EXHIBIT 32.2 - COGNIZANT TECHNOLOGY SOLUTIONS CORP | ctshexhibit32212312017.htm |
| EX-32.1 - EXHIBIT 32.1 - COGNIZANT TECHNOLOGY SOLUTIONS CORP | ctshexhibit32112312017.htm |
| EX-31.2 - EXHIBIT 31.2 - COGNIZANT TECHNOLOGY SOLUTIONS CORP | ctshexhibit31212312017.htm |
| EX-31.1 - EXHIBIT 31.1 - COGNIZANT TECHNOLOGY SOLUTIONS CORP | ctshexhibit31112312017.htm |
| EX-23.1 - EXHIBIT 23.1 - COGNIZANT TECHNOLOGY SOLUTIONS CORP | ctshexhibit23112312017.htm |
| EX-21.1 - EXHIBIT 21.1 - COGNIZANT TECHNOLOGY SOLUTIONS CORP | ctshexhibit21112312017.htm |
| EX-10.3 - EXHIBIT 10.3 - COGNIZANT TECHNOLOGY SOLUTIONS CORP | ctshexhibit10312312017.htm |
UNITED STATES
SECURITIES AND EXCHANGE COMMISSION
Washington, D.C. 20549
FORM 10-K
FOR ANNUAL AND TRANSITION REPORTS
PURSUANT TO SECTIONS 13 OR 15(d) OF THE
SECURITIES EXCHANGE ACT OF 1934
(Mark One)
☒ | ANNUAL REPORT PURSUANT TO SECTION 13 OR 15(d) OF THE SECURITIES EXCHANGE ACT OF 1934 | ||
For the fiscal year ended December 31, 2017 | |||
OR | |||
☐ | TRANSITION REPORT PURSUANT TO SECTION 13 OR 15(d) OF THE SECURITIES EXCHANGE ACT OF 1934 | ||
For the transition period from to | |||
Commission File Number 0-24429
COGNIZANT TECHNOLOGY SOLUTIONS CORPORATION
(Exact Name of Registrant as Specified in Its Charter)
Delaware | 13-3728359 | |
(State or Other Jurisdiction of Incorporation or Organization) | (I.R.S. Employer Identification No.) | |
Glenpointe Centre West 500 Frank W. Burr Blvd. Teaneck, New Jersey | 07666 | |
(Address of Principal Executive Offices) | (Zip Code) | |
Registrant’s telephone number, including area code: (201) 801-0233
Securities registered pursuant to Section 12(b) of the Act:
Title of each class | Name of each exchange on which registered |
Class A Common Stock, $0.01 par value per share | The Nasdaq Stock Market LLC |
Securities registered pursuant to Section 12(g) of the Act: None
Indicate by check mark if the registrant is a well-known seasoned issuer, as defined in Rule 405 of the Securities Act. ☒ Yes ☐ No
Indicate by check mark if the registrant is not required to file reports pursuant to Section 13 or Section 15(d) of the Act. ☐ Yes ☒ No
Indicate by check mark whether the registrant (1) has filed all reports required to be filed by Section 13 or 15(d) of the Securities Exchange Act of 1934 during the preceding 12 months (or for such shorter period that the registrant was required to file such reports), and (2) has been subject to such filing requirements for the past 90 days. ☒ Yes ☐ No
Indicate by check mark whether the registrant has submitted electronically and posted on its corporate Website, if any, every Interactive Data File required to be submitted and posted pursuant to Rule 405 of Regulation S-T (§232.405 of this chapter) during the preceding 12 months (or for such shorter period that the registrant was required to submit and post such files). ☒ Yes ☐ No
Indicate by check mark if disclosure of delinquent filers pursuant to Item 405 of Regulation S-K (§229.405 of this chapter) is not contained herein, and will not be contained, to the best of registrant’s knowledge, in definitive proxy or information statements incorporated by reference in Part III of this Form 10-K or any amendment to this Form 10-K. ☒
Indicate by check mark whether the registrant is a large accelerated filer, an accelerated filer, a non-accelerated filer, smaller reporting company, or an emerging growth company. See the definitions of “large accelerated filer,” “accelerated filer,” “smaller reporting company,” and “emerging growth company” in Rule 12b-2 of the Exchange Act. (Check one):
Large accelerated filer | ☒ | Accelerated filer | ☐ |
Non-accelerated filer | ☐ (Do not check if a smaller reporting company) | Smaller reporting company | ☐ |
Emerging Growth Company | ☐ | ||
If an emerging growth company, indicate by check mark if the registrant has elected not to use the extended transition period for complying with any new or revised financial accounting standards provided pursuant to Section 13(a) of the Exchange Act. ☐
Indicate by check mark whether the registrant is a shell company (as defined in Rule 12b-2 of the Act). ☐ Yes ☒ No
The aggregate market value of the registrant’s voting shares of common stock held by non-affiliates of the registrant on June 30, 2017, based on $66.40 per share, the last reported sale price on the Nasdaq Global Select Market of the Nasdaq Stock Market LLC on that date, was $39.0 billion.
The number of shares of Class A common stock, $0.01 par value, of the registrant outstanding as of February 22, 2018 was 588,051,333 shares.
DOCUMENTS INCORPORATED BY REFERENCE
The following documents are incorporated by reference into the Annual Report on Form 10-K: Portions of the registrant’s definitive Proxy Statement for its 2018 Annual Meeting of Stockholders are incorporated by reference into Part III of this Report.
TABLE OF CONTENTS
Item | Page | |||
1. | ||||
1A. | ||||
1B. | ||||
2. | ||||
3. | ||||
4. | ||||
5. | ||||
6. | ||||
7. | ||||
7A. | ||||
8. | ||||
9. | ||||
9A. | ||||
9B. | ||||
10. | ||||
11. | ||||
12. | ||||
13. | ||||
14. | ||||
15. | ||||
16. | ||||
PART I
Item 1. Business
Company Overview
Cognizant is one of the world’s leading professional services companies. We are in business to help our customers adapt, compete and grow in the face of continual shifts and disruptions within their markets. We do so by partnering with them to apply technology to transform their business, operating, and technology models, allowing them to achieve the full value of digitizing their entire enterprises. We call this being “digital at scale.” When implemented, it enables customers to achieve more efficient and effective operations while reshaping their business models for innovation and growth. Our industry-based, consultative approach helps customers envision, build and run more innovative and efficient businesses. Our core competencies include: business, process, operations and technology consulting, application development and systems integration, enterprise information management, application testing, application maintenance, information technology, or IT, infrastructure services, and business process services. We tailor our services and solutions to specific industries and use an integrated global delivery model that employs customer service teams based at customer locations and delivery teams located at dedicated global and regional delivery centers.
Industry Overview
In today’s fast-paced and complex business environment, most companies face intense competitive pressure and rapidly changing market dynamics. This more demanding environment is partially the result of the broadening use of new digital technologies such as artificial intelligence, analytics, robotic process automation, cybersecurity and hybrid cloud. These technologies have become so effective at transforming business models and core processes that no large enterprise can ignore them and still remain competitive. As a result, advanced technologies are no longer only about supporting the business; increasingly, they are the business. In response, many companies now apply digital technologies to transform the way they engage with customers and employees, and to develop innovative products and services and bring them quickly to market. Companies are also eager to automate additional aspects of their business to improve their cost structures and increase the quality and velocity of their operations. Therefore, customers seek digital transformation experts who can help them reimagine, redefine, and remake their businesses and who can provide this capability through a global sourcing model.
Business Strategy
Our objective is to create value for both our customers and stockholders by enhancing our position as a leading professional services company in the digital era. Our key strategies to achieve this objective are described below.
Align Our Digital Services and Solutions Along Three Practice Areas
Our digital services and solutions are designed to help our customers win in the digital economy by applying technology and analytics to change consumer experiences to drive sustainable growth, deploying systems of intelligence to automate and improve core business processes, and improving technology systems by deploying cloud and cyber security solutions and as-a-service models to make them simpler, more modern and secure.
We have aligned our digital services and solutions into three practice areas across our four industry-oriented business segments, to mirror our clients' needs and the parts of their enterprise they need to transform.
• | Cognizant Digital Business. Our digital business practice works with customers to envision and build human-centric digital solutions, fusing strategy, intelligence, experience and software to drive industry-aligned transformative growth. Our approach combines data science, design thinking, and deep industry and process knowledge with solid technology capabilities to unite the physical and virtual aspects of a company’s offerings seamlessly across every channel. We help customers identify insights, develop business models and go-to-market strategies, and design, prototype and scale meaningful experiences. |
• | Cognizant Digital Operations. Our digital operations practice helps customers re-engineer, digitize, manage and operate their most essential business processes to lower operating costs, improve user experiences and deliver better outcomes and top-line growth. Across the practice, we are creating automated, data-driven platforms and industry utilities. |
• | Cognizant Digital Systems & Technology. Our digital systems and technology practice helps clients create and evolve applications, platforms and infrastructure that meet the needs of modern enterprises. We work with customers to simplify, modernize and secure IT infrastructure and applications by leveraging automation, analytics and agile |
1
development, allowing our customers to unlock the value in their legacy technology environments, adapt to change and maintain the integrity of their core IT infrastructure. We help customers create and evolve systems that meet their needs in the modern enterprise by delivering industry-leading standards of performance, cost and flexibility.
Our global consulting team provides business, process, operations and technology consulting services to bring together the capabilities of all three of our digital practice areas into effective solutions for our customers. Our consulting professionals and domain experts from our industry-focused business segments work closely with our digital practice areas to create frameworks, platforms and solutions that customers find valuable as they pursue new efficiencies and revenue streams.
Scale Our Digital Practice Areas
We are investing to scale our digital practice areas across our business segments and geographies. We seek to drive organic growth through the extensive training and re-skilling of our technical teams and the expansion of our local workforces in the United States and other markets around the world where we operate. Additionally, we pursue select strategic acquisitions, joint ventures, investments and alliances that can expand our intellectual property portfolio, industry expertise, geographic reach, and platform and technology capabilities.
In 2017, we completed several acquisitions to further enhance our digital capabilities. These include the acquisitions of Brilliant Service, a Japan-based intelligent products and solutions company; Netcentric, a leading independent Adobe partner in Europe and a leading provider of digital experience and marketing solutions for some of the world’s most recognized brands; and Zone, a UK-based leading independent, full-service digital agency that specializes in interactive digital strategy, technology and content creation.
Continue To Develop Our Core Business
Our core business supports our ability to provide digital services and solutions to our customers. In many cases, our customers' new digital systems are built upon the backbone of their core, traditional systems. Our deep knowledge of their infrastructure and core systems provides us with a significant advantage as we work with them to build new digital capabilities. Customers often look for efficiencies in the way they run their core operations so they can fund investments in new digital capabilities. We work with them to analyze and identify opportunities to apply advanced automation and deliver new efficiencies. We deploy a variety of commercial and delivery models, including managed services, fixed priced, output- and outcome-based pricing and platforms to meet their varied needs.
Our services include consulting and technology services and outsourcing services. Consulting and technology services include business, process, operations and technology consulting, application development and systems integrations, application testing, enterprise information management and software solutions and related services. Outsourcing services include application maintenance, IT infrastructure services and business process services.
We deliver services to our customers across our four business segments in a standardized, high-quality manner through our global delivery model. During 2017, we invested to broaden and deepen our services and capabilities and have created new tools to help our sales teams more crisply convey the distinctive value of our services to clients. At the same time, we have intensified our focus on developing industry-specific solutions across technologies.
Additionally, we seek to expand the geographic reach of our core portfolio of services. We believe that Europe, the Middle East, Asia Pacific and Latin America will continue to present long-term growth opportunities.
Leverage Our Domain Expertise
Our deep domain expertise in the industries we serve is central to understanding our customers' challenges and designing effective solutions to address them. We hire professionals who are industry experts and invest in continual industry training for our teams as we build out our portfolio of industry-specific services and solutions. This approach is key to our ability to develop relevant solutions that deliver measurable business results.
Utilize a Global Delivery Model
We utilize a global delivery model, with delivery centers worldwide, to respond quickly to customers with high-quality services at competitive rates. Our four-tiered global architecture for service delivery and operations consists of employees co-located at customers’ sites, at local or in-country delivery centers, at regional delivery centers and at offshore delivery centers. As we develop our digital services, we are focused on hiring in the United States and other countries to expand our in-country delivery capabilities. Our extensive facilities, technology and communications infrastructure facilitates the seamless integration of our global workforce.
2
Across our business segments, we are highly dependent upon our foreign operations. Our delivery centers and technical professionals are positioned globally, with the majority located in India. Our operations in India and the rest of the world expose us to various risks, including regulatory, economic and political risks and instability, potentially unfavorable immigration, tax, import and export policies, fluctuations in foreign exchange and inflation rates, international and civil hostilities, terrorism, natural disasters and pandemics.
Deploy Customer-Centric, Collaborative Approach
We put our customers' priorities first and continuously seek to deliver not only what they need today but also what we believe they will need in the future. Our Global Technology Office and Cognizant Accelerator focus on developing innovative offerings for customers' emerging needs and support our business segments and practice areas. A cornerstone of our success is the collaboration of our associates and teams across segments and practice areas. We believe that when we share knowledge and work together, we can achieve more for our customers and our Company.
Business Segments
We are organized around and go to market across our four industry business segments:
Financial Services | Healthcare | Products and Resources | Communications, Media and Technology | |||
● Banking ● Insurance | ● Healthcare ● Life Sciences | ● Retail and Consumer Goods ● Manufacturing and Logistics ● Travel and Hospitality ● Energy and Utilities | ● Communications and Media ● Technology | |||
Our Financial Services segment includes banking, capital markets and insurance services companies. Our Healthcare segment consists of healthcare providers and payers as well as life sciences companies, including pharmaceutical, biotech and medical device companies. Our Products and Resources segment includes manufacturers, retailers, travel and other hospitality companies, as well as companies providing logistics and energy and utility services. Our Communications, Media and Technology segment includes information, media and entertainment, communications and technology companies.
This industry focus has been central to our revenue growth and high customer satisfaction. As the technology services industry continues to mature and shift from supporting the business to becoming one of the main sources of value, customers require service providers to have a deep understanding of their businesses, industry initiatives, customers, markets and cultures and the ability to create solutions tailored to meet their customers’ individual business needs. For the year ended December 31, 2017, the distribution of our revenues across our four industry-focused business segments was as follows:
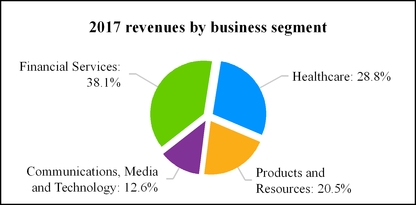
See Note 18 to our consolidated financial statements for additional information related to our business segments, including the disclosure of segment revenues, operating profit and financial information by geographic area.
3
Demand from customers in our business segments is driven by the following trends:
Business Segment | Drivers of demand |
Financial Services | Adoption and integration of digital technologies that are reshaping our customers’ business and operating models, the need for cost optimization, robotic process automation, cyber security and vendor consolidation. |
Healthcare | The need for a broader range of services, including business process services and solutions that address regulatory requirements and emerging industry trends such as regulatory compliance, integrated health management, enterprise information management, claims investigative services and operational improvement in areas such as claims processing, enrollment, membership and billing, advanced data analytics and solutions that span multiple service lines while leveraging cloud technologies and platforms. |
Products and Resources | Application of intelligent systems to manufacturing and logistics operations, enablement of mobile platforms to support field sales, data analytics to make better informed decisions and smart, connected products that are a portal to an ecosystem of data and services, analytics, supply chain consulting, implementation initiatives, product transformation, internet of things and omni channel commerce implementation and integration services. |
Communications, Media and Technology | Digital technologies, digital content operations, the transition to new network technologies, design, development, testing and the introduction of new products and channels, improvements to customer service and satisfaction, transformation of business support systems, services to help our customers balance rationalizing costs while creating a differentiated user experience, transition to agile development methodologies and the enablement of applications for cloud deployment and an expanded range of services, such as business process services. |
Our Solutions and Services
We continually invest in the expansion of our service portfolio to anticipate and meet customers’ evolving needs. These services are delivered to our customers across our four business segments in a standardized, high-quality manner through our global delivery model. Our three digital practice areas span our portfolio of service offerings. Our current service areas include:
Consulting and Technology Services
• | Business, Process, Operations and Technology Consulting. Our global consulting team, Cognizant Consulting, helps customers re-imagine and transform their businesses to gain competitive advantage. Cognizant Consulting works with customers to improve business performance and operational productivity in order to exceed business goals. We also provide assistance with strategy consulting, business and operations consulting, technology strategy and change management, and program management consulting. |
• | Application Development and Systems Integration. We offer a full range of application design, application development and systems integration services, which enables our customers' technology functions to operate in the most efficient, responsive and cost-effective manner. We have particular depth of skills in implementing large, complex, business-critical technology development and integration programs. |
• | Application Testing. Our application testing practice offers a comprehensive suite of services in testing, consulting and engineering. Our quality engineering and assurance transformation services help customers develop deep, agile capabilities that create or extend their competitive advantage. Our business-aligned services in the areas of system and integration testing, package testing, user acceptance, automation, performance testing and test data management address our customers’ critical quality needs. Consulting and infrastructure solutions in quality management, test tools and test infrastructure enable our customers to capitalize on emerging opportunities. |
• | Enterprise Information Management. Our enterprise information management practice focuses on helping customers harness the vast amounts of data available on their operations, customers and markets, and convert that data into information and insights that are valuable to their businesses and can be used to drive management decisions. We help customers identify the types of data available both within their organizations and from outside sources and work to bring that data together in a meaningful “data to foresight” continuum. Among the trends driving this business are the desire of companies to better understand consumer demands and market opportunities in order to create new products and services, the need to manage reporting requirements in regulated industries such as healthcare and financial services, and the pressures to manage operations more efficiently and cost-effectively through the use of analytical tools. |
• | Software Solutions and Related Services. We develop, license, implement and support proprietary and third-party software products for the healthcare industry, including solutions for health insurance plans, third party benefit |
4
administrators and healthcare providers that enable healthcare organizations to work more efficiently and collaboratively to deliver better healthcare services. Our solutions help health plans and third party administrators increase administrative efficiency, improve the cost and quality of care, and succeed in the retail healthcare market. Our solutions help physicians and healthcare organizations simplify business processes and execute strategies for population health management, accountable care, and value-based initiatives.
Outsourcing Services
• | Application Maintenance. Our application maintenance service offering supports some or all of a customer’s applications, ensuring that systems remain operational and responsive to changing user requirements, including the adaptation of systems to digital technologies, and provides on-going enhancements as required by the customer. Our application maintenance services enable customers to improve the overall agility, responsiveness, productivity and efficiency of their IT infrastructure and help reduce cost of ownership. As part of this process, we often introduce products and process enhancements and improve service levels to customers requesting modifications and on-going support. Our global delivery business model enables us to provide a range of rapid response and cost-effective support services. Our on-site personnel often provide help-desk services at the customer’s facility. As part of our application maintenance services, we assist customers in renovating their core systems to meet the requirements imposed by new regulations, new standards or other external events. We consider the future operational environment of our customers’ IT systems as we design and develop such systems. We also offer diagnostic services to assist customers in identifying issues in their IT systems and optimizing the performance of their systems. |
• | IT Infrastructure Services. The major services we provide include data center, infrastructure security, network and convergence, end-user computing services and mobility. We also have cloud services offerings that utilize virtualization technologies across delivery solutions for private cloud, enterprise multi-tenant cloud and public cloud models. We provide services that harness and modernize legacy systems to be digital-ready with agility and speed without sacrificing the knowledge those systems contain. Customers are increasingly utilizing IT infrastructure services to sharpen their focus on core business operations, reallocate overhead costs to growth investments, enable businesses to respond more quickly to changing demands, decrease time to market, ensure that the IT infrastructure can scale as the business evolves and access skill sets outside the organization. |
• | Business Process Services. We provide business process services through unique industry-aligned solutions that integrate process, domain and technology expertise to enable our customers to respond in an agile manner to market opportunities and challenges, while also creating variable cost structures to drive greater effectiveness and cost-efficiency. We have extensive domain-specific expertise in core front office, middle office and back office functions including finance and accounting, procurement, data administration, data management, and research and analytics. Our industry-specific solutions include clinical data management, pharmacovigilance, equity research support, commercial operations and order management. Related services include consulting to ensure process excellence and a range of platform-based services. Our goals for our customer relationships are customer satisfaction, operational productivity, strategic value and business transformation. Among the factors driving growth in our services are the desire to improve cost-effectiveness, the emergence of digital technologies and the need for customers to access capabilities beyond their organizations to adapt to rapid changes in technologies, markets and customer demands. |
Sales and Marketing
We market and sell our services directly through our professional staff, senior management and direct sales personnel operating out of our global headquarters and business development offices, which are strategically located around the world. The sales and marketing group works with our customer delivery team as the sales process moves closer to the customer’s selection of a services provider. The duration of the sales process may vary widely depending on the type and complexity of services.
5
Customers
The number of customers we serve has increased in recent years. As of December 31, 2017, we increased the number of our strategic customers to 357. We define a strategic customer as one offering the potential to generate at least $5 million to $50 million or more in annual revenues at maturity. We provide a significant volume of services to many customers in each of our business segments. Therefore, a loss of a significant customer or a few significant customers in a particular segment could materially reduce revenues for such segment. However, no individual customer exceeded 10% of our consolidated revenues for the years ended December 31, 2017, 2016 and 2015. In addition, the services we provide to our larger customers are often critical to the operations of such customers and a termination of our services generally would require an extended transition period with gradually declining revenues. The volume of work performed for specific customers is likely to vary from year to year, and a significant customer in one year may not use our services in a subsequent year. Revenues from our top customers as a percentage of total revenues were as follows:
For the years ended December 31, | |||||||||
2017 | 2016 | 2015 | |||||||
Top five customers | 8.9 | % | 10.0 | % | 11.0 | % | |||
Top ten customers | 14.9 | % | 16.7 | % | 18.6 | % | |||
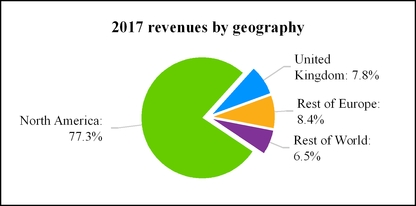
For the year ended December 31, 2017, the distribution of our revenues across geographies was as follows:
Competition
The markets for technology, digital and outsourcing services are highly competitive, characterized by a large number of participants and subject to rapid change. Various competitors in all or some of such markets include:
• | systems integration firms; |
• | contract programming companies; |
• | application software companies; |
• | cloud computing service providers; |
• | large or traditional consulting firms; |
• | professional services groups of computer equipment companies; |
• | infrastructure management and outsourcing companies; and |
• | boutique digital companies. |
Our direct competitors include, among others, Accenture, Atos, Capgemini, Deloitte Digital, DXC Technology, EPAM Systems, Genpact, HCL Technologies, IBM Global Services, Infosys Technologies, Tata Consultancy Services, and Wipro. In addition, we compete with numerous smaller local companies in the various geographic markets in which we operate.
The principal competitive factors affecting the markets for our services include:
• | vision and strategic advisory ability; |
• | digital services capabilities; |
• | performance and reliability; |
• | quality of technical support, training and services; |
6
• | responsiveness to customer needs; |
• | reputation and experience; |
• | financial stability and strong corporate governance; and |
• | competitive pricing of services. |
We rely on the following to compete effectively:
• | investments to scale our digital services practice areas; |
• | a well-developed recruiting, training and retention model; |
• | a successful service delivery model; |
• | entrepreneurial culture and approach to our work; |
• | a broad referral base; |
• | continual investment in process improvement and knowledge capture; |
• | investment in infrastructure and research and development; |
• | financial stability and strong corporate governance; |
• | continued focus on responsiveness to customer needs, quality of services and competitive prices; and |
• | project management capabilities and technical expertise. |
Intellectual Property
We provide value to our customers based, in part, on our proprietary innovations, methodologies, reusable knowledge capital and other intellectual property, or IP, assets. We recognize the importance of IP and its ability to differentiate us from our competitors. We rely on a combination of IP laws, as well as confidentiality procedures and contractual provisions, to protect our IP and our brand. We have registered, and applied for the registration of, U.S. and international trademarks, service marks, domain names and copyrights. Cognizant owns or is licensed under a number of patents, trademarks, copyrights, and licenses, which vary in duration, relating to our products and services. We actively seek IP protection for our innovations. While our proprietary IP rights are important to our success, we believe our business as a whole is not materially dependent on any particular intellectual property right, or any particular group of patents, trademarks, copyrights or licenses.
Employees
We had approximately 260,000 employees at the end of 2017, with approximately 50,400 in North America, approximately 13,800 in Europe and approximately 195,800 in various other locations throughout the rest of world, including 180,000 in India. We are not party to any significant collective bargaining agreements. We consider our relations with our employees to be good.
7
Our Executive Officers
The following table identifies our current executive officers:
Name | Age | Capacities in Which Served | In Current Position Since | ||||
Francisco D’Souza(1) | 49 | Chief Executive Officer | 2007 | ||||
Rajeev Mehta(2) | 51 | President | 2016 | ||||
Karen McLoughlin(3) | 53 | Chief Financial Officer | 2012 | ||||
Ramakrishnan Chandrasekaran(4) | 60 | Executive Vice Chairman, Cognizant India | 2013 | ||||
Debashis Chatterjee(5) | 52 | Executive Vice President and President, Global Delivery | 2016 | ||||
Ramakrishna Prasad Chintamaneni(6) | 48 | Executive Vice President and President, Global Industries and Consulting | 2016 | ||||
Malcolm Frank(7) | 51 | Executive Vice President, Strategy and Marketing | 2012 | ||||
Matthew Friedrich (8) | 51 | Executive Vice President, General Counsel, Chief Corporate Affairs Officer and Secretary | 2017 | ||||
Sumithra Gomatam(9) | 50 | Executive Vice President and President, Digital Operations | 2016 | ||||
Gajakarnan Vibushanan Kandiah(10) | 50 | Executive Vice President and President, Digital Business | 2016 | ||||
Venkat Krishnaswamy(11) | 64 | Executive Vice President and President, Healthcare and Life Sciences | 2013 | ||||
James Lennox(12) | 53 | Executive Vice President, Chief People Officer | 2016 | ||||
Sean Middleton(13) | 36 | Senior Vice President and President, Cognizant Accelerator | 2017 | ||||
Allen Shaheen(14) | 55 | Executive Vice President, North American Regional Delivery Centers | 2018 | ||||
Dharmendra Kumar Sinha(15) | 55 | Executive Vice President and President, Global Client Services | 2013 | ||||
Robert Telesmanic(16) | 51 | Senior Vice President, Controller and Chief Accounting Officer | 2017 | ||||
Santosh Thomas(17) | 49 | Executive Vice President and President, Global Growth Markets | 2016 | ||||
Srinivasan Veeraraghavachary(18) | 58 | Executive Vice President, Chief Operating Officer | 2016 | ||||
(1) | Francisco D’Souza has been our Chief Executive Officer and a member of the Board of Directors since 2007. He also served as our President from 2007 to 2012. Mr. D’Souza joined Cognizant as a co-founder in 1994, the year it was started as a division of The Dun & Bradstreet Corporation, and was previously our Chief Operating Officer from 2003 to 2006 and held a variety of other senior management positions at Cognizant from 1997 to 2003. Mr. D’Souza has served on the Board of Directors of General Electric Company, or GE, since 2013, where he is currently a member of the Audit Committee and the Technology and Industrial Risk Committee. He also serves on the Board of Trustees of Carnegie Mellon University and as Co-Chairman of the Board of Trustees of The New York Hall of Science. Mr. D’Souza has a Bachelor of Business Administration degree from the University of Macau and a Master of Business Administration, or MBA, degree from Carnegie Mellon University. |
(2) | Rajeev Mehta has been our President since September 2016. From December 2013 to September 2016, Mr. Mehta served as our Chief Executive Officer, IT Services. From February 2012 to December 2013, Mr. Mehta served as our Group Chief Executive - Industries and Markets. Mr. Mehta held other senior management positions in client services and our financial services business segment from 2001 to 2012. Prior to joining Cognizant in 1997, Mr. Mehta was involved in implementing GE Information Services' offshore outsourcing program and also held consulting positions at Deloitte & Touche LLP and Andersen Consulting. Mr. Mehta has a Bachelor of Science degree from the University of Maryland and an MBA degree from Carnegie Mellon University. |
(3) | Karen McLoughlin has been our Chief Financial Officer since February 2012. Ms. McLoughlin has held various senior management positions in our finance department since she joined Cognizant in 2003. Prior to joining Cognizant, Ms. McLoughlin held various financial management positions at Spherion Corporation and Ryder System, Inc. and served in various audit roles at Price Waterhouse (now PricewaterhouseCoopers). Ms. McLoughlin has served on the Board of Directors of Best Buy Co., Inc. since 2015, where she is currently a member of the Audit Committee and the Finance and |
8
Investment Policy Committee. Ms. McLoughlin has a Bachelor of Arts degree in Economics from Wellesley College and an MBA degree from Columbia University.
(4) | Ramakrishnan Chandrasekaran has been our Executive Vice Chairman, Cognizant India since December 2013. From February 2012 to December 2013, Mr. Chandrasekaran served as our Group Chief Executive - Technology and Operations. Mr. Chandrasekaran held other senior management positions in global delivery from 1999 to 2012. Prior to joining us in 1994, Mr. Chandrasekaran worked with Tata Consultancy Services. Mr. Chandrasekaran has a Mechanical Engineering degree and an MBA degree from the Indian Institute of Management. |
(5) | Debashis Chatterjee has been our Executive Vice President and President, Global Delivery and managed our Digital Systems and Technology practice area since August 2016. From December 2013 to August 2016, Mr. Chatterjee served as Executive Vice President and President, Technology Solutions. From May 2013 to December 2013, Mr. Chatterjee served as Senior Vice President and Global Head, Technology and Information Services. From March 2012 to April 2013, he was Senior Vice President, Transformational Services. Mr. Chatterjee worked at International Business Machine Corporation, or IBM, from 2011 to 2012 as Vice President and Sectors Leader, Global Business Services, Global Delivery. Prior to that, Mr. Chatterjee held various senior positions in the Banking and Financial Services, or BFS, practice at Cognizant from 2004 to 2011 and other management roles at Cognizant since joining us in 1996. He has been in our industry since 1987, having previously worked at Tata Consultancy Services and Mahindra & Mahindra. Mr. Chatterjee has a Bachelor of Engineering degree in Mechanical Engineering from Jadavpur University in India. |
(6) | Ramakrishna Prasad Chintamaneni has been our Executive Vice President and President, Global Industries and Consulting since August 2016. Mr. Chintamaneni served as our Executive Vice President and President, BFS, from December 2013 to August 2016. From 2011 to December 2013, Mr. Chintamaneni served as our Global Head of the BFS practice. Mr. Chintamaneni held various senior positions in the BFS practice from 2006 to 2011 and was a client partner in our BFS practice from 1999 to 2006. Prior to joining Cognizant in 1999, Mr. Chintamaneni spent seven years in the investment banking and financial services industry, including working at Merrill Lynch and its affiliates for five years as an Investment Banker and a member of Merrill’s business strategy committee in India. Mr. Chintamaneni has a Bachelor of Technology degree in Chemical Engineering from the Indian Institute of Technology, Kanpur and a Postgraduate Diploma in Business Management from the XLRI - Xavier School of Management in India. |
(7) | Malcolm Frank has been our Executive Vice President, Strategy and Marketing since February 2012. Mr. Frank served as our Senior Vice President of Strategy and Marketing from 2005 to 2012. Prior to joining Cognizant in 2005, Mr. Frank was previously a founder and the President and Chief Executive Officer of CXO Systems, Inc., an independent software vendor providing dashboard solutions for senior managers, a founder and the President, Chief Executive Officer and Chairman of NerveWire Inc., a management consulting and systems integration firm, and a founder and executive officer at Cambridge Technology Partners, an information technology professional services firm. Mr. Frank has served on the Board of Directors of Factset Research Systems Inc. since June 2016, where he is a member of the Compensation Committee. Mr. Frank has a Bachelor degree in Economics from Yale University. |
(8) | Matthew Friedrich has been our Executive Vice President, General Counsel, Chief Corporate Affairs Officer and Secretary since May 2017. Prior to joining Cognizant, Mr. Friedrich was Chief Corporate Counsel for Chevron Corporation, a multinational energy company, from August 2014 through May 2017, a partner with the law firm of Freshfields Bruckhaus Deringer LLP from April 2013 through August 2014 and a partner with the law firm of Boies Schiller & Flexner LLP from June 2009 through April 2013. Mr. Friedrich began his legal career in 1995 as a federal prosecutor with the United States Department of Justice, where he remained for nearly 14 years, culminating with his designation as the acting assistant Attorney General of the Criminal Division in 2008. Mr. Friedrich is a life member of the Council on Foreign Relations and serves on the Board of Directors of the U.S.-India Business Council. Mr. Friedrich has a Bachelor of Arts degree in Foreign Affairs from the University of Virginia and a Juris Doctor degree from the University of Texas School of Law. |
(9) | Sumithra Gomatam has been our Executive Vice President and President, Digital Operations since August 2016. From December 2013 to August 2016, Ms. Gomatam served as our Executive Vice President and President, Industry Solutions. From 2008 to December 2013, Ms. Gomatam served as Senior Vice President, and global leader for our Testing practice. Ms. Gomatam held other management positions in our global delivery and BFS practices from 1995 to 2008. Ms. Gomatam has a Bachelor of Engineering degree in Electronics and Communication from Anna University. |
(10) | Gajakarnan Vibushanan Kandiah has been our Executive Vice President and President, Digital Business since August 2016. Mr. Kandiah previously served as Executive Vice President of Business Process Services, or BPS, and Digital Works from January 2014 to August 2016, and as Senior Vice President of BPS from 2011 to December 2013. Previous roles he held at Cognizant included roles in System Integration, Testing, BPS, Information, Media and Entertainment, and Communications practices. Before joining Cognizant in 2003, Mr. Kandiah was a founder and the Chief Operating Officer of NerveWire, Inc. and the Global Vice President of the Interactive Solutions business of Cambridge Technology Partners. Mr. Kandiah completed his advanced level education at the Royal College in Sri Lanka. |
(11) | Venkat Krishnaswamy has been our Executive Vice President and President, Healthcare and Life Sciences since December 2013. From February 2012 to December 2013, Mr. Krishnaswamy served as our Executive Vice President of |
9
Healthcare and Life Sciences. Mr. Krishnaswamy served as our Senior Vice President and General Manager of Healthcare and Life Sciences from 2007 to 2012 and in various other management positions since he joined Cognizant in 1997. Prior to joining Cognizant, Mr. Krishnaswamy spent over ten years in retail and commercial banking with Colonial State Bank (now Commonwealth Bank of Australia). Mr. Krishnaswamy has a Bachelor of Engineering degree from the University of Madras and a Master of Electrical Engineering degree from the Indian Institute of Technology, New Delhi.
(12) | James Lennox has been our Executive Vice President, Chief People Officer since January 2016. Mr. Lennox previously served as our Senior Vice President, Chief People Officer from June 2013 to December 2016, and as Vice President, North America Human Resources, or HR, from July 2011 to June 2013. Previous roles he held at Cognizant included leading the Workforce Management team, Operations Director for our Banking and Insurance practices, leading regional HR teams, and serving as the Chief of Staff to the Company’s Chief Executive Officer. Prior to joining Cognizant in 2004, Mr. Lennox held various management roles in operations, HR, resource management and recruiting for the North American regions of Cap Gemini and Ernst & Young. He started his career at Ernst & Young Consulting. Mr. Lennox has a Bachelor of Science degree in Business Administration from St. Thomas Aquinas College and an MBA degree from Fordham University. |
(13) | Sean Middleton has been our Senior Vice President and President, Cognizant Accelerator since January 2017. He was previously Vice President and President, Cognizant Accelerator from July 2016 to January 2017. Mr. Middleton served as Chief Operating Officer of our Emerging Business Accelerator division from 2012 to July 2016 and as Chief of Staff to the Company's Chief Executive Officer from 2010 to 2013. Prior to joining Cognizant in 2010, Mr. Middleton worked at PricewaterhouseCoopers as a management consultant. Mr. Middleton has a Bachelor degree in Computer Science from Cornell University and an MBA degree from the Wharton School at the University of Pennsylvania. |
(14) | Allen Shaheen has been our Executive Vice President, North American Regional Delivery Centers since January 2018. From August 2015 to December 2017, Mr. Shaheen was Executive Vice President, Corporate Development. From December 2013 to August 2016, Mr. Shaheen was also responsible for various Cognizant practices, including our Enterprise Application Services Practice. Mr. Shaheen was the General Manager for our German business unit from February 2013 to December 2014 and our Markets Delivery Leader for Europe from May 2012 to December 2014. Mr. Shaheen's prior roles included being responsible for our IT Infrastructure Services, head of our Global Technology Office and head of our Systems Integration and Testing practices. Prior to joining Cognizant in 2006, Mr. Shaheen was a consultant for Cognizant from 2004 to 2006, a founder and Executive Vice President of International Operations of Cambridge Technology Partners and the Chief Executive Officer of ArsDigita Corporation. Mr. Shaheen has a Bachelor of Arts degree in Engineering and Applied Sciences from Harvard College. |
(15) | Dharmendra Kumar Sinha has been our Executive Vice President and President, Global Client Services since December 2013. From 2007 to December 2013, Mr. Sinha served as our Senior Vice President and General Manager, Global Sales and Field Marketing. From 2004 to 2007, Mr. Sinha served as our Vice President, responsible for our Manufacturing and Logistics, Retail and Hospitality, and Technology verticals. From 1997 to 2004, Mr. Sinha held a variety of other management roles. Prior to joining Cognizant in 1997, Mr. Sinha worked with Tata Consultancy Services and CMC Limited, an IT solutions provider. Mr. Sinha has a Bachelor of Science degree from Patna Science College, Patna and an MBA degree from the Birla Institute of Technology, Mesra. |
(16) | Robert Telesmanic has been our Senior Vice President, Controller and Chief Accounting Officer since January 2017, a Senior Vice President since 2010 and our Corporate Controller since 2004. Prior to that, he served as our Assistant Corporate Controller from 2003 to 2004. Prior to joining Cognizant, Mr. Telesmanic spent over 14 years with Deloitte & Touche LLP. Mr. Telesmanic has a Bachelor of Science degree from New York University and an MBA degree from Columbia University. |
(17) | Santosh Thomas has been our Executive Vice President and President, Global Growth Markets since August 2016. Prior to his current role, Mr. Thomas served as our Head, Growth Markets from 2011 through July 2016. From 1999 to 2011, Mr. Thomas held various senior positions at Cognizant including leading Continental European operations and various roles in client relationships and market development in North America. Prior to joining Cognizant in 1999, Mr. Thomas worked with Informix and HCL Hewlett Packard Limited. Mr. Thomas has an undergraduate degree in engineering from RV College of Engineering, Bangalore and a Postgraduate Diploma in Business Management from the XLRI - Xavier School of Management in India. |
(18) | Srinivasan Veeraraghavachary has been our Executive Vice President, Chief Operating Officer since August 2016. Prior to his current role, Mr. Veeraraghavachary served as our Executive Vice President, Products and Resources from December 2013 to November 2016 and as our Senior Vice President, Products and Resources from 2011 to December 2013. Previously, he served in various senior management positions in our BFS practice and in our central U.S. operations. Mr. Veeraraghavachary joined Cognizant in 1998. Mr. Veeraraghavachary has a Bachelor degree in Mechanical Engineering from the National Institute of Technology (formerly the Regional Engineering College) in Trichy, India and an MBA degree from the Indian Institute of Management in Calcutta, India. |
None of our executive officers is related to any other executive officer or to any of our Directors. Our executive officers are appointed annually by the Board of Directors and generally serve until their successors are duly appointed and qualified.
10
Corporate History
We began our IT development and maintenance services business in early 1994 as an in-house technology development center for The Dun & Bradstreet Corporation and its operating units. In 1996, we were spun-off from The Dun & Bradstreet Corporation and, in 1998, we completed an initial public offering to become a public company.
Available Information
We make available the following public filings with the Securities and Exchange Commission, or the SEC, free of charge through our website at www.cognizant.com as soon as reasonably practicable after we electronically file such material with, or furnish such material to, the SEC:
• | our Annual Reports on Form 10-K and any amendments thereto; |
• | our Quarterly Reports on Form 10-Q and any amendments thereto; and |
• | our Current Reports on Form 8-K and any amendments thereto. |
In addition, we make available our code of ethics entitled “Core Values and Code of Ethics” free of charge through our website. We intend to post on our website all disclosures that are required by law or Nasdaq Stock Market listing standards concerning any amendments to, or waivers from, any provision of our code of ethics.
No information on our website is incorporated by reference into this Form 10-K or any other public filing made by us with the SEC.
11
Item 1A. Risk Factors
Factors That May Affect Future Results
We face various important risks and uncertainties, including those described below, that could adversely affect our business, results of operations and financial condition and, as a result, cause a decline in the trading price of our common stock.
Risks Relating to our Business
We face intense competition from other service providers.
The markets for technology, digital and outsourcing services are highly competitive, characterized by a large number of participants and subject to rapid change. Various competitors in all or some of such markets include:
• | systems integration firms; |
• | contract programming companies; |
• | application software companies; |
• | cloud computing service providers; |
• | large or traditional consulting companies; |
• | professional services groups of computer equipment companies; |
• | infrastructure management and outsourcing companies; and |
• | boutique digital companies. |
These markets also include numerous smaller local competitors in the various geographic markets in which we operate or intend to operate which may have more experience with operations in these markets or be able to provide services and solutions at lower costs or on terms more attractive to customers than we can. Additionally, these companies may have long-standing or well-established relationships with desired customers which may put us at a competitive disadvantage. Our direct competitors include, among others, Accenture, Atos, Capgemini, Deloitte Digital, DXC Technology, EPAM Systems, Genpact, HCL Technologies, IBM Global Services, Infosys Technologies, Tata Consultancy Services and Wipro. In certain markets, our competitors may have greater financial, technical and marketing resources and name recognition and, therefore, may be better able to compete for new work and skilled professionals. Some of our competitors may be more successful than us at capturing the increasing customer demand for digital services. Increased competition in any of the various market segments in which we compete may put downward pressure on the prices we can charge for our services and, in turn, on our operating margins. Similarly, if our competitors develop and implement processes and methodologies that yield greater efficiency and productivity, they may be able to offer services similar to ours at lower prices without adversely affecting their profit margins. If we are unable to provide our customers with superior services and solutions at competitive prices or successfully market those services to current and prospective customers, our business, results of operations and financial condition may suffer.
We may also face competition from companies that increase in size or scope as the result of strategic mergers or acquisitions. These transactions may include consolidation activity among hardware manufacturers, software companies and vendors, and service providers, which could result in the convergence of products and services. If buyers of products and services in the markets we serve favor using a single provider of integrated products and services, such buyers may direct more business to such providers, which could have a variety of negative effects on our competitive position and, in turn, adversely affect our business, results of operations and financial condition.
We may not be able to increase our operating margin, or our operating margin may decline, and we may not be able to improve or sustain our profitability.
We have announced a margin improvement plan to increase gradually our non-GAAP operating margins over the next two years. This plan is reliant upon a number of assumptions, including our ability to improve the efficiency of our operations, focus on higher-margin business, reduce costs and make successful investments to grow and further develop our business. There can be no assurances that we will be successful in achieving this plan, and other factors beyond our control, including the various other risks described herein, may prevent us from achieving the targeted improvements. Further, our operating margin may decline if we experience declines in demand and pricing for our services, an increase in our operating costs, including due to an imposition of new non-income related taxes or change in law or regulations related to immigration or outsourcing, or adverse fluctuations in foreign currency exchange rates. Wages in India have historically increased at a faster rate than in the United States, which has in the past and may in the future put pressure on our operating margins. Additionally, the number and type of equity-based compensation awards and the assumptions used in valuing equity-based compensation awards may change in a manner that results in increased stock-based compensation expense and lower margins.
12
Our operating margin, and therefore our profitability, is dependent on the rates we are able to recover for our services. If we are not able to maintain favorable pricing for our services, our operating margin and our profitability could suffer. In addition, if we are not able to maintain an appropriate utilization rate for our professionals, our profitability may suffer. If we are unable to control our costs and operate our business in an efficient manner, our operating margin, and therefore our profitability, may decline.
We face legal, reputational and financial risks from security breaches or disclosure of sensitive data or failure to comply with data protection laws and regulations.
We are dependent on information technology networks and systems to process, transmit, host and securely store electronic information and to communicate among our locations around the world and with our customers, suppliers and partners. Security breaches, employee malfeasance, or human or technological error could lead to shutdowns or disruptions of our operations and potential unauthorized disclosure of sensitive data, which in turn could jeopardize projects that are critical to the operations of our customers’ businesses. The theft and/or unauthorized use or publication of our, or our customers’, confidential information or other proprietary business information as a result of such an incident could adversely affect our competitive position and reduce marketplace acceptance of our services. Any failure in the networks or computer systems used by us or our customers could result in a claim for substantial damages against us and significant reputational harm, regardless of our responsibility for the failure.
In addition, as a global service provider with customers in a broad range of industries, we often have access to or are required to manage, utilize, collect and store sensitive data subject to various regulatory regimes, including but not limited to U.S. federal and state laws governing the protection of personal financial and health and the European Union Directive on Data Protection (to be superseded by the European Union's General Data Protection Regulation in May 2018). If unauthorized access to or disclosure of such data in our possession or control occurs or we otherwise fail to comply with applicable laws and regulations in this regard, we could be exposed to civil or criminal enforcement actions and penalties in connection with any violation of applicable data protection laws, as well as lawsuits brought by our customers, our customers’ customers, their clients or others for breaching contractual confidentiality and security provisions or data protection laws. Laws and expectations relating to data protections continue to evolve in ways that may limit our access, use and disclosure of sensitive data, and may require increased expenditures by us or may dictate that we not offer certain types of services.
We may be the target of significant cybersecurity attacks in the future. These risks will increase as we continue to grow our cloud-based offerings and services, store and process increasingly large amounts of our customers’ data and host or manage parts of our customers’ businesses, especially in industries involving particularly sensitive data such as the financial services and healthcare industries.
Our revenues and operating results may experience significant quarterly fluctuations.
We may experience significant quarterly fluctuations in our revenues and results of operations. Among the factors that could cause these variations are:
• | the nature, number, timing, scope and contractual terms of the projects in which we are engaged; |
• | delays incurred in the performance of those projects; |
• | the accuracy of estimates of resources and time required to complete ongoing projects; |
• | changes to the financial condition of our customers; |
• | changes in pricing in response to customer demand and competitive pressures; |
• | longer sales cycles and ramp-up periods for our larger, more complex projects; |
• | volatility and seasonality of our software sales; |
• | the mix of on-site and offshore staffing; |
• | the mix of fixed-price contracts, time-and-materials contracts and transaction or volume-based priced contracts; |
• | employee wage levels and utilization rates; |
• | changes in foreign exchange rates, including the Indian rupee versus the U.S. dollar; |
• | the timing of collection of accounts receivable; |
• | enactment of new taxes; |
• | changes in domestic and international income tax rates and regulations; |
• | changes to levels and types of stock-based compensation awards and assumptions used to determine the fair value of such awards; and |
• | general economic conditions. |
13
As a result of these or other factors, it is possible that in some future periods, our revenues and results of operations may be significantly below the expectations of public market analysts and investors. In such an event, the price of our common stock would likely be materially and adversely affected.
Our business, results of operations and financial condition will suffer if we fail to enhance our existing services and solutions and to develop new services and solutions that allow us to keep pace with rapidly evolving technological developments, including the demand for digital technologies and services.
The markets for technology, digital and outsourcing services are characterized by rapid technological change, evolving industry standards, changing customer preferences and new product and service introductions. We are currently in the midst of a shift towards increasing customer demand for digital technologies and services. Our future success will depend on our ability to develop digital and other services and solutions that keep pace with changes in the markets in which we operate. We cannot be sure that we will be successful in developing digital and other new services and solutions addressing evolving technologies in a timely or cost-effective manner or that any services and solutions we do develop will be successful in the marketplace. Our failure to address the demands of the rapidly evolving technological environment could have a material adverse effect on our ability to retain and attract customers and on our competitive position, which could in turn have a material adverse effect on our business, results of operations and financial condition.
Our business, results of operations and financial condition may be affected by the rate of growth in the use of technology in business and the type and level of technology spending by our customers.
Our business depends, in part, upon continued growth in the use of technology in business by our customers and prospective customers as well as their customers and suppliers. In challenging economic environments, our customers may reduce or defer their spending on new technologies in order to focus on other priorities, or may choose to use their own internal resources rather than engage an outside firm to perform the types of services and solutions we provide. In addition, many companies have already invested substantial resources in their current means of conducting commerce and exchanging information, and they may be unwilling or slow to adopt new approaches that could disrupt existing personnel, processes and infrastructures. If the growth of technology usage in business, or our customers’ spending on technology, declines, or if we cannot convince our customers or potential customers to embrace new technological solutions, our business, results of operations and financial condition could be adversely affected.
Most of our contracts with our customers are short-term, and our business, results of operations and financial condition could be adversely affected if our customers terminate their contracts on short notice.
Consistent with industry practice, most of our contracts with our customers are short-term. A majority of our contracts can be terminated by our customers with short notice and without significant early termination cost. Terminations may occur as a result of, among other things, any failure on our part to satisfy our contractual commitments or more broadly satisfy our customers’ expectations with respect to the services we provide. Our customers may also decide at any time to switch to a different provider or undertake the work themselves due to cost or other considerations. Terminations may also result from factors that are beyond our control and unrelated to our work product or the progress of the project, including the business or financial condition of a customer, changes in ownership, management or the strategy of a customer or economic or market conditions generally or specific to a customer’s industry. When contracts are terminated, we lose the anticipated revenues and might not be able to eliminate our associated costs in a timely manner. Consequently, our operating margins in subsequent periods could be lower than expected. If we are unable to replace the lost revenues with other work on terms we find acceptable or effectively eliminate costs, our business, results of operations and financial condition could be adversely affected.
If our pricing structures are based on inaccurate expectations and assumptions regarding the cost and complexity of performing our work, then our contracts could be unprofitable.
We negotiate pricing terms with our customers utilizing a range of pricing structures and conditions. We predominantly contract to provide services either on a time-and-materials basis, a fixed-price basis or volume basis. Our pricing is highly dependent on our internal forecasts and predictions about our projects and the marketplace, which might be based on limited data and could turn out to be inaccurate. We face a number of risks when pricing our contracts as many of our projects entail the coordination of operations and workforces in multiple locations and utilizing workforces with different skill sets and competencies across geographically diverse service locations. Our pricing, cost and operating margin estimates for the work that we perform frequently include anticipated long-term cost savings from transformational and other initiatives that we expect to achieve and sustain over the life of the contract. There is a risk, particularly for our fixed-price and transaction or volume-based priced contracts, that we will underprice our projects, fail to accurately estimate the costs of performing the work or fail to accurately assess the risks associated with potential contracts. In particular, any increased or unexpected costs, delays, failures to achieve anticipated cost savings, or unexpected risks we encounter in connection with the performance of this work,
14
including those caused by factors outside our control, could make these contracts less profitable or unprofitable, which could have an adverse effect on our business, results of operations and financial condition.
The outcome of the internal investigation being conducted under the oversight of our Audit Committee of possible violations of the U.S. Foreign Corrupt Practices Act, or FCPA, and similar laws and related litigation could have a material adverse effect on our business, annual and interim results of operations, cash flows and financial condition.
The Company is conducting an internal investigation focused on whether certain payments relating to Company-owned facilities in India were made improperly and in possible violation of the U.S. Foreign Corrupt Practices Act, or FCPA, and other applicable laws. The investigation is also examining various other payments made in small amounts in India that may not have complied with Company policy or applicable law. In September 2016, we voluntarily notified the Department of Justice, or DOJ, and the Securities and Exchange Commission, or SEC, and are cooperating fully with both agencies. The investigation is being conducted under the oversight of the Audit Committee, with the assistance of outside counsel.
In 2016, there were putative securities class action complaints filed, naming us and certain of our current and former officers as defendants and alleging violations of the Securities Exchange Act of 1934, as amended, or the Exchange Act, based on allegedly false or misleading statements related to potential violations of the FCPA, our business, prospects and operations, and the effectiveness of our internal control over financial reporting and our disclosure controls and procedures. Additionally, in 2017 and 2016, putative shareholder derivative complaints were filed, naming us, certain of our directors and certain of our current and former officers as defendants. See the section titled "Part I, Item 3. Legal Proceedings."
The outcome of the putative class action litigation, derivative lawsuit, or any other litigation is necessarily uncertain. We could be forced to expend significant resources in the defense of these lawsuits or future ones, and we may not prevail. The imposition of any sanctions, remedial measures or judgments against us could have a material adverse effect on our business, results of operations and financial condition.
If we fail to maintain appropriate internal controls, we may not be able to report our financial results accurately, which may adversely affect our stock price and our business.
Section 404 of the Sarbanes-Oxley Act of 2002 and the related regulations require our management to report on, and our independent registered public accounting firm to attest to, the effectiveness of our internal control over financial reporting. We have committed and will be required to continue to commit significant financial and managerial resources in order to comply with these requirements. As described in "Item 9A - Controls and Procedures," during the closing process for the third quarter of 2016, we identified a material weakness in our internal control over financial reporting, which we remediated as of December 31, 2017. Other material weaknesses, significant deficiencies or deficiencies may develop or be identified in the future.
Further, we are required to integrate any acquired businesses into our system of disclosure controls and procedures and internal control over financial reporting. Companies we acquire, prior to being acquired by us, may not be required to implement or maintain the disclosure controls and procedures or internal control over financial reporting that are required of public companies. We cannot provide assurance as to how long the integration process may take.
Internal control over financial reporting has inherent limitations, including human error and the possibility that controls could be circumvented or be inadequate because of changed conditions or fraud. If we are unable to maintain effective internal controls, we may not have adequate, accurate or timely financial information, and we may be unable to meet our reporting obligations as a publicly traded company or comply with the requirements of the SEC or the Sarbanes-Oxley Act of 2002. This could result in a restatement of our financial statements, the imposition of sanctions, or investigation by regulatory authorities, and could cause investors to lose confidence in our reported financial information. Any such consequence or other negative effect resulting from our inability to meet our reporting requirements or comply with legal and regulatory requirements, as well as any disclosure of an accounting, reporting or control issue, could adversely affect the trading price of our common stock and our business.
We may not be able to successfully acquire target companies or integrate acquired companies or technologies into our company, and we may become subject to certain liabilities assumed or incurred in connection with our acquisitions that could harm our business, results of operations and financial condition.
If we are unable to complete acquisitions of the number, magnitude and nature we have targeted, or if we are inefficient or unsuccessful at integrating any acquired businesses into our operations, we may not be able to achieve our planned rates of growth or improve our market share, profitability or competitive position in specific markets or services. The process of acquiring and integrating a company, business, or technology has created, and will continue to create, operating difficulties. The risks we face include:
15
• | diversion of management time and focus from operating our core business to acquisition and integration challenges; |
• | failure to successfully integrate the acquired business into our operations, including cultural challenges associated with integrating and retaining employees; and |
• | failure to achieve anticipated efficiencies and benefits, realize our strategic objectives or further develop the acquired business. |
Although we conduct due diligence in connection with each of our acquisitions, there may be liabilities that are not properly disclosed to us, that we fail to discover or that we inadequately or incorrectly assess. In particular, to the extent that any acquired business failed to comply with or otherwise violated applicable laws or regulations, failed to fulfill contractual obligations to customers or incurred material liabilities or obligations to customers that are not identified during the diligence process, we, as the successor owner, may be financially responsible for these violations, failures and liabilities and may suffer financial and/or reputational harm or otherwise be adversely affected. In addition, as part of an acquisition, we may assume responsibilities and obligations of the acquired business pursuant to the terms and conditions of agreements entered into by the acquired entity that are not consistent with the terms and conditions that we typically accept and require. We also have been and may in the future be subject to litigation or other claims in connection with an acquired business, including claims from employees, customers, stockholders, or other third parties. Any material liabilities associated with our acquisitions could harm our business, results of operations and financial condition.
System failures, system outages or operational disruptions in our communications or information technology systems and infrastructure could negatively impact our operations and ability to provide our services and solutions, which would have an adverse effect on our business, results of operations and financial condition.
To deliver our services and solutions to our customers, we rely upon high speed networks, including satellite, fiber optic and land lines operated by third parties, to provide active voice and data communications 24 hours per day between our main operating offices in India, our other global delivery centers, the offices of our customers and our associates worldwide. Any systems failure or outage or a significant disruption in such communications or in our information technology systems and infrastructure could result in curtailed operations, a loss of customers and reputational damage, which would have an adverse effect on our business, results of operations and financial condition.
Our business, results of operations and financial condition could be impaired if we lose key members of our management team.
Our future performance depends upon the continued service of the key members of our management team. Competition for experienced executive officers and other key employees in the industries in which we compete is intense, and there can be no assurance that we will be able to retain key persons, or that we will be successful in attracting and retaining replacements in the future. The loss of any one or more of our executive officers or significant employees, or the failure to attract, integrate and retain additional talent, could have a material adverse effect on our business, results of operations and financial condition. We do not maintain key man life insurance on any of our executive officers or significant employees.
In addition, our business could be harmed if any key member of our management team leaves our employment and joins one of our competitors. Currently, we have entered into non-competition agreements with most of our executive officers. We cannot be certain, however, that the restrictions in these agreements prohibiting such executive officers from engaging in competitive activities would be enforceable.
Competition for highly-skilled technical personnel is intense, and our ability to compete for and manage customer engagements depends on our ability to attract and retain such personnel.
Our ability to maintain and renew existing customer engagements and obtain new business depends to a significant extent on our ability to attract, train and retain highly-skilled technical personnel so as to keep our supply of skills and resources in balance with customer demand. In particular, in order to serve customer needs and grow our business, we must attract, train and retain appropriate numbers of talented people, including project managers, IT engineers and other senior technical personnel, who are able to keep pace with continuing changes in information technology, evolving industry standards and changing customer preferences. We cannot guarantee that we will be able to train and assimilate new employees successfully. In addition, we believe there is a shortage of, and significant competition for, professionals with the advanced technological skills we require, especially in the area of digital technologies and services. We have subcontracted in the past, and may continue to subcontract in the future, with other service providers in order to meet our obligations to our customers. If we are unable to attract and retain highly-skilled technical personnel in the numbers and locations and with the advanced technological skills we require, our ability to effectively execute upon our current projects, including the provision of digital technologies and services, and to develop new business, could be jeopardized and our business, results of operations and financial condition adversely affected.
16
Our business could be negatively affected if we incur legal liability in connection with providing our services and solutions.
If we fail to meet our contractual obligations or otherwise breach obligations to our customers, we could be subject to legal liability. If we cannot, or do not, meet our contractual obligations to provide services and solutions, and if our exposure is not adequately limited through the enforceable terms of our agreements, we might face significant legal liability and our business, results of operations and financial condition could be adversely affected.
In the normal course of business and in conjunction with certain customer engagements, we have entered into contractual arrangements through which we may be obligated to indemnify customers or other parties with whom we conduct business with respect to certain matters. These arrangements can include provisions whereby we agree to provide indemnification with respect to third-party claims, including matters such as our breach of certain representations or covenants, our infringement of the intellectual property of others, our violation of laws or our gross negligence or willful misconduct. Payments by us under any of these arrangements are generally conditioned on the customer making a claim and providing us with full control over the defense and settlement of such claim. It is not possible to determine our maximum potential exposure under these arrangements due to the unique facts and circumstances involved in each particular agreement. If events arise requiring us to make payment for indemnification claims under our contractual indemnification obligations, such payments could have a material impact on our business, results of operations and financial condition.
Additionally, our customers may perform audits or require us to perform audits and provide audit reports with respect to the controls and procedures that we use in the performance of services for such customers, especially when we process data belonging to them. Our ability to acquire new customers and retain existing customers may be adversely affected and our reputation could be harmed if we receive a qualified opinion, or if we cannot obtain an unqualified opinion in a timely manner, with respect to our controls and procedures in connection with any such audit. We could also incur liability if our controls and procedures, or the controls and procedures we manage for a customer, were to result in an internal control failure or impair our customer’s ability to comply with its own internal control requirements.
We increasingly provide complex services and solutions for our customers and, if we do not satisfy customer expectations or if customers cancel their engagements with us, our business, results of operations and financial condition could be harmed.
The increased breadth of our service and solution offerings has resulted and may continue to result in larger and more complex projects with our customers. This requires us to establish closer relationships with our customers and achieve a thorough understanding of their operations. Our ability to establish such relationships depends on a number of factors, including the proficiency of our professionals and our management personnel. Our failure to understand our customer requirements or our failure to deliver services and solutions that meet the requirements specified by our customers could result in termination of customer contracts and potential liability for significant penalties or damages, any of which could have a material adverse effect on our business, results of operations and financial condition.
Larger projects often involve multiple engagements or stages, and there is a risk that a customer may choose not to retain us for later stages or may cancel or delay additional planned engagements. Such cancellations or delays make it difficult to plan for project resource requirements and inaccuracies in such resource planning and allocation may have a negative impact on our business, results of operations and financial condition.
If we are unable to collect from our customers for our work, our business, results of operations and financial condition could be adversely affected.
Our business depends on our ability to successfully obtain payment from our customers for work performed. We evaluate the financial condition of our customers and usually bill and collect on relatively short cycles. There is no guarantee that we will accurately assess the creditworthiness of our customers. We maintain allowances against trade accounts receivable and unbilled accounts receivable. Actual losses on customer balances could differ from those that we currently anticipate and, as a result, we might need to adjust our allowances. Macroeconomic conditions could also result in financial difficulties for our customers, including limited access to the credit markets, insolvency or bankruptcy, and, as a result, could cause customers to delay payments to us, request modifications to their payment arrangements that could increase our receivables balance, or default on their payment obligations to us. Timely collection of customer balances also depends on our ability to complete our contractual commitments and bill and collect our contracted fees. If we do work for a customer but are nevertheless unable to meet our contractual commitments, we may not be entitled to collect for our work or may collect reduced amounts and/or experience delays in collection. Any delay or inability to collect from our customers for our work may adversely affect our business, results of operations, cash flows and financial condition.
17
We rely on third parties for certain software products.
Certain of our software products contain components that are developed by third parties. In addition, we resell certain software products of third parties and we use third-party software products to deliver our services and solutions. We may not be able to replace the functions provided by these third-party software components or products if they become obsolete, defective, or incompatible with future versions of our products or with our services and solutions, or if they are not adequately maintained or updated. Any defects in or significant interruption in the availability of these third-party software products or components could harm the sale of our products and our delivery of services and solutions to our customers unless and until we can secure or develop an alternative source. If we fail to comply with the license terms applicable to third party software, we could be liable to the owners of the software for damages. In addition, third-party suppliers of software or other intellectual property assets could be unwilling to permit us to use or to continue to use their intellectual property and this could impede or disrupt use of their products or services by our customers and us. If our ability to provide services and solutions to our customers is impaired as a result of any such denial, our business, results of operations and financial condition could be adversely affected.
Alternate sources for the technologies currently licensed to us may not be available to us in a timely manner, may not provide us with the same functions as currently provided or may be more expensive. Further, our success depends on our ability to maintain our existing relationships with third-party software providers and build new relationships with other providers in order to enhance our services and remain competitive. If we are unable to maintain such existing relationships and successfully build new relationships, our business, results of operations, and financial condition could suffer.
We are exposed to credit risk and fluctuations in the market values of our investment and derivatives portfolios.
Any deterioration of the credit and capital markets in the United States, Europe or other regions of the world could result in volatility of our investment earnings and impairments to our investment portfolio, which could negatively impact our financial condition and reported income. Changes in economic conditions could adversely affect the ability of counterparties, including counterparties to our foreign exchange forward contracts, to meet their obligations to us.
Our revenues are highly dependent on customers concentrated in certain industries, including the financial services and healthcare industries. Consolidation and factors that negatively affect these industries may adversely affect our business, results of operations and financial condition.
During the year ended December 31, 2017, we earned 38.1% of our revenues from our financial services business segment, which includes banking and insurance customers, and 28.8% from our healthcare business segment, which includes healthcare and life sciences customers. Significant consolidation or a decrease in growth in the financial services industry or the healthcare industry may reduce the demand for our services and negatively affect our business, financial condition and results of operations. For example, two or more of our current customers may merge or consolidate and combine their operations, which may cause us to lose work or lose the opportunity to gain additional work. The increased market power of larger companies may also increase competitive and pricing pressures on us. Any of these possible results of industry consolidation could adversely affect our business, results of operations and financial condition. In addition, if we are unable to successfully anticipate changing regulatory, economic and political conditions affecting the industries in which we operate, we may be unable to effectively plan for or respond to those changes, and our business, results of operations and financial condition could be negatively affected.
Our revenues are highly dependent on customers located in the United States and Europe. Any weakening of economic conditions in these markets may adversely affect our business, results of operations and financial condition.
During the year ended December 31, 2017, 77.3% of our revenues were derived from customers located in North America and 16.2% of our revenues were derived from customers located in Europe. Any weakening of economic conditions in the U.S. or European economies could depress the pricing for our services and cause our customers to reduce or postpone their technology spending, which may in turn lower the demand for our services and negatively affect our business, results of operations and financial condition.
If we do not continue to improve our operational, financial and other internal controls and systems to manage our growth and size, our business, results of operations and financial condition could be adversely affected.
Our historic and anticipated growth will continue to place significant demands on our management and other resources, and will require us to continue to develop and improve our operational, financial and other internal controls. In particular, our growth has presented and will continue to present challenges with respect to:
• | recruiting, training and retaining technical, finance, marketing and management personnel with the knowledge, skills and experience that our business model requires; |
• | maintaining high levels of customer satisfaction; |
18
• | developing and improving our internal administrative infrastructure, particularly our financial, operational, communications and other internal systems; |
• | preserving our culture, values and entrepreneurial environment; and |
• | effectively managing our personnel and operations and effectively communicating to our personnel worldwide our core values, strategies and goals. |
In addition, the increasing size and scope of our operations increase the possibility that a member of our personnel will engage in unlawful or fraudulent activity, breach our contractual obligations, or otherwise expose us to unacceptable business risks, despite our efforts to train our people and maintain internal controls to prevent such instances. If we do not continue to develop and implement the right processes and tools to manage our enterprise, our business, results of operations and financial condition could be adversely affected.
We may not be able to pay dividends or repurchase shares of our common stock in accordance with our announced intent or at all.
In February 2017 we announced a plan to return $3.4 billion to stockholders by the end of 2018 through a combination of stock repurchases and cash dividends. As part of this plan, we have undertaken accelerated stock repurchase programs to repurchase a total of $1.8 billion of our Class A common stock and paid $265 million for dividends in 2017. Following the passage of the Tax Cuts and Jobs Act, or the Tax Reform Act, and due in part to the benefits we expect to receive under such act, in February 2018 we announced an increase in our quarterly dividend and have indicated that our Board of Directors intends to continue to review the capital return plan for potential future increases, subject to our financial performance, economic outlook and any other relevant considerations.
The Board of Directors’ determinations regarding dividends and share repurchases will depend on a variety of factors, including amount and location of our cash and investment balances, net income, cash flow generated from operations, overall liquidity position and potential alternative uses of cash, such as acquisitions, as well as economic conditions and expected future financial results. There can be no guarantee that we will achieve our announced capital return plan in the amounts or within the expected time frame that we have indicated, or at all. Our ability to declare future dividends will depend on our future financial performance, which in turn depends on the successful implementation of our strategy and on financial, competitive, regulatory, technical and other factors, general economic conditions, demand and prices for our services and other factors specific to our industry or specific projects, many of which are beyond our control. Therefore, our ability to generate cash flow depends on the performance of our operations and could be limited by decreases in our profitability or increases in costs, regulatory changes, capital expenditures or debt servicing requirements.
Any failure to achieve our announced capital return plan could negatively impact our reputation, harm investor confidence in us, and cause the market price of our common stock to decline.
Risks Relating to our International Operations
Our global operations are subject to complex risks, some of which might be beyond our control.
We have offices and operations in various countries around the world and provide services to customers globally. In 2017, 77.3% of our revenues were attributable to the North American region, 16.2% were attributable to the European region, and the remainder was attributable to the rest of the world, primarily Asia Pacific. We anticipate that revenues from customers outside North America will continue to account for a material portion of our revenues in the foreseeable future and may increase as we expand our international presence.
We may be subject to risks inherently associated with international operations, including risks associated with foreign currency exchange rate fluctuations, difficulties in enforcing intellectual property and/or contractual rights, the burdens of complying with a wide variety of foreign laws and regulations, potentially adverse tax consequences, tariffs, quotas and other barriers, potential difficulties in collecting accounts receivable, international hostilities, terrorism and natural disasters. We may also face difficulties integrating new facilities in different countries into our existing operations, as well as integrating employees that we hire in different countries into our existing corporate culture. If we are unable to manage the risks of our global operations, our business, results of operations and financial condition could be adversely affected.
A substantial portion of our assets and operations are located in India and we are subject to regulatory, economic, political and other uncertainties in India.
We intend to continue to develop and expand our offshore facilities in India where a majority of our technical professionals are located. While wage costs are lower in India than in the United States and other developed countries for comparably skilled professionals, wages in India have historically increased at a faster rate than in the United States and other
19
countries in which we operate. If this trend continues in the future, it would result in increased costs for our skilled professionals and thereby potentially reduce our operating margins. Also, there is no assurance that, in future periods, competition for skilled professionals will not drive salaries higher in India, thereby resulting in increased costs for our technical professionals and reduced operating margins.
In the past, the Indian economy has experienced many of the problems that commonly confront the economies of developing countries, including high inflation, erratic gross domestic product growth and volatility in currency exchange rates. The Indian government has exercised, and continues to exercise, significant influence over many aspects of the Indian economy and Indian government actions concerning the economy could have a material adverse effect on private sector entities like us. In the past, the Indian government has provided significant tax incentives and relaxed certain regulatory restrictions in order to encourage foreign investment in specified sectors of the economy, including the software development services industry. Changes in government leadership in India or a change in policies of the existing government in India that results in the elimination of any of the benefits realized by us from our Indian operations or the imposition of new taxes applicable to such operations could have a material adverse effect on our business, results of operations and financial condition.
Our operating results may be adversely affected by fluctuations in the Indian rupee and other foreign currency exchange rates, restrictions on the deployment of cash across our global operations and our use of derivative financial instruments.
Although we report our operating results in U.S. dollars, a portion of our revenues and expenses are denominated in currencies other than the U.S. dollar. Fluctuations in foreign currency exchange rates can have a number of adverse effects on us. Because our consolidated financial statements are presented in U.S. dollars, we must translate revenues, expenses and income, as well as assets and liabilities, into U.S. dollars at exchange rates in effect during or at the end of each reporting period. Therefore, changes in the value of the U.S. dollar against other currencies will affect our revenues, income from operations, net income and the value of balance sheet items originally denominated in other currencies. There is no guarantee that our financial results will not be adversely affected by currency exchange rate fluctuations. In addition, in some countries we could be subject to strict restrictions on the movement of cash and the exchange of foreign currencies, which could limit our ability to use these funds across our global operations. Further, as we leverage our global delivery model, a portion of our expenses is incurred in currencies other than those in which we bill for the related services. An increase in the value of certain currencies, such as the Indian rupee, against the U.S. dollar could increase costs for delivery of services at offshore sites by increasing labor and other costs that are denominated in local currency.
We have entered into a series of foreign exchange forward contracts that are designated as cash flow hedges of certain rupee denominated payments in India. These contracts are intended to partially offset the impact of the movement of the exchange rates on future operating costs. In addition, we have also entered into foreign exchange forward contracts in order to mitigate foreign currency risk on foreign currency denominated net monetary assets. The hedging strategies that we have implemented, or may in the future implement, to mitigate foreign currency exchange rate risks may not reduce or completely offset our exposure to foreign exchange rate fluctuations and may expose our business to unexpected market, operational and counterparty credit risks. Accordingly, we may incur losses from our use of derivative financial instruments that could have a material adverse effect on our business, results of operations and financial condition.
Our global operations expose us to numerous and sometimes conflicting legal and regulatory requirements, and violations of these regulations could harm our business, results of operations and financial condition.
Because we provide services to customers throughout the world, we are subject to numerous, and sometimes conflicting, legal rules on matters as diverse as import/export controls, content requirements, trade restrictions, tariffs, taxation, sanctions, government affairs, internal and disclosure control obligations, data privacy and labor relations. Violations of these laws or regulations in the conduct of our business could result in fines, criminal sanctions against us or our officers, prohibitions on doing business, damage to our reputation and other unintended consequences such as liability for monetary damages, fines and/or criminal prosecution, unfavorable publicity, restrictions on our ability to process information and allegations by our customers that we have not performed our contractual obligations. Due to the varying degrees of development of the legal systems of the countries in which we operate, local laws might be insufficient to protect our rights. Our failure to comply with applicable legal and regulatory requirements could have a material adverse effect on our business, results of operations and financial condition.
Among other anti-corruption laws and regulations, we are subject to the FCPA, which prohibits improper payments or offers of improper payments to foreign officials to obtain business or any other benefit, and the U.K. Bribery Act. Violations of these laws or regulations could subject us to criminal or civil enforcement actions, including fines and suspension or disqualification from government contracting or contracting with private entities in certain highly regulated industries, any of which could have a material adverse effect on our business, results of operations and financial condition.
20
International hostilities, terrorist activities, other violence or war, natural disasters, pandemics and infrastructure disruptions could delay or reduce the number of new service orders we receive and impair our ability to service our customers, thereby adversely affecting our business, results of operations and financial condition.
Hostilities involving acts of terrorism, violence or war, natural disasters, global health risks or pandemics or the threat or perceived potential for these events could materially adversely affect our operations and our ability to provide services to our customers. Such events may cause customers to delay their decisions on spending for information technology, consulting, and business process services and give rise to sudden significant changes in regional and global economic conditions and cycles. These events also pose significant risks to our personnel and to our and our customers’ physical facilities and operations around the world. Additionally, by disrupting communications and travel, giving rise to travel restrictions, and increasing the difficulty of obtaining and retaining highly-skilled and qualified personnel, these events could make it difficult or impossible for us to deliver services to some or all of our customers. The majority of our employees are located in India, and the majority of our technical professionals in the United States and Europe are Indian nationals who are able to work in the United States and Europe only because they hold currently valid visas and work permits. Any inability to travel could cause us to incur additional unexpected costs and expenses or could impair our ability to retain the skilled professionals we need for our operations. In addition, any extended disruptions of electricity, other public utilities or network services at our facilities could also adversely affect our ability to serve our customers.
Hostilities involving the United States, the United Kingdom, India and other countries in which we provide services to our customers, as well as acts of terrorism, violence or war, natural disasters, global health risks or pandemics may reduce the demand for our services and negatively affect our revenues. If these disruptions prevent us from effectively serving our customers, our business, results of operations and financial condition could be adversely affected.
The results of the United Kingdom’s referendum on withdrawal from the European Union may have a negative effect on global economic conditions, financial markets and our business.
In March 2017, Prime Minister Theresa May of the United Kingdom formally began the process of withdrawing the United Kingdom from the European Union, following the June 2016 referendum in which a majority of voters in the United Kingdom supported the withdrawal, or the Brexit Referendum. The terms of the withdrawal are subject to a negotiation period that could last until March 2019. The Brexit Referendum and the ensuing process of the United Kingdom's withdrawal from the European Union has created political and economic uncertainty about the future relationship between the United Kingdom and the European Union and as to whether any other European countries may similarly seek to exit the European Union. If the United Kingdom and the European Union are unable to negotiate acceptable withdrawal terms or if other European Union member states pursue withdrawal, barrier-free access between the United Kingdom and other European Union member states or among the European economic area overall could be diminished or eliminated. As we have material operations in both the United Kingdom and the Rest of Europe and our global operations serve many customers with significant operations in those regions, our financial condition and results of operation may be impacted by such uncertainty.
For the year ended December 31, 2017, revenues from our customers in the United Kingdom and Rest of Europe represented 7.8% and 8.4%, respectively, of our consolidated revenues. A significant portion of our revenues from customers in the United Kingdom is generated in British pounds. This exposure subjects us to revenue risk with respect to our customers in the United Kingdom as well as to risk resulting from adverse movements in foreign currency exchange rates. In addition, for the year ended December 31, 2017, revenues from our Financial Services customers represented 38.1% of our consolidated revenues. Uncertainty regarding future United Kingdom financial laws and regulations, the withdrawal terms of the United Kingdom from the European Union and the future trade terms between the United Kingdom and the European Union could negatively impact the financial services sector, including our customers in such sector, and as a consequence adversely impact our financial condition and results of operations. Further, it is uncertain what impact the withdrawal of the United Kingdom from the European Union will have on general economic conditions in the United Kingdom, the European Union and globally. Any of these factors could have a material adverse effect on our business, financial condition and results of operations.
Risks Relating to Intellectual Property
We may not be able to enforce or protect our intellectual property rights, which may harm our ability to compete and harm our business.
Our future success will depend, in part, on our ability to protect our software products and other solutions, data, proprietary methodologies and other valuable IP. We presently hold a limited number of issued patents, and we have filed and intend to continue to file patent applications. There is no guarantee that any patents will be issued in the United States or in any other country where we may seek protection or that they will serve as a barrier from competition from other organizations.
21
Additionally, the protection afforded by international patent laws as well as the enforcement actions differ from country to country. There is no guarantee that we will be able to maintain adequate protection or enforcement of our IP rights.
We also rely upon a combination of copyright, trademark and trade secret laws, non-disclosure and related contractual arrangements, and other security measures to protect our IP rights. We believe that laws, rules, regulations and treaties in effect in the United States, India and most other countries in which we operate are adequate to protect us from misappropriation or unauthorized use of our IP. However, there can be no assurance that these laws will not change in ways that may prevent or restrict our ability, or make it more expensive, to continue to protect the software, data and methodologies we use in the performance of our services or that we license to our clients. The existing laws of some countries in which we provide services, such as China, might offer only limited protection of our IP rights. There can be no assurance that the steps we have taken to protect our IP rights will be adequate to deter misappropriation, that we will be able to detect unauthorized use of our IP, or that we will be able to maintain adequate protection or enforcement of our IP rights.
Unauthorized use of our IP may result in development of software products or services that compete with our products and services and unauthorized parties may infringe upon or misappropriate our products, services or proprietary information. If we are unable to protect our IP, our business may be adversely affected and our ability to compete may be impaired.
Depending on the circumstances, we might need to grant a specific customer greater rights in IP developed or used in connection with a contract than we normally do. In certain situations, we forego the right to reuse new IP we create for a customer, which limits our ability to reuse that IP for other customers. Any limitation on our ability to provide a service or solution could cause us to lose revenue-generating opportunities and require us to incur additional expenses to develop new or modified solutions for future projects.
Our ability to enforce our software license agreements, service agreements, and other IP rights is subject to general litigation risks, as well as uncertainty as to the enforceability of our IP rights in various countries. To the extent that we seek to enforce our rights, we could be subject to claims that an IP right is invalid, otherwise not enforceable, or is licensed to the party against whom we are pursuing a claim. In addition, our assertion of IP rights may result in the other party seeking to assert alleged IP rights or assert other claims against us, which could harm our business. If we are not successful in defending such claims in litigation, we may not be able to sell or license a particular service or solution due to an injunction, or we may have to pay damages that could, in turn, harm our results of operations. In addition, governments may adopt regulations, or courts may render decisions, requiring compulsory licensing of intellectual property to others, or governments may require that products meet specified standards that serve to favor local companies. Our inability to enforce our IP rights under these circumstances may harm our competitive position and our business.
Our services or solutions could infringe upon the IP rights of others and we may be subject to claims of infringement of third-party IP rights.
We cannot be sure that our services and solutions, or the solutions of others that we offer to our customers, do not infringe on the IP rights of others. Third parties may assert claims against us or our customers alleging infringement of patent, copyright, trademark, or other intellectual property rights to solutions or services that are important to our business. Infringement claims could harm our reputation, cost us money and prevent us from offering some services or solutions. In our contracts, we generally agree to indemnify our customers for certain expenses or liabilities resulting from potential infringement of the IP rights of third parties. In some instances, the amount of our liability under these indemnities could be substantial. Any claims that products, services or processes we deliver infringe the intellectual property rights of others, regardless of the merit or resolution of such claims, may result in significant costs in defending and resolving such claims, and may divert the efforts and attention of our management and technical personnel from our business. In addition, as a result of such IP infringement claims, we could be required or otherwise decide that it is appropriate to:
• | pay third-party infringement claims; |
• | discontinue using, licensing, or selling particular products, services or processes subject to infringement claims; |
• | develop other technology not subject to infringement claims, which could be costly or may not be possible; and/or |
• | license technology from the third party claiming infringement, which license may not be available on commercially reasonable terms. |
The occurrence of any of the foregoing could result in unexpected expenses or require us to recognize an impairment of our assets, which would reduce the value of our assets and increase expenses. In addition, if we alter or discontinue our offering of affected items or services, our revenues could be affected. If a claim of infringement were successful against us or our customers, an injunction might be ordered against our customer or our own services or operations, causing further damages.
We expect that the risk of infringement claims against us will increase if our competitors are able to obtain patents or other intellectual property rights for software products and methods, technological solutions and processes. We may be subject
22
to IP infringement claims from certain individuals or companies that have acquired patent portfolios for the primary purpose of asserting such claims against other companies. The risk of infringement claims against us may also increase as we continue to develop and license our IP to our customers and other third parties. Any infringement claim or litigation against us could have a material adverse effect on our business, results of operations and financial condition.
Risks Relating to Legislation and Government Regulation
Restrictions on immigration may affect our ability to compete for and provide services to customers, which could hamper our growth and cause our revenues to decline.
Our future success continues to depend on our ability to attract and retain employees with technical and project management skills, including those from developing countries, especially India. The ability of foreign nationals to work in the United States, Europe, Asia Pacific and other regions in which we have customers depends on their and our ability to obtain the necessary visas and work permits for our personnel who need to travel internationally. If we are unable to obtain such visas or work permits, or if their issuance is delayed or if their length is shortened, we may not be able to provide services to our customers or to continue to provide services on a timely and cost-effective basis, receive revenues as early as expected or manage our delivery centers as efficiently as we otherwise could, any of which could have a material adverse effect on our business, results of operations and financial condition.
Immigration and work permit laws and regulations in the countries in which we have customers are subject to legislative and administrative changes as well as changes in the application of standards and enforcement. For example, the U.S. Congress has been actively considering various proposals that would make extensive changes to U.S. immigration laws regarding the admission of high-skilled temporary and permanent workers. Further, the current U.S. administration or Congress may seek to limit the admission of high-skilled temporary and permanent workers and has issued and may continue to issue executive orders designed to limit immigration. Any such provisions may increase our cost of doing business in the United States and may discourage customers from seeking our services. Our international expansion strategy and our business, results of operations and financial condition may be materially adversely affected if changes in immigration and work permit laws and regulations or the administration or enforcement of such laws or regulations impair our ability to staff projects with professionals who are not citizens of the country where the work is to be performed.
Anti-outsourcing legislation, if adopted, and negative perceptions associated with offshore outsourcing could impair our ability to service our customers and adversely affect our business, results of operations and financial condition.
The practice of outsourcing services to organizations operating in other countries is a topic of political discussion in the United States, which is our largest market, as well as other regions in which we have customers. For example, measures aimed at limiting or restricting outsourcing by U.S. companies have been put forward for consideration by the U.S. Congress and in state legislatures to address concerns over the perceived association between offshore outsourcing and the loss of jobs domestically. Further, the current U.S. administration or Congress may seek to limit outsourcing by U.S. companies. If enacted, such measures may broaden existing restrictions on outsourcing by federal and state government agencies and on government contracts with firms that outsource services directly or indirectly, or impact private industry with measures that include tax disincentives, fees or penalties, intellectual property transfer restrictions, mandatory government audit requirements, and new standards that have the effect of restricting the use of certain business and/or work visas. In the event that any of these measures become law, our ability to provide services to our customers could be impaired, which could adversely affect our business, results of operations and financial condition. Existing and future legislative and administrative/regulatory policies restricting the performance of business process services from an offshore location could also have a material adverse effect on our business, results of operations and financial condition.
In addition, from time to time there has been publicity about negative experiences associated with offshore outsourcing, such as domestic job loss and theft and misappropriation of sensitive customer data, particularly involving service providers in India. Current or prospective customers may elect to perform certain services themselves or may be discouraged from utilizing global service delivery providers due to negative perceptions that may be associated with using global service delivery models or firms. Any slowdown or reversal of existing industry trends toward global service delivery would seriously harm our ability to compete effectively with competitors that provide the majority of their services from within the country in which our customers operate.
23
Increased regulation of the financial services industry, healthcare industry or other industries in which our customers operate could harm our business, results of operations and financial condition.
The industries in which our customers are concentrated, such as the financial services industry and the healthcare industry, are, or may be, increasingly subject to governmental regulation and intervention. For instance, the financial services industry is subject to extensive and complex federal and state regulation. As a provider of services to financial institutions, portions of our operations are examined by a number of regulatory agencies. These agencies regulate the services we provide and the manner in which we operate. For example, some financial services regulators have imposed guidelines for use of cloud computing services that mandate specific controls or require financial services enterprises to obtain regulatory approval prior to outsourcing certain functions. If we are unable to comply with these guidelines or controls, or if our customers are unable to obtain regulatory approval to use our services where required, our business may be harmed. In addition, customers in the financial services sector have been subject to increased regulation following the enactment of the Dodd-Frank Wall Street Reform and Consumer Protection Act in the United States. New or changing regulations under Dodd-Frank, as well as other regulations or legislation affecting our customers in the financial services industry, may reduce demand for our services or cause us to incur costly changes in our processes or personnel, thereby negatively affecting our business, results of operations and financial condition.
The healthcare industry is highly regulated at the federal, state and local levels and is subject to changing legislative, regulatory, political and other influences, particularly in light of uncertainties posed by the result of the recent presidential election in the United States. Many healthcare laws, such as the Affordable Care Act, are complex, subject to frequent change, and dependent on interpretation and enforcement decisions from government agencies with broad discretion. The application of these laws to us, our customers or the specific services and relationships we have with our customers is not always clear. Our failure to anticipate accurately any changes to or the repeal of the Affordable Care Act and similar or future laws and regulations, or our failure to comply with them, could create liability for us, result in adverse publicity and negatively affect our business, results of operations and financial condition. Further, the growth of our business, results of operations and financial condition rely, in part, on customers in the healthcare industry that receive substantial revenues from governmental and other third-party payer programs. A reduction or less than expected increase in government funding for these programs, a change in allocation methodologies or the termination of our customers’ government contracts could negatively affect our customers’ businesses and, in turn, negatively impact our business, results of operations and financial condition. In addition, as a service provider to customers who are government contractors, we may in the future become involved in governmental investigations to evaluate our or our customers’ compliance with government healthcare programs, which could result in the assessment of damages, civil or criminal fines or penalties, or other sanctions, any of which could have a material adverse effect on our business, results of operations and financial condition.
Increased regulation, changes in existing regulation or increased government intervention in the other industries in which our customers operate also may adversely affect the growth of their respective businesses and therefore negatively impact our business, results of operations and financial condition.
Risks Relating to Taxes
Our earnings and financial condition may be negatively impacted by certain tax related matters.
We are subject to income taxes in the United States and numerous foreign jurisdictions. Our provision for income taxes and cash tax liability could be adversely affected by numerous factors, including income before taxes being lower than anticipated in countries with lower statutory tax rates and higher than anticipated in countries with higher statutory tax rates, changes in the valuation of deferred tax assets and liabilities, changes in accounting principles or interpretations and changes in tax laws. In addition, our income tax returns are subject to examination in the jurisdictions in which we operate. We regularly assess the likelihood of adverse outcomes resulting from these examinations to determine the adequacy of our provision for income taxes. An unfavorable outcome of one or more of these examinations may have an adverse effect on our business, results of operations and financial condition.
In December 2017, the United States enacted the Tax Reform Act. The one-time provisional incremental income tax expense recorded in 2017 related to the Tax Reform Act reflects certain assumptions based upon our interpretation of the Tax Reform Act as of January 18, 2018, and may change, possibly materially, as we receive additional clarification and guidance and as the interpretation of the Tax Reform Act evolves over time. Such changes could adversely impact our results of operations and financial condition in future periods.
24
Our earnings may be adversely affected if we change our intent not to repatriate Indian accumulated undistributed earnings.
We earn a significant amount of our earnings in India and consider Indian accumulated undistributed earnings to be indefinitely reinvested. While we have no plans to do so, events may occur that could effectively force us to change our intent not to repatriate such earnings. As a result of the Tax Reform Act, U.S. federal taxes have been provisionally accrued on these earnings, as well as other non-U.S. earnings, as of December 31, 2017 as part of the one-time transition tax. However, if we were to change our assertion that our accumulated undistributed Indian earnings are indefinitely reinvested, we would expect, based on our current interpretation of Indian tax law, to accrue additional tax expense at a rate of approximately 21% of cash available for distribution, which could have a material adverse effect on our results of operations and financial condition. This estimate is subject to change based on tax legislative developments in India and other jurisdictions as well as judicial and interpretive developments of applicable tax laws.
Our earnings may be negatively impacted by the loss of certain tax benefits provided by India to companies in our industry as well as by possible changes in Indian tax laws.
Our Indian subsidiaries, collectively referred to as Cognizant India, are primarily export-oriented and are eligible for certain income tax holiday benefits granted by the Indian government for export activities conducted within Special Economic Zones, or SEZs, for periods of up to 15 years. The Indian government has announced a plan to phase out certain tax exemptions and deductions, which includes a discontinuation of tax holidays for new SEZ units commencing operations on or after April 1, 2020. These changes or any changes that would reduce or deny SEZ tax benefits could have a material adverse effect on our business, results of operations and financial condition. In addition, all Indian profits, including those generated within SEZs, are subject to the Minimum Alternative Tax, or MAT, at the rate of 21.3%. Any MAT paid is creditable against future corporate income tax, subject to limitations. Currently, we anticipate utilizing our existing MAT balances against future corporate income tax. Our ability to fully do so may be influenced by possible changes to the Indian tax laws as well as the future financial results of Cognizant India. Our potential inability to fully utilize our deferred income tax assets related to the MAT could have a material adverse effect on our results of operations and financial condition.
Risks Relating to our Common Stock and Governing Documents
Our stock price continues to be volatile.
Our stock has at times experienced substantial price volatility as a result of variations between our actual and anticipated financial results, announcements by us and our competitors, projections or speculation about our business or that of our competitors by the media or investment analysts or uncertainty about current global economic conditions. The stock market, as a whole, also has experienced extreme price and volume fluctuations that have affected the market price of many technology companies in ways that may have been unrelated to these companies’ operating performance. Furthermore, we believe our stock price should reflect future growth and profitability expectations and, if we fail to meet these expectations, our stock price may significantly decline.
Provisions in our charter and by-laws and provisions under Delaware law may discourage unsolicited takeover proposals.
Provisions in our charter and by-laws, each as amended, and Delaware General Corporate Law, or DGCL, may have the effect of deterring unsolicited takeover proposals or delaying or preventing changes in our control or management, including transactions in which stockholders might otherwise receive a premium for their shares over then-current market prices. These provisions include:
• | authority of the Board of Directors, without further action by the stockholders, to fix the rights and preferences of and issue shares of preferred stock; |
• | the inability of our stockholders to act by written consent and the restrictions imposed on our stockholders’ ability to call a special meeting. As a result, any action by our stockholders may be delayed until annual meetings or until a special meeting is called by our chairman, chief executive officer or board of directors; |
• | the supermajority-voting requirement for specified amendments to our charter and by-laws, which allows a minority of our stockholders to block those amendments; and |
• | provisions in the DGCL preventing stockholders from engaging in business combinations with us, subject to certain exceptions. |
These provisions could also discourage bids for our common stock at a premium as well as create a depressive effect on the market price of the shares of our common stock.
25
Item 1B. Unresolved Staff Comments
None.
Item 2. Properties
To support our planned growth, we are continually expanding our global and regional delivery center capacity through a strategy that includes both the construction and leasing of new facilities. As presented in the table below, as of December 31, 2017, we leased 13.1 million square feet and owned 13.8 million square feet related to our global and regional delivery centers located in 32 countries and used to deliver services to our customers across all four of our business segments.
Geographic Area | Number of Locations | Square Footage Leased (in millions) | Square Footage Owned (in millions) | Total Square Footage (in millions) | ||||||||
India | 46 | 10.4 | 13.6 | 24.0 | ||||||||
North America | 57 | 1.5 | 0.2 | 1.7 | ||||||||
Europe | 39 | 0.5 | — | 0.5 | ||||||||
Rest of World1 | 32 | 0.7 | — | 0.7 | ||||||||
Total | 174 | 13.1 | 13.8 | 26.9 | ||||||||
1 | Includes our operations in Asia Pacific, the Middle East and Latin America. Substantially all of this square footage is located in the Philippines, China and Argentina. |
Our executive offices are located in Teaneck, New Jersey, where we lease 0.1 million square feet. In addition to our executive office and the above global and regional delivery centers, we have business development offices in approximately 80 cities and 38 countries across the globe.
We believe that our current facilities are adequate to support our existing operations. We also believe that we will be able to obtain suitable additional facilities on commercially reasonable terms on an “as needed basis.”
Item 3. Legal Proceedings
We are conducting an internal investigation focused on whether certain payments relating to Company-owned facilities in India were made improperly and in possible violation of the FCPA and other applicable laws. The investigation is also examining various other payments made in small amounts in India that may not have complied with Company policy or applicable law. In September 2016, we voluntarily notified the DOJ and SEC and are cooperating fully with both agencies. The investigation is being conducted under the oversight of the Audit Committee, with the assistance of outside counsel. To date, the investigation has identified a total of approximately $6 million in payments made between 2009 and 2016 that may have been improper. Based on the results of the investigation to date, no material adjustments, restatements or other revisions to our previously issued financial statements are required.
On October 5, 2016, October 27, 2016, and November 18, 2016, three putative securities class action complaints were filed in the United States District Court for the District of New Jersey, naming us and certain of our current and former officers as defendants. In an order dated February 3, 2017, the United States District Court for the District of New Jersey consolidated the three putative securities class actions into a single action and appointed lead plaintiffs and lead counsel. On April 7, 2017, the lead plaintiffs filed a consolidated amended complaint on behalf of a putative class of stockholders who purchased our common stock during the period between February 27, 2015 and September 29, 2016, naming us and certain of our current and former officers as defendants and alleging violations of the Exchange Act, based on allegedly false or misleading statements related to potential violations of the FCPA, our business, prospects and operations, and the effectiveness of our internal control over financial reporting and our disclosure controls and procedures. The lead plaintiffs seek an award of compensatory damages, among other relief, and their reasonable costs and expenses, including attorneys’ fees. Under a stipulation filed by the parties on February 23, 2017, defendants filed motions to dismiss the consolidated amended complaint on June 6, 2017, plaintiffs filed an opposition brief on July 21, 2017 responding to defendants’ motions to dismiss, and defendants filed reply briefs in further support of their motions to dismiss on September 5, 2017. On September 5, 2017, defendants also filed a motion to strike certain allegations in the consolidated amended complaint, plaintiffs filed an opposition to the motion to strike on October 2, 2017, and, on October 10, 2017, we filed a reply brief in further support of the motion to strike.
On October 31, 2016, November 15, 2016, and November 18, 2016, three putative shareholder derivative complaints were filed in New Jersey Superior Court, Bergen County, naming us, all of our then current directors and certain of our current and former officers as defendants. On January 24, 2017, the New Jersey Superior Court, Bergen County, consolidated the three putative shareholder derivative actions filed in that court into a single action and appointed lead plaintiff and lead counsel. The
26
complaints assert claims for breach of fiduciary duty, corporate waste, unjust enrichment, abuse of control, mismanagement, and/or insider selling by defendants. On March 16, 2017, the parties filed a stipulation deferring all further proceedings pending a final, non-appealable ruling on the then anticipated motion to dismiss the consolidated putative securities class action. On April 26, 2017, in lieu of ordering the stipulation filed by the parties, the New Jersey Superior Court deferred further proceedings by dismissing the consolidated putative shareholder derivative litigation without prejudice but permitting the parties to file a motion to vacate the dismissal in the future. On February 22, 2017, a fourth putative shareholder derivative complaint asserting similar claims was filed in the United States District Court for the District of New Jersey, naming us and certain of our then current directors as defendants. On April 5, 2017, the United States District Court for the District of New Jersey entered an order staying all proceedings pending a final, non-appealable ruling on the then anticipated motion to dismiss the consolidated putative securities class action. On April 7, 2017, a fifth putative shareholder derivative complaint was filed in the United States District Court for the District of New Jersey, naming us, certain of our then current directors, and certain of our current and former officers as defendants. The complaint in that action asserts claims similar to those in the previously-filed putative shareholder derivative actions, but also adds a claim for violations of Section 10(b) of the Exchange Act against the individual defendants. On May 10, 2017, a sixth putative shareholder derivative complaint was filed in the United States District Court for the District of New Jersey, naming us, certain of our then current directors, and certain of our current and former officers as defendants. The complaint in that action asserts claims similar to those in the previously-filed putative shareholder derivative actions, but also adds a claim for violations of Section 14(a) of the Exchange Act against the individual defendants. In an order dated June 20, 2017, the United States District Court for the District of New Jersey consolidated the three putative shareholder derivative actions filed in that court into a single action, appointed lead plaintiff and lead counsel, and stayed all further proceedings pending a final, non-appealable ruling on the motions to dismiss the consolidated putative securities class action. All of the putative shareholder derivative complaints allege among other things that certain of our public disclosures were false and misleading by failing to disclose that payments allegedly in violation of the FCPA had been made and by asserting that management had determined that our internal controls were effective. The plaintiffs seek awards of compensatory damages and restitution to the Company as a result of the alleged violations and their costs and attorneys’ fees, experts’ fees, and other litigation expenses, among other relief.
We are presently unable to predict the duration, scope or result of the Audit Committee’s investigation, any investigations by the DOJ or the SEC, the consolidated putative securities class action, the putative shareholder derivative actions or any other lawsuits. As such, we are presently unable to develop a reasonable estimate of a possible loss or range of losses, if any, and thus have not recorded any accruals related to these matters. The DOJ and the SEC have a broad range of civil and criminal sanctions under the FCPA and other laws and regulations including injunctive relief, disgorgement, fines, penalties, modifications to business practices, including the termination or modification of existing business relationships, the imposition of compliance programs and the retention of a monitor to oversee compliance with the FCPA. In addition, the DOJ and the SEC could bring enforcement actions against the Company or individuals, including former members of senior management. Such actions, if brought, could result in dispositions, judgments, settlements, fines, injunctions, cease and desist orders, debarment or other civil or criminal penalties against the Company or such individuals.
We expect to incur additional expenses related to remedial measures, and may incur additional expenses related to fines. The imposition of any sanctions or the implementation of remedial measures could have a material adverse effect on our business, annual and interim results of operations, cash flows and financial condition. Furthermore, while the Company intends to defend the lawsuits vigorously, these lawsuits and any other related lawsuits are subject to inherent uncertainties, the actual cost of such litigation will depend upon many unknown factors and the outcome of the litigation is necessarily uncertain.
We are also involved in various claims and legal actions arising in the ordinary course of business. In the opinion of our management, the outcome of such claims and legal actions, if decided adversely, is not expected to have a material adverse effect on our quarterly or annual operating results, cash flows or consolidated financial position.
Item 4. Mine Safety Disclosures
Not applicable.
27
PART II
Item 5. Market for Registrant’s Common Equity, Related Stockholder Matters and Issuer Purchases of Equity Securities
Our Class A common stock trades on the Nasdaq Global Select Market (Nasdaq) under the symbol “CTSH”.
The following table shows the per share range of high and low sale prices for shares of our Class A common stock, as listed for quotation on the Nasdaq and the dividends per share paid, for the quarterly periods indicated.
Quarter Ended | High | Low | Dividends | |||||||||
March 31, 2016 | $ | 63.43 | $ | 51.22 | $ | — | ||||||
June 30, 2016 | 63.23 | 55.17 | — | |||||||||
September 30, 2016 | 60.47 | 45.44 | — | |||||||||
December 31, 2016 | 58.50 | 48.50 | — | |||||||||
March 31, 2017 | 60.39 | 51.52 | — | |||||||||
June 30, 2017 | 68.18 | 57.50 | 0.15 | |||||||||
September 30, 2017 | 73.00 | 66.05 | 0.15 | |||||||||
December 31, 2017 | 76.51 | 69.69 | 0.15 | |||||||||
As of December 31, 2017, the approximate number of holders of record of our Class A common stock was 141 and the approximate number of beneficial holders of our Class A common stock was 310,800.
Cash Dividends
In May 2017 we initiated a quarterly cash dividend of $0.15 per share. On February 5, 2018, our Board of Directors approved the Company's declaration of a $0.20 per share dividend with a record date of February 22, 2018 and a payment date of February 28, 2018. We intend to continue to pay a quarterly cash dividend during 2018 and will continue to review the capital return plan, subject to our financial performance, economic outlook and any other relevant considerations. Our ability to declare future dividends will depend on our future financial performance, which in turn depends on the successful implementation of our strategy and on financial, competitive, regulatory, technical and other factors, general economic conditions, demand and prices for our services, and other factors specific to our industry or specific projects, many of which are beyond our control.
Issuer Purchases of Equity Securities
Effective March 1, 2017, the Board of Directors approved the termination of the stock repurchase program then in effect and approved a new stock repurchase program. The stock repurchase program allows for the repurchase of $3.5 billion of our outstanding shares of Class A common stock, excluding fees and expenses, through December 31, 2019.
Under the stock repurchase program, the Company is authorized to repurchase its Class A common stock through open market purchases, including under a trading plan adopted pursuant to Rule 10b5-1 of the Exchange Act, or in private transactions, including through accelerated stock repurchase agreements entered into with financial institutions, in accordance with applicable federal securities laws. The timing of repurchases and the exact number of shares to be purchased are determined by the Company’s management, in its discretion, or pursuant to a Rule 10b5-1 trading plan, and will depend upon market conditions and other factors.
In December 2017, we entered into an accelerated stock repurchase agreement, referred to as the December ASR, with a financial institution under our stock repurchase program. Under the terms of the December ASR and in exchange for an up-front payment of $300 million, the financial institution initially delivered 3.6 million shares, a portion of the Company's total expected shares to be repurchased under the December ASR. The total number of shares ultimately delivered will be determined in the first quarter of 2018, at the end of the applicable purchase period.
28
As of December 31, 2017, the remaining available balance under the Board of Directors' authorized stock repurchase program was $1.7 billion.
Month | Total Number of Shares Purchased | Average Price Paid per Share | Total Number of Shares Purchased as Part of Publicly Announced Plans or Programs | Approximate Dollar Value of Shares that May Yet Be Purchased under the Plans or Programs (in millions) | ||||||||||
October 1, 2017 - October 31, 2017 | ||||||||||||||
Open market and privately negotiated purchases | — | $ | — | — | $ | 2,000 | ||||||||
November 1, 2017 - November 30, 2017 | ||||||||||||||
Open market and privately negotiated purchases | — | — | — | 2,000 | ||||||||||
December 1, 2017 - December 31, 2017 | ||||||||||||||
Open market and privately negotiated purchases | — | — | — | |||||||||||
December 2017 ASR(a) | 3,581,964 | (a) | 3,581,964 | 1,700 | ||||||||||
Total | 3,581,964 | $ | — | 3,581,964 | ||||||||||
______________
(a) | The number of shares stated above represents shares initially delivered and does not represent the final number of shares to be delivered under the December ASR. The total number of shares ultimately delivered and therefore the average price paid per share, will be determined at the end of the purchase period based on the volume-weighted average price of the Company's common stock during that period. |
We regularly purchase shares in connection with our stock-based compensation plans as shares of our Class A common stock are tendered by employees for payment of applicable statutory tax withholdings. For the three months ended December 31, 2017, we purchased 438,037 shares at an aggregate cost of $32 million in connection with employee tax withholding obligations.
29
Performance Graph
The following graph compares the cumulative total stockholder return on our Class A common stock with the cumulative total return on the S&P 500 Index, Nasdaq-100 Index and a Peer Group Index (capitalization weighted) for the period beginning December 31, 2012 and ending on the last day of our last completed fiscal year. The stock performance shown on the graph below is not indicative of future price performance.
COMPARISON OF CUMULATIVE TOTAL RETURN(1)(2)
Among Cognizant, the S&P 500 Index, the Nasdaq-100 Index
And a Peer Group Index(3) (Capitalization Weighted)
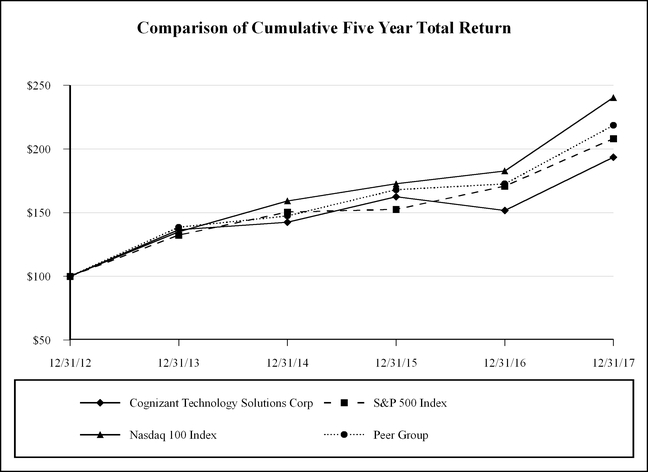
Company / Index | Base Period 12/31/12 | 12/31/13 | 12/31/14 | 12/31/15 | 12/31/16 | 12/31/17 | ||||||||||||||||||
Cognizant Technology Solutions Corp | $ | 100 | $ | 136.68 | $ | 142.55 | $ | 162.47 | $ | 151.67 | $ | 193.49 | ||||||||||||
S&P 500 Index | 100 | 132.39 | 150.51 | 152.59 | 170.84 | 208.14 | ||||||||||||||||||
Nasdaq-100 | 100 | 134.99 | 159.20 | 172.62 | 182.78 | 240.38 | ||||||||||||||||||
Peer Group | 100 | 138.46 | 147.43 | 167.92 | 172.57 | 218.50 | ||||||||||||||||||
(1) | Graph assumes $100 invested on December 31, 2012 in our Class A common stock, the S&P 500 Index, the Nasdaq-100 Index, and the Peer Group Index (capitalization weighted). |
(2) | Cumulative total return assumes reinvestment of dividends. |
(3) | We have constructed a Peer Group Index of other information technology consulting firms. Our peer group consists of Accenture plc., DXC Technology (previously Computer Sciences Corporation), ExlService Holdings Inc., Genpact Limited, Infosys Ltd., Syntel Inc., Wipro Ltd. and WNS (Holdings) Limited. Historically, our peer group also included Computer Task Group, Inc. The old peer group is not presented separately as it is not materially different from the peer group information presented. |
30
Item 6. Selected Financial Data
The following table sets forth our selected consolidated historical financial data as of the dates and for the periods indicated. Our selected consolidated financial data set forth below as of December 31, 2017 and 2016 and for each of the years ended December 31, 2017, 2016 and 2015 have been derived from the audited consolidated financial statements included elsewhere herein. Our selected consolidated financial data set forth below as of December 31, 2015, 2014 and 2013 and for each of the years ended December 31, 2014 and 2013 are derived from our consolidated financial statements not included elsewhere herein. Our selected consolidated financial information for 2017, 2016 and 2015 should be read in conjunction with the Consolidated Financial Statements and the Notes and “Item 7. Management’s Discussion and Analysis of Financial Condition and Results of Operations” which are included elsewhere in this Annual Report on Form 10-K.
2017 | 2016 | 2015 | 2014 | 2013 | ||||||||||||||||
(in millions, except per share data) | ||||||||||||||||||||
For the Year Ended December 31: | ||||||||||||||||||||
Revenues | $ | 14,810 | $ | 13,487 | $ | 12,416 | $ | 10,263 | $ | 8,843 | ||||||||||
Income from operations | 2,481 | 2,289 | 2,142 | 1,885 | 1,678 | |||||||||||||||
Net income(4) | 1,504 | 1,553 | 1,624 | 1,439 | 1,229 | |||||||||||||||
Basic earnings per share(4) | $ | 2.54 | $ | 2.56 | $ | 2.67 | $ | 2.37 | $ | 2.03 | ||||||||||
Diluted earnings per share(4) | $ | 2.53 | $ | 2.55 | $ | 2.65 | $ | 2.35 | $ | 2.02 | ||||||||||
Cash dividends declared per common share | $ | 0.45 | $ | — | $ | — | $ | — | $ | — | ||||||||||
Weighted average number of common shares outstanding-Basic | 593 | 607 | 609 | 608 | 604 | |||||||||||||||
Weighted average number of common shares outstanding-Diluted | 595 | 610 | 613 | 613 | 610 | |||||||||||||||
As of December 31: | ||||||||||||||||||||
Cash, cash equivalents and short-term investments | $ | 5,056 | $ | 5,169 | $ | 4,949 | $ | 3,775 | $ | 3,748 | ||||||||||
Working capital(2)(3) | 6,272 | 6,182 | 5,195 | 3,829 | 4,117 | |||||||||||||||
Total assets(1)(2)(3) | 15,221 | 14,262 | 13,061 | 11,473 | 8,129 | |||||||||||||||
Total debt | 873 | 878 | 1,283 | 1,632 | — | |||||||||||||||
Stockholders’ equity | 10,669 | 10,728 | 9,278 | 7,740 | 6,136 | |||||||||||||||
______________________
(1) | In July 2013, the Financial Accounting Standards Board, or FASB, issued new guidance which requires the netting of any unrecognized tax benefits against all available same-jurisdiction deferred income tax carryforward assets that would apply if the uncertain tax positions were settled. We adopted this standard on January 1, 2014 and conformed prior year's presentation. |
(2) | In November 2015, the FASB issued an update to the standard on income taxes pertaining to the balance sheet classification of deferred income taxes. The update requires that all deferred income tax assets and liabilities, along with any related valuation allowance, within each tax jurisdiction be classified as noncurrent on the balance sheet. As a result, each tax jurisdiction has one net noncurrent deferred income tax asset or liability. We have adopted this guidance retrospectively in the fourth quarter of 2015 and conformed prior years' presentation. |
(3) | In April 2015, the FASB issued an update related to the presentation of debt issuance costs. The update requires debt issuance costs, other than costs incurred to secure lines of credit, be presented in the balance sheet as a direct deduction from the carrying value of that debt liability. The recognition and measurement guidance for debt issuance costs are not affected by this update. We have adopted this guidance retrospectively as of January 1, 2016 and conformed prior periods' presentation as applicable. |
(4) | In March 2016, the FASB issued an update related to stock compensation. The update simplified the accounting for excess tax benefits and deficiencies related to employee stock-based payment transactions. We adopted this standard prospectively on January 1, 2017. For the year ended December 31, 2017, we recognized net excess tax benefits on stock-based compensation awards in our income tax provision in the amount of $40 million or $0.07 per share. In prior periods, such net excess tax benefits were recorded in additional paid in capital. |
31
Item 7. Management’s Discussion and Analysis of Financial Condition and Results of Operations
Executive Summary
We are one of the world’s leading professional services companies. We are in business to help our customers adapt, compete and grow in the face of continual shifts and disruptions within their markets. We do so by partnering with them to apply technology to transform their business, operating, and technology models, allowing them to achieve the full value of digitizing their entire enterprises. We call this being “digital at scale.” When implemented, it enables customers to achieve more efficient and effective operations while reshaping their business models for innovation and growth. Our industry-based, consultative approach helps customers envision, build and run more innovative and efficient businesses. Our core competencies include: business, process, operations and technology consulting, application development and systems integration, enterprise information management, application testing, application maintenance, information technology, or IT, infrastructure services, and business process services. We tailor our services and solutions to specific industries and use an integrated global delivery model that employs customer service teams based at customer locations and delivery teams located at dedicated global and regional delivery centers.
Our objective is to create value for both our customers and stockholders by enhancing our position as a leading professional services company in the digital era. Our digital services and solutions are designed to help our customers win in the digital economy by applying technology and analytics to change consumer experiences to drive sustainable growth, deploying systems of intelligence to automate and improve core business processes, and improving technology systems by deploying cloud and cyber security solutions and as-a-service models to make them simpler, more modern and secure. To accelerate our shift to digital services and solutions, we are deploying the following strategies:
• | Aligning our digital services and solutions along three practice areas - Digital Business, Digital Operations and Digital Systems and Technology - to address the needs of our customers as they transform their business and technology models. |
• | Investing to scale these digital practice areas across our business segments and geographies, including through extensive training and re-skilling of our existing technical teams, expansion of our local workforces in the United States and other markets around the world where we operate and pursuit of select strategic acquisitions, joint ventures, investments and alliances that can expand our intellectual property portfolio, industry expertise, geographic reach, and platform and technology capabilities. |
• | Continuing to develop of our core business, which includes application services, IT infrastructure and business process services. Our customers often look for efficiencies in the running of their core operations to help them fund investments in new digital capabilities. We work with them to analyze and identify opportunities for advanced automation and delivery efficiencies. Additionally, we seek to expand the geographic reach of our core portfolio of services. |
• | Selectively targeting higher margin work within our core business and unifying our delivery capabilities to allow for more cost-conscious delivery. We are leveraging automation and scale, improving our utilization and optimizing our pyramid. |
We believe the above strategies, combined with improving the overall efficiency of our operations, will enable us to gradually expand our non-GAAP operating margins1 with the goal of achieving 22% non-GAAP operating margin1 in 2019. There can be no assurances that we will be successful in achieving this plan or that other factors beyond our control, including the various risks described in Part I, Item 1A. Risk Factors, will not cause us to fail to achieve the targeted improvements.
In 2017, we began a realignment of our business by executing on the above strategies and improving the overall efficiency of our operations while continuing to drive revenue growth. As part of this realignment plan, we incurred expenses of $72 million in 2017, which are reported in "Selling, general and administrative expenses" in our consolidated statements of operations, and are comprised of severance costs, including costs related to a voluntary separation program, or VSP, lease termination costs and advisory fees related to non-routine shareholder matters and to the development of our realignment and return of capital programs. The costs related to the realignment are excluded from non-GAAP operating margin1 and non-GAAP diluted earnings per share1. We believe the majority of the costs related to the realignment have already been incurred, although we anticipate that we may incur additional realignment costs in 2018.
_______________
1 | Non-GAAP operating margin and non-GAAP earnings per share are not measurements of financial performance prepared in accordance with GAAP. See “Non-GAAP Financial Measures” for more information and a reconciliation to the most directly comparable GAAP financial measures. |
32
In February 2017 we announced a plan to return $3.4 billion to our stockholders over a two-year period. During 2017, as part of this plan, we entered into multiple accelerated stock repurchase agreements, collectively referred to as the ASR, to repurchase $1.8 billion of stock and, in May 2017, initiated a quarterly cash dividend. During 2017, we paid dividends totaling $265 million and, in February 2018, increased our quarterly dividend to $0.20 per share. On an ongoing basis, we review our capital return plan, considering our financial performance and liquidity position, investments required to execute our strategic initiatives, the economic outlook, regulatory changes and other relevant factors. Accordingly, we are currently evaluating the impact of the Tax Cuts and Jobs Act, or Tax Reform Act, on our capital return plan.
The following table sets forth a summary of our financial results for the years ended December 31, 2017 and 2016:
Increase (Decrease) | |||||||||||||||
2017 | 2016 | $ | % | ||||||||||||
(Dollars in millions, except per share data) | |||||||||||||||
Revenues | $ | 14,810 | $ | 13,487 | $ | 1,323 | 9.8 | ||||||||
Income from operations | 2,481 | 2,289 | 192 | 8.4 | |||||||||||
Net income | $ | 1,504 | $ | 1,553 | $ | (49 | ) | (3.2 | ) | ||||||
Diluted earnings per share | $ | 2.53 | $ | 2.55 | $ | (0.02 | ) | (0.8 | ) | ||||||
Other Financial Information2 | |||||||||||||||
Non-GAAP income from operations | $ | 2,912 | $ | 2,636 | $ | 276 | 10.5 | ||||||||
Non-GAAP diluted earnings per share | $ | 3.77 | $ | 3.39 | $ | 0.38 | 11.2 | ||||||||
The key drivers of our revenue growth in 2017 as compared to 2016 were as follows:
• | Solid performance in our Communications, Media and Technology (previously referred to as Other), Products and Resources (previously referred to as Manufacturing/Retail/Logistics) and Healthcare business segments with revenue growth of 17.7%, 14.3% and 10.1%, respectively; |
• | Revenues in our Financial Services business segment grew 5.0% as certain banking customers continue to focus on optimizing their cost structure and managing their discretionary spending; |
• | Sustained strength in the North American market where revenues grew 8.6%; |
• | Continued penetration of the European and Rest of World (primarily Asia Pacific) markets: |
◦ | In Europe, we experienced revenue growth of 11.8% after a negative currency impact of 1.2%. Specifically, revenues from our Rest of Europe customers, including revenues from our newly acquired strategic customers, increased 28.8% inclusive of a positive currency impact of 2.0%, while within the United Kingdom we experienced a decrease in revenues of 2.2% after a negative currency impact of 3.8%. Revenue growth in the United Kingdom was negatively affected by weakness in the banking sector in that country; |
◦ | Revenues from our Rest of World customers increased 20.9%; |
• | Increased customer spending on discretionary projects; |
• | Expansion of our service offerings, including consulting and digital services, next-generation IT solutions and platform-based solutions; |
• | Continued expansion of the market for global delivery of technology and business process services; and |
• | Increased penetration at existing customers, including strategic customers. |
Our customers seek to apply digital technologies to transform the way they engage with customers and employees, and to develop innovative products and services and bring them quickly to market. Companies are also eager to automate additional aspects of their business to improve their cost structures and increase the quality and velocity of their operations. Increasingly, the relative emphasis among our customers is shifting towards investment and innovation, as reflected in accelerated demand for our digital services. We also saw an increase in demand for larger, more complex projects, including managed services contracts, which are transformational for our customers. Such contracts may have longer sales cycles and ramp-up periods and could lead to greater variability in our period to period operating results.
_______________
2 | Non-GAAP income from operations and non-GAAP diluted earnings per share are not measurements of financial performance prepared in accordance with GAAP. See “Non-GAAP Financial Measures” for more information and a reconciliation to the most directly comparable GAAP financial measures. |
33
In 2017, our operating margin decreased to 16.8% from 17.0% in 2016, while our non-GAAP operating margin increased to 19.7%3 from 19.5%3 in 2016. The decrease in our GAAP operating margin was due to increases in compensation and benefit costs, the impact of realignment charges and an increase in depreciation expense, partially offset by efficiencies of leveraging our cost structure over a larger organization and a reduction in immigration costs. The increase in our non-GAAP operating margin was due to efficiencies of leveraging our cost structure over a larger organization and a reduction in immigration costs, partially offset by increases in compensation and benefit costs and an increase in depreciation expense.
On December 22, 2017, the United States enacted the Tax Reform Act, which significantly revised the U.S. corporate income tax law for tax years beginning after December 31, 2017 by (among other provisions):
• | reducing the U.S. federal statutory corporate income tax rate from 35% to 21% for tax years beginning after December 31, 2017; |
• | implementing a modified territorial tax system that includes a one-time transition tax on all accumulated undistributed earnings of foreign subsidiaries; and |
• | providing for a full deduction on future dividends received from foreign affiliates. |
As a result of the enactment of the Tax Reform Act, our historical and future foreign earnings are no longer subject to U.S. federal income taxes upon repatriation beyond the one-time transition tax. We therefore reevaluated our assertion that our non-U.S. earnings would be indefinitely reinvested and concluded that our Indian earnings will continue to be indefinitely reinvested while the accumulated undistributed earnings of our foreign subsidiaries, other than our Indian subsidiaries, are now available for repatriation to the United States. During the fourth quarter of 2017, we recorded a one-time provisional net income tax expense of $617 million, which is comprised of: (i) the one-time transition tax expense on accumulated undistributed earnings of foreign subsidiaries of $635 million, (ii) foreign and U.S. state income tax expense that will be applicable upon repatriation of the accumulated undistributed earnings of our foreign subsidiaries, other than our Indian subsidiaries, of $53 million, partially offset by (iii) an income tax benefit of $71 million resulting from the revaluation of U.S. net deferred income tax liabilities to the new lower U.S. income tax rate. The one-time incremental income tax expense is provisional as it reflects certain assumptions based upon our interpretation of the Tax Reform Act as of January 18, 2018 and may change, possibly materially, as we receive additional clarification and guidance and as the interpretation of the Tax Reform Act evolves over time.
Our effective income tax rate for 2017 was 43.4% as compared to 34.2% in 2016. Our 2017 effective income tax rate included a negative impact of 23.2% of pretax earnings due to the Tax Reform Act. Our 2016 effective income tax rate included a negative impact of 10.1% of pretax earnings due to the one-time tax adjustment relating to the India Cash Remittance.
For the years 2018 through 2020, we expect our effective income tax rate to be in the range of 24% to 26%, excluding the impact of discrete items, if any. Our projected effective income tax rates incorporate the anticipated impact of the Tax Reform Act, assumptions regarding our future earnings and their geographic mix, management’s assessment of tax law in the various jurisdictions in which we operate and other risks and uncertainties. As such, our effective income tax rate projections are subject to change, possibly materially, due to changes in underlying estimates and assumptions, changes in tax law and guidance that may be issued, actions the Company may take as a result of these developments, as well as other factors that may be beyond our control.
As previously disclosed, the Company is conducting an internal investigation focused on whether certain payments relating to Company-owned facilities in India were made improperly and in possible violation of the U.S. Foreign Corrupt Practices Act, or FCPA, and other applicable laws. The investigation is also examining various other payments made in small amounts in India that may not have complied with Company policy or applicable law. In September 2016, we voluntarily notified the Department of Justice, or DOJ, and the Securities and Exchange Commission, or SEC, and are cooperating fully with both agencies. The investigation is being conducted under the oversight of the Audit Committee, with the assistance of outside counsel. To date, the investigation has identified a total of approximately $6 million in payments made between 2009 and 2016 that may have been improper. In the second half of 2016, we recorded an out-of-period correction related to $4 million of such payments that had been previously capitalized that should have been expensed. There were no adjustments recorded during 2017 related to the amounts under investigation.
_______________
3 | Non-GAAP operating margin is not a measurement of financial performance prepared in accordance with GAAP. See “Non-GAAP Financial Measures” for more information and a reconciliation to the most directly comparable GAAP financial measures. |
34
In 2016, there were putative securities class action complaints filed, naming us and certain of our current and former officers as defendants and alleging violations of the Securities Exchange Act of 1934, as amended, or the Exchange Act, based on allegedly false or misleading statements related to potential violations of the FCPA, our business, prospects and operations, and the effectiveness of our internal control over financial reporting and our disclosure controls and procedures. Additionally, in 2017 and 2016, putative shareholder derivative complaints were filed, naming us, certain of our current and former directors and certain of our current and former officers as defendants. See the section titled "Part I, Item 3. Legal Proceedings."
In 2017, we incurred $36 million in costs related to the FCPA investigation and related lawsuits in addition to the $27 million we incurred in 2016. We expect to continue to incur expenses related to these matters in 2018.
We finished the year with approximately 260,000 employees, which is a decrease of approximately 200 over the prior year end. Annualized turnover, including both voluntary and involuntary, was approximately 17.9% for the three months ended December 31, 2017. The majority of our turnover occurs in India. As a result, annualized attrition rates in the United States and Europe are below our global attrition rate. In addition, attrition is weighted towards the more junior members of our staff.
During 2018, barring any unforeseen events, we expect the following factors to affect our business and our operating results:
• | Demand from our customers for digital services; |
• | Our customers' dual mandate of simultaneously achieving cost savings while investing in transformation and innovation; |
• | Continued focus by customers on directing technology spending towards cost containment projects, such as application maintenance, infrastructure services and business process services; |
• | Secular changes driven by evolving digital technologies and regulatory changes, including potential regulatory changes with respect to immigration and taxes; |
• | Demand from our healthcare customers may continue to be affected by the uncertainty in the regulatory environment; |
• | Demand from certain banking customers may continue to be negatively affected by their continued focus on optimizing their cost structure and managing their discretionary spending; |
• | Discretionary spending by our retail customers may continue to be affected by weakness in the retail sector; |
• | Legal fees and other expenses related to the internal investigation and related matters as described above; and |
• | Volatility in foreign currency rates. |
In response to this environment, we plan to:
• | Continue to invest in our digital practice areas of focus across industries and geographies; |
• | Continue to invest in our talent base, including through local hiring and re-skilling, and new service offerings, including digital technologies and new delivery models; |
• | Partner with our existing customers to garner an increased portion of our customers’ overall technology spend by providing innovative solutions; |
• | Focus on growing our business in Europe, the Middle East, Asia Pacific and Latin America, where we believe there are opportunities to gain market share; |
• | Increase our strategic customer base across all of our business segments; |
• | Pursue strategic acquisition opportunities that we believe add new technologies, including digital technologies, or platforms that complement our existing services, improve our overall service delivery capabilities, and/or expand our geographic presence; and |
• | Focus on operating discipline in order to appropriately manage our cost structure. |
Business Segments
Our reportable segments are:
• | Financial Services, which consists of our banking and insurance operating segments; |
• | Healthcare, which consists of our healthcare and life sciences operating segments; |
• | Products and Resources (previously referred to as Manufacturing/Retail/Logistics), which consists of our retail and consumer goods, manufacturing and logistics, travel and hospitality, and energy and utilities operating segments; and |
• | Communications, Media and Technology (previously referred to as Other), which includes our communications and media operating segment and our technology operating segment. |
35
Our chief operating decision maker evaluates Cognizant’s performance and allocates resources based on segment revenues and operating profit. Segment operating profit is defined as income from operations before unallocated costs. Generally, operating expenses for each operating segment have similar characteristics and are subject to the same factors, pressures and challenges. However, the economic environment and its effects on industries served by our operating groups may affect revenues and operating expenses to different degrees. Expenses included in segment operating profit consist principally of direct selling and delivery costs as well as a per seat charge for use of the global delivery centers. Certain selling, general and administrative expenses, excess or shortfall of incentive compensation for delivery personnel as compared to target, stock-based compensation expense, costs related to our realignment program, a portion of depreciation and amortization and the impact of the settlements of our cash flow hedges are not allocated to individual segments in internal management reports used by the chief operating decision maker. Accordingly, such expenses are excluded from segment operating profit.
We provide a significant volume of services to many customers in each of our business segments. Therefore, a loss of a significant customer or a few significant customers in a particular segment could materially reduce revenues for that segment. However, no individual customer accounted for sales in excess of 10% of our consolidated revenues during 2017, 2016 or 2015. In addition, the services we provide to our larger customers are often critical to the operations of such customers and we believe that a termination of our services would require an extended transition period with gradually declining revenues.
Results of Operations for the Three Years Ended December 31, 2017
The following table sets forth certain financial data for the three years ended December 31, 2017:
2017 | % of Revenues | 2016 | % of Revenues | 2015 | % of Revenues | Increase/Decrease | ||||||||||||||||||||
2017 | 2016 | |||||||||||||||||||||||||
(Dollars in millions, except per share data) | ||||||||||||||||||||||||||
Revenues | $ | 14,810 | 100.0 | $ | 13,487 | 100.0 | $ | 12,416 | 100.0 | $ | 1,323 | $ | 1,071 | |||||||||||||
Cost of revenues(1) | 9,152 | 61.8 | 8,108 | 60.1 | 7,440 | 59.9 | 1,044 | 668 | ||||||||||||||||||
Selling, general and administrative expenses(1) | 2,769 | 18.7 | 2,731 | 20.2 | 2,509 | 20.2 | 38 | 222 | ||||||||||||||||||
Depreciation and amortization expense | 408 | 2.8 | 359 | 2.7 | 325 | 2.6 | 49 | 34 | ||||||||||||||||||
Income from operations | 2,481 | 16.8 | 2,289 | 17.0 | 2,142 | 17.3 | 192 | 147 | ||||||||||||||||||
Other income (expense), net | 174 | 68 | 22 | 106 | 46 | |||||||||||||||||||||
Income before provision for income taxes | 2,655 | 17.9 | 2,357 | 17.5 | 2,164 | 17.4 | 298 | 193 | ||||||||||||||||||
Provision for income taxes | (1,153 | ) | (805 | ) | (540 | ) | (348 | ) | (265 | ) | ||||||||||||||||
Income from equity method investment | 2 | 1 | — | 1 | 1 | |||||||||||||||||||||
Net income | $ | 1,504 | 10.2 | $ | 1,553 | 11.5 | $ | 1,624 | 13.1 | $ | (49 | ) | $ | (71 | ) | |||||||||||
Diluted earnings per share | $ | 2.53 | $ | 2.55 | $ | 2.65 | $ | (0.02 | ) | $ | (0.10 | ) | ||||||||||||||
Other Financial Information (2) | ||||||||||||||||||||||||||
Non-GAAP income from operations and non-GAAP operating margin | $ | 2,912 | 19.7 | $ | 2,636 | 19.5 | $ | 2,450 | 19.7 | 276 | $ | 186 | ||||||||||||||
Non-GAAP diluted earnings per share | $ | 3.77 | $ | 3.39 | $ | 3.07 | $ | 0.38 | $ | 0.32 | ||||||||||||||||
_____________________
(1) | Exclusive of depreciation and amortization expense. |
(2) | Non-GAAP income from operations, non-GAAP operating margin and non-GAAP diluted earnings per share are not measurements of financial performance prepared in accordance with GAAP. See “Non-GAAP Financial Measures” for more information and a reconciliation to the most directly comparable GAAP financial measure. |
Revenues - Overall. Revenues increased by 9.8% during 2017 as compared to an increase of 8.6% in 2016. The increases in revenues in 2017 and 2016 were primarily attributed to services related to the integration of digital technologies that are reshaping our customers' business and operating models to align with shifts in consumer preferences, increased customer spending on discretionary projects, continued interest in using our global delivery model as a means to reduce overall technology and operations costs and continued penetration in all our geographic markets. Revenues from new customers contributed $208 million and $220 million, representing 15.7% and 20.5% of the year-over-year revenue growth for 2017 and
36
2016, respectively. In 2017, our consulting and technology services revenues increased by 10.9% and represented 58.1% of total 2017 revenues, while our outsourcing services revenues increased by 8.4% and constituted 41.9% of total revenues. In 2016, consulting and technology services revenues increased by 8.6% and represented 57.5% of total 2016 revenues, while our outsourcing services revenues increased by 8.7% and constituted 42.5% of total 2016 revenues.
We increased the number of strategic customers by 28 during the year, bringing the total number of our strategic customers to 357. We define a strategic customer as one offering the potential to generate at least $5 million to $50 million or more in annual revenues at maturity. Revenues from our top customers as a percentage of total revenues were as follows:
For the years ended December 31, | |||||||||
2017 | 2016 | 2015 | |||||||
Top five customers | 8.9 | % | 10.0 | % | 11.0 | % | |||
Top ten customers | 14.9 | % | 16.7 | % | 18.6 | % | |||
As we continue to add new customers and increase our penetration at existing customers, we expect the percentage of revenues from our top five and top ten customers to continue to decline over time.
Revenues - Reportable Segments. Revenues by reportable business segment were as follows:
2017 | 2016 | 2015 | Increase | |||||||||||||||||||||
2017 | 2016 | |||||||||||||||||||||||
$ | % | $ | % | |||||||||||||||||||||
(Dollars in millions) | ||||||||||||||||||||||||
Financial Services | $ | 5,636 | $ | 5,366 | $ | 5,003 | $ | 270 | 5.0 | $ | 363 | 7.3 | ||||||||||||
Healthcare | 4,263 | 3,871 | 3,668 | 392 | 10.1 | 203 | 5.5 | |||||||||||||||||
Products and Resources | 3,040 | 2,660 | 2,344 | 380 | 14.3 | 316 | 13.5 | |||||||||||||||||
Communications, Media and Technology | 1,871 | 1,590 | 1,401 | 281 | 17.7 | 189 | 13.5 | |||||||||||||||||
Total revenues | $ | 14,810 | $ | 13,487 | $ | 12,416 | $ | 1,323 | 9.8 | $ | 1,071 | 8.6 | ||||||||||||
Financial Services
Revenues from our Financial Services segment grew 5.0% in 2017. Growth was stronger among our insurance customers, where revenues increased by $191 million as compared to an increase of $79 million from our banking customers. In this segment, revenues from customers added during 2017 were $56 million and represented 20.7% of the year-over-year revenues increase in this segment. Key areas of focus for our Financial Services customers included the adoption and integration of digital technologies that are reshaping our customers' business and operating models, cost optimization, robotic process automation, cyber security and vendor consolidation. Demand from certain banking customers may continue to be negatively affected by their continued focus on optimizing their cost structure and managing their discretionary spending.
Revenues from our Financial Services segment grew 7.3% in 2016. In 2016, growth was stronger among our insurance customers, where revenues increased by $202 million as compared to an increase of $161 million from our banking customers. In 2016, revenues from customers added during that year was $64 million and represented 17.6% of the year-over-year revenues increase in this segment. In 2016, demand from certain of our banking customers was negatively affected by the macroeconomic conditions affecting the industry, including a sustained low interest rate environment and the weakening of the British pound due to the results of the June 2016 United Kingdom referendum to exit the European Union, or Brexit Referendum.
Healthcare
Revenues from our Healthcare segment grew 10.1% in 2017. Within this segment, revenues increased by $279 million from our healthcare customers as compared to an increase of $113 million among our life sciences customers. Revenues from customers added during 2017 were $40 million and represented 10.2% of the year-over-year revenue increase in this segment. The increase in revenues from our life sciences customers was driven by a growing demand for a broader range of services, including business process services, advanced data analytics and solutions that span multiple service lines while leveraging cloud technologies and platforms. The demand for our services among healthcare customers continues to be affected by uncertainty in the regulatory environment. We believe that in the long term the healthcare industry continues to present a significant growth opportunity due to factors that are transforming the industry, including the changing regulatory environment, increasing focus on medical costs, and the consumerization of healthcare.
Revenues from our Healthcare segment grew 5.5% in 2016. In 2016, our life sciences and healthcare customers contributed $139 million and $64 million, respectively, to the year-over-year revenue growth. In 2016, revenues from
37
customers added during that year were $50 million and represented 24.6% of the year-over-year revenues increase in this segment. The 2016 increase in revenues from our life sciences customers was driven by a growing demand for a broader range of services, including business process services, advanced data analytics and solutions that span multiple service lines while leveraging cloud technologies and platforms.
Products and Resources (previously referred to as Manufacturing/Retail/Logistics)
Revenues from our Products and Resources segment grew 14.3% in 2017. Revenue growth in this segment was strongest among our energy and utilities customers and manufacturing and logistic customers, where revenues increased by a combined $326 million, including revenues from new strategic customers acquired in the fourth quarter of 2016. Revenues from our retail and consumer goods customers and travel and hospitality customers increased by a combined $54 million. Revenues from customers added during 2017 were $85 million and represented 22.4% of the year-over-year revenues increase in this segment. Demand within this segment continues to be driven by increased adoption of digital technologies that are reshaping our customers' business and operating models, as well as growing demand for analytics, supply chain consulting, implementation initiatives, smart products, transformation of business models, internet of things and omni channel commerce implementation and integration services. Discretionary spending by our retail customers has been and may continue to be affected by weakness in the retail sector.
Revenues from our Products and Resources segment grew 13.5% in 2016. During 2016, our energy and utilities customers and manufacturing and logistic customers contributed $186 million to the year-over-year growth as compared to $130 million for our retail and consumer goods customers and travel and hospitality customers. In 2016, revenues from customers added during that year were $71 million and represented 22.5% of the year over year revenue increase in this segment. Demand within this segment in 2016 was primarily driven by the same factors that contributed to the 2017 revenue growth.
Communications, Media and Technology (previously referred to as Other)
Revenues from our Communications, Media and Technology segment grew 17.7% in 2017. In 2017, revenue growth was $154 million among our communications and media customers and $127 million among our technology customers. Revenues from customers added during 2017 were $27 million and represented 9.6% of the year-over-year revenues increase in this segment. Growth within this segment was driven by the increased adoption of digital technologies, digital content operations, services to help our customers balance rationalizing costs while creating a differentiated user experience and an expanded range of services, such as business process services.
Revenues from our Communications, Media and Technology segment grew 13.5% in 2016. In 2016, growth within this segment was driven by the increased adoption of digital technologies, platform engineering for cloud solutions and an expanded range of services, such as business process services. Revenue growth in this segment was strong among our communications and media customers, where revenues increased by $99 million, and our technology customers, where revenues increased by $90 million. Revenues from customers added during 2016 were $35 million and represented 18.5% of the year-over-year revenues increase in this segment.
Revenues - Geographic Locations. Revenues by geographic market, as determined by customer location, were as follows:
2017 | 2016 | 2015 | Increase (Decrease) | |||||||||||||||||||||||
2017 | 2016 | |||||||||||||||||||||||||
$ | % | $ | % | |||||||||||||||||||||||
(Dollars in millions) | ||||||||||||||||||||||||||
North America | $ | 11,450 | $ | 10,546 | $ | 9,759 | $ | 904 | 8.6 | $ | 787 | 8.1 | ||||||||||||||
United Kingdom | 1,150 | 1,176 | 1,188 | (26 | ) | (2.2 | ) | (12 | ) | (1.0 | ) | |||||||||||||||
Rest of Europe | 1,248 | 969 | 820 | 279 | 28.8 | 149 | 18.2 | |||||||||||||||||||
Europe - Total | 2,398 | 2,145 | 2,008 | 253 | 11.8 | 137 | 6.8 | |||||||||||||||||||
Rest of World | 962 | 796 | 649 | 166 | 20.9 | 147 | 22.7 | |||||||||||||||||||
Total revenues | $ | 14,810 | $ | 13,487 | $ | 12,416 | $ | 1,323 | 9.8 | $ | 1,071 | 8.6 | ||||||||||||||
North America continues to be our largest market, representing 77.3% of total 2017 revenues and 68.3% of total revenue growth in 2017. The increase in revenues in 2017 in this region was primarily attributed to services related to the integration of digital technologies that are reshaping our customers' business and operating models to align with shifts in consumer preferences, increased customer spending on discretionary projects and continued interest in using our global delivery model as a means to reduce overall technology and operations costs. In 2017, revenue growth in Europe and Rest of World markets was driven by an increase in demand for an expanded range of services, such as business process services and customer adoption
38
and integration of digital technologies that are reshaping our customers' business and operating models. Revenues from our customers in Europe grew 11.8% after a negative currency impact of 1.2%. Specifically, revenues from our Rest of Europe customers, including revenues from our newly acquired strategic customers, increased 28.8% inclusive of a positive currency impact of 2.0%, while within the United Kingdom we experienced a decrease in revenues of 2.2% after a negative currency impact of 3.8%. Revenue growth in the United Kingdom was negatively affected by weakness in the banking sector in that country. Revenues from our Rest of World customers grew 20.9%, primarily driven by the Australia and India markets. We believe that Europe, the Middle East, Asia Pacific and Latin America will continue to be areas of significant investment for us as we see these regions as long term growth opportunities.
In 2016, North America was also our largest market, representing 78.2% of total revenues and 73.5% of total revenue growth. Revenue growth in Europe and Rest of World markets was driven by an increase in demand for an expanded range of services, such as business process services and customer adoption and integration of digital technologies that are reshaping our customers' business and operating models. Revenues from our customers in Europe grew 6.8%, after a negative currency impact of 6.5%. Specifically, within the United Kingdom, we experienced a decline in revenues of 1.0%, after a negative currency impact of 10.0% while revenues from our Rest of Europe customers increased 18.2% after a negative currency impact of 1.4%. Revenue growth from our United Kingdom and Rest of Europe customers was negatively affected by macroeconomic conditions, including the weakening of the British pound and uncertainty in the markets due to the result of the Brexit Referendum. Revenues from our Rest of World customers grew 22.7% after a negative currency impact of 2.5% and were primarily driven by the India, Singapore, Australia, Japan and Hong Kong markets.
Cost of Revenues (Exclusive of Depreciation and Amortization Expense). Our cost of revenues consists primarily of salaries, incentive-based compensation, stock-based compensation expense, employee benefits, project-related immigration and travel expenses for technical personnel and subcontracting costs related to revenues. Our cost of revenues increased by 12.9% during 2017 as compared to an increase of 9.0% during 2016. In 2017, the increase was due primarily to an increase in compensation and benefits costs of $953 million and increases in certain professional service costs. In 2016, the increase was due primarily to an increase in compensation and benefits costs (partially offset by the impact of lower incentive-based compensation costs) of $508 million and increases in certain professional service costs, partially offset by the favorable impact of the depreciation of the Indian rupee against the U.S. dollar and realized gains on settlement of cash flow hedges in 2016 as compared to losses in 2015.
Selling, General and Administrative Expenses. Selling, general and administrative expenses consist primarily of salaries, incentive-based compensation, stock-based compensation expense, employee benefits, immigration, travel, marketing, communications, management, finance, administrative and occupancy costs. Selling, general and administrative expenses, including depreciation and amortization, increased by 2.8% during 2017 as compared to an increase of 9.0% during 2016. Selling, general and administrative expenses, including depreciation and amortization, decreased as a percentage of revenues to 21.5% in 2017 as compared to 22.9% in 2016 and 22.8% in 2015. In 2017, the decrease as a percentage of revenues was due primarily to a decrease in compensation and benefit costs and a decrease in immigration expense, partially offset by increases in certain operating and professional service costs and increases in depreciation and amortization due to recent acquisitions. In 2016, the increase as a percentage of revenues was due primarily to an increase in compensation and benefit costs (excluding incentive-based compensation), certain professional service costs and increases in depreciation and amortization due to recent acquisitions, partially offset by the impact of lower incentive-based compensation costs, the favorable impact of the depreciation of the Indian rupee versus the U.S. dollar and realized gains on the settlement of cash flow hedges in 2016 as compared to losses in 2015. In 2017 and 2016, we incurred $36 million and $27 million, respectively, in costs related to the FCPA investigation and related lawsuits.
Income from Operations and Operating Margin - Overall. Income from operations increased 8.4% in 2017 as compared to an increase of 6.9% in 2016. Our operating margin decreased to 16.8% of revenues in 2017 from 17.0% of revenues in 2016, due to increases in compensation and benefit costs, the impact of realignment charges and an increase in depreciation expense, partially offset by efficiencies of leveraging our cost structure over a larger organization and a reduction in immigration costs. In 2016, operating margin decreased to 17.0% of revenues from 17.3% of revenues in 2015, due to increases in compensation and benefit costs (excluding incentive-based compensation), increases in certain professional service costs and increases in depreciation and amortization due to recent acquisitions, partially offset by the impact of lower incentive-based compensation in 2016, the depreciation of the Indian rupee against the U.S. dollar, and realized gains on settlement of cash flow hedges in 2016 as compared to losses in 2015. Excluding the impact of applicable designated cash flow hedges, the appreciation of the Indian rupee against the U.S. dollar negatively impacted our operating margin by approximately 58 basis points or 0.58 percentage points in 2017, while in 2016 the depreciation of the Indian rupee against the U.S. dollar positively impacted our operating margin by approximately 90 basis points or 0.90 percentage points. Each additional 1.0% change in exchange rate between the Indian rupee and the U.S. dollar will have the effect of moving our operating margin by approximately 19 basis points or 0.19 percentage points.
39
We have entered into foreign exchange forward contracts to hedge certain Indian rupee denominated payments in India. These hedges are intended to mitigate the volatility of the changes in the exchange rate between the U.S. dollar and the Indian rupee. During the year ended December 31, 2017, the settlement of certain cash flow hedges positively impacted our operating margin by approximately 87 basis points or 0.87 percentage points as compared to a positive impact of approximately 13 basis points or 0.13 percentage points in 2016 and a negative impact of approximately 57 basis points or 0.57 percentage points in 2015.
For the years ended December 31, 2017, 2016 and 2015, our non-GAAP operating margins were 19.7%4, 19.5%4 and 19.7%4, respectively. As set forth in the “Non-GAAP Financial Measures” section below, our non-GAAP operating margin excludes stock-based compensation expense, acquisition-related charges and, in 2017, realignment charges.
Our most significant costs are the salaries and related benefits for our programming staff and other professionals. In certain regions, competition for professionals with advanced technical skills necessary to perform our services has caused wages to increase at a rate greater than the general rate of inflation. As with other service providers in our industry, we must adequately anticipate wage increases, particularly on our fixed-price and transaction- or volume-based priced contracts. Historically, we have experienced increases in compensation and benefit costs in India; however, this has not had a material impact on our results of operations as we have been able to absorb such cost increases through cost management strategies, such as managing discretionary costs, the mix of professional staff and utilization levels, and achieving other operating efficiencies. There can be no assurance that we will be able to offset such cost increases in the future.
Segment Operating Profit. Segment operating profits were as follows:
Increase / Decrease | |||||||||||||||||||||||||
2017 | 2016 | ||||||||||||||||||||||||
2017 | 2016 | 2015 | $ | % | $ | % | |||||||||||||||||||
(Dollars in millions) | |||||||||||||||||||||||||
Financial Services | $ | 1,636 | $ | 1,707 | $ | 1,642 | $ | (71 | ) | (4.2 | ) | $ | 65 | 4.0 | |||||||||||
Healthcare | 1,304 | 1,153 | 1,200 | 151 | 13.1 | (47 | ) | (3.9 | ) | ||||||||||||||||
Products and Resources | 868 | 851 | 803 | 17 | 2.0 | 48 | 6.0 | ||||||||||||||||||
Communications, Media and Technology | 565 | 488 | 453 | 77 | 15.8 | 35 | 7.7 | ||||||||||||||||||
Total segment operating profit | 4,373 | 4,199 | 4,098 | 174 | 4.1 | 101 | 2.5 | ||||||||||||||||||
Less: unallocated costs | 1,892 | 1,910 | 1,956 | (18 | ) | (0.9 | ) | (46 | ) | (2.4 | ) | ||||||||||||||
Income from operations | $ | 2,481 | $ | 2,289 | $ | 2,142 | $ | 192 | 8.4 | $ | 147 | 6.9 | |||||||||||||
In 2017, in our Financial Services, Products and Resources, and Communications, Media and Technology business segments, operating profits decreased as a percentage of revenues due to increases in compensation and benefits costs, investments to accelerate our shift to digital, including re-skilling of service delivery personnel, and the negative impact of the appreciation of various currencies, including the Indian rupee, against the U.S. dollar. Our Financial Services segment’s operating profit was negatively impacted by weakness in the banking sector as certain customers focused on optimizing their cost structure and managing their discretionary spending. The segment operating profit of our Healthcare business segment increased as a percentage of revenues, benefiting from lower losses on certain fixed-price contracts with customers in 2017.
In 2016, across all our segments, segment operating profit decreased as a percentage of revenues due to increases in compensation and benefit costs (excluding incentive-based compensation), increases in certain professional service costs and continued investments to grow our business, partially offset by the favorable impact of the depreciation of the Indian rupee versus the U.S. dollar. The operating profit in our Healthcare segment was further impacted by a loss on a fixed-price contract with a customer of $27 million. In 2016, the unallocated costs decreased when compared to 2015 primarily due to lower incentive-based compensation accrual rates in 2016 compared to 2015.
___________________
4 | Non-GAAP operating margin is not a measurement of financial performance prepared in accordance with GAAP. See “Non-GAAP Financial Measures” for more information and a reconciliation to the most directly comparable GAAP financial measure. |
40
Other Income (Expense), Net. Total other income (expense), net consists primarily of foreign currency exchange gains and (losses), interest income and interest expense. The following table sets forth total other income (expense), net for the years ended December 31:
Increase / Decrease | |||||||||||||||||||
2017 | 2016 | 2015 | 2017 | 2016 | |||||||||||||||
(in millions) | |||||||||||||||||||
Foreign currency exchange gains (losses) | $ | 90 | $ | (27 | ) | $ | (43 | ) | $ | 117 | $ | 16 | |||||||
(Losses) on foreign exchange forward contracts not designated as hedging instruments | (23 | ) | (3 | ) | — | (20 | ) | (3 | ) | ||||||||||
Foreign currency exchange gains (losses), net | 67 | (30 | ) | (43 | ) | 97 | 13 | ||||||||||||
Interest income | 133 | 115 | 84 | 18 | 31 | ||||||||||||||
Interest expense | (23 | ) | (19 | ) | (18 | ) | (4 | ) | (1 | ) | |||||||||
Other, net | (3 | ) | 2 | (1 | ) | (5 | ) | 3 | |||||||||||
Total other income (expense), net | $ | 174 | $ | 68 | $ | 22 | $ | 106 | $ | 46 | |||||||||
The foreign currency exchange gains (losses) in all the years presented were primarily attributable to the remeasurement of the Indian rupee denominated net monetary assets and liabilities in our U.S. dollar functional currency India subsidiaries as
well as the remeasurement of other net monetary assets denominated in currencies other than the functional currencies of our subsidiaries. The losses on foreign exchange forward contracts not designated as hedging instruments relate to the realized and unrealized gains and losses on foreign exchange forward contracts entered into primarily to offset foreign currency exposure to the Indian rupee and other non-U.S. dollar denominated net monetary assets and liabilities. As of December 31, 2017, the notional value of our undesignated hedges was $255 million. The increases in interest income in 2017 and 2016 were primarily attributed to increases in average invested balances.
Provision for Income Taxes. The provision for income taxes was $1,153 million in 2017, $805 million in 2016 and $540 million in 2015. The effective income tax rate increased to 43.4% in 2017 from 34.2% in 2016 and 25.0% in 2015. Our 2017 effective income tax rate included a negative impact of 23.2% of pre-tax earnings due to the Tax Reform Act. Our 2016 effective income tax rate included a negative impact of 10.1% of pre-tax earnings due to the one-time tax adjustment relating to the India Cash Remittance.
For the years 2018 through 2020, we expect our effective income tax rate to be in the range of 24% to 26%, excluding the impact of discrete items, if any. Our projected effective income tax rates incorporate the anticipated impact of the Tax Reform Act, assumptions regarding our future earnings and their geographic mix, management’s assessment of tax law in the various jurisdictions in which we operate and other risks and uncertainties. As such, our effective income tax rate projections are subject to change, possibly materially, due to changes in underlying estimates and assumptions, changes in tax law and guidance that may be issued, actions the Company may take as a result of these developments, as well as other factors that may be beyond our control.
In May 2016, India enacted the Finance Bill 2016 that, among other things, expanded the applicability of India’s buyback distribution tax to certain share buyback transactions occurring after June 1, 2016. In mid-May, prior to the June 1, 2016 effective date of the enactment, our principal operating subsidiary in India repurchased shares from its shareholders, which are non-Indian Cognizant entities, valued at $2.8 billion. This transaction, or the India Cash Remittance, was undertaken pursuant to a plan approved by the High Court of Madras and simplified the shareholding structure of our principal operating subsidiary in India. Pursuant to the transaction, our principal Indian operating subsidiary repurchased approximately $1.2 billion of the total $2.8 billion of shares from its U.S. shareholders, resulting in incremental tax expense, while the remaining $1.6 billion was repurchased from its shareholder outside the United States. Net of taxes, the transaction resulted in a remittance of cash to the United States in the amount of $1.0 billion. As a result of this transaction, we incurred an incremental 2016 income tax expense of $238 million.
Net Income. Net income was $1,504 million in 2017, $1,553 million in 2016 and $1,624 million in 2015. Net income as a percentage of revenues decreased to 10.2% in 2017 from 11.5% in 2016 primarily due to the incremental income tax expense related to the Tax Reform Act in 2017. In 2016, net income as a percentage of revenues decreased to 11.5% from 13.1% in 2015 primarily due to the incremental income tax expense related to the India Cash Remittance.
41
Non-GAAP Financial Measures
Portions of our disclosure, including the following table, include non-GAAP income from operations, non-GAAP operating margin, and non-GAAP diluted earnings per share. These non-GAAP financial measures are not based on any comprehensive set of accounting rules or principles and should not be considered a substitute for, or superior to, financial measures calculated in accordance with GAAP, and may be different from non-GAAP measures used by other companies. In addition, these non-GAAP measures should be read in conjunction with our financial statements prepared in accordance with GAAP. The reconciliations of Cognizant’s non-GAAP financial measures to the corresponding GAAP measures should be carefully evaluated.
Our non-GAAP income from operations and non-GAAP operating margin exclude stock-based compensation expense, acquisition-related charges and, in 2017, realignment charges. Our definition of non-GAAP diluted earnings per share excludes net non-operating foreign currency exchange gains or losses, the effect of recognition in the first quarter of 2017 of an income tax benefit previously unrecognized in our consolidated financial statements related to a specific uncertain tax position, the impact of the one-time incremental income tax expense related to the Tax Reform Act in 2017 and the impact of a one-time incremental income tax expense related to the India Cash Remittance in 2016, in addition to excluding stock-based compensation expense, acquisition-related charges and, in 2017, realignment charges. Our non-GAAP diluted earnings per share is additionally adjusted for the income tax impact of the above items, as applicable. The income tax impact of each item is calculated by applying the statutory rate and local tax regulations in the jurisdiction in which the item was incurred.
We believe providing investors with an operating view consistent with how we manage the Company provides enhanced transparency into the operating results of the Company. For our internal management reporting and budgeting purposes, we use non-GAAP financial measures for financial and operational decision making, to evaluate period-to-period comparisons, to determine portions of the compensation for our executive officers and for making comparisons of our operating results to those of our competitors. Therefore, it is our belief that the use of non-GAAP financial measures excluding these costs provides a meaningful supplemental measure for investors to evaluate our financial performance. Accordingly, we believe that the presentation of non-GAAP income from operations, non-GAAP operating margin and non-GAAP diluted earnings per share, when read in conjunction with our reported GAAP results, can provide useful supplemental information to our management and investors regarding financial and business trends relating to our financial condition and results of operations.
A limitation of using non-GAAP financial measures versus financial measures calculated in accordance with GAAP is that non-GAAP measures do not reflect all of the amounts associated with our operating results as determined in accordance with GAAP and exclude costs that are recurring, namely stock-based compensation expense, certain acquisition-related charges, and net non-operating foreign currency exchange gains or losses. In addition, other companies may calculate non-GAAP financial measures differently than us, thereby limiting the usefulness of these non-GAAP financial measures as a comparative tool. We compensate for these limitations by providing specific information regarding the GAAP amounts excluded from non-GAAP income from operations, non-GAAP operating margin and non-GAAP diluted earnings per share to allow investors to evaluate such non-GAAP financial measures.
42
The following table presents a reconciliation of each non-GAAP financial measure to the most comparable GAAP measure for the years ended December 31:
2017 | % of Revenues | 2016 | % of Revenues | 2015 | % of Revenues | ||||||||||||
(Dollars in millions, except per share data) | |||||||||||||||||
GAAP income from operations and operating margin | $ | 2,481 | 16.8 | $ | 2,289 | 17.0 | $ | 2,142 | 17.3 | ||||||||
Add: Stock-based compensation expense (1) | 221 | 1.5 | 217 | 1.6 | 192 | 1.5 | |||||||||||
Add: Acquisition-related charges (2) | 138 | 0.9 | 130 | 0.9 | 116 | 0.9 | |||||||||||
Add: Realignment charges (3) | 72 | 0.5 | — | — | — | — | |||||||||||
Non-GAAP income from operations and non-GAAP operating margin | $ | 2,912 | 19.7 | $ | 2,636 | 19.5 | $ | 2,450 | 19.7 | ||||||||
GAAP diluted earnings per share | $ | 2.53 | $ | 2.55 | $ | 2.65 | |||||||||||
Effect of above operating adjustments, pre-tax | 0.72 | 0.57 | 0.50 | ||||||||||||||
Effect of non-operating foreign currency exchange (gains) losses, pre-tax (4) | (0.12 | ) | 0.04 | 0.07 | |||||||||||||
Tax effect of non-GAAP adjustments to pre-tax income (5) | (0.31 | ) | (0.16 | ) | (0.15 | ) | |||||||||||
Effect of recognition of income tax benefit related to an uncertain tax position (6) | (0.09 | ) | — | — | |||||||||||||
Effect of incremental income tax expense related to the Tax Reform Act (7) | 1.04 | — | — | ||||||||||||||
Effect of incremental income tax expense related to the India Cash Remittance (8) | — | 0.39 | — | ||||||||||||||
Non-GAAP diluted earnings per share | $ | 3.77 | $ | 3.39 | $ | 3.07 | |||||||||||
_____________________
(1) | Stock-based compensation expense reported in: |
For the years ended December 31, | |||||||||||
2017 | 2016 | 2015 | |||||||||
Cost of revenues | $ | 55 | $ | 53 | $ | 39 | |||||
Selling, general and administrative expenses | 166 | 164 | 153 | ||||||||
(2) | Acquisition-related charges include, when applicable, amortization of purchased intangible assets included in the depreciation and amortization expense line on our consolidated statements of operations, external deal costs, acquisition-related retention bonuses, integration costs, changes in the fair value of contingent consideration liabilities, charges for impairment of acquired intangible assets and other acquisition-related costs. |
(3) | Realignment charges include severance costs, including costs associated with the VSP, lease termination costs, and advisory fees related to non-routine shareholder matters and to the development of our realignment and return of capital programs, as applicable. The total costs related to the realignment are reported in "Selling, general and administrative expenses" in our consolidated statements of operations. |
(4) | Non-operating foreign currency exchange gains (losses) are inclusive of gains and losses on related foreign exchange forward contracts not designated as hedging instruments for accounting purposes, reported in "Foreign currency exchange gains (losses), net" in our consolidated statements of operations. |
(5) | Presented below are the tax impacts of each of our non-GAAP adjustments to pre-tax income: |
For the years ended December 31, | |||||||||||
2017 | 2016 | 2015 | |||||||||
Non-GAAP income tax benefit (expense) related to: | |||||||||||
Stock-based compensation expense | $ | 101 | $ | 49 | $ | 46 | |||||
Acquisition-related charges | 48 | 46 | 43 | ||||||||
Realignment charges | 25 | — | — | ||||||||
Foreign currency exchange gains (losses) | 10 | 5 | 2 | ||||||||
The effective income tax rate related to each of our non-GAAP adjustments varies depending on the jurisdictions in which such income and expenses are generated and the statutory rates applicable in those jurisdictions.
43
(6) | During the three months ended March 31, 2017, we recognized an income tax benefit previously unrecognized in our consolidated financial statements related to a specific uncertain tax position of $55 million. The recognition of the benefit in the first quarter of 2017 was based on management’s reassessment regarding whether this unrecognized tax benefit met the more-likely-than-not threshold in light of the lapse in the statute of limitations as to a portion of such benefit. |
(7) | In connection with the enactment of the Tax Reform Act, we recorded a one-time provisional net income tax expense of $617 million comprised of: (i) the one-time transitional tax expense on accumulated undistributed earnings of foreign subsidiaries of $635 million and (ii) foreign and U.S. state income tax expense that will be applicable upon repatriation of the accumulated undistributed earnings of our foreign subsidiaries, other than our Indian subsidiaries, of $53 million, partially offset by (iii) an income tax benefit of $71 million resulting from the revaluation of U.S. net deferred income tax liabilities to the new lower U.S. income tax rate. The one-time incremental income tax expense reflects certain assumptions based upon our interpretation of the Tax Reform Act as of January 18, 2018 and may change, possibly materially, as we receive additional clarification and guidance and as the interpretation of the Tax Reform Act evolves over time. |
(8) | In May 2016, our principal operating subsidiary in India repurchased shares from its shareholders, which are non-Indian Cognizant entities, valued at $2.8 billion. As a result of this transaction, in 2016 we incurred an incremental income tax expense of $238 million. |
Liquidity and Capital Resources
Our cash generated from operations has historically been our primary source of liquidity to fund operations and investments to grow our business. In addition, as of December 31, 2017, we had cash, cash equivalents and short-term investments of $5,056 million and additional available capacity under our revolving credit facility of approximately $675 million. The following table provides a summary of our cash flows for the three years ended December 31:
Increase / Decrease | ||||||||||||||||||||
2017 | 2016 | 2015 | 2017 | 2016 | ||||||||||||||||
(in millions) | ||||||||||||||||||||
Net cash from operating activities | $ | 2,407 | $ | 1,645 | $ | 2,187 | $ | 762 | $ | (542 | ) | |||||||||
Net cash (used in) investing activities | (582 | ) | (963 | ) | (1,371 | ) | 381 | 408 | ||||||||||||
Net cash (used in) financing activities | (1,985 | ) | (743 | ) | (682 | ) | (1,242 | ) | (61 | ) | ||||||||||
Operating activities. The increase in cash generated from operating activities for 2017 compared to 2016 was primarily attributable to the increase in pre-tax earnings. The decrease in cash generated from operating activities for 2016 compared to 2015 was primarily attributed to the decrease in net income, which includes the impact of incremental taxes paid in connection with the India Cash Remittance, and higher incentive based compensation payments in 2016 as compared to 2015. Trade accounts receivable increased to $2,865 million at December 31, 2017 as compared to $2,556 million at December 31, 2016 and $2,253 million at December 31, 2015. Unbilled accounts receivable were $357 million at December 31, 2017, $349 million at December 31, 2016 and $369 million at December 31, 2015. The increase in trade accounts receivable during 2017 was primarily due to increased revenues.
We monitor turnover, aging and the collection of accounts receivable by customer. Our days sales outstanding calculation includes billed and unbilled accounts receivable, net of allowance for doubtful accounts, reduced by the uncollected portion of our deferred revenue. Our days sales outstanding was 71 days as of December 31, 2017, 72 days as of December 31, 2016 and 70 days as of December 31, 2015.
Investing activities. The decrease in net cash used in investing activities in 2017 compared to 2016 is due to lower net purchases of investments and lower payments for acquisitions. In 2016, the decrease in net cash used when compared to 2015 was primarily due to lower net purchases of investments, partially offset by higher payments for acquisitions and equity and cost method investments.
Financing activities. The increase in cash used in financing activities in 2017 compared to 2016 is primarily attributable to repurchases of common stock under the ASR and dividend payments, partially offset by lower net repayments of debt. In 2016, the increase in cash used when compared to 2015 was primarily attributable to higher net repayments of debt and an increase in stock repurchases.
In 2014, we entered into a credit agreement with a commercial bank syndicate, or the Credit Agreement, providing for a $1,000 million unsecured term loan and a $750 million revolving credit facility. The term loan was used to pay a portion of
44
the cash consideration in connection with our 2014 acquisition of TZ US Parent, Inc., or TriZetto. The revolving credit facility is available for general corporate purposes. The term loan and the revolving credit facility both mature in November 2019. As of December 31, 2017, we had $800 million outstanding under the term loan and $75 million in outstanding notes under the revolving credit facility.
The Credit Agreement contains certain negative covenants, including limitations on liens, mergers, consolidations and acquisitions, subsidiary indebtedness and affiliate transactions, as well as certain affirmative covenants. In addition, the Credit Agreement requires us to maintain a debt to total stockholders' equity ratio not in excess of 0.40 to 1.00. As of December 31, 2017, we are in compliance with our debt covenants and have provided a quarterly certification to our lenders to that effect. We believe that we currently meet all conditions set forth in the Credit Agreement to borrow thereunder, and we are not aware of any conditions that would prevent us from borrowing part or all of the remaining available capacity under the revolving credit facility as of December 31, 2017 and through the date of this filing.
In February 2017 we announced a plan to return $3.4 billion to stockholders by the end of 2018 through a combination of stock repurchases and cash dividends. As part of this plan, in 2017 we expended $1.8 billion to repurchase our Class A common stock under the ASR and paid cash dividends totaling $265 million. The payments related to the ASR were funded with cash on hand in the U.S. and borrowings under the revolving credit facility. We expect to fund the remaining portion of the capital return plan from cash from operations and from available capacity under our revolving credit facility. Stock repurchases may be made from time to time through open-market purchases, through the use of Rule 10b5-1 plans and/or by other means. We are currently evaluating the longer term impact the Tax Reform Act may have on our overall capital return program. As a first step, in February 2018 our Board of Directors approved an increase to our quarterly dividend to $0.20 per share.
Our Board of Directors reviews our capital return plan on an ongoing basis with consideration given to our financial performance, economic outlook, regulatory changes and any other relevant factors. The Board of Directors’ determinations regarding future share repurchases and dividends will include evaluating the longer term impact of the Tax Reform Act, as well as a variety of other factors, including our net income, cash flow generated from operations or other sources, liquidity position and potential alternative uses of cash, such as acquisitions, as well as economic conditions and expected future financial results. As these factors may change over time, the amount of stock repurchase activity and actual amount of dividends declared, if any, during any particular period cannot be predicted and may fluctuate from time to time. There can be no guarantee that we will achieve the objective of our announced capital return plan in the amounts or within the expected time frame that we have indicated, or at all.
As a result of the enactment of the Tax Reform Act, our historical and future foreign earnings are no longer subject to U.S. federal income tax upon repatriation beyond the one-time transition tax. We therefore reevaluated our assertion that our non-U.S. earnings would be indefinitely reinvested and concluded that our Indian earnings will continue to be indefinitely reinvested while historical accumulated undistributed earnings of our foreign subsidiaries as of December 31, 2017, other than our Indian subsidiaries, are available for repatriation to the United States.
We use various strategies in an effort to ensure that our worldwide cash is available in the locations in which it is needed. As part of our ongoing liquidity assessments, we regularly monitor the mix of our domestic and international cash flows and cash balances. As of December 31, 2017, $4,858 million of our cash, cash equivalents and short-term investments were held outside the United States, of which $1,397 million was held in India. We are currently evaluating what portion of the non-U.S. cash, cash equivalents and short-term investments held outside India is needed locally to execute our strategic plans and what amount is available for repatriation back to the United States.
Our current plans do not demonstrate the need to repatriate our historical undistributed earnings of our India subsidiaries to fund our liquidity needs outside of India. In reaching this conclusion, we considered our global capital needs, the available sources of liquidity globally and our growth plans in India. However, future events may occur, such as material changes in cash estimates, discretionary transactions, including corporate restructurings, and changes in applicable laws, which may lead us to repatriate Indian earnings. If we were to change our assertion that our accumulated undistributed Indian earnings are indefinitely reinvested, we would expect, based on our current interpretation of Indian tax law, to accrue additional tax expense at a rate of approximately 21% of cash available for distribution, which could have a material adverse effect on our future effective income tax rate. This estimate is subject to change based on tax legislative developments in India and other jurisdictions as well as judicial and interpretive developments of applicable tax laws.
We expect our operating cash flow, cash and investment balances, and available capacity under our revolving credit facility to be sufficient to meet our operating requirements for the next twelve months. We expect to fund the one-time transition tax of $635 million, which is payable over eight years, from cash generated from operations and the repatriation of a portion of our historical non-U.S. earnings that are available for distribution to the United States. Our ability to expand and
45
grow our business in accordance with current plans, to make acquisitions and form joint ventures, to meet our long-term capital requirements and to execute our announced capital return plan beyond a twelve month period will depend on many factors, including the rate, if any, at which our cash flow increases, our ability and willingness to accomplish acquisitions and joint ventures with capital stock and the availability of public and private debt and equity financing. We cannot be certain that additional financing, if required, will be available on terms and conditions acceptable to us, if at all.
Commitments and Contingencies
Commitments
As of December 31, 2017, we had the following obligations and commitments to make future payments under contractual obligations and commercial commitments:
Payments due by period | ||||||||||||||||||||
Total | Less than 1 year | 1-3 years | 3-5 years | More than 5 years | ||||||||||||||||
(in millions) | ||||||||||||||||||||
Long-term debt obligations(1) | $ | 800 | $ | 100 | $ | 700 | $ | — | $ | — | ||||||||||
Interest on long-term debt(2) | 37 | 20 | 17 | — | — | |||||||||||||||
Capital lease obligations | 51 | 9 | 11 | 8 | 23 | |||||||||||||||
Operating lease obligations | 943 | 188 | 334 | 211 | 210 | |||||||||||||||
Other purchase commitments(3) | 248 | 151 | 96 | 1 | — | |||||||||||||||
Tax Reform Act transition tax(4) | 635 | 51 | 101 | 102 | 381 | |||||||||||||||
Total | $ | 2,714 | $ | 519 | $ | 1,259 | $ | 322 | $ | 614 | ||||||||||
___________
(1) | Consists of scheduled repayments of our term loan. |
(2) | Interest on the term loan was calculated at interest rates in effect as of December 31, 2017. |
(3) | Other purchase commitments include, among other things, communications and information technology obligations, as well as other obligations in the ordinary course of business that we cannot cancel or where we would be required to pay a termination fee in the event of cancellation. |
(4) | The estimated Tax Reform Act transition tax on undistributed foreign earnings is payable over eight years. See Note 10 to our consolidated financial statements. |
As of December 31, 2017, we had $97 million of unrecognized tax benefits. This represents the tax benefits associated with certain tax positions on our domestic and international tax returns that have not been recognized on our financial statements due to uncertainty regarding their resolution. The resolution of these income tax positions with the relevant taxing authorities is at various stages and therefore we are unable to make a reliable estimate of the eventual cash flows by period that may be required to settle these matters.
As announced in February 2018, we intend to set up and provide $100 million of initial funding to the Cognizant U.S. Foundation, which will focus on science, technology, engineering and math, (or collectively, STEM), education in the United States.
Contingencies
We are involved in various claims and legal actions arising in the ordinary course of business. We accrue a liability when a loss is considered probable and the amount can be reasonably estimated. When a material loss contingency is reasonably possible but not probable, we do not record a liability, but instead disclose the nature and the amount of the claim, and an estimate of the loss or range of loss, if such an estimate can be made. Legal fees are expensed as incurred. In the opinion of management, the outcome of any existing claims and legal or regulatory proceedings, other than the specific matters described below, if decided adversely, is not expected to have a material adverse effect on our business, financial condition, results of operations and cash flows.
As previously disclosed, the Company has been conducting an internal investigation focused on whether certain payments relating to Company-owned facilities in India were made improperly and in possible violation of the FCPA and other applicable laws. The investigation is also examining various other payments made in small amounts in India that may not have complied with Company policy or applicable law. In September 2016, we voluntarily notified the DOJ and SEC and are cooperating fully
46
with both agencies. The investigation is being conducted under the oversight of the Audit Committee, with the assistance of outside counsel.
In 2016, there were putative securities class action complaints filed, naming us and certain of our current and former officers as defendants and alleging violations of the Exchange Act, based on allegedly false or misleading statements related to potential violations of the FCPA, our business, prospects and operations, and the effectiveness of our internal control over financial reporting and our disclosure controls and procedures. Additionally, in 2017 and 2016, putative shareholder derivative complaints were filed, naming us, certain of our current and former directors and certain of our current and former officers as defendants. See the section titled "Part I, Item 3. Legal Proceedings."
We have indemnification and expense advancement obligations pursuant to our Bylaws and indemnification agreements with respect to certain current and former members of senior management and the Company’s directors. In connection with the ongoing internal investigation, we have received requests under such indemnification agreements and our Bylaws to provide funds for legal fees and other expenses, and expect additional requests in connection with the investigation and related litigation. We have not recorded any liability for these matters as of December 31, 2017 as we cannot estimate the ultimate outcome at this time but have expensed payments made through December 31, 2017.
We have maintained directors and officers insurance, from which a portion of the indemnification expenses and costs related to the putative securities class action complaints may be recoverable, and have recorded an insurance receivable of less than $1 million as of December 31, 2017. We are unable to make a reliable estimate of the eventual cash flows by period related to the indemnification agreements described here.
Many of our engagements involve projects that are critical to the operations of our customers’ business and provide benefits that are difficult to quantify. Any failure in a customer’s systems or our failure to meet our contractual obligations to our customers, including any breach involving a customer’s confidential information or sensitive data, or our obligations under applicable laws or regulations could result in a claim for substantial damages against us, regardless of our responsibility for such failure. Although we attempt to contractually limit our liability for damages arising from negligent acts, errors, mistakes, or omissions in rendering our services, there can be no assurance that the limitations of liability set forth in our contracts will be enforceable in all instances or will otherwise protect us from liability for damages. Although we have general liability insurance coverage, including coverage for errors or omissions, there can be no assurance that such coverage will cover all types of claims, continue to be available on reasonable terms or will be available in sufficient amounts to cover one or more large claims, or that the insurer will not disclaim coverage as to any future claim. The successful assertion of one or more large claims against us that exceed or are not covered by our insurance coverage or changes in our insurance policies, including premium increases or the imposition of large deductible or co-insurance requirements, could have a material adverse effect on our business, results of operations, financial condition and cash flows.
In the normal course of business and in conjunction with certain customer engagements, we have entered into contractual arrangements through which we may be obligated to indemnify customers or other parties with whom we conduct business with respect to certain matters. These arrangements can include provisions whereby we agree to hold the indemnified party and certain of their affiliated entities harmless with respect to third-party claims related to such matters as our breach of certain representations or covenants, our intellectual property infringement, our gross negligence or willful misconduct or certain other claims made against certain parties. Payments by us under any of these arrangements are generally conditioned on the customer making a claim and providing us with full control over the defense and settlement of such claim. It is not possible to determine the maximum potential liability under these indemnification agreements due to the unique facts and circumstances involved in each particular agreement. Historically, we have not made payments under these indemnification agreements and therefore they have not had any impact on our operating results, financial position, or cash flows. However, if events arise requiring us to make payment for indemnification claims under our indemnification obligations in contracts we have entered, such payments could have material impact on our business, results of operations, financial condition and cash flows.
Off-Balance Sheet Arrangements
Other than our foreign exchange forward contracts, there were no off-balance sheet transactions, arrangements or other relationships with unconsolidated entities or other persons in 2017, 2016 and 2015 that have, or are reasonably likely to have, a current or future effect on our financial condition, revenues or expenses, results of operations, liquidity, capital expenditures or capital resources.
47
Critical Accounting Estimates
Management’s discussion and analysis of our financial condition and results of operations is based on our accompanying consolidated financial statements that have been prepared in accordance with accounting principles generally accepted in the United States of America, or GAAP. We base our estimates on historical experience, current trends and on various other assumptions that are believed to be relevant at the time our consolidated financial statements are prepared. We evaluate our estimates on a continuous basis. However, the actual amounts may differ from the estimates used in the preparation of the accompanying consolidated financial statements.
We believe the following accounting estimates are the most critical to aid in fully understanding and evaluating our reported consolidated financial statements as they require the most difficult, subjective or complex judgments, resulting from the need to make estimates about the effect of matters that are inherently uncertain. Changes to these estimates could have a material adverse effect on our results of operations and financial condition. Our significant accounting policies are described in Note 1 to the accompanying consolidated financial statements.
Revenue Recognition. Revenues related to our fixed-price highly complex application development contracts and certain other fixed-price contracts are recognized as the services are performed using the percentage of completion method and the proportional performance method of accounting, respectively. Under the percentage of completion method, total contract revenues during the term of an agreement are recognized based on the percentage that each contract’s total labor cost to date bears to the total expected labor cost (cost to cost method). Under the proportional performance method, total contract revenues are recognized based on the level of effort to date in relation to total expected efforts provided to the customer. Management reviews the assumptions related to these methods on an ongoing basis. Revisions to our estimates may result in increases or decreases to revenues and income and are reflected in the consolidated financial statements in the periods in which they are first identified. If our estimates indicate that a contract loss will be incurred, a loss provision is recorded in the period in which the loss first becomes probable and reasonably estimable. Contract losses are determined to be the amount by which the estimated costs of the contract exceed the estimated total revenues that will be generated by the contract and such losses are included in cost of revenues in our consolidated statement of operations. Changes in estimates related to our revenue contracts and contract losses were immaterial to the consolidated results of operations for the periods presented.
Income Taxes. Determining the consolidated provision for income tax expense, deferred income tax assets (and related valuation allowance, if any) and liabilities requires significant judgment. We are required to calculate and provide for income taxes in each of the jurisdictions where we operate. Changes in the geographic mix of income before taxes or estimated level of annual pre-tax income can affect our overall effective income tax rate. The consolidated provision for income taxes may also change period to period based on non-recurring events, such as the settlement of income tax audits and changes in tax laws, regulations, or accounting principles.
Our provision for income taxes also includes the impact of reserves established for uncertain income tax positions, as well as the related interest, which may require us to apply judgment to complex issues and may require an extended period of time to resolve. Although we believe we have adequately reserved for our uncertain tax positions, no assurance can be given that the final outcome of these matters will not differ from our recorded amounts. We adjust these reserves in light of changing facts and circumstances, such as the closing of a tax audit. To the extent that the final outcome of these matters differs from the amounts recorded, such differences will impact the provision for income taxes in the period in which such determination is made.
Significant judgment is also required in determining any valuation allowance recorded against deferred income tax assets. In assessing the need for a valuation allowance, we consider all available evidence for each jurisdiction including past operating results, estimates of future taxable income and the feasibility of tax planning strategies. If it is determined that it is more likely than not that future tax benefits associated with a deferred income tax asset will not be realized, a valuation allowance is provided. In the event we change our determination as to the amount of deferred income tax assets that can be realized, we will adjust the valuation allowance with a corresponding impact recorded to our provision for income taxes in the period in which such determination is made.
Our Indian subsidiaries, collectively referred to as Cognizant India, are primarily export-oriented companies and are eligible for certain income tax holiday benefits granted by the government of India for export activities conducted within SEZs for periods of up to 15 years. A majority of our SEZ income tax holiday benefits are currently scheduled to expire in whole or in part during the years 2018 to 2026 and may be extended on a limited basis for an additional five years per unit if certain reinvestment criteria are met. We have constructed and expect to continue to operate most of our newer development facilities in SEZs. Our Indian profits ineligible for SEZ benefits are subject to corporate income tax at the rate of 34.6%. In addition, all Indian profits, including those generated within SEZs, are subject to the MAT, at the rate of 21.3%. Any MAT paid is creditable against future Indian corporate income tax, subject to limitations. Currently, we anticipate utilizing our existing MAT balances
48
against our future corporate income tax obligations in India. However, our ability to do so could be impacted by possible changes to the Indian tax laws as well as the future financial results of Cognizant India.
The one-time provisional incremental income tax expense related to the Tax Reform Act reflects assumptions based upon our interpretation of the Tax Reform Act as of January 18, 2018, and may change, possibly materially, as we receive additional clarification and guidance and as the interpretation of the Tax Reform Act evolves over time. The calculation of the provisional incremental income tax expense is based upon various estimates and assumptions and may be impacted by additional considerations, including, but not limited to, the final computation of 2017 earnings and profits of non-U.S. subsidiaries as of the relevant measurement dates. The provisional amount will be finalized when the 2017 U.S. corporate tax return is filed in 2018. See Note 10 to our consolidated financial statements.
Stock-Based Compensation. Stock-based compensation cost is measured at the grant date fair value of the award and is recognized as expense over the vesting period. Determining the fair value of stock-based awards at the grant date requires judgment, including estimating the number of awards that are expected to be forfeited. In addition, for performance stock units, we are required to estimate the most probable outcome of the performance conditions in order to determine the amount of stock compensation costs to be recorded over the vesting period. To the extent that actual results differ significantly from our estimates, stock-based compensation expense and our results of operations could be materially impacted.
Derivative Financial Instruments. Derivative financial instruments are recorded on the balance sheet as either an asset or liability measured at its fair value as of the reporting date. Our derivative financial instruments consist of foreign exchange forward contracts. We estimate the fair value of each foreign exchange forward contract by using a present value of expected cash flows model. This model utilizes various assumptions, including timing and amounts of cash flows, discount rates, and counterparty credit risk factors. The use of different assumptions could have a positive or negative effect on our results of operations and financial condition.
Investments. Our investment portfolio is comprised primarily of time deposits, mutual funds invested in fixed income securities, Indian rupee denominated commercial paper, Indian rupee denominated international corporate bonds and government debt securities, U.S. dollar denominated corporate bonds, municipal bonds, certificates of deposit, commercial paper, debt issuances by the U.S. government, U.S. government agencies, foreign governments and supranational entities, and asset-backed securities. The asset-backed securities included securities backed by auto loans, credit card receivables and other receivables. The years of issuance of our asset-backed securities fall primarily in the 2012 to 2017 range. Our long-term investments are comprised of held-to-maturity corporate and other debt securities as well as equity and cost method investments.
We utilize various inputs to determine the fair value of our investment portfolio. To the extent they exist, unadjusted quoted market prices for identical assets in active markets (Level 1) or quoted prices on similar assets in active markets or quoted prices for identical or similar assets in markets that are not active or observable and market-corroborated inputs other than quoted prices (collectively, Level 2) are utilized to determine the fair value of each investment in our portfolio. In the absence of quoted prices or liquid markets, valuation techniques would be used to determine fair value of any investments that require inputs that are both significant to the fair value measurement and unobservable (Level 3). Valuation techniques are based on various assumptions, including timing and amounts of cash flows, discount rates, rate of return, and adjustments for nonperformance and liquidity. A significant degree of judgment is involved in valuing investments using Level 3 inputs. As of December 31, 2017, none of our investments were categorized as Level 3 in the fair value hierarchy. See Note 12 to our consolidated financial statements for additional information related to our security valuation methodologies.
We periodically evaluate if unrealized losses, as determined based on the security valuation methodologies discussed above, on individual securities classified as available-for-sale or held-to-maturity are considered to be other-than-temporary. The analysis of other-than-temporary impairment requires the use of various assumptions, including the length of time an investment’s cost basis is greater than fair value, the severity of the investment’s decline, any credit deterioration of the investment, whether management intends to sell the security and whether it is more likely than not that we will be required to sell the security prior to recovery of its amortized cost basis. If we do not expect to recover the entire amortized cost basis of the security, we consider the security to be other-than-temporarily impaired and we record the difference between the security’s amortized cost basis and its recoverable amount in earnings and the difference between the security’s recoverable amount and fair value in other comprehensive income. If we intend to sell the security or it is more likely than not that we will be required to sell the security before recovery of its amortized cost basis, the security is also considered other-than-temporarily impaired and we recognize the entire difference between the security’s amortized cost basis and its fair value in earnings.
Business Combinations. Accounting for business combinations requires the use of significant estimates and assumptions. We account for business combinations using the acquisition method which requires us to estimate the fair value of identifiable assets acquired, liabilities assumed, including any contingent consideration and any noncontrolling interest in the acquiree to
49
properly allocate purchase price consideration to the individual assets acquired and liabilities assumed. The allocation of the purchase price utilizes significant estimates in determining the fair values of identifiable assets acquired and liabilities assumed, especially with respect to intangible assets. The significant estimates and assumptions include the timing and amount of forecasted revenues and cash flows, anticipated growth rates, customer attrition rates, the discount rate reflecting the risk inherent in future cash flows and the determination of useful lives for finite-lived assets.
Long-lived Assets and Finite-lived Intangibles. We review long-lived assets and certain finite-lived identifiable intangibles for impairment whenever events or changes in circumstances indicate that the carrying amount of an asset may not be recoverable. We recognize an impairment loss when the sum of the undiscounted expected future cash flows is less than the carrying amount of such assets. The impairment loss is determined as the amount by which the carrying amount of the asset exceeds the fair value of the asset. Assessing the fair value of assets involves significant estimates and assumptions including estimation of future cash flows, the timing of such cash flows and discount rates reflecting the risk inherent in future cash flows.
Goodwill and Indefinite-lived Intangibles. We exercise judgment to allocate goodwill to the reporting units expected to benefit from each business combination. Goodwill is tested for impairment at the reporting unit level on an annual basis and between annual tests if an event occurs or circumstances change that would more likely than not reduce the fair value of a reporting unit below its carrying value. These events or circumstances could include a significant change in the business climate, regulatory environment, established business plans, operating performance indicators or competition. Evaluation of goodwill for impairment requires judgment, including the identification of reporting units, assignment of assets, liabilities and goodwill to reporting units and determination of the fair value of each reporting unit.
We estimate the fair value of our reporting units using a combination of an income approach, utilizing a discounted cash flow analysis, and a market approach, using market multiples. Under the income approach, we estimate projected future cash flows, the timing of such cash flows and long term growth rates, and determine the appropriate discount rate that reflects the risk inherent in the projected future cash flows. The discount rate used is based on our weighted-average cost of capital and may be adjusted for the relevant risk associated with business-specific characteristics and the uncertainty related to the reporting unit’s ability to execute on the projected future cash flows. Under the market approach, we estimate fair value based on market multiples of revenues and earnings derived from comparable publicly-traded companies with characteristics similar to the reporting unit. There was no indication of goodwill impairment as a result of our 2017 annual impairment analysis, as the fair values of each of our reporting units exceeded their respective net book values, including goodwill. Further, a 10% increase or decrease in any of the key assumptions used under either the income approach or the market approach would not result in a significant impact to the excess fair value over book value for any of our reporting units.
The estimates used to calculate the fair value of a reporting unit change from year to year based on operating results, market conditions and other factors. Changes in these estimates and assumptions could materially affect the determination of fair value for each reporting unit.
We also evaluate indefinite-lived intangible assets for impairment at least annually, or as circumstances warrant. Our 2017 qualitative assessment included the review of relevant macroeconomic factors and entity-specific qualitative factors to determine if it was more-likely-than-not that the fair value of our indefinite-lived intangible assets was below carrying value.
Based on our most recent evaluation of goodwill and indefinite-lived intangible assets, which was performed as of December 31, 2017, none of our reporting units or indefinite-lived intangible assets was considered to be at risk of impairment. As of December 31, 2017, our goodwill and indefinite-lived intangible asset balances were $2,704 million and $63 million, respectively.
Contingencies. Loss contingencies are recorded as liabilities when a loss is considered probable and the amount can be reasonably estimated. When a material loss contingency is reasonably possible but not probable, we do not record a liability, but instead disclose the nature and amount of the claim, and an estimate of the loss or range of loss, if such an estimate can be made. Significant judgment is required in the determination of both probability and whether an exposure is reasonably estimable. Our judgments are subjective and based on the information available from the status of the legal or regulatory proceedings, the merits of our defenses and consultation with in-house and outside legal counsel. As additional information becomes available, we reassess any potential liability related to any pending litigation and may revise our estimates. Such revisions in estimates of any potential liabilities could have a material impact on our results of operations and financial position.
Recently Adopted and New Accounting Pronouncements
See Note 1 to our audited consolidated financial statements for additional information.
50
Forward Looking Statements
The statements contained in this Annual Report on Form 10-K that are not historical facts are forward-looking statements (within the meaning of Section 21E of the Securities Exchange Act of 1934, as amended) that involve risks and uncertainties. Such forward-looking statements may be identified by, among other things, the use of forward-looking terminology such as “believe,” “expect,” “may,” “could,” “would,” “plan,” “intend,” “estimate,” “predict,” “potential,” “continue,” “should” or “anticipate” or the negative thereof or other variations thereon or comparable terminology, or by discussions of strategy that involve risks and uncertainties. From time to time, we or our representatives have made or may make forward-looking statements, orally or in writing.
Such forward-looking statements may be included in various filings made by us with the SEC, or press releases or oral statements made by or with the approval of one of our authorized executive officers. These forward-looking statements, such as statements regarding anticipated future revenues or operating margins, contract percentage completions, earnings, capital expenditures, anticipated effective tax rates, liquidity, access to capital, capital return plan, investment strategies, cost management, realignment program, plans and objectives, including those related to our digital practice areas, investment in our business and potential acquisitions, industry trends, customer behaviors and trends, and the ongoing internal investigation and other statements regarding matters that are not historical facts, are based on our current expectations, estimates and projections, management’s beliefs and certain assumptions made by management, many of which, by their nature, are inherently uncertain and beyond our control. Actual results, performance, achievements and outcomes could differ materially from the results expressed in, or implied by, these forward-looking statements. There are a number of important factors that could cause our results to differ materially from those indicated by such forward-looking statements, including:
• | competition from other service providers; |
• | the risk that we may not be able to achieve targeted improvements in our operating margin and level of profitability, or that our operating margin and profitability may decline; |
• | the risk of liability or damage to our reputation resulting from security breaches or disclosure of sensitive data or failure to comply with data protection laws and regulations; |
• | the risk that we may not be able to keep pace with the rapidly evolving technological environment; |
• | the rate of growth in the use of technology in business and the type and level of technology spending by our customers; |
• | mispricing of our services, especially on our fixed-price and transaction- or volume-based priced contracts; |
• | risks associated with our ongoing internal investigation into possible violations of the FCPA and similar laws, including the cost of such investigation and any sanctions, fines or remedial measures that may be imposed by the DOJ or SEC, additional expenses related to remedial measures, the costs of defending and/or settling possible judgments against us that may result from associated lawsuits against us and any possible impact on our ability to timely file the required reports with the SEC; |
• | our inability to successfully acquire or integrate target companies; |
• | system failure or disruptions in our communications or information technology; |
• | the risk that we may lose key executives and not be able to enforce non-competition agreements with them; |
• | competition for hiring highly-skilled technical personnel; |
• | possible failure to provide business solutions and deliver complex and large projects for our customers; |
• | the risk of reputational harm to us; |
• | the effect of our use of derivative instruments; |
• | our revenues being highly dependent on customers concentrated in certain industries, including financial services and healthcare, and located primarily in the United States and Europe; |
• | the risk that we may not be able to pay dividends or repurchase shares in accordance with our capital return plan, or at all; |
• | risks relating to our global operations, including our operations in India; |
• | the effects of fluctuations in the Indian rupee and other currency exchange rates; |
• | the risk of war, terrorist activities, pandemics and natural disasters; |
• | the Brexit Referendum and any negative effects on global economic conditions, financial markets and our business; |
• | the risk that we may not be able to enforce or protect our intellectual property rights, or that we may infringe upon the intellectual property rights of others; |
51
• | regulatory uncertainties, including in the areas of outsourcing, immigration and taxes; |
• | increased regulation of the financial services and healthcare industries, as well as other industries in which our customers operate; |
• | the possibility that we may be required to or choose to repatriate Indian earnings; |
• | the possibility that we may lose certain tax benefits provided to companies in our industry by the Indian government; and |
• | the factors set forth in Part I, in the section entitled “Item 1A. Risk Factors” in this report. |
You are advised to consult any further disclosures we make on related subjects in the reports we file with the Securities and Exchange Commission, including this report in the sections titled “Part I, Item 1. Business,” “Part I, Item 1A. Risk Factors” and “Part II, Item 7. Management’s Discussion and Analysis of Financial Condition and Results of Operations.” We undertake no obligation to update or revise any forward-looking statements, whether as a result of new information, future events or otherwise, except as may be required under applicable securities laws.
Item 7A. Quantitative and Qualitative Disclosures about Market Risk
Foreign Currency Risk
We are exposed to foreign currency exchange rate risk in the ordinary course of doing business as we transact or hold a portion of our funds in foreign currencies, particularly the Indian rupee. Additionally, the Brexit Referendum and its effect on the British pound may subject us to increased volatility in foreign currency exchange rate movements. Accordingly, we periodically evaluate the need for hedging strategies, including the use of derivative financial instruments, to mitigate the effect of foreign currency exchange rate fluctuations and expect to continue to use such instruments in the future to reduce foreign currency exposure to appreciation or depreciation in the value of certain foreign currencies. All hedging transactions are authorized and executed pursuant to regularly reviewed policies and procedures.
Revenues from our customers in the United Kingdom, Rest of Europe and Rest of World represented 7.8%, 8.4% and 6.5%, respectively, of our 2017 revenues, and are typically denominated in currencies other than the U.S. dollar. Accordingly, our operating results may be affected by fluctuations in the exchange rates, primarily the Indian rupee, the British pound and the Euro, as compared to the U.S. dollar.
A portion of our costs in India, representing approximately 22.5% of our global operating costs during 2017, are denominated in the Indian rupee and are subject to foreign currency exchange rate fluctuations. These foreign currency exchange rate fluctuations have an impact on our results of operations.
We have entered into a series of foreign exchange forward contracts that are designated as cash flow hedges of certain Indian rupee denominated payments in India. Cognizant India converts U.S. dollar receipts from intercompany billings to Indian rupees to fund local expenses. These U.S. dollar / Indian rupee hedges are intended to partially offset the impact of movement of exchange rates on future operating costs. As of December 31, 2017, the notional value and weighted average contract rates of these contracts were as follows:
Notional Value (in millions) | Weighted Average Contract Rate (Indian rupee to U.S. dollar) | |||||
2018 | $ | 1,185 | 72.7 | |||
2019 | 720 | 69.6 | ||||
Total | $ | 1,905 | 71.5 | |||
As of December 31, 2017, the unrealized gain on our outstanding foreign exchange forward contracts designated as cash flow hedges was $154 million. Based upon a sensitivity analysis at December 31, 2017, which estimates the fair value of the contracts based upon market exchange rate fluctuations, a 10.0% change in the foreign currency exchange rate against the U.S. dollar with all other variables held constant would have resulted in a change in the fair value of our foreign exchange forward contracts of approximately $198 million.
A portion of our balance sheet is exposed to foreign currency exchange rate fluctuations, which may result in non-operating foreign currency exchange gains or losses upon remeasurement. In 2017, we reported foreign currency exchange gains, exclusive of hedging losses, of approximately $90 million, which were primarily attributed to the remeasurement of net monetary assets and liabilities denominated in currencies other than the functional currencies of our subsidiaries. As of December 31, 2017, we had $1,546 million in cash, cash equivalents and investments denominated in Indian rupees. Based
52
upon a sensitivity analysis, a 10.0% change in the Indian rupee exchange rate against the U.S. dollar, with all other variables held constant, would have resulted in a change in the U.S. dollar reported value of these balances and a corresponding non-operating foreign currency exchange gain or loss of approximately $156 million.
We use foreign exchange forward contracts to hedge balance sheet exposure to certain monetary assets and liabilities denominated in currencies other than the functional currency of the subsidiary. These contracts are not designated as hedges and are intended to offset the foreign currency exchange gains or losses upon remeasurement of these net monetary assets and liabilities. We entered into a series of foreign exchange forward contracts scheduled to mature in 2018 that are used to hedge our foreign currency denominated net monetary assets and liabilities. At December 31, 2017, the notional value of the outstanding contracts was $255 million and the related fair value was a liability of $5 million. Based upon a sensitivity analysis of our foreign exchange forward contracts at December 31, 2017, which estimates the fair value of the contracts based upon market exchange rate fluctuations, a 10.0% change in the foreign currency exchange rate against the U.S. dollar with all other variables held constant would have resulted in a change in the fair value of approximately $23 million.
Interest Rate Risk
As of December 31, 2017, we have $800 million outstanding under our term loan and $75 million in outstanding notes under the revolving credit facility. The Credit Agreement requires interest to be paid at either the base rate or the Eurocurrency rate, plus a margin. The margin over the base rate is 0.00%, and the margin over the Eurocurrency rate ranges from 0.75% to 1.125%, depending on our debt ratings (or, if we have not received debt ratings, from 0.875% to 1.00%, depending on our debt to total stockholders' equity ratio). Thus, our debt exposes us to market risk from changes in interest rates. We performed a sensitivity analysis to determine the effect of interest rate fluctuations on our interest expense. A 10.0% change in interest rates, with all other variables held constant, would have resulted in a 4.7% change to our reported interest expense for 2017.
In addition, our available-for-sale and held-to-maturity fixed income securities are subject to market risk from changes in interest rates. As of December 31, 2017, our available-for-sale and held-to-maturity portfolios were $1,972 million and $906 million, respectively. As of December 31, 2017, a 10% change in interest rates, with all other variables held constant, would result in a change in the fair market value of our available-for-sale and held-to-maturity investment securities of approximately $6 million and $2 million, respectively. We typically invest in highly rated securities and our policy generally limits the amount of credit exposure to any one issuer. Our investment policy requires investments to be investment grade with the objective of minimizing the potential risk of principal loss. We may sell our available-for-sale investments prior to their stated maturities for strategic purposes, in anticipation of credit deterioration, or for duration management. Our investment portfolio is comprised primarily of time deposits, mutual funds invested in fixed income securities, Indian rupee denominated commercial paper, Indian rupee denominated international corporate bonds and government debt securities, U.S. dollar denominated corporate bonds, municipal bonds, certificates of deposit, commercial paper, debt issuances by the U.S. government, U.S. government agencies, foreign governments and supranational entities, and asset-backed securities. The asset-backed securities included securities backed by auto loans, credit card receivables and other receivables.
Information provided by the sensitivity analysis of foreign currency risk and interest rate risk does not necessarily represent the actual changes that would occur under normal market conditions.
Item 8. Financial Statements and Supplementary Data
The financial statements required to be filed pursuant to this Item 8 are appended to this Annual Report on Form 10-K. A list of the financial statements filed herewith is found in Part IV, “Item 15. Exhibits, Financial Statements and Financial Statement Schedule.”
Item 9. Changes in and Disagreements with Accountants on Accounting and Financial Disclosure
Not applicable.
Item 9A. Controls and Procedures
Background
As previously disclosed, the Company is conducting an internal investigation focused on whether certain payments relating to Company-owned facilities in India were made improperly and in possible violation of the FCPA and other applicable laws. The investigation is also examining various other payments made in small amounts in India that may not have complied with Company policy or applicable law. Based on the findings of the internal investigation as of each date, in our Quarterly Report on Form 10-Q for the third quarter of 2016 and in subsequent reporting periods through the Quarterly Report on Form
53
10-Q for the third quarter of 2017, we disclosed a material weakness in our internal control over financial reporting as we did not maintain an effective internal control environment. Specifically, we did not maintain an effective tone at the top as certain members of senior management may have participated in or been aware of the making of potentially improper payments and failed to take action to prevent the making of potentially improper payments by either overriding or failing to enforce the controls established by the Company relating to real estate and procurement principally in connection with permits for certain facilities in India.
This control deficiency did not result in a material misstatement of our current or prior period consolidated annual or interim financial statements. However, this control deficiency could have resulted in material misstatements to the annual or interim consolidated financial statements that would not have been prevented or detected. Accordingly, management concluded that this control deficiency constituted a material weakness.
Remediation of Material Weakness
As of December 31, 2017, we have remediated the material weakness in our internal control over financial reporting noted above. We have undertaken a number of measures designed to directly address, or that contributed to, the remediation of our material weakness or the enhancement of our internal control over financial reporting. While the internal investigation is ongoing, based on the results of the investigation to date, the members of senior management who may have participated in or been aware of the making of the identified potentially improper payments and failed to take action to prevent the making of the identified potentially improper payments are no longer with the Company or in a senior management position. Additional personnel actions have been taken with respect to other employees.
Further, among other things, we made certain new management appointments, including a new President and a new General Counsel, added resources and personnel to our compliance function and programs, enhanced our oversight controls in the areas of procurement and accounts payable as they relate to real estate transactions in India, and enhanced our compliance program and control environment through a number of actions, including providing additional anti-corruption and ethical conduct training and communications to our employees, distributing a revised code of ethics worldwide, and implementing additional anti-corruption policies and procedures.
As of December 31, 2017, we were able to demonstrate that these measures implemented as part of our remediation efforts were operating effectively, and management therefore concluded that the material weakness described above has been remediated as of that date.
Management’s Responsibility for the Financial Statements
Our management is responsible for the integrity and objectivity of all information presented in this Annual Report. The consolidated financial statements were prepared in conformity with accounting principles generally accepted in the United States of America and include amounts based on management’s best estimates and judgments. Management believes the consolidated financial statements fairly reflect the form and substance of transactions and that the financial statements fairly represent the Company’s financial position and results of operations.
The Audit Committee of the Board of Directors, which is composed solely of independent directors, meets regularly with the Company’s independent registered public accounting firm and representatives of management to review accounting, financial reporting, internal control and audit matters, as well as the nature and extent of the audit effort. The Audit Committee is responsible for the engagement of the independent registered public accounting firm. The independent registered public accounting firm has free access to the Audit Committee.
Evaluation of Disclosure Controls and Procedures
Our management, under the supervision and with the participation of our chief executive officer and our chief financial officer, evaluated the design and operating effectiveness of our disclosure controls and procedures (as defined in Rules 13a-15(e) and 15d-15(e) under the Securities Exchange Act of 1934, as amended, or the Exchange Act) as of December 31, 2017.
Based on the evaluation of the design and effectiveness of our disclosure controls and procedures, our chief executive officer and chief financial officer have concluded that, as of December 31, 2017, our disclosure controls and procedures were effective.
54
Management’s Report on Internal Control Over Financial Reporting
Our management is responsible for establishing and maintaining adequate internal control over financial reporting. Internal control over financial reporting is defined in Rule 13a-15(f) and 15d-15(f) of the Exchange Act and is a process designed by, or under the supervision of, our chief executive and chief financial officers and effected by our Board of Directors, management and other personnel, to provide reasonable assurance regarding the reliability of financial reporting and the preparation of financial statements for external purposes in accordance with generally accepted accounting principles and includes those policies and procedures that:
• | Pertain to the maintenance of records that, in reasonable detail, accurately and fairly reflect the transactions and dispositions of our assets; |
• | Provide reasonable assurance that transactions are recorded as necessary to permit preparation of financial statements in accordance with generally accepted accounting principles, and that receipts and expenditures of the Company are being made only in accordance with authorizations of our management and directors; and |
• | Provide reasonable assurance regarding prevention or timely detection of unauthorized acquisition, use or disposition of the Company’s assets that could have a material effect on the financial statements. |
Our management, under the supervision and with the participation of our chief executive officer and our chief financial officer, assessed the effectiveness of the Company’s internal control over financial reporting as of December 31, 2017. In making this assessment, the Company’s management used the criteria set forth by the Committee of Sponsoring Organizations of the Treadway Commission (COSO) in Internal Control-Integrated Framework (2013).
Based on its evaluation, our management has concluded that, as of December 31, 2017, our internal control over financial reporting was effective. The effectiveness of the Company’s internal control over financial reporting has been audited by PricewaterhouseCoopers LLP, an independent registered public accounting firm, as stated in their report which appears herein.
Changes in Internal Control over Financial Reporting
Other than described in “Remediation of Material Weakness” above, there were no changes in our internal control over financial reporting that occurred during the fourth quarter of 2017 that have materially affected, or are reasonably likely to materially affect, our internal control over financial reporting.
Inherent Limitation of Internal Controls
Because of its inherent limitations, internal control over financial reporting may not prevent or detect all misstatements. Projections of any evaluation of effectiveness to future periods are subject to the risk that controls may become inadequate because of changes in conditions, or the degree of compliance with the policies or procedures may deteriorate.
Item 9B. Other Information
None.
55
PART III
Item 10. Directors, Executive Officers and Corporate Governance
The information relating to our executive officers in response to this item is contained in part under the caption “Our Executive Officers” in Part I of this Annual Report on Form 10-K.
We have adopted a written code of ethics, entitled “Core Values and Code of Ethics,” that applies to all of our employees, including our principal executive officer, principal financial officer, principal accounting officer and controller, or persons performing similar functions. We make available our code of ethics free of charge through our website which is located at www.cognizant.com. We intend to post on our website all disclosures that are required by law or Nasdaq Stock Market listing standards concerning any amendments to, or waivers from, any provision of our code of ethics.
The remaining information required by this item will be included in our definitive proxy statement for the 2018 Annual Meeting of Stockholders and is incorporated herein by reference to such proxy statement.
Item 11. Executive Compensation
The information required by this item will be included in our definitive proxy statement for the 2018 Annual Meeting of Stockholders and is incorporated herein by reference to such proxy statement.
Item 12. Security Ownership of Certain Beneficial Owners and Management and Related Stockholder Matters
The information required by this item will be included in our definitive proxy statement for the 2018 Annual Meeting of Stockholders and is incorporated herein by reference to such proxy statement.
Item 13. Certain Relationships and Related Transactions, and Director Independence
The information required by this item will be included in our definitive proxy statement for the 2018 Annual Meeting of Stockholders and is incorporated herein by reference to such proxy statement.
Item 14. Principal Accountant Fees and Services
The information required by this item will be included in our definitive proxy statement for the 2018 Annual Meeting of Stockholders and is incorporated herein by reference to such proxy statement.
56
PART IV
Item 15. Exhibits, Financial Statement Schedules
(a) | (1) Consolidated Financial Statements. Reference is made to the Index to Consolidated Financial Statements on Page F-1. |
(2) Consolidated Financial Statement Schedule. Reference is made to the Index to Financial Statement Schedule on Page F-1. | |
(3) Exhibits. | |
Schedules other than as listed above are omitted as not required or inapplicable or because the required information is provided in the consolidated financial statements, including the notes thereto.
EXHIBIT INDEX
Incorporated by Reference | |||||||||||||
Number | Exhibit Description | Form | File No. | Exhibit | Date | Filed or Furnished Herewith | |||||||
2.1 | 8-K | 000-24429 | 2.1 | 9/15/2014 | |||||||||
3.1 | 8-K | 000-24429 | 3.2 | 9/17/2013 | |||||||||
3.2 | 8-K | 000-24429 | 3.1 | 3/31/2017 | |||||||||
4.1 | S-4/A | 333-101216 | 4.2 | 1/30/2003 | |||||||||
10.1† | 10-Q | 000-24429 | 10.1 | 8/7/2013 | |||||||||
10.2† | 10-K | 000-24429 | 10.2 | 3/1/2017 | |||||||||
10.3† | Filed | ||||||||||||
10.4† | 10-K | 000-24429 | 10.4 | 2/26/2013 | |||||||||
10.5† | 8-K | 000-24429 | 10.1 | 6/8/2007 | |||||||||
10.6† | 8-K | 000-24429 | 10.1 | 6/5/2013 | |||||||||
10.7† | 10-Q | 000-24429 | 10.1 | 11/8/2004 | |||||||||
57
Incorporated by Reference | |||||||||||||
Number | Exhibit Description | Form | File No. | Exhibit | Date | Filed or Furnished Herewith | |||||||
10.8† | 10-Q | 000-24429 | 10.1 | 5/4/2015 | |||||||||
10.9† | 8-K | 000-24429 | 10.1 | 7/6/2009 | |||||||||
10.10† | 8-K | 000-24429 | 10.2 | 7/6/2009 | |||||||||
10.11† | 8-K | 000-24429 | 10.3 | 7/6/2009 | |||||||||
10.12† | 8-K | 000-24429 | 10.4 | 7/6/2009 | |||||||||
10.13† | 8-K | 000-24429 | 10.5 | 7/6/2009 | |||||||||
10.14† | 8-K | 000-24429 | 10.6 | 7/6/2009 | |||||||||
10.15† | 8-K | 000-24429 | 10.7 | 7/6/2009 | |||||||||
10.16† | 8-K | 000-24429 | 10.8 | 7/6/2009 | |||||||||
10.17† | 8-K | 000-24429 | 10.1 | 6/7/2017 | |||||||||
10.18† | 10-Q | 000-24429 | 10.2 | 8/3/2017 | |||||||||
10.19† | 10-Q | 000-24429 | 10.3 | 8/3/2017 | |||||||||
10.20† | 10-Q | 000-24429 | 10.4 | 8/3/2017 | |||||||||
10.21† | 10-Q | 000-24429 | 10.5 | 8/3/2017 | |||||||||
10.22 | 8-K | 000-24429 | 10.1 | 11/20/2014 | |||||||||
10.23 | 10-Q | 000-24429 | 10.1 | 11/7/2016 | |||||||||
10.24 | 8-K | 000-24429 | 10.1 | 2/8/2017 | |||||||||
58
Incorporated by Reference | |||||||||||||
Number | Exhibit Description | Form | File No. | Exhibit | Date | Filed or Furnished Herewith | |||||||
10.25 | 10-Q | 000-24429 | 10.2 | 5/5/2017 | |||||||||
10.26 | 8-K | 000-24429 | 10.1 | 3/14/2017 | |||||||||
21.1 | Filed | ||||||||||||
23.1 | Filed | ||||||||||||
31.1 | Filed | ||||||||||||
31.2 | Filed | ||||||||||||
32.1 | Furnished | ||||||||||||
32.2 | Furnished | ||||||||||||
101.INS | XBRL Instance Document | Filed | |||||||||||
101.SCH | XBRL Taxonomy Extension Schema Document | Filed | |||||||||||
101.CAL | XBRL Taxonomy Extension Calculation Linkbase Document | Filed | |||||||||||
101.DEF | XBRL Taxonomy Extension Definition Linkbase Document | Filed | |||||||||||
101.LAB | XBRL Taxonomy Extension Label Linkbase Document | Filed | |||||||||||
101.PRE | XBRL Taxonomy Extension Presentation Linkbase Document | Filed | |||||||||||
† | A management contract or compensatory plan or arrangement required to be filed as an exhibit pursuant to Item 15(a)(3) of Form 10-K. |
Item 16. Form 10-K Summary
None.
59
SIGNATURES
Pursuant to the requirements of Section 13 or 15(d) of the Securities Exchange Act of 1934, the Registrant has duly caused this report to be signed on its behalf by the undersigned, thereunto duly authorized.
COGNIZANT TECHNOLOGY SOLUTIONS CORPORATION | ||
By: | /S/ FRANCISCO D’SOUZA | |
Francisco D’Souza, | ||
Chief Executive Officer | ||
(Principal Executive Officer) | ||
Date: | February 27, 2018 | |
Pursuant to the requirements of the Securities Exchange Act of 1934, this report has been signed below by the following persons on behalf of the Registrant and in the capacities and on the dates indicated.
Signature | Title | Date | ||
/s/ FRANCISCO D’SOUZA | Chief Executive Officer and Director (Principal Executive Officer) | February 27, 2018 | ||
Francisco D’Souza | ||||
/s/ KAREN MCLOUGHLIN | Chief Financial Officer (Principal Financial Officer) | February 27, 2018 | ||
Karen McLoughlin | ||||
/s/ ROBERT TELESMANIC | Controller and Chief Accounting Officer (Principal Accounting Officer) | February 27, 2018 | ||
Robert Telesmanic | ||||
/s/ JOHN E. KLEIN | Chairman of the Board and Director | February 27, 2018 | ||
John E. Klein | ||||
/s/ ZEIN ABDALLA | Director | February 27, 2018 | ||
Zein Abdalla | ||||
/s/ BETSY S. ATKINS | Director | February 27, 2018 | ||
Betsy S. Atkins | ||||
/s/ MAUREEN BREAKIRON-EVANS | Director | February 27, 2018 | ||
Maureen Breakiron-Evans | ||||
/s/ JONATHAN CHADWICK | Director | February 27, 2018 | ||
Jonathan Chadwick | ||||
/s/ JOHN M. DINEEN | Director | February 27, 2018 | ||
John M. Dineen | ||||
/s/ JOHN N. FOX, JR. | Director | February 27, 2018 | ||
John N. Fox, Jr. | ||||
/s/ LEO S. MACKAY, JR. | Director | February 27, 2018 | ||
Leo S. Mackay, Jr. | ||||
/s/ MICHAEL PATSALOS-FOX | Director | February 27, 2018 | ||
Michael Patsalos-Fox | ||||
/s/ JOSEPH M. VELLI | Director | February 27, 2018 | ||
Joseph M. Velli | ||||
60
COGNIZANT TECHNOLOGY SOLUTIONS CORPORATION
INDEX TO CONSOLIDATED FINANCIAL STATEMENTS
AND FINANCIAL STATEMENT SCHEDULE
Page | |||
Consolidated Financial Statements: | |||
Financial Statement Schedule: | |||
F-1
Report of Independent Registered Public Accounting Firm
To the Board of Directors and Stockholders of Cognizant Technology Solutions Corporation
Opinions on the Financial Statements and Internal Control over Financial Reporting
We have audited the accompanying consolidated statements of financial position of Cognizant Technology Solutions Corporation and its subsidiaries as of December 31, 2017 and 2016, and the related consolidated statements of operations, of comprehensive income, of stockholders' equity and of cash flows for each of the three years in the period ended December 31, 2017, including the related notes and financial statement schedule listed in the accompanying index (collectively referred to as the “consolidated financial statements”). We also have audited the Company's internal control over financial reporting as of December 31, 2017, based on criteria established in Internal Control - Integrated Framework (2013) issued by the Committee of Sponsoring Organizations of the Treadway Commission (COSO).
In our opinion, the consolidated financial statements referred to above present fairly, in all material respects, the financial position of the Company as of December 31, 2017 and 2016, and the results of their operations and their cash flows for each of the three years in the period ended December 31, 2017 in conformity with accounting principles generally accepted in the United States of America. Also in our opinion, the Company maintained, in all material respects, effective internal control over financial reporting as of December 31, 2017, based on criteria established in Internal Control - Integrated Framework (2013) issued by the COSO.
Basis for Opinions
The Company's management is responsible for these consolidated financial statements, for maintaining effective internal control over financial reporting, and for its assessment of the effectiveness of internal control over financial reporting, included in Management's Report on Internal Control Over Financial Reporting appearing under Item 9A. Our responsibility is to express opinions on the Company’s consolidated financial statements and on the Company's internal control over financial reporting based on our audits. We are a public accounting firm registered with the Public Company Accounting Oversight Board (United States) ("PCAOB") and are required to be independent with respect to the Company in accordance with the U.S. federal securities laws and the applicable rules and regulations of the Securities and Exchange Commission and the PCAOB.
We conducted our audits in accordance with the standards of the PCAOB. Those standards require that we plan and perform the audits to obtain reasonable assurance about whether the consolidated financial statements are free of material misstatement, whether due to error or fraud, and whether effective internal control over financial reporting was maintained in all material respects.
Our audits of the consolidated financial statements included performing procedures to assess the risks of material misstatement of the consolidated financial statements, whether due to error or fraud, and performing procedures that respond to those risks. Such procedures included examining, on a test basis, evidence regarding the amounts and disclosures in the consolidated financial statements. Our audits also included evaluating the accounting principles used and significant estimates made by management, as well as evaluating the overall presentation of the consolidated financial statements. Our audit of internal control over financial reporting included obtaining an understanding of internal control over financial reporting, assessing the risk that a material weakness exists, and testing and evaluating the design and operating effectiveness of internal control based on the assessed risk. Our audits also included performing such other procedures as we considered necessary in the circumstances. We believe that our audits provide a reasonable basis for our opinions.
Definition and Limitations of Internal Control over Financial Reporting
A company’s internal control over financial reporting is a process designed to provide reasonable assurance regarding the reliability of financial reporting and the preparation of financial statements for external purposes in accordance with generally accepted accounting principles. A company’s internal control over financial reporting includes those policies and procedures that (i) pertain to the maintenance of records that, in reasonable detail, accurately and fairly reflect the transactions and dispositions of the assets of the company; (ii) provide reasonable assurance that transactions are recorded as necessary to permit preparation of financial statements in accordance with generally accepted accounting principles, and that receipts and expenditures of the company are being made only in accordance with authorizations of management and directors of the company; and (iii) provide reasonable assurance regarding prevention or timely detection of unauthorized acquisition, use, or disposition of the company’s assets that could have a material effect on the financial statements.
Because of its inherent limitations, internal control over financial reporting may not prevent or detect misstatements. Also, projections of any evaluation of effectiveness to future periods are subject to the risk that controls may become inadequate because of changes in conditions, or that the degree of compliance with the policies or procedures may deteriorate.
/s/ PricewaterhouseCoopers LLP
New York, New York
February 27, 2018
We have served as the Company’s auditor since 1997.
F-2
COGNIZANT TECHNOLOGY SOLUTIONS CORPORATION
CONSOLIDATED STATEMENTS OF FINANCIAL POSITION
(in millions, except par values)
At December 31, | |||||||
2017 | 2016 | ||||||
Assets | |||||||
Current assets: | |||||||
Cash and cash equivalents | $ | 1,925 | $ | 2,034 | |||
Short-term investments | 3,131 | 3,135 | |||||
Trade accounts receivable, net of allowances of $65 and $48, respectively | 2,865 | 2,556 | |||||
Unbilled accounts receivable | 357 | 349 | |||||
Other current assets | 833 | 526 | |||||
Total current assets | 9,111 | 8,600 | |||||
Property and equipment, net | 1,324 | 1,311 | |||||
Goodwill | 2,704 | 2,554 | |||||
Intangible assets, net | 981 | 951 | |||||
Deferred income tax assets, net | 418 | 425 | |||||
Long-term investments | 235 | 62 | |||||
Other noncurrent assets | 448 | 359 | |||||
Total assets | $ | 15,221 | $ | 14,262 | |||
Liabilities and Stockholders’ Equity | |||||||
Current liabilities: | |||||||
Accounts payable | $ | 210 | $ | 175 | |||
Deferred revenue | 383 | 306 | |||||
Short-term debt | 175 | 81 | |||||
Accrued expenses and other current liabilities | 2,071 | 1,856 | |||||
Total current liabilities | 2,839 | 2,418 | |||||
Deferred revenue, noncurrent | 104 | 151 | |||||
Deferred income tax liabilities, net | 146 | 6 | |||||
Long-term debt | 698 | 797 | |||||
Long-term income taxes payable | 584 | — | |||||
Other noncurrent liabilities | 181 | 162 | |||||
Total liabilities | 4,552 | 3,534 | |||||
Commitments and contingencies (See Note 14) | |||||||
Stockholders’ equity: | |||||||
Preferred stock, $0.10 par value, 15.0 shares authorized, none issued | — | — | |||||
Class A common stock, $0.01 par value, 1,000 shares authorized, 588 and 608 shares issued and outstanding at December 31, 2017 and 2016, respectively | 6 | 6 | |||||
Additional paid-in capital | 49 | 358 | |||||
Retained earnings | 10,544 | 10,478 | |||||
Accumulated other comprehensive income (loss) | 70 | (114 | ) | ||||
Total stockholders’ equity | 10,669 | 10,728 | |||||
Total liabilities and stockholders’ equity | $ | 15,221 | $ | 14,262 | |||
The accompanying notes are an integral part of the consolidated financial statements.
F-3
COGNIZANT TECHNOLOGY SOLUTIONS CORPORATION
CONSOLIDATED STATEMENTS OF OPERATIONS
(in millions, except per share data)
Year Ended December 31, | ||||||||||||
2017 | 2016 | 2015 | ||||||||||
Revenues | $ | 14,810 | $ | 13,487 | $ | 12,416 | ||||||
Operating expenses: | ||||||||||||
Cost of revenues (exclusive of depreciation and amortization expense shown separately below) | 9,152 | 8,108 | 7,440 | |||||||||
Selling, general and administrative expenses | 2,769 | 2,731 | 2,509 | |||||||||
Depreciation and amortization expense | 408 | 359 | 325 | |||||||||
Income from operations | 2,481 | 2,289 | 2,142 | |||||||||
Other income (expense), net: | ||||||||||||
Interest income | 133 | 115 | 84 | |||||||||
Interest expense | (23 | ) | (19 | ) | (18 | ) | ||||||
Foreign currency exchange gains (losses), net | 67 | (30 | ) | (43 | ) | |||||||
Other, net | (3 | ) | 2 | (1 | ) | |||||||
Total other income (expense), net | 174 | 68 | 22 | |||||||||
Income before provision for income taxes | 2,655 | 2,357 | 2,164 | |||||||||
Provision for income taxes | (1,153 | ) | (805 | ) | (540 | ) | ||||||
Income from equity method investments | 2 | 1 | — | |||||||||
Net income | $ | 1,504 | $ | 1,553 | $ | 1,624 | ||||||
Basic earnings per share | $ | 2.54 | $ | 2.56 | $ | 2.67 | ||||||
Diluted earnings per share | $ | 2.53 | $ | 2.55 | $ | 2.65 | ||||||
Weighted average number of common shares outstanding—Basic | 593 | 607 | 609 | |||||||||
Dilutive effect of shares issuable under stock-based compensation plans | 2 | 3 | 4 | |||||||||
Weighted average number of common shares outstanding—Diluted | 595 | 610 | 613 | |||||||||
Dividends declared per common share | $ | 0.45 | $ | — | $ | — | ||||||
The accompanying notes are an integral part of the consolidated financial statements.
F-4
COGNIZANT TECHNOLOGY SOLUTIONS CORPORATION
CONSOLIDATED STATEMENTS OF COMPREHENSIVE INCOME
(in millions)
Year Ended December 31, | ||||||||||||
2017 | 2016 | 2015 | ||||||||||
Net income | $ | 1,504 | $ | 1,553 | $ | 1,624 | ||||||
Other comprehensive income (loss), net of tax: | ||||||||||||
Foreign currency translation adjustments | 111 | (59 | ) | (55 | ) | |||||||
Change in unrealized gains and losses on cash flow hedges, net of taxes | 76 | 51 | 75 | |||||||||
Change in unrealized losses on available-for-sale investment securities, net of taxes | (3 | ) | — | (3 | ) | |||||||
Other comprehensive income (loss) | 184 | (8 | ) | 17 | ||||||||
Comprehensive income | $ | 1,688 | $ | 1,545 | $ | 1,641 | ||||||
The accompanying notes are an integral part of the consolidated financial statements.
F-5
COGNIZANT TECHNOLOGY SOLUTIONS CORPORATION
CONSOLIDATED STATEMENTS OF STOCKHOLDERS’ EQUITY
(in millions)
Class A Common Stock | Additional Paid-in Capital | Retained Earnings | Accumulated Other Comprehensive Income (Loss) | Total | |||||||||||||||||||
Shares | Amount | ||||||||||||||||||||||
Balance, December 31, 2014 | 609 | $ | 6 | $ | 556 | $ | 7,301 | $ | (123 | ) | $ | 7,740 | |||||||||||
Net income | — | — | — | 1,624 | — | 1,624 | |||||||||||||||||
Other comprehensive income | — | — | — | — | 17 | 17 | |||||||||||||||||
Common stock issued, stock-based compensation plans | 7 | — | 131 | — | — | 131 | |||||||||||||||||
Tax benefit, stock-based compensation plans | — | — | 34 | — | — | 34 | |||||||||||||||||
Stock-based compensation expense | — | — | 192 | — | — | 192 | |||||||||||||||||
Repurchases of common stock | (7 | ) | — | (460 | ) | — | — | (460 | ) | ||||||||||||||
Balance, December 31, 2015 | 609 | 6 | 453 | 8,925 | (106 | ) | 9,278 | ||||||||||||||||
Net income | — | — | — | 1,553 | — | 1,553 | |||||||||||||||||
Other comprehensive (loss) | — | — | — | — | (8 | ) | (8 | ) | |||||||||||||||
Common stock issued, stock-based compensation plans | 8 | — | 176 | — | — | 176 | |||||||||||||||||
Tax benefit, stock-based compensation plans | — | — | 24 | — | — | 24 | |||||||||||||||||
Stock-based compensation expense | — | — | 217 | — | — | 217 | |||||||||||||||||
Repurchases of common stock | (9 | ) | — | (512 | ) | — | — | (512 | ) | ||||||||||||||
Balance, December 31, 2016 | 608 | 6 | 358 | 10,478 | (114 | ) | 10,728 | ||||||||||||||||
Net income | — | — | — | 1,504 | — | 1,504 | |||||||||||||||||
Other comprehensive income | — | — | — | — | 184 | 184 | |||||||||||||||||
Common stock issued, stock-based compensation plans | 9 | — | 189 | — | — | 189 | |||||||||||||||||
Stock-based compensation expense | — | — | 221 | — | — | 221 | |||||||||||||||||
Repurchases of common stock | (29 | ) | — | (719 | ) | (1,170 | ) | — | (1,889 | ) | |||||||||||||
Dividends | — | — | — | (268 | ) | — | (268 | ) | |||||||||||||||
Balance, December 31, 2017 | 588 | $ | 6 | $ | 49 | $ | 10,544 | $ | 70 | $ | 10,669 | ||||||||||||
The accompanying notes are an integral part of the consolidated financial statements.
F-6
COGNIZANT TECHNOLOGY SOLUTIONS CORPORATION
CONSOLIDATED STATEMENTS OF CASH FLOWS
(in millions)
Year Ended December 31, | |||||||||||
2017 | 2016 | 2015 | |||||||||
Cash flows from operating activities: | |||||||||||
Net income | $ | 1,504 | $ | 1,553 | $ | 1,624 | |||||
Adjustments to reconcile net income to net cash provided by operating activities: | |||||||||||
Depreciation and amortization | 443 | 379 | 330 | ||||||||
Provision for doubtful accounts | 15 | 12 | 10 | ||||||||
Deferred income taxes | 124 | (91 | ) | (126 | ) | ||||||
Stock-based compensation expense | 221 | 217 | 192 | ||||||||
Other | (86 | ) | 46 | 49 | |||||||
Changes in assets and liabilities: | |||||||||||
Trade accounts receivable | (249 | ) | (330 | ) | (322 | ) | |||||
Other current assets | (181 | ) | (104 | ) | (33 | ) | |||||
Other noncurrent assets | (89 | ) | (59 | ) | (39 | ) | |||||
Accounts payable | 16 | 6 | 19 | ||||||||
Deferred revenue, current and noncurrent | 18 | (38 | ) | 50 | |||||||
Other current and noncurrent liabilities | 671 | 54 | 433 | ||||||||
Net cash provided by operating activities | 2,407 | 1,645 | 2,187 | ||||||||
Cash flows from investing activities: | |||||||||||
Purchases of property and equipment | (284 | ) | (300 | ) | (273 | ) | |||||
Purchases of available-for-sale investment securities | (3,120 | ) | (4,231 | ) | (2,050 | ) | |||||
Proceeds from maturity or sale of available-for-sale investment securities | 3,404 | 3,982 | 1,290 | ||||||||
Purchases of held-to-maturity investment securities | (1,221 | ) | (54 | ) | — | ||||||
Proceeds from maturity of held-to-maturity investment securities | 404 | 15 | — | ||||||||
Purchases of other investments | (385 | ) | (884 | ) | (954 | ) | |||||
Proceeds from maturity or sale of other investments | 836 | 843 | 618 | ||||||||
Payments for business combinations, net of cash acquired, and equity and cost method investments | (216 | ) | (334 | ) | (2 | ) | |||||
Net cash (used in) investing activities | (582 | ) | (963 | ) | (1,371 | ) | |||||
Cash flows from financing activities: | |||||||||||
Issuance of common stock under stock-based compensation plans | 189 | 176 | 131 | ||||||||
Repurchases of common stock | (1,889 | ) | (512 | ) | (460 | ) | |||||
Repayment of term loan borrowings and capital lease obligations | (95 | ) | (57 | ) | (53 | ) | |||||
Net change in notes outstanding under the revolving credit facility | 75 | (350 | ) | (300 | ) | ||||||
Dividends paid | (265 | ) | — | — | |||||||
Net cash (used in) financing activities | (1,985 | ) | (743 | ) | (682 | ) | |||||
Effect of exchange rate changes on cash and cash equivalents | 51 | (30 | ) | (19 | ) | ||||||
(Decrease) increase in cash and cash equivalents | (109 | ) | (91 | ) | 115 | ||||||
Cash and cash equivalents, beginning of year | 2,034 | 2,125 | 2,010 | ||||||||
Cash and cash equivalents, end of period | $ | 1,925 | $ | 2,034 | $ | 2,125 | |||||
Supplemental information: | |||||||||||
Cash paid for income taxes during the year | $ | 587 | $ | 845 | $ | 579 | |||||
Cash interest paid during the year | $ | 21 | $ | 16 | $ | 14 | |||||
The accompanying notes are an integral part of the consolidated financial statements.
F-7
COGNIZANT TECHNOLOGY SOLUTIONS CORPORATION
NOTES TO CONSOLIDATED FINANCIAL STATEMENTS
(Dollars in millions, except share data)
Note 1 — Business Description and Summary of Significant Accounting Policies
The terms “Cognizant,” “we,” “our,” “us” and “the Company” refer to Cognizant Technology Solutions Corporation and its subsidiaries unless the context indicates otherwise.
Description of Business. We are one of the world’s leading professional services companies. We are in business to help our customers adapt, compete and grow in the face of continual shifts and disruptions within their markets. We do so by partnering with them to apply technology to transform their business, operating and technology models allowing them to achieve the full value of digitizing their entire enterprises. We call this being “digital at scale.” When implemented, it enables customers to achieve more efficient and effective operations while reshaping their business models for innovation and growth. Our industry-based, consultative approach helps customers envision, build and run more innovative and efficient businesses. Our core competencies include: business, process, operations and technology consulting, application development and systems integration, enterprise information management, application testing, application maintenance, information technology, or IT, infrastructure services, and business process services. We tailor our services and solutions to specific industries and use an integrated global delivery model that employs customer service teams based at customer locations and delivery teams located at dedicated global and regional delivery centers.
Basis of Presentation, Principles of Consolidation and Use of Estimates. The consolidated financial statements are presented in accordance with generally accepted accounting principles in the United States of America, or GAAP, and reflect the consolidated financial position, results of operations, comprehensive income and cash flows of our consolidated subsidiaries for all periods presented. All intercompany balances and transactions have been eliminated in consolidation.
The preparation of financial statements requires management to make estimates and assumptions that affect the reported amounts in the consolidated financial statements and accompanying disclosures. We evaluate our estimates on a continuous basis. We base our estimates on historical experience and on various other assumptions that are believed to be reasonable under the circumstances. The actual amounts may vary from the estimates used in the preparation of the accompanying consolidated financial statements. We have reclassified certain prior period amounts to conform to current period presentation.
Cash and Cash Equivalents and Investments. Cash and cash equivalents consist of all cash balances, including money market funds and liquid instruments. Liquid instruments are classified as cash equivalents when their maturities at the date of purchase are 90 days or less and as short-term investments when their maturities at the date of purchase are greater than 90 days.
We determine the appropriate classification of our investments in marketable securities at the date of purchase and reevaluate such designation at each balance sheet date. We have classified and accounted for our marketable securities as either trading, available-for-sale or held-to-maturity. After consideration of our risk versus reward objectives, as well as our liquidity requirements, we may sell our trading and available-for-sale securities prior to their stated maturities. We classify these marketable securities with maturities at the date of purchase beyond 90 days as short-term investments based on their highly liquid nature and because such marketable securities represent an investment of cash that is available for current operations. Our held-to-maturity investment securities are financial instruments for which we have the intent and ability to hold to maturity and we classify these securities with maturities beyond 90 days but less than one year as short-term investments. Any held-to-maturity investment securities with maturities beyond one year from the balance sheet date are classified as noncurrent.
Trading securities are reported at fair value with changes in unrealized gains and losses recorded in Other income (expense), net in our consolidated statements of operations. Available-for-sale securities are reported at fair value with changes in unrealized gains and losses recorded as a separate component of accumulated other comprehensive income (loss) until realized. We determine the cost of the securities sold based on the specific identification method. Held-to-maturity securities are reported at amortized cost. Time deposits with financial institutions are valued at cost, which approximates fair value.
Interest and amortization of premiums and discounts for debt securities are included in interest income. On a quarterly basis, we evaluate our available-for-sale and held-to-maturity investments for possible other-than-temporary impairment by reviewing quantitative and qualitative factors. If we do not intend to sell the security or it is not more likely than not that we will be required to sell the security before recovery of our amortized cost, we evaluate quantitative and qualitative criteria to determine whether we expect to recover the amortized cost basis of the security. If we do not expect to recover the entire amortized cost basis of the security, we consider the security to be other-than-temporarily impaired and we record the difference
F-8
between the security’s amortized cost basis and its recoverable amount in earnings and the difference between the security’s recoverable amount and fair value in other comprehensive income. If we intend to sell the security or it is more likely than not that we will be required to sell the security before recovery of its amortized cost basis, the security is also considered other-than-temporarily impaired and we recognize the entire difference between the security’s amortized cost basis and its fair value in earnings.
Allowance for Doubtful Accounts. We maintain an allowance for doubtful accounts for estimated losses resulting from the inability of our customers to make required payments. The allowance for doubtful accounts is determined by evaluating the relative credit-worthiness of each customer, historical collections experience and other information, including the aging of the receivables. We evaluate the collectibility of our accounts receivable on an on-going basis and write off accounts when they are deemed to be uncollectible.
Unbilled Accounts Receivable. Unbilled accounts receivable represent revenues recognized that are to be billed in subsequent periods, as per the terms of the related contracts.
Short-term Financial Assets and Liabilities. Cash and certain cash equivalents, trade receivables, accounts payable and other accrued liabilities are short-term in nature and, accordingly, their carrying values approximate fair value.
Property and Equipment. Property and equipment are stated at cost, net of accumulated depreciation. Depreciation is calculated on a straight-line basis over the estimated useful lives of the assets. Leasehold improvements are amortized on a straight-line basis over the shorter of the term of the lease or the estimated useful life of the improvement. In India, leasehold land is leased by us from the government of India with lease terms ranging up to 99 years. Lease payments are made at the inception of the lease agreement and amortized over the lease term. Maintenance and repairs are expensed as incurred, while renewals and betterments are capitalized. Deposits paid towards acquisition of long-lived assets and the cost of assets not put in use before the balance sheet date are disclosed under the caption “Capital work-in-progress” in Note 6.
Internal Use Software. We capitalize certain costs that are incurred to purchase, develop and implement internal-use software during the application development phase, which primarily include coding, testing and certain data conversion activities. Capitalized costs are amortized on a straight-line basis over the useful life of the software. Costs incurred in performing activities associated with the preliminary project phase and the post-implementation phase are expensed as incurred.
Software to be Sold, Leased or Marketed. We capitalize costs incurred after technological feasibility is reached but before software is available for general release to customers, which primarily include coding and testing activities. Once the product is ready for general release, capitalized costs are amortized over the useful life of the software.
Business Combinations. We account for business combinations using the acquisition method, which requires the identification of the acquirer, the determination of the acquisition date and the allocation of the purchase price paid by the acquirer to the identifiable tangible and intangible assets acquired, the liabilities assumed, including any contingent consideration and any noncontrolling interest in the acquiree at their acquisition date fair values. Goodwill represents the excess of the purchase price over the fair value of net assets acquired, including the amount assigned to identifiable intangible assets. Identifiable intangible assets with finite lives are amortized over their useful lives. Acquisition-related costs are expensed in the periods in which the costs are incurred. The results of operations of acquired businesses are included in our consolidated financial statements from the acquisition date.
Equity Method Investments. Equity investments that give us the ability to exercise significant influence, but not control, over an investee are accounted for using the equity method of accounting and recorded in the caption "Long-term investments" on our consolidated statements of financial position. Equity method investments are initially recorded at cost and any excess cost over our proportionate share of the fair value of the net assets of the investee at the acquisition date is recognized as goodwill and included in the carrying amount of the investment. We periodically review the carrying value of our equity method investments to determine if there has been an other-than-temporary decline in carrying value. The Company's proportionate share of the net income or loss of the investee is recorded in the caption "Income from equity method investments" on our consolidated statements of operations. The investment balance is increased or decreased for cash contributions or distributions to or from these investees. If we subsequently obtain control of the investee, the existing carrying value of the investment is remeasured to the fair value on the change of control date and any gain or loss is recognized in results of operations.
Cost Method Investments. Equity investments without readily determinable fair values in which we do not exercise significant influence or control are accounted for using the cost method of accounting and recorded in the caption "Long-term investments" on our consolidated statements of financial position. Investments are carried at cost and are adjusted only for
F-9
other-than-temporary declines in fair value, certain distributions and additional investments. We periodically review the carrying value of our cost method investments to determine if there has been an other-than-temporary decline in carrying value.
Long-lived Assets and Finite-lived Intangibles. We review long-lived assets and certain finite-lived identifiable intangibles for impairment whenever events or changes in circumstances indicate that the carrying amount of an asset may not be recoverable. We recognize an impairment loss when the sum of undiscounted expected future cash flows is less than the carrying amount of such assets. The impairment loss is determined as the amount by which the carrying amount of the asset exceeds the fair value of the asset. Intangible assets consist primarily of customer relationships and developed technology, which are being amortized on a straight-line basis over their estimated useful lives.
Goodwill and Indefinite-lived Intangibles. We evaluate goodwill and indefinite-lived intangible assets for impairment at least annually, or as circumstances warrant. Goodwill is evaluated at the reporting unit level by comparing the fair value of the reporting unit with its carrying amount including goodwill. An impairment of goodwill exists if the carrying amount of the reporting unit exceeds its fair value. The impairment loss is the amount by which the carrying amount exceeds the reporting unit’s fair value, limited to the total amount of goodwill allocated to that reporting unit. For indefinite-lived intangible assets, if our annual qualitative assessment indicates that it is more-likely-than-not that an indefinite-lived intangible asset is impaired, we test the assets for impairment by comparing the fair value of such assets to their carrying value. If an impairment is indicated, a write down to the fair value of indefinite-lived intangible asset is recorded.
Stock Repurchase Program. Under the Board of Directors authorized stock repurchase program, the Company is authorized to repurchase its Class A common stock through open market purchases, including under a trading plan adopted pursuant to Rule 10b5-1 of the Exchange Act, or in private transactions, including through accelerated stock repurchase agreements (or ASRs) entered into with financial institutions, in accordance with applicable federal securities laws. We account for the repurchased shares as constructively retired. Shares are returned to the status of authorized and unissued shares at the time of repurchase or in the periods they are delivered, if repurchased under an ASR. To reflect share repurchases in the consolidated statement of financial position, the Company (i) reduces common stock for the par value of the shares, (ii) reduces additional paid-in capital for the amount in excess of par during the period in which the shares are repurchased and (iii) records any residual amount in excess of available additional paid-in capital to retained earnings. Upfront payments related to ASRs are accounted for as a reduction to stockholders’ equity in the consolidated statement of financial position in the period the payments are made.
Revenue Recognition. Revenues related to time-and-materials contracts are recognized as the service is performed and amounts are earned. Revenues from transaction- or volume-based priced contracts are recognized as transactions are processed and amounts are earned. Revenues related to fixed-price contracts for highly complex application development and systems integration services are recognized as the service is performed using the percentage of completion method of accounting, under which the total value of revenues is recognized on the basis of the percentage that each contract’s total labor cost to date bears to the total expected labor costs (cost to cost method). Revenues related to fixed-price outsourcing services are recognized on a straight-line basis unless revenues are earned and obligations are fulfilled in a different pattern. Revenues related to fixed-price contracts for consulting or other technology services are recognized as services are performed on a proportional performance basis based upon the level of effort.
For all services, revenues are earned and recognized only when all of the following criteria are met: evidence of an arrangement exists, the price is fixed or determinable, the services have been rendered and collectibility is reasonably assured. Contingent or incentive revenues are recognized when the contingency is satisfied and we conclude the amounts are earned. Volume discounts are recorded as a reduction of revenues as services are provided. Revenues also include the reimbursement of out-of-pocket expenses.
Costs to deliver services are expensed as incurred with the exception of specific costs directly related to transition or set-up activities for outsourcing contracts. Transition costs are deferred and expensed ratably over the period of service. Deferred amounts are protected by collected cash or early termination penalty clauses and are monitored regularly for impairment. Impairment losses are recorded when projected remaining undiscounted operating cash flows of the related contract are not sufficient to recover the carrying amount of the contract assets. Deferred transition costs were approximately $267 million and $188 million as of December 31, 2017 and 2016, respectively, and are included in other noncurrent assets in our consolidated statements of financial position. Costs related to warranty provisions are accrued at the time the related revenues are recorded.
We may enter into arrangements that consist of multiple elements. Such arrangements may include any combination of our products, solutions and services. For arrangements with multiple deliverables, we evaluate at the inception of each new arrangement all deliverables to determine whether they represent separate units of accounting. For arrangements with multiple units of accounting, other than arrangements that contain software licenses and software-related services, we allocate
F-10
consideration among the units of accounting, where separable, based on their relative selling price. Relative selling price is determined based on vendor-specific objective evidence, or VSOE, if it exists. Otherwise, third-party evidence of selling price is used, when it is available, and in circumstances when neither VSOE nor third-party evidence of selling price is available, management’s best estimate of selling price is used. Revenues are recognized for each unit of accounting based on our revenue recognition policy described above.
Fixed-price contracts are generally cancelable subject to a specified notice period. All services provided by us through the date of cancellation are due and payable under the contract terms. We issue invoices related to fixed-price contracts based upon achievement of milestones during a project or other contractual terms. Differences between the timing of billing, based on contract milestones or other contractual terms, and the recognition of revenues are recognized as either unbilled receivables or deferred revenue. Estimates of certain fixed-price contracts are subject to adjustment as a project progresses to reflect changes in expected completion costs or efforts. The cumulative impact of any revision in estimates is reflected in the financial reporting period in which the change in estimate becomes known and any anticipated losses on contracts are recognized immediately.
We also generate product revenues from licensing our software. For perpetual software license arrangements that do not require significant modification or customization of the underlying software, revenues are recognized when the software is delivered and all other software revenue recognition criteria are met. For software license arrangements that require significant functionality enhancements or modification of the software, revenues for the software license and those services are recognized as those services are performed. For software license arrangements that include a right to use the product for a defined period of time, we recognize revenues ratably over the term of the license.
We may enter into arrangements with customers that purchase both software licenses and software-related services from us at the same time, or within close proximity of one another (referred to as software-related multiple-element arrangements). Such software related multiple-element arrangements may include software licenses, software license updates, product support contracts and other software-related services. For those software related multiple-element arrangements, we apply the residual method to determine the amount of software license revenues. Under the residual method, if VSOE of fair value exists for undelivered elements in a multiple-element arrangement, revenues equal to the fair value of the undelivered elements are deferred with the remaining portion of the arrangement consideration generally recognized upon delivery of the software license. For arrangements in which VSOE of fair value does not exist for each software-related undelivered element, revenues for the software license are deferred and not recognized until VSOE of fair value is available for the undelivered element or delivery of each element has occurred. If the only undelivered element is a service, revenues from the delivered element are recognized over the service period.
We also enter into multiple-element arrangements that may include a combination of software licenses and various software-related and non-software-related services. In such arrangements, we first allocate the total arrangement consideration, based on relative selling prices, between the software group of elements and the non-software group of elements. We then further allocate consideration within the software group to the respective elements within that group following the software-related multiple-element arrangements policies described above. For the non-software group of elements, we further allocate consideration to the respective elements based on relative selling prices. After the arrangement consideration has been allocated to the individual elements, we account for each respective element in the arrangement as described above.
Stock-Based Compensation. Stock-based compensation expense for awards of equity instruments to employees and non-employee directors is determined based on the grant-date fair value of those awards. We recognize these compensation costs net of an estimated forfeiture rate over the requisite service period of the award. Forfeitures are estimated on the date of grant and revised if actual or expected forfeiture activity differs materially from original estimates.
Foreign Currency. The assets and liabilities of our foreign subsidiaries whose functional currency is not the U.S. dollar are translated into U.S. dollars from functional currencies at current exchange rates while revenues and expenses are translated from functional currencies at average monthly exchange rates. The resulting translation adjustments are recorded in the caption "Accumulated other comprehensive income (loss)" on the accompanying consolidated statements of financial position.
Foreign currency transactions and balances are those that are denominated in a currency other than the subsidiary’s functional currency. The U.S. dollar is the functional currency for certain foreign subsidiaries who conduct business predominantly in U.S. dollars. For these subsidiaries, transactions and balances denominated in the local currency are foreign currency transactions. Foreign currency transactions and balances related to non-monetary assets and liabilities are remeasured to the functional currency of the subsidiary at historical exchange rates while monetary assets and liabilities are remeasured to the functional currency of the subsidiary at current exchange rates. Foreign currency exchange gains or losses from
F-11
remeasurement are included in the caption "Foreign currency exchange gain (losses), net" on our consolidated statement of operations together with gains or losses on our undesignated foreign currency hedges.
Derivative Financial Instruments. Derivative financial instruments are recorded on the balance sheet as either an asset or liability measured at its fair value as of the reporting date. Our derivative financial instruments consist of foreign exchange forward contracts. For derivative financial instruments to qualify for hedge accounting, the following criteria must be met: (1) the hedging instrument must be designated as a hedge; (2) the hedged exposure must be specifically identifiable and must expose us to risk; and (3) it must be expected that a change in fair value of the derivative financial instrument and an opposite change in the fair value of the hedged exposure will have a high degree of correlation. Changes in our derivatives’ fair values are recognized in income unless specific hedge accounting and documentation criteria are met (i.e., the instruments are designated and accounted for as hedges). We record the effective portion of the unrealized gains and losses on our derivative financial instruments that are designated as cash flow hedges in the caption "Accumulated other comprehensive income (loss)" in the accompanying consolidated statements of financial position. Any ineffectiveness or excluded portion of a designated cash flow hedge is recognized in income. Upon occurrence of the hedged transaction, the gains and losses on the derivative are recognized in income.
Income Taxes. We provide for income taxes utilizing the asset and liability method of accounting. Under this method, deferred income taxes are recorded to reflect the tax consequences in future years of differences between the tax basis of assets and liabilities and their financial reporting amounts at each balance sheet date, based on enacted tax laws and statutory tax rates applicable to the periods in which the differences are expected to affect taxable income. If it is determined that it is more likely than not that future tax benefits associated with a deferred income tax asset will not be realized, a valuation allowance is provided. The effect of a change in tax rates on deferred income tax assets and liabilities is recognized in the provision for income taxes in the period that includes the enactment date. Beginning in 2017, differences between actual tax benefits realized on employee stock awards and estimated tax benefits at date of grant are adjusted to our provision for income taxes upon vesting or exercise of the stock award. Our provision for income taxes also includes the impact of provisions established for uncertain income tax positions, as well as any related penalties and interest.
Earnings Per Share, or EPS. Basic EPS excludes dilution and is computed by dividing earnings available to common stockholders by the weighted-average number of common shares outstanding for the period. Diluted EPS includes all potential dilutive common stock in the weighted average shares outstanding. For purposes of computing diluted earnings per share for the years ended December 31, 2017, 2016 and 2015, respectively, 2 million, 3 million and 4 million shares were assumed to have been outstanding related to common share equivalents. We exclude from the calculation of diluted EPS options with exercise prices that are greater than the average market price and shares related to stock-based awards whose combined exercise price and unamortized fair value were greater in each of those periods than the average market price of our common stock for the period, because their effect would be anti-dilutive. We excluded less than 1 million of anti-dilutive shares in each of 2017, 2016 and 2015 from our diluted EPS calculation. We include performance stock unit awards in the dilutive potential common shares when they become contingently issuable per the authoritative guidance and exclude the awards when they are not contingently issuable.
F-12
Recently Adopted Accounting Pronouncements.
Date Issued and Topic | Date Adopted and Method | Description | Impact |
March 2016 Derivatives and Hedging | January 1, 2017 Prospectively | This update clarifies the effect of derivative contract novations on existing hedge accounting relationships. As it relates to derivative instruments, novation refers to replacing one of the parties to a derivative instrument with a new party, which may occur for a variety of reasons such as: financial institution mergers, intercompany transactions, an entity exiting a particular derivatives business or relationship, or because of laws or regulatory requirements. The update clarifies that a change in the counterparty to a derivative instrument that has been designated as the hedging instrument does not, in and of itself, require dedesignation of that hedge accounting relationship provided that all other hedge accounting criteria continue to be met. | The adoption of this update did not have any effect on our financial condition or results of operations. |
March 2016 Stock Compensation | January 1, 2017 Prospectively / Retrospectively | This update requires excess tax benefits and tax deficiencies to be recorded to the provision for income taxes in the income statement when the awards vest or are exercised and provides an accounting policy election to account for forfeitures as they occur. The update also clarifies that all cash payments made on an employee’s behalf for withheld shares should be presented as financing activity in the statement of cash flows and cash flows related to excess tax benefits should be classified along with other income tax cash flows as an operating activity. | The primary impact of the adoption of this update is that we prospectively reduced our 2017 provision for income taxes and earning per share by $40 million or $0.07, respectively, for the recognition of net excess income tax benefits rather than an increase to additional paid-in capital. We elected to continue to estimate expected forfeitures to determine the stock compensation expense to be recognized each period. We also elected to retrospectively apply the presentation requirements for cash flows related to excess tax benefits for all periods presented, which resulted in an increase to both net cash provided by operating activities and net cash used in financing activities of $24 million and $34 million during 2016 and 2015, respectively. |
January 2017 Business Combinations | January 1, 2017 Prospectively | This update clarifies the definition of a business and requires a business to include at least an input and a substantive process that together significantly contribute to the ability to create outputs. The update also states that the definition of a business is not met if substantially all of the fair value of the gross assets acquired is concentrated in a single identifiable asset or a group of similar identifiable assets. | The adoption of this update did not have a material effect on our financial condition or results of operations. |
January 2017 Goodwill | January 1, 2017 Prospectively | This update eliminates the need to calculate the implied fair value of goodwill when an impairment is indicated. The update states that goodwill impairment is measured as the excess of a reporting unit’s carrying value over its fair value, not to exceed the carrying amount of goodwill. | The adoption of this update did not have any effect on our financial condition or results of operations. |
F-13
New Accounting Pronouncements. | |||
Date Issued and Topic | Effective Date | Description | Impact |
May 2014 Revenue | January 1, 2018 | The new standard, as amended, sets forth a single comprehensive model for recognizing and reporting revenues. The standard also requires additional financial statement disclosures that will enable users to understand the nature, amount, timing and uncertainty of revenues and cash flows relating to customer contracts. The standard allows for two methods of adoption: the full retrospective adoption, which requires the standard to be applied to each prior period presented, or the modified retrospective adoption, which requires the cumulative effect of adoption to be recognized as an adjustment to opening retained earnings in the period of adoption. We will adopt the standard using the modified retrospective method. | The most significant impacts of the new standard primarily relate to (1) changes in the method used to measure progress on our application maintenance, consulting and business process services fixed-price contracts, (2) the longer period of amortization for costs to fulfill a contract, as well as (3) the timing of revenue recognition and allocation of purchase price on our software license contracts. We expect the one-time adjustment to opening retained earnings in connection with the adoption of this standard to be an increase of approximately $119 million, after a tax impact of approximately $36 million. |
February 2016 Lease Accounting | January 1, 2019 | The new standard replaces the existing guidance on leases and requires the lessee to recognize a right-of-use asset and a lease liability for all leases with lease terms equal to or greater than twelve months. For finance leases, the lessee would recognize interest expense and amortization of the right-of-use asset, and for operating leases, the lessee would recognize total lease expense on a straight-line basis. Upon adoption, entities will be required to use a modified retrospective transition which provides for certain practical expedients. Entities are required to apply the new standard at the beginning of the earliest comparative period presented. | We expect the requirement to recognize a right-of-use asset and a lease liability for operating leases to have a material impact on the presentation of our consolidated statements of financial position. |
March 2017 Nonrefundable Fees and Other Costs | January 1, 2019 | This update shortens the amortization period for certain callable debt securities held at a premium to the earliest call date. The amendments do not require an accounting change for securities held at a discount. Upon adoption, entities will be required to use a modified retrospective transition with the cumulative effect adjustment recognized to retained earnings as of the beginning of the period of adoption. | We are currently evaluating the effect the amendments will have on our consolidated financial statements and related disclosures. |
May 2017 Share-based Payment Arrangements | January 1, 2018 | This update amends the scope of modification accounting for share-based payment arrangements. The amendment requires that an entity will not apply modification accounting to a share-based payment award if the award’s fair value, vesting conditions and classification are the same immediately before and after the modification. Upon adoption, entities will be required to apply this guidance prospectively to an award modified on or after the adoption date. | We do not expect the adoption of this update to have a material effect on our financial condition or results of operations. |
F-14
Date Issued and Topic | Effective Date | Description | Impact |
August 2017 Derivatives and Hedging | January 1, 2019 | This update expands and refines hedge accounting for both financial and nonfinancial hedging strategies to better align hedge accounting with companies’ risk management strategies. The update also amends the presentation and disclosure requirements and changes how companies assess effectiveness of their hedges. Adoption methods will differ by type of hedge. | We are currently evaluating the effect the update will have on our consolidated financial statements and related disclosures. |
February 2018 Income Statement - Reporting Comprehensive Income | January 1, 2019 | This update provides an option for entities to reclassify stranded tax effects caused by the newly-enacted Tax Cuts and Jobs Act, or Tax Reform Act, from accumulated other comprehensive income to retained earnings. Upon adoption, entities have the option to apply the update retrospectively or in the period of adoption. Early adoption of this update is permitted. | We expect to early adopt this update as of January 1, 2018. The adoption is expected to result in an increase of $1 million in accumulated other comprehensive income and a corresponding decrease to opening retained earnings. |
Note 2 — Internal Investigation and Related Matters
We are conducting an internal investigation focused on whether certain payments relating to Company-owned facilities in India were made improperly and in possible violation of the U.S. Foreign Corrupt Practices Act, or FCPA, and other applicable laws. The investigation is also examining various other payments made in small amounts in India that may not have complied with Company policy or applicable law. In September 2016, we voluntarily notified the U.S. Department of Justice, or DOJ, and Securities and Exchange Commission, or SEC, and are cooperating fully with both agencies. The investigation is being conducted under the oversight of the Audit Committee, with the assistance of outside counsel. To date, the investigation has identified a total of approximately $6 million in payments made between 2009 and 2016 that may have been improper. During the year ended December 31, 2016, we recorded out-of-period corrections related to $4 million of such payments that had been previously capitalized that should have been expensed. Of the $4 million out-of-period correction, $3 million was recorded in the third quarter of 2016 and $1 million was recorded in the fourth quarter of 2016. These out-of-period corrections and the other $2 million in potentially improper payments were not material to any previously issued financial statements. There were no adjustments recorded during the year ended December 31, 2017.
Note 3 — Business Combinations
All acquisitions completed during the three years ended December 31, 2017, 2016 and 2015 were not individually material to our operations, financial position or cash flow. Accordingly, pro forma results have not been presented. These acquisitions were included in our consolidated financial statements as of the date on which the businesses were acquired. We have allocated the purchase price related to these transactions to tangible and intangible assets and liabilities, including non-deductible goodwill, based on their estimated fair values.
2017
In 2017, we completed five business combinations for total consideration of approximately $233 million, inclusive of contingent consideration. These acquisitions included (a) an intelligent products and solutions company based in Japan specializing in digital strategy, product design and engineering, the internet of things, and enterprise mobility that expands our digital transformation portfolio and capabilities, (b) a U.S. healthcare management consulting firm that strengthens our consulting service offerings within the healthcare consulting market, (c) a leading national provider of business process services to the U.S. government healthcare market that further strengthens our business process-as-a-service solutions for government and public health programs, (d) a provider of digital experience and marketing solutions for some of the world's most recognized brands and an independent Adobe partner in Europe that will enhance our ability to deliver business critical digital experience solutions, and (e) an independent full-service digital agency in the UK specializing in customer experience, digital strategy, technology and content creation that will enhance and expand our digital interactive expertise in experience design, human science-driven insights and analytics.
F-15
2016
In 2016, we completed eight business combinations for total consideration of approximately $287 million. These transactions included (a) an acquisition of a global consulting and technology services company that strengthens and expands our digital capabilities to deliver cloud-based application services, (b) three acquisitions of delivery centers spanning several industries such as oil and gas services, steel and metal products, and banking and insurance to enhance our delivery capabilities across Europe along with multi-year service agreements, (c) an acquisition of tangible property, an assembled workforce and a multi-year service agreement which qualifies as a business combination under accounting guidance, (d) an acquisition of a global consulting company that offers digital innovation, strategy, design and technology services, (e) an acquisition of a digital marketing and customer experience agency that expands our digital business capabilities across Europe, and (f) an acquisition of an Australia-based consulting, business transformation and technology services provider in the insurance industry.
2015
We did not complete any significant business combinations in 2015.
Allocation of Purchase Price
The allocations of purchase price to the fair value of the aggregate assets acquired and liabilities assumed were as follows:
2017 | 2016 | ||||||||||
Fair Value | Weighted Average Useful Life | Fair Value | Weighted Average Useful Life | ||||||||
(in millions) | (in millions) | ||||||||||
Cash | $ | 8 | $ | 17 | |||||||
Current assets | 47 | 84 | |||||||||
Property, plant and equipment and other noncurrent assets | 19 | 53 | |||||||||
Non-deductible goodwill | 125 | 157 | |||||||||
Customer relationship intangible assets | 147 | 10.6 years | 199 | 6.6 years | |||||||
Other intangible assets | 4 | 2.4 years | 1 | 3.3 years | |||||||
Current liabilities | (50 | ) | (173 | ) | |||||||
Noncurrent liabilities | (67 | ) | (51 | ) | |||||||
Purchase price | $ | 233 | $ | 287 | |||||||
For acquisitions completed in 2017, the allocation is preliminary and will be finalized as soon as practicable within the measurement period, but in no event later than one year following the date of acquisition. The primary items that generated goodwill are the value of the acquired assembled workforces and synergies between the acquired companies and us, neither of which qualify as an amortizable intangible asset.
Note 4 — Realignment Charges
In 2017, we began a realignment of our business to accelerate the shift to digital services and solutions while improving the overall efficiency of our operations. During 2017, we incurred $72 million in realignment charges, reported in "Selling, general and administrative expenses" in our consolidated statements of operations. The realignment charges are comprised of severance costs, including those related to a voluntary separation program, or VSP, advisory fees related to non-routine shareholder matters and to the development of our realignment and return of capital programs and lease termination costs.
Realignment charges for the year ended December 31, 2017 were as follows:
(in millions) | ||||
Employee separations | $ | 53 | ||
Advisory fees | 18 | |||
Lease termination costs | 1 | |||
Total realignment costs | $ | 72 | ||
There were no realignment charges incurred in 2016 and 2015.
F-16
Note 5 — Investments
Our investments were as follows as of December 31:
2017 | 2016 | ||||||
(in millions) | |||||||
Short-term investments: | |||||||
Trading investment securities | $ | 25 | $ | 25 | |||
Available-for-sale investment securities | 1,972 | 2,264 | |||||
Held-to-maturity investment securities | 745 | 40 | |||||
Time deposits | 389 | 806 | |||||
Total short-term investments | $ | 3,131 | $ | 3,135 | |||
Long-term investments: | |||||||
Equity and cost method investments | $ | 74 | $ | 62 | |||
Held-to-maturity investment securities | 161 | — | |||||
Total long-term investments | $ | 235 | $ | 62 | |||
Trading Investment Securities
Our trading investment securities consist of a U.S. dollar denominated investment in a fixed income mutual fund. Unrealized losses recognized on our trading investment securities were $1 million in each of the years ended December 31, 2017 and 2016. There were no realized gains or losses on trading securities during the years ended December 31, 2017 and 2016. The value of the fixed income mutual fund invested in fixed income securities is based on the net asset value, or NAV, of the fund, with appropriate consideration of the liquidity and any restrictions on disposition of our investment in the fund.
Available-for-Sale Investment Securities
Our available-for-sale investment securities consist of U.S. dollar denominated investments primarily in U.S. Treasury notes, U.S. government agency debt securities, municipal debt securities, non-U.S. government debt securities, U.S. and international corporate bonds, certificates of deposit, commercial paper, debt securities issued by supranational institutions, and asset-backed securities, including securities backed by auto loans, credit card receivables, and other receivables. Our investment guidelines are to purchase securities which are investment grade at the time of acquisition. We monitor the credit ratings of the securities in our portfolio on an ongoing basis.
The amortized cost, gross unrealized gains and losses and fair value of our available-for-sale investment securities were as follows at December 31:
2017 | |||||||||||||||
Amortized Cost | Unrealized Gains | Unrealized Losses | Fair Value | ||||||||||||
(in millions) | |||||||||||||||
U.S. Treasury and agency debt securities | $ | 667 | $ | — | $ | (6 | ) | $ | 661 | ||||||
Corporate and other debt securities | 439 | — | (2 | ) | 437 | ||||||||||
Certificates of deposit and commercial paper | 450 | — | — | 450 | |||||||||||
Asset-backed securities | 297 | — | (2 | ) | 295 | ||||||||||
Municipal debt securities | 130 | — | (1 | ) | 129 | ||||||||||
Total available-for-sale investment securities | $ | 1,983 | $ | — | $ | (11 | ) | $ | 1,972 | ||||||
F-17
2016 | |||||||||||||||
Amortized Cost | Unrealized Gains | Unrealized Losses | Fair Value | ||||||||||||
(in millions) | |||||||||||||||
U.S. Treasury and agency debt securities | $ | 605 | $ | — | $ | (3 | ) | $ | 602 | ||||||
Corporate and other debt securities | 407 | — | (2 | ) | 405 | ||||||||||
Certificates of deposit and commercial paper | 910 | 1 | — | 911 | |||||||||||
Asset-backed securities | 232 | — | (1 | ) | 231 | ||||||||||
Municipal debt securities | 116 | — | (1 | ) | 115 | ||||||||||
Total available-for-sale investment securities | $ | 2,270 | $ | 1 | $ | (7 | ) | $ | 2,264 | ||||||
The fair value and related unrealized losses of our available-for-sale investment securities in a continuous unrealized loss position for less than 12 months and for 12 months or longer were as follows as of December 31:
2017 | |||||||||||||||||||||||
Less than 12 Months | 12 Months or More | Total | |||||||||||||||||||||
Fair Value | Unrealized Losses | Fair Value | Unrealized Losses | Fair Value | Unrealized Losses | ||||||||||||||||||
(in millions) | |||||||||||||||||||||||
U.S. Treasury and agency debt securities | $ | 519 | $ | (4 | ) | $ | 124 | $ | (2 | ) | $ | 643 | $ | (6 | ) | ||||||||
Corporate and other debt securities | 297 | (1 | ) | 126 | (1 | ) | 423 | (2 | ) | ||||||||||||||
Certificates of deposit and commercial paper | 49 | — | — | — | 49 | — | |||||||||||||||||
Asset-backed securities | 193 | (1 | ) | 94 | (1 | ) | 287 | (2 | ) | ||||||||||||||
Municipal debt securities | 107 | (1 | ) | 18 | — | 125 | (1 | ) | |||||||||||||||
Total | $ | 1,165 | $ | (7 | ) | $ | 362 | $ | (4 | ) | $ | 1,527 | $ | (11 | ) | ||||||||
2016 | |||||||||||||||||||||||
Less than 12 Months | 12 Months or More | Total | |||||||||||||||||||||
Fair Value | Unrealized Losses | Fair Value | Unrealized Losses | Fair Value | Unrealized Losses | ||||||||||||||||||
(in millions) | |||||||||||||||||||||||
U.S. Treasury and agency debt securities | $ | 526 | $ | (3 | ) | $ | — | $ | — | $ | 526 | $ | (3 | ) | |||||||||
Corporate and other debt securities | 342 | (2 | ) | 1 | — | 343 | (2 | ) | |||||||||||||||
Certificates of deposit and commercial paper | 185 | — | — | — | 185 | — | |||||||||||||||||
Asset-backed securities | 206 | (1 | ) | 1 | — | 207 | (1 | ) | |||||||||||||||
Municipal debt securities | 88 | (1 | ) | 1 | — | 89 | (1 | ) | |||||||||||||||
Total | $ | 1,347 | $ | (7 | ) | $ | 3 | $ | — | $ | 1,350 | $ | (7 | ) | |||||||||
The unrealized losses for the above securities as of December 31, 2017 and 2016 are primarily attributable to changes in interest rates. At each reporting date, the Company performs an evaluation of impaired available-for-sale securities to determine if the unrealized losses are other-than-temporary. As of December 31, 2017, we do not consider any of the investments to be other-than-temporarily impaired. The gross unrealized gains and losses in the above tables were recorded, net of tax, in "Accumulated other comprehensive income (loss)" in our consolidated statements of financial position.
F-18
The contractual maturities of our fixed income available-for-sale investment securities as of December 31, 2017 are set forth in the following table:
Amortized Cost | Fair Value | ||||||
(in millions) | |||||||
Due within one year | $ | 590 | $ | 590 | |||
Due after one year up to two years | 454 | 450 | |||||
Due after two years up to three years | 556 | 551 | |||||
Due after three years | 86 | 86 | |||||
Asset-backed securities | 297 | 295 | |||||
Total available-for-sale investment securities | $ | 1,983 | $ | 1,972 | |||
Asset-backed securities were excluded from the maturity categories because the actual maturities may differ from the contractual maturities since the underlying receivables may be prepaid without penalties. Further, actual maturities of debt securities may differ from those presented above since certain obligations provide the issuer the right to call or prepay the obligation prior to scheduled maturity without penalty.
Proceeds from sales of available-for-sale investment securities and the gross gains and losses that have been included in earnings as a result of those sales were as follows:
2017 | 2016 | 2015 | ||||||||||
(in millions) | ||||||||||||
Proceeds from sales of available-for-sale investment securities | $ | 2,922 | $ | 3,541 | $ | 782 | ||||||
Gross gains | $ | 1 | $ | 5 | $ | 1 | ||||||
Gross losses | (3 | ) | (4 | ) | — | |||||||
Net realized (losses) gains on sales of available-for-sale investment securities | $ | (2 | ) | $ | 1 | $ | 1 | |||||
Held-to-Maturity Investment Securities
Our held-to-maturity investment securities consist of Indian rupee denominated investments primarily in commercial paper, international corporate bonds and government debt securities. Our investment guidelines are to purchase securities that are investment grade at the time of acquisition. We monitor the credit ratings of the securities in our portfolio on an ongoing basis.
The amortized cost, gross unrealized gains and losses and fair value of held-to-maturity investment securities were as follows at December 31:
2017 | |||||||||||||||
Amortized Cost | Unrealized Gains | Unrealized Losses | Fair Value | ||||||||||||
(in millions) | |||||||||||||||
Short-term investments: | |||||||||||||||
Corporate and other debt securities | $ | 346 | $ | — | $ | (1 | ) | $ | 345 | ||||||
Commercial paper | 399 | — | (2 | ) | 397 | ||||||||||
Total short-term held-to-maturity investments | 745 | — | (3 | ) | 742 | ||||||||||
Long-term investments: | |||||||||||||||
Corporate and other debt securities | 161 | — | (1 | ) | 160 | ||||||||||
Total held-to-maturity investment securities | $ | 906 | $ | — | $ | (4 | ) | $ | 902 | ||||||
F-19
2016 | |||||||||||||||
Amortized Cost | Unrealized Gains | Unrealized Losses | Fair Value | ||||||||||||
(in millions) | |||||||||||||||
Short-term investments: | |||||||||||||||
Certificates of deposit and commercial paper | $ | 40 | $ | — | $ | — | $ | 40 | |||||||
There were no long-term held-to-maturity investment securities at December 31, 2016.
The fair value and related unrealized losses of held-to-maturity investment securities in a continuous unrealized loss position for less than 12 months and for 12 months or longer were as follows as of December 31, 2017:
Less than 12 Months | 12 Months or More | Total | |||||||||||||||||||||
Fair Value | Unrealized Losses | Fair Value | Unrealized Losses | Fair Value | Unrealized Losses | ||||||||||||||||||
(in millions) | |||||||||||||||||||||||
Corporate and other debt securities | $ | 473 | $ | (2 | ) | $ | — | $ | — | $ | 473 | $ | (2 | ) | |||||||||
Commercial paper | 394 | (2 | ) | — | — | 394 | (2 | ) | |||||||||||||||
Total | $ | 867 | $ | (4 | ) | $ | — | $ | — | $ | 867 | $ | (4 | ) | |||||||||
As of December 31, 2016, there were no material held-to-maturity investment securities in an unrealized loss position. At each reporting date, the Company performs an evaluation of held-to-maturity securities to determine if the unrealized losses are other-than-temporary. We do not consider any of the investments to be other-than-temporarily impaired as of December 31, 2017.
The contractual maturities of our fixed income held-to-maturity investment securities as of December 31, 2017 are set forth in the following table:
Amortized Cost | Fair Value | ||||||
(in millions) | |||||||
Due within one year | $ | 745 | $ | 742 | |||
Due after one year up to two years | 155 | 154 | |||||
Due after two years | 6 | 6 | |||||
Total held-to-maturity investment securities | $ | 906 | $ | 902 | |||
During the years ended December 31, 2017 and 2016, there were no transfers of investments between our trading, available-for-sale and held-to-maturity investment portfolios.
Equity and Cost Method Investments
As of December 31, 2017 and 2016, we had equity method investments of $67 million and $57 million, respectively, which primarily consist of a 49% ownership interest in a strategic consulting firm specializing in the use of human sciences to help business leaders better understand customer behavior. As of December 31, 2017 and 2016, we had cost method investments of $7 million and $5 million, respectively.
F-20
Note 6 — Property and Equipment, net
Property and equipment were as follows as of December 31:
Estimated Useful Life (Years) | 2017 | 2016 | ||||||||
(in millions) | ||||||||||
Buildings | 30 | $ | 836 | $ | 823 | |||||
Computer equipment | 3 – 5 | 364 | 379 | |||||||
Computer software | 3 – 8 | 594 | 470 | |||||||
Furniture and equipment | 5 – 9 | 511 | 431 | |||||||
Land | 19 | 23 | ||||||||
Leasehold land | lease term | 63 | 63 | |||||||
Capital work-in-progress | 145 | 169 | ||||||||
Leasehold improvements | Shorter of the lease term or the life of the leased asset | 308 | 266 | |||||||
Sub-total | 2,840 | 2,624 | ||||||||
Accumulated depreciation and amortization | (1,516 | ) | (1,313 | ) | ||||||
Property and equipment, net | $ | 1,324 | $ | 1,311 | ||||||
Depreciation and amortization expense related to property and equipment was $313 million, $266 million and $233 million for the years ended December 31, 2017, 2016 and 2015, respectively.
The gross amount of property and equipment recorded under capital leases was $44 million and $37 million at December 31, 2017 and 2016, respectively, and primarily related to buildings. Accumulated amortization and amortization expense related to capital lease assets were immaterial for the periods presented. Amortization expense of leasehold land is immaterial for the periods presented and is included in depreciation and amortization expense in our accompanying consolidated statements of operations.
The amount of property and equipment recorded for software to be sold, leased or marketed, net of accumulated amortization was $40 million and $33 million as of December 31, 2017 and 2016, respectively. Amortization expense of property and equipment recorded for software to be sold, leased or marketed was immaterial for the periods presented.
Note 7 — Goodwill and Intangible Assets, net
Changes in goodwill by our reportable segments were as follows for the years ended December 31, 2017 and 2016:
Segment | January 1, 2017 | Goodwill Additions and Adjustments | Foreign Currency Translation Adjustments | December 31, 2017 | ||||||||||||
(in millions) | ||||||||||||||||
Financial Services | $ | 227 | $ | 27 | $ | 11 | $ | 265 | ||||||||
Healthcare | 2,089 | 13 | 4 | 2,106 | ||||||||||||
Products and Resources (1) | 159 | 72 | 9 | 240 | ||||||||||||
Communications, Media and Technology (2) | 79 | 11 | 3 | 93 | ||||||||||||
Total goodwill | $ | 2,554 | $ | 123 | $ | 27 | $ | 2,704 | ||||||||
F-21
Segment | January 1, 2016 | Goodwill Additions and Adjustments | Foreign Currency Translation Adjustments | December 31, 2016 | ||||||||||||
(in millions) | ||||||||||||||||
Financial Services | $ | 203 | $ | 28 | $ | (4 | ) | $ | 227 | |||||||
Healthcare | 2,076 | 14 | (1 | ) | 2,089 | |||||||||||
Products and Resources (1) | 67 | 94 | (2 | ) | 159 | |||||||||||
Communications, Media and Technology (2) | 59 | 21 | (1 | ) | 79 | |||||||||||
Total goodwill | $ | 2,405 | $ | 157 | $ | (8 | ) | $ | 2,554 | |||||||
_____________
(1) | Products and Resources was previously referred to as Manufacturing/Retail/Logistics. |
(2) | Communications, Media and Technology was previously referred to as Other. |
We have not recognized any impairment losses on our goodwill balances to-date.
Components of intangible assets were as follows as of December 31:
2017 | ||||||||||||
Gross Carrying Amount | Accumulated Amortization | Net Carrying Amount | ||||||||||
(in millions) | ||||||||||||
Customer relationships | $ | 1,005 | $ | (304 | ) | $ | 701 | |||||
Developed technology | 333 | (140 | ) | 193 | ||||||||
Indefinite life trademarks | 63 | — | 63 | |||||||||
Other | 51 | (27 | ) | 24 | ||||||||
Total intangible assets | $ | 1,452 | $ | (471 | ) | $ | 981 | |||||
2016 | ||||||||||||
Gross Carrying Amount | Accumulated Amortization | Net Carrying Amount | ||||||||||
(in millions) | ||||||||||||
Customer relationships | $ | 845 | $ | (219 | ) | $ | 626 | |||||
Developed technology | 332 | (96 | ) | 236 | ||||||||
Indefinite life trademarks | 63 | — | 63 | |||||||||
Other | 48 | (22 | ) | 26 | ||||||||
Total intangible assets | $ | 1,288 | $ | (337 | ) | $ | 951 | |||||
Other than certain trademarks with indefinite lives, our intangible assets have finite lives and, as such, are subject to amortization. Amortization of intangible assets totaled $130 million for 2017, $113 million for 2016 and $97 million for 2015. Of these amounts, during 2017, 2016 and 2015, amortization of $35 million, $20 million and $5 million, respectively, relating to customer relationship intangible assets attributable to direct revenue contracts with sellers of acquired businesses was recorded as a reduction of revenues.
Estimated amortization related to our existing intangible assets for the next five years is as follows:
Year | Amount | |||
(in millions) | ||||
2018 | $ | 134 | ||
2019 | 131 | |||
2020 | 123 | |||
2021 | 120 | |||
2022 | 105 | |||
F-22
Note 8 — Accrued Expenses and Other Current Liabilities
Accrued expenses and other current liabilities were as follows as of December 31:
2017 | 2016 | ||||||
(in millions) | |||||||
Compensation and benefits | $ | 1,272 | $ | 1,134 | |||
Income taxes | 48 | 10 | |||||
Professional fees | 100 | 99 | |||||
Travel and entertainment | 32 | 36 | |||||
Customer volume and other incentives | 289 | 258 | |||||
Derivative financial instruments | 5 | 4 | |||||
Other | 325 | 315 | |||||
Total accrued expenses and other current liabilities | $ | 2,071 | $ | 1,856 | |||
Note 9 — Debt
In 2014, we entered into a credit agreement with a commercial bank syndicate, or, as amended, the Credit Agreement, providing for a $1,000 million unsecured term loan and a $750 million unsecured revolving credit facility. All notes drawn to date under the revolving credit facility have been less than 90 days in duration. The term loan and the revolving credit facility both mature in November 2019. We are required under the Credit Agreement to make scheduled quarterly principal payments on the term loan. We were in compliance with all debt covenants and representations as of December 31, 2017.
The Credit Agreement requires interest to be paid at either the base rate or the Eurocurrency rate, plus a margin. The margin over the base rate is 0.00%, and the margin over the Eurocurrency rate ranges from 0.75% to 1.125%, depending on our debt ratings (or, if we have not received debt ratings, from 0.875% to 1.00%, depending on our debt to total stockholders' equity ratio). Under the Credit Agreement, we are required to pay commitment fees on the unused portion of the revolving credit facility, which vary based on our debt ratings (or, if we have not received debt ratings, our debt to total stockholders' equity ratio). At December 31, 2017, the interest rate on the term loan was 2.4%. As the interest rates on our term loan and notes outstanding under the revolving credits facility are variable, the fair value of our debt balances approximates their carrying value as of December 31, 2017 and 2016.
The Credit Agreement contains certain negative covenants, including limitations on liens, mergers, consolidations and acquisitions, subsidiary indebtedness and affiliate transactions, as well as certain affirmative covenants. In addition, the Credit Agreement requires us to maintain a debt to total stockholders' equity ratio not in excess of 0.40 to 1.00.
Short-term Debt
The following summarizes our short-term debt balances as of December 31:
2017 | 2016 | |||||||||||
Amount | Weighted Average Interest Rate | Amount | Weighted Average Interest Rate | |||||||||
(in millions) | (in millions) | |||||||||||
Notes outstanding under revolving credit facility | $ | 75 | 4.5 | % | $ | — | — | % | ||||
Term loan - current maturities | 100 | 2.4 | % | 81 | 1.8 | % | ||||||
Total short-term debt | $ | 175 | $ | 81 | ||||||||
F-23
Long-term Debt
The following summarizes our long-term debt balances as of December 31:
2017 | 2016 | |||||||
(in millions) | ||||||||
Term loan, due November 2019 | $ | 800 | $ | 881 | ||||
Less: | ||||||||
Current maturities | (100 | ) | (81 | ) | ||||
Deferred financing costs | (2 | ) | (3 | ) | ||||
Long-term debt, net of current maturities | $ | 698 | $ | 797 | ||||
The following represents the schedule of maturities of our long-term debt:
Year | Amounts | |||
(in millions) | ||||
2018 | $ | 100 | ||
2019 | 700 | |||
$ | 800 | |||
Note 10 — Income Taxes
Income before provision for income taxes shown below is based on the geographic location to which such income is attributed for years ended December 31:
2017 | 2016 | 2015 | ||||||||||
(in millions) | ||||||||||||
United States | $ | 810 | $ | 752 | $ | 739 | ||||||
Foreign | 1,845 | 1,605 | 1,425 | |||||||||
Income before provision for income taxes | $ | 2,655 | $ | 2,357 | $ | 2,164 | ||||||
The provision for income taxes consists of the following components for the years ended December 31:
2017 | 2016 | 2015 | ||||||||||
(in millions) | ||||||||||||
Current: | ||||||||||||
Federal and state | $ | 767 | $ | 544 | $ | 352 | ||||||
Foreign | 262 | 352 | 314 | |||||||||
Total current provision | 1,029 | 896 | 666 | |||||||||
Deferred: | ||||||||||||
Federal and state | 102 | (44 | ) | (58 | ) | |||||||
Foreign | 22 | (47 | ) | (68 | ) | |||||||
Total deferred provision (benefit) | 124 | (91 | ) | (126 | ) | |||||||
Total provision for income taxes | $ | 1,153 | $ | 805 | $ | 540 | ||||||
On December 22, 2017, the United States enacted the Tax Reform Act, which significantly revised the U.S. corporate income tax law for tax years beginning after December 31, 2017 by (among other provisions):
• | reducing the U.S. federal statutory corporate income tax rate from 35% to 21% for tax years beginning after December 31, 2017; |
• | implementing a modified territorial tax system that includes a one-time transition tax on all accumulated undistributed earnings of foreign subsidiaries; and |
• | providing for a full deduction on future dividends received from foreign affiliates. |
F-24
During the fourth quarter of 2017, in accordance with the SEC Staff Accounting Bulletin No. 118 - Income Tax Accounting Implications of the Tax Cuts and Jobs Act, we recorded a one-time provisional net income tax expense of $617 million, which is comprised of: (i) the one-time transition tax expense on accumulated undistributed earnings of foreign subsidiaries of $635 million, (ii) foreign and U.S. state income tax expense that will be applicable upon repatriation of the accumulated undistributed earnings of our foreign subsidiaries, other than our Indian subsidiaries, of $53 million, partially offset by (iii) an income tax benefit of $71 million resulting from the revaluation of U.S. net deferred income tax liabilities to the new lower U.S. income tax rate. The transition tax on undistributed earnings is payable over the next eight years, of which $51 million is payable within one year. The one-time incremental income tax expense is provisional as it reflects certain assumptions based upon our interpretation of the Tax Reform Act as of January 18, 2018 and may change, possibly materially, as we receive additional clarification and guidance and as the interpretation of the Tax Reform Act evolves over time. We anticipate completing the accounting for the Tax Reform Act within the measurement period.
As a result of the enactment of the Tax Reform Act, our historical and future foreign earnings are no longer subject to U.S. federal income taxes upon repatriation, beyond the one-time transition tax. We therefore reevaluated our assertion that our foreign earnings would be indefinitely reinvested and concluded that our Indian earnings will continue to be indefinitely reinvested while historical accumulated undistributed earnings of our foreign subsidiaries, other than our Indian subsidiaries, are available for repatriation to the United States. Our assertion that our earnings in India continue to be indefinitely reinvested is consistent with our ongoing strategy to expand our Indian operations, including through infrastructure investments. As of December 31, 2017, the amount of unrepatriated Indian earnings is estimated at approximately $4,082 million. If such Indian earnings are repatriated in the future, or are no longer deemed to be indefinitely reinvested, then we would expect to accrue additional tax expense at a rate of approximately 21% of actual cash distributions to the United States, based on our current interpretation of India tax law. This estimate is subject to change based on tax legislation developments in India and other jurisdictions as well as judicial and interpretive developments of applicable tax laws.
In May 2016, India enacted the Finance Bill 2016 that, among other things, expanded the applicability of India’s buyback distribution tax to certain share buyback transactions occurring after June 1, 2016. In mid-May, prior to the June 1, 2016 effective date of the enactment, our principal operating subsidiary in India repurchased shares from its shareholders, which are non-Indian Cognizant entities, valued at $2.8 billion. This transaction, or the India Cash Remittance, was undertaken pursuant to a plan approved by the High Court of Madras and simplified the shareholding structure of our principal operating subsidiary in India. Pursuant to the transaction, our principal Indian operating subsidiary repurchased approximately $1.2 billion of the total $2.8 billion of shares from its U.S. shareholders, resulting in incremental tax expense, while the remaining $1.6 billion was repurchased from its shareholder outside the United States. Net of taxes, the transaction resulted in a remittance of cash to the United States in the amount of $1.0 billion. As a result of this transaction, we incurred an incremental 2016 income tax expense of $238 million.
The reconciliation between our effective income tax rate and the U.S. federal statutory rate were as follows for the years ended December 31:
2017 | % | 2016 | % | 2015 | % | ||||||||||||||||
(Dollars in millions) | |||||||||||||||||||||
Tax expense, at U.S. federal statutory rate | $ | 929 | 35.0 | $ | 825 | 35.0 | $ | 757 | 35.0 | ||||||||||||
State and local income taxes, net of federal benefit | 39 | 1.5 | 42 | 1.8 | 42 | 2.0 | |||||||||||||||
Non-taxable income for Indian tax purposes | (216 | ) | (8.2 | ) | (203 | ) | (8.6 | ) | (201 | ) | (9.3 | ) | |||||||||
Rate differential on foreign earnings | (76 | ) | (2.9 | ) | (55 | ) | (2.3 | ) | (34 | ) | (1.6 | ) | |||||||||
Net impact related to the Tax Reform Act | 617 | 23.2 | — | — | — | — | |||||||||||||||
India Cash Remittance | — | — | 238 | 10.1 | — | — | |||||||||||||||
Recognition of previously unrecognized income tax benefits related to uncertain tax positions | (73 | ) | (2.7 | ) | (16 | ) | (0.7 | ) | (23 | ) | (1.1 | ) | |||||||||
Credits and other incentives | (37 | ) | (1.4 | ) | (57 | ) | (2.4 | ) | (23 | ) | (1.0 | ) | |||||||||
Other | (30 | ) | (1.1 | ) | 31 | 1.3 | 22 | 1.0 | |||||||||||||
Total provision for income taxes | $ | 1,153 | 43.4 | $ | 805 | 34.2 | $ | 540 | 25.0 | ||||||||||||
F-25
The significant components of deferred income tax assets and liabilities recorded on the consolidated statements of financial position were as follows as of December 31:
2017 | 2016 | |||||||
(in millions) | ||||||||
Deferred income tax assets: | ||||||||
Net operating losses | $ | 15 | $ | 14 | ||||
Revenue recognition | 55 | 69 | ||||||
Compensation and benefits | 125 | 165 | ||||||
Stock-based compensation | 14 | 25 | ||||||
Minimum alternative tax (MAT) and other credits | 369 | 274 | ||||||
Other accrued expenses | 22 | 161 | ||||||
600 | 708 | |||||||
Less: valuation allowance | (10 | ) | (10 | ) | ||||
Deferred income tax assets, net | 590 | 698 | ||||||
Deferred income tax liabilities: | ||||||||
Depreciation and amortization | 209 | 266 | ||||||
Deferred costs | 65 | — | ||||||
Other | 44 | 13 | ||||||
Deferred income tax liabilities | 318 | 279 | ||||||
Net deferred income tax assets | $ | 272 | $ | 419 | ||||
In the table above, certain unrecognized income tax benefits have been netted against available same-jurisdiction deferred income tax carryforward assets.
At December 31, 2017, we had foreign and U.S. net operating loss carryforwards of approximately $38 million and $12 million, respectively. We have recorded valuation allowances on certain foreign net operating loss carryforwards. As of December 31, 2017 and 2016, deferred income tax assets related to the minimum alternative tax, or MAT, were approximately $278 million and $286 million, respectively. The calculation of the MAT includes all profits realized by our Indian subsidiaries and any MAT paid is creditable against future corporate income tax, subject to certain limitations. Our existing MAT assets expire between March 2023 and March 2032 and we expect to fully utilize them within the applicable expiration periods, which was extended to 15 years from 10 years by the 2017 Union Budget of India.
Our Indian subsidiaries, collectively referred to as Cognizant India, are primarily export-oriented and are eligible for certain income tax holiday benefits granted by the government of India for export activities conducted within Special Economic Zones, or SEZs, for periods of up to 15 years. Our SEZ income tax holiday benefits are currently scheduled to expire in whole or in part during the years 2018 to 2026 and may be extended on a limited basis for an additional five years per unit if certain reinvestment criteria are met. Our Indian profits ineligible for SEZ benefits are subject to corporate income tax at the rate of 34.6%. In addition, all Indian profits, including those generated within SEZs, are subject to the MAT, at the rate of 21.3%. For the years ended December 31, 2017, 2016 and 2015, the effect of the income tax holidays granted by the Indian government was to reduce the overall income tax provision and increase net income by approximately $217 million, $203 million and $201 million, respectively, and increase diluted EPS by $0.36, $0.33 and $0.33, respectively. Any MAT paid is creditable against future Indian corporate income tax, subject to limitations.
We conduct business globally and file income tax returns in the United States, including federal and state, as well as various foreign jurisdictions. Tax years that remain subject to examination by the Internal Revenue Service are 2012 and onward, and years that remain subject to examination by state authorities vary by state. Years under examination by foreign tax authorities are 2001 and onward. We record incremental tax expense, based upon the more-likely-than-not standard, for any uncertain tax positions. In addition, when applicable, we adjust the previously recorded income tax expense to reflect examination results when the position is effectively settled or otherwise resolved. Our ongoing evaluations of the more-likely-than-not outcomes of the examinations and related tax positions require judgment and can result in adjustments that increase or decrease our effective income tax rate, as well as impact our operating results. The specific timing of when the resolution of each tax position will be reached is uncertain.
F-26
Changes in unrecognized income tax benefits were as follows for the years ended December 31:
2017 | 2016 | |||||||
(in millions) | ||||||||
Balance, beginning of year | $ | 151 | $ | 139 | ||||
Additions based on tax positions related to the current year | 17 | 11 | ||||||
Additions for tax positions of prior years | 2 | 19 | ||||||
Additions for tax positions of acquired subsidiaries | — | — | ||||||
Reductions for tax positions due to lapse of statutes of limitations | (41 | ) | (15 | ) | ||||
Reductions for tax positions of prior years | (32 | ) | (1 | ) | ||||
Settlements | — | — | ||||||
Foreign currency exchange movement | — | (2 | ) | |||||
Balance, end of year | $ | 97 | $ | 151 | ||||
At December 31, 2017, the unrecognized income tax benefits would affect our effective income tax rate, if recognized. While the Company believes uncertain tax positions may be settled or resolved within the next twelve months, it is difficult to estimate the income tax impact of these potential resolutions at this time. We recognize accrued interest and any penalties associated with uncertain tax positions as part of our provision for income taxes. The total amount of accrued interest and penalties at December 31, 2017 and 2016 was approximately $8 million and $7 million, respectively, and relates to U.S. and foreign tax matters. The amounts of interest and penalties recorded in the provision for income taxes in 2017, 2016 and 2015 were immaterial.
Note 11 — Derivative Financial Instruments
In the normal course of business, we use foreign exchange forward contracts to manage foreign currency exchange rate risk. The estimated fair value of the foreign exchange forward contracts considers the following items: discount rate, timing and amount of cash flow and counterparty credit risk. Derivatives may give rise to credit risks from the possible non-performance by counterparties. Credit risk is limited to the fair value of those contracts that are favorable to us. We have limited our credit risk by entering into derivative transactions only with highly-rated financial institutions, limiting the amount of credit exposure with any one financial institution and conducting ongoing evaluation of the creditworthiness of the financial institutions with which we do business. In addition, all the assets and liabilities related to our foreign exchange forward contracts set forth in the below table are subject to International Swaps and Derivatives Association, or ISDA, master netting arrangements or other similar agreements with each individual counterparty. These master netting arrangements generally provide for net settlement of all outstanding contracts with the counterparty in the case of an event of default or a termination event. We have presented all the assets and liabilities related to our foreign exchange forward contracts on a gross basis, with no offsets, in our accompanying consolidated statements of financial position. There is no financial collateral (including cash collateral) posted or received by us related to our foreign exchange forward contracts.
The following table provides information on the location and fair values of derivative financial instruments included in our consolidated statement of financial position as of December 31:
2017 | 2016 | |||||||||||||||||
Designation of Derivatives | Location on Statement of Financial Position | Assets | Liabilities | Assets | Liabilities | |||||||||||||
(in millions) | ||||||||||||||||||
Foreign exchange forward contracts - Designated as cash flow hedging instruments | Other current assets | $ | 134 | $ | — | $ | 34 | $ | — | |||||||||
Other noncurrent assets | 20 | — | 17 | — | ||||||||||||||
Total | 154 | — | 51 | — | ||||||||||||||
Foreign exchange forward contracts - Not designated as cash flow hedging instruments | Accrued expenses and other current liabilities | — | 5 | — | 4 | |||||||||||||
Total | — | 5 | — | 4 | ||||||||||||||
Total | $ | 154 | $ | 5 | $ | 51 | $ | 4 | ||||||||||
F-27
Cash Flow Hedges
We have entered into a series of foreign exchange forward contracts that are designated as cash flow hedges of Indian rupee denominated payments in India. These contracts are intended to partially offset the impact of movement of exchange rates on future operating costs and are scheduled to mature each month during 2018 and 2019. Under these contracts, we purchase Indian rupees and sell U.S. dollars. The changes in fair value of these contracts are initially reported in the caption “Accumulated other comprehensive income (loss)” in our consolidated statements of financial position and are subsequently reclassified to earnings in the same period the forecasted Indian rupee denominated payments are recorded in earnings. As of December 31, 2017, we estimate that $100 million, net of tax, of the net gains related to derivatives designated as cash flow hedges recorded in accumulated other comprehensive income (loss) is expected to be reclassified into earnings within the next 12 months.
The notional value of our outstanding contracts by year of maturity and the net unrealized gains included in accumulated other comprehensive income (loss) for such contracts were as follows as of December 31:
2017 | 2016 | ||||||
(in millions) | |||||||
2017 | $ | — | $ | 1,320 | |||
2018 | 1,185 | 1,020 | |||||
2019 | 720 | — | |||||
Total notional value of contracts outstanding | $ | 1,905 | $ | 2,340 | |||
Net unrealized gains included in accumulated other comprehensive income (loss), net of taxes | $ | 115 | $ | 39 | |||
Upon settlement or maturity of the cash flow hedge contracts, we record the related gains or losses, based on our designation at the commencement of the contract, with the related hedged Indian rupee denominated expense reported within cost of revenues and selling, general and administrative expenses. Hedge ineffectiveness was immaterial for all periods presented.
The following table provides information on the location and amounts of pre-tax gains on our cash flow hedges for the year ended December 31:
Change in Derivative Gains Recognized in Accumulated Other Comprehensive Income (Loss) (effective portion) | Location of Net Derivative Gains Reclassified from Accumulated Other Comprehensive Income (Loss) into Income (effective portion) | Net Gains Reclassified from Accumulated Other Comprehensive Income (Loss) into Income (effective portion) | |||||||||||||||
2017 | 2016 | 2017 | 2016 | ||||||||||||||
(in millions) | |||||||||||||||||
Foreign exchange forward contracts - Designated as cash flow hedging instruments | $ | 232 | $ | 83 | Cost of revenues | $ | 109 | $ | 14 | ||||||||
Selling, general and administrative expenses | 20 | 3 | |||||||||||||||
Total | $ | 129 | $ | 17 | |||||||||||||
The activity related to the change in net unrealized gains on our cash flow hedges included in accumulated other comprehensive income (loss) is presented in Note 13.
Other Derivatives
We use foreign exchange forward contracts, which have not been designated as hedges, to hedge balance sheet exposure to certain monetary assets and liabilities denominated in currencies other than the functional currency of our foreign subsidiaries. We entered into a series of foreign exchange forward contracts that are scheduled to mature in 2018. Realized gains or losses and changes in the estimated fair value of these derivative financial instruments are reported in the caption "Foreign currency exchange gains (losses), net" in our consolidated statements of operations.
F-28
Additional information related to our outstanding foreign exchange forward contracts not designated as hedging instruments is as follows as of December 31:
2017 | 2016 | ||||||||||||||
Notional | Market Value | Notional | Market Value | ||||||||||||
(in millions) | |||||||||||||||
Contracts outstanding | $ | 255 | $ | (5 | ) | $ | 213 | $ | (4 | ) | |||||
The following table provides information on the location and amounts of realized and unrealized pre-tax gains and losses on our other derivative financial instruments for the year ended December 31:
Location of Net (Losses) on Derivative Instruments | Amount of Net (Losses) on Derivative Instruments | |||||||||
2017 | 2016 | |||||||||
(in millions) | ||||||||||
Foreign exchange forward contracts - Not designated as hedging instruments | Foreign currency exchange gains (losses), net | $ | (23 | ) | $ | (3 | ) | |||
The related cash flow impacts of all of our derivative activities are reflected as cash flows from operating activities.
Note 12 — Fair Value Measurements
We measure our cash equivalents, investments and foreign exchange forward contracts at fair value. The authoritative guidance defines fair value as the exit price, or the amount that would be received to sell an asset or paid to transfer a liability in an orderly transaction between market participants as of the measurement date. The authoritative guidance also establishes a fair value hierarchy that is intended to increase consistency and comparability in fair value measurements and related disclosures. The fair value hierarchy is based on inputs to valuation techniques that are used to measure fair value that are either observable or unobservable. Observable inputs reflect assumptions market participants would use in pricing an asset or liability based on market data obtained from independent sources while unobservable inputs reflect a reporting entity’s pricing based upon their own market assumptions.
The fair value hierarchy consists of the following three levels:
• | Level 1 – Inputs are quoted prices in active markets for identical assets or liabilities. |
• | Level 2 – Inputs are quoted prices for similar assets or liabilities in an active market, quoted prices for identical or similar assets or liabilities in markets that are not active, inputs other than quoted prices that are observable and market-corroborated inputs which are derived principally from or corroborated by observable market data. |
• | Level 3 – Inputs are derived from valuation techniques in which one or more significant inputs or value drivers are unobservable. |
F-29
The following table summarizes our financial assets and (liabilities) measured at fair value on a recurring basis as of December 31, 2017:
Level 1 | Level 2 | Level 3 | Total | ||||||||||||
(in millions) | |||||||||||||||
Cash equivalents: | |||||||||||||||
Money market funds | $ | 334 | $ | — | $ | — | $ | 334 | |||||||
Bank deposits | — | 80 | — | 80 | |||||||||||
Commercial paper | — | 386 | — | 386 | |||||||||||
Total cash equivalents | 334 | 466 | — | 800 | |||||||||||
Short-term investments: | |||||||||||||||
Time deposits | — | 389 | — | 389 | |||||||||||
Available-for-sale investment securities: | |||||||||||||||
U.S. Treasury and agency debt securities | 585 | 76 | — | 661 | |||||||||||
Corporate and other debt securities | — | 437 | — | 437 | |||||||||||
Certificates of deposit and commercial paper | — | 450 | — | 450 | |||||||||||
Asset-backed securities | — | 295 | — | 295 | |||||||||||
Municipal debt securities | — | 129 | — | 129 | |||||||||||
Total available-for-sale investment securities | 585 | 1,387 | — | 1,972 | |||||||||||
Held-to-maturity investment securities: | |||||||||||||||
Commercial paper | — | 397 | — | 397 | |||||||||||
Corporate and other debt securities | — | 345 | — | 345 | |||||||||||
Total short-term held-to-maturity investment securities | — | 742 | — | 742 | |||||||||||
Total short-term investments(1) | 585 | 2,518 | — | 3,103 | |||||||||||
Long-term investments: | |||||||||||||||
Held-to-maturity investment securities: | |||||||||||||||
Corporate and other debt securities | — | 160 | — | 160 | |||||||||||
Total long-term held-to-maturity investment securities | — | 160 | — | 160 | |||||||||||
Total long-term investments(2) | — | 160 | — | 160 | |||||||||||
Derivative financial instruments - foreign exchange forward contracts: | |||||||||||||||
Other current assets | — | 134 | — | 134 | |||||||||||
Accrued expenses and other current liabilities | — | (5 | ) | — | (5 | ) | |||||||||
Other noncurrent assets | — | 20 | — | 20 | |||||||||||
Total | $ | 919 | $ | 3,293 | $ | — | $ | 4,212 | |||||||
________________
(1) | Excludes trading securities invested in a mutual fund valued at $25 million based on the NAV of the fund at December 31, 2017. |
(2) | Excludes equity and cost method investments of $74 million at December 31, 2017, which are accounted for using the equity method of accounting and at cost, respectively. |
F-30
The following table summarizes our financial assets and (liabilities) measured at fair value on a recurring basis as of December 31, 2016:
Level 1 | Level 2 | Level 3 | Total | ||||||||||||
(in millions) | |||||||||||||||
Cash equivalents: | |||||||||||||||
Money market funds | $ | 624 | $ | — | $ | — | $ | 624 | |||||||
Commercial paper | — | 131 | — | 131 | |||||||||||
Total cash equivalents | 624 | 131 | — | 755 | |||||||||||
Short-term investments: | |||||||||||||||
Time deposits | — | 806 | — | 806 | |||||||||||
Available-for-sale investment securities: | |||||||||||||||
U.S. Treasury and agency debt securities | 558 | 44 | — | 602 | |||||||||||
Corporate and other debt securities | — | 405 | — | 405 | |||||||||||
Certificates of deposit and commercial paper | — | 911 | — | 911 | |||||||||||
Asset-backed securities | — | 231 | — | 231 | |||||||||||
Municipal debt securities | — | 115 | — | 115 | |||||||||||
Total available-for-sale investment securities | 558 | 1,706 | — | 2,264 | |||||||||||
Held-to-maturity investment securities: | |||||||||||||||
Certificates of deposit and commercial paper | — | 40 | — | 40 | |||||||||||
Total held-to-maturity investment securities | — | 40 | — | 40 | |||||||||||
Total short-term investments(1) | 558 | 2,552 | — | 3,110 | |||||||||||
Derivative financial instruments - foreign exchange forward contracts: | |||||||||||||||
Other current assets | — | 34 | — | 34 | |||||||||||
Accrued expenses and other current liabilities | — | (4 | ) | — | (4 | ) | |||||||||
Other noncurrent assets | — | 17 | — | 17 | |||||||||||
Total | $ | 1,182 | $ | 2,730 | $ | — | $ | 3,912 | |||||||
________________
(1) | Excludes trading securities invested in a mutual fund valued at $25 million based on the NAV of the fund at December 31, 2016. |
We measure the fair value of money market funds and U.S. Treasury securities based on quoted prices in active markets for identical assets and therefore classify these assets as Level 1. The fair value of commercial paper, certificates of deposit, U.S. government agency securities, municipal debt securities, debt securities issued by supranational institutions, U.S. and international corporate bonds and foreign government debt securities is measured based on relevant trade data, dealer quotes, or model-driven valuations using significant inputs derived from or corroborated by observable market data, such as yield curves and credit spreads. We measure the fair value of our asset-backed securities using model-driven valuations based on significant inputs derived from or corroborated by observable market data such as dealer quotes, available trade information, spread data, current market assumptions on prepayment speeds and defaults and historical data on deal collateral performance. The carrying value of the time deposits approximated fair value as of December 31, 2017 and 2016.
We estimate the fair value of each foreign exchange forward contract by using a present value of expected cash flows model. This model calculates the difference between the current market forward price and the contracted forward price for each foreign exchange contract and applies the difference in the rates to each outstanding contract. The market forward rates include a discount and credit risk factor. The amounts are aggregated by type of contract and maturity.
During the years ended December 31, 2017, 2016 and 2015, there were no transfers among Level 1, Level 2 or Level 3 financial assets and liabilities.
F-31
Note 13 — Stockholders' Equity
Stock Repurchase Program
Effective March 1, 2017, the Board of Directors approved the termination of the stock repurchase program then in effect and approved a new stock repurchase program. The stock repurchase program allows for the repurchase of $3,500 million of our outstanding shares of Class A common stock, excluding fees and expenses, through December 31, 2019.
In March 2017, we entered into accelerated stock repurchase agreements, referred to collectively as the March ASR, with certain financial institutions under our stock repurchase program. Under the terms of the ASR and in exchange for up-front payments of $1,500 million, the financial institutions delivered 23.7 million shares. The March ASR was completed in August 2017. The final number of shares repurchased was based on the final volume-weighted average price of the Company's Class A common stock during the purchase period less the negotiated discount.
In December 2017, we entered into another accelerated stock repurchase agreement, or December ASR, with a financial institution under our stock repurchase program. Under the terms of the December ASR and in exchange for an up-front payment of $300 million, the financial institution initially delivered 3.6 million shares, a portion of the Company's total expected shares to be repurchased under the December ASR. The total number of shares ultimately delivered will be determined in the first quarter of 2018, at the end of the applicable purchase period.
The combined March ASR and December ASR were accounted for as a $630 million reduction in common stock and additional paid-in capital and a $1,170 million reduction in retained earnings in our consolidated statements of financial position. As of December 31, 2017, the remaining available balance under our stock repurchase program was $1,700 million. The ASRs met all of the applicable criteria for equity classification, and therefore were not accounted for as derivative instruments.
Additionally, stock repurchases were made in connection with our stock-based compensation plans, whereby Company shares were tendered by employees for payment of applicable statutory tax withholdings. In 2017, we also repurchased a limited number of shares from employees at the repurchase date market price. Combined such repurchases in 2017, 2016 and 2015 totaled 1.3 million, 1.2 million and 1.3 million shares, respectively, at an aggregate cost of $89 million, $72 million and $84 million, respectively.
Dividends
Dividends on our Class A common stock during the year were as follows:
Dividends per Share | Amount | |||||||
(in millions) | ||||||||
Three months ended June 30, 2017 | $ | 0.15 | $ | 89 | ||||
Three months ended September 30, 2017 | 0.15 | 90 | ||||||
Three months ended December 31, 2017 | 0.15 | 89 | ||||||
Year ended December 31, 2017 | $ | 268 | ||||||
We did not pay any dividends during 2016 or 2015.
On February 5, 2018, our Board of Directors approved the Company's declaration of a $0.20 per share dividend with a record date of February 22, 2018 and a payment date of February 28, 2018.
F-32
Accumulated Other Comprehensive Income (Loss)
Changes in accumulated other comprehensive income (loss) by component were as follows for the year ended December 31, 2017:
2017 | |||||||||||
Before Tax Amount | Tax Effect | Net of Tax Amount | |||||||||
(in millions) | |||||||||||
Foreign currency translation adjustments: | |||||||||||
Beginning balance | $ | (149 | ) | $ | — | $ | (149 | ) | |||
Change in foreign currency translation adjustments | 111 | — | 111 | ||||||||
Ending balance | $ | (38 | ) | $ | — | $ | (38 | ) | |||
Unrealized (losses) on available-for-sale investment securities: | |||||||||||
Beginning balance | $ | (6 | ) | $ | 2 | $ | (4 | ) | |||
Net unrealized losses arising during the period | (7 | ) | 3 | (4 | ) | ||||||
Reclassification of net losses to Other, net | 2 | (1 | ) | 1 | |||||||
Net change | (5 | ) | 2 | (3 | ) | ||||||
Ending balance | $ | (11 | ) | $ | 4 | $ | (7 | ) | |||
Unrealized gains on cash flow hedges: | |||||||||||
Beginning balance | $ | 51 | $ | (12 | ) | $ | 39 | ||||
Unrealized gains arising during the period | 232 | (57 | ) | 175 | |||||||
Reclassifications of net (gains) to: | |||||||||||
Cost of revenues | (109 | ) | 26 | (83 | ) | ||||||
Selling, general and administrative expenses | (20 | ) | 4 | (16 | ) | ||||||
Net change | 103 | (27 | ) | 76 | |||||||
Ending balance | $ | 154 | $ | (39 | ) | $ | 115 | ||||
Accumulated other comprehensive income (loss): | |||||||||||
Beginning balance | $ | (104 | ) | $ | (10 | ) | $ | (114 | ) | ||
Other comprehensive income (loss) | 209 | (25 | ) | 184 | |||||||
Ending balance | $ | 105 | $ | (35 | ) | $ | 70 | ||||
F-33
Changes in accumulated other comprehensive income (loss) by component were as follows for the years ended December 31, 2016 and 2015:
2016 | 2015 | ||||||||||||||||||||||
Before Tax Amount | Tax Effect | Net of Tax Amount | Before Tax Amount | Tax Effect | Net of Tax Amount | ||||||||||||||||||
(in millions) | |||||||||||||||||||||||
Foreign currency translation adjustments: | |||||||||||||||||||||||
Beginning balance | $ | (90 | ) | $ | — | $ | (90 | ) | $ | (35 | ) | $ | — | $ | (35 | ) | |||||||
Change in foreign currency translation adjustments | (59 | ) | — | (59 | ) | (55 | ) | — | (55 | ) | |||||||||||||
Ending balance | $ | (149 | ) | $ | — | $ | (149 | ) | $ | (90 | ) | $ | — | $ | (90 | ) | |||||||
Unrealized (losses) on available-for-sale investment securities: | |||||||||||||||||||||||
Beginning balance | $ | (7 | ) | $ | 3 | $ | (4 | ) | $ | (2 | ) | $ | 1 | $ | (1 | ) | |||||||
Net unrealized gains (losses) arising during the period | 5 | (2 | ) | 3 | (4 | ) | 1 | (3 | ) | ||||||||||||||
Reclassification of net (gains) to Other, net | (4 | ) | 1 | (3 | ) | (1 | ) | 1 | — | ||||||||||||||
Net change | 1 | (1 | ) | — | (5 | ) | 2 | (3 | ) | ||||||||||||||
Ending balance | $ | (6 | ) | $ | 2 | $ | (4 | ) | $ | (7 | ) | $ | 3 | $ | (4 | ) | |||||||
Unrealized gains (losses) on cash flow hedges: | |||||||||||||||||||||||
Beginning balance | $ | (15 | ) | $ | 3 | $ | (12 | ) | $ | (103 | ) | $ | 16 | $ | (87 | ) | |||||||
Unrealized gains arising during the period | 83 | (19 | ) | 64 | 17 | — | 17 | ||||||||||||||||
Reclassifications of net (gains) losses to: | |||||||||||||||||||||||
Cost of revenues | (14 | ) | 3 | (11 | ) | 59 | (11 | ) | 48 | ||||||||||||||
Selling, general and administrative expenses | (3 | ) | 1 | (2 | ) | 12 | (2 | ) | 10 | ||||||||||||||
Net change | 66 | (15 | ) | 51 | 88 | (13 | ) | 75 | |||||||||||||||
Ending balance | $ | 51 | $ | (12 | ) | $ | 39 | $ | (15 | ) | $ | 3 | $ | (12 | ) | ||||||||
Accumulated other comprehensive income (loss): | |||||||||||||||||||||||
Beginning balance | $ | (112 | ) | $ | 6 | $ | (106 | ) | $ | (140 | ) | $ | 17 | $ | (123 | ) | |||||||
Other comprehensive income (loss) | 8 | (16 | ) | (8 | ) | 28 | (11 | ) | 17 | ||||||||||||||
Ending balance | $ | (104 | ) | $ | (10 | ) | $ | (114 | ) | $ | (112 | ) | $ | 6 | $ | (106 | ) | ||||||
F-34
Note 14 — Commitments and Contingencies
We lease office space and equipment under operating leases, which expire at various dates through the year 2028. Certain leases contain renewal provisions and generally require us to pay utilities, insurance, taxes, and other operating expenses. Future minimum rental payments on our operating leases as of December 31, 2017 are as follows:
Operating lease obligation | |||
(in millions) | |||
2018 | $ | 188 | |
2019 | 178 | ||
2020 | 156 | ||
2021 | 124 | ||
2022 | 87 | ||
Thereafter | 210 | ||
Total minimum lease payments | $ | 943 | |
Rental expense totaled $265 million, $227 million and $212 million for the years ended December 31, 2017, 2016 and 2015, respectively.
Future minimum rental payments on our capital leases as of December 31, 2017 are as follows:
Capital lease obligation | |||
(in millions) | |||
2018 | $ | 9 | |
2019 | 6 | ||
2020 | 5 | ||
2021 | 4 | ||
2022 | 4 | ||
Thereafter | 23 | ||
Total minimum lease payments | 51 | ||
Interest | (10 | ) | |
Present value of minimum lease payments | $ | 41 | |
We are involved in various claims and legal actions arising in the ordinary course of business. We accrue a liability when a loss is considered probable and the amount can be reasonably estimated. When a material loss contingency is reasonably possible but not probable, we do not record a liability, but instead disclose the nature and the amount of the claim, and an estimate of the loss or range of loss, if such an estimate can be made. Legal fees are expensed as incurred. In the opinion of management, the outcome of any existing claims and legal or regulatory proceedings, other than the specific matters described below, if decided adversely, is not expected to have a material adverse effect on our business, financial condition, results of operations and cash flows.
We are conducting an internal investigation focused on whether certain payments relating to Company-owned facilities in India were made improperly and in possible violation of the FCPA and other applicable laws. The investigation is also examining various other payments made in small amounts in India that may not have complied with Company policy or applicable law. In September 2016, we voluntarily notified the DOJ and SEC and are cooperating fully with both agencies. The investigation is being conducted under the oversight of the Audit Committee, with the assistance of outside counsel. To date, the investigation has identified a total of approximately $6 million in payments made between 2009 and 2016 that may have been improper. During the year ended December 31, 2016, we recorded out-of-period corrections related to $4 million of such payments that were previously capitalized that should have been expensed. These out-of-period corrections and the other $2 million in potentially improper payments were not material to any previously issued financial statements. There were no adjustments recorded during the year ended December 31, 2017.
On October 5, 2016, October 27, 2016, and November 18, 2016, three putative securities class action complaints were filed in the United States District Court for the District of New Jersey, naming us and certain of our current and former officers
F-35
as defendants. In an order dated February 3, 2017, the United States District Court for the District of New Jersey consolidated the three putative securities class actions into a single action and appointed lead plaintiffs and lead counsel. On April 7, 2017, the lead plaintiffs filed a consolidated amended complaint on behalf of a putative class of stockholders who purchased our common stock during the period between February 27, 2015 and September 29, 2016, naming us and certain of our current and former officers as defendants and alleging violations of the Exchange Act, based on allegedly false or misleading statements related to potential violations of the FCPA, our business, prospects and operations, and the effectiveness of our internal controls over financial reporting and our disclosure controls and procedures. The lead plaintiffs seek an award of compensatory damages, among other relief, and their reasonable costs and expenses, including attorneys’ fees. Under a stipulation filed by the parties on February 23, 2017, defendants filed motions to dismiss the consolidated amended complaint on June 6, 2017, plaintiffs filed an opposition brief on July 21, 2017 responding to defendants’ motions to dismiss, and defendants filed reply briefs in further support of their motions to dismiss on September 5, 2017. On September 5, 2017, defendants also filed a motion to strike certain allegations in the consolidated amended complaint, plaintiffs filed an opposition to the motion to strike on October 2, 2017, and, on October 10, 2017, we filed a reply brief in further support of the motion to strike.
On October 31, 2016, November 15, 2016, and November 18, 2016, three putative shareholder derivative complaints were filed in New Jersey Superior Court, Bergen County, naming us, all of our then current directors and certain of our current and former officers as defendants. On January 24, 2017, the New Jersey Superior Court, Bergen County, consolidated the three putative shareholder derivative actions filed in that court into a single action and appointed lead plaintiff and lead counsel. The complaints assert claims for breach of fiduciary duty, corporate waste, unjust enrichment, abuse of control, mismanagement, and/or insider selling by defendants. On March 16, 2017, the parties filed a stipulation deferring all further proceedings pending a final, non-appealable ruling on the then anticipated motion to dismiss the consolidated putative securities class action. On April 26, 2017, in lieu of ordering the stipulation filed by the parties, the New Jersey Superior Court deferred further proceedings by dismissing the consolidated putative shareholder derivative litigation without prejudice but permitting the parties to file a motion to vacate the dismissal in the future. On February 22, 2017, a fourth putative shareholder derivative complaint asserting similar claims was filed in the United States District Court for the District of New Jersey, naming us and certain of our then current directors as defendants. On April 5, 2017, the United States District Court for the District of New Jersey entered an order staying all proceedings pending a final, non-appealable ruling on the then anticipated motion to dismiss the consolidated putative securities class action. On April 7, 2017, a fifth putative shareholder derivative complaint was filed in the United States District Court for the District of New Jersey, naming us, certain of our then current directors, and certain of our current and former officers as defendants. The complaint in that action asserts claims similar to those in the previously-filed putative shareholder derivative actions, but also adds a claim for violations of Section 10(b) of the Exchange Act against the individual defendants. On May 10, 2017, a sixth putative shareholder derivative complaint was filed in the United States District Court for the District of New Jersey, naming us, certain of our then current directors, and certain of our current and former officers as defendants. The complaint in that action asserts claims similar to those in the previously-filed putative shareholder derivative actions, but also adds a claim for violations of Section 14(a) of the Exchange Act against the individual defendants. In an order dated June 20, 2017, the United States District Court for the District of New Jersey consolidated the three putative shareholder derivative actions filed in that court into a single action, appointed lead plaintiff and lead counsel, and stayed all further proceedings pending a final, non-appealable ruling on the motions to dismiss the consolidated putative securities class action. All of the putative shareholder derivative complaints allege among other things that certain of our public disclosures were false and misleading by failing to disclose that payments allegedly in violation of the FCPA had been made and by asserting that management had determined that our internal controls were effective. The plaintiffs seek awards of compensatory damages and restitution to the Company as a result of the alleged violations and their costs and attorneys’ fees, experts’ fees, and other litigation expenses, among other relief.
We are presently unable to predict the duration, scope or result of the internal investigation, any investigations by the DOJ or the SEC, the consolidated putative securities class action, the putative shareholder derivative actions or any other lawsuits. As such, we are presently unable to develop a reasonable estimate of a possible loss or range of losses, if any, and thus have not recorded any accruals related to these matters. The DOJ and the SEC have a broad range of civil and criminal sanctions under the FCPA and other laws and regulations including injunctive relief, disgorgement, fines, penalties, modifications to business practices, including the termination or modification of existing business relationships, the imposition of compliance programs and the retention of a monitor to oversee compliance with the FCPA. In addition, the DOJ and the SEC could bring enforcement actions against the Company or individuals, including former members of senior management. Such actions, if brought, could result in dispositions, judgments, settlements, fines, injunctions, cease and desist orders, debarment or other civil or criminal penalties against the Company or such individuals.
We expect to incur additional expenses related to remedial measures, and may incur additional expenses related to fines. The imposition of any sanctions or the implementation of remedial measures could have a material adverse effect on our business, annual and interim results of operations, cash flows and financial condition. Furthermore, while the Company intends
F-36
to defend the lawsuits vigorously, these lawsuits and any other related lawsuits are subject to inherent uncertainties, the actual cost of such litigation will depend upon many unknown factors and the outcome of the litigation is necessarily uncertain.
We have indemnification and expense advancement obligations pursuant to our Bylaws and indemnification agreements with respect to certain current and former members of senior management and the Company’s directors. In connection with the ongoing internal investigation, we have received requests under such indemnification agreements and our Bylaws to provide funds for legal fees and other expenses, and expect additional requests in connection with the investigation and related litigation. We have not recorded any liability for these matters as of December 31, 2017 as we cannot estimate the ultimate outcome at this time but have expensed payments made through December 31, 2017.
We have maintained directors and officers insurance, from which a portion of the indemnification expenses and costs related to the putative securities class action complaints may be recoverable, and have recorded an insurance receivable of less than $1 million as of December 31, 2017. We are unable to make a reliable estimate of the eventual cash flows by period related to the indemnification agreements described here.
Many of our engagements involve projects that are critical to the operations of our customers’ business and provide benefits that are difficult to quantify. Any failure in a customer’s systems or our failure to meet our contractual obligations to our customers, including any breach involving a customer’s confidential information or sensitive data, or our obligations under applicable laws or regulations could result in a claim for substantial damages against us, regardless of our responsibility for such failure. Although we attempt to contractually limit our liability for damages arising from negligent acts, errors, mistakes, or omissions in rendering our services, there can be no assurance that the limitations of liability set forth in our contracts will be enforceable in all instances or will otherwise protect us from liability for damages. Although we have general liability insurance coverage, including coverage for errors or omissions, there can be no assurance that such coverage will cover all types of claims, continue to be available on reasonable terms or will be available in sufficient amounts to cover one or more large claims, or that the insurer will not disclaim coverage as to any future claim. The successful assertion of one or more large claims against us that exceed or are not covered by our insurance coverage or changes in our insurance policies, including premium increases or the imposition of large deductible or co-insurance requirements, could have a material adverse effect on our business, results of operations, financial condition and cash flows.
In the normal course of business and in conjunction with certain customer engagements, we have entered into contractual arrangements through which we may be obligated to indemnify customers or other parties with whom we conduct business with respect to certain matters. These arrangements can include provisions whereby we agree to hold the indemnified party and certain of their affiliated entities harmless with respect to third-party claims related to such matters as our breach of certain representations or covenants, our intellectual property infringement, our gross negligence or willful misconduct or certain other claims made against certain parties. Payments by us under any of these arrangements are generally conditioned on the customer making a claim and providing us with full control over the defense and settlement of such claim. It is not possible to determine the maximum potential liability under these indemnification agreements due to the unique facts and circumstances involved in each particular agreement. Historically, we have not made payments under these indemnification agreements and therefore they have not had any impact on our operating results, financial position, or cash flows. However, if events arise requiring us to make payment for indemnification claims under our indemnification obligations in contracts we have entered, such payments could have material impact on our business, results of operations, financial condition and cash flows.
Note 15 — Employee Benefits
We contribute to defined contribution plans in the United States and Europe, including 401(k) savings and supplemental retirement plans in the United States. Total expenses for our contributions to these plans were $91 million, $76 million and $62 million for the years ended December 31, 2017, 2016 and 2015, respectively.
We maintain employee benefit plans that cover substantially all India-based employees. The employees’ provident fund, pension and family pension plans are statutorily defined contribution retirement benefit plans. Under the plans, employees contribute up to 12.0% of their base compensation, which is matched by an equal contribution by the Company. For these plans, we recognized a contribution expense of $86 million, $79 million and $71 million for the years ended December 31, 2017, 2016 and 2015, respectively.
F-37
We also maintain a gratuity plan in India that is a statutory post-employment benefit plan providing defined lump sum benefits. We make annual contributions to the employees’ gratuity fund established with a government-owned insurance corporation to fund a portion of the estimated obligation. Accordingly, our liability for the gratuity plan reflects the undiscounted benefit obligation payable as of the balance sheet date which was based upon the employees’ salary and years of service. As of December 31, 2017 and 2016, the amount accrued under the gratuity plan was $114 million and $106 million, which is net of fund assets of $138 million and $103 million, respectively. Expense recognized by us was $40 million, $41 million and $30 million for the years ended December 31, 2017, 2016 and 2015, respectively.
Note 16 — Stock-Based Compensation Plans
The Company's 2017 Incentive Award Plan, or the 2017 Incentive Plan, and the 2004 Employee Stock Purchase Plan, or the Purchase Plan, as amended in 2013, provide for the issuance of up to 48.8 million (plus any shares underlying outstanding awards that are forfeited under the Company’s Amended and Restated 2009 Incentive Compensation Plan, or 2009 Incentive Plan) and 28.0 million shares, respectively, of Class A common stock to eligible employees. The 2017 Incentive Plan does not affect any awards outstanding under the 2009 Incentive Plan. As of December 31, 2017, we have 46.1 million and 2.4 million shares available for grant under the 2017 Incentive Plan and the Purchase Plan, respectively.
Stock options granted to employees under our plans have a life ranging from seven to ten years, vest proportionally over four years, unless specified otherwise, and have an exercise price equal to the fair market value of the common stock on the date of grant. Grants to non-employee directors vest proportionally over two years. Stock-based compensation expense relating to stock options is recognized on a straight-line basis over the requisite service period.
Restricted stock units, or RSUs, vest proportionately in quarterly or annual installments over one to four years. Stock-based compensation expense relating to RSUs is recognized on a straight-line basis over the requisite service period.
We granted performance stock units, or PSUs, that vest over periods ranging from one to three years to employees, including our executive officers. The vesting of PSUs is contingent on both meeting certain financial performance targets and continued service. Stock-based compensation costs for PSUs that vest proportionally are recognized on a graded-vesting basis over the vesting period based on the most probable outcome of the performance conditions. If the minimum performance targets are not met, no compensation cost is recognized and any recognized compensation cost is reversed.
All RSUs and PSUs have dividend equivalent rights, which entitle holders to the same dividend value per share as holders of common stock. Dividend equivalent rights are subject to the same vesting and other terms and conditions as the corresponding unvested RSUs and PSUs and are accumulated and paid when the underlying shares vest.
The Purchase Plan provides for eligible employees to purchase shares of Class A common stock at a price of 90% of the lesser of: (a) the fair market value of a share of Class A common stock on the first date of the purchase period or (b) the fair market value of a share of Class A common stock on the last date of the purchase period. Stock-based compensation expense for the Purchase Plan is recognized over the vesting period of three months on a straight-line basis.
The allocation of total stock-based compensation expense between cost of revenues and selling, general and administrative expenses as well as the related income tax benefit were as follows for the three years ended December 31:
2017 | 2016 | 2015 | ||||||||||
(in millions) | ||||||||||||
Cost of revenues | $ | 55 | $ | 53 | $ | 39 | ||||||
Selling, general and administrative expenses | 166 | 164 | 153 | |||||||||
Total stock-based compensation expense | $ | 221 | $ | 217 | $ | 192 | ||||||
Income tax benefit | $ | 101 | $ | 49 | $ | 46 | ||||||
In 2017, as a result of the adoption of new authoritative stock compensation guidance, we recognized net excess tax benefits upon exercise or vesting of stock-based compensation awards in our income tax provision in the amount of $40 million or $0.07 per share. In 2016 and 2015, such excess tax benefits were recorded in additional paid in capital.
We estimate the fair value of each stock option granted using the Black-Scholes option-pricing model. For the years ended December 31, 2017, 2016 and 2015, expected volatility was calculated using implied market volatilities. In addition, the expected term, which represents the period of time, measured from the grant date, that vested options are expected to be outstanding, was derived by incorporating exercise and post-vest termination assumptions, based on historical data, in a Monte Carlo simulation model. The risk-free rate is derived from the U.S. Treasury yield curve in effect at the time of grant. The
F-38
expected dividend yield is based on the annual dividend amount expected on the date of grant divided by the stock price on the date of grant. Forfeiture assumptions used to recognize stock-based compensation expense are based on an analysis of historical data.
The fair values of option grants, including the Purchase Plan, were estimated at the date of grant during the years ended December 31, 2017, 2016, and 2015 based upon the following assumptions and were as follows:
2017 | 2016 | 2015 | ||||||||||
Dividend yield | 1.0 | % | 0.0 | % | 0.0 | % | ||||||
Weighted average volatility factor: | ||||||||||||
Stock options | 25.9 | % | 28.3 | % | 28.1 | % | ||||||
Purchase Plan | 24.3 | % | 26.5 | % | 25.8 | % | ||||||
Weighted average expected life (in years): | ||||||||||||
Stock options | 4.36 | 4.46 | 4.29 | |||||||||
Purchase Plan | 0.25 | 0.25 | 0.25 | |||||||||
Weighted average risk-free interest rate: | ||||||||||||
Stock options | 1.9 | % | 1.1 | % | 1.4 | % | ||||||
Purchase Plan | 0.9 | % | 0.4 | % | 0.1 | % | ||||||
Weighted average grant date fair value: | ||||||||||||
Stock options | $ | 13.06 | $ | 15.17 | $ | 16.53 | ||||||
Purchase Plan | $ | 9.23 | $ | 8.74 | $ | 9.04 | ||||||
During the year ended December 31, 2017, we issued 2.8 million shares of Class A common stock under the Purchase Plan with a total vested fair value of approximately $26 million.
A summary of the activity for stock options granted under our stock-based compensation plans as of December 31, 2017 and changes during the year then ended is presented below:
Number of Options (in millions) | Weighted Average Exercise Price (in dollars) | Weighted Average Remaining Life (in years) | Aggregate Intrinsic Value (in millions) | ||||||||||
Outstanding at January 1, 2017 | 2.4 | $ | 21.08 | ||||||||||
Granted | — | — | |||||||||||
Exercised | (1.7 | ) | 19.76 | ||||||||||
Cancelled | — | — | |||||||||||
Expired | — | — | |||||||||||
Outstanding at December 31, 2017 | 0.7 | $ | 24.88 | 1.6 | $ | 29 | |||||||
Vested and expected to vest at December 31, 2017 | 0.7 | $ | 24.78 | 1.6 | $ | 29 | |||||||
Exercisable at December 31, 2017 | 0.7 | $ | 23.28 | 1.5 | $ | 29 | |||||||
As of December 31, 2017, $0.2 million of total remaining unrecognized stock-based compensation cost related to stock options is expected to be recognized over the weighted-average remaining requisite service period of 0.5 years . The total intrinsic value of options exercised was $78 million, $74 million and $59 million for the years ended December 31, 2017, 2016 and 2015, respectively.
The fair value of RSUs and PSUs is determined based on the number of stock units granted and the quoted price of our stock at date of grant.
F-39
A summary of the activity for PSUs granted under our stock-based compensation plans as of December 31, 2017 and changes during the year then ended is presented below. The presentation reflects the number of PSUs at the maximum performance milestones.
Number of Units (in millions) | Weighted Average Grant Date Fair Value (in dollars) | ||||||
Unvested at January 1, 2017 | 2.7 | $ | 55.24 | ||||
Granted | 2.0 | 60.77 | |||||
Vested | (0.9 | ) | 55.07 | ||||
Forfeited | (0.4 | ) | 56.81 | ||||
Reduction due to the achievement of lower than maximum performance milestones | (0.7 | ) | 55.04 | ||||
Unvested at December 31, 2017 | 2.7 | $ | 59.15 | ||||
As of December 31, 2017, $60 million of total remaining unrecognized stock-based compensation cost related to PSUs is expected to be recognized over the weighted-average remaining requisite service period of 1.2 years.
A summary of the activity for RSUs granted under our stock-based compensation plans as of December 31, 2017 and changes during the year then ended is presented below:
Number of Units (in millions) | Weighted Average Grant Date Fair Value (in dollars) | ||||||
Unvested at January 1, 2017 | 4.8 | $ | 56.45 | ||||
Granted | 3.6 | 67.56 | |||||
Vested | (2.5 | ) | 56.81 | ||||
Forfeited | (0.7 | ) | 57.63 | ||||
Unvested at December 31, 2017 | 5.2 | $ | 63.80 | ||||
As of December 31, 2017, $282 million of total remaining unrecognized stock-based compensation cost related to RSUs is expected to be recognized over the weighted-average remaining requisite service period of 2.2 years.
Note 17— Related Party Transactions
Brackett B. Denniston, III was the Interim General Counsel and an executive officer of the Company from December 2016 until May 15, 2017. Mr. Denniston is, and was during such period, a Senior Counsel at the law firm of Goodwin Procter LLP, or Goodwin. During the years ended December 31, 2017 and 2016, Goodwin performed legal services for the Company for which it earned approximately $4 million and $2 million, respectively. Goodwin has continued to perform such legal services since December 31, 2017 through the date of this filing. Goodwin did not perform any services for the Company during the year ended December 31, 2015. The provision of legal services by Goodwin was reviewed and approved by our Audit Committee.
Note 18 — Segment Information
Our reportable segments are:
• | Financial Services, which consists of our banking and insurance operating segments; |
• | Healthcare, which consists of our healthcare and life sciences operating segments; |
• | Products and Resources (previously referred to as Manufacturing/Retail/Logistics), which consists of our retail and consumer goods, manufacturing and logistics, travel and hospitality, and energy and utilities operating segments; and |
• | Communications, Media and Technology (previously referred to as Other), which includes our communications and media operating segment and our technology operating segment. |
F-40
Our sales managers, account executives, account managers and project teams are aligned in accordance with the specific industries they serve. Our chief operating decision maker evaluates the Company’s performance and allocates resources based on segment revenues and operating profit. Segment operating profit is defined as income from operations before unallocated costs. Generally, operating expenses for each operating segment have similar characteristics and are subject to the same factors, pressures and challenges. However, the economic environment and its effects on industries served by our operating segments may affect revenues and operating expenses to differing degrees. Expenses included in segment operating profit consist principally of direct selling and delivery costs as well as a per seat charge for use of the global delivery centers. Certain selling, general and administrative expenses, excess or shortfall of incentive compensation for delivery personnel as compared to target, stock-based compensation expense, a portion of depreciation and amortization, costs related to our realigment program and the impact of the settlements of our cash flow hedges are not allocated to individual segments in internal management reports used by the chief operating decision maker. Accordingly, such expenses are excluded from segment operating profit and are separately disclosed as “unallocated costs” and adjusted only against our total income from operations. Additionally, management has determined that it is not practical to allocate identifiable assets by segment, since such assets are used interchangeably among the segments.
Revenues from external customers and segment operating profit, before unallocated costs, by reportable segment were as follows:
2017 | 2016 | 2015 | |||||||||
(in millions) | |||||||||||
Revenues: | |||||||||||
Financial Services | $ | 5,636 | $ | 5,366 | $ | 5,003 | |||||
Healthcare | 4,263 | 3,871 | 3,668 | ||||||||
Products and Resources | 3,040 | 2,660 | 2,344 | ||||||||
Communications, Media and Technology | 1,871 | 1,590 | 1,401 | ||||||||
Total revenues | $ | 14,810 | $ | 13,487 | $ | 12,416 | |||||
Segment Operating Profit: | |||||||||||
Financial Services | $ | 1,636 | $ | 1,707 | $ | 1,642 | |||||
Healthcare | 1,304 | 1,153 | 1,200 | ||||||||
Products and Resources | 868 | 851 | 803 | ||||||||
Communications, Media and Technology | 565 | 488 | 453 | ||||||||
Total segment operating profit | 4,373 | 4,199 | 4,098 | ||||||||
Less: unallocated costs | 1,892 | 1,910 | 1,956 | ||||||||
Income from operations | $ | 2,481 | $ | 2,289 | $ | 2,142 | |||||
F-41
Geographic Area Information
Revenues and long-lived assets, by geographic area, were as follows:
2017 | 2016 | 2015 | |||||||||
(in millions) | |||||||||||
Revenues: (1) | |||||||||||
North America(2) | $ | 11,450 | $ | 10,546 | $ | 9,759 | |||||
United Kingdom | 1,150 | 1,176 | 1,188 | ||||||||
Rest of Europe | 1,248 | 969 | 820 | ||||||||
Europe - Total | 2,398 | 2,145 | 2,008 | ||||||||
Rest of World(3) | 962 | 796 | 649 | ||||||||
Total | $ | 14,810 | $ | 13,487 | $ | 12,416 | |||||
2017 | 2016 | 2015 | |||||||||
(in millions) | |||||||||||
Long-lived Assets:(4) | |||||||||||
North America(2) | $ | 360 | $ | 279 | $ | 242 | |||||
Europe | 63 | 52 | 32 | ||||||||
Rest of World(3)(5) | 901 | 980 | 997 | ||||||||
Total | $ | 1,324 | $ | 1,311 | $ | 1,271 | |||||
_____________
(1) | Revenues are attributed to regions based upon customer location. |
(2) | Substantially all relates to operations in the United States. |
(3) | Includes our operations in Asia Pacific, the Middle East and Latin America. |
(4) | Long-lived assets include property and equipment, net of accumulated depreciation and amortization. |
(5) | Substantially all of these long-lived assets relate to our operations in India. |
F-42
Note 19 — Quarterly Financial Data (Unaudited)
Summarized quarterly results for the two years ended December 31, 2017 are as follows:
Three Months Ended | ||||||||||||||||||||
2017 | March 31 | June 30 | September 30 | December 31 | Full Year | |||||||||||||||
(in millions, except per share data) | ||||||||||||||||||||
Revenues | $ | 3,546 | $ | 3,670 | $ | 3,766 | $ | 3,828 | $ | 14,810 | ||||||||||
Cost of revenues (exclusive of depreciation and amortization expense shown separately below) | 2,194 | 2,261 | 2,337 | 2,360 | 9,152 | |||||||||||||||
Selling, general and administrative expenses | 686 | 709 | 674 | 700 | 2,769 | |||||||||||||||
Depreciation and amortization expense | 96 | 94 | 107 | 111 | 408 | |||||||||||||||
Income from operations | 570 | 606 | 648 | 657 | 2,481 | |||||||||||||||
Net income (loss) (1) | 557 | 470 | 495 | (18 | ) | 1,504 | ||||||||||||||
Basic earnings (losses) per share (2) (3) | $ | 0.92 | $ | 0.80 | $ | 0.84 | $ | (0.03 | ) | $ | 2.54 | |||||||||
Diluted earnings (losses) per share (2) (3) | $ | 0.92 | $ | 0.80 | $ | 0.84 | $ | (0.03 | ) | $ | 2.53 | |||||||||
Three Months Ended | ||||||||||||||||||||
2016 | March 31 | June 30 | September 30 | December 31 | Full Year | |||||||||||||||
(in millions, except per share data) | ||||||||||||||||||||
Revenues | $ | 3,202 | $ | 3,370 | $ | 3,453 | $ | 3,462 | $ | 13,487 | ||||||||||
Cost of revenues (exclusive of depreciation and amortization expense shown separately below) | 1,915 | 2,038 | 2,077 | 2,078 | 8,108 | |||||||||||||||
Selling, general and administrative expenses | 646 | 654 | 701 | 730 | 2,731 | |||||||||||||||
Depreciation and amortization expense | 87 | 87 | 92 | 93 | 359 | |||||||||||||||
Income from operations | 554 | 591 | 583 | 561 | 2,289 | |||||||||||||||
Net income | 441 | 252 | 444 | 416 | 1,553 | |||||||||||||||
Basic earnings per share (2) | $ | 0.73 | $ | 0.42 | $ | 0.73 | $ | 0.69 | $ | 2.56 | ||||||||||
Diluted earnings per share (2) | $ | 0.72 | $ | 0.41 | $ | 0.73 | $ | 0.68 | $ | 2.55 | ||||||||||
____________________________
(1) The net loss for the quarter ended December 31, 2017, includes the one-time provisional incremental income tax expense relating to the Tax Reform Act. See Note 10 to our consolidated financial statements.
(2) The sum of the quarterly basic and diluted earnings (losses) per share for each of the four quarters may not equal the earnings (losses) per share for the year due to rounding.
(3) In March 2016, the FASB issued an update related to stock compensation. The update simplified the accounting for excess tax benefits and deficiencies related to employee stock-based payment transactions. We adopted this standard prospectively on January 1, 2017. For the first, second, third and fourth quarters of 2017, we recognized net excess tax benefits on stock-based compensation awards in our income tax provision in the amount of $6 million, $5 million, $5 million and $24 million, respectively. This impacted our earnings per shares in the first, second, third and fourth quarters of 2017 by $0.01, $0.01, $0.01 and $0.04 per share, respectively. In prior periods, such net excess tax benefits were recorded in additional paid in capital.
F-43
Cognizant Technology Solutions Corporation
Valuation and Qualifying Accounts
For the Years Ended December 31, 2017, 2016 and 2015
(in millions)
Description | Balance at Beginning of Period | Charged to Costs and Expenses | Charged to Other Accounts | Deductions /Other | Balance at End of Period | |||||||||||||||
(in millions) | ||||||||||||||||||||
Trade accounts receivable allowance for doubtful accounts: | ||||||||||||||||||||
2017 | $ | 48 | $ | 15 | $ | 3 | $ | 1 | $ | 65 | ||||||||||
2016 | $ | 39 | $ | 12 | $ | — | $ | 3 | $ | 48 | ||||||||||
2015 | $ | 37 | $ | 10 | $ | — | $ | 8 | $ | 39 | ||||||||||
Warranty accrual: | ||||||||||||||||||||
2017 | $ | 26 | $ | 30 | $ | — | $ | 26 | $ | 30 | ||||||||||
2016 | $ | 24 | $ | 28 | $ | — | $ | 26 | $ | 26 | ||||||||||
2015 | $ | 21 | $ | 28 | $ | — | $ | 25 | $ | 24 | ||||||||||
Valuation allowance—deferred income tax assets: | ||||||||||||||||||||
2017 | $ | 10 | $ | — | $ | — | $ | — | $ | 10 | ||||||||||
2016 | $ | 10 | $ | — | $ | — | $ | — | $ | 10 | ||||||||||
2015 | $ | 11 | $ | 3 | $ | — | $ | 4 | $ | 10 | ||||||||||
F-44