Attached files
| file | filename |
|---|---|
| 8-K - 8-K - Landmark Infrastructure Partners LP | lmrk-8k_20180223.htm |
Exhibit 99.1

LANDMARK INFRASTRUCTURE Landmark Infrastructure Partners LP (LMRK) Investor Presentation February 2018
LMRK Disclaimer This presentation may contain forward‐lookingstatements that involve risks and uncertainties. These forward‐lookingstatements include information about possible or assumed future results of Landmark Infrastructure Partner LP’s (“LMRK” or the “Partnership”) business, future events, financial condition or performance, expectations, competitive environment, availability of resources, regulation, liquidity, results of operations, strategies, plans and objectives.These forward‐looking statements also include, without limitation, statements concerning projections, predictions, expectations, estimates, or forecasts as to LMRK’s business, financial and operational results, and future economic performance, as well as statements of management’s goals and objectives and other similar expressions concerning matters that are not historical facts. The words “may,” “should,” “could,” “would,” “predicts,” “potential,” “continue,” “expects,” “anticipates,” “future,” “intends,” “plans,” “believes,” “estimates” or similar expressions or their negatives, as well as statements in future tense, are intended to identify forward‐looking statements. You should not place undue reliance on these forward‐looking statements. Statements regarding the following subjects are forward‐looking by their nature: market trends and LMRK’s business strategy, projected operating results, and ability to obtain future financing arrangements. Forward‐looking statements should not be read as a guarantee of future performance or results, and will not necessarily be accurate indications of the times at, or by, which such performance or results will be achieved.A forward-looking statement may include a statement of the beliefs, assumptions and expectations of future performance, at the time those statements are made or management’s good faith belief as of that time with respect to future events. While LMRK believes it has chosen these beliefs, assumptions and expectations in good faith and that they are reasonable, these beliefs, assumptions and expectations can change as a result of many possible events or factors, not all of which are known to LMRK or under LMRK’s control. If a change occurs (such as a change in general economic conditions, competitive conditions in our industry, actions taken by our customers and competitors, our ability to successfully implement our business plan, our ability to successfully make acquisitions, interest rates, customer defaults, or any other factors), LMRK’s business, financial condition, liquidity and results of operations may vary materially from those expressed in the forward‐looking statements in this presentation.You should carefully consider these risks before you make an investment decision with respect to the Partnership, including our common units representing limited partner interests (“common units”), along with the following factors that could cause actual results to vary from our forward‐looking statements: the factors in our Annual Report on Form 10-K for the year ended December 31, 2017, including those set forth under the section captioned “Risk Factors”; general volatility of the capital markets and the market price of the common units; changes in LMRK’s business strategy; availability, terms and deployment of capital; availability of qualified personnel; changes in LMRK’s industry, interest rates or the general economy; and the degree and nature of LMRK’s competition. Forward looking statements speak only as of the date the statements are made. You should not put undue reliance on any forward‐looking statements. LMRK assumes no obligation to update forward‐looking statements to reflect actual results, changes in assumptions, or changes in other factors affecting forward‐looking information, except to the extent required by applicable securities laws.This document includes certain non-GAAP financial measures as defined under SEC Regulation G. A reconciliation of those measures to the most directly comparable generally accepted accounting principles (“GAAP”) measures is provided in this presentation. We define EBITDA as net income before interest, income taxes, depreciation and amortization, and we define Adjusted EBITDA as EBITDA before unrealized and realized gain or loss on derivatives, gain or loss on sale of real property interests, straight line rent adjustments, amortization of above- and below-market rents, impairments, acquisition-related expenses, unit-based compensation, repayments of investments in receivables and after the capital contribution to fund our general and administrative expense reimbursement. We define distributable cash flow as Adjusted EBITDA less cash interest paid, current cash income tax paid, preferred distributions, distributions to noncontrolling interest holders and maintenance capital expenditures. For additional information on non-GAAP financial measures, review slide 21 hereto and the disclosures set forth in our Annual Report on Form 10-K for the year ended December 31, 2017, including those set forth under the section captioned "Selected Financial Data."
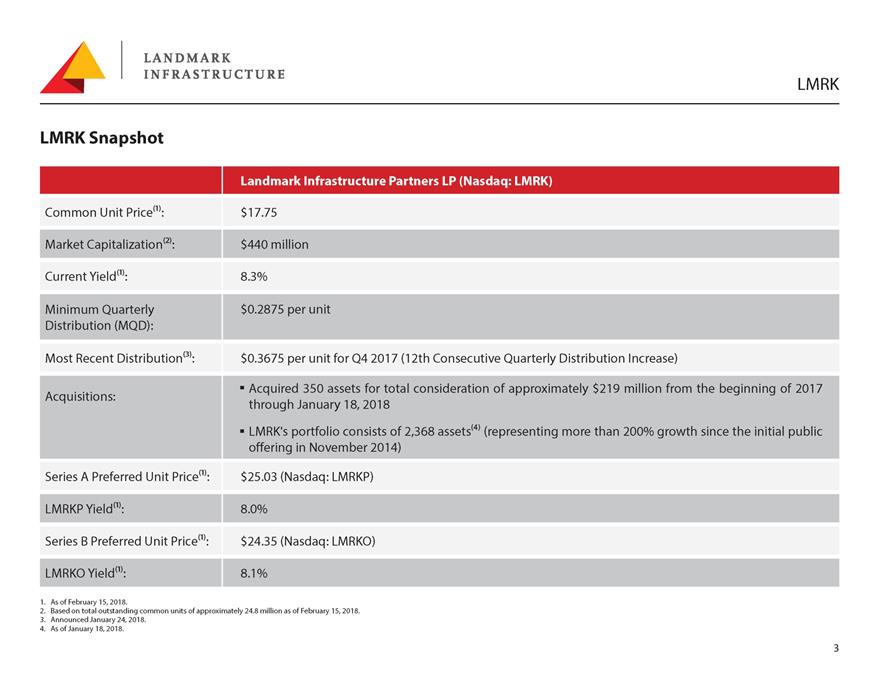
LMRK Snapshot Landmark Infrastructure Partners LP (Nasdaq: LMRK) Common Unit Price⁽1⁾: $17.75 Market Capitalization⁽2⁾: $440 million Current Yield⁽1⁾: 8.3% Minimum Quarterly Distribution (MQD): $0.2875 per unit Most Recent Distribution⁽3⁾: $0.3675 per unit for Q4 2017 (12th Consecutive Quarterly Distribution Increase) Acquisitions: Acquired 350 assets for total consideration of approximately $219 million from the beginning of 2017 through January 18, 2018 LMRK's portfolio consists of 2,368 assets⁽⁴⁾ (representing more than 200% growth since the initial public offering in November 2014) Series A Preferred Unit Price⁽1⁾: $25.03 (Nasdaq: LMRKP) LMRKP Yield⁽1⁾: 8.0% Series B Preferred Unit Price⁽1⁾: $24.35 (Nasdaq: LMRKO) LMRKO Yield⁽1⁾: 8.1% 1. As of February 15, 2018. 2. Based on total outstanding common units of approximately 24.8 million as of February 15, 2018. 3. Announced January 24, 2018. 4. As of January 18, 2018.
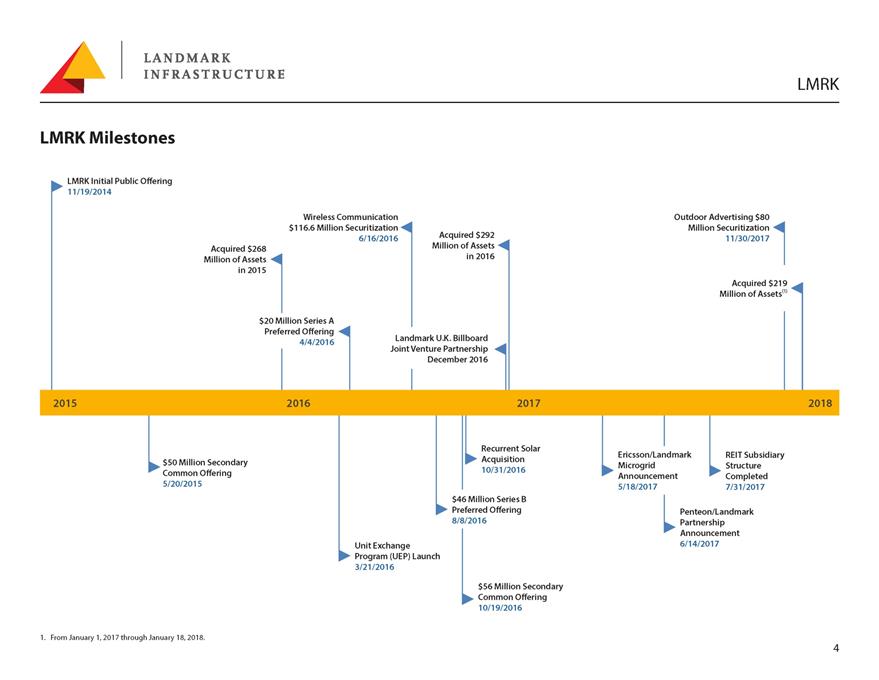
LMRK Milestones LMRK Initial Public Offering 11/19/2014 Acquired $268 Million of Assets in 2015 Wireless Communication $116.6 Million Securitization 6/16/2016 Acquired $292 Million of Assets in 2016 Outdoor Advertising $80 Million Securitization 11/30/2017 Acquired $219 Million of Assets⁽1⁾ $20 Million Series A Preferred Offering 4/4/2016 Landmark U.K. Billboard Joint Venture Partnership December 2016 2015 2016 2017 2018 $50 Million Secondary Common Offering 5/20/2015 Recurrent Solar Acquisition 10/31/2016 $46 Million Series B Ericsson/Landmark Microgrid Announcement 5/18/2017 REIT Subsidiary Structure Completed 7/31/2017 Unit Exchange Program (UEP) Launch 3/21/2016 Preferred Offering 8/8/2016 $56 Million Secondary Common Offering 10/19/2016 Penteon/Landmark Partnership Announcement 6/14/2017 1. From January 1, 2017 through January 18, 2018.
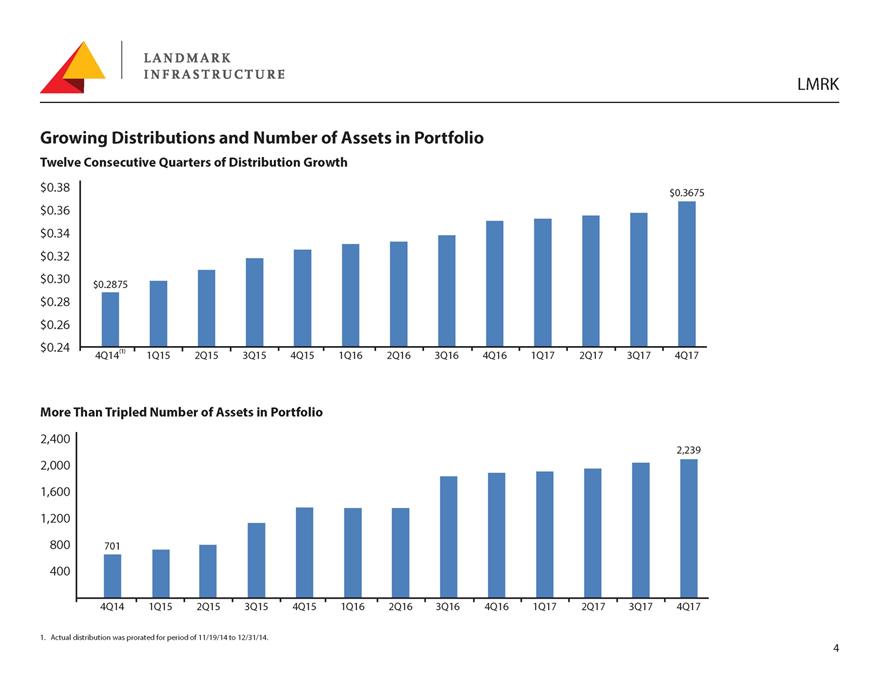
Growing Distributions and Number of Assets in Portfolio Twelve Consecutive Quarters of Distribution Growth $0.38 $0.36 $0.34 $0.32 $0.30 $0.28 $0.26 $0.24 More Than Tripled Number of Assets in Portfolio 2,400 2,000 1,600 1,200 800 400 4Q14 1Q15 2Q15 3Q15 4Q15 1Q16 2Q16 3Q16 4Q16 1Q17 2Q17 3Q17 4Q17 1. Actual distribution was prorated for period of 11/19/14 to 12/31/14.
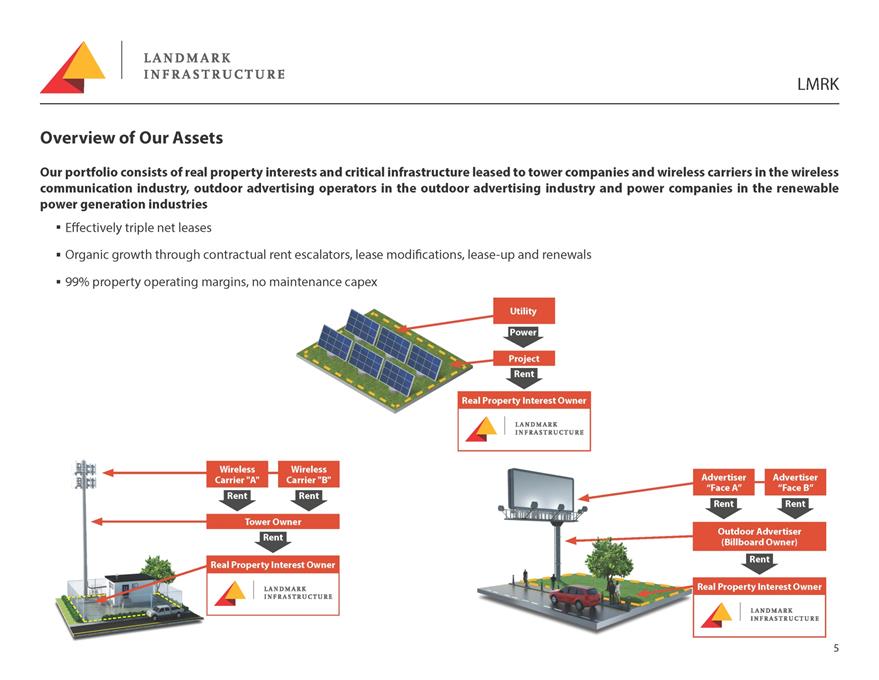
Overview of Our Assets Our portfolio consists of real property interests and critical infrastructure leased to tower companies and wireless carriers in the wireless communication industry, outdoor advertising operators in the outdoor advertising industry and power companies in the renewable power generation industries Effectively triple net leases Organic growth through contractual rent escalators, lease modifications, lease-up and renewals 99% property operating margins, no maintenance capex
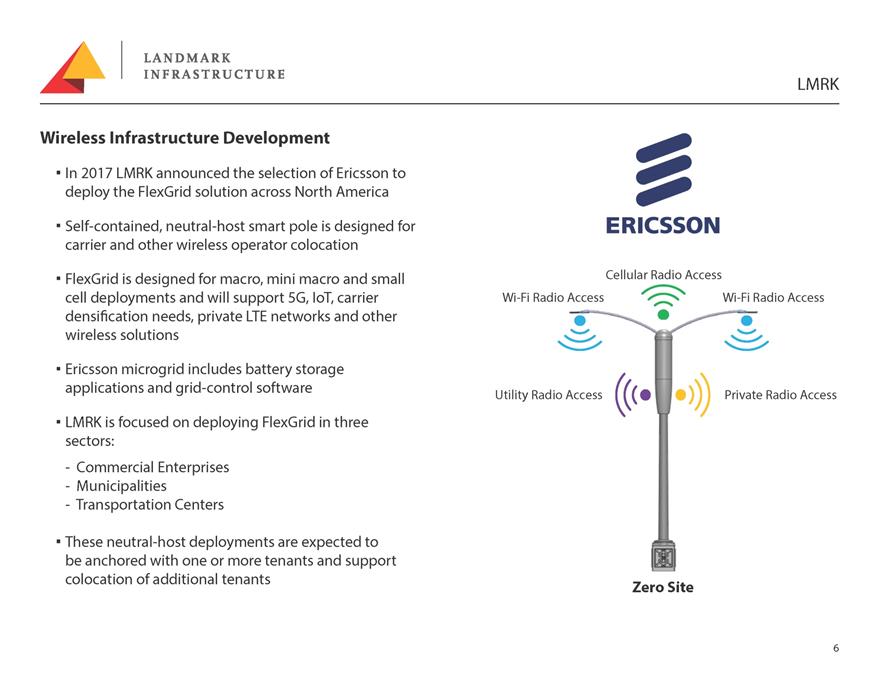
Wireless Infrastructure Development In 2017 LMRK announced the selection of Ericsson to deploy the FlexGrid solution across North America Self-contained, neutral-host smart pole is designed for carrier and other wireless operator colocation FlexGrid is designed for macro, mini macro and small cell deployments and will support 5G, IoT, carrier densification needs, private LTE networks and other wireless solutions Ericsson microgrid includes battery storage Wi-Fi Radio Access Cellular Radio Access Wi-Fi Radio Access applications and grid-control software LMRK is focused on deploying FlexGrid in three sectors: - Commercial Enterprises - Municipalities - Transportation Centers These neutral-host deployments are expected to be anchored with one or more tenants and support colocation of additional tenants Utility Radio Access Private Radio Access Zero Site
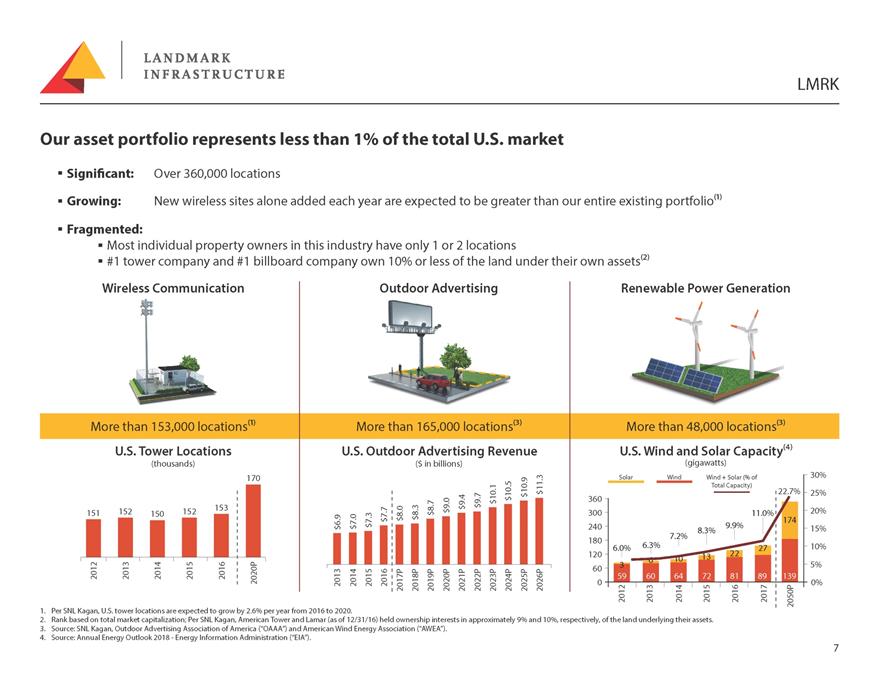
Our asset portfolio represents less than 1% of the total U.S. market Significant: Growing: Fragmented: Over 360,000 locations New wireless sites alone added each year are expected to be greater than our entire existing portfolio⁽1⁾ Most individual property owners in this industry have only 1 or 2 locations #1 tower company and #1 billboard company own 10% or less of the land under their own assets⁽2⁾ 1. Per SNL Kagan, U.S. tower locations are expected to grow by 2.6% per year from 2016 to 2020. 2. Rank based on total market capitalization; Per SNL Kagan, American Tower and Lamar (as of 12/31/16) held ownership interests in approximately 9% and 10%, respectively, of the land underlying their assets. 3. Source: SNL Kagan, Outdoor Advertising Association of America (“OAAA”) and American Wind Energy Association (“AWEA”). 4. Source: Annual Energy Outlook 2018 - Energy Information Administration (“EIA”).
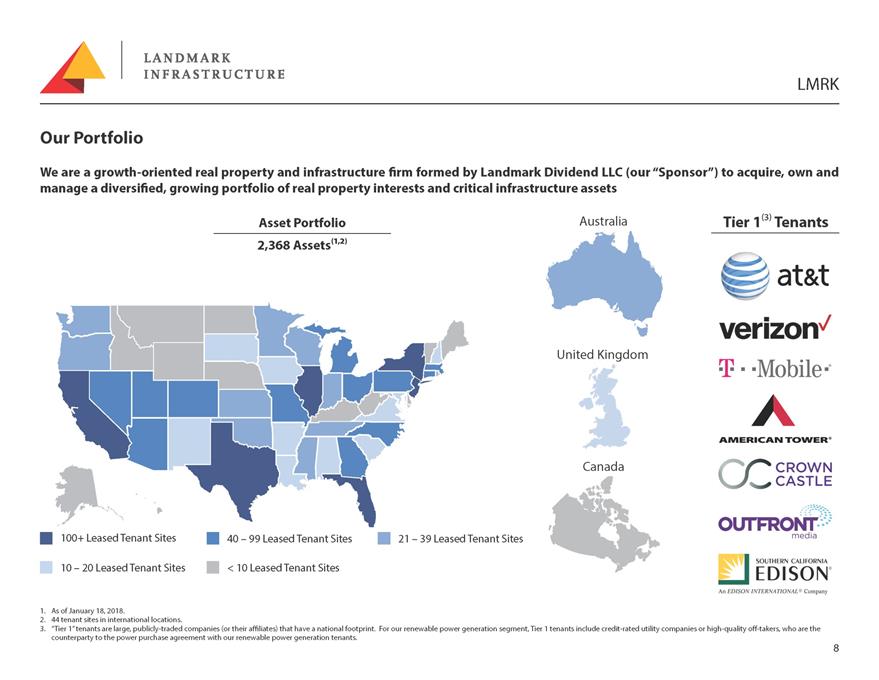
Our Portfolio We are a growth-oriented real property and infrastructure firm formed by Landmark Dividend LLC (our “Sponsor”) to acquire, own and manage a diversified, growing portfolio of real property interests and critical infrastructure assets 100+ Leased Tenant Sites 10 – 20 Leased Tenant Sites Asset Portfolio 2,368 Assets⁽1,2⁾ 40 – 99 Leased Tenant Sites < 10 Leased Tenant Sites 21 – 39 Leased Tenant Sites Australia United Kingdom Canada Tier 1⁽3⁾ Tenants 1. As of January 18, 2018. 2. 44 tenant sites in international locations. 3. “Tier 1” tenants are large, publicly-traded companies (or their affiliates) that have a national footprint. For our renewable power generation segment, Tier 1 tenants include credit-rated utility companies or high-quality off-takers, who are the counterparty to the power purchase agreement with our renewable power generation tenants.
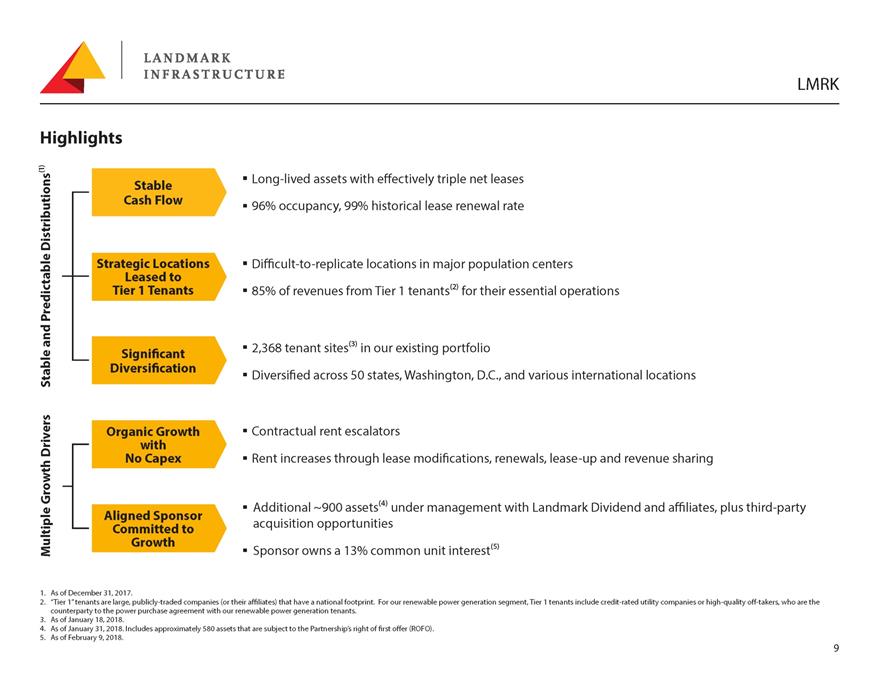
Highlights Long-lived assets with effectively triple net leases 96% occupancy, 99% historical lease renewal rate Difficult-to-replicate locations in major population centers 85% of revenues from Tier 1 tenants⁽2⁾ for their essential operations 2,368 tenant sites⁽3⁾ in our existing portfolio Diversified across 50 states, Washington, D.C., and various international locations Contractual rent escalators Rent increases through lease modifications, renewals, lease-up and revenue sharing Additional ~900 assets⁽⁴⁾ under management with Landmark Dividend and affiliates, plus third-party acquisition opportunities Sponsor owns a 13% common unit interest⁽⁵⁾ 1. As of December 31, 2017. 2. “Tier 1” tenants are large, publicly-traded companies (or their affiliates) that have a national footprint. For our renewable power generation segment, Tier 1 tenants include credit-rated utility companies or high-quality off-takers, who are the counterparty to the power purchase agreement with our renewable power generation tenants. 3. As of January 18, 2018. 4. As of January 31, 2018. Includes approximately 580 assets that are subject to the Partnership’s right of first offer (ROFO). 5. As of February 9, 2018.
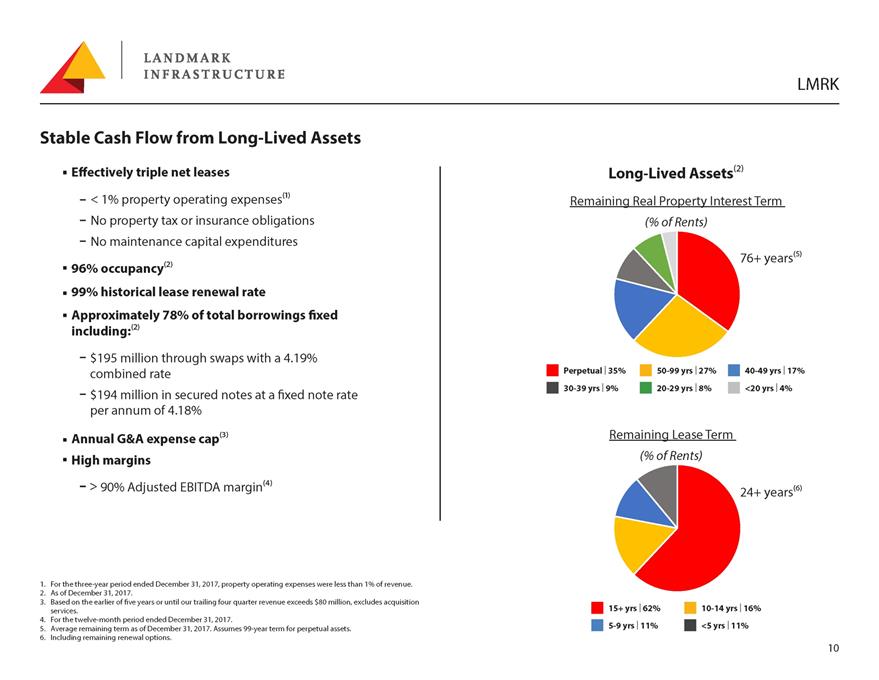
Stable Cash Flow from Long-Lived Assets Effectively triple net leases < 1% property operating expenses⁽1⁾ No property tax or insurance obligations No maintenance capital expenditures 96% occupancy⁽2⁾ 99% historical lease renewal rate Approximately 78% of total borrowings fixed including:⁽2⁾ $195 million through swaps with a 4.19% Long-Lived Assets⁽2⁾ Remaining Real Property Interest Term (% of Rents) 76+ years⁽⁵⁾ combined rate $194 million in secured notes at a fixed note rate per annum of 4.18% Perpetual | 35% 30-39 yrs | 9% 50-99 yrs | 27% 20-29 yrs | 8% 40-49 yrs | 17% <20 yrs | 4% Annual G&A expense cap⁽3⁾ High margins > 90% Adjusted EBITDA margin⁽⁴⁾ Remaining Lease Term (% of Rents) 24+ years⁽⁶⁾ 1. For the three-year period ended December 31, 2017, property operating expenses were less than 1% of revenue. 2. As of December 31, 2017. 3. Based on the earlier of five years or until our trailing four quarter revenue exceeds $80 million, excludes acquisition services. 4. For the twelve-month period ended December 31, 2017. 5. Average remaining term as of December 31, 2017. Assumes 99-year term for perpetual assets. 6. Including remaining renewal options. 15+ yrs | 62% 5-9 yrs | 11% 10-14 yrs | 16% <5 yrs | 11%
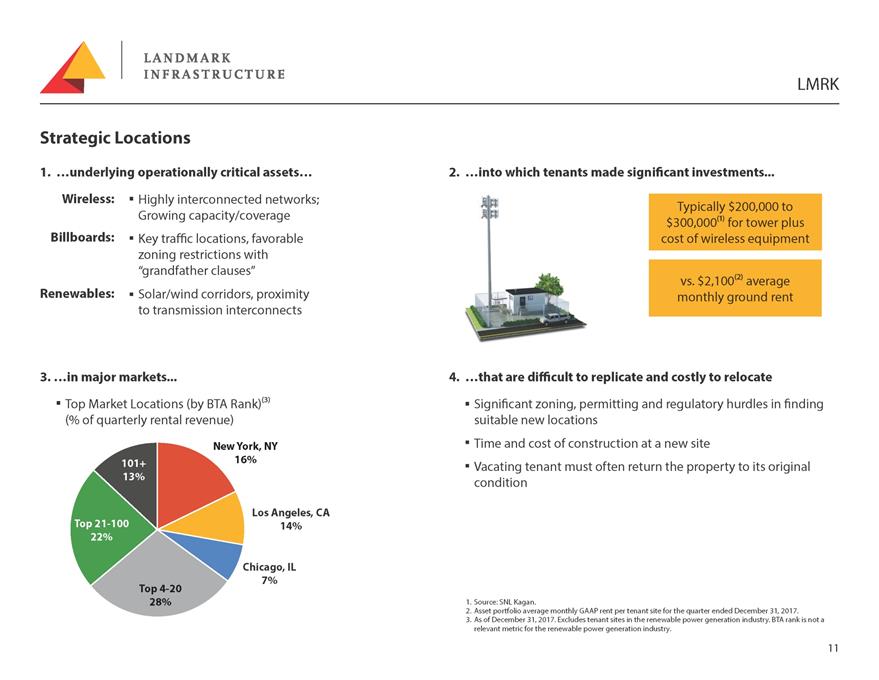
Strategic Locations 1. …underlying operationally critical assets… 2. …into which tenants made significant investments... Wireless: Billboards: Renewables: Highly interconnected networks; Growing capacity/coverage Key traffic locations, favorable zoning restrictions with “grandfather clauses” Solar/wind corridors, proximity to transmission interconnects 3. …in major markets... Top Market Locations (by BTA Rank)⁽3⁾ (% of quarterly rental revenue) New York, NY 4. …that are difficult to replicate and costly to relocate Significant zoning, permitting and regulatory hurdles in finding suitable new locations Time and cost of construction at a new site 101+ 13% 16% Vacating tenant must often return the property to its original condition Top 21-100 22% Los Angeles, CA 14% Top 4-20 28% Chicago, IL 7% 1. Source: SNL Kagan. 2. Asset portfolio average monthly GAAP rent per tenant site for the quarter ended December 31, 2017. 3. As of December 31, 2017. Excludes tenant sites in the renewable power generation industry. BTA rank is not a relevant metric for the renewable power generation industry.
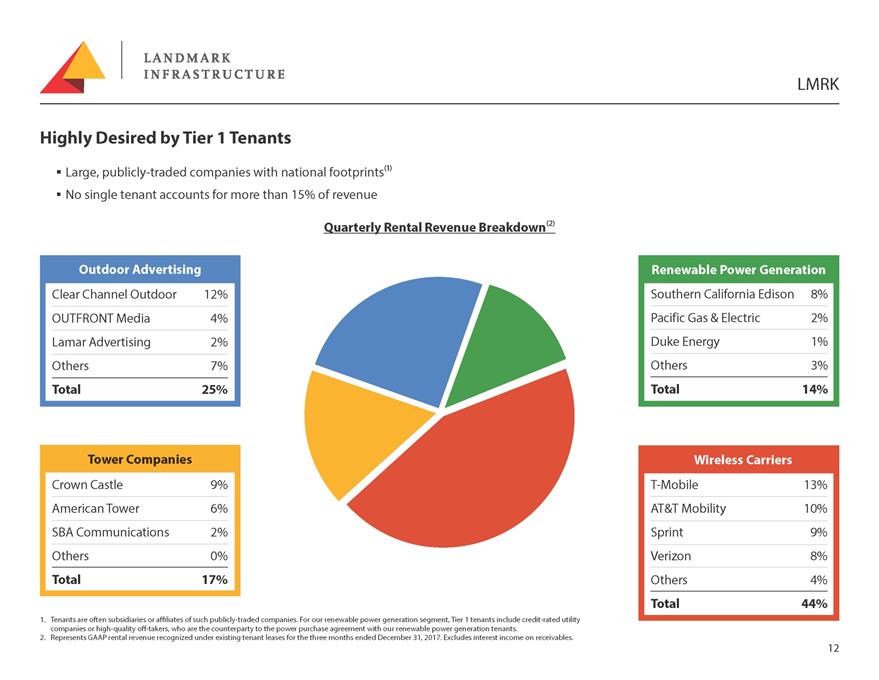
Highly Desired by Tier 1 Tenants Large, publicly-traded companies with national footprints⁽1⁾ No single tenant accounts for more than 15% of revenue Quarterly Rental Revenue Breakdown⁽2⁾ 1. Tenants are often subsidiaries or affiliates of such publicly-traded companies. For our renewable power generation segment, Tier 1 tenants include credit-rated utility companies or high-quality off-takers, who are the counterparty to the power purchase agreement with our renewable power generation tenants. 2. Represents GAAP rental revenue recognized under existing tenant leases for the three months ended December 31, 2017. Excludes interest income on receivables.
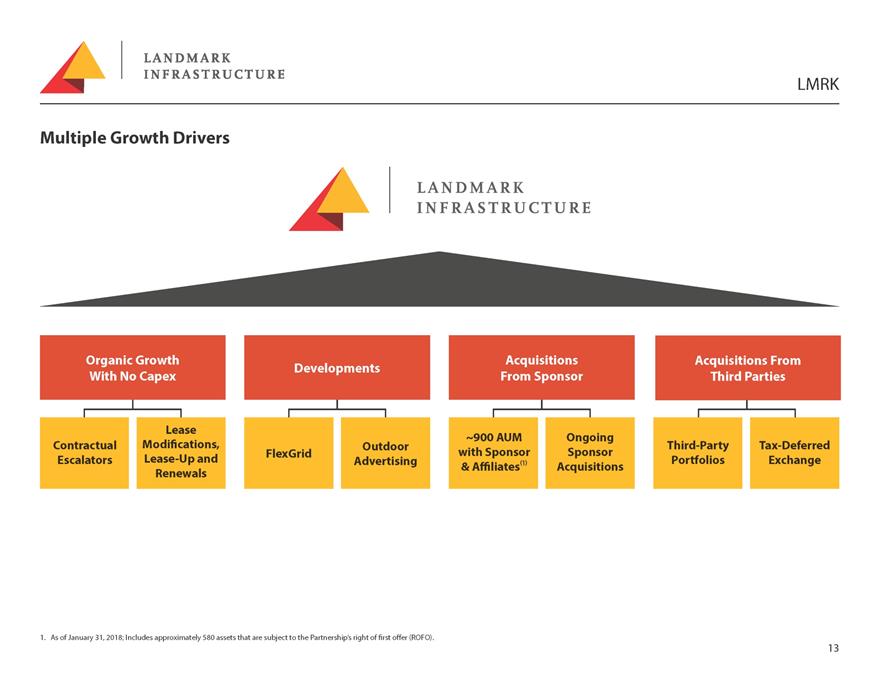
Multiple Growth Drivers 1. As of January 31, 2018; Includes approximately 580 assets that are subject to the Partnership’s right of first offer (ROFO).
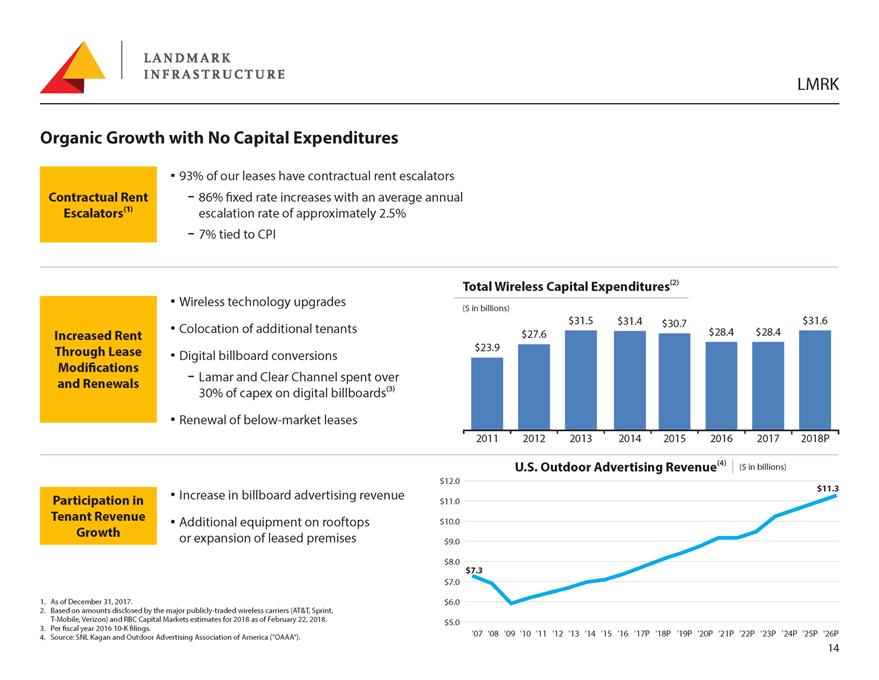
Organic Growth with No Capital Expenditures 93% of our leases have contractual rent escalators 86% fixed rate increases with an average annual escalation rate of approximately 2.5% 7% tied to CPI 1. As of December 31, 2017. Wireless technology upgrades Colocation of additional tenants Digital billboard conversions Lamar and Clear Channel spent over 30% of capex on digital billboards⁽3⁾ Renewal of below-market leases Increase in billboard advertising revenue Additional equipment on rooftops or expansion of leased premises $12.0 $11.0 $10.0 $9.0 $8.0 $7.0 $6.0 Total Wireless Capital Expenditures⁽2⁾ ($ in billions) 2011 2012 2013 2014 2015 2016 2017 2018P U.S. Outdoor Advertising Revenue⁽⁴⁾ ($ in billions) $11.3 2. Based on amounts disclosed by the major publicly-traded wireless carriers (AT&T, Sprint, T-Mobile, Verizon) and RBC Capital Markets estimates for 2018 as of February 22, 2018. 3. Per fiscal year 2016 10-K filings. 4. Source: SNL Kagan and Outdoor Advertising Association of America ("OAAA"). $5.0 '07 '08 '09 '10 '11 '12 '13 '14 '15 '16 '17P '18P '19P '20P '21P '22P '23P '24P '25P '26P
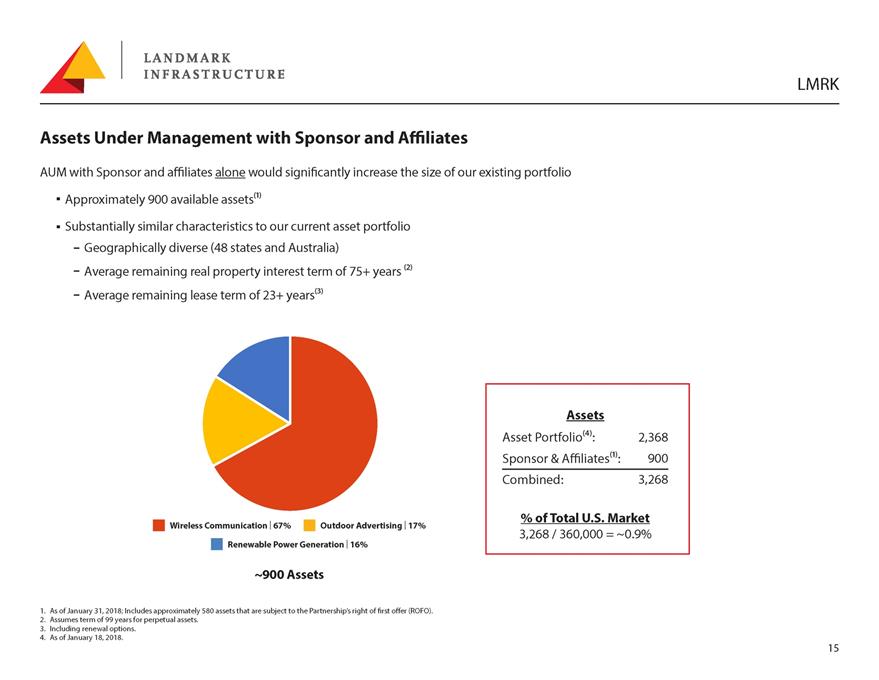
Assets Under Management with Sponsor and Affiliates AUM with Sponsor and affiliates alone would significantly increase the size of our existing portfolio Approximately 900 available assets⁽1⁾ Substantially similar characteristics to our current asset portfolio Geographically diverse (48 states and Australia) Average remaining real property interest term of 75+ years ⁽2⁾ Average remaining lease term of 23+ years⁽3⁾ Wireless Communication | 67% Outdoor Advertising | 17% Renewable Power Generation | 16% ~900 Assets 1. As of January 31, 2018; Includes approximately 580 assets that are subject to the Partnership’s right of first offer (ROFO). 2. Assumes term of 99 years for perpetual assets. 3. Including renewal options. 4. As of January 18, 2018.
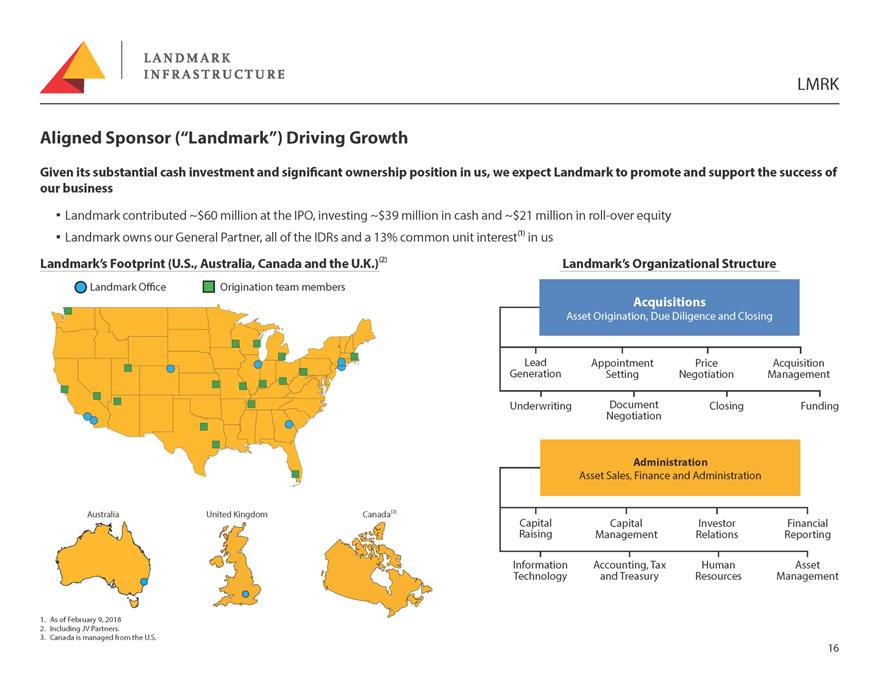
Aligned Sponsor (“Landmark”) Driving Growth Given its substantial cash investment and significant ownership position in us, we expect Landmark to promote and support the success of our business Landmark contributed ~$60 million at the IPO, investing ~$39 million in cash and ~$21 million in roll-over equity Landmark owns our General Partner, all of the IDRs and a 13% common unit interest⁽1⁾ in us Landmark’s Footprint (U.S., Australia, Canada and the U.K.)⁽2⁾ Landmark’s Organizational Structure Underwriting Document Negotiation Closing Funding Australia United Kingdom Canada⁽3⁾ 1. As of February 9, 2018 2. Including JV Partners. 3. Canada is managed from the U.S. Capital Raising Information Technology Capital Management Accounting, Tax and Treasury Investor Relations Human Resources Financial Reporting Asset Management
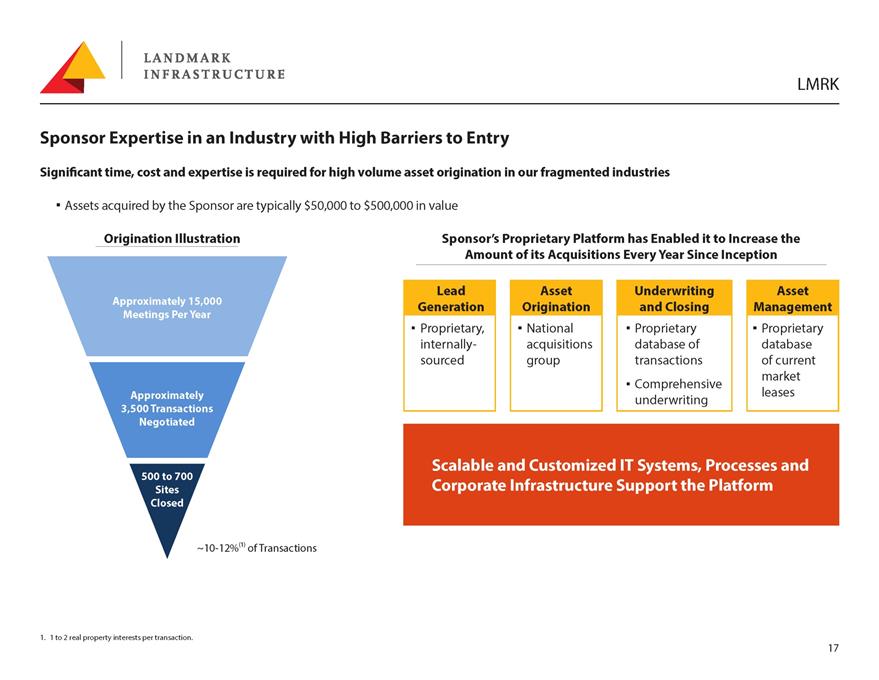
Sponsor Expertise in an Industry with High Barriers to Entry Significant time, cost and expertise is required for high volume asset origination in our fragmented industries Assets acquired by the Sponsor are typically $50,000 to $500,000 in value Origination Illustration Sponsor’s Proprietary Platform has Enabled it to Increase the Amount of its Acquisitions Every Year Since Inception Approximately 15,000 Meetings Per Year Approximately 3,500 Transactions Negotiated 500 to 700 Sites Closed ~10-12%⁽1⁾ of Transactions 1. 1 to 2 real property interests per transaction.
Third-Party Acquisitions Tax-efficient MLP/REIT capital structure Directly acquire third-party assets by leveraging the Sponsor’s origination and acquisition platform Large portfolios Direct from property owners Alternative Currency (Unit Exchange Program) Common units used for acquisitions in tax-deferred exchanges Benefits to sellers include: Significant diversification Taxable gain deferral Potential growth in value Option for liquidity through common unit sale as derived Increase Potential Acquisition Opportunities to Drive Accretive Growth
Disciplined and Flexible Financial Strategy Stable rents from effectively triple net leases High-quality due diligence to maintain 99% renewal rates 99% property operating margins with no maintenance capex Contractual escalators Lease rate increases from lease renewals of below-market leases Accretive drop-down acquisitions from Sponsor originations Accretive acquisitions of third-party portfolios Target leverage of approximately 40% debt-to-total market capitalization Appropriate fixed vs. floating interest rate exposure Policies to ensure consistent and growing distributions Efficient tax structure with no UBTI or state-sourced income

Appendix
Non-GAAP Financial Measures We define EBITDA as net income before interest, income taxes, depreciation and amortization, and we define Adjusted EBITDA as EBITDA before unrealized and realized gain or loss on derivatives, gain or loss on sale of real property interests, straight line rent adjustments, amortization of above and below market rents, impairments, acquisition-re- lated expenses, unit-based compensation, repayments of investments in receivables and the capital contribution to fund our general and administrative expense reimburse- ment. We define distributable cash flow as Adjusted EBITDA less cash interest paid, current cash income tax paid, preferred distributions, distributions to noncontrolling interest holders and maintenance capital expenditures. Distributable cash flow will not reflect changes in working capital balances. EBITDA, Adjusted EBITDA and distrib- utable cash flow should not be considered an alternative to net income (determined in accordance with GAAP) as an indication of our performance, and we believe that to understand our performance further, EBITDA, Adjusted EBITDA and distributable cash flow should be compared with our reported net income in accordance with GAAP, as presented in our combined financial statements. EBITDA, Adjusted EBITDA and distributable cash flow are non GAAP supplemental financial measures that management and external users of our financial statements, such as industry analysts, investors, lenders and rating agencies, may use to assess: our operating performance as compared to other publicly traded limited partnerships, without regard to historical cost basis or, in the case of Adjusted EBITDA, financing methods; the ability of our business to generate sufficient cash to support our decision to make distributions to our unitholders; our ability to incur and service debt and fund capital expenditures; and the viability of acquisitions and the returns on investment of various investment opportunities. We believe that the presentation of EBITDA, Adjusted EBITDA and distributable cash flow provides information useful to investors in assessing our financial condition and results of operations. The GAAP measures most directly comparable to EBITDA, Adjusted EBITDA and distributable cash flow are net income and net cash provided by operating activities. EBITDA, Adjusted EBITDA and distributable cash flow should not be considered as an alternative to GAAP net income, net cash provided by (used in) operating activities or any other measure of financial performance or liquidity presented in accordance with GAAP. Each of EBITDA, Adjusted EBITDA and distributable cash flow has important limitations as analytical tools because they exclude some, but not all, items that affect net income and net cash provided by operating activities, and these measures may vary from those of other companies. You should not consider EBITDA, Adjusted EBITDA and distributable cash flow in isolation or as a substitute for analysis of our results as reported under GAAP. As a result, because EBITDA, Adjusted EBITDA and distributable cash flow may be defined differently by other companies in our industry, EBITDA, Adjusted EBITDA and distributable cash flow as presented below may not be comparable to similarly titled measures of other companies, thereby diminishing their utility. For a reconciliation of EBITDA, Adjusted EBITDA and distributable cash flow to the most comparable financial measures calculated and presented in accordance with GAAP, please see the “Reconciliation of EBITDA, Adjusted EBITDA and Distributable Cash Flow” table below.
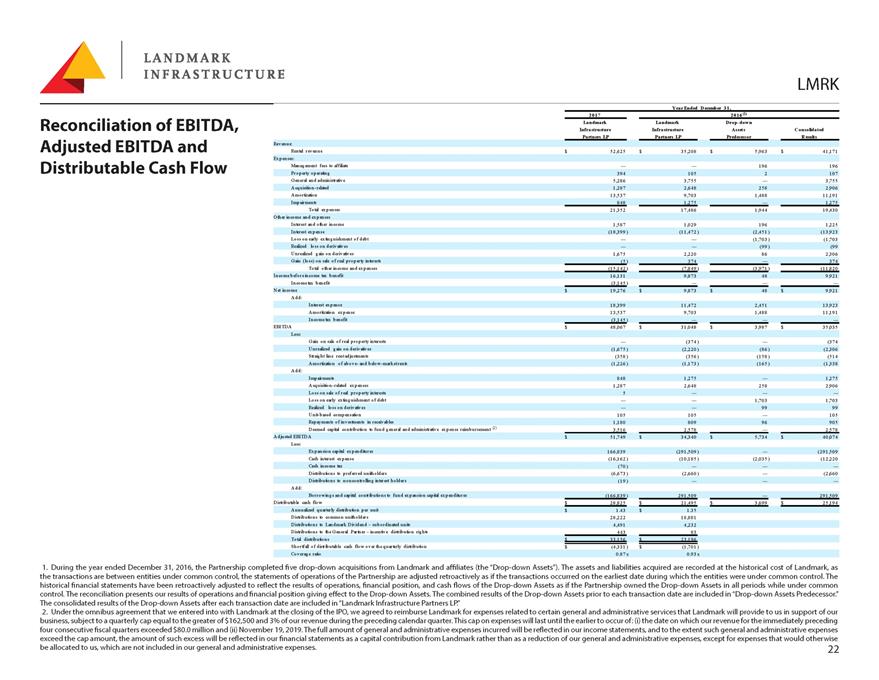
Reconciliation of EBITDA, Adjusted EBITDA and Distributable Cash Flow Ren tal rev en ue $ 52,625 $ 35,208 $ 5,963 $ 41,171 1. During the year ended December 31, 2016, the Partnership completed five drop-down acquisitions from Landmark and affiliates (the “Drop-down Assets”). The assets and liabilities acquired are recorded at the historical cost of Landmark, as the transactions are between entities under common control, the statements of operations of the Partnership are adjusted retroactively as if the transactions occurred on the earliest date during which the entities were under common control. The historical financial statements have been retroactively adjusted to reflect the results of operations, financial position, and cash flows of the Drop-down Assets as if the Partnership owned the Drop-down Assets in all periods while under common control. The reconciliation presents our results of operations and financial position giving effect to the Drop-down Assets. The combined results of the Drop-down Assets prior to each transaction date are included in “Drop-down Assets Predecessor.” The consolidated results of the Drop-down Assets after each transaction date are included in“Landmark Infrastructure Partners LP.” 2. Under the omnibus agreement that we entered into with Landmark at the closing of the IPO, we agreed to reimburse Landmark for expenses related to certain general and administrative services that Landmark will provide to us in support of our business, subject to a quarterly cap equal to the greater of $162,500 and 3% of our revenue during the preceding calendar quarter. This cap on expenses will last until the earlier to occur of: (i) the date on which our revenue for the immediately preceding four consecutive fiscal quarters exceeded $80.0 million and (ii) November 19, 2019. The full amount of general and administrative expenses incurred will be reflected in our income statements, and to the extent such general and administrative expenses exceed the cap amount, the amount of such excess will be reflected in our financial statements as a capital contribution from Landmark rather than as a reduction of our general and administrative expenses, except for expenses that would otherwise be allocated to us, which are not included in our general and administrative expenses. 22
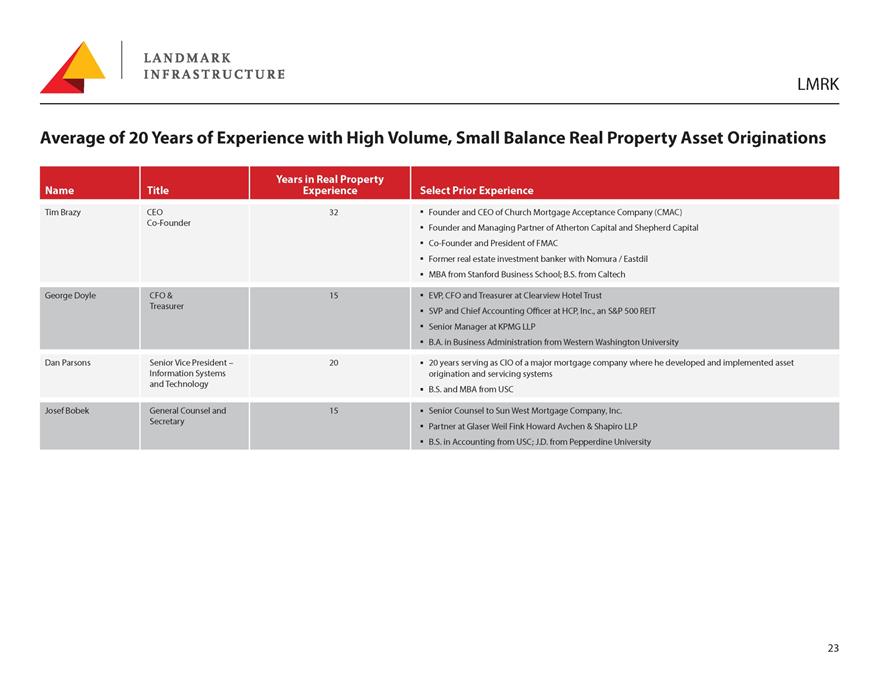
Average of 20 Years of Experience with High Volume, Small Balance Real Property Asset Originations Name Title Years in Real Property Experience Select Prior Experience Tim Brazy CEO Co-Founder 32 Founder and CEO of Church Mortgage Acceptance Company (CMAC) Founder and Managing Partner of Atherton Capital and Shepherd Capital Co‐Founder and President of FMAC Former real estate investment banker with Nomura / Eastdil MBA from Stanford Business School; B.S. from Caltech George Doyle CFO & Treasurer 15 EVP, CFO and Treasurer at Clearview Hotel Trust SVP and Chief Accounting Officer at HCP, Inc., an S&P 500 REIT Senior Manager at KPMG LLP B.A. in Business Administration from Western Washington University Dan Parsons Senior Vice President – Information Systems and Technology 20 20 years serving as CIO of a major mortgage company where he developed and implemented asset origination and servicing systems B.S. and MBA from USC Josef Bobek General Counsel and Secretary 15 Senior Counsel to Sun West Mortgage Company, Inc. Partner at Glaser Weil Fink Howard Avchen & Shapiro LLP B.S. in Accounting from USC; J.D. from Pepperdine University
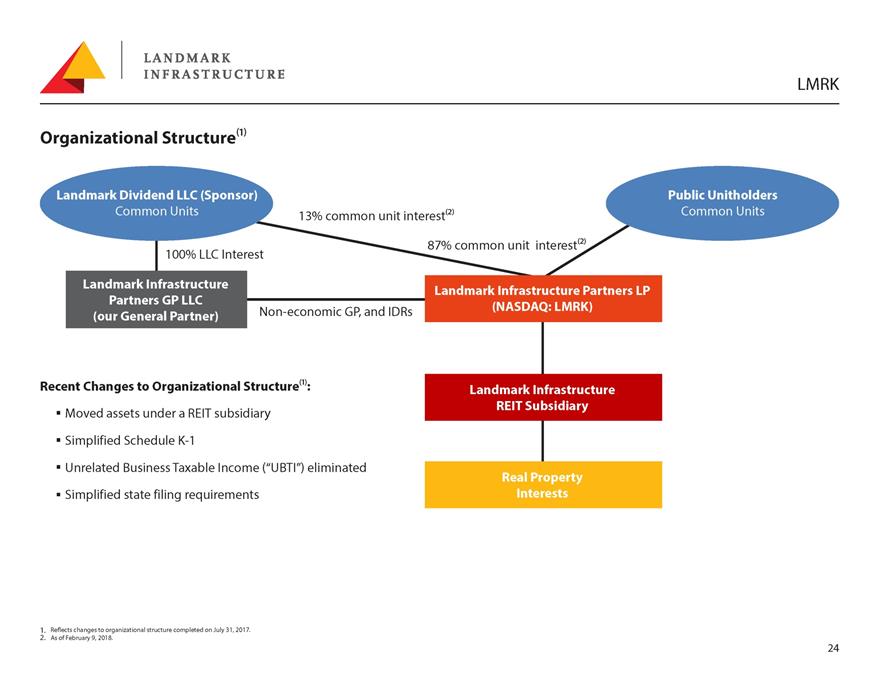
Organizational Structure⁽1⁾ Recent Changes to Organizational Structure⁽1⁾: Moved assets under a REIT subsidiary Simplified Schedule K-1 Unrelated Business Taxable Income (“UBTI”) eliminated Simplified state filing requirements 1. Reflects changes to organizational structure completed on July 31, 2017. 2. As of February 9, 2018.