Attached files
| file | filename |
|---|---|
| EX-32 - EX-32 - Walker & Dunlop, Inc. | wd-20171231xex32.htm |
| EX-31.2 - EX-31.2 - Walker & Dunlop, Inc. | wd-20171231ex312fb5136.htm |
| EX-31.1 - EX-31.1 - Walker & Dunlop, Inc. | wd-20171231ex31143ff8f.htm |
| EX-23 - EX-23 - Walker & Dunlop, Inc. | wd-20171231xex23.htm |
| EX-21 - EX-21 - Walker & Dunlop, Inc. | wd-20171231ex211c478a4.htm |
| EX-10.36 - EX-10.36 - Walker & Dunlop, Inc. | wd-20171231ex10362cbfd.htm |
| EX-10.35 - EX-10.35 - Walker & Dunlop, Inc. | wd-20171231ex10355e0df.htm |
| EX-10.34 - EX-10.34 - Walker & Dunlop, Inc. | wd-20171231ex1034c4697.htm |
| EX-10.33 - EX-10.33 - Walker & Dunlop, Inc. | wd-20171231ex1033fc977.htm |
| EX-10.32 - EX-10.32 - Walker & Dunlop, Inc. | wd-20171231ex10324eb31.htm |

UNITED STATES SECURITIES AND EXCHANGE COMMISSION
Washington, D.C. 20549
FORM 10-K
☑ ANNUAL REPORT PURSUANT TO SECTION 13 OR 15(d) OF THE SECURITIES EXCHANGE ACT OF 1934
For the fiscal year ended December 31, 2017
OR
☐ TRANSITION REPORT PURSUANT TO SECTION 13 OR 15(d) OF THE SECURITIES EXCHANGE ACT OF 1934
For the transition period from to
Commission File Number: 001-35000
Walker & Dunlop, Inc.
(Exact name of registrant as specified in its charter)
|
Maryland |
|
80-0629925 |
|
(State or other jurisdiction of |
|
(I.R.S. Employer Identification No.) |
|
incorporation or organization) |
|
|
|
7501 Wisconsin Avenue, Suite 1200E |
|
|
|
Bethesda, Maryland |
|
20814 |
|
(Address of principal executive offices) |
|
(Zip Code) |
Registrant’s telephone number, including area code: (301) 215-5500
Securities registered pursuant to Section 12(b) of the Act:
|
Title of each class |
|
Name of each exchange on which registered |
|
Common stock, par value $0.01 per share |
|
New York Stock Exchange |
Securities registered pursuant to Section 12(g) of the Act: None
Indicate by check mark if the registrant is a well-known seasoned issuer, as defined in Rule 405 of the Securities Act. Yes ☒ No ☐
Indicate by check mark if the registrant is not required to file reports pursuant to Section 13 or Section 15(d) of the Exchange Act. Yes ☐ No ☒
Indicate by check mark whether the registrant (1) has filed all reports required to be filed by Section 13 or 15(d) of the Securities Exchange Act of 1934 during the preceding 12 months (or for such shorter period that the registrant was required to file such reports), and (2) has been subject to such filing requirements for the past 90 days. Yes ☒ No ☐
Indicate by check mark whether the registrant has submitted electronically and posted on its corporate Web site, if any, every Interactive Data File required to be submitted and posted pursuant to Rule 405 of Regulation S-T (§232.405 of this chapter) during the preceding 12 months (or for such shorter period that the registrant was required to submit and post such files). Yes ☒ No ☐
Indicate by check mark if disclosure of delinquent filers pursuant to Item 405 of Regulation S-K is not contained herein, and will not be contained, to the best of registrant’s knowledge, in definitive proxy or information statements incorporated by reference in Part III of this Form 10-K or any amendment to this Form 10-K. ☐
Indicate by check mark whether the registrant is a large accelerated filer, an accelerated filer, a non-accelerated filer, a smaller reporting company, or an emerging growth company. See the definitions of “large accelerated filer,” “accelerated filer,” “smaller reporting company,” and “emerging growth company” in Rule 12b-2 of the Exchange Act.
|
Large accelerated filer ☒ |
|
Accelerated filer ☐ |
|
Non-accelerated filer ☐ |
|
Smaller reporting company ☐ |
|
Emerging growth company ☐ |
|
(Do not check if a |
||||
If an emerging growth company, indicate by check mark if the registrant has elected not to use the extended transition period for complying with any new or revised financial accounting standards provided pursuant to Section 13(a) of the Exchange Act. ◻
Indicate by check mark whether the registrant is a shell company (as defined in Rule 12b-2 of the Exchange Act). Yes ☐ No ☒
The aggregate market value of the common stock held by non-affiliates of the Registrant was approximately $987.1 million as of the end of the Registrant’s second fiscal quarter (based on the closing price for the common stock on the New York Stock Exchange on June 30, 2017). The Registrant has no non-voting common equity.
As of January 31, 2018, there were 30,793,945 total shares of common stock outstanding.
DOCUMENTS INCORPORATED BY REFERENCE
Portions of the Proxy Statement of Walker & Dunlop, Inc. with respect to its 2018 Annual Meeting of Stockholders to be filed with the Securities and Exchange Commission pursuant to Regulation 14A of the Securities Exchange Act of 1934 on or prior to April 30, 2018 are incorporated by reference into Part III of this report.
|
|
|
|
|
Page |
|
|
|
|
|
|
|
|
|
|
|
|
|
|
|
3 |
||
|
|
|
11 |
||
|
|
|
23 |
||
|
|
|
23 |
||
|
|
|
23 |
||
|
|
|
24 |
||
|
|
|
|
|
|
|
|
|
|
|
|
|
|
|
24 |
||
|
26 |
||||
|
|
Management's Discussion and Analysis of Financial Condition and Results of Operations |
|
28 |
|
|
|
|
63 |
||
|
|
|
64 |
||
|
|
Changes in and Disagreements with Accountants on Accounting and Financial Disclosure |
|
64 |
|
|
|
|
64 |
||
|
|
|
65 |
||
|
|
|
|
|
|
|
|
|
|
|
|
|
|
|
65 |
||
|
|
|
65 |
||
|
|
Security Ownership of Certain Beneficial Owners and Management and Related Stockholder Matters |
|
65 |
|
|
|
Certain Relationships and Related Transactions, and Director Independence |
|
65 |
|
|
|
|
65 |
||
|
|
|
|
|
|
|
|
|
|
|
|
|
|
|
66 |
||
|
|
|
71 |
||
|
|
||||
|
EX-10.32 EX-10.33 EX-10.34 EX-10.35 EX-10.36 |
||||
|
EX-21 |
||||
|
EX-23 |
||||
|
EX-31.1 |
||||
|
EX-31.2 |
||||
|
EX-32 |
||||
|
EX-101.1 |
||||
|
EX-101.2 |
||||
|
EX-101.3 |
||||
|
EX-101.4 |
||||
|
EX-101.5 |
||||
|
EX-101.6 |
||||
Forward-Looking Statements
Some of the statements in this Annual Report on Form 10-K of Walker & Dunlop, Inc. and subsidiaries (the “Company,” “Walker & Dunlop,” “we,” “us”), may constitute forward-looking statements within the meaning of the federal securities laws. Forward-looking statements relate to expectations, projections, plans and strategies, anticipated events or trends and similar expressions concerning matters that are not historical facts. In some cases, you can identify forward-looking statements by the use of forward-looking terminology such as “may,” “will,” “should,” “expects,” “intends,” “plans,” “anticipates,” “believes,” “estimates,” “predicts,” or “potential” or the negative of these words and phrases or similar words or phrases which are predictions of or indicate future events or trends and which do not relate solely to historical matters. You can also identify forward-looking statements by discussions of strategy, plans, or intentions.
The forward-looking statements contained in this Annual Report on Form 10-K reflect our current views about future events and are subject to numerous known and unknown risks, uncertainties, assumptions, and changes in circumstances that may cause actual results to differ significantly from those expressed or contemplated in any forward-looking statement. Statements regarding the following subjects, among others, may be forward looking:
|
· |
the future of the Federal National Mortgage Association (“Fannie Mae”) and the Federal Home Loan Mortgage Corporation (“Freddie Mac,” and together with Fannie Mae, the “GSEs”), including their origination capacities, and their impact on our business; |
|
· |
changes to and trends in the interest rate environment and its impact on our business; |
|
· |
our growth strategy; |
|
· |
our projected financial condition, liquidity, and results of operations; |
|
· |
our ability to obtain and maintain warehouse and other loan-funding arrangements; |
|
· |
our ability to make future dividend payments or repurchase shares of our common stock; |
|
· |
availability of and our ability to attract and retain qualified personnel and our ability to develop and retain relationships with borrowers, key principals, and lenders; |
|
· |
degree and nature of our competition; |
|
· |
changes in governmental regulations and policies, tax laws and rates, and similar matters and the impact of such regulations, policies, and actions; |
|
· |
our ability to comply with the laws, rules, and regulations applicable to us; |
|
· |
trends in the commercial real estate finance market, commercial real estate values, the credit and capital markets, or the general economy, including demand for multifamily housing and rent growth; and |
|
· |
general volatility of the capital markets and the market price of our common stock. |
While forward-looking statements reflect our good-faith projections, assumptions, and expectations, they are not guarantees of future results. Furthermore, we disclaim any obligation to publicly update or revise any forward-looking statement to reflect changes in underlying assumptions or factors, new information, data or methods, future events or other changes, except as required by applicable law. For a further discussion of these and other factors that could cause future results to differ materially from those expressed or contemplated in any forward-looking statements, see “Risk Factors.”
General
We are one of the leading commercial real estate services and finance companies in the United States, with a primary focus on multifamily lending. We have been in business for more than 80 years; a Fannie Mae Delegated Underwriting and Servicing ™ (“DUS”) lender since 1988, when the DUS program began; a lender with the Government National Mortgage Association (“Ginnie Mae”) and the Federal Housing Administration, a division of the U.S. Department of Housing and Urban Development (together with Ginnie Mae, “HUD”) since acquiring a HUD license in 2009; and a Freddie Mac Multifamily Approved Seller/Servicer for Conventional Loans (“Freddie Mac seller/servicer”) since 2009.
3
We originate, sell, and service a range of multifamily and other commercial real estate loans and broker sales of multifamily properties. Our clients are owners and developers of multifamily properties and other commercial real estate across the country. We originate and sell multifamily loans through the programs of Fannie Mae, Freddie Mac, and HUD (collectively, the “Agencies”). We retain servicing rights and asset management responsibilities on substantially all loans that we originate for the Agencies’ programs. We are approved as a Fannie Mae DUS lender nationally, a Freddie Mac seller/servicer in 23 states and the District of Columbia, a Freddie Mac targeted affordable housing seller/servicer, a HUD Multifamily Accelerated Processing (“MAP”) lender nationally, a HUD Section 232 LEAN lender nationally, and a Ginnie Mae issuer. We broker, and occasionally service, loans for several life insurance companies, commercial banks, commercial mortgage backed securities (“CMBS”) issuers, and other institutional investors, in which cases we do not fund the loan but rather act as a loan broker. We also underwrite, service, and asset-manage interim loans. Most of these interim loans are closed through a joint venture. Those interim loans not closed by the joint venture are originated by us and held for investment and included on our balance sheet. We offer investment sales brokerage services that are focused primarily in the southeastern United States.
Walker & Dunlop, Inc. is a holding company. We conduct the majority of our operations through Walker & Dunlop, LLC, our operating company.
Our Product and Service Offerings
Our product offerings include a range of multifamily and other commercial real estate financing products, including Multifamily Finance, FHA Finance, Capital Markets, and Bridge Financing. We focus primarily on multifamily properties and offer a range of commercial real estate finance products to our customers, including first mortgage loans, second trust loans, supplemental financings, construction loans, mezzanine loans, and bridge/interim loans. Our long-established relationships with the Agencies and institutional investors enable us to offer this broad range of loan products and services. We provide investment sales brokerage services to owners and developers of multifamily properties. Each of our product offerings is designed to maximize our ability to meet client needs, source capital, and grow our commercial real estate finance business.
The sale of each loan through the Agencies’ programs is negotiated prior to rate locking the loan with the borrower. For loans originated pursuant to the Fannie Mae DUS program, we generally are required to share the risk of loss, with our maximum loss capped at 20% of the loan amount at origination. In addition to our risk-sharing obligations, we may be obligated to repurchase loans that are originated for the Agencies’ programs if certain representations and warranties that we provide in connection with such originations are breached. We have never been required to repurchase a loan. We have established a strong credit culture over decades of originating loans and are committed to disciplined risk management from the initial underwriting stage through loan payoff.
Multifamily Finance
We are one of 25 approved lenders that participate in Fannie Mae’s DUS program for multifamily, manufactured housing communities, student housing, affordable housing, and certain seniors housing properties. Under the Fannie Mae DUS program, Fannie Mae has delegated to us responsibility for ensuring that the loans we originate under the Fannie Mae DUS program satisfy the underwriting and other eligibility requirements established from time to time by Fannie Mae. In exchange for this delegation of authority, we share risk for a portion of the losses that may result from a borrower's default. For more information regarding our risk-sharing agreements with Fannie Mae, see “Management's Discussion and Analysis of Financial Condition and Results of Operations—Liquidity and Capital Resources—Credit Quality and Allowance for Risk-Sharing Obligations.” Most of the Fannie Mae loans that we originate are sold in the form of a Fannie Mae-guaranteed security to third-party investors. Fannie Mae contracts us to service and asset-manage all loans that we originate under the Fannie Mae DUS program.
We are one of 22 lenders approved as a Freddie Mac seller/servicer where we originate and sell to Freddie Mac multifamily, manufactured housing communities, student housing, affordable housing, and seniors housing loans that sat
4
isfy Freddie Mac's underwriting and other eligibility requirements. Under Freddie Mac’s programs, we submit our completed loan underwriting package to Freddie Mac and obtain its commitment to purchase the loan at a specified price after closing. Freddie Mac ultimately performs its own underwriting of loans that we sell to it. Freddie Mac may choose to hold, sell, or later securitize such loans. We very rarely have any risk-sharing arrangements on loans we sell to Freddie Mac under its program. Freddie Mac contracts us to service and asset-manage all loans that we originate under its program.
Under certain limited circumstances, we may make preferred equity investments in entities controlled by certain of our borrowers that will assist those borrowers in acquiring and repositioning properties. The terms of such investments are negotiated with each investment.
FHA Finance
As an approved HUD MAP and HUD LEAN lender and Ginnie Mae issuer, we provide construction and permanent loans to developers and owners of multifamily housing, affordable housing, seniors housing, and healthcare facilities. We submit our completed loan underwriting package to HUD and obtain HUD's approval to originate the loan. We service and asset-manage all loans originated through HUD’s various programs.
HUD-insured loans are typically placed in single loan pools which back Ginnie Mae securities. Ginnie Mae is a United States government corporation in the United States Department of Housing and Urban Development. Ginnie Mae securities are backed by the full faith and credit of the United States, and we very rarely bear any risk of loss on Ginnie Mae securities. In the event of a default on a HUD-insured loan, HUD will reimburse approximately 99% of any losses of principal and interest on the loan, and Ginnie Mae will reimburse the remaining losses. We are obligated to continue to advance principal and interest payments and tax and insurance escrow amounts on Ginnie Mae securities until the Ginnie Mae securities are fully paid.
Capital Markets
We serve as an intermediary in the placement of commercial real estate debt between institutional sources of capital, such as life insurance companies, investment banks, commercial banks, pension funds, CMBS issuers, and other institutional investors, and owners of all types of commercial real estate. A client seeking to finance or refinance a property will seek our assistance in developing different alternatives and soliciting interest from various sources of capital. We often advise on capital structure, develop the financing package, facilitate negotiations between our client and institutional sources of capital, coordinate due diligence, and assist in closing the transaction. In these instances, we act as a loan broker and do not underwrite or originate the loan and do not retain any interest in the loan. We service some of these loans.
Over the past four years, the Company has invested approximately $45.7 million to acquire certain assets and assume certain liabilities of three capital markets brokerage companies. These acquisitions have expanded our network of loan originators and provided further diversification to our origination platform.
Bridge Financing
We currently offer bridge financing to our borrowers through interim loans. These interim loans provide floating-rate, interest-only loans for terms of up to three years to experienced borrowers seeking to acquire or reposition multifamily properties that do not currently qualify for permanent financing (the “Interim Program”). We underwrite, service, and asset-manage all loans executed through the Interim Program. The ultimate goal of the Interim Program is to provide permanent Agency financing on these transition properties. The Interim Program has two distinct executions:
Interim Program JV Loans
During the second quarter of 2017, we formed a joint venture with an affiliate of one of the world’s largest owners of commercial real estate to originate, hold, and finance loans that meet the criteria of the Interim Program (the “Interim Program JV” or the “joint venture”). The Interim Program JV assumes full risk of loss while the loans it originates are
5
outstanding. We hold a 15% ownership interest in the Interim Program JV and are responsible for sourcing, underwriting, servicing, and asset-managing the loans originated by the joint venture. The joint venture funds its operations using a combination of equity contributions from its owners and third-party credit facilities. During the third quarter of 2017, we transferred $119.8 million of loans from our loans held for investment portfolio to the joint venture at par. We do not expect to sell additional loans held for investment to the joint venture in the future.
Held for Investment
We originate and hold some interim loans for investment. During the time that these loans are outstanding, we assume the full risk of loss. We have not experienced any delinquencies or charged off any loans originated and held for investment under the Interim Program, which began operations in 2012. As of December 31, 2017, we had five loans held for investment under the Interim Program with an aggregate outstanding unpaid principal balance of $67.0 million.
Prior to June 30, 2017, all loans originated through the Interim Program were held for investment. During the last six months of 2017, substantially all of the loans originated through the Interim Program were Interim Program JV loans. We expect that substantially all loans satisfying the criteria for the Interim Program will be originated by the joint venture going forward; however, we may opportunistically originate loans held for investment through the Interim Program in the future.
Investment Sales Brokerage Services
In 2015, we completed our purchase of 75% of certain assets and the assumption of certain liabilities of Engler Financial Group, LLC (“EFG”) for an agreed-upon price of $13.0 million, payable in $11.1 million cash and $1.9 million of our common stock issued in a private placement (the “EFG Acquisition”). The net assets purchased from EFG were contributed to a newly formed subsidiary, Walker & Dunlop Investment Sales, LLC (“WDIS”), through which we conduct our investment sales operations. The acquisition allowed us to begin offering investment sales brokerage services to owners and developers of multifamily properties that are seeking to sell these properties. We seek to maximize proceeds and certainty of closure for our clients using our knowledge of the commercial real estate and capital markets and the experience of our transaction professionals. Our investment sales brokerage services are offered primarily in the southeastern United States. We have added several investment sales brokerage teams since the acquisition and continue to seek to add other investment sales brokers, with the goal of expanding these brokerage services nationally.
We consolidate the activities of WDIS and present the portion of WDIS that we do not control as Noncontrolling interests in the Consolidated Balance Sheets and Net income from noncontrolling interests in the Consolidated Statements of Income.
Direct Loan Originators and Correspondent Network
We originate loans directly through loan originators operating out of 28 offices nationwide. At December 31, 2017, we employed 145 loan originators and investment sales brokers. These individuals have deep knowledge of the commercial real estate lending business and bring with them extensive relationships with some of the largest property owners in the country. They have a thorough understanding of the financial needs and objectives of borrowers, the geographic markets in which they operate, market conditions specific to different types of commercial properties, and how to structure a loan product to meet their borrowers’ needs. These loan originators collect and analyze financial and property information, assist the borrower in submitting information required to complete a loan application and, ultimately, help the borrower close the loan. Our loan originators are paid a salary and commissions based on the fees associated with the loans that they originate.
In addition to our group of loan originators, at December 31, 2017, we had correspondent agreements with 27 independently owned mortgage banking companies across the country with which we have relationships for Agency loan originations. This network of correspondents helps us extend our geographic reach into new and/or smaller markets on a
6
cost effective basis. In addition to identifying potential borrowers and key principal(s) (the individual or individuals directing the activities of the borrowing entity), our correspondents assist us in evaluating loans, including pre-screening the borrowers, key principal(s), and properties for program eligibility, coordinating due diligence, and generally providing market intelligence. In exchange for providing these services, the correspondent earns an origination fee based on a percentage of the principal amount of the financing arranged and in some cases a fee paid out over time based on the servicing revenues earned over the life of the loan.
Underwriting and Risk Management
We use several tools to manage our Fannie Mae risk-sharing exposure. These tools include an underwriting and approval process that is independent of the loan originator; evaluating and modifying our underwriting criteria given the underlying multifamily housing market fundamentals; limiting our geographic, borrower, and key principal exposures; and using modified risk-sharing under the Fannie Mae DUS program. Similar tools are used to manage our exposure to credit loss on loans originated under the Interim Program.
Our underwriting process begins with a review of suitability for our investors and a detailed review of the borrower, key principal(s), and the property. We review a borrower's financial statements for minimum net worth and liquidity requirements, as well as obtaining credit and criminal background checks. We also review a borrower's and key principal(s)’s operating track record, including evaluating the performance of other properties owned by the applicable borrower and key principal(s). We also consider the borrower's and key principal(s)’s bankruptcy and foreclosure history. We believe that lending to a borrower and key principal(s) with a proven track record as an operator mitigates our credit risk.
We review the fundamental value and credit profile of the underlying property, including an analysis of regional economic trends, appraisals of the property, site visits, and reviews of historical and prospective financials. Third-party vendors are engaged for appraisals, engineering reports, environmental reports, flood certification reports, zoning reports, and credit reports. We utilize a list of approved third-party vendors for these reports. Each report is reviewed by our underwriting team for accuracy, quality, and comprehensiveness. All third-party vendors are reviewed periodically for the quality of their work and are removed from our list of approved vendors if the quality or timeliness of the reports is below our standards. This is particularly true for engineering and environmental reports on which we rely to make decisions regarding ongoing replacement reserves and environmental matters.
In addition, we maintain concentration limits with respect to our Fannie Mae loans. We limit geographic concentration, focusing on regional employment concentration and trends. We also limit the aggregate amount of loans subject to full risk-sharing for any one borrower. Our full risk-sharing cap is currently set at $60.0 million. Accordingly, we may elect to use modified risk-sharing for loans of more than $60.0 million in order to limit our maximum loss on any one loan to $12.0 million (such exposure would occur in the event that the underlying collateral is determined to be completely without value at the time of loss). However, we occasionally elect to originate a loan with full risk sharing even when the loan balance is greater than $60.0 million if we believe the loan characteristics support such an approach.
Servicing and Asset Management
We service nearly all loans we originate for the Agencies and our Interim Program and some of the loans we broker for institutional investors, primarily life insurance companies. We are an approved servicer for Fannie Mae, Freddie Mac, and HUD loans. We are currently a rated primary servicer with Fitch Ratings. Our servicing function includes loan servicing and asset management activities, performing or overseeing the following activities:
|
· |
carrying out all cashiering functions relating to the loan, including providing monthly billing statements to the borrower and collecting and applying payments on the loan; |
|
· |
administering reserve and escrow funds for repairs, tenant improvements, taxes, and insurance; |
|
· |
obtaining and analyzing financial statements of the borrower and performing periodic property inspections; |
|
· |
preparing and providing periodic reports and remittances to the GSEs, investors, master servicers, or other designated persons; |
7
|
· |
administering lien filings; and |
|
· |
performing other tasks and obligations that are delegated to us. |
Life insurance companies, whose loans we may service, may perform some or all of the activities identified in the list above. We outsource some of our servicing activities to a subservicer.
For most loans we service under the Fannie Mae DUS program, we are currently required to advance the principal and interest payments and tax and insurance escrow amounts for four months. We are reimbursed by Fannie Mae for these advances, which may be used to offset any losses incurred under our risk-sharing obligations once the loan is settled.
Under the HUD program, we are obligated to advance tax and insurance escrow amounts and principal and interest payments on the Ginnie Mae securities until the Ginnie Mae security is fully paid. In the event of a default on a HUD-insured loan, we can elect to assign the loan to HUD and file a mortgage insurance claim. HUD will reimburse approximately 99% of any losses of principal and interest on the loan and Ginnie Mae will reimburse substantially all of the remaining losses. In cases where we elect to not assign the loan to HUD, we attempt to mitigate losses to HUD by assisting the borrower to obtain a modification to the loan that will improve the borrower’s likelihood of future performance.
Our Growth Strategy
We believe we are positioned to continue growing and diversifying our business by taking advantage of opportunities in the commercial real estate finance and services market. The Company has implemented a strategy for the next three years with the goal of reaching the following milestones by the end of 2020: (i) $30 to $35 billion of annual loan origination volume, (ii) annual investment sales volume of $8 to $10 billion, (iii) an unpaid principal balance of $100 billion in our servicing portfolio, and (iv) $8 to $10 billion of assets under management. To reach these milestones, we will focus on the following areas:
|
· |
Remain a Top Five Lender in Agency Executions. We intend to further grow our Agency loan originations with the goal of increasing our market share with the GSEs and remaining a top five lender of HUD products. For 2017, we ranked as the largest Fannie Mae DUS lender, and we ranked as the third largest Freddie Mac seller/servicer. Additionally, we were a top five lender with HUD in 2017. At December 31, 2017, our origination platform had approximately 53 loan originators focused on selling Agency products, supplemented by 27 independently owned mortgage banking companies with whom we have correspondent relationships. We believe that we will have significant opportunities to continue broadening our Agency loan origination networks to maintain or grow our market share. This expansion may include organic growth, recruitment of talented origination professionals, and potentially acquisitions of competitors with strong origination capabilities. |
|
· |
Continue to Expand our Capital Markets and Investment Sales Teams. At December 31, 2017, we had 82 loan originators in 19 offices focused on capital markets transactions across the United States. Additionally, we had 10 investment sales brokers in eight offices located primarily in the southeastern United States. Over the past four years, we have added 72 new loan originators to our capital markets team through recruiting and the acquisition of the loan origination platforms of three companies. We have also doubled the size of our investment sales team since we acquired an investment sales company in 2015. We intend to continue growing our capital markets and investment sales teams to strengthen our market position and borrower relationships and to grow our market share. Continued growth of our capital markets team will provide greater exposure to the overall commercial real estate market, expose us to new correspondent relationships, and provide us with institutional access to deal flow supporting our bridge lending solutions. In addition, many of our capital markets loan originators also originate loans through the Agencies’ programs, assisting our growth objectives with the Agencies, while we are also successful at arranging the financing for many of our investment sales transactions. |
8
|
· |
Continue to Develop Proprietary Sources of Capital. Since our initial public offering, we have expanded our product offerings to include the Interim Program. We anticipate partnering with additional sources of third-party capital or acquiring an asset management platform, which will allow us to offer additional commercial real estate loan products to our clients as their financial needs evolve, while generating positive returns for the third-party capital. We believe that we have the structuring, underwriting, servicing, credit, and asset management expertise to offer these additional commercial real estate loan products and services; and we believe that cash on hand, together with third-party financing sources, will allow us to meet client demand for additional products that are within our areas of expertise, including multifamily and other lending for our balance sheet or for our partnerships or future funds. |
Competition
We compete in the commercial real estate services industry. We are one of 25 approved lenders that participate in Fannie Mae’s DUS program and one of 22 lenders approved as a Freddie Mac seller/servicer. We face significant competition across our business, including, but not limited to, commercial real estate services subsidiaries of large national commercial banks, privately-held and public commercial real estate service providers, CMBS conduits, and insurance companies, some of which are also investors in loans we originate. Our competitors include, but are not limited to, Wells Fargo, N.A.; CBRE Group, Inc.; Jones Lang LaSalle Incorporated; Marcus & Millichap, Inc.; HFF, Inc.; Eastdil Secured (a subsidiary of Wells Fargo, N.A.); PNC Real Estate; Northmarq Capital, LLC; Berkeley Point Capital; and Berkadia Commercial Mortgage, LLC. Many of these competitors enjoy advantages over us, including greater name recognition, financial resources, and access to lower-cost capital. The commercial real estate services subsidiaries of the large national commercial banks may have an advantage over us in originating commercial loans if borrowers already have other lending relationships with the bank.
We compete on the basis of quality of service, relationships, loan structure, terms, pricing, breadth of product offerings, and industry depth. Industry depth includes the knowledge of local and national real estate market conditions, commercial real estate, loan product expertise, and the ability to analyze and manage credit risk. Our competitors seek to compete aggressively on these factors. Our success depends on our ability to offer attractive loan products, provide superior service, demonstrate industry depth, maintain and capitalize on relationships with investors, borrowers, and key loan correspondents, and remain competitive in pricing. In addition, future changes in laws, regulations, and Agency program requirements, increased investment from foreign entities, and consolidation in the commercial real estate finance market could lead to the entry of more competitors.
Regulatory Requirements
Our business is subject to laws and regulations in a number of jurisdictions. The level of regulation and supervision to which we are subject varies from jurisdiction to jurisdiction and is based on the type of business activities involved. The regulatory requirements that apply to our activities are subject to change from time to time and may become more restrictive, making our compliance with applicable requirements more difficult or expensive or otherwise restricting our ability to conduct our business in the manner that it is now conducted. Changes in applicable regulatory requirements, including changes in their enforcement, could materially and adversely affect us.
Federal and State Regulation of Commercial Real Estate Lending Activities
Our multifamily and commercial real estate lending, servicing, and asset management businesses are subject, in certain instances, to supervision and regulation by federal and state governmental authorities in the United States. In addition, these businesses may be subject to various laws and judicial and administrative decisions imposing various requirements and restrictions, which, among other things, regulate lending activities, regulate conduct with borrowers, establish maximum interest rates, finance charges, and other charges and require disclosures to borrowers. Although most states do not regulate commercial finance, certain states impose limitations on interest rates, as well as other charges on certain collection practices and creditor remedies. Some states also require licensing of lenders, loan brokers, and loan servicers and adequate disclosure of certain contract terms. We also are required to comply with certain provisions of, among other
9
statutes and regulations, the USA PATRIOT Act, regulations promulgated by the Office of Foreign Asset Control, the Employee Retirement Income Security Act of 1974, as amended, which we refer to as “ERISA,” and federal and state securities laws and regulations.
Requirements of the Agencies
To maintain our status as an approved lender for Fannie Mae and Freddie Mac and as a HUD-approved mortgagee and issuer of Ginnie Mae securities, we are required to meet and maintain various eligibility criteria from time to time established by the Agencies, such as minimum net worth, operational liquidity and collateral requirements, and compliance with reporting requirements. We also are required to originate our loans and perform our loan servicing functions in accordance with the applicable program requirements and guidelines from time to time established by the Agencies. If we fail to comply with the requirements of any of these programs, the Agencies may terminate or withdraw our approval. In addition, the Agencies have the authority under their guidelines to terminate a lender's authority to sell loans to them and service their loans. The loss of one or more of these approvals would have a material adverse impact on us and could result in further disqualification with other counterparties, and we may be required to obtain additional state lender or mortgage banker licensing to originate loans if that status is revoked.
Employees
At December 31, 2017, we employed 623 full-time employees. All employees, except our executive officers, are employed by our operating subsidiary, Walker & Dunlop, LLC. Our executive officers are employees of Walker & Dunlop, Inc. None of our employees is represented by a union or subject to a collective bargaining agreement, and we have never experienced a work stoppage. We believe that our employee relations are exceptional. For example, in 2017, we were ranked one of the best workplaces in the United States in Fortune’s Great Place to Work® 2017 Best Medium Workplaces list. This is the fifth time in six years that we have received this recognition.
Available Information
We file annual, quarterly, and current reports, proxy statements, and other information with the Securities and Exchange Commission (the “SEC”). These filings are available to the public over the Internet at the SEC’s website at http://www.sec.gov. You may also read and copy any document we file at the SEC’s public reference room located at 100 F Street, NE, Washington, DC 20549. Please call the SEC at 1-800-SEC-0330 for further information on the public reference room.
Our principal Internet website can be found at http://www.walkerdunlop.com. The content within or accessible through our website is not part of this Annual Report on Form 10-K. We make available free of charge on or through our website, access to our Annual Report on Form 10-K, quarterly reports on Form 10-Q, current reports on Form 8-K, and amendments to those reports as soon as reasonably practicable after such material is electronically filed, or furnished, to the SEC.
Our website also includes a corporate governance section which contains our Corporate Governance Guidelines (which includes our Director Responsibilities and Qualifications), Code of Business Conduct and Ethics, Code of Ethics for Principal Executive Officer and Senior Financial Officers, Board of Directors’ Committee Charters for the Audit, Compensation, and Nominating and Corporate Governance Committees, Code of Ethics for Principal Executive Officer and Senior Financial Officers, and the method by which interested parties may contact our Ethics Hotline.
In the event of any changes to these charters, codes, or guidelines, changed copies will also be made available on our website. If we waive or amend any provision of our code of ethics, we will promptly disclose such waiver or amendment as required by SEC or New York Stock Exchange (“NYSE”) rules. We intend to promptly post any waiver or amendment of our Code of Ethics for Principal Executive Officer and Senior Financial Officers to our website.
10
You may request a copy of any of the above documents, at no cost to you, by writing or telephoning us at: Walker & Dunlop, Inc., 7501 Wisconsin Avenue, Suite 1200E, Bethesda, Maryland 20814, Attention: Investor Relations, telephone (301) 215-5500. We will not send exhibits to these reports, unless the exhibits are specifically requested and you pay a modest fee for duplication and delivery.
Investing in our common stock involves risks. You should carefully consider the following risk factors, together with all the other information contained in this Annual Report on Form 10-K, before making an investment decision to purchase our common stock. The realization of any of the following risks could materially and adversely affect our business, prospects, financial condition, results of operations, and the market price and liquidity of our common stock, which could cause you to lose all or a significant part of your investment in our common stock. Some statements in this Annual Report, including statements in the following risk factors, constitute forward-looking statements. Please refer to the section titled “Forward-Looking Statements.”
Risks Relating to Our Business
The loss of or changes in our relationships with the Agencies and institutional investors would adversely affect our ability to originate commercial real estate loans through the Agencies’ programs, which would materially and adversely affect us.
Currently, we originate a significant percentage of our loans held for sale through the Agencies’ programs. We are approved as a Fannie Mae DUS lender nationwide, a Freddie Mac seller/servicer in 23 states and the District of Columbia, a Freddie Mac targeted affordable housing seller/servicer, a HUD MAP lender nationwide, and a Ginnie Mae issuer. Our status as an approved lender affords us a number of advantages and may be terminated by the applicable Agency at any time. The loss of such status would, or changes in our relationships could, prevent us from being able to originate commercial real estate loans for sale through the particular Agency, which would materially and adversely affect us. It could also result in a loss of similar approvals from the Agencies.
We also broker loans on behalf of certain life insurance companies, investment banks, commercial banks, pension funds, CMBS conduits, and other institutional investors that directly underwrite and provide funding for the loans at closing. In cases where we do not fund the loan, we act as a loan broker. If these investors discontinue their relationship with us and replacement investors cannot be found on a timely basis, we could be adversely affected.
A change to the conservatorship of Fannie Mae and Freddie Mac and related actions, along with any changes in laws and regulations affecting the relationship between Fannie Mae and Freddie Mac and the U.S. federal government or the existence of Fannie Mae and Freddie Mac, could materially and adversely affect our business.
Currently, we originate a majority of our loans for sale through the GSEs’ programs. Additionally, a substantial majority of our servicing rights are derived from loans we sell through the GSEs’ programs. Changes in the business charters, structure, or existence of one or both of the GSEs could eliminate or substantially reduce the number of loans we originate with the GSEs, which in turn would lead to a reduction in fees related to such loans. These effects would likely cause us to realize significantly lower revenues from our loan originations and servicing fees, and ultimately would have a material adverse impact on our business and financial results.
Conservatorships of the GSEs
In September 2008, the GSEs’ regulator, the Federal Housing Finance Agency, (the “FHFA”) placed each GSE into conservatorship. The conservatorship is a statutory process designed to preserve and conserve the GSEs’ assets and property and put them in a sound and solvent condition. The conservatorships have no specified termination dates and there continues to be significant uncertainty regarding the future of the GSEs, including how long they will continue to exist in
11
their current forms, the extent of their roles in the housing markets and whether or in what form they may exist following conservatorship.
Housing Finance Reform
Policymakers and others have focused significant attention in recent years on how to reform the nation’s housing finance system, including what role, if any, the GSEs should play. It is unclear at this time what the Trump Administration’s goals are with respect to the future state of the GSEs.
Regulatory Reform
As the primary regulator of the GSEs, the FHFA has taken a number of steps during conservatorship to manage the GSEs’ multifamily business activities. In 2013, the FHFA established limits on the volume of new multifamily loans that may be purchased annually by the GSEs. In November 2017, the FHFA announced that the GSE’s 2018 multifamily loan purchases would be capped at $35.0 billion for each GSE, with exceptions for loans in “affordable” and underserved market segments. These exemptions allowed Fannie Mae and Freddie Mac’s 2017 lending volumes to reach $66 billion and $73 billion, respectively.
The current Director of the FHFA’s term expires in January 2019. The new Director will be appointed by the President of the United States and confirmed by the United States Senate. We cannot predict who will be the next FHFA Director and whether such successor(s) will implement regulatory and other policy changes at FHFA that will modify the GSEs’ multifamily businesses.
Legislative Reform
Congress has considered various housing finance reform bills since the GSEs went into conservatorship in 2008. Several of the bills have called for the winding down or receivership of the GSEs. We expect Congress to continue considering housing finance reform in the future, including conducting hearings and considering legislation that would alter the housing finance system. We cannot predict the prospects for the enactment, timing or content of legislative proposals regarding the future status of the GSEs.
We are subject to risk of loss in connection with defaults on loans sold under the Fannie Mae DUS program that could materially and adversely affect our results of operations and liquidity.
Under the Fannie Mae DUS program, we originate and service multifamily loans for Fannie Mae without having to obtain Fannie Mae's prior approval for certain loans, as long as the loans meet the underwriting guidelines set forth by Fannie Mae. In return for the delegated authority to make loans and the commitment to purchase loans by Fannie Mae, we must maintain minimum collateral and generally are required to share risk of loss on loans sold through Fannie Mae. Under the full risk-sharing formula, we are required to absorb the first 5% of any losses on the unpaid principal balance of a loan at the time of loss settlement, and above 5% we are required to share the loss with Fannie Mae, with our maximum loss capped at 20% of the original unpaid principal balance of a loan. In addition, Fannie Mae can double or triple our risk-sharing obligations if the loan does not meet specific underwriting criteria or if the loan defaults within 12 months of its sale to Fannie Mae. As of December 31, 2017, we had pledged securities of $97.9 million as collateral against future losses under $28.1 billion of loans outstanding that are subject to risk-sharing obligations, as more fully described under “Management's Discussion and Analysis of Financial Condition and Results of Operations—Liquidity and Capital Resources,” which we refer to as our "at risk balance." Fannie Mae collateral requirements may change in the future. As of December 31, 2017, our allowance for risk-sharing as a percentage of the at risk balance was 0.01%, or $3.8 million, and reflects our current estimate of our future expected payouts under our risk-sharing obligations. Additionally, we have a guaranty obligation of $41.2 million as of December 31, 2017. The guaranty obligation and the allowance for risk-sharing obligations as a percentage of the at risk balance was 0.8% as of December 31, 2017. We cannot ensure that our estimate of the allowance for risk-sharing obligations will be sufficient to cover future write offs. Other factors may also affect a borrower's decision to default on a loan, such as property, cash flow, occupancy, maintenance needs, and other financing
12
obligations. As of December 31, 2017, there was one loan with an unpaid principal balance of $6.0 million in our at risk servicing portfolio that was 60+ days delinquent, representing 0.02% of our at risk servicing portfolio. If loan defaults increase, actual risk-sharing obligation payments under the Fannie Mae DUS program may increase, and such defaults and payments could have a material adverse effect on our results of operations and liquidity. In addition, any failure to pay our share of losses under the Fannie Mae DUS program could result in the revocation of our license from Fannie Mae and the exercise of various remedies available to Fannie Mae under the Fannie Mae DUS program.
The number of delinquent and/or defaulted loans could increase, which could have a material adverse effect on us.
As a loan servicer, we maintain the primary contact with the borrower throughout the life of the loan and are responsible, pursuant to our servicing agreements with the Agencies and institutional investors, for asset management. We are also responsible, together with the applicable Agency or institutional investor, for taking actions to mitigate losses. Our asset management process may be unsuccessful in identifying loans that are in danger of underperforming or defaulting or in taking appropriate action once those loans are identified. While we can recommend a loss mitigation strategy for the Agencies, decisions regarding loss mitigation are within the control of the Agencies. Previous turmoil in the real estate, credit and capital markets have made this process even more difficult and unpredictable. When loans become delinquent, we incur additional expenses in servicing and asset managing the loan and are typically required to advance principal and interest payments and tax and insurance escrow amounts. We also could be subject to a loss of our contractual servicing fee and we could suffer losses of up to 20% (or more for loans that do not meet specific underwriting criteria or default within 12 months) of the unpaid principal balance of a Fannie Mae DUS loan with full risk-sharing. These items could have a negative impact on our cash flows and a negative effect on the net carrying value of the mortgage servicing right (MSR) on our balance sheet and could result in a charge to our earnings. Because of the foregoing, a rise in delinquencies could have a material adverse effect on us.
A reduction in the prices paid for our loans and services or an increase in loan or security interest rates required by investors could materially and adversely affect our results of operations and liquidity.
Our results of operations and liquidity could be materially and adversely affected if the Agencies or institutional investors lower the price they are willing to pay to us for our loans or services or adversely change the material terms of their loan purchases or service arrangements with us. Multiple factors determine the price we receive for our loans. With respect to Fannie Mae related originations, our loans are generally sold as Fannie Mae-insured securities to third-party investors. With respect to HUD related originations, our loans are generally sold as Ginnie Mae securities to third-party investors. In both cases, the price paid to us reflects, in part, the competitive market bidding process for these securities.
We sell loans directly to Freddie Mac. Freddie Mac may choose to hold, sell or later securitize such loans. We believe terms set by Freddie Mac are influenced by similar market factors as those that impact the price of Fannie Mae–insured or Ginnie Mae securities, although the pricing process differs. With respect to loans that are placed with institutional investors, the origination fees that we receive from borrowers are determined through negotiations, competition, and other market conditions.
Loan servicing fees are based, in part, on the risk-sharing obligations associated with the loan and the market pricing of credit risk. The credit risk premium offered by Fannie Mae for new loans can change periodically but remains fixed once we enter into a commitment to sell the loan. Over the past several years, Fannie Mae loan servicing fees have been higher due to the market pricing of credit risk. There can be no assurance that such fees will continue to remain at such levels or that such levels will be sufficient if delinquencies occur.
Servicing fees for loans placed with institutional investors are negotiated with each institutional investor pursuant to agreements that we have with them. These fees for new loans vary over time and may be materially and adversely affected by a number of factors, including competitors that may be willing to provide similar services at lower rates.
13
A significant portion of our revenue is derived from loan servicing fees, and declines in or terminations of servicing engagements or breaches of servicing agreements, including from non-performance by third parties that we engage for back-office loan servicing functions, could have a material adverse effect on us.
We expect that loan servicing fees will continue to constitute a significant portion of our revenues for the foreseeable future. Nearly all of these fees are derived from loans that we originate and sell through the Agencies’ programs or place with institutional investors. A decline in the number or value of loans that we originate for these investors or terminations of our servicing engagements will decrease these fees. HUD has the right to terminate our current servicing engagements for cause. In addition to termination for cause, Fannie Mae and Freddie Mac may terminate our servicing engagements without cause by paying a termination fee. Our institutional investors typically may terminate our servicing engagements at any time with or without cause, without paying a termination fee. We are also subject to losses that may arise from servicing errors, such as a failure to maintain insurance, pay taxes, or provide notices. In addition, we have contracted with a third party to perform certain routine back-office aspects of loan servicing. If we or this third party fails to perform, or we breach or the third-party causes us to breach our servicing obligations to the Agencies or institutional investors, our servicing engagements may be terminated. Declines or terminations of servicing engagements or breaches of such obligations could materially and adversely affect us.
If one or more of our warehouse facilities, on which we are highly dependent, are terminated, we may be unable to find replacement financing on favorable terms, or at all, which would have a material adverse effect on us.
We require a significant amount of short-term funding capacity for loans we originate. As of December 31, 2017, we had $3.3 billion of committed loan funding available through five commercial banks and $1.5 billion of uncommitted funding available through Fannie Mae’s As Soon As Pooled (“ASAP”) program. Additionally, consistent with industry practice, five of our existing warehouse facilities are short-term, requiring annual renewal. If any of our committed facilities are terminated or are not renewed or our uncommitted facilities are not honored, we may be unable to find replacement financing on favorable terms, or at all, and we might not be able to originate loans, which would have a material adverse effect on us. Additionally, as our business continues to expand, we may need additional warehouse funding capacity for loans we originate. There can be no assurance that, in the future, we will be able to obtain additional warehouse funding capacity on favorable terms, on a timely basis, or at all.
If we fail to meet or satisfy any of the financial or other covenants included in our warehouse facilities, we would be in default under one or more of these facilities and our lenders could elect to declare all amounts outstanding under the facilities to be immediately due and payable, enforce their interests against loans pledged under such facilities and restrict our ability to make additional borrowings. These facilities also contain cross-default provisions, such that if a default occurs under any of our debt agreements, generally the lenders under our other debt agreements could also declare a default. These restrictions may interfere with our ability to obtain financing or to engage in other business activities, which could materially and adversely affect us. There can be no assurance that we will maintain compliance with all financial and other covenants included in our warehouse facilities in the future.
We are subject to the risk of failed loan deliveries, and even after a successful closing and delivery, may be required to repurchase the loan or to indemnify the investor if there is a breach of a representation or warranty made by us in connection with the sale of loans through the programs of the Agencies or CMBS securitizations, any of which could have a material adverse effect on us.
We bear the risk that a borrower will choose not to close on a loan that has been pre-sold to an investor or that the investor will choose not to take delivery of the loan, including because a catastrophic change in the condition of a property occurs after we fund the loan and prior to the investor purchase date. We also have the risk of serious errors in loan documentation which prevent timely delivery of the loan prior to the investor purchase date. A complete failure to deliver a loan could be a default under the warehouse line used to finance the loan. We can provide no assurance that we will not experience failed deliveries in the future or that any losses will not be material or will be mitigated through property insurance or payment protections.
14
We must make certain representations and warranties concerning each loan originated by us for the Agencies’ programs or through CMBS securitizations. The representations and warranties relate to our practices in the origination and servicing of the loans and the accuracy of the information being provided by us. For example, we are generally required to provide the following, among other, representations and warranties: we are authorized to do business and to sell or assign the loan; the loan conforms to the requirements of the Agencies and certain laws and regulations; the underlying mortgage represents a valid lien on the property and there are no other liens on the property; the loan documents are valid and enforceable; taxes, assessments, insurance premiums, rents and similar other payments have been paid or escrowed; the property is insured, conforms to zoning laws and remains intact; and we do not know of any issues regarding the loan that are reasonably expected to cause the loan to be delinquent or unacceptable for investment or adversely affect its value. We are permitted to satisfy certain of these representations and warranties by furnishing a title insurance policy.
In the event of a breach of any representation or warranty concerning a loan, investors could, among other things, require us to repurchase the full amount of the loan and seek indemnification for losses from us, or, for Fannie Mae DUS loans, increase the level of risk-sharing on the loan. Our obligation to repurchase the loan is independent of our risk-sharing obligations. The Agencies or CMBS investors could require us to repurchase the loan if representations and warranties are breached, even if the loan is not in default. Because the accuracy of many such representations and warranties generally is based on our actions or on third-party reports, such as title reports and environmental reports, we may not receive similar representations and warranties from other parties that would serve as a claim against them. Even if we receive representations and warranties from third parties and have a claim against them in the event of a breach, our ability to recover on any such claim may be limited. Our ability to recover against a borrower that breaches its representations and warranties to us may be similarly limited. Our ability to recover on a claim against any party would also be dependent, in part, upon the financial condition and liquidity of such party. There can be no assurance that we, our employees or third parties will not make mistakes that would subject us to repurchase or indemnification obligations. Any significant repurchase or indemnification obligations imposed on us could have a material adverse effect on us.
We have made preferred equity investments and investments in interim loans, both of which are funded with corporate capital. These investments may involve a greater risk of loss than our traditional real estate lending activities.
We have made preferred equity investments in entities owning real estate. Such investments are subordinate to debt financing and are not secured by property. If the issuer of the preferred equity defaults on our investment, in most instances we would only be able to proceed against the entity that issued the equity in accordance with the terms of the investment, and not any property owned by the entity. As a result, we may not recover some or all of our invested capital, which could result in losses to the Company. As of December 31, 2017, we have preferred equity investments with one borrower totaling $41.7 million. We expect these preferred equity investments to be repaid within the next two years.
Under the Interim Program, we offer short-term, floating-rate loans to borrowers seeking to acquire or reposition multifamily properties that do not currently qualify for permanent financing. Such a borrower under an interim loan often has identified a transitional asset that has been under-managed and/or is located in a recovering market. If the market in which the asset is located fails to recover according to the borrower’s projections, or if the borrower fails to improve the quality of the asset’s management and/or the value of the asset, the borrower may not receive a sufficient return on the asset to satisfy the interim loan, and we bear the risk that we may not recover some or all of the loan balance. In addition, borrowers usually use the proceeds of a long-term mortgage loan to repay an interim loan. We may therefore be dependent on a borrower’s ability to obtain permanent financing to repay our interim loan, which could depend on market conditions and other factors. Further, interim loans may be relatively less liquid than loans against stabilized properties due to their short life, their potential unsuitability for securitization, any unstabilized nature of the underlying real estate and the difficulty of recovery in the event of a borrower’s default. This lack of liquidity may significantly impede our ability to respond to adverse changes in the performance of loans in the Interim Program and may adversely affect the fair value of such loans and the proceeds from their disposition. Carrying loans for longer periods of time on our balance sheet exposes us to greater risks of loss than we currently face for loans that are pre-sold or placed with investors, including, without limitation, 100% exposure for defaults and impairment charges, which may adversely affect our profitability.
15
Our business is significantly affected by general business, economic and market conditions and cycles, particularly in the multifamily and commercial real estate industry, including changes in government fiscal and monetary policies, and, accordingly, we could be materially harmed in the event of a market downturn or changes in government policies.
We are sensitive to general business, economic and market conditions and cycles, particularly in the multifamily and commercial real estate industry. These conditions include changes in short-term and long-term interest rates, inflation and deflation, fluctuations in the real estate and debt capital markets and developments in national and local economies, unemployment rates, commercial property vacancy rates, and rental rates. Any sustained period of weakness or weakening business or economic conditions in the markets in which we do business or in related markets could result in a decrease in the demand for our loans and services, which could materially harm us. In addition, the number of borrowers who become delinquent, become subject to bankruptcy or default on their loans could increase, resulting in a decrease in the value of our MSRs, higher levels of servicer advances, and loss on our Fannie Mae loans for which we share risk of loss, and could materially and adversely affect us.
We also are significantly affected by the fiscal, monetary, and budgetary policies of the U.S. government and its agencies. We are particularly affected by the policies of the Board of Governors of the Federal Reserve System (the “Federal Reserve”), which regulates the supply of money and credit in the United States. The Federal Reserve’s policies affect interest rates, which can have a significant impact on the demand for multifamily and commercial real estate loans. Significant fluctuations in interest rates as well as protracted periods of increases or decreases in interest rates could adversely affect the operation and income of multifamily and commercial real estate properties, as well as the demand from investors for multifamily and commercial real estate debt in the secondary market. In particular, higher interest rates often decrease the number of loans originated. An increase in interest rates could cause refinancing of existing loans to become less attractive and qualifying for a loan to become more difficult. Budgetary policies also impact our ability to originate loans, particularly if it has a negative impact on the ability of the Agencies to do business with us. Changes in fiscal, monetary, and budgetary policies are beyond our control, are difficult to predict, and could materially and adversely affect us.
We are dependent upon the success of the multifamily real estate sector and conditions that negatively impact the multifamily sector may reduce demand for our products and services and materially and adversely affect us.
We provide commercial real estate financial products and services primarily to developers and owners of multifamily properties. Accordingly, the success of our business is closely tied to the overall success of the multifamily real estate market. Various changes in real estate conditions may impact the multifamily sector. Any negative trends in such real estate conditions may reduce demand for our products and services and, as a result, adversely affect our results of operations. These conditions include:
|
· |
oversupply of, or a reduction in demand for, multifamily housing; |
|
· |
a change in policy or circumstances that may result in a significant number of potential residents of multifamily properties deciding to purchase homes instead of renting; |
|
· |
rent control or stabilization laws, or other laws regulating multifamily housing, which could affect the profitability of multifamily developments; |
|
· |
changes in the tax code related to investment real estate; |
|
· |
increased competition in the multifamily sector based on considerations such as the attractiveness, location, rental rates, amenities, and safety record of various properties; and |
|
· |
increased operating costs, including increased real property taxes, maintenance, insurance, and utilities costs. |
Moreover, other factors may adversely affect the multifamily sector, including changes in government regulations and other laws, rules and regulations governing real estate, zoning or taxes, changes in interest rate levels, the potential liability under environmental and other laws, and other unforeseen events. Any or all of these factors could negatively impact the multifamily sector and, as a result, reduce the demand for our products and services. Any such reduction could materially and adversely affect us.
16
The loss of our key management could result in a material adverse effect on our business and results of operations.
Our future success depends to a significant extent on the continued services of our senior management, particularly William Walker, our Chairman and Chief Executive Officer. The loss of the services of any of these individuals could have a material adverse effect on our business and results of operations. We maintain “key person” life insurance only on Mr. Walker, and the insurance proceeds from such insurance may be insufficient to cover the cost associated with recruiting a new Chief Executive Officer.
Our growth strategy relies upon our ability to hire and retain qualified loan originators, and if we are unable to do so, our growth could be limited.
We depend on our loan originators to generate borrower clients by, among other things, developing relationships with commercial property owners, real estate agents and brokers, developers and others, which we believe leads to repeat and referral business. Accordingly, we must be able to attract, motivate and retain skilled loan originators. The market for loan originators is highly competitive and may lead to increased costs to hire and retain them. We cannot guarantee that we will be able to attract or retain qualified loan originators. If we cannot attract, motivate or retain a sufficient number of skilled loan originators, or if our hiring and retention costs increase, we could be materially and adversely affected.
We have numerous significant competitors and potential future competitors, some of which may have greater resources and access to capital than we do; consequently, we may not be able to compete effectively in the future.
We continue to face significant competition from other commercial real estate service providers, commercial banks, CMBS conduit lenders, and life insurance companies, some of which are also investors in loans we originate. Many of these competitors may enjoy competitive advantages over us, including:
|
· |
greater name recognition; |
|
· |
a larger, more established network of correspondents and loan originators; |
|
· |
established relationships with institutional investors; |
|
· |
access to lower cost and more stable funding sources; |
|
· |
an established market presence in markets where we do not yet have a presence or where we have a smaller presence; |
|
· |
ability to diversify and grow by providing a greater variety of commercial real estate loan products on more attractive terms, some of which require greater access to capital and the ability to retain loans on the balance sheet; and |
|
· |
greater financial resources and access to capital to develop branch offices and compensate key employees. |
Commercial banks may have an advantage over us in originating loans if borrowers already have a line of credit or construction financing with the bank. Commercial real estate service providers may have an advantage over us to the extent they also offer a larger or more comprehensive investment sales platform. We compete based on quality of service, relationships, loan structure, terms, pricing, and industry depth. Industry depth includes the knowledge of local and national real estate market conditions, commercial real estate expertise, loan product expertise, and the ability to analyze and manage credit risk. Our competitors seek to compete aggressively on the basis of these factors and our success depends on our ability to offer attractive loan products, provide superior service, demonstrate industry depth, maintain and capitalize on relationships with investors, borrowers and key loan correspondents and remain competitive in pricing. In addition, future changes in laws, regulations, and Agency program requirements and consolidation in the commercial real estate finance market could lead to the entry of more competitors. We cannot guarantee that we will be able to compete effectively in the future, and our failure to do so would materially and adversely affect us.
17
At times, we have grown our business through corporate acquisitions. We intend to drive a significant portion of our future growth through additional acquisitions. If we do not successfully identify and complete such acquisitions, our growth may be limited. Additionally, continued growth in our business may place significant demands on our administrative, operational, and financial resources.
We have completed several corporate acquisitions in recent years that have expanded our pre-existing product lines and services, increased our origination capacity, and broadened our geographic coverage. We intend to pursue continued growth by acquiring complementary businesses, but we cannot guarantee such efforts will be successful. We do not know whether the favorable conditions that enabled our recent growth will continue.
In addition, if our growth continues, it could increase our expenses and place additional demands on our management, personnel, information systems, and other resources. Sustaining our growth could require us to commit additional management, operational and financial resources to maintain appropriate operational and financial systems to adequately support expansion. There can be no assurance that we will be able to manage any growth effectively and any failure to do so could adversely affect our ability to generate revenue and control our expenses, which could materially and adversely affect us.
The integration of any companies that we may acquire or start up in the future, including investments in new ventures and new lines of business, may be difficult, resulting in high transaction, start-up, and integration costs. Additionally, the integration process may be disruptive to our business, and the acquired businesses or new venture may not perform as we expect.
Our future success depends, in part, on our ability to expand or modify our business in response to changing borrower demands and competitive pressures. In some circumstances, we may determine to do so through the acquisition of complementary businesses or investments in new ventures rather than through internal growth.
In the future, we may explore additional strategic acquisitions or investments. The identification of suitable acquisition candidates and new ventures can be difficult, time consuming and costly, and we may not be able to successfully complete identified acquisitions or investments in new ventures on favorable terms, or at all. Furthermore, even if we successfully complete an acquisition or an investment in new ventures, we may not be able to successfully integrate newly acquired businesses or new ventures into our operations, and the process of integration could be expensive and time consuming and may strain our resources. Acquisitions or new ventures also typically involve significant costs related to integrating information technology, accounting, reporting, and management services and rationalizing personnel levels and may require significant time to obtain new or updated regulatory approvals from the Agencies and other Federal and state authorities. Acquisitions or new ventures could divert management's attention from the regular operations of our business and result in the potential loss of our key personnel, and we may not achieve the anticipated benefits of the acquisitions or new ventures, any of which could materially and adversely affect us. In addition, future acquisitions or new ventures could result in significantly dilutive issuances of equity securities or the incurrence of substantial debt, contingent liabilities, or expenses or other charges, which could also materially and adversely affect us.
Risks Relating to Regulatory Matters
If we fail to comply with the numerous government regulations and program requirements of the Agencies, we may lose our approved lender status with these entities and fail to gain additional approvals or licenses for our business. We are also subject to changes in laws, regulations and existing Agency program requirements, including potential increases in reserve and risk retention requirements that could increase our costs and affect the way we conduct our business, which could materially and adversely affect us.
Our operations are subject to regulation by federal, state, and local government authorities, various laws and judicial and administrative decisions, and regulations and policies of the Agencies. These laws, regulations, rules, and policies impose, among other things, minimum net worth, operational liquidity and collateral requirements. Fannie Mae requires us to maintain operational liquidity based on a formula that considers the balance of the loan and the level of credit loss
18
exposure (level of risk-sharing). Fannie Mae requires us to maintain collateral, which may include pledged securities, for our risk-sharing obligations. The amount of collateral required under the Fannie Mae DUS program is calculated at the loan level and is based on the balance of the loan, the level of risk-sharing, the seasoning of the loan, and our rating.
Regulatory authorities also require us to submit financial reports and to maintain a quality control plan for the underwriting, origination and servicing of loans. Numerous laws and regulations also impose qualification and licensing obligations on us and impose requirements and restrictions affecting, among other things: our loan originations; maximum interest rates, finance charges and other fees that we may charge; disclosures to consumers; the terms of secured transactions; debt collection; personnel qualifications; and other trade practices. We also are subject to inspection by the Agencies and regulatory authorities. Our failure to comply with these requirements could lead to, among other things, the loss of a license as an approved Agency lender, the inability to gain additional approvals or licenses, the termination of contractual rights without compensation, demands for indemnification or loan repurchases, class action lawsuits and administrative enforcement actions.
Regulatory and legal requirements are subject to change. For example, Fannie Mae increased its collateral requirements, on loans classified by Fannie Mae as Tier II, from 60 basis points to 75 basis points, effective as of January 1, 2013, which applied to a large portion of our outstanding Fannie Mae at risk portfolio. The incremental collateral required for existing loans was funded over a two-year period ending December 31, 2014. The incremental requirement for any newly originated Fannie Mae Tier II loans will be funded over the 48 months subsequent to the sale of the loan to Fannie Mae. Fannie Mae has indicated that it may increase collateral requirements in the future, which may adversely impact us.
If we fail to comply with laws, regulations and market standards regarding the privacy, use, and security of customer information, or if we are the target of a successful cyber-attack, we may be subject to legal and regulatory actions and our reputation would be harmed.
We receive, maintain, and store non-public personal information of our loan applicants. The technology and other controls and processes designed to secure our customer information and to prevent, detect, and remedy any unauthorized access to that information were designed to obtain reasonable, not absolute, assurance that such information is secure and that any unauthorized access is identified and addressed appropriately. We are not aware of any data breaches, successful hacker attacks, unauthorized access and misuse, or significant computer viruses affecting our networks that may have occurred in the past; however, our controls may not have detected, and may in the future fail to prevent or detect, unauthorized access to our borrower information. In addition, we are exposed to the risks of denial-of-service (“DOS”) attacks and damage to or destruction of our network or other information systems. A successful DOS attack or damage to our systems could result in a delay in the processing of our business, or even lost business. Additionally, we could incur significant costs associated with the recovery from a DOS attack or damage to our systems.
If borrower information is inappropriately accessed and used by a third party or an employee for illegal purposes, such as identity theft, we may be responsible to the affected applicant or borrower for any losses he or she may have incurred as a result of misappropriation. In such an instance, we may be liable to a governmental authority for fines or penalties associated with a lapse in the integrity and security of our customers' information. Additionally, if we are the target of a successful cyber-attack, we may experience reputational harm that could impact our standing with our borrowers and adversely impact our financial results.
19
Risks Related to Our Common Stock
The trading and market price of our common stock may be volatile and could decline substantially.
The stock markets, including the NYSE (on which our common stock is listed), have at times experienced significant price and volume fluctuations. As a result, the trading and market price of our common stock is likely to be similarly volatile and subject to wide fluctuations, and investors in our common stock may experience a decrease in the value of their shares, including decreases unrelated to our operating performance. The market price of our common stock could decline substantially in response to a number of factors, including (in no particular order):
|
· |
our actual or anticipated financial condition, liquidity and operating performance; |
|
· |
actual or anticipated changes in our business and growth strategies or the success of their implementation; |
|
· |
failure to meet, or changes in, earnings estimates of stock analysts; |
|
· |
publication of research reports about us, the commercial real estate finance market or the real estate industry; |
|
· |
equity issuances by us, or stock resales by our stockholders, or the perception that such issuances or resales could occur; |
|
· |
the passage of adverse legislation or other regulatory developments, including those from or affecting the Agencies; |
|
· |
general business, economic and market conditions and cycles; |
|
· |
changes in market valuations of similar companies; |
|
· |
additions to or departures of our key personnel; |
|
· |
actions by our stockholders; |
|
· |
actual, potential, or perceived accounting problems or changes in accounting principles; |
|
· |
failure to satisfy the listing requirements of the NYSE; |
|
· |
failure to comply with the requirements of the Sarbanes-Oxley Act; |
|
· |
speculation in the press or investment community; |
|
· |
the realization of any of the other risk factors presented in this Annual Report on Form 10-K; and |
|
· |
general market and economic conditions. |
In the past, securities class action litigation has often been instituted against companies following periods of volatility in the market price of their common stock. This type of litigation could result in substantial costs and divert our management's attention and resources, which could have a material adverse effect on our ability to execute our business and growth strategies.
Future issuances of debt securities, which would rank senior to our common stock upon our liquidation, and future issuances of equity securities, which would dilute the holdings of our existing common stockholders and may be senior to our common stock for the purposes of paying dividends, periodically or upon liquidation, may negatively affect the market price of our common stock.
In the future, we may issue debt or equity securities or incur other borrowings. Upon liquidation, holders of our debt securities and other loans and preferred stock will receive a distribution of our available assets before common stockholders. We are not required to offer any such additional debt or equity securities to existing common stockholders on a preemptive basis. Therefore, additional common stock issuances, directly or through convertible or exchangeable securities, warrants or options, could dilute our existing common stockholders' ownership in us and such issuances, or the perception that such issuances may occur, may reduce the market price of our common stock. Our preferred stock, if issued, would likely have a preference on dividend payments, periodically or upon liquidation, which could eliminate or otherwise limit our ability to pay dividends to common stockholders. Because our decision to issue debt or equity securities or otherwise incur debt in the future will depend on market conditions and other factors beyond our control, we cannot predict or estimate the amount, timing, nature or success of our future capital raising efforts. Thus, common stockholders bear the risk that our future issuances of debt or equity securities or our other borrowing will negatively affect the market price of our common stock and dilute their ownership in us.
20
Risks Related to Our Organization and Structure
Certain provisions of Maryland law could inhibit changes in control.
Certain provisions of the Maryland General Corporation Law (the “MGCL”) may have the effect of deterring a third party from making a proposal to acquire us or of impeding a change in control under circumstances that otherwise could provide the holders of our common stock with the opportunity to realize a premium over the then-prevailing market price of our common stock. We will be subject to the “business combination” provisions of the MGCL that, subject to limitations, prohibit certain business combinations (including a merger, consolidation, share exchange, or, in circumstances specified in the statute, an asset transfer or issuance or reclassification of equity securities) between us and an “interested stockholder” (defined generally as any person who beneficially owns 10% or more of our then outstanding voting capital stock or an affiliate or associate of ours who, at any time within the two-year period prior to the date in question, was the beneficial owner of 10% or more of our then outstanding voting capital stock) or an affiliate thereof for five years after the most recent date on which the stockholder becomes an interested stockholder. After the five-year prohibition, any business combination between us and an interested stockholder generally must be recommended by our board of directors and approved by the affirmative vote of at least (i) 80% of the votes entitled to be cast by holders of outstanding shares of our voting capital stock; and (ii) two-thirds of the votes entitled to be cast by holders of voting capital stock of the corporation other than shares held by the interested stockholder with whom or with whose affiliate the business combination is to be effected or held by an affiliate or associate of the interested stockholder. These super-majority vote requirements do not apply if our common stockholders receive a minimum price, as defined under Maryland law, for their shares in the form of cash or other consideration in the same form as previously paid by the interested stockholder for its shares. These provisions of the MGCL do not apply, however, to business combinations that are approved or exempted by a board of directors prior to the time that the interested stockholder becomes an interested stockholder.
The “control share” provisions of the MGCL provide that “control shares” of a Maryland corporation (defined as shares which, when aggregated with other shares controlled by the stockholder (except solely by virtue of a revocable proxy) entitle the stockholder to exercise one of three increasing ranges of voting power in electing directors) acquired in a “control share acquisition” (defined as the direct and indirect acquisition of ownership or control of issued and outstanding "control shares") have no voting rights except to the extent approved by our stockholders by the affirmative vote of at least two-thirds of all the votes entitled to be cast on the matter, excluding votes entitled to be cast by the acquirer of control shares, our officers and our personnel who are also our directors.
Certain provisions of the MGCL permit our board of directors, without stockholder approval and regardless of what is currently provided in our charter or bylaws, to adopt certain mechanisms, some of which (for example, a classified board) we do not yet have. These provisions may have the effect of limiting or precluding a third party from making an acquisition proposal for us or of delaying, deferring or preventing a transaction or a change in control of our company under circumstances that otherwise could provide the holders of shares of our common stock with the opportunity to realize a premium over the then current market price. Our charter contains a provision whereby we elect, at such time as we become eligible to do so, to be subject to the provisions of Title 3, Subtitle 8 of the MGCL relating to the filling of vacancies on our board of directors.
Our authorized but unissued shares of common and preferred stock may prevent a change in our control.
Our charter authorizes us to issue additional authorized but unissued shares of common or preferred stock. In addition, our board of directors may, without stockholder approval, amend our charter to increase the aggregate number of shares of our common stock or the number of shares of stock of any class or series that we have authority to issue and classify or reclassify any unissued shares of common or preferred stock and set the preferences, rights and other terms of the classified or reclassified shares. As a result, our board of directors may establish a class or series of common or preferred stock that could delay, defer, or prevent a transaction or a change in control of our company that might involve a premium price for shares of our common stock or otherwise be in the best interests of our stockholders.
21
Our rights and the rights of our stockholders to take action against our directors and officers are limited, which could limit our stockholders’ recourse in the event actions are taken that are not in our stockholders’ best interests.
Under Maryland law generally, a director is required to perform his or her duties in good faith, in a manner he or she reasonably believes to be in the best interests of the Company and with the care that an ordinarily prudent person in a like position would use under similar circumstances. Under Maryland law, directors are presumed to have acted with this standard of care. In addition, our charter limits the liability of our directors and officers to us and our stockholders for money damages, except for liability resulting from:
|
· |
actual receipt of an improper benefit or profit in money, property or services; or |
|
· |
active and deliberate dishonesty by the director or officer that was established by a final judgment as being material to the cause of action adjudicated. |
Our charter and bylaws obligate us to indemnify our directors and officers for actions taken by them in those capacities to the maximum extent permitted by Maryland law. In addition, we are obligated to advance the defense costs incurred by our directors and officers. As a result, we and our stockholders may have more limited rights against our directors and officers than might otherwise exist absent the current provisions in our charter and bylaws or that might exist with companies domiciled in jurisdictions other than Maryland.
Our charter contains limitations on our stockholders’ ability to remove our directors, which could make it difficult for our stockholders to effect changes to our management.
Our charter provides that a director may only be removed for cause upon the affirmative vote of holders of two-thirds of the votes entitled to be cast in the election of directors. Vacancies may be filled only by a majority of the remaining directors in office, even if less than a quorum. These requirements make it more difficult to change our management by removing and replacing directors and may delay, defer, or prevent a change in control of our company that is in the best interests of our stockholders.
We are a holding company with minimal direct operations and rely largely on funds received from our subsidiaries for our cash requirements.
We are a holding company and conduct the majority of our operations through Walker & Dunlop, LLC, our operating company. We do not have, apart from our ownership of this operating company and certain other subsidiaries, any significant independent operations. As a result, we rely on distributions from our operating company to pay any dividends we might declare on shares of our common stock. We also rely largely on distributions from this operating company to meet any of our cash requirements, including our tax liability on taxable income allocated to us and debt payments.
In addition, because we are a holding company, any claims from common stockholders are structurally subordinated to all existing and future liabilities (whether or not for borrowed money) and any preferred equity of our operating company. Therefore, in the event of our bankruptcy, liquidation or reorganization, our assets and those of our operating company will be able to satisfy the claims of our common stockholders only after all of our and our operating company's liabilities and any preferred equity have been paid in full.
Risks Related to Our Financial Statements
Our financial statements are based in part on assumptions and estimates which, if wrong, could result in unexpected cash and non-cash losses in the future, and our financial statements depend on our internal control over financial reporting.
Pursuant to U.S. GAAP, we are required to use certain assumptions and estimates in preparing our financial statements, including in determining credit loss reserves and the fair value of MSRs, among other items. We make fair value determinations based on internally developed models or other means which ultimately rely to some degree on management
22
judgment. These and other assets and liabilities may have no direct observable price levels, making their valuation particularly subjective as they are based on significant estimation and judgment. Several of our accounting policies are critical because they require management to make difficult, subjective, and complex judgments about matters that are inherently uncertain and because it is likely that materially different amounts would be reported under different conditions or using different assumptions. If assumptions or estimates underlying our financial statements are incorrect, losses may be greater than those expectations.
The Sarbanes-Oxley Act requires our management to evaluate our disclosure controls and procedures and its internal control over financial reporting and requires our auditors to issue a report on our internal control over financial reporting. We are required to disclose, in our Annual Report on Form 10-K, the existence of any “material weaknesses” in our internal control over financial reporting. We cannot assure that we will not identify one or more material weaknesses as of the end of any given quarter or year, nor can we predict the effect on our stock price of disclosure of a material weakness.
Our existing goodwill could become impaired, which may require us to take significant non-cash charges.
Under current accounting guidelines, we evaluate our goodwill for potential impairment annually or more frequently if circumstances indicate impairment may have occurred. In addition to the annual impairment evaluation, we evaluate at least quarterly whether events or circumstances have occurred in the period subsequent to the annual impairment testing which indicate that it is more likely than not an impairment loss has occurred. Any impairment of goodwill as a result of such analysis would result in a non-cash charge against earnings, which charge could materially adversely affect our reported results of operations, stockholders’ equity, and our stock price.
* * *
Any factor described in this filing or in any of our other SEC filings could by itself, or together with other factors, adversely affect our financial results and condition. Refer to our quarterly reports on Form 10-Q filed with the SEC in 2018 for material changes to the above discussion of risk factors.
Item 1B. Unresolved Staff Comments.
Our principal headquarters are located in Bethesda, Maryland. We currently maintain an additional 27 offices across the country. Most of our offices are small, loan origination and investment sales offices. The majority of our real estate services activity occurs in our corporate headquarters and our office in Needham, Massachusetts. We believe that our facilities are adequate for us to conduct our present business activities.
All of our office space is leased. The most significant terms of the lease arrangements for our office space are the length of the lease and the amount of the rent. Our leases have terms varying in duration as a result of differences in prevailing market conditions in different geographic locations, with the longest leases expiring in 2023. We do not believe that any single office lease is material to us. In addition, we believe there is adequate alternative office space available at acceptable rental rates to meet our needs, although adverse movements in rental rates in some markets may negatively affect our results of operations and cash flows when we execute new leases.
In the ordinary course of business, we may be party to various claims and litigation, none of which we believe is material. We cannot predict the outcome of any pending litigation and may be subject to consequences that could include fines, penalties, and other costs, and our reputation and business may be impacted. Our management believes that any
23
liability that could be imposed on us in connection with the disposition of any pending lawsuits would not have a material adverse effect on our business, results of operations, liquidity, or financial condition.
Item 4. Mine Safety Disclosures.
Not applicable.
Item 5. Market for Registrant's Common Equity, Related Stockholder Matters, and Issuer Purchases of Equity Securities.
Our common stock trades on the NYSE under the symbol “WD.” In connection with our initial public offering, our common stock began trading on the NYSE on December 15, 2010. There was no established public trading market for our common stock prior to that date. On February 16, 2018, the closing sales price, as reported by the NYSE, was $51.00.
The following table sets forth the intra-day high and low sale prices for our common stock as reported by the NYSE for the periods indicated:
|
|
|
|
|
|
|
|
|
|||||||
|
|
|
2017 |
|
|||||||||||
|
|
|
High |
|
Low |
|
|||||||||
|
1st Quarter |
|
$ |
43.28 |
|
$ |
29.93 |
|
|||||||
|
2nd Quarter |
|
|
53.43 |
|
|
39.38 |
|
|||||||
|
3rd Quarter |
|
|
53.20 |
|
|
44.78 |
|
|||||||
|
4th Quarter |
|
|
56.46 |
|
|
45.67 |
|
|||||||
|
|
|
|
|
|
|
|
|
|||||||
|
|
|
2016 |
|
|||||||||||
|
|
|
High |
|
Low |
|
|||||||||
|
1st Quarter |
|
$ |
29.06 |
|
$ |
19.50 |
|
|||||||
|
2nd Quarter |
|
|
25.43 |
|
|
19.87 |
|
|||||||
|
3rd Quarter |
|
|
28.05 |
|
|
21.75 |
|
|||||||
|
4th Quarter |
|
|
32.43 |
|
|
23.61 |
|
|||||||
As of the close of business on January 31, 2018, there were 21 stockholders of record. We believe that the number of beneficial holders is much greater.
Dividend Policy
On February 6, 2018, our Board of Directors declared a dividend of $0.25 per share for the first quarter of 2018. The dividend will be paid March 7, 2018 to all holders of record of our restricted and unrestricted common stock and restricted stock units as of February 23, 2018. This dividend represents the first such payment of dividends since our initial public offering in December 2010. We expect to make regular quarterly dividend payments at similar levels for the foreseeable future.
Our current and projected dividends provide a return to shareholders while retaining sufficient capital to continue investing in the growth of our business. Our Term Loan (defined in Item 7 below) contains direct restrictions to the amount of dividends we may pay, and our warehouse debt facilities and agreements with the Agencies contain minimum equity, liquidity, and other capital requirements that indirectly restrict the amount of dividends we may pay. While the dividend level remains a decision of our Board of Directors, it is subject to these direct and indirect restrictions, and will continue to be evaluated in the context of future business performance. We currently believe that we can support future annual dividend payments, barring significant unforeseen events.
24
Stock Performance Graph
The following chart graphs our performance in the form of a cumulative five-year total return to holders of our common stock since December 31, 2012 in comparison to the Standard and Poor’s (“S&P”) 500 and the S&P 600 Small Cap Financials Index for that same five-year period. We believe that the S&P 600 Small Cap Financials Index is an appropriate index to compare us with other companies in our industry and that it is a widely recognized and used index for which components and total return information are readily accessible to our security holders to assist in their understanding of our performance relative to other companies in our industry.
The comparison below assumes $100 was invested on December 31, 2012 in our common stock and in each of the indices shown and assumes that all dividends were reinvested. Our stock price performance shown in the following graph is not indicative of future performance or relative performance in comparison to the indices.
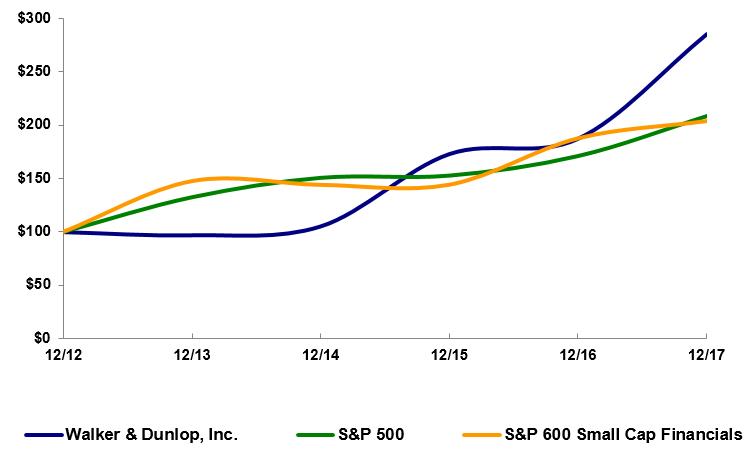
Issuer Purchases of Equity Securities
Under the 2015 Equity Incentive Plan, which constitutes an amendment to and restatement of the 2010 Equity Incentive Plan, subject to the Company’s approval, grantees have the option of electing to satisfy minimum tax withholding obligations at the time of vesting or exercise by allowing the Company to withhold and purchase the shares of stock otherwise issuable to the grantee. For the quarter and year ended December 31, 2017, we purchased 17 thousand shares and 468 thousand shares, respectively, to satisfy grantee tax withholding obligations. Additionally, we announced a share repurchase program in the first quarter of 2017. The repurchase program authorized by our Board of Directors permitted us to repurchase up to $75.0 million of shares of our common stock over a 12-month period ending February 10, 2018. The Company had $59.0 million of authorized share repurchase capacity remaining as of December 31, 2017. In February 2018, our Board of Directors approved a new stock repurchase program that permits the repurchase of up to $50.0 million
25
of shares of our common stock over a 12-month period beginning on February 9, 2018. The following table provides information regarding common stock repurchases for the quarter and year ended December 31, 2017:
|
|
|
|
|
|
|
|
|
|
|
|
|
|
|
|
|
|
|
|
Total Number of |
|
Approximate |
|
||
|
|
|
|
|
|
|
|
Shares Purchased as |
|
Dollar Value |
|
|
|
|
|
Total Number |
|
Average |
|
Part of Publicly |
|
of Shares that May |
|
||
|
|
|
of Shares |
|
Price Paid |
|
Announced Plans |
|
Yet Be Purchased Under |
|
||
|
Period |
|
Purchased |
|
per Share |
|
or Programs |
|
the Plans or Programs |
|
||
|
1st Quarter |
|
439,593 |
|
$ |
39.89 |
|
— |
|
$ |
75,000,000 |
|
|
2nd Quarter |
|
1,133 |
|
$ |
41.69 |
|
— |
|
$ |
75,000,000 |
|
|
3rd Quarter |
|
238,906 |
|
$ |
47.15 |
|
228,419 |
|
$ |
64,240,362 |
|
|
|
|
|
|
|
|
|
|
|
|
|
|
|
October 1-31, 2017 |
|
— |
|
$ |
— |
|
— |
|
|
|
|
|
November 1-30, 2017 |
|
41,158 |
|
|
47.36 |
|
35,744 |
|
|
|
|
|
December 1-31, 2017 |
|
86,543 |
|
|
47.20 |
|
74,782 |
|
|
|
|
|
4th Quarter |
|
127,701 |
|
$ |
47.25 |
|
110,526 |
|
$ |
59,036,570 |
|
|
Total |
|
807,333 |
|
|
|
|
338,945 |
|
|
|
|
Securities Authorized for Issuance Under Equity Compensation Plans
For information regarding securities authorized for issuance under our employee stock-based compensation plans, see Part III, Item 12.
Item 6. Selected Financial Data
The selected historical financial information as of and for the years ended December 31, 2017, 2016, 2015, 2014, and 2013 has been derived from our audited historical financial statements. The selected historical financial data should be read in conjunction with “Management’s Discussion and Analysis of Financial Condition and Results of Operations,” the consolidated financial statements as of December 31, 2017 and 2016 and for the years ended December 31, 2017, 2016, and 2015, and the related notes, all contained elsewhere in this Annual Report on Form 10-K. The significant reduction in the Company’s effective tax rate for the year ended December 31, 2017 is more fully discussed in “Management's Discussion and Analysis of Financial Condition and Results of Operations—Results of Operations” in Item 7 below.
26
SELECTED FINANCIAL DATA
|
|
|
As of and For the Year Ended December 31, |
|
|||||||||||||
|
(dollars in thousands, except per share amounts) |
|
2017 |
|
2016 |
|
2015 |
|
2014 |
|
2013 |
|
|||||
|
Statement of Income Data |
|
|
|
|
|
|
|
|
|
|
|
|
|
|
|
|
|
Revenues |
|
|
|
|
|
|
|
|
|
|
|
|
|
|
|
|
|
Gains from mortgage banking activities |
|
$ |
439,370 |
|
$ |
367,185 |
|
$ |
290,466 |
|
$ |
221,983 |
|
$ |
203,671 |
|
|
Servicing fees |
|
|
176,352 |
|
|
140,924 |
|
|
114,757 |
|
|
98,414 |
|
|
90,215 |
|
|
Net warehouse interest income, loans held for sale |
|
|
15,077 |
|
|
16,245 |
|
|
14,541 |
|
|
11,343 |
|
|
6,214 |
|
|
Net warehouse interest income, loans held for investment |
|
|
9,390 |
|
|
7,482 |
|
|
9,419 |
|
|
6,151 |
|
|
1,231 |
|
|
Escrow earnings and other interest income |
|
|
20,396 |
|
|
9,168 |
|
|
4,473 |
|
|
4,526 |
|
|
4,008 |
|
|
Other |
|
|
51,272 |
|
|
34,272 |
|
|
34,542 |
|
|
18,355 |
|
|
13,700 |
|
|
Total revenues |
|
$ |
711,857 |
|
$ |
575,276 |
|
$ |
468,198 |
|
$ |
360,772 |
|
$ |
319,039 |
|
|
|
|
|
|
|
|
|
|
|
|
|
|
|
|
|
|
|
|
Expenses |
|
|
|
|
|
|
|
|
|
|
|
|
|
|
|
|
|
Personnel |
|
$ |
289,277 |
|
$ |
227,491 |
|
$ |
184,590 |
|
$ |
149,374 |
|
$ |
133,667 |
|
|
Amortization and depreciation |
|
|
131,246 |
|
|
111,427 |
|
|
98,173 |
|
|
80,138 |
|
|
75,955 |
|
|
Provision (benefit) for credit losses |
|
|
(243) |
|
|
(612) |
|
|
1,644 |
|
|
2,206 |
|
|
1,322 |
|
|
Interest expense on corporate debt |
|
|
9,745 |
|
|
9,851 |
|
|
9,918 |
|
|
10,311 |
|
|
3,743 |
|
|
Other operating expenses |
|
|
48,171 |
|
|
41,338 |
|
|
38,507 |
|
|
34,831 |
|
|
37,565 |
|
|
Total expenses |
|
$ |
478,196 |
|
$ |
389,495 |
|
$ |
332,832 |
|
$ |
276,860 |
|
$ |
252,252 |
|
|
Income from operations |
|
$ |
233,661 |
|
$ |
185,781 |
|
$ |
135,366 |
|
$ |
83,912 |
|
$ |
66,787 |
|
|
Income tax expense |
|
|
21,827 |
|
|
71,470 |
|
|
52,771 |
|
|
32,490 |
|
|
25,257 |
|
|
Net income before noncontrolling interests |
|
$ |
211,834 |
|
$ |
114,311 |
|
$ |
82,595 |
|
$ |
51,422 |
|
$ |
41,530 |
|
|
Net income from noncontrolling interests |
|
|
707 |
|
|
414 |
|
|
467 |
|
|
— |
|
|
— |
|
|
Walker & Dunlop net income |
|
$ |
211,127 |
|
$ |
113,897 |
|
$ |
82,128 |
|
$ |
51,422 |
|
$ |
41,530 |
|
|
Basic earnings per share |
|
$ |
7.03 |
|
$ |
3.87 |
|
$ |
2.76 |
|
$ |
1.60 |
|
$ |
1.23 |
|
|
Diluted earnings per share |
|
$ |
6.56 |
|
$ |
3.65 |
|
$ |
2.65 |
|
$ |
1.58 |
|
$ |
1.21 |
|
|
Basic weighted average shares outstanding |
|
|
30,014 |
|
|
29,432 |
|
|
29,754 |
|
|
32,210 |
|
|
33,764 |
|
|
Diluted weighted average shares outstanding |
|
|
32,205 |
|
|
31,172 |
|
|
30,949 |
|
|
32,624 |
|
|
34,336 |
|
|
|
|
|
|
|
|
|
|
|
|
|
|
|
|
|
|
|
|
Balance Sheet Data |
|
|
|
|
|
|
|
|
|
|
|
|
|
|
|
|
|
Cash and cash equivalents |
|
$ |
191,218 |
|
$ |
118,756 |
|
$ |
136,988 |
|
$ |
113,354 |
|
$ |
170,563 |
|
|
Restricted cash and pledged securities |
|
|
104,536 |
|
|
94,711 |
|
|
77,496 |
|
|
81,573 |
|
|
55,078 |
|
|
Mortgage servicing rights |
|
|
634,756 |
|
|
521,930 |
|
|
412,348 |
|
|
375,907 |
|
|
353,024 |
|
|
Loans held for sale, at fair value |
|
|
951,829 |
|
|
1,858,358 |
|
|
2,499,111 |
|
|
1,072,116 |
|
|
281,477 |
|
|
Loans held for investment, net |
|
|
66,510 |
|
|
220,377 |
|
|
231,493 |
|
|
223,059 |
|
|
134,656 |
|
|
Goodwill |
|
|
123,767 |
|
|
96,420 |
|
|
90,338 |
|
|
74,525 |
|
|
60,212 |
|
|
Total assets |
|
|
2,208,427 |
|
|
3,052,432 |
|
|
3,514,991 |
|
|
2,009,390 |
|
|
1,124,579 |
|
|
Warehouse notes payable |
|
|
937,769 |
|
|
1,990,183 |
|
|
2,649,470 |
|
|
1,214,279 |
|
|
371,629 |
|
|
Note payable |
|
|
163,858 |
|
|
164,163 |
|
|
164,462 |
|
|
169,095 |
|
|
170,349 |
|
|
Total liabilities |
|
|
1,393,446 |
|
|
2,437,358 |
|
|
3,022,642 |
|
|
1,575,939 |
|
|
721,738 |
|
|
Total equity |
|
|
814,981 |
|
|
615,074 |
|
|
492,349 |
|
|
433,451 |
|
|
402,841 |
|
|
|
|
|
|
|
|
|
|
|
|
|
|
|
|
|
|
|
|
Supplemental Data |
|
|
|
|
|
|
|
|
|
|
|
|
|
|
|
|
|
Operating margin |
|
|
33 |
% |
|
32 |
% |
|
29 |
% |
|
23 |
% |
|
21 |
% |
|
Return on equity |
|
|
31 |
% |
|
21 |
% |
|
19 |
% |
|
13 |
% |
|
11 |
% |
|
Total transaction volume |
|
$ |
27,905,831 |
|
$ |
19,298,112 |
|
$ |
17,758,748 |
|
$ |
11,367,706 |
|
$ |
8,395,037 |
|
|
Servicing portfolio |
|
$ |
74,492,166 |
|
$ |
63,081,154 |
|
$ |
50,212,264 |
|
$ |
44,031,890 |
|
$ |
38,937,027 |
|
27
Item 7. Management’s Discussion and Analysis of Financial Condition and Results of Operations.
The following discussion should be read in conjunction with “Selected Financial Data” and the historical financial statements and the related notes thereto included elsewhere in this Annual Report on Form 10-K. The following discussion contains, in addition to historical information, forward-looking statements that include risks and uncertainties. Our actual results may differ materially from those expressed or contemplated in those forward-looking statements as a result of certain factors, including those set forth under the headings “Forward-Looking Statements” and “Risk Factors” elsewhere in this Annual Report on Form 10-K.
Business
Walker & Dunlop, Inc. is a holding company, and we conduct the majority of our operations through Walker & Dunlop, LLC, our operating company.
We are one of the leading commercial real estate services and finance companies in the United States, with a primary focus on multifamily lending. We originate, sell, and service a range of commercial real estate financing products to owners and developers of commercial real estate across the country and broker sales of multifamily properties primarily in the southeastern United States. We originate and sell multifamily loans through the programs of Fannie Mae, Freddie Mac, Ginnie Mae, and HUD, with which we have licenses and long-established relationships. We retain servicing rights and asset management responsibilities on nearly all loans that we originate for the Agencies’ programs. We are approved as a Fannie Mae DUS lender nationally, a Freddie Mac seller/servicer in 23 states and the District of Columbia, a Freddie Mac targeted affordable housing seller/servicer, a HUD MAP lender nationally, a HUD LEAN lender nationally, and a Ginnie Mae issuer. We broker and service loans for a number of life insurance companies, CMBS conduits, commercial banks, and other institutional investors, in which cases we do not fund the loan but rather act as a loan broker. We also underwrite, asset-manage, and service short-term bridge loans, some of which we hold as an investment and carry on our balance sheet. Beginning in the second quarter of 2015 in connection with the EFG Acquisition, we began offering multifamily investment sales brokerage services.
We fund loans for the Agencies’ programs, generally through warehouse facility financings, and sell them to investors in accordance with the related loan sale commitment, which we obtain at rate lock. Proceeds from the sale of the loan are used to pay off the warehouse facility. The sale of the loan is typically completed within 60 days after the loan is closed, and we retain the right to service substantially all of these loans. In cases where we do not fund the loan, we act as a loan broker. Our loan originators who focus on loan brokerage are engaged by borrowers to work with a variety of institutional lenders to find the most appropriate loan. These loans are then funded directly by the institutional lender, and we receive an origination fee for placing the loan and a servicing fee for any of the loans we service.
We recognize gains from mortgage banking activities when we make simultaneous commitments to originate a loan to a borrower and sell that loan to an investor. The gains from mortgage banking activities reflect the fair value attributable to loan origination fees, premiums on the sale of loans, net of any co-broker fees, and the fair value of the expected net cash flows associated with servicing the loans, net of any guaranty obligations retained.
We retain servicing rights on substantially all the loans we originate and sell and generate revenues from the fees we receive for servicing the loans, from the interest income on escrow deposits held on behalf of borrowers, from late charges, and from other ancillary fees. Servicing fees set at the time an investor agrees to purchase the loan are generally paid monthly for the duration of the loan, and are based on the unpaid principal balance of the loan. Our Fannie Mae and Freddie Mac servicing arrangements generally provide for prepayment fees to us in the event of a voluntary prepayment. For loans serviced outside of Fannie Mae and Freddie Mac, we typically do not share in any such payments.
We also generate revenues from (i) net warehouse interest income we earn while the loan is held for sale through one of our warehouse facilities, (ii) net warehouse interest income from loans held for investment while they are outstanding, and (iii) broker fees for brokering the sale of multifamily properties.
28
We are currently not exposed to unhedged interest rate risk during the loan commitment, closing, and delivery process. The sale or placement of each loan to an investor is negotiated prior to establishing the coupon rate for the loan. We also seek to mitigate the risk of a loan not closing. We have agreements in place with the Agencies that specify the cost of a failed loan delivery in the event we fail to deliver the loan to the investor. To protect us against such fees, we require a deposit from the borrower at rate lock that is typically more than the potential fee. The deposit is returned to the borrower only once the loan is closed. Any potential loss from a catastrophic change in the property condition while the loan is held for sale using warehouse facility financing is mitigated through property insurance equal to replacement cost. We are also protected contractually from an investor’s failure to purchase the loan. We have experienced an immaterial number of failed deliveries in our history and have incurred immaterial losses on such failed deliveries.
We have risk-sharing obligations on substantially all loans we originate under the Fannie Mae DUS program. When a Fannie Mae DUS loan is subject to full risk-sharing, we absorb losses on the first 5% of the unpaid principal balance of a loan at the time of loss settlement, and above 5% we share a percentage of the loss with Fannie Mae, with our maximum loss capped at 20% of the original unpaid principal balance of the loan (subject to doubling or tripling if the loan does not meet specific underwriting criteria or if the loan defaults within 12 months of its sale to Fannie Mae). We may, however, request decreased risk-sharing at the time of origination, which reduces our potential risk-sharing losses from the levels described above. We occasionally request modified risk-sharing based on the size of the loan. We may also request increased risk-sharing on large transactions if we do not believe that we are being fully compensated for the risks of the transactions or to manage overall risk levels. Our current risk-sharing limit is $60 million, which equates to a maximum loss per loan of $12 million. Our servicing fees for risk-sharing loans include compensation for the risk-sharing obligations and are larger than the servicing fees we receive from Fannie Mae for loans with no risk-sharing obligations. We receive a lower servicing fee for modified risk-sharing than for full risk-sharing.
Our Interim Program offers floating-rate, interest-only loans for terms of up to three years to experienced borrowers seeking to acquire or reposition multifamily properties that do not currently qualify for permanent financing. We underwrite, asset-manage, and service all loans executed through the Interim Program. The ultimate goal of the Interim Program is to provide permanent Agency financing on these transition properties. The Interim Program has two distinct executions: held for investment and held by a joint venture. During the time loans held for investment are outstanding, we assume the full risk of loss on the loans. We have not experienced any delinquencies or charged off any loans originated under the Interim Program, which began operations in 2012. As of December 31, 2017, we had five loans held for investment under the Interim Program with an aggregate outstanding unpaid principal balance of $67.0 million.
Interim loans not held for investment are held by the Interim Program JV, in which we hold a 15% investment. The Interim Program JV assumes full risk of loss while the loans it originates are outstanding. Prior to 2017 and during the first six months of 2017, all loans originated through the Interim Program were held for investment. During the last six months of 2017, substantially all of the loans originated through the Interim Program were Interim Program JV loans. We expect that substantially all loans satisfying the criteria for the Interim Program will be originated by the joint venture going forward; however, we may opportunistically originate loans held for investment through the Interim Program in the future.
Under certain limited circumstances, we may make preferred equity investments in entities controlled by certain of our borrowers that will assist those borrowers to acquire and reposition properties. The terms of such investments are negotiated with each investment. As of December 31, 2017, we have preferred equity investments with one borrower totaling $41.7 million. We expect these preferred equity investments to be repaid within the next two years.
During the second quarter of 2015, in connection with the acquisition of 75% of certain assets and assumption of certain liabilities of EFG, we began providing multifamily investment sales brokerage services through a newly formed subsidiary, WDIS. The initial focus of the investment sales brokerage services is the southeastern United States. We plan to expand these brokerage services nationally. We consolidate the activities of WDIS and present the portion of WDIS that we do not control as Noncontrolling interests in the Consolidated Balance Sheets and Net income from noncontrolling interests in the Consolidated Statements of Income.
29
During 2016, we purchased the rights to service a HUD loan portfolio with an aggregate $3.6 billion unpaid principal balance from a third-party servicer for $43.1 million. During 2017, we purchased the rights to service another HUD loan portfolio with an aggregate $0.6 billion unpaid principal balance from a third-party servicer for $7.8 million (together with the 2016 acquisition, the “Servicing Portfolio Acquisitions”). The acquisition of the servicing portfolios substantially increased our HUD servicing portfolio and led to our being one of the largest servicers of HUD commercial real estate loans as of December 31, 2017. We expect the Servicing Portfolio Acquisitions to have the following benefits:
|
|
|
|
reduce the average cost to service each loan as we leverage our existing servicing platform, |
|
|
|
|
provide new borrower relationships, |
|
|
|
|
provide opportunities for additional loan origination volume when these loans mature or prepay, and |
|
|
|
|
produce a stable stream of cash revenues over the estimated lives of the portfolios. |
As of December 31, 2017, our servicing portfolio was $74.5 billion, up 18% from December 31, 2016, making it the 7th largest commercial/multifamily primary and master servicing portfolio in the nation according to the Mortgage Bankers’ Association’s (“MBA”) 2017 year-end survey (the “Survey”). Our servicing portfolio includes $32.1 billion of loans serviced for Fannie Mae and $26.8 billion for Freddie Mac, making us the 2nd and 4th largest primary and master servicer of Fannie Mae and Freddie Mac loans in the nation, respectively, according to the Survey. Also included in our servicing portfolio is $9.6 billion of HUD loans, the largest HUD primary and master servicing portfolio in the nation according to the Survey.
The average number of our loan originators increased from 97 during 2016 to 130 during 2017 due to our own organic growth and from acquisitions completed in the current and prior year, resulting in an increase of 49% in our loan origination volume, from a total of $16.7 billion during 2016 to a total of $24.9 billion during 2017. Fannie Mae recently announced that we ranked as its largest DUS lender in 2017, by loan deliveries, and Freddie Mac recently announced that we ranked as its 3rd largest seller/servicer in 2017, by loan deliveries.
Basis of Presentation
The accompanying consolidated financial statements include all of the accounts of the Company and its wholly owned subsidiaries, and all intercompany transactions have been eliminated.
Critical Accounting Policies
Our consolidated financial statements have been prepared in accordance with generally accepted accounting principles in the United States of America (“GAAP”), which require management to make estimates and assumptions that affect reported amounts. The estimates and assumptions are based on historical experience and other factors management believes to be reasonable. Actual results may differ from those estimates and assumptions. We believe the following critical accounting policies represent the areas where more significant judgments and estimates are used in the preparation of our consolidated financial statements.
Mortgage Servicing Rights (“MSRs”). MSRs are recorded at fair value at loan sale or upon purchase. The fair value of MSRs acquired through a stand-alone servicing portfolio purchase is equal to the purchase price paid. The fair value at loan sale is based on estimates of expected net cash flows associated with the servicing rights and takes into consideration an estimate of loan prepayment. The estimated net cash flows are discounted at a rate that reflects the credit and liquidity risk of the MSR over the estimated life of the underlying loan. The discount rates used throughout the periods presented for all MSRs recognized at loan sale were between 10-15% and varied based on the loan type. The life of the underlying loan is estimated giving consideration to the prepayment provisions in the loan. Our model for originated MSRs assumes no prepayment while the prepayment provisions have not expired and full prepayment of the loan at or near the point where the prepayment provisions have expired. We record an individual MSR asset (or liability) for each loan at loan sale. For purchased stand-alone servicing portfolios, we record and amortize a portfolio-level MSR asset based on the estimated remaining life of the portfolio using the prepayment characteristics of the portfolio. We have had two stand-alone servicing portfolio purchases, one of which occurred in 2016 and one in 2017.
30
The assumptions used to estimate the fair value of MSRs at loan sale are based on internal models and are periodically compared to assumptions used by other market participants. Due to the relatively few transactions in the multifamily MSR market, we have experienced little volatility in the assumptions we use during the periods presented, including the most-significant assumption – the discount rate. Additionally, we do not expect to see much volatility in the assumptions for the foreseeable future. Management actively monitors the assumptions used and makes adjustments to those assumptions when market conditions change or other factors indicate such adjustments are warranted. We carry originated and purchased MSRs at the lower of amortized cost or fair value and evaluate the carrying value for impairment quarterly. We test for impairment on the purchased stand-alone servicing portfolio separately from our other MSRs. The MSRs from both stand-alone portfolio purchases and from loan sales are tested for impairment at the portfolio level. We have never recorded an impairment of MSRs in our history. We engage a third party to assist in determining an estimated fair value of our existing and outstanding MSRs on at least a semi-annual basis.
Gains from mortgage banking activities income is recognized when we record a derivative asset upon the simultaneous commitments to originate a loan with a borrower and sell the loan to an investor. The commitment asset related to the loan origination is recognized at fair value, which reflects the fair value of the contractual loan origination related fees and sale premiums, net of any co-broker fees, and the estimated fair value of the expected net cash flows associated with the servicing of the loan, net of the estimated net future cash flows associated with any risk-sharing obligations (the “servicing component of the commitment asset”). Upon loan sale, we derecognize the servicing component of the commitment asset and recognize an MSR. All MSRs are amortized into expense using the interest method over the estimated life of the loan and presented as a component of Amortization and depreciation in the Consolidated Statements of Income.
For MSRs recognized at loan sale, the individual loan-level MSR is written off through a charge to Amortization and depreciation when a loan prepays, defaults, or is probable of default. For MSRs related to purchased stand-alone servicing portfolios, a constant rate of prepayments and defaults is included in the determination of the portfolio’s estimated life (and thus included as a component of the portfolio’s amortization). Accordingly, prepayments and defaults of individual MSRs do not change the level of amortization expense recorded for the portfolio unless the pattern of actual prepayments and defaults varies significantly from the estimated pattern. When such a significant difference in the pattern of estimated and actual prepayments and defaults occurs, we prospectively adjust the estimated life of the portfolio (and thus future amortization) to approximate the actual pattern observed. We have not adjusted the estimated life of our purchased stand-alone servicing portfolios as the actual prepayment experience has not differed materially from the expected prepayment experience. We do not anticipate an adjustment to the estimated life of the portfolios will be necessary in the near term due to the characteristics of the portfolios, especially the low weighted-average interest rates and the relatively long remaining periods of prepayment protection.
Allowance for Risk-sharing Obligations. The allowance for risk-sharing obligations relates to our at risk servicing portfolio and is presented as a separate liability within the Consolidated Balance Sheets. The amount of this allowance considers our assessment of the likelihood of repayment by the borrower or key principal(s), the risk characteristics of the loan, the loan’s risk rating, historical loss experience, adverse situations affecting individual loans, the estimated disposition value of the underlying collateral, and the level of risk sharing. Historically, initial loss recognition occurs at or before a loan becomes 60 days delinquent. We regularly monitor the allowance on all applicable loans and update loss estimates as current information is received. Provision (benefit) for credit losses in the Consolidated Statements of Income reflects the income statement impact of changes to both the allowance for risk-sharing obligations and allowance for loan losses.
We perform a quarterly evaluation of all of our risk-sharing loans to determine whether a loss is probable. Our process for identifying which risk-sharing loans may be probable of loss consists of an assessment of several qualitative and quantitative factors including payment status, property financial performance, local real estate market conditions, loan-to-value ratio, debt-service-coverage ratio, and property condition. When we believe a loan is probable of foreclosure or in foreclosure, we record an allowance for that loan (a “specific reserve”). The specific reserve is based on the estimate of the property fair value less selling and property preservation costs and considers the loss-sharing requirements detailed below in the “Credit Quality and Allowance for Risk-Sharing Obligations” section. The estimate of property fair value at initial recognition of the allowance for risk-sharing obligations is based on appraisals, broker opinions of value, or net
31
operating income and market capitalization rates, whichever we believe is the best estimate of the net disposition value. The allowance for risk-sharing obligations for such loans is updated as any additional information is received until the loss is settled with Fannie Mae. The settlement with Fannie Mae is based on the actual sales price of the property and selling and property preservation costs and considers the Fannie Mae loss-sharing requirements. Loss settlement with Fannie Mae has historically concluded within 18 to 36 months after foreclosure. Historically, the initial specific reserves have not varied significantly from the final settlement. We are uncertain whether such a trend will continue in the future.
In addition to the specific reserves discussed above, we also record an allowance for risk-sharing obligations related to all risk-sharing loans on our watch list (“general reserves”). Such loans are not probable of foreclosure but are probable of loss as the characteristics of these loans indicate that it is probable that these loans include some losses even though the loss cannot be attributed to a specific loan. For all other risk-sharing loans not on our watch list, we continue to carry a guaranty obligation. We calculate the general reserves based on a migration analysis of the loans on our historical watch lists, adjusted for qualitative factors. We have not experienced volatility in the general reserves loss percentage and do not expect to experience significant volatility in the near term.
When we place a risk-sharing loan on our watch list, we transfer the remaining unamortized balance of the guaranty obligation to the general reserves. If a risk-sharing loan is subsequently removed from our watch list due to improved financial performance, we transfer the unamortized balance of the guaranty obligation back to the guaranty obligation classification on the balance sheet and amortize the remaining unamortized balance evenly over the remaining estimated life. For each loan for which we have a risk-sharing obligation, we record one of the following liabilities associated with that loan as discussed above: guaranty obligation, general reserve, or specific reserve. Although the liability type may change over the life of the loan, at any particular point in time, only one such liability is associated with a loan for which we have a risk-sharing obligation.
Overview of Current Business Environment
The fundamentals of the commercial and multifamily real estate market remain strong. Multifamily occupancy rates and effective rents continue to remain at historical highs based upon strong rental market demand while delinquency rates remain at historic lows, all of which aid loan performance and loan origination volumes due to their importance to the cash flows of the underlying properties. Additionally, the single-family home ownership level remains near historic lows despite an increase in 2017 while new household formation grows, resulting in increased demand for multifamily housing. The MBA recently reported that the amount of commercial and multifamily mortgage debt outstanding continued to grow in the third quarter of 2017, reaching $3.1 trillion by the end of the third quarter of 2017, an increase of 1.5% from the second quarter of 2017. Multifamily mortgage debt outstanding rose to $1.2 trillion, an increase of 2.1% from the second quarter of 2017. The majority of this growth in multifamily mortgage debt outstanding was related to Agency lending. The MBA also recently reported that multifamily loan originations during the third quarter of 2017 increased 15% from the third quarter of 2016 and 12% from the second quarter of 2017. These increases in debt outstanding and loan origination volume for the third quarter of 2017 expand upon similar increases for the first and second quarters of 2017.
The increase in rental housing demand and gaps in housing production have led to continued steady rising rents in multifamily properties in most markets. The positive performance has boosted the value of many multifamily properties towards the high end of historical ranges. Multifamily rents grew 2.5% in 2017 according to RealPage, a real estate technology and analytics company. However, according to RealPage, the 2017 rent growth slowed to the lowest rate in seven years. Additionally, the level of multifamily properties under construction is at a nearly 40-year high, which has led to a year-over-year increase in national vacancy rates of 40 basis points from the third quarter of 2016, as reported by Reis, a provider of commercial real estate data and analytics, as newly constructed multifamily properties continue to come online. RealPage reported that national multifamily occupancy levels at the end of the fourth quarter of 2017 remained unchanged from the end of the fourth quarter of 2016. We believe that the market demand for multifamily housing in the upcoming quarters will absorb most of the capacity created by these properties currently under construction and that vacancy rates will remain at historic lows, making multifamily properties an attractive investment option.
32
In addition to the improved property fundamentals, for the last several years, the U.S. commercial and multifamily mortgage market has experienced historically low interest rates, leading many borrowers to seek refinancing prior to the scheduled maturity date of their loans. As borrowers have sought to take advantage of the interest rate environment and improved property fundamentals, the number of lenders and amount of capital available to lend have increased. All of these factors have benefited our origination volumes over the past several years, especially in 2017. We expect the U.S. multifamily loan origination volumes in 2017 will be a record high. Competition for lending on commercial and multifamily real estate among commercial real estate services firms, banks, life insurance companies, and the GSEs remains fierce.
The Federal Reserve raised its targeted Fed Funds Rate by 75 basis points during 2017 and by 100 basis points during the 13-month period ended December 31, 2017. We have not experienced a decline in origination volume or profitability as long-term mortgage interest rates have remained at historically low levels as the yield curve has flattened throughout most of 2017. Reis recently reported that in spite of these recent interest-rate increases and slowing rent growth, multifamily cap rates ended the third quarter of 2017 at 5.8%, down from 6.0% in the fourth quarter of 2016. We cannot be certain that these trends will continue as the number, timing, and magnitude of any future increases by the Federal Reserve, taken together with previous interest rate increases and combined with other macroeconomic factors, may have a different effect on the commercial real estate market.
We expect to see continued strength in the multifamily market in 2018 due to the underlying fundamentals of the multifamily market as labor markets are strong and demand increases from new household formation. Additionally, the MBA recently released the results of its 2018 survey of commercial real estate firms and reported that 78% of the firms expect loan originations to increase in 2018. And many expect multifamily cap rates to remain at their historically low 2017 levels.
We are a market-leading originator with Fannie Mae and Freddie Mac, and the GSEs remain the most significant providers of capital to the multifamily market. The FHFA 2018 GSE Scorecard (“2018 Scorecard”) established Fannie Mae’s and Freddie Mac’s 2018 loan origination caps at $35.0 billion each for market-rate apartments (“2018 Caps”), down slightly from $36.5 billion each in 2017. Affordable housing loans and manufactured housing rental community loans continue to be excluded from the 2018 Caps. Additionally, the definition of the affordable housing loan exclusion continues to encompass affordable housing in high- and very-high cost markets and to allow for an exclusion from the 2018 Caps for the pro-rata portion of any loan on a multifamily property that includes affordable housing units. The 2018 Scorecard provides the FHFA with the flexibility to review the estimated size of the multifamily loan origination market on a quarterly basis and proactively adjust the 2018 Caps upward should the market be larger than expected in 2018. The 2018 Scorecard also provides exclusions for loans to properties located in underserved markets including rural, small multifamily, and senior assisted living and for loans to finance multifamily properties that invest in energy or water efficiency improvements.
Our GSE loan origination volume for 2017 increased 41% over 2016 as demand for multifamily lending remained strong as borrowers continue to focus on locking in interest rates in a rising interest rate environment and ride the strong fundamentals in the multifamily market. We expect the GSEs to maintain their historical market share in a multifamily market that is projected by Freddie Mac to be $305.0 billion in 2018. The GSEs reported a combined loan origination volume of $139.3 billion during 2017 compared to $112.1 billion during 2016. As seen from our GSE loan origination volumes for 2017, we believe our market leadership positions us to be a significant lender with the GSEs for the foreseeable future. Our originations with the GSEs are some of our most profitable executions as they provide significant non-cash gains from mortgage servicing rights, and cash revenue streams in the future. A decline in our GSE originations would negatively impact our financial results as our non-cash revenues would decrease disproportionately with loan origination volume and future servicing fee revenue would be constrained or decline. We do not know whether the FHFA will impose stricter limitations on GSE multifamily production volume beyond 2018.
We continue to significantly grow our capital markets platform to gain greater access to capital, deal flow, and borrower relationships. The apparent appetite for debt funding within the broader commercial real estate market, along with the additions of brokered loan originators over the past several years, has resulted in significant growth in our brokered
33
originations, as evidenced by the 75% year-over-year growth in brokered originations from 2016 to 2017. Our outlook for our capital markets platform is positive as we expect continued growth in non-bank commercial and multifamily markets in the near future.
Over the last few years, HUD has reduced the cost of borrowing, making HUD loans more competitive and returning them to relevance for our core multifamily borrowers in 2016 and into 2017, as evidenced by a 54% increase in HUD loan originations from 2016 to 2017. HUD remains a strong source of capital for new construction loans and healthcare facilities. We expect that HUD will continue to be a meaningful supplier of capital to our borrowers. We remain committed to the HUD multifamily business, adding resources and scale to our HUD lending platform, particularly in the area of seniors housing and skilled nursing, where HUD remains a dominant provider of capital in the current business environment.
Many of our borrowers continue to seek higher returns by identifying and acquiring the transitional properties that the Interim Program and Interim Program JV are designed to address. We entered into the Interim Program JV to both increase the overall capital available to transitional properties and dramatically expand our capacity to originate new interim loans. The demand for transitional lending has brought increased competition from lenders, specifically banks, mortgage REITs, and life insurance companies. All are actively pursuing transitional properties by leveraging their low cost of capital and desire for short-term, floating-rate, high-yield commercial real estate investments. We originated $314.4 million of interim loans in 2017.
Finally, as we have stated, multifamily property values are at near historic highs on the back of positive fundamentals across the industry. As a result, we saw increased activity within the investment sales business during 2017. The investment sales market overall grew slightly in 2017. The overall growth in the market, along with the additions we have made to our investment sales team over the past year, resulted in an 18% increase in our investment sales volume from 2016 to 2017. We continue our efforts to expand our investment sales platform more broadly across the United States and to increase the size of our investment sales team to capture what we believe will be strong multifamily investment sales activity over the coming quarters.
During the third quarter of 2017, Hurricanes Harvey and Irma made landfall in the United States, causing substantial damage to the affected areas. Although we have operations in affected areas, none of our operating assets was materially affected by the natural disasters. Located within the affected areas are multiple properties collateralizing loans for which we have risk-sharing obligations. Based on our current assessment of these properties, we believe that few, if any, of these properties incurred significant damage, and those that did have adequate insurance coverage. Additionally, we have not experienced an increase in late payments from risk-sharing loans collateralized by properties in the affected areas. Accordingly, the hurricanes did not have an impact on our December 31, 2017 Allowance for risk-sharing obligations. Additionally, based on information currently available, we do not believe that these natural disasters will have a material impact on the Allowance for risk-sharing obligations in 2018. However, the impact to borrowers from such natural disasters may not be known by us until well after the occurrence of the disaster; therefore, over the coming months, we may experience an increase in late payments or defaults of loans for which we have risk-sharing obligations that are collateralized by properties in the affected areas.
Factors That May Impact Our Operating Results
We believe that our results are affected by a number of factors, including the items discussed below.
|
· |
Performance of Multifamily and Other Commercial Real Estate Related Markets. Our business is dependent on the general demand for, and value of, commercial real estate and related services, which are sensitive to long-term mortgage interest rates and other macroeconomic conditions and the continued existence of the GSEs. Demand for multifamily and other commercial real estate generally increases during stronger economic environments, resulting in increased property values, transaction volumes, and loan origination volumes. During weaker economic environments, multifamily and other commercial real estate may experience higher property vacancies, lower demand and reduced values. These conditions can result in lower property |
34
transaction volumes and loan originations, as well as an increased level of servicer advances and losses from our Fannie Mae DUS risk-sharing obligations and our interim lending program. |
|
· |
The Level of Losses from Fannie Mae Risk-Sharing Obligations. Under the Fannie Mae DUS program, we share risk of loss on most loans we sell to Fannie Mae. In the majority of cases, we absorb the first 5% of any losses on the loan’s unpaid principal balance at the time of loss settlement, and above 5% we share a percentage of the loss with Fannie Mae, with our maximum loss capped at 20% of the loan’s unpaid principal balance on the origination date. As a result, a rise in defaults could have a material adverse effect on us. |
|
· |
The Price of Loans in the Secondary Market. Our profitability is determined in part by the price we are paid for the loans we originate. A component of our origination related revenues is the premium we recognize on the sale of a loan. Stronger investor demand typically results in larger premiums while weaker demand results in little to no premium. |
|
· |
Market for Servicing Commercial Real Estate Loans. Servicing fee rates for new loans are set at the time we enter into a loan sale commitment based on origination fees, competition, prepayment rates, and any risk-sharing obligations we undertake. Changes in servicing fee rates impact the value of our MSRs and future servicing revenues, which could impact our profit margins and operating results over time. |
|
· |
The Percentage of Adjustable Rate Loans Originated and the Overall Loan Origination Mix. The adjustable rate mortgage loans (“ARMs”) we originate typically have less stringent prepayment protection features than fixed rate mortgage loans (“FRMs”), resulting in a shorter expected life for ARMs than FRMs. The shorter expected life for ARMs results in smaller MSRs recorded than for FRMs. Absent an increase in originations, an increase in the proportion of our loans originated that are ARMs could adversely impact the gains from mortgage banking activities we record. Additionally, the loan product mix we originate can significantly impact our overall earnings. For example, an increase in loan origination volume for our two highest-margin products, Fannie Mae and HUD loans, without a change in total loan origination volume would increase our overall profitability, while a decrease in the loan origination volume of these two products without a change in total loan origination volume would decrease our overall profitability, all else equal. |
Revenues
Gains from Mortgage Banking Activities. Mortgage banking activity income is recognized when we record a derivative asset upon the simultaneous commitments to originate a loan with a borrower and sell to an investor. The commitment asset related to the loan origination is recognized at fair value, which reflects the fair value of the contractual loan origination related fees and sale premiums, net of co-broker fees, the estimated fair value of the expected net cash flows associated with the servicing of the loan, and the estimated fair value of any guaranty obligations to be assumed. Also included in gains from mortgage banking activities are changes to the fair value of loan commitments, forward sale commitments, and loans held for sale that occur during their respective holding periods. Upon sale of the loans, no gains or losses are recognized as such loans are recorded at fair value during their holding periods. MSRs and guaranty obligations are recognized as assets and liabilities, respectively, upon the sale of the loans.
Brokered loans tend to have lower origination fees because they often require less time to execute, there is more competition for brokerage assignments, and because the borrower will also have to pay an origination fee to the institutional lender.
Premiums received on the sale of a loan result when a loan is sold to an investor for more than its face value. There are various reasons investors may pay a premium when purchasing a loan. For example, the fixed rate on the loan may be higher than the rate of return required by an investor or the characteristics of a particular loan may be desirable to an investor. We do not receive premiums on brokered loans.
35
MSRs are recorded at fair value upon loan sale. The fair value is based on estimates of expected net cash flows associated with the servicing rights. The estimated net cash flows are discounted at a rate that reflects the credit and liquidity risk of the MSR over the estimated life of the loan.
Servicing Fees. We service nearly all loans we originate and some loans we broker. We earn servicing fees for performing certain loan servicing functions, such as processing loan, tax, and insurance payments and managing escrow balances. Servicing generally also includes asset management functions, such as monitoring the physical condition of the property, analyzing the financial condition and liquidity of the borrower, and performing loss mitigation activities as directed by the Agencies.
Our servicing fees on loans we originate provide a stable revenue stream. They are based on contractual terms, are earned over the life of the loan, and are generally not subject to significant prepayment risk. Our Fannie Mae and Freddie Mac servicing agreements provide for make-whole payments in the event of a voluntary prepayment. Accordingly, we currently do not hedge our servicing portfolio for prepayment risk. Any make-whole payments received are included in Other revenue.
HUD has the right to terminate our current servicing engagements for cause. In addition to termination for cause, Fannie Mae and Freddie Mac may terminate our servicing engagements without cause by paying a termination fee. Our institutional investors typically may terminate our servicing engagements for brokered loans at any time with or without cause, without paying a termination fee.
Net Warehouse Interest Income, Loans Held for Sale. We earn net interest income on loans funded through borrowings from our warehouse facilities from the time the loan is closed until the loan is sold pursuant to the loan purchase agreement. Each borrowing on a warehouse line relates to a specific loan for which we have already secured a loan sale commitment with an investor. Related interest expense from the warehouse loan funding is netted in our financial statements against interest income. Net warehouse interest income related to loans held for sale varies based on the period of time between the loan closing and the sale of the loan to the investor, the size of the average balance of the loans held for sale, and the net interest spread between the loan coupon rate and the cost of warehouse financing. Loans typically remain in the warehouse facility for up to 60 days, but the average time in the warehouse facility is approximately 30 days. Loans that we broker for institutional investors and other investors are funded directly by them; therefore, there is no warehouse interest income or expense associated with brokered loan transactions. Additionally, the amortization of debt issuance costs is included in net warehouse interest income, loans held for sale.
Net Warehouse Interest Income, Loans Held for Investment. Similar to loans held for sale, we earn net interest income on loans held for investment during the period they are outstanding. We earn interest income on the loan, which is funded partially by an investment of our cash and through one of our interim warehouse credit facilities. The loans originated for investment are typically interest-only, variable-rate loans of terms up to three years. The warehouse credit facilities are variable rate. The interest rate reset date is typically the same for the loans and the credit facility. Related interest expense from the warehouse loan funding is netted in our financial statements against interest income. Net warehouse interest income related to loans held for investment varies based on the period of time the loans are outstanding, the size of the average balance of the loans held for investment, and the net interest spread between the loan coupon rate and the cost of warehouse financing. The net spread has historically not varied much. Additionally, the amortization of deferred fees and costs and the amortization of debt issuance costs are included in net warehouse interest income, loans held for investment. We expect net warehouse interest income from loans held for investment to decrease in the coming years as most, if not all, of the loans originated through the Interim Program are held by the Interim Program JV.
Escrow Earnings and Other Interest Income. We earn fee income on property-level escrow deposits in our servicing portfolio, generally based on a fixed or variable placement fee negotiated with the financial institutions that hold the escrow deposits. Escrow earnings reflect interest income net of interest paid to the borrower, if required, which generally equals a money market rate. Escrow earnings tend to increase as short-term interest rates increase as they did in 2017. We expect this trend to continue for the foreseeable future.
36
Other. Other income is comprised of fees for processing loan assumptions, prepayment fee income, application fees, investment sales broker fees, income from equity-method investments, income from preferred equity investments, and other miscellaneous revenues related to our operations.
Costs and Expenses
Personnel. Personnel expense includes the cost of employee compensation and benefits, which include fixed and discretionary amounts tied to company and individual performance, commissions, severance expense, signing and retention bonuses, and share-based compensation.
Amortization and Depreciation. Amortization and depreciation is principally comprised of amortization of our MSRs, net of amortization of our guaranty obligations. The MSRs are amortized using the interest method over the period that servicing income is expected to be received. We amortize the guaranty obligations evenly over their expected lives. When the loan underlying an MSR prepays, we write off the remaining unamortized balance, net of any related guaranty obligation, and record the write off to Amortization and depreciation. Similarly, when the loan underlying an MSR defaults, we write the MSR off to Amortization and depreciation. We depreciate property, plant, and equipment ratably over their estimated useful lives.
Amortization and depreciation also includes the amortization of intangible assets, principally related to the amortization of the mortgage pipeline and investment sales pipeline intangible assets recognized in connection with acquisitions. For the years presented in the Consolidated Statements of Income, the amortization of intangible assets relates primarily to the mortgage pipeline intangible asset recognized in conjunction with acquisitions in 2016 and 2017 and the EFG Acquisition in 2015. We recognize amortization related to the mortgage pipeline intangible asset when a loan included in the mortgage pipeline intangible asset is rate locked or is no longer probable of rate locking. We recognize amortization related to the investment sales pipeline intangible asset when a transaction included in the intangible asset is closed or no longer probable of closing.
Provision (Benefit) for Credit Losses. The provision (benefit) for credit losses consists of two components: the provision associated with our risk-sharing loans and the provision associated with our loans held for investment. The provision (benefit) for credit losses associated with risk-sharing loans is established at the loan level when the borrower has defaulted on the loan or is probable of defaulting on the loan or collectively for loans that are not probable of default but on a watch list. This provision is in addition to the guaranty obligation that is recognized when the loan is sold. The provision (benefit) for credit losses associated with our loans held for investment is established collectively for loans that are not impaired and individually for loans that are impaired. Our estimates of property fair value are based on appraisals, broker opinions of value, or net operating income and market capitalization rates, whichever we believe is the best estimate of the net disposition value.
Interest Expense on Corporate Debt. Interest expense on corporate debt includes interest expense incurred and amortization of debt discount and debt issuance costs related to our term note facility.
Other Operating Expenses. Other operating expenses include sub-servicing costs, facilities costs, travel and entertainment costs, marketing costs, professional fees, license fees, dues and subscriptions, corporate insurance premiums, and other administrative expenses.
Income Tax Expense. The Company is a C-corporation subject to both federal and state corporate tax. As of December 31, 2017, our estimated combined statutory federal and state tax rate was approximately 38.2% compared to approximately 38.6% as of December 31, 2016. Our combined statutory tax rate has historically not varied significantly as the only material difference in the calculation of the combined statutory tax rate from year to year is the apportionment of our taxable income amongst the various states where we are subject to taxation since we do not have foreign operations or significant permanent differences. For example, since we went public in 2010, our combined statutory tax rate has varied by only 0.7%, with a low of 38.2% and a high of 38.9%. In December 2017, the Tax Cuts and Jobs Act (“Tax Reform”) was enacted. The Tax Reform significantly reduced the Federal income tax rate from 35.0% to 21.0%. Due to the reduced
37
Federal statutory rate, we expect our combined statutory tax rate in 2018 to be approximately 25.0%. Absent additional significant legislative changes to statutory tax rates (particularly the Federal tax rate), we expect minimal deviation from the 2018 expected combined statutory tax rate of 25.0% for years after 2018. However, we do expect some variability in the effective tax rate going forward due to excess tax benefits recognized and limitations on the deductibility of executive compensation.
In 2016, we adopted a new accounting standard that requires excess tax benefits from stock compensation to be recorded as a reduction to income tax expense instead of being recorded directly to equity. Excess tax benefits recognized in 2016 and 2017 reduced income tax expense by $0.6 million and $9.5 million, respectively. We expect the reduction to income tax expense due to excess tax benefits in 2018 to be significantly less than the reduction in 2017 given (i) the expectation for a significantly fewer number of shares to vest in 2018 than in 2017, (ii) a significantly higher weighted-average grant date price of shares expected to vest in 2018 than those that did vest in 2017, and (iii) the aforementioned reduction in the combined statutory tax rate due to Tax Reform. The impact of excess tax benefits beyond 2018 will vary depending on the trend of the price of our common stock and the number of shares that vest.
Results of Operations
Following is a discussion of our results of operations for the years ended December 31, 2017, 2016, and 2015. The financial results are not necessarily indicative of future results. Our annual results have fluctuated in the past and are expected to fluctuate in the future, reflecting the interest-rate environment, the volume of transactions, business acquisitions, regulatory actions, and general economic conditions. Please refer to the table below, which provides supplemental data regarding our financial performance.
SUPPLEMENTAL OPERATING DATA
|
|
|
For the year ended December 31, |
|
|||||||
|
(in thousands; except per share data) |
|
2017 |
|
2016 |
|
2015 |
|
|||
|
Transaction Volume: |
|
|
|
|
|
|
|
|
|
|
|
Loan Origination Volume by Product Type |
|
|
|
|
|
|
|
|
|
|
|
Fannie Mae |
|
$ |
7,894,106 |
|
$ |
7,000,942 |
|
$ |
5,012,790 |
|
|
Freddie Mac |
|
|
7,981,156 |
|
|
4,234,071 |
|
|
6,326,471 |
|
|
Ginnie Mae - HUD |
|
|
1,358,221 |
|
|
879,941 |
|
|
592,026 |
|
|
Brokered (1) |
|
|
7,326,907 |
|
|
4,189,116 |
|
|
4,122,307 |
|
|
Interim Loans |
|
|
314,372 |
|
|
419,600 |
|
|
185,075 |
|
|
Total Loan Origination Volume |
|
$ |
24,874,762 |
|
$ |
16,723,670 |
|
$ |
16,238,669 |
|
|
Investment Sales Volume |
|
|
3,031,069 |
|
|
2,574,442 |
|
|
1,520,079 |
|
|
Total Transaction Volume |
|
$ |
27,905,831 |
|
$ |
19,298,112 |
|
$ |
17,758,748 |
|
|
|
|
|
|
|
|
|
|
|
|
|
|
Key Performance Metrics: |
|
|
|
|
|
|
|
|
|
|
|
Operating margin |
|
|
33 |
% |
|
32 |
% |
|
29 |
% |
|
Return on equity |
|
|
31 |
% |
|
21 |
% |
|
19 |
% |
|
Walker & Dunlop net income |
|
$ |
211,127 |
|
$ |
113,897 |
|
$ |
82,128 |
|
|
Adjusted EBITDA (2) |
|
$ |
200,950 |
|
$ |
129,928 |
|
$ |
124,279 |
|
|
Diluted EPS |
|
$ |
6.56 |
|
$ |
3.65 |
|
$ |
2.65 |
|
|
|
|
|
|
|
|
|
|
|
|
|
|
Key Expense Metrics (as a percentage of total revenues): |
|
|
|
|
|
|
|
|
|
|
|
Personnel expenses |
|
|
41 |
% |
|
40 |
% |
|
39 |
% |
|
Other operating expenses |
|
|
7 |
% |
|
7 |
% |
|
8 |
% |
|
Key Revenue Metrics (as a percentage of loan origination volume): |
|
|
|
|
|
|
|
|
|
|
|
Origination related fees |
|
|
0.99 |
% |
|
1.04 |
% |
|
0.97 |
% |
|
Gains attributable to MSRs |
|
|
0.78 |
% |
|
1.15 |
% |
|
0.82 |
% |
|
Gains attributable to MSRs, as a percentage of Agency loan origination volume (3) |
|
|
1.13 |
% |
|
1.59 |
% |
|
1.12 |
% |
38
SUPPLEMENTAL OPERATING DATA (Continued)
|
As of December 31, |
||||||||||||
|
Servicing Portfolio by Product: |
2017 |
2016 |
2015 |
|||||||||
|
Fannie Mae |
$ |
32,075,617 |
$ |
27,728,164 |
$ |
22,915,088 |
||||||
|
Freddie Mac |
26,782,581 |
20,688,410 |
17,810,007 |
|||||||||
|
Ginnie Mae - HUD |
9,640,312 |
9,155,794 |
5,657,809 |
|||||||||
|
Brokered (1) |
5,744,518 |
5,286,473 |
3,595,990 |
|||||||||
|
Interim Loans |
249,138 |
222,313 |
233,370 |
|||||||||
|
Total Servicing Portfolio |
$ |
74,492,166 |
$ |
63,081,154 |
$ |
50,212,264 |
||||||
|
Key Servicing Metrics (end of period): |
||||||||||||
|
Weighted-average servicing fee rate (basis points) |
25.7 |
26.1 |
24.8 |
|||||||||
|
Weighted-average remaining term (years) |
10.0 | 10.3 | 9.6 | |||||||||
|
(1) |
Brokered transactions for life insurance companies, commercial mortgage backed securities, commercial banks, and other capital sources. |
|
(2) |
This is a non-GAAP financial measure. For more information on adjusted EBITDA, refer to the section below titled “Non-GAAP Financial Measures.” |
|
(3) |
The fair value of the expected net cash flows associated with the servicing of the loan, net of any guaranty obligations retained, as a percentage of Agency loan origination volume. |
39
Year Ended December 31, 2017 Compared to Year Ended December 31, 2016
The following table presents a period-to-period comparison of our financial results for the years ended December 31, 2017 and 2016.
FINANCIAL RESULTS – 2017 COMPARED TO 2016
|
|
|
Year Ended December 31, |
|
Dollar |
|
Percentage |
|
|
|||||
|
(dollars in thousands) |
|
2017 |
|
2016 |
|
Change |
|
Change |
|
|
|||
|
Revenues |
|
|
|
|
|
|
|
|
|
|
|
|
|
|
Gains from mortgage banking activities |
|
$ |
439,370 |
|
$ |
367,185 |
|
$ |
72,185 |
|
20 |
% |
|
|
Servicing fees |
|
|
176,352 |
|
|
140,924 |
|
|
35,428 |
|
25 |
|
|
|
Net warehouse interest income, loans held for sale |
|
|
15,077 |
|
|
16,245 |
|
|
(1,168) |
|
(7) |
|
|
|
Net warehouse interest income, loans held for investment |
|
|
9,390 |
|
|
7,482 |
|
|
1,908 |
|
26 |
|
|
|
Escrow earnings and other interest income |
|
|
20,396 |
|
|
9,168 |
|
|
11,228 |
|
122 |
|
|
|
Other |
|
|
51,272 |
|
|
34,272 |
|
|
17,000 |
|
50 |
|
|
|
Total revenues |
|
$ |
711,857 |
|
$ |
575,276 |
|
$ |
136,581 |
|
24 |
|
|
|
|
|
|
|
|
|
|
|
|
|
|
|
|
|
|
Expenses |
|
|
|
|
|
|
|
|
|
|
|
|
|
|
Personnel |
|
$ |
289,277 |
|
$ |
227,491 |
|
$ |
61,786 |
|
27 |
% |
|
|
Amortization and depreciation |
|
|
131,246 |
|
|
111,427 |
|
|
19,819 |
|
18 |
|
|
|
Provision (benefit) for credit losses |
|
|
(243) |
|
|
(612) |
|
|
369 |
|
(60) |
|
|
|
Interest expense on corporate debt |
|
|
9,745 |
|
|
9,851 |
|
|
(106) |
|
(1) |
|
|
|
Other operating expenses |
|
|
48,171 |
|
|
41,338 |
|
|
6,833 |
|
17 |
|
|
|
Total expenses |
|
$ |
478,196 |
|
$ |
389,495 |
|
$ |
88,701 |
|
23 |
|
|
|
Income from operations |
|
$ |
233,661 |
|
$ |
185,781 |
|
$ |
47,880 |
|
26 |
|
|
|
Income tax expense |
|
|
21,827 |
|
|
71,470 |
|
|
(49,643) |
|
(69) |
|
|
|
Net income before noncontrolling interests |
|
$ |
211,834 |
|
$ |
114,311 |
|
$ |
97,523 |
|
85 |
|
|
|
Less: net income from noncontrolling interests |
|
|
707 |
|
|
414 |
|
|
293 |
|
71 |
|
|
|
Walker & Dunlop net income |
|
$ |
211,127 |
|
$ |
113,897 |
|
$ |
97,230 |
|
85 |
|
|
|
|
|
|
|
|
|
|
|
|
|
|
|
|
|
Overview
The increase in revenues was primarily attributable to increases in gains from mortgage banking activities, servicing fees, escrow earnings and other interest income, and other revenues. The increase in gains from mortgage banking activities was largely due to the significant increase in loan origination volume from 2016 to 2017. The growth in loan origination volume is primarily due to an increase in the average number of loan originators from 2016 to 2017. The increase in servicing fees was due to an increase in the average servicing portfolio. The substantial increase in escrow earnings and other interest income related to increases in the escrow balances of loans serviced and the escrow earnings rate. Other revenues increased due to increases in investment sales broker fees, preferred equity investment income, prepayment fees, and assumption fees.
The increase in expenses was principally the result of higher personnel, amortization and depreciation, and other operating expenses. Personnel expense increased mostly due to an increase in salaries expense resulting from a rise in average headcount year over year and an increase in commissions costs due to an increase in origination fees driven by the increase in total transaction volume. Headcount increased due to acquisitions and hiring to support the growth of the Company. Amortization and depreciation expense increased as a result of a rise in the average balance of MSRs outstanding year over year as we originated a record amount of loans in 2017. The increase in other operating expenses was largely due to an increase in office expenses due to the increase in average headcount year over year.
40
Revenues
Gains from Mortgage Banking Activities. The following table provides additional information that helps explain changes in gains from mortgage banking activities over the past three years:
|
|
|
Loan Origination Volume by Product Type |
|
||||||
|
|
|
For the year ended December 31, |
|
||||||
|
|
|
2017 |
|
|
2016 |
|
|
2015 |
|
|
Fannie Mae |
|
32 |
% |
|
42 |
% |
|
31 |
% |
|
Freddie Mac |
|
32 |
|
|
25 |
|
|
39 |
|
|
Ginnie Mae - HUD |
|
5 |
|
|
5 |
|
|
4 |
|
|
Brokered |
|
30 |
|
|
25 |
|
|
25 |
|
|
Interim Loans |
|
1 |
|
|
3 |
|
|
1 |
|
|
|
Gains from Mortgage Banking Activities Detail |
|
|||||||
|
|
For the year ended December 31, |
|
|||||||
|
(dollars in thousands) |
2017 |
|
2016 |
|
2015 |
|
|||
|
Origination Fees |
$ |
245,484 |
|
$ |
174,360 |
|
$ |
156,835 |
|
|
Dollar Change |
$ |
71,124 |
|
$ |
17,525 |
|
|
|
|
|
Percentage Change |
|
41 |
% |
|
11 |
% |
|
|
|
|
MSR Income (1) |
$ |
193,886 |
|
$ |
192,825 |
|
$ |
133,631 |
|
|
Dollar Change |
$ |
1,061 |
|
$ |
59,194 |
|
|
|
|
|
Percentage Change |
|
1 |
% |
|
44 |
% |
|
|
|
|
Origination Fee Rate (2) (basis points) |
|
99 |
|
|
104 |
|
|
97 |
|
|
Basis Point Change |
|
(5) |
|
|
7 |
|
|
|
|
|
Percentage Change |
|
(5) |
% |
|
7 |
% |
|
|
|
|
MSR Rate (3) (basis points) |
|
78 |
|
|
115 |
|
|
82 |
|
|
Basis Point Change |
|
(37) |
|
|
33 |
|
|
|
|
|
Percentage Change |
|
(32) |
% |
|
40 |
% |
|
|
|
|
Agency MSR Rate (4) (basis points) |
|
113 |
|
|
159 |
|
|
112 |
|
|
Basis Point Change |
|
(46) |
|
|
47 |
|
|
|
|
|
Percentage Change |
|
(29) |
% |
|
42 |
% |
|
|
|
|
(1) |
The fair value of the expected net cash flows associated with the servicing of the loan, net of any guaranty obligations retained. |
|
(2) |
Origination fees as a percentage of loan origination volume. |
|
(3) |
MSR income as a percentage of loan origination volume. |
|
(4) |
MSR income as a percentage of Agency loan origination volume. |
Gains from mortgage banking activities reflect the fair value of loan origination fees, the fair value of loan premiums, net of any co-broker fees, and the fair value of the expected net cash flows associated with the servicing of the loan, net of any guaranty obligations retained (“MSR income”). The increase in origination fees was largely attributable to the 49% increase in loan origination volume year over year, partially offset by a small decline in the origination fee rate. The small increase in MSR income was driven by the $5.1 billion increase in Agency loan origination volume from 2016 to 2017, almost completely offset by the 29% decrease in the Agency MSR rate. The decline in the Agency MSR rate was driven by (i) an increase in Freddie Mac loan origination volume as a percentage of total Agency volume from 35% in 2016 to 46% in 2017 and (ii) an increase in the large portfolio transactions year over year. The MSR income from Freddie Mac loans is the lowest of the Agency loan products. In addition, we typically receive lower servicing fees on large portfolio transactions, resulting in a lower MSR rate on these loans.
41
Servicing Fees. The increase was primarily attributable to an increase in the average servicing portfolio from 2016 to 2017 as shown below due primarily to record new loan originations and relatively few payoffs. Additionally, the servicing portfolio’s weighted average servicing fee increased as shown below due to an increase in the Fannie Mae servicing portfolio.
|
|
Servicing Fees Details |
|
|||||||
|
|
For the year ended December 31, |
|
|||||||
|
(dollars in thousands) |
2017 |
|
2016 |
|
2015 |
|
|||
|
Average Servicing Portfolio |
$ |
67,072,015 |
|
$ |
55,540,993 |
|
$ |
47,096,080 |
|
|
Dollar Change |
$ |
11,531,022 |
|
$ |
8,444,913 |
|
|
|
|
|
Percentage Change |
|
21 |
% |
|
18 |
% |
|
|
|
|
Average Servicing Fee (basis points) |
|
26.2 |
|
|
25.3 |
|
|
24.3 |
|
|
Basis Point Change |
|
0.9 |
|
|
1.0 |
|
|
|
|
|
Percentage Change |
|
4 |
% |
|
4 |
% |
|
|
|
Escrow Earnings and Other Interest Income. The increase was due to increases in both the average balance of escrow accounts and the average earnings rate from 2016 to 2017. The increase in the average balance was due to the increase in the average servicing portfolio. The increase in the average earnings rate was due to the increase in short-term interest rates during 2017.
Other Revenues. The increase is related to increases in investment sales broker fees, preferred equity investment income, prepayment fees, and assumption fees. Investment sales broker fees increased $5.0 million year over year as a result of the increase in investment sales volume. Preferred equity investment income increased $2.8 million from 2016 to 2017 due to an increase in the average balance of preferred equity investments outstanding. Prepayment fees increased $6.7 million, while assumption fees increased $1.8 million, both as a result of increased activity as our average servicing portfolio continues to grow.
Expenses
Personnel. The increase was principally the result of higher loan originator commission costs and increased salaries expense. Commission costs increased due to the increase in origination fee income attributable to the increase in total transaction volume. Salaries expense increased due to a rise in average headcount from 519 in 2016 to 599 in 2017 as a result of acquisitions and organic growth of the Company.
Amortization and Depreciation. The increase was attributable to loan origination activity and the resulting growth in the average MSR balance outstanding from 2016 to 2017.
Other Operating Expenses. The increase was primarily attributable to a $2.9 million increase in office expenses. These expenses increased as a result of the aforementioned increase in average headcount.
Income Tax Expense. The decrease in income tax expense was primarily due to an increase in excess tax benefits from stock compensation recognized year over year and the enactment of Tax Reform in 2017, partially offset by the increase in income from operations. Excess tax benefits reduced income tax expense by $9.5 million in 2017 compared to $0.6 million in 2016. As mentioned previously, excess tax benefits reduced income tax expense in 2016 but not 2015 due to a new accounting standard that we adopted in 2016.
As discussed previously, Tax Reform was enacted in December 2017, reducing the Federal income tax rate from 35.0% to 21.0%. In connection with the enactment of the Tax Reform, we revalued our net deferred tax liabilities using the new Federal income tax rate of 21.0%. These net deferred tax liabilities decreased as the future payment of taxes from these liabilities will be less than previously expected, resulting in a decrease to income tax expense of $58.3 million. The significant reductions to income tax expense in 2017 resulted in an effective tax rate of 9.3% compared to 38.5% in 2016.
42
Year Ended December 31, 2016 Compared to Year Ended December 31, 2015
The following table presents a period-to-period comparison of our financial results for the years ended December 31, 2016 and 2015.
FINANCIAL RESULTS – 2016 COMPARED TO 2015
|
|
|
For the year ended |
|
|
|
|
|
|
|||||
|
|
|
December 31, |
|
Dollar |
|
Percentage |
|
|
|||||
|
(dollars in thousands) |
|
2016 |
|
2015 |
|
Change |
|
Change |
|
|
|||
|
Revenues |
|
|
|
|
|
|
|
|
|
|
|
|
|
|
Gains from mortgage banking activities |
|
$ |
367,185 |
|
$ |
290,466 |
|
$ |
76,719 |
|
26 |
% |
|
|
Servicing fees |
|
|
140,924 |
|
|
114,757 |
|
|
26,167 |
|
23 |
% |
|
|
Net warehouse interest income, loans held for sale |
|
|
16,245 |
|
|
14,541 |
|
|
1,704 |
|
12 |
% |
|
|
Net warehouse interest income, loans held for investment |
|
|
7,482 |
|
|
9,419 |
|
|
(1,937) |
|
(21) |
% |
|
|
Escrow earnings and other interest income |
|
|
9,168 |
|
|
4,473 |
|
|
4,695 |
|
105 |
% |
|
|
Other |
|
|
34,272 |
|
|
34,542 |
|
|
(270) |
|
(1) |
% |
|
|
Total revenues |
|
$ |
575,276 |
|
$ |
468,198 |
|
$ |
107,078 |
|
23 |
% |
|
|
|
|
|
|
|
|
|
|
|
|
|
|
|
|
|
Expenses |
|
|
|
|
|
|
|
|
|
|
|
|
|
|
Personnel |
|
$ |
227,491 |
|
$ |
184,590 |
|
$ |
42,901 |
|
23 |
% |
|
|
Amortization and depreciation |
|
|
111,427 |
|
|
98,173 |
|
|
13,254 |
|
14 |
% |
|
|
Provision (benefit) for credit losses |
|
|
(612) |
|
|
1,644 |
|
|
(2,256) |
|
(137) |
% |
|
|
Interest expense on corporate debt |
|
|
9,851 |
|
|
9,918 |
|
|
(67) |
|
(1) |
% |
|
|
Other operating expenses |
|
|
41,338 |
|
|
38,507 |
|
|
2,831 |
|
7 |
% |
|
|
Total expenses |
|
$ |
389,495 |
|
$ |
332,832 |
|
$ |
56,663 |
|
17 |
% |
|
|
Income from operations |
|
$ |
185,781 |
|
$ |
135,366 |
|
$ |
50,415 |
|
37 |
% |
|
|
Income tax expense |
|
|
71,470 |
|
|
52,771 |
|
|
18,699 |
|
35 |
% |
|
|
Net income before noncontrolling interests |
|
$ |
114,311 |
|
$ |
82,595 |
|
$ |
31,716 |
|
38 |
% |
|
|
Less: net income from noncontrolling interests |
|
|
414 |
|
|
467 |
|
|
(53) |
|
(11) |
% |
|
|
Walker & Dunlop net income |
|
$ |
113,897 |
|
$ |
82,128 |
|
$ |
31,769 |
|
39 |
% |
|
Overview
The increase in revenues was primarily attributable to increases in gains from mortgage banking activities and servicing fees. The increase in gains from mortgage banking activities was largely due to the significant increase in Fannie Mae loan origination volume from 2015 to 2016. The growth in Fannie Mae loan origination volume was due to Fannie Mae’s increased competitiveness with Freddie Mac for fixed-rate lending in 2016 compared to 2015. The increase in servicing fees was due to an increase in the average servicing portfolio. The increase in expenses was principally the result of higher personnel and amortization and depreciation expenses. Personnel expense increased due to higher commission costs from the increased gains from mortgage banking activities, increased bonus expense due to our improved financial results year over year, higher salaries expense due to a rise in headcount, and larger stock compensation expense. Headcount increased due to acquisitions and hiring to support the growth of the Company. Amortization and depreciation expense increased as a result of a rise in the average MSR balance from 2015 to 2016.
43
Revenues
Gains from Mortgage Banking Activities. The following table provides additional information that helps explain changes in gains from mortgage banking activities over the past three years:
|
|
For the year ended December 31, |
|||||||
|
|
2016 |
|
2015 |
|
2014 |
|||
|
Loan Origination Volume by Product Type |
|
|
|
|
|
|
|
|
|
Fannie Mae |
42 |
% |
|
31 |
% |
|
35 |
% |
|
Freddie Mac |
25 |
% |
|
39 |
% |
|
32 |
% |
|
Ginnie Mae - HUD |
5 |
% |
|
4 |
% |
|
6 |
% |
|
Brokered |
25 |
% |
|
25 |
% |
|
24 |
% |
|
Interim Loans |
3 |
% |
|
1 |
% |
|
3 |
% |
|
|
100 |
% |
|
100 |
% |
|
100 |
% |
|
(dollars in thousands) |
|
|
|
|
|
|
|
|
|
Origination Fees |
$ |
174,360 |
|
$ |
156,835 |
|
$ |
125,468 |
|
Dollar Change |
|
17,525 |
|
|
31,367 |
|
|
|
|
Percentage Change |
|
11 |
% |
|
25 |
% |
|
|
|
MSR Income (1) |
$ |
192,825 |
|
$ |
133,631 |
|
$ |
96,515 |
|
Dollar Change |
|
59,194 |
|
|
37,116 |
|
|
|
|
Percentage Change |
|
44 |
% |
|
38 |
% |
|
|
|
Origination Fee Rate (2) (basis points) |
|
104 |
|
|
97 |
|
|
110 |
|
Basis Point Change |
|
7 |
|
|
(13) |
|
|
|
|
Percentage Change |
|
7 |
% |
|
(12) |
% |
|
|
|
MSR Rate (3) (basis points) |
|
115 |
|
|
82 |
|
|
85 |
|
Basis Point Change |
|
33 |
|
|
(3) |
|
|
|
|
Percentage Change |
|
40 |
% |
|
(4) |
% |
|
|
|
(1) |
The fair value of the expected net cash flows associated with the servicing of the loan, net of any guaranty obligations retained. |
|
(1) |
Origination fees as a percentage of loan origination volume. |
|
(1) |
MSR income as a percentage of loan origination volume. |
Gains from mortgage banking activities reflect the fair value of loan origination fees, the fair value of loan premiums, net of any co-broker fees, and the fair value of the expected net cash flows associated with the servicing of the loan, net of any guaranty obligations retained (“MSR income”). The increase was primarily the result of the mix of loan origination volume, as our two highest-margin products, Fannie Mae and HUD, represented 47% of our overall loan origination volume in 2016 compared to 35% in 2015. The change in mix of loan origination volume led to the increases in the origination fee rate and the MSR rate from 2015 to 2016 shown above, leading to increases in both origination fees and MSR income.
Servicing Fees. The increase was primarily attributable to an increase in the average servicing portfolio from 2015 to 2016 as shown below due to new loan originations, the Servicing Portfolio Acquisition, and relatively few payoffs. Additionally, the servicing portfolio’s weighted average servicing fee increased as shown below due to an increase in the Fannie Mae and HUD servicing portfolios.
|
(dollars in thousands) |
|
2016 |
|
|
2015 |
|
|
2014 |
|
Average Servicing Portfolio |
$ |
55,540,993 |
|
$ |
47,096,080 |
|
$ |
40,408,751 |
|
Dollar Change |
|
8,444,913 |
|
|
6,687,329 |
|
|
|
|
Percentage Change |
|
18 |
% |
|
17 |
% |
|
|
|
Average Servicing Fee (basis points) |
|
25.3 |
|
|
24.3 |
|
|
24.4 |
|
Basis Point Change |
|
1.0 |
|
|
(0.1) |
|
|
|
|
Percentage Change |
|
4 |
% |
|
0 |
% |
|
|
44
Net Warehouse Interest Income, Loans Held for Sale. The increase is primarily attributable to an increase in the average balance outstanding of loans held for sale (“LHFS”) in 2016 compared to 2015 as shown below, partially offset by the decrease in net spread as shown below. The increase in the average balance was due to an increase in the average holding period from 2015 to 2016. The decrease in the net spread was a result of a greater increase in the short-term interest rates on which our borrowings are based than in the long-term interest rates on which the majority of our loans held for sale are based.
|
(dollars in thousands) |
|
2016 |
|
|
2015 |
|
|
2014 |
|
Average LHFS Outstanding Balance |
$ |
1,342,928 |
|
$ |
1,149,679 |
|
$ |
650,513 |
|
Dollar Change |
|
193,249 |
|
|
499,166 |
|
|
|
|
Percentage Change |
|
17 |
% |
|
77 |
% |
|
|
|
LHFS Net Spread (basis points) |
|
121 |
|
|
126 |
|
|
174 |
|
Basis Point Change |
|
(5) |
|
|
(48) |
|
|
|
|
Percentage Change |
|
(4) |
% |
|
(28) |
% |
|
|
Net Warehouse Interest Income, Loans Held for Investment. The decrease was primarily due to a decrease in the average balance outstanding of loans held for investment (“LHFI”) from 2015 to 2016 as shown below. The decrease in the average balance outstanding was a result of an increase in payoffs from year to year.
|
(dollars in thousands) |
|
2016 |
|
|
2015 |
|
|
2014 |
|
Average LHFI Outstanding Balance |
$ |
224,237 |
|
$ |
281,584 |
|
$ |
188,867 |
|
Dollar Change |
|
(57,347) |
|
|
92,717 |
|
|
|
|
Percentage Change |
|
(20) |
% |
|
49 |
% |
|
|
|
LHFI Net Spread (basis points) |
|
334 |
|
|
335 |
|
|
326 |
|
Basis Point Change |
|
(1) |
|
|
9 |
|
|
|
|
Percentage Change |
|
0 |
% |
|
3 |
% |
|
|
Escrow Earnings and Other Interest Income. The increase was due to increases in both the average balance of escrow accounts and the average earnings rate from 2015 to 2016. The increase in the average balance was due to the increase in the average servicing portfolio, particularly the significant increase in the average balance of the HUD servicing portfolio as HUD loans have the highest escrow balances of all of our products. The increase in the average earnings rate was due to the increase in short-term interest rates during 2016.
Expenses
Personnel. The increase was principally the result of higher loan originator commission costs, increased bonus expense, increased salaries expense, and an increase in stock compensation expense. Commission costs increased due to the increase in origination fee income and a larger concentration of origination fees earned by our top loan originators. The percentage of origination fee income a loan originator earns as a commission increases as that loan originator achieves certain thresholds. Bonus expense increased due to our improved financial results year over year. Salaries expense increased due to a rise in average headcount from 483 in 2015 to 519 in 2016 as a result of acquisitions and organic growth of the Company. The increase in stock compensation expense is largely related to a performance stock compensation plan that began in 2016 and increased expense related to an award granted to a large base of employees at the end of 2015.
Amortization and Depreciation. The increase was primarily attributable to loan origination activity and the resulting growth in the MSR balance from 2015 to 2016, partially offset by decreased write-offs of MSRs of $3.2 million from the prior year as fewer borrowers elected to refinance their loans early or sell the underlying properties in 2016 than in 2015.
Other Operating Expenses. The increase was primarily attributable to increases in travel and entertainment expenses and office expenses. These expenses increased as a result of the aforementioned increase in average headcount.
Income Tax Expense. The increase in income tax expense was primarily due to the increase in income from operations, partially offset by a reduction to income tax expense in 2016 of $0.6 million related to excess tax benefits from stock
45
compensation. As mentioned previously, excess tax benefits reduced income tax expense in 2016 but not 2015 due to a new accounting standard that we adopted in 2016.
Non-GAAP Financial Measures
To supplement our financial statements presented in accordance with GAAP, we use adjusted EBITDA, a non-GAAP financial measure. The presentation of adjusted EBITDA is not intended to be considered in isolation or as a substitute for, or superior to, the financial information prepared and presented in accordance with GAAP. When analyzing our operating performance, readers should use adjusted EBITDA in addition to, and not as an alternative for, net income. Adjusted EBITDA represents net income before income taxes, interest expense on our term loan facility, and amortization and depreciation, adjusted for provision (benefit) for credit losses net of write-offs, stock-based incentive compensation charges, and non-cash revenues such as gains attributable to MSRs. Because not all companies use identical calculations, our presentation of adjusted EBITDA may not be comparable to similarly titled measures of other companies. Furthermore, adjusted EBITDA is not intended to be a measure of free cash flow for our management’s discretionary use, as it does not reflect certain cash requirements such as tax and debt service payments. The amounts shown for adjusted EBITDA may also differ from the amounts calculated under similarly titled definitions in our debt instruments, which are further adjusted to reflect certain other cash and non-cash charges that are used to determine compliance with financial covenants.
We use adjusted EBITDA to evaluate the operating performance of our business, for comparison with forecasts and strategic plans, and for benchmarking performance externally against competitors. We believe that this non-GAAP measure, when read in conjunction with our GAAP financials, provides useful information to investors by offering:
|
· |
the ability to make more meaningful period-to-period comparisons of our on-going operating results; |
|
· |
the ability to better identify trends in our underlying business and perform related trend analyses; and |
|
· |
a better understanding of how management plans and measures our underlying business. |
We believe that adjusted EBITDA has limitations in that it does not reflect all of the amounts associated with our results of operations as determined in accordance with GAAP and that adjusted EBITDA should only be used to evaluate our results of operations in conjunction with net income.
Adjusted EBITDA is calculated as follows:
ADJUSTED FINANCIAL METRIC RECONCILIATION TO GAAP
|
|
|
For the year ended December 31, |
|
|||||||
|
(in thousands) |
|
2017 |
|
2016 |
|
2015 |
|
|||
|
Reconciliation of Walker & Dunlop Net Income to Adjusted EBITDA |
|
|||||||||
|
Walker & Dunlop Net Income |
|
$ |
211,127 |
|
$ |
113,897 |
|
$ |
82,128 |
|
|
Income tax expense |
|
|
21,827 |
|
|
71,470 |
|
|
52,771 |
|
|
Interest expense on corporate debt |
|
|
9,745 |
|
|
9,851 |
|
|
9,918 |
|
|
Amortization and depreciation |
|
|
131,246 |
|
|
111,427 |
|
|
98,173 |
|
|
Provision (benefit) for credit losses |
|
|
(243) |
|
|
(612) |
|
|
1,644 |
|
|
Net write-offs |
|
|
— |
|
|
(1,757) |
|
|
(808) |
|
|
Stock compensation expense |
|
|
21,134 |
|
|
18,477 |
|
|
14,084 |
|
|
Gains attributable to mortgage servicing rights (1) |
|
|
(193,886) |
|
|
(192,825) |
|
|
(133,631) |
|
|
Adjusted EBITDA |
|
$ |
200,950 |
|
$ |
129,928 |
|
$ |
124,279 |
|
|
|
|
|
|
|
|
|
|
|
|
|
|
(1) |
Represents the fair value of the expected net cash flows from servicing recognized at commitment, net of the expected guaranty obligation. |
46
Year Ended December 31, 2017 Compared to Year Ended December 31, 2016
The following table presents a period-to-period comparison of our adjusted EBITDA for the years ended December 31, 2017 and 2016:
ADJUSTED EBITDA – 2017 COMPARED TO 2016
|
|
For the year ended |
|
|
|
|
|
|
||||
|
|
December 31, |
|
Dollar |
|
Percentage |
|
|||||
|
(dollars in thousands) |
2017 |
|
2016 |
|
Change |
|
Change |
|
|||
|
Origination fees |
$ |
245,484 |
|
$ |
174,360 |
|
$ |
71,124 |
|
41 |
% |
|
Servicing fees |
|
176,352 |
|
|
140,924 |
|
|
35,428 |
|
25 |
|
|
Net warehouse interest income |
|
24,467 |
|
|
23,727 |
|
|
740 |
|
3 |
|
|
Escrow earnings and other interest income |
|
20,396 |
|
|
9,168 |
|
|
11,228 |
|
122 |
|
|
Other revenues |
|
50,565 |
|
|
33,858 |
|
|
16,707 |
|
49 |
|
|
Personnel |
|
(268,143) |
|
|
(209,014) |
|
|
(59,129) |
|
28 |
|
|
Net write-offs |
|
— |
|
|
(1,757) |
|
|
1,757 |
|
(100) |
|
|
Other operating expenses |
|
(48,171) |
|
|
(41,338) |
|
|
(6,833) |
|
17 |
|
|
Adjusted EBITDA |
$ |
200,950 |
|
$ |
129,928 |
|
$ |
71,022 |
|
55 |
|
|
|
|
|
|
|
|
|
|
|
|
|
|
See the table above for the components of the change in adjusted EBITDA. The increase in origination fees was largely attributable to the 49% increase in loan origination volume year over year. Servicing fees increased principally due to an increase in the average servicing portfolio from 2016 to 2017 primarily as a result of record new loan originations and relatively few payoffs. Escrow earnings and other interest income increased largely due to a rise in the average outstanding balances of escrow accounts and an increase in the average earnings rate from 2016 to 2017. Other revenues increased due to increases in investment sales broker fees, preferred equity investment income, prepayment fees, and assumption fees. The increase in personnel expense was principally the result of higher loan originator commission costs due to the increase in origination fees and increased salaries expense due to an increase in average headcount. The increase in other operating expenses was largely due to an increase in office expenses due to the increase in average headcount year over year.
Year Ended December 31, 2016 Compared to Year Ended December 31, 2015
The following table presents a period-to-period comparison of our adjusted EBITDA for the years ended December 31, 2016 and 2015:
ADJUSTED EBITDA – 2016 COMPARED TO 2015
|
|
|
|
|
|
|
|
|
|
|
|
|
|
|
|
|
For the year ended |
|
|
|
|
|
|
||||
|
|
|
December 31, |
|
Dollar |
|
Percentage |
|
|||||
|
(dollars in thousands) |
|
2016 |
|
2015 |
|
Change |
|
Change |
|
|||
|
Origination fees |
|
$ |
174,360 |
|
$ |
156,835 |
|
$ |
17,525 |
|
11 |
% |
|
Servicing fees |
|
|
140,924 |
|
|
114,757 |
|
|
26,167 |
|
23 |
% |
|
Net warehouse interest income |
|
|
23,727 |
|
|
23,960 |
|
|
(233) |
|
(1) |
% |
|
Escrow earnings and other interest income |
|
|
9,168 |
|
|
4,473 |
|
|
4,695 |
|
105 |
% |
|
Other revenues |
|
|
33,858 |
|
|
34,075 |
|
|
(217) |
|
(1) |
% |
|
Personnel |
|
|
(209,014) |
|
|
(170,506) |
|
|
(38,508) |
|
23 |
% |
|
Net write-offs |
|
|
(1,757) |
|
|
(808) |
|
|
(949) |
|
117 |
% |
|
Other operating expenses |
|
|
(41,338) |
|
|
(38,507) |
|
|
(2,831) |
|
7 |
% |
|
Adjusted EBITDA |
|
$ |
129,928 |
|
$ |
124,279 |
|
$ |
5,649 |
|
5 |
% |
See the table above for the components of the change in adjusted EBITDA. The increase in loan origination fees was largely the result of increases in loan origination volume of our two highest-margin products, Fannie Mae and HUD.
47
Servicing fees increased principally due to an increase in the average servicing portfolio from 2015 to 2016 as a result of new loan originations, the Servicing Portfolio Acquisition, and relatively few payoffs. Escrow earnings and other interest income increased largely due to a rise in the average outstanding balances of escrow accounts and an increase in the average earnings rate from 2015 to 2016. The increase in personnel expense was principally the result of higher loan originator commission costs due to the increase in origination fees and a higher concentration of origination fees coming from the top loan originators from 2015 to 2016, increased bonus expense due to our improved financial results year over year, and increased salaries expense due to an increase in average headcount. Other operating expenses increased primarily as a result of increases in travel and entertainment expense and office expenses due to the increase in average headcount.
Cash Flows from Operating Activities
Our cash flows from operations are generated from loan sales, servicing fees, escrow earnings, net warehouse interest income and other income, net of loan originations and operating costs. Our cash flows from operations are impacted by the fees generated by our loan originations, the timing of loan closings, and the period of time loans are held for sale in the warehouse loan facility prior to delivery to the investor.
Cash Flow from Investing Activities
We usually lease facilities and equipment for our operations. However, when necessary and cost effective, we invest cash in property, plant, and equipment. Our cash flows from investing activities also include the funding and repayment of loans held for investment and the funding of preferred equity investments. We opportunistically invest cash for acquisitions and MSR portfolio purchases.
Cash Flow from Financing Activities
We use our warehouse loan facilities and, when necessary, our corporate cash to fund loan closings. We believe that our current warehouse loan facilities are adequate to meet our increasing loan origination needs. Historically, we have used a combination of long-term debt and cash flows from operations to fund acquisitions, repurchase shares, and fund a portion of loans held for investment.
Prior to 2018, we had never paid a dividend. However, on February 6, 2018, our Board of Directors declared a dividend of $0.25 per share for the first quarter of 2018. We expect to continue to make regular quarterly dividend payments for the foreseeable future.
48
Year Ended December 31, 2017 Compared to Year Ended December 31, 2016
The following table presents a period-to-period comparison of the significant components of cash flows for the years ended December 31, 2017 and 2016.
SIGNIFICANT COMPONENTS OF CASH FLOWS – 2017 COMPARED TO 2016
|
|
|
For the year ended December 31, |
|
Dollar |
|
Percentage |
|
|||||
|
(dollars in thousands) |
|
2017 |
|
2016 |
|
Change |
|
Change |
|
|||
|
Net cash provided by (used in) operating activities |
|
$ |
1,067,642 |
|
$ |
759,366 |
|
$ |
308,276 |
|
41 |
% |
|
Net cash provided by (used in) investing activities |
|
|
104,136 |
|
|
(66,761) |
|
|
170,897 |
|
(256) |
|
|
Net cash provided by (used in) financing activities |
|
|
(1,089,491) |
|
|
(693,622) |
|
|
(395,869) |
|
57 |
|
|
Total of cash, cash equivalents, restricted cash, and restricted cash equivalents at end of period (“Total Cash”) |
|
|
295,754 |
|
|
213,467 |
|
|
82,287 |
|
39 |
|
|
|
|
|
|
|
|
|
|
|
|
|
|
|
|
Cash flows from operating activities |
|
|
|
|
|
|
|
|
|
|
|
|
|
Net receipt (use) of cash for loan origination activity |
|
$ |
919,491 |
|
$ |
656,650 |
|
$ |
262,841 |
|
40 |
% |
|
Net cash provided by (used in) operating activities, excluding loan origination activity |
|
|
148,151 |
|
|
102,716 |
|
|
45,435 |
|
44 |
|
|
|
|
|
|
|
|
|
|
|
|
|
|
|
|
Cash flows from investing activities |
|
|
|
|
|
|
|
|
|
|
|
|
|
Funding of preferred equity investments |
|
$ |
(16,884) |
|
$ |
(24,835) |
|
$ |
7,951 |
|
(32) |
% |
|
Capital invested in Interim Program JV |
|
|
(6,342) |
|
|
— |
|
|
(6,342) |
|
N/A |
|
|
Acquisitions, net of cash received |
|
|
(15,000) |
|
|
(6,350) |
|
|
(8,650) |
|
136 |
|
|
Purchase of mortgage servicing rights |
|
|
(7,781) |
|
|
(43,097) |
|
|
35,316 |
|
(82) |
|
|
|
|
|
|
|
|
|
|
|
|
|
|
|
|
Originations of loans held for investment |
|
|
(183,916) |
|
|
(414,763) |
|
|
230,847 |
|
(56) |
|
|
Total principal collected on loans held for investment |
|
|
339,266 |
|
|
425,820 |
|
|
(86,554) |
|
(20) |
|
|
Net payoff of (investment in) loans held for investment |
|
$ |
155,350 |
|
$ |
11,057 |
|
$ |
144,293 |
|
1,305 |
% |
|
|
|
|
|
|
|
|
|
|
|
|
|
|
|
Cash flows from financing activities |
|
|
|
|
|
|
|
|
|
|
|
|
|
Borrowings (repayments) of warehouse notes payable, net |
|
$ |
(955,040) |
|
$ |
(649,845) |
|
$ |
(305,195) |
|
47 |
% |
|
Borrowings of interim warehouse notes payable |
|
|
140,341 |
|
|
325,828 |
|
|
(185,487) |
|
(57) |
|
|
Repayments of interim warehouse notes payable |
|
|
(237,912) |
|
|
(355,738) |
|
|
117,826 |
|
(33) |
|
|
Repurchase of common stock |
|
|
(34,899) |
|
|
(12,893) |
|
|
(22,006) |
|
171 |
|
The increase of $82.3 million in the Total Cash balance from December 31, 2016 to December 31, 2017 is primarily the result of cash earnings of $148.6 million and the return of cash invested in loans held for investment totaling $57.8 million as a result of the formation of the Interim Program JV in the third quarter of 2017. These increases were partially offset by (i) $51.2 million of investments for acquisitions, funding of preferred equity investments, the purchase of a servicing portfolio, capital expenditures, and capital invested in the Interim Program JV, and (ii) $34.9 million of cash used to repurchase shares of our own stock.
Changes in cash flows from operations were driven primarily by loans acquired and sold. Such loans are held for short periods of time, generally less than 60 days, and impact cash flows presented as of a point in time. The increase in cash flows from operations year over year is primarily attributable to the net receipt of $0.9 billion for the funding of loan originations, net of sales of loans to third parties during 2017 compared to the net receipt of $0.7 billion during 2016. Excluding cash used for the origination and sale of loans, cash flows provided by operations was $148.2 million during 2017 compared to $102.7 million during 2016. The significant components of the change included a $97.5 million increase in net income before noncontrolling interests and an increase of $19.8 million in the adjustment to net income for amortization and depreciation, partially offset by a $68.6 million decrease in deferred tax expense (a non-cash adjustment) due to Tax Reform. For 2016, deferred tax expense was $37.6 million compared to a benefit of $31.0 million for 2017.
49
The increase in cash provided by (used in) investing activities is primarily attributable to an increase in the net payoff of loans held for investment and decreases in cash used for the purchase of mortgage servicing rights and to fund preferred equity investments, partially offset by increases in net cash used for acquisitions and cash used to invest in the Interim Program JV. The net payoff of loans held for investment during 2017 was $155.4 million compared to net payoff of loans held for investment of $11.1 million during 2016. Of the $155.4 million of the net payoff of loans held for investment during 2017, $97.6 million was funded using interim warehouse borrowings (included in cash flows from financing activities), with the other $57.8 million funded using corporate cash. Of the $11.1 million of the net payoff of loans held for investment during 2016, $29.9 million was funded using interim warehouse borrowings, requiring an additional $18.8 million of corporate cash. The decrease in cash paid for mortgage servicing rights was due to the substantially smaller size of the servicing portfolio purchased in 2017. The decrease in cash used to fund preferred equity investments was due to the committed funding amount nearing its cap in 2017. Net cash paid for acquisitions increased due to an increase in the size of acquisitions year over year. Cash paid to invest in the Interim Program JV increased as the Interim Program JV began operations in the third quarter of 2017.
The substantial change in cash provided by (used in) financing activities was primarily attributable to the significant change in net warehouse borrowings period to period and increases in net repayments of interim warehouse notes payable and cash used to repurchase and retire shares of our common stock. The change in net borrowings (repayments) of warehouse borrowings during 2017 was due to a large increase in the unpaid principal balance of loans held for sale funded by Agency Warehouse Facilities (as defined below) from December 31, 2016 to December 31, 2017. During 2017, the unpaid principal balance of loans held for sale funded by Agency Warehouse Facilities decreased $919.5 million from their December 31, 2016 balance compared to a decrease of $627.0 million during the same period in 2016. The change in net borrowings of interim warehouse notes payable was principally due to a decrease in originations of loans held for investment and an increase in payoffs of loans held for investment year over year. Both the decrease in originations and increase in payoffs of loans held for investment were due to the formation of the Interim Program JV in the third quarter of 2017. The increase in share repurchase activity was principally related to an increase in the repurchase of shares to settle employee tax obligations for restricted and performance-based share awards along with a substantial increase in the fair value of the Company’s stock, which increased the taxable compensation to employees upon vesting. No performance-based awards vested during 2016 compared to 0.6 million shares during 2017. Additionally, we repurchased 0.3 million shares of our own stock under a repurchase program as more fully discussed below in the “Uses of Liquidity, Cash and Cash Equivalents” section.
Year Ended December 31, 2016 compared to Year Ended December 31, 2015
The following table presents a period-to-period comparison of the significant components of cash flows for the years ended December 31, 2016 and 2015. Certain prior-year balances have been adjusted for the adoption of a new accounting standard relating to the presentation of cash flows associated with restricted cash and restricted cash equivalents as more fully described in NOTE 2 of the consolidated financial statements in the Annual Report on Form 10-K for the year ended December 31, 2016.
50
SIGNIFICANT COMPONENTS OF CASH FLOWS – 2016 COMPARED TO 2015
|
|
|
Year Ended December 31, |
|
Dollar |
|
Percentage |
|
|||||
|
(dollars in thousands) |
|
2016 |
|
2015 |
|
Change |
|
Change |
|
|||
|
Net cash provided by (used in) operating activities |
|
$ |
759,366 |
|
$ |
(1,338,715) |
|
$ |
2,098,081 |
|
(157) |
% |
|
Net cash provided by (used in) investing activities |
|
|
(66,761) |
|
|
(27,232) |
|
|
(39,529) |
|
145 |
|
|
Net cash provided by (used in) financing activities |
|
|
(693,622) |
|
|
1,385,504 |
|
|
(2,079,126) |
|
(150) |
|
|
Total of cash, cash equivalents, restricted cash, and restricted cash equivalents at end of period |
|
|
213,467 |
|
|
214,484 |
|
|
(1,017) |
|
0 |
|
|
|
|
|
|
|
|
|
|
|
|
|
|
|
|
Cash flows from operating activities |
|
|
|
|
|
|
|
|
|
|
|
|
|
Net receipt (use) of cash for loan origination activity |
|
$ |
656,650 |
|
$ |
(1,423,197) |
|
$ |
2,079,847 |
|
(146) |
% |
|
Net cash provided by (used in) operating activities, excluding loan origination activity |
|
|
102,716 |
|
|
84,482 |
|
|
18,234 |
|
22 |
|
|
|
|
|
|
|
|
|
|
|
|
|
|
|
|
Cash flows from investing activities |
|
|
|
|
|
|
|
|
|
|
|
|
|
Acquisitions, net of cash received |
|
$ |
(6,350) |
|
$ |
(12,767) |
|
$ |
6,417 |
|
(50) |
% |
|
Purchase of mortgage servicing rights |
|
|
(43,097) |
|
|
— |
|
|
(43,097) |
|
N/A |
|
|
Funding of preferred equity investments |
|
|
(24,835) |
|
|
— |
|
|
(24,835) |
|
N/A |
|
|
|
|
|
|
|
|
|
|
|
|
|
|
|
|
Originations of loans held for investment |
|
$ |
(414,763) |
|
$ |
(180,375) |
|
$ |
(234,388) |
|
130 |
|
|
Principal collected on loans held for investment |
|
|
425,820 |
|
|
172,323 |
|
|
253,497 |
|
147 |
|
|
Net payoff of (investment in) loans held for investment |
|
$ |
11,057 |
|
$ |
(8,052) |
|
$ |
19,109 |
|
(237) |
% |
|
|
|
|
|
|
|
|
|
|
|
|
|
|
|
Cash flows from financing activities |
|
|
|
|
|
|
|
|
|
|
|
|
|
Borrowings (repayments) of warehouse notes payable, net |
|
$ |
(649,845) |
|
$ |
1,423,911 |
|
$ |
(2,073,756) |
|
(146) |
% |
|
Borrowings of interim warehouse notes payable |
|
|
325,828 |
|
|
137,397 |
|
|
188,431 |
|
137 |
|
|
Repayments of interim warehouse notes payable |
|
|
(355,738) |
|
|
(125,542) |
|
|
(230,196) |
|
183 |
|
|
Repurchase of common stock |
|
|
(12,893) |
|
|
(50,261) |
|
|
37,368 |
|
(74) |
|
The decrease of $18.2 million in the unrestricted cash balance from December 31, 2015 to December 31, 2016 is primarily the result of $6.4 million of net cash used for acquisitions, $17.2 million used to fund restricted cash and pledged securities, $24.8 million used to fund preferred equity investments, $43.1 million used to purchase MSRs, and $12.9 million of cash used to repurchase shares of our own stock, partially offset by cash earnings.
Changes in cash flows from operations were driven primarily by loans acquired and sold. Such loans are held for short periods of time, generally less than 60 days, and impact cash flows presented as of a point in time. The increase in cash flows from operations year over year is primarily attributable to the net receipt of $0.7 billion for the funding of loan originations, net of sales of loans to third parties during 2016 compared to net use of $1.4 billion during 2015. Excluding cash used for the origination and sale of loans, cash flows provided by operations was $102.7 million during 2016 compared to $84.5 million during 2015. The significant components of the change included a $31.7 million increase in net income before noncontrolling interests, a $20.7 million increase in deferred tax expense (a non-cash expense), a $13.3 million increase in amortization and depreciation (a non-cash expense), and a $13.9 million benefit from the changes in performance deposits from borrowers, partially offset by a greater reduction to net income related to gains attributable to future servicing rights of $59.2 million.
The increase in cash used in investing activities is primarily attributable to net cash paid to purchase mortgage servicing rights of $43.1 million in 2016.
The substantial change in cash provided by (used in) financing activities was primarily attributable to the significant change in net warehouse borrowings period to period and an increase in repayments of interim warehouse notes payable, partially offset by an increase in borrowings of interim warehouse notes payable and a decrease in cash used to repurchase and retire shares of our common stock. The substantial net repayment of warehouse borrowings during 2016 was due to a significant decrease in the unpaid principal balance of loans held for sale from December 31, 2015 to December 31, 2016, resulting in net repayments of warehouse borrowings during 2016. From December 31, 2014 to December 31, 2015, the
51
unpaid principal balance of loans held for sale increased substantially, resulting in a substantial amount of net warehouse borrowings in 2015. The change in net borrowings of interim warehouse notes payable was principally due to an increase in payoffs of loans held for investment, partially offset by an increase in originations of loans held for investment year over year. During 2015, our repurchases of common stock included a single transaction of a large block of our shares of common stock from our largest stockholder at the time. Our share repurchases during 2016 were in multiple transactions of smaller size.
Liquidity and Capital Resources
Uses of Liquidity, Cash and Cash Equivalents
Our significant recurring cash flow requirements consist of (i) short-term liquidity necessary to fund loans held for sale; (ii) liquidity necessary to fund loans held for investment under the Interim Program; (iii) working capital to support our day-to-day operations, including debt service payments, servicing advances consisting of principal and interest advances for Fannie Mae or HUD loans that become delinquent, advances on insurance and tax payments if the escrow funds are insufficient, and payments for salaries, commissions, and income taxes; (iv) working capital to satisfy collateral requirements for our Fannie Mae DUS risk-sharing obligations and to meet the operational liquidity requirements of Fannie Mae, Freddie Mac, HUD, Ginnie Mae, and our warehouse facility lenders; and (v) quarterly dividend payments as approved by our Board of Directors.
Fannie Mae has established benchmark standards for capital adequacy, and reserves the right to terminate our servicing authority for all or some of the portfolio if at any time it determines that our financial condition is not adequate to support our obligations under the DUS agreement. We are required to maintain acceptable net worth as defined in the standards, and we satisfied the requirements as of December 31, 2017. The net worth requirement is derived primarily from unpaid balances on Fannie Mae loans and the level of risk-sharing. At December 31, 2017, the net worth requirement was $155.8 million, and our net worth was $725.9 million, as measured at our wholly owned operating subsidiary, Walker & Dunlop, LLC. As of December 31, 2017, we were required to maintain at least $30.7 million of liquid assets to meet our operational liquidity requirements for Fannie Mae, Freddie Mac, HUD, Ginnie Mae and our warehouse facility lenders. As of December 31, 2017, we had operational liquidity of $238.6 million, as measured at our wholly owned operating subsidiary, Walker & Dunlop, LLC.
As noted previously, under certain limited circumstances, we may make preferred equity investments in entities controlled by certain of our borrowers that will assist those borrowers to acquire and reposition properties. The terms of such investments are negotiated with each investment. As of December 31, 2017, we have funded $41.7 million of such investments. We expect these preferred equity investments to be repaid to us within the next two years.
We have historically retained all future earnings for the operation and expansion of our business and therefore did not pay cash dividends on our common stock. However, on February 6, 2018, our Board of Directors declared a dividend of $0.25 per share for the first quarter of 2018. We expect to continue to make regular quarterly dividend payments for the foreseeable future. Since the beginning of 2014, we have repurchased 5.5 million shares of our common stock from large stockholders for an aggregate cost of $82.3 million and invested $101.1 million of cash in acquisitions and the purchase of mortgage servicing rights. We continually seek opportunities to execute additional acquisitions and purchases of mortgage servicing rights and complete such acquisitions if the economics of such acquisitions are favorable. On occasion, we may use cash to fund Agency loans held for sale instead of using our warehouse lines. As of December 31, 2017, we used corporate cash to fund Agency loans held for sale with an unpaid principal balance of $39.0 million. During the first quarter of 2017, our Board of Directors authorized us to repurchase up to $75.0 million of our common stock over a 12-month period that ended on February 10, 2018. We repurchased 0.6 million shares of our stock under this program for an aggregate cost of $27.4 million during 2017 and the first quarter of 2018, bringing the two-year total of stock repurchases under such plans to 1.0 million shares for a cost of $36.5 million. In February 2018, our Board of Directors approved a new stock repurchase program that permits the repurchase of up to $50.0 million of shares of our common stock over a 12-month period beginning on February 9, 2018.
52
Historically, our cash flows from operations and warehouse facilities have been sufficient to enable us to meet our short-term liquidity needs and other funding requirements, including payments for income taxes. We believe that cash flows from operations will continue to be sufficient for us to meet our current obligations for the foreseeable future. Additionally, we do not expect to incur tax payments outside the normal course of business for the foreseeable future.
Restricted Cash and Pledged Securities
Restricted cash consists primarily of good faith deposits held on behalf of borrowers between the time we enter into a loan commitment with the borrower and the investor purchases the loan.
We are generally required to share the risk of any losses associated with loans sold under the Fannie Mae DUS program. We are required to secure this obligation by assigning collateral to Fannie Mae. We meet this obligation by assigning pledged securities to Fannie Mae. The amount of collateral required by Fannie Mae is a formulaic calculation at the loan level and considers the balance of the loan, the risk level of the loan, the age of the loan, and the level of risk-sharing. Fannie Mae requires collateral for Tier 2 loans of 75 basis points, which is funded over a 48-month period that begins upon delivery of the loan to Fannie Mae. Collateral held in the form of money market funds holding U.S. Treasuries is discounted 5% for purposes of calculating compliance with the collateral requirements. As of December 31, 2017, we held the majority of our restricted liquidity in money market funds holding U.S. Treasuries in the aggregate amount of $86.6 million. Additionally, substantially all of the loans for which we have risk sharing are Tier 2 loans. We fund any growth in our Fannie Mae required operational liquidity and collateral requirements from our working capital.
We are in compliance with the December 31, 2017 collateral requirements as outlined above. As of December 31, 2017, reserve requirements for the December 31, 2017 DUS loan portfolio will require us to fund $67.2 million in additional restricted liquidity over the next 48 months, assuming no further principal paydowns, prepayments, or defaults within our at risk portfolio. Fannie Mae periodically reassesses the DUS Capital Standards and may make changes to these standards in the future. We generate sufficient cash flow from our operations to meet these capital standards and do not expect any future changes to have a material impact on our future operations; however, any future changes to collateral requirements may adversely impact our available cash.
Under the provisions of the DUS agreement, we must also maintain a certain level of liquid assets referred to as the operational and unrestricted portions of the required reserves each year. We satisfied these requirements as of December 31, 2017.
53
Sources of Liquidity: Warehouse Facilities
The following table provides information related to our warehouse facilities as of December 31, 2017.
|
|
|
As of December 31, 2017 |
|
|
|||||||||||||
|
(dollars in thousands) |
|
Committed |
|
Uncommitted |
|
Temporary |
|
Total Facility |
|
Outstanding |
|
|
|||||
|
Facility |
|
Amount |
|
Amount |
|
Increase |
|
Capacity |
|
Balance |
|
Interest rate |
|||||
|
Agency Warehouse Facility #1 |
|
$ |
425,000 |
|
$ |
300,000 |
|
$ |
— |
|
$ |
725,000 |
|
$ |
100,188 |
|
30-day LIBOR plus 1.30% |
|
Agency Warehouse Facility #2 |
|
|
500,000 |
|
|
300,000 |
|
|
— |
|
|
800,000 |
|
|
346,291 |
|
30-day LIBOR plus 1.30% |
|
Agency Warehouse Facility #3 |
|
|
480,000 |
|
|
— |
|
|
400,000 |
|
|
880,000 |
|
|
44,619 |
|
30-day LIBOR plus 1.25% |
|
Agency Warehouse Facility #4 |
|
|
350,000 |
|
|
— |
|
|
— |
|
|
350,000 |
|
|
129,787 |
|
30-day LIBOR plus 1.30% |
|
Agency Warehouse Facility #5 |
|
|
30,000 |
|
|
— |
|
|
— |
|
|
30,000 |
|
|
19,057 |
|
30-day LIBOR plus 1.80% |
|
Agency Warehouse Facility #6 |
|
|
250,000 |
|
|
250,000 |
|
|
— |
|
|
500,000 |
|
|
130,859 |
|
30-day LIBOR plus 1.35% |
|
Fannie Mae repurchase agreement, uncommitted line and open maturity |
|
|
— |
|
|
1,500,000 |
|
|
— |
|
|
1,500,000 |
|
|
123,153 |
|
30-day LIBOR plus 1.15% |
|
Total Agency Warehouse Facilities |
|
$ |
2,035,000 |
|
$ |
2,350,000 |
|
$ |
400,000 |
|
$ |
4,785,000 |
|
$ |
893,954 |
|
|
|
|
|
|
|
|
|
|
|
|
|
|
|
|
|
|
|
|
|
|
Interim Warehouse Facility #1 |
|
$ |
85,000 |
|
$ |
— |
|
$ |
— |
|
$ |
85,000 |
|
$ |
10,290 |
|
30-day LIBOR plus 1.90% |
|
Interim Warehouse Facility #2 |
|
|
100,000 |
|
|
— |
|
|
— |
|
|
100,000 |
|
|
24,662 |
|
30-day LIBOR plus 2.00% |
|
Interim Warehouse Facility #3 |
|
|
75,000 |
|
|
— |
|
|
— |
|
|
75,000 |
|
|
10,594 |
|
30-day LIBOR plus 2.00% to 2.50% |
|
Total Interim Warehouse Facilities |
|
$ |
260,000 |
|
$ |
— |
|
$ |
— |
|
$ |
260,000 |
|
$ |
45,546 |
|
|
|
Total warehouse facilities |
|
$ |
2,295,000 |
|
$ |
2,350,000 |
|
$ |
400,000 |
|
$ |
5,045,000 |
|
$ |
939,500 |
|
|
|
|
|
|
|
|
|
|
|
|
|
|
|
|
|
|
|
|
|
Agency Warehouse Facilities
To provide financing to borrowers under the Agencies’ programs, we have seven warehouse credit facilities that we use to fund substantially all of our loan originations. As of December 31, 2017, we had six committed warehouse lines of credit in the aggregate amount of $3.3 billion with certain national banks and a $1.5 billion uncommitted facility with Fannie Mae (collectively, the “Agency Warehouse Facilities”). Consistent with industry practice, five of these facilities are revolving commitments we expect to renew annually, one is a revolving commitment we expect to renew every 18 months, and the other facility is provided on an uncommitted basis without a specific maturity date. Our ability to originate mortgage loans depends upon our ability to secure and maintain these types of short-term financing on acceptable terms.
Agency Warehouse Facility #1:
We have a warehousing credit and security agreement with a national bank for a $425.0 million committed warehouse line that is scheduled to mature on October 29, 2018. The agreement provides us with the ability to fund Fannie Mae, Freddie Mac, HUD, and FHA loans. Advances are made at 100% of the loan balance and borrowings under this line bear interest at the 30-day London Interbank Offered Rate (“LIBOR”) plus 130 basis points. In addition to the committed borrowing capacity, the agreement provides $300.0 million of uncommitted borrowing capacity that bears interest at the same rate as the committed facility. The agreement contains certain affirmative and negative covenants that are binding on the Company’s operating subsidiary, Walker & Dunlop, LLC (which are in some cases subject to exceptions), including, but not limited to, restrictions on its ability to assume, guarantee, or become contingently liable for the obligation of another person, to undertake certain fundamental changes such as reorganizations, mergers, amendments to the Company’s certificate of formation or operating agreement, liquidations, dissolutions or dispositions or acquisitions of assets or businesses, to cease to be directly or indirectly wholly owned by the Company, to pay any subordinated debt in advance of its stated maturity or to take any action that would cause Walker & Dunlop, LLC to lose all or any part of its status as an eligible lender, seller, servicer or issuer or any license or approval required for it to engage in the business of originating, acquiring, or servicing mortgage loans.
54
In addition, the agreement requires compliance with certain financial covenants, which are measured for the Company and its subsidiaries on a consolidated basis, as follows:
|
· |
tangible net worth of the Company of not less than (i) $200.0 million plus (ii) 75% of the net proceeds of any equity issuances by the Company or any of its subsidiaries after the closing date, |
|
· |
compliance with the applicable net worth and liquidity requirements of Fannie Mae, Freddie Mac, Ginnie Mae, FHA, and HUD, |
|
· |
liquid assets of the Company of not less than $15.0 million, |
|
· |
maintenance of aggregate unpaid principal amount of all mortgage loans comprising the Company’s consolidated servicing portfolio of not less than $20.0 billion or (ii) all Fannie Mae DUS mortgage loans comprising the Company’s consolidated servicing portfolio of not less than $10.0 billion, exclusive in both cases of mortgage loans which are 60 or more days past due or are otherwise in default or have been transferred to Fannie Mae for resolution, |
|
· |
aggregate unpaid principal amount of Fannie Mae DUS mortgage loans within the Company’s consolidated servicing portfolio which are 60 or more days past due or otherwise in default not to exceed 3.5% of the aggregate unpaid principal balance of all Fannie Mae DUS mortgage loans within the Company’s consolidated servicing portfolio, and |
|
· |
maximum indebtedness (excluding warehouse lines) to tangible net worth of 2.25 to 1.0. |
The agreement contains customary events of default, which are in some cases subject to certain exceptions, thresholds, notice requirements, and grace periods.
During the fourth quarter of 2017, the Company executed the Amended and Restated Warehousing Credit and Security Agreement that extended the maturity date to October 29, 2018, reduced the interest rate to 30-day LIBOR plus 130 basis points, and provides $300.0 million of uncommitted borrowing capacity that bears interest at the same rate as the committed facility. No other material modifications were made to the agreement during 2017.
Agency Warehouse Facility #2:
We have a warehousing credit and security agreement with a national bank for a $500.0 million committed warehouse line that is scheduled to mature on September 10, 2018. The committed warehouse facility provides the Company with the ability to fund Fannie Mae, Freddie Mac, HUD and FHA loans. Advances are made at 100% of the loan balance, and borrowings under this line bear interest at 30-day LIBOR plus 130 basis points. During the third quarter of 2017, we executed the Second Amended and Restated Warehousing Credit and Security Agreement (the “Second Amended Agreement”) related to Agency Warehouse Facility #2. The Second Amended Agreement removed one of the lenders under the prior agreement, which reduced the maximum committed borrowing capacity of Agency Warehouse Facility #2 to $500.0 million. It also extended the maturity date to September 10, 2018 and reduced the interest rate to 30-day LIBOR plus 130 basis points. In addition to the committed borrowing capacity, the Second Amended Agreement provides $300.0 million of uncommitted borrowing capacity that bears interest at the same rate as the committed facility. Concurrent with the execution of the Second Amended Agreement, we executed a new, separate warehousing credit agreement with one of the lenders under the prior facility, which is referred to as Agency Warehouse Facility #6 and is more fully described below. No other material modifications were made to the agreement during 2017.
The negative and financial covenants of the amended and restated warehouse agreement conform to those of the warehouse agreement for Agency Warehouse Facility #1, described above, with the exception of the leverage ratio covenant, which is not included in the warehouse agreement for Agency Warehouse Facility #2.
Agency Warehouse Facility #3:
We have an $880.0 million committed warehouse credit and security agreement with a national bank that is scheduled to mature on April 30, 2018. The total commitment amount of $880.0 million as of December 31, 2017 consists of a base committed amount of $480.0 million and a temporary increase of $400.0 million, as more fully described below. The
55
committed warehouse facility provides us with the ability to fund Fannie Mae, Freddie Mac, HUD, and FHA loans. Advances are made at 100% of the loan balance, and the borrowings under the warehouse agreement bear interest at a rate of LIBOR plus 125 basis points. During the second quarter of 2017, we executed the seventh amendment to the credit and security agreement. The amendment reduced the interest rate to 30-day LIBOR plus 125 basis points, extended the maturity date to April 30, 2018, and increased the permanent borrowing capacity to $480.0 million. Additionally, during the third quarter of 2017, we executed the eighth amendment to the credit and security agreement that provided for a temporary increase of $400.0 million to the maximum borrowing capacity that expired on January 30, 2018, at which time the maximum borrowing capacity returned to $480.0 million. No other material modifications were made to the agreement during 2017.
The negative and financial covenants of the warehouse agreement conform to those of the warehouse agreement for Agency Warehouse Facility #1, described above.
Agency Warehouse Facility #4:
We have a $350.0 million committed warehouse credit and security agreement with a national bank that is scheduled to mature on October 5, 2018. The committed warehouse facility provides us with the ability to fund Fannie Mae, Freddie Mac, HUD, and FHA loans. The borrowings under the warehouse agreement bear interest at a rate of 30-day LIBOR plus 130 basis points. During the fourth quarter of 2017, we executed the third amendment to the warehouse loan and security agreement that extended the maturity date of the facility to October 5, 2018 and reduced the interest rate to 30-day LIBOR plus 130 basis points. No other material modifications were made to the agreement during 2017.
The negative and financial covenants of the warehouse agreement conform to those of the warehouse agreement for Agency Warehouse Facility #1, described above, with the exception of the leverage ratio covenant, which is not included in the warehouse agreement for Agency Warehouse Facility #4.
Agency Warehouse Facility #5:
We have a $30.0 million committed warehouse credit and security agreement with a national bank that is scheduled to mature on July 12, 2019. The committed warehouse facility provides us with the ability to fund defaulted HUD and FHA loans. The borrowings under the warehouse agreement bear interest at a rate of 30-day LIBOR plus 180 basis points. No material modifications were made to the agreement in 2017. During the first quarter of 2018, the Company executed the first amendment to the warehouse credit and security agreement that extended the maturity date to July 12, 2019. The amendment also provides the Company the unilateral option to extend the agreement for one additional year.
The negative and financial covenants of the warehouse agreement conform to those of the warehouse agreement for Agency Warehouse Facility #1, described above, with the exception of the leverage ratio covenant, which is not included in the warehouse agreement for Agency Warehouse Facility #5.
Agency Warehouse Facility #6
During the third quarter of 2017, we executed a warehousing and security agreement that established Agency Warehouse Facility #6. The warehouse facility has a $250.0 million maximum committed borrowing capacity, provides us with the ability to fund Fannie Mae, Freddie Mac, HUD, and FHA loans, and matures September 18, 2018. The borrowings under the warehouse agreement bear interest at a rate of 30-day LIBOR plus 135 basis points. In addition to the committed borrowing capacity, the agreement provides $250.0 million of uncommitted borrowing capacity that bears interest at the same rate as the committed facility.
56
The negative and financial covenants of the warehouse agreement conform to those of the warehouse agreement for Agency Warehouse Facility #1, described above, with the exception of the leverage ratio covenant, which is not included in the warehouse agreement for Agency Warehouse Facility #6.
Uncommitted Agency Warehouse Facility:
We have a $1.5 billion uncommitted facility with Fannie Mae under its ASAP funding program. After approval of certain loan documents, Fannie Mae will fund loans after closing and the advances are used to repay the primary warehouse line. Fannie Mae will advance 99% of the loan balance, and borrowings under this program bear interest at LIBOR plus 115 basis points, with a minimum LIBOR rate of 35 basis points. There is no expiration date for this facility. No changes have been made to the uncommitted facility during 2017. The uncommitted facility has no specific negative or financial covenants.
Interim Warehouse Facilities
To assist in funding loans held for investment under the Interim Program, we have three warehouse facilities with certain national banks in the aggregate amount of $0.3 billion as of December 31, 2017 (“Interim Warehouse Facilities”). Consistent with industry practice, two of these facilities are revolving commitments we expect to renew annually, and one is a revolving commitment we expect to renew every two years. Our ability to originate loans held for investment depends upon our ability to secure and maintain these types of short-term financings on acceptable terms.
Interim Warehouse Facility #1:
We have an $85.0 million committed warehouse line agreement that is scheduled to mature on April 30, 2018. The facility provides us with the ability to fund first mortgage loans on multifamily real estate properties for periods of up to three years, using available cash in combination with advances under the facility. Borrowings under the facility are full recourse to the Company and bear interest at 30-day LIBOR plus 190 basis points. Repayments under the credit agreement are interest-only, with principal repayments made upon the earlier of the refinancing of an underlying mortgage or the maturity of an advance under the credit agreement. During the second quarter of 2017, we executed the seventh amendment to the credit and security agreement that extended the maturity date to April 30, 2018. No other material modifications were made to the agreement during 2017.
The facility agreement requires the Company’s compliance with the same financial covenants as Agency Warehouse Facility #1, described above, and also includes the following additional financial covenant:
|
· |
minimum rolling four-quarter EBITDA, as defined, to total debt service ratio of 2.00 to 1.0 |
Interim Warehouse Facility #2:
We have a $100.0 million committed warehouse line agreement that is scheduled to mature on December 13, 2019. The agreement provides us with the ability to fund first mortgage loans on multifamily real estate properties for periods of up to three years, using available cash in combination with advances under the facility. Borrowings under the facility are full recourse to the Company. All borrowings originally bear interest at LIBOR plus 200 basis points. The lender retains a first priority security interest in all mortgages funded by such advances on a cross-collateralized basis. Repayments under the credit agreement are interest-only, with principal repayments made upon the earlier of the refinancing of an underlying mortgage or the maturity of an advance under the credit agreement. During the fourth quarter of 2017, the Company executed the fourth amendment to the agreement that extended the maturity date to December 13, 2019 and reduced the maximum borrowing capacity to $100.0 million. The Company requested the reduction in the maximum borrowing capacity due to the formation of the Interim Program JV, which reduced the Company’s need to fund loans under the Interim Program. No other material modifications were made to the agreement during 2017.
The credit agreement, as amended and restated, requires the borrower and the Company to abide by the same financial covenants as Agency Warehouse Facility #1, described above, with the exception of the leverage ratio covenant, which
57
is not included in the warehouse agreement for Interim Warehouse Facility #2. Additionally, Interim Warehouse Facility #2 has the following additional financial covenants:
|
· |
rolling four-quarter EBITDA, as defined, of not less than $35 million, and |
|
· |
debt service coverage ratio, as defined, of not less than 2.75 to 1.0 |
Interim Warehouse Facility #3:
We have a $75.0 million repurchase agreement with a national bank that is scheduled to mature on May 19, 2018. The agreement provides us with the ability to fund first mortgage loans on multifamily real estate properties for periods of up to three years, using available cash in combination with advances under the facility. Borrowings under the facility are full recourse to the Company. The borrowings under the agreement bear interest at a rate of LIBOR plus 2.00% to 2.50% (“the spread”). The spread varies according to the type of asset the borrowing finances. Repayments under the credit agreement are interest-only, with principal repayments made upon the earlier of the refinancing of an underlying mortgage or the maturity of an advance under the credit agreement. During the second quarter of 2017, we exercised our option to extend the maturity date of the repurchase agreement to May 19, 2018. No other material modifications were made to the agreement during 2017.
The Repurchase Agreement requires the borrower and the Company to abide by the following financial covenants:
|
· |
tangible net worth of the Company of not less than (i) $200.0 million plus (ii) 75% of the net proceeds of any equity issuances by the Company or any of its subsidiaries after the closing date, |
|
· |
liquid assets of the Company of not less than $15.0 million, |
|
· |
leverage ratio, as defined, of not more than 3.0 to 1.0, and |
|
· |
debt service coverage ratio, as defined, of not less than 2.75 to 1.0. |
The warehouse agreements above contain cross-default provisions, such that if a default occurs under any of our warehouse agreements, generally the lenders under our other warehouse agreements could also declare a default. As of December 31, 2017, we were in compliance with all of our warehouse line covenants.
We believe that the combination of our capital and warehouse facilities is adequate to meet our loan origination needs.
Debt Obligations
We have a senior secured term loan credit agreement (the “Term Loan Agreement”). The Term Loan Agreement provides for a $175.0 million term loan that was issued at a discount of 1.0% (the “Term Loan”). At any time, we may also elect to request the establishment of one or more incremental term loan commitments to make up to three additional term loans (any such additional term loan, an “Incremental Term Loan”) in an aggregate principal amount for all such Incremental Term Loans not to exceed $60.0 million.
The Term Loan requires mandatory prepayments in certain circumstances pursuant to the terms of the Term Loan Agreement. In April of 2015, we made a mandatory prepayment of $3.6 million. In connection with the mandatory prepayment, our quarterly principal installments were reduced to $0.3 million from $0.4 million, beginning with the June 30, 2015 principal payment. The final principal installment of the Term Loan is required to be paid in full on December 20, 2020 (or, if earlier, the date of acceleration of the Term Loan pursuant to the terms of the Term Loan Agreement) and will be in an amount equal to the aggregate outstanding principal of the Term Loan on such date (together with all accrued interest thereon).
At our election, the Term Loan will bear interest at either (i) the “Base Rate” plus an applicable margin or (ii) the London Interbank Offered Rate (“LIBOR Rate”) plus an applicable margin, subject to adjustment if an event of default
58
under the Term Loan Agreement has occurred and is continuing with a minimum LIBOR Rate of 1.0%. The “Base Rate” means the highest of (a) the administrative agent’s “prime rate,” (b) the federal funds rate plus 0.50% and (c) LIBOR for an interest period of one month plus 1%. During the fourth quarter of 2017, the Company executed the second amendment to the Term Loan Agreement that reduced the applicable margin from 4.25% to 3.00% for LIBOR Rate loans and from 3.25% to 2.00% for Base Rate loans as of December 31, 2017.
Our obligations under the Term Loan Agreement are guaranteed by Walker & Dunlop Multifamily, Inc., Walker & Dunlop, LLC, Walker & Dunlop Capital, LLC, and W&D BE, Inc., each of which is a direct or indirect wholly owned subsidiary of the Company (together with the Company, the “Loan Parties”), pursuant to a Guarantee and Collateral Agreement entered into on December 20, 2013 among the Loan Parties and the Agent.
The Term Loan Agreement contains certain affirmative and negative covenants that are binding on the Loan Parties, including, but not limited to, restrictions (subject to specified exceptions and qualifications) on the ability of the Loan Parties to incur indebtedness, to create liens on their property, to make investments, to merge, consolidate or enter into any similar combination, or enter into any asset disposition of all or substantially all assets, or liquidate, wind-up or dissolve, to make asset dispositions, to declare or pay dividends or make related distributions, to enter into certain transactions with affiliates, to enter into any negative pledges or other restrictive agreements, to engage in any business other than the business of the Loan Parties as of the date of the Term Loan Agreement and business activities reasonably related or ancillary thereto, to amend certain material contracts or to enter into any sale leaseback arrangements.
In addition, the Term Loan Agreement requires us to abide by certain financial covenants calculated for us and our subsidiaries on a consolidated basis as follows:
|
· |
As of the last day of any fiscal quarter, permit the Consolidated Corporate Leverage Ratio (as defined in the Term Loan Agreement) to be less than 4.25 to 1.00. |
|
· |
As of the last day of any fiscal quarter permit the Consolidated Corporate Interest Coverage Ratio (as defined in the Term Loan Agreement) to be less than 2.75 to 1.00. |
|
· |
As of the last day of any fiscal quarter permit the Asset Coverage Ratio (as defined in the Term Loan Agreement) to be less than 1.50 to 1.00. |
The Term Loan Agreement contains customary events of default (which are in some cases subject to certain exceptions, thresholds, notice requirements and grace periods), including, but not limited to, non-payment of principal or interest or other amounts, misrepresentations, failure to perform or observe covenants, cross-defaults with certain other indebtedness or material agreements, certain change in control events, voluntary or involuntary bankruptcy proceedings, failure of the Term Loan Agreement or other loan documents to be valid and binding, and certain ERISA events and judgments.
As of December 31, 2017, the outstanding principal balance of the note payable was $166.2 million.
The note payable and the warehouse facilities are senior obligations of the Company. As of December 31, 2017, we were in compliance with all covenants related to the Term Loan Agreement.
59
Credit Quality and Allowance for Risk-Sharing Obligations
The following table sets forth certain information useful in evaluating our credit performance.
|
|
|
As of December 31, |
|
|||||||
|
(dollars in thousands) |
|
2017 |
|
2016 |
|
2015 |
|
|||
|
Key Credit Metrics |
|
|
|
|
|
|
|
|
|
|
|
Risk-sharing servicing portfolio: |
|
|
|
|
|
|
|
|
|
|
|
Fannie Mae Full Risk |
|
$ |
24,173,829 |
|
$ |
20,669,404 |
|
$ |
17,180,577 |
|
|
Fannie Mae Modified Risk |
|
|
7,491,822 |
|
|
6,396,812 |
|
|
4,970,569 |
|
|
Freddie Mac Modified Risk |
|
|
53,207 |
|
|
53,368 |
|
|
53,506 |
|
|
Interim Program JV Modified Risk (1) |
|
|
182,175 |
|
|
— |
|
|
— |
|
|
Total risk-sharing servicing portfolio |
|
$ |
31,901,033 |
|
$ |
27,119,584 |
|
$ |
22,204,652 |
|
|
|
|
|
|
|
|
|
|
|
|
|
|
Non-risk-sharing servicing portfolio: |
|
|
|
|
|
|
|
|
|
|
|
Fannie Mae No Risk |
|
$ |
409,966 |
|
$ |
661,948 |
|
$ |
763,942 |
|
|
Freddie Mac No Risk |
|
|
26,729,374 |
|
|
20,635,042 |
|
|
17,756,501 |
|
|
GNMA - HUD No Risk |
|
|
9,640,312 |
|
|
9,155,794 |
|
|
5,657,809 |
|
|
Brokered |
|
|
5,744,518 |
|
|
5,286,473 |
|
|
3,595,990 |
|
|
Total non-risk-sharing servicing portfolio |
|
$ |
42,524,170 |
|
$ |
35,739,257 |
|
$ |
27,774,242 |
|
|
Total loans serviced for others |
|
$ |
74,425,203 |
|
$ |
62,858,841 |
|
$ |
49,978,894 |
|
|
Interim loans (full risk) servicing portfolio |
|
|
66,963 |
|
|
222,313 |
|
|
233,370 |
|
|
Total servicing portfolio unpaid principal balance |
|
$ |
74,492,166 |
|
$ |
63,081,154 |
|
$ |
50,212,264 |
|
|
|
|
|
|
|
|
|
|
|
|
|
|
At risk servicing portfolio (2) |
|
$ |
28,058,967 |
|
$ |
24,072,347 |
|
$ |
19,544,422 |
|
|
Maximum exposure to at risk portfolio (3) |
|
|
5,680,798 |
|
|
4,921,802 |
|
|
4,062,971 |
|
|
60+ day delinquencies, within at risk portfolio |
|
|
5,962 |
|
|
— |
|
|
— |
|
|
Specifically identified at risk loan balances associated with allowance for risk-sharing obligations |
|
|
5,962 |
|
|
— |
|
|
16,884 |
|
|
|
|
|
|
|
|
|
|
|
|
|
|
60+ day delinquencies as a percentage of the at risk portfolio |
|
|
0.02 |
% |
|
0.00 |
% |
|
0.00 |
% |
|
Allowance for risk-sharing as a percentage of the at risk portfolio |
|
|
0.01 |
|
|
0.02 |
|
|
0.03 |
|
|
Allowance for risk-sharing as a percentage of the specifically identified at risk loan balances |
|
|
63.45 |
|
|
N/A |
|
|
33.08 |
|
|
Allowance for risk-sharing as a percentage of maximum exposure |
|
|
0.07 |
|
|
0.07 |
|
|
0.14 |
|
|
Allowance for risk-sharing and guaranty obligation as a percentage of maximum exposure |
|
|
0.79 |
|
|
0.73 |
|
|
0.82 |
|
|
(1) |
We indirectly share in a portion of the risk of loss associated with these loans through our 15% equity ownership in the Interim Program JV. |
|
(2) |
At risk servicing portfolio is defined as the balance of Fannie Mae DUS loans subject to the risk-sharing formula described below, as well as a small number of Freddie Mac and GNMA - HUD loans on which we share in the risk of loss. Use of the at risk portfolio provides for comparability of the full risk-sharing and modified risk-sharing loans because the provision and allowance for risk-sharing obligations are based on the at risk balances of the associated loans. Accordingly, we have presented the key statistics as a percentage of the at risk portfolio. |
For example, a $15 million loan with 50% risk-sharing has the same potential risk exposure as a $7.5 million loan with full DUS risk sharing. Accordingly, if the $15 million loan with 50% risk-sharing were to default, we would view the overall loss as a percentage of the at risk balance, or $7.5 million, to ensure comparability between all risk-sharing obligations. To date, substantially all of the risk-sharing obligations that we have settled have been from full risk-sharing loans.
60
|
(3) |
Represents the maximum loss we would incur under our risk-sharing obligations if all of the loans we service, for which we retain some risk of loss, were to default and all of the collateral underlying these loans was determined to be without value at the time of settlement. The maximum exposure is not representative of the actual loss we would incur. |
Fannie Mae DUS risk-sharing obligations are based on a tiered formula and represent substantially all of our risk-sharing activities. The risk-sharing tiers and amount of the risk-sharing obligations we absorb under full risk-sharing are provided below. Except as described in the following paragraph, the maximum amount of risk-sharing obligations we absorb at the time of default is 20% of the origination unpaid principal balance (“UPB”) of the loan.
|
|
|
|
|
|
Risk-Sharing Losses |
|
Percentage Absorbed by Us |
|
|
First 5% of UPB at the time of loss settlement |
|
100% |
|
|
Next 20% of UPB at the time of loss settlement |
|
25% |
|
|
Losses above 25% of UPB at the time of loss settlement |
|
10% |
|
|
Maximum loss |
|
20% of origination UPB |
|
Fannie Mae can double or triple our risk-sharing obligation if the loan does not meet specific underwriting criteria or if a loan defaults within 12 months of its sale to Fannie Mae. We may request modified risk-sharing at the time of origination, which reduces our potential risk-sharing obligation from the levels described above.
We use several techniques to manage our risk exposure under the Fannie Mae DUS risk-sharing program. These techniques include maintaining a strong underwriting and approval process, evaluating and modifying our underwriting criteria given the underlying multifamily housing market fundamentals, limiting our geographic market and borrower exposures, and electing the modified risk-sharing option under the Fannie Mae DUS program.
We may request modified risk-sharing based on such factors as the size of the loan, market conditions and loan pricing. Our current credit management policy is to cap the loan balance subject to full risk-sharing at $60.0 million. Accordingly, we currently elect to use modified risk-sharing for loans of more than $60.0 million in order to limit our maximum loss on any loan to $12.0 million (such exposure would occur in the event that the underlying collateral is determined to be completely without value at the time of loss). However, we occasionally elect to originate a loan with full risk sharing even when the loan balance is greater than $60.0 million if we believe the loan characteristics support such an approach.
A provision for risk-sharing obligations is recorded, and the allowance for risk-sharing obligations is increased, when it is probable that we have incurred risk-sharing obligations. We regularly monitor the credit quality of all loans for which we have a risk-sharing obligation. Loans with indicators of underperforming credit are placed on a watch list, assigned a numerical risk rating based on our assessment of the relative credit weakness, and subjected to additional evaluation or loss mitigation. Indicators of underperforming credit include poor financial performance, poor physical condition, poor management, and delinquency.
The amount of the provision considers our assessment of the likelihood of payment by the borrower, the value of the underlying collateral, and the level of risk-sharing. Historically, the loss recognition occurs at or before the loan becoming 60 days delinquent. Our estimates of value are determined considering broker opinions and other sources of market value information relevant to underlying property and collateral. Risk-sharing obligations are written off against the allowance at final settlement with Fannie Mae.
As of December 31, 2017 and 2016, $6.0 million and $0 of our at risk balances was more than 60 days delinquent, respectively. For the years ended December 31, 2017, 2016, and 2015, our provisions for risk-sharing obligations were a provision of $0.1 million, a net benefit of $0.1 million, and a provision of $1.7 million, respectively. The net benefit for the year ended December 31, 2016 was the result of a $0.8 million aggregate recovery related to the losses on two loans previously settled with Fannie Mae.
61
As of December 31, 2017 and 2016, our allowance for risk-sharing obligations was $3.8 million and $3.6 million, respectively, or one basis point and two basis points of the at risk balance, respectively. Our risk-sharing obligation with Fannie Mae requires, in the event of delinquency or default, that we advance principal and interest payments to Fannie Mae on behalf of the borrower for a period of four months. Advances made by us are used to reduce the proceeds required to settle any ultimate loss incurred. As of both December 31, 2017 and 2016, we had advanced an immaterial amount.
For the ten-year period from January 1, 2008 through December 31, 2017, we recognized net write-offs of risk-sharing obligations of $24.1 million, or an average of two basis points annually of the average at risk Fannie Mae portfolio balance.
We have never been required to repurchase a loan.
Off-Balance Sheet Risk
Other than the risk-sharing obligations under the Fannie Mae DUS Program disclosed previously in this Annual Report on Form 10-K, we do not have any off-balance sheet arrangements.
Contractual Obligations
We have contractual obligations to make future payments on debt and lease agreements. Additionally, in the normal course of business, we enter into contractual arrangements whereby we commit to future purchases of products or services from unaffiliated parties. We believe our recurring cash flows from operations and proceeds from loan sales and loan payoffs will provide sufficient cash flows to cover the scheduled payments over the near term related to our contractual obligations outstanding as of December 31, 2017.
Contractual payments due under warehouse facility obligations, long-term debt, and other obligations at December 31, 2017 are as follows:
|
|
|
|
|
|
|
|
|
Due after 1 |
|
Due after 3 |
|
|
|
|
||
|
|
|
|
|
|
Due in 1 Year |
|
Year through 3 |
|
Years through |
|
Due after 5 |
|
||||
|
(in thousands) |
|
Total |
|
or Less |
|
Years |
|
5 Years |
|
Years |
|
|||||
|
Long-term debt (1) |
|
$ |
188,735 |
|
$ |
8,658 |
|
$ |
180,077 |
|
$ |
— |
|
$ |
— |
|
|
Warehouse facilities (2) |
|
|
945,562 |
|
|
935,117 |
|
|
10,445 |
|
|
— |
|
|
— |
|
|
Operating leases |
|
|
30,019 |
|
|
6,054 |
|
|
11,296 |
|
|
9,402 |
|
|
3,267 |
|
|
Purchase obligations |
|
|
3,740 |
|
|
2,123 |
|
|
1,617 |
|
|
— |
|
|
— |
|
|
Total |
|
$ |
1,168,056 |
|
$ |
951,952 |
|
$ |
203,435 |
|
$ |
9,402 |
|
$ |
3,267 |
|
|
(1) |
Interest for long-term debt is based on a variable rate. Such interest is included here and based on the effective interest rate for long-term debt as of December 31, 2017. |
|
(2) |
To be repaid from proceeds from loan sales for facilities relating to loans held for sale and from proceeds from payoffs for facilities relating to loans held for investment under the Interim Program. Includes interest at the effective interest rate for warehouse borrowings as of December 31, 2017. |
New/Recent Accounting Pronouncements
NOTE 2 of the financial statements in Item 15 of Part IV in this Annual Report on Form 10-K contains a listing that presents the accounting pronouncements that the Financial Accounting Standards Board has issued and that have the potential to impact the Company but have not yet been adopted by the Company and a listing that presents the accounting standards adopted by the Company during 2017 and 2018. Although we do not believe any of the accounting pronouncements listed in that table will have a significant impact on our business activities or compliance with our debt covenants, we are still in the process of determining the impact some of the new pronouncements may have on our financial results and operating activities.
62
Item 7A. Quantitative and Qualitative Disclosure About Market Risk
Interest Rate Risk
For loans held for sale to Fannie Mae, Freddie Mac, and HUD, we are not currently exposed to unhedged interest rate risk during the loan commitment, closing, and delivery processes. The sale or placement of each loan to an investor is negotiated prior to closing on the loan with the borrower, and the sale or placement is typically effectuated within 60 days of closing. The coupon rate for the loan is set at the same time we establish the interest rate with the investor.
Some of our assets and liabilities are subject to changes in interest rates. Earnings from escrows are generally based on LIBOR. 30-day LIBOR as of December 31, 2017 and 2016 was 156 basis points and 77 basis points, respectively. The following table shows the impact on our annual escrow earnings due to a 100-basis point increase and decrease in 30-day LIBOR based on our escrow balances outstanding at each period end. A portion of these changes in earnings as a result of a 100-basis point increase in the 30-day LIBOR would be delayed several months due to the negotiated nature of some of our escrow arrangements.
|
|
|
As of December 31, |
|
||||
|
Change in annual escrow earnings due to (in thousands): |
|
2017 |
|
2016 |
|
||
|
100 basis point increase in 30-day LIBOR |
|
$ |
19,527 |
|
$ |
15,699 |
|
|
100 basis point decrease in 30-day LIBOR (1) |
|
|
(19,527) |
|
|
(11,297) |
|
The borrowing cost of our warehouse facilities used to fund loans held for sale and loans held for investment is based on LIBOR. The interest income on our loans held for investment is based on LIBOR. The LIBOR reset date for loans held for investment is the same date as the LIBOR reset date for the corresponding warehouse facility. The following table shows the impact on our annual net warehouse interest income due to a 100-basis point increase and decrease in 30-day LIBOR based on our warehouse borrowings outstanding at each period end. The changes shown below reflect the assumption that there is a corresponding 100-basis point increase or decrease in the interest rate earned on our loans held for sale.
|
|
|
As of December 31, |
|
||||
|
Change in annual net warehouse interest income due to (in thousands): |
|
2017 |
|
2016 |
|
||
|
100 basis point increase in 30-day LIBOR |
|
$ |
(17,491) |
|
$ |
(10,368) |
|
|
100 basis point decrease in 30-day LIBOR (1) |
|
|
17,491 |
|
|
7,984 |
|
All of our corporate debt is based on 30-day LIBOR, with a 30-day LIBOR floor of 100 basis points. The following table shows the impact on our annual earnings due to a 100-basis point increase and decrease in 30-day LIBOR based on our note payable balance outstanding at each period end.
|
|
|
As of December 31, |
|
||||
|
Change in annual earnings due to (in thousands): |
|
2017 |
|
2016 |
|
||
|
100 basis point increase in 30-day LIBOR (2) |
|
$ |
(1,662) |
|
$ |
(1,288) |
|
|
100 basis point decrease in 30-day LIBOR (3) |
|
|
931 |
|
|
— |
|
|
(1) |
The decrease in 2016 was to zero as 30-day LIBOR was less than 100 basis points. |
|
(2) |
The increase in 2016 was 77 basis points due to the 30-day LIBOR floor. |
|
(3) |
There was no impact in 2016 as 30-day LIBOR at the time was less than the 30-day LIBOR floor. The decrease in 2017 was 56 basis points due to the 30-day LIBOR floor. |
63
Market Value Risk
The fair value of our MSRs is subject to market-value risk. A 100-basis point increase or decrease in the weighted average discount rate would decrease or increase, respectively, the fair value of our MSRs by approximately $26.3 million as of December 31, 2017 compared to $21.2 million as of December 31, 2016. Our Fannie Mae and Freddie Mac servicing engagements provide for make-whole payments in the event of a voluntary prepayment prior to the expiration of the prepayment protection period. Our servicing contracts with institutional investors and HUD do not require payment of a make-whole amount. As of both December 31, 2017 and 2016, 87% of the servicing fees are protected from the risk of prepayment through make-whole requirements; given this significant level of prepayment protection, we do not hedge our servicing portfolio for prepayment risk.
Item 8. Financial Statements and Supplementary Data.
The consolidated financial statements of Walker & Dunlop, Inc. and subsidiaries and the notes related to the foregoing financial statements, together with the independent registered public accounting firm’s report thereon, listed in Item 15, are filed as part of this Annual Report on Form 10-K and are incorporated herein by reference.
Item 9. Changes in and Disagreements with Accountants on Accounting and Financial Disclosure
None.
Item 9A. Controls and Procedures
Evaluation of Disclosure Controls and Procedures
As of the end of the period covered by this report, an evaluation was performed under the supervision and with the participation of our management, including the principal executive officer and principal financial officer, of the effectiveness of our disclosure controls and procedures, as defined in Rules 13a-15(e) and 15d-15(e) under the Securities Exchange Act of 1934.
Based on that evaluation, the principal executive officer and principal financial officer concluded that the design and operation of these disclosure controls and procedures as of the end of the period covered by this report were effective to provide reasonable assurance that information required to be disclosed in our reports under the Securities and Exchange Act of 1934 is recorded, processed, summarized, and reported within the time periods specified in the U.S. Securities and Exchange Commission’s rules and forms and that such information is accumulated and communicated to our management, including our principal executive officer and principal financial officer, as appropriate, to allow timely decisions regarding required disclosure.
Management's Report on Internal Control Over Financial Reporting
Our management is responsible for establishing and maintaining adequate internal control over financial reporting, as such term is defined in Rule 13a-15(f) under the Securities and Exchange Act of 1934. Under the supervision and with the participation of our management, including our principal executive officer and principal financial officer, we conducted an evaluation of the effectiveness of our internal control over financial reporting based on the framework in Internal Control — Integrated Framework (2013) issued by the Committee of Sponsoring Organizations of the Treadway Commission. Based on our evaluation under the framework in Internal Control — Integrated Framework (2013), our management concluded that our internal control over financial reporting was effective as of December 31, 2017. Our internal control over financial reporting as of December 31, 2017 has been audited by KPMG LLP, an independent registered public accounting firm, as stated in their audit report which is included herein.
64
Changes in Internal Control Over Financial Reporting
There have been no changes in our internal control over financial reporting during the quarter ended December 31, 2017 that have materially affected, or are reasonably likely to materially affect, our internal control over financial reporting.
None
Item 10. Directors, Executive Officers, and Corporate Governance.
The information required by this item regarding directors, executive officers, corporate governance and our code of ethics is hereby incorporated by reference to the material appearing in the Proxy Statement for the Annual Meeting of Stockholders to be held in 2018 (the “Proxy Statement”) under the captions “BOARD OF DIRECTORS AND CORPORATE GOVERNANCE” and “EXECUTIVE OFFICERS – Executive Officer Biographies.” The information required by this item regarding compliance with Section 16(a) of the Securities Exchange Act of 1934, as amended, is hereby incorporated by reference to the material appearing in the Proxy Statement under the caption “VOTING SECURITIES OF CERTAIN BENEFICIAL OWNERS AND MANAGEMENT — Section 16(a) Beneficial Ownership Reporting Compliance.” The information required by this Item 10 with respect to the availability of our code of ethics is provided in this Annual Report on Form 10-K. See “Available Information.”
Item 11. Executive Compensation.
The information required by this item is hereby incorporated by reference to the material appearing in the Proxy Statement under the captions “COMPENSATION DISCUSSION AND ANALYSIS,” “COMPENSATION OF DIRECTORS AND EXECUTIVE OFFICERS,” “COMPENSATION DISCUSSION AND ANALYSIS – Compensation Committee Report” and “COMPENSATION OF DIRECTORS AND EXECUTIVE OFFICERS – Compensation Committee Interlocks and Insider Participation.”
Item 12. Security Ownership of Certain Beneficial Owners and Management and Related Stockholder Matters.
The information regarding security ownership of certain beneficial owners and management and securities authorized for issuance under our employee stock-based compensation plans required by this item is hereby incorporated by reference to the material appearing in the Proxy Statement under the captions “VOTING SECURITIES OF CERTAIN BENEFICIAL OWNERS AND MANAGEMENT” and “COMPENSATION OF DIRECTORS AND EXECUTIVE OFFICERS – Equity Compensation Plan Information.”
Item 13. Certain Relationships and Related Transactions, and Director Independence.
Item 13 is hereby incorporated by reference to material appearing in the Proxy Statement under the captions “CERTAIN RELATIONSHIPS AND RELATED TRANSACTIONS” and “BOARD OF DIRECTORS AND CORPORATE GOVERNANCE – Corporate Governance Information – Director Independence.”
Item 14. Principal Accounting Fees and Services.
The information required by this item is hereby incorporated by reference to the material appearing in the Proxy Statement under the caption “AUDIT RELATED MATTERS.”
65
Item 15. Exhibits and Financial Statement Schedules.
The following documents are filed as part of this report:
|
(a) |
Financial Statements |
Walker & Dunlop, Inc. and Subsidiaries Consolidated Financial Statements
Report of Independent Registered Public Accounting Firm
Consolidated Balance Sheets
Consolidated Statements of Income
Consolidated Statements of Changes in Equity
Consolidated Statements of Cash Flows
Notes to Consolidated Financial Statements
(b) Exhibits
|
2.1 |
|
||
|
2.2 |
|
||
|
2.3 |
|
||
|
2.4 |
|
||
|
3.1 |
|
||
|
3.2 |
|||
|
4.1 |
|
||
|
4.2 |
|
||
|
4.3 |
|
||
|
4.4 |
|
||
|
4.5 |
|
||
66
|
4.6 |
|
||
|
10.1 |
|
||
|
10.2† |
|
||
|
10.3† |
|
||
|
10.4† |
|
||
|
10.5† |
|
||
|
10.6† |
|
||
|
10.7† |
|
||
|
10.8† |
|
||
|
10.9† |
|
||
|
10.10† |
|
||
|
10.11† |
|
||
|
10.12† |
|||
|
10.13† |
|||
|
10.14† |
|
||
|
10.15† |
|
||
|
10.16† |
|
||
|
10.17† |
|
||
|
10.18† |
|
||
|
10.19† |
|
||
67
|
10.20† |
|
||
|
10.21† |
|
||
|
10.22† |
|
||
|
10.23† |
|
||
|
10.24† |
|
||
|
10.25† |
|||
|
10.26† |
|
||
|
10.27† |
|
||
|
10.28† |
|
||
|
10.29† |
|
||
|
10.30† |
|
||
|
10.31† |
|
||
|
10.32†* |
|
Management Deferred Stock Unit Purchase Plan, as amended and restated effective May 1, 2017 |
|
|
10.33†* |
|
||
|
10.34†* |
|
Form of Deferred Stock Unit Award Agreement (Purchase Plan, as amended) |
|
|
10.35†* |
|
Form of Deferred Stock Unit Award Agreement (Matching Program) |
|
|
10.36†* |
|
Form of Restricted Stock Unit Award Agreement (Matching Program) |
|
|
10.37 |
|
||
|
10.38† |
|
||
|
10.39† |
|
||
|
10.40† |
|
||
|
10.41† |
|
||
|
10.42† |
|
||
|
10.43† |
|
||
|
10.44† |
|
||
68
|
10.45† |
|
||
|
10.46† |
|
||
|
10.47† |
|
||
|
10.48† |
|
||
|
10.49† |
|
||
|
10.50† |
|
||
|
10.51† |
|
||
|
10.52† |
|
||
|
10.53 |
|
||
|
10.54 |
|
||
|
10.55 |
|
||
|
10.56 |
|
||
|
10.57 |
|
||
|
10.58 |
|
||
|
10.59 |
|
||
|
10.60 |
|
||
69
|
10.61 |
|
||
|
10.62 |
|
||
|
10.63 |
|
||
|
10.64 |
|
||
|
10.65 |
|
||
|
10.66 |
|
||
|
10.67 |
|
||
|
10.68 |
|
||
|
10.69 |
|
||
|
10.70 |
|
||
|
10.71 |
|
||
|
10.72 |
|
||
|
10.73 |
|
||
|
21* |
|
List of Subsidiaries of Walker & Dunlop, Inc. as of December 31, 2017 |
|
|
23* |
|
Consent of KPMG LLP (Independent Registered Public Accounting Firm) |
|
|
31.1* |
|
Certification of Walker & Dunlop, Inc.'s Chief Executive Offer Pursuant to Rule 13a-14(a) |
|
|
31.2* |
|
Certification of Walker & Dunlop, Inc.'s Chief Financial Offer Pursuant to Rule 13a-14(a) |
|
|
32** |
|
||
70
|
101.1* |
|
XBRL Instance Document |
|
101.2* |
|
XBRL Taxonomy Extension Schema Document |
|
101.3* |
|
XBRL Taxonomy Extension Calculation Linkbase Document |
|
101.4* |
|
XBRL Taxonomy Extension Definition Linkbase Document |
|
101.5* |
|
XBRL Taxonomy Extension Label Linkbase Document |
|
101.6* |
|
XBRL Taxonomy Extension Presentation Linkbase Document |
†:Denotes a management contract or compensation plan, contract or arrangement.
*:Filed herewith.
**: Furnished herewith.
Not applicable.
71
Pursuant to the requirements of Section 13 or 15(d) of the Securities Exchange Act of 1934, the registrant has duly caused this report to be signed on its behalf by the undersigned thereunto duly authorized.
Walker & Dunlop, Inc.
|
By: |
/s/ William M. Walker |
|
|
|
William M. Walker |
|
|
|
Chairman and Chief Executive Officer |
|
|
Date: |
February 23, 2018 |
|
Pursuant to the requirements of the Securities Exchange Act of 1934, this report has been signed by the following persons on behalf of the registrant and in the capacities and on the dates indicated.
|
Signature |
Title |
Date |
||
|
/s/ William M. Walker |
Chairman and Chief Executive |
February 23, 2018 |
||
|
William M. Walker |
Officer (Principal Executive Officer) |
|||
|
/s/ Alan J. Bowers |
Director |
February 23, 2018 |
||
|
Alan J. Bowers |
||||
|
/s/ Cynthia A. Hallenbeck |
Director |
February 23, 2018 |
||
|
Cynthia A. Hallenbeck |
||||
|
/s/ Michael D. Malone |
Director |
February 23, 2018 |
||
|
Michael D. Malone |
||||
|
/s/ John Rice |
Director |
February 23, 2018 |
||
|
John Rice |
||||
|
/s/ Dana L. Schmaltz |
Director |
February 23, 2018 |
||
|
Dana L. Schmaltz |
||||
|
/s/ Howard W. Smith, III |
President and Director |
February 23, 2018 |
||
|
Howard W. Smith, III |
|
/s/ Michael J. Warren |
Director |
February 23, 2018 |
||
|
Michael J. Warren |
|
/s/ Stephen P. Theobald |
Executive Vice President and Chief Financial |
February 23, 2018 |
||
|
Stephen P. Theobald |
Officer (Principal Financial Officer and Principal Accounting Officer) |
72
INDEX TO THE FINANCIAL STATEMENTS
CONTENTS
F-1
REPORT OF INDEPENDENT REGISTERED PUBLIC ACCOUNTING FIRM
To the Board of Directors and Stockholders
Walker & Dunlop, Inc. and subsidiaries:
Opinions on the Consolidated Financial Statements and Internal Control Over Financial Reporting
We have audited the accompanying consolidated balance sheets of Walker & Dunlop, Inc. and subsidiaries (the “Company”) as of December 31, 2017 and 2016, the related consolidated statements of income, changes in equity, and cash flows for each of the years in the three-year period ended December 31, 2017, and the related notes (collectively, the “consolidated financial statements”). We also have audited the Company’s internal control over financial reporting as of December 31, 2017, based on criteria established in Internal Control – Integrated Framework (2013) issued by the Committee of Sponsoring Organizations of the Treadway Commission.
In our opinion, the consolidated financial statements referred to above present fairly, in all material respects, the financial position of the Company as of December 31, 2017 and 2016, and the results of its operations and its cash flows for each of the years in the three-year period ended December 31, 2017, in conformity with U.S. generally accepted accounting principles. Also in our opinion, the Company maintained, in all material respects, effective internal control over financial reporting as of December 31, 2017, based on criteria established in Internal Control – Integrated Framework (2013) issued by the Committee of Sponsoring Organizations of the Treadway Commission.
Basis for Opinion
The Company’s management is responsible for these consolidated financial statements, for maintaining effective internal control over financial reporting, and for its assessment of the effectiveness of internal control over financial reporting, included in the accompanying Management’s Report on Internal Control over Financial Reporting. Our responsibility is to express an opinion on the Company’s consolidated financial statements and an opinion on the Company’s internal control over financial reporting based on our audits. We are a public accounting firm registered with the Public Company Accounting Oversight Board (United States) (“PCAOB”) and are required to be independent with respect to the Company in accordance with the U.S. federal securities laws and the applicable rules and regulations of the Securities and Exchange Commission and the PCAOB.
We conducted our audits in accordance with the standards of the PCAOB. Those standards require that we plan and perform the audits to obtain reasonable assurance about whether the consolidated financial statements are free of material misstatement, whether due to error or fraud, and whether effective internal control over financial reporting was maintained in all material respects.
Our audits of the consolidated financial statements included performing procedures to assess the risks of material misstatement of the consolidated financial statements, whether due to error or fraud, and performing procedures that respond to those risks. Such procedures included examining, on a test basis, evidence regarding the amounts and disclosures in the consolidated financial statements. Our audits also included evaluating the accounting principles used and significant estimates made by management, as well as evaluating the overall presentation of the consolidated financial statements. Our audit of internal control over financial reporting included obtaining an understanding of internal control over financial reporting, assessing the risk that a material weakness exists, and testing and evaluating the design and operating effectiveness of internal control based on the assessed risk. Our audits also included performing such other procedures as we considered necessary in the circumstances. We believe that our audits provide a reasonable basis for our opinions.
Definition and Limitations of Internal Control Over Financial Reporting
A company’s internal control over financial reporting is a process designed to provide reasonable assurance regarding the reliability of financial reporting and the preparation of financial statements for external purposes in accordance with generally accepted accounting principles. A company’s internal control over financial reporting includes those policies and
F-2
procedures that (1) pertain to the maintenance of records that, in reasonable detail, accurately and fairly reflect the transactions and dispositions of the assets of the company; (2) provide reasonable assurance that transactions are recorded as necessary to permit preparation of financial statements in accordance with generally accepted accounting principles, and that receipts and expenditures of the company are being made only in accordance with authorizations of management and directors of the company; and (3) provide reasonable assurance regarding prevention or timely detection of unauthorized acquisition, use, or disposition of the company’s assets that could have a material effect on the financial statements.
Because of its inherent limitations, internal control over financial reporting may not prevent or detect misstatements. Also, projections of any evaluation of effectiveness to future periods are subject to the risk that controls may become inadequate because of changes in conditions, or that the degree of compliance with the policies or procedures may deteriorate.
|
|
|
|
|
|
|
/s/ KPMG LLP |
We have served as the Company’s auditor since 2007.
McLean, Virginia
February 23, 2018
F-3
Walker & Dunlop, Inc. and Subsidiaries
(In thousands, except per share data)
|
|
|
December 31, |
|
||||
|
Assets |
|
2017 |
|
2016 |
|
||
|
Cash and cash equivalents |
|
$ |
191,218 |
|
$ |
118,756 |
|
|
Restricted cash |
|
|
6,677 |
|
|
9,861 |
|
|
Pledged securities, at fair value |
|
|
97,859 |
|
|
84,850 |
|
|
Loans held for sale, at fair value |
|
|
951,829 |
|
|
1,858,358 |
|
|
Loans held for investment, net |
|
|
66,510 |
|
|
220,377 |
|
|
Servicing fees and other receivables, net |
|
|
41,693 |
|
|
29,459 |
|
|
Derivative assets |
|
|
10,357 |
|
|
61,824 |
|
|
Mortgage servicing rights |
|
|
634,756 |
|
|
521,930 |
|
|
Goodwill and other intangible assets |
|
|
124,543 |
|
|
97,372 |
|
|
Other assets |
|
|
82,985 |
|
|
49,645 |
|
|
Total assets |
|
$ |
2,208,427 |
|
$ |
3,052,432 |
|
|
|
|
|
|
|
|
|
|
|
Liabilities |
|
|
|
|
|
|
|
|
Accounts payable and other liabilities |
|
$ |
130,479 |
|
$ |
93,211 |
|
|
Performance deposits from borrowers |
|
|
6,461 |
|
|
10,480 |
|
|
Derivative liabilities |
|
|
1,850 |
|
|
4,396 |
|
|
Guaranty obligation, net of accumulated amortization |
|
|
41,187 |
|
|
32,292 |
|
|
Allowance for risk-sharing obligations |
|
|
3,783 |
|
|
3,613 |
|
|
Deferred tax liabilities, net |
|
|
108,059 |
|
|
139,020 |
|
|
Warehouse notes payable |
|
|
937,769 |
|
|
1,990,183 |
|
|
Note payable |
|
|
163,858 |
|
|
164,163 |
|
|
Total liabilities |
|
$ |
1,393,446 |
|
$ |
2,437,358 |
|
|
|
|
|
|
|
|
|
|
|
Equity |
|
|
|
|
|
|
|
|
Preferred shares, 50,000 authorized, none issued. |
|
$ |
— |
|
$ |
— |
|
|
Common stock, $0.01 par value. Authorized 200,000; issued and outstanding 30,016 shares at December 31, 2017 and 29,551 shares at December 31, 2016 |
|
|
300 |
|
|
296 |
|
|
Additional paid-in capital |
|
|
229,173 |
|
|
228,889 |
|
|
Retained earnings |
|
|
579,943 |
|
|
381,031 |
|
|
Total stockholders’ equity |
|
$ |
809,416 |
|
$ |
610,216 |
|
|
Noncontrolling interests |
|
|
5,565 |
|
|
4,858 |
|
|
Total equity |
|
$ |
814,981 |
|
$ |
615,074 |
|
|
Commitments and contingencies (NOTE 10) |
|
|
— |
|
|
— |
|
|
Total liabilities and equity |
|
$ |
2,208,427 |
|
$ |
3,052,432 |
|
|
|
|
|
|
|
|
|
|
See accompanying notes to consolidated financial statements.
F-4
Walker & Dunlop, Inc. and Subsidiaries
Consolidated Statements of Income
(In thousands, except per share data)
|
For the year ended December 31, |
||||||||||
|
|
|
2017 |
|
2016 |
|
2015 |
|
|||
|
Revenues |
|
|
|
|
|
|
|
|
|
|
|
Gains from mortgage banking activities |
|
$ |
439,370 |
|
$ |
367,185 |
|
$ |
290,466 |
|
|
Servicing fees |
|
|
176,352 |
|
|
140,924 |
|
|
114,757 |
|
|
Net warehouse interest income, loans held for sale |
|
|
15,077 |
|
|
16,245 |
|
|
14,541 |
|
|
Net warehouse interest income, loans held for investment |
|
|
9,390 |
|
|
7,482 |
|
|
9,419 |
|
|
Escrow earnings and other interest income |
|
|
20,396 |
|
|
9,168 |
|
|
4,473 |
|
|
Other |
|
|
51,272 |
|
|
34,272 |
|
|
34,542 |
|
|
Total revenues |
|
$ |
711,857 |
|
$ |
575,276 |
|
$ |
468,198 |
|
|
|
|
|
|
|
|
|
|
|
|
|
|
Expenses |
|
|
|
|
|
|
|
|
|
|
|
Personnel |
|
$ |
289,277 |
|
$ |
227,491 |
|
$ |
184,590 |
|
|
Amortization and depreciation |
|
|
131,246 |
|
|
111,427 |
|
|
98,173 |
|
|
Provision (benefit) for credit losses |
|
|
(243) |
|
|
(612) |
|
|
1,644 |
|
|
Interest expense on corporate debt |
|
|
9,745 |
|
|
9,851 |
|
|
9,918 |
|
|
Other operating expenses |
|
|
48,171 |
|
|
41,338 |
|
|
38,507 |
|
|
Total expenses |
|
$ |
478,196 |
|
$ |
389,495 |
|
$ |
332,832 |
|
|
Income from operations |
|
$ |
233,661 |
|
$ |
185,781 |
|
$ |
135,366 |
|
|
Income tax expense |
|
|
21,827 |
|
|
71,470 |
|
|
52,771 |
|
|
Net income before noncontrolling interests |
|
$ |
211,834 |
|
$ |
114,311 |
|
$ |
82,595 |
|
|
Less: net income from noncontrolling interests |
|
|
707 |
|
|
414 |
|
|
467 |
|
|
Walker & Dunlop net income |
|
$ |
211,127 |
|
$ |
113,897 |
|
$ |
82,128 |
|
|
|
|
|
|
|
|
|
|
|
|
|
|
Basic earnings per share |
|
$ |
7.03 |
|
$ |
3.87 |
|
$ |
2.76 |
|
|
Diluted earnings per share |
|
$ |
6.56 |
|
$ |
3.65 |
|
$ |
2.65 |
|
|
|
|
|
|
|
|
|
|
|
|
|
|
Basic weighted average shares outstanding |
|
|
30,014 |
|
|
29,432 |
|
|
29,754 |
|
|
Diluted weighted average shares outstanding |
|
|
32,205 |
|
|
31,172 |
|
|
30,949 |
|
|
|
|
|
|
|
|
|
|
|
|
|
See accompanying notes to consolidated financial statements.
F-5
Walker & Dunlop, Inc. and Subsidiaries
Consolidated Statements of Changes in Equity
(In thousands)
|
|
|
|
|
Stockholders' Equity |
|
|
|
|
|
|
||||||||
|
|
|
|
|
|
|
|
Additional |
|
|
|
|
|
|
|
|
|
|
|
|
|
|
Common Stock |
|
Paid-In |
|
Retained |
|
Noncontrolling |
|
Total |
|
|||||||
|
|
|
Shares |
|
Amount |
|
Capital |
|
Earnings |
|
Interests |
|
Equity |
|
|||||
|
Balance at December 31, 2014 |
|
31,822 |
|
$ |
318 |
|
$ |
224,164 |
|
$ |
208,969 |
|
$ |
— |
|
$ |
433,451 |
|
|
Walker & Dunlop net income |
|
— |
|
|
— |
|
|
— |
|
|
82,128 |
|
|
— |
|
|
82,128 |
|
|
Net income from noncontrolling interests |
|
— |
|
|
— |
|
|
— |
|
|
— |
|
|
467 |
|
|
467 |
|
|
Stock-based compensation—equity classified |
|
— |
|
|
— |
|
|
13,428 |
|
|
— |
|
|
— |
|
|
13,428 |
|
|
Issuance of common stock in connection with equity compensation plans |
|
815 |
|
|
8 |
|
|
5,653 |
|
|
— |
|
|
— |
|
|
5,661 |
|
|
Issuance of unvested restricted common stock in connection with acquisitions |
|
— |
|
|
— |
|
|
1,892 |
|
|
— |
|
|
— |
|
|
1,892 |
|
|
Repurchase and retirement of common stock (NOTE 12) |
|
(3,171) |
|
|
(31) |
|
|
(31,163) |
|
|
(19,067) |
|
|
— |
|
|
(50,261) |
|
|
Tax benefit from vesting of restricted shares |
|
— |
|
|
— |
|
|
1,410 |
|
|
— |
|
|
— |
|
|
1,410 |
|
|
Noncontrolling interests acquired |
|
— |
|
|
— |
|
|
— |
|
|
— |
|
|
4,339 |
|
|
4,339 |
|
|
Other |
|
— |
|
|
— |
|
|
191 |
|
|
— |
|
|
(357) |
|
|
(166) |
|
|
Balance at December 31, 2015 |
|
29,466 |
|
$ |
295 |
|
$ |
215,575 |
|
$ |
272,030 |
|
$ |
4,449 |
|
$ |
492,349 |
|
|
Cumulative effect from change in accounting for stock compensation |
|
— |
|
|
— |
|
|
135 |
|
|
(120) |
|
|
— |
|
|
15 |
|
|
Walker & Dunlop net income |
|
— |
|
|
— |
|
|
— |
|
|
113,897 |
|
|
— |
|
|
113,897 |
|
|
Net income from noncontrolling interests |
|
— |
|
|
— |
|
|
— |
|
|
— |
|
|
414 |
|
|
414 |
|
|
Stock-based compensation—equity classified |
|
— |
|
|
— |
|
|
17,616 |
|
|
— |
|
|
— |
|
|
17,616 |
|
|
Issuance of common stock in connection with equity compensation plans |
|
645 |
|
|
6 |
|
|
3,759 |
|
|
— |
|
|
— |
|
|
3,765 |
|
|
Repurchase and retirement of common stock (NOTE 12) |
|
(560) |
|
|
(5) |
|
|
(8,112) |
|
|
(4,776) |
|
|
— |
|
|
(12,893) |
|
|
Other |
|
— |
|
|
— |
|
|
(84) |
|
|
— |
|
|
(5) |
|
|
(89) |
|
|
Balance at December 31, 2016 |
|
29,551 |
|
$ |
296 |
|
$ |
228,889 |
|
$ |
381,031 |
|
$ |
4,858 |
|
$ |
615,074 |
|
|
Walker & Dunlop net income |
|
— |
|
|
— |
|
|
— |
|
|
211,127 |
|
|
— |
|
|
211,127 |
|
|
Net income from noncontrolling interests |
|
— |
|
|
— |
|
|
— |
|
|
— |
|
|
707 |
|
|
707 |
|
|
Stock-based compensation—equity classified |
|
— |
|
|
— |
|
|
19,973 |
|
|
— |
|
|
— |
|
|
19,973 |
|
|
Issuance of common stock in connection with equity compensation plans |
|
1,272 |
|
|
12 |
|
|
3,001 |
|
|
— |
|
|
— |
|
|
3,013 |
|
|
Repurchase and retirement of common stock (NOTE 12) |
|
(807) |
|
|
(8) |
|
|
(22,676) |
|
|
(12,215) |
|
|
— |
|
|
(34,899) |
|
|
Other |
|
— |
|
|
— |
|
|
(14) |
|
|
— |
|
|
— |
|
|
(14) |
|
|
Balance at December 31, 2017 |
|
30,016 |
|
$ |
300 |
|
$ |
229,173 |
|
$ |
579,943 |
|
$ |
5,565 |
|
$ |
814,981 |
|
See accompanying notes to consolidated financial statements.
F-6
Walker & Dunlop, Inc. and Subsidiaries
Consolidated Statements of Cash Flows
(In thousands)
|
|
|
For the year ended December 31, |
|
||||||||
|
|
|
2017 |
|
2016 |
|
2015 |
|
||||
|
Cash flows from operating activities |
|
|
|
|
|
|
|
|
|
|
|
|
Net income before noncontrolling interests |
|
$ |
211,834 |
|
$ |
114,311 |
|
$ |
82,595 |
|
|
|
Adjustments to reconcile net income to net cash provided by (used in) operating activities: |
|
|
|
|
|
|
|
|
|
|
|
|
Gains attributable to the fair value of future servicing rights, net of guaranty obligation |
|
|
(193,886) |
|
|
(192,825) |
|
|
(133,631) |
|
|
|
Change in the fair value of premiums and origination fees (NOTE 2) |
|
|
5,781 |
|
|
(10,796) |
|
|
1,959 |
|
|
|
Amortization and depreciation |
|
|
131,246 |
|
|
111,427 |
|
|
98,173 |
|
|
|
Stock compensation-equity and liability classified |
|
|
21,134 |
|
|
18,477 |
|
|
14,084 |
|
|
|
Provision (benefit) for credit losses |
|
|
(243) |
|
|
(612) |
|
|
1,644 |
|
|
|
Deferred tax expense (benefit) |
|
|
(30,961) |
|
|
37,595 |
|
|
16,919 |
|
|
|
Originations of loans held for sale |
|
|
(17,018,424) |
|
|
(12,040,559) |
|
|
(12,111,553) |
|
|
|
Sales of loans to third parties |
|
|
17,937,915 |
|
|
12,697,209 |
|
|
10,688,356 |
|
|
|
Amortization of deferred loan fees and costs |
|
|
(2,298) |
|
|
(1,578) |
|
|
(1,775) |
|
|
|
Amortization of debt issuance costs and debt discount |
|
|
4,886 |
|
|
5,581 |
|
|
3,756 |
|
|
|
Origination fees received from loans held for investment |
|
|
1,109 |
|
|
2,104 |
|
|
1,429 |
|
|
|
Tax shortfall (benefit) from vesting of equity awards |
|
|
— |
|
|
— |
|
|
(1,410) |
|
|
|
Cash paid to settle risk-sharing obligations |
|
|
— |
|
|
(1,613) |
|
|
(795) |
|
|
|
Changes in: |
|
|
|
|
|
|
|
|
|
|
|
|
Servicing fees and other receivables |
|
|
(12,234) |
|
|
(5,744) |
|
|
(623) |
|
|
|
Other assets |
|
|
(7,064) |
|
|
(1,014) |
|
|
2,974 |
|
|
|
Accounts payable and other liabilities |
|
|
22,866 |
|
|
22,035 |
|
|
7,739 |
|
|
|
Performance deposits from borrowers |
|
|
(4,019) |
|
|
5,368 |
|
|
(8,556) |
|
|
|
Net cash provided by (used in) operating activities |
|
$ |
1,067,642 |
|
$ |
759,366 |
|
$ |
(1,338,715) |
|
|
|
|
|
|
|
|
|
|
|
|
|
|
|
|
Cash flows from investing activities |
|
|
|
|
|
|
|
|
|
|
|
|
Capital expenditures |
|
$ |
(5,207) |
|
$ |
(2,478) |
|
$ |
(1,413) |
|
|
|
Purchase of equity-method investments |
|
|
— |
|
|
— |
|
|
(5,000) |
|
|
|
Funding of preferred equity investments |
|
|
(16,884) |
|
|
(24,835) |
|
|
— |
|
|
|
Capital invested in Interim Program JV |
|
|
(6,342) |
|
|
— |
|
|
— |
|
|
|
Net cash paid to increase ownership interest in a previously held equity-method investment |
|
|
— |
|
|
(1,058) |
|
|
— |
|
|
|
Acquisitions, net of cash received |
|
|
(15,000) |
|
|
(6,350) |
|
|
(12,767) |
|
|
|
Purchase of mortgage servicing rights |
|
|
(7,781) |
|
|
(43,097) |
|
|
— |
|
|
|
Originations of loans held for investment |
|
|
(183,916) |
|
|
(414,763) |
|
|
(180,375) |
|
|
|
Principal collected on loans held for investment upon payoff |
|
|
219,516 |
|
|
425,820 |
|
|
172,323 |
|
|
|
Transfer of loans held for investment upon formation of Interim Program JV |
|
|
119,750 |
|
|
— |
|
|
— |
|
|
|
Net cash provided by (used in) investing activities |
|
$ |
104,136 |
|
$ |
(66,761) |
|
$ |
(27,232) |
|
|
|
|
|
|
|
|
|
|
|
|
|
|
|
|
Cash flows from financing activities |
|
|
|
|
|
|
|
|
|
|
|
|
Borrowings (repayments) of warehouse notes payable, net |
|
$ |
(955,040) |
|
$ |
(649,845) |
|
$ |
1,423,911 |
|
|
|
Borrowings of interim warehouse notes payable |
|
|
140,341 |
|
|
325,828 |
|
|
137,397 |
|
|
|
Repayments of interim warehouse notes payable |
|
|
(237,912) |
|
|
(355,738) |
|
|
(125,542) |
|
|
|
Repayments of note payable |
|
|
(1,104) |
|
|
(1,104) |
|
|
(4,819) |
|
|
|
Proceeds from issuance of common stock |
|
|
3,013 |
|
|
3,765 |
|
|
7,553 |
|
|
F-7
Walker & Dunlop, Inc. and Subsidiaries
Consolidated Statements of Cash Flows (CONTINUED)
(In thousands)
|
Repurchase of common stock |
|
|
(34,899) |
|
|
(12,893) |
|
|
(50,261) |
|
|
|
Debt issuance costs |
|
|
(3,890) |
|
|
(3,630) |
|
|
(4,145) |
|
|
|
Distributions to noncontrolling interests |
|
|
— |
|
|
(5) |
|
|
— |
|
|
|
Tax benefit from vesting of equity awards |
|
|
— |
|
|
— |
|
|
1,410 |
|
|
|
Net cash provided by (used in) financing activities |
|
$ |
(1,089,491) |
|
$ |
(693,622) |
|
$ |
1,385,504 |
|
|
|
|
|
|
|
|
|
|
|
|
|
|
|
|
Net increase (decrease) in cash, cash equivalents, restricted cash, and restricted cash equivalents (NOTE 2) |
|
$ |
82,287 |
|
$ |
(1,017) |
|
$ |
19,557 |
|
|
|
Cash, cash equivalents, restricted cash, and restricted cash equivalents at beginning of period |
|
|
213,467 |
|
|
214,484 |
|
|
194,927 |
|
|
|
Total of cash, cash equivalents, restricted cash, and restricted cash equivalents at end of period |
|
$ |
295,754 |
|
$ |
213,467 |
|
$ |
214,484 |
|
|
|
|
|
|
|
|
|
|
|
|
|
|
|
|
Supplemental Disclosure of Cash Flow Information: |
|
|
|
|
|
|
|
|
|
|
|
|
Cash paid to third parties for interest |
|
$ |
56,267 |
|
$ |
39,311 |
|
$ |
32,854 |
|
|
|
Cash paid for income taxes |
|
|
45,524 |
|
|
34,432 |
|
|
34,832 |
|
|
See accompanying notes to consolidated financial statements.
F-8
These financial statements represent the consolidated financial position and results of operations of Walker & Dunlop, Inc. and its subsidiaries. Unless the context otherwise requires, references to “we,” “us,” “our,” “Walker & Dunlop” and the “Company” mean the Walker & Dunlop consolidated companies.
Walker & Dunlop, Inc. is a holding company and conducts the majority of its operations through Walker & Dunlop, LLC, the operating company. Walker & Dunlop is one of the leading commercial real estate services and finance companies in the United States. The Company originates, sells, and services a range of multifamily and other commercial real estate financing products and provides multifamily investment sales brokerage services. The Company originates and sells loans pursuant to the programs of the Federal National Mortgage Association (“Fannie Mae”) and the Federal Home Loan Mortgage Corporation (“Freddie Mac,” and together with Fannie Mae, the “GSEs”), the Government National Mortgage Association (“Ginnie Mae”) and the Federal Housing Administration, a division of the U.S. Department of Housing and Urban Development (together with Ginnie Mae, “HUD”). The Company also offers a proprietary loan program offering interim loans (the “Interim Program”).
During the second quarter of 2017, the Company formed a joint venture with an affiliate of one of the world’s largest owners of commercial real estate to originate, finance, and hold loans that previously met the criteria of the Interim Program (the “Interim Program JV”). The Interim Program JV assumes full risk of loss while the loans it originates are outstanding. The Company holds a 15% ownership interest in the joint venture and is responsible for underwriting, servicing, and asset-managing the loans originated by the Interim Program JV. The Interim Program JV funds its operations using a combination of equity contributions from the partners and third-party credit facilities. The Company expects that substantially all loans satisfying the criteria for the Interim Program will be originated by the Interim Program JV going forward; however, the Company may opportunistically originate loans held for investment through the Interim Program in the future. During the third quarter of 2017, the Company sold certain loans from its portfolio of interim loans with an unpaid principal balance of $119.8 million to the Interim Program JV at par. The Company does not expect to sell additional loans held for investment to the Interim Program JV. The Company does not consolidate the activities of the Interim Program JV; therefore, it accounts for the activities associated with its ownership interest using the equity method.
NOTE 2—SUMMARY OF SIGNIFICANT ACCOUNTING POLICIES
Principles of Consolidation—The consolidated financial statements include the accounts of the Company and all of its consolidated entities. All intercompany transactions have been eliminated. When the Company has significant influence over operating and financial decisions for an entity but does not own a majority of the voting interests, the Company accounts for the investment using the equity method of accounting.
Subsequent Events—The Company has evaluated the effects of all events that have occurred subsequent to December 31, 2017. There have been no material events that would require recognition in the consolidated financial statements. The Company has made certain disclosures in the notes to the consolidated financial statements of events that have occurred subsequent to December 31, 2017. No other material subsequent events have occurred that would require disclosure.
Use of Estimates—The preparation of consolidated financial statements in accordance with accounting principles generally accepted in the United States of America (“GAAP”) requires management to make estimates and assumptions that affect the reported amounts of assets, liabilities, revenues, and expenses, including guaranty obligations, allowance for risk-sharing obligations, capitalized mortgage servicing rights, derivative instruments, and the disclosure of contingent assets and liabilities. Actual results may vary from these estimates.
F-9
Gains from Mortgage Banking Activities and Mortgage Servicing Rights—Gains from mortgage banking activities income is recognized when the Company records a derivative asset upon the commitment to originate a loan with a borrower and sell the loan to an investor. This commitment asset is recognized at fair value, which reflects the fair value of the contractual loan origination related fees and sale premiums, net of any co-broker fees, and the estimated fair value of the expected net cash flows associated with the servicing of the loan, net of the estimated net future cash flows associated with any guaranty obligations retained. For loans the Company brokers, gains from mortgage banking activities are recognized when the loan is closed and represent the origination fee earned by the Company. The co-broker fees for the years ended December 31, 2017, 2016, and 2015 were $19.3 million, $35.8 million, and $18.0 million, respectively.
Transfer of financial assets is reported as a sale when (a) the transferor surrenders control over those assets, (b) the transferred financial assets have been legally isolated from the Company’s creditors, (c) the transferred assets can be pledged or exchanged by the transferee, and (d) consideration other than beneficial interests in the transferred assets is received in exchange. The transferor is considered to have surrendered control over transferred assets if, and only if, certain conditions are met. The Company determined that all loans sold during the periods presented met these specific conditions and accounted for all transfers of loans held for sale as completed sales.
When a loan is sold, the Company retains the right to service the loan and initially recognizes an individual mortgage servicing right (“MSR”) for the loan sold at fair value. The initial capitalized amount is equal to the estimated fair value of the expected net cash flows associated with servicing the loans, net of the expected net cash flows associated with any guaranty obligations. The following describes the principal assumptions used in estimating the value of capitalized MSRs:
Discount rate—Depending upon loan type, the discount rate used is management's best estimate of market discount rates. The rates used for loans sold were 10% to 15% for each of the periods presented and varied based on loan type.
Estimated Life—The estimated life of the MSRs is derived based upon the stated yield maintenance and/or prepayment protection term of the underlying loan and may be reduced by 6 to 12 months based upon the expiration of various types of prepayment provisions and/or lockout provisions prior to that stated maturity date. The Company’s model for originated MSRs assumes no prepayment while the prepayment provisions have not expired and full prepayment of the loan at or near the point where the prepayment provisions have expired. The Company’s historical experience is that the prepayment provisions typically do not provide a significant deterrent to a borrower’s paying off the loan within 6 to 12 months of the expiration of the prepayment provisions.
Servicing Cost—The estimated future cost to service the loan for the estimated life of the MSR is subtracted from the estimated future cash flows.
The assumptions used to estimate the fair value of MSRs at loan sale are based on internal models and are compared to assumptions used by other market participants periodically. When such comparisons indicate that these assumptions have changed significantly, the Company adjusts its assumptions accordingly.
Subsequent to the initial measurement date, MSRs are amortized using the interest method over the period that servicing income is expected to be received and presented as a component of Amortization and depreciation in the Consolidated Statements of Income. For MSRs recognized at loan sale, the individual loan-level MSR is written off through a charge to Amortization and depreciation when a loan prepays, defaults, or is probable of default. We evaluate MSRs for impairment quarterly. The Company tests for impairment on the purchased stand-alone servicing portfolio separately from the Company’s other MSRs. The MSRs from both stand-alone portfolio purchases and from loan sales are tested for impairment at the portfolio level. The Company engages a third party to assist in determining an estimated fair value of our existing and outstanding MSRs on at least a semi-annual basis.
The fair value of MSRs acquired through a stand-alone servicing portfolio purchase is equal to the purchase price paid. For purchased stand-alone servicing portfolios, we record a portfolio-level MSR asset and determine the estimated
F-10
life of the portfolio based on the prepayment characteristics of the portfolio. We subsequently amortize such MSRs and test for impairment quarterly as discussed in more detail above.
For MSRs related to purchased stand-alone servicing portfolios, a constant rate of prepayments and defaults is included in the determination of the portfolio’s estimated life (and thus included as a component of the portfolio’s amortization). Accordingly, prepayments and defaults of individual MSRs do not change the level of amortization expense recorded for the portfolio unless the pattern of actual prepayments and defaults varies significantly from the estimated pattern. When such a significant difference in the pattern of estimated and actual prepayments and defaults occurs, we prospectively adjust the estimated life of the portfolio (and thus future amortization) to approximate the actual pattern observed.
Guaranty Obligation and Allowance for Risk-sharing Obligations—When a loan is sold under the Fannie Mae DUS program, the Company undertakes an obligation to partially guarantee the performance of the loan. Upon loan sale, a liability for the fair value of the obligation undertaken in issuing the guaranty is recognized and presented as Guaranty obligation, net of accumulated amortization on the Consolidated Balance Sheets. The recognized guaranty obligation is the greater of the fair value of the Company’s obligation to stand ready to perform over the term of the guaranty (the noncontingent guaranty) and the fair value of the Company’s obligation to make future payments should those triggering events or conditions occur (contingent guaranty).
Historically, the fair value of the contingent guaranty at inception has been de minimis; therefore, the fair value of the noncontingent guaranty has been recognized. In determining the fair value of the guaranty obligation, the Company considers the risk profile of the collateral, historical loss experience, and various market indicators. Generally, the estimated fair value of the guaranty obligation is based on the present value of the cash flows expected to be paid under the guaranty over the estimated life of the loan (historically three to five basis points per year) discounted using a 12-15 percent discount rate. The discount rate used is consistent with what is used for the calculation of the MSR for each loan. The estimated life of the guaranty obligation is the estimated period over which the Company believes it will be required to stand ready under the guaranty. Subsequent to the initial measurement date, the liability is amortized over the life of the guaranty period using the straight-line method as a component of and reduction to Amortization and depreciation in the Consolidated Statements of Income, unless, as discussed more fully below, the loan defaults, or management determines that the loan’s risk profile is such that amortization should cease.
The Company monitors the performance of each risk-sharing loan for events or conditions which may signal a potential default. Our process for identifying which risk-sharing loans may be probable of loss consists of an assessment of several qualitative and quantitative factors including payment status, property financial performance, local real estate market conditions, loan-to-value ratio, debt-service-coverage ratio, and property condition. Historically, initial loss recognition occurs at or before a loan becomes 60 days delinquent. In instances where payment under the guaranty on a specific loan is determined to be probable and estimable (as the loan is probable of foreclosure or in foreclosure), the Company records a liability for the estimated allowance for risk-sharing (a “specific reserve”) through a charge to the provision for risk-sharing obligations, which is a component of Provision (benefit) for credit losses in the Consolidated Statements of Income, along with a write-off of the associated loan-specific MSR.
The amount of the allowance considers the Company’s assessment of the likelihood of repayment by the borrower or key principal(s), the risk characteristics of the loan, the loan’s risk rating, historical loss experience, adverse situations affecting individual loans, the estimated disposition value of the underlying collateral, and the level of risk sharing. The estimate of property fair value at initial recognition of the allowance for risk-sharing obligations is based on appraisals, broker opinions of value, or net operating income and market capitalization rates, depending on the facts and circumstances associated with the loan. We regularly monitor the specific reserves on all applicable loans and update loss estimates as current information is received. The settlement with Fannie Mae is based on the actual sales price of the property and selling and property preservation costs and considers the Fannie Mae loss-sharing requirements.
F-11
In addition to the specific reserves discussed above, the Company also records an allowance for risk-sharing obligations related to risk-sharing loans on its watch list (“general reserves”). Such loans are not probable of foreclosure but are probable of loss as the characteristics of these loans indicate that it is probable that these loans include some losses even though the loss cannot be attributed to a specific loan. For all other risk-sharing loans not on our watch list, the Company continues to carry a guaranty obligation. The Company calculates the general reserves based on a migration analysis of the loans on its historical watch lists, adjusted for qualitative factors. When the Company places a risk-sharing loan on its watch list, the Company transfers the remaining unamortized balance of the guaranty obligation to the general reserves. The Company recognizes a provision for risk-sharing obligations to the extent the calculated general reserve exceeds the remaining unamortized guaranty obligation. If a risk-sharing loan is subsequently removed from the watch list due to improved financial performance or other factors, the Company transfers the unamortized balance of the guaranty obligation back to the guaranty obligation classification on the balance sheet and amortizes the remaining unamortized balance evenly over the remaining estimated life.
For each loan for which we have a risk-sharing obligation, we record one of the following liabilities associated with that loan as discussed above: guaranty obligation, general reserve, or specific reserve. Although the liability type may change over the life of the loan, at any particular point in time, only one such liability is associated with a loan for which we have a risk-sharing obligation. The total of the specific reserves and general reserves is presented as Allowance for risk-sharing obligations in the Consolidated Balance Sheets.
Loans Held for Investment, net—Loans held for investment are multifamily loans originated by the Company through the Interim Program for properties that currently do not qualify for permanent GSE or HUD (collectively, the “Agencies”) financing. These loans have terms of up to three years and are all interest-only, multifamily loans with similar risk characteristics and no geographic concentration. The loans are carried at their unpaid principal balances, adjusted for net unamortized loan fees and costs, and net of any allowance for loan losses. Interest income is accrued based on the actual coupon rate, adjusted for the level-yield amortization of net deferred fees and costs, and is recognized as revenue when earned and deemed collectible.
As of December 31, 2017, Loans held for investment, net consisted of 5 loans with an aggregate $67.0 million of unpaid principal balance less $0.4 million of net unamortized deferred fees and costs and $0.1 million of allowance for loan losses. As of December 31, 2016, Loans held for investment, net consisted of 12 loans with an aggregate $222.3 million of unpaid principal balance less $1.5 million of net unamortized deferred fees and costs and $0.4 million of allowance for loan losses.
The allowance for loan losses is the Company’s estimate of credit losses inherent in the loan portfolio at the balance sheet date. The allowance for loan losses is estimated collectively for loans with similar characteristics and for which there is no evidence of impairment. The collective allowance is based on recent historical loss probability and historical loss rates incurred in our risk-sharing portfolio, adjusted as needed for current market conditions. We use the loss experience from our risk-sharing portfolio as a proxy for losses incurred in our loans held for investment portfolio since (i) we have not experienced any actual losses related to our loans held for investment to date and (ii) the loans in the loans-held-for-investment portfolio have similar characteristics to loans held in the risk-sharing portfolio. The allowance for loan losses recorded as of December 31, 2017 and December 31, 2016 is based on the Company’s collective assessment of the portfolio.
None of the loans held for investment was delinquent, impaired, or on non-accrual status as of December 31, 2017 or December 31, 2016. Additionally, we have not experienced any delinquencies related to these loans or charged off any loan held for investment since the inception of the Interim Program in 2012.
Provision (Benefit) for Credit Losses—The Company records the income statement impact of the changes in the allowance for loan losses and the allowance for risk-sharing obligations within Provision (benefit) for credit losses in the
F-12
Consolidated Statements of Income. Provision (benefit) for credit losses consisted of the following activity for the years ended December 31, 2017, 2016, and 2015:
|
(in thousands) |
|
2017 |
|
2016 |
|
2015 |
|
|||
|
Benefit for loan losses |
|
$ |
(294) |
|
$ |
(467) |
|
$ |
(36) |
|
|
Provision (benefit) for risk-sharing obligations |
|
|
51 |
|
|
(145) |
|
|
1,680 |
|
|
Provision (benefit) for credit losses |
|
$ |
(243) |
|
$ |
(612) |
|
$ |
1,644 |
|
Business Combinations—The Company accounts for business combinations using the acquisition method of accounting, under which the purchase price of the acquisition is allocated to the assets acquired and liabilities assumed using the fair values determined by management as of the acquisition date. The Company recognizes identifiable assets acquired and liabilities (both specific and contingent) assumed at their fair values at the acquisition date. Furthermore, acquisition-related costs, such as due diligence, legal and accounting fees, are not capitalized or applied in determining the fair value of the acquired assets. The excess of the purchase price over the assets acquired, identifiable intangible assets and liabilities assumed is recognized as goodwill. During the measurement period, the Company records adjustments to the assets acquired and liabilities assumed with corresponding adjustments to goodwill in the reporting period in which the adjustment is identified. After the measurement period, which could be up to one year after the transaction date, subsequent adjustments are recorded to the Company’s Consolidated Statements of Income.
Goodwill—The Company evaluates goodwill for impairment annually. In addition to the annual impairment evaluation, the Company evaluates at least quarterly whether events or circumstances have occurred in the period subsequent to the annual impairment testing which indicate that it is more likely than not an impairment loss has occurred. The Company currently has only one reporting unit; therefore, all goodwill is allocated to that one reporting unit. The Company performs its impairment testing annually as of October 1. The annual impairment analysis begins by comparing the Company’s market capitalization to its net assets. If the market capitalization exceeds the net asset value, further analysis is not required, and goodwill is not considered impaired. As of the date of our latest annual impairment test, October 1, 2017, the Company’s market capitalization exceeded its net asset value by $937.9 million, or 131.8%. As of December 31, 2017, there have been no events subsequent to that analysis that are indicative of an impairment loss.
Derivative Assets and Liabilities—Certain loan commitments and forward sales commitments meet the definition of a derivative and are recorded at fair value in the Consolidated Balance Sheets. The estimated fair value of loan commitments includes the fair value of loan origination fees and premiums on anticipated sale of the loan, net of co-broker fees, and the fair value of the expected net cash flows associated with the servicing of the loan, net of any estimated net future cash flows associated with the risk-sharing obligation. The estimated fair value of forward sale commitments includes the effects of interest rate movements between the trade date and balance sheet date. Adjustments to the fair value are reflected as a component of income within Gains on mortgage banking in the Consolidated Statements of Income.
Loans Held for Sale—Loans held for sale represent originated loans that are generally transferred or sold within 60 days from the date that a mortgage loan is funded. The Company initially measures all originated loans at fair value. Subsequent to initial measurement, the Company measures all mortgage loans at fair value, unless the Company documents at the time the loan is originated that it will measure the specific loan at the lower of cost or fair value for the life of the loan. Electing to use fair value allows a better offset of the change in fair value of the loan and the change in fair value of the derivative instruments used as economic hedges. During the period prior to its sale, interest income on a loan held for sale is calculated in accordance with the terms of the individual loan. There were no loans held for sale that were valued at the lower of cost or fair value or on a non-accrual status at December 31, 2017 and 2016.
Share-Based Payment—The Company recognizes compensation costs for all share-based payment awards made to employees and directors, including restricted stock, restricted stock units, and employee stock options based on the grant date fair value.
F-13
Restricted stock awards are granted without cost to the Company’s officers, employees, and non-employee directors, for which the fair value of the award was calculated as the fair value of the Company’s common stock on the date of grant.
Stock option awards are granted to executive officers, with an exercise price equal to the closing price of the Company’s common stock on the date of the grant, and are granted with a ten-year exercise period, vesting ratably over three years dependent solely on continued employment. To estimate the grant-date fair value of stock options, the Company uses the Black-Scholes pricing model. The Black-Scholes model estimates the per share fair value of an option on its date of grant based on the following inputs: the option’s exercise price, the price of the underlying stock on the date of the grant, the estimated option life, the estimated dividend yield, a “risk-free” interest rate, and the expected volatility. For each of the years presented, the Company used the simplified method to estimate the expected term of the options as the Company did not have sufficient historical exercise data to provide a reasonable basis for estimating the expected term. The Company has historically used an estimated dividend yield of zero as the Company’s stock options are not dividend eligible and at the time of grant there was no expectation that the Company would pay a dividend. For the “risk-free” rate, the Company uses a U.S. Treasury Note due in a number of years equal to the option’s expected term. For all years presented in the Consolidated Statements of Income, the expected volatility was calculated based on the Company’s historical common stock volatility. The Company issues new shares from the pool of authorized but not yet issued shares when an employee exercises stock options.
Generally, the Company’s stock option and restricted stock awards for its officers and employees vest ratably over a three-year period based solely on continued employment. Restricted stock awards for non-employee directors fully vest after one year.
In 2014, 2016, and 2017, the Company offered a performance share plan (“PSP”) for the Company’s executives and certain other members of senior management. The performance period for each PSP is three full calendar years beginning on January 1 of the first year of the performance period. Participants in the PSP receive restricted stock units (“RSUs”) on the grant date for the PSP in an amount equal to achievement of all performance targets at a maximum level. If the performance targets are met at the end of the performance period and the participant remains employed by the Company, the participant fully vests in the RSUs, which immediately convert to unrestricted shares of common stock. If the performance targets are not met at the maximum level, the participant forfeits a portion of the RSUs. If the participant is no longer employed by the Company, the participant forfeits all of the RSUs. The performance targets for the 2014 PSP are based on meeting adjusted diluted earnings per share and total revenues goals. The performance targets for the 2016 and 2017 PSPs are based on meeting diluted earnings per share, return on equity, and total revenues goals. The Company records compensation expense for the PSP based on the grant-date fair value in an amount proportionate to the service time rendered by the participant when it is probable that the achievement of the goals will be met.
Compensation expense for restricted shares and stock options is adjusted for actual forfeitures and is recognized on a straight-line basis, for each separately vesting portion of the award as if the award were in substance multiple awards, over the requisite service period of the award. Share-based compensation is recognized within the income statement as Personnel, the same expense line as the cash compensation paid to the respective employees.
Net Warehouse Interest Income—The Company presents warehouse interest income net of warehouse interest expense. Warehouse interest income is the interest earned from loans held for sale and loans held for investment. For the periods presented in the Consolidated Balance Sheets, all loans that were held for sale were financed with matched borrowings under our warehouse facilities incurred to fund a specific loan held for sale. A portion of all loans that are held for investment is financed with matched borrowings under our warehouse facilities. The portion of loans held for investment not funded with matched borrowings is financed with the Company’s own cash. Warehouse interest expense is incurred on borrowings used to fund loans solely while they are held for sale or for investment. Warehouse interest income and expense are earned or incurred on loans held for sale after a loan is closed and before a loan is sold. Warehouse interest income and expense are earned or incurred on loans held for investment after a loan is closed and before a loan is repaid.
F-14
Included in Net warehouse interest income for the years ended December 31, 2017, 2016, and 2015 are the following components:
|
|
|
|
|
|
|
|
|
|
|
|
|
|
For the year ended December 31, |
|||||||
|
(in thousands) |
|
2017 |
|
2016 |
|
2015 |
|||
|
Warehouse interest income - loans held for sale |
|
$ |
61,298 |
|
$ |
47,523 |
|
$ |
37,675 |
|
Warehouse interest expense - loans held for sale |
|
|
(46,221) |
|
|
(31,278) |
|
|
(23,134) |
|
Net warehouse interest income - loans held for sale |
|
$ |
15,077 |
|
$ |
16,245 |
|
$ |
14,541 |
|
|
|
|
|
|
|
|
|
|
|
|
Warehouse interest income - loans held for investment |
|
$ |
15,218 |
|
$ |
12,808 |
|
$ |
15,456 |
|
Warehouse interest expense - loans held for investment |
|
|
(5,828) |
|
|
(5,326) |
|
|
(6,037) |
|
Net warehouse interest income - loans held for investment |
|
$ |
9,390 |
|
$ |
7,482 |
|
$ |
9,419 |
Statement of Cash Flows—The Company records the fair value of premiums and origination fees as a component of the fair value of derivatives when a loan intended to be sold is rate locked and records the related income within Gains from mortgage banking activities within the Consolidated Statements of Income. The cash for the origination fee is received upon closing of the loan, and the cash for the premium is received upon loan sale, resulting in a mismatch of the recognition of income and the receipt of cash in a given period when the derivative or loan held for sale remains outstanding at period end.
The Company accounts for this mismatch by recording an adjustment called Change in the fair value of premiums and origination fees within the Consolidated Statements of Cash Flows. The amount of the adjustment reflects a reduction to cash provided by or used in operations for the amount of income recognized upon rate lock (i.e., non-cash income) for derivatives and loans held for sale outstanding at period end and an increase to cash provided by or used in operations for cash received upon loan origination or sale for derivatives and loans held for sale that were outstanding at prior period end. When income recognized upon rate lock is greater than cash received upon loan origination or sale, the adjustment is a negative amount. When income recognized upon rate lock is less than cash received upon loan origination or loan sale, the adjustment is a positive amount.
For presentation in the Consolidated Statements of Cash Flows, the Company considers Pledged securities, at fair value to be restricted cash equivalents. The following table presents a reconciliation of the total of cash, cash equivalents, restricted cash, and restricted cash equivalents as presented in the Consolidated Statements of Cash Flows to the related captions in the Consolidated Balance Sheets as of December 31, 2017, 2016, 2015, and 2014.
|
|
December 31, |
|
||||||||||
|
(in thousands) |
2017 |
|
2016 |
|
2015 |
|
2014 |
|
||||
|
Cash and cash equivalents |
$ |
191,218 |
|
$ |
118,756 |
|
$ |
136,988 |
|
$ |
113,354 |
|
|
Restricted cash |
|
6,677 |
|
|
9,861 |
|
|
5,306 |
|
|
13,854 |
|
|
Pledged securities, at fair value (restricted cash equivalents) |
|
97,859 |
|
|
84,850 |
|
|
72,190 |
|
|
67,719 |
|
|
Total cash, cash equivalents, restricted cash, and restricted cash equivalents |
$ |
295,754 |
|
$ |
213,467 |
|
$ |
214,484 |
|
$ |
194,927 |
|
Income Taxes—The Company files income tax returns in the applicable U.S. federal, state, and local jurisdictions and generally is subject to examination by the respective jurisdictions for three years from the filing of a tax return. The Company accounts for income taxes using the asset and liability method. Deferred tax assets and liabilities are recognized for the estimated future tax consequences attributable to the differences between the financial statement carrying amounts of existing assets and liabilities and their respective tax bases. Deferred tax assets and liabilities are measured using enacted tax rates in effect for the year in which those temporary differences are expected to be recovered or settled. The effect on deferred tax assets and liabilities from a change in tax rates is recognized in earnings in the period when the new rate is enacted.
F-15
Deferred tax assets are recognized only to the extent that it is more likely than not that they will be realizable based on consideration of available evidence, including future reversals of existing taxable temporary differences, projected future taxable income, and tax planning strategies.
The Company had no accruals for tax uncertainties as of December 31, 2017 and 2016.
Comprehensive Income—For the years ended December 31, 2017, 2016, and 2015, comprehensive income equaled Net income before noncontrolling interests; therefore, a separate statement of comprehensive income is not included in the accompanying consolidated financial statements.
Pledged Securities—As collateral against its Fannie Mae risk-sharing obligations (NOTES 5 and 10), certain securities have been pledged to the benefit of Fannie Mae to secure the Company's risk-sharing obligations. The balance of securities pledged against Fannie Mae risk-sharing obligations and included as a component of Pledged securities, at fair value within the Consolidated Balance Sheets as of December 31, 2017 and 2016 was $95.7 million and $80.5 million, respectively. Additionally, the Company has pledged an immaterial amount of cash as collateral against its risk-sharing obligations with Fannie Mae and Freddie Mac. The pledged securities as of December 31, 2017 and 2016 consist primarily of a highly liquid investment valued using quoted market prices from recent trades, and are therefore considered restricted cash equivalents for presentation in the Consolidated Statements of Cash Flows.
Cash and Cash Equivalents—The term cash and cash equivalents, as used in the accompanying consolidated financial statements, includes currency on hand, demand deposits with financial institutions, and short-term, highly liquid investments purchased with an original maturity of three months or less. The Company had no cash equivalents as of December 31, 2017 and 2016.
Restricted Cash—Restricted cash represents primarily good faith deposits from borrowers. The Company records a corresponding liability for these good faith deposits from borrowers within Performance deposits from borrowers within the Consolidated Balance Sheets.
Servicing Fees and Other Receivables, Net—Servicing fees and other receivables, net represents amounts currently due to the Company pursuant to contractual servicing agreements, investor good faith deposits held in escrow by others, general accounts receivable, and advances of principal and interest payments and tax and insurance escrow amounts if the borrower is delinquent in making loan payments, to the extent such amounts are determined to be reimbursable and recoverable.
Concentrations of Credit Risk—Financial instruments, which potentially subject the Company to concentrations of credit risk, consist principally of cash and cash equivalents, loans held for sale, and derivative financial instruments.
The Company places the cash and temporary investments with high-credit-quality financial institutions and believes no significant credit risk exists. The counterparties to the loans held for sale and funding commitments are owners of residential multifamily properties located throughout the United States. Mortgage loans are generally transferred or sold within 60 days from the date that a mortgage loan is funded. There is no material residual counterparty risk with respect to the Company's funding commitments as each potential borrower must make a non-refundable good faith deposit when the funding commitment is executed. The counterparty to the forward sale is Fannie Mae, Freddie Mac, or a broker-dealer that has been determined to be a credit-worthy counterparty by us and our warehouse lenders. There is a risk that the purchase price agreed to by the investor will be reduced in the event of a late delivery. The risk for non-delivery of a loan primarily results from the risk that a borrower does not close on the funding commitment in a timely manner. This risk is generally mitigated by the non-refundable good faith deposit.
Recently Adopted Accounting Pronouncements—In the first quarter of 2017, Accounting Standards Update 2017-04 (“ASU 2017-04”), Intangibles—Goodwill and Other (Topic 350): Simplifying the Test for Goodwill Impairment, was
F-16
issued. ASU 2017-04 simplifies the accounting for goodwill impairment by eliminating the requirement to calculate the implied fair value of a reporting unit’s goodwill. ASU 2017-04 is effective for the Company on January 1, 2020, with early adoption permitted. The Company prospectively adopted ASU 2017-04 in the first quarter of 2017. There was no impact to the Company as the Company was not required to measure a goodwill impairment charge.
In the first quarter of 2017, Accounting Standards Update 2017-01 (“ASU 2017-01”), Business Combinations (Topic 805): Clarifying the Definition of a Business, was issued. ASU 2017-01 changed the definition of a business in an effort to assist entities with evaluating whether a set of transferred assets and activities is a business. ASU 2017-01 is effective for the Company on January 1, 2018, with early adoption permitted. The Company prospectively adopted ASU 2017-01 in the first quarter of 2017 with no current impact to the Company.
In the second quarter of 2014, Accounting Standards Update 2014-09 (“ASU 2014-09”), Revenue from Contracts with Customers (Topic 606) was issued. ASU 2014-09 represents a comprehensive reform of many of the revenue recognition requirements in GAAP. The guidance in the ASU supersedes the revenue recognition requirements in Topic 605, Revenue Recognition, and supersedes or amends much of the industry-specific revenue recognition guidance found throughout the Accounting Standards Codification. The core principle of the guidance is that an entity should recognize revenue to depict the transfer of promised goods or services to customers in an amount that reflects the consideration to which the entity expects to be entitled in exchange for those goods and services. The ASU creates a five-step process for achieving the core principle: 1) identifying the contract with the customer, 2) identifying the performance obligations in the contract, 3) determining the transaction price, 4) allocating the transaction price to the performance obligations, and 5) recognizing revenue when an entity has completed the performance obligations. The ASU also requires additional disclosures that allow users of the financial statements to understand the nature, amount, timing, and uncertainty of revenue and cash flows resulting from contracts with customers. The guidance permits the use of the full retrospective or modified retrospective transition methods.
The Company adopted ASU 2014-09 in the first quarter of 2018 without a material impact to the Company. Substantially all of the Company’s revenue streams are related to loans, derivatives, financial instruments, and transfers and servicing, all of which are outside the scope of the new standard. The Company has also concluded that ASU 2014-09 will not have a significant impact on the Company’s disclosures related to revenue recognition.
In the first quarter of 2016, Accounting Standards Update 2016-01 (“ASU 2016-01”), Financial Instruments – Overall – Recognition and Measurement of Financial Assets and Financial Liabilities was issued. The guidance requires that unconsolidated equity investments not accounted for under the equity method be recorded at fair value, with changes in fair value recorded through net income. The accounting principles that permitted available-for-sale classification with unrealized holding gains and losses recorded in other comprehensive income for equity securities will no longer be applicable. The guidance is not applicable to debt securities and loans and requires minor changes to the disclosure and presentation of financial instruments. The Company adopted ASU 2016-01 in the first quarter of 2018 with no impact to the Company’s reported financial results.
Recently Announced Accounting Pronouncements—In the first quarter of 2016, Accounting Standards Update 2016-02 (“ASU 2016-02”), Leases (Topic 842) was issued. ASU 2016-02 represents a significant reform to the accounting for leases. Lessees initially recognize a lease liability for the obligation to make lease payments and a right-of-use (“ROU”) asset for the right to use the underlying asset for the lease term. The lease liability is measured at the present value of the lease payments over the lease term. The ROU asset is measured at the lease liability amount, adjusted for lease prepayments, lease incentives received, and the lessee’s initial direct costs. Lessees generally recognize lease expense for these leases on a straight-line basis, which is similar to what they do today. ASU 2016-02 requires additional disclosures and is effective for the Company January 1, 2019. It also requires entities to use a modified retrospective approach for leases that exist or are entered into after the beginning of the earliest comparative period in the financial statements with a cumulative-effect adjustment to retained earnings recorded at the earliest comparative period. The Financial Accounting Standards Board (“FASB”) recently issued a proposed update to ASU 2016-02 that would provide companies with the option to
F-17
apply a practical expedient that allows adoption of the provisions of ASU 2016-02 prospectively with a cumulative-effect adjustment recorded to retained earnings upon the date of adoption.
The Company intends to adopt the standard when required on January 1, 2019 and to elect the available practical expedients, including the proposed practical expedient discussed in the previous paragraph, if approved by the FASB. The Company has completed its analysis of the new standard and has begun to adapt our accounting systems for adoption. The Company expects to have its accounting systems ready in time for the adoption next year. The Company is also in the process of analyzing the disclosures that will be required for the new standard. We expect ASU 2016-02 to have an impact on the Consolidated Balance Sheets as quantified below when we recognize ROU assets and the corresponding lease liability. We expect an immaterial impact on the Consolidated Statements of Income. There will be no change to the classification of the Company’s leases, which are all currently classified as operating leases. Based on the Company’s leases as of December 31, 2017, the Company estimates it would record ROU assets of approximately $26.6 million as of December 31, 2017 with a corresponding balance of lease liabilities. The Company expects that the ROU asset and lease liability balances recorded upon adoption will not differ materially from this estimate.
In the second quarter of 2016, Accounting Standards Update 2016-13 (“ASU 2016-13”), Financial Instruments - Credit Losses (Topic 326): Measurement of Credit Losses on Financial Instruments was issued. ASU 2016-13 ("the Standard") represents a significant change to the incurred loss model currently used to account for credit losses. The Standard requires an entity to estimate the credit losses expected over the life of the credit exposure upon initial recognition of that exposure. The expected credit losses consider historical information, current information, and reasonable and supportable forecasts, including estimates of prepayments. Exposures with similar risk characteristics are required to be grouped together when estimating expected credit losses. The initial estimate and subsequent changes to the estimated credit losses are required to be reported in current earnings in the income statement and through an allowance in the balance sheet. ASU 2016-13 is applicable to financial assets subject to credit losses and measured at amortized cost and certain off-balance-sheet credit exposures. The Standard will modify the way the Company estimates its allowance for risk-sharing obligations and its allowance for loan losses. ASU 2016-13 requires modified retrospective application to all outstanding, in-scope instruments, with a cumulative-effect adjustment recorded to opening retained earnings as of the beginning of the period of adoption.
The Company plans on adopting ASU 2016-13 when the standard is required to be adopted, January 1, 2020. The Company is in the preliminary stages of implementation as it is still in the process of determining the significance of the impact the Standard will have on its financial statements and the timing of when it will adopt ASU 2016-13. The Company expects its allowance for risk-sharing obligations to increase when ASU 2016-13 is adopted.
There were no other accounting pronouncements issued during 2018 or 2017 that have the potential to impact the Company’s consolidated financial statements.
Reclassifications—The Company has made certain immaterial reclassifications to prior-year balances to conform to current-year presentation.
NOTE 3—GAINS FROM MORTGAGE BANKING ACTIVITIES
Gains from mortgage banking activities consist of the following activity for each of the years ended December 31, 2017, 2016, and 2015:
|
|
For the year ended December 31, |
|
|||||||
|
(in thousands) |
2017 |
|
2016 |
|
2015 |
|
|||
|
Contractual loan origination related fees, net |
$ |
245,484 |
|
$ |
174,360 |
|
$ |
156,835 |
|
|
Fair value of expected net cash flows from servicing recognized at commitment |
|
207,662 |
|
|
205,311 |
|
|
142,420 |
|
|
Fair value of expected guaranty obligation recognized at commitment |
|
(13,776) |
|
|
(12,486) |
|
|
(8,789) |
|
|
Total gains from mortgage banking activities |
$ |
439,370 |
|
$ |
367,185 |
|
$ |
290,466 |
|
F-18
NOTE 4—MORTGAGE SERVICING RIGHTS
The fair value of MSRs at December 31, 2017 and December 31, 2016 was $834.5 million and $669.4 million, respectively. The Company uses a discounted static cash flow valuation approach and the key economic assumption is the discount rate. See the following sensitivities related to the discount rate:
The impact of a 100-basis point increase in the discount rate at December 31, 2017 is a decrease in the fair value of $26.3 million to the MSRs outstanding as of December 31, 2017.
The impact of a 200-basis point increase in the discount rate at December 31, 2017 is a decrease in the fair value of $50.8 million to the MSRs outstanding as of December 31, 2017.
These sensitivities are hypothetical and should be used with caution. These estimates do not include interplay among assumptions and are estimated as a portfolio rather than individual assets.
Activity related to capitalized MSRs for the year ended December 31, 2017 and 2016 follows:
|
|
|
For the year ended December 31, |
|
||||
|
(in thousands) |
|
2017 |
|
2016 |
|
||
|
Beginning balance |
|
$ |
521,930 |
|
$ |
412,348 |
|
|
Additions, following the sale of loan |
|
|
239,503 |
|
|
181,032 |
|
|
Purchases |
|
|
7,781 |
|
|
43,097 |
|
|
Amortization |
|
|
(119,599) |
|
|
(99,417) |
|
|
Pre-payments and write-offs |
|
|
(14,859) |
|
|
(15,130) |
|
|
Ending balance |
|
$ |
634,756 |
|
$ |
521,930 |
|
As shown in the table above, during 2016 and 2017, the Company purchased MSRs. In both years, the servicing rights acquired were for HUD loans. The servicing portfolio acquired in 2016 consisted of approximately $3.6 billion of unpaid principal balance and had a weighted average estimated remaining life of 10.9 years. The servicing portfolio acquired in 2017 consisted of approximately $0.6 billion of unpaid principal balance and had a weighted average estimated remaining life of 10.7 years.
The following tables summarize the components of the net carrying value of the Company’s acquired and originated MSRs as of December 31, 2017 and 2016:
|
|
|
As of December 31, 2017 |
|
|||||||
|
|
|
Gross |
|
Accumulated |
|
Net |
|
|||
|
(in thousands) |
|
carrying value |
|
amortization |
|
carrying value |
|
|||
|
Acquired MSRs |
|
$ |
183,715 |
|
$ |
(121,643) |
|
$ |
62,072 |
|
|
Originated MSRs |
820,137 |
(247,453) |
572,684 |
|||||||
|
Total |
|
$ |
1,003,852 |
|
$ |
(369,096) |
|
$ |
634,756 |
|
F-19
|
|
|
As of December 31, 2016 |
|
|||||||
|
|
|
Gross |
|
Accumulated |
|
Net |
|
|||
|
(in thousands) |
|
carrying value |
|
amortization |
|
carrying value |
|
|||
|
Acquired MSRs |
|
$ |
175,934 |
|
$ |
(104,264) |
|
$ |
71,670 |
|
|
Originated MSRs |
|
|
642,030 |
|
|
(191,770) |
|
|
450,260 |
|
|
Total |
|
$ |
817,964 |
|
$ |
(296,034) |
|
$ |
521,930 |
|
|
|
|
|
|
|
|
|
|
|
|
|
The expected amortization of MSRs recorded as of December 31, 2017 is shown in the table below. Actual amortization may vary from these estimates.
|
|
|
Originated MSRs |
|
Acquired MSRs |
|
Total MSRs |
|
|||
|
(in thousands) |
|
Amortization |
|
Amortization |
|
Amortization |
|
|||
|
Year Ending December 31, |
|
|
|
|
|
|
|
|
|
|
|
2018 |
|
$ |
107,258 |
|
$ |
11,828 |
|
$ |
119,086 |
|
|
2019 |
|
|
93,265 |
|
|
10,694 |
|
|
103,959 |
|
|
2020 |
|
|
82,695 |
|
|
9,183 |
|
|
91,878 |
|
|
2021 |
|
|
72,138 |
|
|
7,512 |
|
|
79,650 |
|
|
2022 |
|
|
59,073 |
|
|
5,662 |
|
|
64,735 |
|
|
Thereafter |
|
|
158,255 |
|
|
17,193 |
|
|
175,448 |
|
|
Total |
|
$ |
572,684 |
|
$ |
62,072 |
|
$ |
634,756 |
|
|
|
|
|
|
|
|
|
|
|
|
|
The Company recorded write-offs of MSRs related to loans that were repaid prior to the expected maturity and loans that defaulted. These write-offs are included as a component of Amortization and depreciation in the accompanying Consolidated Statements of Income and the MSR roll forward shown above and relate to MSRs recognized at loan sale only. Prepayment fees totaling $17.3 million, $10.6 million, and $15.0 million were collected for 2017, 2016, and 2015, respectively, and are included as a component of Other revenues in the Consolidated Statements of Income. All other ancillary servicing fees were immaterial for the periods presented.
Management reviews the capitalized MSRs for temporary impairment quarterly by comparing the aggregate carrying value of the MSR portfolio to the aggregate estimated fair value of the portfolio. Additionally, MSRs related to Fannie Mae loans where the Company has risk-sharing obligations are assessed for permanent impairment on an asset-by-asset basis, considering factors such as debt service coverage ratio, property location, loan-to-value ratio, and property type. Except for defaulted or prepaid loans, no temporary or permanent impairment was recognized for the years ended December 31, 2017, 2016, and 2015.
The weighted average remaining life of the aggregate MSR portfolio is 7.4 years.
NOTE 5—GUARANTY OBLIGATION AND ALLOWANCE FOR RISK-SHARING OBLIGATIONS
When a loan is sold under the Fannie Mae DUS program, the Company typically agrees to guarantee a portion of the ultimate loss incurred on the loan should the borrower fail to perform. The compensation for this risk is a component of the servicing fee on the loan. No guaranty is provided for loans sold under the Freddie Mac or HUD loan programs.
F-20
A summary of the Company’s guaranty obligation for the noncontingent portion of the guaranty obligation as of and for the years ended December 31, 2017 and 2016 follows:
|
|
|
For the year ended December 31, |
|
||||
|
(in thousands) |
|
2017 |
|
2016 |
|
||
|
Beginning balance |
|
$ |
32,292 |
|
$ |
27,570 |
|
|
Additions, following the sale of loan |
|
|
16,039 |
|
|
10,597 |
|
|
Amortization |
|
|
(7,025) |
|
|
(5,946) |
|
|
Other |
|
|
(119) |
|
|
71 |
|
|
Ending balance |
|
$ |
41,187 |
|
$ |
32,292 |
|
|
|
|
|
|
|
|
|
|
A summary of the Company’s allowance for risk-sharing obligations for the contingent portion of the guaranty obligation as of and for the years ended December 31, 2017 and 2016 follows:
|
|
|
For the year ended December 31, |
|
||||
|
(in thousands) |
|
2017 |
|
2016 |
|
||
|
Beginning balance |
|
$ |
3,613 |
|
$ |
5,586 |
|
|
Provision (benefit) for risk-sharing obligations |
|
|
51 |
|
|
(145) |
|
|
Write-offs |
|
|
— |
|
|
(1,757) |
|
|
Other |
|
|
119 |
|
|
(71) |
|
|
Ending balance |
|
$ |
3,783 |
|
$ |
3,613 |
|
|
|
|
|
|
|
|
|
|
When the Company places a loan for which it has a risk-sharing obligation on its watch list, the Company ceases to amortize the guaranty obligation and transfers the remaining unamortized balance of the guaranty obligation to the allowance for risk-sharing obligations. When a loan for which the Company has a risk-sharing obligation is removed from the watch list, the loan’s reserve is transferred from the allowance for risk-sharing obligations to the guaranty obligation, and the amortization of the remaining balance over the remaining estimated life is resumed. This net transfer of the unamortized balance of the guaranty obligation from a noncontingent classification to a contingent classification (and vice versa) is presented in the guaranty obligation and allowance for risk-sharing obligations tables above as “Other.”
The Allowance for risk-sharing obligations as of December 31, 2017 is based principally on the Company’s collective assessment of the probability of loss related to the loans on the watch list as of December 31, 2017. The write-offs in the table above for the year ended December 31, 2016 are net of $0.8 million of recoveries. The net benefit for risk-sharing obligations for the year ended December 31, 2016 is the result of the aforementioned recoveries.
During the third quarter of 2017, Hurricanes Harvey and Irma made landfall in the United States, causing substantial damage to the affected areas. Located within the affected areas are multiple properties collateralizing loans for which the Company has risk-sharing obligations. Based on its current assessment of these properties, the Company believes that few, if any, of these properties incurred significant damage, and those that did have adequate insurance coverage. Additionally, the Company has not experienced an increase in late payments from risk-sharing loans collateralized by properties in the affected areas. Accordingly, based on information currently available, these natural disasters did not have a material impact on the Allowance for risk-sharing obligations as of December 31, 2017. Additionally, the Company does not believe that these natural disasters will have a material impact on its Allowance for risk-sharing obligations in the future.
As of December 31, 2017 and 2016, the maximum quantifiable contingent liability associated with the Company’s guarantees under the Fannie Mae DUS agreement was $5.7 billion and $4.9 billion, respectively. This maximum quantifiable contingent liability relates to the at risk loans serviced for Fannie Mae at the specific point in time indicated. The term and the amount of the liability vary with the origination and payoff activity of the at risk portfolio. The maximum quantifiable contingent liability is not representative of the actual loss the Company would incur. The Company would be
F-21
liable for this amount only if all of the loans it services for Fannie Mae, for which the Company retains some risk of loss, were to default and all of the collateral underlying these loans was determined to be without value at the time of settlement.
NOTE 6—SERVICING
The total unpaid principal balance of loans the Company was servicing for various institutional investors was $74.5 billion as of December 31, 2017 compared to $63.1 billion as of December 31, 2016. The December 31, 2017 balance includes the unamortized portion of the addition of $0.6 billion related to purchase activity as more fully discussed in NOTE 4.
As of December 31, 2017 and 2016, custodial escrow accounts relating to loans serviced by the Company totaled $2.0 billion and $1.6 billion, respectively. These amounts are not included in the accompanying consolidated balance sheets as such amounts are not Company assets. Certain cash deposits at other financial institutions exceed the Federal Deposit Insurance Corporation insured limits. The Company places these deposits with financial institutions that meet the requirements of the Agencies and where it believes the risk of loss to be minimal.
NOTE 7—DEBT
At December 31, 2017, to provide financing to borrowers under the Agencies’ programs, the Company has committed and uncommitted warehouse lines of credit in the amount of $3.3 billion with certain national banks and a $1.5 billion uncommitted facility with Fannie Mae (collectively, the “Agency Warehouse Facilities”). In support of these Agency Warehouse Facilities, the Company has pledged substantially all of its loans held for sale under the Company's approved programs. The Company’s ability to originate mortgage loans depends upon its ability to secure and maintain these types of short-term financings on acceptable terms.
Additionally, at December 31, 2017, the Company has arranged for warehouse lines of credit in the amount of $0.3 billion with certain national banks to assist in funding loans held for investment under the Interim Program (“Interim Warehouse Facilities”). The Company has pledged substantially all of its loans held for investment against these Interim Warehouse Facilities. The Company’s ability to originate loans held for investment depends upon its ability to secure and maintain these types of short-term financings on acceptable terms.
F-22
The maximum amount and outstanding borrowings under the warehouse notes payable at December 31, 2017 and 2016 follow:
|
|
|
December 31, 2017 |
|
|
|
|||||||||||||
|
(dollars in thousands) |
|
Committed |
|
Uncommitted |
|
Temporary |
|
Total Facility |
|
Outstanding |
|
|
|
|||||
|
Facility1 |
|
Amount |
|
Amount |
|
Increase |
|
Capacity |
|
Balance |
|
Interest rate |
|
|||||
|
Agency Warehouse Facility #1 |
|
$ |
425,000 |
|
$ |
300,000 |
|
$ |
— |
|
$ |
725,000 |
|
$ |
100,188 |
|
30-day LIBOR plus 1.30% |
|
|
Agency Warehouse Facility #2 |
|
|
500,000 |
|
|
300,000 |
|
|
— |
|
|
800,000 |
|
|
346,291 |
|
30-day LIBOR plus 1.30% |
|
|
Agency Warehouse Facility #3 |
|
|
480,000 |
|
|
— |
|
|
400,000 |
|
|
880,000 |
|
|
44,619 |
|
30-day LIBOR plus 1.25% |
|
|
Agency Warehouse Facility #4 |
|
|
350,000 |
|
|
— |
|
|
— |
|
|
350,000 |
|
|
129,787 |
|
30-day LIBOR plus 1.30% |
|
|
Agency Warehouse Facility #5 |
|
|
30,000 |
|
|
— |
|
|
— |
|
|
30,000 |
|
|
19,057 |
|
30-day LIBOR plus 1.80% |
|
|
Agency Warehouse Facility #6 |
|
|
250,000 |
|
|
250,000 |
|
|
— |
|
|
500,000 |
|
|
130,859 |
|
30-day LIBOR plus 1.35% |
|
|
Fannie Mae repurchase agreement, uncommitted line and open maturity |
|
|
— |
|
|
1,500,000 |
|
|
— |
|
|
1,500,000 |
|
|
123,153 |
|
30-day LIBOR plus 1.15% |
|
|
Total Agency Warehouse Facilities |
|
$ |
2,035,000 |
|
$ |
2,350,000 |
|
$ |
400,000 |
|
$ |
4,785,000 |
|
$ |
893,954 |
|
|
|
|
|
|
|
|
|
|
|
|
|
|
|
|
|
|
|
|
|
|
|
|
Interim Warehouse Facility #1 |
|
$ |
85,000 |
|
$ |
— |
|
$ |
— |
|
$ |
85,000 |
|
$ |
10,290 |
|
30-day LIBOR plus 1.90% |
|
|
Interim Warehouse Facility #2 |
|
|
100,000 |
|
|
— |
|
|
— |
|
|
100,000 |
|
|
24,662 |
|
30-day LIBOR plus 2.00% |
|
|
Interim Warehouse Facility #3 |
|
|
75,000 |
|
|
— |
|
|
— |
|
|
75,000 |
|
|
10,594 |
|
30-day LIBOR plus 2.00% to 2.50% |
|
|
Total Interim Warehouse Facilities |
|
$ |
260,000 |
|
$ |
— |
|
$ |
— |
|
$ |
260,000 |
|
$ |
45,546 |
|
|
|
|
Debt issuance costs |
|
|
— |
|
|
— |
|
|
— |
|
|
— |
|
|
(1,731) |
|
|
|
|
Total warehouse facilities |
|
$ |
2,295,000 |
|
$ |
2,350,000 |
|
$ |
400,000 |
|
$ |
5,045,000 |
|
$ |
937,769 |
|
|
|
|
|
|
|
|
|
|
|
|
|
|
|
|
|
|
|
|
|
|
|
|
|
|
December 31, 2016 |
|
|
|
|||||||||||||
|
(dollars in thousands) |
|
Committed |
|
Uncommitted |
|
Temporary |
|
Total Facility |
|
Outstanding |
|
|
|
|||||
|
Facility1 |
|
Amount |
|
Amount |
|
Increase |
|
Capacity |
|
Balance |
|
Interest rate |
|
|||||
|
Agency Warehouse Facility #1 |
|
$ |
425,000 |
|
$ |
— |
|
$ |
— |
|
$ |
425,000 |
|
$ |
109,087 |
|
30-day LIBOR plus 1.40% |
|
|
Agency Warehouse Facility #2 |
|
|
650,000 |
|
|
— |
|
|
— |
|
|
650,000 |
|
|
274,181 |
|
30-day LIBOR plus 1.40% |
|
|
Agency Warehouse Facility #3 |
|
|
280,000 |
|
|
— |
|
|
400,000 |
|
|
680,000 |
|
|
320,801 |
|
30-day LIBOR plus 1.35% |
|
|
Agency Warehouse Facility #4 |
|
|
350,000 |
|
|
— |
|
|
— |
|
|
350,000 |
|
|
186,869 |
|
30-day LIBOR plus 1.40% |
|
|
Agency Warehouse Facility #5 |
|
|
30,000 |
|
|
— |
|
|
— |
|
|
30,000 |
|
|
14,551 |
|
30-day LIBOR plus 1.80% |
|
|
Fannie Mae repurchase agreement, uncommitted line and open maturity |
|
|
— |
|
|
1,500,000 |
|
|
— |
|
|
1,500,000 |
|
|
943,505 |
|
30-day LIBOR plus 1.15% |
|
|
Total agency warehouse facilities |
|
$ |
1,735,000 |
|
$ |
1,500,000 |
|
$ |
400,000 |
|
$ |
3,635,000 |
|
$ |
1,848,994 |
|
|
|
|
|
|
|
|
|
|
|
|
|
|
|
|
|
|
|
|
|
|
|
|
Interim Warehouse Facility #1 |
|
$ |
85,000 |
|
$ |
— |
|
$ |
— |
|
$ |
85,000 |
|
$ |
36,916 |
|
30-day LIBOR plus 1.90% |
|
|
Interim Warehouse Facility #2 |
|
|
200,000 |
|
|
— |
|
|
— |
|
|
200,000 |
|
|
70,196 |
|
30-day LIBOR plus 2.00% |
|
|
Interim Warehouse Facility #3 |
|
|
75,000 |
|
|
— |
|
|
— |
|
|
75,000 |
|
|
36,005 |
|
30-day LIBOR plus 2.00% to 2.50% |
|
|
Total interim warehouse facilities |
|
$ |
360,000 |
|
$ |
— |
|
$ |
— |
|
$ |
360,000 |
|
$ |
143,117 |
|
|
|
|
Debt issuance costs |
|
|
— |
|
|
— |
|
|
— |
|
|
— |
|
|
(1,928) |
|
|
|
|
Total warehouse facilities |
|
$ |
2,095,000 |
|
$ |
1,500,000 |
|
$ |
400,000 |
|
$ |
3,995,000 |
|
$ |
1,990,183 |
|
|
|
1 Agency Warehouse Facilities and the Fannie Mae repurchase agreement are used to fund loans held for sale, while Interim Warehouse Facilities are used to partially fund loans held for investment.
F-23
30-day LIBOR was 1.56% as of December 31, 2017 and 0.77% as of December 31, 2016. Interest expense under the warehouse notes payable for the years ended December 31, 2017, 2016, and 2015 aggregated to $52.0 million, $36.6 million, and $29.2 million, respectively. Included in interest expense in 2017, 2016, and 2015 are the amortization of facility fees totaling $4.6 million, $5.5 million, and $4.5 million, respectively. The warehouse notes payable are subject to various financial covenants, and the Company was in compliance with all such covenants at December 31, 2017.
Warehouse Facilities
Agency Warehouse Facilities
The following section provides a summary of the key terms related to each of the Agency Warehouse Facilities.
Agency Warehouse Facility #1:
The Company has a warehousing credit and security agreement with a national bank for a $425.0 million committed warehouse line that is scheduled to mature on October 29, 2018. The agreement provides the Company with the ability to fund Fannie Mae, Freddie Mac, HUD, and FHA loans. Advances are made at 100% of the loan balance and borrowings under this line bear interest at the 30-day London Interbank Offered Rate (“LIBOR”) plus 130 basis points. In addition to the committed borrowing capacity, the agreement provides $300.0 million of uncommitted borrowing capacity that bears interest at the same rate as the committed facility. The agreement contains certain affirmative and negative covenants that are binding on the Company’s operating subsidiary, Walker & Dunlop, LLC (which are in some cases subject to exceptions), including, but not limited to, restrictions on its ability to assume, guarantee, or become contingently liable for the obligation of another person, to undertake certain fundamental changes such as reorganizations, mergers, amendments to the Company’s certificate of formation or operating agreement, liquidations, dissolutions or dispositions or acquisitions of assets or businesses, to cease to be directly or indirectly wholly owned by the Company, to pay any subordinated debt in advance of its stated maturity or to take any action that would cause Walker & Dunlop, LLC to lose all or any part of its status as an eligible lender, seller, servicer or issuer or any license or approval required for it to engage in the business of originating, acquiring, or servicing mortgage loans.
In addition, the agreement requires compliance with certain financial covenants, which are measured for the Company and its subsidiaries on a consolidated basis, as follows:
|
· |
tangible net worth of the Company of not less than (i) $200.0 million plus (ii) 75% of the net proceeds of any equity issuances by the Company or any of its subsidiaries after the closing date, |
|
· |
compliance with the applicable net worth and liquidity requirements of Fannie Mae, Freddie Mac, Ginnie Mae, FHA, and HUD, |
|
· |
liquid assets of the Company of not less than $15.0 million, |
|
· |
maintenance of aggregate unpaid principal amount of all mortgage loans comprising the Company’s consolidated servicing portfolio of not less than $20.0 billion or (ii) all Fannie Mae DUS mortgage loans comprising the Company’s consolidated servicing portfolio of not less than $10.0 billion, exclusive in both cases of mortgage loans which are 60 or more days past due or are otherwise in default or have been transferred to Fannie Mae for resolution, |
|
· |
aggregate unpaid principal amount of Fannie Mae DUS mortgage loans within the Company’s consolidated servicing portfolio which are 60 or more days past due or otherwise in default not to exceed 3.5% of the aggregate unpaid principal balance of all Fannie Mae DUS mortgage loans within the Company’s consolidated servicing portfolio, and |
|
· |
maximum indebtedness (excluding warehouse lines) to tangible net worth of 2.25 to 1.0. |
F-24
The agreement contains customary events of default, which are in some cases subject to certain exceptions, thresholds, notice requirements, and grace periods. During the fourth quarter of 2017, the Company executed the Amended and Restated Warehousing Credit and Security Agreement that extended the maturity date to October 29, 2018, reduced the interest rate to 30-day LIBOR plus 130 basis points, and provides $300.0 million of uncommitted borrowing capacity that bears interest at the same rate as the committed facility. No other material modifications were made to the agreement during 2017.
Agency Warehouse Facility #2:
The Company has a warehousing credit and security agreement with a national bank for a $500.0 million committed warehouse line that is scheduled to mature on September 10, 2018. The committed warehouse facility provides the Company with the ability to fund Fannie Mae, Freddie Mac, HUD and FHA loans. Advances are made at 100% of the loan balance, and borrowings under this line bear interest at 30-day LIBOR plus 130 basis points. During the third quarter of 2017, the Company executed the Second Amended and Restated Warehousing Credit and Security Agreement (the “Second Amended Agreement”) related to Agency Warehouse Facility #2. The Second Amended Agreement removed one of the lenders under the prior agreement, which reduced the maximum committed borrowing capacity of Agency Warehouse Facility #2 to $500.0 million. It also extended the maturity date to September 10, 2018 and reduced the interest rate to 30-day LIBOR plus 130 basis points. In addition to the committed borrowing capacity, the Second Amended Agreement provides $300.0 million of uncommitted borrowing capacity that bears interest at the same rate as the committed facility. Concurrent with the execution of the Second Amended Agreement, the Company executed a new, separate warehousing credit agreement with one of the lenders under the prior facility, which is referred to as Agency Warehouse Facility #6 and is more fully described below. No other material modifications were made to the agreement during 2017.
The negative and financial covenants of the amended and restated warehouse agreement conform to those of the warehouse agreement for Agency Warehouse Facility #1, described above, with the exception of the leverage ratio covenant, which is not included in the warehouse agreement for Agency Warehouse Facility #2.
Agency Warehouse Facility #3:
The Company has an $880.0 million committed warehouse credit and security agreement with a national bank that is scheduled to mature on April 30, 2018. The total commitment amount of $880.0 million as of December 31, 2017 consists of a base committed amount of $480.0 million and a temporary increase of $400.0 million, as more fully described below. The committed warehouse facility provides the Company with the ability to fund Fannie Mae, Freddie Mac, HUD and FHA loans. Advances are made at 100% of the loan balance, and the borrowings under the warehouse agreement bear interest at a rate of 30-day LIBOR plus 125 basis points. During the second quarter of 2017, the Company executed the seventh amendment to the credit and security agreement that increased the committed amount to $480.0 million, decreased the interest rate to 30-day LIBOR plus 125 basis points, and extended the maturity date to April 30, 2018. Additionally, during the third quarter of 2017, the Company executed the eighth amendment to the credit and security agreement that provided a temporary increase of $400.0 million to the maximum borrowing capacity that expired in January 2018, at which time the maximum borrowing capacity returned to $480.0 million. No other material modifications were made to the agreement during 2017.
The negative and financial covenants of the warehouse agreement conform to those of the warehouse agreement for Agency Warehouse Facility #1, described above.
Agency Warehouse Facility #4:
The Company has a $350.0 million committed warehouse credit and security agreement with a national bank that is scheduled to mature on October 5, 2018. The committed warehouse facility provides the Company with the ability to fund Fannie Mae, Freddie Mac, HUD, and FHA loans. Advances are made at 100% of the loan balance, and the borrowings under the warehouse agreement bear interest at a rate of 30-day LIBOR plus 130 basis points. During the fourth quarter of
F-25
2017, the Company executed the third amendment to the warehouse loan and security agreement that extended the maturity date of the facility to October 5, 2018 and reduced the interest rate to 30-day LIBOR plus 130 basis points. No other material modifications were made to the agreement during 2017.
The negative and financial covenants of the warehouse agreement conform to those of the warehouse agreement for Agency Warehouse Facility #1, described above, with the exception of the leverage ratio covenant, which is not included in the warehouse agreement for Agency Warehouse Facility #4.
Agency Warehouse Facility #5:
The Company has a $30.0 million committed warehouse credit and security agreement with a national bank that is scheduled to mature on July 12, 2019. The committed warehouse facility provides us with the ability to fund defaulted HUD and FHA loans. The borrowings under the warehouse agreement bear interest at a rate of 30-day LIBOR plus 180 basis points. No material modifications were made to the agreement in 2017. During the first quarter of 2018, the Company executed the first amendment to the warehouse credit and security agreement that extended the maturity date to July 12, 2019. The amendment also provides the Company the unilateral option to extend the agreement for one additional year.
The negative and financial covenants of the warehouse agreement conform to those of the warehouse agreement for Agency Warehouse Facility #1, described above, with the exception of the leverage ratio covenant, which is not included in the warehouse agreement for Agency Warehouse Facility #5.
Agency Warehouse Facility #6:
During the third quarter of 2017, we executed a warehousing and security agreement that established Agency Warehouse Facility #6. The warehouse facility has a $250.0 million maximum committed borrowing capacity, provides us with the ability to fund Fannie Mae, Freddie Mac, HUD, and FHA loans, and matures September 18, 2018. Advances are made at 100% of the loan balance, and the borrowings under the warehouse agreement bear interest at a rate of 30-day LIBOR plus 135 basis points. In addition to the committed borrowing capacity, the agreement provides $250.0 million of uncommitted borrowing capacity that bears interest at the same rate as the committed facility.
The negative and financial covenants of the warehouse agreement conform to those of the warehouse agreement for Agency Warehouse Facility #1, described above, with the exception of the leverage ratio covenant, which is not included in the warehouse agreement for Agency Warehouse Facility #6.
Uncommitted Agency Warehouse Facility:
The Company has a $1.5 billion uncommitted facility with Fannie Mae under its ASAP funding program. After approval of certain loan documents, Fannie Mae will fund loans after closing and the advances are used to repay the primary warehouse line. Fannie Mae will advance 99% of the loan balance, and borrowings under this program bear interest at LIBOR plus 115 basis points, with a minimum LIBOR rate of 35 basis points. There is no expiration date for this facility. No changes were made to the uncommitted facility during 2017. The uncommitted facility has no specific negative or financial covenants.
During the first quarter of 2018, the Company executed a warehousing and security agreement to establish another Agency warehouse facility. The warehouse facility has a committed $250.0 million maximum borrowing amount and is scheduled to mature on February 2, 2019. The Company can fund Fannie Mae, Freddie Mac, HUD, and FHA loans under the facility. Advances are made at 100% of the loan balance, and the borrowings under the warehouse agreement bear interest at a rate of LIBOR plus 130 basis points. The agreement provides $100.0 million of uncommitted borrowing capacity that bears interest at the same rate as the committed facility. This new agreement has the same financial covenants as Agency Warehouse Facility #1.
F-26
Interim Warehouse Facilities
The following section provides a summary of the key terms related to each of the Interim Warehouse Facilities.
Interim Warehouse Facility #1:
The Company has an $85.0 million committed warehouse line agreement that is scheduled to mature on April 30, 2018. The facility provides the Company with the ability to fund first mortgage loans on multifamily real estate properties for periods of up to three years, using available cash in combination with advances under the facility. Borrowings under the facility are full recourse to the Company and bear interest at 30-day LIBOR plus 190 basis points. Repayments under the credit agreement are interest-only, with principal repayments made upon the earlier of the refinancing of an underlying mortgage or the maturity of an advance under the credit agreement. During the second quarter of 2017, the Company executed the seventh amendment to the credit and security agreement that extended the maturity date to April 30, 2018. No other material modifications were made to the agreement during 2017.
The facility agreement requires the Company’s compliance with the same financial covenants as Agency Warehouse Facility #1, described above, and also includes the following additional financial covenant:
|
· |
minimum rolling four-quarter EBITDA, as defined, to total debt service ratio of 2.00 to 1.0 |
Interim Warehouse Facility #2:
The Company has a $100.0 million committed warehouse line agreement that is scheduled to mature on December 13, 2019. The agreement provides the Company with the ability to fund first mortgage loans on multifamily real estate properties for periods of up to three years, using available cash in combination with advances under the facility. Borrowings under the facility are full recourse to the Company. All borrowings originally bear interest at 30-day LIBOR plus 200 basis points. The lender retains a first priority security interest in all mortgages funded by such advances on a cross-collateralized basis. Repayments under the credit agreement are interest-only, with principal repayments made upon the earlier of the refinancing of an underlying mortgage or the maturity of an advance under the credit agreement. During the fourth quarter of 2017, the Company executed the fourth amendment to the agreement that extended the maturity date to December 13, 2019 and reduced the maximum borrowing capacity to $100.0 million. The Company requested the reduction in the maximum borrowing capacity due to the formation of the Interim Program JV, which reduced the Company’s need to fund loans under the Interim Program. No other material modifications were made to the agreement during 2017.
The credit agreement, as amended and restated, requires the borrower and the Company to abide by the same financial covenants as Agency Warehouse Facility #1, described above, with the exception of the leverage ratio covenant, which is not included in the warehouse agreement for Interim Warehouse Facility #2. Additionally, Interim Warehouse Facility #2 has the following additional financial covenants:
|
· |
rolling four-quarter EBITDA, as defined, of not less than $35.0 million and |
|
· |
debt service coverage ratio, as defined, of not less than 2.75 to 1.0 |
Interim Warehouse Facility #3:
The Company has a $75.0 million repurchase agreement with a national bank that is scheduled to mature on May 19, 2018. The agreement provides the Company with the ability to fund first mortgage loans on multifamily real estate properties for periods of up to three years, using available cash in combination with advances under the facility. Borrowings under the facility are full recourse to the Company. The borrowings under the agreement bear interest at a rate of LIBOR plus 2.00% to 2.50% (“the spread”). The spread varies according to the type of asset the borrowing finances.
F-27
Repayments under the credit agreement are interest-only, with principal repayments made upon the earlier of the refinancing of an underlying mortgage or the maturity of an advance under the credit agreement. During the second quarter of 2017, the Company exercised its option to extend the maturity date of the repurchase agreement to May 19, 2018. No other material modifications were made to the agreement during 2017.
The Repurchase Agreement requires the borrower and the Company to abide by the following financial covenants:
|
· |
tangible net worth of the Company of not less than (i) $200.0 million plus (ii) 75% of the net proceeds of any equity issuances by the Company or any of its subsidiaries after the closing date, |
|
· |
liquid assets of the Company of not less than $15.0 million, |
|
· |
leverage ratio, as defined, of not more than 3.0 to 1.0, and |
|
· |
debt service coverage ratio, as defined, of not less than 2.75 to 1.0. |
The warehouse agreements contain cross-default provisions, such that if a default occurs under any of the Company’s warehouse agreements, generally the lenders under the other warehouse agreements could also declare a default. As of December 31, 2017, the Company was in compliance with all of its warehouse line covenants.
Note Payable
On December 20, 2013, the Company entered into a $175.0 million senior secured term loan credit agreement (the “Term Loan Agreement”) that was issued at a discount of 1.0%. At any time, the Company may also elect to request the establishment of one or more incremental term loan commitments to make up to three additional term loans in an aggregate principal amount not to exceed $60.0 million.
The term loan requires certain mandatory prepayments in certain circumstances pursuant to the terms of the Term Loan Agreement. In April of 2015, the Company made a mandatory prepayment of $3.6 million. In connection with the mandatory prepayment, the Company’s quarterly principal installments were reduced to $0.3 million from $0.4 million, beginning with the June 30, 2015 principal payment. The final principal installment of the term loan is required to be paid in full on the maturity date of December 20, 2020 (or, if earlier, the date of acceleration of the term loan pursuant to the terms of the Term Loan Agreement) and will be in an amount equal to the aggregate outstanding principal of the term loan on such date (together with all accrued interest thereon).
At the Company’s election, the term loan will bear interest at either (i) the “Base Rate” plus an applicable margin or (ii) the London Interbank Offered Rate (“LIBOR Rate”) plus an applicable margin, subject to adjustment if an event of default under the Term Loan Agreement has occurred and is continuing with a minimum LIBOR Rate of 1.0%. The “Base Rate” means the highest of (a) the Agent’s “prime rate,” (b) the federal funds rate plus 0.50% and (c) LIBOR for an interest period of one month plus 1%. During the fourth quarter of 2017, the Company executed the second amendment to Term Loan Agreement that reduced the applicable margin from 4.25% to 3.00% for LIBOR Rate loans and from 3.25% to 2.00% for Base Rate loans as of December 31, 2017.
The obligations of the Company under the Term Loan Agreement are guaranteed by Walker & Dunlop Multifamily, Inc.; Walker & Dunlop, LLC; Walker & Dunlop Capital, LLC; and W&D BE, Inc., each of which is a direct or indirect wholly owned subsidiary of the Company (together with the Company, the “Loan Parties”), pursuant to a Guarantee and Collateral Agreement entered into on December 20, 2013 among the Loan Parties and the Agent (the “Guarantee and Collateral Agreement”). Subject to certain exceptions and qualifications contained in the Term Loan Agreement, the Company is required to cause any newly created or acquired subsidiary, unless such subsidiary has been designated as an Excluded Subsidiary (as defined in the Term Loan Agreement) by the Company in accordance with the terms of the Term Loan Agreement, to guarantee the obligations of the Company under the Term Loan Agreement and become a party to the
F-28
Guarantee and Collateral Agreement. The Company may designate a newly created or acquired subsidiary as an Excluded Subsidiary so long as certain conditions and requirements provided for in the Term Loan Agreement are met.
The Term Loan Agreement contains certain affirmative and negative covenants that are binding on the Loan Parties, including, but not limited to, restrictions (subject to specified exceptions and qualifications) on the ability of the Loan Parties to incur indebtedness, to create liens on their property, to make investments, to merge, consolidate or enter into any similar combination, or enter into any asset disposition of all or substantially all assets, or liquidate, wind-up or dissolve, to make asset dispositions, to declare or pay dividends or make related distributions, to enter into certain transactions with affiliates, to enter into any negative pledges or other restrictive agreements, to engage in any business other than the business of the Loan Parties as of the date of the Term Loan Agreement and business activities reasonably related or ancillary thereto, to amend certain material contracts or to enter into any sale leaseback arrangements.
In addition, the Term Loan Agreement requires the Company to abide by certain financial covenants calculated for the Company and its subsidiaries on a consolidated basis as follows:
|
· |
As of the last day of any fiscal quarter, permit the Consolidated Corporate Leverage Ratio (as defined in the Term Loan Agreement) to be less than 4.25 to 1.00. |
|
· |
As of the last day of any fiscal quarter, permit the Consolidated Corporate Interest Coverage Ratio (as defined in the Term Loan Agreement) to be less than 2.75 to 1.00. |
|
· |
As of the last day of any fiscal quarter, permit the Asset Coverage Ratio (as defined in the Term Loan Agreement) to be less than 1.50 to 1.00. |
The Term Loan Agreement contains customary events of default (which are in some cases subject to certain exceptions, thresholds, notice requirements and grace periods), including, but not limited to, non-payment of principal or interest or other amounts, misrepresentations, failure to perform or observe covenants, cross-defaults with certain other indebtedness or material agreements, certain change in control events, voluntary or involuntary bankruptcy proceedings, failure of the Term Loan Agreement or other loan documents to be valid and binding, and certain ERISA events and judgments. As of December 31, 2017, the Company was in compliance with all covenants related to the Term Loan Agreement.
The following table shows the components of the note payable as of December 31, 2017 and 2016:
|
(in thousands, unless otherwise specified) |
|
December 31, |
|
|
|
||||
|
Component |
|
2017 |
|
2016 |
|
Interest rate and repayments |
|
||
|
Unpaid principal balance |
|
$ |
166,223 |
|
$ |
167,327 |
|
Interest rate varies - see above for further details; |
|
|
Unamortized debt discount |
|
|
(738) |
|
|
(987) |
|
quarterly principal payments of $0.3 million |
|
|
Unamortized debt issuance costs |
|
|
(1,627) |
|
|
(2,177) |
|
|
|
|
Carrying balance |
|
$ |
163,858 |
|
$ |
164,163 |
|
|
|
|
|
|
|
|
|
|
|
|
|
|
The scheduled maturities, as of December 31, 2017, for the aggregate of the warehouse notes payable and the note payable is shown below. The warehouse notes payable obligations are incurred in support of the related loans held for sale and loans held for investment. Amounts advanced under the warehouse notes payable for loans held for sale are included in the subsequent year as the amounts are usually drawn and repaid within 60 days. The amounts included below related to the note payable include only the quarterly and final principal payments required by the related credit agreement (i.e.,
F-29
the non-contingent payments) and do not include any principal payments that are contingent upon Company cash flow, as defined in the credit agreement (i.e., the contingent payments). The maturities below are in thousands.
|
Year Ending December 31, |
|
Maturities |
|
|
|
2018 |
|
$ |
930,314 |
|
|
2019 |
|
|
11,394 |
|
|
2020 |
|
|
164,015 |
|
|
2021 |
|
|
— |
|
|
2022 |
|
|
— |
|
|
Thereafter |
|
|
— |
|
|
Total |
|
$ |
1,105,723 |
|
All of the debt instruments, including the warehouse facilities, are senior obligations of the Company. All warehouse notes payable balances associated with loans held for sale and outstanding as of December 31, 2017 were or are expected to be repaid in 2018.
NOTE 8—GOODWILL AND OTHER INTANGIBLE ASSETS
A summary of the Company’s goodwill as of and for the year ended December 31, 2017 and 2016 follows:
|
|
|
Years Ended December 31, |
|
||||
|
(in thousands) |
|
2017 |
|
2016 |
|
||
|
Beginning balance |
|
$ |
96,420 |
|
$ |
90,338 |
|
|
Additions from acquisitions |
|
|
27,347 |
|
|
6,082 |
|
|
Impairment |
|
|
— |
|
|
— |
|
|
Ending balance |
|
$ |
123,767 |
|
$ |
96,420 |
|
The addition from acquisitions during 2017 shown in the table above relates to an immaterial acquisition completed during the first quarter of 2017. The Company purchased certain assets and assumed certain liabilities of Deerwood Real Estate Capital, LLC (“Deerwood”), a regional commercial mortgage banking company based in the greater New York City area, for $28.2 million in total consideration, which consisted of $15.0 million of cash consideration and $13.2 million of contingent consideration. The contingent consideration may be earned over the three-year period after the acquisition based on achievement of certain revenue targets. The Company determined the fair value of the contingent consideration using a probability-based, discounted cash flow estimate for the revenue targets (Level 3).
Prior to the acquisition, Deerwood engaged in commercial real estate loan brokerage services across the United States, with a primary focus in the Greater New York City area. The acquisition expands the Company’s network of loan originators and provides further diversification to its loan origination platform.
Substantially all of the value associated with Deerwood related to its assembled workforce and commercial lending platform, resulting in the goodwill shown above. The Company expects all of goodwill to be tax deductible, with the tax-deductible amount of goodwill related to the contingent consideration to be determined once the cash payments to settle the contingent consideration are made. The other assets acquired included immaterial balances related to mortgage pipeline intangible assets and other assets. The operations of Deerwood have been merged into the Company’s existing operations. The goodwill resulting from the acquisition of Deerwood is allocated to the Company’s one reporting unit.
During 2017, the Company recorded an immaterial amount of accretion expense related to the Deerwood contingent consideration and did not make any cash payments. As of December 31, 2017, the Company has fully amortized all material intangible assets obtained from acquisitions.
F-30
NOTE 9—FAIR VALUE MEASUREMENTS
The Company uses valuation techniques that are consistent with the market approach, the income approach, and/or the cost approach to measure assets and liabilities that are measured at fair value. Inputs to valuation techniques refer to the assumptions that market participants would use in pricing the asset or liability. Inputs may be observable, meaning those that reflect the assumptions market participants would use in pricing the asset or liability developed based on market data obtained from independent sources, or unobservable, meaning those that reflect the reporting entity's own assumptions about the assumptions market participants would use in pricing the asset or liability developed based on the best information available in the circumstances. In that regard, accounting standards establish a fair value hierarchy for valuation inputs that gives the highest priority to quoted prices in active markets for identical assets or liabilities and the lowest priority to unobservable inputs. The fair value hierarchy is as follows:
|
· |
Level 1—Financial assets and liabilities whose values are based on unadjusted quoted prices in active markets for identical assets or liabilities that the Company has the ability to access. |
|
· |
Level 2—Financial assets and liabilities whose values are based on inputs other than quoted prices included in Level 1 that are observable for the asset or liability, either directly or indirectly. These might include quoted prices for similar assets or liabilities in active markets, quoted prices for identical or similar assets or liabilities in markets that are not active, inputs other than quoted prices that are observable for the asset or liability (such as interest rates, volatilities, prepayment speeds, credit risks, etc.) or inputs that are derived principally from or corroborated by market data by correlation or other means. |
|
· |
Level 3—Financial assets and liabilities whose values are based on inputs that are both unobservable and significant to the overall valuation. |
The Company's MSRs are measured at fair value on a nonrecurring basis. That is, the instruments are not measured at fair value on an ongoing basis but are subject to fair value adjustments in certain circumstances (for example, when there is evidence of impairment). The Company's MSRs do not trade in an active, open market with readily observable prices. While sales of multifamily MSRs do occur on occasion, precise terms and conditions vary with each transaction and are not readily available. Accordingly, the estimated fair value of the Company’s MSRs was developed using discounted cash flow models that calculate the present value of estimated future net servicing income. The model considers contractually specified servicing fees, prepayment assumptions, delinquency rates, late charges, other ancillary revenue, costs to service, and other economic factors. The Company periodically reassesses and adjusts, when necessary, the underlying inputs and assumptions used in the model to reflect observable market conditions and assumptions that a market participant would consider in valuing an MSR asset. MSRs are carried at the lower of amortized cost or fair value.
A description of the valuation methodologies used for assets and liabilities measured at fair value, as well as the general classification of such instruments pursuant to the valuation hierarchy, is set forth below. These valuation methodologies were applied to all of the Company's assets and liabilities carried at fair value:
|
· |
Derivative Instruments—The derivative positions consist of interest rate lock commitments and forward sale agreements. These instruments are valued using a discounted cash flow model developed based on changes in the U.S. Treasury rate and other observable market data. The value was determined after considering the potential impact of collateralization, adjusted to reflect nonperformance risk of both the counterparty and the Company, and are classified within Level 3 of the valuation hierarchy. |
|
· |
Loans Held for Sale—Loans held for sale are reported at fair value. The Company determines the fair value of the loans held for sale using discounted cash flow models that incorporate quoted observable inputs from market participants. Therefore, the Company classifies these loans held for sale as Level 2. |
F-31
|
· |
Pledged Securities—Pledged securities are valued using quoted market prices from recent trades. Therefore, the Company classifies pledged securities as Level 1. |
The following table summarizes financial assets and financial liabilities measured at fair value on a recurring basis as of December 31, 2017 and 2016, segregated by the level of the valuation inputs within the fair value hierarchy used to measure fair value:
|
|
|
Quoted Prices in |
|
Significant |
|
Significant |
|
|
|
|
|||
|
|
|
Active Markets |
|
Other |
|
Other |
|
|
|
|
|||
|
|
|
For Identical |
|
Observable |
|
Unobservable |
|
|
|
|
|||
|
|
|
Assets |
|
Inputs |
|
Inputs |
|
Balance as of |
|
||||
|
(in thousands) |
|
(Level 1) |
|
(Level 2) |
|
(Level 3) |
|
Period End |
|
||||
|
December 31, 2017 |
|
|
|
|
|
|
|
|
|
|
|
|
|
|
Assets |
|
|
|
|
|
|
|
|
|
|
|
|
|
|
Loans held for sale |
|
$ |
— |
|
$ |
951,829 |
|
$ |
— |
|
$ |
951,829 |
|
|
Pledged securities |
|
|
97,859 |
|
|
— |
|
|
— |
|
|
97,859 |
|
|
Derivative assets |
|
|
— |
|
|
— |
|
|
10,357 |
|
|
10,357 |
|
|
Total |
|
$ |
97,859 |
|
$ |
951,829 |
|
$ |
10,357 |
|
$ |
1,060,045 |
|
|
|
|
|
|
|
|
|
|
|
|
|
|
|
|
|
Liabilities |
|
|
|
|
|
|
|
|
|
|
|
|
|
|
Derivative liabilities |
|
$ |
— |
|
$ |
— |
|
$ |
1,850 |
|
$ |
1,850 |
|
|
Total |
|
$ |
— |
|
$ |
— |
|
$ |
1,850 |
|
$ |
1,850 |
|
|
|
|
|
|
|
|
|
|
|
|
|
|
|
|
|
December 31, 2016 |
|
|
|
|
|
|
|
|
|
|
|
|
|
|
Assets |
|
|
|
|
|
|
|
|
|
|
|
|
|
|
Loans held for sale |
|
$ |
— |
|
$ |
1,858,358 |
|
$ |
— |
|
$ |
1,858,358 |
|
|
Pledged securities |
|
|
84,850 |
|
|
— |
|
|
— |
|
|
84,850 |
|
|
Derivative assets |
|
|
— |
|
|
— |
|
|
61,824 |
|
|
61,824 |
|
|
Total |
|
$ |
84,850 |
|
$ |
1,858,358 |
|
$ |
61,824 |
|
$ |
2,005,032 |
|
|
|
|
|
|
|
|
|
|
|
|
|
|
|
|
|
Liabilities |
|
|
|
|
|
|
|
|
|
|
|
|
|
|
Derivative liabilities |
|
$ |
— |
|
$ |
— |
|
$ |
4,396 |
|
$ |
4,396 |
|
|
Total |
|
$ |
— |
|
$ |
— |
|
$ |
4,396 |
|
$ |
4,396 |
|
There were no transfers between any of the levels within the fair value hierarchy during the years ended December 31, 2017 and 2016.
Derivative instruments (Level 3) are outstanding for short periods of time (generally less than 60 days). A roll forward of derivative instruments is presented below:
|
|
|
Fair Value Measurements |
|
|
|
|
|
Using Significant |
|
|
|
|
|
Unobservable Inputs: |
|
|
|
|
|
Derivative Instruments |
|
|
|
(in thousands) |
|
December 31, 2017 |
|
|
|
Derivative assets and liabilities, net |
|
|
|
|
|
Beginning balance December 31, 2016 |
|
$ |
57,428 |
|
|
Settlements |
|
|
(488,291) |
|
|
Realized gains recorded in earnings (1) |
|
|
430,863 |
|
|
Unrealized gains recorded in earnings (1) |
|
|
8,507 |
|
|
Ending balance December 31, 2017 |
|
$ |
8,507 |
|
F-32
|
|
|
Fair Value Measurements |
|
|
|
|
|
Using Significant |
|
|
|
|
|
Unobservable Inputs: |
|
|
|
|
|
Derivative Instruments |
|
|
|
(in thousands) |
|
December 31, 2016 |
|
|
|
Derivative assets and liabilities, net |
|
|
|
|
|
Beginning balance December 31, 2015 |
|
$ |
10,345 |
|
|
Settlements |
|
|
(320,102) |
|
|
Realized gains (losses) recorded in earnings (1) |
|
|
309,757 |
|
|
Unrealized gains (losses) recorded in earnings (1) |
|
|
57,428 |
|
|
Ending balance December 31, 2016 |
|
$ |
57,428 |
|
|
(1) |
Realized and unrealized gains from derivatives are recognized in Gains from mortgage banking activities in the Consolidated Statements of Income. |
The following table presents information about significant unobservable inputs used in the recurring measurement of the fair value of the Company’s Level 3 assets and liabilities as of December 31, 2017:
|
|
|
|
|
|
|
|
|
|
|
|
|
|
|
Quantitative Information about Level 3 Measurements |
|
|||||||
|
(in thousands) |
|
Fair Value |
|
Valuation Technique |
|
Unobservable Input (1) |
|
Input Value (1) |
|
|
|
Derivative assets |
|
$ |
10,357 |
|
Discounted cash flow |
|
Counterparty credit risk |
|
— |
|
|
Derivative liabilities |
|
$ |
1,850 |
|
Discounted cash flow |
|
Counterparty credit risk |
|
— |
|
|
(1) |
Significant increases in this input may lead to significantly lower fair value measurements. |
The carrying amounts and the fair values of the Company's financial instruments as of December 31, 2017 and December 31, 2016 are presented below:
|
|
|
|
|
|
|
|
|
|
|
|
|
|
|
|
|
|
December 31, 2017 |
|
December 31, 2016 |
|
||||||||
|
|
|
Carrying |
|
Fair |
|
Carrying |
|
Fair |
|
||||
|
(in thousands) |
|
Amount |
|
Value |
|
Amount |
|
Value |
|
||||
|
Financial assets: |
|
|
|
|
|
|
|
|
|
|
|
|
|
|
Cash and cash equivalents |
|
$ |
191,218 |
|
$ |
191,218 |
|
$ |
118,756 |
|
$ |
118,756 |
|
|
Restricted cash |
|
|
6,677 |
|
|
6,677 |
|
|
9,861 |
|
|
9,861 |
|
|
Pledged securities |
|
|
97,859 |
|
|
97,859 |
|
|
84,850 |
|
|
84,850 |
|
|
Loans held for sale |
|
|
951,829 |
|
|
951,829 |
|
|
1,858,358 |
|
|
1,858,358 |
|
|
Loans held for investment, net |
|
|
66,510 |
|
|
66,963 |
|
|
220,377 |
|
|
222,313 |
|
|
Derivative assets |
|
|
10,357 |
|
|
10,357 |
|
|
61,824 |
|
|
61,824 |
|
|
Total financial assets |
|
$ |
1,324,450 |
|
$ |
1,324,903 |
|
$ |
2,354,026 |
|
$ |
2,355,962 |
|
|
|
|
|
|
|
|
|
|
|
|
|
|
|
|
|
Financial liabilities: |
|
|
|
|
|
|
|
|
|
|
|
|
|
|
Derivative liabilities |
|
$ |
1,850 |
|
$ |
1,850 |
|
$ |
4,396 |
|
$ |
4,396 |
|
|
Warehouse notes payable |
|
|
937,769 |
|
|
939,500 |
|
|
1,990,183 |
|
|
1,992,111 |
|
|
Note payable |
|
|
163,858 |
|
|
166,223 |
|
|
164,163 |
|
|
167,327 |
|
|
Total financial liabilities |
|
$ |
1,103,477 |
|
$ |
1,107,573 |
|
$ |
2,158,742 |
|
$ |
2,163,834 |
|
The following methods and assumptions were used to estimate the fair value of each class of financial instruments for which it is practicable to estimate that value:
Cash and Cash Equivalents and Restricted Cash—The carrying amounts approximate fair value because of the short maturity of these instruments (Level 1).
F-33
Pledged Securities—Consist of highly liquid investments in money market accounts invested in government securities and investments in government guaranteed securities. Substantially all investments have maturities of 90 days or less and are valued using quoted market prices from recent trades.
Loans Held For Sale—Consist of originated loans that are generally transferred or sold within 60 days from the date that a mortgage loan is funded and are valued using discounted cash flow models that incorporate observable prices from market participants.
Loans Held For Investment—Consist of originated interim loans which the Company expects to hold for investment for the term of the loan, which is three years or less, and are valued using discounted cash flow models that incorporate primarily observable inputs from market participants and also credit-related adjustments, if applicable (Level 3). As of December 31, 2017 and December 31, 2016, no credit-related adjustments were required.
Derivative Instruments—Consist of interest rate lock commitments and forward sale agreements. These instruments are valued using discounted cash flow models developed based on changes in the U.S. Treasury rate and other observable market data. The value is determined after considering the potential impact of collateralization, adjusted to reflect nonperformance risk of both the counterparty and the Company.
Warehouse Notes Payable—Consist of borrowings outstanding under warehouse line agreements. The borrowing rates on the warehouse lines are based upon 30-day LIBOR plus a margin. The unpaid principal balance of warehouse notes payable approximates fair value because of the short maturity of these instruments and the monthly resetting of the index rate to prevailing market rates (Level 2).
Note Payable—Consists of borrowings outstanding under a term note agreement. The borrowing rate on the note payable is based upon 30-day LIBOR plus an applicable margin. The Company estimates the fair value by discounting the future cash flows at market rates (Level 2).
Fair Value of Derivative Instruments and Loans Held for Sale—In the normal course of business, the Company enters into contractual commitments to originate and sell multifamily mortgage loans at fixed prices with fixed expiration dates. The commitments become effective when the borrowers "lock-in" a specified interest rate within time frames established by the Company. All mortgagors are evaluated for creditworthiness prior to the extension of the commitment. Market risk arises if interest rates move adversely between the time of the "lock-in" of rates by the borrower and the sale date of the loan to an investor.
To mitigate the effect of the interest rate risk inherent in providing rate lock commitments to borrowers, the Company's policy is to enter into a sale commitment with the investor simultaneous with the rate lock commitment with the borrower. The sale contract with the investor locks in an interest rate and price for the sale of the loan. The terms of the contract with the investor and the rate lock with the borrower are matched in substantially all respects, with the objective of eliminating interest rate risk to the extent practical. Sale commitments with the investors have an expiration date that is longer than our related commitments to the borrower to allow, among other things, for the closing of the loan and processing of paperwork to deliver the loan into the sale commitment.
Both the rate lock commitments to borrowers and the forward sale contracts to buyers are undesignated derivatives and, accordingly, are marked to fair value through Gains on mortgage banking activities in the Consolidated Statements of Income. The fair value of the Company's rate lock commitments to borrowers and loans held for sale and the related input levels includes, as applicable:
|
· |
the estimated gain of the expected loan sale to the investor (Level 2); |
|
· |
the expected net cash flows associated with servicing the loan, net of any guaranty obligations retained (Level 2); |
F-34
|
· |
the effects of interest rate movements between the date of the rate lock and the balance sheet date (Level 2); and |
|
· |
the nonperformance risk of both the counterparty and the Company (Level 3). |
The fair value of the Company's forward sales contracts to investors considers effects of interest rate movements between the trade date and the balance sheet date (Level 2). The market price changes are multiplied by the notional amount of the forward sales contracts to measure the fair value.
The estimated gain considers the amount that the Company has discounted the price to the borrower from par for competitive reasons, if at all, and the expected net cash flows from servicing to be received upon sale of the loan (Level 2). The fair value of the expected net cash flows associated with servicing the loan is calculated pursuant to the valuation techniques applicable to MSRs (Level 2).
To calculate the effects of interest rate movements, the Company uses applicable published U.S. Treasury prices, and multiplies the price movement between the rate lock date and the balance sheet date by the notional loan commitment amount (Level 2).
The fair value of the Company's forward sales contracts to investors considers the market price movement of the same type of security between the trade date and the balance sheet date (Level 2). The market price changes are multiplied by the notional amount of the forward sales contracts to measure the fair value.
The fair value of the Company’s interest rate lock commitments and forward sales contracts is adjusted to reflect the risk that the agreement will not be fulfilled. The Company’s exposure to nonperformance in interest rate lock commitments and forward sale contracts is represented by the contractual amount of those instruments. Given the credit quality of our counterparties and the short duration of interest rate lock commitments and forward sale contracts, the risk of nonperformance by the Company’s counterparties has historically not been significant (Level 3).
The following table presents the components of fair value and other relevant information associated with the Company’s derivative instruments and loans held for sale as of December 31, 2017 and 2016.
|
|
|
|
|
|
Fair Value Adjustment Components |
|
Balance Sheet Location |
|
||||||||||||||
|
|
|
|
|
|
|
|
|
|
|
|
|
|
|
|
|
|
|
|
|
Fair Value |
|
|
|
|
|
Notional or |
|
Estimated |
|
|
|
|
Total |
|
|
|
|
|
|
|
Adjustment |
|
||||
|
|
|
Principal |
|
Gain |
|
Interest Rate |
|
Fair Value |
|
Derivative |
|
Derivative |
|
To Loans |
|
|||||||
|
(in thousands) |
|
Amount |
|
on Sale |
|
Movement |
|
Adjustment |
|
Assets |
|
Liabilities |
|
Held for Sale |
|
|||||||
|
December 31, 2017 |
|
|
|
|
|
|
|
|
|
|
|
|
|
|
|
|
|
|
|
|
|
|
|
Rate lock commitments |
|
$ |
241,760 |
|
$ |
7,587 |
|
$ |
(678) |
|
$ |
6,909 |
|
$ |
6,909 |
|
$ |
— |
|
$ |
— |
|
|
Forward sale contracts |
|
|
1,175,192 |
|
|
— |
|
|
1,598 |
|
|
1,598 |
|
|
3,448 |
|
|
(1,850) |
|
|
— |
|
|
Loans held for sale |
|
|
933,432 |
|
|
19,317 |
|
|
(920) |
|
|
18,397 |
|
|
— |
|
|
— |
|
|
18,397 |
|
|
Total |
|
|
|
|
$ |
26,904 |
|
$ |
— |
|
$ |
26,904 |
|
$ |
10,357 |
|
$ |
(1,850) |
|
$ |
18,397 |
|
|
|
|
|
|
|
|
|
|
|
|
|
|
|
|
|
|
|
|
|
|
|
|
|
|
December 31, 2016 |
|
|
|
|
|
|
|
|
|
|
|
|
|
|
|
|
|
|
|
|
|
|
|
Rate lock commitments |
|
$ |
395,462 |
|
$ |
15,844 |
|
$ |
(2,275) |
|
$ |
13,569 |
|
$ |
14,482 |
|
$ |
(913) |
|
$ |
— |
|
|
Forward sale contracts |
|
|
2,248,385 |
|
|
— |
|
|
43,859 |
|
|
43,859 |
|
|
47,342 |
|
|
(3,483) |
|
|
— |
|
|
Loans held for sale |
|
|
1,852,923 |
|
|
47,019 |
|
|
(41,584) |
|
|
5,435 |
|
|
— |
|
|
— |
|
|
5,435 |
|
|
Total |
|
|
|
|
$ |
62,863 |
|
$ |
— |
|
$ |
62,863 |
|
$ |
61,824 |
|
$ |
(4,396) |
|
$ |
5,435 |
|
F-35
NOTE 10—LITIGATION, COMMITMENTS, AND CONTINGENCIES
Fannie Mae DUS Related Commitments—Commitments for the origination and subsequent sale and delivery of loans to Fannie Mae represent those mortgage loan transactions where the borrower has locked an interest rate and scheduled closing and the Company has entered into a mandatory delivery commitment to sell the loan to Fannie Mae. As discussed in NOTE 9, the Company accounts for these commitments as derivatives recorded at fair value.
The Company is generally required to share the risk of any losses associated with loans sold under the Fannie Mae DUS program. The Company is required to secure these obligations by assigning restricted cash balances and securities to Fannie Mae. The amount of collateral required by Fannie Mae is a formulaic calculation at the loan level and considers the balance of the loan, the risk level of the loan, the age of the loan, and the level of risk-sharing. Fannie Mae requires restricted liquidity for Tier 2 loans of 75 basis points, which is funded over a 48-month period that begins upon delivery of the loan to Fannie Mae. Restricted liquidity held in the form of money market funds holding U.S. Treasuries is discounted 5% for purposes of calculating compliance with the restricted liquidity requirements. As of December 31, 2017, the Company held the majority of its restricted liquidity in money market funds holding U.S. Treasuries. Additionally, substantially all of the loans for which the Company has risk sharing are Tier 2 loans.
The Company is in compliance with the December 31, 2017 collateral requirements as outlined above. As of December 31, 2017, reserve requirements for the December 31, 2017 DUS loan portfolio will require the Company to fund $67.2 million in additional restricted liquidity over the next 48 months, assuming no further principal paydowns, prepayments, or defaults within the at risk portfolio. Fannie Mae periodically reassesses the DUS Capital Standards and may make changes to these standards in the future. The Company generates sufficient cash flow from its operations to meet these capital standards and does not expect any future changes to have a material impact on its future operations; however, any future changes to collateral requirements may adversely impact the Company’s available cash.
Fannie Mae has established benchmark standards for capital adequacy, and reserves the right to terminate the Company's servicing authority for all or some of the portfolio if at any time it determines that the Company's financial condition is not adequate to support its obligations under the DUS agreement. The Company is required to maintain acceptable net worth as defined in the agreement, and the Company satisfied the requirements as of December 31, 2017. The net worth requirement is derived primarily from unpaid balances on Fannie Mae loans and the level of risk sharing. At December 31, 2017, the net worth requirement was $155.8 million, and the Company's net worth was $725.9 million, as measured at our wholly owned operating subsidiary, Walker & Dunlop, LLC. As of December 31, 2017, the Company was required to maintain at least $30.7 million of liquid assets to meet operational liquidity requirements for Fannie Mae, Freddie Mac, HUD, and Ginnie Mae. As of December 31, 2017, the Company had operational liquidity of $238.6 million, as measured at our wholly owned operating subsidiary, Walker & Dunlop, LLC.
Litigation—In the ordinary course of business, the Company may be party to various claims and litigation, none of which the Company believes is material. The Company cannot predict the outcome of any pending litigation and may be subject to consequences that could include fines, penalties, and other costs, and the Company’s reputation and business may be impacted. The Company believes that any liability that could be imposed on the Company in connection with the disposition of any pending lawsuits would not have a material adverse effect on its business, results of operations, liquidity, or financial condition.
Lease Commitments—In the normal course of business, the Company enters into lease arrangements for all of its office space. All such lease arrangements are accounted for as operating leases. Rent expense related to these lease agreements is recognized on the straight-line basis over the term of the lease. Rent expense was $7.1 million, $6.4 million, and $5.9 million for the years ended December 31, 2017, 2016, and 2015, respectively.
F-36
Minimum cash basis operating lease commitments follow (in thousands):
|
|
|
|
|
|
|
Year Ending December 31, |
|
|
|
|
|
2018 |
|
$ |
6,054 |
|
|
2019 |
|
|
5,860 |
|
|
2020 |
|
|
5,436 |
|
|
2021 |
|
|
4,904 |
|
|
2022 |
|
|
4,498 |
|
|
Thereafter |
|
|
3,267 |
|
|
Total |
|
$ |
30,019 |
|
NOTE 11—SHARE-BASED PAYMENT
As of December 31, 2017, there were 8.5 million shares of stock authorized for issuance to directors, officers, and employees under the 2015 Equity Incentive Plan. At December 31, 2017, 2.1 million shares remain available for grant under the 2015 Equity Incentive Plan.
During 2017, 2016, and 2015, the Company granted stock options to executive officers under the 2015 Equity Incentive Plan and restricted shares to officers, employees, and non-employee directors, without cost to the grantee. During 2017, 2016, and 2015, the Company also granted 0.3 million, 0.5 million, and zero RSUs, respectively, to the officers and certain other employees in connection with PSPs (“performance awards”). The Company granted the RSUs at the maximum performance thresholds for each metric each year. As of December 31, 2017, all of the RSUs issued in connection with the 2016 and 2017 PSPs are unvested and outstanding.
The performance period for the 2014 PSP concluded on December 31, 2016. The two performance goals related to the 2014 PSP were met at varying levels. Accordingly, 0.6 million shares related to the 2014 PSP vested in the first quarter of 2017. As of December 31, 2017, the Company concluded that the three performance targets related to the 2016 PSP and the 2017 PSP were probable of achievement at varying levels. As of December 31, 2016, the Company concluded that the three performance targets related to the 2016 PSP were probable of achievement at varying levels.
The following table summarizes stock compensation expense for the years ended December 31, 2017, 2016, and 2015:
|
Components of stock compensation expense (in thousands) |
|
2017 |
|
2016 |
|
2015 |
|
|||
|
Restricted shares |
|
$ |
12,336 |
|
$ |
10,272 |
|
$ |
8,214 |
|
|
Stock options |
|
|
1,570 |
|
|
1,768 |
|
|
1,957 |
|
|
2014 PSP |
|
|
766 |
|
|
3,625 |
|
|
3,913 |
|
|
2016 PSP |
|
|
4,728 |
|
|
2,812 |
|
|
— |
|
|
2017 PSP |
|
|
1,734 |
|
|
— |
|
|
— |
|
|
Total stock compensation expense |
|
$ |
21,134 |
|
$ |
18,477 |
|
$ |
14,084 |
|
|
|
|
|
|
|
|
|
|
|
|
|
|
Excess tax benefit recognized |
|
$ |
9,545 |
|
$ |
631 |
|
$ |
1,410 |
|
|
|
|
|
|
|
|
|
|
|
|
|
The restricted shares amounts in the table above include both equity-classified awards granted in restricted shares and liability-classified awards to be granted in restricted shares. The excess tax benefits recognized in 2017 and 2016 reduced income tax expense, while the excess tax benefit recognized in 2015 was recorded directly to equity with no impact on income tax expense.
F-37
The following table summarizes restricted share activity for the year ended December 31, 2017:
|
|
|
|
|
Weighted- |
|
|
|
|
|
|
|
Average |
|
|
|
|
|
|
|
Grant-date |
|
|
|
Restricted Shares |
|
Shares |
|
Fair Value |
|
|
|
Nonvested at January 1, 2017 |
|
1,481,483 |
|
$ |
20.71 |
|
|
Granted |
|
385,379 |
|
|
41.15 |
|
|
Vested |
|
(507,442) |
|
|
20.08 |
|
|
Forfeited |
|
(14,897) |
|
|
27.67 |
|
|
Nonvested at December 31, 2017 |
|
1,344,523 |
|
$ |
26.68 |
|
The fair value of restricted share awards granted during 2017 was estimated using the closing price on the date of grant. The weighted average grant date fair values of restricted shares granted in 2016 and 2015 were $21.51 per share and $21.03 per share, respectively. The fair values of the restricted shares that vested during the years ended December 31, 2017, 2016, and 2015 were $21.2 million, $10.3 million, and $9.6 million, respectively.
As of December 31, 2017, the total unrecognized compensation cost for outstanding restricted shares was $18.9 million. As of December 31, 2017, the weighted-average period over which this unrecognized compensation cost will be recognized is 2.4 years.
The following table summarizes activity related to performance awards for the year ended December 31, 2017:
|
|
|
|
|
Weighted- |
|
|
|
|
|
|
|
Average |
|
|
|
|
|
|
|
Grant-date |
|
|
|
Restricted Share Units |
|
Share Units |
|
Fair Value |
|
|
|
Nonvested at January 1, 2017 |
|
1,164,791 |
|
$ |
19.61 |
|
|
Granted |
|
335,991 |
|
|
41.79 |
|
|
Vested |
|
(579,589) |
|
|
16.07 |
|
|
Forfeited |
|
(59,875) |
|
|
16.07 |
|
|
Nonvested at December 31, 2017 |
|
861,318 |
|
$ |
30.89 |
|
|
|
|
|
|
|
|
|
The fair value of performance awards granted during 2017 was estimated using the closing price on the date of grant. The weighted average grant date fair values of performance awards granted in 2016 was $23.92 per share. There were no performance shares granted in 2015. The fair value of the performance awards that vested during the year ended December 31, 2017 was $23.1 million. There were no performance awards that vested during the years ended December 31, 2016 and 2015.
As of December 31, 2017, the total unrecognized compensation cost for outstanding performance awards was $10.0 million. As of December 31, 2017, the weighted-average period over which this unrecognized compensation cost will be recognized is 1.6 years. The unrecognized compensation cost is based on the achievement levels that are probable as of December 31, 2017.
F-38
The following table summarizes stock options activity for the year ended December 31, 2017:
|
|
|
|
|
|
|
|
Weighted- |
|
|
|
|
|
|
|
|
|
Weighted- |
|
Average |
|
Aggregate |
|
||
|
|
|
|
|
Average |
|
Remaining |
|
Intrinsic |
|
||
|
|
|
|
|
Exercise |
|
Contract Life |
|
Value |
|
||
|
Stock Options |
|
Options |
|
Price |
|
(Years) |
|
(in thousands) |
|
||
|
Outstanding at January 1, 2017 |
|
1,295,375 |
|
$ |
16.97 |
|
|
|
|
|
|
|
Granted |
|
112,731 |
|
|
39.82 |
|
|
|
|
|
|
|
Exercised |
|
(11,400) |
|
|
46.98 |
|
|
|
|
|
|
|
Forfeited |
|
— |
|
|
— |
|
|
|
|
|
|
|
Expired |
|
— |
|
|
— |
|
|
|
|
|
|
|
Outstanding at December 31, 2017 |
|
1,396,706 |
|
$ |
18.85 |
|
6.3 |
|
$ |
40,018 |
|
|
|
|
|
|
|
|
|
|
|
|
|
|
|
Exercisable at December 31, 2017 |
|
1,061,465 |
|
$ |
16.59 |
|
5.7 |
|
$ |
32,812 |
|
The total intrinsic value of the stock options exercised during the years ended December 31, 2017, 2016, and 2015 was $0.4 million, $0.2 million, and $2.6 million, respectively. We received no cash from the exercise of options for each of the years ended December 31, 2017, 2016, and 2015.
As of December 31, 2017, the total unrecognized compensation cost for outstanding options was $1.8 million. As of December 31, 2017, the weighted-average period over which the unrecognized compensation cost will be recognized is 1.8 years.
The fair value of stock option awards granted during 2017, 2016, and 2015 were estimated on the grant date using the Black-Scholes option pricing model, based on the following inputs:
|
|
|
2017 |
|
2016 |
|
2015 |
|
|||
|
Estimated option life |
|
|
6.00 years |
|
|
6.00 years |
|
|
6.00 years |
|
|
Risk free interest rate |
|
|
2.04 |
% |
|
1.31 |
% |
|
1.68 |
% |
|
Expected volatility |
|
|
35.34 |
% |
|
34.42 |
% |
|
33.48 |
% |
|
Expected dividend rate |
|
|
0.00 |
% |
|
0.00 |
% |
|
0.00 |
% |
|
Strike price |
|
$ |
39.82 |
|
$ |
20.40 |
|
$ |
16.72 |
|
|
Weighted average grant date fair value per share of options granted |
|
$ |
14.98 |
|
$ |
7.21 |
|
$ |
5.90 |
|
F-39
NOTE 12—EARNINGS PER SHARE
The following weighted average shares and share equivalents are used to calculate basic and diluted earnings per share for years ended December 31, 2017, 2016, and 2015:
|
|
|
For the year ended December 31, |
||||
|
(in thousands) |
|
2017 |
|
2016 |
|
2015 |
|
Weighted average number of shares outstanding used to calculate basic earnings per share |
|
30,014 |
|
29,432 |
|
29,754 |
|
|
|
|
|
|
|
|
|
Dilutive securities |
|
|
|
|
|
|
|
Unvested restricted shares and restricted share units |
|
1,406 |
|
1,403 |
|
952 |
|
Stock options |
|
785 |
|
337 |
|
243 |
|
Weighted average number of shares and share equivalents outstanding used to calculate diluted earnings per share |
|
32,205 |
|
31,172 |
|
30,949 |
|
|
|
|
|
|
|
|
The assumed proceeds used for calculating the dilutive impact of restricted stock awards under the treasury method includes the unrecognized compensation costs associated with the awards. The following table presents any average outstanding options to purchase shares of common stock and average restricted shares that were not included in the computation of diluted earnings per share because the effect would have been anti-dilutive (the exercise price of the options or the grant date market price of the restricted shares was greater than the average market price of the Company’s shares during the periods presented).
|
|
|
|
|
|
|
|
|
|
|
|
For the year ended December 31, |
|
||||
|
(in thousands) |
|
2017 |
|
2016 |
|
2015 |
|
|
Average options |
|
99 |
|
181 |
|
— |
|
|
Average restricted shares |
|
6 |
|
181 |
|
14 |
|
Under the 2015 Equity Incentive Plan, subject to the Company’s approval, grantees have the option of electing to satisfy tax withholding obligations at the time of vesting or exercise by allowing the Company to withhold and purchase the shares of stock otherwise issuable to the grantee. For the years ended December 31, 2017, 2016, and 2015, the Company repurchased and retired 0.2 million, 0.2 million, and 0.2 million restricted shares at a weighted average market price of $41.21, $22.74, and $20.11, upon grantee vesting, respectively. For the year ended December 31, 2017, the Company repurchased and retired 0.3 million restricted share units at a weighted average market price of $39.82. The Company did not repurchase any restricted share units during the years ended December 31, 2016 and 2015.
In the first quarter of 2015, the Company repurchased 3.0 million shares of its common stock from one of its largest stockholders at the time at a price of $15.60 per share, which was below the quoted price at the time, and immediately retired the shares, reducing stockholders’ equity by $46.8 million.
During 2016, the Company repurchased 0.4 million shares of its common stock under a share repurchase program at a weighted average price of $23.11 per share and immediately retired the shares, reducing stockholders’ equity by $9.2 million.
In February 2017, the Company’s Board of Directors approved a stock repurchase program that permits the repurchase of up to $75.0 million of shares of our common stock over a 12-month period beginning on February 10, 2017. During 2017, the Company repurchased 0.3 million shares of its common stock under the share repurchase program at a weighted average price of $47.10 per share and immediately retired the shares, reducing stockholders’ equity by $16.0 million. The Company had $59.0 million of authorized share repurchase capacity remaining as of December 31, 2017.
In February 2018, the Company’s Board of Directors approved a new stock repurchase program that permits the repurchase of up to $50.0 million of shares of our common stock over a 12-month period beginning on February 9, 2018.
F-40
In February 2018, the Company’s Board of Directors declared a dividend of $0.25 per share for the first quarter of 2018. The dividend will be paid March 7, 2018 to all holders of record of our restricted and unrestricted common stock and restricted stock units as of February 23, 2018. This dividend represents the first such payment of dividends since the Company’s initial public offering in December 2010. The Company expects this dividend to be an insignificant portion of the Company’s net income for the year ended December 31, 2017, retained earnings as of December 31, 2017, and cash and cash equivalents as of December 31, 2017.
The Term Loan contains direct restrictions to the amount of dividends the Company may pay, and the warehouse debt facilities and agreements with the Agencies contain minimum equity, liquidity, and other capital requirements that indirectly restrict the amount of dividends the Company may pay. The Company does not believe that these restrictions currently limit the amount of dividends the Company can pay for the foreseeable future.
NOTE 13—INCOME TAXES
Income Tax Expense
The Company calculates its provision for federal and state income taxes based on current tax law. The reported tax provision differs from the amounts currently receivable or payable because some income and expense items are recognized in different time periods for financial reporting purposes than for income tax purposes. The following is a summary of income tax expense for the years ended December 31, 2017, 2016, and 2015:
|
|
|
For the year ended December 31, |
|
|||||||
|
(in thousands) |
|
2017 |
|
2016 |
|
2015 |
|
|||
|
Current |
|
|
|
|
|
|
|
|
|
|
|
Federal |
|
$ |
45,726 |
|
$ |
28,699 |
|
$ |
29,117 |
|
|
State |
|
|
7,062 |
|
|
5,176 |
|
|
5,325 |
|
|
Total current expense |
|
$ |
52,788 |
|
$ |
33,875 |
|
$ |
34,442 |
|
|
|
|
|
|
|
|
|
|
|
|
|
|
Deferred |
|
|
|
|
|
|
|
|
|
|
|
Federal |
|
$ |
25,055 |
|
$ |
32,159 |
|
$ |
14,571 |
|
|
State |
|
|
2,297 |
|
|
5,436 |
|
|
2,348 |
|
|
Revaluation of deferred tax liabilities, net |
|
|
(58,313) |
|
|
— |
|
|
— |
|
|
Total deferred expense (benefit) |
|
$ |
(30,961) |
|
$ |
37,595 |
|
$ |
16,919 |
|
|
|
|
|
|
|
|
|
|
|
|
|
|
Items credited directly to stockholders' equity |
|
|
|
|
|
|
|
|
|
|
|
Federal |
|
$ |
— |
|
$ |
— |
|
$ |
1,218 |
|
|
State |
|
|
— |
|
|
— |
|
|
192 |
|
|
Total credits to stockholders' equity |
|
$ |
— |
|
$ |
— |
|
$ |
1,410 |
|
|
Income tax expense |
|
$ |
21,827 |
|
$ |
71,470 |
|
$ |
52,771 |
|
In 2016, the Company adopted a new accounting standard that requires excess tax benefits from stock compensation to be recorded as a reduction to income tax expense instead of being recorded directly to equity. Excess tax benefits recognized for the years ended December 31, 2017 and 2016 reduced income tax expense by $9.5 million and $0.6 million, respectively. In the reconciliation of income tax expense presented below, the reduction of income tax expense from excess tax benefits recognized is included as a component of the “Other” line item.
In December 2017, the Tax Cuts and Jobs Act (“Tax Reform”) was enacted. The Tax Reform significantly reduced the Federal income tax rate from 35.0% to 21.0%. GAAP requires an entity to account for the impact of a tax law change
F-41
in the period of enactment. Accordingly, the Company revalued its deferred tax assets and deferred tax liabilities using the new Federal income tax rate of 21.0%, which is the rate at which the Company expects the deferred assets and liabilities to reverse in the future. Deferred tax assets decreased as the future benefit from these assets will be less than previously expected, resulting in an increase to deferred tax expense. Deferred tax liabilities also decreased as the future payment of taxes from these liabilities will be less than previously expected, resulting in a decrease to deferred tax expense. As the Company had more deferred tax liabilities than deferred tax assets as of December 31, 2017, the impact of Tax Reform on deferred tax expense was an overall significant decrease in deferred tax expense as shown above.
A reconciliation of the statutory federal tax expense to the income tax expense in the accompanying statements of income follows:
|
|
|
For the year ended December 31, |
|
|||||||
|
(in thousands) |
|
2017 |
|
2016 |
|
2015 |
|
|||
|
Statutory federal expense (35%) |
|
$ |
81,781 |
|
$ |
65,023 |
|
$ |
47,378 |
|
|
Statutory state income tax expense, net of federal tax benefit |
|
|
7,594 |
|
|
6,714 |
|
|
4,611 |
|
|
Revaluation of deferred tax liabilities, net |
|
|
(58,313) |
|
|
— |
|
|
— |
|
|
Other |
|
|
(9,235) |
|
|
(267) |
|
|
782 |
|
|
Income tax expense |
|
$ |
21,827 |
|
$ |
71,470 |
|
$ |
52,771 |
|
Deferred Tax Assets/Liabilities
The tax effects of temporary differences between reported earnings and taxable earnings consisted of the following:
|
|
|
As of December 31, |
|
||||
|
(in thousands) |
|
2017 |
|
2016 |
|
||
|
Deferred Tax Assets |
|
|
|
|
|
|
|
|
Compensation related |
|
$ |
14,320 |
|
$ |
17,341 |
|
|
Credit losses |
|
|
959 |
|
|
1,269 |
|
|
Other |
|
|
149 |
|
|
407 |
|
|
Total deferred tax assets |
|
$ |
15,428 |
|
$ |
19,017 |
|
|
|
|
|
|
|
|
|
|
|
Deferred Tax Liabilities |
|
|
|
|
|
|
|
|
Mark-to-market of derivatives and loans held for sale |
|
$ |
(4,389) |
|
$ |
(19,934) |
|
|
Mortgage servicing rights related |
|
|
(115,239) |
|
|
(135,519) |
|
|
Acquisition related (1) |
|
|
(2,323) |
|
|
(722) |
|
|
Depreciation |
|
|
(1,536) |
|
|
(1,862) |
|
|
Total deferred tax liabilities |
|
$ |
(123,487) |
|
$ |
(158,037) |
|
|
Deferred tax liabilities, net |
|
$ |
(108,059) |
|
$ |
(139,020) |
|
|
(1) |
Acquisition-related deferred tax liabilities consist of book-to-tax differences associated with basis step ups related to the amortization of goodwill recorded from acquisitions, acquisition-related costs capitalized for tax purposes, and book-to-tax differences in intangible asset amortization. |
The Company believes it is more likely than not that it will generate sufficient taxable income in future periods to realize the deferred tax assets, even after consideration of Tax Reform. The significant decrease in the deferred tax liabilities, net shown above is related to the revaluation of the Company’s deferred tax assets and deferred tax liabilities from the enactment of Tax Reform.
F-42
Tax Uncertainties
The Company periodically assesses its liabilities and contingencies for all periods open to examination by tax authorities based on the latest available information. Where the Company believes it is more likely than not that a tax position will not be sustained, management records its best estimate of the resulting tax liability, including interest, in the consolidated financial statements. As of December 31, 2017, based on all known facts and circumstances and current tax law, management believes that there are no tax positions for which it is reasonably possible that the unrecognized tax benefits will significantly increase or decrease over the next 12 months, producing, individually or in the aggregate, a material effect on the Company’s results of operations, financial condition, or cash flows.
The Company is one of the leading commercial real estate services and finance companies in the United States, with a primary focus on multifamily lending. The Company originates a range of multifamily and other commercial real estate loans that are sold to the Agencies or placed with institutional investors. The Company also services nearly all of the loans it sells to the Agencies and some of the loans that it places with institutional investors. Substantially all of the Company’s operations involve the delivery and servicing of loan products for its customers. Management makes operating decisions and assesses performance based on an ongoing review of these integrated operations, which constitute the Company's only operating segment for financial reporting purposes.
The Company evaluates the performance of its business and allocates resources based on a single-segment concept. No one borrower/key principal accounts for more than 4% of our total risk-sharing loan portfolio.
An analysis of the product concentrations and geographic dispersion that impact the Company’s servicing revenue is shown in the following tables. This information is based on the distribution of the loans serviced for others. The principal balance of the loans serviced for others, by product, as of December 31, 2017, 2016, and 2015 follows:
|
|
|
|
|
|
|
|
|
|
|
|
|
|
|
As of December 31, |
|
|||||||
|
(in thousands) |
|
2017 |
|
2016 |
|
2015 |
|
|||
|
Fannie Mae |
|
$ |
32,075,617 |
|
$ |
27,728,164 |
|
$ |
22,915,088 |
|
|
Freddie Mac |
|
|
26,782,581 |
|
|
20,688,410 |
|
|
17,810,007 |
|
|
Ginnie Mae-HUD |
|
|
9,640,312 |
|
|
9,155,794 |
|
|
5,657,809 |
|
|
Life insurance companies and other |
|
|
5,993,656 |
|
|
5,508,786 |
|
|
3,829,360 |
|
|
Total |
|
$ |
74,492,166 |
|
$ |
63,081,154 |
|
$ |
50,212,264 |
|
The percentage of unpaid principal balance of the loans serviced for others as of December 31, 2017, 2016, and 2015 by geographical area, is as shown in the following table. No other state accounted for more than 5% unpaid principal balance and related servicing revenues in any of the years presented. The Company does not have any operations outside of the United States.
|
|
|
Percent of Total UPB as of December 31, |
|
||||
|
|
|
2017 |
|
2016 |
|
2015 |
|
|
California |
|
18.4 |
% |
17.2 |
% |
16.1 |
% |
|
Florida |
|
9.4 |
|
8.2 |
|
8.4 |
|
|
Texas |
|
9.2 |
|
8.5 |
|
7.9 |
|
|
Wisconsin |
|
4.5 |
|
5.0 |
|
4.9 |
|
|
All other states |
|
58.5 |
|
61.1 |
|
62.7 |
|
|
Total |
|
100.0 |
% |
100.0 |
% |
100.0 |
% |
F-43
NOTE 15—OTHER OPERATING EXPENSES
The following is a summary of the major components of other operating expenses for the years ended December 31, 2017, 2016, and 2015.
|
|
|
|
|
|
|
|
|
|
|
|
|
|
|
For the year ended December 31, |
|
|||||||
|
(in thousands) |
|
2017 |
|
2016 |
|
2015 |
|
|||
|
Professional fees |
|
$ |
12,154 |
|
$ |
12,089 |
|
$ |
10,936 |
|
|
Travel and entertainment |
|
|
8,038 |
|
|
7,004 |
|
|
6,461 |
|
|
Rent |
|
|
7,057 |
|
|
6,404 |
|
|
5,943 |
|
|
Marketing and preferred broker |
|
|
7,819 |
|
|
5,607 |
|
|
4,599 |
|
|
Office expenses |
|
|
6,776 |
|
|
4,539 |
|
|
4,103 |
|
|
All other |
|
|
6,327 |
|
|
5,695 |
|
|
6,465 |
|
|
Total |
$ |
48,171 |
$ |
41,338 |
$ |
38,507 |
||||
NOTE 16—QUARTERLY RESULTS (UNAUDITED)
The following tables set forth unaudited selected financial data and operating information on a quarterly basis as of and for the years ended December 31, 2017 and 2016. As noted previously, the Company’s financial results for the fourth quarter of 2017 reflect the impacts of the Tax Reform, which significantly reduced the Company’s income tax expense with a corresponding increase to Walker & Dunlop net income and impacts the comparison of the fourth quarter of 2017 to the fourth quarter of 2016.
|
|
|
|
|
|
|
|
|
|
|
|
|
|
|
|
|
|
As of and for the year ended December 31, 2017 |
|
||||||||||
|
(in thousands, except per share data) |
|
4th Quarter |
|
3rd Quarter |
|
2nd Quarter |
|
1st Quarter |
|
||||
|
Gains from mortgage banking activities |
|
$ |
129,458 |
|
$ |
111,304 |
|
$ |
102,176 |
|
$ |
96,432 |
|
|
Servicing fees |
|
|
46,713 |
|
|
44,900 |
|
|
43,214 |
|
|
41,525 |
|
|
Total revenues |
|
|
207,202 |
|
|
179,736 |
|
|
166,407 |
|
|
158,512 |
|
|
Personnel |
|
|
91,120 |
|
|
78,469 |
|
|
63,516 |
|
|
56,172 |
|
|
Amortization and depreciation |
|
|
33,705 |
|
|
32,343 |
|
|
32,860 |
|
|
32,338 |
|
|
Total expenses |
|
|
140,442 |
|
|
125,040 |
|
|
110,325 |
|
|
102,389 |
|
|
Income from operations |
|
|
66,760 |
|
|
54,696 |
|
|
56,082 |
|
|
56,123 |
|
|
Walker & Dunlop net income |
|
|
98,961 |
|
|
34,378 |
|
|
34,567 |
|
|
43,221 |
|
|
Diluted earnings per share |
|
$ |
3.06 |
|
$ |
1.06 |
|
$ |
1.08 |
|
$ |
1.35 |
|
|
Total transaction volume |
|
$ |
8,312,167 |
|
$ |
8,549,532 |
|
$ |
6,031,636 |
|
$ |
5,012,496 |
|
|
Servicing portfolio |
|
$ |
74,492,166 |
|
$ |
70,284,682 |
|
$ |
66,290,754 |
|
$ |
64,384,024 |
|
|
|
|
|
|
|
|
|
|
|
|
|
|
|
|
|
|
|
As of and for the year ended December 31, 2016 |
|
||||||||||
|
(in thousands, except per share data) |
|
4th Quarter |
|
3rd Quarter |
|
2nd Quarter |
|
1st Quarter |
|
||||
|
Gains from mortgage banking activities |
|
$ |
117,779 |
|
$ |
100,630 |
|
$ |
102,453 |
|
$ |
46,323 |
|
|
Servicing fees |
|
|
39,370 |
|
|
37,134 |
|
|
32,771 |
|
|
31,649 |
|
|
Total revenues |
|
|
178,391 |
|
|
154,786 |
|
|
147,858 |
|
|
94,241 |
|
|
Personnel |
|
|
73,126 |
|
|
64,377 |
|
|
55,758 |
|
|
34,230 |
|
|
Amortization and depreciation |
|
|
30,603 |
|
|
29,244 |
|
|
26,425 |
|
|
25,155 |
|
|
Total expenses |
|
|
117,210 |
|
|
106,074 |
|
|
96,152 |
|
|
70,059 |
|
|
Income from operations |
|
|
61,181 |
|
|
48,712 |
|
|
51,706 |
|
|
24,182 |
|
|
Walker & Dunlop net income |
|
|
36,790 |
|
|
29,628 |
|
|
32,021 |
|
|
15,458 |
|
|
Diluted earnings per share |
|
$ |
1.16 |
|
$ |
0.96 |
|
$ |
1.05 |
|
$ |
0.50 |
|
|
Total transaction volume |
|
$ |
6,260,898 |
|
$ |
5,032,238 |
|
$ |
5,389,276 |
|
$ |
2,615,700 |
|
|
Servicing portfolio |
|
$ |
63,081,154 |
|
$ |
59,121,989 |
|
$ |
57,321,824 |
|
$ |
51,040,752 |
|
F-44