Attached files
| file | filename |
|---|---|
| EX-32.02 - EXHIBIT 32.02 - PROOFPOINT INC | a12312017-ex3202.htm |
| EX-32.01 - EXHIBIT 32.01 - PROOFPOINT INC | a12312017-ex3201.htm |
| EX-31.02 - EXHIBIT 31.02 - PROOFPOINT INC | a12312017-ex3102.htm |
| EX-31.01 - EXHIBIT 31.01 - PROOFPOINT INC | a12312017-ex3101.htm |
| EX-23.01 - EXHIBIT 23.01 - PROOFPOINT INC | proofpoint-12312017xex2301.htm |
| EX-21.01 - EXHIBIT 21.01 - PROOFPOINT INC | proofpoint-12312017xex2101.htm |
UNITED STATES
SECURITIES AND EXCHANGE COMMISSION
Washington, D.C. 20549
__________________________________
FORM 10-K
þ | ANNUAL REPORT PURSUANT TO SECTION 13 OR 15(d) OF THE SECURITIES EXCHANGE ACT OF 1934 | |
For the Fiscal Year Ended December 31, 2017
OR
o | TRANSITION REPORT PURSUANT TO SECTION 13 OR 15(d) OF THE SECURITIES EXCHANGE ACT OF 1934 | |
For the Transition Period from to
Commission File Number 001-35506
PROOFPOINT, INC.
(Exact name of Registrant as specified in its charter)
Delaware (State or other jurisdiction of incorporation or organization) | 51-0414846 (I.R.S. employer identification no.) | |
892 Ross Drive Sunnyvale, California (Address of principal executive offices) | 94089 (Zip Code) | |
(408) 517-4710
(Registrant’s telephone number, including area code)
__________________________________
Securities registered pursuant to Section 12(b) of the Act:
Title of Each Class | Name of each exchange on which registered | |
Common Stock, $0.0001 par value per share | NASDAQ Global Select Market | |
Securities registered pursuant to Section 12(g) of the Act:
None | ||
__________________________________
Indicate by check mark if the registrant is a well-known seasoned issuer, as defined in Rule 405 of the Securities Act. YES þ NO o
Indicate by check mark if the registrant is not required to file reports pursuant to Section 13 or Section 15(d) of the Act. YES o NO þ
Indicate by check mark whether the registrant (1) has filed all reports required to be filed by Section 13 or 15(d) of the Securities Exchange Act of 1934 during the preceding 12 months (or for such shorter period that the registrant was required to file such reports), and (2) has been subject to such filing requirements for the past 90 days. YES þ NO o
Indicate by check mark whether the registrant has submitted electronically and posted on its corporate Web site, if any, every Interactive Data File required to be submitted and posted pursuant to Rule 405 of Regulation S-T (§232.405 of this chapter) during the preceding 12 months (or for such shorter period that the registrant was required to submit and post such files). YES þ NO o
Indicate by check mark if disclosure of delinquent filers pursuant to Item 405 of Regulation S-K (§229.405 of this chapter) is not contained herein, and will not be contained, to the best of registrant’s knowledge, in definitive proxy or information statements incorporated by reference in Part III of this Form 10-K or any amendment to this Form 10-K. o
Indicate by check mark whether the registrant is a large accelerated filer, an accelerated filer, a non-accelerated filer, or a smaller reporting company. See the definitions of “large accelerated filer,” “accelerated filer” and “smaller reporting company” in Rule 12b-2 of the Exchange Act.
Large accelerated filer þ | Accelerated filer o | Non-accelerated filer o (Do not check if a smaller reporting company) | Smaller reporting company o | Emerging growth company o | ||||
If an emerging growth company, indicate by check mark if the registrant has elected not to use the extended transition period for complying with any new or revised financial accounting standards provided pursuant to Section 13(a) of the Exchange Act. o
Indicate by check mark whether the registrant is a shell company (as defined in Rule 12b-2 of the Exchange Act). YES ¨ NO þ
The aggregate market value of the voting and non-voting common equity held by non-affiliates of the registrant, based upon the closing price of a share of the registrant’s common stock on June 30, 2017 as reported by the NASDAQ Global Select Market on that date, was approximately $3,763 million. This calculation does not reflect a determination that certain persons are affiliates of the registrant for any other purpose.
The number of shares outstanding of the registrant’s common stock as of February 9, 2018 was 50,546,319 shares.
__________________________________
DOCUMENTS INCORPORATED BY REFERENCE
Portions of the registrant’s Proxy Statement for its 2018 Annual Meeting of Stockholders (the “Proxy Statement”), to be filed with the Securities and Exchange Commission, are incorporated by reference into Part III of this Annual Report on Form 10-K where indicated. The Proxy Statement will be filed with the Securities and Exchange Commission within 120 days of the registrant’s fiscal year ended December 31, 2017.
PROOFPOINT, INC.
FORM 10-K
For the Fiscal Year Ended December 31, 2017
TABLE OF CONTENTS
Page | ||
PART I. | ||
Item 1. | ||
Item 1A. | ||
Item 1B. | ||
Item 2. | ||
Item 3. | ||
Item 4. | ||
PART II. | ||
Item 5. | ||
Item 6. | ||
Item 7. | ||
Item 7A. | ||
Item 8. | ||
Item 9. | ||
Item 9A. | ||
Item 9B. | ||
PART III. | ||
Item 10. | ||
Item 11. | ||
Item 12. | ||
Item 13. | ||
Item 14. | ||
PART IV. | ||
Item 15. | ||
Signatures | ||
1
CAUTIONARY STATEMENT REGARDING FORWARD-LOOKING STATEMENTS
This Annual Report on Form 10-K contains forward-looking statements within the meaning of the Private Securities Litigation Reform Act of 1995. All statements contained in this Annual Report on Form 10-K other than statements of historical fact, including statements regarding our future results of operations and financial position, our business strategy and plans, and our objectives for future operations, are forward-looking statements. The words “believe,” “may,” “will,” “estimate,” “continue,” “anticipate,” “intend,” “expect,” and similar expressions are intended to identify forward-looking statements. We have based these forward-looking statements largely on our current expectations and projections about future events and trends that we believe may affect our financial condition, results of operations, business strategy, short-term and long-term business operations and objectives, and financial needs. These forward-looking statements are subject to a number of risks, uncertainties and assumptions, including those described in Part I, Item 1A, “Risk Factors” in this Annual Report on Form 10-K. Moreover, we operate in a very competitive and rapidly changing environment. New risks emerge from time to time. It is not possible for our management to predict all risks, nor can we assess the impact of all factors on our business or the extent to which any factor, or combination of factors, may cause actual results to differ materially from those contained in any forward-looking statements we may make. In light of these risks, uncertainties and assumptions, the future events and trends discussed in this Annual Report on Form 10-K may not occur and actual results could differ materially and adversely from those anticipated or implied in the forward-looking statements. We undertake no obligation to revise or publicly release the results of any revision to these forward-looking statements, except as required by law. Given these risks and uncertainties, readers are cautioned not to place undue reliance on such forward-looking statements.
Unless expressly indicated or the context requires otherwise, the terms “Proofpoint,” “Company,” “Registrant,” “we,” “us,” and “our” mean Proofpoint, Inc. and its subsidiaries unless the context indicates otherwise.
2
PART I
ITEM 1. BUSINESS
Overview
Proofpoint is a leading next generation cybersecurity company that enables large and mid-sized organizations worldwide to protect the way their people work from advanced threats and compliance risks. Our security and compliance platform is comprised of an integrated suite of threat protection, information protection, and brand protection solutions, including email protection, advanced threat protection, email authentication, data loss prevention, SaaS application protection, response orchestration and automation, digital risk, web browser isolation, email encryption, archiving, eDiscovery, supervision, and secure communication. Our solutions are built on a flexible, cloud-based platform and leverage a number of proprietary technologies - including big data analytics, machine learning, deep content inspection, secure storage, advanced encryption, intelligent message routing, dynamic malware analysis, threat correlation, and virtual execution environments to address today’s rapidly changing threat and compliance landscape.
Cyberattacks have fundamentally shifted from targeting infrastructure to targeting people, relying on tricking users into running code, divulging their passwords, or even sending money or data. This transformation of the threat landscape manifests in nearly every form of cyber threat, from nation state advanced persistent threat (APT) actors relying on phishing, through to cybercriminals launching massive ransomware email campaigns, and more targeted campaigns designed to steal valuable data from both legacy and cloud-based systems. At the same time, the rapid adoption of cloud applications has increased organizations’ attack surface by moving both threats and sensitive data away from the traditional network perimeter, reducing the effectiveness of many existing security products. These factors have contributed to an increasing number of severe data breaches and expanding regulatory mandates, notably the European Union’s General Data Protection Regulation (GDPR), all of which have accelerated demand for effective threat protection and compliance solutions.
Our platform addresses this growing challenge by not only protecting data as it flows into and out of the enterprise via on-premises and cloud-based email, social media, and other cloud applications, but also by keeping track of this information as it is modified and distributed throughout the enterprise for compliance and data loss prevention, and securely archiving these communications for compliance and discovery. We address four important problems for the enterprise:
• | Protecting users from the advanced attacks that target them via email, social media, and SaaS apps; |
• | Preventing the theft or inadvertent loss of sensitive information and, in turn, ensuring compliance with regulatory data protection mandates; |
• | Collecting, retaining, supervising and discovering sensitive data for compliance and litigation support; and |
• | Enabling organizations to respond quickly to security issues, providing both the intelligence and the context to prioritize incidents and orchestrate remediation actions. |
Our platform and its associated solutions are sold to customers on a subscription basis and can be deployed through our unique cloud-based architecture that leverages both our global data centers as well as optional points-of-presence behind our customers’ firewalls. Our flexible deployment model enables us to deliver superior security and compliance while maintaining the favorable economics afforded by cloud computing, creating a competitive advantage for us over legacy on-premises and cloud-only offerings.
We were founded in 2002 to provide a unified solution to help enterprises address their growing data security requirements. Our first solution was commercially released in 2003 to combat the burgeoning problem of spam and viruses and their impact on corporate email systems. To address the evolving threat landscape and the adoption of communication and collaboration systems beyond corporate email and networks, we have broadened our solutions to defend against a wide range of threats, including email, mobile apps and social media, to protect the information people create from both compromise and compliance risks, and to archive and govern corporate information. Today, our solutions are used worldwide to protect well over 100 million end-users at enterprise customers, and millions more via service providers through our Cloudmark division. We market and sell our solutions worldwide both directly through our sales teams and indirectly through a hybrid model where our sales organization actively assists our network of distributors and resellers. We also distribute our solutions through strategic partners.
3
Proofpoint Solutions
Our integrated suite of on-demand security-as-a-service solutions enables large and mid-sized organizations to protect people throughout the enterprise from advanced attacks and compliance risks. Our comprehensive platform provides a secure email gateway, advanced threat protection, threat intelligence, email authentication, email encryption, data loss prevention, digital risk, SaaS application protection, web browser isolation, archiving, eDiscovery, and threat response capabilities. These solutions are built on a cloud-based architecture, protecting enterprises and their customers from inbound threats via email, social media, and mobile apps, while identifying and protecting enterprise data not only where it is stored within the enterprise but also as it transits beyond the organization’s borders such as via email or social media. We have pioneered the use of innovative technologies to deliver better ease-of-use, greater protection against the latest advanced threats, and lower total cost of ownership than traditional alternatives. The key elements of our solution include:
• | Superior protection against both advanced and targeted threats. We use a combination of proprietary technologies for big data analytics, machine learning, deep content inspection, static and dynamic malware analysis, protocol analysis, threat correlation, threat intelligence extraction, and virtual execution environments to predictively and actively detect and stop targeted “spear phishing” and other sophisticated advanced threats, including malicious attachments, polymorphic threats, zero-day exploits, user-transparent “drive-by” downloads, malicious web links, hybrid threats (such as links inserted into attached files), malware free attacks like impostor threats and credential phishing, and other penetration tactics. By processing, analyzing and correlating billions of data points on a daily basis, we can recognize anomalies in order to predictively detect targeted attacks before users are exposed. Our deep content inspection technology enables us to identify malicious message attachments and distinguish between valid messages and “phishing” messages designed to look authentic and trick the end-user into divulging sensitive data or clicking on a malicious web link. Our machine learning technology enables us to detect targeted “zero-hour” attacks in real-time, even if they have not been seen previously at other locations, and quarantine them appropriately. Our dynamic malware analysis and virtual execution environment technologies enable us to examine web site destinations and downloadable files to identify and block potentially hostile code that would otherwise compromise end-user computers, even in cases where the web sites are considered reputable or the attachment’s malicious payload is obfuscated or otherwise disguised. Our threat correlation technologies enable us to rapidly confirm and contain threats, providing rapid, automated protection. In addition, our threat intelligence and response capabilities enable our customers to both prioritize threats that may have compromised them via our Emerging Threat Intelligence and orchestrate or automate protective countermeasures via Proofpoint Threat Response. |
• | Comprehensive, integrated email security, advanced threat, information protection and archiving, and digital risk protection product families. We offer a comprehensive solution for email security, composed of our Enterprise Protection, Email Fraud Defense, and Email Continuity offerings. Our advanced threat product family includes solutions to protect organizations across the predominant threat vectors, including email, social media, mobile apps, and SaaS applications. To protect enterprise data from security and compliance risks, our Information Protection product family includes a suite of security solutions (Data Loss Prevention, Encryption, and Data Discover for data at rest) and compliance (Enterprise Archive, eDiscovery Analytics, and Supervision). Finally, our digital risk protection suite enables organizations to look beyond their borders for threats targeting their customers across email phishing, malicious web domains, fraudulent mobile apps, and fraudulent social media accounts. |
• | Designed to empower end-users. Unlike legacy offerings that simply block communication or report audit violations, our solutions actively enable secure business-to-business and business-to-consumer communications. Our easy-to-use policy-based email encryption service automatically encrypts sensitive emails and delivers them to any PC or mobile device. In addition, our secure file-transfer solution makes it easy for end-users to securely share various forms of documents and other content that are typically too large to send through traditional e-mail systems. All of our solutions provide mobile-optimized capabilities to empower the growing number of people who use mobile devices as their primary computing platform. |
• | Security optimized cloud architecture. Our multi-tenant security-as-a-service solution leverages a distributed, scalable architecture deployed in our global data centers for deep content inspection, global threat correlation and analytics, high-speed search, secure storage, encryption key management, software updates, intelligent message routing, and other core functions. Our architecture also enables us to look across hundreds of billions of data points gathered from across our product portfolio and intelligence feeds to better correlate and analyze both targeted and broad-based threat campaigns. Customers can choose to deploy optional physical or virtual points-of-presence behind their firewalls for those who prefer to deploy certain functionality inside their |
4
security perimeter. This architecture enables us to leverage the benefits of the cloud to cost-effectively deliver superior security and compliance, while optimizing each deployment for the customer’s unique threat environment.
• | Extensible security-as-a-service platform. The key components of our security-as-a-service platform, including services for secure storage, content inspection, reputation, big data analytics, encryption, key management, and identity and policy, can be exposed through application programming interfaces, or APIs, to integrate with internally developed applications as well as with those developed by third-parties. In addition, these APIs provide a means to integrate with the other security and compliance components deployed in our customers’ infrastructures, including Proofpoint’s ecosystem partners. |
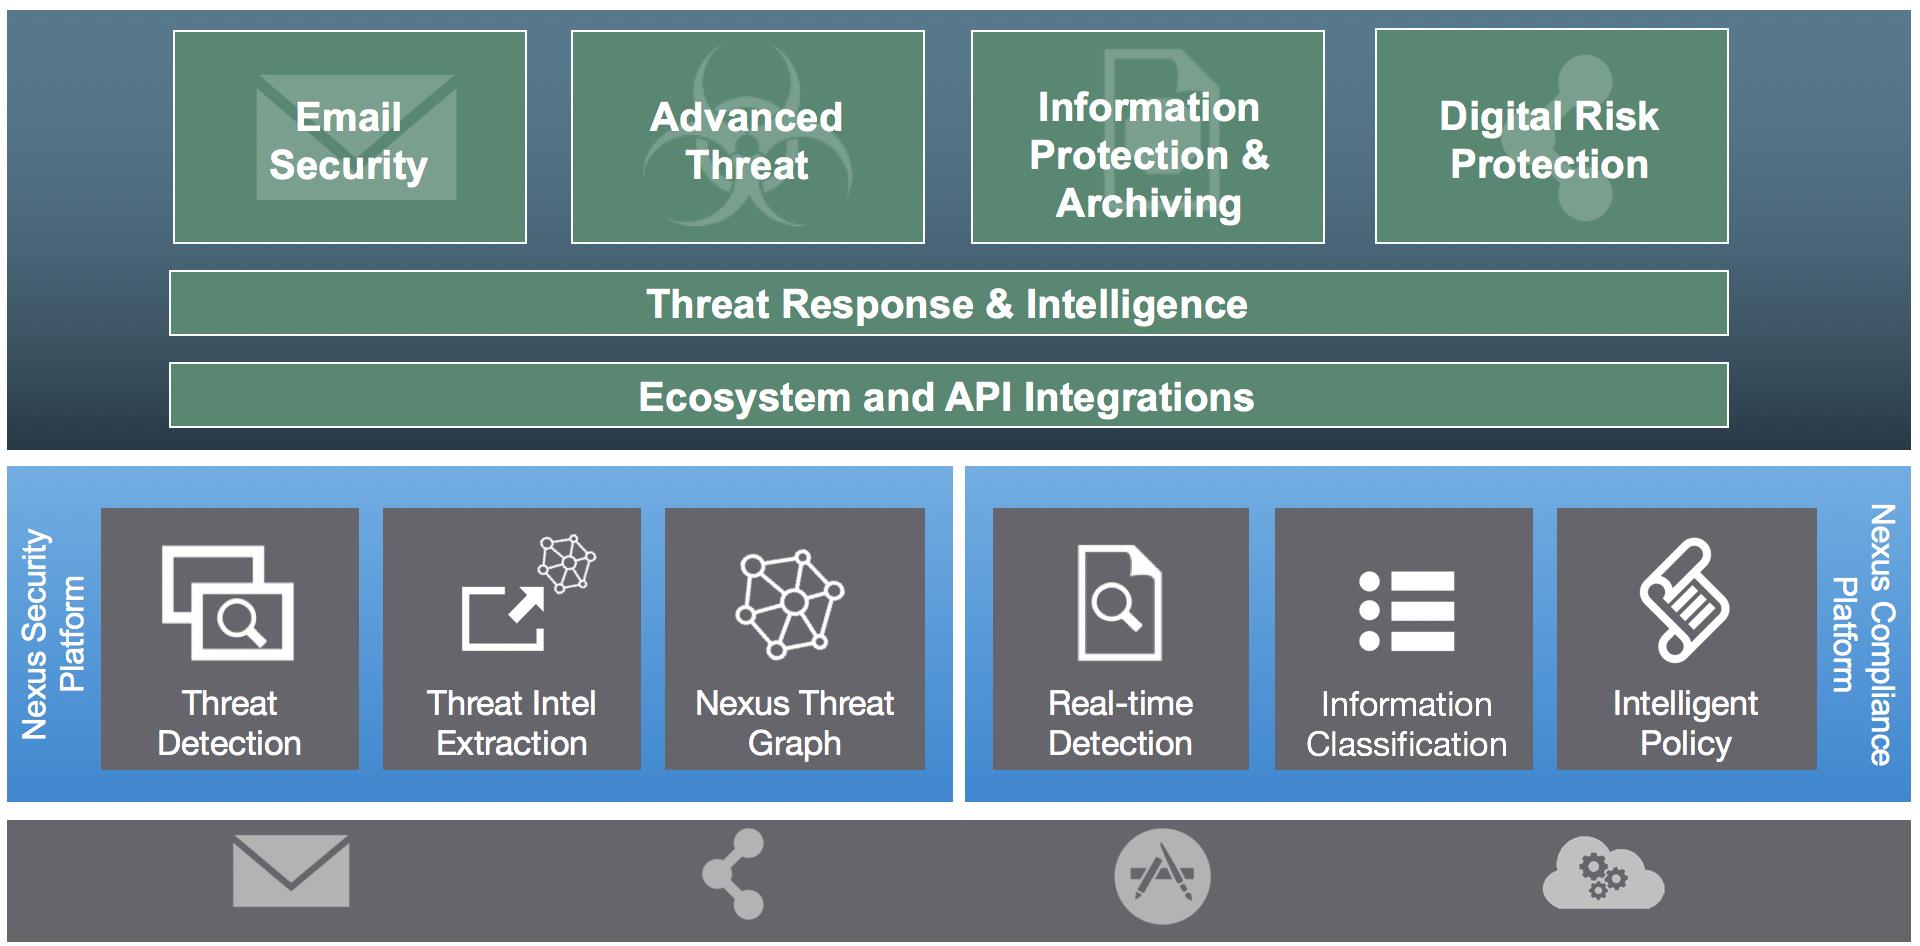
Our Security-as-a-Service Platform
We provide a multi-tiered security-as-a-service platform consisting of solutions, platform technologies and infrastructure. Our platform currently includes product families and related bundles for the convenience of our customers, distributors and resellers. Each of these solutions is built as an aspect of our security-as-a-service platform, which includes both platform services and enabling technologies for both security and compliance. Our platform services provide the key functionality to enable our various solutions while our enabling technologies work in conjunction with our platform services to enable the efficient construction, scaling and maintenance of our customer-facing solutions.
Our suite is delivered by a cloud infrastructure and can be deployed as a secure cloud-only solution, or as a hybrid solution with optional physical or virtual points-of-presence behind our customers’ firewalls for those who prefer to deploy certain functionality inside their security perimeter. In all deployment scenarios, our cloud-based architecture enables us to leverage the benefits of the cloud to cost-effectively deliver superior security and compliance while maintaining the flexibility to optimize deployments for customers’ unique environments. The modularity of our solutions enables our existing customers to implement additional modules in a simple and efficient manner.
Product Families
Email Security
Proofpoint’s Email Security Product family includes the Enterprise Protection secure email gateway, Email Fraud Defense, Email Continuity, and Proofpoint Essentials. This suite of enterprise products is designed to protect customers’ mission-critical messaging infrastructure from outside threats, enable enterprises to authenticate their email to reduce consumer phishing and fight business email compromise (“BEC”) attacks, and keep email operational in the event of a service provider outage. Proofpoint Essentials provides a version of these capabilities tailored to small- and medium-sized businesses. Key capabilities within the email security products include:
5
• | Enterprise Protection. Uses our Proofpoint MLX machine learning technology and reputation data to examine millions of possible attributes in every message to block phishing and spear phishing attacks, spam, viruses, impostor email/business email compromise attacks, and other forms of malicious or objectionable content. This solution also includes sophisticated policy and routing controls designed to ensure security and the effective handling of all classifications of content, and includes the Smart Search tool to provide real-time visibility into message flows across an organization’s messaging infrastructure, using built-in logging and reporting capabilities with advanced message tracing, forensics and log analysis capabilities. |
• | Email Fraud Defense. Enables organizations to understand who is sending email from their domains, and create a policy to both authenticate legitimate email and block fraudulent email. |
• | Email Continuity. Allows organizations to maintain email communications if their on-premises or cloud-based email servers experience an outage. |
• | Proofpoint Essentials. Our suite of security-as-a-service and compliance solutions specifically designed for distribution across managed service providers and dedicated security resellers. Key capabilities include inbound email filtering to block spam and malware, outbound filtering for compliance with company policies, email continuity to enable email service availability, targeted attack protection, and email archiving. |
Key benefits of the email security products include:
• | Superior protection from advanced threats, spam and viruses. Protects against advanced threats, spam and other malware such as remote access Trojans, banking Trojans, ransomware, viruses, and spyware. |
• | Comprehensive outbound threat protection. Analyzes all outbound email traffic to block spam, viruses and other malicious content from leaving the corporate network, and pinpoint the responsible compromised systems. |
• | Effective, flexible policy management and administration. Provides a user-friendly, web-based administration interface and robust reporting capabilities that make it easy to define, enforce and manage an enterprise’s messaging policies. |
• | Easy-to-use end-user controls. Gives email users easy, self-service control over their individual email preferences within the parameters of corporate-defined messaging policies. |
• | Superior protection from business email compromise. Combining a dynamic classifier on the email gateway with a proactive authentication solution and a lookalike domain discovery service delivers the industry’s most comprehensive protection from these attacks. |
• | Business continuity. Provides an always-on insurance policy for crucial business communications via email. |
Proofpoint Advanced Threat Protection
Proofpoint’s advanced threat protection products leverage a broad set of detection techniques that are constantly refined as the threat landscape evolves. The products are capable of detecting and preventing threats across email, social media, mobile apps, and SaaS applications, and deliver rich intelligence to enable enterprises to understand as much as possible about the attacks they are seeing and the adversaries behind them. Key capabilities of the advanced threat products include:
• | Targeted attack protection. Enterprises are protected against both commodity and advanced threats such as phishing and other targeted email attacks by the use of big data analysis, predictive, virtual execution, static analysis, protocol analysis, and dynamic malware analysis techniques to identify and apply additional security controls against suspicious messages, attachments and any associated links to the web. The same detection techniques are extended to look for malicious content in enterprise social media accounts, malicious links and files sent to users via SaaS applications, and malicious mobile apps that siphon off data or function as remote access Trojans. |
• | Threat response. Provides threat information and indicators of compromise (“IoCs”) correlation, aggregating across Proofpoint and other third-party security products, to confirm and contain system compromises. By taking advantage of this automated incident response, enterprises can minimize exfiltration windows and leverage staff for breach prevention and mitigation. In addition, it can be leveraged to automatically remove malicious emails that have been delivered to users’ email inboxes, reducing the potential risk exposure. |
Key benefits of Proofpoint Advanced Threat Protection include:
6
• | Superior effectiveness. Proofpoint’s agility in deploying new detection measures and adjusting defenses in response to changes in the threat landscape results in high effectiveness in stopping threats before they reach enterprise users. |
• | Curated threat intelligence. Proofpoint’s threat research team tracks campaigns and actors, providing detailed research in addition to curated IoCs. The high quality of this threat intelligence enables customers to better prioritize their responses to alerts generated by Proofpoint products, as well as leverage the intelligence to hunt for threats that may have compromised their enterprises via other channels. |
Proofpoint Information Protection and Archiving
A comprehensive data protection strategy must address both security and compliance risks. Our data loss prevention, encryption and compliance solution defends against leaks of confidential information, and helps ensure compliance with common U.S., international and industry-specific data protection regulations - including the Health Care Insurance Portability and Accountability Act of 1996 (“HIPAA”), the Gramm-Leach-Bliley Act, Canada’s Personal Information Protection and Electronic Documents Act, as well as acts such as CA SB 24, MA 201 CMR 17.00, ITAR, NERC-CIP, CFTC red flag rules, Basel II, EuroSOX (Directive 84/253/EEC), the European Union GDPR, and the Payment Card Industry Data Security Standard (PCI-DSS).
Proofpoint Information Protection and Archiving is designed to ensure accurate enforcement of data governance, data retention and supervision policies and mandates; cost-effective litigation support through efficient discovery; and active legal-hold management. It can store, govern and discover a wide range of data including email, instant message conversations, social media interactions, and other files throughout the enterprise.
Key capabilities within Proofpoint Information Protection and Archiving include:
• | Advanced data loss prevention. Our advanced data loss prevention solution identifies regulated private content, valuable corporate assets and confidential information before it leaves the organization via email, web-based applications, or our Secure Share solution. Pre-packaged smart identifiers and dictionaries automatically and accurately detect a wide range of regulated content such as social security numbers, health records, credit card numbers, and driver’s license numbers. In addition to regulated content, our machine learning technology can identify confidential, organization-specific content and assets. Once identified and classified, sensitive data can be blocked, encrypted and transmitted or re-routed internally based on content and identity-aware policies. |
• | Flexible remediation and supervision. Content, identity and destination-aware policies enable effective remediation of potential data breaches or regulatory violations. Remediation options include stopping the transfer completely, automatically forcing data-encryption, or routing to a compliance supervisor or the end-user for disposition. The solution also provides comprehensive reporting on potential violations and remediation using our analytics capabilities. |
• | Policy-based encryption. Automatically encrypts regulated and other sensitive data before it leaves an organization’s security perimeter without requiring cumbersome end-user key management. This enables authorized external recipients, whether or not they are our customers, to quickly and easily decrypt and view content from most devices. |
• | Encrypted message portal. Organizations in regulated industries like financial services and healthcare frequently need to share highly confidential messages with outside parties. Proofpoint provides a “pull encryption” portal that enables these organizations to create branded portals that seamlessly integrate with their email systems to securely communicate with their customers, patients, or other third parties. |
• | Secure share. Cloud-based security-focused solution designed to enable enterprise users to securely exchange large files with ease while staying compliant with enterprise data policies. |
• | Data Discover. Automated discovery and remediation solution that identifies sensitive content across the enterprise and enables corrective action, while reducing risk of data breaches and compliance violations. |
• | Secure cloud storage. With our proprietary double blind encryption technology and the associated data storage architecture, all email messages, files and other content are encrypted with keys controlled by the customer before the data enters the Proofpoint Enterprise Archive. This ensures that even our employees and law-enforcement agencies cannot access a readable form of the customer data without authorized access by the customer to the encryption keys stored behind the customer’s firewall. |
7
• | Search performance. By employing parallel, big data search techniques, we are able to deliver search performance measured in seconds, even when searching hundreds of terabytes of archived data. Traditional on-premise solutions can take hours or even days to return search results to a complex query. |
• | Flexible policy enforcement. Enables organizations to easily define and automatically enforce data retention and destruction policies necessary to comply with regulatory mandates or internal policies that can vary by user, group, geography or domain. |
• | Active legal-hold management. Enables administrators or legal professionals to easily designate specific individuals or content as subject to legal-hold. Proofpoint Enterprise Archive then provides active management of these holds by suspending normal deletion policies and automatically archiving subsequent messages and files related to the designated matter. |
• | End-user supervision. Leveraging our flexible workflow capabilities, Proofpoint Enterprise Archive analyzes all electronic communications, including email and communications from leading instant messaging and social networking sites, for potential violations of regulations, such as those imposed by Financial Industry Regulatory Authority (“FINRA”) and the SEC in the financial services industry. |
Key benefits of Proofpoint Information Protection and Archiving include:
• | Regulatory compliance. Data Loss Prevention and Encryption enable outbound messages to comply with national and state government and industry-specific privacy regulations, while Enterprise Archive helps organizations meet regulatory requirements by archiving all messages and content according to compliance retention policies and enabling staff to systematically review messages for compliance supervision. SaaS Protection extends the same compliance functionality to cloud applications like Office 365, Box, Salesforce, and G Suite. |
• | Superior malicious and accidental data loss protection. Protects against the loss of sensitive data, whether from a cybercriminal attempting to exfiltrate valuable data from a compromised system, or from an employee accidentally distributing a file to the wrong party through email, webmail, social media, file sharing, or other Internet-based mechanisms for publishing content. |
• | Easy-to-use secure communication. Allows corporate end-users to easily share sensitive data without compromising security and privacy, and enables authorized external recipients to transparently decrypt and read the communications from any device. Our mobile-optimized interfaces provide an easy experience for the rapidly growing number of recipients on smartphones and tablets. |
• | Reduction in “attack surface”. Enables the automated protection of sensitive data, reducing the amount of critical information potentially exposed to an attacker in a breach scenario. |
• | Proactive data governance. Allows organizations to create, maintain and consistently enforce a clear corporate data retention policy, reducing the risk of data loss and the cost of eDiscovery. |
• | Efficient litigation support. Provides advanced search features that reduce the cost of eDiscovery and allow organizations to more effectively manage the litigation hold process. |
• | Reduced storage and management costs. Helps to simplify mailbox and file system management by automatically moving storage-intensive attachments and files into cost-effective cloud storage. |
Proofpoint Digital Risk Protection
Proofpoint Digital Risk Protection looks beyond the enterprise perimeter to deliver real-time, omnichannel digital risk discovery and protection from brand fraud, data loss, physical threats, and cyber threats. With this solution, enterprises can engage with their customers across web, email, mobile, and social media with the confidence that their brands and customers are safe from all forms of digital risk.
The key features of the Digital Risk product family include:
• | Detecting Brand Fraud. Fraudsters imitate companies’ brands across digital channels to target customers with phishing scams, malware, phishing, and counterfeit products. Using a native cloud-based platform, customers can quickly find fraudulent social media accounts, web domains, and mobile apps that are affiliated with their brands. |
8
• | Detecting External Threats. External threat management tools enable organizations to quickly identify leaked intellectual property, credentials, and customer data on the web or dark web. Additionally, detection measures can identify cyber criminals using digital tools to plan and execute cyber-attacks that target company’s digital presence and/or physical attacks on its executives, employees, and physical locations. |
• | Compliance Monitoring and Protection. Leveraging social media APIs, the platform can monitor and apply content policies to the brand’s owned social media accounts for security, compliance and acceptable use. Using proprietary Deep Social Linguistic Analysis technology, social media and brand managers can aggregate content from across their enterprise and review it for security, risk and compliance violations (including FINRA, Federal Financial Institutions Examination Council, Food and Drug Administration, SEC, Financial Conduct Authority violations), allowing them to safely syndicate content distribution across their social media marketing platforms. |
Key benefits of Proofpoint Digital Risk Protection include:
• | Reduction of fraud. Enterprises can reduce both the direct and indirect costs relating to fraud by rapidly and proactively identifying fraudulent web domains, mobile apps, and social media accounts leveraged by cyber criminals in phishing and other forms of attacks. |
• | Visibility into external threats. Organizations benefit from early warnings of potentially harmful threats to physical sites, digital presences, and key executives, as well as well as unauthorized posting or resale of their private data. |
• | Enhanced compliance. Reduces potential liability from inadvertent posting of sensitive data and demonstrates compliance with more than 35 standards and industry regulations. Automates compliance review processes and social advocate programs through seamless integration with leading social media management suites. |
Platform Services
Our platform services provide the key functionality to implement our various solutions, using our enabling technologies. Our platform services primarily consist of:
• | Threat detection. Proofpoint deploys an ensemble approach to detect both malware and malware-free attacks. The approach combines multiple forms of detection, including composite reputation correlation, sandboxing for malicious attachments, URLs, and credential phishing, code analysis, network detection, and classifiers for phishing and impostor/BEC attacks. |
• | Threat intel extraction. Proofpoint leverages a dedicated environment to learn as much as possible about threats that are detected by any part of the ensemble approach. The extraction environment leverages virtual sandboxes, physical hardware, and human analysts to induce malware to detonate and gather as much forensic detail about it as possible. |
• | Nexus threat graph. Proofpoint synthesizes threat intelligence gathered from the vectors and threat feeds in a graph database known as Proofpoint Nexus, which is leveraged by threat researchers to correlate threats into campaigns, analyze new threats for links to known actors, and lend context (e.g. what vertical industries are seeing a given campaign) to all detected threats. |
• | Real-time detection. Proofpoint leverages platform services to be in the flow of the movement of potentially sensitive data, including our email gateways, API-based social media integrations, mobile applications store scanning tools, and SaaS application API/proxy connectivity. |
• | Information classification. For regulated or otherwise sensitive data, Proofpoint leverages smart identifiers to accurately recognize data types that are relevant from either a security or compliance perspective. |
• | Intelligent policy. Proofpoint’s information protection and archive products leverage an intelligent policy framework that spans retention, legal hold, smart identifiers, and compliance frameworks, regardless of where the data may be stored or by which channel it is being sent. |
Enabling Technologies
Our enabling technologies are a proprietary set of building blocks that work in conjunction with our application services to enable the efficient construction, scaling and maintenance of our customer-facing solutions. These technologies primarily consist of:
9
• | Big data analytics. Indexes and analyzes petabytes of information in real-time to discover threats, detect data leaks and enable end-users to quickly and efficiently access information distributed across their organizations. |
• | Machine learning. Builds predictive data models using our proprietary Proofpoint MLX machine learning techniques to rapidly identify and classify threats and sensitive content in real-time. |
• | Identity and policy. Enables the definition and enforcement of sophisticated data protection policies based on a wide set of variables, including type of content, sender, recipient, pending legal matters, time and date, regulatory status and more. |
• | Secure storage. Stores petabytes of data in the cloud cost-effectively using proprietary encryption methods, keeping sensitive data tamper-proof and private, yet fully searchable in real-time. |
• | Virtual execution environments. Exposes suspected malware to a permuted set of instrumented virtual system environments, to assess maliciousness, exploit activity and compromise processes. |
• | Intelligent message routing. Policies can be established by administrators to automatically direct email communications differently through the email network, based on aspects of the messages, for security, compliance, supervisory, system performance, or other reasons. |
• | Threat intelligence correlation. Utilizes inputs from Proofpoint, cloud, and other third-party products to assess IoCs and confirm successful system compromises by malicious actors in near-real-time, then administers network controls to effectively contain the compromised systems. |
Infrastructure
We deliver our security-as-a-service solutions through our cloud architecture and international data center infrastructure. We operate thousands of physical and virtual servers across thirteen data centers located in the United States, Canada, the Netherlands, France, and Germany.
Our cloud architecture is optimized to meet the unique demands of delivering real-time security-as-a-service to global enterprises. Key design elements include:
• | Security. Security is central to our cloud architecture and is designed into all levels of the system, including physical security, network security, application security, and security at our third-party data centers. Our security measures have met the rigorous standards of SSAE 16 certification. In addition to this commercial certification program, we have also successfully completed the FISMA certification for our cloud-based information protection and archiving solution, enabling us to serve the rigorous security requirements of U.S. federal agencies. |
• | Scalability and performance. By leveraging a distributed, scalable architecture we process billions of requests against our reputation systems and hundreds of millions of messages per day, all in near real-time. Massively-parallel query processing technology is designed to ensure rapid search results over this vast data volume. In addition to this aggregate scalability across all customers, our architecture also scales to effectively meet the needs of several of our largest individual customers, each of which has millions of users and processes tens of millions of messages per day. |
• | Hybrid Deployment. Our cloud architecture enables individual customers to deploy entirely in Proofpoint’s global data centers or in hybrid configurations with optional points of presence located behind the customer’s firewall. This deployment flexibility enables us to deliver security, compliance and performance tailored to the unique threat profile and operating environment of each customer. |
• | High availability. Our services employ a wide range of technologies including redundancy, geographic distribution, real-time data replication and end-to-end service monitoring to provide 24x7 system availability. |
• | Network operations control. We employ a team of skilled professionals who monitor, manage and maintain our global data center infrastructure and its interoperability with the distributed points of presence located behind our customers’ firewalls to ensure 24x7 operations. |
10
Customers
As of December 31, 2017, we had customers of all sizes across a wide variety of industries. A number of our largest customers use our platform to protect more than a million users and handle over a billion messages per day. During the year ended December 31, 2017, one partner accounted for 12% of total revenue, although the partner sold to a number of end-users, none of which accounted for more than 10% of our total revenue in 2017. During the years ended December 31, 2016 and 2015, no individual customer accounted for more than 10% of total revenue. In each year since the launch of our first solution in 2003, we have maintained a renewal rate with our existing customers of over 90%.
We target large and mid-sized organizations across all major verticals including aerospace and defense, education, financial services, government, healthcare, manufacturing and retail. We have been particularly successful selling to the largest enterprises in the United States as ranked by Fortune Magazine. We have also had success penetrating the market leaders in a number of significant verticals including:
• | 3 of the 5 largest U.S. retailers |
• | 4 of the 5 largest U.S. aerospace and defense contractors |
• | 5 of the 5 largest U.S. banks |
• | 3 of the 5 largest global pharmaceutical companies |
• | 3 of the 5 largest U.S. petroleum refining companies |
Sales and Marketing
Sales
We primarily target large and mid-sized organizations across all industries. Our sales and marketing programs are organized by geographic regions, including Asia-Pacific, EMEA, Japan, North America, and South America, and we further segment and organize our sales force into teams that focus on large enterprises (4,000 employees and above), mid-sized organizations (1,000 - 4,000 employees) and existing customers. In addition, we create integrated sales and marketing programs targeting specific vertical-markets. This vertical-market approach enables us to provide a higher level of service and understanding of our customers’ unique needs, including the industry-specific business and regulatory requirements in industries such as healthcare, financial services, retail and education.
We sell through both direct and indirect channels, including technology and channel partners:
• | Direct sales and reseller channel. We market and sell our solutions to large and mid-sized customers directly through our field and inside sales teams as well as indirectly through a hybrid model, where our sales organization actively assists our network of distributors and resellers. Our sales personnel are primarily located in North America, with additional personnel located in Asia-Pacific, EMEA, Japan and South America. Our reseller partners maintain relationships with their customers throughout the territories in which they operate, providing them with services and third-party solutions to help meet their evolving security requirements. As such, these partners act as a direct conduit through which we can connect with these prospective customers to offer our solutions. Our channel partners include security centric resellers such as CDW, Optiv, and AT&T, as well as distributors such as Ingram Micro and Exclusive Networks. |
• | Strategic relationships. We also sell our solutions indirectly through key technology companies that offer our solutions in conjunction with one or more of their own products or services. These companies each have their own base of customers, and they distribute our products to augment their own branded products and solutions, sometimes under their own brand and sometimes under the Proofpoint brand. In addition, our Cloudmark division delivers email protection to many of the largest global internet service providers. |
For sales involving a partner such as a distributor, reseller or strategic partner, the partner engages with the prospective customer directly and involves our sales team as needed to assist in developing and closing an order. At the conclusion of a successful sales cycle, we sell the associated subscription, hardware and services to the partner who in turn resells these items to the customer, with the partner earning a margin based on the amount paid to Proofpoint as compared to the amount charged to the customer. With the order completed, we provide these customers with direct access to our security-as-a-service platform and other associated services, enabling us to establish a direct relationship and provide them with support as part of ensuring that the customer has a good experience with our platform. At the end of the contract term, the partner engages with the customer to execute a renewal order, with our team providing assistance as required.
11
Marketing
We have a number of marketing initiatives to build awareness about our solutions and encourage customer adoption of our solutions. Our marketing programs include a variety of digital marketing, advertising, conferences, events, white-papers, public relations activities and web-based seminar campaigns targeted at key decision makers within our prospective customers.
We offer free trials, competitive evaluations, and free security and compliance risk assessments to allow prospective customers to experience the quality of our solutions, to learn in detail about the features and functionality of our suite, and to quantify the potential benefits of our solutions.
Customer Service and Support
We believe that our customer service and support provide a competitive advantage and are critical to retaining and expanding our customer base. We conduct regular third-party surveys to measure customer loyalty and satisfaction with our solutions.
Proofpoint Support Services
We deliver 24x7x365 customer support from support centers located in EMEA, North America and Asia-Pacific regions. We offer a wide range of support offerings with varying levels of access to our support resources.
Proofpoint Professional Services and Training
With our security-as-a-service model, our solutions are designed to be implemented, configured, and operated without the need for any training or professional services. For those customers that would like to develop deeper expertise in the use of our solutions or would like some assistance with complex configurations or the importing of data, we offer various training and professional services. Many implementation services can be completed in one day and are primarily provided remotely using web-based conferencing tools. If requested, our professional services organization also provides additional assistance with data importing, design, implementation, customization, or advanced reporting. We also offer a learning center for both in-person and online training and certification.
Research and Development
We devote significant resources to improve and enhance our existing security solutions and maintain the effectiveness of our platform, monitoring the threat landscape in real-time and making constant adjustments to remain effective as the threat landscape shifts. We also work closely with our customers to gain valuable insights into their threat environments and security management practices to assist us in designing new solutions and features that extend the data protection, archiving and governance capabilities of our platform. Our technical staff monitors and tests our software on a regular basis, and we maintain a regular release process to update and enhance our existing solutions. Leveraging our on-demand platform model, we can deploy real-time upgrades with no downtime.
Research and development expenses were $129.8 million, $98.5 million and $74.5 million for 2017, 2016 and 2015, respectively.
Competition
Our markets are highly competitive, fragmented and subject to rapid changes in technology. We compete primarily with companies that offer a broad array of data protection and governance solutions. Providers of data protection solutions generally have product offerings that include threat protection, virus protection, data loss prevention, flexible remediation, data encryption, and in some cases secure file transfer. Providers of archiving solutions generally have product offerings that provide data storage, search, policy enforcement, legal-hold management, and in some cases supervision.
Key competitors include:
• | Email and Advanced Threat Protection: Cisco Systems, Inc. (through its acquisitions of IronPort, SourceFire, and ThreatGRID), Microsoft Corporation (through its acquisition of Frontbridge), FireEye, Inc., Symantec Corporation (through its acquisitions of Brightmail and MessageLabs), Mimecast and Google (through its acquisition of Postini). |
12
• | Archiving: Micro Focus International plc and Veritas Technologies LLC (through its acquisitions of KVS and LiveOffice while under the ownership of Symantec Corporation). |
We believe we compete favorably based on the following factors:
• | effectiveness of our protection against advanced threats; |
• | comprehensiveness and integration of the solution; |
• | flexibility of delivery models; |
• | total cost of ownership; |
• | scalability and performance; |
• | customer support; and |
• | extensibility of platform. |
Certain of our competitors have greater sales, marketing and financial resources, more extensive geographic presence and greater name recognition than we do. We may face future competition in our markets from other large, established companies, as well as from emerging companies. In addition, we expect that there is likely to be continued consolidation in our industry that could lead to increased price competition and other forms of competition.
Intellectual Property
We rely on a combination of trade secrets, patents, copyrights and trademarks, as well as contractual protections, to establish and protect our intellectual property rights and protect our proprietary technology. As of December 31, 2017, we had 93 patents and 47 patent applications. We have a number of registered and unregistered trademarks. We require our employees, consultants and other third parties to enter into confidentiality and proprietary rights agreements and control access to software, documentation and other proprietary information. Although we rely on intellectual property rights, including trade secrets, patents, copyrights and trademarks, as well as contractual protections to establish and protect our proprietary rights, we believe that factors such as the technological and creative skills of our personnel, creation of new modules, features and functionality, and frequent enhancements to our solutions are more essential to establishing and maintaining our technology leadership position.
Despite our efforts to protect our proprietary technology and our intellectual property rights, unauthorized parties may attempt to copy or obtain and use our technology to develop products with the same functionality as our solution. Policing unauthorized use of our technology and intellectual property rights is difficult.
We expect that software and other solutions in our industry may be subject to third-party infringement claims as the number of competitors grows and the functionality of products in different industry segments overlaps. Any of these third parties might make a claim of infringement against us at any time.
Employees
As of December 31, 2017, we had 2,047 employees. We also engage a number of temporary employees and consultants. None of our employees is represented by a labor union with respect to his or her employment with us. We have not experienced any work stoppages and we consider our relations with our employees to be good. Our future success will depend upon our ability to attract and retain qualified personnel. Competition for qualified personnel remains intense and we may not be successful in retaining our key employees or attracting skilled personnel.
Corporate Information
We were incorporated in Delaware in 2002. Our principal executive offices are located at 892 Ross Drive, Sunnyvale, California 94089, and our telephone number is +1 (408) 517-4710. Our website is www.proofpoint.com.
Proofpoint, the Proofpoint logo, all of our product names and our other registered or common law trademarks, service marks, or trade names appearing in this Annual Report on Form 10-K are our property. Other trademarks appearing in this prospectus are the property of their respective holders.
13
Geographic Information
For financial reporting purposes, net revenue and long-lived assets attributable to significant geographic areas are presented in Note 11, “Segment Reporting”, to the consolidated financial statements, which is incorporated herein by reference.
Available Information
We file annual reports on Form 10-K, quarterly reports on Form 10-Q, current reports on Form 8-K, proxy and information statements and amendments to reports filed or furnished pursuant to Sections 13(a), 14 and 15(d) of the Securities Exchange Act of 1934, as amended. The SEC also maintains a website at http://www.sec.gov that contains reports, proxy and information statements and other information regarding Proofpoint and other companies that file materials with the SEC electronically. The public may also obtain these filings at the Securities and Exchange Commission (“SEC”)’s Public Reference Room at 100 F Street, NE, Washington, DC 20549 or by calling the SEC at 1-800-SEC-0330. Copies of Proofpoint’s reports on Form 10-K, definitive Proxy Statements, Forms 10-Q and Forms 8-K, may be obtained, free of charge, electronically through our Internet website, http://investors.proofpoint.com/financials.cfm, or by sending an electronic message by visiting the Contact Us section within the investor relations portion of our website.
14
ITEM 1A. RISK FACTORS
Investing in our common stock involves a high degree of risk. You should carefully consider the following risk factors, as well as the other information in this Annual Report on Form 10-K, before deciding whether to invest in shares of our common stock. The occurrence of any of the events described below could harm our business, financial condition, results of operation and growth prospects. In such an event, the trading price of our common stock may decline and you may lose all or part of your investment.
Risks Related to Our Business and Industry
We have a history of losses, and we are unable to predict the extent of any future losses or when, if ever, we will achieve profitability in the future.
We have incurred net losses in every year since our inception, including net losses of $84.3 million, $111.2 million and $98.7 million in 2017, 2016 and 2015, respectively. As a result, we had an accumulated deficit of $554.4 million as of December 31, 2017. Achieving profitability will require us to increase revenue, manage our cost structure, and avoid unanticipated liabilities. We do not expect to be profitable in the near term. Revenue growth may slow or revenue may decline for a number of possible reasons, including slowing demand for our solutions, increasing competition, a decrease in the growth of our overall market, or if we fail for any reason to continue to capitalize on growth opportunities. Any failure by us to obtain and sustain profitability, or to continue our revenue growth, could cause the price of our common stock to decline significantly.
Our quarterly operating results and other metrics are likely to vary significantly and be unpredictable, which could cause the trading price of our stock to decline.
Our operating results and other metrics have historically varied from period to period, and we expect that they will continue to do so as a result of a number of factors, many of which are outside of our control and may be difficult to predict, including:
• | the level of demand for our solutions, including our newly-introduced solutions, and the level of perceived urgency regarding security threats and compliance requirements; |
• | the timing of new subscriptions and renewals of existing subscriptions; |
• | the mix of solutions sold; |
• | the extent to which customers subscribe for additional solutions or increase the number of users; |
• | customer budgeting cycles and seasonal buying patterns; |
• | the extent to which we bring on new distributors; |
• | any changes in the competitive landscape of our industry, including consolidation among our competitors, customers, partners or resellers; |
• | timing of costs and expenses during a quarter; |
• | deferral of orders in anticipation of new solutions or enhancements announced by us; |
• | price competition; |
• | changes in renewal rates and terms in any quarter; |
• | the impact of acquisitions; |
• | litigation costs; |
• | any disruption in our sales channels or termination of our relationship with strategic channel partners; |
• | general economic conditions, both domestically and in our foreign markets, and related changes to currency exchange rates; |
• | insolvency or credit difficulties confronting our customers, affecting their ability to purchase or pay for our solutions; or |
• | future accounting pronouncements or changes in our accounting policies, including ASU 2014-09. |
15
Any one of the factors above or the cumulative effect of some of the factors referred to above may result in significant fluctuations in our financial and other operating results, including fluctuations in our key metrics. This variability and unpredictability could result in our failing to meet the expectations of securities analysts or investors for any period. If we fail to meet or exceed such expectations for these or any other reasons, the market price of our shares could fall substantially and we could face costly lawsuits, including securities class action suits. In addition, a significant percentage of our operating expenses are fixed in nature and based on forecasted revenue and cash flow trends. Accordingly, in the event of revenue shortfalls, we are generally unable to mitigate the negative impact on margins or other operating results in the short term.
We may fail to meet or exceed the expectations of securities analysts and investors, and the market price for our common stock could decline. If one or more of the securities analysts who cover us change their recommendation regarding our stock adversely, the market price for our common stock could decline. Additionally, our stock price may be based on expectations, estimates or forecasts of our future performance that may be unrealistic or may not be achieved. Further, our stock price may be affected by financial media, including press reports and blogs.
If we are unable to maintain high subscription renewal rates, our future revenue and operating results will be harmed.
Our customers have no obligation to renew their subscriptions for our solutions after the expiration of their initial subscription period, which typically ranges from one to three years. In addition, our customers may renew for fewer subscription services or users, renew for shorter contract lengths or renew at lower prices due to competitive or other pressures. We cannot accurately predict renewal rates and our renewal rates may decline or fluctuate as a result of a number of factors, including competition, customers’ IT budgeting and spending priorities, and deteriorating general economic conditions. If our customers do not renew their subscriptions for our solutions, our revenue would decline and our business would suffer.
If we are unable to sell additional solutions to our customers, our future revenue and operating results will be harmed.
Our future success depends on our ability to sell additional solutions to our customers. This may require increasingly sophisticated and costly sales efforts and may not result in additional sales. In addition, the rate at which our customers purchase additional solutions depends on a number of factors, including the perceived need for additional solutions, growth in the number of end-users, and general economic conditions. If our efforts to sell additional solutions to our customers are not successful, our business may suffer.
If our solutions fail to protect our customers from security breaches, our brand and reputation could be harmed, which could have a material adverse effect on our business and results of operations.
The threats facing our customers are constantly evolving and the techniques used by attackers to access or sabotage data change frequently. As a result, we must constantly update our solutions to respond to these threats. If we fail to update our solutions in a timely or effective manner to respond to these threats, our customers could experience security breaches. Many federal, state and foreign governments have enacted laws requiring companies to notify individuals of data security breaches involving their personal data. These mandatory disclosures regarding a security breach often lead to widespread negative publicity, and any association of us with such publicity may cause our customers to lose confidence in the effectiveness of our data security measures. Any security breach at one of our customers or even an unproven allegation of a security breach at one of our customers, could harm our reputation as a secure and trusted company and could cause the loss of customers. Similarly, if a well-publicized breach of data security at a customer of any other cloud‑based data protection or archiving service provider or other major enterprise cloud services provider were to occur, there could be a loss of confidence in the cloud‑based protection and storage of sensitive data and information generally.
In addition, our solutions work in conjunction with a variety of other elements in customers’ IT and security infrastructure, and we may receive blame and negative publicity for a security breach that may have been the result of the failure of one of the other elements not provided by us. The occurrence of a breach, whether or not caused by our solutions, or allegations of a breach, even if such allegations turn out to be untrue, could delay or reduce market acceptance of our solutions and have an adverse effect on our business and financial performance. In addition, any revisions to our solutions that we believe may be necessary or appropriate in connection with any such breach may cause us to incur significant expenses. Any of these events could have material adverse effects on our brand and reputation, which could harm our business, financial condition, and operating results.
16
If our customers experience data losses, our brand, reputation and business could be harmed.
Our customers rely on our archiving and other solutions to store their corporate data, which may include financial records, credit card information, business information, health information, other personally identifiable information or other sensitive personal information. A breach of our network security and systems or other events that cause the loss or public disclosure of, or access by third parties to, our customers’ stored files or data could have serious negative consequences for our business, including possible fines, penalties and damages, reduced demand for our solutions, an unwillingness of our customers to use our solutions, harm to our brand and reputation, and time-consuming and expensive litigation. The techniques used to obtain unauthorized access, disable or degrade service, or sabotage systems change frequently, often are not recognized until launched against a target, and may originate from less regulated or remote areas around the world. As a result, we may be unable to proactively prevent these techniques, implement adequate preventative or reactionary measures, or enforce the laws and regulations that govern such activities. In addition, because of the large amount of data that we collect and manage, it is possible that hardware failures, human errors or errors in our systems could result in data loss or corruption, or cause the information that we collect to be incomplete or contain inaccuracies that our customers regard as significant. If our customers experience any data loss, or any data corruption or inaccuracies, whether caused by security breaches or otherwise, our brand, reputation and business would be harmed.
Our insurance may be inadequate or may not be available in the future on acceptable terms, or at all. In addition, our policy may not cover any claim against us for loss of data or other indirect or consequential damages. Defending a suit based on any data loss or system disruption, regardless of its merit, could be costly and divert management’s attention.
Defects or vulnerabilities in our solutions could harm our reputation, reduce the sales of our solutions and expose us to liability for losses.
Because our solutions are complex, undetected errors, failures or bugs may occur, especially when solutions are first introduced or when new versions or updates are released, or when we introduce an acquired company’s products of services, despite our efforts to test those solutions and enhancements prior to release. This includes not only vulnerabilities that are specific to our solutions, but also vulnerabilities that impact the third party or open source software that we use or the hardware that we rely on for our solutions. We may not be able to correct defects, errors, vulnerabilities or failures promptly, or at all.
Any defects, errors, vulnerabilities or failures in our solutions could result in:
• | expenditure of significant financial and development resources in efforts to analyze, correct, eliminate or work around errors or defects or to address and eliminate vulnerabilities; |
• | loss of existing or potential partners or customers; |
• | loss or disclosure of our customers’ confidential information, or the inability to access such information; |
• | loss of our proprietary technology; |
• | our solutions being susceptible to hacking or electronic break-ins or otherwise failing to secure data; |
• | delayed or lost revenue; |
• | delay or failure to attain market acceptance; |
• | lost market share; |
• | negative publicity, which could harm our reputation; or |
• | litigation, regulatory inquiries or investigations that would be costly and harm our reputation. |
Limitation of liability provisions in our standard terms and conditions and our other agreements may not adequately or effectively protect us from any claims related to defects, errors, vulnerabilities or failures in our solutions, including as a result of federal, state or local laws or ordinances or unfavorable judicial decisions in the United States or other countries.
Because we provide security solutions, our software, website, hosted and internal systems may be subject to intentional disruption that could adversely impact our reputation and future sales.
We could be a target of attacks specifically designed to impede the performance of our solutions and harm our reputation. Similarly, experienced computer hackers may attempt to penetrate our network or other security or the security of our website or other hosted or internal systems and misappropriate proprietary information and/or cause interruptions of our
17
services. Because the techniques used by such computer hackers to access or sabotage networks change frequently and may not be recognized until launched against a target, we may be unable to anticipate these techniques. If an actual or perceived breach of network security occurs as a result of third-party action, including cyber-attacks or other intentional misconduct by computer hackers, employee error, malfeasance, or otherwise, it could adversely affect the market perception of our solutions, and may expose us to the loss of information, litigation and possible liability. In addition, such a security breach could impair our ability to operate our business, including our ability to provide support services to our customers.
Our solutions may collect, filter and store customer data which may contain personal information, which raises privacy concerns and could result in us having liability or inhibit sales of our solutions.
Many federal, state and foreign government bodies and agencies have adopted or are considering adopting laws and regulations regarding the collection, use, and disclosure of personal information. Because many of the features of our solutions use, store, and report on customer data which may contain personal information from our customers, any inability to adequately address privacy concerns, or comply with applicable privacy laws, regulations and policies could, even if unfounded, result in liability to us, damage to our reputation, loss of sales, and harm to our business. Furthermore, the costs of compliance with, and other burdens imposed by, such laws, regulations and policies that are applicable to the businesses of our customers may limit the use and adoption of our solutions and reduce overall demand for them. Privacy concerns, whether or not valid, may inhibit market adoption of our solutions. For example, in the United States regulations such as the Gramm‑Leach‑Bliley Act, which protects and restricts the use of consumer credit and financial information, and HIPAA which regulates the use and disclosure of personal health information, impose significant security and data protection requirements and obligations on businesses that may affect the use and adoption of our solutions. The European Union’s Data Protection Directive requires member states to impose restrictions on the collection and use of personal data that, in some respects, are more stringent, and impose more significant burdens on subject businesses, than current privacy standards in the United States.
In the past we have relied on the U.S.-European Union Frameworks, as agreed to by the U.S. Department of Commerce and the European Union (“EU”) as one of the means to legally transfer European personal information from Europe to the United States. However, on October 6, 2015, the European Court of Justice invalidated the U.S.-EU Safe Harbor framework. On February 2, 2016, the U.S. and E.U. announced agreement on a new framework for transatlantic data flows entitled the EU-US Privacy Shield and we self-certified under the EU-US Privacy Shield framework on October 5, 2016. However, it is possible that Privacy Shield may be challenged in EU courts, so there is some uncertainty regarding its future validity and our ability to rely on it for EU to US data transfers. Additionally, the EU has enacted the new General Data Protection Regulation, which will take effect on May 25, 2018 and carries with it significantly increased responsibilities and potential penalties for companies that process EU personal data. As this date draws nearer, we expect to see increased regulatory and customer attention surrounding EU Data Privacy. Furthermore, outside of the EU, we continue to see increased regulation of data privacy and security, including the adoption of more stringent subject matter specific state laws, national laws regulating the collection and use of data, and security and data breach obligations. The uncertainty and changes in the requirements of multiple jurisdictions may increase the cost of compliance, delay or reduce demand for our services, restrict our ability to offer services in certain locations, impact our customers’ ability to deploy our solutions in certain jurisdictions, or subject us to sanctions, by national data protection regulators, all of which could harm our business, financial condition and results of operations.
The regulatory framework for privacy issues is evolving worldwide, and various government and consumer agencies and public advocacy groups have called for new regulation and changes in industry practices. It is possible that new laws and regulations will be adopted in the United States and internationally, or existing laws and regulations may be interpreted in new ways, that would affect our business. Complying with any new regulatory requirements could force us to incur substantial costs or require us to change our business practices in a manner that could reduce our revenue or compromise our ability to effectively pursue our growth strategy.
Any failure or perceived failure to comply with laws and regulations may result in proceedings or actions against us by government entities or others, or could cause us to lose users and customers, which could potentially have an adverse effect on our business.
We operate in a highly competitive environment with large, established competitors, and our competitors may gain market share in the markets for our solutions that could adversely affect our business and cause our revenue to decline.
Our traditional competitors include security‑focused software vendors, such as Symantec Corporation and Cisco Systems, Inc. (“Cisco”), which offer software products that directly compete with our solutions. In addition to competing with these vendors directly for sales to customers, we compete with them for the opportunity to have our solutions bundled
18
with the product offerings of our strategic partners. Our competitors could gain market share from us if any of these partners replace our solutions with the products of our competitors or if these partners more actively promote our competitors’ products over our solutions. In addition, software vendors who have bundled our solutions with theirs may choose to bundle their software with their own or other vendors’ software, or may limit our access to standard product interfaces and inhibit our ability to develop solutions for their platform.
We also face competition from large technology companies, such as Google Inc., Micro Focus International plc and Microsoft Corporation. These companies are increasingly developing and incorporating into their products data protection and storage software that compete on various levels with our solutions. Our competitive position could be adversely affected to the extent that our customers perceive that the functionality incorporated into these products would replace the need for our solutions or that buying from one vendor would provide them with increased leverage and purchasing power and a better customer experience. We also face competition from independent security vendors such as FireEye, Inc. that offer network security products and many smaller companies like Mimecast Ltd that specialize in particular segments of the markets in which we compete.
Many of our competitors have greater financial, technical, sales, marketing or other resources than we do and consequently may have the ability to influence our customers to purchase their products instead of ours. Further consolidation within our industry or other changes in the competitive environment could also result in larger competitors that compete with us on several levels. In addition, acquisitions of smaller companies by large technology companies that specialize in particular segments of the markets in which we compete would result in increased competition from these large technology companies. If we are unsuccessful in responding to our competitors or to changing technological and customer demands, our competitive position and financial results could be adversely affected.
If we do not effectively expand and train our sales force, we may be unable to add new customers or increase sales to our existing customers and our business will be harmed.
We continue to be substantially dependent on our sales force to obtain new customers and to sell additional solutions to our existing customers. We believe that there is significant competition for sales personnel with the skills and technical knowledge that we require. Our ability to achieve significant revenue growth will depend, in large part, on our success in recruiting, training and retaining sufficient numbers of sales personnel. New hires require significant training and may take significant time before they achieve full productivity. Our recent hires and planned hires may not become as productive as we expect, and we may be unable to hire or retain sufficient numbers of qualified individuals in the markets where we do business or plan to do business. If we are unable to hire and train sufficient numbers of effective sales personnel, or the sales personnel are not successful in obtaining new customers or increasing sales to our existing customer base, our business will be harmed.
Our sales cycle is long and unpredictable, and our sales efforts require considerable time and expense. As a result, our results are difficult to predict and may vary substantially from quarter to quarter, which may cause our operating results to fluctuate.
We sell our security and compliance offerings primarily to enterprise IT departments that are managing a growing set of user and compliance demands, which has increased the complexity of customer requirements to be met and confirmed in the sales cycle. Increasingly, we have found that increasingly security, legal and compliance departments are involved in testing, evaluating and finally approving purchases, which has also made the sales cycle longer and less predictable. We may not be able to accurately predict or forecast the timing of sales, which makes our future revenue difficult to predict and could cause our results to vary significantly. In addition, we might devote substantial time and effort to a particular unsuccessful sales effort, and as a result we could lose other sales opportunities or incur expenses that are not offset by an increase in revenue, which could harm our business.
Because our long-term success depends, in part, on our ability to expand the sales of our platform to our customers located outside of the United States, our business will be increasingly susceptible to risks associated with international operations.
One key element of our growth strategy is to develop a worldwide customer base and expand our operations worldwide, such as by adding employees, offices and customers internationally, particularly in Europe and Asia.
Operating in international markets requires significant resources and management attention and will subject us to regulatory, economic, political and competitive risks and competition that are different from those in the United States.
19
In addition, our international operations may fail to succeed due to other risks inherent in operating businesses internationally, including:
• | fluctuations in currency exchange rates, which may cause our revenues and operating results to differ materially from expectations; |
• | our lack of familiarity with commercial and social norms and customs in other countries which may adversely affect our ability to recruit, retain and manage employees in these countries; |
• | difficulties and costs associated with staffing and managing foreign operations; |
• | the potential diversion of management’s attention to oversee and direct operations that are geographically distant from our U.S. headquarters; |
• | compliance with multiple, conflicting and changing governmental laws and regulations, including employment, tax, privacy and data protection laws and regulations; |
• | legal systems in which our ability to enforce and protect our rights may be different or less effective than in the United States, including more limited protection for intellectual property rights in some countries; |
• | immaturity of compliance regulations in other jurisdictions, which may lower demand for our solutions; |
• | greater difficulty with payment collections and longer payment cycles; |
• | higher employee costs and difficulty terminating non-performing employees; |
• | differences in workplace cultures; |
• | the need to adapt our solutions for specific countries; |
• | our ability to comply with differing technical and certification requirements outside the United States; |
• | tariffs, export controls and other non-tariff barriers such as quotas and local content rules; |
• | uncertainties related to the United Kingdom’s withdrawal from the European Union; |
• | adverse tax consequences; |
• | restrictions on the transfer of funds; |
• | anti-bribery compliance by us or our partners, including under the Foreign Corrupt Practices Act and similar laws of other jurisdictions; and |
• | new and different sources of competition. |
Our failure to manage any of these risks successfully could harm our existing and future international operations and seriously impair our overall business.
If we are unable to enhance our existing solutions and develop new solutions, our growth will be harmed and we may not be able to achieve profitability.
Our ability to attract new customers and increase revenue from existing customers will depend in large part on our ability to enhance and improve our existing solutions and to introduce new solutions. The success of any enhancement or new solution depends on several factors, including the timely completion, introduction and market acceptance of the enhancement or solution. Any new enhancement or solution we develop or acquire may not be introduced in a timely or cost-effective manner and may not achieve the broad market acceptance necessary to generate significant revenue. If we are unable to successfully develop or acquire new solutions or enhance our existing solutions to meet customer requirements, we may not grow as expected and we may not achieve profitability.
We cannot be certain that our development activities will be successful or that we will not incur delays or cost overruns. Furthermore, we may not have sufficient financial resources to identify and develop new technologies and bring enhancements or new solutions to market in a timely and cost-effective manner. New technologies and enhancements could be delayed or cost more than we expect, and we cannot ensure that any of these solutions will be commercially successful if and when they are introduced.
20
If we are unable to cost-effectively scale or adapt our existing architecture to accommodate increased traffic, technological advances or changing customer requirements, our operating results could be harmed.
As our customer base grows, the number of users accessing our solutions over the Internet will correspondingly increase. Increased traffic could result in slow access speeds and response times. Since our customer agreements often include service availability commitments, slow speeds or our failure to accommodate increased traffic could result in breaches of our service level agreements or obligate us to issue service credits. In addition, the market for our solutions is characterized by rapid technological advances and changes in customer and regulatory requirements. In order to accommodate increased traffic and respond to technological advances and evolving customer and regulatory requirements, we expect that we will be required to make future investments in our network architecture. If we do not implement future upgrades to our network architecture cost-effectively, or if we experience prolonged delays or unforeseen difficulties in connection with upgrading our network architecture, our service quality may suffer and our operating results could be harmed.
If we fail to manage our sales and distribution channels effectively or if our partners choose not to market and sell our solutions to their customers, our operating results could be adversely affected.
We have derived and anticipate that in the future we will continue to derive a substantial portion of the sales of our solutions through channel partners. In order to scale our channel program to support growth in our business, it is important that we continue to help our partners enhance their ability to independently sell and deploy our solutions. We may be unable to continue to successfully expand and improve the effectiveness of our channel sales program.
Our agreements with our channel partners are generally non-exclusive and some of our channel partners have entered, and may continue to enter, into strategic relationships with our competitors or are competitors themselves. Further, many of our channel partners have multiple strategic relationships and they may not regard us as significant for their businesses. Our channel partners may terminate their respective relationships with us with limited or no notice and with limited or no penalty, pursue other partnerships or relationships, or attempt to develop or acquire products or services that compete with our solutions. Our partners also may impair our ability to enter into other desirable strategic relationships. If our channel partners do not effectively market and sell our solutions, if they choose to place greater emphasis on products of their own or those offered by our competitors, or if they fail to meet the needs of our customers, our ability to grow our business and sell our solutions may be adversely affected. Similarly, the loss of a substantial number of our channel partners, and our possible inability to replace them, the failure to recruit additional channel partners, any reduction or delay in their sales of our solutions, or any conflicts between channel sales and our direct sales and marketing activities could materially and adversely affect our results of operations.
Because we recognize revenue from subscriptions over the term of the relevant service period, decreases or increases in sales are not immediately reflected in full in our operating results.
We recognize revenue from subscriptions over the term of the relevant service period, which typically range from one to three years, with some up to five years. As a result, most of our quarterly revenue from subscriptions results from agreements entered into during previous quarters. Consequently, a shortfall in demand for our solutions in any quarter may not significantly reduce our subscription revenue for that quarter, but could negatively affect subscription revenue in future quarters. We may be unable to adjust our cost structure to compensate for this potential shortfall in subscription revenue. Accordingly, the effect of significant downturns in sales of subscriptions may not be fully reflected in our results of operations until future periods. Our subscription model also makes it difficult for us to rapidly increase our subscription revenue through additional sales in any period, as subscription revenue must be recognized over the term of the contract.
Interruptions or delays in services provided by third parties could impair the delivery of our service and harm our business.
We currently serve our customers from third‑party data center facilities and resources located in the United States, Canada and Europe. We also rely on bandwidth providers, Internet service providers, mobile networks and other third-party IT service providers to operate our business and to deliver our solutions. Any damage to, or failure of, the systems of our third‑party providers could result in interruptions to our service. If for any reason our arrangement with one or more of our data centers is terminated we could experience additional expense in arranging for new facilities and support. Our data center facilities providers have no obligations to renew their agreements with us on commercially reasonable terms, or at all. If we are unable to renew our agreements with the facilities providers on commercially reasonable terms or if in the future we add additional data center facility providers, we may experience costs or downtime in connection with the transfer to, or the addition of, new data center facilities. In addition, the failure of our data centers to meet our capacity requirements could
21
result in interruptions in the availability of our solutions, impair the functionality of our solutions or impede our ability to scale our operations. As we continue to add data centers, restructure our data management plans, and increase capacity in existing and future data centers, we may move or transfer our data and our customers’ data. Despite precautions taken during such processes and procedures, any unsuccessful data transfers may impair the delivery of our service, and we may experience costs or downtime in connection with the transfer of data to other facilities. Similarly, some of our solutions’ features run or depend on IT services run by third parties, such as data feeds or public clouds, and an extended failure of such services might materially and adversely impact our ability to provide our services to our customers. Furthermore, some of our sales and business operations, such as CRM and billing and invoicing depend in part on third-party IT service providers and if those services were to be unavailable for extended periods of time it might materially and adversely affect our ability to operate.
We also depend on access to the Internet through third‑party bandwidth providers to operate our business. If we lose the services of one or more of our bandwidth providers, or if these providers experience outages, for any reason, we could experience disruption in delivering our solutions or we could be required to retain the services of a replacement bandwidth provider. Our business also depends on our customers having high-speed access to the Internet. Any Internet outages or delays could adversely affect our ability to provide our solutions to our customers.
Our operations rely heavily on the availability of electricity, which also comes from third-party providers. If we or the third-party data center facilities that we use to deliver our services were to experience a major power outage or if the cost of electricity were to increase significantly, our operations and financial results could be harmed. If we or our third‑party data centers were to experience a major power outage, we or they would have to rely on back-up generators, which might not work properly or might not provide an adequate power supply during a major power outage. Such a power outage could result in a significant disruption of our business.
The occurrence of an extended interruption of our or third‑party services for any reason could result in lengthy interruptions in our services or in the delivery of customers’ email and require us to provide service credits, refunds, indemnification payments or other payments to our customers, and could also result in the loss of customers.
Any failure to offer high-quality technical support services may adversely affect our relationships with our customers and harm our financial results.
Once our solutions are deployed, our customers depend on our support organization to resolve any technical issues relating to our solutions. In addition, our sales process is highly dependent on our solutions and business reputation and on strong recommendations from our existing customers. Any failure to maintain high-quality technical support, or a market perception that we do not maintain high-quality support, could harm our reputation, adversely affect our ability to sell our solutions to existing and prospective customers, and harm our business, operating results and financial condition.
We offer technical support services with many of our solutions. We may be unable to respond quickly enough to accommodate short-term increases in customer demand for support services. We also may be unable to modify the format of our support services to compete with changes in support services provided by competitors. Increased customer demand for these services, without corresponding revenue, could increase costs and adversely affect our operating results.
We have outsourced a substantial portion of our worldwide customer support functions to third‑party service providers. If these companies experience financial difficulties, do not maintain sufficiently skilled workers and resources to satisfy our contracts, or otherwise fail to perform at a sufficient level, the level of support services to our customers may be significantly disrupted, which could materially harm our reputation and our relationships with these customers.
If we fail to develop or protect our brand, our business may be harmed.
We believe that developing and maintaining awareness and integrity of our company and our brand are important to achieving widespread acceptance of our existing and future offerings and are important elements in attracting new customers. We believe that the importance of brand recognition will increase as competition in our market further intensifies. Successful promotion of our brand will depend on the effectiveness of our marketing efforts and on our ability to provide reliable and useful solutions at competitive prices. We plan to continue investing substantial resources to promote our brand, both domestically and internationally, but there is no guarantee that our brand development strategies will enhance the recognition of our brand. Some of our existing and potential competitors have well-established brands with greater recognition than we have. If our efforts to promote and maintain our brand are not successful, our operating results and our ability to attract and retain customers may be adversely affected. In addition, even if our brand recognition and loyalty increases, this may not result in increased use of our solutions or higher revenue.
22
In addition, independent industry analysts often provide reviews of our solutions, as well as those of our competitors, and perception of our solutions in the marketplace may be significantly influenced by these reviews. We have no control over what these industry analysts report, and because industry analysts may influence current and potential customers, our brand could be harmed if they do not provide a positive review of our solutions or view us as a market leader.
The steps we have taken to protect our intellectual property rights may not be adequate.
We rely on a combination of contractual rights, trademarks, trade secrets, patents and copyrights to establish and protect our intellectual property rights. These offer only limited protection, however, and the steps we have taken to protect our proprietary technology may not deter its misuse, theft or misappropriation. Any of our patents, copyrights, trademarks or other intellectual property rights may be challenged by others or invalidated through administrative process or litigation. Competitors may independently develop technologies or products that are substantially equivalent or superior to our solutions or that inappropriately incorporate our proprietary technology into their products. Competitors may hire our former employees who may misappropriate our proprietary technology or misuse our confidential information. Although we rely in part upon confidentiality agreements with our employees, consultants and other third parties to protect our trade secrets and other confidential information, those agreements may not effectively prevent disclosure of trade secrets and other confidential information and may not provide an adequate remedy in the event of misappropriation of trade secrets or unauthorized disclosure of confidential information. In addition, others may independently discover our trade secrets and confidential information, and in such cases we could not assert any trade secret rights against such parties.
We might be required to spend significant resources to monitor and protect our intellectual property rights. We may initiate claims or litigation against third parties for infringement of our intellectual property rights or misappropriation of our trade secrets, or to establish the validity of our intellectual property rights. Any litigation, whether or not it is resolved in our favor, could result in significant expense to us and divert the efforts of our technical and management personnel, which may adversely affect our business, operating results and financial condition. Certain jurisdictions may not provide adequate legal infrastructure for effective protection of our intellectual property rights. Changing legal interpretations of liability for unauthorized use of our solutions or lessened sensitivity by corporate, government or institutional users to refraining from intellectual property piracy or other infringements of intellectual property could also harm our business.
Our issued patents may not provide us with any competitive advantages or may be challenged by third parties, and our patent applications may never be granted at all. It is possible that innovations for which we seek patent protection may not be protectable. Additionally, the process of obtaining patent protection is expensive and time consuming, and we may not be able to prosecute all necessary or desirable patent applications at a reasonable cost or in a timely manner. Given the cost, effort, risks and downside of obtaining patent protection, including the requirement to ultimately disclose the invention to the public, we may not choose to seek patent protection for certain innovations. However, such patent protection could later prove to be important to our business. Even if issued, there can be no assurance that any patents will have the coverage originally sought or adequately protect our intellectual property, as the legal standards relating to the validity, enforceability and scope of protection of patent and other intellectual property rights are uncertain. Any patents that are issued may be invalidated or otherwise limited, or may lapse or may be abandoned, enabling other companies to better develop products that compete with our solutions, which could adversely affect our competitive business position, business prospects and financial condition.
We cannot assure you that the measures we have taken to protect our intellectual property will adequately protect us, and any failure to protect our intellectual property could harm our business.
Third parties claiming that we infringe their intellectual property rights could cause us to incur significant legal expenses and prevent us from selling our solutions.
Companies in the software and technology industries, including some of our current and potential competitors, own large numbers of patents, copyrights, trademarks and trade secrets and frequently enter into litigation based on allegations of infringement, misappropriation or other violations of intellectual property rights. In addition, many of these companies have the capability to dedicate substantially greater resources to enforce their intellectual property rights and to defend claims that may be brought against them. The litigation may involve patent holding companies or other adverse patent owners who have no relevant product revenue and against whom our potential patents may provide little or no deterrence. We have received, and may in the future receive, notices that claim we have infringed, misappropriated or otherwise violated other parties’ intellectual property rights. In the past we have been involved in litigation involving such allegations of infringement. To the extent we gain greater visibility, we could face a higher risk of being the subject of intellectual property infringement claims, which is not uncommon with respect to software technologies in general and information security technology in particular. There may be third‑party intellectual property rights, including issued or pending patents that cover significant aspects of our
23
technologies or business methods. Any intellectual property claims, with or without merit, could be very time consuming, could be expensive to settle or litigate and could divert our management’s attention and other resources. These claims could also subject us to significant liability for damages, potentially including treble damages if we are found to have willfully infringed patents or copyrights. These claims could also result in our having to stop using technology found to be in violation of a third-party’s rights. We might be required to seek a license for the intellectual property, which may not be available on reasonable terms or at all. Even if a license were available, we could be required to pay significant royalties, which would increase our operating expenses. As a result, we may be required to develop alternative non-infringing technology, which could require significant effort and expense. If we cannot license or develop technology for any infringing aspect of our business, we would be forced to limit or stop sales of one or more of our solutions or features of our solutions and may be unable to compete effectively. Any of these results would harm our business, operating results and financial condition.
In addition, our agreements with customers and channel partners include indemnification provisions under which we agree to indemnify them for losses suffered or incurred as a result of claims of intellectual property infringement and, in some cases, for damages caused by us to property or persons. Large indemnity payments could harm our business, operating results and financial condition.
We rely on technology and intellectual property licensed from other parties, the failure or loss of which could increase our costs and delay or prevent the delivery of our solutions.
We utilize various types of software and other technology, as well as intellectual property rights, licensed from unaffiliated third parties in order to provide certain elements of our solutions. Any errors or defects in any third‑party technology could result in errors in our solutions that could harm our business. In addition, licensed technology and intellectual property rights may not continue to be available on commercially reasonable terms, or at all. While we believe that there are currently adequate replacements for the third‑party technology we use, any loss of the right to use any of this technology on commercially reasonable terms, or at all, could result in delays in producing or delivering our solutions until equivalent technology is identified and integrated, which delays could harm our business. In this situation we would be required to either redesign our solutions to function with software available from other parties or to develop these components ourselves, which would result in increased costs. Furthermore, we might be forced to limit the features available in our current or future solutions. If we fail to maintain or renegotiate any of these technology or intellectual property licenses, we could face significant delays and diversion of resources in attempting to develop similar or replacement technology, or to license and integrate a functional equivalent of the technology.
Some of our solutions contain “open source” software, and any failure to comply with the terms of one or more of these open source licenses could negatively affect our business.
Some of our solutions are distributed with software licensed by its authors or other third parties under so-called “open source” licenses, which may include, by way of example, the GNU General Public License, or GPL, and the Apache License. Some of these licenses contain requirements that we make available source code for modifications or derivative works we create based upon the open source software, and that we license such modifications or derivative works under the terms of a particular open source license or other license granting third parties certain rights of further use. By the terms of certain open source licenses, we could be required to release the source code of our proprietary software, and to make our proprietary software available under open source licenses, if we combine our proprietary software with open source software in a certain manner. In the event that portions of our proprietary software are determined to be subject to an open source license, we could be required to publicly release the affected portions of our source code, re-engineer all or a portion of our technologies, or otherwise be limited in the licensing of our technologies, each of which could reduce or eliminate the value of our technologies and solutions. In addition to risks related to license requirements, usage of open source software can lead to greater risks than use of third-party commercial software, as open source licensors generally do not provide warranties or controls on the origin of the software. We have established processes to help alleviate these risks, including a review process for screening requests from our development organizations for the use of open source software, but we cannot be sure that all open source software is submitted for approval prior to use in our solutions, that our programmers have not incorporated open source software into our proprietary solutions and technologies or that they will not do so in the future. In addition, many of the risks associated with usage of open source software cannot be eliminated, and could, if not properly addressed, negatively affect our business.
Governmental regulations affecting the export of certain of our solutions could negatively affect our business.
Some of our products are subject to U.S. export controls, and we incorporate encryption technology into certain of our products. These encryption products and the underlying technology may be exported outside the United States only with the required export authorizations, including by license, a license exception or other appropriate government authorizations,
24
including the filing of an encryption registration. Governmental regulation of encryption technology and regulation of imports or exports, or our failure to obtain required import or export approval for our products, could harm our international sales and adversely affect our revenue.
Failure to comply with such regulations, whether by us or companies that we have acquired, in the future could result in penalties, costs, and restrictions on export privileges, which could also harm our operating results.
We have, and may further, expand through acquisitions of, or investments in, other companies, which may divert our management’s attention, dilute our stockholders’ ownership interests and consume corporate resources that otherwise would be necessary to sustain and grow our business.
We have made multiple acquisitions in the past, and our business strategy may, from time to time, continue to include acquiring complementary products, technologies or businesses. We also may enter into relationships with other businesses in order to expand our solutions, which could involve preferred or exclusive licenses, additional channels of distribution, or investments by or between the two parties. Negotiating these transactions can be time consuming, difficult and expensive, and our ability to close these transactions may be subject to third‑party approvals, such as government regulation, which are beyond our control. Consequently, we can make no assurance that these transactions, once undertaken and announced, will close.
These transactions may result in unforeseen operating difficulties and expenditures. In particular, we may encounter difficulties assimilating or integrating the businesses, technologies, products, personnel or operations of acquired companies, particularly if the key personnel of the acquired business choose not to work for us, and we may have difficulty retaining the customers of any acquired business. Acquisitions may also disrupt our ongoing business, divert our resources and require significant management attention that would otherwise be available for development of our business. Any acquisition or investment could expose us to unknown liabilities.
In addition, as of December 31, 2017, we had $393.3 million in goodwill and intangible assets, net of accumulated amortization, recorded on our balance sheet. We will incur expenses related to the amortization of intangible assets and we may in the future need to incur charges with respect to the impairment of goodwill or intangible assets, which could adversely affect our operating results. Moreover, we cannot assure you that the anticipated benefits of any acquisition or investment would be realized or that we would not be exposed to unknown liabilities. In connection with these types of transactions, we may issue additional equity securities that would dilute our stockholders’ ownership interests, use cash that we may need in the future to operate our business, incur debt on terms unfavorable to us or that we are unable to repay, incur large charges or substantial liabilities, encounter difficulties integrating diverse business cultures, and become subject to adverse tax consequences, substantial depreciation or deferred compensation charges. These challenges related to acquisitions or investments could adversely affect our business, operating results and financial condition.
If we are unable to attract and retain qualified employees, lose key personnel, fail to integrate replacement personnel successfully, or fail to manage our employee base effectively, we may be unable to develop new and enhanced solutions, effectively manage or expand our business, or increase our revenue.
Our future success depends upon our ability to recruit and retain key management, technical, sales, marketing, finance, and other critical personnel. Competition for qualified management, technical and other personnel is intense, and we may not be successful in attracting and retaining such personnel. If we fail to attract and retain qualified employees, our ability to grow our business could be harmed. Our officers and other key personnel are employees-at-will, and we cannot assure you that we will be able to retain them. Competition for people with the specific skills that we require is significant. In order to attract and retain personnel in a competitive marketplace, we believe that we must provide a competitive compensation package, including cash and equity‑based compensation. Volatility in our stock price may from time to time adversely affect our ability to recruit or retain employees. If we are unable to hire and retain qualified employees, or conversely, if we fail to manage employee performance or reduce staffing levels when required by market conditions, our business and operating results could be adversely affected.
In addition, hiring, training, and successfully integrating replacement personnel could be time consuming, may cause additional disruptions to our operations, and may be unsuccessful, which could negatively impact future revenue.
25
Changes in laws and/or regulations related to the Internet or changes in the Internet infrastructure itself may diminish the demand for our solutions, and could have a negative impact on our business.
The future success of our business depends upon the continued use of the Internet as a primary medium for commerce, communication and business applications. Federal, state or foreign government bodies or agencies have in the past adopted, and may in the future adopt, laws or regulations affecting data privacy and the use of the Internet as a commercial medium. Changes in these laws or regulations could require us to modify our solutions in order to comply with these changes. In addition, government agencies or private organizations may begin to impose taxes, fees or other charges for accessing the Internet or commerce conducted via the Internet. These laws or charges could limit the growth of Internet‑related commerce or communications generally, result in a decline in the use of the Internet and the viability of Internet‑based applications such as ours and reduce the demand for our solutions.
The legal and regulatory framework also drives demand for our solutions. Our customers are subject to laws, regulations and internal policies that mandate how they process, handle, store, use and transmit a variety of sensitive data and communications. These laws and regulations are subject to revision, change and interpretation at any time, and any such change could either help or hurt the demand for our solutions. We cannot be sure that the legal and regulatory framework in any given jurisdiction will be favorable to our business or that we will be able to sustain or grow our business if there are any adverse changes to these laws and regulations.
If we are required to collect sales and use taxes on the solutions we sell, we may be subject to liability for past sales and our future sales may decrease.
State and local taxing jurisdictions have differing rules and regulations governing sales and use taxes, and these rules and regulations are subject to varying interpretations that may change over time. In particular, the applicability of sales taxes to our subscription services in various jurisdictions is unclear. It is possible that we could face sales tax audits and that our liability for these taxes could exceed our estimates as state tax authorities could still assert that we are obligated to collect additional amounts as taxes from our customers and remit those taxes to those authorities. We could also be subject to audits with respect to state and international jurisdictions for which we have not accrued tax liabilities. A successful assertion that we should be collecting additional sales or other taxes on our services in jurisdictions where we have not historically done so and do not accrue for sales taxes could result in substantial tax liabilities for past sales, discourage customers from purchasing our application or otherwise harm our business and operating results.
Adverse conditions in the national and global economies and financial markets may adversely affect our business and financial results.
Adverse macroeconomic conditions could negatively affect our customers, thereby impacting our business, operating results or financial condition. Challenging economic conditions worldwide have from time to time contributed, and may continue to contribute, to slowdowns in the information technology industry, resulting in reduced demand for our solutions as a result of continued constraints on IT-related capital spending by our customers and increased price competition for our solutions. Moreover, we target some of our solutions to the financial services industry and therefore if there is consolidation in that industry, or layoffs, or lack of funding for IT purchases, our business may suffer. If economic conditions deteriorate, our business, financial condition and operating results could be materially and adversely affected.
Our business is subject to the risks of earthquakes, fire, power outages, floods and other catastrophic events, and to interruption by manmade problems such as terrorism.
Natural disasters or other catastrophic events may cause damage or disruption to our operations, international commerce and the global economy, and thus could have a strong negative effect on us. We have significant operations in the Silicon Valley area of Northern California, a region known for seismic activity. A major earthquake or other natural disaster, fire, act of terrorism or other catastrophic event that results in the destruction or disruption of any of our critical business operations or information technology systems could severely affect our ability to conduct normal business operations and, as a result, our future operating results could be harmed. These negative events could make it difficult or impossible for us to deliver our services to our customers, and could decrease demand for our services. Because we do not carry earthquake insurance for direct quake‑related losses, and significant recovery time could be required to resume operations, our financial condition and operating results could be materially adversely affected in the event of a major earthquake or catastrophic event.
26
A portion of our revenue is generated by sales to government entities, which are subject to a number of challenges and risks.
Sales to U.S. and foreign federal, state and local governmental agency customers have accounted for a portion of our revenue in past periods, and we may in the future increase sales to government entities. Sales into government entities are subject to a number of risks. Selling to government entities can be highly competitive, expensive and time consuming, often requiring significant upfront time and expense without any assurance that we will win a sale. We have invested in the creation of a cloud offering that has been certified under both the Federal Information Security Management Act and the Federal Risk and Authorization Management Program for government usage but we cannot be sure that we will continue to sustain or renew this certification, that the government will continue to mandate such certification or that other government agencies or entities will use this cloud offering. Government demand and payment for our solutions may be impacted by public sector budgetary cycles and funding authorizations, with funding reductions or delays adversely affecting public sector demand for our solutions. Government entities may have contractual or other legal rights to terminate contracts with our distributors and resellers for convenience or due to a default, and any such termination may adversely impact our future results of operations. For example, if the distributor receives a significant portion of its revenue from sales to such governmental entity, the financial health of the distributor could be substantially harmed, which could negatively affect our future sales to such distributor. Governments routinely investigate and audit government contractors’ administrative processes, and any unfavorable audit could result in the government refusing to continue buying our solutions, a reduction of revenue or fines or civil or criminal liability if the audit uncovers improper or illegal activities. Any such penalties could adversely impact our results of operations in a material way.
If we fail to maintain an effective system of internal controls, our ability to produce timely and accurate financial statements or comply with applicable regulations could be impaired.
As a public company, we are subject to the reporting requirements of the Exchange Act, the Sarbanes‑Oxley Act of 2002 (the “Sarbanes-Oxley Act”), and the rules and regulations of the NASDAQ Global Market. We expect that the requirements of these rules and regulations will continue to increase our legal, accounting and financial compliance costs, make some activities more difficult, time consuming and costly, and place significant strain on our personnel, systems and resources.
The Sarbanes-Oxley Act requires, among other things, that we maintain effective disclosure controls and procedures and internal control over financial reporting. We are continuing to develop and refine our disclosure controls and other procedures that are designed to ensure that information required to be disclosed by us in the reports that we file with the SEC, is recorded, processed, summarized and reported within the time periods specified in SEC rules and forms, and that information required to be disclosed in reports under the Exchange Act is accumulated and communicated to our principal executive and financial officers.
Our current controls and any new controls that we develop may become inadequate because of changes in conditions in our business. In addition, because we have acquired companies in the past and may continue to do so in the future, we will also need to expend resources to integrate the controls of these acquired entities with ours. Further, weaknesses in our internal controls may be discovered in the future. Any failure to develop or maintain effective controls, or any difficulties encountered in their implementation or improvement, could harm our operating results or cause us to fail to meet our reporting obligations and may result in a restatement of our financial statements for prior periods. Any failure to implement and maintain effective internal controls also could adversely affect the results of periodic management evaluations and annual independent registered public accounting firm report regarding the effectiveness of our internal control over financial reporting that we are required to include in our Annual Report on Form 10-K under Section 404 of the Sarbanes‑Oxley Act. Ineffective disclosure controls and procedures and internal control over financial reporting could also cause investors to lose confidence in our reported financial and other information, which would likely have a negative effect on the trading price of our common stock.
In order to maintain and improve the effectiveness of our disclosure controls and procedures and internal control over financial reporting, we have expended, and anticipate that we will continue to expend, significant resources, including accounting‑related costs, and provide significant management oversight. Any failure to maintain the adequacy of our internal controls, or consequent inability to produce accurate financial statements on a timely basis, could increase our operating costs and could materially impair our ability to operate our business. In the event that we or our independent registered public accounting firm are not able to complete the work required under Section 404 of the Sarbanes-Oxley Act on a timely basis, or we are not able to demonstrate compliance with Section 404, we could be subject to late filings of our annual and quarterly reports, restatements of consolidated financial statements or other corrective disclosure, and, investors may lose confidence in
27
our operating results and our stock price could decline. In addition, if we are unable to continue to meet these requirements, we may not be able to remain listed on the NASDAQ Global Market.
We may not be able to utilize a significant portion of our net operating loss or research tax credit carryforwards, which could adversely affect our profitability.
As of December 31, 2017, we had federal and state net operating loss carryforwards due to prior period losses, some of which if not utilized will continue to expire in 2018 for federal and state purposes. We also have federal research tax credit carryforwards, which if not utilized will begin to expire in 2022. These net operating loss and research tax credit carryforwards could expire unused and be unavailable to offset future income tax liabilities, which could adversely affect our profitability.
In addition, under Sections 382 and 383 of the Internal Revenue Code of 1986, as amended, our ability to utilize net operating loss carryforwards or other tax attributes, such as research tax credits, in any taxable year may be limited if we experience an “ownership change.” An “ownership change” generally occurs if one or more stockholders or groups of stockholders who own at least 5% of our stock increase their ownership by more than 50 percentage points over their lowest ownership percentage within a rolling three-year period. Similar rules may apply under state tax laws.
Future issuances of our stock could cause an “ownership change.” It is possible that any future ownership change could have a material effect on the use of our net operating loss carryforwards or other tax attributes, which could adversely affect our profitability.
We have been incurring significant costs and devoting substantial management time as a result of operating as a public company.
As a public company, we incur significant legal, accounting and other expenses. For example, we are required to comply with certain of the requirements of the Sarbanes‑Oxley Act and the Dodd Frank Wall Street Reform and Consumer Protection Act, as well as rules and regulations subsequently implemented by the SEC, and the NASDAQ Global Market, our stock exchange, including the establishment and maintenance of effective disclosure and financial controls and changes in corporate governance practices. We expect that compliance with these requirements will continue to result in significant legal and financial compliance costs and will make some activities more time consuming and costly. In addition, we expect that our management and other personnel will need to divert attention from operational and other business matters to devote substantial time to these public company requirements.
Risks Related to the Ownership of Our Common Stock
Our stock price has been volatile in the past and may be subject to volatility in the future.
The trading price of our common stock has been volatile historically, and is likely to continue to be subject to wide fluctuations in response to various factors described below. These factors, as well as the volatility of our common stock, could also impact the price of our convertible notes. Factors affecting the market price of our securities include:
• | variations in our revenue, billings, gross margin, operating results, free cash flow, loss per share and how these results compare to analyst expectations; |
• | forward looking guidance that we may provide regarding financial metrics such as billings, revenue, gross margin, operating results, free cash flow, and loss per share; |
• | announcements of technological innovations, new products or services, strategic alliances, acquisitions or significant agreements by us or by our competitors; |
• | disruptions in our cloud-based operations or services or disruptions of other prominent cloud-based operations or services; |
• | the economy as a whole, market conditions in our industry, and the industries of our customers; |
• | trading activity by directors, executive officers and significant stockholders, or the perception in the market that the holders of a large number of shares intend to sell their shares; |
• | the size of our market float and significant option exercises; |
• | any future issuances of securities; |
• | sales and purchases of any common stock issued upon conversion of our convertible notes; and |
28
• | any other factors discussed herein. |
In addition, the stock markets in general and the NASDAQ Global Market in particular, have experienced substantial price and volume volatility that is often seemingly unrelated to the operating results of any particular companies. Moreover, if the market for technology stocks, especially security and cloud computing-related stocks, or the stock market in general experiences uneven investor confidence, the market price of our common stock could decline for reasons unrelated to our business, operating results or financial condition. The market price for our stock might also decline in reaction to events that affect other companies within, or outside, our industry, even if these events do not directly affect us. Some companies that have experienced volatility in the trading price of their stock have been subject of securities litigation. If we are the subject of such litigation, it could result in substantial costs and a diversion of management’s attention and resources.
We have indebtedness in the form of convertible senior notes.
In June 2015, we completed an offering of $230.0 million aggregate principal amount of 0.75% convertible senior notes due 2020 (the "0.75% Notes,"). As a result of this convertible notes offering, we incurred $230.0 million principal amount of indebtedness, the principal amount of which we may be required to pay at maturity in 2020, or, upon the occurrence of a make-whole fundamental change (as defined in the indentures). There can be no assurance that we will be able to repay this indebtedness when due, or that we will be able to refinance this indebtedness on acceptable terms or at all. In addition, this indebtedness could, among other things:
• | make it difficult for us to pay other obligations; |
• | make it difficult to obtain favorable terms for any necessary future financing for working capital, capital expenditures, debt service requirements or other purposes; |
• | require us to dedicate a substantial portion of our cash flow from operations to service the indebtedness, reducing the amount of cash flow available for other purposes; and |
• | limit our flexibility in planning for and reacting to changes in our business. |
Conversion of our 0.75% Notes may affect the price of our common stock and the value of the 0.75% Notes.
The conversion of some or all of our 0.75% Notes may dilute the ownership interest of existing stockholders to the extent we deliver shares of common stock upon conversion. Holders of the 0.75% Notes will be able to convert them only upon the satisfaction of certain conditions prior to December 15, 2019. Upon conversion, holders of the 0.75% Notes will receive cash, shares of common stock or a combination of cash and shares of common stock, at our election. Any sales in the public market of shares of common stock issued upon conversion of the 0.75% Notes could adversely affect the trading price of our common stock and the value of the 0.75% Notes.
Anti-takeover provisions contained in our certificate of incorporation, bylaws and convertible notes, as well as provisions of Delaware law, could impair a takeover attempt.
Our certificate of incorporation and bylaws contain provisions that could have the effect of rendering more difficult, delaying or preventing an acquisition of our company deemed undesirable by our board of directors. These provisions could also reduce the price that investors might be willing to pay in the future for shares of our common stock and result in the market price of our common stock being lower than it would be without these provisions. Our corporate governance documents include provisions:
• | creating a classified board of directors whose members serve staggered three-year terms; |
• | authorizing “blank check” preferred stock, which could be issued by our board without stockholder approval which may contain voting, liquidation, dividend and other rights which are superior to our common stock; |
• | limiting the liability of, and providing indemnification to, our directors and officers; |
• | limiting the ability of our stockholders to call and bring business before special meetings by providing that any stockholder action must be effected at a duly called meeting of the stockholders and not by a consent in writing, and providing that only our board of directors, the chairman of our board of directors, our Chief Executive Officer or President may call a special meeting of the stockholders; and |
• | requiring advance notice of stockholder proposals for business to be conducted at meetings of our stockholders and for nominations of candidates for election to our board of directors. |
29
These provisions, alone or together, could frustrate, delay or prevent hostile takeovers and changes in control or changes in our management.
In addition, the fundamental changes provisions of our Notes may delay or prevent a change in control of our company, because those provisions allow note holders to require us to repurchase such Notes upon the occurrence of a fundamental change (as defined in the indenture for the Notes). Furthermore, the indenture for the Notes prohibits us from engaging in certain mergers or acquisitions unless, among other things, the surviving entity assumes our obligations under the Notes.
As a Delaware corporation, we are also subject to provisions of Delaware law, including Section 203 of the Delaware General Corporation law, which prevents some stockholders holding more than 15% of our outstanding common stock from engaging in certain business combinations merging or combining with us without approval of the holders of a substantial majority of all of our outstanding common stock.
Our failure to raise additional capital or generate the significant capital necessary to expand our operations and invest in new solutions could reduce our ability to compete and could harm our business.
We may need to raise additional funds, and we may not be able to obtain additional debt or equity financing on favorable terms, if at all. If we raise additional equity financing, our stockholders may experience significant dilution of their ownership interests and the per share value of our common stock could decline. If we issue equity securities in any additional financing, the new securities may have rights and preferences senior to our common stock. If we engage in debt financing, we may be required to accept terms that restrict our ability to incur additional indebtedness and force us to maintain specified liquidity or other ratios. If we need additional capital and cannot raise it on acceptable terms, we may not be able to, among other things:
• | develop or enhance our application and services; |
• | continue to expand our product development, sales and marketing organizations; |
• | acquire complementary technologies, products or businesses; |
• | expand operations, in the United States or internationally; |
• | hire, train and retain employees; or |
• | respond to competitive pressures or unanticipated working capital requirements. |
Future sales of our common stock in the public market could lower the market price for our common stock and adversely impact the trading price of the Notes.
In the future, we may sell additional shares of our common stock to raise capital. In addition, a substantial number of shares of our common stock is reserved for issuance upon the exercise of stock options, the vesting of restricted stock units and restricted stock pursuant to our employee benefit plans, for purchase by employees under our employee stock purchase plan, and upon conversion of our outstanding convertible notes. We cannot predict the size of future issuances or the effect, if any, that they may have on the market price for our common stock. The issuance and sale of substantial amounts of common stock, or the perception that such issuances and sales may occur, could adversely affect the trading price of the Notes and the market price of our common stock and impair our ability to raise capital through the sale of additional equity securities.
We do not anticipate paying cash dividends, and accordingly, stockholders must rely on stock appreciation for any return on their investment.
We do not anticipate paying cash dividends on our common stock in the future. As a result, only appreciation of the price of our common stock will provide a return to our stockholders. Investors seeking cash dividends should not invest in our common stock.
ITEM 1B. UNRESOLVED STAFF COMMENTS
None.
30
ITEM 2. PROPERTIES
Our corporate headquarters, which includes our operations and research and development facilities, is located in Sunnyvale, California, and currently consists of 95,557 square feet of space under a lease that expires in 2020, with a five-year extension option, and 43,925 square feet space under a lease that expires in 2024, with a five-year extension option.
We lease additional U.S. offices in California, Utah, Texas, Indiana and Colorado. We also lease offices in Toronto, Canada; Paris France; Tokyo, Japan; Nurnberg, Germany, London and Reading, United Kingdom; Belfast, Ireland, Sydney, Australia; Taipei, Taiwan and Herzliya, Israel. We believe our facilities are adequate for our current needs and for the foreseeable future.
The following is a list of our locations and the primary functions.
Location | Primary function |
Sunnyvale, California, U.S. | Research and development, sales, marketing and administration |
San Francisco, California, U.S. | Research and development, sales, marketing and administration |
Minuteman, Utah, U.S. | Research and development, sales, marketing and administration |
Austin, Texas, U.S. | Research and development, marketing |
Indianapolis, Indiana, U.S. | Research and development |
Denver and Broomfield, Colorado | Research and development, sales and marketing |
Herzliya, Israel | Research and development |
Toronto, Canada | Research and development, sales, marketing and administration |
United Kingdom | Research and development, sales and marketing |
Paris, France | Sales |
Tokyo, Japan | Sales |
Nurnberg, Germany | Sales |
Belfast, Ireland | Research and development, sales and marketing |
Taipei, Taiwan | Research and development, sales, marketing and administration |
Sydney, Australia | Sales and marketing |
We operate thirteen data centers at third-party facilities throughout the world: eight in the United States, two in Canada, one in the Netherlands, one in France and one in Germany.
ITEM 3. LEGAL PROCEEDINGS
From time to time, we may be involved in legal proceedings and subject to claims in the ordinary course of business.
Although the results of these proceedings and claims cannot be predicted with certainty, we do not believe the ultimate cost to resolve these matters would individually, or taken together, have a material adverse effect on our business, operating results, cash flows or financial condition. Regardless of the outcome, such proceedings can have an adverse impact on us because of defense and settlement costs, diversion of resources and other factors, and there can be no assurances that favorable outcomes will be obtained.
ITEM 4. MINE SAFETY DISCLOSURES
Not applicable.
31
PART II.
ITEM 5. MARKET FOR REGISTRANT’S COMMON EQUITY, RELATED STOCKHOLDER MATTERS AND ISSUER PURCHASES OF EQUITY SECURITIES
Market Price of Our Common Stock
Our common stock is traded on the NASDAQ Global Market, under the symbol PFPT. The following table set forth, for the periods, indicated, the highest and lowest intraday sales price of our common shares as reported by the NASDAQ Global Market.
High | Low | ||||||
Year Ended December 31, 2017 | |||||||
First Quarter | $ | 84.36 | $ | 71.08 | |||
Second Quarter | $ | 94.33 | $ | 70.30 | |||
Third Quarter | $ | 97.00 | $ | 83.22 | |||
Fourth Quarter | $ | 97.92 | $ | 82.60 | |||
Year Ended December 31, 2016 | |||||||
First Quarter | $ | 65.28 | $ | 35.56 | |||
Second Quarter | $ | 65.19 | $ | 46.58 | |||
Third Quarter | $ | 80.68 | $ | 63.01 | |||
Fourth Quarter | $ | 88.00 | $ | 68.04 | |||
Holders of our Common Shares
As of February 9, 2018, there were 38 stockholders of record, although we believe that there are a larger number of beneficial owners as many of our shares of our common stock are held by brokers and other institutions on behalf of stockholders.
Dividend Policy
We have never declared or paid any cash dividends on our common stock. We currently intend to retain any future earnings and do not expect to pay any cash dividends on our common stock for the foreseeable future. Any determination to pay dividends in the future will be at the discretion of our board of directors and will be dependent on a number of factors, including our earnings, capital requirements and overall financial conditions.
Unregistered Sales of Equity Securities
During the three months ended December 31, 2017, we issued an aggregate of 5,108,170 shares of our common stock to holders of our 1.25% Notes in connection with the conversion of $199.3 million aggregate principal amount of such 1.25% Notes submitted for conversion pursuant to their terms. These shares of common stock were issued on multiple dates in reliance on Section 3(a)(9) of the Securities Act of 1933, as amended. For additional information, refer to Note 8 “Convertible Senior Notes” to the accompanying consolidated financial statements in this report.
Use of Proceeds from Public Offering of Common Stock
There has been no material change in the use of proceeds from our initial public offering in April 2012.
32
Stock Performance Graph
The following graph shows a comparison of the five years ended December 31, 2017, of the cumulative total return for our common stock, the NASDAQ Composite Index, and the NASDAQ Computer Index. The graph assumes an investment of $100 on December 31, 2012 and reinvestment of any dividends. The comparisons in the graph below are required by the Securities and Exchange Commission and are not intended to forecast or be indicative of possible future performance of our common shares.
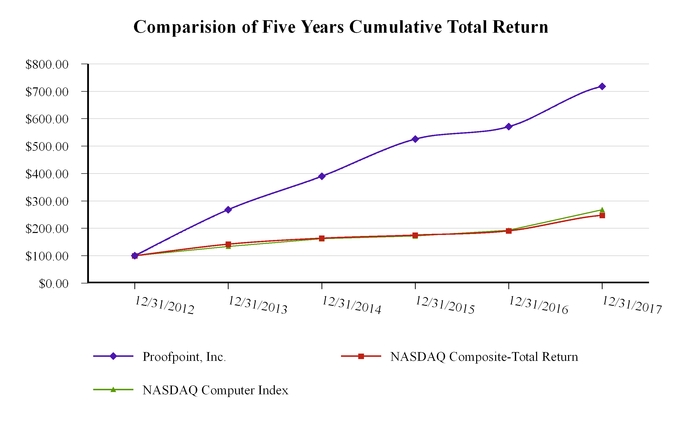
December 31, 2012 | December 31, 2013 | December 31, 2014 | December 31, 2015 | December 31, 2016 | December 31, 2017 | ||||||||||||||||||
Proofpoint, Inc. | $ | 100.00 | $ | 268.15 | $ | 389.89 | $ | 525.55 | $ | 571.14 | $ | 717.95 | |||||||||||
NASDAQ Composite - Total Returns | $ | 100.00 | $ | 142.22 | $ | 164.00 | $ | 175.41 | $ | 190.97 | $ | 247.56 | |||||||||||
NASDAQ Computer Index | $ | 100.00 | $ | 134.24 | $ | 161.77 | $ | 171.87 | $ | 192.96 | $ | 267.77 | |||||||||||
The above stock Performance Graph and related information shall not be deemed “filed” with the SEC and is not to be incorporated by reference into any filing of Proofpoint, Inc. made under the Securities Act of 1933, as amended, or the Securities Exchange Act of 1934, as amended.
ITEM 6. SELECTED CONSOLIDATED FINANCIAL DATA
The following tables present selected historical financial data for our business. You should read this information together with “Management’s Discussion and Analysis of Financial Condition and Results of Operations” and the consolidated financial statements, related notes and other financial information included elsewhere in this Annual Report on Form 10-K. The selected consolidated financial data in this section are not intended to replace the consolidated financial statements and are qualified in their entirety by the consolidated financial statements and related notes included elsewhere in this Annual Report on Form 10-K.
We derived the consolidated statements of operations data for the years ended December 31, 2017, 2016 and 2015, and the consolidated balance sheet data as of December 31, 2017 and 2016 from our audited consolidated financial
33
statements included elsewhere in this report. We derived the consolidated statements of operations data for the years ended December 31, 2014 and 2013 and the consolidated balance sheet data as of December 31, 2015, 2014 and 2013 from our consolidated financial statements not included in this report. Our historical results are not necessarily indicative of the results to be expected in the future.
Years Ended December 31, | |||||||||||||||||||
2017 | 2016 | 2015 | 2014 | 2013 | |||||||||||||||
(in thousands, except per share data) | |||||||||||||||||||
Consolidated Statements of Operations Data: | |||||||||||||||||||
Revenue: | |||||||||||||||||||
Subscription | $ | 503,257 | $ | 365,960 | $ | 257,329 | $ | 187,527 | $ | 132,062 | |||||||||
Hardware and services | 12,032 | 9,536 | 8,068 | 8,080 | 5,869 | ||||||||||||||
Total revenue | 515,289 | 375,496 | 265,397 | 195,607 | 137,931 | ||||||||||||||
Cost of revenue:(1) | |||||||||||||||||||
Subscription | 125,832 | 94,716 | 71,746 | 53,136 | 35,468 | ||||||||||||||
Hardware and services | 17,546 | 13,877 | 12,312 | 12,543 | 6,124 | ||||||||||||||
Total cost of revenue | 143,378 | 108,593 | 84,058 | 65,679 | 41,592 | ||||||||||||||
Gross profit | 371,911 | 266,903 | 181,339 | 129,928 | 96,339 | ||||||||||||||
Operating expense:(1) | |||||||||||||||||||
Research and development | 129,803 | 98,506 | 74,459 | 51,903 | 34,449 | ||||||||||||||
Sales and marketing | 258,837 | 201,204 | 148,414 | 98,333 | 69,123 | ||||||||||||||
General and administrative | 52,735 | 52,774 | 36,616 | 26,679 | 19,622 | ||||||||||||||
Total operating expense | 441,375 | 352,484 | 259,489 | 176,915 | 123,194 | ||||||||||||||
Operating loss | (69,464 | ) | (85,581 | ) | (78,150 | ) | (46,987 | ) | (26,855 | ) | |||||||||
Interest expense | (25,597 | ) | (23,538 | ) | (18,000 | ) | (11,213 | ) | (641 | ) | |||||||||
Other income (expense), net | 774 | (1,103 | ) | (1,927 | ) | (2,230 | ) | (215 | ) | ||||||||||
Loss before income taxes | (94,287 | ) | (110,222 | ) | (98,077 | ) | (60,430 | ) | (27,711 | ) | |||||||||
Benefit from (provision for) income taxes | 9,950 | (986 | ) | (635 | ) | 313 | 2,808 | ||||||||||||
Net loss | $ | (84,337 | ) | $ | (111,208 | ) | $ | (98,712 | ) | $ | (60,117 | ) | $ | (24,903 | ) | ||||
Net loss per share, basic and diluted | $ | (1.91 | ) | $ | (2.66 | ) | $ | (2.48 | ) | $ | (1.61 | ) | $ | (0.71 | ) | ||||
Weighted average shares outstanding, basic and diluted | 44,258 | 41,859 | 39,787 | 37,381 | 34,874 | ||||||||||||||
(1) | Includes stock-based compensation and amortization of intangible assets as follows: |
34
Years Ended December 31, | |||||||||||||||||||
2017 | 2016 | 2015 | 2014 | 2013 | |||||||||||||||
(in thousands) | |||||||||||||||||||
Stock-based compensation: | |||||||||||||||||||
Cost of subscription revenue | $ | 10,635 | $ | 7,427 | $ | 5,028 | $ | 2,404 | $ | 1,007 | |||||||||
Cost of hardware and services revenue | $ | 1,893 | $ | 1,494 | $ | 1,098 | $ | 604 | $ | 196 | |||||||||
Research and development | $ | 30,588 | $ | 24,342 | $ | 20,672 | $ | 10,204 | $ | 3,608 | |||||||||
Sales and marketing | $ | 33,962 | $ | 28,607 | $ | 21,511 | $ | 10,795 | $ | 4,270 | |||||||||
General and administrative | $ | 20,382 | $ | 16,826 | $ | 11,785 | $ | 6,997 | $ | 3,002 | |||||||||
Amortization of intangible assets: | |||||||||||||||||||
Cost of subscription revenue | $ | 14,512 | $ | 9,423 | $ | 7,079 | $ | 4,157 | $ | 2,220 | |||||||||
Research and development | $ | 60 | $ | 60 | $ | 91 | $ | 93 | $ | 47 | |||||||||
Sales and marketing | $ | 3,934 | $ | 4,938 | $ | 5,074 | $ | 4,494 | $ | 1,743 | |||||||||
General and administrative | $ | — | $ | — | $ | 12 | $ | 46 | $ | 34 | |||||||||
As of December 31, | |||||||||||||||||||
2017 | 2016 | 2015 | 2014 | 2013 | |||||||||||||||
(in thousands) | |||||||||||||||||||
Consolidated Balance Sheet Data: | |||||||||||||||||||
Cash, cash equivalents and short-term investments | $ | 331,598 | $ | 396,751 | $ | 406,237 | $ | 214,986 | $ | 251,801 | |||||||||
Deferred commissions, current and long-term | $ | 32,955 | $ | 25,664 | $ | 22,802 | $ | 15,060 | $ | 10,938 | |||||||||
Property and equipment, net | $ | 73,617 | $ | 52,523 | $ | 34,501 | $ | 18,718 | $ | 11,221 | |||||||||
Total assets | $ | 974,813 | $ | 801,660 | $ | 705,616 | $ | 439,076 | $ | 401,211 | |||||||||
Convertible senior notes | $ | 197,858 | $ | 366,541 | $ | 345,699 | $ | 161,396 | $ | 152,642 | |||||||||
Other debt, current and long-term | $ | 89 | $ | 123 | $ | 155 | $ | 695 | $ | 2,350 | |||||||||
Deferred revenue, current and long-term | $ | 451,788 | $ | 312,181 | $ | 223,726 | $ | 162,675 | $ | 123,983 | |||||||||
Total stockholders’ equity | $ | 233,124 | $ | 44,923 | $ | 83,185 | $ | 71,533 | $ | 88,098 | |||||||||
ITEM 7. MANAGEMENT’S DISCUSSION AND ANALYSIS OF FINANCIAL CONDITION AND RESULTS OF OPERATIONS
The following discussion and analysis of our financial condition and results of operations should be read in conjunction with our “Selected Consolidated Financial Data” and our consolidated financial statements and related notes included elsewhere in this Annual Report on Form 10-K. This discussion contains forward-looking statements that involve risks and uncertainties. Our actual results could differ materially from those forward-looking statements below. Factors that could cause or contribute to those differences include, but are not limited to, those identified below and those discussed in the section entitled “Risk Factors” included elsewhere in this Annual Report on Form 10-K. This Annual Report on Form 10-K contains “forward-looking statements” within the meaning of Section 21E of the Securities Exchange Act of 1934, as amended (the “Exchange Act”). These statements are often identified by the use of words such as “may,” “will,” “expect,” “believe,” “anticipate,” “intend,” “could,” “estimate,” or “continue,” and similar expressions or variations. Such forward-looking statements are subject to risks, uncertainties and other factors that could cause actual results and the timing of certain events to differ materially from future results expressed or implied by such forward-looking statements. Factors that could cause or contribute to such differences include, but are not limited to, those identified herein, and those discussed in the section titled “Risk Factors”, set forth in Part I, Item 1A of this Form 10-K. Except as required by law, we disclaim any obligation to update any forward-looking statements to reflect events or circumstances after the date of such statements.
Overview
Proofpoint is a leading next generation cybersecurity company that enables large and mid-sized organizations worldwide to protect the way their people work from advanced threats and compliance risks. Our security and compliance
35
platform is comprised of an integrated suite of threat protection, information protection, and brand protection solutions, including email protection, advanced threat protection, email authentication, data loss prevention, SaaS application protection, response orchestration and automation, digital risk, web browser isolation, email encryption, archiving, eDiscovery, supervision, and secure communication. Our solutions are built on a flexible, cloud-based platform and leverage a number of proprietary technologies - including big data analytics, machine learning, deep content inspection, secure storage, advanced encryption, intelligent message routing, dynamic malware analysis, threat correlation, and virtual execution environments to address today’s rapidly changing threat and compliance landscape.
Our platform addresses this growing challenge by not only protecting data as it flows into and out of the enterprise via on-premises and cloud-based email, instant messaging, social media, and other cloud-applications, but also by keeping track of this information as it is modified and distributed throughout the enterprise for compliance and data loss prevention, and securely archiving these communications for compliance and discovery. We address four important problems for the enterprise:
• | protecting users from the advanced attacks that target them via email, social media and SaaS applications; |
• | preventing the theft or inadvertent loss of sensitive information and, in turn, ensuring compliance with regulatory data protection mandates; |
• | collecting, retaining, governing and discovering sensitive data for compliance and litigation support; and |
• | enabling organizations to respond quickly to security issues, providing both the intelligence and the context to prioritize incidents and orchestrate remediation actions. |
Our platform and its associated solutions are sold to customers on a subscription basis and can be deployed through our unique cloud-based architecture that leverages both our global data centers as well as optional points-of-presence behind our customers’ firewalls. Our flexible deployment model enables us to deliver superior security and compliance while maintaining the favorable economics afforded by cloud computing, creating a competitive advantage for us over legacy on-premises and cloud-only offerings.
We were founded in 2002 to provide a unified solution to help enterprises address their growing data security requirements. Our first solution was commercially released in 2003 to combat the burgeoning problem of spam and viruses and their impact on corporate email systems. To address the evolving threat landscape and the adoption of communication and collaboration systems beyond corporate email and networks, we have broadened our solutions to defend against a wide range of threats, protect against outbound security risks, and archive and govern corporate information. As the threat environment has continued to evolve, we have dedicated significant resources to meet the ongoing challenges that this highly dynamic environment creates for our customers such as investing significantly to expand the breadth of our data protection platform as these expenditures are primarily in connection with the replacement and upgrade of equipment to lower the cost of deployment as well as to improve the efficiency for our cloud-based architecture.
Our business is based on a recurring revenue model. Our customers pay a subscription fee to license the various components of our SaaS platform for a contract term that is typically one to three years. At the end of the license term, customers may renew their subscription and in each year since the launch of our first solution in 2003, we have maintained a renewal rate with our existing customers of over 90%. We derive this retention rate by calculating the total annually recurring subscription revenue from customers currently using our SaaS platform and dividing it by the total annually recurring subscription revenue from both these current customers as well as all business lost through non-renewal.
We market and sell our solutions worldwide both directly through our sales teams and indirectly through a hybrid model where our sales organization actively assists our network of distributors and resellers. We also derive a lesser portion of our total revenue from the license of our solutions to strategic partners who offer our solutions in conjunction with one or more of their own products or services.
Our solutions are designed to be implemented, configured and operated without the need for any training or professional services. We offer various trainings and professional services for those customers that seek to develop deeper expertise in the use of our solutions or would like assistance with complex configurations or the importing of data. In some cases, we provide a hardware appliance to those customers that elect to host elements of our solution behind their firewall. Increasing adoption of virtualization in the data center has led to a decline in the sales of our hardware appliances and a shift towards our software-based virtual appliances, which are delivered as a download via the Internet. Our hardware and services offerings carry lower margins and are provided as a courtesy to our customers. We expect the overall proportion of revenue derived from the hardware and services offerings to generally remain below 5% of our total revenue.
36
Historically, the majority of our revenue was derived from our customers in the United States. We believe the markets outside of the United States offer an opportunity for growth and we intend to make additional investments in sales and marketing to expand in these markets. Revenue from customers outside of the United States grew 38% for the year ended December 31, 2017 as compared to prior year. In terms of customer concentration, there was one partner who accounted for 12% of our total revenue in 2017, though that partner sold to a number of end-users, none of which accounted for more than 10% of our total revenue in 2017. No individual customers or partners accounted for more than 10% of our total revenue in 2016 or 2015.
We have not been profitable to date and will need to grow revenue at a rate faster than our investments in cost of revenue and operating expenses in order to achieve profitability, as discussed in more detail below.
Key Opportunities and Challenges
The total costs associated with the teams tasked with closing business with new customers and additional business with our existing customers have represented more than 90% of our total sales and marketing costs since 2008. Although we expect customers to be profitable over the duration of the customer relationship, the upfront costs typically exceed related revenue during the earlier periods of a contract. As a result, while our practice of invoicing our customers for the entire amount of the contract at the start of the term provides us with a relatively immediate contribution to cash flow, the revenue is recognized ratably over the term of the contract, and hence contributions toward operating income are limited in the period where the sales and marketing costs are incurred. Accordingly, an increase in the mix of new customers as a percentage of total customers would likely negatively impact our near-term operating results. On the other hand, we expect that an increase in the mix of existing customers as a percentage of total customers would positively impact our operating results over time. As we accumulate customers that continue to renew their contracts, we anticipate that our mix of existing customers will increase, contributing to a decrease in our sales and marketing costs as a percentage of total revenue and a commensurate improvement in our operating income.
As part of our SaaS platform maintenance, we provide ongoing updates and enhancements to the platform services both in terms of the software as well as the underlying hardware and data center infrastructure. These updates and enhancements are provided to our customers at no additional charge as part of the subscription fees paid for the use of our platform. While more traditional products eventually become obsolete and require replacement, we are constantly updating and maintaining our cloud-based services and as such they operate with a continuous product life cycle. Much of this work is designed to both maintain and enhance the customers’ experience over time while also lowering our costs to deliver the service. Our SaaS platform is a shared infrastructure that is used by all of our customers. Accordingly, the costs of the platform are spread in a relatively uniform manner across the entire customer base and no specific infrastructure elements are directly attached to any particular customer. As such, in the event that a customer chooses not to renew its subscription, the underlying resources are reallocated either to new customers or to accommodate the expanding needs of our existing customers and, as a result, we do not believe that the loss of any particular customer has a meaningful impact on our gross profit as long as we continue to grow our customer base.
To date, our customers have primarily used our solutions in conjunction with email messaging content. We have developed solutions to address new and evolving messaging solutions such as social media and file sharing applications, but these solutions are relatively nascent. If customers increase their use of these new messaging solutions in the future, we anticipate that our growth in revenue associated with older email messaging solutions may slow over time. Although revenue associated with our social media and file sharing applications has not been material to date, we believe that our ability to provide security, archiving, governance and discovery for these new solutions will be viewed as valuable by our existing customers, enabling us to derive revenue from these new forms of messaging and communication.
While the majority of our current and prospective customers run their email systems on premise, we believe that there is a trend for large and mid-sized enterprises to migrate these systems to the cloud. While our current revenue derived from customers using cloud-based email systems continues to grow as a percentage of our total revenue, many of these cloud-based email solutions offer some form of threat protection and governance services, potentially mitigating the need for customers to buy these capabilities from third parties such as our company. We believe that we can continue to provide security, archiving, governance, and discovery solutions that are differentiated from the services offered by cloud-based email providers, and as such our platform will continue to be viewed as valuable to enterprises once they have migrated their email services to the cloud, enabling us to continue to derive revenue from this new trend toward cloud-based email deployment models.
With the majority of our business, we invoice our customers for the entire contract amount at the start of the term and these amounts are recorded as deferred revenue on our balance sheet, with the dollar weighted average duration of these
37
contracts for any given period over the past three years typically ranging from 14 to 20 months. As a result, while our practice of invoicing customers for the entire amount of the contract at the start of the term provides us with a relatively immediate contribution to cash flow, the revenue is recognized ratably over the term of the contract, and hence contributions toward operating income are realized over an extended period. As such, our efforts to improve our profitability require us to invest far less in operating expenses than the cash flow generated by our business might otherwise allow. As we strive to invest in an effort to continue to increase the size and scale of our business, we expect that the level of investment afforded by our growth in revenue should be sufficient to fund the investments needed to drive revenue growth and broaden our product line.
Considering all of these factors, we do not expect to be profitable on a GAAP basis in the near term and in order to achieve profitability we will need to grow revenue at a rate faster than our investments in operating expenses and cost of revenue.
We intend to grow our revenue through acquiring new customers by investing in our sales and marketing activities. We believe that an increase in new customers in the near term will result in a larger base of renewal customers, which, over time, we expect to be more profitable for us.
Sales and marketing is our largest expense and hence a significant contributing factor to our operating losses. We believe that our opportunity to improve our return on investment on sales and marketing costs relies primarily on our ongoing ability to cost-effectively renew our business with existing customers, thereby lowering our overall sales and marketing costs as a percentage of revenue, as the mix of revenue derived from this more profitable renewal activity increases over time. Therefore, we anticipate that our initial significant investments in sales and marketing activities will, over time, generate a larger base of more profitable customers. Cost of subscription revenue is also a significant expense for us, and we expect to continue to build on the improvements over the past years, such as in replacing third-party technology with our proprietary technology and improving the utilization of our fixed investments in equipment and infrastructure, in order to provide the opportunity for improved subscription gross margins over time. Although we plan to continue enhancing our solutions, we intend to lower our rate of investment in research and development as a percentage of revenue over time by deriving additional revenue from our existing platform of solutions rather than by adding entirely new categories of solutions. In addition, as personnel costs are one of the primary drivers of the increases in our operating expenses, we plan to reduce our historical rate of headcount growth over time.
Key Metrics
We regularly review a number of metrics, including the following key metrics presented in the table below, to evaluate our business, measure our performance, identify trends in our business, prepare financial projections and make strategic decisions. Many of these key metrics, such as non-GAAP gross margin, billings, and free cash flows, are non-GAAP measures. This non-GAAP information is not necessarily comparable to non-GAAP information of other companies. Users of this financial information should consider the types of events and transactions for which adjustments have been made.
Year Ended December 31, | |||||||||||
2017 | 2016 | 2015 | |||||||||
(in thousands) | |||||||||||
Total revenue | $ | 515,289 | $ | 375,496 | $ | 265,397 | |||||
Growth | 37 | % | 41 | % | 36 | % | |||||
Gross margin percentage | 72 | % | 71 | % | 68 | % | |||||
Non-GAAP gross margin | 77 | % | 76 | % | 73 | % | |||||
Billings (non-GAAP) | $ | 638,796 | $ | 462,751 | $ | 324,348 | |||||
Growth | 38 | % | 43 | % | 39 | % | |||||
Free cash flows (non-GAAP) | $ | 106,728 | $ | 59,828 | $ | 20,677 | |||||
Non-GAAP gross margin
We define non-GAAP gross margin as non-GAAP gross profit divided by GAAP revenue. We define non-GAAP gross profit as GAAP gross profit, adjusted to exclude stock-based compensation expense and the amortization of intangible assets associated with acquisitions. We consider this non-GAAP financial measure to be a useful metric for management and investors because it excludes the effect of stock-based compensation expense and the amortization of intangible assets associated with acquisitions so that our management and investors can compare our business operating results over multiple
38
periods, and compare our financial results with other companies in its industry, many of which present similar non-GAAP financial measure. However, there are a number of limitations related to the use of non-GAAP gross margin versus gross margin calculated in accordance with GAAP. For example, stock-based compensation has been and will continue to be for the foreseeable future a significant recurring expense in our business. Stock-based compensation is an important part of our employees’ compensation and impacts their performance. In addition, the components of the costs that we exclude in our calculation of non-GAAP gross margin may differ from the components that our peer companies exclude when they report their non-GAAP results. Management compensates for these limitations by providing specific information regarding the GAAP amounts excluded from non-GAAP gross margin and evaluating non-GAAP gross margin together with gross margin calculated in accordance with GAAP.
The following table presents the reconciliation of gross margin to Non-GAAP gross margin for the years ended December 31, 2017, 2016 and 2015:
Year Ended December 31, | |||||||||||
2017 | 2016 | 2015 | |||||||||
(in thousands) | |||||||||||
GAAP gross profit | $ | 371,911 | $ | 266,903 | $ | 181,339 | |||||
GAAP gross margin | 72 | % | 71 | % | 68 | % | |||||
Plus: | |||||||||||
Stock-based compensation expense | 12,528 | 8,921 | 6,126 | ||||||||
Amortization of intangible assets | 14,512 | 9,423 | 7,079 | ||||||||
Non-GAAP gross profit | $ | 398,951 | $ | 285,247 | $ | 194,544 | |||||
Non-GAAP gross margin | 77 | % | 76 | % | 73 | % | |||||
Billings
We have included billings, a non-GAAP financial measure, in this report because it is a key measure used by our management and board of directors to manage our business and monitor our near term cash flows. We define billings as total revenue plus change in deferred revenue during a period, less deferred revenue from acquisitions. We have provided reconciliation between total revenue, the most directly comparable GAAP financial measure, and billings. Accordingly, we believe that billings provides useful information to investors and others in understanding and evaluating our operating results in the same manner as our management and board of directors.
Our use of billings as a non-GAAP measure has limitations as an analytical tool, and you should not consider it in isolation or as a substitute for revenue or an analysis of our results as reported under GAAP. Some of these limitations are:
• | Billings is not a substitute for revenue, as trends in billings are not necessarily directly correlated to trends in revenue; |
• | Billings is affected by a combination of factors including the timing of renewals, the sales of our solutions to both new and existing customers, the relative duration of contracts sold, and the relative amount of business derived from strategic partners. As each of these elements has unique characteristics in the relationship between billings and revenue, our billings activity is not necessarily closely correlated to revenue; and |
• | Other companies, including companies in our industry, may not use billings, may calculate billings differently, or may use other financial measures to evaluate their performance ‑ all of which reduce the usefulness of billings as a comparative measure. |
39
The following table presents the reconciliation of total revenue to billings for the years ended December 31, 2017, 2016 and 2015:
Year Ended December 31, | |||||||||||
2017 | 2016 | 2015 | |||||||||
(in thousands) | |||||||||||
Total revenue | $ | 515,289 | $ | 375,496 | $ | 265,397 | |||||
Deferred revenue | |||||||||||
Ending | 451,788 | 312,181 | 223,726 | ||||||||
Beginning | 312,181 | 223,726 | 162,675 | ||||||||
Net change | 139,607 | 88,455 | 61,051 | ||||||||
Less: deferred revenue contributed by acquisitions | (16,100 | ) | (1,200 | ) | (2,100 | ) | |||||
Billings | $ | 638,796 | $ | 462,751 | $ | 324,348 | |||||
Free cash flows
We define free cash flow as net cash provided by operating activities minus capital expenditures. We consider free cash flow to be a liquidity measure that provides useful information to management and investors about the amount of cash generated by the business that, after the acquisition of property and equipment, can be used for strategic opportunities, including investing in our business, making strategic acquisitions, and strengthening the balance sheet. Analysis of free cash flow facilitates management’s comparisons of our operating results to competitors’ operating results. A limitation of using free cash flow versus the GAAP measure of net cash provided by operating activities as a means for evaluating our company is that free cash flow does not represent the total increase or decrease in the cash balance from operations for the period because it excludes cash used for capital expenditures during the period. Management compensates for this limitation by providing information about our capital expenditures on the face of the cash flow statement and in the “Liquidity and Capital Resources” section below.
Year Ended December 31, | |||||||||||
2017 | 2016 | 2015 | |||||||||
(in thousands) | |||||||||||
GAAP cash flows provided by operating activities: | $ | 153,686 | $ | 94,235 | $ | 46,504 | |||||
Less: | |||||||||||
Purchase of property and equipment | (46,958 | ) | (34,407 | ) | (25,827 | ) | |||||
Non-GAAP free cash flows | $ | 106,728 | $ | 59,828 | $ | 20,677 | |||||
Net cash used in investing activities | $ | (190,427 | ) | $ | (89,192 | ) | $ | (102,789 | ) | ||
Net cash (used in) provided by financing activities | $ | (23,212 | ) | $ | (5,238 | ) | $ | 223,188 | |||
Components of Our Results of Operations
In May 2014, the FASB issued ASU No. 2014-09, Revenue from Contracts with Customers: Topic 606 (“ASC 606”), to supersede nearly all existing revenue recognition guidance under U.S. GAAP. The standard contains a comprehensive new revenue recognition model that requires revenue to be recognized in a manner to depict the transfer of goods or services to a customer at an amount that reflects the consideration expected to be received in exchange for those goods and services. The FASB has issued several amendments to the standard, including clarifications on disclosure of prior-period and remaining performance obligations.
We will adopt ASC 606 effective January 1, 2018 using the full retrospective transition method. While we are finalizing the impact, this standard has on our consolidated financial statements and related disclosures, we expect the new standard to mostly change i) the timing of revenue recognition for contracts related to certain on-premise offerings, in which we grant customers the right to deploy our subscription software on the customer's own servers. For these contracts, we will be required to recognize as revenue a significant portion of the contract price upon delivery of the software compared to the current practice of recognizing the entire contract price ratably over a subscription period; ii) the timing of revenue recognition in instances when all revenue recognition criteria were not met until after the start date of the subscription.
40
Previously these amounts were recognized prospectively over the remaining contract term, while under ASC 606, we will be required to recognize revenue on a cumulative catch-up basis for amounts earned up to the time all revenue recognition criteria have been met. The expected impact, upon adoption of ASC 606, is that reported revenue will increase by $4 to $5 million in 2017 and by $2 to $3 million in 2016.
We also expect that certain contract acquisition costs such as sales commissions, will be amortized over an expected benefit period that is longer than our current policy of amortizing the deferred amounts over the specific revenue contract term for the associated contract. The expected impact, upon adoption of ASC 606 is that reported sales and marketing expense will decrease by $7 to $9 million in 2017 and by $9 to $11 million in 2016. Finally, due to the adoption of ASC 606, we expect our accumulated deficit as of January 1, 2016 to decrease by $35 to $38 million.
Revenue
We derive our revenue primarily through the license of various solutions and services on our security-as-a-service platform on a subscription basis, supplemented by the sales of training, professional services and hardware depending upon our customers’ requirements.
Subscription. We license our platform and its associated solutions and services on a subscription basis. The fees are charged on a per user, per year basis. Subscriptions are typically one to three years in duration. We invoice our customers upon signing for the entire term of the contract. The invoiced amounts billed in advance are treated as deferred revenue on the balance sheet and are recognized ratably, in accordance with the appropriate revenue recognition guidelines, over the term of the contract. We also derive a portion of our subscription revenue from the license of our solutions to strategic partners. We bill these strategic partners monthly. We expect our subscription revenue will continue to grow and remain above 95% of our total revenue.
Hardware and services. We provide hardware appliances as a convenience to our customers and as such it represents a small part of our business. Our solutions are designed to be implemented, configured and operated without the need for any training or professional services. For those customers that seek to develop deeper expertise in the use of our solutions or would like assistance with complex configurations or the importing of data, we offer various training and professional services. We typically invoice the customer for hardware at the time of shipment. We typically invoice customers for services at the time the order is placed and recognize this revenue ratably over the term of the contract. On occasion, customers may retain us for special projects such as archiving import and export services; these types of services are recognized upon completion of the project. We expect the overall proportion of revenue derived from hardware and service offerings to generally remain below 5% of our total revenue.
Cost of Revenue
Our cost of revenues consists of cost of subscription revenue and cost of hardware and services revenue. Personnel costs, data center costs and hardware costs are the most significant components of our cost of revenues. We expect personnel costs to continue to increase in absolute dollars as we hire new employees to continue to grow our business.
Cost of Subscription Revenue. Cost of subscription revenue primarily includes personnel costs, consisting of salaries, benefits, bonuses, and stock-based compensation, for employees who provide support services to our customers and operate our data centers. Other costs include fees paid to contractors who supplement our support and data center personnel; expenses related to the use of third-party data centers in both the United States and internationally; depreciation of data center equipment; amortization of licensing fees and royalties paid for the use of third-party technology; amortization of internally developed intangible assets; and the amortization of intangible assets acquired through business combinations. Growth in subscription revenue generally consumes production resources, requiring us to gradually increase our cost of subscription revenue in absolute dollars as we expand our investment in data center equipment, the third-party data center space required to house this equipment, and the personnel needed to manage this higher level of activity.
Cost of Hardware and Services Revenue. Cost of hardware and services revenue includes personnel costs for employees who provide training and professional services to our customers as well as the cost of server hardware shipped to our customers that we procure from third parties and configure with our software solutions.
Operating Expenses
Our operating expenses consist of research and development, sales and marketing, and general and administrative expenses. Personnel costs, which consist of salaries, benefits, bonuses, and stock-based compensation, are the most significant component of our operating expenses. Our headcount has increased from 449 employees as of December 31, 2012
41
to 2,047 employees as of December 31, 2017. As a result of this growth in headcount, operating expenses have increased significantly over these periods. We expect personnel costs to continue to increase in absolute dollars as we hire new employees to continue to grow our business.
Research and Development. Research and development expenses include personnel costs, consulting services and depreciation. We believe that these investments have played an important role in broadening the capabilities of our platform over the course of our operating history, enhancing the relevance of our solutions in the market in general and helping us to retain our customers over time. We expect to continue to devote substantial resources to research and development in an effort to continuously improve our existing solutions as well as to develop new offerings. We believe that these investments are necessary to maintain and improve our competitive position. However, over the longer term, we intend to monitor these costs so as to decrease this spending as a percentage of total revenue. Our research efforts include both software developed for our internal use on behalf of our customers as well as software elements to be used by our customers in their own facilities. To date, our capitalized costs on software developed for internal use on behalf of our customers were not material. For the software developed for use on our customers’ premises, the costs associated with the development work between technological feasibility and the general availability has not been material and as such we have not capitalized any of these development costs to date.
Sales and Marketing. Sales and marketing expenses include personnel costs, sales commissions, and other costs including travel and entertainment, marketing and promotional events, public relations and marketing activities. These costs also include amortization of intangible assets as a result of our past acquisitions. Due to our continued investment in growing our sales and marketing operations, both domestically and internationally, headcount increases were reflected in higher compensation expense consistent with our revenue growth. Our sales personnel are typically not immediately productive, and therefore the increase in sales and marketing expenses we incur when we add new sales representatives is not immediately offset by increased revenue and may not result in increased revenue over the long-term if these new sales people fail to become productive. The timing of our hiring of new sales personnel and the rate at which they generate incremental revenue will affect our future financial performance. We expect that sales and marketing expenses will continue to increase in absolute dollars and be among the most significant components of our operating expenses.
General and Administrative. General and administrative expenses consist of personnel costs, consulting services, audit fees, tax services, legal expenses and other general corporate items. As a result of our operational growth, we expect our general and administrative expenses to increase in absolute dollars in future periods as we continue to expand our operations and hire additional personnel.
Interest Expense
Interest expense consists of interest income earned on our cash, cash equivalents and short-term investments, the interest expense related to our convertible senior notes and our capital lease payments.
Other Income (Expense), Net
Other income (expense), net, consists primarily of the net effect of foreign currency transaction gains and losses.
Benefit from (Provision for) Income Taxes
For 2013 and prior years, the benefit from (provision for) income taxes was related to state and foreign income taxes. As we have incurred operating losses in all periods to date and recorded a full valuation allowance against our deferred tax assets, we have not historically recorded a provision for federal income taxes. However, in the years ended December 31, 2016 and 2015, we recognized $0.4 million and $0.1 million, respectively, of deferred tax expense in the U.S. related to amortization of tax goodwill on business acquisitions. For the year ended December 31, 2017, we recognized $0.2 million of deferred tax benefit in the U.S. related to amortization of tax goodwill on business acquisitions and $12.3 million of deferred tax benefit in the U.S. related to changes in the Company’s valuation allowance resulting from Cloudmark, Inc. and WebLife Balance, Inc. business acquisitions. Realization of any of our deferred tax assets depends upon future earnings, the timing and amount of which are uncertain. Utilization of our net operating losses and research and development credits may be subject to substantial annual limitation due to the ownership change limitations provided by the Internal Revenue Code and similar state provisions. Analyses have been conducted to determine whether an ownership change had occurred since inception. The analyses have indicated that although ownership changes have occurred in prior years, the net operating losses and research and development credits would not expire before utilization as a result of the ownership change. In the event we have subsequent changes in ownership, net operating losses and research and development credit carryovers could be limited and may expire unutilized as a result of the subsequent ownership change.
42
Results of Operations
The following table is a summary of our consolidated statements of operations.
Year Ended December 31, | |||||||||||
2017 | 2016 | 2015 | |||||||||
(in thousands) | |||||||||||
Revenue: | |||||||||||
Subscription | $ | 503,257 | $ | 365,960 | $ | 257,329 | |||||
Hardware and services | 12,032 | 9,536 | 8,068 | ||||||||
Total revenue | 515,289 | 375,496 | 265,397 | ||||||||
Cost of revenue:(1) | |||||||||||
Subscription | 125,832 | 94,716 | 71,746 | ||||||||
Hardware and services | 17,546 | 13,877 | 12,312 | ||||||||
Total cost of revenue | 143,378 | 108,593 | 84,058 | ||||||||
Gross profit | 371,911 | 266,903 | 181,339 | ||||||||
Operating expense:(1) | |||||||||||
Research and development | 129,803 | 98,506 | 74,459 | ||||||||
Sales and marketing | 258,837 | 201,204 | 148,414 | ||||||||
General and administrative | 52,735 | 52,774 | 36,616 | ||||||||
Total operating expense | 441,375 | 352,484 | 259,489 | ||||||||
Operating loss | (69,464 | ) | (85,581 | ) | (78,150 | ) | |||||
Interest expense | (25,597 | ) | (23,538 | ) | (18,000 | ) | |||||
Other income (expense), net | 774 | (1,103 | ) | (1,927 | ) | ||||||
Loss before income taxes | (94,287 | ) | (110,222 | ) | (98,077 | ) | |||||
Benefit from (provision for) income taxes | 9,950 | (986 | ) | (635 | ) | ||||||
Net loss | $ | (84,337 | ) | $ | (111,208 | ) | $ | (98,712 | ) | ||
43
The following table sets forth our consolidated results of operations for the specified periods as a percentage of our total revenue for those periods.
Year Ended December 31, | ||||||||
2017 | 2016 | 2015 | ||||||
Revenue: | ||||||||
Subscription | 98 | % | 97 | % | 97 | % | ||
Hardware and services | 2 | 3 | 3 | |||||
Total revenue | 100 | 100 | 100 | |||||
Cost of revenue:(1) | ||||||||
Subscription | 25 | 25 | 27 | |||||
Hardware and services | 3 | 4 | 5 | |||||
Total cost of revenue | 28 | 29 | 32 | |||||
Gross profit | 72 | 71 | 68 | |||||
Operating expense:(1) | ||||||||
Research and development | 25 | 26 | 28 | |||||
Sales and marketing | 50 | 54 | 56 | |||||
General and administrative | 10 | 14 | 14 | |||||
Total operating expense | 85 | 94 | 98 | |||||
Operating loss | (13 | ) | (23 | ) | (30 | ) | ||
Interest expense | (5 | ) | (6 | ) | (7 | ) | ||
Other income (expense), net | — | (1 | ) | — | ||||
Loss before income taxes | (18 | ) | (30 | ) | (37 | ) | ||
Benefit from (provision for) income taxes | 2 | — | — | |||||
Net loss | (16 | )% | (30 | )% | (37 | )% | ||
_______________________________________________________________________________
(1) | Includes stock-based compensation and amortization of intangible assets as follows: |
Year Ended December 31, | |||||||||||
2017 | 2016 | 2015 | |||||||||
(in thousands) | |||||||||||
Stock-based compensation: | |||||||||||
Cost of subscription revenue | $ | 10,635 | $ | 7,427 | $ | 5,028 | |||||
Cost of hardware and services revenue | $ | 1,893 | $ | 1,494 | $ | 1,098 | |||||
Research and development | $ | 30,588 | $ | 24,342 | $ | 20,672 | |||||
Sales and marketing | $ | 33,962 | $ | 28,607 | $ | 21,511 | |||||
General and administrative | $ | 20,382 | $ | 16,826 | $ | 11,785 | |||||
Amortization of intangible assets: | |||||||||||
Cost of subscription revenue | $ | 14,512 | $ | 9,423 | $ | 7,079 | |||||
Research and development | $ | 60 | $ | 60 | $ | 91 | |||||
Sales and marketing | $ | 3,934 | $ | 4,938 | $ | 5,074 | |||||
General and administrative | $ | — | $ | — | $ | 12 | |||||
44
Revenue
Year Ended December 31, | Change | Year Ended December 31, | Change | ||||||||||||||||||||||||||
2017 | 2016 | $ | % | 2016 | 2015 | $ | % | ||||||||||||||||||||||
(in thousands) | (in thousands) | ||||||||||||||||||||||||||||
Subscription | $ | 503,257 | $ | 365,960 | $ | 137,297 | 38 | % | $ | 365,960 | $ | 257,329 | $ | 108,631 | 42 | % | |||||||||||||
Hardware and services | 12,032 | 9,536 | 2,496 | 26 | % | 9,536 | 8,068 | 1,468 | 18 | % | |||||||||||||||||||
Total revenue | $ | 515,289 | $ | 375,496 | $ | 139,793 | 37 | % | $ | 375,496 | $ | 265,397 | $ | 110,099 | 41 | % | |||||||||||||
Subscription revenue increased $137.3 million and $108.6 million, or 38% and 42%, respectively, for 2017 and 2016. These increases were primarily due to a $113.5 million and $92.9 million increase in revenue from the United States and, to a lesser extent, a $23.8 million and $15.7 million increase from international customers for 2017 and 2016, respectively.
The increase in subscription revenue for 2017 and 2016 was due to the ongoing robust demand for our advanced threat solutions, increase in add-on activity and renewal rate being higher than 90%. Additionally, the revenue recognized from acquired deferred revenue related to the acquisitions we made was $3.2 million, $2.7 million and $4.7 million in 2017, 2016 and 2015, respectively. The change in subscription revenue due to pricing was not significant for either period.
Hardware and services revenue for 2017 increased $2.5 million or 26%, as compared to 2016, primarily due to $1.9 million increase in professional service revenue due to an increase in configuration and installation service revenue, and a $0.6 million increase in hardware revenue due to more units sold. The increase in hardware and services revenue in 2016 as compared to 2015 was $1.5 million, or 18%, primarily due to higher revenue from professional services related to the archiving solutions.
Cost of Revenue
Year Ended December 31, | Change | Year Ended December 31, | Change | ||||||||||||||||||||||||||
2017 | 2016 | $ | % | 2016 | 2015 | $ | % | ||||||||||||||||||||||
(in thousands) | (in thousands) | ||||||||||||||||||||||||||||
Subscription | $ | 125,832 | $ | 94,716 | $ | 31,116 | 33 | % | $ | 94,716 | $ | 71,746 | $ | 22,970 | 32 | % | |||||||||||||
Hardware and services | 17,546 | 13,877 | 3,669 | 26 | % | 13,877 | 12,312 | 1,565 | 13 | % | |||||||||||||||||||
Total cost of revenue | $ | 143,378 | $ | 108,593 | $ | 34,785 | 32 | % | $ | 108,593 | $ | 84,058 | $ | 24,535 | 29 | % | |||||||||||||
Cost of subscription revenue increased $31.1 million, or 33%, in 2017 as compared to 2016, and $23.0 million, or 32%, in 2016 as compared to 2015. The increases were primarily due to increases in operations-related expense of $21.1 million and $13.6 million, respectively, due to increased headcount, depreciation expense as a result of higher capital expenditures to support our growth, and amortization of intangible assets expense of developed technology from the acquisitions. Additionally, support-related expenses increased $8.4 million and $6.5 million, respectively, primarily due to higher headcount and consulting costs. Data center costs increased $1.8 million and $2.9 million, respectively, primarily due to subscription revenue growth in our cloud-based solutions.
Cost of hardware and services revenue for 2017 and 2016 increased $3.7 million and $1.6 million, or 26% and 13%, respectively, as compared to the year before, primarily due to an increase in professional service costs as our headcount increased. The change in hardware and services cost was not material in either period.
45
Operating Expenses
Year Ended December 31, | Change | Year Ended December 31, | Change | ||||||||||||||||||||||||||
2017 | 2016 | $ | % | 2016 | 2015 | $ | % | ||||||||||||||||||||||
(in thousands) | (in thousands) | ||||||||||||||||||||||||||||
Research and development | $ | 129,803 | $ | 98,506 | $ | 31,297 | 32 | % | $ | 98,506 | $ | 74,459 | $ | 24,047 | 32 | % | |||||||||||||
Percent of total revenue | 25 | % | 26 | % | 26 | % | 28 | % | |||||||||||||||||||||
Research and development expenses increased $31.3 million and $24.0 million, or 32% and 32%, for 2017 and 2016, respectively. The increases were primarily due to increases in personnel-related costs of $25.3 million and $18.7 million for 2017 and 2016, respectively, from higher headcount, including those from the integration of the acquisitions in 2017 and 2016. Additionally, corporate expense increased $5.8 million and $2.7 million for 2017 and 2016, respectively, primarily due to higher costs from expanded operations, higher allocated costs from facilities, human resources and IT-related expense as we grew year-over-year, and increased consulting costs of $2.8 million in 2016 as compared to 2015, as we grew rapidly in both years.
Year Ended December 31, | Change | Year Ended December 31, | Change | ||||||||||||||||||||||||||
2017 | 2016 | $ | % | 2016 | 2015 | $ | % | ||||||||||||||||||||||
(in thousands) | (in thousands) | ||||||||||||||||||||||||||||
Sales and marketing | $ | 258,837 | $ | 201,204 | $ | 57,633 | 29 | % | $ | 201,204 | $ | 148,414 | $ | 52,790 | 36 | % | |||||||||||||
Percent of total revenue | 50 | % | 54 | % | 54 | % | 56 | % | |||||||||||||||||||||
Sales and marketing expenses increased $57.6 million and $52.8 million, or 29% and 36%, for 2017 and 2016, respectively. The increase in headcount on a worldwide basis and increase in revenue resulted in increased personnel-related and commissions costs of $45.7 million and $45.8 million, for 2017 and 2016, respectively. Travel expenses increased $3.8 million in 2017 and $1.1 million in 2016. Corporate and facilities expenses increased $4.5 million in 2017 and $3.3 million in 2016 due to costs related to our acquisitions and higher allocated costs as the company expanded. Marketing expenses related to lead generation, trade shows, advertising and other initiatives increased $4.1 million in 2017 and $2.3 million in 2016.
Year Ended December 31, | Change | Year Ended December 31, | Change | ||||||||||||||||||||||||||
2017 | 2016 | $ | % | 2016 | 2015 | $ | % | ||||||||||||||||||||||
(in thousands) | (in thousands) | ||||||||||||||||||||||||||||
General and administrative | $ | 52,735 | $ | 52,774 | $ | (39 | ) | — | % | $ | 52,774 | $ | 36,616 | $ | 16,158 | 44 | % | ||||||||||||
Percent of total revenue | 10 | % | 14 | % | 14 | % | 14 | % | |||||||||||||||||||||
The change in general and administrative expenses in 2017 was not material as compared to 2016. General and administrative expenses increased $16.2 million, or 44%, in 2016 as compared to 2015. Personnel-related costs increased $9.2 million and $7.5 million for 2017 and 2016, respectively, to support our continued growth as a public company and business acquisitions in 2017 and 2016. Legal expense decreased $12.9 million in 2017, and increased $8.4 million in 2016, primarily due to the timing of litigation and settlement costs related to the lawsuit and settlement with Finjan, Inc. On June 3, 2016, we executed a Confidential Patent License, Settlement and Release Agreement with Finjan, Inc. The change in fair value of acquisition-related contingent consideration liability and acquisition-related expenses decreased general and administrative expense by $0.9 million and $0.8 million for 2017, respectively, the decreases were offset by a $3.5 million increase in outside consulting and audit costs primarily due to the impending adoption of a new revenue recognition standard and implementation of a new ERP system, and a $1.3 million increase in corporate and facilities expenses.
46
Interest Expense
Year Ended December 31, | Change | Year Ended December 31, | Change | ||||||||||||||||||||||||||
2017 | 2016 | $ | % | 2016 | 2015 | $ | % | ||||||||||||||||||||||
(in thousands) | (in thousands) | ||||||||||||||||||||||||||||
Interest expense | $ | (25,597 | ) | $ | (23,538 | ) | $ | (2,059 | ) | (9 | )% | $ | (23,538 | ) | $ | (18,000 | ) | $ | (5,538 | ) | (31 | )% | |||||||
Total net interest expense increased $2.1 million in 2017, primarily due to a $2.7 million loss on conversion of convertible notes in 2017 (see Note 8 “Convertible Senior Notes” to the Consolidated Financial Statements), and a $0.9 million increase in amortization of debt issuance costs and accretion of debt discount, partially offset by a $1.4 million increase in interest income from short-term investments and cash balances.
Total net interest expense increased $5.5 million in 2016, primarily due to higher interest expense related to the issuance of the convertible senior notes in June 2015 and December 2013 and the associated interest expense, accretion of the debt discount and debt issuance costs.
Other Income (Expense), Net
Year Ended December 31, | Change | Year Ended December 31, | Change | ||||||||||||||||||||||||||
2017 | 2016 | $ | % | 2016 | 2015 | $ | % | ||||||||||||||||||||||
(in thousands) | (in thousands) | ||||||||||||||||||||||||||||
Other income (expense), net | $ | 774 | $ | (1,103 | ) | $ | 1,877 | 170 | % | $ | (1,103 | ) | $ | (1,927 | ) | $ | 824 | (43 | )% | ||||||||||
The changes in other income (expense), net for 2017 and 2016 were primarily due to U.S. Dollar translation rate changes against other currencies, in particular the Euro, the Japanese Yen, the British Pound and the Canadian Dollar.
Benefit From (Provision For) Income Taxes
Year Ended December 31, | Change | Year Ended December 31, | Change | ||||||||||||||||||||||||||
2017 | 2016 | $ | % | 2016 | 2015 | $ | % | ||||||||||||||||||||||
(in thousands) | (in thousands) | ||||||||||||||||||||||||||||
Benefit from (provision for) income taxes | $ | 9,950 | $ | (986 | ) | $ | 10,936 | (1,109 | )% | $ | (986 | ) | $ | (635 | ) | $ | (351 | ) | 55 | % | |||||||||
Total benefit from income taxes increased $10.9 million in 2017 as compared to 2016. The increase was primarily due to $12.3 million of deferred tax benefit in the U.S. related to changes in the Company’s valuation allowance resulting from the businesses acquired in 2017 and $2.0 million deferred tax benefit related to the 2017 Tax Cuts and Jobs Act (the “Tax Act”), offset by a $2.0 million increase in foreign tax expense due to an increase in spending in certain foreign subsidiaries who operate on a cost-plus basis. Total provision for income taxes increased $0.4 million in 2016 as compared to 2015. The increase is primarily due to an increase in U.S. deferred tax liabilities on goodwill related to certain taxable business acquisitions.
Quarterly Results of Operations
The following table sets forth our unaudited quarterly consolidated statements of operations data for each of the eight quarters in the period ended December 31, 2017. We have prepared the quarterly data on a basis consistent with our audited annual financial statements, including, in the opinion of management, all normal recurring adjustments necessary for the fair statement of the financial information contained in these statements. The historical results are not necessarily indicative of future results and should be read in conjunction with our consolidated financial statements and the related notes included elsewhere in this Annual Report on Form 10-K.
47
Three Months Ended | |||||||||||||||||||||||||||||||
Dec. 31, 2017 | Sept. 30, 2017 | June 30, 2017 | Mar. 31, 2017 | Dec. 31, 2016 | Sept. 30, 2016 | June 30, 2016 | Mar. 31, 2016 | ||||||||||||||||||||||||
(in thousands, except per share amounts) | |||||||||||||||||||||||||||||||
Consolidated Statements of Operations Data: | |||||||||||||||||||||||||||||||
Revenue: | |||||||||||||||||||||||||||||||
Subscription | $ | 142,366 | $ | 131,038 | $ | 118,928 | $ | 110,925 | $ | 104,082 | $ | 97,163 | $ | 87,318 | $ | 77,397 | |||||||||||||||
Hardware and services | 3,032 | 3,274 | 3,401 | 2,325 | 2,723 | 2,621 | 2,586 | 1,606 | |||||||||||||||||||||||
Total revenue | 145,398 | 134,312 | 122,329 | 113,250 | 106,805 | 99,784 | 89,904 | 79,003 | |||||||||||||||||||||||
Cost of revenue:(1) | |||||||||||||||||||||||||||||||
Subscription | 35,937 | 31,211 | 30,363 | 28,321 | 25,849 | 23,987 | 23,198 | 21,682 | |||||||||||||||||||||||
Hardware and services | 4,561 | 4,800 | 4,130 | 4,055 | 3,982 | 3,293 | 3,460 | 3,142 | |||||||||||||||||||||||
Total cost of revenue | 40,498 | 36,011 | 34,493 | 32,376 | 29,831 | 27,280 | 26,658 | 24,824 | |||||||||||||||||||||||
Gross profit | 104,900 | 98,301 | 87,836 | 80,874 | 76,974 | 72,504 | 63,246 | 54,179 | |||||||||||||||||||||||
Operating expense:(1) | |||||||||||||||||||||||||||||||
Research and development | 35,414 | 32,477 | 32,306 | 29,606 | 27,772 | 24,493 | 23,588 | 22,653 | |||||||||||||||||||||||
Sales and marketing | 69,133 | 68,518 | 62,454 | 58,732 | 54,550 | 51,467 | 48,664 | 46,523 | |||||||||||||||||||||||
General and administrative | 16,512 | 13,388 | 12,348 | 10,487 | 10,778 | 8,393 | 22,999 | 10,604 | |||||||||||||||||||||||
Total operating expense | 121,059 | 114,383 | 107,108 | 98,825 | 93,100 | 84,353 | 95,251 | 79,780 | |||||||||||||||||||||||
Operating loss | (16,159 | ) | (16,082 | ) | (19,272 | ) | (17,951 | ) | (16,126 | ) | (11,849 | ) | (32,005 | ) | (25,601 | ) | |||||||||||||||
Interest expense | (8,050 | ) | (5,733 | ) | (5,848 | ) | (5,966 | ) | (6,009 | ) | (5,920 | ) | (5,809 | ) | (5,800 | ) | |||||||||||||||
Other (expense) income, net | (110 | ) | 829 | 184 | (129 | ) | (575 | ) | (228 | ) | (302 | ) | 2 | ||||||||||||||||||
Loss before income taxes | (24,319 | ) | (20,986 | ) | (24,936 | ) | (24,046 | ) | (22,710 | ) | (17,997 | ) | (38,116 | ) | (31,399 | ) | |||||||||||||||
Benefit from (provision for) income taxes | 13,360 | (977 | ) | (999 | ) | (1,434 | ) | (174 | ) | (370 | ) | (185 | ) | (257 | ) | ||||||||||||||||
Net loss | $ | (10,959 | ) | $ | (21,963 | ) | $ | (25,935 | ) | $ | (25,480 | ) | $ | (22,884 | ) | $ | (18,367 | ) | $ | (38,301 | ) | $ | (31,656 | ) | |||||||
Net loss per share, basic and diluted | $ | (0.24 | ) | $ | (0.49 | ) | $ | (0.59 | ) | $ | (0.59 | ) | $ | (0.54 | ) | $ | (0.44 | ) | $ | (0.92 | ) | $ | (0.77 | ) | |||||||
Weighted average shares outstanding, basic and diluted | 45,424 | 44,418 | 43,890 | 43,230 | 42,616 | 42,109 | 41,605 | 41,093 | |||||||||||||||||||||||
_______________________________________________________________________________
(1) | Includes stock-based compensation expense and amortization of intangible assets as follows: |
Three Months Ended | |||||||||||||||||||||||||||||||
Dec. 31, 2017 | Sept. 30, 2017 | June 30, 2017 | Mar. 31, 2017 | Dec. 31, 2016 | Sept. 30, 2016 | June 30, 2016 | Mar. 31, 2016 | ||||||||||||||||||||||||
(in thousands) | |||||||||||||||||||||||||||||||
Stock-based compensation: | |||||||||||||||||||||||||||||||
Cost of subscription revenue | $ | 2,520 | $ | 2,876 | $ | 2,863 | $ | 2,376 | $ | 1,988 | $ | 2,080 | $ | 1,721 | $ | 1,638 | |||||||||||||||
Cost of hardware and services revenue | 492 | 493 | 469 | 439 | 374 | 375 | 392 | 353 | |||||||||||||||||||||||
Research and development | 7,991 | 7,803 | 7,744 | 7,050 | 6,844 | 6,019 | 5,877 | 5,602 | |||||||||||||||||||||||
Sales and marketing | 8,892 | 8,943 | 8,230 | 7,897 | 7,897 | 7,174 | 6,718 | 6,818 | |||||||||||||||||||||||
General and administrative | 5,350 | 5,222 | 5,198 | 4,612 | 4,439 | 4,315 | 4,000 | 4,072 | |||||||||||||||||||||||
Total stock based compensation expenses | $ | 25,245 | $ | 25,337 | $ | 24,504 | $ | 22,374 | $ | 21,542 | $ | 19,963 | $ | 18,708 | $ | 18,483 | |||||||||||||||
Amortization of intangible assets: | |||||||||||||||||||||||||||||||
Cost of subscription revenue | $ | 4,945 | $ | 3,190 | $ | 3,189 | $ | 3,188 | $ | 2,965 | $ | 2,223 | $ | 2,118 | $ | 2,117 | |||||||||||||||
Research and development | 15 | 15 | 15 | 15 | 15 | 15 | 15 | 15 | |||||||||||||||||||||||
Sales and marketing | 1,143 | 875 | 949 | 967 | 1,000 | 1,429 | 1,236 | 1,273 | |||||||||||||||||||||||
Total amortization of intangible assets | $ | 6,103 | $ | 4,080 | $ | 4,153 | $ | 4,170 | $ | 3,980 | $ | 3,667 | $ | 3,369 | $ | 3,405 | |||||||||||||||
48
The following unaudited table sets forth our consolidated results of operations data as a percentage of total revenue.
Three Months Ended | |||||||||||||||||||||||
Dec. 31, 2017 | Sept. 30, 2017 | June 30, 2017 | Mar. 31, 2017 | Dec. 31, 2016 | Sept. 30, 2016 | June 30, 2016 | Mar. 31, 2016 | ||||||||||||||||
Consolidated Statements of Operations Data: | |||||||||||||||||||||||
Revenue: | |||||||||||||||||||||||
Subscription | 98 | % | 98 | % | 97 | % | 98 | % | 97 | % | 97 | % | 97 | % | 98 | % | |||||||
Hardware and services | 2 | 2 | 3 | 2 | 3 | 3 | 3 | 2 | |||||||||||||||
Total revenue | 100 | 100 | 100 | 100 | 100 | 100 | 100 | 100 | |||||||||||||||
Cost of revenue: | |||||||||||||||||||||||
Subscription | 25 | 23 | 25 | 25 | 24 | 24 | 26 | 27 | |||||||||||||||
Hardware and services | 3 | 4 | 3 | 4 | 4 | 3 | 4 | 4 | |||||||||||||||
Total cost of revenue | 28 | 27 | 28 | 29 | 28 | 27 | 30 | 31 | |||||||||||||||
Gross profit | 72 | 73 | 72 | 71 | 72 | 73 | 70 | 69 | |||||||||||||||
Operating expense: | |||||||||||||||||||||||
Research and development | 24 | 24 | 27 | 26 | 26 | 25 | 26 | 29 | |||||||||||||||
Sales and marketing | 48 | 51 | 51 | 52 | 51 | 52 | 54 | 59 | |||||||||||||||
General and administrative | 11 | 10 | 10 | 9 | 10 | 8 | 26 | 13 | |||||||||||||||
Total operating expense | 83 | 85 | 88 | 87 | 87 | 85 | 106 | 101 | |||||||||||||||
Operating loss | (11 | ) | (12 | ) | (16 | ) | (16 | ) | (15 | ) | (12 | ) | (36 | ) | (32 | ) | |||||||
Interest expense | (6 | ) | (4 | ) | (5 | ) | (5 | ) | (6 | ) | (6 | ) | (7 | ) | (8 | ) | |||||||
Other (expense) income, net | — | 1 | — | — | — | — | — | — | |||||||||||||||
Loss before income taxes | (17 | ) | (15 | ) | (21 | ) | (21 | ) | (21 | ) | (18 | ) | (43 | ) | (40 | ) | |||||||
Benefit from (provision for) income taxes | 9 | (1 | ) | — | (1 | ) | — | — | — | — | |||||||||||||
Net loss | (8 | )% | (16 | )% | (21 | )% | (22 | )% | (21 | )% | (18 | )% | (43 | )% | (40 | )% | |||||||
Liquidity and Capital Resources
As of December 31, 2017, we had $286.1 million in cash and cash equivalents and $45.5 million in short-term investments, for a total of $331.6 million. Also refer to Note 8 “Convertible Senior Notes” to the consolidated financial statements for discussion of the Notes.
We plan to grow our customer base by continuing to emphasize investments in sales and marketing to add new customers, expand our customers’ use of our platform, and maintain high renewal rates. We also expect to incur additional cost of subscription revenue in accordance with the resulting growth in our customer base. We believe that the combination of our ongoing improvements in gross margins, the benefits of lower sales and marketing costs associated with our renewal activity, and the fact that our contracts are structured to bill our customers in advance should enable us to improve our cash flow from operations as we grow. Based on our current level of operations and anticipated growth, both of which are expected to be consistent with recent quarters, we believe that our existing sources of liquidity will be sufficient to fund our operations for at least the next 12 months. Our future capital requirements will depend on many factors, including our rate of revenue growth, the expansion of our sales and marketing activities, and the timing and extent of spending to support product development efforts and expansion into new territories, and the timing of introductions of new features and enhancements to our solutions. To the extent that existing cash and cash equivalents and cash from operations are insufficient to fund our future activities, we may need to raise additional funds through public or private equity or debt financing. We have invested, and plan to continue investing in acquiring complementary businesses, applications and technologies, and may continue to make such investments in the future, any of which could also require us to seek equity or debt financing in addition to our Notes. Additional funds may not be available on terms favorable to us or at all.
As of December 31, 2017, the amount of cash and cash equivalents held by our foreign subsidiaries was $17.6 million, including intercompany receivable balances. If these funds were needed for our operations in the United States, we would be required to withhold foreign taxes on the funds repatriated of approximately $0.5 million. We have not recorded a liability for these taxes, as it is our intention that the majority of these funds are indefinitely reinvested outside the United States and our current plans do not demonstrate a need to repatriate these funds to our United States operations.
49
Due to negative earnings and profits in our foreign subsidiaries, we have not recorded a provisional tax liability relating to the one-time mandatory transition tax imposed by the Tax Act on our accumulated foreign earnings. As the Tax Act also eliminates U.S. taxes on foreign subsidiary distributions, future earnings in foreign jurisdictions will be available for distribution to the U.S. without incremental U.S. taxes.
Cash Flows
The following table sets forth a summary of our consolidated cash flows for the periods indicated:
Years Ended December 31, | |||||||||||
2017 | 2016 | 2015 | |||||||||
(in thousands) | |||||||||||
Net cash provided by operating activities | $ | 153,686 | $ | 94,235 | $ | 46,504 | |||||
Net cash used in investing activities | $ | (190,427 | ) | $ | (89,192 | ) | $ | (102,789 | ) | ||
Net cash (used in) provided by financing activities | $ | (23,212 | ) | $ | (5,238 | ) | $ | 223,188 | |||
Net Cash Flows Provided by Operating Activities
Our net loss and cash flows from operating activities are significantly influenced by our investments in headcount and data center operations to support anticipated growth. Our cash flows are also influenced by cash payments from customers. We invoice customers for the entire contract amount at the start of the term, and as such our cash flow from operations is also affected by the length of a customer contract.
Net cash provided by operating activities was $153.7 million in 2017 as compared to $94.2 million in 2016. The increase of $59.5 million was primarily due to:
• | A $26.9 million decrease in net loss; |
• | An increase in amortization of intangible assets of $4.1 million due to acquired businesses, and an increase in depreciation of fixed assets of $6.5 million due to an increase in capital expenditures; |
• | Stock-based compensation expense increased $18.8 million due to the increase in headcount and grants made; |
• | Amortization of deferred commissions increased $3.7 million due to an increase in revenue; |
• | Loss on conversion of convertible notes increased $2.7 million due to their conversion in 2017 (see Note 8 “Convertible Senior Notes” to the Consolidated Financial Statements); |
• | An increase in accrued liabilities change of $7.5 million due to the timing of compensation and other payments; |
• | An increase in deferred revenue change of $36.3 million due to higher billings; |
• | The increase was offset by a deferred income tax expense change of $16.1 million primarily related to a $12.3 million decrease in valuation allowance due to the business acquisitions made in 2017 and $2.0 million benefit due to the U.S. 2017 Tax Cuts and Job Act, an increase in accounts receivable change of $14.8 million, an increase in deferred commissions change of $8.1 million due to higher billings, and a $5.9 million decrease in accounts payable change due to the timing of the payments. |
Net cash provided by operating activities was $94.2 million in 2016 as compared to $46.5 million in 2015. The increase of $47.7 million was primarily due to:
• | An increase in amortization of intangible assets of $2.2 million due to the acquired businesses, and an increase in depreciation of fixed assets of $4.5 million due to the increase in capital expenditure; |
• | Stock-based compensation expense increased $18.6 million due to the increase in headcount and valuation of grants made; |
• | Amortization of debt issuance costs and accretion of debt discount increased $5.9 million due to the issuance of our convertible notes in June 2015; |
• | Amortization of deferred commissions increased $11.2 million due to an increase in revenue; |
• | An increase in accounts payable change of $1.8 million due to the timing of the payments; |
50
• | An increase in deferred revenue change of $28.3 million due to higher billings; |
• | An increase in accrued liabilities change of $2.0 million due to the timing of compensation and other payments; |
• | The increase was offset by a net loss increase of $12.5 million, an increase in accounts receivable change of $5.7 million, and an increase in capitalized commissions of $6.4 million. |
Net Cash Flows Used in Investing Activities
Our primary investing activities consisted of acquisitions of businesses, capital expenditures in support of expanding our infrastructure and workforce and the purchase and sale of short-term investments. As our business grows, we expect our capital expenditures and our investment activity to continue to increase. We may also target other companies for acquisition.
Net cash used in investing activities was $190.4 million in 2017 as compared to $89.2 million in 2016. The increase in cash used of $101.2 million was due to an increase in business acquisition cost of $101.2 million, a $20.8 million decrease in maturities of short-term investments, an increase in capital expenditures of $12.6 million for infrastructure expansion and daily operations, offset by $17.9 million decrease in payments for short-term investments, $9.6 million paid to escrow account due to the Return Path acquisition in 2016, and by an increase in receipts from escrow account of $5.8 million.
Net cash used in investing activities was $89.2 million in 2016 as compared to $102.9 million in 2015. The decrease in cash used of $13.6 million was due to a $84.3 million increase in sales and maturities of short-term investments, offset by $50.1 million increase in payments for short-term investments, an increase in capital expenditures of $8.6 million for infrastructure expansion and daily operations, an increase in payments to escrow account of $9.6 million due to the Return Path acquisition, and an increase in business acquisition cost of $2.6 million.
Net Cash Flows (Used in) Provided by Financing Activities
Net cash used in financing activities was $23.2 million in 2017 as compared to $5.2 million in 2016. The increase in cash used of $18.0 million was primarily due to a $17.2 million increase in withholding taxes paid related to restricted stock unit net share settlement, a $6.1 million increase in contingent consideration payment, partially offset by a $3.9 million increase in proceeds from common stock issuance related to employee stock plans, and $1.4 million paid in 2016 to release an indemnification holdback liability incurred in connection with the Abaca Technology Corporation acquisition in July 2013.
Net cash used in financing activities was $5.2 million in 2016 as compared to cash provided of $223.2 million in 2015. The decrease of $228.4 million was primarily due to proceeds of $223.8 million from the issuance of the 0.75% Notes in June 2015 (see Note 8 to our Consolidated Financial Statements), a $7.5 million increase in withholding taxes paid related to restricted stock unit net share settlement, $1.4 million paid in 2016 to release an indemnification holdback liability incurred in connection with the Abaca Technology Corporation acquisition in July 2013, partially offset by $3.2 million increase in proceeds from common stock issuance related to employee stock plans and $0.7 million decrease in payments for equipment loans and capital lease obligations.
Contractual Obligations and Commitments
The following table summarizes our contractual obligations as of December 31, 2017 (in thousands):
Payment Due by Period | |||||||||||||||||||
Total (5) | Less Than 1 Year | 1-3 Years | 3-5 Years | More than 5 years | |||||||||||||||
Convertible senior notes(1) | $ | 230,000 | $ | — | $ | 230,000 | $ | — | $ | — | |||||||||
Interest payments(2) | 4,321 | 1,730 | 2,591 | — | — | ||||||||||||||
Capital and operating lease obligations(3) | 57,895 | 18,019 | 23,341 | 9,843 | 6,692 | ||||||||||||||
Purchase obligations(4) | 35,861 | 18,444 | 17,417 | — | — | ||||||||||||||
Total | $ | 328,077 | $ | 38,193 | $ | 273,349 | $ | 9,843 | $ | 6,692 | |||||||||
_______________________________________________________________________________
(1) | Represents the 0.75% convertible senior notes issued in June 2015. See Note 8, “Convertible Senior Notes” for further information. |
(2) | Represents interest payments on capital lease, and the 0.75% senior convertible notes. |
(3) | Consists of capital leases and contractual obligations under operating leases for office space and data centers. |
51
(4) | Consists of minimum purchase commitment of products and services. Obligations under contracts that we can cancel without a significant penalty were not included in the table above. |
(5) | As we are unable to reasonably predict the timing of settlement of liabilities related to unrecognized tax benefits, net, the table does not include $4.7 million of such non-current liabilities included in Other long-term liabilities recorded on our consolidated balance sheet as of December 31, 2017. |
Off-Balance Sheet Arrangements
During the periods presented, we did not have, nor do we currently have, any relationships with unconsolidated entities or financial partnerships, such as entities often referred to as structured finance or special purpose entities, which would have been established for the purpose of facilitating off-balance sheet arrangements or other contractually narrow or limited purposes. We are therefore not exposed to any financing, liquidity, market or credit risk that could arise if we had engaged in those types of relationships.
Under the indemnification provisions of our standard customer agreements, we agree to indemnify, defend and hold harmless our customers against, among other things, infringement of any patents, trademarks or copyrights under any country’s laws or the misappropriation of any trade secrets arising from the customer’s legal use of our solutions. Certain indemnification provisions potentially expose us to losses in excess of the aggregate amount paid to us by the customer under the applicable customer agreement. No material claims have been made against us pursuant to these indemnification provisions to date.
Critical Accounting Policies and Estimates
Our management's discussion and analysis of our financial condition and results of operations are based on our consolidated financial statements, which have been prepared in accordance with GAAP. GAAP requires us to make certain estimates and judgments that can affect the reported amounts of assets and liabilities, the disclosure of contingencies, and the reported amounts of revenue and expenses. We base our estimates on historical experience and on various other assumptions that we believe to be reasonable under the circumstances, the results of which form the basis for making judgments about the carrying values of assets and liabilities. If actual results or events differ materially from those contemplated by us in making these estimates, our reported financial condition and results of operations for future periods could be materially affected. See "Risk Factors" for certain matters that may affect our future financial condition or results of operations. An accounting policy is deemed to be critical if it requires an accounting estimate to be made based on assumptions about matters that are uncertain at the time the estimate is made, if different estimates reasonably could have been used, or if the changes in estimate that are reasonably likely to occur could materially impact the financial statements.
Our significant accounting policies, including those considered to be critical accounting policies, are summarized in Note 1 “The Company and Summary of Significant Accounting Policies” to the accompanying consolidated financial statements in this report. The following critical accounting policies reflect significant judgments and estimates used in the preparation of our consolidated financial statements:
• | Revenue recognition; |
• | Deferred commissions; |
• | Stock-based compensation expense; |
• | Fair value of assets acquired and liabilities assumed in business combinations; |
• | Impairment assessment of goodwill, intangible assets and other long-lived assets |
• | Loss contingencies; and |
• | Recognition and measurement of current and deferred income taxes. |
Revenue Recognition
We derive our revenue primarily from two sources: (1) subscription revenue for rights related to the use of our software and security-as-a-service platform and (2) hardware, training, and professional services revenue provided to customers related to their use of our platform. Subscription revenue is derived from a subscription-based enterprise licensing model with contract terms typically ranging from one to three years, and consists of (i) subscription fees from the licensing of our software and security-as-a-service platform, (ii) subscription fees for access to the on-demand elements of our platform and (iii) subscription fees for the right to access our customer support services.
Revenue is recognized when all of the following criteria have been met:
52
• | Persuasive evidence of an arrangement exists; |
• | Delivery has occurred or services have been rendered; |
• | Sales price is fixed or determinable; and |
• | Collectability is reasonably assured. |
We generate sales directly through our sales team and, to a growing extent, through our channel partners. Sales to channel partners are made at a discount and revenues are recorded at this discounted price once all revenue recognition criteria are met. Channel partners generally receive an order from an end-customer prior to placing an order with us, and these partners do not carry any inventory of our products or solutions. Payment from channel partners is not contingent on the partner’s success in sales to end-customers. In the event that we offer rebates, joint marketing funds, or other incentive programs to a partner, recorded revenues are reduced by these amounts accordingly.
We apply industry-specific software revenue recognition guidance to transactions involving the licensing of software, as well as related support, training, and other professional services. Software revenue recognition guidance requires revenue earned on software arrangements involving multiple elements such as software license, support, training, and other professional services to be allocated to each element based on the relative fair values of these elements. The fair value of an element must be based on vendor-specific objective evidence ("VSOE") of fair value. VSOE of fair value of each element is based on the price charged when the element is sold separately.
We have analyzed all of the elements included in our multiple element software arrangements and have determined that we do not have sufficient VSOE of fair value to allocate revenue to our software license agreements, support, training, and professional services. We defer all revenue under the arrangement until the commencement of the subscription services and any associated professional services. Once the subscription services and the associated professional services have commenced, the entire fee from the arrangement is recognized ratably over the remaining period of the arrangement. If the professional services are essential to the functionality of the subscription, then the revenue recognition does not commence until such services are completed.
Our arrangements typically include subscription services to our security-as-a-service platform. These hosted on demand service arrangements do not provide customers with the right to take possession of the software supporting the hosted services. Certain arrangements also include the sale of hardware appliances. Revenue from hardware appliances containing software components and hardware components that function together to deliver the hardware appliance’s essential functionality is excluded from the scope of the industry specific revenue recognition guidance. We recognize revenue from our hosted on demand services in accordance with general revenue recognition accounting guidance. Only revenue derived from the licensing of the software is recognized in accordance with the industry specific revenue guidance.
When a sales arrangement contains multiple elements, such as hardware appliances, subscription services, customer support services, and/or professional services, we allocate revenue to each element based on a selling price hierarchy. In multiple element arrangements, revenue is allocated to each separate unit of accounting using the relative selling prices of each of the deliverables in the arrangement based on the selling price hierarchy. An element constitutes a separate unit of accounting when the delivered item has standalone value and delivery of the undelivered element is probable and within our control. When applying the relative selling price method, we determine the selling price for each deliverable using VSOE of selling price. If VSOE does not exist, we use third-party evidence (“TPE”) of selling price. If neither VSOE nor TPE of selling price exist for a deliverable, we use our best estimate of selling price (“BESP”) for that deliverable. Revenue allocated to each element is then recognized when the basic revenue recognition criteria are met for each element. We determine BESP for an individual element within a multiple element revenue arrangement using the same methods utilized to determine the selling price of an element sold on a standalone basis. We estimate the selling price for our subscription solutions by considering internal factors such as historical pricing practices and we estimate the selling price of our hardware and other services using a combination of our historical costs paired with external measurements regarding the pricing of similar products and services in similar industries.
Hardware appliance revenue is recognized upon shipment. Subscription and support revenue are recognized over the contract period commencing on the start date of the contract. Professional services and training, when sold with hardware appliances or subscription and support services, are accounted for separately when those services have standalone value. In determining whether professional services and training services can be accounted for separately from subscription and support services, we consider the following factors: availability of the services from other vendors, the nature of the services, and the dependence of the subscription services on the customer’s decision to buy the professional services. If professional
53
services and training do not qualify for separate accounting, we recognize the professional services and training ratably over the contract term of the subscription services.
Delivery generally occurs when the hardware appliance is delivered to a common carrier freight on board shipping point by us or the hosted service has been activated and communicated to the customer accordingly. Our fees are typically considered to be fixed or determinable at the inception of an arrangement and are negotiated at the outset of an arrangement, generally based on specific products and quantities to be delivered. In the event payment terms are provided that differ significantly from our standard business practices, the fees are deemed to not be fixed or determinable and revenue is recognized as the fees become paid.
We assess collectability based on a number of factors, including credit worthiness of the customer and past transaction history of the customer. Through December 31, 2017, we have not experienced any material credit losses.
Deferred Commissions
Deferred commissions are the direct and incremental selling costs that are associated with our customer contracts and consist of sales commissions paid to our direct sales force and referral fees paid to independent third-parties. The commissions are amortized to sales and marketing expense over the non-cancelable terms of the related contracts with our customers. The commissions payments, which are paid in full the month after the customer’s service commences, are a direct and incremental cost of the revenue arrangements. Direct sales commissions are deferred when earned and amortized over the same period that revenues are recognized for the related non-cancelable contract. We believe this is the preferable method of accounting as the commission charges are so closely related to the revenue from the non-cancelable customer contracts that they should be recorded as an asset and charged to expense over the same period that the related revenue is recognized.
Stock-Based Compensation Expense
We use the Black-Scholes option valuation model to estimate the fair value of stock options and ESPP shares. This valuation model requires the input of highly subjective assumptions, the most significant of which is our estimates of expected volatility and the expected term of the award.
Starting January 1, 2016, the expected volatility of our common stock is based on the Company’s historical volatility. Prior to January 1, 2016, the common stock price volatility was determined based on the historical average volatilities of the common stock of a group of publicly-traded peer companies that operated in a similar industry as the Company did not have sufficient trading history for its common stock.
The expected life of options granted has been determined utilizing the “simplified” method as permitted by the SEC. The risk-free interest rate is based on a daily treasury yield curve rate whose term is consistent with the expected life of the stock options. We have not, historically, paid and, in the future, do not anticipate paying cash dividends on our shares of common stock and therefore, the expected dividend yield is assumed to be zero.
During the year ended December 31, 2017, the Company adopted Accounting Standards Update 2016-09 and elected to account for forfeitures as they occur. Refer to Accounting Pronouncements Adopted in 2017 in Note 2 “The Company and Summary of Significant Accounting Policies” to the consolidated financial statements for changes in the accounting for stock-based compensation expense.
Fair Value of Assets Acquired and Liabilities Assumed in Business Combinations
In each of our acquisitions, we used the purchase method of accounting which requires us to allocate the fair value of the total consideration transferred to tangible and identifiable intangible assets acquired and liabilities assumed based on their estimated fair values on the date of the acquisition, with the difference between the net assets acquired and the total consideration transferred recorded as goodwill. The fair values assigned, defined as the price that would be received to sell an asset or paid to transfer a liability in an orderly transaction between willing market participants, are based on significant estimates and assumptions determined by management. These estimates and assumptions are inherently uncertain and subject to refinement, as a result, during the adjustment period, which may be up to one year from the acquisition date, we may record adjustments to the assets acquired or liabilities assumed with any corresponding offset to goodwill. Upon conclusion of the measurement period or final determination of the values of assets acquired or liabilities assumed, whichever comes first, any subsequent adjustments are recorded within our consolidated statements of operations.
We used either the discounted cash flow method or the replacement cost method to assign fair values to acquired identifiable intangible assets. This method requires significant management judgment to forecast future operating results and
54
establish residual growth rates and discount factors. These models are based on reasonable estimates and assumptions given available facts and circumstances, including industry estimates and averages, as of the acquisition dates and are consistent with the plans and estimates that we use to manage our business. If the subsequent actual results and updated projections of the underlying business activity change compared with the estimates and assumptions used to develop these values, we could experience impairment charges. In addition, we have estimated the economic lives of certain acquired assets and these lives are used to calculate depreciation and amortization expense. If our estimates of the economic lives change, depreciation or amortization expenses could be accelerated or slowed.
Accounting for business combinations requires our management to make significant estimates and assumptions, especially at the acquisition date including our estimates for intangible assets, contractual obligations assumed, restructuring liabilities, pre-acquisition contingencies and contingent consideration, where applicable. Although we believe the assumptions and estimates we have made in the past have been reasonable and appropriate, they are based in part on historical experience and information obtained from the management of the acquired companies and are inherently uncertain.
Examples of critical estimates in valuing certain of the intangible assets we have acquired include but are not limited to:
• | future expected cash flows from our revenue streams; |
• | cost to build the acquired technology; |
• | the acquired company’s brand and competitive position, as well as assumptions about the period of time the acquired brand will continue to be used in the combined company’s product portfolio; and |
• | discount rates. |
Unanticipated events and circumstances may occur that may affect the accuracy or validity of such assumptions, estimates or actual results.
For a given acquisition, we may identify certain pre-acquisition contingencies as of the acquisition date and may extend our review and evaluation of these pre-acquisition contingencies throughout the measurement period in order to obtain sufficient information to assess whether we include these contingencies as a part of the fair value estimates of assets acquired and liabilities assumed and, if so, to determine their estimated amounts.
If we cannot reasonably determine the fair value of a pre-acquisition contingency (non-income tax related) by the end of the measurement period, which is generally the case given the nature of such matters, we will recognize an asset or a liability for such pre-acquisition contingency if: (i) it is probable that an asset existed or a liability had been incurred at the acquisition date and (ii) the amount of the asset or liability can be reasonably estimated. Subsequent to the measurement period, changes in our estimates of such contingencies will affect earnings and could have a material effect on our results of operations and financial position.
In addition, uncertain tax positions and tax related valuation allowances assumed in connection with a business combination are initially estimated as of the acquisition date. We reevaluate these items quarterly based upon facts and circumstances that existed as of the acquisition date with any adjustments to our preliminary estimates being recorded to goodwill if identified within the measurement period. Subsequent to the measurement period or our final determination of the tax allowance’s or contingency’s estimated value, whichever comes first, changes to these uncertain tax positions and tax related valuation allowances will affect our provision for income taxes in our consolidated statements of operations and could have a material impact on our results of operations and financial position.
Goodwill, Intangible Assets and Other Long-Lived Assets - Impairment Assessments
We review goodwill for impairment annually and whenever events or changes in circumstances indicate its carrying value may not be recoverable. For the purposes of impairment testing, we have determined that we have one reporting unit. We perform the two-step impairment test, whereby we compare the fair value of the reporting unit to its carrying value. If the fair value of the reporting unit exceeds the carrying value of the net assets assigned to that unit, goodwill is not considered impaired and we are not required to perform further testing. If the carrying value of the net assets assigned to the reporting unit exceeds the fair value of the reporting unit, then we must perform the second step of the impairment test in order to determine the implied fair value of the reporting unit’s goodwill. If the carrying value of a reporting unit’s goodwill exceeds its implied fair value, then we would record impairment loss equal to the difference. No impairment has been noted to date.
55
We periodically review the carrying amounts of intangible assets and other long-lived assets for impairment whenever events or changes in circumstances indicate that the carrying value of these assets may not be recoverable. We measure the recoverability of these assets by comparing the carrying amount of such assets (or asset group) to the future undiscounted cash flow we expect the assets (or asset group) to generate. If we consider any of these assets to be impaired, the impairment to be recognized equals the amount by which the carrying value of the assets exceeds its fair value. We make judgments about the recoverability of purchased intangible assets whenever events or changes in circumstances indicate that impairment may exist.
Each period we evaluate the estimated remaining useful lives of intangible assets and other long-lived assets to assess whether a revision to the remaining periods of amortization is required. Assumptions and estimates about remaining useful lives of our intangible and other long-lived assets are subjective. They can be affected by a variety of factors, including external factors such as industry and economic trends and internal factors such as changes in our business strategy. Although we believe the historical assumptions and estimates we have made are reasonable and appropriate, different assumptions and estimates could materially impact our reported financial results. We did not recognize any intangible asset impairment charges to date.
Loss contingencies
We evaluate contingent liabilities including threatened or pending litigation in accordance with the authoritative guidance on contingencies. We assess the likelihood of any adverse judgments or outcomes from potential claims or legal proceedings, as well as potential ranges of probable losses, when the outcomes of the claims or proceedings are probable and reasonably estimable. A determination of the amount of accrued liabilities required, if any, for these contingencies is made after the analysis of each separate matter. Because of uncertainties related to these matters, we base our estimates on the information available at the time of our assessment. As additional information becomes available, we reassess the potential liability related to our pending claims and litigation and may revise our estimates. Any revisions in the estimates of potential liabilities could have a material impact on our operating results and financial position.
Income Taxes
We determine our current and deferred tax provisions based on estimates and assumptions that could differ from the actual results reflected in our income tax returns filed during the subsequent year. We record adjustments based on filed returns when we have identified and finalized them, which is generally in the fourth quarters of the subsequent year for U.S. federal and state provisions, respectively. We have placed a full valuation allowance on all net U.S. deferred tax assets because realization of these tax benefits through future taxable income cannot be reasonably assured. We intend to maintain the valuation allowance until sufficient positive evidence exists to support the reversal of the valuation allowance. Any decision to reverse part or all of the valuation allowance would be based on our estimate of future profitability. If our estimate were to be wrong, we could be required to charge potentially significant amounts to income tax expense to establish a new valuation allowance.
Our effective tax rate includes the impact of certain undistributed foreign earnings for which we partially provided taxes because we plan to reinvest majority of such earnings indefinitely outside the United States. We plan foreign earnings remittance amounts based on projected cash flow needs as well as the working capital and long-term investment requirements of our foreign subsidiaries and our domestic operations. Material changes in our estimates of cash, working capital and long-term investment requirements in the various jurisdictions in which we do business could impact our effective tax rate. We are subject to income taxes in the United States and certain foreign countries, and we are subject to corporate income tax audits in some of these jurisdictions. We believe that our tax return positions are fully supported, but tax authorities are likely to challenge certain positions, which may not be fully sustained. However, our income tax expense includes amounts intended to satisfy income tax assessments that result from these challenges. Determining the income tax expense for these potential assessments and recording the related assets and liabilities requires management judgments and estimates. We evaluate our uncertain tax positions in accordance with the guidance for accounting for uncertainty in income taxes. We believe that our liability for uncertain tax positions is adequate. We review our liability for uncertain tax positions quarterly, and we may adjust such liability because of proposed assessments by tax authorities, changes in facts and circumstances, issuance of new regulations or new case law, previously unavailable information obtained during the course of an examination, negotiations between tax authorities of different countries concerning our transfer prices, or the expiration of statutes of limitations.
Recent Accounting Pronouncements
Refer to Note 1 of the notes to our consolidated financial statements in Part II, Item 8 of this Annual Report on Form 10-K for a full description of recent accounting pronouncements.
56
Item 7A. QUANTITATIVE AND QUALITATIVE DISCLOSURES ABOUT MARKET RISK
We have operations both within the United States and internationally, and we are exposed to market risks in the ordinary course of our business. These risks primarily include interest rate, foreign exchange and inflation risks, as well as risks relating to changes in the general economic conditions in the countries where we conduct business. To reduce certain of these risks, we monitor the financial condition of our large clients and limit credit exposure by collecting in advance and setting credit limits as we deem appropriate. In addition, our investment strategy has been to invest in financial instruments that are highly liquid and readily convertible into cash. To date, we have not used derivative instruments to mitigate the impact of our market risk exposures. We have also not used, nor do we intend to use, derivatives for trading or speculative purposes.
Interest Rate Risk
We are exposed to market risk related to changes in interest rates. Our investments primarily consist of money market funds, corporate debt securities, commercial papers, U.S. agency and Treasury securities, and certificates of deposit. As of December 31, 2017, we had cash, cash equivalents, and short-term investments of $331.6 million. The carrying amount of our cash equivalents and short-term investments reasonably approximates fair value, due to the short maturities of these investments. The primary objectives of our investment activities are the preservation of capital, the fulfillment of liquidity needs and the fiduciary control of cash and investments. We do not enter into investments for trading or speculative purposes. Our investments are exposed to market risk due to a fluctuation in interest rates, which may affect our interest income and the fair market value of our investments. Due to the short-term nature of our investment portfolio, we believe only dramatic fluctuations in interest rates would have a material effect on our investments. We do not believe that an immediate 10% increase in interest rates would have a material effect on the fair market value of our portfolio. As such we do not expect our operating results or cash flows to be materially affected by a sudden change in market interest rates.
As of December 31, 2017, we had an outstanding balance of $230.0 million aggregate principal amount of the Notes (see Note 8 “Convertible Senior Notes” to our Consolidated Financial Statements). We carry the Notes at face value, less relative fair value of conversion options allocated to equity and unamortized discounts, on our accompanying Consolidated Balance Sheets. Since these Notes bear interest at fixed rates, we have no financial statement risk associated with changes in interest rates. However, the fair value of these Notes fluctuates as interest rate changes when the market price of our common stock fluctuates.
Foreign Currency Risk
The functional currency for our wholly owned foreign subsidiaries is the U.S. dollar. Accordingly, the subsidiaries remeasure monetary assets and liabilities at period-end exchange rates, while nonmonetary items are remeasured at historical rates. Income and expense accounts are remeasured at the average exchange rates in effect during the year. Remeasurement adjustments are recognized in the consolidated statements of operations as foreign currency transaction gains or losses in the year of occurrence. Aggregate foreign currency transaction gains (losses) included in determining net loss were $0.6 million, $(0.9) million and $(1.7) million for 2017, 2016 and 2015, respectively. Transaction gains and losses are included in other expense, net.
As our international operations grow, our risks associated with fluctuation in currency rates will become greater, and we will continue to reassess our approach to managing this risk. In addition, currency fluctuations or a weakening U.S. dollar can increase the costs of our international expansion. For our operating results and cash flows, we evaluated the effects of a 10% shift in exchange rates between those currencies and the U.S. dollar. We have determined that there would not be a material effect on our results of operations from such a shift. To date, we have not entered into any foreign currency hedging contracts, since exchange rate fluctuations have not had a material impact on our operating results and cash flows. Based on our current international structure, we do not plan on engaging in hedging activities in the near future.
Inflation Risk
We do not believe that inflation has had a material effect on our business, financial condition or results of operations. Nonetheless, if our costs were to become subject to significant inflationary pressures, we may not be able to fully offset such higher costs through price increases. Our inability or failure to do so could harm our business, financial condition and results of operations.
57
ITEM 8. FINANCIAL STATEMENTS AND SUPPLEMENTARY DATA
The information in response to this item is included in our consolidated financial statements, together with the report thereon of PricewaterhouseCoopers LLP, appearing in Item 15 of this Annual Report on Form 10-K, and in Item 7 under the heading Management’s Discussion and Analysis of Financial Condition and Results of Operations.
ITEM 9. CHANGES IN AND DISAGREEMENTS WITH ACCOUNTANTS ON ACCOUNTING AND FINANCIAL DISCLOSURE
None.
ITEM 9A. CONTROLS AND PROCEDURES
Evaluation of Disclosure Controls and Procedures
Regulations under the Securities Exchange Act of 1934, or the Exchange Act, require public companies, including us, to maintain “disclosure controls and procedures,” which are defined in Rule 13a-15(e) and Rule 15d-15(e) to mean a company’s controls and other procedures that are designed to ensure that information required to be disclosed in the reports that it files or submits under the Exchange Act is recorded, processed, summarized and reported, within the time periods specified in the SEC’s rules and forms. Disclosure controls and procedures include, without limitation, controls and procedures designed to ensure that information required to be disclosed in our reports that we file or submit under the Exchange Act is accumulated and communicated to management, including our Chief Executive Officer and Chief Financial Officer, as appropriate to allow timely decisions regarding required disclosures. Our management, with the participation of our Chief Executive Officer and Chief Financial Officer, evaluated the effectiveness of the Company’s disclosure controls and procedures as of December 31, 2017. Based on their evaluation, as of December 31, 2017, our Chief Executive Officer and Chief Financial Officer have concluded that the Company’s disclosure controls and procedures were effective.
Management’s Annual Report on Internal Control over Financial Reporting
Our management is responsible for establishing and maintaining adequate internal control over financial reporting, as such term is defined in Exchange Act Rule 13a-15(f) and Rule 15d-15(f). Our management, including our Chief Executive Officer and Chief Financial Officer, conducted an evaluation of the effectiveness of our internal control over financial reporting based on the framework in Internal Control - Integrated Framework (2013) issued by the Committee of Sponsoring Organizations of the Treadway Commission. Based on its evaluation under the framework in Internal Control - Integrated Framework (2013), our management concluded that our internal control over financial reporting was effective as of December 31, 2017.
Management’s assessment of the effectiveness of our internal control over financial reporting as of December 31, 2017 excluded Cloudmark, Inc., which was acquired by Proofpoint on November 21, 2017. Excluded assets of Cloudmark, Inc. as of December 31, 2017 represent approximately 1.5% of our total consolidated assets, and Cloudmark Inc.’s revenues for the period from November 21, 2017 through December 31, 2017 represent approximately 1% of our total consolidated revenues.
The effectiveness of our internal control over financial reporting as of December 31, 2017, has been audited by PricewaterhouseCoopers LLP, an independent registered public accounting firm, as stated in their report which appears in Item 15(a) of this Annual Report on Form 10-K.
Changes in Internal Control
There have been no changes in our internal control over financial reporting during the quarter ended December 31, 2017 that materially affected, or are reasonably likely to materially affect, our internal control over financial reporting.
Inherent Limitations on Effectiveness of Controls
Management does not expect that our disclosure controls and procedures or our internal control over financial reporting will prevent or detect all error and fraud. Any control system, no matter how well designed and operated, is based upon certain assumptions and can provide only reasonable, not absolute, assurance that its objectives will be met. Further, no evaluation of controls can provide absolute assurance that misstatements due to error or fraud will not occur or that all control issues and instances of fraud, if any, within the Company have been detected.
58
ITEM 9B. OTHER INFORMATION
None.
59
PART III
ITEM 10. DIRECTORS, EXECUTIVE OFFICERS AND CORPORATE GOVERNANCE
The information required by this item will be set forth in the definitive Proxy Statement for our 2018 Annual Meeting of Stockholders (the “Proxy Statement”) and is incorporated into this report by reference.
ITEM 11. EXECUTIVE COMPENSATION
The information required by this item will be set forth in the Proxy Statement and is incorporated into this report by reference.
ITEM 12. SECURITY OWNERSHIP OF CERTAIN BENEFICIAL OWNERS AND MANAGEMENT AND RELATED STOCKHOLDER MATTERS
The information required by this item will be set forth in the Proxy Statement and is incorporated into this report by reference.
ITEM 13. CERTAIN RELATIONSHIPS AND RELATED TRANSACTIONS, AND DIRECTOR INDEPENDENCE
The information required by this item will be set forth in the Proxy Statement and is incorporated into this report by reference.
ITEM 14. PRINCIPAL ACCOUNTING FEES AND SERVICES
The information required by this item will be set forth in the Proxy Statement and is incorporated into this report by reference.
60
PART IV
ITEM 15. EXHIBITS, FINANCIAL STATEMENT SCHEDULES
(a)
(1) Financial Statements
INDEX TO CONSOLIDATED FINANCIAL STATEMENTS
Page | |
(2) Financial Statement Schedules
Financial statement schedules have been omitted because they are not required, not applicable, not present in amounts sufficient to require submission of the schedule, or the required information is shown in the Consolidated Financial Statements or Notes thereto.
(3) Exhibits
The information required by this Item is set forth in the Exhibits Index that precedes the signature page of this Annual Report on Form 10-K.
61
REPORT OF INDEPENDENT REGISTERED PUBLIC ACCOUNTING FIRM
To the Board of Directors and Stockholders of Proofpoint, Inc.
Opinions on the Financial Statements and Internal Control over Financial Reporting
We have audited the accompanying consolidated balance sheets of Proofpoint, Inc. and its subsidiaries as of December 31, 2017 and 2016, and the related consolidated statements of operations, comprehensive loss, stockholders’ equity and cash flows for each of the three years in the period ended December 31, 2017, including the related notes (collectively referred to as the “consolidated financial statements”). We also have audited the Company's internal control over financial reporting as of December 31, 2017, based on criteria established in Internal Control - Integrated Framework (2013) issued by the Committee of Sponsoring Organizations of the Treadway Commission (COSO).
In our opinion, the consolidated financial statements referred to above present fairly, in all material respects, the financial position of the Company as of December 31, 2017 and 2016, and the results of its operations and its cash flows for each of the three years in the period ended December 31, 2017 in conformity with accounting principles generally accepted in the United States of America. Also in our opinion, the Company maintained, in all material respects, effective internal control over financial reporting as of December 31, 2017, based on criteria established in Internal Control - Integrated Framework (2013) issued by the COSO.
Change in Accounting Principle
As discussed in Note 1 to the consolidated financial statements, the Company changed the manner in which it accounts for share-based payments in 2017.
Basis for Opinions
The Company's management is responsible for these consolidated financial statements, for maintaining effective internal control over financial reporting, and for its assessment of the effectiveness of internal control over financial reporting, included in Management's Annual Report on Internal Control over Financial Reporting appearing under Item 9A. Our responsibility is to express opinions on the Company’s consolidated financial statements and on the Company's internal control over financial reporting based on our audits. We are a public accounting firm registered with the Public Company Accounting Oversight Board (United States) ("PCAOB") and are required to be independent with respect to the Company in accordance with the U.S. federal securities laws and the applicable rules and regulations of the Securities and Exchange Commission and the PCAOB.
We conducted our audits in accordance with the standards of the PCAOB. Those standards require that we plan and perform the audits to obtain reasonable assurance about whether the consolidated financial statements are free of material misstatement, whether due to error or fraud, and whether effective internal control over financial reporting was maintained in all material respects.
Our audits of the consolidated financial statements included performing procedures to assess the risks of material misstatement of the consolidated financial statements, whether due to error or fraud, and performing procedures that respond to those risks. Such procedures included examining, on a test basis, evidence regarding the amounts and disclosures in the consolidated financial statements. Our audits also included evaluating the accounting principles used and significant estimates made by management, as well as evaluating the overall presentation of the consolidated financial statements. Our audit of internal control over financial reporting included obtaining an understanding of internal control over financial reporting, assessing the risk that a material weakness exists, and testing and evaluating the design and operating effectiveness of internal control based on the assessed risk. Our audits also included performing such other procedures as we considered necessary in the circumstances. We believe that our audits provide a reasonable basis for our opinions.
As described in Management’s Annual Report on Internal Control over Financial Reporting, management has excluded Cloudmark, Inc. from its assessment of internal control over financial reporting as of December 31, 2017 because it was acquired by the Company in a purchase business combination during 2017. We have also excluded Cloudmark, Inc. from our audit of internal control over financial reporting. Cloudmark, Inc. is a wholly-owned subsidiary whose total assets and total revenues excluded from management’s assessment and our audit of internal control over financial reporting represent approximately 1.5% and 1%, respectively, of the related consolidated financial statement amounts as of and for the year ended December 31, 2017.
62
Definition and Limitations of Internal Control over Financial Reporting
A company’s internal control over financial reporting is a process designed to provide reasonable assurance regarding the reliability of financial reporting and the preparation of financial statements for external purposes in accordance with generally accepted accounting principles. A company’s internal control over financial reporting includes those policies and procedures that (i) pertain to the maintenance of records that, in reasonable detail, accurately and fairly reflect the transactions and dispositions of the assets of the company; (ii) provide reasonable assurance that transactions are recorded as necessary to permit preparation of financial statements in accordance with generally accepted accounting principles, and that receipts and expenditures of the company are being made only in accordance with authorizations of management and directors of the company; and (iii) provide reasonable assurance regarding prevention or timely detection of unauthorized acquisition, use, or disposition of the company’s assets that could have a material effect on the financial statements.
Because of its inherent limitations, internal control over financial reporting may not prevent or detect misstatements. Also, projections of any evaluation of effectiveness to future periods are subject to the risk that controls may become inadequate because of changes in conditions, or that the degree of compliance with the policies or procedures may deteriorate.
/s/ PricewaterhouseCoopers LLP
San Jose, California
February 23, 2018
We have served as the Company’s auditor since 2008, which includes periods before the Company became subject to SEC reporting requirements.
63
Proofpoint, Inc.
Consolidated Balance Sheets
(in thousands, except per share amounts)
At December 31, | |||||||
2017 | 2016 | ||||||
Assets | |||||||
Current assets: | |||||||
Cash and cash equivalents | $ | 286,072 | $ | 345,426 | |||
Short-term investments | 45,526 | 51,325 | |||||
Accounts receivable, net | 109,325 | 72,951 | |||||
Inventory | 730 | 598 | |||||
Deferred product costs | 1,541 | 1,829 | |||||
Deferred commissions | 27,144 | 21,168 | |||||
Prepaid expenses and other current assets | 18,669 | 17,498 | |||||
Total current assets | 489,007 | 510,795 | |||||
Property and equipment, net | 73,617 | 52,523 | |||||
Deferred product costs | 259 | 310 | |||||
Goodwill | 297,704 | 167,270 | |||||
Intangible assets, net | 95,602 | 61,708 | |||||
Long-term deferred commissions | 5,811 | 4,496 | |||||
Other assets | 12,813 | 4,558 | |||||
Total assets | $ | 974,813 | $ | 801,660 | |||
Liabilities and Stockholders’ Equity | |||||||
Current liabilities: | |||||||
Accounts payable | $ | 12,271 | $ | 15,297 | |||
Accrued liabilities | 63,926 | 50,765 | |||||
Capital lease obligations | 34 | 32 | |||||
Deferred rent | 586 | 409 | |||||
Deferred revenue | 381,915 | 259,109 | |||||
Total current liabilities | 458,732 | 325,612 | |||||
Convertible senior notes | 197,858 | 366,541 | |||||
Long-term capital lease obligations | 55 | 91 | |||||
Long-term deferred rent | 4,102 | 2,413 | |||||
Other long-term liabilities | 11,069 | 9,008 | |||||
Long-term deferred revenue | 69,873 | 53,072 | |||||
Total liabilities | 741,689 | 756,737 | |||||
Commitments and contingencies (Note 7) | |||||||
Stockholders’ equity: | |||||||
Convertible preferred stock, $0.0001 par value; 5,000 shares authorized; no shares issued and outstanding as of December 31, 2017 and 2016 | — | — | |||||
Common stock, $0.0001 par value; 200,000 shares authorized; 50,325 and 43,015 shares issued and outstanding at December 31, 2017 and December 31, 2016, respectively | 5 | 4 | |||||
Additional paid-in capital | 787,572 | 514,034 | |||||
Accumulated other comprehensive loss | (9 | ) | (7 | ) | |||
Accumulated deficit | (554,444 | ) | (469,108 | ) | |||
Total stockholders’ equity | 233,124 | 44,923 | |||||
Total liabilities and stockholders’ equity | $ | 974,813 | $ | 801,660 | |||
The accompanying notes are an integral part of these consolidated financial statements.
64
Proofpoint, Inc.
Consolidated Statements of Operations
(in thousands, except per share amounts)
Year Ended December 31, | |||||||||||
2017 | 2016 | 2015 | |||||||||
Revenue: | |||||||||||
Subscription | $ | 503,257 | $ | 365,960 | $ | 257,329 | |||||
Hardware and services | 12,032 | 9,536 | 8,068 | ||||||||
Total revenue | 515,289 | 375,496 | 265,397 | ||||||||
Cost of revenue:(1)(2) | |||||||||||
Subscription | 125,832 | 94,716 | 71,746 | ||||||||
Hardware and services | 17,546 | 13,877 | 12,312 | ||||||||
Total cost of revenue | 143,378 | 108,593 | 84,058 | ||||||||
Gross profit | 371,911 | 266,903 | 181,339 | ||||||||
Operating expense:(1)(2) | |||||||||||
Research and development | 129,803 | 98,506 | 74,459 | ||||||||
Sales and marketing | 258,837 | 201,204 | 148,414 | ||||||||
General and administrative | 52,735 | 52,774 | 36,616 | ||||||||
Total operating expense | 441,375 | 352,484 | 259,489 | ||||||||
Operating loss | (69,464 | ) | (85,581 | ) | (78,150 | ) | |||||
Interest expense | (25,597 | ) | (23,538 | ) | (18,000 | ) | |||||
Other income (expense), net | 774 | (1,103 | ) | (1,927 | ) | ||||||
Loss before income taxes | (94,287 | ) | (110,222 | ) | (98,077 | ) | |||||
Benefit from (provision for) income taxes | 9,950 | (986 | ) | (635 | ) | ||||||
Net loss | $ | (84,337 | ) | $ | (111,208 | ) | $ | (98,712 | ) | ||
Net loss per share, basic and diluted | $ | (1.91 | ) | $ | (2.66 | ) | $ | (2.48 | ) | ||
Weighted average shares outstanding, basic and diluted | 44,258 | 41,859 | 39,787 | ||||||||
(1) Includes stock-based compensation expense as follows: | |||||||||||
Cost of subscription revenue | $ | 10,635 | $ | 7,427 | $ | 5,028 | |||||
Cost of hardware and services revenue | $ | 1,893 | $ | 1,494 | $ | 1,098 | |||||
Research and development | $ | 30,588 | $ | 24,342 | $ | 20,672 | |||||
Sales and marketing | $ | 33,962 | $ | 28,607 | $ | 21,511 | |||||
General and administrative | $ | 20,382 | $ | 16,826 | $ | 11,785 | |||||
(2) Includes intangible amortization expense as follows: | |||||||||||
Cost of subscription revenue | $ | 14,512 | $ | 9,423 | $ | 7,079 | |||||
Research and development | $ | 60 | $ | 60 | $ | 91 | |||||
Sales and marketing | $ | 3,934 | $ | 4,938 | $ | 5,074 | |||||
General and administrative | $ | — | $ | — | $ | 12 | |||||
The accompanying notes are an integral part of these consolidated financial statements.
65
Proofpoint, Inc.
Consolidated Statements of Comprehensive Loss
(In thousands)
Year Ended December 31, | |||||||||||
2017 | 2016 | 2015 | |||||||||
Net loss | $ | (84,337 | ) | $ | (111,208 | ) | $ | (98,712 | ) | ||
Other comprehensive income (loss), net of tax: | |||||||||||
Unrealized (losses) gains on investments, net | (2 | ) | 16 | 4 | |||||||
Comprehensive loss | $ | (84,339 | ) | $ | (111,192 | ) | $ | (98,708 | ) | ||
The accompanying notes are an integral part of these consolidated financial statements.
66
Proofpoint, Inc.
Consolidated Statements of Stockholders’ Equity
(in thousands)
Common Stock | Additional Paid-In Capital | Accumulated Other Comprehensive Income (Loss) | Accumulated Deficit | Total Stockholders’ Equity | ||||||||||||||||||
Shares | Amount | |||||||||||||||||||||
Balances at December 31, 2014 | 38,665 | $ | 4 | $ | 330,744 | $ | (27 | ) | $ | (259,188 | ) | $ | 71,533 | |||||||||
Net loss | — | — | — | — | (98,712 | ) | (98,712 | ) | ||||||||||||||
Unrealized gain on short-term investments | — | — | — | 4 | — | 4 | ||||||||||||||||
Embedded conversion feature on Convertible Senior Notes | — | — | 54,049 | — | — | 54,049 | ||||||||||||||||
Stock-based compensation expense | — | — | 54,418 | — | — | 54,418 | ||||||||||||||||
Common stock issued | 2,486 | — | 20,292 | — | — | 20,292 | ||||||||||||||||
Tax withholding upon vesting of restricted stock awards | (311 | ) | — | (18,400 | ) | — | — | (18,400 | ) | |||||||||||||
Vesting of early exercise options | — | — | 1 | — | — | 1 | ||||||||||||||||
Balances at December 31, 2015 | 40,840 | 4 | 441,104 | (23 | ) | (357,900 | ) | 83,185 | ||||||||||||||
Net loss | — | — | — | — | (111,208 | ) | (111,208 | ) | ||||||||||||||
Unrealized gain on short-term investments | — | — | — | 16 | — | 16 | ||||||||||||||||
Stock-based compensation expense | — | — | 70,560 | — | — | 70,560 | ||||||||||||||||
Acquisition of FireLayers, Ltd. (Note 2) | 111 | — | 176 | — | — | 176 | ||||||||||||||||
Common stock issued | 2,474 | — | 27,799 | — | — | 27,799 | ||||||||||||||||
Tax withholding upon vesting of restricted stock awards | (410 | ) | — | (25,605 | ) | — | — | (25,605 | ) | |||||||||||||
Balances at December 31, 2016 | 43,015 | 4 | 514,034 | (7 | ) | (469,108 | ) | 44,923 | ||||||||||||||
Cumulative effect adjustment from adoption of new accounting pronouncement (Note 1) | — | — | 999 | — | (999 | ) | — | |||||||||||||||
Net loss | — | — | — | — | (84,337 | ) | (84,337 | ) | ||||||||||||||
Unrealized loss on short-term investments | — | — | — | (2 | ) | — | (2 | ) | ||||||||||||||
Conversion of convertible senior notes to common stock (Note 8) | 5,159 | 1 | 193,153 | — | — | 193,154 | ||||||||||||||||
Stock-based compensation expense | — | 88,449 | — | — | 88,449 | |||||||||||||||||
Acquisition of businesses (Note 2) | — | — | 424 | — | — | 424 | ||||||||||||||||
Common stock issued | 2,672 | — | 34,024 | — | — | 34,024 | ||||||||||||||||
Tax withholding upon vesting of restricted stock awards | (521 | ) | — | (43,511 | ) | — | — | (43,511 | ) | |||||||||||||
Balances at December 31, 2017 | 50,325 | $ | 5 | $ | 787,572 | $ | (9 | ) | $ | (554,444 | ) | $ | 233,124 | |||||||||
The accompanying notes are an integral part of these consolidated financial statements.
67
Proofpoint, Inc.
Consolidated Statements of Cash Flows
(in thousands)
Year Ended December 31, | |||||||||||
2017 | 2016 | 2015 | |||||||||
Cash flows from operating activities | |||||||||||
Net loss | $ | (84,337 | ) | $ | (111,208 | ) | $ | (98,712 | ) | ||
Adjustments to reconcile net loss to net cash provided by operating activities: | |||||||||||
Depreciation and amortization | 42,098 | 31,552 | 24,900 | ||||||||
Stock-based compensation | 97,460 | 78,696 | 60,094 | ||||||||
Change in fair value of contingent consideration | (1,533 | ) | (669 | ) | — | ||||||
Amortization of debt issuance costs and accretion of debt discount | 21,789 | 20,842 | 14,933 | ||||||||
Amortization of deferred commissions | 36,865 | 33,147 | 21,899 | ||||||||
Loss on conversion of convertible notes | 2,696 | — | — | ||||||||
Deferred income taxes | (15,953 | ) | 119 | 67 | |||||||
Other | (348 | ) | 1,170 | 2,364 | |||||||
Changes in assets and liabilities, net of effect of acquisitions: | |||||||||||
Accounts receivable | (33,538 | ) | (18,737 | ) | (13,042 | ) | |||||
Inventory | (132 | ) | (113 | ) | 14 | ||||||
Deferred product costs | 338 | 402 | (388 | ) | |||||||
Deferred commissions | (44,157 | ) | (36,009 | ) | (29,641 | ) | |||||
Prepaid expenses | (1,663 | ) | (2,660 | ) | (1,829 | ) | |||||
Other current assets | (139 | ) | (1,472 | ) | 104 | ||||||
Long-term assets | (3,429 | ) | 959 | 47 | |||||||
Accounts payable | (1,648 | ) | 4,271 | 2,460 | |||||||
Accrued liabilities | 13,943 | 6,398 | 4,448 | ||||||||
Deferred rent | 1,867 | 292 | (165 | ) | |||||||
Deferred revenue | 123,507 | 87,255 | 58,951 | ||||||||
Net cash provided by operating activities | 153,686 | 94,235 | 46,504 | ||||||||
Cash flows from investing activities | |||||||||||
Proceeds from maturities of short-term investments | 102,556 | 123,405 | 39,056 | ||||||||
Purchase of short-term investments | (96,741 | ) | (114,686 | ) | (64,537 | ) | |||||
Purchase of property and equipment | (46,958 | ) | (34,407 | ) | (25,827 | ) | |||||
Payments to escrow account | — | (9,645 | ) | — | |||||||
Receipts from escrow account | 6,066 | 260 | — | ||||||||
Acquisitions of business, net of cash and restricted cash acquired | (155,350 | ) | (54,119 | ) | (51,481 | ) | |||||
Net cash used in investing activities | (190,427 | ) | (89,192 | ) | (102,789 | ) | |||||
Cash flows from financing activities | |||||||||||
Proceeds from issuance of common stock | 25,725 | 21,779 | 18,583 | ||||||||
Withholding taxes related to restricted stock net share settlement | (42,823 | ) | (25,588 | ) | (18,108 | ) | |||||
Proceeds from issuance of convertible senior notes, net of discount | — | — | 223,790 | ||||||||
Payments of debt issuance costs | — | — | (371 | ) | |||||||
Repayments of equipment loans and capital lease obligations | (34 | ) | (32 | ) | (706 | ) | |||||
Repayment of convertible notes | (14 | ) | — | — | |||||||
Holdback payments for prior acquisitions | — | (1,397 | ) | — | |||||||
Contingent consideration payment | (6,066 | ) | — | — | |||||||
Net cash (used in) provided by financing activities | (23,212 | ) | (5,238 | ) | 223,188 | ||||||
Effect of exchange rate changes on cash, cash equivalents and restricted cash | 1,076 | (545 | ) | (963 | ) | ||||||
Net (decrease) increase in cash, cash equivalents and restricted cash | (58,877 | ) | (740 | ) | 165,940 | ||||||
Cash, cash equivalents, and restricted cash | |||||||||||
Beginning of period | 345,537 | 346,277 | 180,337 | ||||||||
End of period | $ | 286,660 | $ | 345,537 | $ | 346,277 | |||||
68
Year Ended December 31, | |||||||||||
2017 | 2016 | 2015 | |||||||||
Supplemental disclosures of cash flow information | |||||||||||
Cash paid for interest | $ | 4,236 | $ | 4,250 | $ | 3,381 | |||||
Cash paid for taxes | $ | 5,311 | $ | 893 | $ | 672 | |||||
Supplemental disclosure of noncash investing and financing activities | |||||||||||
Unpaid purchases of property and equipment and asset retirement obligations | $ | 3,349 | $ | 6,035 | $ | 4,906 | |||||
Liability awards converted to equity | $ | 8,307 | $ | 6,059 | $ | 1,745 | |||||
Convertible senior notes converted to equity | $ | 193,153 | $ | — | $ | — | |||||
December 31, 2017 | December 31, 2016 | December 31, 2015 | |||||||||
Reconciliation of cash, cash equivalents and restricted cash as shown in the consolidated statement of cash flows | |||||||||||
Cash and cash equivalents | $ | 286,072 | $ | 345,426 | $ | 346,205 | |||||
Restricted cash included in prepaid expenses and other current assets | 315 | 79 | 40 | ||||||||
Restricted cash included in other non-current assets | 273 | 32 | 32 | ||||||||
Total cash, cash equivalents and restricted cash | $ | 286,660 | $ | 345,537 | $ | 346,277 | |||||
The accompanying notes are an integral part of these consolidated financial statements.
69
Proofpoint, Inc.
Notes to Consolidated Financial Statements
(dollars and share amounts in thousands, except per share amounts)
1. The Company and Summary of Significant Accounting Policies
The Company
Proofpoint, Inc. (the “Company”) was incorporated in Delaware in June 2002 and is headquartered in California.
Proofpoint, Inc. is a leading security-as-a-service provider that enables large and mid-sized organizations worldwide to defend, protect, archive and govern their most sensitive data. The Company’s security-and compliance platform is comprised of an integrated suite of threat protection, information protection, and brand protection solutions, including email protection, advanced threat protection, email authentication, data loss prevention, SaaS application protection, response orchestration and automation, digital risk, web browser isolation, email encryption, archiving, eDiscovery, supervision, and secure communication.
Basis of Presentation and Consolidation
The accompanying consolidated financial statements have been prepared in conformity with U.S. generally accepted accounting principles ("GAAP"). The consolidated financial statements include the accounts of the Company and its wholly-owned subsidiaries. All intercompany transactions and balances have been eliminated in consolidation.
During the reporting periods, the Company completed a number of acquisitions which are more fully described in Note 2, "Acquisitions". The consolidated financial statements include the results of operations from these business combinations from their date of acquisition.
Use of Estimates
The preparation of consolidated financial statements in conformity with GAAP requires management to make estimates and assumptions that affect the reported amounts of assets and liabilities and disclosure of contingent assets and liabilities at the date of the financial statements, and the reported amounts of expenses during the reporting period. Actual results could differ materially from those estimates. Significant items subject to such estimates and assumptions include those related to revenue recognition, deferred commissions, stock-based compensation expense, fair value of assets acquired and liabilities assumed in business combinations, impairment assessments of goodwill, intangible assets and other long-lived assets, loss contingencies, and income taxes.
Foreign Currency Remeasurement and Transactions
The functional currency of the Company's wholly-owned foreign subsidiaries is the U.S. dollar. Accordingly, the subsidiaries remeasure monetary assets and liabilities at period-end exchange rates, while nonmonetary items are remeasured at historical rates. Income and expense accounts are remeasured at the average exchange rates in effect during the year. Remeasurement adjustments are recognized in the consolidated statements of operations as transaction gains or losses within other income (expense), net, in the period of occurrence. Aggregate transaction gains (losses) included in determining net loss were $574, $(852) and $(1,657) for the years ended December 31, 2017, 2016 and 2015, respectively.
Cash and Cash Equivalents
The Company considers currency on hand, demand deposits, time deposits, money market funds and all highly liquid investments with an original maturity of three months or less at the date of purchase to be cash and cash equivalents. Cash and cash equivalents are held in various financial institutions in the United States and internationally.
Investments
The Company classifies all its investments as available-for-sale at the time of purchase since it is management’s intent that these investments be available for current operations, and as such, includes these investments as short-term investments on its balance sheets. These investments consist of money market funds, corporate debt securities, commercial papers, U.S. agency and Treasury securities, and certificates of deposit with original maturities longer than three months.
70
Proofpoint, Inc.
Notes to Consolidated Financial Statements (Continued)
(dollars and share amounts in thousands, except per share amounts)
Short-term investments classified as available-for-sale are recorded at fair value with the related unrealized gains and losses included in accumulated other comprehensive income (loss), a component of stockholders’ equity. Realized gains and losses are recorded in the consolidated statements of operations and comprehensive loss based on specific identification.
Inventories
Inventories are stated at lower of cost or net realizable value, with costs computed on a first-in, first-out basis. The Company periodically reviews its inventories for excess and obsolete items and adjusts carrying costs to estimated net realizable values when they are determined to be less than cost. Inventories held at December 31, 2017 and December 31, 2016 consist primarily of finished goods.
Revenue Recognition
The Company derives its revenue primarily from two sources: (1) subscription revenue for rights related to the use of the security-as-a-service platform and (2) hardware, training and professional services revenue provided to customers related to their use of the platform. The Company records its revenues net of any value added or sales tax. Subscription revenue is derived from a subscription‑based enterprise licensing model with contract terms typically ranging from one to three years, and consists of (i) subscription fees from the licensing of the security-as-a-service platform, (ii) subscription fees for access to the on-demand elements of the platform and (iii) subscription fees for the right to access the Company’s customer support services.
Revenue is recognized when all of the following criteria have been met:
• | Persuasive evidence of an arrangement exists; |
• | Delivery has occurred or services have been rendered; |
• | Sales price is fixed or determinable; and |
• | Collectability is reasonably assured. |
The Company generates sales directly through its sales team and, to a growing extent, through its channel partners. Sales to channel partners are made at a discount and revenues are recorded at this discounted price once all revenue recognition criteria are met. Channel partners generally receive an order from an end-customer prior to placing an order with the Company, and these partners do not carry any inventory of the Company’s products or solutions. Payment from channel partners is not contingent on the partner’s success in sales to end-customers. In the event that the Company offers rebates, joint marketing funds, or other incentive programs to a partner, recorded revenues are reduced by these amounts accordingly.
From time to time, certain third parties that the Company has an arrangement with provide the Company with referrals for which the Company pays a referral fee. The referral fee paid could vary depending on the level of effort. These fees are recorded in sales and marketing expense in proportion to the related revenue streams consistent with the sales commissions accounting. The Company did not incur any material referral fee expenses during the years ended December 31, 2017, 2016 and 2015.
The Company applies industry-specific software revenue recognition guidance to transactions involving the licensing of software, as well as related support, training, and other professional services. The Company has analyzed all of the elements included in its multiple element software arrangements and has determined that it does not have sufficient VSOE of fair value to allocate revenue to its subscription and software license agreements, support, training and professional services. The Company defers all revenue under the software arrangement until the commencement of the subscription services and any associated professional services. Once the subscription services and the associated professional services have commenced, the entire fee from the arrangement is recognized ratably over the remaining period of the arrangement. If the professional services are essential to the functionality of the subscription, then the revenue recognition does not commence until such services are completed.
The Company’s revenue arrangements typically include subscription services to its security-as-a-service platform. These hosted on demand service arrangements do not provide customers with the right to take possession of the software supporting the hosted services. Certain arrangements also include the sale of hardware appliances. Revenue from hardware appliances containing software components and hardware components that function together to deliver the hardware appliance’s essential functionality is excluded from the scope of the industry specific revenue recognition guidance. The Company recognizes revenue from its hosted on demand services in accordance with general revenue recognition accounting
71
Proofpoint, Inc.
Notes to Consolidated Financial Statements (Continued)
(dollars and share amounts in thousands, except per share amounts)
guidance. Only revenue derived from the licensing of the software is recognized in accordance with the industry specific revenue guidance.
When a sales arrangement contains multiple elements, such as hardware appliances, subscription services, customer support services, and/or professional services, the Company allocates revenue to each unit of accounting or element based on a selling price hierarchy. An element constitutes a separate unit of accounting when the delivered item has standalone value and delivery of the undelivered element is probable and within the Company’s control. When applying the relative selling price method, the Company determines the selling price for each deliverable using vendor-specific objective evidence (“VSOE”) of selling price. If VSOE does not exist, the Company uses third-party evidence (“TPE”) of selling price. If neither VSOE nor TPE of selling price exist for a deliverable, the Company uses its best estimate of selling price (“BESP”) for that deliverable. Revenue allocated to each element is then recognized when the basic revenue recognition criteria are met for each element. The Company determines BESP for an individual element within a multiple element revenue arrangement using the same methods utilized to determine the selling price of an element sold on a standalone basis. The Company estimates the selling price for its subscription solutions by considering internal factors such as historical pricing practices and it estimates the selling price of hardware and other services using a cost plus model.
Hardware appliance revenue is recognized upon shipment. Subscription and support revenue are recognized over the contract period commencing on the start date of the contract. Professional services and training, when sold with hardware appliances or subscription and support services, are accounted for separately when those services have standalone value. In determining whether professional services and training services can be accounted for separately from subscription and support services, the Company considers the following factors: availability of the services from other vendors, the nature of the services, and the dependence of the subscription services on the customer’s decision to buy the professional services. If professional services and training do not qualify for separate accounting, the Company recognizes the professional services and training ratably over the contract term of the subscription services.
Delivery generally occurs when the hardware appliance is delivered to a common carrier freight on board shipping point by the Company or the hosted service has been activated and communicated to the customer accordingly. The Company’s fees are typically considered to be fixed or determinable at the inception of an arrangement and are negotiated at the outset of an arrangement, generally based on specific products and quantities to be delivered. In the event payment terms are provided that differ significantly from the Company’s standard business practices, the fees are deemed to not be fixed or determinable and revenue is recognized as the fees become paid.
The Company assesses collectability based on a number of factors, including credit worthiness of the customer and past transaction history of the customer. Through December 31, 2017, the Company has not experienced material credit losses.
Deferred Revenue
Deferred revenue primarily consists of billings or payments received in advance of revenue recognition from the sale of the Company’s subscription fees, training and professional services. Once the revenue recognition criteria are met, this revenue is recognized ratably over the term of the associated contract.
Deferred Commissions
Deferred commissions are the direct and incremental selling costs that are associated with the Company's customer contracts and consist of sales commissions paid to the Company's direct sales force and referral fees paid to independent third-parties. The commissions are amortized to sales and marketing expense over the non-cancelable terms of the related contracts with the Company's customers. The commission payments, which are paid in full the month after the customer's service commences, are a direct and incremental cost of the revenue arrangements. Direct sales commissions are deferred when earned and amortized over the same period that revenues are recognized for the related non-cancelable contract.
Deferred Product Costs
Deferred product costs are the incremental costs that are directly associated with each noncancellable customer contract or hosting agreement and primarily consist of cost of appliances and royalty payments made to third parties, from whom the Company has obtained licenses to integrate certain software into its products. The costs are deferred and amortized over the noncancellable term of the related customer contract or hosting agreement, which typically range from 12 to 36 months.
72
Proofpoint, Inc.
Notes to Consolidated Financial Statements (Continued)
(dollars and share amounts in thousands, except per share amounts)
Property and Equipment
Property and equipment are stated at cost. Depreciation is computed using the straight-line method over the estimated useful life of the related asset. Amortization of leasehold improvements is computed using the straight-line method over the shorter of the lease term or the estimated useful life of the asset or improvement. Cost of maintenance and repairs that do not improve or extend the lives of the respective assets are expensed as incurred. When property and equipment are retired or otherwise disposed of, the cost and related accumulated depreciation are removed from the balance sheet and the resulting gain or loss is included in other (expense) income, net.
Impairment of Intangible Assets and Other Long-Lived Assets
The Company evaluates long-lived assets, including property, equipment and definitive-lived intangible assets, for impairment whenever events or changes in circumstances indicate that the carrying value of an asset may not be recoverable. Recoverability of these assets is measured by comparison of the carrying amount of such assets (or asset group) to the future undiscounted cash flows the assets (or asset group) is expected to generate. If the assets are considered to be impaired, the amount of any impairment is measured as the difference between the carrying value and the fair value of the impaired assets. The Company also evaluates the estimated remaining useful lives of intangible assets and other long-lived assets to assess whether a revision to the remaining periods of amortization is required. No assets were determined to be impaired as of December 31, 2017.
Software Development Costs
Internally developed software includes security software developed to meet the Company’s internal needs to provide cloud-based subscription services to its end-customers and business software that the Company customizes to meet its operating needs. These capitalized costs consist of internal compensation related costs and external direct costs incurred during the application development stage. The costs capitalized were not material in the years ended December 31, 2017, 2016 and 2015.
The costs to develop software that is marketed externally have not been capitalized as the current software development process is essentially completed concurrently with the establishment of technological feasibility. As such, all related software development costs are expensed as incurred and included in research and development expense in the consolidated statements of operations.
Internally and externally developed software is amortized over the software’s estimated useful life of three to five years.
Advertising and Promotion Costs
Expenses related to advertising and promotion of solutions is charged to sales and marketing expense as incurred. The Company did not incur any material advertising and promotion expenses during the years ended December 31, 2017, 2016 and 2015.
Goodwill and Intangible Assets
Goodwill represents the excess of the purchase price of the acquired enterprise over the fair value of identifiable assets acquired and liabilities assumed. The Company performs an annual goodwill impairment test during the fourth quarter of a calendar year and more frequently if an event or circumstances indicates that impairment may have occurred. For the purposes of impairment testing, the Company has determined that it has one operating segment and one reporting unit. The Company performs a two-step impairment test of goodwill whereby the fair value of the reporting unit is compared to its carrying value. If the fair value of the reporting unit exceeds the carrying value of the net assets assigned to that unit, goodwill is not considered impaired and further testing is not required. If the carrying value of the net assets assigned to the reporting unit exceeds the fair value of the reporting unit, then the Company must perform the second step of the impairment test in order to determine the implied fair value of the reporting unit’s goodwill. If the carrying value of a reporting unit’s goodwill exceeds its implied fair value, then impairment loss equal to the difference is recorded. The identification and measurement of goodwill impairment involves the estimation of the fair value of the Company. The estimate of fair value of the Company, based on the best information available as of the date of the assessment, is subjective and requires judgment, including management assumptions about expected future revenue forecasts and discount rates, changes in the overall
73
Proofpoint, Inc.
Notes to Consolidated Financial Statements (Continued)
(dollars and share amounts in thousands, except per share amounts)
economy, trends in the stock price and other factors. No impairment was identified by the Company as of December 31, 2017.
Intangible assets consist of developed technology, customer relationships, non-compete arrangements, trademarks and patents, and order backlog. The values assigned to intangibles are based on estimates and judgments regarding expectations for success and life cycle of solutions and technologies acquired.
Intangible assets are amortized on a straight-line basis over their estimated lives, which approximate the pattern in which the economic benefits of the intangible assets are consumed, as follows (in years):
Low | High | ||
Patents | 4 | 5 | |
Developed technology | 3 | 7 | |
Customer relationships | 2 | 8 | |
Order backlog | 1 | 3 | |
Tradenames and trademarks | 1 | 5 | |
Warranty
The Company provides limited warranties on all sales and provides for the estimated cost of the warranties at the date of sale, to the extent not already provided by its own vendors. Warranty costs and the accrued warranty liabilities were not material for all periods presented.
Income Taxes
The Company accounts for income taxes in accordance with authoritative guidance, which requires use of the asset and liability method. Under this method, deferred income tax assets and liabilities are determined based on the difference between the consolidated financial statements carrying amounts and the tax basis of assets and liabilities and are measured using the enacted tax rates expected to apply to taxable income in the years in which the differences are expected to be reversed.
The Company records net deferred tax assets to the extent the Company believes these assets will more likely than not be realized. In making such determination, the Company considers all available positive and negative evidence, including future reversals of existing taxable temporary differences, projected future taxable income, tax planning strategies and recent financial operations.
The Company recognizes interest and penalties related to uncertain tax positions within the income tax expense line in the consolidated statements of operations. Accrued interest and penalties are included within the related tax liability line on the consolidated balance sheets.
Employee Benefit Plans
The Company sponsors a 401(k) defined contribution plan covering all employees. The Company may make discretionary contributions to the 401(k). To date, no contributions have been made by the Company.
Stock-Based Compensation
The Company issues stock-based compensation awards to employees and directors in the form of stock options, restricted stock units (“RSUs”), performance stock units (“PSUs”), employee stock purchase plan (“ESPP”) and stock bonus and other liability awards (collectively, “awards”).
The Company measures and recognizes compensation expense for all stock-based awards based on the awards’ fair value. Stock-based compensation for RSUs and PSUs is measured based on the value of the Company’s common stock on the grant date. Stock-based compensation for employee stock options and ESPP awards are measured on the date of grant using a Black-Scholes option pricing model.
74
Proofpoint, Inc.
Notes to Consolidated Financial Statements (Continued)
(dollars and share amounts in thousands, except per share amounts)
Stock bonus and other liability awards are accounted for as liability-classified awards, because the obligations are based predominantly on fixed monetary amounts that are generally known at the inception of the obligation, to be settled with a variable number of shares of the Company’s common stock.
Awards vest either on a graded schedule or in a lump sum. The Company determines the fair value of each award as a single award and recognizes the expense on a straight-line basis over the service period of the award, which is generally the vesting period. The exercise price of stock options granted is equal to the fair value of the Company's common stock on the date of grant. Stock options expire ten years from the date of grant.
During the year ended December 31, 2017, the Company adopted Accounting Standards Update (“ASU”) 2016-09 and elected to account for forfeitures as they occur. Refer to Accounting Pronouncements Adopted in 2017 below for changes in the accounting for stock-based compensation expense.
Comprehensive Income (Loss)
Comprehensive income (loss) includes all changes in equity that are not the result of transactions with stockholders. The Company’s comprehensive income (loss) consists of its net loss and changes in unrealized gains (losses) on its available-for-sale investments.
Loss Contingencies
The Company may be involved in various lawsuits, claims and proceedings that arise in the ordinary course of business. The Company records a provision for a liability when it believes that it is both probable that a liability has been incurred and the amount can be reasonably estimated. Significant judgment is required to determine both probability and the estimated amount. The Company reviews these provisions at least quarterly and adjusts these provisions to reflect the impact of negotiations, settlements, rulings, and updated information.
Accounting Pronouncements Adopted in 2017
In November 2016, the Financial Accounting Standards Board (FASB) issued Accounting Standards Update (“ASU”) No. 2016-18, Statement of Cash Flows (Topic 230): Restricted Cash (“ASU 2016-18”). The ASU 2016-18 provides amendments to current guidance to address the classification and presentation of changes in restricted cash in the statement of cash flows. The Company adopted the ASU in 2017 and retrospectively applied the change to the presentation of the statement of cash flows for the years ended December 31, 2016 and 2015. The adoption of this standard did not have a material impact on the Company's consolidated financial statements and related disclosures.
In March 2016, FASB issued ASU No. 2016-09, Compensation-Stock Compensation (Topic 718): Improvements to Employee Share-Based Payment Accounting (“ASU 2016-09”). The ASU 2016-09 was effective for the Company beginning in the first quarter of 2017. This ASU simplifies various aspects related to how share-based payments are accounted for and presented in the financial statements, including forfeitures, income taxes and statutory tax withholding requirements.
As a result of adopting ASU 2016-09, the Company has made an accounting policy election to account for forfeitures as they occur. This change has been applied on a modified retrospective basis, resulting in a cumulative-effect adjustment to increase the accumulated deficit by $999 as of January 1, 2017, the date of adoption. The adoption of this ASU also requires that excess tax benefits and tax deficiencies be recorded in the consolidated statement of operations as opposed to additional paid-in capital when the awards vest or are settled, and has been applied on a prospective basis starting January 1, 2017. As a result of the adoption, the Company's deferred tax assets as of January 1, 2017 include certain deferred tax assets that arose directly from tax deductions related to equity compensation greater than compensation recognized for financial reporting in the amount of $79,336, which is fully offset by the valuation allowance. The adoption of ASU 2016-09 as it relates to the accounting for minimum statutory withholding tax requirements has no impact on the Company's current consolidated financial statements or on any prior period financial statements presented.
ASU 2016-09 also requires changes in the classification of shares withheld to pay employee taxes and excess tax benefits in the consolidated statements of cash flows. The ASU requires that cash paid by an employer when directly withholding shares for tax-withholding purposes be classified as a financing activity and be applied retrospectively to all prior periods presented. As the Company has previously presented these cash flows as financing activities, there is no change resulting from the adoption of this provision of the ASU. ASU 2016-09 also requires excess tax benefits to be classified as an operating activity, consistent with other income tax cash flows, with the application either on a retrospective or prospective
75
Proofpoint, Inc.
Notes to Consolidated Financial Statements (Continued)
(dollars and share amounts in thousands, except per share amounts)
basis. The Company has elected to apply this provision on a prospective basis; and there is no impact to its prior year consolidated statements of cash flows.
Recent Accounting Policies Not Yet Effective
In January 2017, the FASB issued ASU No. 2017-04, Intangibles - Goodwill and Other (Topic 350): Simplifying the Accounting for Goodwill Impairment (“ASU 2017-04”). ASU 2017-04 removes the requirement to perform a hypothetical purchase price allocation to measure goodwill impairment. A goodwill impairment charge will be the amount by which a reporting unit’s carrying value exceeds its fair value, not to exceed the carrying amount of goodwill. The update to the standard is effective for interim and annual periods beginning after December 15, 2019, with early adoption permitted, and should be applied prospectively. The Company does not expect ASU 2017-04 to have a material impact on its financial statements.
In January 2017, FASB issued ASU No. 2017-01, Business Combinations (Topic 805) Clarifying the Definition of Business (“ASU 2017-01”). ASU 2017-01 clarifies the definition of a business with the objective of adding guidance to assist entities with evaluating whether transactions should be accounted for as acquisitions (or disposals) of assets or businesses. The update to the standard is effective for interim and annual periods beginning after December 15, 2017, and applied prospectively. Early adoption is permitted. The Company does not expect ASU 2017-01 to have a material impact on its consolidated financial statements.
In October 2016, FASB issued ASU No. 2016-16, Income Taxes: Intra-Entity Transfers of Assets Other Than Inventory (“ASU 2016-16”). ASU 2016-16 eliminates the requirement to defer the recognition of current and deferred income taxes for intra-entity asset transfer until the asset has been sold to an outside party. Therefore, an entity should recognize the income tax consequences of an intra-entity transfer of an asset other than inventory when the transfer occurs. ASU 2016-16 is effective for interim and annual reporting periods beginning after December 15, 2017. The ASU should be applied on a modified retrospective basis through a cumulative-effect adjustment directly to retained earnings as of the beginning of the period of adoption. The Company has evaluated the impact of the adoption of ASU 2016-16 on its consolidated financial statements and anticipates that its accumulated deficit will increase by $3,216 as of January 1, 2018, the date of adoption.
In August 2016, FASB issued ASU No. 2016-15, Statement of Cash Flows (Topic 230): Classification of Certain Cash Receipts and Cash Payments (“ASU 2016-15”). ASU 2016-15 clarifies how certain cash receipts and payments should be classified in the statement of cash flows, including the potential cash settlement of the Company's convertible senior notes. If the Company elects to cash settle its convertible senior notes (see Note 8 "Convertible Senior Notes"), repayment of the principal amounts will be bifurcated between (i) cash outflows for operating activities for the portion related to accreted interest attributable to debt discounts arising from the difference between the coupon interest rate and the effective interest rate, and (ii) financing activities for the remainder. See Note 8 "Convertible Senior Notes" regarding timing of settlement. The update to the standard is effective for interim and annual periods beginning after December 15, 2017, and requires adoption on a retrospective transition method unless it is impracticable to apply. The Company is currently evaluating the impact of the adoption of ASU 2016-15 on its consolidated financial statements.
In June 2016, FASB issued an ASU No. 2016-13, Financial Instruments - Credit Losses (Topic 326): Measurement of Credit Losses on Financial Instruments (“ASU 2016-13”). ASU 2016-13 changes the impairment model for most financial assets, and will require the use of an expected loss model in place of the currently used incurred loss method. Under this model, entities will be required to estimate the lifetime expected credit loss on such instruments and record an allowance to offset the amortized cost basis of the financial asset, resulting in a net presentation of the amount expected to be collected on the financial asset. The update to the standard is effective for interim and annual periods beginning after December 15, 2019. The Company is currently evaluating the impact of the adoption of ASU 2016-13 on its consolidated financial statements.
In February 2016, FASB issued ASU No. 2016-02, Leases (Topic 842) (“ASU 2016-02”), which requires lessees to put most leases on their balance sheets but recognize the expenses on their statements of operations in a manner similar to current practice. ASU 2016-02 states that a lessee would recognize a lease liability for the obligation to make lease payments and a right-to-use asset for the right to use the underlying asset for the lease term. The new standard is effective for interim and annual periods beginning after December 15, 2018 and early adoption is permitted. While the Company is currently assessing the impact ASU 2016-02 will have on the Company’s consolidated financial statements, the Company expects the primary impact to its consolidated financial position upon adoption will be the recognition, on a discounted basis, of the Company’s minimum commitments under non-cancelable operating leases on its consolidated balance sheets resulting in the recording of right of use assets and lease obligations.
76
Proofpoint, Inc.
Notes to Consolidated Financial Statements (Continued)
(dollars and share amounts in thousands, except per share amounts)
In May 2014, FASB issued ASU No. 2014-09, Revenue from Contracts with Customers: Topic 606 (“ASC 606”), to supersede nearly all existing revenue recognition guidance under U.S. GAAP. The standard contains a comprehensive new revenue recognition model that requires revenue to be recognized in a manner to depict the transfer of goods or services to a customer at an amount that reflects the consideration expected to be received in exchange for those goods and services. The FASB has issued several amendments to the standard, including clarifications on disclosure of prior-period performance obligations and remaining performance obligations.
The Company will adopt ASC 606 effective January 1, 2018 using the full retrospective transition method. While the Company is finalizing the impact this standard has on its consolidated financial statements and related disclosures, the Company expects the new standard to mostly change i) the timing of revenue recognition for contracts related to certain on-premise offerings, in which the Company grants customers the right to deploy its subscription software on the customer's own servers. For these contracts, the Company will be required to recognize as revenue a significant portion of the contract price upon delivery of the software compared to the current practice of recognizing the entire contract price ratably over a subscription period; ii) the timing of revenue recognition in instances when all revenue recognition criteria were not met until after the start date of the subscription. Previously these amounts were recognized prospectively over the remaining contract term, while under ASC 606 the Company will be required to recognize revenue on a cumulative catch-up basis for amounts earned up to the time all revenue recognition criteria have been met. The expected impact, upon adoption of ASC 606, is that reported revenue will increase by $4,000 to $5,000 in 2017 and by $2,000 to $3,000 in 2016.
The Company expects that certain contract acquisition costs such as sales commissions, will be amortized over an expected benefit period that is longer than the Company’s current policy of amortizing the deferred amounts over the specific revenue contract term for the associated contract. The expected impact, upon adoption of ASC 606 is that reported sales and marketing expense will decrease by $7,000 to $9,000 in 2017 and by $9,000 to $11,000 in 2016. Finally, due to the adoption of ASC 606 the Company expects its accumulated deficit as of January 1, 2016 to decrease by $35,000 to $38,000.
The Company does not expect the adoption of ASC 606 to have any impact on its operating cash flows.
2. Acquisitions
Acquisitions are accounted for under the purchase method of accounting in which the tangible and identifiable intangible assets and liabilities of each acquired company are recorded at their respective fair values as of each acquisition date, including an amount for goodwill representing the difference between the respective acquisition consideration and fair values of identifiable net assets. The Company believes that for each acquisition, the combined entities will achieve savings in corporate overhead costs and opportunities for growth through expanded geographic and customer segment diversity with the ability to leverage additional products and capabilities. These factors, among others, contributed to a purchase price in excess of the estimated fair value of each acquired company’s net identifiable assets acquired and, as a result, goodwill was recorded in connection with each acquisition. Goodwill related to each acquisition below is not deductible for tax purposes.
While the Company uses its best estimates and assumptions as part of the purchase price allocation process to value assets acquired and liabilities assumed at the acquisition date, these estimates and assumptions are subject to refinement. When additional information becomes available, such as finalization of negotiations of working capital adjustments and tax related matters, the Company may revise its preliminary purchase price allocation. As a result, during the preliminary purchase price allocation period, which may be up to one year from the acquisition date, the Company may record adjustments to the assets acquired and liabilities assumed, with the corresponding offset to goodwill. Subsequent to the purchase price allocation period, adjustments to assets acquired or liabilities assumed are recognized in the operating results.
2017 Acquisitions
Cloudmark, Inc.
On November 21, 2017 (the “Cloudmark Acquisition Date”), pursuant to the terms of the merger agreement, the Company acquired all shares of Cloudmark, Inc. (“Cloudmark”), a leader in messaging security and threat intelligence for internet service providers and mobile carriers worldwide. As part of the acquisition, Cloudmark’s Global Threat Network will be incorporated into Proofpoint’s cloud-based Nexus platform, which powers its email, social media, mobile, and SaaS security effectiveness.
The Company believes that with this acquisition, it will benefit from increased messaging threat intelligence from the analysis of billions of daily emails, malicious domain intelligence, and visibility into fraudulent and malicious SMS
77
Proofpoint, Inc.
Notes to Consolidated Financial Statements (Continued)
(dollars and share amounts in thousands, except per share amounts)
messages directed to mobile carriers worldwide. The Company also expects to achieve savings in corporate overhead costs for the combined entities. These factors, among others, contributed to a purchase price in excess of the estimated fair value of acquired net identifiable assets and, as a result, goodwill was recorded in connection with the acquisition.
The Company has provisionally estimated fair values of acquired tangible and intangible assets and assumed liabilities at the Cloudmark Acquisition Date. The amounts reported are considered provisional as the Company is completing the valuation work to determine the fair value of certain assets and liabilities acquired, largely with respect to working capital adjustments. The results of operations and the provisional fair values of the acquired assets and liabilities assumed have been included in the accompanying consolidated financial statements since the Cloudmark Acquisition Date. The Company recorded $3,052 in revenue from Cloudmark for the year ended December 31, 2017, and due to the continued integration of the combined businesses, it was impractical to determine the earnings.
At the Cloudmark Acquisition Date, the consideration transferred was $107,283, net of cash acquired of $31,973. Of the consideration transferred, $16,700 was held in escrow to secure indemnification obligations, which has not been released as of the filing date of this Annual Report on Form 10-K. The Company incurred $413 in acquisition-related costs which were recorded within operating expenses during the year ended December 31, 2017.
Per the terms of the merger agreement, unvested stock options and unvested restricted stock units held by Cloudmark employees were canceled and exchanged for the Company’s unvested stock options and unvested restricted stock units, respectively. The fair value of $91 of these unvested awards was attributed to precombination services and included in consideration transferred. The fair value of $1,180 was allocated to postcombination services. The unvested awards are subject to the recipient’s continued service with the Company, and $1,180 will be recognized ratably as stock-based compensation expense over the required remaining service period.
The following table summarizes the fair values of tangible assets acquired, liabilities assumed, intangible assets and goodwill:
Estimated Fair Value | Estimated Useful Life (in years) | ||||
Current assets acquired | $ | 37,390 | N/A | ||
Fixed assets acquired | 543 | N/A | |||
Non-current assets acquired | 50 | N/A | |||
Liabilities assumed | (4,542 | ) | N/A | ||
Deferred revenue assumed | (15,400 | ) | N/A | ||
Customer relationships | 15,300 | 8 | |||
Order backlog | 1,400 | 1 | |||
Core/developed technology | 18,500 | 4 | |||
Deferred tax liability, net | (7,905 | ) | N/A | ||
Goodwill | 93,920 | Indefinite | |||
$ | 139,256 | ||||
WebLife Balance, Inc.
On November 30, 2017 (the “WebLife Acquisition Date”), pursuant to the terms of a merger agreement, the Company acquired all shares of WebLife Balance, Inc. (“WebLife”), a browser isolation offerings vendor, to extend its advanced threat protection capabilities into personal email, while preserving the privacy of its users.
The Company has estimated fair values of acquired tangible assets, intangible assets and liabilities at the WebLife Acquisition Date. The amounts reported are considered provisional as the Company is completing the valuation work to determine the fair value of certain assets and liabilities acquired, largely with respect to working capital adjustments. The results of operations and the provisional fair values of the acquired assets and liabilities assumed have been included in the accompanying consolidated financial statements since the WebLife Acquisition Date. Revenue from WebLife was not material for the year ended December 31, 2017 and due to the continued integration of the combined businesses, it was impractical to determine the earnings.
78
Proofpoint, Inc.
Notes to Consolidated Financial Statements (Continued)
(dollars and share amounts in thousands, except per share amounts)
At the WebLife Acquisition Date, the consideration transferred was $48,765, net of cash acquired of $278. Of the consideration transferred, $6,203 was held in escrow to secure indemnification obligations, which has not been released as of the filling date of this Annual Report on Form 10-K. The Company incurred $168 in acquisition-related costs which were recorded within operating expenses for the year ended December 31, 2017.
Per the terms of the merger agreement, unvested stock options held by WebLife employees were canceled and exchanged for the Company’s unvested awards. The fair value of $333 of these unvested options was attributed to precombination service and included in consideration transferred. The fair value of $1,468 was allocated to postcombination services. The unvested awards are subject to the recipient’s continued service with the Company, and $1,468 will be recognized ratably as stock-based compensation expense over the required remaining service period. Also, as part of the merger agreement, 107 shares of the Company’s common stock were deferred for certain key employees with the total fair value of $9,652 (see Note 9), which was not included in the purchase price. The deferred shares are subject to forfeiture if employment terminates prior to the lapse of the restrictions, and their fair value is expensed as stock-based compensation expense over the vesting period.
The following table summarizes the fair values of tangible assets acquired, liabilities assumed, intangible assets and goodwill:
Estimated Fair Value | Estimated Useful Life (in years) | ||||
Current assets acquired | $ | 534 | N/A | ||
Fixed assets acquired | 23 | N/A | |||
Liabilities assumed | (88 | ) | N/A | ||
Deferred revenue assumed | (700 | ) | N/A | ||
Customer relationships | 600 | 5 | |||
Core/developed technology | 16,600 | 5 | |||
Deferred tax liability, net | (4,440 | ) | N/A | ||
Goodwill | 36,514 | Indefinite | |||
$ | 49,043 | ||||
2016 Acquisitions
FireLayers
On October 24, 2016 (the “FireLayers Acquisition Date”), pursuant to the terms of a share purchase agreement, the Company acquired all shares of FireLayers, Ltd. (“FireLayers”), a provider of solutions for organizations to control and protect their cloud applications. With this acquisition, the Company will extend Targeted Attack Protection to SaaS applications, enabling customers to protect their employees using SaaS applications from advanced malware.
The Company has estimated fair values of acquired tangible assets, intangible assets and liabilities at the FireLayers Acquisition Date. The results of operations and the fair values of the acquired assets and liabilities assumed have been included in the accompanying consolidated financial statements since the FireLayers Acquisition Date.
The total purchase price was $45,616, net of cash acquired of $210. Of the cash consideration paid, $7,740 was held in escrow to secure indemnification obligations, which has not been released as of the filing date of this Annual Report on Form 10-K. The Company incurred $827 in acquisition-related costs which were recorded within operating expenses for the year ended December 31, 2016.
Per the terms of the share purchase agreement, unvested stock options held by FireLayers employees were canceled and exchanged for unvested stock options to purchase shares of the Company's common stock. The fair value of $1,326 of these unvested options, which are subject to the recipient’s continued service with the Company and thus excluded from the purchase price, are recognized ratably as stock-based compensation expense over the required service period. Also, as part of the share purchase agreement, 111 shares of restricted stock were issued to certain key employees with the total fair value of $8,669 (see Note 9), which was not included in the purchase price. The shares of restricted stock are subject to forfeiture if
79
Proofpoint, Inc.
Notes to Consolidated Financial Statements (Continued)
(dollars and share amounts in thousands, except per share amounts)
employment terminates prior to the lapse of the restrictions, and their fair value is expensed as stock-based compensation expense over the vesting period.
The following table summarizes the fair values of acquired assets and liabilities:
Fair Value | Estimated Useful Life (in years) | ||||
Current assets acquired | $ | 432 | N/A | ||
Developed technology | 22,600 | 5 | |||
Fixed assets | 52 | N/A | |||
Deferred tax liability, net | (3,530 | ) | N/A | ||
Other liabilities assumed | (540 | ) | N/A | ||
Additional-paid-in-capital | (176 | ) | N/A | ||
Goodwill | 26,988 | Indefinite | |||
$ | 45,826 | ||||
Return Path
On August 24, 2016 (the “Return Path Acquisition Date”), pursuant to the terms of an asset purchase agreement, the Company acquired Return Path, Inc.’s (“Return Path”) Email Fraud Protection (“EFP”) business unit. Return Path’s EFP business, which provides standards-based DMARC authentication and proprietary sender-analysis capabilities, will be integrated into the Company’s suite of email protection solutions to further enhance its business email compromise capabilities.
The Company has estimated fair values of acquired tangible assets, intangible assets and liabilities at the Return Path Acquisition Date. The results of operations and the fair values of the acquired assets and liabilities assumed have been included in the accompanying consolidated financial statements since the Return Path Acquisition Date. The Company recorded $1,025 revenue from Return Path for the year ended December 31, 2016. Pro forma results of operations have not been presented because the acquisition was not material to the Company’s consolidated financial statements.
The total purchase price was $17,513, of which $9,162 was classified and recorded as contingent consideration on the balance sheet as of the Return Path Acquisition Date. The Company expects to pay the contingent consideration within two years depending on the timing of contract assignments following the Return Path acquisition date and the maximum potential payment amount could be up to $9,644. The Company incurred $406 in acquisition related costs which were recorded within operating expenses for the year ended December 31, 2016.
The fair value of the contingent consideration liability was determined as of the acquisition date using unobservable inputs. These inputs include the estimated amount and timing of future contract assignments, the probability of success and a risk-adjusted discount rate to adjust the probability-weighted cash flows to present value.
The following table summarizes the fair values of acquired assets and liabilities:
Fair Value | Estimated Useful Life (in years) | ||||
Customer relationships | $ | 7,600 | 6 | ||
Developed technology | 3,900 | 4 | |||
Order backlog | 700 | 1 | |||
Deferred revenue assumed | (1,200 | ) | N/A | ||
Goodwill | 6,513 | Indefinite | |||
$ | 17,513 | ||||
80
Proofpoint, Inc.
Notes to Consolidated Financial Statements (Continued)
(dollars and share amounts in thousands, except per share amounts)
2015 Acquisitions
In the fourth quarter of the year ended December 31, 2015, the Company made two acquisitions that were accounted for as business combinations. The results of operations and the fair values of the acquired assets and liabilities assumed have been included in the accompanying consolidated financial statements from the respective date of each acquisition. Pro forma results of operations for these acquisitions have not been presented because the Company does not consider these acquisitions to be material, individually or in the aggregate, to the Company’s consolidated financial statements.
The aggregate purchase price was $11,568. The Company incurred $355 in acquisition related costs which were recorded within operating expenses for the year ended December 31, 2015. The following table summarizes the fair values of acquired tangible and intangible assets, liabilities and goodwill:
Fair Value | Estimated Useful Life (in years) | ||||
Current assets acquired | $ | 414 | N/A | ||
Fixed assets acquired | 73 | N/A | |||
Liabilities assumed | (234 | ) | N/A | ||
Deferred revenue assumed | (1,400 | ) | N/A | ||
Deferred tax liability, net | (45 | ) | N/A | ||
Customer relationships | 2,800 | 7 | |||
Order Backlog | 900 | 3 | |||
Developed technology | 3,000 | 4 | |||
Goodwill | 6,060 | Indefinite | |||
$ | 11,568 | ||||
Marble Security, Inc.
On July 22, 2015 (the “Marble Acquisition Date”), pursuant to the terms of an asset purchase agreement, the Company acquired certain assets of Marble Security, Inc. (“Marble”). The Marble mobile security technology proactively removes malicious mobile applications by leveraging its tight integration with the leading enterprise mobility management platforms, including MobileIron and AirWatch by VMware. The acquisition extends the Company’s threat intelligence and advanced threat protection for email and social media security into the realm of mobile devices.
The results of operations and the fair values of the acquired assets and liabilities assumed have been included in the accompanying consolidated financial statements since the Marble Acquisition Date. Revenue from Marble was not material for the year ended December 31, 2015, and due to the continued integration of the combined businesses, it was impractical to determine the earnings. Pro forma results of operations have not been presented because the acquisition was not material to the Company’s results of operations.
The total purchase price was $8,500. The Company incurred $277 in acquisition related costs which were recorded within operating expenses for the year ended December 31, 2015.
The following table summarizes the fair values of acquired tangible, intangible assets and goodwill:
Fair Value | Estimated Useful Life (in years) | ||||
Fixed assets acquired | $ | 25 | N/A | ||
Developed technology | 7,300 | 4 | |||
Goodwill | 1,175 | Indefinite | |||
$ | 8,500 | ||||
81
Proofpoint, Inc.
Notes to Consolidated Financial Statements (Continued)
(dollars and share amounts in thousands, except per share amounts)
Emerging Threats Pro, LLC
On March 6, 2015 (the “Emerging Threats Acquisition Date”), pursuant to the terms of a purchase agreement, the Company acquired 100% of membership interests in Emerging Threats Pro, LLC (“Emerging Threats”). Based in Indianapolis, Indiana, Emerging Threats provides threat intelligence solutions to help protect networks from known or potentially malicious threats. With this acquisition, the Company integrated Emerging Threat’s advanced threat intelligence solutions with its existing Targeted Attack Protection and Threat Response security solutions to advance threat detection and response across the completed attack chain. The combined technology provides customers with deeper insight into cyberthreats, enabling them to react faster to inbound cyberattacks, and to identify, block, and disable previously undetected malware already embedded in their organizations.
The results of operations and the fair values of the acquired assets and liabilities assumed have been included in the accompanying consolidated financial statements since the Emerging Threat Acquisition Date. Revenue from Emerging Threats was $2,477 for the year ended December 31, 2015, and due to the continued integration of the combined businesses, it was impractical to determine the earnings.
The total purchase price was $31,803, net of cash acquired of $52. The Company incurred $277 in acquisition-related costs which were recorded within operating expenses for the year ended December 31, 2015.
The following table summarizes the fair values of tangible and intangible assets acquired, liabilities assumed and goodwill:
Fair Value | Estimated Useful Life (in years) | ||||
Current assets acquired | $ | 1,275 | N/A | ||
Fixed assets acquired | 174 | N/A | |||
Liabilities assumed | (448 | ) | N/A | ||
Deferred revenue assumed | (700 | ) | N/A | ||
Holdback liability to the sellers | (3,662 | ) | N/A | ||
Trade names | 200 | 2 | |||
Customer relationships | 4,200 | 7 | |||
Order Backlog | 200 | 1 | |||
Developed technology | 7,900 | 7 | |||
Goodwill | 19,054 | Indefinite | |||
$ | 28,193 | ||||
Pro Forma Financial Information (unaudited)
The following unaudited pro forma financial information presents the combined results of operations for the years ended December 31, 2017, 2016 and 2015 as though the acquisitions that occurred during the reporting periods had occurred as of the beginning of the comparable prior annual reporting periods, with adjustments to give effect to pro forma events that are directly attributable to the acquisitions such as amortization expense of acquired intangible assets, stock-based compensation directly attributable to the acquisitions and acquisition-related transaction costs. The unaudited pro forma results do not include immaterial acquisitions made in the fourth quarter of 2015 and the acquisitions of Return Path and Marble, and do not reflect any operating efficiencies or potential cost savings which may result from the consolidation of the operations of the Company and acquisitions. Accordingly, these unaudited pro forma results are presented for informational purposes only and are not necessarily indicative of what the actual results of operations of the combined company would have been if the acquisitions had occurred at the beginning of the period presented, nor are they indicative of future results of operations:
82
Proofpoint, Inc.
Notes to Consolidated Financial Statements (Continued)
(dollars and share amounts in thousands, except per share amounts)
Year Ended December 31, | |||||||||||
2017 | 2016 | 2015 | |||||||||
Total revenue | $ | 550,314 | $ | 414,539 | $ | 264,904 | |||||
Net loss | $ | (89,515 | ) | $ | (121,147 | ) | $ | (111,440 | ) | ||
Basic and diluted net loss per share | $ | (2.02 | ) | $ | (2.89 | ) | $ | (2.80 | ) | ||
The unaudited pro forma financial information includes acquisition-related transaction costs of $581 for the year ended December 31, 2017.
3. Concentration of Risks
Financial instruments that potentially subject the Company to credit risk consist principally of cash and cash equivalents, short-term investments and accounts receivable.
The Company limits its concentration of risk in cash equivalents and short-term investments by diversifying its investments among a variety of industries and issuers and by limiting the average maturity to one year or less. The Company’s professional portfolio managers adhere to this investment policy as approved by the Company’s Board of Directors.
The Company’s investment policy is to invest only in fixed income investments denominated and payable in U.S. dollars. Investment in obligations of the U.S. government and its agencies, money market instruments, commercial paper, certificates of deposit, bankers’ acceptances, corporate bonds of U.S. companies, municipal securities and asset backed securities are allowed. The Company does not invest in auction rate securities, futures contracts, or hedging instruments.
The Company’s accounts receivables are derived from revenue earned from customers primarily located in the United States of America. The Company performs periodic evaluations of its customers’ financial condition and generally does not require its customers to provide collateral or other security to support accounts receivable, and maintains an allowance for doubtful accounts. Credit losses historically have not been material.
During the year ended December 31, 2017, one partner accounted for 12% of total revenue, though the partner sold to a number of end-users, none of which accounted for more than 10% of our total revenue in 2017. During the years ended December 31, 2016 and 2015, no individual customers accounted for more than 10% of total revenue.
One customer accounted for 11% and 21% of total accounts receivable as of December 31, 2017 and 2016, respectively.
4. Balance Sheet Components
Property and equipment at December 31, 2017 and December 31, 2016 consist of the following:
Useful Life (in years) | December 31, | ||||||||
2017 | 2016 | ||||||||
Computer equipment | 2 to 4 | $ | 125,296 | $ | 92,462 | ||||
Software | 2 to 5 | 2,647 | 2,266 | ||||||
Furniture | 5 | 2,523 | 1,532 | ||||||
Office equipment | 2 to 5 | 587 | 467 | ||||||
Leasehold improvements | 5 years, or lease term, if shorter | 10,632 | 6,198 | ||||||
Other | 2 | 59 | 59 | ||||||
Construction in progress | 1,854 | 1,483 | |||||||
143,598 | 104,467 | ||||||||
Less: Accumulated depreciation | (69,981 | ) | (51,944 | ) | |||||
$ | 73,617 | $ | 52,523 | ||||||
83
Proofpoint, Inc.
Notes to Consolidated Financial Statements (Continued)
(dollars and share amounts in thousands, except per share amounts)
Property and equipment acquired under capital leases:
December 31, | |||||||
2017 | 2016 | ||||||
Computer equipment | $ | 453 | $ | 453 | |||
Less: Accumulated depreciation | (372 | ) | (341 | ) | |||
$ | 81 | $ | 112 | ||||
The allowance for doubtful accounts receivable was not material as of December 31, 2017 and 2016.
Depreciation expense for the years ended December 31, 2017, 2016 and 2015 was approximately $23,591, $17,131, and $12,644, respectively. This included depreciation expense for assets under capital leases of $31, $31 and $23 for the years ended December 31, 2017, 2016 and 2015, respectively.
Accrued liabilities at December 31, 2017 and December 31, 2016 consisted of the following:
December 31, | |||||||
2017 | 2016 | ||||||
Accrued compensation | $ | 37,028 | $ | 30,295 | |||
ESPP contributions | 2,339 | 1,701 | |||||
Customer deposits | 570 | 173 | |||||
Accrued royalties | 780 | 754 | |||||
Acquisition-related contingent consideration | 634 | 7,629 | |||||
Other | 22,575 | 10,213 | |||||
$ | 63,926 | $ | 50,765 | ||||
5. Goodwill and Intangible Assets
The goodwill activity and balances are presented below:
December 31, | |||||||
2017 | 2016 | ||||||
Opening balance | $ | 167,270 | $ | 133,769 | |||
Add: Goodwill from acquisitions | 130,434 | 33,501 | |||||
Closing balance | $ | 297,704 | $ | 167,270 | |||
Intangible Assets
Intangible assets consisted of the following:
December 31, 2017 | December 31, 2016 | ||||||||||||||||||||||
Gross Carrying Amount | Accumulated Amortization | Net Carrying Amount | Gross Carrying Amount | Accumulated Amortization | Net Carrying Amount | ||||||||||||||||||
Developed technology | $ | 118,869 | $ | (52,554 | ) | $ | 66,315 | $ | 83,769 | $ | (38,042 | ) | $ | 45,727 | |||||||||
Customer relationships | 33,600 | (5,918 | ) | 27,682 | 17,943 | (3,228 | ) | 14,715 | |||||||||||||||
Trademark and patents | 930 | (825 | ) | 105 | 930 | (667 | ) | 263 | |||||||||||||||
Order backlog | 2,300 | (800 | ) | 1,500 | 1,600 | (597 | ) | 1,003 | |||||||||||||||
$ | 155,699 | $ | (60,097 | ) | $ | 95,602 | $ | 104,242 | $ | (42,534 | ) | $ | 61,708 | ||||||||||
84
Proofpoint, Inc.
Notes to Consolidated Financial Statements (Continued)
(dollars and share amounts in thousands, except per share amounts)
Amortization expense of intangibles totaled $18,506, $14,421 and $12,256 during the years ended December 31, 2017, 2016 and 2015, respectively.
Future estimated amortization costs of intangible assets as of December 31, 2017 are presented below:
Year Ended December 31, | |||
2018 | $ | 25,990 | |
2019 | 21,450 | ||
2020 | 19,199 | ||
2021 | 16,898 | ||
2022 | 6,535 | ||
Thereafter | 5,530 | ||
$ | 95,602 | ||
6. Fair Value Measurements and Investments
Fair Value Measurements
Fair value is defined as the price that would be received to sell an asset or paid to transfer a liability (i.e., the “exit price”) in an orderly transaction between market participants at the measurement date. A hierarchy for inputs used in measuring fair value has been defined to minimize the use of unobservable inputs by requiring the use of observable market data when available. Observable inputs are inputs that market participants would use in pricing the asset or liability based on active market data. Unobservable inputs are inputs that reflect the Company’s assumptions about the assumptions market participants would use in pricing the asset or liability based on the best information available in the circumstances.
The fair value hierarchy prioritizes the inputs into three broad levels:
• | Level 1: Quoted (unadjusted) prices in active markets for identical assets or liabilities. The Company’s Level 1 assets generally consist of money market funds. |
• | Level 2: Observable inputs other than quoted prices included in Level 1, such as quoted prices for similar assets or liabilities in active markets; quoted prices for identical or similar assets or liabilities in markets that are not active; or other inputs that are observable or can be corroborated by observable market data for substantially the full term of the asset or liability. The Company’s Level 2 assets and liabilities generally consist of corporate debt securities, commercial papers, U.S. agency and Treasury securities and convertible senior notes. |
• | Level 3: Unobservable inputs to the valuation methodology that are supported by little or no market activity and that are significant to the measurement of the fair value of the assets or liabilities. Level 3 assets and liabilities include those whose fair value measurements are determined using pricing models, discounted cash flow methodologies or similar valuation techniques, as well as significant management judgment or estimation. |
In connection with the acquisition of Return Path, a liability was recognized on Return Path Acquisition Date for the estimate of the fair value of the Company’s contingent payment. The Company determined the fair value of the Acquisition-related contingent liability based on the estimated amount and timing of future contract assignments, and the probability of success. This fair value measurement is based on significant inputs not observable in the market and thus represent Level 3 measurement.
The following tables summarize, for each category of assets or liabilities carried at fair value, the respective fair value as of December 31, 2017 and December 31, 2016 and the classification by level of input within the fair value hierarchy:
85
Proofpoint, Inc.
Notes to Consolidated Financial Statements (Continued)
(dollars and share amounts in thousands, except per share amounts)
December 31, 2017 | |||||||||||||||
Total | Level 1 | Level 2 | Level 3 | ||||||||||||
Assets | |||||||||||||||
Cash equivalents: | |||||||||||||||
Money market funds | $ | 231,828 | $ | 231,828 | $ | — | $ | — | |||||||
Commercial paper | 7,995 | — | 7,995 | — | |||||||||||
U.S. agency securities | 1,996 | — | 1,996 | — | |||||||||||
Short-term investments: | |||||||||||||||
Corporate debt securities | 11,600 | — | 11,600 | — | |||||||||||
Commercial paper | 27,939 | — | 27,939 | — | |||||||||||
U.S. agency securities | 3,991 | — | 3,991 | — | |||||||||||
U.S. Treasury securities | 1,996 | — | 1,996 | — | |||||||||||
Total financial assets | $ | 287,345 | $ | 231,828 | $ | 55,517 | $ | — | |||||||
Liabilities | |||||||||||||||
Acquisition-related contingent consideration | $ | 634 | $ | — | $ | — | $ | 634 | |||||||
December 31, 2016 | |||||||||||||||
Total | Level 1 | Level 2 | Level 3 | ||||||||||||
Assets | |||||||||||||||
Cash equivalents: | |||||||||||||||
Money market funds | $ | 304,020 | $ | 304,020 | $ | — | $ | — | |||||||
Corporate debt securities | 2,139 | — | 2,139 | — | |||||||||||
Commercial paper | 13,243 | — | 13,243 | — | |||||||||||
Short-term investments: | |||||||||||||||
Corporate debt securities | 24,450 | — | 24,450 | — | |||||||||||
Commercial paper | 22,979 | — | 22,979 | — | |||||||||||
U.S. agency securities | 1,946 | — | 1,946 | — | |||||||||||
U.S. Treasury securities | 1,950 | — | 1,950 | — | |||||||||||
Total financial assets | $ | 370,727 | $ | 304,020 | $ | 66,707 | $ | — | |||||||
Liabilities | |||||||||||||||
Acquisition-related contingent consideration | $ | 8,233 | $ | — | $ | — | $ | 8,233 | |||||||
Based on quoted market prices as of December 31, 2017, the fair value of the 0.75% Convertible Senior Notes (Note 8) was approximately $285,453, determined using Level 2 inputs as they are not actively traded in markets.
86
Proofpoint, Inc.
Notes to Consolidated Financial Statements (Continued)
(dollars and share amounts in thousands, except per share amounts)
The following table represents a reconciliation of the Acquisition-related contingent consideration liability measured at fair value on a recurring basis, using significant unobservable inputs (Level 3):
Amount | |||
Balance as of December 31, 2015 | $ | — | |
Additions during the period | 9,162 | ||
Payments during the period | (260 | ) | |
Adjustments to fair value during the period recorded in General and administrative expenses | (669 | ) | |
Balance as of December 31, 2016 | 8,233 | ||
Additions during the period | — | ||
Payments during the period | (6,066 | ) | |
Adjustments to fair value during the period recorded in General and administrative expenses | (1,533 | ) | |
Balance as of December 31, 2017 | $ | 634 | |
The carrying amounts of the Company's cash equivalents, accounts receivable and accounts payable approximate their fair values due to their short maturities.
Investments
The cost and fair value of the Company’s cash, cash equivalents and available-for-sale investments as of December 31, 2017 and December 31, 2016 were as follows:
December 31, 2017 | |||||||||||||||
Amortized Cost | Unrealized Gains | Unrealized Losses | Fair Value | ||||||||||||
Cash and cash equivalents: | |||||||||||||||
Cash | $ | 44,253 | $ | — | $ | — | $ | 44,253 | |||||||
Money market funds | 231,828 | — | — | 231,828 | |||||||||||
Commercial paper | 7,995 | — | — | 7,995 | |||||||||||
U.S. agency securities | 1,996 | — | — | 1,996 | |||||||||||
Total | $ | 286,072 | $ | — | $ | — | $ | 286,072 | |||||||
Short-term investments: | |||||||||||||||
Corporate debt securities | $ | 11,607 | $ | — | $ | (7 | ) | $ | 11,600 | ||||||
Commercial paper | 27,939 | — | — | 27,939 | |||||||||||
U.S. agency securities | 3,992 | — | (1 | ) | 3,991 | ||||||||||
U.S. Treasury securities | 1,997 | — | (1 | ) | 1,996 | ||||||||||
Total | $ | 45,535 | $ | — | $ | (9 | ) | $ | 45,526 | ||||||
87
Proofpoint, Inc.
Notes to Consolidated Financial Statements (Continued)
(dollars and share amounts in thousands, except per share amounts)
December 31, 2016 | |||||||||||||||
Amortized Cost | Unrealized Gains | Unrealized Losses | Fair Value | ||||||||||||
Cash and cash equivalents: | |||||||||||||||
Cash | $ | 26,024 | $ | — | $ | — | $ | 26,024 | |||||||
Money market funds | 304,020 | — | — | 304,020 | |||||||||||
Corporate debt securities | 2,140 | — | (1 | ) | 2,139 | ||||||||||
Commercial papers | 13,243 | — | — | 13,243 | |||||||||||
Total | $ | 345,427 | $ | — | $ | (1 | ) | $ | 345,426 | ||||||
Short-term investments: | |||||||||||||||
Corporate debt securities | $ | 24,458 | $ | — | $ | (8 | ) | $ | 24,450 | ||||||
Commercial papers | 22,979 | — | — | 22,979 | |||||||||||
U.S. agency securities | 1,945 | 1 | — | 1,946 | |||||||||||
U.S. Treasury securities | 1,950 | — | — | 1,950 | |||||||||||
Total | $ | 51,332 | $ | 1 | $ | (8 | ) | $ | 51,325 | ||||||
As of December 31, 2017 and December 31, 2016, all investments mature in less than one year. Fair values for marketable securities are based on quoted market prices for the same or similar instruments.
The Company reviews its investments on a quarterly basis to identify and evaluate investments that have an indication of possible impairment and has determined that no other-than-temporary impairments were required to be recognized during the years ended December 31, 2017, 2016 and 2015.
7. Commitments and Contingencies
Operating Leases
The Company leases certain of its facilities under non-cancellable operating leases with various expiration dates through 2027.
Premises rent expense was $8,010, $5,054 and $3,831 for the years ended December 31, 2017, 2016 and 2015, respectively.
Capital Leases
In July 2012, the Company entered into two lease agreements to lease certain office equipment with expiration dates in July and October 2015. The leases bear an annual interest rate of 4.50%. Also, in July 2015, the Company entered into a new lease agreement (the “July 2015 Lease”) to lease certain office equipment with expiration in August 2020. The July 2015 Lease bears an annual interest rate of 6.5%. All leases are secured by fixed assets used in the Company’s office locations.
88
Proofpoint, Inc.
Notes to Consolidated Financial Statements (Continued)
(dollars and share amounts in thousands, except per share amounts)
At December 31, 2017, future annual minimum lease payments under noncancellable operating and capital leases were as follows:
Capital Leases | Operating Leases | ||||||
2018 | $ | 39 | $ | 17,985 | |||
2019 | 37 | 15,625 | |||||
2020 | 21 | 7,661 | |||||
2021 | — | 4,924 | |||||
2022 | — | 4,919 | |||||
Thereafter | — | 6,692 | |||||
Total minimum lease payments | 97 | $ | 57,806 | ||||
Less: Amount representing interest | (8 | ) | |||||
Present value of capital lease obligations | 89 | ||||||
Less: Current portion | (34 | ) | |||||
Long-term portion of capital lease obligations | $ | 55 | |||||
Purchase Commitments
As of December 31, 2017, the Company’s minimum purchase commitments for products and services were $35,861, of which $17,417 represent long-term purchase commitments through the year ending December 31, 2020.
Contingencies
Under the indemnification provisions of the Company’s customer agreements, the Company agrees to indemnify and defend and hold harmless its customers against, among other things, infringement of any patent, trademark or copyright under any country’s laws or the misappropriation of any trade secret arising from the customers’ legal use of the Company’s solutions. The exposure to the Company under these indemnification provisions is generally limited to the total amount paid by the customers under the applicable customer agreement. However, certain indemnification provisions potentially expose the Company to losses in excess of the aggregate amount paid to the Company by the customer under the applicable customer agreement. To date, there have been no claims against the Company or its customers pursuant to these indemnification provisions.
Legal Contingencies
From time to time, the Company may be involved in legal proceedings and subject to claims in the ordinary course of business. For lawsuits where the Company is the defendant, the Company is in the process of defending these litigation matters, and while there can be no assurances and the outcomes of these matters are currently not determinable, the Company currently believes that there are no existing claims or proceedings that are likely to have a material adverse effect on the Company's financial position, results of operations or cash flows.
8. Convertible Senior Notes
0.75% Convertible Senior Notes due June 2020
On June 17, 2015, the Company issued $200,000 principal amount of 0.75% Convertible Senior Notes (the “0.75% Notes”) due 2020 in a private offering to qualified institutional buyers (“Holders”) pursuant to Rule 144A under the Securities Act of 1934, as amended (the “Securities Act”). The initial Holders of the 0.75% Notes also had an option to purchase an additional $30,000 in principal amount which was exercised in full. The net proceeds after the agent’s discount and issuance costs of $6,581 from the 0.75% Notes offering were approximately $223,419. The Company uses the net proceeds for working capital and general corporate purposes, which may include funding the Company’s operations, capital expenditures, and potential acquisitions of businesses, products or technologies believed to be of strategic importance. The 0.75% Notes bear interest at 0.75% per year, payable semi-annually in arrears every June 15 and December 15, beginning on December 15, 2015.
89
Proofpoint, Inc.
Notes to Consolidated Financial Statements (Continued)
(dollars and share amounts in thousands, except per share amounts)
The 0.75% Notes are unsecured and rank senior in right of payment to any indebtedness expressly subordinated in right of payment to the 0.75% Notes. They rank equally with the Company’s other existing and future unsecured indebtedness that is not subordinated and are structurally subordinated to any current or future secured indebtedness to the extent of the value of the assets securing the indebtedness and other liabilities of the Company’s subsidiaries.
The initial conversion rate is 12.3108 shares of the Company’s common stock per $1 principal amount of notes which equates to 2,831 shares of common stock, or a conversion price equivalent of $81.23 per share of common stock. Throughout the term of the 0.75% Notes, the conversion rate may be adjusted upon the occurrence of certain events, such as the payment of cash dividends or issuance of stock warrants. The 0.75% Notes mature on June 15, 2020, unless repurchased, redeemed or converted in accordance with their terms prior to such date.
At the Company’s option, on or after June 20, 2018, the Company will be able to redeem all or a portion of the 0.75% Notes at 100% of the principal amount, plus any accrued and unpaid interest, under certain conditions. The Company may redeem the 0.75% Notes in shares of the Company’s common stock, cash, or some combination of each.
Prior to December 15, 2019, the 0.75% Notes will be convertible at the option of the Holders only upon the satisfaction of certain conditions and during certain periods if any of the following events occur:
• | during the calendar quarter commencing after September 30, 2015, if the last reported sale price of the Company’s common stock is greater than or equal to 130% of the applicable conversion price on each such trading day for at least 20 trading days (whether or not consecutive) during the period of 30 consecutive trading days ending on the last trading day of the preceding calendar quarter; |
• | during the 5 business day period after any 5 consecutive trading day period in which the trading price, as defined, per $1 principal amount of the 0.75% Notes for each trading day of such measurement period was less than 98% of the product of the last reported sale price of the Company’s common stock and the applicable conversion rate on each such trading day; |
• | upon a notice of redemption by the Company; or |
• | upon the occurrence of specified corporate transactions. |
Subsequent to December 15, 2019, Holders may convert their 0.75% Notes at the applicable conversion rate at any time prior to the close of business on the second scheduled trading day immediately preceding the maturity date.
Holders of the 0.75% Notes also have the right to require the Company to repurchase all or a portion of the 0.75% Notes at 100% of the principal amount, plus accrued and unpaid special interest, if any, upon the occurrence of certain fundamental changes to the Company.
In accordance with the authoritative accounting guidance, the Company allocated the total amount of the 0.75% Notes into liability and equity components. The carrying value of the liability component at issuance was calculated as the present value of its cash flows using a discount rate of 6.5% based on the blended rate between the yield rate for a Moody’s B1 rating and the average debt rate for comparable convertible transactions from similar companies. The difference between the 0.75% Notes principal and the carrying value of the liability component, representing the value of conversion premium assigned to the equity component, was recorded as an increase to additional paid in capital and as a debt discount on the issuance date. The equity component is being accreted using the effective interest rate method over the period from the issuance date through June 15, 2020 as a non-cash charge to interest expense. The amount recorded to additional paid in capital is not remeasured as long as it continues to meet the conditions for equity classification. Upon issuance of the 0.75% Notes, the Company recorded $174,359 as debt and $55,641 as additional paid in capital within stockholders’ equity.
Additionally, the debt discount and issuance costs were allocated based on the total amount incurred to the liability and equity components using the same proportions as the proceeds from the 0.75% Notes. The equity issuance costs of $1,592 were recorded as a decrease to additional paid-in capital at the issuance date.
1.25% Convertible Senior Notes due December 2018
On December 11, 2013, the Company issued $175,000 principal amount of 1.25% Convertible Senior Notes (the “1.25% Notes,” and together with the 0.75% Notes, the “Notes”) due 2018 in a private offering to Holders pursuant to Rule 144A under the Securities Act. The initial Holders of the 1.25% Notes also had an option to purchase an additional $26,250 in principal amount which was exercised in full. The net proceeds after the agent’s discount and issuance costs of $5,803 from
90
Proofpoint, Inc.
Notes to Consolidated Financial Statements (Continued)
(dollars and share amounts in thousands, except per share amounts)
the 1.25% Notes offering were approximately $195,446. The Company used the net proceeds for working capital and general corporate purposes, which included funding the Company’s operations, capital expenditures, and potential acquisitions of businesses, products or technologies believed to be of strategic importance. The 1.25% Notes bore interest at 1.25% per year, payable semi-annually in arrears every June 15 and December 15, beginning on June 15, 2014.
In accordance with the authoritative accounting guidance, the Company allocated the total amount of the 1.25% Notes into liability and equity components. The carrying value of the liability component at issuance was calculated as the present value of its cash flows using a discount rate of 6.5% based on the blended rate between the yield rate for a Moody’s B1-rating and the average debt rate for comparable convertible transactions from similar companies. The difference between the 1.25% Notes principal and the carrying value of the liability component, representing the value of conversion premium assigned to the equity component, was recorded as an increase to additional paid in capital and as a debt discount on the issuance date. The equity component was being accreted using the effective interest rate method over the period from the issuance date through the extinguishment date as a non-cash charge to interest expense. Upon issuance of the Notes, the Company recorded $156,672 as debt and $44,578 as additional paid in capital within stockholders’ equity.
Additionally, the discount and issuance costs were allocated based on the total amount incurred to the liability and equity components using the same proportions as the proceeds from the 1.25% Notes. The equity issuance costs of $1,285 were recorded as a decrease to additional paid-in capital at the issuance date.
During the year ended December 31, 2017, $201,250 of the principal amount of the 1.25% Notes was converted into 5,159 shares of common stock, with the remaining $14 paid in cash. The shares of common stock had a fair value of $473,176 at the time of the conversion. This resulted in a $2,696 loss on extinguishment that is included in interest expense in the Consolidated Statement of Operations. The loss on extinguishment was calculated as the difference between the fair value amount allocated to the liability component and net carrying amount of the liability component.
The following tables represent the carrying values of all Notes as of December 31, 2017 and 2016:
December 31, 2017 | |||||||||||
0.75% Notes | 1.25% Notes | Total | |||||||||
Liability component: | |||||||||||
Principal | $ | 230,000 | $ | — | $ | 230,000 | |||||
Less: debt discount and issuance costs, net of amortization | (32,142 | ) | — | (32,142 | ) | ||||||
Net carrying amount | $ | 197,858 | $ | — | $ | 197,858 | |||||
Equity component (1) | $ | 54,049 | $ | — | $ | 54,049 | |||||
December 31, 2016 | |||||||||||
0.75% Notes | 1.25% Notes | Total | |||||||||
Liability component: | |||||||||||
Principal | $ | 230,000 | $ | 201,250 | $ | 431,250 | |||||
Less: debt discount and issuance costs, net of amortization | (43,896 | ) | (20,813 | ) | (64,709 | ) | |||||
Net carrying amount | $ | 186,104 | $ | 180,437 | $ | 366,541 | |||||
Equity component (1) | $ | 54,049 | $ | 43,293 | $ | 97,342 | |||||
_______________________________________________________________________________
(1) | Recorded on the consolidated balance sheets as additional paid-in capital, net of the issuance costs in equity |
91
Proofpoint, Inc.
Notes to Consolidated Financial Statements (Continued)
(dollars and share amounts in thousands, except per share amounts)
For the years ended December 31, 2017, 2016 and 2015, the Company incurred the following interest expense and loss on conversion related to the Notes:
2017 | 2016 | 2015 | |||||||||
Interest expense related to contractual interest coupon | $ | 4,123 | $ | 4,240 | $ | 3,441 | |||||
Amortization of debt discount and issuance costs | 21,789 | 20,842 | 14,933 | ||||||||
Loss on conversion | 2,696 | — | — | ||||||||
Total | $ | 28,608 | $ | 25,082 | $ | 18,374 | |||||
9. Equity Award Plans
Stock-Based Compensation Plans
On March 30, 2012, the Board of Directors and the Company’s stockholders approved the 2012 Equity Incentive Plan (the "2012 Plan"), which became effective in April 2012. The Company has six equity incentive plans: the Company’s 2002 stock option plan (the “2002 Plan”), the 2012 Plan, and four plans assumed by the Company upon various business acquisitions. The assumed plans are the Cloudmark plan, the WebLife plan, and two FireLayers plans. Upon the Company’s initial public offering, all shares that were reserved under the 2002 Plan but not issued, and shares issued but subsequently returned to the plan through forfeitures, cancellations and repurchases became part of the 2012 Plan and no further shares will be granted pursuant to the 2002 Plan. No further shares will be granted pursuant to the assumed plans. All outstanding stock awards under the 2002 Plan, the assumed plans and 2012 Plan will continue to be governed by their existing terms. Under the 2012 Plan, the Company has the ability to issue incentive stock options (“ISOs”), non-statutory stock options (“NSOs”), restricted stock awards, stock bonus awards, stock appreciation rights (“SARs”), restricted stock units (“RSUs”), and performance stock units (“PSUs”). The 2012 Plan also allows direct issuance of common stock to employees, outside directors and consultants at prices equal to the fair market value at the date of grant of options or issuance of common stock. Additionally, the 2012 Plan provides for the grant of performance cash awards to employees, directors and consultants. The Company has the right to repurchase any unvested shares (at the option exercise price) of common stock issued directly or under option exercises. The right of repurchase generally expires over the vesting period.
Stock bonus and other liability awards are accounted for as liability-classified awards, because the obligations are based predominantly on fixed monetary amounts that are generally known at the inception of the obligation, to be settled with a variable number of shares of the Company’s common stock.
Under the equity incentive plans, the term of an option grant shall not exceed ten years from the date of its grant and options generally vest over a three to four-year period, with vesting on a monthly or annual interval. Under the 2012 Plan, 20,316 shares of common stock are reserved for issuance to eligible participants. As of December 31, 2017, 5,283 shares were available for future grant. Restricted stock awards generally vest over a four-year period.
The Company net-share settles equity awards held by employees by withholding shares upon vesting to satisfy tax withholding obligations. The shares withheld to satisfy employee tax withholding obligations are returned to the Company’s 2012 Plan and will be available for future issuance. Payments for employee’s tax obligations to the tax authorities are recognized as a reduction to additional paid-in capital and reflected as financing activities in the Company’s consolidated statements of cash flows.
Stock Options
The fair value of options granted is estimated on the grant date using the Black-Scholes option valuation model. This valuation model for stock-based compensation expense requires the Company to make assumptions and judgments about the variables used in the calculation, including the expected term (weighted-average period of time that the options granted are expected to be outstanding), the volatility of the common stock price and the assumed risk-free interest rate. Upon adoption of ASU 2016-09 in the year ended December 2017, the Company has made an accounting policy election to account for forfeitures as they occur.
No options were granted during the year ended December 31, 2017. The weighted average fair value of stock options granted to employees during the years ended December 31, 2016 and 2015 was $24.04 and $28.20, respectively. The
92
Proofpoint, Inc.
Notes to Consolidated Financial Statements (Continued)
(dollars and share amounts in thousands, except per share amounts)
fair values were estimated on the grant dates using the Black-Scholes option-pricing model with the following weighted-average assumptions:
Year Ended December 31, | |||
2016 | 2015 | ||
Expected life (in years) | 5.31 - 6.08 | 5.31 - 6.08 | |
Volatility | 45% | 50% - 52% | |
Risk-free interest rate | 1.3% - 1.4% | 1.6% - 1.8% | |
Dividend yield | —% | —% | |
The estimate for expected life of options granted reflects the midpoint of the vesting term and the contractual life computed utilizing the simplified method as allowed by the SEC staff. The Company does not have significant historical share option exercise experience and hence considers the expected term assumption calculated using the simplified method to be reasonable. Starting January 1, 2016, the expected volatility of the Company's common stock is based on the Company's historical volatility. Prior to January 1, 2016, the common stock price volatility was determined based on the historical average volatilities of the common stock of a group of publicly-traded peer companies that operate in a similar industry as the Company did not have sufficient trading history for its common stock. The risk-free interest rate used was the Federal Reserve Bank's constant maturities interest rate commensurate with the expected life of the options in effect at the time of the grant. The expected dividend yield was zero, as the Company does not anticipate paying a dividend within the relevant time frame.
The Company realized no income tax benefit from stock option exercises in each of the periods presented due to recurring losses and the valuation allowances for deferred tax assets.
Stock option activity is as follows:
Shares subject to Options Outstanding | ||||||||||||
Number of Shares | Weighted Average Exercise Price | Weighted Average Remaining Contractual Term (in years) | Aggregate Intrinsic Value | |||||||||
Balance at December 31, 2014 | 5,288 | $ | 11.06 | 6.31 | $ | 196,608 | ||||||
Options granted | 284 | 57.47 | ||||||||||
Options exercised | (1,429 | ) | 8.31 | |||||||||
Options forfeited and canceled | (101 | ) | 19.11 | |||||||||
Balance at December 31, 2015 | 4,042 | 15.10 | 5.77 | $ | 201,736 | |||||||
Options assumed per FireLayers acquisition | 20 | 4.33 | ||||||||||
Options granted | 237 | 54.11 | ||||||||||
Options exercised | (1,089 | ) | 11.59 | |||||||||
Options forfeited and canceled | (27 | ) | 43.15 | |||||||||
Balance at December 31, 2016 | 3,183 | 18.91 | 5.39 | $ | 164,842 | |||||||
Options assumed per business acquisitions | 13 | 20.27 | ||||||||||
Options exercised | (1,126 | ) | 11.04 | |||||||||
Options forfeited and canceled | (30 | ) | 45.54 | |||||||||
Balance at December 31, 2017 | 2,040 | $ | 22.88 | 5.17 | $ | 134,511 | ||||||
Exercisable, December 31, 2017 | 1,809 | $ | 19.37 | 4.83 | $ | 125,608 | ||||||
Vested and expected to vest, December 31, 2017 | 2,040 | $ | 22.88 | 5.17 | $ | 134,511 | ||||||
93
Proofpoint, Inc.
Notes to Consolidated Financial Statements (Continued)
(dollars and share amounts in thousands, except per share amounts)
The total intrinsic value of options exercised was $82,131, $58,061 and $72,993, for the years ended December 31, 2017, 2016 and 2015, respectively. Total cash proceeds from such option exercises were $12,383, $12,620 and $11,868 for the years ended December 31, 2017, 2016 and 2015, respectively.
The grant date fair value of options that vested was $7,450, $9,106 and $9,520 during the years ended December 31, 2017, 2016 and 2015, respectively.
As of December 31, 2017, the Company had unrecognized stock-based compensation expense of $7,341 related to stock options that will be recognized, over the average remaining vesting term of the options of 1.65 years.
Restricted Stock Units and Performance Stock Units
A following table summarizes the activity of RSUs and PSUs:
RSUs and PSUs Outstanding | ||||||
Number of Shares | Granted Fair Value Per Unit | |||||
Awarded and unvested at December 31, 2014 | 2,934 | $ | 37.45 | |||
Awards granted | 1,541 | 61.48 | ||||
Awards vested | (897 | ) | 38.70 | |||
Awards forfeited | (267 | ) | 41.89 | |||
Awarded and unvested at December 31, 2015 | 3,311 | 47.94 | ||||
Awards granted | 1,605 | 64.08 | ||||
Awards vested | (1,116 | ) | 44.73 | |||
Awards forfeited | (335 | ) | 51.40 | |||
Awarded and unvested at December 31, 2016 | 3,465 | 56.11 | ||||
Awards assumed per business acquisition | 8 | 91.10 | ||||
Awards granted | 1,865 | 84.91 | ||||
Awards vested | (1,320 | ) | 52.36 | |||
Awards forfeited | (478 | ) | 63.44 | |||
Awarded and unvested at December 31, 2017 | 3,540 | $ | 71.77 | |||
As of December 31, 2017, there was $197,681 of unamortized stock-based compensation expense related to unvested RSUs, which are expected to be recognized over a weighted average period of 2.90 years.
The Company granted 177, 146 and 189 PSUs in the years ended December 31, 2017, 2016 and 2015, respectively. The PSU vesting conditions were based on individual performance targets. Unamortized stock-based compensation expense was $16,367 as of December 31, 2017.
Stock Bonus Awards and Other Liability Awards
The total accrued liability for the stock bonus awards and other liability awards was $8,502 and $7,855 as of December 31, 2017 and 2016, respectively.
During the years ended December 31, 2017, 2016 and 2015, 85, 93 and 30 shares of common stock earned under the stock bonus program were issued. Stock-based compensation expense related to stock bonus program were $6,616, $5,288 and $3,792, respectively, for the years ended December 31, 2017, 2016 and 2015.
In March 2015, the Company issued liability awards with a fair value of $6,885, which vest over three years period and are subject to continuous service and other conditions. The liability awards will be settled with a variable number of shares of the Company’s common stock. During the year ended December 31, 2017 and December 31, 2016, 29 and 45
94
Proofpoint, Inc.
Notes to Consolidated Financial Statements (Continued)
(dollars and share amounts in thousands, except per share amounts)
shares were vested and issued. The Company recognized $2,293, $2,299 and $1,884 of stock-based compensation expense related to these liability awards in the years ended December 31, 2017, 2016 and 2015.
Employee Stock Purchase Plan
On March 30, 2012, the Board of Directors and the Company’s stockholders approved the 2012 Employee Stock Purchase Plan (the “ESPP”), which became effective in April 2012. A total of 745 shares of the Company’s common stock were initially reserved for future issuance under the ESPP. The number of shares reserved for issuance under the ESPP will increase automatically on January 1 of each of the first eight years commencing with 2013 by the number of shares equal to 1% of the Company’s shares outstanding on the immediately preceding December 31, but not to exceed 1,490 shares, unless the Board of Directors, in its discretion, determines to make a smaller increase. As of December 31, 2017, there were 1,608 shares of the Company’s common stock available for future issuance under the ESPP.
The fair value of the option component of the ESPP shares was estimated at the grant date using the Black-Scholes option pricing model with the following weighted average assumptions:
Year ended December 31, | |||||
2017 | 2016 | 2015 | |||
Expected life (in years) | 0.5 | 0.5 | 0.5 | ||
Volatility | 29% - 37% | 37% - 48% | 42% - 47% | ||
Risk-free interest rate | 0.76% - 1.16% | 0.38% - 0.45% | 0.08% - 0.33% | ||
Dividend yield | —% | —% | —% | ||
The Company issued 183 shares, 200 shares and 161 shares under the ESPP in the years ended December 31, 2017, 2016 and 2015, respectively, at a weighted average exercise price per share of $73.02, $45.65, and $41.84, respectively. As of December 31, 2017, the Company expects to recognize $1,864 of the total unamortized compensation cost related to employee purchases under the ESPP over a weighted average period of 0.37 years.
Restricted Stock and Deferred Shares
The Company granted 54 shares of restricted stock in the fourth quarter of 2014 to certain key employees with a total fair value of $2,357 and two-year cliff vesting in 2016. The shares fully vested in 2016.
The Company granted 111 shares of restricted stock in 2016 to certain key employees with a total fair value of $8,669 with annual vesting term of three years. The Company recognized $2,887 and $546 of stock based compensation expense in 2017 and 2016, respectively. As of December 31, 2017, there was $5,236 of unamortized stock-based compensation expense related to the unvested shares of restricted stock. The shares of restricted stock are subject to forfeiture if employment terminates prior to the lapse of the restrictions, and are expensed over the vesting period. They are considered issued and outstanding shares of the Company at the grant date and have the same rights as other shares of common stock.
As part of the Weblife acquisition, 107 shares were deferred for certain key employees with the total fair value of $9,652, and a vesting period between three and four years. The Company recognized $205 of stock based compensation in 2017. As of December 31, 2017, there was $9,447 of unamortized stock-based compensation expense related to the unvested deferred shares. The deferred shares are subject to forfeiture if employment terminates prior to the lapse of the deferral date, and are expensed over the vesting period.
10. Net Loss per Share
Basic net loss per share of common stock is calculated by dividing the net loss by the weighted‑average number of shares of common stock outstanding for the period. The weighted‑average number of shares of common stock used to calculate basic net loss per share of common stock excludes those shares subject to repurchase related to stock options or restricted stock that were exercised or issued prior to vesting as these shares are not deemed to be issued for accounting purposes until they vest. Diluted net loss per share of common stock is computed by dividing the net loss using the weighted‑average number of shares of common stock, excluding common stock subject to repurchase, and, if dilutive, potential shares of common stock outstanding during the period. Basic and diluted net loss per common share was the same for all periods presented as the impact of all potentially dilutive securities outstanding was anti-dilutive.
95
Proofpoint, Inc.
Notes to Consolidated Financial Statements (Continued)
(dollars and share amounts in thousands, except per share amounts)
The following table presents the potentially dilutive common shares outstanding that were excluded from the computation of diluted net loss per share of common stock for the periods presented because including them would have been anti-dilutive:
December 31, | ||||||||
2017 | 2016 | 2015 | ||||||
Stock options to purchase common stock | 2,040 | 3,183 | 4,042 | |||||
Restricted stock units | 3,540 | 3,465 | 3,311 | |||||
Employee stock purchase plan | 118 | 92 | 81 | |||||
Common stock subject to repurchase | 90 | 135 | 54 | |||||
Stock bonus awards and other liability awards | 98 | 159 | 174 | |||||
1.25% Convertible senior notes | — | 5,158 | 5,158 | |||||
0.75% Convertible senior notes | 2,831 | 2,831 | 2,831 | |||||
Total | 8,717 | 15,023 | 15,651 | |||||
11. Segment Reporting
Operating segments are reported in a manner consistent with the internal reporting supported and defined by the components of an enterprise about which separate financial information is available, provided and is evaluated regularly by the chief operating decision maker in deciding how to allocate resources and in assessing performance. The Company’s chief operating decision maker is its Chief Executive Officer. The Company’s Chief Executive Officer reviews financial information presented on a consolidated basis. The Company has one business activity, and there are no segment managers who are held accountable for operations, operating results and plans for levels or components below the consolidated unit level. Accordingly, the Company determined that it has one operating and reportable segment.
The following sets forth total revenue by solutions offered by the Company and by geographic area. Revenue by geographic area is based upon the billing address of the customer:
Year Ended December 31, | |||||||||||
2017 | 2016 | 2015 | |||||||||
Total revenue by solution: | |||||||||||
Protection and Advanced Threat | $ | 387,695 | $ | 272,621 | $ | 183,050 | |||||
Archiving, Privacy and Governance | 127,594 | 102,875 | 82,347 | ||||||||
Total revenue | $ | 515,289 | $ | 375,496 | $ | 265,397 | |||||
Year Ended December 31, | |||||||||||
2017 | 2016 | 2015 | |||||||||
Total revenue by geographic area: | |||||||||||
United States | $ | 428,775 | $ | 312,601 | $ | 218,424 | |||||
Rest of world | 86,514 | 62,895 | 46,973 | ||||||||
Total revenue | $ | 515,289 | $ | 375,496 | $ | 265,397 | |||||
96
Proofpoint, Inc.
Notes to Consolidated Financial Statements (Continued)
(dollars and share amounts in thousands, except per share amounts)
The following sets forth long-lived tangible assets by geographic area:
December 31, | |||||||
2017 | 2016 | ||||||
Long-lived assets: | |||||||
United States | $ | 66,134 | $ | 43,789 | |||
Rest of world | 7,483 | 8,734 | |||||
Total long-lived assets | $ | 73,617 | $ | 52,523 | |||
12. Income Taxes
The domestic and foreign components of loss before income taxes were as follows for the years ended December 31, 2017, 2016 and 2015:
Year Ended December 31, | |||||||||||
2017 | 2016 | 2015 | |||||||||
Domestic | $ | (124,727 | ) | $ | (112,904 | ) | $ | (101,453 | ) | ||
Foreign | 30,440 | 2,682 | 3,376 | ||||||||
Loss before income taxes | $ | (94,287 | ) | $ | (110,222 | ) | $ | (98,077 | ) | ||
The (provision for) benefit from income taxes is comprised of:
Year Ended December 31, | |||||||||||
2017 | 2016 | 2015 | |||||||||
Current tax expense: | |||||||||||
Federal | $ | — | $ | — | $ | — | |||||
State | 80 | 72 | 54 | ||||||||
Foreign | 5,923 | 795 | 514 | ||||||||
Total current | 6,003 | 867 | 568 | ||||||||
Deferred tax expense: | |||||||||||
Federal | (12,268 | ) | 411 | 105 | |||||||
State | (266 | ) | — | (45 | ) | ||||||
Foreign | (3,419 | ) | (292 | ) | 7 | ||||||
Total deferred | (15,953 | ) | 119 | 67 | |||||||
(Benefit from) provision for income taxes | $ | (9,950 | ) | $ | 986 | $ | 635 | ||||
97
Proofpoint, Inc.
Notes to Consolidated Financial Statements (Continued)
(dollars and share amounts in thousands, except per share amounts)
As the result of adopting ASU 2016-09, the Company recorded excess tax benefits on a prospective basis starting January 1, 2017 (Note 1). The reconciliation of income tax expense (benefit) at the statutory federal income tax rate of 34% to the income tax provision (benefit) included in the consolidated statements of operations for the years ended December 31, 2017, 2016 and 2015 is as follows:
Year Ended December 31, | |||||||||||
2017 | 2016 | 2015 | |||||||||
Tax at federal statutory rate | $ | (32,058 | ) | $ | (37,476 | ) | $ | (33,346 | ) | ||
Foreign income tax rate differential | (3,076 | ) | (187 | ) | (270 | ) | |||||
State, net of federal benefit | (3,378 | ) | (3,478 | ) | (2,952 | ) | |||||
Stock compensation charges | (32,150 | ) | 3,517 | 2,393 | |||||||
SubPart F and other permanent items | 2,757 | 1,422 | 1,434 | ||||||||
Provision to return and other | 2,480 | 1,419 | 749 | ||||||||
Research and development credits | (7,713 | ) | (4,464 | ) | (2,920 | ) | |||||
Uncertain tax positions | 5,888 | 749 | 561 | ||||||||
Impact of Tax Act and other tax law changes | 87,495 | — | — | ||||||||
Valuation allowance | (30,195 | ) | 39,484 | 34,986 | |||||||
(Benefit from) provision for income taxes | $ | (9,950 | ) | $ | 986 | $ | 635 | ||||
Deferred tax assets and liabilities reflect the net tax effects of net operating loss and tax credit carryovers and the temporary differences between the carrying amount of assets and liabilities for financial reporting and the amounts used for income tax purposes. Significant components of the Company’s deferred tax assets were as follows:
At December 31, | |||||||
2017 | 2016 | ||||||
Deferred tax assets: | |||||||
Net operating loss carryforwards | $ | 158,535 | $ | 119,168 | |||
Tax credit carryforwards | 24,700 | 13,966 | |||||
Research expenditures | 859 | 2,401 | |||||
Deferred revenue | 14,460 | 13,698 | |||||
Stock compensation | 14,842 | 18,509 | |||||
Fixed assets | 274 | 207 | |||||
Accruals and other | 10,107 | 11,554 | |||||
Gross deferred tax assets | 223,777 | 179,503 | |||||
Valuation allowance | (194,943 | ) | (141,398 | ) | |||
Total deferred tax assets | 28,834 | 38,105 | |||||
Deferred tax liabilities: | |||||||
Intangible assets and other | (12,086 | ) | (8,793 | ) | |||
Deferred commissions | (7,881 | ) | (9,545 | ) | |||
Convertible senior notes | (6,857 | ) | (21,541 | ) | |||
Total deferred tax liabilities | (26,824 | ) | (39,879 | ) | |||
Total net deferred tax assets (liabilities) | $ | 2,010 | $ | (1,774 | ) | ||
Non-current deferred income tax assets (included in other long-term assets) | $ | 2,543 | $ | 2,121 | |||
Non-current deferred income tax liabilities (included in long-term liabilities) | $ | 533 | $ | 3,895 | |||
The Company records net deferred tax assets to the extent that Company believes these assets will more likely than not be realized. In making such determination, the Company considers all available positive and negative evidence, including
98
Proofpoint, Inc.
Notes to Consolidated Financial Statements (Continued)
(dollars and share amounts in thousands, except per share amounts)
future reversals of existing taxable temporary differences, projected future taxable income, tax planning strategies and recent financial operations.
Realization of deferred tax assets is dependent upon future earnings, if any, the timing and amount of which are uncertain. The valuation allowance increased by approximately $53,545 and $39,489 during the years ended December 31, 2017 and December 31, 2016, respectively. The change in valuation allowance for the year ended December 31, 2017, includes an increase of $79,336 related to the prospective adoption of ASU 2016-09, an increase of $2,554 related to 2013 convertible notes conversion, and an increase of $1,525 related to the Cloudmark acquisition.
In December 22, 2017, the U.S. government enacted comprehensive tax legislation commonly referred to as the Tax Cuts and Jobs Act (the “Tax Act”). The Tax Act significantly impacts the future ongoing U.S. corporate income tax by, among things, lowering the U.S. corporate income tax rates from 34% to 21%, providing for unlimited net operating loss carry-forward periods, and implementing a territorial tax system. The reduction of the U.S. corporate tax rate required the Company to revalue its U.S. deferred tax assets and liabilities to the recently enacted federal rate of 21%. This transitional impact resulted in a provisional deferred tax benefit of $2,024 in the period ended December 31, 2017 related to a reduction in a US deferred tax liability on certain long-lived acquired intangibles. This transitional impact also resulted in a $87,621 provisional reduction of certain of the Company’s US deferred tax assets which are offset by a full valuation allowance.
During the year ended December 31, 2017, the Company recorded a deferred tax benefit of $7,904 and $4,440 related to changes in the Company’s US valuation allowances as a result of the Cloudmark and WebLife acquisitions, respectively.
As of December 31, 2017 and December 31, 2016, the Company had net operating loss carry-forwards for federal income tax purposes of $659,587 and $533,825, respectively. The federal net operating losses will expire between 2018 and 2037. As of December 31, 2017 and December 31, 2016, the Company had federal research credit carry-forwards of $16,122 and $9,231 respectively. The federal research and development credits will begin to expire in 2022.
As of December 31, 2017 and December 31, 2016, the Company had net operating loss carry-forwards for state income tax purposes of approximately $323,013 and $305,493, respectively. The state net operating losses will continue to expire between 2018 and 2037. As of December 31, 2017 and December 31, 2016, the Company had research and development credit carry-forwards for state income tax purpose of $18,362 and $11,195, respectively. The state research and development credits have no expiration period.
As of December 31, 2017, the Company had no net operating losses carry-forwards in non-U.S. locations. As of December 31, 2016, the Company had net operating losses carry-forwards in non-U.S. locations of approximately $7,045. The non-US operating losses carry-forwards have no expiration period. In addition, as of December 31, 2017 and December 31, 2016, the Company had research and development credit carry-forwards in its non-U.S. locations of approximately $2,375 and $2,010, respectively. The non-U.S. research and development credits will begin to expire in 2031.
Utilization of the federal and state net operating losses may be subject to substantial annual limitation due to the ownership change limitations provided by the Internal Revenue Code and similar state provisions. Analyses have been conducted to determine whether an ownership change had occurred since inception. The analyses have indicated that although ownership changes have occurred in prior years, the net operating losses and research and development credits would not expire before utilization as a result of the ownership change. In the event the Company has subsequent changes in ownership, net operating losses and research and development credit carryovers could be limited and may expire unutilized as a result of the subsequent ownership change.
The Company recognizes interest and penalties related to uncertain tax positions within the income tax expense line in the consolidated statements of operations. Accrued interest and penalties are included within the related tax liability line in the consolidated balance sheets. During the year ended December 31, 2017, the Company reduced income tax benefit by $90 from interest and penalties related to tax contingencies and has $288 of interest and penalties recorded as a long-term income tax liability as of December 31, 2017. During the year ended December 31, 2016, the Company reduced income tax expense by $45 from interest and penalties related to tax contingencies and had $182 of interest and penalties recorded as a long-term income tax liability.
As of December 31, 2017, the Company had recorded unrecognized tax benefits of $4,700 that if recognized, would benefit the Company’s effective tax rate. As of December 31, 2016, the Company had recorded unrecognized tax benefits of $922 that if recognized, would benefit the Company’s effective tax rate.
99
Proofpoint, Inc.
Notes to Consolidated Financial Statements (Continued)
(dollars and share amounts in thousands, except per share amounts)
The Company is currently under audit by the Israel Tax Authority for tax years 2013 through 2017. Related to the audit by the Israel Tax Authority it is reasonably possible that the Company’s uncertain tax positions could change within the next 12 months. An estimate of the range of any change cannot be made. The Company believes it has recorded all appropriate provisions for all jurisdictions and open years. However, the Company can give no assurance that taxing authorities will not propose adjustments that would increase its tax liabilities. The Company is not currently under audit by the IRS or any similar taxing authority in any other material jurisdiction.
Because of net operating loss and credit carry-forwards, all of the Company’s tax years dating to inception in 2002 remain open to tax examination in U.S. and certain state tax jurisdictions. For other major non-U.S. jurisdictions, tax years from 2010 to present remain open to tax examination. The Company is not currently under audit in any material jurisdictions.
The aggregate changes in the balance of gross unrecognized tax benefits were as follows:
Balance as of December 31, 2014 | $ | 4,229 | |
Increase in balances related to tax positions taken during the current period | 806 | ||
Increase in balances related to tax positions taken during the prior period | — | ||
Decrease in balances related to tax positions taken during the prior period | (130 | ) | |
Decrease in balances related to statute expirations during the current period | (85 | ) | |
Balance as of December 31, 2015 | 4,820 | ||
Increase in balances related to tax positions taken during the current period | 1,262 | ||
Increase in balances related to tax positions taken during the prior period | 20 | ||
Decrease in balances related to tax positions taken during the prior period | (17 | ) | |
Decrease in balances related to statute expirations during the current period | (239 | ) | |
Balance as of December 31, 2016 | 5,846 | ||
Increase in balances related to tax positions taken during the current period | 8,160 | ||
Increase in balances related to tax positions taken during the prior period | 45 | ||
Decrease in balances related to tax positions taken during the prior period | (2 | ) | |
Decrease in balances related to statute expirations during the current period | (188 | ) | |
Balance as of December 31, 2017 | $ | 13,861 | |
As part of the transition to the new territorial tax system, the Act imposes a one-time repatriation tax on deemed repatriation of historical earnings of foreign subsidiaries. Based on the current evaluation of the Company’s operations, no repatriation tax charge is anticipated due to negative earnings and profits in the Company’s foreign operations.
The Company continues to appropriately refine such amounts within the measurement period allowed by Staff Accounting Bulletin No. 118, which will continue through the end of 2018. In addition, further interpretations from U.S. Federal and State governments and regulatory organizations may change the accounting treatment of the provisional tax liability.
13. Subsequent Event
On February 2, 2018, the Company entered into a definitive agreement to acquire Wombat Securities Technologies, Inc. (“Wombat”). The aggregate consideration payable in exchange for all of the outstanding equity interests of Wombat is approximately $225 million. The consideration is subject to an adjustment based on (i) purchase price adjustment provisions for indebtedness, cash, transaction expenses and net working capital of Wombat and (ii) indemnification obligations of Wombat stockholders and option holders after the acquisition. Approximately 10% of the aggregate consideration will be placed in escrow to satisfy certain indemnification obligations of Wombat stockholders and option holders.
Wombat provides security awareness computer-based training. By combining Wombat’s market-leading technology with the Company’s industry leading threat detection and intelligence, enterprises will have the most accurate insights into their employees’ vulnerability to the real phishing attacks. In addition, by collecting user-reported phishing threat data from
100
Proofpoint, Inc.
Notes to Consolidated Financial Statements (Continued)
(dollars and share amounts in thousands, except per share amounts)
Wombat’s PhishAlarm solution, the Company’s intelligence will amplify to include data on phishing campaigns as seen by non-company customers, providing broader visibility and intelligence to the Company’s Nexus platform.
The acquisition date is subject to customary closing conditions and expected to occur in the first half of 2018.
101
EXHIBIT INDEX
Incorporated by Reference | |||||||||||
Exhibit No. | Exhibit Title | Form | File No. | Filing Date | Exhibit No. | ||||||
3.01 | S-1A | 333-178479 | April 9, 2012 | 3.02 | |||||||
3.02 | S-1A | 333-178479 | April 9, 2012 | 3.04 | |||||||
4.01 | S-1A | 333-178479 | April 9, 2012 | 4.01 | |||||||
4.02 | 8-K | 001-35506 | June 17, 2015 | 4.1 | |||||||
10.01 | 10-Q | 001-35506 | October 31, 2017 | 10.01 | |||||||
10.02 | † | S-1A | 333-178479 | April 9, 2012 | 10.02 | ||||||
10.03 | † | S-1A | 333-178479 | April 9, 2012 | 10.03 | ||||||
10.04 | † | S-1A | 333-178479 | April 9, 2012 | 10.04 | ||||||
10.05 | † | 10-K | 001-35506 | February 26, 2015 | 10.05 | ||||||
10.06 | S-1 | 333-178479 | December 14, 2011 | 10.05 | |||||||
10.07 | † | S-1 | 333-178479 | December 14, 2011 | 10.07 | ||||||
10.08 | † | S-1A | 333-178479 | January 25, 2012 | 10.08 | ||||||
10.09 | † | S-1A | 333-178479 | January 25, 2012 | 10.11 | ||||||
10.10 | † | 10-K | 001-35506 | March 14, 2014 | 10.11 | ||||||
10.11 | † | 10-K | 001-35506 | February 23, 2017 | 10.12 | ||||||
21.01 | * | ||||||||||
23.01 | * | ||||||||||
31.01 | * | ||||||||||
31.02 | * | ||||||||||
32.01 | ** | ||||||||||
32.02 | ** | ||||||||||
101.INS | ** | XBRL Instance Document | |||||||||
101.SCH | ** | XBRL Taxonomy Extension Schema Document | |||||||||
101.CAL | ** | XBRL Taxonomy Extension Calculation Linkbase Document | |||||||||
101.DEF | ** | XBRL Taxonomy Extension Definition Linkbase Document | |||||||||
101.LAB | ** | XBRL Taxonomy Extension Label Linkbase Document | |||||||||
101.PRE | ** | XBRL Taxonomy Extension Presentation Linkbase Document | |||||||||
____________________________________________________________________
† Indicates a management contract or compensatory plan.
* Filed herewith
**These exhibits are furnished with this Annual Report on Form 10-K and are not deemed filed with the Securities and Exchange Commission and are not incorporated by reference in any filing of Proofpoint, Inc. under the Securities Act of 1933 or the Exchange Act of 1934, whether made before or after the date hereof and irrespective of any general incorporation language in such filings.
102
SIGNATURES
Pursuant to the requirements of Section 13 or 15(d) of the Securities Exchange Act of 1934, the Company has duly caused this report to be signed on its behalf by the undersigned, thereunto duly authorized, on February 23, 2018.
PROOFPOINT, INC. | |||
By: | /s/ GARY STEELE | ||
Gary Steele Chief Executive Officer | |||
POWER OF ATTORNEY
KNOW ALL PERSONS BY THESE PRESENTS, that each person whose signature appears below constitutes and appoints Gary Steele and Paul Auvil, and each of them, as his or her true and lawful attorneys-in-fact and agents, with full power of substitution and resubstitution, for him or her and in his or her name, place and stead, in any and all capacities, to sign any and all amendments to this Annual Report on Form 10-K, and to file the same, with all exhibits thereto, and other documents in connection therewith, with the Securities and Exchange Commission, granting unto said attorneys-in-fact and agents, and each of them, full power and authority to do and perform each and every act and thing requisite and necessary to be done in connection therewith, as fully to all intents and purposes as he or she might or could do in person, hereby ratifying and confirming that all said attorneys-in-fact and agents, or any of them or their or his or her substitute or substitutes, may lawfully do or cause to be done by virtue hereof.
Pursuant to the requirements of the Securities Exchange Act of 1934, this report has been signed below by the following persons in the capacities and on the date indicated:
Name | Title | Date | ||
/s/ Gary Steele | Chief Executive Officer (Principal Executive Officer) | February 23, 2018 | ||
Gary Steele | ||||
/s/ Paul Auvil | Chief Financial Officer (Principal Financial Officer and Principal Accounting officer) | February 23, 2018 | ||
Paul Auvil | ||||
/s/ Dana Evan | Director | February 23, 2018 | ||
Dana Evan | ||||
/s/ Jonathan Feiber | Director | February 23, 2018 | ||
Jonathan Feiber | ||||
/s/ Kristen Gil | Director | February 23, 2018 | ||
Kristen Gil | ||||
/s/ Eric Hahn | Director | February 23, 2018 | ||
Eric Hahn | ||||
/s/ Kevin Harvey | Director | February 23, 2018 | ||
Kevin Harvey | ||||
/s/ R. Scott Herren | Director | February 23, 2018 | ||
R. Scott Herren | ||||
/s/ Michael Johnson | Director | February 23, 2018 | ||
Michael Johnson | ||||
/s/ Richard Wallace | Director | February 23, 2018 | ||
Richard Wallace | ||||
103