Attached files
| file | filename |
|---|---|
| EX-32.1 - EXHIBIT 32.1 - Integer Holdings Corp | itgr-20171229ex321.htm |
| EX-31.2 - EXHIBIT 31.2 - Integer Holdings Corp | itgr-20171229ex312.htm |
| EX-31.1 - EXHIBIT 31.1 - Integer Holdings Corp | itgr-20171229ex311.htm |
| EX-23.1 - EXHIBIT 23.1 - Integer Holdings Corp | itgr-20171229ex231.htm |
| EX-21.1 - EXHIBIT 21.1 - Integer Holdings Corp | itgr-20171229ex211.htm |
| EX-12.1 - EXHIBIT 12.1 - Integer Holdings Corp | itgr-20171229ex121.htm |
| EX-10.33 - EXHIBIT 10.33 - Integer Holdings Corp | itgr-20171229ex1033.htm |
| EX-10.32 - EXHIBIT 10.32 - Integer Holdings Corp | itgr-20171229ex1032.htm |
| EX-10.31 - EXHIBIT 10.31 - Integer Holdings Corp | itgr-20171229ex1031.htm |
UNITED STATES
SECURITIES AND EXCHANGE COMMISSION
Washington, D.C. 20549
_____________________________________
FORM 10-K
_____________________________________
ANNUAL REPORT PURSUANT TO SECTION 13 or 15(d)
OF THE SECURITIES EXCHANGE ACT OF 1934
For The Fiscal Year Ended December 29, 2017
Commission File Number 1-16137
_____________________________________
INTEGER HOLDINGS CORPORATION
(Exact name of Registrant as specified in its charter)
_____________________________________
Delaware | 16-1531026 | |
(State of Incorporation) | (I.R.S. Employer Identification No.) | |
2595 Dallas Parkway
Suite 310
Frisco, Texas 75034
(Address of principal executive offices)
(214) 618-5243
(Registrant’s telephone number, including area code)
Securities Registered Pursuant to Section 12(b) of the Act:
Title of Each Class: | Name of Each Exchange on Which Registered: | |
Common Stock, Par Value $0.001 Per Share | New York Stock Exchange | |
Securities Registered Pursuant to Section 12(g) of the Act: None
Indicate by check mark if the registrant is a well-known seasoned issuer, as defined in Rule 405 of the Securities Act. Yes x No ¨
Indicate by check mark if the registrant is not required to file reports pursuant to Section 13 or Section 15(d) of the Act. Yes ¨ No x
Indicate by check mark whether the registrant (1) has filed all reports required to be filed by Section 13 or 15(d) of the Securities Exchange Act of 1934 during the preceding 12 months (or for such shorter period that the registrant was required to file such reports), and (2) has been subject to such filing requirements for the past 90 days. Yes x No ¨
Indicate by checkmark whether the registrant has submitted electronically and posted on its corporate Web site, if any, every Interactive Data File required to be submitted and posted pursuant to Rule 405 of Regulation S-T (§232.405 of this chapter) during the preceding 12 months (or for such shorter period that the registrant was required to submit and post such files). Yes x No ¨
Indicate by check mark if disclosure of delinquent filers pursuant to Item 405 of Regulation S-K (§229.405 of this chapter) is not contained herein, and will not be contained, to the best of registrant’s knowledge, in definitive proxy or information statements incorporated by reference in Part III of this Form 10-K or any amendment to this Form 10-K. x
Indicate by check mark whether the registrant is a large accelerated filer, an accelerated filer, a non-accelerated filer, a smaller reporting company, or emerging growth company. See the definitions of large accelerated filer, accelerated filer, smaller reporting company, and emerging growth company in Rule 12b-2 of the Exchange Act.
Large accelerated filer | x | Accelerated filer | ¨ | |
Non-accelerated filer | ¨ | Smaller reporting company | ¨ | |
Emerging growth company | ¨ | |||
If an emerging growth company, indicate by check mark if the registrant has elected not to use the extended transition period for complying with any new or revised financial accounting standards provided pursuant to Section 13(a) of the Exchange Act. ¨
Indicate by check mark whether the registrant is a shell company (as defined in Rule 12b-2 of the Act). Yes ¨ No x
The aggregate market value of common stock held by non-affiliates as of June 30, 2017 (the last business day of the registrant’s most recently completed second fiscal quarter), based on the last sale price of $43.25, as reported on the New York Stock Exchange on that date: $1.3 billion. Solely for the purpose of this calculation, shares held by directors and officers and 10 percent stockholders of the registrant have been excluded. This exclusion should not be deemed a determination or an admission that these individuals are, in fact, affiliates of the registrant.
Shares of common stock outstanding as of February 16, 2018: 31,900,584
DOCUMENTS INCORPORATED BY REFERENCE
Portions of the following document are specifically incorporated by reference into the indicated parts of this report:
Document | Part | |
Proxy Statement for the 2018 Annual Meeting of Stockholders | Part III, Item 10 “Directors, Executive Officers and Corporate Governance” | |
Part III, Item 11 “Executive Compensation” | ||
Part III, Item 12 “Security Ownership of Certain Beneficial Owners and Management and Related Stockholder Matters” | ||
Part III, Item 13 “Certain Relationships and Related Transactions, and Director Independence” | ||
Part III, Item 14 “Principal Accountant Fees and Services” | ||
TABLE OF CONTENTS
PAGE | ||
Item 1. | Business..................................................................................................................................................................... | |
Item 1A. | Risk Factors............................................................................................................................................................... | |
Item 1B. | Unresolved Staff Comments...................................................................................................................................... | |
Item 2. | Properties................................................................................................................................................................... | |
Item 3. | Legal Proceedings..................................................................................................................................................... | |
Item 4. | Mine Safety Disclosures............................................................................................................................................ | |
Item 5. | ||
Item 6. | Selected Financial Data............................................................................................................................................. | |
Item 7. | Management’s Discussion and Analysis of Financial Condition and Results of Operations.................................... | |
Item 7A. | Quantitative and Qualitative Disclosures About Market Risk.................................................................................. | |
Item 8. | Financial Statements and Supplementary Data......................................................................................................... | |
Item 9. | Changes in and Disagreements With Accountants on Accounting and Financial Disclosure................................... | |
Item 9A. | Controls and Procedures............................................................................................................................................ | |
Item 9B. | Other Information...................................................................................................................................................... | |
Item 10. | Directors, Executive Officers and Corporate Governance........................................................................................ | |
Item 11. | Executive Compensation........................................................................................................................................... | |
Item 12. | ||
Item 13. | Certain Relationships and Related Transactions, and Director Independence.......................................................... | |
Item 14. | Principal Accountant Fees and Services.................................................................................................................... | |
Item 15. | Exhibits and Financial Statement Schedules............................................................................................................. | |
Item 16. | Form 10-K Summary................................................................................................................................................. | |
Signatures.................................................................................................................................................................. | ||
- 2 -
PART I
ITEM 1. BUSINESS
OVERVIEW
Integer Holdings Corporation, headquartered in Frisco, Texas, is among the world’s largest medical device outsource (“MDO”) manufacturing companies, serving the cardiac, neuromodulation, orthopedics, vascular and advanced surgical markets. We also serve the non-medical power solutions market. We provide innovative, high quality medical technologies that enhance the lives of patients worldwide. In addition, we develop batteries for high-end niche applications in energy, military, and environmental markets. Our brands include GreatbatchTM Medical, Lake Region MedicalTM and ElectrochemTM. Our primary customers include large, multi-national original equipment manufacturers (“OEMs”) and their affiliated subsidiaries. When used in this report, the terms “Integer,” “we,” “us,” “our” and the “Company” mean Integer Holdings Corporation and its subsidiaries.
On October 27, 2015, we completed the acquisition of Lake Region Medical Holdings, Inc. (“LRM”), headquartered in Wilmington, MA, in a cash and stock transaction for a total purchase price including debt assumed of approximately $1.77 billion. LRM was primarily a manufacturer of interventional and diagnostic wire-formed medical devices and components specializing in minimally invasive devices for cardiovascular, endovascular, and neurovascular applications. The acquisition of LRM added scale and diversity to our legacy operations, which has enhanced our opportunities to access customers and customer experience by providing a more comprehensive portfolio of technologies.
On March 14, 2016, we completed the spin-off of a portion of our former QiG segment through a tax-free distribution of all of the shares of our former QiG Group, LLC subsidiary to Integer’s stockholders of record as of the close of business on March 7, 2016 (the “Spin-off”). Immediately prior to completion of the Spin-off, QiG Group, LLC was converted into a corporation incorporated under the laws of Delaware and changed its name to Nuvectra Corporation (“Nuvectra”). Each Integer stockholder received one share of Nuvectra common stock for every three shares of Integer common stock held as of the record date. As a result, Nuvectra became an independent, publicly traded company listed on the NASDAQ stock exchange. Integer retains no ownership interest in Nuvectra.
Refer to Note 2 “Divestiture and Acquisition” of the Notes to Consolidated Financial Statements contained in Item 8 of this report for further description of these transactions.
SEGMENT INFORMATION
We reorganized our operations, including our internal management and financial reporting structure, and aligned our segments in fiscal year 2016 due to the LRM acquisition and the Spin-off. For more information on our segments, please refer to Note 17 “Segment and Geographic Information” of the Notes to Consolidated Financial Statements contained in Item 8 of this report.
Our operating segments, along with their related product lines, are as follows:
Medical
• | Advanced Surgical, Orthopedics & Portable Medical |
• | Cardio & Vascular |
• | Cardiac & Neuromodulation |
Non-Medical
• | Electrochem |
- 3 -
MEDICAL
Advanced Surgical, Orthopedics & Portable Medical
The Advanced Surgical, Orthopedics & Portable Medical (“AS&O”) product line offers a broad range of products and services across the many businesses it serves. In partnership with customers, AS&O offers advanced development, engineering and program management, which provides us with an in-depth understanding of our customers’ market drivers and end-user needs.
The following are the principal products and services offered by our AS&O product line:
Arthroscopic Devices & Components. Our arthroscopic devices & component products include devices used for minimally invasive surgery in the joint space, also referred to as “sports medicine.” Our products include shaver blades and burrs, ablation probes, and suture anchors, which are used in procedures such as arthroscopic ACL reconstruction, arthroscopic repair, rotator cuff repair, and hip labrum repair.
Laparoscopic & General Surgery. Our laparoscopic & general surgery products include devices used primarily for minimally invasive procedures in the abdominal space, but may also be used in open or general surgery. Customers of our laparoscopy and general surgery products require energy-based devices and endomechanical devices that are efficient and reliable. Our products include trocars, endoscopes and laparoscopes, closure devices, harmonic scalpels, bipolar energy delivery devices, radio frequency probes, thermal tumor ablation devices and ophthalmic surgery devices.
Biopsy & Drug Delivery. Biopsy and drug delivery products include biopsy and grasping forceps, breast biopsy devices, auto injection systems, cannula-based delivery systems, implantable brachytherapy seeds, tubes, catheters, infusion and IV connectors, and wearable patient constant or variable delivery systems.
Orthopedic. Our orthopedic products include hip and shoulder joint reconstruction implants, plates, screws and spinal devices, as well as instruments and delivery systems used in hip and knee replacement, trauma fixation, extremity and spine surgeries. Orthopedic implants are used in reconstructive surgeries to replace or repair hips, knees and other joints, such as shoulders, ankles and elbows that have deteriorated as a result of disease or injury. Trauma implant systems are used primarily to reattach or stabilize damaged bone or tissue while the body heals. Spinal implant systems are used by orthopedic surgeons and neurosurgeons in the treatment of degenerative diseases, deformities and injuries in various regions of the spine.
Each implant system typically has an associated instrument set that is used specifically in the surgical implant procedure. Instruments included in a set vary by implant system. Orthopedic trays have generally been designed to allow for sterilization and re-use after an implant or other surgical procedure is performed. Recently, the industry trend is moving towards single use instrumentation. Cases are used to store, transport and arrange implant systems and other medical devices and related surgical instruments. The majority of cases are tailored for a specific implant procedure so that the instruments, implants, and other devices are arranged to match the order of use in the procedure and are securely held in clearly labeled, custom-formed pockets or brackets.
Power Solutions. Our comprehensive capabilities include expertise in a range of cell technologies. Today, our batteries power over 100 external medical devices. We provide complete mission critical batteries and other power solutions through the combined efforts of innovative research, product development, manufacturing and customer partnerships to advance the way healthcare is powered. Our offerings include state of the art customized rechargeable batteries and chargers and non-rechargeable batteries. We design and develop basic and “smart” chargers and docking stations of varying complexities to safely and reliably maximize the efficiency of the rechargeable batteries. We develop batteries, and the attendant chargers, for patient monitoring, portable defibrillators, and portable ultrasound, X-Ray machines, hearing devices and other devices. We collaborate with our customers on product development opportunities incorporating our power solutions into Class I, II or III medical devices.
- 4 -
Cardio & Vascular
The Cardio & Vascular product line offers a full range of products and services from our global facilities for the development of diagnostic and interventional cardiac and endovascular devices. Our comprehensive design and development services produce components, subassemblies and finished devices for a range of cardiac and endovascular procedures.
The following are the principal products and services offered by our Cardio & Vascular product line:
Cardiovascular and Structural Heart. Cardiovascular and structural heart products include products used for vascular, cardiac surgery and structural heart disease such as guidewire and catheter components, subassemblies and completed devices for cardiovascular, cardiac surgery and structural heart disease applications. For vascular procedures, product applications include introducers, steerable sheaths, guidewires, guide catheters, microcatheters, ultrasound catheters, and delivery systems, balloon expandable delivery systems, stents, atherectomy devices, embolic protection devices, catheter design and assembly, sterile packaging, catheter shafts, radiopaque marker bands, molded hubs, fabricated hypotube assembly, and wire stent frames. For cardiac surgery and structural heart disease procedures, product applications are comprised of access and delivery systems for patent foramen ovale closure devices, vessel harvesting systems, beating heart surgery systems, transcatheter heart valves, heart valves and leaflets, and anastomosis devices.
Peripheral Vascular, Neurovascular, Urology and Oncology. Our peripheral vascular, neurovascular, urology and oncology products are primarily focused on the design and manufacturing of devices used during the treatment of peripheral arterial disease, peripheral transcatheter embolization and occlusion, aortic aneurysm repair, arteriovenous malformations and endoscopic retrograde cholangiopancreatography. We design and manufacture guidewire and catheter components, subassemblies and completed devices for the various applications.
The primary neurovascular applications for these products are cerebrovascular aneurysms, while the urology and oncology applications are stone retrieval, thermal tumor ablation, transarterial chemoembolization and radio frequency probes. Our products within this area include peripheral vascular and urology guidewires, neurovascular and oncology micro-guidewires, angiographic and diagnostic guidewires, guiding catheters, support and crossing catheters, embolic protection devices, micro-catheters, and delivery systems.
Electrophysiology, Infusion Therapy & Hemodialysis. Our electrophysiology and infusion therapy products include devices that are used in the electrophysiology ablation catheter and cardiac rhythm systems such as guidewire and catheter components, subassemblies and completed devices for the various electrophysiology applications, as well as components and assemblies for cardiac and neurostimulation leads and implantable pulse generators (“IPG”).
Electrophysiology atrial fibrillation ablation catheters, which deliver therapy to the heart and eliminate tissue paths for irregular electrical impulses, and electrophysiology catheters, which diagnose irregular electrical impulses in the heart’s electrical system, are the focal points of our electrophysiology offering. For stimulation therapy applications, cardiac rhythm management (“CRM”) devices, such as pacemakers, implantable cardioverter defibrillator, cardiac leads and neurostimulation devices for spinal cord and deep brain stimulation, are the primary applications of focus.
Cardiac & Neuromodulation
The Cardiac & Neuromodulation product line offers a comprehensive collection of technologies and capabilities. Our complete spectrum of design, development, and manufacturing expertise provides our customers with a superior quality solution in an efficient, cost-effective and consistent manner.
Cardiac and neuromodulation products include batteries, capacitors, filtered and unfiltered feedthroughs, engineered components, implantable stimulation leads and enclosures used in implantable medical devices (“IMD”). Additionally, we offer value-added assembly for these IMDs. An IMD is an instrument that is surgically inserted into the body to provide diagnosis and/or therapy. One sector of the IMD market is cardiac, which is comprised of devices such as implantable pacemakers, implantable cardioverter defibrillators (“ICD”), cardiac resynchronization therapy (“CRT”) devices, cardiac resynchronization therapy with backup defibrillation devices (“CRT-D”), insertable cardiac monitors (“ICM”), and ventricular assist devices. Another sector of the IMD market is neuromodulation, comprised of pacemaker-type devices that stimulate nerves for the treatment of various conditions. Beyond established therapies for pain control, incontinence, movement disorders (Parkinson’s disease, essential tremor and dystonia) and epilepsy, nerve stimulation for the treatment of other disabilities such as sleep apnea, heart failure, migraines, obesity and depression has shown promising results.
- 5 -
The following are the main categories of battery-powered IMDs and the principal illness or symptoms treated by each device:
Device | Principal Illness or Symptom | |||
Pacemakers | Abnormally slow heartbeat (Bradycardia) | |||
ICDs | Rapid and irregular heartbeat (Tachycardia) | |||
CRT/CRT-Ds | Congestive heart failure | |||
ICMs | Unexplained fainting or risk of cardiac arrhythmias | |||
Neurostimulators | Chronic pain, incontinence, movement disorders, epilepsy, obesity or depression | |||
Cochlear hearing devices | Hearing loss | |||
IMD systems generally include an IPG and one or more stimulation leads. An IPG is a battery powered device that produces electrical pulses. A lead then carries this electrical pulse from the IPG to the heart, spinal cord or other location in the body. Our portfolio of proprietary technologies, products, and capabilities has been built to provide our cardiac and neuromodulation customers with a single source for the vast majority of the components and subassemblies required to manufacture an IPG or lead, including complete lead systems. Our investments in research and development have generated proprietary products such as the QHR®, QMR®, and QCAPSTM primary battery and capacitor lines, which have enabled our OEM partners to make improvements in their system offerings in terms of device reliability, size, longevity and power. Our XcellionTM line of lithium-ion rechargeable batteries leverages decades of implantable battery research, development and manufacturing expertise. This line of battery cells includes the optional CoreGuardTM feature, which enables batteries to discharge to zero volts without performance degradation.
The following are the principal products and services offered by our Cardiac & Neuromodulation product line:
Cardiac Rhythm Management. We provide a broad range of products and services to enable next generation CRM medical devices to address heart disease and heart rhythm disorders through such systems as: pacemakers, implantable cardiac defibrillators, cardiac resynchronization therapy devices, implantable cardiac monitors and other novel implantable devices. Our battery and capacitor technologies provide a reliable and safe power source for our customer’s CRM system, based on decades of research, development and manufacturing experience. As a leading supplier of low-polarization specialty-coated electrodes and lead components, we provide a full range of therapy delivery development and manufacturing solutions. We are also a leading supplier of medical stamped components, and shallow and deep draw casings and assemblies.
Neuromodulation. We offer a wide range of products and services for our customers’ next generation neuromodulation medical devices. Examples include implantable medical devices that address chronic pain, hearing loss, incontinence, movement disorders, psychiatric disorders and sleep disorders.
We help our customers develop and manufacture unique neuromodulation solutions, including IPGs, programmer systems, battery chargers, and patient controllers. We offer a full range of therapy delivery development and manufacturing solutions for low-polarization specialty-coated electrodes, lead components and fully finished lead systems.
NON-MEDICAL
Our power solutions enable the success and advancement of our customers’ critical non-medical applications. We provide custom battery packs to the energy, military and environmental markets for use in extreme environments where failure is not an option.
The following are the principal products and services offered by our Non-Medical product line:
Electrochem. Electrochem provides customized battery power and management systems, charging and docking stations, and power supplies to markets where safety, reliability, quality and durability are critical. We design customized primary (non-rechargeable) and secondary (rechargeable) battery solutions, which are used in the energy, military and environmental markets.
Electrochem’s primary lithium power solutions, which include high, moderate and low rate non-rechargeable cell solutions, are utilized in extreme conditions and can withstand exceptionally high and low temperatures, and high shock and vibration. Electrochem’s product design capability includes protective circuitry, glass-to-metal hermetic seals, fuses and diodes to help ensure safe, durable and reliable power as devices using our battery solutions are subjected to harsh conditions. Our primary batteries are often used in remote and demanding environments, including down hole drilling tools, military devices, and oceanographic buoys.
In addition to primary power solutions, Electrochem offers customized secondary or rechargeable battery packs, in a diverse range of chemistries for critical applications requiring rechargeable solutions. Rechargeable chemistries include lithium ion, lithium ion polymer, nickel metal hydride, nickel cadmium, lithium iron phosphate and sealed lead acid. Electrochem’s rechargeable battery packs include advanced electronics, smart charging and battery management systems and are used in critical military and industrial applications.
- 6 -
OTHER FACTORS IMPACTING OUR OPERATIONS
Customers
Our products are designed to provide reliable, long-lasting solutions that meet the evolving requirements and needs of our customers. The nature and extent of our commercial relationships with each of our customers are different in terms of breadth of products purchased, purchased product volumes, length of contractual commitment, ordering patterns, inventory management, and selling prices. For customers with long-term contracts, we have generally negotiated tiered pricing arrangements based on pre-determined volume levels. In general, the higher the volume level, the lower the pricing. We have pricing arrangements with our customers that at times do not specify minimum order quantities. During new contract negotiations, price level decreases (concessions) for future sales may be offered to customers in exchange for volume and/or long-term commitments. Once new contracts are signed, these prices are fixed and determinable for all future sales. We recognize revenue when it is realized or realizable and earned. This occurs when persuasive evidence of an arrangement exists, delivery has occurred, the price is fixed or determinable, the buyer is obligated to pay us (i.e. payment is not contingent on a future event), the risk of loss is transferred, there is no obligation of future performance, collectability is reasonably assured and the amount of future returns can reasonably be estimated. Those criteria are met when title passes, generally at the point of shipment.
Our visibility into customer forecasted purchases is only over a relatively short period of time into the future. Our customers may have inventory management programs, vertical integration plans and/or alternate supply arrangements that may not be communicated to or shared with us. Additionally, the relative market share among the OEM manufacturers changes periodically. Consequently, these and other factors can significantly impact our sales in any given period. Our customers may initiate field actions with respect to market-released products. These actions may include product recalls or communications with a significant number of physicians about a product or labeling issue. The scope of such actions can range from very minor issues affecting a small number of units to more significant actions. There are a number of factors, both short-term and long-term, related to these field actions that may impact our results. In the short-term, if a product has to be replaced, or customer inventory levels have to be restored, demand will increase. Also, changing customer order patterns due to market share shifts or accelerated device replacements may also have a positive or negative impact on our sales results in the near-term. These same factors may have longer-term implications as well. Customer inventory levels may ultimately have to be rebalanced to match new demand.
Our Medical customers include large multi-national medical device OEMs and their subsidiaries such as Abbott Laboratories, Biotronik, Boehringer Ingelheim, Boston Scientific, Cardinal Health, Johnson & Johnson, LivaNova, Medtronic, Nevro Corp., Philips Healthcare, Smith & Nephew, Stryker, and Zimmer Biomet. During 2017, Abbott Laboratories, Boston Scientific, Johnson & Johnson, and Medtronic collectively accounted for 55% of our total sales. We believe that the diversification of our sales among the various subsidiaries and market segments with those four customers reduces our exposure to negative developments with any one customer. The loss of a significant amount of business from any of these four customers or a further consolidation of such customers could have a material adverse effect on our financial condition and results of operations, as further explained in Item 1A “Risk Factors” of this report.
Our Non-Medical customers include large multi-national OEMs and their subsidiaries serving the energy, military and environmental services markets such as Halliburton, Teledyne Technologies and Weatherford International.
Competition
The MDO manufacturing industry has traditionally been highly fragmented with several thousand companies, many of which we believe have limited manufacturing capabilities and limited sales and marketing expertise. We believe that very few companies offer the scope of manufacturing capabilities and services that we provide to medical device companies, however, we may compete in the future against other companies that provide broad manufacturing capabilities and related services. We compete against different companies depending on the type of product or service offered or the geographic area served. We also face competition from existing and prospective customers that employ in-house capabilities to produce some of the products we provide.
Our existing or potential competitors include suppliers with different subsets of our manufacturing capabilities, suppliers that concentrate in niche markets, and suppliers that have, are developing, or may in the future develop, broad manufacturing capabilities and related services. We compete for new business at all phases of the product life cycle, which includes development of new products, the redesign of existing products and transfer of mature product lines to outsourced manufacturers. Competitive advantage is generally based on reputation, quality, delivery, responsiveness, breadth of capabilities, including design and engineering support, price, customer relationships and increasingly the ability to provide complete supply chain solutions rather than only producing and providing individual components.
Many of our customers, if they choose to undertake vertical integration initiatives, also have the capability to manufacture similar products, in house, to those that we currently supply to them.
- 7 -
Acquisitions and Investments
One facet of our growth strategy is to make acquisitions that complement our core competencies in technology and manufacturing to enable us to manufacture and sell additional products to our existing customers and to expand our business into related markets.
The rapid pace of technological development in the medical industry and the specialized expertise required in different areas of medicine make it difficult for one company alone to develop an all-encompassing portfolio of technological solutions. In addition to internally generated growth through our research, development and engineering (“RD&E”) efforts, we have relied, and expect to continue to rely, upon acquisitions, investments, and alliances to provide access to new technologies both in areas served by our existing businesses as well as in new areas and markets. This strategy also aligns with our customers’ expectations of increasing the speed to market of critical solutions.
We expect to make future investments or acquisitions where we believe that we can stimulate the development of, or acquire, new technologies and products to further our strategic objectives, and strengthen our existing businesses. Our acquisition focus, if any, will be primarily directed at smaller “bolt-on” or adjacent acquisition opportunities that have a strategic fit with our existing core businesses, particularly opportunities that support our enterprise strategy and enhance the value proposition of our product offerings. For additional information, refer to Note 2 “Divestiture and Acquisition” of the Notes to Consolidated Financial Statements contained in Item 8 of this report and “Risks Related to Our Industries” under Item 1A “Risk Factors” of this report.
Research and Development
Our position as a leading developer and manufacturer of medical devices and components is largely the result of our long history of technological innovation. We invest substantial RD&E. Our scientists, engineers and technicians focus on developing new products, improving and enhancing existing products, and expanding the use of our products in new or tangential applications. In addition to our internal technology and product development efforts, we also engage outside research institutions for unique technology projects. During fiscal years 2017, 2016, and 2015, we invested $55.2 million, $55.0 million, and $53.0 million on RD&E, respectively.
Product Development
Medical. We believe our core business is well positioned because our OEM customers leverage our portfolio of intellectual property. We continue to build a healthy pipeline of diverse medical technology opportunities and provide a new level of industry leading capabilities and services to our OEM customers across the full range of medical device products and services continuum. We are at the forefront of innovating technologies and products that help change the face of healthcare, enabling us to provide our customers with a distinct advantage as they bring complete medical systems and solutions to market. In turn, our customers are able to accelerate patient access to life enhancing therapies. We offer our customers a comprehensive portfolio comprising the best technologies, providing a single point of support, and driving optimal outcomes. Some of the more significant product development opportunities our Medical segment is pursuing are as follows:
Product Line | Product Development Opportunities | |||
AS&O | Developing a portfolio of products including single use instruments and coated products for the orthopedics market and instruments for the robotics market. | |||
Cardio & Vascular | Developing a portfolio of catheter, introducer, wire-based, sensor and coating products for the cardio and vascular markets. | |||
Cardiac & Neuromodulation | Developing next generation technology programs for our batteries, filtered feedthroughs, high voltage capacitors and lead solutions to reduce the size and cost, while increasing performance for cardiac and neuromodulation devices. | |||
Non-Medical. Some of the more significant product development opportunities our Non-Medical segment is pursuing include developing the next generation medium-rate and high rate batteries, as well as products with extended performance such as higher power pulsing capabilities and increased operating temperature range.
Patents and Proprietary Technology
Our policy is to protect our intellectual property rights related to our technologies and products and we rely on a combination of patents, licenses, trade secrets and know-how to establish and protect our rights. Where appropriate, we apply for U.S. and foreign patents. We also are a party to license agreements with third parties under which we have obtained, on varying terms, exclusive or non-exclusive rights to patents held by them. As of December 29, 2017, we owned 983 U.S. and foreign patents and held licenses to an additional 279 U.S. and foreign patents. As of December 29, 2017, we also have 296 U.S. and foreign pending patent applications at various stages of approval.
Design, development and regulatory aspects of our business also provide competitive advantages, and we require our employees, consultants and other parties having access to our confidential information to execute confidentiality agreements. These
- 8 -
agreements prohibit disclosure of confidential information to third parties, except in specified circumstances. In the case of employees and consultants, the agreements generally provide that all confidential information relating to our business is the exclusive property of Integer.
Manufacturing and Quality Control
We leverage our strength as an innovative designer and manufacturer of finished devices and components to the medical device industry. Our manufacturing and engineering services include: design, testing, component production, and device assembly. We have integrated our proprietary technologies in our own products and those of our customers. Our flexible, high productivity manufacturing capabilities span sites across the United States, Mexico, Uruguay, Europe, and Malaysia.
Due to the highly regulated nature of the products we produce, we have implemented strong quality systems across all sites. The quality systems at our sites are compliant with and certified to various recognized international standards, requirements, and directives. Each site’s quality system is certified under an applicable International Organization for Standardization (“ISO”) quality system standard, such as ISO 13485 or ISO 9001. This certification requires, among other things, an implemented quality system that applies (where applicable) to the design and manufacture of components, assemblies and finished medical devices, including component quality and supplier control. Maintenance of these certifications for each facility requires periodic re-examination from an independent notified body.
Along with ISO 13485, the facilities producing finished medical devices are subject to extensive and rigorous regulation by numerous government bodies, including the U.S. Food and Drug Administration (“FDA”) and comparable international regulatory agencies in order to ship product worldwide. For these facilities, we maintain FDA registration and compliance with all applicable domestic and international regulations. Compliance with applicable regulatory requirements is subject to continual review and is monitored through periodic inspections by the FDA and other international regulatory bodies.
Sales and Marketing
We sell our products directly to our customers. In 2017, approximately 59% of our products were sold in the U.S. Sales outside the U.S. are primarily to customers whose corporate offices are located and headquartered in the U.S. Information regarding our sales by geographic area is set forth in Note 17 “Segment and Geographic Information” of the Notes to Consolidated Financial Statements contained in Item 8 of this report.
Although the majority of our customers contract with us to develop custom components and assemblies to fit their product specifications, we also provide system and device solutions ready for market distribution by OEMs. We have established close working relationships between our internal program managers and our customers. We market our products and technologies at industry meetings and trade shows domestically and internationally.
Internal account executives support all sales activity and involve engineers and technology professionals in the sales process to address customer requests across all product lines. For system and device solutions, we partner with our customers’ research, marketing, and clinical groups to jointly develop technology platforms in alignment with their product roadmaps and therapy needs.
We leverage our account executives with support from our engineers to design and sell product solutions into our targeted markets. Our account executives are trained to assist our customers in selecting appropriate materials and configurations. We market our products and services through well-defined selling strategies and marketing campaigns that are customized for each of the industries we target.
We have placed additional emphasis on reaching long-term agreements with our OEM customers in order to secure our revenue base. At times, we have provided our customers with price concessions in exchange for entering into long-term agreements and certain volume commitments.
Firm backlog orders at December 29, 2017 and December 30, 2016 were approximately $489 million and $407 million, respectively. The majority of the orders outstanding at December 29, 2017 are expected to be shipped within one year.
Suppliers and Raw Materials
We purchase critical raw materials from a limited number of suppliers due to the technically challenging requirements of the supplied product and/or the lengthy process required to qualify these materials both internally and with our customers. We cannot quickly establish additional or replacement suppliers for these materials because of these rigid requirements. For these critical raw materials, we maintain minimum safety stock levels and partner with suppliers through contract to help ensure the continuity of supply. Historically, we have not experienced any significant interruptions or delays in obtaining critical raw materials.
Many of the raw materials that are used in our products are subject to fluctuations in market price. In particular, the prices of stainless steel, titanium and precious metals, such as platinum, have historically fluctuated, and the prices that we pay for these materials, and, in some cases, their availability, are dependent upon general market conditions. In most cases, we have pass-
- 9 -
through pricing arrangements with our customers that purchase components containing precious metals or have established firm-pricing agreements with our suppliers that are designed to minimize our exposure to market fluctuations.
For non-critical raw material purchases, we utilize competitive pricing methods such as bulk purchases, precious metal pool buys, blanket orders, and long-term contracts to secure supply. We believe that there are alternative suppliers or substitute products available at competitive prices for all of these non-critical raw materials.
As discussed more fully in Item 1A “Risk Factors” of this report, our business depends on a continuous supply of raw materials from a limited number of suppliers. If an unforeseen interruption of supply were to occur, we may be unable to obtain substitute sources for these raw materials on a timely basis, on terms acceptable to us or at all, which could harm our ability to manufacture our products profitably or on time. Additionally, we may be unable to quickly establish additional or replacement suppliers for these materials as there are a limited number of worldwide suppliers.
Working Capital Practices
Our goal is to carry sufficient levels of inventory to ensure that we have adequate supply of raw materials from suppliers and meet the product delivery needs of our customers. We also provide payment terms to customers in the normal course of business and rights to return product under warranty to meet the operational demands of our customers. It will continue to be a priority for us to maintain appropriate working capital levels while improving our operating cash flow and pay down outstanding debt.
Government Regulation
Medical Device Regulation
The development, manufacture and sale of our products is subject to regulation by numerous agencies and legislative bodies, including the FDA and comparable foreign counterparts. In the U.S., these regulations were enacted under the Medical Device Amendments of 1976 to the Federal Food, Drug and Cosmetic Act and its subsequent amendments, and the regulations issued or proposed thereunder. These regulatory requirements subject our products and our business to numerous risks that are specifically discussed within “Risks Related to Our Industries” under Item 1A “Risk Factors” of this report. A summary of critical aspects of our regulatory environment is included below.
The FDA’s Quality System Regulations set forth requirements for our product design and manufacturing processes, require the maintenance of certain records, and provide for on-site inspection of our facilities and continuing review by the FDA. Authorization to commercially market our non-exempt products in the U.S. is granted by the FDA under procedures referred to as 510(k) pre-market notification or pre-market approval (“PMA”). These processes require us to notify the FDA of the new product and obtain FDA clearance or approval before marketing the device.
The FDA classifies medical devices based on the risks associated with the device. Devices are classified into one of three categories - Class I, Class II, or Class III. Class I devices are deemed to be low risk and are therefore subject to the least regulatory controls. Class II devices are higher risk devices than Class I and require greater regulatory controls, generally a
510(k), to provide reasonable assurance of the device’s safety and effectiveness as well as substantial equivalence to a previously cleared device, as demonstrated by data. Class III devices are generally the highest risk devices and are therefore subject to the highest level of regulatory control, requiring a PMA by the FDA before they are marketed.
We market our products in numerous foreign countries and therefore are subject to regulations affecting, among other things, product standards, sterilization, packaging requirements, labeling requirements, import laws and onsite inspection by independent bodies with the authority to issue or not issue certifications we may require to be able to sell products in certain countries. Many of the regulations applicable to our devices and products in these countries are similar to those of the FDA. The member countries of the European Union (“EU”) have adopted the European Medical Device Directives, which create a single set of medical device regulations for all member countries. These regulations require companies that wish to manufacture and distribute medical devices in the EU to maintain quality system certifications through EU recognized Notified Bodies. These Notified Bodies authorize the use of the CE Mark, which allows for free movement of our products throughout the member countries. Requirements pertaining to our products vary widely from country to country, ranging from simple product registrations to detailed submissions such as those required by the FDA.
In the U.S., our introducer, guidewire, and delivery catheter products are considered Class II devices and generally the 510(k) process applies. Orthopedic instruments are considered Class I exempt, while pacing leads are subject to the Class III PMA process. In Europe, these devices are considered either Class I, Class IIa, Class III, or AIMD, under European Medical Device Directives. These Directives require companies that wish to manufacture and distribute medical devices in EU member countries to obtain a CE Mark for those products, which indicate that the products meet minimum standards of performance, essential requirements, safety conformity assessment and quality.
We believe that the procedures we use for quality controls, development, testing, manufacturing, labeling, marketing and distribution of our medical devices conform to the requirements of all pertinent regulations.
- 10 -
Environmental Health and Safety Laws
We are subject to direct governmental regulation, including the laws and regulations generally applicable to all businesses in the jurisdictions in which we operate. We are subject to federal, state and local environmental laws and regulations governing the emission, discharge, use, storage and disposal of hazardous materials and the remediation of contamination associated with the release of these materials at our facilities and at off-site disposal locations. Our manufacturing and RD&E activities may involve the controlled use of small amounts of hazardous materials. Liabilities associated with hazardous material releases arise principally under the Federal Comprehensive Environmental Response, Compensation and Liability Act and analogous state laws that impose strict, joint and several liability on owners and operators of contaminated facilities and parties that arrange for the off-site disposal of hazardous materials. Except as described below, we are not aware of any material noncompliance with the environmental laws currently applicable to our business and we are not subject to any material claim for liability with respect to contamination at any of our facilities or any off-site location. We may, however, become subject to these environmental liabilities in the future as a result of our historic or current operations.
Our Collegeville, Pennsylvania facility, which was acquired as part of the LRM acquisition, is subject to an administrative consent order entered into with the U.S. Environmental Protection Agency (the “EPA”), which requires ongoing groundwater treatment and monitoring at the site as a result of historic leaks from underground storage tanks. Upon approval by the EPA of our proposed Post Remediation Care Plan (“PRCP”), which requires a continuation of the groundwater treatment and monitoring process at the site, we expect that the consent order will be terminated. We are hopeful that a decision from the EPA on whether our PRCP has been approved and the consent order removed will be made by the end of 2018. The groundwater treatment process at the Collegeville facility consists of a groundwater extraction and treatment system and the performance of annual sampling of a defined set of groundwater wells as a means to monitor containment within approved boundaries.
Conflict Minerals and Supply Chain
We are subject to Securities and Exchange Commission (“SEC”) rules adopted pursuant to the Dodd-Frank Wall Street Reform and Consumer Protection Act concerning “conflict minerals” (generally tin, tantalum, tungsten and gold) and similar rules are being implemented by the EU. Certain of these conflict minerals are used in the manufacture of our products. These rules require us to investigate the source of any conflict minerals necessary to the production or functionality of our products. If any such conflict minerals originated in the Democratic Republic of the Congo or adjoining countries (the “DRC region”), we must undertake comprehensive due diligence to determine whether such minerals financed or benefited armed groups in the DRC region. Since our supply chain is complex, our ongoing compliance with these rules could affect the pricing, sourcing and availability of conflict minerals used in the manufacture of our products.
We are also subject to disclosure requirements regarding abusive labor practices in portions of our supply chain under the California Transparency in Supply Chains Act and the UK Modern Slavery Act.
Other Laws and Regulations
Our sales and marketing practices are subject to regulation by the U.S. Department of Health and Human Services pursuant to federal anti-kickback laws, and are also subject to similar state laws.
Employees
As of December 29, 2017, we employed approximately 9,700 persons, of whom approximately 5,050 are located in the U.S., 2,650 are located in Mexico, 1,500 are located in Europe, 300 are located in South America, and 200 are located in Southeast Asia. We also employ approximately 650 temporary employees worldwide to assist us with various projects and service functions and address peaks in staff requirements. Our employees at our Chaumont, France, Tijuana, Mexico, and Aura, Germany facilities are represented by a union. We believe that we have a good relationship with our employees.
Seasonality
Our quarterly net sales are influenced by many factors, including new product introductions, customer inventory management initiatives, acquisitions, regulatory approvals, patient and physician holiday schedules and other factors. Net sales in the third quarter are typically lower than other quarters of the year as a result of patient tendencies to defer, if possible, procedures during the summer months and from the seasonality of the U.S. and European markets, where summer vacation schedules normally result in fewer procedures.
- 11 -
Inflation
We utilize certain critical raw materials (including precious metals) in our products. Our results may be negatively impacted by an increase in the price of these critical raw materials. This risk is partially mitigated as many of the supply agreements with our customers allow us to partially adjust prices for the impact of any raw material price increases and the supply agreements with our vendors have final one-time buy clauses to meet a long-term need. Historically, raw material price increases have not materially impacted our net results of operations.
Available Information
The SEC maintains a website that contains reports, proxy and information statements, and other information regarding issuers, including the Company, that file electronically with the SEC. The public can obtain any documents that we file with the SEC at http://www.sec.gov. We file annual reports, quarterly reports, proxy statements, and other documents with the SEC under the Securities Exchange Act of 1934, as amended (the “Exchange Act”). The public may read and copy any materials that we file with the SEC at the SEC’s Public Reference Room at 100 F Street, N.E., Room 1580, Washington, D.C. 20549. Please call the SEC at 1-800-SEC-0330 for further information on the operation of the public reference facilities.
We also make available free of charge through our Internet website our annual report on Form 10-K, quarterly reports on Form 10-Q, current reports on Form 8-K and amendments to those reports filed or furnished pursuant to Section 13(a) or 15(d) of the Exchange Act as soon as reasonably practicable after we electronically file those reports with, or furnish them to, the SEC. Our Internet address is www.integer.net. The information contained on our website is not incorporated by reference in this annual report on Form 10-K and should not be considered a part of this report.
EXECUTIVE OFFICERS OF THE COMPANY
Information concerning our executive officers is presented below as of February 22, 2018. The officers’ terms of office run from year to year until the first meeting of the Board of Directors occurring immediately following our Annual Meeting of Stockholders, and until their successors are elected and qualified, except in the case of earlier death, retirement, resignation or removal.
Joseph W. Dziedzic, age 49, is President and Chief Executive Officer of the Company and a member of our Board of Directors. He assumed that role on July 16, 2017 following his appointment as interim President & Chief Executive Officer on March 27, 2017. Mr. Dziedzic was the Executive Vice President and Chief Financial Officer of The Brink’s Company from 2009 to 2016, and prior to joining The Brink’s Company in 2009, he had a 20-year career with General Electric.
Gary J. Haire, age 47, is Executive Vice President and Chief Financial Officer. Prior to joining the Company on May 1, 2017, Mr. Haire served as Chief Financial Officer for Rexel North America since September 2014, and as Chief Financial Officer for Shale-Inland Holdings, LLC (now FloWorks International LLC) from January 2013 to August 2014. From 2003 to 2012, Mr. Haire served in various roles at Tyco International, including Global Vice President, Finance for Tyco Valves & Controls (Pentair) from 2010 to 2012.
Jeremy Friedman, age 64, is Executive Vice President & Chief Operating Officer and has served in that role since October of 2016. Following the Company’s acquisition of LRM in October 2015 until appointed to his current role, he was President, Cardio & Vascular. Prior to that acquisition, he was Executive Vice President of LRM and President and Chief Operating Officer of LRM’s Cardio & Vascular Division from August 2013 to October 2015. From September 2007 to August 2013, he was Executive Vice President and Chief Financial Officer of Accellent, Inc. From January 2001 until September 2007, Mr. Friedman held a number of leadership positions at Flextronics, a global contract manufacturing services firm, including Chief Operating Officer of Flextronics Network Services in Stockholm, Sweden and Senior Vice President of Finance and Operations, Components Division. From June 1994 until January 2001, he was President and Chief Operating Officer of We’re Entertainment, Inc., a specialty retailer of apparel and hard goods. Prior to 1994, Mr. Friedman held a number of finance and operations positions with Phillips-Van Heusen Corporation and KPMG.
Antonio Gonzalez, age 44, is President, CRM & Neuromodulation, and has served in that office since October 2015. From October 2014 to October 2015, he served as Vice President, Operations, Greatbatch Medical Mexico. Previously, Mr. Gonzalez served as Executive Director, Operations Mexico between November 2011 and October 2014, Director of Global Supply Chain from November 2007 to November 2011, Director of Strategic Projects from March 2006 to November 2007, and Supply Chain Manager for Greatbatch Tecnologías de Mexico from January 2005 to March 2006. Prior to joining our Company, he served in a variety of finance, operations, supply chain and customer management roles with Sanmina-SCI, BellSouth Telecommunications, HSBC and ING Bank.
Payman Khales, age 48, is President, Cardio & Vascular, and joined the company on February 20, 2018. Prior to joining Integer, Mr. Khales was the President of the Environmental Technologies Segment at CECO Environmental Company from May 2014 through July 2017. Previously, he was employed by Ingersoll Rand Company where he held a variety of different roles in the
- 12 -
United States and Canada, including Vice-President Product Management for the global Power Tools division from January 2012 through April 2014, and Vice-President Strategic Accounts & Channels from February 2010 through December 2011.
Declan Smyth, age 47, is President, Advanced Surgical & Orthopedics, having served in that office since October 2015. From January 2013 until the Company’s acquisition of LRM in October 2015, he was President of LRM’s Advanced Surgical business. From January 2012 to January 2013, he was Strategic Product Leader of Surgical Devices and Diagnostics at Accellent, Inc. and prior to that served as Senior Director of Engineering at Accellent, Inc. from August 2009 to January 2012.
Jennifer M. Bolt, age 49, is President, Electrochem, and has served in that office since October 2015. In November 2017, Ms. Bolt assumed leadership of the Power Solutions product line, and in February 2018, she assumed leadership for the Integer Manufacturing Excellence strategic imperative. From June 2013 to October 2015 she was Vice President, Supply Chain and Operational Excellence for Greatbatch. Ms. Bolt held the position of Vice President, Operations for Electrochem from May 2012 to June 2013, and prior to that served as Director of Operations of our Raynham, MA facility from September 2007 to May 2012. Ms. Bolt joined our Company in May 2005 as the Manufacturing Engineering Manager for our Alden, NY facility. Prior to joining our Company, she served in a variety of engineering and operational roles at General Motors/Delphi and Eastman Kodak.
Kirk Thor, age 54, is Executive Vice President and Chief Human Resources Officer. From 2013 until joining the Company in January 2018, Mr. Thor was Vice President for Global Talent Management & Organization Effectiveness at Flowserve Corporation. From 2007 to 2012, he served as Vice President for Talent Management & Organization Development at JC Penney. In February 2018, he assumed leadership for the Integer Culture strategic imperative.
Joseph Flanagan, age 59, is Executive Vice President for Quality and Regulatory Affairs, a position he has held since October 2015. In February 2018, he assumed co-leadership for the Integer Business Process Excellence strategic imperative. From January 2012 until the Company’s acquisition of LRM in October 2015, he was Vice President of Quality and Regulatory Affairs for LRM. Prior to joining LRM, Mr. Flanagan served as Vice President of Quality and Regulatory Affairs for NP Medical from April of 2008 until January of 2012.
Timothy G. McEvoy, age 60, is Senior Vice President, General Counsel & Secretary, and has served in that office since joining our Company in February 2007. From 1992 until January 2007, he was employed in a variety of legal roles by Manufacturers and Traders Trust Company.
Michael L. Spencer, age 48, is Senior Vice President and Chief Ethics & Compliance Officer. Prior to joining the Company in October 2015, Mr. Spencer was Chief Ethics and Compliance Officer of Orthofix Inc. where he had served since August of 2013. Prior to that, between 2001 and 2013, he served as Ethics and Compliance Officer for the Smith and Nephew Advanced Surgical Division.
- 13 -
CAUTIONARY FACTORS THAT MAY AFFECT FUTURE RESULTS
Some of the statements contained in this annual report on Form 10-K and other written and oral statements made from time to time by us are not statements of historical or current fact. As such, they are “forward-looking statements” within the meaning of Section 27A of the Securities Act of 1933, as amended, and Section 21E of the Exchange Act. We have based these forward-looking statements on our current expectations, and these statements are subject to known and unknown risks, uncertainties and assumptions. Forward-looking statements include statements relating to:
• | future sales, expenses and profitability; |
• | future development and expected growth of our business and industry; |
• | our ability to execute our business model and our business strategy; |
• | our ability to identify trends within our industries and to offer products and services that meet the changing needs of those markets; and |
• | projected capital expenditures. |
You can identify forward-looking statements by terminology such as “may,” “will,” “should,” “could,” “expects,” “intends,” “plans,” “anticipates,” “believes,” “estimates,” “predicts,” “potential” or “continue” or “variations” or the negative of these terms or other comparable terminology. These statements are only predictions. Actual events or results may differ materially from those stated or implied by these forward-looking statements. In evaluating these statements and our prospects, you should carefully consider the factors set forth below. All forward-looking statements attributable to us or persons acting on our behalf are expressly qualified in their entirety by these cautionary factors and to others contained throughout this report. Except as required by applicable law, we are under no duty to update any of the forward-looking statements after the date of this report or to conform these statements to actual results.
Although it is not possible to create a comprehensive list of all factors that may cause actual results to differ from the results expressed or implied by our forward-looking statements or that may affect our future results, some of these factors include the following: our high level of indebtedness, our inability to pay principal and interest on this high level of outstanding indebtedness or to remain in compliance with financial and other covenants under our senior secured credit facilities, and the risk that this high level of indebtedness limits our ability to invest in our business and overall financial flexibility; our dependence upon a limited number of customers; customer ordering patterns; product obsolescence; our inability to market current or future products; pricing pressure from customers; our ability to timely and successfully implement cost savings and consolidation initiatives; our reliance on third party suppliers for raw materials, products and subcomponents; fluctuating operating results; our inability to maintain high quality standards for our products; challenges to our intellectual property rights; product liability claims; product field actions or recalls; our inability to successfully consummate and integrate acquisitions and to realize synergies and to operate these acquired businesses, including LRM, in accordance with expectations; our unsuccessful expansion into new markets; our failure to develop new products; the timing, progress and ultimate success of pending regulatory actions and approvals; our inability to obtain licenses to key technology; regulatory changes, including health care or tax reform, or consolidation in the healthcare industry; global economic factors including currency exchange rates and interest rates; the resolution of various legal actions brought against the Company; and other risks and uncertainties that arise from time to time and are described in Item 1A “Risk Factors” of this report.
- 14 -
ITEM 1A. RISK FACTORS
Our business faces many risks. Any of the risks discussed below, or elsewhere in this report or in our other SEC filings, could have a material impact on our business, financial condition or results of operations.
Risks Related To Our Business
We depend heavily on a limited number of customers, and if we lose any of them or they reduce their business with us, we would lose a substantial portion of our revenues.
In 2017, Abbott Laboratories, Boston Scientific, Johnson & Johnson and Medtronic collectively accounted for approximately 55% of our revenues. Our supply agreements with these customers may not be renewed. Furthermore, many of our supply agreements do not contain minimum purchase level requirements and therefore there is no guaranteed source of revenue that we can depend upon under these agreements. The loss of any large customer, a reduction of business with that customer, or a delay or failure by that customer to make payments due to us, would harm our business, financial condition and results of operations.
If we do not respond to changes in technology, our products may become obsolete and we may experience a loss of customers and lower revenues.
We sell our products to customers in several industries that experience rapid technological changes, new product introductions and evolving industry standards. Without the timely introduction of new products, technologies and enhancements, our products and services will likely become technologically obsolete over time and we may lose or see a reduction in business from a significant number of our customers. We dedicate a significant amount of resources to the development of our products, technologies and enhancements. Our product development efforts may be affected by a number of factors, including our ability to anticipate customer needs, develop new technologies and enhancements, secure intellectual property protection for our products, and manufacture products in a cost effective manner. We would be harmed if we did not meet customer requirements and expectations. Our inability, for technological or other reasons, to successfully develop and introduce new and innovative products, technologies and enhancements could result in a loss of customers and lower revenues.
We may face competition that could harm our business and we may be unable to compete successfully against new entrants and established companies with greater resources.
Competition in connection with the manufacturing of our medical products has intensified in recent years and may continue to intensify in the future. One or more of our medical customers may undertake additional vertical integration and/or supplier diversification initiatives and begin to manufacture or dual-source some or all of their components that we currently supply to them, which could cause our operating results to suffer. The market for commercial power sources is competitive, fragmented and subject to rapid technological change. Many other commercial power source suppliers are larger and have greater financial, operational, economies of scale, personnel, sales, technical and marketing resources than us. These and other companies may develop products that are superior, technologically or otherwise, or more cost effective to ours, which could result in lower revenues and operating results.
If we are unable to successfully market our current or future products, our business will be harmed and our revenues and operating results will be adversely affected.
The markets for our products have been changing in recent years. If the markets for our products do not grow as forecasted by industry experts, our revenues could be less than expected. Furthermore, it is difficult to predict the rate at which the markets for our products will grow or if new and increased competition will result in market saturation. Slower growth in the cardiac, neuromodulation, advanced surgical, orthopedic, portable medical, cardio and vascular, environmental, military or energy markets in particular would negatively impact our revenues. In addition, we face the risk that our products will lose widespread market acceptance. Our customers may not continue to utilize the products we offer and a market may not develop for our future products.
We may at times determine that it is not technically or economically feasible for us to continue to manufacture certain products and we may not be successful in developing or marketing them. Additionally, new technologies that we develop may not be rapidly accepted because of industry-specific factors, including the need for regulatory clearance, entrenched patterns of clinical practice and uncertainty over third party reimbursement. If this occurs, our business will be harmed and our revenues and operating results will be adversely affected.
- 15 -
We intend to develop new products and expand into new markets, which may not be successful and could harm our operating results.
We intend to expand into new markets and develop new and modified products based on our existing technologies and engineering capabilities. These efforts have required and will continue to require us to make substantial investments, including significant RD&E expenditures and capital expenditures for new, expanded or improved manufacturing facilities. Additionally, many of the new products we are working on and developing take longer and more resources to develop and commercialize, including obtaining regulatory approval.
Specific risks in connection with expanding into new products and markets include: longer product development cycles, the inability to transfer our quality standards and technology into new products, the failure to receive or the delay in receipt of regulatory approval for new products or modifications to existing products, and the failure of our customers to accept the new or modified products. Our inability to develop new products or expand into new markets, as currently intended, could hurt our business, financial condition and results of operations.
We may never realize the full value of our intangible assets, which represent a significant portion of our total assets.
At December 29, 2017, we had $1.9 billion of intangible assets, representing 67% of our total assets. These intangible assets consist primarily of goodwill, trademarks, tradenames, customer lists and patented technology arising from our acquisitions. Goodwill and other intangible assets with indefinite lives are not amortized, but are tested annually or upon the occurrence of certain events that indicate that the assets may be impaired. Definite lived intangible assets are amortized over their estimated useful lives and are tested for impairment upon the occurrence of certain events that indicate that the assets may be impaired. We may not receive the recorded value for our intangible assets if we sell or liquidate our business or assets. In addition, this significant amount of intangible assets increases the risk of a large charge to earnings in the event that the recoverability of these intangible assets is impaired. In the event of such a charge to earnings, the market price of our common stock could be negatively affected. In addition, intangible assets with definite lives, which represent $830.1 million of our net intangible assets at December 29, 2017, will continue to be amortized. These expenses will continue to reduce our future earnings or increase our future losses.
We are subject to pricing pressures from customers, which could harm our operating results.
Given the competitive industry in which we operate, we have made price concessions to some of our larger customers in recent years and we expect customer pressure for price concessions will continue in the future. Price concessions or reductions may cause our operating results to suffer.
We rely on third party suppliers for raw materials, key products and subcomponents, and if we are unable to obtain these materials, products and/or subcomponents on a timely basis or on terms acceptable to us, our ability to manufacture products will suffer.
Our business depends on a continuous supply of raw materials. The principal raw materials used in our business include lithium, iodine, gold, CFx, palladium, stainless steel, aluminum, cobalt chrome, tantalum, platinum, ruthenium, gallium trichloride, vanadium oxide, iridium, titanium and plastics. The supply and price of these raw materials are susceptible to fluctuations due to transportation issues, government regulations, price controls, foreign civil unrest, tariffs, worldwide economic conditions or other unforeseen circumstances. Increasing global demand for these raw materials has caused prices of these materials to increase. In addition, there are a limited number of worldwide suppliers of several raw materials needed to manufacture our products. For reasons of quality, cost effectiveness or availability, we obtain some raw materials from a single supplier. Although we work closely with our suppliers to seek to ensure continuity of supply, we may not be able to continue to procure raw materials critical to our business at all or to procure them at acceptable price levels.
In addition, we rely on third party manufacturers to supply many of the products and subcomponents that are incorporated into our own products and components. Manufacturing problems may occur with these and other outside sources, as a supplier may fail to develop and supply products and subcomponents to us on a timely basis, or may supply us with products and subcomponents that do not meet our quality, quantity and cost requirements. If any of these problems occur, we may be unable to obtain substitute sources for these products and subcomponents on a timely basis or on terms acceptable to us, which could harm our ability to manufacture our own products and components profitably or on time. In addition, to the extent the processes our suppliers use to manufacture products and subcomponents are proprietary, we may be unable to obtain comparable products and subcomponents from alternative suppliers.
Quality problems with our products could harm our reputation and erode our competitive advantage.
Quality is important to us and our customers, and our products, given their intended uses, are held to high quality and performance standards. In the event our products fail to meet these standards, our reputation could be harmed, which could erode our competitive advantage over competitors, causing us to lose or see a reduction in business from customers and resulting in lower revenues.
- 16 -
Quality problems with our products could result in warranty claims and additional costs.
We generally allow customers to return defective or damaged products for credit, replacement or repair. We generally warrant that our products will meet customer specifications and will be free from defects in materials and workmanship. Additionally, we carry a safety stock of inventory for our customers that may be impacted by warranty claims. We reserve for our exposure to warranty claims based upon recent historical experience and other specific information as it becomes available. However, these reserves may not be adequate to cover future warranty claims. If these reserves are inadequate, additional warranty costs or inventory write-offs may need to be incurred in the future, which could harm our operating results.
Regulatory issues resulting from product complaints, or recalls, or regulatory audits could harm our ability to produce and supply products or bring new products to market.
Our products are designed, manufactured and distributed globally in compliance with applicable regulations and standards. However, a product complaint, recall or negative regulatory audit may cause our products to be removed from the market and harm our operating results or financial condition. In addition, during the period in which corrective action is being taken by us to remedy a complaint, recall or negative audit, regulators may not allow our new products to be cleared for marketing and sale.
If we become subject to product liability claims, our operating results and financial condition could suffer.
Our business exposes us to potential product liability claims, which may take the form of a one-off claim from a single claimant or a class action lawsuit covering multiple claimants, that are inherent in the design, manufacture and sales of our products. Product failures, including those that arise from the failure to meet product specifications, misuse or malfunction, or design flaws, or the use of our products with components or systems not manufactured or sold by us could result in product liability claims or a recall. Many of our products are components and function in interaction with our customers’ medical devices. For example, our batteries are produced to meet electrical performance, longevity and other specifications, but the actual performance of those products is dependent on how they are utilized as part of our customers’ devices over the lifetime of their products. Product performance and device interaction from time to time have been, and may in the future be, different than expected for a number of reasons. Consequently, it is possible that customers may experience problems with their medical devices that could require device recall or other corrective action, where our batteries met the specification at delivery, and for reasons that are not related primarily or at all to any failure by our product to perform in accordance with specifications. It is possible that our customers (or end-users) may in the future assert that our products caused or contributed to device failure. Even if these assertions do not lead to product liability or contract claims, they could harm our reputation and our customer relationships.
Provisions contained in our agreements with key customers attempting to limit our damages, including provisions to limit damages to liability for negligence, may not be enforceable in all instances or may otherwise fail to adequately protect us from liability for damages. Product liability claims or product recalls, regardless of their ultimate outcome, could require us to spend significant time and money in litigation and require us to pay significant damages and could divert the attention of our management from our business operations. The occurrence of product liability claims or product recalls could affect our operating results and financial condition.
We carry product liability insurance with coverage that is limited in scope and amount. We may not be able to maintain this insurance at a reasonable cost or on reasonable terms, or at all. This insurance may not be adequate to protect us against a product liability claim that arises in the future.
Our operating results may fluctuate, which may make it difficult to forecast our future performance and may result in volatility in our stock price.
Our operating results have fluctuated in the past and are likely to continue to fluctuate from quarter to quarter, making forecasting future performance difficult and resulting in volatility in our stock price. These fluctuations are due to a variety of factors, including the following:
• | a substantial percentage of our costs are fixed in nature, which results in our operations being particularly sensitive to fluctuations in production volumes; |
• | changes in the mix of our revenue represented by our various products and customers could result in reductions in our profits if the mix of our revenue represented by lower margin products increases; |
• | timing of orders placed by our principal customers who account for a significant portion of our revenues; and |
• | increased costs of raw materials or supplies. |
- 17 -
If we are unable to protect our intellectual property and proprietary rights, our business could be harmed.
We rely on a combination of patents, licenses, trade secrets and know-how to establish and protect our rights to our technologies and products. However, we cannot assure you that any of our patent rights, whether issued, subject to license or in process, will not be misappropriated, circumvented or invalidated. In addition, competitors may design around our technology or develop competing technologies that do not infringe our proprietary rights. As patents and other intellectual property protection expire, we may lose our competitive advantage. If third parties infringe or misappropriate our patents or other proprietary rights, our businesses could be seriously harmed.
In addition, we cannot be assured that our existing or planned products do not or will not infringe on the intellectual property rights of others or that others will not claim such infringement. Our industry has experienced extensive ongoing patent litigation which can result in the incurrence of significant legal costs for indeterminate periods of time, injunctions against the manufacture or sale of infringing products and significant royalty payments. At any given time, we may be a plaintiff or defendant in such an action. We cannot assure you that we will be able to prevent competitors from challenging our patents or other intellectual property rights or entering markets we currently serve.
In addition to seeking formal patent protection whenever possible, we attempt to protect our proprietary rights and trade secrets by entering into confidentiality agreements with employees, consultants and third parties with which we do business. However, these agreements may be breached and, if a breach occurs, there may be no adequate remedies available to us and we may be unable to prevent the unauthorized disclosure or use of our technical knowledge, practices and/or procedures. If our trade secrets become known, we may lose our competitive advantages.
We may be subject to intellectual property claims, which could be costly and time consuming and could divert our management’s attention from our business operations.
In producing our products, third parties may claim that we are infringing on their intellectual property rights, and we may be found to have infringed on those intellectual property rights. We may be unaware of intellectual property rights of others that may be used in our technology and products. In addition, third parties may claim that our patents have been improperly granted and may seek to invalidate our existing or future patents. If any claim for invalidation prevailed, third parties may manufacture and sell products that compete with our products and our revenues from any related license agreements would decrease accordingly. We also typically do not receive significant indemnification from parties that license technology to us against third party claims of intellectual property infringement.
Any litigation or other challenges regarding our patents or other intellectual property could be costly and time consuming and could divert the attention of our management and key personnel from our business operations. The complexity of the technology involved in producing our products, and the uncertainty of intellectual property litigation increases these risks. Claims of intellectual property infringement may also require us to enter into costly royalty or license agreements. However, we may not be able to obtain royalty or license agreements on terms acceptable to us, or at all. We also may be made subject to significant damages or injunctions against development and sale of our products.
Our failure to obtain licenses from third parties for new technologies or the loss of these licenses could impair our ability to design and manufacture new products and reduce our revenues.
We occasionally license technologies from third parties rather than depending exclusively on our own proprietary technology and developments. Our ability to license new technologies from third parties is and will continue to be critical to our ability to offer new and improved products. We may not be able to continue to identify new technologies developed by others and even if we are able to identify new technologies, we may not be able to negotiate licenses on favorable terms, or at all. Additionally, we could lose rights granted under licenses for reasons beyond our control.
We may not be able to attract, train and retain a sufficient number of qualified associates to maintain and grow our business.
We monitor the markets in which we compete and assess opportunities to better align expenses with revenues, while preserving our ability to make needed investments in RD&E projects, capital and our associates that we believe are critical to our long-term success. Our success will depend in large part upon our ability to attract, train, retain and motivate highly skilled associates. There is currently aggressive competition for employees who have experience in technology and engineering. We compete intensely with other companies to recruit and hire from this limited pool. The industries in which we compete for employees are characterized by high levels of employee attrition. Although we believe we offer competitive salaries and benefits, we may have to increase spending in order to attract, train and retain qualified personnel.
- 18 -
We are dependent upon our senior management team and key technical personnel and the loss of any of them could significantly harm us.
Our future performance depends to a significant degree upon the continued contributions of our senior management team and key technical personnel. In general, only highly qualified and trained scientists have the necessary skills to develop our products, which are often highly technical in nature. The loss or unavailability to us of any member of our senior management team or a key technical employee could significantly harm us. We face intense competition for these professionals from our competitors, customers and companies operating in our industry. To the extent that the services of members of our senior management team and key technical personnel would be unavailable to us for any reason, we would be required to hire other personnel to manage and operate our Company and to develop our products and technology, which could negatively impact our business. We may not be able to locate or employ these qualified personnel on acceptable terms or may need to increase spending in order to attract these qualified personnel.
We have significant indebtedness that could affect our operations and financial condition, and our failure to meet certain financial covenants required by our debt agreements may materially and adversely affect our assets, financial position and cash flows.
At December 29, 2017, our total indebtedness was $1.6 billion. As of December 29, 2017, our debt service obligations, comprised of principal and interest, during the year ending December 28, 2018 are estimated to be approximately $123 million. The outstanding indebtedness and the terms and covenants of the agreements under which this debt was incurred, could, among other things:
• | require us to dedicate a large portion of our cash flow from operations to the servicing and repayment of our outstanding indebtedness, thereby reducing funds available for working capital, capital expenditures, RD&E expenditures and other general corporate requirements; |
• | limit our ability to obtain additional financing to fund future working capital, capital expenditures, RD&E expenditures and other general corporate requirements in the future; |
• | limit our flexibility in planning for, or reacting to, changes in our business and the industry in which we operate; |
• | restrict our ability to make strategic acquisitions or dispositions or to exploit business opportunities; |
• | place us at a competitive disadvantage compared to our competitors that have less outstanding indebtedness; and |
• | adversely affect the market price of our common stock. |
If we are not successful in making acquisitions to expand and develop our business, our operating results may suffer.
One facet of our growth strategy is to make acquisitions that complement our core competencies in technology and manufacturing to enable us to manufacture and sell additional products to our existing customers and to expand our business into related markets. Our continued growth may depend on our ability to successfully identify and acquire companies that complement or enhance our existing business on acceptable terms. We may not be able to identify or complete future acquisitions. In addition, even if we are able to identify future acquisitions, we may not be able to effect such acquisitions under the terms of the Indenture governing our 9.125% senior notes due 2023 or our Senior Secured Credit Facility. In connection with pursuing this growth strategy, some of the risks that we may encounter include expenses associated with and difficulties in identifying potential targets, the costs associated with unsuccessful acquisitions, and higher prices for acquired companies because of competition for attractive acquisition targets.
We may not realize the expected benefits from our cost savings and consolidation initiatives or those initiatives may have unintended consequences, which may harm our business.
We have incurred significant charges related to various cost savings and consolidation initiatives. These initiatives were undertaken to improve our operational effectiveness, efficiencies and profitability. Information regarding some of these initiatives is discussed in Note 11 “Other Operating Expenses” of the Notes to Consolidated Financial Statements contained in Item 8 of this report. Cost reduction efforts under these initiatives include various cost and efficiency improvement measures, such as headcount reductions, the relocation of resources and administrative and functional activities, the closure of facilities, the transfer of production lines, the sale of non-strategic assets and other efforts to streamline our business, among other actions. These measures could yield unintended consequences, such as distraction of our management and associates, business disruption, disputes with customers, attrition beyond our planned reduction in workforce and reduced associate productivity. If any of these unintended consequences were to occur, they could negatively affect our business, financial condition and results of operations. In addition, headcount reductions and customer disputes may subject us to the risk of litigation, which could result in the incurrence of substantial costs. Moreover, our cost reduction efforts result in charges and expenses that impact our operating results. Our cost savings and consolidation initiatives, or other expense reduction measures we take in the future, may not result in the expected cost savings.
- 19 -
Successful integration and anticipated benefits of recent and future acquisitions cannot be assured and integration matters could divert attention of management away from operations.
Part of our business strategy includes acquiring additional businesses and assets. If we do not successfully integrate acquisitions, we may not realize anticipated operating advantages and cost savings. Our ability to realize the anticipated benefits from acquisitions will depend, to a large extent, on our ability to integrate these acquired businesses with our legacy businesses. Integrating and coordinating aspects of the operations and personnel of the acquired business with legacy businesses involves complex operational, technological and personnel-related challenges. This process is time-consuming and expensive, disrupts the businesses of both companies and may not result in the achievement of the full benefits expected by us, including cost synergies expected to arise from supply chain efficiencies and overlapping general and administrative functions.
The potential difficulties, and resulting costs and delays, include:
• | managing a larger combined company; |
• | consolidating corporate and administrative infrastructures; |
• | issues in integrating manufacturing, warehouse and distribution facilities, RD&E and sales forces; |
• | difficulties attracting and retaining key personnel; |
• | loss of customers and suppliers and inability to attract new customers and suppliers; |
• | unanticipated issues in integrating information technology, communications and other systems; |
• | incompatibility of purchasing, logistics, marketing, administration and other systems and processes; and |
• | unforeseen and unexpected liabilities related to the acquired business. |
Additionally, the integration of our legacy businesses with an acquired company’s operations, products and personnel may place a significant burden on management and other internal resources. The attention of our management may be directed towards integration considerations and may be diverted from our day-to-day business operations, and matters related to the integration may require commitments of time and resources that could otherwise have been devoted to other opportunities that might have been beneficial to us and our business. The diversion of management’s attention, and any difficulties encountered in the transition and integration process, could harm our business, financial condition and operating results.
We may not be able to maintain the levels of operating efficiency that acquired companies have achieved or might achieve separately. Successful integration of each acquisition will depend upon our ability to manage those operations and to eliminate redundant and excess costs. Difficulties in integration may be magnified if we make multiple acquisitions over a relatively short period of time. Because of difficulties in combining and expanding operations, we may not be able to achieve the cost savings and other size-related benefits that we hoped to achieve after these acquisitions.
Any of the matters described above could adversely affect our business or harm our financial condition, results of operations or business prospects.
Interruptions of our manufacturing operations could delay production and affect our operations.
Our products are designed and manufactured in facilities located around the world. In most cases, the manufacturing of specific product lines is concentrated in one or a few locations. If an event (including any weather or natural disaster-related event) occurred that resulted in material damage or loss of one or more of these manufacturing facilities or we lacked sufficient labor to fully operate the facility, we might be unable to transfer the manufacture of the relevant products to another facility or location in a cost-effective or timely manner, if at all. This potential inability to transfer production could occur for a number of reasons, including but not limited to a lack of necessary relevant manufacturing capability at another facility, or the regulatory requirements of the FDA or other governmental regulatory bodies. In addition, our business involves complex manufacturing processes and hazardous materials that can be dangerous to our associates. Although we employ safety procedures in the design and operation of our facilities, there is a risk that an accident or death could occur. Any accident, such as a chemical spill or fire, could result in significant manufacturing delays or claims for damages resulting from injuries, which would harm our operations and financial condition. The potential liability resulting from any such accident or death, to the extent not covered by insurance, could harm our financial condition or operating results. Any disruption of operations at any of our facilities, and in particular our larger facilities, could result in production delays, which could affect our operations and harm our business.
- 20 -
We may experience significant variability in our quarterly and annual effective tax rate and may not be able to use our net operating loss carryforwards and tax credit carryforwards which would affect our reported net income.
We have a complex tax profile due to the global nature of our operations, which encompass multiple taxing jurisdictions. Variability in the mix and profitability of domestic and international activities, identification and resolution of various tax uncertainties, changes in tax laws and rates, and the extent to which we are able to realize net operating loss and other carryforwards included in deferred tax assets and avoid potential adverse outcomes included in deferred tax liabilities, among other matters, may significantly affect our effective income tax rate in the future.
Changes in international tax laws or additional changes in U.S. tax laws could materially affect our financial position and results of operations. In December 2017, the U.S. enacted tax reform legislation informally known as the Tax Cuts and Jobs Act (the “Tax Reform Act”) that, among other significant changes to existing U.S. tax laws, reduced the U.S. federal corporate income tax rate to 21% from 35% effective January 1, 2018. We are in the process of completing our analysis of the impact of the Tax Reform Act on us. The full impact of the Tax Reform Act may change significantly as regulations, interpretations and rulings relating to the Tax Reform Act are issued and based upon any additional changes in U.S. federal and state tax laws that may be made in the future. In addition, many countries in the EU, as well as a number of other countries and organizations such as the Organization for Economic Cooperation and Development, are also actively considering changes to existing tax laws. If tax laws and related regulations change, our financial results could be materially impacted. Given the unpredictability of these possible changes and their potential interdependency, it is possible such changes could adversely impact our financial results.
Our effective income tax rate is the result of the income tax rates in the various countries in which we do business. Our mix of income and losses in these jurisdictions affects our effective tax rate. For example, relatively more income in higher tax rate jurisdictions would increase our effective tax rate and thus lower our net income. Similarly, if we generate losses in tax jurisdictions for which no benefits are available, our effective income tax rate will increase. Our effective income tax rate may also be impacted by the recognition of discrete income tax items, such as required adjustments to our liabilities for uncertain tax positions or our deferred tax asset valuation allowance. A significant increase in our effective income tax rate could have a material adverse impact on our earnings.
We have recorded deferred tax assets based on our assessment that we will be able to realize the benefits of our net operating losses and other favorable tax attributes. Realization of deferred tax assets involve significant judgments and estimates which are subject to change and ultimately depends on generating sufficient taxable income of the appropriate character during the appropriate periods. Changes in circumstances may affect the likelihood of such realization, which in turn may trigger a write-down of our deferred tax assets, the amount of which would depend on a number of factors. A write-down would reduce our reported net income, which may adversely impact our financial condition or results of operations or cash flows. In addition, we are potentially subject to ongoing and periodic tax examinations and audits in various jurisdictions, including with respect to the amount of our net operating losses and any limitation thereon. An adjustment to such net operating loss carryforwards, including an adjustment from a taxing authority, could result in higher tax costs, penalties and interest, thereby adversely impacting our financial condition, results of operations or cash flows.
The failure of our information technology systems to perform as anticipated could disrupt our business and affect our financial condition.
The efficient operation of our business is dependent on our information technology (“IT”) systems. Accordingly, we rely upon the capacity, reliability and security of our IT hardware and software infrastructure and our ability to expand and update this infrastructure in response to our changing needs. Despite our implementation of security measures, our systems are vulnerable to damages from computer viruses, natural disasters, incursions by intruders or hackers, failures in hardware or software, power fluctuations, cyber terrorists and other similar disruptions. The failure of our IT systems to perform as anticipated for any reason or any significant breach of security could disrupt our business and result in numerous consequences, including reduced effectiveness and efficiency of operations, inappropriate disclosure of confidential information, increased overhead costs and loss of important information, which could have a material effect on our business and results of operations. In addition, we may be required to incur significant costs to protect against damage caused by these disruptions or security breaches in the future.
Our operations are subject to cyber-attacks that could have a material adverse effect on our business, consolidated results of operations and consolidated financial condition.
Our operations are increasingly dependent on digital technologies and services. We use these technologies for internal purposes, including data storage, processing and transmissions, as well as in our interactions with customers and suppliers. Digital technologies are subject to the risk of cyber-attacks. If our systems for protecting against cybersecurity risks prove not to be sufficient, we could be adversely affected by, among other things: loss of or damage to intellectual property, proprietary or confidential information, or customer, supplier, or employee data; interruption of our business operations; and increased costs required to prevent, respond to, or mitigate cybersecurity attacks. These risks could harm our reputation and our relationships with customers, suppliers, employees and other third parties, and may result in claims against us. These risks could have a material adverse effect on our business, financial condition and results of operations.
- 21 -
Our international sales and operations are subject to a variety of market and financial risks and costs that could affect our profitability and operating results.
Our sales outside the U.S., which accounted for 41% of sales for 2017, and our operations in Europe, Asia, Mexico and South America are and will continue to be subject to a number of risks and potential costs, including:
• | changes in foreign economic conditions and/or regulatory requirements; |
• | changes in foreign currency exchange rates; |
• | local product preferences and product requirements; |
• | outstanding accounts receivables that take longer to collect than is typical in the U.S.; |
• | difficulties in enforcing agreements through foreign legal systems; |
• | less protection of intellectual property in some countries outside of the U.S.; |
• | trade protection measures and import and export licensing requirements; |
• | work force instability; |
• | political and economic instability; and |
• | complex tax and cash management issues. |
We earn revenue and incur expenses related to our foreign sales and operations that are denominated in a foreign currency. Additionally, to the extent that monetary assets and liabilities, including short-term and long-term intercompany loans, are recorded in a currency other than the functional currency of our foreign subsidiaries, these amounts are remeasured each period, with the resulting gain or loss being recorded in Other (Income) Loss, Net. We may buy hedges in certain currencies to reduce or offset our exposure to currency exchange fluctuations; however, these transactions may not be adequate or effective to protect us from the exposure for which they are purchased. Historically, foreign currency fluctuations have not had a material effect on our net financial results. However, fluctuations in foreign currency exchange rates could have a significant impact, positive or negative, on our financial results in the future.
Economic and credit market uncertainty could interrupt our access to capital markets, borrowings, or financial transactions to hedge certain risks, which could adversely affect our financial condition.
To date, we have been able to access debt and equity financing that has allowed us to complete acquisitions, make investments in growth opportunities and fund working capital requirements. In addition, we enter into financial transactions to hedge certain risks, including foreign exchange and interest rate risk. Our continued access to capital markets, the stability of our lenders under our Senior Secured Credit Facility and their willingness to support our needs, and the stability of the parties to our financial transactions that hedge risks are essential for us to meet our current and long-term obligations, fund operations, and fund our strategic initiatives. An interruption in our access to external financing or financial transactions to hedge risk could affect our business prospects and financial condition.
Risks Related To Our Industries
Our business is subject to environmental regulations that could be costly to comply with.
Federal, state and local regulations impose various environmental controls on the manufacturing, transportation, storage, use and disposal of batteries and hazardous chemicals and other materials used in, and hazardous waste produced by the manufacturing of our products. Conditions relating to our historical operations may require expenditures for clean-up in the future and changes in environmental laws and regulations may impose costly compliance requirements on us or otherwise subject us to future liabilities. Additional or modified regulations relating to the manufacture, transportation, storage, use and disposal of materials used to manufacture our products or restricting disposal or transportation of batteries may be imposed that may result in higher costs or lower operating results. In addition, we cannot predict the effect that additional or modified environmental regulations may have on us or our customers.
Our international operations expose us to legal and regulatory risks, which could have a material effect on our business.
Our profitability and international operations are, and will continue to be, subject to risks relating to changes in foreign legal and regulatory requirements. In addition, our international operations are governed by various U.S. laws and regulations, including the Foreign Corrupt Practices Act (“FCPA”) and other similar laws that prohibit us and our business partners from making improper payments or offers of payment to foreign governments and their officials and political parties for the purpose of obtaining or retaining business. Any alleged or actual violations of these regulations may subject us to government scrutiny, severe criminal or civil sanctions and other liabilities and could negatively affect our business, reputation, operating results, and financial condition.
- 22 -
Consolidation in the healthcare industry could result in greater competition and reduce our revenues and harm our business.
Many healthcare industry companies are consolidating to create new companies with greater market power. As the healthcare industry consolidates, competition to provide products and services to industry participants will become more intense. These industry participants may try to use their market power to negotiate price concessions or reductions for our products or may undertake additional vertical integration and/or supplier diversification initiatives. If we are forced to reduce our prices, our revenues would decrease and our operating results would suffer.
The healthcare industry is highly regulated and subject to various political, economic and regulatory changes that could increase our compliance costs and force us to modify how we develop and price our products.
The healthcare industry is highly regulated and is influenced by changing political, economic and regulatory factors. Several of our product lines are subject to international, federal, state and local health and safety, packaging and product content regulations. In addition, medical devices are subject to regulation by the FDA and similar governmental agencies. These regulations cover a wide variety of product activities from design and development to labeling, manufacturing, promotion, sales and distribution. Compliance with these regulations may be time consuming, burdensome and expensive and could negatively affect our ability to sell products. This may result in higher than anticipated costs or lower than anticipated revenues.
Furthermore, healthcare industry regulations are complex, change frequently and have tended to become more stringent over time. Federal and state legislatures have periodically considered and implemented programs to reform or amend the U.S. healthcare system at both the federal and state levels. In addition, these regulations may contain proposals to increase governmental involvement in healthcare, lower reimbursement rates or otherwise change the environment in which healthcare industry participants operate. We may be required to incur significant expenses to comply with these regulations or remedy past violations of these regulations. Our failure to comply with applicable government regulations could also result in cessation of portions or all of our operations, impositions of fines and restrictions on our ability to carry on or expand our operations. In addition, because many of our products are sold into regulated industries, we must comply with additional regulations in marketing our products.
In response to perceived increases in healthcare costs in recent years, there have been and continue to be proposals by the Presidential administrations, members of Congress, state governments, regulators and third-party payors to control these costs and, more generally, to reform the U.S. healthcare system, including by repealing or replacing the Patient Protection and Affordable Care Act. Health care reform imposed a Medical Device Excise Tax (“the MDET”) on medical device manufacturers through the end of 2015. The Consolidated Appropriations Act, 2016, enacted in December 2015, included a two-year moratorium on MDET such that medical device sales in 2016 and 2017 were exempt from the MDET. New legislation was passed in January 2018 such that implementation of the MDET was suspended until January 1, 2020. Although the MDET was suspended, if this suspension is not continued or made permanent thereafter, the MDET will be automatically reinstated starting on January 1, 2020 and would result in a significant increase in the tax burden on our industry, which could have a material negative impact on our financial condition, results of operations and our cash flows. Other elements of health care reform such as comparative effectiveness research, an independent payment advisory board, payment system reforms including shared savings pilots and other provisions could meaningfully change the way healthcare is developed and delivered, and may materially adversely impact numerous aspects of our business, results of operations and financial condition.
Our business is indirectly subject to healthcare industry cost containment measures that could result in reduced sales of our products.
Several of our customers rely on third party payors, such as government programs and private health insurance plans, to reimburse some or all of the cost of the procedures in which our products are used. The continuing efforts of governments, insurance companies and other payors of healthcare costs to contain or reduce those costs could lead to patients being unable to obtain approval for payment from these third party payors for procedures in which our products are used. If that occurred, sales of medical devices may decline significantly and our customers may reduce or eliminate purchases of our products, or demand further price reductions. The cost containment measures that healthcare payors are instituting, both in the U.S. and internationally, could reduce our revenues and harm our operating results.
- 23 -
Our energy market revenues are dependent on conditions in the oil and natural gas industry, which historically have been volatile.
Sales of our products into the energy market depends upon the condition of the oil and gas industry. Currently, oil and natural gas prices have been subject to significant fluctuation and the oil and gas exploration and production industry has historically been cyclical, and it is likely that oil and natural gas prices will continue to fluctuate in the future. The current and anticipated prices of oil and natural gas influence the oil and gas exploration and production business and are affected by a variety of political and economic factors, including worldwide demand for oil and natural gas, worldwide and domestic supplies of oil and natural gas, the ability of the Organization of Petroleum Exporting Countries (“OPEC”) to set and maintain production levels and pricing, the level of production of non-OPEC countries, the price and availability of alternative fuels, political stability in oil producing regions and the policies of the various governments regarding exploration and development of their oil and natural gas reserves. A change in the oil and gas exploration and production industry or a reduction in the exploration and production expenditures of oil and gas companies could cause our energy market revenues to decline.
ITEM 1B. UNRESOLVED STAFF COMMENTS
None.
ITEM 2. PROPERTIES
Our principal executive office and headquarters is located in Frisco, Texas, in a leased facility. As of December 29, 2017, we operated 34 facilities in the U.S., six in Europe, three in Mexico, one in South America, and two in Southeast Asia. Of these facilities, 31 were leased and 15 were owned. We occupy approximately 2.4 million square feet of manufacturing and RD&E space worldwide. We believe the facilities we operate and their equipment are effectively utilized, well maintained, generally are in good condition, and will be able to accommodate our capacity needs to meet current levels of demand. We continuously review our anticipated requirements for facilities and, on the basis of that review, may from time to time acquire additional facilities and/or dispose of existing facilities.
- 24 -
ITEM 3. LEGAL PROCEEDINGS
In April 2013, the Company commenced an action against AVX Corporation and AVX Filters Corporation (collectively “AVX”) alleging that AVX had infringed the Company’s patents by manufacturing and selling filtered feedthrough assemblies used in implantable pacemakers and cardioverter defibrillators that incorporate the Company’s patented technology. Juries in the United States District Court for the District of Delaware have returned verdicts finding that AVX infringed three Greatbatch patents and awarded the Company $37.5 million in damages. The finding is subject to post-trial proceedings.
In January 2015, LRM was notified by the New Jersey Department of Environmental Protection (“NJDEP”) of NJDEP’s intent to revoke a no further action determination made by NJDEP in favor of LRM in 2002 pertaining to a property on which a subsidiary of LRM operated a manufacturing facility in South Plainfield, New Jersey beginning in 1971. LRM sold the property in 2004 and vacated the facility in 2007. In response to NJDEP’s notice, LRM further investigated the matter and submitted a technical report to NJDEP in August of 2015 that concluded that NJDEP’s notice of intent to revoke was unwarranted. After reviewing the technical report, NJDEP issued a draft response in May 2016, stating that NJDEP would not revoke the no further action determination at that time but would require some additional site investigation to support the Company’s conclusion. The Company is cooperating with NJDEP and has begun the requested additional investigation. The Company does not expect that this environmental matter will have a material effect on its consolidated results of operations, financial position or cash flows.
We are party to various other legal actions arising in the normal course of business. A description of pending legal actions against the Company is set forth in Note 13 “Commitments and Contingencies” of the Notes to Consolidated Financial Statements contained in Item 8 of this report. Other than as discussed in Note 13, we do not believe that the ultimate resolution of any pending legal actions will have a material effect on our consolidated results of operations, financial position or cash flows. However, litigation is subject to inherent uncertainties and there can be no assurance that any pending legal action, which we currently believe to be immaterial, does not become material in the future.
ITEM 4. MINE SAFETY DISCLOSURES
Not applicable.
- 25 -
PART II
ITEM 5. MARKET FOR REGISTRANT’S COMMON EQUITY, RELATED STOCKHOLDER MATTERS AND
ISSUER PURCHASES OF EQUITY SECURITIES
The Company’s common stock trades on the New York Stock Exchange (“NYSE”) under the symbol “ITGR.” The following table sets forth information on the prices of our common stock as reported by the NYSE:
Fourth Quarter | Third Quarter | Second Quarter | First Quarter | ||||||||||||
2017 | |||||||||||||||
High | $ | 55.20 | $ | 51.65 | $ | 44.25 | $ | 41.80 | |||||||
Low | 42.75 | 40.01 | 33.90 | 29.00 | |||||||||||
Close | 45.30 | 51.15 | 43.25 | 40.20 | |||||||||||
2016 | |||||||||||||||
High | $ | 31.45 | $ | 33.19 | $ | 39.45 | $ | 52.40 | |||||||
Low | 18.10 | 20.62 | 28.55 | 30.95 | |||||||||||
Close | 29.45 | 21.69 | 32.00 | 34.92 | |||||||||||
We have not paid cash dividends and currently intend to retain any earnings to reinvest in our business or pay down outstanding debt. In addition, the term of our Senior Secured Credit Facility and the Indenture governing our 9.125% senior notes due 2023 limits the amount of dividends that we may pay. As of February 16, 2018, there were approximately 120 record holders of the Company’s common stock.
- 26 -
PERFORMANCE GRAPH
The following graph compares, for the five year period ended December 29, 2017, the cumulative total stockholder return for Integer Holdings Corporation, the S&P SmallCap 600 Index, and the Hemscott Peer Group Index. The Hemscott Peer Group Index includes approximately 110 comparable companies included in the Hemscott Industry Group 520 Medical Instruments & Supplies and 521 Medical Appliances & Equipment. The graph assumes that $100 was invested on December 28, 2012 and assumes reinvestment of dividends. No adjustments have been made for the value provided to shareholders for spin-offs, including the spin-off of Nuvectra by the Company in March 2016. The stock price performance shown on the following graph is not necessarily indicative of future price performance.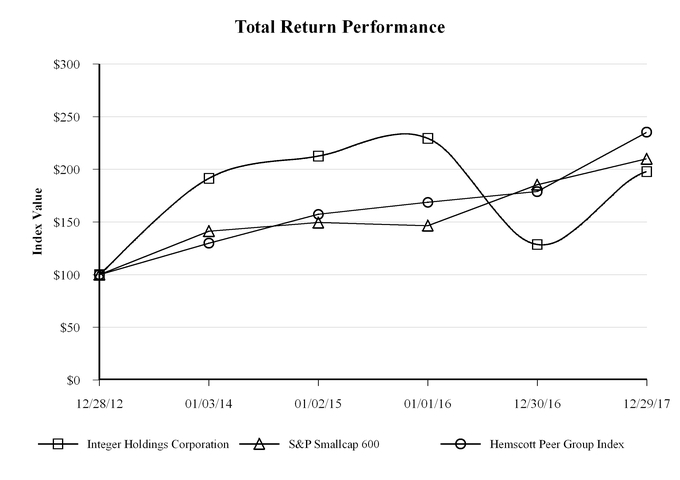
Company/Index | 12/28/12 | 01/03/14 | 01/02/15 | 01/01/16 | 12/30/16 | 12/29/17 | |||||||||||||
Integer Holdings Corporation | $ | 100.00 | $ | 191.35 | $ | 212.58 | $ | 229.36 | $ | 128.66 | $ | 197.90 | |||||||
S&P Smallcap 600 | 100.00 | 141.31 | 149.45 | 146.50 | 185.40 | 209.94 | |||||||||||||
Hemscott Peer Group Index | 100.00 | 129.89 | 157.39 | 168.77 | 178.91 | 235.29 | |||||||||||||
- 27 -
ITEM 6. SELECTED FINANCIAL DATA
Five-Year Summary Financial Data
(in thousands, except per share amounts)
This data should be read along with Item 7 “Management’s Discussion and Analysis of Financial Condition and Results of Operations” and Item 8 “Financial Statements and Supplementary Data” appearing elsewhere in this report. Fiscal year 2013 consisted of 53 weeks. All other fiscal years consisted of 52 weeks.
2017 (1)(2)(3) | 2016 (1)(2) | 2015 (1)(2) | 2014 (1)(2) | 2013 (1) | |||||||||||||||
Summary of Operations for the Fiscal Year: | |||||||||||||||||||
Sales | $ | 1,461,921 | $ | 1,386,778 | $ | 800,414 | $ | 687,787 | $ | 663,945 | |||||||||
Net income (loss) | 66,679 | 5,961 | (7,594 | ) | 55,458 | 36,267 | |||||||||||||
Earnings (loss) per share | |||||||||||||||||||
Basic | $ | 2.12 | $ | 0.19 | $ | (0.29 | ) | $ | 2.23 | $ | 1.51 | ||||||||
Diluted | 2.09 | 0.19 | (0.29 | ) | 2.14 | 1.43 | |||||||||||||
Financial Position at Year End: | |||||||||||||||||||
Working capital | $ | 322,906 | $ | 332,087 | $ | 360,764 | $ | 242,022 | $ | 190,731 | |||||||||
Total assets | 2,848,345 | 2,832,543 | 2,982,136 | 955,122 | 889,629 | ||||||||||||||
Long-term obligations | 1,745,961 | 1,922,084 | 1,917,671 | 233,099 | 255,772 | ||||||||||||||
(1) | From 2013 to 2017, we recorded material charges in Other Operating Expenses (“OOE”), primarily related to our cost savings and consolidation initiatives and our acquisitions. Additional information is set forth in Note 11 “Other Operating Expenses” of the Notes to Consolidated Financial Statements contained in Item 8 of this report. |
(2) | On October 27, 2015 and August 12, 2014, we acquired LRM and Centro de Construcción de Cardioestimuladores del Uruguay, respectively. On March 14, 2016, we spun-off a portion of our former QiG segment, which is now an independent, publicly traded company known as Nuvectra. This data includes the results of operations of these acquired companies subsequent to their acquisition and does not include the result of operations of Nuvectra subsequent to the Spin-off. Additional information is set forth in Note 2 “Divestiture and Acquisition” of the Notes to Consolidated Financial Statements contained in Item 8 of this report. Additionally, in connection with our acquisition of LRM we issued approximately $1.8 billion of long-term debt. Additional information is set forth in Note 8 “Debt” of the Notes to Consolidated Financial Statements contained in Item 8 of this report. |
(3) | On December 22, 2017, the Tax Reform Act was enacted, which significantly changed existing U.S. tax laws, reducing the federal corporate income tax rate from 35% to 21%, and imposing a deemed repatriation tax on unremitted foreign earnings, as well as other changes. As a result of the Tax Reform Act, our Consolidated Statement of Operations and Comprehensive Income (Loss) reflects a net benefit of $39.4 million in the fourth quarter of fiscal year 2017. Additional information is set forth in Note 12 “Income Taxes” of the Notes to Consolidated Financial Statements contained in Item 8 of this report. |
- 28 -
ITEM 7. MANAGEMENT’S DISCUSSION AND ANALYSIS OF FINANCIAL CONDITION AND RESULTS OF
OPERATIONS
The following discussion and analysis of our financial condition and results of operations should be read together with our selected financial data and our consolidated financial statements and the related notes appearing elsewhere in this report.
This discussion and analysis contains forward-looking statements that involve risks, uncertainties and assumptions. Our actual results may differ materially from those anticipated in these forward-looking statements as a result of many factors, including but not limited to those under the heading “Risk Factors” in Item 1A of this report.
Our Business
• | Our business |
• | Our acquisition and divestiture |
• | Use of non-GAAP financial information |
• | Strategic overview |
• | Financial overview |
• | Cost savings and consolidation efforts |
Critical Accounting Estimates
• | Inventories |
• | Valuation of goodwill, intangible and other long-lived assets |
• | Income taxes |
Our Financial Results
• | Fiscal 2017 compared with fiscal 2016 |
• | Fiscal 2016 compared with fiscal 2015 |
• | Liquidity and capital resources |
• | Off-balance sheet arrangements |
• | Contractual obligations |
• | Impact of recently issued accounting standards |
We utilize a fifty-two or fifty-three week fiscal year ending on the Friday nearest December 31. Fiscal years 2017, 2016 and 2015 each consisted of fifty-two weeks and ended on December 29, 2017, December 30, 2016 and January 1, 2016, respectively.
During the first quarter of 2017, we revised the method used to present sales by product line in order to align the methodologies used by our legacy companies. Prior period amounts have been reclassified to conform to the new product line sales reporting presentation.
Our Business
Integer Holdings Corporation is one of the largest medical device outsource (“MDO”) manufacturers in the world serving the cardiac, neuromodulation, orthopedics, vascular and advanced surgical markets. We also develop batteries for high-end niche applications in the non-medical energy, military, and environmental markets. Our vision is to enhance the lives of patients worldwide by being our customers’ partner of choice for innovative technologies and services.
We organize our business into two reportable segments, Medical and Non-Medical, and derive our revenues from four principle product lines. The Medical segment includes the Advanced Surgical, Orthopedics & Portable Medical, Cardio & Vascular and Cardiac & Neuromodulation product lines and the Non-Medical segment is comprised of the Electrochem product line. For more information on our segments, please refer to Note 17 “Segment and Geographic Information” of the Notes to Consolidated Financial Statements contained in Item 8 of this report.
- 29 -
MANAGEMENT’S DISCUSSION AND ANALYSIS
Our Acquisition and Divestiture
On October 27, 2015, we acquired all of the outstanding common stock of Lake Region Medical Holdings, Inc. (“LRM”), headquartered in Wilmington, MA. LRM was a manufacturer of interventional and diagnostic wire-formed medical devices and components specializing in minimally invasive devices for cardiovascular, endovascular, and neurovascular applications. This acquisition has added scale and diversification to enhance customer access and experience by providing a comprehensive portfolio of technologies. The operating results of LRM are included in our Medical segment from the date of acquisition. The aggregate purchase price of LRM including debt assumed was $1.77 billion, which was funded primarily through a new senior secured credit facility and the issuance of senior notes. Total assets acquired from LRM were $2.1 billion. Total liabilities assumed from LRM were $1.3 billion.
On March 14, 2016, we spun-off a portion of our former QiG segment (the “Spin-off”), which is now an independent publicly traded company known as Nuvectra Corporation (“Nuvectra”).
Refer to Note 2 “Divestiture and Acquisition” of the Notes to Consolidated Financial Statements contained in Item 8 of this report for further description of the LRM acquisition and Spin-off.
Use of Non-GAAP Financial Information
We prepare our consolidated financial statements in accordance with generally accepted accounting principles in the United States of America (“GAAP”). Additionally, we consistently report and discuss in our earnings releases and investor presentations adjusted pre-tax income, adjusted net income, adjusted earnings per diluted share (“EPS”), earnings before interest, taxes, depreciation, and amortization (“EBITDA”), adjusted EBITDA and organic sales growth rates.
Adjusted pre-tax income, adjusted net income and adjusted diluted EPS consist of GAAP amounts adjusted for the following to the extent occurring during the period: (i) acquisition and integration related charges and expenses, (ii) amortization of intangible assets including inventory step-up amortization, (iii) facility consolidation, optimization, manufacturing transfer and system integration charges, (iv) asset write-down and disposition charges, (v) charges in connection with corporate realignments or a reduction in force, (vi) certain litigation expenses, charges and gains, (vii) unusual or infrequently occurring items, (viii) gain/loss on cost and equity method investments, (ix) extinguishment of debt charges, (x) the income tax (benefit) related to these adjustments (not for adjusted pre-tax income) and (xi) certain tax items that are outside the normal provision for the period (not for adjusted pre-tax income). Adjusted diluted EPS is calculated by dividing adjusted net income by diluted weighted average shares outstanding.
Adjusted EBITDA consists of GAAP net income (loss) plus (i) the same adjustments as listed above except for items (x) and (xi), (ii) GAAP stock-based compensation, interest expense, and depreciation, (iii) GAAP provision (benefit) for income taxes and (iv) non-cash gains received from cost and equity method investments during the period. To calculate organic sales growth rates, which exclude the impact of changes in foreign currency exchange rates, as well as the impact of any acquisitions or divestitures of product lines on sales growth rates, we convert current period sales from local currency to U.S. dollars using the previous periods’ foreign currency exchange rates and exclude the amount of sales acquired/divested during the period from the current/previous period amounts, respectively.
We believe that the presentation of adjusted pre-tax income, adjusted net income, adjusted diluted earnings per share, EBITDA, adjusted EBITDA, and organic sales growth rates provides important supplemental information to management and investors seeking to understand the financial and business trends relating to our financial condition and results of operations, including compliance with our bank covenant calculations. Additionally, incentive compensation targets for our executives and associates are based upon certain of these adjusted measures.
- 30 -
MANAGEMENT’S DISCUSSION AND ANALYSIS
Strategic Overview
The last several years have been transformational for Integer. In 2015, we merged with LRM to form one of the largest MDO manufacturers in the world. In 2016, we spun-off our former QiG Group, LLC subsidiary and its neuromodulation medical device business, known as Nuvectra, to allow both companies to capitalize on their respective growth opportunities and focus on their respective strategic plans. In mid-2016, our transformation culminated with the unification of the combined companies under one name - “Integer” - signifying the full portfolio of product offerings we can provide our customers from discrete component technologies to full active implantable medical devices.
Throughout 2016 and 2017 we completed the integration of our two legacy companies, and since the LRM acquisition have achieved deal synergies of approximately $50 million, which is consistent with our original expectations. Additionally, during 2017 we undertook a thorough strategic review of our customers, competitors and markets. As a result of this review, during the fourth quarter of 2017, we began to take steps to better align our resources in order to invest to grow, protect, preserve and to enhance the profitability of our portfolio of products. These steps will include focusing our investment in research and development and manufacturing, improving our business processes and redirecting investments away from projects where the market does not justify the investment. The execution of this strategy will be our primary focus going forward.
We believe Integer is well-positioned within the medical technology and MDO manufacturing market and that there is a robust pipeline of opportunities to pursue. We have expanded our medical device capabilities and are excited about opportunities to partner with customers to drive innovation. We believe we have the scale and global presence, supported by world-class manufacturing and quality capabilities, to capture these opportunities. We are confident in our abilities as one of the largest MDO manufacturers, with a long history of successfully integrating companies, driving down costs and growing revenues over the long-term. Ultimately, our strategic vision is to drive shareholder value by enhancing the lives of patients worldwide by being our customers’ partner of choice for innovative technologies and services.
Financial Overview
Fiscal 2017 Compared with Fiscal 2016
Net income for 2017 was $66.7 million or $2.09 per diluted share compared to net income of $6.0 million or $0.19 per diluted share for 2016. These variances are primarily the result of the following:
• | Sales for 2017 increased 5.4% primarily driven by market growth, new business wins, and lower comparables versus 2016 in our Cardio & Vascular, Advanced Surgical, Orthopedics & Portable Medical and Non-Medical product lines. These increases were partially offset by price concessions given to our larger OEM customers in return for long-term volume commitments, which lowered 2017 sales by approximately $16 million in comparison to 2016; |
• | Gross profit for 2017 increased $15.3 million primarily due to the increase in sales discussed above, as well as production efficiencies, partially offset by the price concessions given to our larger OEM customers and higher incentive compensation expenses based upon 2017 results; |
• | Operating expenses for 2017 were lower by $15.9 million primarily due to the results of Nuvectra not being included after the Spin-off ($4.7 million), lower consolidation and integration charges ($24.4 million), and various efficiencies and synergies gained as a result of our integration and consolidation initiatives partially offset by higher incentive compensation expenses ($8.6 million); |
• | Interest expense for 2017 declined $4.8 million primarily due to the amendment of our Term Loan B Facility in 2017, which lowered the interest rate paid on that debt by 100 basis points, as well as the net repayment of $128.6 million of debt during 2017. These reductions were partially offset by the accelerated write-off of deferred fees and original issue discount of $3.6 million due to the accelerated pay down of debt during 2017, as well as the increase in LIBOR during 2017; |
• | Other (income) loss, net for 2017 was lower by $14.6 million (higher net loss) due to higher foreign currency exchange rate losses driven by the remeasurement of intercompany loans as a result of the weakening of the U.S. dollar relative to the Euro during 2017, which are primarily non-cash in nature; |
• | As a result of the U.S. Tax Cuts and Jobs Act (the “Tax Reform Act”), which was enacted on December 22, 2017, we recognized a $39.4 million net income tax benefit primarily related to the revaluation of our net deferred tax liabilities partially offset by a one-time mandatory tax on the repatriation of undistributed foreign subsidiary earnings and profits; |
• | Our weighted average diluted shares increased 915,000 in 2017 primarily due to the issuance of shares under our stock-based compensation programs, as well as the increase in our average stock price during the year. The net result of this increase was a decrease to diluted EPS by $0.06 per share. |
- 31 -
MANAGEMENT’S DISCUSSION AND ANALYSIS
Fiscal 2016 Compared with Fiscal 2015
Net income for 2016 was $6.0 million or $0.19 per diluted share compared to a net loss of $7.6 million or $0.29 per diluted share for 2015. These variances are primarily the result of the following:
• | Sales for 2016 of $1.39 billion increased $586 million or 73% in comparison to 2015. During 2016, incremental sales contributed by LRM were approximately $650 million. Sales for 2016 also include the impact of foreign currency exchange rate fluctuations, which reduced legacy Greatbatch Medical sales by approximately $1 million in comparison to the prior year due to the strengthening dollar versus the Euro. Excluding the impact of these items, as well as the divestiture of $1 million of revenue earned by Nuvectra prior to the Spin-off, organic sales decreased 8% in comparison to the prior year. This decrease was primarily due to 1) the reduction of shipments in a limited number of cardiac rhythm management (“CRM”) customer programs; 2) the 30% decline in Non-Medical sales caused by the slowdown in the energy markets; and 3) contractual price reductions given in exchange for longer-term volume commitments from customers. These decreases were partially offset by growth in sales to our neuromodulation customers during 2016; |
• | Gross profit for 2016 increased $143.2 million primarily due to the acquisition of LRM which added $192.7 million to gross profit. 2015 cost of sales includes $23.0 million of inventory step-up amortization recorded as a result of the LRM acquisition, which was fully amortized at the end of 2015; |
• | Operating expenses for 2016 increased $48.0 million primarily due to the acquisition of LRM, which added $76.1 million of operating expenses partially offset by lower operating expenses due to the Spin-off of Nuvectra of $20.4 million; and |
• | Interest expense for 2016 increased $77.8 million primarily due the $1.8 billion of debt issued in connection with the LRM acquisition. In addition to the debt incurred, we issued 5.0 million shares to the former owners of LRM as part of the consideration paid, which increased weighted average diluted shares outstanding. |
We consistently report and discuss in our earnings releases and investor presentations adjusted diluted EPS and adjusted EBITDA. These amounts consist of GAAP amounts adjusted for unusual or infrequently occurring items and specific items related to our acquisition and consolidation initiatives. We believe that the presentation of adjusted diluted earnings per share and adjusted EBITDA provides important supplemental information to management and investors seeking to understand the financial and business trends relating to our financial condition and results of operations, including compliance with our bank covenant calculations. Refer to “Use of Non-GAAP Financial Information” above for a further description of these items.
- 32 -
MANAGEMENT’S DISCUSSION AND ANALYSIS
A reconciliation of GAAP net income (loss) and diluted EPS to adjusted amounts for fiscal years 2017, 2016 and 2015 is as follows (in thousands, except per share amounts):
2017 | 2016 | 2015 | |||||||||||||||||||||||||||||||||
Pre-Tax | Net Income | Per Diluted Share | Pre-Tax | Net Income | Per Diluted Share | Pre-Tax | Net Income (Loss) | Per Diluted Share | |||||||||||||||||||||||||||
As reported (GAAP) | $ | 21,827 | $ | 66,679 | $ | 2.09 | $ | 1,185 | $ | 5,961 | $ | 0.19 | $ | (15,700 | ) | $ | (7,594 | ) | $ | (0.29 | ) | ||||||||||||||
Adjustments: | |||||||||||||||||||||||||||||||||||
Amortization of intangibles(a) | 44,174 | 31,255 | 0.98 | 37,862 | 26,771 | 0.86 | 17,496 | 12,273 | 0.45 | ||||||||||||||||||||||||||
IP related litigation (SG&A)(a)(b) | 4,375 | 2,844 | 0.09 | 3,040 | 1,976 | 0.06 | 4,417 | 2,871 | 0.11 | ||||||||||||||||||||||||||
Other operating expenses(a): | |||||||||||||||||||||||||||||||||||
Consolidation and optimization(c) | 13,349 | 10,529 | 0.33 | 26,490 | 21,582 | 0.69 | 26,393 | 21,158 | 0.77 | ||||||||||||||||||||||||||
Acquisition and integration(c) | 10,870 | 7,202 | 0.22 | 28,316 | 18,554 | 0.59 | 33,449 | 25,885 | 0.95 | ||||||||||||||||||||||||||
Asset dispositions, severance and other(c) | 7,182 | 4,808 | 0.15 | 6,931 | 5,760 | 0.18 | 6,622 | 5,099 | 0.19 | ||||||||||||||||||||||||||
Strategic reorganization and alignment(c) | 5,891 | 3,829 | 0.12 | — | — | — | — | — | — | ||||||||||||||||||||||||||
(Gain) loss on cost and equity method investments, net(a) | 1,565 | 1,017 | 0.03 | 833 | 541 | 0.02 | (3,350 | ) | (2,177 | ) | (0.08 | ) | |||||||||||||||||||||||
Loss on extinguishment of debt(a)(d) | 3,525 | 2,291 | 0.07 | — | — | — | — | — | — | ||||||||||||||||||||||||||
Tax adjustments(e) | — | (40,281 | ) | (1.26 | ) | — | (154 | ) | — | — | — | — | |||||||||||||||||||||||
Nuvectra results prior to Spin-off(a)(f) | — | — | — | 4,037 | 2,624 | 0.08 | 24,103 | 15,667 | 0.57 | ||||||||||||||||||||||||||
Acquisition related inventory step-up amortization (COS)(a) | — | — | — | — | — | — | 22,986 | 15,605 | 0.57 | ||||||||||||||||||||||||||
Acquisition transaction costs(a)(g) | — | — | — | — | — | — | 9,463 | 6,151 | 0.23 | ||||||||||||||||||||||||||
Adjusted (Non-GAAP) | $ | 112,758 | $ | 90,173 | $ | 2.81 | $ | 108,694 | $ | 83,615 | $ | 2.68 | $ | 125,879 | $ | 94,938 | $ | 3.48 | |||||||||||||||||
Diluted weighted average shares for adjusted EPS(h) | 32,056 | 31,222 | 27,304 | ||||||||||||||||||||||||||||||||
(a) | The difference between pre-tax and net income amounts is the estimated tax impact related to the respective adjustment. Net income amounts are computed using a 35% U.S. tax rate, and the statutory tax rates in Mexico, Germany, France, Netherlands, Uruguay, Ireland and Switzerland, as adjusted for the existence of net operating losses. Expenses that are not deductible for tax purposes (i.e. permanent tax differences) are added back at 100%. |
(b) | In 2013, we filed suit against AVX Corporation alleging they were infringing our intellectual property (“IP”). Given the complexity and significant costs incurred pursuing this litigation, we are excluding these litigation expenses from adjusted amounts. Refer to Note 13 “Commitments and Contingencies” of the Notes to Consolidated Financial Statements contained in Item 8 of this report for additional information regarding this litigation. |
(c) | Refer to the “Cost Savings and Consolidation Efforts” section of this Item and Note 11 “Other Operating Expenses” of the Notes to Consolidated Financial Statements contained in Item 8 of this report for additional information regarding these initiatives. |
(d) | Represents debt extinguishment charges in connection with pre-payments made on our Term B Loan Facility during 2017, which are included in interest expense. |
(e) | The tax adjustment for 2017 represents the net tax benefit resulting from the Tax Reform Act, which was signed into law on December 22, 2017. Tax adjustments also include a discrete tax benefit related to certain transaction costs of the LRM acquisition and the spin-off of Nuvectra in 2016 and a tax charge in the fourth quarter of 2016 and 2017 in connection with the enactment of regulations under §987 of the Internal Revenue Code, which resulted in an adjustment to our deferred tax assets. |
(f) | Represents the results of Nuvectra prior to its Spin-off on March 14, 2016. |
(g) | During 2015, we recorded transaction costs (i.e. debt commitment fees, interest rate swap termination costs, and debt extinguishment charges) in connection with our acquisition of LRM. These expenses are included as a component of interest expense in our Consolidated Statement of Operations and Comprehensive Income (Loss). |
- 33 -
MANAGEMENT’S DISCUSSION AND ANALYSIS
(h) | The diluted weighted average shares for adjusted EPS or fiscal years 2017, 2016 and 2015 include 168,000, 249,000 and 941,000, respectively, of potentially dilutive shares not included in the computation of diluted weighted average common shares for GAAP diluted EPS purposes because their effect would have been anti-dilutive in that period. |
For 2017, adjusted diluted EPS increased 4.9% to $2.81 per share in comparison to 2016 primarily due to our increased gross profit and lower interest expense partially offset by higher incentive compensation ($8.6 million (SG&A, RD&E)) and higher foreign currency exchange losses ($14.6 million). Excluding the impact of these foreign currency exchange losses which are primarily non-cash in nature, adjusted diluted EPS increased 19.6%.
For 2016, adjusted diluted EPS decreased 23.0% to $2.68 per share in comparison to 2015 primarily due to the increase in interest expense as discussed above partially offset by the incremental income provided by LRM.
A reconciliation of GAAP net income (loss) to EBITDA and adjusted EBITDA for fiscal years 2017, 2016 and 2015 is as follows (dollars in thousands):
2017 | 2016 | 2015 | |||||||||
Net income (loss) as reported (GAAP) | $ | 66,679 | $ | 5,961 | $ | (7,594 | ) | ||||
Interest expense | 106,460 | 111,270 | 33,513 | ||||||||
Benefit for income taxes | (44,852 | ) | (4,776 | ) | (8,106 | ) | |||||
Depreciation | 56,084 | 52,662 | 27,136 | ||||||||
Amortization excluding OOE | 44,174 | 37,862 | 17,496 | ||||||||
EBITDA (Non-GAAP) | 228,545 | 202,979 | 62,445 | ||||||||
IP related litigation | 4,375 | 3,040 | 4,417 | ||||||||
Stock-based compensation expense excluding OOE | 12,424 | 6,933 | 9,287 | ||||||||
Consolidation and optimization expenses | 13,349 | 26,490 | 26,393 | ||||||||
Acquisition and integration expenses | 10,870 | 28,316 | 33,449 | ||||||||
Asset dispositions, severance and other | 7,182 | 6,931 | 6,622 | ||||||||
Strategic reorganization and alignment | 5,891 | — | — | ||||||||
Noncash loss on cost and equity method investments | 2,965 | 1,495 | 275 | ||||||||
Nuvectra results prior to Spin-off | — | 3,665 | 23,517 | ||||||||
Acquisition related inventory step-up amortization | — | — | 22,986 | ||||||||
Adjusted EBITDA (Non-GAAP) | $ | 285,601 | $ | 279,849 | $ | 189,391 | |||||
The changes in adjusted EBITDA for 2017 versus 2016 and 2015 are primarily the result of the same factors that drove the changes in adjusted diluted EPS as discussed above.
- 34 -
MANAGEMENT’S DISCUSSION AND ANALYSIS
Cost Savings and Consolidation Efforts
In fiscal years 2017, 2016 and 2015, we recorded charges in OOE related to various cost savings and consolidation initiatives. These initiatives were undertaken to improve our operational efficiencies and profitability, the most significant of which are as follows (dollars in millions):
Initiative | Expected Expense | Expected Capital | Expected Annual Cost Savings(a) | Expected Completion Date | ||||
Consolidation and optimization expenses | ||||||||
Manufacturing alignment to support growth | $9 - $11 | $4 - $6 | $2 - $3 | 2019 | ||||
LRM consolidations | $18 - $22 | $5 - $6 | $12 - $13 | 2018 | ||||
Investments in capacity and capabilities | $56 | $23 | > $20 | Complete | ||||
Strategic reorganization and alignment | $10 - $12 | - | $8 - $12 | 2018 | ||||
(a) Represents the annual benefit to our operating income expected to be realized from these initiatives through cost savings and/or increased capacity. These benefits will be phased in over time as the various initiatives are completed, some of which are already included in our current period results.
We continually evaluate our operating structure in order to maximize efficiencies and drive margin expansion. Future charges are expected to be incurred as we seek to create an optimized manufacturing footprint, leveraging our increased scale and product capabilities while also supporting the needs of our customers. Our efforts will include:
• | potential manufacturing consolidations; |
• | continuous improvement; |
• | productivity initiatives; |
• | direct material and indirect expense savings opportunities; and |
• | the establishment of centers of excellence. |
Since the acquisition of LRM, we achieved approximately $50 million of cumulative annual run-rate synergies, which is consistent with our original expectations.
Refer to Note 11 “Other Operating Expenses” of the Notes to Consolidated Financial Statements contained in Item 8 of this report for additional information about the timing, cash flow impact, and amount of future expenditures for our cost savings and consolidation initiatives.
- 35 -
MANAGEMENT’S DISCUSSION AND ANALYSIS
CRITICAL ACCOUNTING ESTIMATES
Management’s discussion and analysis of financial condition and results of operations are based upon our consolidated financial statements which have been prepared in accordance with GAAP. We make estimates and assumptions in the preparation of our consolidated financial statements that affect the reported amounts of assets and liabilities, revenue and expenses and related disclosures of contingent assets and liabilities. We base our estimates and judgments upon historical experience and other factors that are believed to be reasonable under the circumstances. Changes in estimates or assumptions could result in a material adjustment to the consolidated financial statements.
We have identified several critical accounting estimates. An accounting estimate is considered critical if both: (a) the nature of the estimates or assumptions is material due to the levels of subjectivity and judgment involved, and (b) the impact of changes in the estimates and assumptions would have a material effect on the consolidated financial statements. This listing is not a comprehensive list of all of our accounting policies. For further information regarding the application of these and other accounting policies, see Note 1 “Summary of Significant Accounting Policies” of the Notes to Consolidated Financial Statements contained in Item 8 of this report.
Inventories
Inventories are measured on a first-in, first-out basis at the lower of cost or net realizable value. Net realizable value is the estimated selling prices in the ordinary course of business, less reasonably predictable costs of completion, disposal, and transportation. Inventory costing requires complex calculations that include assumptions for overhead absorption, scrap, sample calculations, manufacturing yield estimates, costs to sell, and the determination of which costs may be capitalized. The valuation of inventory requires us to estimate obsolete or excess inventory, as well as inventory that is not of saleable quality.
Historically, our inventory adjustment has been adequate to cover our losses. However, variations in methods or assumptions could have a material impact on our results. If our demand forecast for specific products is greater than actual demand and we fail to reduce manufacturing output accordingly, we could be required to record additional inventory write-down or expense a greater amount of overhead costs, which would negatively impact our net income. As of December 29, 2017, we have $227.5 million of inventory recorded on our consolidated balance sheet, representing approximately 8% of total assets. A 1% write-down of our inventory would decrease our 2017 net income approximately $1.5 million, or $0.05 per diluted share.
Valuation of Goodwill, Intangible and Other Long-Lived Assets
We make assumptions in establishing the carrying value, fair value and, if applicable, the estimated lives of our goodwill, intangible and other long-lived assets. Goodwill and intangible assets determined to have an indefinite useful life are not amortized. Instead, these assets are evaluated for impairment on an annual basis on the last day of our fiscal year and whenever events or business conditions change that could indicate that the asset is impaired. Long-lived assets are reviewed for impairment whenever events or changes in circumstances indicate that the carrying amount of an asset (asset group) may not be recoverable.
Evaluation of goodwill for impairment
We test each reporting unit’s goodwill for impairment on the last day of our fiscal year and between annual tests if an event occurs or circumstances change that would more-likely-than-not reduce the fair value of a reporting unit below its carrying value. In conducting this annual impairment testing, we may first perform a qualitative assessment of whether it is more-likely-than-not that a reporting unit’s fair value is less than its carrying value. If not, no further goodwill impairment testing is required. If it is more-likely-than-not that a reporting unit’s fair value is less than its carrying value, or if we elect not to perform a qualitative assessment of a reporting unit, a quantitative analysis is performed, in which the fair value of the reporting unit is compared to its net book value. If the net book value of a reporting unit exceeds its fair value, an impairment loss is recognized equal to the excess, limited to the amount of goodwill allocated to that reporting unit.
We performed a qualitative assessment of our Medical and Non-Medical reporting units as of December 29, 2017. As part of this analysis, we evaluated factors including, but not limited to, macro-economic conditions, market and industry conditions, cost factors, the competitive environment, share price fluctuations, previous impairment testing results, and the operational stability and overall financial performance of the reporting units. More specifically, for our Medical and Non-Medical reporting units we noted that 2017 actual and projected 2018 revenues exceeded those used in the 2016 assessment, the respective discount rates for each reporting unit were consistent or more favorable than those used in the 2016 assessment, the respective tax rates for each reporting unit were more favorable than those used in the 2016 assessment, and the long-term growth rate for each reporting unit were consistent with the 2016 assessment. Additionally, other positive indicators considered since the last quantitative assessment was the 54% increase in the Company’s stock prices and the significant rebound in the energy markets. As a result, we concluded that it was more-likely-than-not that the fair value of each of the reporting units exceeded its respective carrying value, and as such, a quantitative assessment was not required.
- 36 -
MANAGEMENT’S DISCUSSION AND ANALYSIS
Our annual impairment test on December 30, 2016, was the last time we performed a quantitative assessment of goodwill. In that assessment, the fair value of each reporting unit, Medical and Non-Medical, was determined using a combination of the income and market approaches. The present value of the risk adjusted cash flows computed under the income approach for the Medical reporting unit were calculated using a discount rate of 9.0%, a tax rate of 28%, and a long-term terminal growth rate of 3.0%. The market approach used for the Medical reporting unit considered EBITDA multiples based upon comparable public companies ranging from 8.5x to 9.5x and recent market transactions ranging from 10.5x to 12.5x. The present value of the risk adjusted cash flows computed under the income approach for the Non-Medical reporting unit were calculated using a discount rate of 10.0%, a tax rate of 38%, and a long-term terminal growth rate of 3.0%. The market approach used for the Non-Medical reporting unit considered EBITDA multiples based upon comparable public companies of 9.5x and recent market transactions ranging from 11.0x to 13.5x.
We do not believe that any of our reporting units are at risk for impairment. However, changes to the factors considered above could affect the estimated fair value of one or more of our reporting units and could result in a goodwill impairment charge in a future period. We may be unaware of one or more significant factors that, if we had been aware of, would cause our conclusion to change, which could result in a goodwill impairment charge in a future period. As of December 29, 2017, we have $990.2 million of goodwill recorded on our consolidated balance sheet, representing approximately 35% of total assets. A 1% write-down of our goodwill would decrease our 2017 net income approximately $6.4 million, or $0.20 per diluted share.
Evaluation of indefinite-lived intangible assets for impairment
Our indefinite-lived intangible assets include the Greatbatch Medical and Lake Region Medical tradenames. Similar to goodwill, we perform an annual impairment review of our indefinite-lived intangible assets on the last day of our fiscal year, unless events occur that trigger the need for an interim impairment review. We have the option to first assess qualitative factors in determining whether it is more-likely-than-not that an indefinite-lived intangible asset is impaired. If we elect not to use this option, or we determine that it is more-likely-than-not that the asset is impaired, we perform a quantitative assessment that requires us to estimate the fair value of each indefinite-lived intangible asset and compare that amount to its carrying value. Fair value is estimated using the relief-from-royalty method. Significant assumptions inherent in this methodology include estimates of royalty rates and discount rates. The discount rate applied is based on the risk inherent in the respective intangible assets and royalty rates are based on the rates at which comparable tradenames are being licensed in the marketplace. Impairment, if any, is based on the excess of the carrying value over the fair value of these assets.
We performed a quantitative assessment to test our other indefinite-lived intangible assets for impairment as of December 29, 2017. In testing our other indefinite-lived intangible assets for impairment, we assumed forecasted revenues for a period of eight years with a discount rate of 10.5%, terminal growth rate of 3.0%, and royalty rates ranging from 1.0% to 2.0%. For the Greatbatch Medical tradename, the excess of the estimated fair value over carrying value (expressed as a percentage of carrying value) was in excess of 400% and had a carrying value of $20 million at December 29, 2017. The Lake Region Medical tradename had an excess of the estimated fair value over carrying value of approximately 44% (11% in 2016) and a carrying value of $70 million at December 29, 2017. A significant increase in the discount rate, decrease in the terminal growth rate, increase in tax rates, decrease in the royalty rate or substantial reductions in our end markets and volume assumptions could have a negative impact on the estimated fair values of either of our tradenames and require us to recognize impairments of these other indefinite-lived intangible assets in a future period. A 1% write-down of our tradenames would decrease our 2017 net income approximately $0.6 million, or $0.02 per diluted share.
Evaluation of long-lived assets for impairment
Our long-lived assets consist primarily of property, plant and equipment and definite-lived intangible assets, including purchased technology and patents, and customer lists. Property, plant and equipment and definite-lived intangible assets are carried at cost. The cost of property, plant and equipment is charged to depreciation expense over the estimated life of the operating assets, primarily on a straight-line basis. Definite-lived intangible assets are amortized over the expected life of the asset. We assess long-lived assets and definite-lived intangible assets for impairment when events occur or circumstances change that would indicate that the carrying value of the asset may not be recoverable.
- 37 -
MANAGEMENT’S DISCUSSION AND ANALYSIS
Factors that we consider in deciding when to perform an impairment review include, but are not limited to: a significant decrease in the market price of the asset (asset group); a significant change in the extent or manner in which the asset (asset group) is being used or in its physical condition; a significant change in legal factors or business climate that could affect the value of a long-lived asset (asset group), including an action or assessment by a regulator; an accumulation of costs significantly in excess of the amount originally expected for the acquisition or construction of a long-lived asset (asset group); a current-period operating or cash flow loss combined with a history of operating or cash flow losses or a projection or forecast that demonstrates continuing losses associated with the use of a long-lived asset (asset group); and a current expectation that it is more likely than not that a long-lived asset (asset group) will be sold or otherwise disposed of significantly before the end of its previously estimated useful life.
When impairment indicators exist, we determine if the carrying value of the long-lived asset(s) or definite-lived intangible asset(s) exceeds the related undiscounted future cash flows. In cases where the carrying value exceeds the undiscounted future cash flows, the carrying value is written down to fair value. Fair value is generally determined using a discounted cash flow analysis. When it is determined that the useful life of an asset (asset group) is shorter than the originally estimated life, and there are sufficient cash flows to support the carrying value of the asset (asset group), we accelerate the rate of depreciation/amortization in order to fully depreciate/amortize the asset over its shorter useful life.
Estimation of the cash flows and useful lives of long-lived assets and definite-lived intangible assets requires significant management judgment. Events could occur that would materially affect our estimates and assumptions. Unforeseen changes, such as the loss of one or more significant customers, technology obsolescence, or significant manufacturing disruption, amongst other factors, could substantially alter the assumptions regarding the ability to realize the return of our investment in long-lived assets, definite-lived intangible assets or their estimated useful lives. Also, as we make manufacturing process conversions and other facility consolidation decisions, we must make subjective judgments regarding the remaining cash flows and useful lives of our assets, primarily manufacturing equipment and buildings. Significant changes in these estimates and assumptions could change the amount of future depreciation or amortization expense or could create future impairments of these long-lived assets (asset groups) or definite-lived intangible assets.
As of December 29, 2017, we have $370.4 million of tangible long-lived assets on our consolidated balance sheet, representing approximately 13% of total assets. A 1% write-down in our tangible long-lived assets would decrease our 2017 net income approximately $2.4 million, or $0.08 per diluted share.
Income Taxes
Our consolidated financial statements have been prepared using the asset and liability approach in accounting for income taxes, which requires the recognition of deferred income taxes for the expected future tax consequences of net operating losses, credits and temporary differences between the financial statement carrying amounts and the tax basis of assets and liabilities. A valuation allowance is provided on deferred tax assets if it is determined that it is more likely than not that the asset will not be realized.
In recording the provision for income taxes, management must estimate the future tax rates applicable to the reversal of temporary differences based upon the timing of the expected reversal. Also, estimates are made as to whether taxable operating income in future periods will be sufficient to fully recognize any gross deferred tax assets. If recovery is not likely, we must increase our provision for income taxes by recording a valuation allowance against the deferred tax assets that we estimate will not ultimately be recoverable. Alternatively, we may make estimates about the potential usage of deferred tax assets that decrease our valuation allowances.
The calculation of our tax liabilities involves dealing with uncertainties in the application of complex tax regulations. Significant judgment is required in evaluating our tax positions and determining our provision for income taxes. During the ordinary course of business, there are many transactions and calculations for which the ultimate tax determination is uncertain. We establish reserves for uncertain tax positions when we believe that those tax positions do not meet the more likely than not threshold. We adjust these reserves in light of changing facts and circumstances, such as the outcome of a tax audit or the lapse of statutes of limitations. The provision for income taxes includes the impact of reserve provisions and changes to the reserves that are considered appropriate.
Changes could occur that would materially affect our estimates and assumptions regarding deferred taxes. Changes in current tax laws and tax rates could affect the valuation of deferred tax assets and liabilities, thereby changing the income tax provision. Also, significant declines in taxable income could materially impact the realizable value of deferred tax assets.
- 38 -
MANAGEMENT’S DISCUSSION AND ANALYSIS
The Tax Reform Act was enacted in December of 2017. The Tax Reform Act permanently reduces the U.S. federal corporate income tax rate from a maximum of 35% to a flat 21% rate, effective January 1, 2018, and creates a territorial-style taxing system. The Tax Reform Act also requires companies to pay a one-time transition tax on earnings of certain foreign subsidiaries that were previously deferred and also creates new taxes on certain types of foreign earnings. We are subject to the provisions of the Financial Accounting Standards Board (“FASB”) Accounting Standards Codification (“ASC”) 740-10, Income Taxes, which requires that the effect on deferred tax assets and liabilities from a change in tax rates be recognized in the period the tax rate change was enacted. In December of 2017, the SEC staff issued Staff Accounting Bulletin (“SAB”) 118 which allows companies that have not completed their accounting analysis of the effects of the Tax Reform Act, but can determine a reasonable estimate of those effects, should include a provisional amount based on their reasonable estimate in their financial statements. The guidance in SAB 118 also allows companies to adjust the provisional amounts during a one year measurement period. As of December 29, 2017, we have not completed our accounting for all of the tax effects associated with the enactment of the Tax Reform Act. However, we have, in certain cases made a reasonable estimate of the effects on our existing deferred tax balances and the one-time transition tax on earnings of certain foreign subsidiaries. Consequently, during the fourth quarter of 2017, we recognized a non-cash provisional net benefit of $39.4 million. Further information on the impacts of the Tax Reform Act is presented in Note 12 “Income Taxes” of the Notes to Consolidated Financial Statements contained in Item 8 of this report.
At December 29, 2017, we had $149.5 million of gross deferred tax assets on our consolidated balance sheet and a valuation allowance of $36.5 million has been established for certain deferred tax assets, as it is more likely than not that they will not be realized. An increase in the valuation allowance representing 1% of our gross deferred tax assets would decrease our 2017 net income by approximately $1.5 million, or $0.05 per diluted share.
- 39 -
MANAGEMENT’S DISCUSSION AND ANALYSIS
Our Financial Results
The following table presents selected financial information derived from our Consolidated Financial Statements, contained in Item 8 of this report, for the periods presented (dollars in thousands, except per share amounts):
Change | Change | ||||||||||||||||||||||||
2017 vs. 2016 | 2016 vs. 2015 | ||||||||||||||||||||||||
2017 | 2016 | 2015 | $ | % | $ | % | |||||||||||||||||||
Medical Sales: | |||||||||||||||||||||||||
Cardio & Vascular | $ | 536,794 | $ | 490,857 | $ | 131,299 | $ | 45,937 | 9 | % | $ | 359,558 | 274 | % | |||||||||||
Cardiac & Neuromodulation | 428,349 | 439,541 | 361,722 | (11,192 | ) | (3 | )% | 77,819 | 22 | % | |||||||||||||||
Advanced Surgical, Orthopedics & Portable Medical | 439,810 | 414,701 | 247,944 | 25,109 | 6 | % | 166,757 | 67 | % | ||||||||||||||||
Total Medical Sales | 1,404,953 | 1,345,099 | 740,965 | 59,854 | 4 | % | 604,134 | 82 | % | ||||||||||||||||
Non-Medical | 56,968 | 41,679 | 59,449 | 15,289 | 37 | % | (17,770 | ) | (30 | )% | |||||||||||||||
Total sales | 1,461,921 | 1,386,778 | 800,414 | 75,143 | 5 | % | 586,364 | 73 | % | ||||||||||||||||
Cost of sales | 1,068,370 | 1,008,479 | 565,279 | 59,891 | 6 | % | 443,200 | 78 | % | ||||||||||||||||
Gross profit | 393,551 | 378,299 | 235,135 | 15,252 | 4 | % | 143,164 | 61 | % | ||||||||||||||||
Gross profit as a % of sales | 26.9 | % | 27.3 | % | 29.4 | % | |||||||||||||||||||
Selling, general and administrative expenses (“SG&A”) | 161,573 | 153,291 | 102,530 | 8,282 | 5 | % | 50,761 | 50 | % | ||||||||||||||||
SG&A as a % of sales | 11.1 | % | 11.1 | % | 12.8 | % | |||||||||||||||||||
Research, development and engineering costs (“RD&E”) | 55,247 | 55,001 | 52,995 | 246 | — | % | 2,006 | 4 | % | ||||||||||||||||
RD&E as a % of sales | 3.8 | % | 4.0 | % | 6.6 | % | |||||||||||||||||||
Other operating expenses | 37,292 | 61,737 | 66,464 | (24,445 | ) | (40 | )% | (4,727 | ) | (7 | )% | ||||||||||||||
Operating income | 139,439 | 108,270 | 13,146 | 31,169 | 29 | % | 95,124 | NM | |||||||||||||||||
Operating margin | 9.5 | % | 7.8 | % | 1.6 | % | |||||||||||||||||||
Interest expense | 106,460 | 111,270 | 33,513 | (4,810 | ) | (4 | )% | 77,757 | NM | ||||||||||||||||
(Gain) loss on cost and equity method investments, net | 1,565 | 833 | (3,350 | ) | 732 | 88 | % | 4,183 | NM | ||||||||||||||||
Other (income) loss, net | 9,587 | (5,018 | ) | (1,317 | ) | 14,605 | NM | (3,701 | ) | NM | |||||||||||||||
Income (loss) before benefit for income taxes | 21,827 | 1,185 | (15,700 | ) | 20,642 | 16,885 | |||||||||||||||||||
Benefit for income taxes | (44,852 | ) | (4,776 | ) | (8,106 | ) | (40,076 | ) | NM | 3,330 | NM | ||||||||||||||
Effective tax rate | (205.5 | )% | (403.0 | )% | 51.6 | % | |||||||||||||||||||
Net income (loss) | $ | 66,679 | $ | 5,961 | $ | (7,594 | ) | $ | 60,718 | NM | $ | 13,555 | NM | ||||||||||||
Net margin | 4.6 | % | 0.4 | % | (0.9 | )% | |||||||||||||||||||
Diluted earnings (loss) per share | $ | 2.09 | $ | 0.19 | $ | (0.29 | ) | $ | 1.90 | NM | $ | 0.48 | NM | ||||||||||||
NM - Calculated change not meaningful.
- 40 -
MANAGEMENT’S DISCUSSION AND ANALYSIS
Fiscal 2017 Compared with Fiscal 2016
Sales
Sales by product line for fiscal years 2017 and 2016 were as follows (dollars in thousands):
Change | ||||||||||||||
2017 | 2016 | $ | % | |||||||||||
Medical Sales: | ||||||||||||||
Cardio & Vascular | $ | 536,794 | $ | 490,857 | $ | 45,937 | 9.4 | % | ||||||
Cardiac & Neuromodulation | 428,349 | 439,541 | (11,192 | ) | (2.5 | )% | ||||||||
Advanced Surgical, Orthopedics & Portable Medical | 439,810 | 414,701 | 25,109 | 6.1 | % | |||||||||
Total Medical Sales | 1,404,953 | 1,345,099 | 59,854 | 4.4 | % | |||||||||
Non-Medical | 56,968 | 41,679 | 15,289 | 36.7 | % | |||||||||
Total sales | $ | 1,461,921 | $ | 1,386,778 | $ | 75,143 | 5.4 | % | ||||||
Total 2017 sales increased 5.4% to $1.46 billion in comparison to 2016. The most significant drivers of this increase were as follows:
Cardio & Vascular sales for 2017 increased $45.9 million or 9.4% in comparison to 2016. This increase was primarily attributable to market growth and new business wins, especially for guidewires, as well as lower comparables in 2016 due to the disruption of supply caused by our consolidation initiatives, which occurred throughout 2016. During 2017, price concessions to our larger OEM customers reduced Cardio & Vascular sales by approximately $2 million in comparison to 2016. During 2017, foreign currency exchange rate fluctuations increased our Cardio & Vascular sales in comparison to 2016 by approximately $1 million primarily due to the weakening U.S. dollar relative to the Euro.
Cardiac & Neuromodulation sales for 2017 decreased $11.2 million or 2.5% in comparison to 2016. Approximately $1.2 million of this decrease was a result of the Spin-off of Nuvectra in the first quarter of 2016. Additionally, during 2017, price concessions to our larger OEM customers reduced Cardiac & Neuromodulation sales by approximately $9 million in comparison to 2016. Finally, this decrease is also the result of market declines, as well as customer inventory management and in-sourcing initiatives. Partially offsetting these decreases was growth in our neuromodulation products, which was not enough to offset the declines in our legacy cardiac rhythm management products. Foreign currency exchange rate fluctuations did not have a material impact on Cardiac & Neuromodulation sales during 2017 in comparison to 2016.
Advanced Surgical, Orthopedics & Portable Medical sales for 2017 increased $25.1 million or 6.1% in comparison to 2016. Foreign currency exchange rate fluctuations increased 2017 sales by approximately $1.5 million in comparison to 2016 primarily due to the weakening U.S. dollar relative to the Euro. For 2017, organic Advanced Surgical, Orthopedics & Portable Medical sales, which excludes a 0.4% positive impact from foreign currency exchange rate fluctuations, increased 5.7% in comparison to 2016 primarily due to advanced surgical market growth, the timing of customer inventory builds, new product ramps, and lower comparables due to the disruption of supply caused by our consolidation initiatives which occurred during 2016. For 2017, price concessions to our larger OEM customers reduced Advanced Surgical, Orthopedics & Portable Medical sales by approximately $4 million in comparison to 2016.
Non-Medical sales for 2017 increased $15.3 million or 36.7% in comparison to 2016. This increase was primarily driven by the recovery in the energy markets, as well as new business wins and market share gains. During the downturn in the energy markets, we were able to advance our competitive position with key strategic customers resulting in multi-year supply agreements and the opportunity to quote on significant new business opportunities. Additionally, we actively pursued new customer and market opportunities, developed new product solutions and invested in research and development to advance our technology. These efforts benefitted 2017 sales as we were able to increase our market share as the markets recovered. Foreign currency exchange rates and price fluctuations did not have a material impact on Non-Medical sales during 2017 in comparison to 2016.
- 41 -
MANAGEMENT’S DISCUSSION AND ANALYSIS
Gross Profit
Changes to gross profit as a percentage of sales (“Gross Margin”) from the prior year were due to the following:
% Change | ||
2017 vs. 2016 | ||
Price(a) | (1.1 | )% |
Mix(b) | (0.2 | )% |
Incentive compensation(c) | (0.6 | )% |
Production efficiencies and volume(d) | 1.5 | % |
Total percentage point change to gross profit as a percentage of sales | (0.4 | )% |
(a) | Our Gross Margin for 2017 was negatively impacted by price concessions given to our larger OEM customers in return for long-term volume commitments. |
(b) | Our Gross Margin for 2017 was negatively impacted by a higher mix of sales of lower margin products. |
(c) | Amount represents the impact to our Gross Margin attributable to our cash and stock incentive programs. Performance-based compensation is accrued based upon actual results achieved. |
(d) | Represents various increases and decreases to our Gross Margin. Overall, our Gross Margin for 2017 was positively impacted by production efficiencies and synergies gained as a result of our integration and consolidation initiatives as well as higher volumes in comparison to 2016. |
Over the long-term, we expect our Gross Margin to continue to improve as we further rationalize our manufacturing footprint and continue to recognize supply chain synergies. However, we also expect our Gross Margin to continue to be impacted by pricing pressures from our customers. If the manufacturing efficiencies realized are not enough to offset these pricing pressures, we could see a further deterioration in our Gross Margin.
SG&A Expenses
Changes to SG&A expenses were primarily due to the following (in thousands):
$ Change | |||
2017 vs. 2016 | |||
Nuvectra SG&A(a) | $ | (1,913 | ) |
Legal expenses(b) | 986 | ||
Intangible asset amortization(c) | 6,462 | ||
Incentive compensation programs(d) | 5,569 | ||
Other(e) | (2,822 | ) | |
Net increase in SG&A Expenses | $ | 8,282 | |
(a) | Amount represents the impact to our SG&A related to the overhead costs divested as a result of the Spin-off of Nuvectra in March 2016. |
(b) | Amount represents the change in legal costs compared to the prior year period. This variance is primarily due to the timing of legal expenses incurred related to our on-going IP infringement case. Refer to Note 13 “Commitments and Contingencies” of the Notes to Consolidated Financial Statements contained in Item 1 of this report for information related to this IP infringement litigation. |
(c) | Amount represents the increase in intangible asset amortization (i.e. customer list), which is amortized based upon the forecasted cash flows at the time of acquisition for the respective asset. |
(d) | Amount represents the impact to our SG&A attributable to our cash and stock incentive programs. Performance-based compensation is accrued based upon actual results achieved. |
(e) | Represents various increases and decreases to our SG&A. Overall, our SG&A for 2017 was positively impacted by efficiencies and synergies gained as a result of our integration and consolidation initiatives. |
- 42 -
MANAGEMENT’S DISCUSSION AND ANALYSIS
RD&E Expenses
Changes to RD&E expenses for fiscal years 2017 and 2016 were as follows (in thousands):
$ Change | |||
2017 vs. 2016 | |||
Nuvectra RD&E(a) | $ | (2,830 | ) |
Incentive compensation programs(b) | 2,995 | ||
Other(c) | 81 | ||
Net increase in RD&E | $ | 246 | |
(a) | Represents the impact to our RD&E related to the divested costs as a result of the Spin-off of Nuvectra in March 2016. |
(b) | Represents the impact to our RD&E attributable to our cash and stock incentive programs. Performance-based compensation is accrued based upon actual results achieved. |
(c) | Represents various increases and decreases to our RD&E. Our RD&E for 2017 was positively impacted by efficiencies and synergies gained as a result of our integration and consolidation initiatives, which was offset by our increased investment in projects with a higher growth opportunity. |
Other Operating Expenses
OOE was comprised of the following for fiscal years 2017 and 2016 (in thousands):
2017 | 2016 | Change | |||||||||
Consolidation and optimization initiatives(a) | $ | 13,349 | $ | 26,490 | $ | (13,141 | ) | ||||
Acquisition and integration costs(b) | 10,870 | 28,316 | (17,446 | ) | |||||||
Asset dispositions, severance and other(c) | 7,182 | 6,931 | 251 | ||||||||
Strategic reorganization and alignment(d) | 5,891 | — | $ | 5,891 | |||||||
Total other operating expenses | $ | 37,292 | $ | 61,737 | $ | (24,445 | ) | ||||
(a) | Refer to the “Cost Savings and Consolidation Efforts” section of this Item and Note 11 “Other Operating Expenses” of the Notes to Consolidated Financial Statements contained in Item 8 of this report for additional information regarding these initiatives. |
(b) | During 2017 and 2016, we incurred costs related to the acquisition of LRM, consisting primarily of professional, consulting, severance, retention, relocation, and travel costs. In addition, the 2016 fiscal year included change-in-control payments to former LRM executives. |
(c) | During 2017 and 2016, we recorded losses in connection with various asset disposals and/or write-downs. The 2017 amount also includes approximately $5.3 million in expense related to our leadership transitions. Additionally, during 2016 we incurred legal and professional costs in connection with the Spin-off of $4.4 million. |
(d) | As a result of the strategic review of our customers, competitors and markets we undertook during the fourth quarter of 2017, we began to take steps to better align our resources in order to invest to grow, protect, preserve and to enhance the profitability of our portfolio of products. This will include focusing our investment in RD&E and manufacturing, improving our business processes and redirecting investments away from projects where the market does not justify the investment. As a result, during the fourth quarter of 2017 we incurred charges related to the initial steps of this initiative, which included lease termination charges and accelerated amortization of certain intangible assets. |
We continually evaluate our operating structure in order to maximize efficiencies and drive margin expansion. For 2018, OOE is expected to be approximately $10 million to $15 million. Refer to the “Cost Savings and Consolidation Efforts” section of this Item for further details on these initiatives.
- 43 -
MANAGEMENT’S DISCUSSION AND ANALYSIS
Interest Expense
Interest expense decreased $4.8 million to $106.5 million in 2017 from $111.3 million in 2016. The weighted average interest rates paid on average borrowings outstanding during 2017 and 2016 was 5.58% and 5.77%, respectively. The lower weighted average interest rates paid in 2017 were primarily due to the amendment of our Senior Secured Credit Facilities in March 2017 and again in November 2017, which resulted in a cumulative 100 basis point reduction to the applicable interest rate margins of our Term Loan B facility, partially offset by an increase in LIBOR during 2017. Cash interest expense decreased $8.4 million during 2017 when compared to 2016, primarily due to the previously mentioned rate reduction combined with lower outstanding debt balances due to the net repayment of $129 million of debt during 2017. Non-cash interest expense (i.e. deferred fee and discount amortization) increased $3.6 million during 2017 when compared to 2016, primarily attributable to the accelerated write-off (losses from extinguishment of debt) of deferred fees and discounts due to prepayments of a portion of our Term Loan B Facility during 2017. We recognized losses from extinguishment of debt of $3.5 million during 2017. See Note 8 “Debt” of the Notes to Condensed Consolidated Financial Statements contained in Item 1 of this report for additional information pertaining to our debt.
(Gain) Loss on Cost and Equity Method Investments, Net
During fiscal year 2017 and 2016, we realized net losses on our cost and equity method investments of $1.6 million and $0.8 million, respectively. During 2017 and 2016, we recognized impairment charges on our cost method investments of $5.3 million and $1.6 million, respectively. We also recorded a $0.7 million gain on our cost method investments during 2016. During 2017 and 2016, we recognized gains of $3.7 million and $0.1 million, respectively, from our equity method investment. As of December 29, 2017 and December 30, 2016, we held $20.8 million and $22.8 million, respectively, of cost and equity method investments. The total carrying value of these investments is reviewed quarterly for changes in circumstance or the occurrence of events that suggest our investment may not be recoverable. These investments are in start-up research and development companies whose fair value is highly subjective in nature and could be subject to significant fluctuations in the future that could result in material gains or losses. See Note 16 “Fair Value Measurements” of the Notes to Consolidated Financial Statements contained in Item 8 of this report for further details regarding these investments.
Other (Income) Loss, Net
Other (income) loss was a $9.6 million loss during fiscal year 2017 compared to income of $5.0 million during fiscal year 2016.
The impact of foreign currency exchange rates on transactions denominated in foreign currencies included in Other (Income) Loss, Net for 2017 was a loss of $9.7 million, compared to a gain of $4.9 million in 2016. The losses in 2017 were primarily driven by the impact of the weakening U.S. dollar relative to the Euro on our intercompany loans and are primarily non-cash in nature. During 2017, we took and will continue to take steps, to manage the impact of currency exchange fluctuations on earnings and believe our exposure has been significantly reduced. However, fluctuations in foreign currency exchange rates could have a significant impact, positive or negative, on our financial results in the future.
- 44 -
MANAGEMENT’S DISCUSSION AND ANALYSIS
Benefit for Income Taxes
During 2017 and 2016, our benefit for income taxes was $44.9 million and $4.8 million, respectively. The stand-alone U.S. component of the effective tax rate for 2017 reflected a $61.3 million benefit on $46.5 million of pre-tax book losses (131.9%) versus a $13.8 million benefit on $52.4 million of pre-tax book losses (26.3%) for 2016. The stand-alone International component of the effective tax rate for 2017 reflected tax expense of $16.4 million on $68.3 million of pre-tax book income (24.1%) versus a tax expense of $9.0 million on $53.6 million of pre-tax book income (16.8%) for 2016. The benefit for income taxes for 2017 differs from the U.S. statutory rate due to the following (dollars in thousands):
U.S. | International | Combined | ||||||||||||||||||
$ | % | $ | % | $ | % | |||||||||||||||
Income (loss) before provision (benefit) for income taxes | $ | (46,459 | ) | $ | 68,286 | $ | 21,827 | |||||||||||||
Provision (benefit) at statutory rate | $ | (16,261 | ) | 35.0 | % | $ | 23,900 | 35.0 | % | $ | 7,639 | 35.0 | % | |||||||
Federal tax credits | (1,850 | ) | 4.0 | (46 | ) | (0.1 | ) | (1,896 | ) | (8.7 | ) | |||||||||
Foreign rate differential | 3,063 | (6.6 | ) | (14,188 | ) | (20.8 | ) | (11,125 | ) | (50.9 | ) | |||||||||
Uncertain tax positions | 34 | (0.1 | ) | 3,483 | 5.1 | 3,517 | 16.1 | |||||||||||||
State taxes, net of federal benefit | (864 | ) | 1.9 | — | — | (864 | ) | (4.0 | ) | |||||||||||
Valuation allowance | 546 | (1.2 | ) | 484 | 0.7 | 1,030 | 4.7 | |||||||||||||
Other | (3,732 | ) | 8.0 | (27 | ) | — | (3,759 | ) | (17.2 | ) | ||||||||||
Tax expense (benefit) before U.S. Tax Reform items | (19,064 | ) | 41.0 | 13,606 | 19.9 | (5,458 | ) | (25.0 | ) | |||||||||||
U.S. Tax Reform items: | ||||||||||||||||||||
Change in tax rates | (56,408 | ) | 121.4 | (45 | ) | (0.1 | ) | (56,453 | ) | (258.6 | ) | |||||||||
Toll charge on unremitted earnings | 14,719 | (31.7 | ) | — | — | 14,719 | 67.4 | |||||||||||||
Change in unremitted earnings assertion | (545 | ) | 1.2 | 2,885 | 4.2 | 2,340 | 10.7 | |||||||||||||
Tax expense related to U.S. Tax Reform items | (42,234 | ) | 90.9 | 2,840 | 4.1 | (39,394 | ) | (180.5 | ) | |||||||||||
Provision (benefit) for income taxes | $ | (61,298 | ) | 131.9 | % | $ | 16,446 | 24.1 | % | $ | (44,852 | ) | (205.5 | )% | ||||||
On December 22, 2017, the Tax Reform Act was signed into law. This legislation significantly changes U.S. tax law by, among other things, lowering corporate income tax rates, implementing a territorial tax system and imposing a repatriation tax on deemed repatriated earnings of foreign subsidiaries. The Tax Reform Act permanently reduces the U.S. corporate income tax rate from a maximum of 35% to a flat 21% rate, effective January 1, 2018.
Deferred tax assets and liabilities are measured using enacted tax rates expected to apply to taxable income in the years in which those temporary differences are expected to reverse. As a result of the reduction in the U.S. corporate income tax rate from 35% to 21% under the Tax Reform Act, we revalued our ending net deferred tax liabilities at December 29, 2017 and recognized a $56.5 million tax benefit for the year ended December 29, 2017.
The Tax Reform Act provided for a one-time deemed mandatory repatriation of post-1986 undistributed foreign subsidiary earnings and profits (“E&P”) through the year ended December 29, 2017. We had an estimated $147.5 million of undistributed foreign E&P subject to the deemed mandatory repatriation and recognized a provisional $14.7 million of income tax expense for the year ended December 29, 2017. Additionally, we recorded $2.3 million in deferred taxes associated with foreign withholding taxes in accordance with the change in our permanent reinvestment assertion related to the undistributed earnings subject to the deemed mandatory repatriation provisions. We have sufficient U.S. NOLs to offset cash tax liabilities associated with these repatriation taxes.
While the Tax Reform Act provides for a territorial tax system, beginning in 2018, it also includes two new U.S. tax base erosion provisions - the global intangible low-taxed income (“GILTI”) provisions and the base-erosion and anti-abuse tax (“BEAT”) provisions.
- 45 -
MANAGEMENT’S DISCUSSION AND ANALYSIS
The GILTI provisions require us to include foreign subsidiary earnings in excess of a deemed return on the foreign subsidiary’s tangible assets in our U.S. income tax return. We expect that we will be subject to incremental U.S. tax on GILTI income beginning in 2018. Because of the complexity of the new GILTI tax rules, we continue to evaluate this provision of the Tax Reform Act and the application of ASC 740, Income Taxes. Under GAAP, we are allowed to make an accounting policy choice of either (1) treating taxes due on future U.S. inclusions in taxable income related to GILTI as a current-period expense when incurred (the “period cost method”) or (2) factoring such amounts into the our measurement of our deferred taxes (the “deferred method”). Our selection of an accounting policy with respect to the new GILTI tax rules will depend, in part, on analyzing our global income to determine whether we expect to have future U.S. inclusions in taxable income related to GILTI and, if so, what the impact is expected to be. Whether we expect to have future U.S. inclusions in taxable income related to GILTI depends on not only our current structure and estimated future results of global operations, but also our intent and ability to modify this structure. We are currently in the process of analyzing our structure and have not yet made any adjustments related to potential GILTI tax in our financial statements and have not yet made a policy decision regarding whether to record deferred tax on GILTI.
The BEAT provisions in the Tax Reform Act eliminate the deduction of certain base-erosion payments made to related foreign corporations, and impose a minimum tax if greater than regular tax. We do not expect to be materially impacted by the BEAT provisions however we are still in the process of analyzing the effect of this provision of the Tax Reform Act. We have not included any tax impact of BEAT in our consolidated financial statements for the year ended December 29, 2017.
On December 22, 2017, the SEC issued SAB No. 118 to address the application of GAAP in situations when a registrant does not have the necessary information available, prepared, or analyzed (including computations) in reasonable detail to complete the accounting for certain income tax effects of the Tax Reform Act. We have recognized the tax impact of the revaluation of deferred tax assets and liabilities and the provisional tax impacts related to the deemed repatriated earnings of foreign subsidiaries and included these amounts in our consolidated financial statements for the year ended December 29, 2017. The ultimate impact may differ from the provisional amounts, possibly materially, due to, among other things, additional analysis, changes in interpretations and assumptions we have made, additional regulatory guidance that may be issued, and actions we may take as a result of the Tax Reform Act. The accounting is expected to be complete by the time that our 2017 U.S. corporate income tax return is filed in 2018.
We believe it is reasonably possible that a reduction of approximately $1.1 million of the balance of unrecognized tax benefits may occur within the next twelve months as a result of the lapse of the statute of limitations and/or audit settlements. As of December 29, 2017, approximately $11.8 million of unrecognized tax benefits would favorably impact the effective tax rate (net of federal impact on state issues), if recognized.
In addition to the impact of the Tax Reform Act described above, there is a prospective potential for volatility of our effective tax rate due to several factors, including changes in the mix of pre-tax income and the jurisdictions to which it relates, business acquisitions, settlements with taxing authorities, changes in tax rates, and foreign currency exchange rate fluctuations. In addition, we continue to explore tax planning opportunities that may have a material impact on our effective tax rate.
The difference between our effective tax rate and the U.S. federal statutory income tax rate in the current year is primarily attributable to the components of the Tax Reform Act as well as our overall lower effective tax rate in the foreign jurisdictions in which we operate and where our foreign earnings are derived. The lower tax rate jurisdictions in which we operate and the respective statutory tax rate for each respective jurisdiction include Switzerland (22%), Mexico (30%), Uruguay (25%), and Ireland (12.5%). In addition, we currently have a tax holiday in Malaysia through April 2018, with a potential extension through April 2023 if certain conditions are met. While we are not currently aware of any material trends in these jurisdictions that are likely to impact our current or future tax expense, our future effective tax rates could be adversely affected by earnings being lower than anticipated in countries where we have lower effective tax rates and higher than anticipated in countries where we have higher effective tax rates, or by changes in tax laws or regulations. We regularly assess any significant exposure associated with increases in tax rates in international jurisdictions and adjustments are made as events occur that warrant adjustment to our tax provisions.
- 46 -
MANAGEMENT’S DISCUSSION AND ANALYSIS
Fiscal 2016 Compared with Fiscal 2015
Sales
Sales by product lines for fiscal years 2016 and 2015 were as follows (dollars in thousands):
Change | ||||||||||||||
2016 | 2015 | $ | % | |||||||||||
Medical Sales: | ||||||||||||||
Cardio & Vascular | $ | 490,857 | $ | 131,299 | $ | 359,558 | 273.8 | % | ||||||
Cardiac & Neuromodulation | 439,541 | 361,722 | 77,819 | 21.5 | % | |||||||||
Advanced Surgical, Orthopedics & Portable Medical | 414,701 | 247,944 | 166,757 | 67.3 | % | |||||||||
Total Medical Sales | 1,345,099 | 740,965 | 604,134 | 81.5 | % | |||||||||
Non-Medical | 41,679 | 59,449 | (17,770 | ) | (29.9 | )% | ||||||||
Total sales | $ | 1,386,778 | $ | 800,414 | $ | 586,364 | 73.3 | % | ||||||
Total 2016 sales increased 73.3% to $1.39 billion in comparison to 2015. The most significant drivers of this increase were as follows:
Cardio & Vascular sales for 2016 increased $359.6 million in comparison to 2015 and includes approximately $354 million of incremental sales from LRM. On an organic basis, our Cardio and Vascular sales increased 4% in comparison to 2015 primarily due to normal market growth.
Cardiac & Neuromodulation sales for 2016 increased $77.8 million in comparison to 2015. 2016 sales includes approximately $104 million of incremental sales from LRM and reflects approximately $3 million less in sales due to the Spin-off. Organic Cardiac & Neuromodulation sales in decreased 6% in comparison to 2015 primarily due to reduced shipments in a limited number of CRM customer programs and approximately $8 million of contractual price reductions given in exchange for longer-term volume commitments. The reduced shipments were driven by both internal and external delays in product launches, customer clinical market share changes, customers lowering inventory levels, and order disruption due to acquisition-related influences in the medical technology markets. These factors were partially offset by growth in sales to neuromodulation customers in 2016.
Advanced Surgical, Orthopedics & Portable Medical sales for 2016 increased $166.8 million in comparison to 2015 and includes approximately $193 million of incremental sales from LRM. During 2016, foreign currency exchange rate fluctuations reduced this product line’s sales by approximately $1 million in comparison to the prior year due to the strengthening U.S. dollar versus the Euro. On an organic basis, our Advanced Surgical, Orthopedics, and Portable Medical sales decreased 10% in comparison to 2015 primarily due to portable medical customers building safety stock in the fourth quarter of 2015 in anticipation of our product line transfers, thus lowering orders in 2016, a backlog in shipments to one specific Portable Medical customer due to the product line transfer, and approximately $5 million of contractual price reductions given in exchange for longer-term volume commitments. Additionally, 2016 was a slower product launch year when compared to 2015.
Non-Medical sales during 2016 declined 30% in comparison to 2015. This decrease was primarily due to the slowdown in the energy markets, which has caused customers to reduce drilling and exploration volumes. Our Non-Medical product line tends to trend with the oil and gas market.
- 47 -
MANAGEMENT’S DISCUSSION AND ANALYSIS
Gross Profit
Changes to Gross Margin were primarily due to the following:
% Change | ||
2016 vs. 2015 | ||
Impact of LRM acquisition(a) | (3.1 | )% |
Price(b) | (2.1 | )% |
Production efficiencies, volume and mix(c) | 0.1 | % |
Incentive compensation(d) | 0.4 | % |
Warranty reserves and obsolescence write-offs(e) | (0.3 | )% |
Inventory step-up amortization(f) | 2.9 | % |
Total percentage point change to gross profit as a percentage of sales | (2.1 | )% |
(a) Represents the impact to our Gross Margin related to LRM, which historically had lower Gross Margins.
(b) | Our Gross Margin for 2016 was negatively impacted by contractual price reductions given in exchange for longer-term volume commitments. |
(c) | Our Gross Margin benefited from production efficiencies gained at our manufacturing facilities as a result of our various lean, supply chain, and integration initiatives, which were offset by a higher sales mix of lower margin products and lower sales volumes. |
(d) | Represents the impact to our Gross Margin from the change in cash and stock incentive compensation versus the prior year and is recorded based upon the actual results achieved. |
(e) | Cost of sales for fiscal year 2016 includes the impact of various warranty reserves and obsolescence write-offs, including reserves related to various customer returns and field actions that were higher than normal in 2016. |
(f) | Represents the impact to Gross Margin in comparison to 2015 related to the $23.0 million of inventory step-up amortization recorded in 2015 as a result of the LRM acquisition. The inventory step-up was fully amortized during fiscal year 2015. |
SG&A Expenses
Changes to SG&A expenses were primarily due to the following (in thousands):
$ Change | |||
2016 vs. 2015 | |||
Impact of LRM acquisition(a) | $ | 56,885 | |
Nuvectra SG&A(b) | (8,628 | ) | |
Legal fees(c) | (1,553 | ) | |
Other(d) | 4,057 | ||
Net increase in SG&A | $ | 50,761 | |
(a) | Represents the incremental SG&A expenses from LRM, which was acquired in October 2015. |
(b) | Represents the net decrease in SG&A costs attributable to Nuvectra, which was spun-off in March 2016. |
(c) | Represents the change in legal costs in comparison to 2015. Costs associated with our ongoing IP infringement case accounted for approximately $1.4 million of the decrease in SG&A expenses from 2015 to 2016. |
(d) | Represents the net impact of various increases and decreases to SG&A costs, including incremental operating costs associated with operating a company that nearly doubled in size at the end of 2015. |
- 48 -
MANAGEMENT’S DISCUSSION AND ANALYSIS
RD&E Expenses
Changes to RD&E expenses for fiscal years 2016 and 2015 were as follows (in thousands):
$ Change | |||
2016 vs. 2015 | |||
Impact of LRM acquisition(a) | $ | 10,889 | |
Nuvectra RD&E(b) | (12,600 | ) | |
Other(c) | 3,717 | ||
Net increase in RD&E | $ | 2,006 | |
(a) | Represents the incremental RD&E expenses from LRM, which was acquired in October 2015. |
(b) | Represents the net decrease in RD&E costs attributable to Nuvectra, which was spun-off in March 2016. |
(c) | Represents the net impact of various increases and decreases to RD&E costs and includes the impact of normal increases in operating costs, as well as our continued investment in developing our core and new technologies to drive future growth. |
Other Operating Expenses
OOE was comprised of the following for fiscal years 2016 and 2015 (in thousands):
2016 | 2015 | Change | |||||||||
Consolidation and optimization initiatives(a) | $ | 26,490 | $ | 26,393 | $ | 97 | |||||
Acquisition and integration costs(b) | 28,316 | 33,449 | (5,133 | ) | |||||||
Asset dispositions, severance and other(c) | 6,931 | 6,622 | 309 | ||||||||
Total other operating expenses | $ | 61,737 | $ | 66,464 | $ | (4,727 | ) | ||||
(a) | Refer to the “Cost Savings and Consolidation Efforts” section of this Item and Note 11 “Other Operating Expenses” of the Notes to Consolidated Financial Statements contained in Item 8 of this report for additional information regarding these initiatives. |
(b) | During 2016 and 2015, we incurred costs related to the acquisition and integration of LRM consisting primarily of change-in-control payments to former LRM executives, professional and consulting fees, severance, retention, relocation, and travel costs. |
(b) | During 2016 and 2015, we recorded losses in connection with various asset disposals and/or write-downs. Additionally, during 2016 and 2015, we incurred legal and professional costs in connection with the Spin-off of $4.4 million and $6.0 million, respectively. |
Interest Expense
Interest expense for 2016 increased $77.8 million in comparison to 2015. This increase was primarily due to the $1.8 billion of debt issued in connection with the LRM acquisition in October 2015, which caused our average debt balance to increase from $446 million in 2015 to $1.786 billion in 2016, and our average rate paid on our debt to increase from 4.95% in 2015 to 5.79% in 2016. Additionally, our reported interest expense for 2016 and 2015 included $7.3 million and $1.8 million, respectively, of non-cash amortization of debt issuance costs. In connection with the issuance of our debt in 2015 for the purchase of LRM, we incurred $9.5 million in transaction costs (i.e. debt commitment fees, interest rate swap termination costs, debt extinguishment charges), which was recorded in interest expense.
(Gain) Loss on Cost and Equity Method Investments, Net
During 2016, we recognized an impairment charge related to one of our cost method investments of $1.6 million and recorded a gain of $0.7 million from another cost method investment. During 2015, we recognized a $4.7 million gain from our equity method investment and recorded an impairment charge related to one of our cost method investments of $1.4 million. As of December 30, 2016 and January 1, 2016, we held $22.8 million and $20.6 million, respectively, of cost and equity method investments.
- 49 -
MANAGEMENT’S DISCUSSION AND ANALYSIS
Other (Income) Loss, Net
Other (income) loss, net primarily includes the impact of foreign currency exchange rate fluctuations on transactions denominated in foreign currencies. We recognized foreign currency transaction gains of $4.9 million in 2016 and $1.3 million in 2015, primarily related to the remeasurement of intercompany loans and the strengthening of the U.S. dollar relative to the Euro.
Benefit for Income Taxes
During 2016 and 2015, our benefit for income taxes was $4.8 million and $8.1 million, respectively. The stand-alone U.S. component of the effective tax rate for 2016 reflected a $13.8 million benefit on $52.4 million of pre-tax book losses (26.3%) versus a $13.1 million benefit on $42.2 million of pre-tax book losses (31.2%) for 2015. The stand-alone international component of the effective tax rate for 2016 reflected tax expense of $9.0 million on $53.6 million of pre-tax book income (16.8%) versus a tax expense of $5.0 million on $26.5 million of pre-tax book income (19.0%) for 2015.
The (benefit) provision for income taxes for 2016 differs from the U.S. statutory rate due to the following (dollars in thousands):
U.S. | International | Combined | ||||||||||||||||||
$ | % | $ | % | $ | % | |||||||||||||||
Income (loss) before provision (benefit) for income taxes | $ | (52,446 | ) | $ | 53,631 | $ | 1,185 | |||||||||||||
Provision (benefit) at statutory rate | $ | (18,356 | ) | 35.0 | % | $ | 18,771 | 35.0 | % | $ | 415 | 35.0 | % | |||||||
Federal tax credits | (1,750 | ) | 3.3 | (42 | ) | (0.1 | ) | (1,792 | ) | (151.2 | ) | |||||||||
Foreign rate differential | 3,192 | (6.1 | ) | (10,278 | ) | (19.2 | ) | (7,086 | ) | (598.0 | ) | |||||||||
Uncertain tax positions | 1,464 | (2.8 | ) | 260 | 0.5 | 1,724 | 145.5 | |||||||||||||
State taxes, net of federal benefit | (1,068 | ) | 2.0 | — | — | (1,068 | ) | (90.1 | ) | |||||||||||
Change in foreign tax rates | — | — | (270 | ) | (0.5 | ) | (270 | ) | (22.8 | ) | ||||||||||
Non-deductible transaction costs | 1,012 | (1.9 | ) | — | — | 1,012 | 85.4 | |||||||||||||
Valuation allowance | 811 | (1.5 | ) | 529 | 1.0 | 1,340 | 113.1 | |||||||||||||
Change in Tax law | 2,630 | (5.0 | ) | — | — | 2,630 | 221.9 | |||||||||||||
Other | (1,703 | ) | 3.2 | 22 | — | (1,681 | ) | (141.8 | ) | |||||||||||
Provision (benefit) for income taxes | $ | (13,768 | ) | 26.3 | % | $ | 8,992 | 16.8 | % | $ | (4,776 | ) | (403.0 | )% | ||||||
The 2015 and 2016 U.S. component of the effective tax rate reflects the impact of non-deductible transaction costs related to the acquisition of LRM and the Spin-off, which resulted in a reduction in the overall U.S. benefit of 1.9% in 2016 and 11.5% in 2015. Additionally, during 2016 we recorded a $2.6 million tax charge in connection with the enactment of regulations under §987 of the Internal Revenue Code, which resulted in an adjustment to our deferred tax assets. The international component of the rate, which decreased from 2015 to 2016, reflects an increase in the foreign rate differential due to an increase of taxable profits in lower tax jurisdictions.
- 50 -
MANAGEMENT’S DISCUSSION AND ANALYSIS
Liquidity and Capital Resources
(dollars in thousands) | December 29, 2017 | December 30, 2016 | |||||
Cash and cash equivalents | $ | 44,096 | $ | 52,116 | |||
Working capital | $ | 322,906 | $ | 332,087 | |||
Current ratio | 2.54 | 2.79 | |||||
Cash and cash equivalents decreased by $8.0 million from December 30, 2016 as excess cash flow from operations was used to pay down our debt. Working capital decreased $9.2 million from December 30, 2016 due to the Company’s initiative to reduce working capital in order to generate cash to pay down debt.
At December 29, 2017, $23.2 million of our cash and cash equivalents were held by foreign subsidiaries. As a result of the Tax Reform Act, we changed our permanent reinvestment assertion related to previously undistributed foreign earnings. Going forward, we intend to limit our distributions from foreign subsidiaries to previously taxed income. If distributions are made utilizing current period earnings, we will record foreign withholding taxes in the period of the distribution.
Summary of Cash Flow
The following is a summary of cash flow information for fiscal years 2017 and 2016 (in thousands):
2017 | 2016 | ||||
Cash provided by (used in): | |||||
Operating activities | 149,357 | 105,532 | |||
Investing activities | (47,936 | ) | (63,300 | ) | |
Financing activities | (111,669 | ) | (72,146 | ) | |
Effect of foreign currency exchange rates on cash and cash equivalents | 2,228 | (448 | ) | ||
Net change in cash and cash equivalents | (8,020 | ) | (30,362 | ) | |
Operating Activities - During 2017, we generated $149.4 million in cash from operations compared to $105.5 million in 2016. This increase is primarily due to a $34.4 million increase in cash net income (i.e. net income plus adjustments to reconcile net income (loss) to net cash provided by operating activities) and a $9.4 million increase in cash flow provided by working capital due to our strategic priority in 2017 to reduce our working capital levels.
Investing Activities - The $15.4 million decrease in net cash used in investing activities was primarily attributable to lower purchases of property, plant, and equipment. Our current expectation is that capital spending for 2018 will be in the range of $50 million to $55 million, of which approximately half is discretionary in nature.
Financing Activities - Net cash used in financing activities during 2017 was $111.7 million compared to $72.1 million in 2016. Financing activities during 2017 included net payments of $130.9 million related to paying down our debt obligations, partially offset by $19.3 million of proceeds from the exercise of stock options. Financing activities during 2016 included $76.3 million of cash divested with the Spin-off, which was partially funded by $57.0 million in borrowings incurred under our Revolving Credit Facility, and $6.8 million paid to purchase the remaining non-controlling interests in Nuvectra. Refer to Note 2 “Divestiture and Acquisition” of the Notes to Consolidated Financial Statements contained in Item 8 of this report for further description of the Spin-off.
Capital Structure - As of December 29, 2017, our capital structure consists of $1.64 billion of principal outstanding under our Senior Secured Credit Facilities and Senior Notes and 31.9 million shares of common stock outstanding. If necessary, we currently have access to $116.7 million under our Revolving Credit Facility. This amount may vary from period to period based upon our debt and EBITDA levels, which impacts the covenant calculations discussed below. If necessary, we are also authorized to issue up to 100 million shares of common stock and 100 million shares of preferred stock. As of December 29, 2017, our debt service obligations for 2018, consisting of principal and interest on our outstanding debt, are estimated to be approximately $123 million.
Based on current expectations, we believe that our projected cash flows provided by operations, available cash and cash equivalents and potential borrowings under our revolving credit facility are sufficient to meet our working capital, debt service and capital expenditure requirements for the next twelve months. If our future financing needs increase, we may need to arrange additional debt or equity financing. Accordingly, we evaluate and consider from time to time various financing alternatives to supplement our existing financial resources. However, we cannot be assured that we will be able to enter into any such arrangements on acceptable terms or at all. Our ultimate goal is to de-lever the Company to 3x to 4x Adjusted EBITDA.
- 51 -
MANAGEMENT’S DISCUSSION AND ANALYSIS
Credit Facilities - As of December 29, 2017, we had senior secured credit facilities (the “Senior Secured Credit Facilities”) that consist of (i) a $200 million revolving credit facility (the “Revolving Credit Facility”), which had $74 million drawn as of December 29, 2017, (ii) a $335 million term loan A facility (the “TLA Facility”), and (iii) an $873 million term loan B facility (the “TLB Facility”). Additionally, as of December 29, 2017, we had $360 million aggregate principal amount of 9.125% senior notes due on November 1, 2023 (the “Senior Notes”) outstanding. The Revolving Credit Facility will mature on October 27, 2020, the TLA Facility will mature on October 27, 2021 and the TLB Facility will mature on October 27, 2022. The Senior Secured Credit Facilities include a mandatory prepayment provision customary for credit facilities of its nature.
In March 2017 and again in November of 2017, we amended the Senior Secured Credit Facilities to lower the interest rate on the TLB Facility. The amendments reduced the applicable interest rate margins of our TLB Facility for both base rate and adjusted LIBOR borrowings by a cumulative 100 basis points. The amendments include a prepayment fee of 1.00% in the event of another repricing event (as defined in the Senior Secured Credit Facilities) on or before the six-month anniversary of the amendment. There was no change to maturities or covenants under the Senior Secured Credit Facilities as a result of these repricing amendments.
The Revolving Credit Facility and the TLA Facility contain covenants requiring (A) a maximum total net leverage ratio of 6.25:1.0, subject to step downs beginning in the first quarter of 2018 and (B) a minimum interest coverage ratio of adjusted EBITDA (as defined in the Senior Secured Credit Facilities) to interest expense of not less than 2.50:1.0, subject to step ups beginning in the first quarter of 2018. As of December 29, 2017, our total net leverage ratio, calculated in accordance with our credit agreement, was approximately 5.09 to 1.0. For the twelve month period ended December 29, 2017, our ratio of adjusted EBITDA to interest expense, calculated in accordance with our credit agreement, was approximately 3.31 to 1.0.
Failure to comply with these financial covenants would result in an event of default as defined under the Revolving Credit Facility and TLA Facility unless waived by the lenders. An event of default may result in the acceleration of our indebtedness. As a result, management believes that compliance with these covenants is material to us. As of December 29, 2017, we were in full compliance with the financial covenants described above. However, a significant increase in the LIBOR interest rate and/or a decline in our operating performance, and in particular our sales and/or adjusted EBITDA, could result in our inability to meet these financial covenants and lead to an event of default if a waiver or amendment could not be obtained from our lenders. As of December 29, 2017, our adjusted EBITDA would have to decline by more than $58.8 million, or approximately 19%, in order for us to not be in compliance with our financial covenants.
The Revolving Credit Facility is supported by a consortium of thirteen lenders with no lender controlling more than 27% of the facility. As of December 29, 2017, the banks supporting 88% of the Revolving Credit Facility each had an S&P credit rating of at least BBB+ or better, which is considered investment grade. The banks which support the remaining 12% of the Revolving Credit Facility are not currently being rated.
Refer to Note 8 “Debt” of the Notes to Consolidated Financial Statements contained in Item 8 of this report for further description of our outstanding debt.
Non-Guarantor Information – For the year ended December 29, 2017, our subsidiaries that are non-Guarantors under our Senior Secured Credit Facilities facilities represented approximately 36% and 69% of our revenue and EBITDA, respectively. In addition, as of December 29, 2017, the non-Guarantors under our Senior Secured Credit Facilities held approximately 32% of our total tangible assets and 5% of our total tangible liabilities. Tangible assets consist of total assets less intangible assets, intercompany receivables, and deferred taxes. Tangible liabilities consist of total liabilities less intercompany payables and deferred taxes.
Off-Balance Sheet Arrangements
We have no off-balance sheet arrangements within the meaning of Item 303(a)(4) of Regulation S-K.
- 52 -
MANAGEMENT’S DISCUSSION AND ANALYSIS
Contractual Obligations
Presented below is a summary of contractual obligations and other minimum commitments as of December 29, 2017. Refer to Note 13 “Commitments and Contingencies” of the Notes to Consolidated Financial Statements contained in Item 8 of this report for additional information regarding self-insurance liabilities, which are not reflected in the table below.
Payments due by period | |||||||||||||||||||
Total | Less than 1 year | 1-3 years | 3-5 years | More than 5 years | |||||||||||||||
Total debt obligations | $ | 1,642,443 | $ | 30,469 | $ | 149,000 | $ | 1,102,974 | $ | 360,000 | |||||||||
Interest on debt(a) | 444,006 | 92,322 | 178,775 | 148,271 | 24,638 | ||||||||||||||
Operating lease obligations(b) | 64,548 | 12,815 | 20,380 | 13,310 | 18,043 | ||||||||||||||
Foreign currency contracts(b) | 65,367 | 65,367 | — | — | — | ||||||||||||||
Defined benefit plan obligations(c) | 3,804 | 289 | 534 | 668 | 2,313 | ||||||||||||||
Other(d) | 81,076 | 76,539 | 4,526 | 11 | — | ||||||||||||||
Total | $ | 2,301,244 | $ | 277,801 | $ | 353,215 | $ | 1,265,234 | $ | 404,994 | |||||||||
(a) | Interest payments in the table above reflect the contractual interest payments on our outstanding debt based upon the balance outstanding and applicable interest rates at December 29, 2017, and exclude the impact of the debt discount amortization and impact of interest rate swap agreements. Refer to Note 8 “Debt” of the Notes to Consolidated Financial Statements contained in Item 8 of this report for additional information regarding long-term debt. |
(b) | Refer to Note 13 “Commitments and Contingencies” of the Notes to Consolidated Financial Statements contained in Item 8 of this report for additional information about our operating lease obligations and foreign currency contracts. |
(c) | Refer to Note 9 “Benefit Plans” of the Notes to Consolidated Financial Statements contained in Item 8 of this report for additional information about our defined benefit plan obligations. |
(d) | Amounts include inventory purchase commitments, which are legally binding and specify minimum purchase quantities. These commitments do not include open purchase orders. |
This table does not reflect $12.1 million of unrecognized tax benefits, as we are uncertain if or when such amounts may be settled. Refer to Note 12 “Income Taxes” of the Notes to Consolidated Financial Statements in Item 8 of this report for additional information about these unrecognized tax benefits.
Impact of Recently Issued Accounting Standards
In the normal course of business, we evaluate all new accounting pronouncements issued by the FASB, SEC, or other authoritative accounting bodies to determine the potential impact they may have on our Consolidated Financial Statements. Refer to Note 1 “Summary of Significant Accounting Policies” of the Notes to Consolidated Financial Statements contained in Item 8 of this report for additional information about these recently issued accounting standards and their potential impact on our financial condition or results of operations.
ITEM 7A. QUANTITATIVE AND QUALITATIVE DISCLOSURES ABOUT MARKET RISK
MARKET RISK
In the normal course of business, we are exposed to market risk primarily due to changes in foreign currency exchange rates and interest rates. Changes in these rates could result in fluctuations in our earnings and cash flows. We regularly assess these risks and have established policies and business practices to help protect against the adverse effects of these and other potential exposures. However, fluctuations in foreign currency exchange rates and interest rates could have a significant impact, positive or negative, on our financial results in the future.
- 53 -
Foreign Currency Exchange Rate Risk
We have foreign operations in Ireland, Germany, France, Switzerland, Mexico, Uruguay, and Malaysia which expose us to foreign currency exchange rate fluctuations due to transactions denominated in Euros, Swiss francs, Mexican pesos, Uruguayan pesos, and Malaysian ringgits. We continuously evaluate our foreign currency risk, and we use operational hedges, as well as forward currency exchange rate contracts, to manage the impact of currency exchange rate fluctuations on earnings and cash flows. We do not enter into currency exchange rate derivative instruments for speculative purposes. A hypothetical 10% change in the value of the U.S. dollar in relation to our most significant foreign currency exposures would have had an impact of approximately $14 million on our 2017 annual sales. This amount is not indicative of the hypothetical net earnings impact due to the partially offsetting impacts on cost of sales and operating expenses in those currencies. We estimate that foreign currency exchange rate fluctuations during 2017 decreased sales in comparison to 2016 by approximately $2 million.
We had currency derivative instruments outstanding in the notional amount of $65.4 million as of December 29, 2017 and $24.7 million as of December 30, 2016. As of December 29, 2017 and December 30, 2016, we recorded $0.9 million and $2.1 million, respectively, to recognize the fair value of these derivative instruments on our Consolidated Balance Sheets. The amounts recorded during 2017 related to our forward contracts were an increase in Sales of $1.3 million and an increase in Cost of Sales of $0.1 million. Refer to Note 13 “Commitments and Contingencies” to the Consolidated Financial Statements contained in Item 8 of this report for additional information regarding our outstanding forward contracts.
To the extent that our monetary assets and liabilities, including short-term and long-term intercompany loans, are recorded in a currency other than the functional currency of the subsidiary, these amounts are remeasured each period at the period-end exchange rate, with the resulting gain or loss being recorded in Other (Income) Loss, Net, in the Consolidated Statements of Operations and Comprehensive Income (Loss). Net foreign currency transaction gains and losses included in Other (Income) Loss, Net, amounted to a loss of $9.7 million for 2017 and a gain of $4.9 million for 2016 and primarily related to the remeasurement of intercompany loans and fluctuations of the U.S. dollar relative to the Euro. During 2017, we took steps to eliminate the majority of these intercompany balances. As such, we expect foreign currency exchange rate gains (losses) to be significantly less than the 2017 and 2016 amounts. A hypothetical 10% change in the value of the U.S. dollar in relation to our most significant foreign currency monetary assets and liabilities outstanding as of December 29, 2017 would have had an impact of approximately $1 million on our Other (Income) Loss, Net.
We translate all assets and liabilities of our foreign operations where the U.S. dollar is not the functional currency at the period-end exchange rate and translate sales and expenses at the average exchange rates in effect during the period. The net effect of these translation adjustments is recorded in the Consolidated Financial Statements as Comprehensive Income (Loss). The translation adjustment for 2017 was a $65.9 million gain and primarily related to the weakening of the U.S. dollar relative to the Euro. Translation adjustments are not adjusted for income taxes as they relate to permanent investments in our foreign subsidiaries. A hypothetical 10% change in the value of the U.S. dollar in relation to our most significant foreign currency net assets would have had an impact of approximately $46 million on our foreign net assets as of December 29, 2017.
Interest Rate Risk
We regularly monitor interest rate risk attributable to our outstanding debt obligations. From time to time, we enter into interest rate swap agreements in order to hedge against potential changes in cash flows on our outstanding variable rate debt.
During 2016, we entered into a three year $200 million interest rate swap to hedge against potential changes in cash flows on our outstanding variable rate debt, which is indexed to the one-month LIBOR rate. The variable rate received on the interest rate swap and the variable rate paid on the variable rate debt will have the same rate of interest, excluding the credit spread, and will reset and pay interest on the same day. The swap is being accounted for as a cash flow hedge. As of December 29, 2017, this swap had a positive fair value of $4.3 million. The amount recorded during 2017 related to interest rate swaps was a reduction of $0.5 million to Interest Expense.
As of December 29, 2017, we had $1.64 billion in principal amount of debt outstanding. Interest rates on our Revolving Credit Facility, TLA Facility and TLB Facility, reset, at our option, based upon the prime rate or LIBOR rate, thus subjecting us to interest rate risk. Our TLB Facility has a 1.00% LIBOR floor, thus is only variable when LIBOR interest rates are above 1.00%. Our Senior Notes have a fixed interest rate. Refer to Note 8 “Debt” of the Notes to Consolidated Financial Statements in Item 8 of this report for additional information about our outstanding debt. A hypothetical one percentage point (100 basis points) increase in the LIBOR rate on the $1.08 billion of unhedged variable rate debt outstanding at December 29, 2017 would increase our interest expense by approximately $11 million.
- 54 -
ITEM 8. FINANCIAL STATEMENTS AND SUPPLEMENTARY DATA
INTEGER HOLDINGS CORPORATION
Index to Consolidated Financial Statements
Page | |
Management’s Report on Internal Control Over Financial Reporting................................................................................... | |
Reports of Independent Registered Public Accounting Firm................................................................................................. | |
Consolidated Balance Sheets as of December 29, 2017 and December 30, 2016.................................................................. | |
Consolidated Statements of Operations and Comprehensive Income (Loss) for the years ended December 29, 2017, December 30, 2016 and January 1, 2016................................................................................................................................ | |
Consolidated Statements of Cash Flows for the years ended December 29, 2017, December 30, 2016 and January 1, 2016........................................................................................................................................................................................ | |
Consolidated Statements of Stockholders’ Equity for the years ended December 29, 2017, December 30, 2016 and January 1, 2016....................................................................................................................................................................... | |
Notes to Consolidated Financial Statements.......................................................................................................................... | |
- 55 -
MANAGEMENT’S REPORT ON INTERNAL CONTROL OVER FINANCIAL REPORTING
The Company’s certifying officers are responsible for establishing and maintaining adequate internal control over financial reporting. The Company’s internal control over financial reporting is designed and maintained under the supervision of its certifying officers to provide reasonable assurance regarding the reliability of financial reporting and the preparation of the Company’s consolidated financial statements for external reporting purposes in accordance with accounting principles generally accepted in the United States of America.
As of December 29, 2017, management conducted an assessment of the effectiveness of the Company’s internal control over financial reporting based on the framework established in Internal Control – Integrated Framework (2013) issued by the Committee of Sponsoring Organizations of the Treadway Commission. Based on this assessment, management has determined that the Company’s internal control over financial reporting as of December 29, 2017 is effective.
The effectiveness of internal control over financial reporting as of December 29, 2017 has been audited by Deloitte & Touche LLP, the Company’s independent registered public accounting firm.
Dated: February 22, 2018
/s/ Joseph W. Dziedzic | /s/ Gary J. Haire | |
Joseph W. Dziedzic | Gary J. Haire | |
President & Chief Executive Officer | Executive Vice President & Chief Financial Officer | |
- 56 -
REPORT OF INDEPENDENT REGISTERED PUBLIC ACCOUNTING FIRM
To the stockholders and Board of Directors of Integer Holdings Corporation
Opinion on Internal Control over Financial Reporting
We have audited the internal control over financial reporting of Integer Holdings Corporation and subsidiaries (the “Company”) as of December 29, 2017, based on criteria established in Internal Control - Integrated Framework (2013) issued by the Committee of Sponsoring Organizations of the Treadway Commission (COSO). In our opinion, the Company maintained, in all material respects, effective internal control over financial reporting as of December 29, 2017, based on criteria established in Internal Control - Integrated Framework (2013) issued by COSO.
We have also audited, in accordance with the standards of the Public Company Accounting Oversight Board (United States) (PCAOB), the consolidated financial statements and consolidated financial statement schedule as of and for the year ended December 29, 2017 of the Company and our report dated February 22, 2018 expressed an unqualified opinion on those consolidated financial statements and consolidated financial statement schedule.
Basis for Opinion
The Company’s management is responsible for maintaining effective internal control over financial reporting and for its assessment of the effectiveness of internal control over financial reporting, included in the accompanying Management’s Report on Internal Control Over Financial Reporting. Our responsibility is to express an opinion on the Company’s internal control over financial reporting based on our audit. We are a public accounting firm registered with the PCAOB and are required to be independent with respect to the Company in accordance with the U.S. federal securities laws and the applicable rules and regulations of the Securities and Exchange Commission and the PCAOB.
We conducted our audit in accordance with the standards of the PCAOB. Those standards require that we plan and perform the audit to obtain reasonable assurance about whether effective internal control over financial reporting was maintained in all material respects. Our audit included obtaining an understanding of internal control over financial reporting, assessing the risk that a material weakness exists, testing and evaluating the design and operating effectiveness of internal control based on the assessed risk, and performing such other procedures as we considered necessary in the circumstances. We believe that our audit provides a reasonable basis for our opinion.
Definition and Limitations of Internal Control over Financial Reporting
A company’s internal control over financial reporting is a process designed to provide reasonable assurance regarding the reliability of financial reporting and the preparation of financial statements for external purposes in accordance with generally accepted accounting principles. A company’s internal control over financial reporting includes those policies and procedures that (1) pertain to the maintenance of records that, in reasonable detail, accurately and fairly reflect the transactions and dispositions of the assets of the company; (2) provide reasonable assurance that transactions are recorded as necessary to permit preparation of financial statements in accordance with generally accepted accounting principles, and that receipts and expenditures of the company are being made only in accordance with authorizations of management and directors of the company; and (3) provide reasonable assurance regarding prevention or timely detection of unauthorized acquisition, use, or disposition of the company’s assets that could have a material effect on the financial statements.
Because of its inherent limitations, internal control over financial reporting may not prevent or detect misstatements. Also, projections of any evaluation of effectiveness to future periods are subject to the risk that controls may become inadequate because of changes in conditions, or that the degree of compliance with the policies or procedures may deteriorate.
/s/ Deloitte & Touche LLP
Williamsville, New York
February 22, 2018
- 57 -
REPORT OF INDEPENDENT REGISTERED PUBLIC ACCOUNTING FIRM
To the stockholders and the Board of Directors of Integer Holdings Corporation
Opinion on the Financial Statements
We have audited the accompanying consolidated balance sheets of Integer Holdings Corporation and subsidiaries (the “Company”) as of December 29, 2017 and December 30, 2016, the related consolidated statements of operations and comprehensive income (loss), cash flows, and stockholders’ equity for each of the three years in the period ended December 29, 2017, and the related notes and the schedule listed in the Index at Item 15 (collectively referred to as the “financial statements”). In our opinion, the financial statements present fairly, in all material respects, the financial position of the Company as of December 29, 2017 and December 30, 2016, and the results of its operations and its cash flows for each of the three years in the period ended December 29, 2017, in conformity with accounting principles generally accepted in the United States of America.
We have also audited, in accordance with the standards of the Public Company Accounting Oversight Board (United States) (PCAOB), the Company’s internal control over financial reporting as of December 29, 2017, based on criteria established in Internal Control - Integrated Framework (2013) issued by the Committee of Sponsoring Organizations of the Treadway Commission and our report dated February 22, 2018 expressed an unqualified opinion on the Company’s internal control over financial reporting.
Basis for Opinion
These financial statements are the responsibility of the Company’s management. Our responsibility is to express an opinion on the Company’s financial statements based on our audits. We are a public accounting firm registered with the PCAOB and are required to be independent with respect to the Company in accordance with the U.S. federal securities laws and the applicable rules and regulations of the Securities and Exchange Commission and the PCAOB.
We conducted our audits in accordance with the standards of the PCAOB. Those standards require that we plan and perform the audit to obtain reasonable assurance about whether the financial statements are free of material misstatement, whether due to error or fraud. Our audits included performing procedures to assess the risks of material misstatement of the financial statements, whether due to error or fraud, and performing procedures that respond to those risks. Such procedures included examining, on a test basis, evidence regarding the amounts and disclosures in the financial statements. Our audits also included evaluating the accounting principles used and significant estimates made by management, as well as evaluating the overall presentation of the financial statements. We believe that our audits provide a reasonable basis for our opinion.
/s/ Deloitte & Touche LLP
Williamsville, New York
February 22, 2018
We have served as the Company’s auditor since 1985.
- 58 -
INTEGER HOLDINGS CORPORATION
CONSOLIDATED BALANCE SHEETS
(in thousands except share and per share data) | December 29, 2017 | December 30, 2016 | |||||
ASSETS | |||||||
Current assets: | |||||||
Cash and cash equivalents | $ | 44,096 | $ | 52,116 | |||
Accounts receivable, net of allowance for doubtful accounts of $0.8 million and $0.7 million, respectively | 242,456 | 204,626 | |||||
Inventories | 227,534 | 225,151 | |||||
Refundable income taxes | 37 | 13,388 | |||||
Prepaid expenses and other current assets | 17,786 | 22,026 | |||||
Total current assets | 531,909 | 517,307 | |||||
Property, plant and equipment, net | 370,375 | 372,042 | |||||
Goodwill | 990,238 | 967,326 | |||||
Other intangible assets, net | 920,393 | 940,060 | |||||
Deferred income taxes | 4,152 | 3,970 | |||||
Other assets | 31,278 | 31,838 | |||||
Total assets | $ | 2,848,345 | $ | 2,832,543 | |||
LIABILITIES AND STOCKHOLDERS’ EQUITY | |||||||
Current liabilities: | |||||||
Current portion of long-term debt | $ | 30,469 | $ | 31,344 | |||
Accounts payable | 83,517 | 77,896 | |||||
Income taxes payable | 13,477 | 3,699 | |||||
Accrued expenses | 81,540 | 72,281 | |||||
Total current liabilities | 209,003 | 185,220 | |||||
Long-term debt | 1,578,696 | 1,698,819 | |||||
Deferred income taxes | 145,364 | 208,579 | |||||
Other long-term liabilities | 21,901 | 14,686 | |||||
Total liabilities | 1,954,964 | 2,107,304 | |||||
Commitments and contingencies (Note 13) | |||||||
Stockholders’ equity: | |||||||
Preferred stock, $0.001 par value, authorized 100,000,000 shares; no shares issued or outstanding | — | — | |||||
Common stock, $0.001 par value; 100,000,000 shares authorized; 31,977,953 and 31,059,038 shares issued, respectively; 31,871,427 and 30,925,496 shares outstanding, respectively | 32 | 31 | |||||
Additional paid-in capital | 669,756 | 637,955 | |||||
Treasury stock, at cost, 106,526 and 133,542 shares, respectively | (4,654 | ) | (5,834 | ) | |||
Retained earnings | 176,068 | 109,087 | |||||
Accumulated other comprehensive income (loss) | 52,179 | (16,000 | ) | ||||
Total stockholders’ equity | 893,381 | 725,239 | |||||
Total liabilities and stockholders’ equity | $ | 2,848,345 | $ | 2,832,543 | |||
The accompanying notes are an integral part of these consolidated financial statements.
- 59 -
INTEGER HOLDINGS CORPORATION
CONSOLIDATED STATEMENTS OF OPERATIONS
AND COMPREHENSIVE INCOME (LOSS)
Fiscal Year Ended | |||||||||||
(in thousands except per share data) | December 29, 2017 | December 30, 2016 | January 1, 2016 | ||||||||
Sales | $ | 1,461,921 | $ | 1,386,778 | $ | 800,414 | |||||
Cost of sales | 1,068,370 | 1,008,479 | 565,279 | ||||||||
Gross profit | 393,551 | 378,299 | 235,135 | ||||||||
Operating expenses: | |||||||||||
Selling, general and administrative expenses | 161,573 | 153,291 | 102,530 | ||||||||
Research, development and engineering costs | 55,247 | 55,001 | 52,995 | ||||||||
Other operating expenses | 37,292 | 61,737 | 66,464 | ||||||||
Total operating expenses | 254,112 | 270,029 | 221,989 | ||||||||
Operating income | 139,439 | 108,270 | 13,146 | ||||||||
Interest expense | 106,460 | 111,270 | 33,513 | ||||||||
(Gain) loss on cost and equity method investments, net | 1,565 | 833 | (3,350 | ) | |||||||
Other (income) loss, net | 9,587 | (5,018 | ) | (1,317 | ) | ||||||
Income (loss) before benefit for income taxes | 21,827 | 1,185 | (15,700 | ) | |||||||
Benefit for income taxes | (44,852 | ) | (4,776 | ) | (8,106 | ) | |||||
Net income (loss) | $ | 66,679 | $ | 5,961 | $ | (7,594 | ) | ||||
Earnings (loss) per share: | |||||||||||
Basic | $ | 2.12 | $ | 0.19 | $ | (0.29 | ) | ||||
Diluted | $ | 2.09 | $ | 0.19 | $ | (0.29 | ) | ||||
Weighted average shares outstanding: | |||||||||||
Basic | 31,402 | 30,778 | 26,363 | ||||||||
Diluted | 31,888 | 30,973 | 26,363 | ||||||||
Comprehensive Income (Loss) | |||||||||||
Net income (loss) | $ | 66,679 | $ | 5,961 | $ | (7,594 | ) | ||||
Other comprehensive income (loss): | |||||||||||
Foreign currency translation gain (loss) | 65,860 | (19,269 | ) | (7,841 | ) | ||||||
Net change in cash flow hedges, net of tax | 2,243 | 2,478 | 108 | ||||||||
Defined benefit plan liability adjustment, net of tax | 76 | (579 | ) | (20 | ) | ||||||
Other comprehensive income (loss), net | 68,179 | (17,370 | ) | (7,753 | ) | ||||||
Comprehensive income (loss) | $ | 134,858 | $ | (11,409 | ) | $ | (15,347 | ) | |||
The accompanying notes are an integral part of these consolidated financial statements.
- 60 -
INTEGER HOLDINGS CORPORATION
CONSOLIDATED STATEMENTS OF CASH FLOWS
Fiscal Year Ended | |||||||||||
(in thousands) | December 29, 2017 | December 30, 2016 | January 1, 2016 | ||||||||
Cash flows from operating activities: | |||||||||||
Net income (loss) | $ | 66,679 | $ | 5,961 | $ | (7,594 | ) | ||||
Adjustments to reconcile net income (loss) to net cash provided by operating activities: | |||||||||||
Depreciation and amortization | 102,796 | 90,524 | 44,632 | ||||||||
Debt related charges included in interest expense | 10,911 | 7,278 | 11,320 | ||||||||
Inventory step-up amortization | — | — | 22,986 | ||||||||
Stock-based compensation | 14,680 | 8,408 | 9,376 | ||||||||
Non-cash loss on cost and equity method investments | 2,965 | 1,495 | 275 | ||||||||
Other non-cash losses | 7,110 | 5,216 | 1,093 | ||||||||
Deferred income taxes | (59,212 | ) | (7,350 | ) | (10,298 | ) | |||||
Changes in operating assets and liabilities, net of acquisitions: | |||||||||||
Accounts receivable | (34,597 | ) | (2,169 | ) | 3,684 | ||||||
Inventories | (986 | ) | 22,170 | (25,752 | ) | ||||||
Prepaid expenses and other assets | 4,854 | (3,846 | ) | (1,861 | ) | ||||||
Accounts payable | 4,887 | (1,127 | ) | 3,129 | |||||||
Accrued expenses | 14,977 | (13,935 | ) | (28,605 | ) | ||||||
Income taxes payable | 14,293 | (7,093 | ) | (9,906 | ) | ||||||
Net cash provided by operating activities | 149,357 | 105,532 | 12,479 | ||||||||
Cash flows from investing activities: | |||||||||||
Acquisition of property, plant and equipment | (47,301 | ) | (58,632 | ) | (44,616 | ) | |||||
Proceeds from sale of property, plant and equipment | 472 | 347 | 746 | ||||||||
Purchase of cost and equity method investments | (1,316 | ) | (3,015 | ) | (6,300 | ) | |||||
Acquisitions, net of cash acquired | — | — | (423,389 | ) | |||||||
Other investing activities | 209 | (2,000 | ) | — | |||||||
Net cash used in investing activities | (47,936 | ) | (63,300 | ) | (473,559 | ) | |||||
Cash flows from financing activities: | |||||||||||
Principal payments of long-term debt | (178,558 | ) | (46,000 | ) | (1,232,175 | ) | |||||
Proceeds from issuance of long-term debt | 50,000 | 57,000 | 1,749,750 | ||||||||
Proceeds from the exercise of stock options | 19,324 | 2,821 | 6,583 | ||||||||
Payment of debt issuance costs | (2,360 | ) | (1,177 | ) | (45,933 | ) | |||||
Distribution of cash and cash equivalents to Nuvectra Corporation | — | (76,256 | ) | — | |||||||
Purchase of non-controlling interests | — | (6,818 | ) | (9,875 | ) | ||||||
Other financing activities | (75 | ) | (1,716 | ) | (440 | ) | |||||
Net cash (used in) provided by financing activities | (111,669 | ) | (72,146 | ) | 467,910 | ||||||
Effect of foreign currency exchange rates on cash and cash equivalents | 2,228 | (448 | ) | (1,176 | ) | ||||||
Net (decrease) increase in cash and cash equivalents | (8,020 | ) | (30,362 | ) | 5,654 | ||||||
Cash and cash equivalents, beginning of year | 52,116 | 82,478 | 76,824 | ||||||||
Cash and cash equivalents, end of year | $ | 44,096 | $ | 52,116 | $ | 82,478 | |||||
The accompanying notes are an integral part of these consolidated financial statements.
- 61 -
INTEGER HOLDINGS CORPORATION
CONSOLIDATED STATEMENTS OF STOCKHOLDERS’ EQUITY
Common Stock | Additional Paid-In Capital | Treasury Stock | Retained Earnings | Accumulated Other Comprehensive Income (Loss) | Total Stockholders’ Equity | ||||||||||||||||||||||||
(in thousands) | Shares | Amount | Shares | Amount | |||||||||||||||||||||||||
January 2, 2015 | 25,099 | $ | 25 | $ | 366,073 | (28 | ) | $ | (1,307 | ) | $ | 239,448 | $ | 9,123 | $ | 613,362 | |||||||||||||
Comprehensive loss: | |||||||||||||||||||||||||||||
Net loss | — | — | — | — | — | (7,594 | ) | — | (7,594 | ) | |||||||||||||||||||
Other comprehensive loss, net | — | — | — | — | — | — | (7,753 | ) | (7,753 | ) | |||||||||||||||||||
Share-based compensation plans: | — | ||||||||||||||||||||||||||||
Stock-based compensation | — | — | 9,364 | — | — | — | — | 9,364 | |||||||||||||||||||||
Net shares issued (acquired) | 585 | 1 | 5,764 | (107 | ) | (5,261 | ) | — | — | 504 | |||||||||||||||||||
Excess tax benefit on share-based compensation | — | — | 5,639 | — | — | — | — | 5,639 | |||||||||||||||||||||
Shares contributed to 401(k) Plan | — | — | 452 | 72 | 3,468 | — | — | 3,920 | |||||||||||||||||||||
Shares issued in connection with acquisition | 4,980 | 5 | 245,363 | — | — | — | — | 245,368 | |||||||||||||||||||||
Roll-over options issued in connection with acquisition | — | — | 4,508 | — | — | — | — | 4,508 | |||||||||||||||||||||
Purchase of non-controlling interests in subsidiaries | — | — | (16,693 | ) | — | — | — | — | (16,693 | ) | |||||||||||||||||||
January 1, 2016 | 30,664 | 31 | 620,470 | (63 | ) | (3,100 | ) | 231,854 | 1,370 | 850,625 | |||||||||||||||||||
Comprehensive loss: | |||||||||||||||||||||||||||||
Net income | — | — | — | — | — | 5,961 | — | 5,961 | |||||||||||||||||||||
Other comprehensive loss, net | — | — | — | — | — | — | (17,370 | ) | (17,370 | ) | |||||||||||||||||||
Share-based compensation plans: | |||||||||||||||||||||||||||||
Stock-based compensation | — | — | 8,408 | — | — | — | — | 8,408 | |||||||||||||||||||||
Net shares issued (acquired) | 395 | — | 1,570 | (71 | ) | (2,734 | ) | — | — | (1,164 | ) | ||||||||||||||||||
Excess tax benefit on share-based compensation | — | — | 2,266 | — | — | — | — | 2,266 | |||||||||||||||||||||
Spin-off of Nuvectra Corporation | — | — | 5,241 | — | — | (128,728 | ) | — | (123,487 | ) | |||||||||||||||||||
December 30, 2016 | 31,059 | 31 | 637,955 | (134 | ) | (5,834 | ) | 109,087 | (16,000 | ) | 725,239 | ||||||||||||||||||
Cumulative effect adjustment of the adoption of ASU 2016-09 (Note 1) | — | — | (812 | ) | — | — | 302 | — | (510 | ) | |||||||||||||||||||
Comprehensive income: | |||||||||||||||||||||||||||||
Net income | — | — | — | — | — | 66,679 | — | 66,679 | |||||||||||||||||||||
Other comprehensive income, net | — | — | — | — | — | — | 68,179 | 68,179 | |||||||||||||||||||||
Share-based compensation plans: | |||||||||||||||||||||||||||||
Stock-based compensation | — | — | 14,680 | — | — | — | — | 14,680 | |||||||||||||||||||||
Net shares issued | 919 | 1 | 17,933 | 27 | 1,180 | — | — | 19,114 | |||||||||||||||||||||
December 29, 2017 | 31,978 | $ | 32 | $ | 669,756 | (107 | ) | $ | (4,654 | ) | $ | 176,068 | $ | 52,179 | $ | 893,381 | |||||||||||||
The accompanying notes are an integral part of these consolidated financial statements.
- 62 -
INTEGER HOLDINGS CORPORATION
NOTES TO CONSOLIDATED FINANCIAL STATEMENTS
(1.) SUMMARY OF SIGNIFICANT ACCOUNTING POLICIES
Integer Holdings Corporation (together with its consolidated subsidiaries, “Integer” or the “Company”) is a publicly traded corporation listed on the New York Stock Exchange under the symbol “ITGR.” Integer is one of the largest medical device outsource manufacturers in the world serving the cardiac, neuromodulation, orthopedics, vascular, advanced surgical and portable medical markets. The Company provides innovative, high-quality medical technologies that enhance the lives of patients worldwide. In addition, it develops batteries for high-end niche applications in the energy, military, and environmental markets. The Company’s customers include large multi-national original equipment manufacturers (“OEMs”) and their affiliated subsidiaries.
On October 27, 2015, the Company acquired all of the outstanding common stock of Lake Region Medical Holdings, Inc. (“LRM”). On March 14, 2016, the Company completed the spin-off of a portion of its former QiG segment through a tax-free distribution of all of the shares of its former QiG Group, LLC subsidiary to the stockholders of Integer on a pro rata basis (the “Spin-off”). Refer to Note 2 “Divestiture and Acquisition” for further details of these transactions.
Basis of Presentation and Principles of Consolidation
The consolidated financial statements have been prepared in conformity with accounting principles generally accepted in the United States of America (“GAAP”) and include the accounts of Integer Holdings Corporation and its wholly owned subsidiaries. All intercompany balances and transactions have been eliminated in consolidation.
The Company’s results for periods prior to the Spin-off on March 14, 2016 include the financial and operating results of QiG Group, LLC. The Company’s results include the financial and operating results of LRM since the date of acquisition on October 27, 2015. Results for periods prior to October 27, 2015 do not include the financial and operating results of LRM.
The Company organizes its business into two reportable segments: (1) Medical and (2) Non-Medical. Refer to Note 17 “Segment and Geographic Information,” for additional information on the Company’s reportable segments.
Fiscal Year
The Company utilizes a fifty-two or fifty-three week fiscal year ending on the Friday nearest December 31. Fiscal years 2017, 2016 and 2015 consisted of fifty-two weeks and ended on December 29, 2017, December 30, 2016 and January 1, 2016, respectively.
Use of Estimates
The preparation of financial statements in conformity with GAAP requires management to make estimates and assumptions that affect the reported amounts of assets and liabilities and disclosure of contingent assets and liabilities at the date of the financial statements and reported amounts of sales and expenses during the reporting periods. Actual results could differ materially from those estimates.
Reclassifications
Certain prior period amounts have been reclassified to conform to the current segment structure. Refer to Note 17 “Segment and Geographic Information,” for a description of the changes made to reflect the current year product line sales reporting presentation.
Cash and Cash Equivalents
Cash and cash equivalents consist of cash and highly liquid, short-term investments with maturities at the time of purchase of three months or less.
Concentration of Credit Risk
Financial instruments that potentially subject the Company to concentration of credit risk consist principally of accounts receivable. A significant portion of the Company’s sales and accounts receivable are to four customers, all in the medical device industry, and, as such, the Company is directly affected by the condition of those customers and that industry. However, the credit risk associated with trade receivables is partially mitigated due to the stability of those customers. The Company performs on-going credit evaluations of its customers. Note 17 “Segment and Geographic Information” contains information on sales and accounts receivable for these customers. The Company maintains cash deposits with major banks, which from time to time may exceed insured limits. The Company performs on-going credit evaluations of its banks.
- 63 -
INTEGER HOLDINGS CORPORATION
NOTES TO CONSOLIDATED FINANCIAL STATEMENTS
(1.) SUMMARY OF SIGNIFICANT ACCOUNTING POLICIES (Continued)
Trade Accounts Receivable and Allowance for Doubtful Accounts
The Company provides credit, in the normal course of business, to its customers in the form of trade receivables. Credit is extended based on evaluation of a customer’s financial condition and collateral is not required. The Company maintains an allowance for those customer receivables that it does not expect to collect. The Company accrues its estimated losses from uncollectable accounts receivable to the allowance based upon recent historical experience, the length of time the receivable has been outstanding and other specific information as it becomes available. Provisions to the allowance for doubtful accounts are charged to current operating expenses. Actual losses are charged against this allowance when incurred.
Inventories
Inventories are stated at the lower of cost, determined using the first-in first-out method, or net realizable value. Net realizable value is the estimated selling prices in the ordinary course of business, less reasonably predictable costs of completion, disposal, and transportation. Write-downs for excess, obsolete or expired inventory are based primarily on how long the inventory has been held as well as estimates of forecasted net sales of that product. A significant change in the timing or level of demand for products may result in recording additional write-downs for excess, obsolete or expired inventory in the future. Note 4 “Inventories” contains additional information on the Company’s inventory.
Property, Plant and Equipment (“PP&E”)
PP&E is carried at cost less accumulated depreciation. Depreciation is computed by the straight-line method over the estimated useful lives of the assets, as follows: buildings and building improvements 12-30 years; machinery and equipment 3-10 years; office equipment 3-10 years; and leasehold improvements over the remaining lives of the improvements or the lease term, if less. The cost of repairs and maintenance are expensed as incurred; renewals and betterments are capitalized. Upon retirement or sale of an asset, its cost and related accumulated depreciation or amortization is removed from the accounts and any gain or loss is recorded in operating income or expense. The Company also reviews its PP&E for impairment when impairment indicators exist. When impairment indicators exist, the Company determines if the carrying value of its fixed asset(s) exceeds the related undiscounted future cash flows. In cases where the carrying value of the Company's long-lived assets or asset groups (excluding goodwill and indefinite-lived intangible assets) exceeds the related undiscounted cash flows, the carrying value is written down to fair value. Fair value is generally determined using a discounted cash flow analysis. Note 5 “Property, Plant and Equipment, Net” contains additional information on the Company’s PP&E.
Fair Value Measurements
Fair value is defined as the price that would be received to sell an asset or paid to transfer a liability (i.e. the “exit price”) in an orderly transaction between market participants at the measurement date. Accounting Standards Codification (“ASC”) 820, Fair Value Measurements, establishes a hierarchy for inputs used in measuring fair value that maximizes the use of observable inputs and minimizes the use of unobservable inputs by requiring that the most observable inputs be used when available. Observable inputs are inputs that market participants would use in pricing the asset or liability developed based on market data obtained from sources independent of the Company. Unobservable inputs are inputs that reflect the Company’s assumptions about the assumptions market participants would use in pricing the asset or liability developed based on the best information available in the circumstances. The hierarchy is broken down into three levels based on the reliability of inputs as follows:
Level 1 – Valuation is based on quoted prices in active markets for identical assets or liabilities that the Company has the ability to access. Level 1 valuations do not entail a significant degree of judgment.
Level 2 – Valuation is determined from quoted prices for similar assets or liabilities in active markets, quoted prices for identical instruments in markets that are not active or by model-based techniques in which all significant inputs are observable in the market.
Level 3 – Valuation is based on unobservable inputs that are significant to the overall fair value measurement. The degree of judgment in determining fair value is greatest for Level 3 valuations.
Fair value is a market-based measure considered from the perspective of a market participant rather than an entity-specific measure. Therefore, even when market assumptions are not readily available, assumptions are required to reflect those that market participants would use in pricing the asset or liability at the measurement date. Note 16 “Fair Value Measurements” contains additional information on assets and liabilities recorded at fair value in the consolidated financial statements.
- 64 -
INTEGER HOLDINGS CORPORATION
NOTES TO CONSOLIDATED FINANCIAL STATEMENTS
(1.) SUMMARY OF SIGNIFICANT ACCOUNTING POLICIES (Continued)
Acquisitions
Results of operations of acquired companies are included in the Company’s results of operations as of the respective acquisition dates. The purchase price of each acquisition is allocated to the net assets acquired based on estimates of their fair values at the date of the acquisition. Any purchase price in excess of these net assets is recorded as goodwill. All direct acquisition-related costs are expensed as incurred. The allocation of purchase price in certain cases may be subject to revision based on the final determination of fair values during the measurement period, which may be up to one year from the acquisition date.
Goodwill
Goodwill represents the excess of cost over the fair value of identifiable net assets of a business acquired and is assigned to one or more reporting units. The Company tests each reporting unit’s goodwill for impairment at least annually as of the last day of the fiscal year and between annual tests if an event occurs or circumstances change that would more-likely-than-not reduce the fair value of a reporting unit below its carrying amount. In conducting its annual impairment testing, the Company may first perform a qualitative assessment of whether it is more likely than not that a reporting unit’s fair value is less than its carrying amount. If not, no further goodwill impairment testing is required. If it is more likely than not that a reporting unit’s fair value is less than its carrying amount, or if the Company elects not to perform a qualitative assessment of a reporting unit, the Company then compares the fair value of the reporting unit to the related net book value. If the net book value of a reporting unit exceeds its fair value, an impairment loss is measured and recognized. The term more likely than not refers to a level of likelihood that is more than 50 percent.
The Company performed a qualitative assessment of its reporting units as of December 29, 2017. As part of this analysis, the Company evaluated factors including, but not limited to, macro-economic conditions, market and industry conditions, cost factors, competitive environment, share price fluctuations, results of the last impairment test, and the operational stability and the overall financial performance of the reporting units. The assessment indicated that it was more likely than not that the fair value of each of the reporting units exceeded its respective carrying value. The Company does not believe that any of its reporting units are at risk for impairment.
Other Intangible Assets
Other intangible assets consist of purchased technology and patents, customer lists and trademarks. Definite-lived intangible assets are amortized on an accelerated or straight-line basis, which approximates the projected cash flows used to fair value those definite-lived intangible assets at the time of acquisition, as follows: purchased technology and patents 5-15 years; customer lists 7-20 years and other intangible assets 1-10 years. Certain trademark assets are considered indefinite-lived intangible assets and are not amortized. The Company expenses the costs incurred to renew or extend the term of intangible assets.
The Company reviews its definite-lived intangible assets for impairment when impairment indicators exist. When impairment indicators exist, the Company determines if the carrying value of its definite-lived intangible assets exceeds the related undiscounted future cash flows. In cases where the carrying value exceeds the undiscounted future cash flows, the carrying value is written down to fair value. Fair value is generally determined using a discounted cash flow analysis.
The Company assesses its indefinite-lived intangible assets for impairment periodically to determine if any adverse conditions exist that would indicate impairment or when impairment indicators exist. The Company assesses its indefinite-lived intangible assets for impairment at least annually by comparing the fair value of the indefinite-lived intangible asset to its carrying value. The fair value is determined using the income approach.
Refer to Note 6 “Goodwill and Other Intangible Assets, Net” for further details of the Company’s goodwill and other intangible assets.
Cost and Equity Method Investments
Certain of the Company’s investments in equity and other securities are long-term, strategic investments in companies that are in varied stages of development. These investments are included in Other Assets on the Consolidated Balance Sheets. The Company accounts for investments in these entities under the cost or equity method depending on the type of ownership interest, as well as the Company’s ability to exercise influence over these entities. Investments accounted for under the cost method are initially recorded at the amount of the Company’s investment and carried at that cost until a security is deemed impaired or is sold. Equity securities accounted for under the equity method are initially recorded at the amount of the Company’s investment and are adjusted each period for the Company’s share of the investee’s income or loss and dividends paid. The share of net income or losses of equity investments is included (Gain) Loss on Cost and Equity Method Investments, Net, in the Consolidated Statements of Operations and Comprehensive Income (Loss).
- 65 -
INTEGER HOLDINGS CORPORATION
NOTES TO CONSOLIDATED FINANCIAL STATEMENTS
(1.) SUMMARY OF SIGNIFICANT ACCOUNTING POLICIES (Continued)
Equity securities accounted for under both the cost and equity methods are reviewed quarterly for changes in circumstance or the occurrence of events that suggest the Company’s investment may not be recoverable. Examples of such impairment indicators include, but are not limited to: a recent sale or offering of similar shares of the investment at a price below the Company’s cost basis; a significant deterioration in earnings performance; a significant change in the regulatory, economic or technological environment of the investee; or a significant doubt about an investee’s ability to continue as a going concern. If an impairment indicator is identified, management will estimate the fair value of the investment and compare it to its carrying value. The estimation of fair value considers all available financial information related to the investee, including, but not limited to, valuations based on recent third-party equity investments in the investee. Impairment is deemed to be other-than-temporary unless the Company has the ability and intent to hold the investment for a period sufficient for a market recovery up to the carrying value of the investment. Further, evidence must indicate that the carrying value of the investment is recoverable within a reasonable period. For other-than-temporary impairments, an impairment loss is recognized equal to the difference between the investment’s carrying value and its fair value and is recognized in (Gain) Loss on Cost and Equity Method Investments, Net, in the Consolidated Statements of Operations and Comprehensive Income (Loss) in the period the determination is made.
The Company has determined that these investments are not considered variable interest entities. The Company’s exposure related to these entities is limited to its recorded investment. These investments are in start-up research and development companies whose fair value is highly subjective in nature and subject to future fluctuations, which could be significant. Refer to Note 16 “Fair Value Measurements” for further discussion of the Company’s Cost and Equity Method Investments.
Debt Issuance Costs and Discounts
Debt issuance costs and discounts associated with the issuance of debt by the Company are deferred and amortized over the lives of the related debt. Debt issuance costs incurred in connection with the Company’s issuance of its revolving credit facility are classified within Other Assets and amortized to Interest Expense on a straight-line basis over the contractual term of the credit facility. Debt issuance costs and discounts related to the Company’s term-debt are recorded as a reduction of the carrying value of the related debt and are amortized to Interest Expense using the effective interest method over the period from the date of issuance to the put option date (if applicable) or the maturity date, whichever is earlier. The amortization of debt issuance costs and discounts are included in Debt Related Charges Included in Interest Expense in the Consolidated Statements of Cash Flows. Upon prepayment of the related debt, the Company accelerates the recognition of an appropriate amount of the costs as refinancing or extinguishment of debt. Note 8 “Debt” contains additional information on the Company’s debt issuance costs and discounts.
Income Taxes
The consolidated financial statements of the Company have been prepared using the asset and liability approach in accounting for income taxes, which requires the recognition of deferred income taxes for the expected future tax consequences of net operating losses, credits, and temporary differences between the financial statement carrying amounts and the tax bases of assets and liabilities. A valuation allowance is provided on deferred tax assets if it is determined, within each taxing jurisdiction, that it is more likely than not that the asset will not be realized.
The Company accounts for uncertain tax positions using a more likely than not recognition threshold. The evaluation of uncertain tax positions is based on factors including, but not limited to, changes in tax law, the measurement of tax positions taken or expected to be taken in tax returns, the effective settlement of matters subject to audit, new audit activity and changes in facts or circumstances related to a tax position. These tax positions are evaluated on a quarterly basis. The Company recognizes interest expense related to uncertain tax positions as Provision (Benefit) for Income Taxes. Penalties, if incurred, are recognized as a component of Selling, General and Administrative Expenses (“SG&A”).
The Company and its subsidiaries file a consolidated U.S. federal income tax return. State tax returns are filed on a combined or separate basis depending on the applicable laws in the jurisdictions where the tax returns are filed. The Company also files foreign tax returns on a separate company basis in the countries in which it operates.
- 66 -
INTEGER HOLDINGS CORPORATION
NOTES TO CONSOLIDATED FINANCIAL STATEMENTS
(1.) SUMMARY OF SIGNIFICANT ACCOUNTING POLICIES (Continued)
Derivative Financial Instruments
The Company recognizes all derivative financial instruments in its consolidated financial statements at fair value. Changes in the fair value of derivative instruments are recorded in earnings unless hedge accounting criteria are met. The Company designated its interest rate swap (Refer to Note 8 “Debt”) and foreign currency contracts (Refer to Note 13 “Commitments and Contingencies”) entered into as cash flow hedges. The effective portion of the changes in fair value of these cash flow hedges is recorded each period, net of tax, in Accumulated Other Comprehensive Income (Loss) until the related hedged transaction occurs. Any ineffective portion of the changes in fair value of these cash flow hedges is recorded in earnings. In the event the hedged cash flow for forecasted transactions does not occur, or it becomes probable that they will not occur, the Company reclassifies the amount of any gain or loss on the related cash flow hedge to income (expense) at that time. Cash flows related to these derivative financial instruments are included in cash flows from operating activities. The cash flows from the termination of interest rate swap agreements are reported as operating activities in the Consolidated Statements of Cash Flows.
Revenue Recognition
The Company recognizes revenue when it is realized or realizable and earned. This occurs when persuasive evidence of an arrangement exists, delivery has occurred, the price is fixed or determinable (including any price concessions under long-term agreements), the buyer is obligated to pay us (i.e., not contingent on a future event), the risk of loss is transferred, there is no obligation of future performance, collectability is reasonably assured and the amount of future returns can reasonably be estimated. With regards to the Company’s customers (including distributors), those criteria are met when title passes, generally at the point of shipment. Currently, the revenue recognition policy is the same for the Company’s Medical and Non-Medical segments. In general, for customers with long-term contracts, we have negotiated fixed pricing arrangements. During new contract negotiations, price level decreases (concessions) for future sales may be offered to customers in exchange for volume and/or long-term commitments. Once the new contracts are signed, these prices are fixed and determinable for all future sales and revenue is recognized at that fixed price. The Company includes shipping and handling fees billed to customers in Sales. Shipping and handling costs associated with inbound and outbound freight are recorded in Cost of Sales.
Environmental Costs
Environmental expenditures that relate to an existing condition caused by past operations and that do not provide future benefits are expensed as incurred. Liabilities are recorded when environmental assessments are made, the requirement for remedial efforts is probable and the amount of the liability can be reasonably estimated. Liabilities are recorded generally no later than the completion of feasibility studies. The Company has an ongoing monitoring and identification process to assess how the activities, with respect to known exposures, are progressing against the recorded liabilities, as well as to identify other potential remediation sites that are presently unknown.
Restructuring Expenses
The Company continually evaluates alternatives to align the business with the changing needs of its customers and to lower operating costs. This includes the realignment of its existing manufacturing capacity, facility closures, or similar actions, either in the normal course of business or pursuant to significant restructuring programs. These actions may result in employees receiving voluntary or involuntary employee termination benefits, which may be pursuant to contractual agreements. Voluntary termination benefits are accrued when an employee accepts the related offer. Involuntary termination benefits are accrued upon the commitment to a termination plan and the benefit arrangement is communicated to affected employees, or when liabilities are determined to be probable and estimable, depending on the existence of a substantive plan for severance or termination. All other exit costs are expensed as incurred. Refer to Note 11 “Other Operating Expenses” for additional information.
Product Warranties
The Company allows customers to return defective or damaged products for credit, replacement, or repair. The Company warrants that its products will meet customer specifications and will be free from defects in materials and workmanship. The Company accrues its estimated exposure to warranty claims, through Cost of Sales, based upon recent historical experience and other specific information as it becomes available. Note 13 “Commitments and Contingencies” contains additional information on the Company’s product warranties.
Research, Development and Engineering Costs (“RD&E”)
RD&E costs are expensed as incurred. The primary costs are salary and benefits for personnel, material costs used in development projects and subcontracting costs.
- 67 -
INTEGER HOLDINGS CORPORATION
NOTES TO CONSOLIDATED FINANCIAL STATEMENTS
(1.) SUMMARY OF SIGNIFICANT ACCOUNTING POLICIES (Continued)
Stock-Based Compensation
The Company recognizes stock-based compensation expense for its related compensation plans, which include stock options, restricted stock awards (“RSAs”), restricted stock units (“RSUs”) and performance-based restricted stock units (“PRSUs”). For the Company's PRSUs, in addition to service conditions, the ultimate number of shares to be earned depends on the achievement of targets based on market-based conditions, such as total shareholder return, or financial metrics such as adjusted operating income (“AOI”) and adjusted earnings before income taxes and depreciation (“EBITDA”). The Company recognizes forfeitures of equity awards as incurred.
The fair value of the stock-based compensation is determined at the grant date. The Company uses the Black-Scholes standard option pricing model (“Black-Scholes model”) to determine the fair value of stock options. The fair value of each RSU and RSA is determined based on the Company's closing stock price on the date of grant. The fair value of each PRSU is determined based on either the Company's closing stock price on the date of grant or through a Monte Carlo simulation valuation model (“Monte Carlo model”) for those awards that include a market-based condition. In addition to the closing stock price on the date of grant, the determination of the fair value of awards using both the Black-Scholes and Monte Carlo models is affected by other assumptions, including the following:
Expected Term - The Company analyzes historical employee exercise and termination data to estimate the expected term assumption for stock options. For market-based awards, the term is commensurate with the performance period remaining as of the grant date.
Risk-free Interest Rate - A risk-free rate is based on the U.S. Treasury rates in effect on the grant date for a maturity equal to or approximating the expected term of the award.
Expected Volatility - For stock options, expected volatility is calculated using historical volatility based on the daily closing prices of the Company's common stock over a period equal to the expected term. For market-based awards, a combination of historical and implied volatilities for the Company and members of its peer group are used in developing the expected volatility assumption.
Dividend Yield - The dividend yield assumption is based on the Company’s history and the expected annual dividend yield on the grant date.
The Company recognizes compensation expense based on the fair value of the award on the date of grant. For stock options, RSAs and RSUs, compensation expense is recognized over the respective service period using the straight-line amortization method. Compensation expense for PRSUs with financial metrics is reassessed each reporting period and recognized based upon the probability that the performance targets will be achieved. Compensation expense for market-based awards is not adjusted based on actual achievement of the performance goals. Based on the vesting terms of the grant, compensation expense for PRSUs is amortized over the service period using either a graded vesting method or the straight-line amortization method. The actual expense recognized over the vesting period will only be for those awards that ultimately vest, excluding market-based award considerations.
All stock option awards granted under the Company’s compensation plans have an exercise price equal to the closing stock price on the date of grant, a ten-year contractual life and generally, vest annually over a three-year vesting term. RSUs typically vest in equal annual installments over a three or four year period. Stock option and RSAs issued to members of the Company’s Board of Directors as a portion of their annual retainer vest quarterly over a one-year vesting term. Earned PRSUs typically vest two to three years from the date of grant.
The Company records deferred tax assets for awards that result in deductions on the Company's income tax returns, based on the amount of stock-based compensation expense recognized and the statutory tax rate in the jurisdiction in which it will receive a deduction. Differences between the deferred tax assets recognized for financial reporting purposes and the actual tax deduction reported on the income tax return are recorded as a component of income tax expense in the Consolidated Statements of Operations and Comprehensive Income (Loss). Note 10 “Stock-Based Compensation” contains additional information on the Company’s stock-based compensation.
- 68 -
INTEGER HOLDINGS CORPORATION
NOTES TO CONSOLIDATED FINANCIAL STATEMENTS
(1.) SUMMARY OF SIGNIFICANT ACCOUNTING POLICIES (Continued)
Foreign Currency Translation and Remeasurement
The Company translates all assets and liabilities of its foreign subsidiaries, where the U.S. dollar is not the functional currency, at the period-end exchange rate and translates income and expenses at the average exchange rates in effect during the period. The net effect of this translation is recorded in the consolidated financial statements as Accumulated Other Comprehensive Income (Loss). Translation adjustments are not adjusted for income taxes as they relate to permanent investments in the Company’s foreign subsidiaries.
The Company has foreign operations in Ireland, Germany, France, Switzerland, Mexico, Uruguay, and Malaysia, which expose the Company to foreign currency exchange rate fluctuations due to transactions denominated in Euros, Swiss francs, Mexican pesos, Uruguayan pesos, and Malaysian ringgits. To the extent that monetary assets and liabilities, including short-term and long-term intercompany loans, are recorded in a currency other than the functional currency of the subsidiary, these amounts are remeasured each period at the period-end exchange rate, with the resulting gain or loss being recorded in Other (Income) Loss, Net in the Consolidated Statements of Operations and Comprehensive Income (Loss). Net foreign currency transaction gains (losses) included in Other (Income) Loss, Net amounted to $(9.7) million, $4.9 million and $1.3 million for 2017, 2016 and 2015, respectively, and primarily related to the remeasurement of intercompany loans and the fluctuation of the U.S. dollar relative to the Euro.
Defined Benefit Plans
The Company recognizes in its balance sheet as an asset or liability the overfunded or underfunded status of its defined benefit plans provided to its employees located in Mexico, Switzerland, France and Germany. This asset or liability is measured as the difference between the fair value of plan assets, if any, and the benefit obligation of those plans. For these plans, the benefit obligation is the projected benefit obligation, which is calculated based on actuarial computations of current and future benefits for employees. Actuarial gains or losses and prior service costs or credits that arise during the period, but are not included as components of net periodic benefit expense, are recognized as a component of Accumulated Other Comprehensive Income (Loss). Defined benefit expenses are charged to Cost of Sales, SG&A and RD&E expenses as applicable. Note 9 “Benefit Plans” contains additional information on these costs.
Earnings (Loss) Per Share (“EPS”)
Basic EPS is calculated by dividing Net Income (Loss) by the weighted average number of shares outstanding during the period. Diluted EPS is calculated by adjusting the weighted average number of shares outstanding for potential common shares if dilutive to the EPS calculation and consist of stock options, unvested RSAs and RSUs and, if applicable, contingently convertible instruments such as convertible debt. Note 14 “Earnings (Loss) Per Share” contains additional information on the computation of the Company’s EPS.
Comprehensive Income (Loss)
The Company’s comprehensive income (loss) as reported in the Consolidated Statements of Operations and Comprehensive Income (Loss) includes net income (loss), foreign currency translation adjustments, the net change in cash flow hedges, and defined benefit plan liability adjustments. The Consolidated Statements of Operations and Comprehensive Income (Loss) and Note 15 “Accumulated Other Comprehensive Income (Loss)” contains additional information on the computation of the Company’s comprehensive income (loss).
Recent Accounting Pronouncements
In the normal course of business, management evaluates all new accounting pronouncements issued by the Financial Accounting Standards Board (“FASB”), Securities and Exchange Commission (“SEC”), or other authoritative accounting bodies to determine the potential impact they may have on the Company’s Consolidated Financial Statements. Based upon this review, except as noted below, management does not expect any of the recently issued accounting pronouncements, which have not already been adopted, to have a material impact on the Company’s Consolidated Financial Statements.
- 69 -
INTEGER HOLDINGS CORPORATION
NOTES TO CONSOLIDATED FINANCIAL STATEMENTS
(1.) SUMMARY OF SIGNIFICANT ACCOUNTING POLICIES (Continued)
Recently Adopted
In March 2016, the FASB issued Accounting Standards Update (“ASU”) 2016-09, “Compensation - Stock Compensation (Topic 718): Improvements to Employee Share-Based Payment Accounting.” ASU 2016-09 simplifies various aspects of the accounting for stock-based payments. The simplifications include:
• | recording all tax effects associated with stock-based compensation through the income statement, as opposed to recording certain amounts in other paid-in capital, which eliminates the requirements to calculate a windfall pool; |
• | allowing entities to withhold shares to satisfy the employer’s statutory tax withholding requirement up to the highest marginal tax rate applicable to employees rather than the employer’s minimum statutory rate, without requiring liability classification for the award; |
• | modifying the requirement to estimate the number of awards that will ultimately vest by providing an accounting policy election to either estimate the number of forfeitures or recognize forfeitures as they occur; |
• | changing certain presentation requirements in the statement of cash flows, including removing the requirement to present excess tax benefits as an inflow from financing activities and an outflow from operating activities, and requiring the cash paid to taxing authorities arising from withheld shares to be classified as a financing activity; and |
• | the assumed proceeds from applying the treasury stock method when computing EPS is amended to exclude the amount of excess tax benefits that would be recognized in additional paid-in capital. |
The Company adopted the provisions of ASU 2016-09 on December 31, 2016, the beginning of its 2017 fiscal year. The adoption of ASU 2016-09 resulted in the Company making an accounting policy election to change how it will recognize the number of stock awards that will ultimately vest. In the past, the Company applied a forfeiture rate to shares granted. With the adoption of ASU 2016-09, the Company will recognize forfeitures as they occur. This change resulted in the Company making a cumulative effect change to retained earnings of $0.3 million. In addition, the Company recorded the tax effects associated with stock-based compensation through the income statement for 2017 and will continue to record amounts prospectively through the income statement in accordance with ASU 2016-09. Finally, the Company adjusted its dilutive shares calculation to remove the excess tax benefits from the calculation of EPS on a prospective basis. The revised calculation is more dilutive, but did not have a material impact on the Company's diluted EPS calculation for 2017.
In July 2015, the FASB issued ASU 2015-11, “Simplifying the Measurement of Inventory,” which simplifies the subsequent measurement of inventory by requiring inventory to be measured at the lower of cost and net realizable value. Net realizable value is the estimated selling prices in the ordinary course of business, less reasonably predictable costs of completion, disposal, and transportation. This ASU is effective for public business entities for fiscal years beginning after December 15, 2016, and interim periods within those fiscal years. The Company adopted this standard in the first quarter of fiscal year 2017 on a prospective basis. The adoption of this ASU did not have a material impact on the Company’s consolidated financial statements.
In January 2017, the FASB issued ASU 2017-04, “Simplifying the Test for Goodwill Impairment (Topic 350)” to simplify the accounting for goodwill impairment. The guidance removes Step 2 of the goodwill impairment test. A goodwill impairment will now be measured as the amount by which a reporting unit’s carrying value exceeds its fair value, limited to the amount of goodwill allocated to that reporting unit. ASU 2017-04 is effective for interim and annual periods beginning after December 15, 2019, with early adoption permitted for any impairment tests performed after January 1, 2017. The Company adopted the new guidance on a prospective basis during the first quarter of 2017. The adoption of this ASU did not impact the Company’s consolidated financial statements.
Not Yet Adopted
In February 2018, the FASB issued ASU 2018-02, “Reclassification of Certain Tax Effects from Accumulated Other Comprehensive Income,” which allows for the reclassification of certain income tax effects related to the U.S. Tax Cuts and Jobs Act (the “Tax Reform Act”) between accumulated other comprehensive income (loss) and retained earnings. The amendments eliminate the stranded tax effects that were created as a result of the reduction of the U.S. federal corporate income tax rate. The accounting update is effective for fiscal years beginning after December 15, 2018, and interim periods within those fiscal years, with early adoption permitted. Adoption of this ASU is to be applied either in the period of adoption or retrospectively to each period in which the effect of the change in the tax laws or rates were recognized. The Company is currently evaluating the impact that the adoption of this ASU will have on its consolidated financial statements.
- 70 -
INTEGER HOLDINGS CORPORATION
NOTES TO CONSOLIDATED FINANCIAL STATEMENTS
(1.) SUMMARY OF SIGNIFICANT ACCOUNTING POLICIES (Continued)
In August 2017, the FASB issued ASU No. 2017-12, “Derivatives and Hedging (Topic 815): Targeted Improvements to Accounting for Hedging Activities.” The amendments in this ASU better align an entity’s risk management activities and financial reporting for hedging relationships through changes to both the designation and measurement guidance for qualifying hedging relationships, making more hedges eligible for hedge accounting, particularly for rates and commodities hedges. It also aligns the recognition and presentation of the effects of the hedging instrument and the hedged item in the financial statements by requiring an entity to present the earnings effect of the hedging instrument in the same income statement line item in which the earnings effect of the hedged item is reported. This guidance is effective for the Company in the first quarter of fiscal year 2019, with early adoption permitted. The Company does not believe the adoption of this guidance will have a material impact on its consolidated financial statements.
In October 2016, the FASB issued ASU 2016-16, “Income Taxes (Topic 740): Intra-entity Transfers of Assets Other Than Inventory,” which requires entities to recognize the income tax consequences of intra-entity transfers of assets other than inventory when the transfers occur. This ASU is effective for the Company for fiscal years beginning after December 15, 2017, including interim periods within those fiscal years. The Company does not believe the adoption of this guidance will have a material impact on its consolidated financial statements.
In August 2016, the FASB issued ASU 2016-15 “Statement of Cash Flows (Topic 230): Classification of Certain Cash Receipts and Cash Payments: A Consensus of the FASB Emerging Issues Task Force.” ASU 2016-15 makes targeted changes to how cash receipts and cash payments are presented in the statement of cash flows. The areas specifically addressed include debt prepayment and debt extinguishment costs, the settlement of zero-coupon debt instruments, contingent consideration payments made after a business combination, proceeds from the settlement of insurance claims, cash premiums paid for and proceeds from corporate-owned life insurance policies, distributions received from equity method investees and cash receipts from payments on transferor’s beneficial interest on securitized trade receivables. Additionally, the amendment states that, in the absence of other prevailing guidance, cash receipts and payments that have characteristics of more than one class of cash flows should have each separately identifiable source or use of cash presented within the most predominant class of cash flows based on the nature of the underlying cash flows. This guidance is effective for the Company in the first quarter of fiscal year 2018, with early adoption permitted. The Company does not believe the adoption of this guidance will have a material impact on its consolidated financial statements.
In February 2016, the FASB issued ASU 2016-02, “Leases (Topic 842),” which requires companies to recognize a lease liability that represents the discounted obligation to make future minimum lease payments, and a corresponding right-of-use asset on the balance sheet for most leases. This ASU retains a distinction between finance leases and operating leases, and the classification criteria for distinguishing between finance leases and operating leases are substantially similar to the classification criteria for distinguishing between capital leases and operating leases in the current accounting literature. The result of retaining a distinction between finance leases and operating leases is that under the lessee accounting model in Topic 842, the effect of leases in a consolidated statement of comprehensive income and a consolidated statement of cash flows is largely unchanged from previous GAAP. The amendments in this ASU are effective for fiscal years beginning after December 15, 2018, including interim periods within those fiscal years, and are required to be applied on a modified retrospective basis. Earlier application is permitted. The Company expects the adoption of ASU 2016-02 will result in a material increase in the assets and liabilities on its Consolidated Balance Sheets for its right-to-use assets and lease liabilities. The Company is currently evaluating the impact that the adoption of this ASU will have on its Consolidated Statements of Operations and Comprehensive Income (Loss).
In January 2016, the FASB issued ASU 2016-01, “Financial Instruments - Overall (Subtopic 825-10): Recognition and Measurement of Financial Assets and Financial Liabilities.” This ASU requires equity investments (except those accounted for under the equity method of accounting, or those that result in consolidation of the investee) to be measured at fair value with changes in fair value recognized in net income; requires entities to use the exit price notion when measuring the fair value of financial instruments for disclosure purposes; requires separate presentation of financial assets and financial liabilities by measurement category and form of financial asset and requires entities to present separately in other comprehensive income the portion of the total change in the fair value of a liability resulting from a change in the instrument-specific credit risk (also referred to as “own credit”) when the organization has elected to measure the liability at fair value in accordance with the fair value option. The new ASU is effective for public companies for fiscal years beginning after December 15, 2017. Early adoption of the own credit provision is permitted. The Company is currently evaluating the impact that the adoption of this ASU will have on its consolidated financial statements.
- 71 -
INTEGER HOLDINGS CORPORATION
NOTES TO CONSOLIDATED FINANCIAL STATEMENTS
(1.) SUMMARY OF SIGNIFICANT ACCOUNTING POLICIES (Continued)
In May 2014, the FASB issued ASU 2014-09, “Revenue from Contracts with Customers,” which has been subsequently updated by ASU 2015-14, 2016-08, 2016-10 and 2016-12. The core principle behind ASU 2014-09 is that an entity should recognize revenue in an amount that reflects the consideration to which it expects to be entitled in exchange for delivering goods and services using a five-step model. Enhanced disclosures are required, including revenue recognition policies to identify performance obligations and significant judgments in measurement and recognition. This ASU can be adopted using either a full retrospective approach, where historical financial information is presented in accordance with the new standard, or a modified retrospective approach, where this ASU is applied to the most current period presented in the financial statements. This ASU is effective for the Company in the first quarter of fiscal year 2018.
The Company has evaluated the impact of adopting ASU 2014-09 by applying the five-step model to existing contracts with customers. The majority of the Company’s customer contracts consist of a single performance obligation for which revenue will continue to be recognized at the point of shipment. As a result, the Company has concluded that this standard does not have a material impact on the Company’s financial condition or results of operations. In conjunction with this evaluation, the Company also reviewed internal controls, business processes and key system functionality and no significant changes were deemed necessary. The Company is currently finalizing the required additional disclosures related to the nature, timing and uncertainty of revenue and cash flows arising from contracts with customers. The Company will adopt using the modified retrospective approach on December 30, 2017, the first day of the Company’s 2018 fiscal year.
As ASU 2014-09 is principle based, interpretation of those principles may vary from company to company based upon their unique circumstances. New information may arise that could change the Company’s current understanding and interpretation of the standard and its impact on the Company. The Company will continue to monitor industry activities and any additional guidance provided by regulators, standard setters or the accounting profession and will adjust its implementation of the standard accordingly.
(2.) DIVESTITURE AND ACQUISITION
Spin-off of Nuvectra Corporation
On March 14, 2016, Integer completed the spin-off of a portion of its former QiG segment through a tax-free distribution of all of the shares of its former QiG Group, LLC subsidiary to the stockholders of Integer on a pro rata basis. Immediately prior to completion of the Spin-off, QiG Group, LLC was converted into a corporation organized under the laws of Delaware and changed its name to Nuvectra Corporation (“Nuvectra”). On March 14, 2016, each of the Company’s stockholders of record as of the close of business on March 7, 2016 (the “Record Date”) received one share of Nuvectra common stock for every three shares of Integer common stock held as of the Record Date. Upon completion of the Spin-off, Nuvectra became an independent publicly traded company whose common stock is listed on the NASDAQ stock exchange under the symbol “NVTR.”
The portion of the former QiG segment spun-off consisted of QiG Group, LLC and its subsidiaries: (i) Algostim, LLC (“Algostim”), (ii) PelviStim LLC (“PelviStim”), and (iii) the Company’s NeuroNexus Technologies (“NeuroNexus”) subsidiary. The operations of Centro de Construcción de Cardioestimuladores del Uruguay (“CCC”) and certain other existing QiG research and development capabilities were retained by the Company and not included as part of the Spin-off. As the Company continues to focus on the design and development of complete medical device systems and components, and more specifically on medical device systems and components in the neuromodulation market, the Spin-off was not considered a strategic shift that had a major effect on the Company’s operations and financial results. Accordingly, the Spin-off is not presented as a discontinued operation in the Company’s Consolidated Financial Statements. The results of Nuvectra are included in the Consolidated Statements of Operations and Comprehensive Income (Loss) through the date of the Spin-off.
- 72 -
INTEGER HOLDINGS CORPORATION
NOTES TO CONSOLIDATED FINANCIAL STATEMENTS
(2.) DIVESTITURE AND ACQUISITION (Continued)
In connection with the Spin-off, during the first quarter of 2016, the Company made a cash capital contribution of $75 million to Nuvectra and divested the following assets and liabilities (in thousands):
Assets divested | |||
Cash and cash equivalents | $ | 76,256 | |
Other current assets | 977 | ||
Property, plant and equipment, net | 4,407 | ||
Amortizing intangible assets, net | 1,931 | ||
Goodwill | 40,830 | ||
Deferred income taxes | 6,446 | ||
Total assets divested | 130,847 | ||
Liabilities transferred | |||
Current liabilities | 2,119 | ||
Net assets divested | $ | 128,728 | |
Nuvectra contributed a pre-tax loss of $5.2 million and $24.4 million to the Company’s results of operations for the fiscal years ended December 30, 2016 and January 1, 2016, respectively.
Acquisition of LRM
On October 27, 2015, the Company acquired all of the outstanding common stock of LRM for a total purchase price including debt assumed of approximately $1.77 billion. LRM specialized in the design, development, and manufacturing of products across the medical component and device spectrum primarily serving the cardio, vascular and advanced surgical markets.
Fair Value of Consideration Transferred
The aggregate consideration paid by the Company to the stockholders of LRM consisted of the following (in thousands):
Cash | $ | 478,490 | |
Fair value of Integer common stock | 245,368 | ||
Replacement stock options attributable to pre-acquisition service | 4,508 | ||
Total purchase consideration | $ | 728,366 | |
The fair value of the Integer common stock issued as part of the consideration was determined based upon the closing stock price of Integer’s shares as of the acquisition date. The fair value of the Integer stock options issued as part of the consideration was determined utilizing a Black-Scholes option pricing model as of the acquisition date. Concurrent with the closing of the acquisition, the Company repaid all of the outstanding debt of LRM of approximately $1.0 billion. The cash portion of the purchase price and the repayment of LRM’s debt was primarily funded through a new senior secured credit facility and the issuance of senior notes. Refer to Note 8 “Debt” for additional information regarding the Company’s debt.
Fair Value of Assets Acquired and Liabilities Assumed
This transaction was accounted for under the acquisition method of accounting. Accordingly, the cost of the acquisition was allocated to the LRM assets acquired and liabilities assumed based on their fair values as of the closing date of the acquisition, with the amount exceeding the fair value of the net assets acquired recorded as goodwill. The fair value of assets acquired and liabilities assumed was finalized during the third quarter of fiscal year 2016. Measurement-period adjustments made during 2016 were an increase to current liabilities of $1.5 million, and reductions to goodwill of $1.1 million and deferred tax liabilities of $2.6 million These adjustments did not impact the Company’s Consolidated Statements of Operations and Comprehensive Income (Loss). The measurement period for this acquisition is closed and no further purchase price adjustments will be made.
- 73 -
INTEGER HOLDINGS CORPORATION
NOTES TO CONSOLIDATED FINANCIAL STATEMENTS
(2.) DIVESTITURE AND ACQUISITION (Continued)
The fair values of the assets acquired and liabilities assumed are as follows (in thousands):
Assets acquired | |||
Current assets | $ | 269,815 | |
Property, plant and equipment | 216,473 | ||
Amortizing intangible assets | 849,000 | ||
Indefinite-lived intangible assets | 70,000 | ||
Goodwill | 660,670 | ||
Other non-current assets | 1,629 | ||
Total assets acquired | 2,067,587 | ||
Liabilities assumed | |||
Current liabilities | 103,986 | ||
Debt assumed | 1,044,675 | ||
Other long-term liabilities | 190,560 | ||
Total liabilities assumed | 1,339,221 | ||
Net assets acquired | $ | 728,366 | |
The goodwill acquired in connection with the acquisition was allocated to the Medical segment and is not deductible for tax purposes. Various factors contributed to the establishment of goodwill, including the value of LRM’s highly trained assembled work force and management team, the incremental value resulting from LRM’s industry leading capabilities and services to OEMs, enhanced synergies, and the expected revenue growth over time that is attributable to increased market penetration from future products and customers. In connection with the acquisition, the Company recognized a $70 million trademarks and tradenames indefinite-lived intangible asset, $160 million of purchased technology definite-lived intangible assets that had an estimated weighted average amortization period of 7 years and $689 million of customer lists definite-lived intangible assets that had an estimated weighted average amortization period of 14 years. In connection with the acquisition, the Company also recorded the inventory acquired at fair value resulting in an increase in inventory of $23.0 million. This step-up in the fair value of inventory was amortized as the inventory to which the step-up relates was sold and was fully amortized as of January 1, 2016.
The operating results of LRM have been included in the Company’s consolidated results since the date of acquisition. For the fiscal year ended December 30, 2016, LRM had $802.4 million of revenue and $32.8 million of net income. For the fiscal year ended January 1, 2016, LRM had $138.6 million of revenue and a net loss of $17.4 million. Disclosure of the operating results from LRM for fiscal year 2017 is not practicable, as the Company has already integrated operations in many areas.
Unaudited Pro Forma Financial Information
The following unaudited pro forma information summarizes the consolidated results of operations of the Company and LRM for fiscal year 2015 as if the acquisition of LRM occurred as of the beginning of fiscal year 2015 (in thousands, except per share amounts):
Sales | $ | 1,445,689 | |
Net income | 2,405 | ||
Earnings per share: | |||
Basic | $ | 0.08 | |
Diluted | $ | 0.08 | |
- 74 -
INTEGER HOLDINGS CORPORATION
NOTES TO CONSOLIDATED FINANCIAL STATEMENTS
(2.) DIVESTITURE AND ACQUISITION (Continued)
The unaudited pro forma information presents the combined operating results of Integer and LRM, with the results prior to the acquisition date adjusted to include the pro forma impact of the amortization of acquired intangible assets, the adjustment to interest expense reflecting the amount borrowed in connection with the acquisition at Integer’s interest rate, and the impact of income taxes on the pro forma adjustments utilizing the applicable statutory tax rate. Fiscal year 2015 pro forma earnings were adjusted to exclude $32.3 million of acquisition-related costs (change-in-control payments, investment banking fees, professional fees), $9.5 million of debt related charges (commitment fees, swap termination fees, debt extinguishment fees) and $23.0 million of nonrecurring amortization expense related to the fair value step-up of inventory incurred in 2015 as a result of the acquisition of LRM. The unaudited pro forma consolidated basic and diluted earnings per share calculations are based on the consolidated basic and diluted weighted average shares of Integer. The unaudited pro forma results are presented for illustrative purposes only and do not reflect the realization of potential cost savings, and any related integration costs. Costs savings may result from the acquisition; however, there can be no assurance that these cost savings will be achieved. These pro forma results do not purport to be indicative of the results that would have been obtained by the combined company, or to be a projection of results that may be obtained in the future by the combined company.
(3.) SUPPLEMENTAL CASH FLOW INFORMATION
The following represents supplemental cash flow information for fiscal years 2017, 2016 and 2015 (in thousands):
2017 | 2016 | 2015 | |||||||||
Noncash investing and financing activities: | |||||||||||
Property, plant and equipment purchases included in accounts payable | $ | 3,474 | $ | 3,499 | $ | 7,401 | |||||
Common stock contributed to 401(k) Plan | — | — | 3,920 | ||||||||
Common stock issued in connection with LRM acquisition | — | — | 245,368 | ||||||||
Replacement stock options issued in connection with LRM acquisition | — | — | 4,508 | ||||||||
Purchase of non-controlling interests in subsidiaries included in accrued expenses | — | — | 6,818 | ||||||||
Cash paid (refunded) during the year for: | |||||||||||
Interest | 93,839 | 106,475 | 13,057 | ||||||||
Income taxes | (8,185 | ) | 7,263 | 6,312 | |||||||
Acquisition of noncash assets | — | — | 2,013,604 | ||||||||
Liabilities assumed | — | — | 1,340,339 | ||||||||
(4.) INVENTORIES
Inventories are comprised of the following (in thousands):
December 29, 2017 | December 30, 2016 | ||||||
Raw materials | $ | 97,615 | $ | 100,738 | |||
Work-in-process | 92,650 | 89,224 | |||||
Finished goods | 37,269 | 35,189 | |||||
Total | $ | 227,534 | $ | 225,151 | |||
- 75 -
INTEGER HOLDINGS CORPORATION
NOTES TO CONSOLIDATED FINANCIAL STATEMENTS
(5.) PROPERTY, PLANT AND EQUIPMENT, NET
PP&E is comprised of the following (in thousands):
December 29, 2017 | December 30, 2016 | ||||||
Manufacturing machinery and equipment | $ | 373,558 | $ | 332,886 | |||
Buildings and building improvements | 138,605 | 132,277 | |||||
Information technology hardware and software | 62,204 | 52,467 | |||||
Leasehold improvements | 64,675 | 59,292 | |||||
Furniture and fixtures | 20,555 | 18,989 | |||||
Land and land improvements | 19,577 | 20,046 | |||||
Construction work in process | 28,051 | 32,252 | |||||
Other | 1,146 | 1,062 | |||||
708,371 | 649,271 | ||||||
Accumulated depreciation | (337,996 | ) | (277,229 | ) | |||
Total | $ | 370,375 | $ | 372,042 | |||
Depreciation expense for PP&E was as follows for fiscal years 2017, 2016 and 2015 (in thousands):
2017 | 2016 | 2015 | |||||||||
Depreciation expense | $ | 56,084 | $ | 52,662 | $ | 27,136 | |||||
- 76 -
INTEGER HOLDINGS CORPORATION
NOTES TO CONSOLIDATED FINANCIAL STATEMENTS
(6.) GOODWILL AND OTHER INTANGIBLE ASSETS, NET
Goodwill
The change in the carrying amount of goodwill by reportable segment during fiscal year 2017 was as follows (in thousands):
Medical | Non-Medical | Total | |||||||||
December 30, 2016 | $ | 950,326 | $ | 17,000 | $ | 967,326 | |||||
Foreign currency translation | 22,912 | — | 22,912 | ||||||||
December 29, 2017 | $ | 973,238 | $ | 17,000 | $ | 990,238 | |||||
As of December 29, 2017, no accumulated impairment loss has been recognized for the goodwill allocated to the Company’s Medical or Non-Medical segments.
Intangible Assets
Intangible assets are comprised of the following (in thousands):
Gross Carrying Amount | Accumulated Amortization | Foreign Currency Translation | Net Carrying Amount | ||||||||||||
December 29, 2017 | |||||||||||||||
Definite-lived: | |||||||||||||||
Purchased technology and patents | $ | 256,719 | $ | (117,695 | ) | $ | 2,483 | $ | 141,507 | ||||||
Customer lists | 759,987 | (87,555 | ) | 16,103 | 688,535 | ||||||||||
Other | 4,534 | (7,797 | ) | 3,326 | 63 | ||||||||||
Total amortizing intangible assets | $ | 1,021,240 | $ | (213,047 | ) | $ | 21,912 | $ | 830,105 | ||||||
Indefinite-lived: | |||||||||||||||
Trademarks and tradenames | $ | 90,288 | |||||||||||||
December 30, 2016 | |||||||||||||||
Definite-lived: | |||||||||||||||
Purchased technology and patents | $ | 256,719 | $ | (100,719 | ) | $ | 333 | $ | 156,333 | ||||||
Customer lists | 759,987 | (60,474 | ) | (6,269 | ) | 693,244 | |||||||||
Other | 4,534 | (5,142 | ) | 803 | 195 | ||||||||||
Total amortizing intangible assets | $ | 1,021,240 | $ | (166,335 | ) | $ | (5,133 | ) | $ | 849,772 | |||||
Indefinite-lived: | |||||||||||||||
Trademarks and tradenames | $ | 90,288 | |||||||||||||
Aggregate intangible asset amortization expense is comprised of the following for fiscal years 2017, 2016 and 2015 (in thousands):
2017 | 2016 | 2015 | |||||||||
Cost of sales | $ | 16,586 | $ | 16,769 | $ | 7,403 | |||||
SG&A | 27,043 | 20,581 | 9,681 | ||||||||
RD&E | 545 | 512 | 412 | ||||||||
Other Operating Expenses | 2,538 | — | — | ||||||||
Total intangible asset amortization expense | $ | 46,712 | $ | 37,862 | $ | 17,496 | |||||
Estimated future intangible asset amortization expense based upon the carrying value as of December 29, 2017 is as follows (in thousands):
2018 | 2019 | 2020 | 2021 | 2022 | After 2022 | ||||||||||||||||||
Amortization Expense | $ | 45,316 | $ | 45,433 | $ | 46,051 | $ | 45,176 | $ | 43,142 | $ | 604,987 | |||||||||||
- 77 -
INTEGER HOLDINGS CORPORATION
NOTES TO CONSOLIDATED FINANCIAL STATEMENTS
(7.) ACCRUED EXPENSES
Accrued expenses are comprised of the following (in thousands):
December 29, 2017 | December 30, 2016 | ||||||
Salaries and benefits | $ | 32,529 | $ | 30,199 | |||
Profit sharing and bonuses | 19,244 | 3,054 | |||||
Accrued interest | 8,523 | 6,838 | |||||
Other | 21,244 | 32,190 | |||||
Total | $ | 81,540 | $ | 72,281 | |||
(8.) DEBT
Long-term debt is comprised of the following (in thousands):
December 29, 2017 | December 30, 2016 | ||||||
Senior secured term loan A | $ | 335,157 | $ | 356,250 | |||
Senior secured term loan B | 873,286 | 1,014,750 | |||||
9.125% senior notes due 2023 | 360,000 | 360,000 | |||||
Revolving line of credit | 74,000 | 40,000 | |||||
Unamortized discount on term loan B and debt issuance costs | (33,278 | ) | (40,837 | ) | |||
Total debt | 1,609,165 | 1,730,163 | |||||
Current portion of long-term debt | (30,469 | ) | (31,344 | ) | |||
Total long-term debt | $ | 1,578,696 | $ | 1,698,819 | |||
Senior Secured Credit Facilities
The Company has senior secured credit facilities (the “Senior Secured Credit Facilities”) consisting of (i) a $200 million revolving credit facility (the “Revolving Credit Facility”), (ii) a $375 million term loan A facility (the “TLA Facility”), and (iii) a $1,025 million term loan B facility (the “TLB Facility”). The TLA Facility and TLB Facility are collectively referred to as the “Term Loan Facilities.” The TLB facility was issued at a 1% discount.
In March 2017 and again in November of 2017, the Company amended the Senior Secured Credit Facilities to lower the interest rate on the TLB Facility. The amendments reduced the applicable interest rate margins of its TLB Facility for both base rate and adjusted LIBOR borrowings by a cumulative 100 basis points. The amendments include a prepayment fee of 1.00% in the event of another repricing event (as defined in the Senior Secured Credit Facilities) on or before the six-month anniversary of the amendment. There was no change to maturities or covenants under the Senior Secured Credit Facilities as a result of these repricing amendments.
Revolving Credit Facility
The Revolving Credit Facility matures on October 27, 2020 and includes a $15 million sublimit for swingline loans and a $25 million sublimit for standby letters of credit. The Company is required to pay a commitment fee on the unused portion of the Revolving Credit Facility, which will range between 0.175% and 0.25%, depending on the Company’s total net leverage ratio, as defined in the Senior Secured Credit Facilities agreement. Interest rates on the TLA Facility, as well as the Revolving Credit Facility, are at the Company’s option, either at: (i) the prime rate plus the applicable margin, which will range between 0.75%and 2.25%, based on the Company’s total net leverage ratio, as defined in the Senior Secured Credit Facilities agreement or (ii) the applicable LIBOR rate plus the applicable margin, which will range between 1.75% and 3.25%, based on the Company’s total net leverage ratio.
As of December 29, 2017, the Company had $74 million of outstanding borrowings on the Revolving Credit Facility and an available borrowing capacity of $116.7 million after giving effect to $9.3 million of outstanding standby letters of credit. As of December 29, 2017, the weighted average interest rate on outstanding borrowings under the Revolving Credit Facility was 4.73%.
- 78 -
INTEGER HOLDINGS CORPORATION
NOTES TO CONSOLIDATED FINANCIAL STATEMENTS
(8.) DEBT (Continued)
Subject to certain conditions, commitments under the Revolving Credit Facility may be increased through an incremental revolving facility so long as, on a pro forma basis, the Company’s first lien net leverage ratio does not exceed 4.25:1.00. The outstanding amount of the Revolving Credit Facility approximated its fair value as of December 29, 2017 based upon the debt being variable rate and short-term in nature.
Term Loan Facilities
The TLA Facility and TLB Facility mature on October 27, 2021 and October 27, 2022, respectively. Interest rates on the TLB Facility are, at the Company’s option, either at: (i) the prime rate plus 2.25% or (ii) the applicable LIBOR rate plus 3.25%, with LIBOR subject to a 1.00% floor. As of December 29, 2017, the interest rate on the TLA Facility and TLB Facility were 4.82% and 4.66%, respectively. Additionally, if the Company receives both (a) a public corporate family credit rating from Moody’s Investors Services, Inc. of “B2” (stable outlook) or higher and (b) a public corporate credit rating from Standard & Poor’s Financial Services LLC of “B” (stable outlook) or higher, the interest rate margins for the TLB Facility will step down by an additional 25 basis points. Subject to certain conditions, one or more incremental term loan facilities may be added to the Term Loan Facilities so long as, on a pro forma basis, the Company’s first lien net leverage ratio does not exceed 4.25:1.00.
As of December 29, 2017, the estimated fair value of the TLB Facility was approximately $883 million, based on quoted market prices for the debt, recent sales prices for the debt and consideration of comparable debt instruments with similar interest rates and trading frequency, among other factors, and is classified as Level 2 measurements within the fair value hierarchy. The par amount of the TLA Facility approximated its fair value as of December 29, 2017 based upon the debt being variable rate in nature.
Covenants
The Revolving Credit Facility and the TLA Facility contain covenants requiring (A) a maximum total net leverage ratio of 6.25:1.0, subject to step downs beginning in the first quarter of 2018 and (B) a minimum interest coverage ratio of adjusted EBITDA (as defined in the Senior Secured Credit Facilities) to interest expense of not less than 2.50:1.0, subject to step ups beginning in the first quarter of 2018. As of December 29, 2017, the Company was in compliance with these financial covenants. The TLB Facility does not contain any financial maintenance covenants.
The Senior Secured Credit Facilities also contain negative covenants that restrict the Company’s ability to (i) incur additional indebtedness; (ii) create certain liens; (iii) consolidate or merge; (iv) sell assets, including capital stock of the Company’s subsidiaries; (v) engage in transactions with the Company’s affiliates; (vi) create restrictions on the payment of dividends or other amounts from the Company’s restricted subsidiaries; (vii) pay dividends on capital stock or redeem, repurchase or retire capital stock; (viii) pay, prepay, repurchase or retire certain subordinated indebtedness; (ix) make investments, loans, advances and acquisitions; (x) make certain amendments or modifications to the organizational documents of the Company or its subsidiaries or the documentation governing other senior indebtedness of the Company; and (xi) change the Company’s type of business. These negative covenants are subject to a number of limitations and exceptions that are described in the Senior Secured Credit Facilities agreement. As of December 29, 2017, the Company was in compliance with all negative covenants under the Senior Secured Credit Facilities.
The Senior Secured Credit Facilities provide for customary events of default. Upon the occurrence and during the continuance of an event of default, the outstanding advances and all other obligations under the Senior Secured Credit Facilities become immediately due and payable.
9.125% Senior Notes due 2023
On October 27, 2015, the Company completed a private offering of $360 million aggregate principal amount of 9.125% senior notes due on November 1, 2023 (the “Senior Notes”). All the Senior Notes are outstanding as of December 29, 2017.
Interest on the Senior Notes is payable on May 1 and November 1 of each year. The Company may redeem the Senior Notes, in whole or in part, prior to November 1, 2018 at a price equal to 100% of the principal amount thereof plus a “make-whole” premium. Prior to November 1, 2018, the Company may also redeem up to 40% of the aggregate principal amount of the Senior Notes using the proceeds from certain equity offerings at a redemption price equal to 109.125% of the aggregate principal amount of the Senior Notes. On or after November 1, 2018, the Company may redeem the Senior Notes, in whole or in part, pursuant to a customary schedule of declining redemption prices. As of December 29, 2017, the estimated fair value of the Senior Notes was approximately $392 million, based on quoted market prices of these notes, recent sales prices for the notes and consideration of comparable debt instruments with similar interest rates and trading frequency, among other factors, and is classified as Level 2 measurements within the fair value hierarchy.
- 79 -
INTEGER HOLDINGS CORPORATION
NOTES TO CONSOLIDATED FINANCIAL STATEMENTS
(8.) DEBT (Continued)
The Senior Notes are senior unsecured obligations and contain normal incurrence-based covenants and limitations such as the ability to incur or guarantee additional indebtedness, pay dividends, make other restricted payments and investments, create liens and effect certain corporate acts such as mergers and consolidations. These covenants are subject to a number of limitations and exceptions that are described in the indenture for the Senior Notes. The Senior Notes provide for customary events of default, subject in certain cases to customary cure periods, in which the Senior Notes and any unpaid interest would become due and payable. As of December 29, 2017, the Company was in compliance with all restrictive covenants under the indenture governing the Senior Notes.
As of December 29, 2017, the weighted average interest rate on all outstanding borrowings is 5.67%.
Contractual maturities of the Company’s debt facilities for the next five years and thereafter, excluding any discounts or premiums, as of December 29, 2017 are as follows (in thousands):
2018 | 2019 | 2020 | 2021 | 2022 | After 2022 | |||||||||||||
Future minimum principal payments | $ | 30,469 | 37,500 | 111,500 | 229,688 | 873,286 | 360,000 | |||||||||||
Debt Issuance Costs and Discounts
The Company incurred debt issuance costs in conjunction with the issuance of the Senior Secured Credit Facilities and the Senior Notes. The change in deferred debt issuance costs related to the Company’s Revolving Credit Facility is as follows (in thousands):
January 1, 2016 | $ | 4,791 | |
Amortization during the period | (991 | ) | |
December 30, 2016 | 3,800 | ||
Amortization during the period | (992 | ) | |
December 29, 2017 | $ | 2,808 | |
The change in unamortized discount and debt issuance costs related to the Term Loan Facilities and Senior Notes is as follows (in thousands):
Debt Issuance Costs | Unamortized Discount on TLB Facility | Total | |||||||||
January 1, 2016 | $ | 35,908 | $ | 10,039 | $ | 45,947 | |||||
Financing costs incurred | 1,177 | — | 1,177 | ||||||||
Amortization during the period | (4,989 | ) | (1,298 | ) | (6,287 | ) | |||||
December 30, 2016 | 32,096 | 8,741 | 40,837 | ||||||||
Financing costs incurred | 2,360 | — | 2,360 | ||||||||
Write-off of debt issuance costs and unamortized discount | (2,421 | ) | (1,104 | ) | (3,525 | ) | |||||
Amortization during the period | (5,146 | ) | (1,248 | ) | (6,394 | ) | |||||
December 29, 2017 | $ | 26,889 | $ | 6,389 | $ | 33,278 | |||||
The Company prepaid portions of its TLB Facility and recognized losses from extinguishment of debt during fiscal year 2017 of $3.5 million, which is included in Interest Expense, Net in the Consolidated Statements of Operations and Comprehensive Income (Loss). The loss from extinguishment of debt represents the portion of the unamortized discount and debt issuance costs related to the portion of the TLB Facility that was prepaid. During fiscal year 2015, the Company wrote off $1.6 million of debt issuance costs in connection with the extinguishment and modification of its term loan and revolving line of credit, respectively, which is included in Interest Expense in the Consolidated Statements of Operations and Comprehensive Income (Loss).
- 80 -
INTEGER HOLDINGS CORPORATION
NOTES TO CONSOLIDATED FINANCIAL STATEMENTS
(8.) DEBT (Continued)
Interest Rate Swaps
From time to time, the Company enters into interest rate swap agreements in order to hedge against potential changes in cash flows on its outstanding variable rate debt. During 2016, the Company entered into a one year $250 million interest rate swap, which expired during 2017, and a three year $200 million interest rate swap to hedge against potential changes in cash flows on its outstanding variable rate debt, which is indexed to the one-month LIBOR rate. The variable rate received on the interest rate swap and the variable rate paid on the variable rate debt will have the same rate of interest, excluding the credit spread, and will reset and pay interest on the same day.
Information regarding the Company’s outstanding interest rate swap designated as a cash flow hedge as of December 29, 2017 is as follows (dollars in thousands):
Notional Amount | Start Date | End Date | Pay Fixed Rate | Receive Current Floating Rate | Fair Value | Balance Sheet Location | |||||||||||
$ | 200,000 | Jun-17 | Jun-20 | 1.1325 | % | 1.5521% | $ | 4,279 | Other Assets | ||||||||
The estimated fair value of the interest rate swap agreements represents the amount the Company expects to receive (pay) to terminate the contract. No portion of the change in fair value of the Company’s interest rate swaps during 2017, 2016, or 2015 were considered ineffective. The amount recorded to Interest Expense related to the Company’s interest rate swaps was a reduction of $0.5 million during 2017 and an increase of $0.1 million and $3.5 million during 2016 and 2015, respectively. The 2015 amount includes a $2.8 million charge related to the termination of interest rate swap agreements in connection with the LRM acquisition. The estimated Accumulated Other Comprehensive Income related to the Company’s interest rate swaps that is expected to be reclassified into earnings within the next twelve months is a $1.3 million gain.
(9.) BENEFIT PLANS
Savings Plan
The Company sponsors a defined contribution 401(k) plan (the “Plan”), for its U.S. based employees. The Plan provides for the deferral of employee compensation under Internal Revenue Code §401(k) and a Company match.
Beginning in 2017, the Company matches $0.50 per dollar of participant deferral, up to 6% of the compensation of each participant. Contributions from employees, as well at those matched by the Company, vest immediately. In 2016, and 2015, the Company match was 35% of an employee’s contributions (50% of an employee’s contributions for legacy LRM associates) up to the first 6% of the total compensation. Net costs related to defined contribution plans were $8.1 million in 2017, $6.4 million in 2016 and $3.1 million in 2015.
Defined Benefit Plans
The Company is required to provide its employees located in Switzerland, Mexico, France, and Germany certain statutorily mandated defined benefits. Under these plans, benefits accrue to employees based upon years of service, position, age and compensation. The defined benefit pension plan provided to the Company’s employees located in Switzerland is a funded contributory plan, while the plans that provide benefits to the Company’s employees located in Mexico, France, and Germany are unfunded and noncontributory. The assets of the Switzerland plan are held at an AA- rated insurance carrier who bears the pension risk and longevity risk, and will be used to cover the pension liability for the remaining retirees of the Swiss plan, as well as the remaining employees at that location. The liability and corresponding expense related to these benefit plans is based on actuarial computations of current and future benefits for employees.
- 81 -
INTEGER HOLDINGS CORPORATION
NOTES TO CONSOLIDATED FINANCIAL STATEMENTS
(9.) BENEFIT PLANS (Continued)
The Company’s fiscal year end dates are the measurement dates for its defined benefit plans. Information relating to the funding position of the Company’s defined benefit plans for fiscal years 2017 and 2016 were as follows (in thousands):
2017 | 2016 | ||||||
Change in projected benefit obligation: | |||||||
Projected benefit obligation at beginning of year | $ | 8,728 | $ | 7,992 | |||
Service cost | 464 | 431 | |||||
Interest cost | 162 | 174 | |||||
Plan participants’ contribution | 75 | 75 | |||||
Actuarial (gain) loss | (143 | ) | 341 | ||||
Benefits (paid) transferred in, net | (160 | ) | 84 | ||||
Foreign currency translation | 1,027 | (369 | ) | ||||
Projected benefit obligation at end of year | 10,153 | 8,728 | |||||
Change in fair value of plan assets: | |||||||
Fair value of plan assets at beginning of year | 1,172 | 871 | |||||
Employer contributions | 56 | 36 | |||||
Plan participants’ contributions | 75 | 75 | |||||
Actual loss on plan assets | — | (9 | ) | ||||
Benefits transferred in, net | — | 224 | |||||
Foreign currency translation | 55 | (25 | ) | ||||
Fair value of plan assets at end of year | 1,358 | 1,172 | |||||
Projected benefit obligation in excess of plan assets at end of year | $ | 8,795 | $ | 7,556 | |||
Defined benefit liability classified as other current liabilities | $ | 120 | $ | 109 | |||
Defined benefit liability classified as long-term liabilities | $ | 8,675 | $ | 7,447 | |||
Accumulated benefit obligation at end of year | $ | 8,322 | $ | 7,115 | |||
Amounts recognized in Accumulated Other Comprehensive Income (Loss) for fiscal years 2017 and 2016 are as follows (in thousands):
2017 | 2016 | ||||||
Net loss occurring during the year | $ | 20 | $ | 368 | |||
Amortization of losses | (63 | ) | (62 | ) | |||
Prior service cost | 1 | 1 | |||||
Amortization of prior service cost | (11 | ) | (11 | ) | |||
Pre-tax adjustment (gain) loss | (53 | ) | 296 | ||||
Taxes | (23 | ) | 283 | ||||
Net (gain) loss | $ | (76 | ) | $ | 579 | ||
The amortization of amounts in Accumulated Other Comprehensive Income (Loss) expected to be recognized as components of net periodic benefit expense during fiscal year 2018 are as follows (in thousands):
Amortization of net prior service cost | $ | 11 | |
Amortization of net loss | 43 | ||
- 82 -
INTEGER HOLDINGS CORPORATION
NOTES TO CONSOLIDATED FINANCIAL STATEMENTS
(9.) BENEFIT PLANS (Continued)
Net pension cost for fiscal years 2017 and 2016 is comprised of the following (in thousands):
2017 | 2016 | ||||||
Service cost | $ | 464 | $ | 431 | |||
Interest cost | 162 | 174 | |||||
Expected return on assets | (19 | ) | (18 | ) | |||
Recognized net actuarial loss | 72 | 72 | |||||
Net pension cost | $ | 679 | $ | 659 | |||
The weighted-average rates used in the actuarial valuations to determine the net pension cost for fiscal years 2017, 2016 and 2015 were as follows:
2017 | 2016 | 2015 | |||
Discount rate | 1.9% | 2.2% | 2.3% | ||
Salary growth | 2.9% | 2.9% | 3.0% | ||
Expected rate of return on assets | 1.5% | 2.0% | 2.3% | ||
The weighted-average rates used in the actuarial valuations to determine the projected benefit obligation for fiscal years 2017, 2016 and 2015 were as follows:
2017 | 2016 | 2015 | |||
Discount rate | 2.0% | 1.9% | 2.2% | ||
Salary growth | 2.9% | 2.9% | 2.9% | ||
Expected rate of return on assets | 1.3% | 1.5% | 2.0% | ||
The discount rate used is based on the yields of AA bonds with a duration matching the duration of the liabilities plus approximately 50 basis points to reflect the risk of investing in corporate bonds. The expected rate of return on plan assets reflects earnings expectations on existing plan assets.
The following table provides information by level for the defined benefit plan assets that are measured at fair value as of December 29, 2017 and December 30, 2016 (in thousands).
Fair Value | Quoted Prices in Active Markets (Level 1) | Significant Other Observable Inputs (Level 2) | Significant Unobservable Inputs (Level 3) | ||||||||||||
December 29, 2017 | |||||||||||||||
Insurance contract | $ | 1,358 | $ | — | $ | 1,358 | $ | — | |||||||
December 30, 2016 | |||||||||||||||
Insurance contract | $ | 1,172 | $ | — | $ | 1,172 | $ | — | |||||||
The fair value of Level 2 plan assets are obtained from quoted market prices in inactive markets or valuation models with observable market data inputs to estimate fair value. These observable market data inputs include benchmark yields, reported trades, broker/dealer quotes, issuer spreads, benchmark securities, bids, offers and reference data. Refer to Note 1 “Summary of Significant Accounting Policies” for discussion of the fair value measurement terms of Levels 1, 2, and 3.
Estimated benefit payments over for the next ten years as of December 29, 2017 are as follows (in thousands):
2018 | 2019 | 2020 | 2021 | 2022 | 2023-2027 | |||||||||||||
Estimated benefit payments | $ | 289 | 290 | 244 | 279 | 389 | 2,313 | |||||||||||
- 83 -
INTEGER HOLDINGS CORPORATION
NOTES TO CONSOLIDATED FINANCIAL STATEMENTS
(10.) STOCK-BASED COMPENSATION
Stock-based Compensation Plans
The Company maintains certain stock-based compensation plans that were approved by the Company’s stockholders and are administered by the Board of Directors, or the Compensation and Organization Committee of the Board. The stock-based compensation plans provide for the granting of stock options, shares of restricted stock awards, restricted stock units, stock appreciation rights and stock bonuses to employees, non-employee directors, consultants, and service providers.
The 2009 Stock Incentive Plan (“2009 Plan”), as amended, and 2011 Stock Incentive Plan (“2011 Plan”), as amended, each authorize the issuance of up to 1,350,000 shares of equity incentive awards and the 2016 Stock Incentive Plan (the “2016 Plan”) authorizes the issuance of up to 1,450,000 shares of equity incentive awards. The 2009 Plan limits the amount of restricted stock, restricted stock units and stock bonuses that may be awarded in the aggregate to 200,000 shares of the 1,350,000 shares authorized. Stock options remain outstanding under the 2005 Stock Incentive Plan, but the plan has been frozen to any new award issuances.
As of December 29, 2017, there were 917,567, 9,142 and 78,747 shares available for future grants under the 2016 Plan, 2011 Plan and 2009 Plan, respectively. Due to plan sub-limits, of the shares available for grant, less than 500 shares may be awarded under the 2009 Plan in the form of restricted stock, restricted stock units or stock bonuses.
In connection with the Spin-off, under the provisions of the 2009 Plan and 2011 Plan, employee stock options, restricted stock awards, and restricted stock unit awards were adjusted to preserve the fair value of the awards immediately before and after the Spin-off. As such, the Company did not record any modification expense related to the conversion of the awards. Certain awards granted to employees who transferred to Nuvectra in connection with the Spin-off were canceled. As required, the Company accelerated the remaining expense related to these canceled awards of $0.5 million during the first quarter of 2016, which was classified as Other Operating Expenses (“OOE”).
The Company recognized a net tax benefit from the exercise of stock options and vesting of restricted stock and restricted stock units of $1.9 million, $2.3 million and $5.6 million for 2017, 2016 and 2015, respectively. In 2017, this amount was recorded as a component of income tax expense. In 2016 and 2015, these amounts were recorded as increases in additional paid-in capital on the consolidated balance sheets and as cash from financing activities on the consolidated statements of cash flows.
Stock-based Compensation Expense
The components and classification of stock-based compensation expense for fiscal years 2017, 2016 and 2015 were as follows (in thousands):
2017 | 2016 | 2015 | |||||||||
Stock options | $ | 1,716 | $ | 2,499 | $ | 2,708 | |||||
RSAs and RSUs (time-based) | 5,324 | 1,991 | 2,027 | ||||||||
PRSUs | 7,640 | 3,918 | 4,641 | ||||||||
Total stock-based compensation expense | $ | 14,680 | $ | 8,408 | $ | 9,376 | |||||
Cost of sales | $ | 1,062 | $ | 332 | $ | 795 | |||||
SG&A | 10,623 | 6,246 | 7,510 | ||||||||
RD&E | 739 | 355 | 982 | ||||||||
OOE | 2,256 | 1,475 | 89 | ||||||||
Total stock-based compensation expense | $ | 14,680 | $ | 8,408 | $ | 9,376 | |||||
During the first quarter of 2017, the Company recorded $2.2 million of accelerated stock-based compensation expense in connection with the transition of its former Chief Executive Officer per the terms of his contract, which was classified as OOE.
- 84 -
INTEGER HOLDINGS CORPORATION
NOTES TO CONSOLIDATED FINANCIAL STATEMENTS
(10.) STOCK-BASED COMPENSATION (Continued)
Stock Options
The following table includes the weighted average grant date fair value of stock options granted to employees during fiscal years 2017, 2016 and 2015 and the related weighted average assumptions used in the Black-Scholes model:
2017 | 2016 | 2015 | |||||||||
Weighted average fair value of options granted | $ | 12.86 | $ | 8.52 | $ | 12.18 | |||||
Assumptions: | |||||||||||
Expected term (in years) | 4.5 | 4.7 | 4.7 | ||||||||
Risk-free interest rate | 1.77 | % | 1.49 | % | 1.55 | % | |||||
Expected volatility | 37 | % | 27 | % | 26 | % | |||||
Expected dividend yield | 0 | % | 0 | % | 0 | % | |||||
The following table summarizes stock option activity during the fiscal year ended December 29, 2017:
Number of Stock Options | Weighted Average Exercise Price | Weighted Average Remaining Contractual Term (in years) | Aggregate Intrinsic Value (in millions) | |||||||||
Outstanding at December 30, 2016 | 1,739,972 | $ | 28.26 | |||||||||
Granted | 125,020 | 38.78 | ||||||||||
Exercised | (804,064 | ) | 24.03 | |||||||||
Forfeited or expired | (129,575 | ) | 45.74 | |||||||||
Outstanding at December 29, 2017 | 931,353 | $ | 30.89 | 6.2 | $ | 13.9 | ||||||
Vested and expected to vest at December 29, 2017 | 931,353 | $ | 30.89 | 6.2 | $ | 13.9 | ||||||
Exercisable at December 29, 2017 | 798,311 | $ | 30.13 | 5.8 | $ | 12.5 | ||||||
Intrinsic value is calculated for in-the-money options (exercise price less than market price) as the difference between the market price of the Company’s common shares as of December 29, 2017 ($45.30) and the weighted average exercise price of the underlying stock options, multiplied by the number of options outstanding and/or exercisable. As of December 29, 2017, $1.2 million of unrecognized compensation cost related to non-vested stock options is expected to be recognized over a weighted-average period of 1.8 years. Shares are distributed from the Company’s authorized but unissued reserve upon the exercise of stock options.
The following table provides certain information relating to the exercise of stock options during fiscal years 2017, 2016 and 2015 (in thousands):
2017 | 2016 | 2015 | |||||||||
Intrinsic value | $ | 13,928 | $ | 690 | $ | 8,231 | |||||
Cash received | 19,324 | 2,821 | 6,583 | ||||||||
- 85 -
INTEGER HOLDINGS CORPORATION
NOTES TO CONSOLIDATED FINANCIAL STATEMENTS
(10.) STOCK-BASED COMPENSATION (Continued)
Restricted Stock Awards and Restricted Stock Units
The following table summarizes time-vested RSA and RSU activity during the fiscal year ended December 29, 2017:
Time-Vested Restricted Stock Units and Awards | Weighted Average Grant Date Fair Value | |||||
Nonvested at December 30, 2016 | 39,394 | $ | 45.51 | |||
Granted | 309,107 | 34.18 | ||||
Vested | (148,299 | ) | 34.28 | |||
Forfeited | (36,771 | ) | 38.03 | |||
Nonvested at December 29, 2017 | 163,431 | $ | 35.96 | |||
As of December 29, 2017, there was $5.1 million of total unrecognized compensation cost related to time-based RSAs and RSUs, which is expected to be recognized over a weighted-average period of approximately 2.0 years. The fair value of RSA and RSU shares vested in 2017, 2016 and 2015 was $6.4 million, $1.3 million and $3.0 million, respectively. The weighted average grant date fair value of RSAs and RSUs granted during fiscal years 2017, 2016 and 2015 was $34.18, $47.95 and $49.84, respectively.
Performance-Based Shares
The following table summarizes the maximum number of PRSUs which could be earned and related activity during the fiscal year ended December 29, 2017:
Performance- Vested Restricted Stock Units and Awards | Weighted Average Grant Date Fair Value | |||||
Nonvested at December 30, 2016 | 356,586 | $ | 31.87 | |||
Granted | 419,112 | 31.62 | ||||
Forfeited | (305,809 | ) | 30.77 | |||
Nonvested at December 29, 2017 | 469,889 | $ | 32.37 | |||
For the Company's PRSUs, in addition to service conditions, the ultimate number of shares to be earned depends on the achievement of financial performance or market-based conditions. The financial performance conditions are based on the Company's AOI and adjusted EBITDA targets. The market condition is based on the Company’s achievement of a relative total shareholder return performance requirement, on a percentile basis, compared to a defined group of peer companies over two and three year performance periods.
Compensation expense for the PRSUs is initially estimated based on target performance and adjusted as appropriate throughout the performance period. At December 29, 2017, there was $2.6 million of total unrecognized compensation cost related to unvested PRSUs, which is expected to be recognized over a weighted-average period of approximately 1.4 years. The fair value of PRSU shares vested in 2016 and 2015 was $10.5 million and $13.1 million, respectively. The weighted average grant date fair value of PRSUs granted during fiscal years 2017, 2016 and 2015 was $31.62, $30.83 and $32.92, respectively.
The grant-date fair value of the market-based portion of the PRSUs granted during fiscal year 2017 was determined using the Monte Carlo simulation model on the date of grant, assuming the following (i) expected term of 1.84 years, (ii) risk free interest rate of 1.14%, (iii) expected dividend yield of 0.0% and (iv) expected stock price volatility over the expected term of the award of 48%.
- 86 -
INTEGER HOLDINGS CORPORATION
NOTES TO CONSOLIDATED FINANCIAL STATEMENTS
(11.) OTHER OPERATING EXPENSES
OOE for fiscal years 2017, 2016 and 2015 is comprised of the following (in thousands):
2017 | 2016 | 2015 | |||||||||
Consolidation and optimization initiatives | $ | 13,349 | $ | 26,490 | $ | 26,393 | |||||
Acquisition and integration costs | 10,870 | 28,316 | 33,449 | ||||||||
Asset dispositions, severance and other | 7,182 | 6,931 | 6,622 | ||||||||
Strategic reorganization and alignment | 5,891 | — | — | ||||||||
Total other operating expenses | $ | 37,292 | $ | 61,737 | $ | 66,464 | |||||
Consolidation and optimization initiatives
Manufacturing alignment to support growth - In 2017, the Company initiated several initiatives designed to reduce costs, improve operating efficiencies and increase manufacturing capacity to accommodate growth. The plan involves the relocation of certain manufacturing operations and expansion of certain of the Company's facilities. The Company estimates that it will incur aggregate pre-tax restructuring related charges in connection with the realignment plan of between approximately $9 million to $11 million, the majority of which are expected to be cash expenditures, and capital expenditures of between approximately $4 million to $6 million. Total expense of $0.3 million has been incurred for this initiative through December 29, 2017. These actions are expected to be substantially completed by the end of 2019.
LRM consolidations - In 2014, LRM initiated plans to close its Arvada, CO site, consolidate its two Galway, Ireland sites into one facility, and other restructuring actions that will result in a reduction in staff across manufacturing and administrative functions at certain locations. This initiative was substantially completed in 2016. During the third quarter of 2016, the Company announced the planned closure of its Clarence, NY facility. The machined component product lines manufactured in this facility are being transferred to other Integer locations in the U.S. Total expense expected to be incurred for these initiatives are between $18 million and $22 million, of which $16.3 million has been incurred through December 29, 2017. The total capital investment expected to be incurred for these initiatives is between $5 million and $6 million, of which $3.2 million has been expended through December 29, 2017. This project is expected to be completed by the end of the first quarter of 2018.
Investments in capacity and capabilities - In 2014, the Company initiated plans to transfer the manufacture of catheters and introducers performed at its facility in Plymouth, MN into the Company’s existing facility in Tijuana, Mexico. Additionally, functions performed at the Company’s facilities in Beaverton, OR and Raynham, MA to manufacture products for the portable medical market were transferred to a new facility in Tijuana, Mexico. Total restructuring expense and capital expenditures incurred through December 29, 2017 in connection with these initiatives were $55.8 million and $23.4 million, respectively. These initiatives were substantially completed in 2017 and the Company does not expect to incur any material additional costs associated with these initiatives.
Other consolidation and optimization initiatives - During 2013, the Company began a project to expand its Chaumont, France facility in order to enhance its capabilities and fulfill larger volume customer supply agreements. Total expense incurred during the 2017 fiscal year for this project was $0.6 million. This initiative was completed in 2017.
Costs related to the Company’s consolidation and optimization initiatives were primarily recorded within the Medical Segment. The change in accrued liabilities related to consolidation and optimization initiatives is as follows (in thousands):
Severance and Retention | Accelerated Depreciation/ Asset Write-offs | Other | Total | ||||||||||||
December 30, 2016 | $ | 795 | $ | — | $ | 402 | $ | 1,197 | |||||||
Restructuring charges | 1,781 | — | 11,568 | 13,349 | |||||||||||
Cash payments | (1,268 | ) | — | (11,970 | ) | (13,238 | ) | ||||||||
December 29, 2017 | $ | 1,308 | $ | — | $ | — | $ | 1,308 | |||||||
Other expenses include costs to relocate certain equipment and personnel, duplicate personnel costs, excess overhead, disposal, moving, revalidation, personnel, training, consulting, and travel costs associated with these consolidation projects.
- 87 -
INTEGER HOLDINGS CORPORATION
NOTES TO CONSOLIDATED FINANCIAL STATEMENTS
(11.) OTHER OPERATING EXPENSES (Continued)
Acquisition and integration costs
Acquisition and integration costs are predominantly related to the acquisition of LRM and primarily include professional, consulting, severance, retention, relocation, and travel costs. For fiscal years 2016 and 2015, expenses also consisted of transaction costs including change-in-control payments to former LRM executives. As of December 29, 2017 and December 30, 2016, $0.4 million and $4.5 million, respectively, of acquisition and integration costs related to the LRM acquisition were accrued. Total integration expense and capital expenditures incurred through December 29, 2017 in connection with the LRM acquisition were $43.5 million and $11.9 million, respectively. The Company does not expect to incur any material additional costs associated with these activities as they were substantially completed in 2017.
Asset dispositions, severance and other
During 2017, 2016 and 2015, the Company recorded losses in connection with various asset disposals and/or write-downs. The 2017 amount also includes approximately $5.3 million in expense related to the Company’s leadership transitions, which were recorded within the corporate unallocated segment. In addition, during 2016 and 2015, the Company incurred legal and professional costs in connection with the Spin-off of $4.4 million and $6.0 million, respectively. Total transaction related costs incurred for the Spin-off since inception were $10.4 million. Expenses related to the Spin-off were primarily recorded within the corporate unallocated and the Medical segment. These activities were substantially completed in 2017. Refer to Note 2 “Divestiture and Acquisition” for additional information on the Spin-off.
Strategic reorganization and alignment
As a result of the Company’s strategic review of its markets, customers and competitors during the fourth quarter of 2017, the Company began to take steps to better align its resources in order to enhance the profitability of its portfolio of products. This includes improving its business processes and redirecting investments away from projects where the market does not justify the investment, as well as aligning resources with market conditions and the Company’s future strategic direction. The Company estimates that it will incur aggregate pre-tax charges in connection with the strategic reorganization and alignment plan of between approximately $10 million to $12 million, of which an estimated $8 million to $12 million are expected to result in cash outlays. In 2017, the Company incurred charges related to the initial steps of this initiative, which primarily included lease termination charges and accelerated amortization of intangible assets. These expenses were primarily recorded within corporate unallocated expenses. These actions are expected to be substantially completed by the end of the second quarter of 2018.
- 88 -
INTEGER HOLDINGS CORPORATION
NOTES TO CONSOLIDATED FINANCIAL STATEMENTS
(12.) INCOME TAXES
On December 22, 2017, the Tax Reform Act was signed into law. This legislation significantly changes U.S. tax law by, among other things, lowering corporate income tax rates, implementing a territorial tax system and imposing a repatriation tax on deemed repatriated earnings of foreign subsidiaries. The Tax Reform Act permanently reduces the U.S. corporate income tax rate from a maximum of 35% to a flat 21% rate, effective January 1, 2018.
Deferred tax assets and liabilities are measured using enacted tax rates expected to apply to taxable income in the years in which those temporary differences are expected to reverse. As a result of the reduction in the U.S. corporate income tax rate from 35% to 21% under the Tax Reform Act, the Company revalued its ending net deferred tax liabilities at December 29, 2017 and recognized a $56.5 million tax benefit in the Company’s Consolidated Statements of Operations and Comprehensive Income (Loss) for the year ended December 29, 2017.
The Tax Reform Act provided for a one-time deemed mandatory repatriation of post-1986 undistributed foreign subsidiary earnings and profits (“E&P”) through the year ended December 29, 2017. The Company had an estimated $147.5 million of undistributed foreign E&P subject to the deemed mandatory repatriation and recognized a provisional $14.7 million of income tax expense in the Company’s Consolidated Statement of Operations and Comprehensive Income (Loss) for the year ended December 29, 2017. The Company has sufficient U.S. net operating losses to offset cash tax liabilities associated with this repatriation tax.
While the Tax Reform Act provides for a territorial tax system, beginning in 2018, it also includes two new U.S. tax base erosion provisions - the global intangible low-taxed income (“GILTI”) provisions and the base-erosion and anti-abuse tax (“BEAT”) provisions.
The GILTI provisions require the Company to include foreign subsidiary earnings in excess of a deemed return on the foreign subsidiary’s tangible assets in its U.S. income tax return. The Company expects that it will be subject to incremental U.S. tax on GILTI income beginning in 2018. Because of the complexity of the new GILTI tax rules, the Company continues to evaluate this provision of the Tax Reform Act and the application of ASC 740, Income Taxes. Under GAAP, the Company is allowed to make an accounting policy choice of either (1) treating taxes due on future U.S. inclusions in taxable income related to GILTI as a current-period expense when incurred (the “period cost method”) or (2) factoring such amounts into the Company's measurement of its deferred taxes (the “deferred method”). The Company's selection of an accounting policy with respect to the new GILTI tax rules will depend, in part, on analyzing its global income to determine whether it expects to have future U.S. inclusions in taxable income related to GILTI and, if so, what the impact is expected to be. Whether the Company expects to have future U.S. inclusions in taxable income related to GILTI depends on not only the Company's current structure and estimated future results of global operations, but also its intent and ability to modify its structure. The Company is currently in the process of analyzing its structure and has not made any adjustments related to potential GILTI tax in its consolidated financial statements and has not made a policy decision regarding whether to record deferred tax on GILTI.
The BEAT provisions in the Tax Reform Act eliminate the deduction of certain base-erosion payments made to related foreign corporations, and impose a minimum tax if greater than regular tax. The Company does not expect to be materially impacted by the BEAT provisions, however, it is still in the process of analyzing the effect of this provision of the Tax Reform Act. The Company has not included any tax impact of BEAT in its consolidated financial statements for the year ended December 29, 2017.
On December 22, 2017, the Securities and Exchange Commission issued Staff Accounting Bulletin (“SAB”) No. 118 to address the application of GAAP in situations when a registrant does not have the necessary information available, prepared, or analyzed (including computations) in reasonable detail to complete the accounting for certain income tax effects of the Tax Reform Act. The Company has recognized the tax impact of the revaluation of deferred tax assets and liabilities and the provisional tax impacts related to deemed repatriated earnings and included these amounts in its consolidated financial statements for the year ended December 29, 2017. The ultimate impact may differ from the provisional amounts, possibly materially, due to, among other things, additional analysis, changes in interpretations and assumptions the Company has made, additional regulatory guidance that may be issued, and actions the Company may take as a result of the Tax Reform Act. The accounting is expected to be complete when the Company’s 2017 U.S. corporate income tax return is filed in 2018.
- 89 -
INTEGER HOLDINGS CORPORATION
NOTES TO CONSOLIDATED FINANCIAL STATEMENTS
(12.) INCOME TAXES (Continued)
The U.S. and international components of income (loss) before benefit for income taxes for fiscal years 2017, 2016 and 2015 were as follows (in thousands):
2017 | 2016 | 2015 | |||||||||
U.S. | $ | (46,459 | ) | $ | (52,446 | ) | $ | (42,166 | ) | ||
International | 68,286 | 53,631 | 26,466 | ||||||||
Total income (loss) before benefit for income taxes | $ | 21,827 | $ | 1,185 | $ | (15,700 | ) | ||||
The benefit for income taxes for fiscal years 2017, 2016 and 2015 was comprised of the following (in thousands):
2017 | 2016 | 2015 | |||||||||
Current: | |||||||||||
Federal | $ | (1,558 | ) | $ | (8,327 | ) | $ | (3,753 | ) | ||
State | (29 | ) | 149 | (367 | ) | ||||||
International | 15,947 | 10,752 | 6,312 | ||||||||
14,360 | 2,574 | 2,192 | |||||||||
Deferred: | |||||||||||
Federal | (58,924 | ) | (4,952 | ) | (8,144 | ) | |||||
State | (788 | ) | (638 | ) | (880 | ) | |||||
International | 500 | (1,760 | ) | (1,274 | ) | ||||||
(59,212 | ) | (7,350 | ) | (10,298 | ) | ||||||
Total benefit for income taxes | $ | (44,852 | ) | $ | (4,776 | ) | $ | (8,106 | ) | ||
The benefit for income taxes differs from the U.S. statutory rate for fiscal years 2017, 2016 and 2015 due to the following:
2017 | 2016 | 2015 | |||||||||||||||
Statutory rate | $ | 7,639 | 35.0 | % | $ | 415 | 35.0 | % | $ | (5,495 | ) | 35.0 | % | ||||
Federal tax credits | (1,896 | ) | (8.7 | ) | (1,792 | ) | (151.2 | ) | (1,850 | ) | 11.8 | ||||||
Foreign rate differential | (11,125 | ) | (50.9 | ) | (7,086 | ) | (598.0 | ) | (3,180 | ) | 20.2 | ||||||
Uncertain tax positions | 3,517 | 16.1 | 1,724 | 145.5 | (531 | ) | 3.4 | ||||||||||
State taxes, net of federal benefit | (864 | ) | (4.0 | ) | (1,068 | ) | (90.1 | ) | (1,490 | ) | 9.5 | ||||||
Non-deductible transaction costs | — | — | 1,012 | 85.4 | 4,867 | (31.0 | ) | ||||||||||
Valuation allowance | 1,030 | 4.7 | 1,340 | 113.1 | 626 | (4.0 | ) | ||||||||||
Change in tax rates | (56,453 | ) | (258.6 | ) | (270 | ) | (22.8 | ) | (91 | ) | 0.6 | ||||||
U.S. Tax Reform - Toll charge on unremitted earnings | 14,719 | 67.4 | — | — | — | — | |||||||||||
Change in unremitted earnings assertion | 2,340 | 10.7 | — | — | — | — | |||||||||||
Change in tax law (Internal Revenue Code §987) | — | — | 2,630 | 221.9 | — | — | |||||||||||
Other | (3,759 | ) | (17.2 | ) | (1,681 | ) | (141.8 | ) | (962 | ) | 6.1 | ||||||
Effective tax rate | $ | (44,852 | ) | (205.5 | )% | $ | (4,776 | ) | (403.0 | )% | $ | (8,106 | ) | 51.6 | % | ||
The difference between the Company’s effective tax rate and the U.S. federal statutory income tax rate in the current year is primarily attributable to the components of Tax Reform Act as well as the Company’s overall lower effective tax rate in the foreign jurisdictions in which it operates and where its foreign earnings are derived, including Switzerland, Mexico, Germany, Uruguay, and Ireland. In addition, the Company currently has a tax holiday in Malaysia through April 2018, with a potential extension through April 2023 if certain conditions are met.
- 90 -
INTEGER HOLDINGS CORPORATION
NOTES TO CONSOLIDATED FINANCIAL STATEMENTS
(12.) INCOME TAXES (Continued)
Difference Attributable to Foreign Investments. As a result of the deemed mandatory repatriation of earnings of foreign subsidiaries provisions in the Tax Reform Act, the Company included an estimated $147.5 million of undistributed earnings of foreign subsidiaries in income subject to U.S. tax at reduced tax rates. In addition to the provisional $14.7 million of income tax expense recorded on the deemed mandatory repatriation, the Company recorded an additional $2.3 million in deferred taxes associated with foreign withholding taxes in accordance with the change in its permanent reinvestment assertion related to the undistributed earnings subject to the deemed mandatory repatriation provisions.
Prospectively, the Company intends to limit its distributions to previously taxed income. If distributions are made utilizing current period earnings, the Company will record foreign withholding taxes in the period of the distribution.
Deferred tax assets (liabilities) consist of the following (in thousands):
December 29, 2017 | December 30, 2016 | ||||||
Net operating loss carryforwards | $ | 107,005 | $ | 154,706 | |||
Tax credit carryforwards | 28,215 | 24,646 | |||||
Inventories | 4,956 | 7,524 | |||||
Accrued expenses | 3,815 | 5,724 | |||||
Stock-based compensation | 5,531 | 10,614 | |||||
Other | — | 936 | |||||
Gross deferred tax assets | 149,522 | 204,150 | |||||
Less valuation allowance | (36,480 | ) | (35,391 | ) | |||
Net deferred tax assets | 113,042 | 168,759 | |||||
Property, plant and equipment | (27,547 | ) | (33,069 | ) | |||
Intangible assets | (219,576 | ) | (337,722 | ) | |||
Convertible subordinated notes | (806 | ) | (2,577 | ) | |||
Other | (6,325 | ) | — | ||||
Gross deferred tax liabilities | (254,254 | ) | (373,368 | ) | |||
Net deferred tax liability | $ | (141,212 | ) | $ | (204,609 | ) | |
Presented as follows: | |||||||
Noncurrent deferred tax asset | $ | 4,152 | $ | 3,970 | |||
Noncurrent deferred tax liability | (145,364 | ) | (208,579 | ) | |||
Net deferred tax liability | $ | (141,212 | ) | $ | (204,609 | ) | |
As of December 29, 2017, the Company has the following carryforwards available:
Jurisdiction | Tax Attribute | Amount (in millions) | Begin to Expire | |||||
U.S. Federal | Net operating loss | $ | 415.9 | 2019 | ||||
U.S. State | Net operating loss | 227.3 | 2018 | |||||
International | Net operating loss | 37.4 | 2018 | |||||
U.S. Federal | Foreign tax credit | 17.0 | 2019 | |||||
U.S. Federal and State | R&D tax credit | 7.2 | 2018 | |||||
U.S. State | Investment tax credit | 6.3 | 2018 | |||||
Net operating losses are presented as pre-tax amounts.
- 91 -
INTEGER HOLDINGS CORPORATION
NOTES TO CONSOLIDATED FINANCIAL STATEMENTS
(12.) INCOME TAXES (Continued)
Certain U.S. tax attributes are subject to limitations of Internal Revenue Code §382, which in general provides that utilization is subject to an annual limitation if an ownership change results from transactions increasing the ownership of certain shareholders or public groups in stock of a corporation by more than 50 percentage points over a three-year period. Such an ownership change occurred upon the consummation of the acquisition of LRM. The Company does not anticipate that these limitations will affect utilization of these carryforwards prior to their expiration.
The Company’s federal net operating loss carryforward and certain other federal tax credits reported on its income tax returns included uncertain tax positions taken in prior years. Due to the application of the accounting for uncertain tax positions, the actual tax attributes are larger than the tax amounts for which a deferred tax asset is recognized for financial statement purposes.
In assessing the realizability of deferred tax assets, management considers, within each taxing jurisdiction, whether it is more likely than not that some portion or all of the deferred tax assets will not be realized. Management considers the scheduled reversal of deferred tax liabilities, projected future taxable income and tax planning strategies in making this assessment. Based on the consideration of the weight of both positive and negative evidence, management has determined that a portion of the deferred tax assets as of December 29, 2017 and December 30, 2016 related to certain foreign tax credits, state investment tax credits, and foreign and state net operating losses will not be realized.
The Company files annual income tax returns in the U.S., various state and local jurisdictions, and in various foreign jurisdictions. A number of years may elapse before an uncertain tax position, for which the Company has unrecognized tax benefits, is examined and finally settled. While it is often difficult to predict the final outcome or the timing of resolution of any particular uncertain tax position, the Company believes that its unrecognized tax benefits reflect the most probable outcome. The Company adjusts these unrecognized tax benefits, as well as the related interest, in light of changing facts and circumstances. The resolution of an uncertain tax position, if recognized, would be recorded as an adjustment to the Provision (Benefit) for Income Taxes and the effective tax rate in the period of resolution.
Below is a summary of changes to the unrecognized tax benefit for fiscal years 2017, 2016 and 2015 (in thousands):
2017 | 2016 | 2015 | |||||||||
Balance, beginning of year | $ | 10,561 | $ | 9,271 | $ | 2,411 | |||||
Additions based upon tax positions related to the current year | 3,833 | 1,450 | 274 | ||||||||
Reductions as a result of a lapse of applicable statute of limitations | (510 | ) | — | (470 | ) | ||||||
Revaluation due to change in tax rate (Tax Reform Act) | (1,782 | ) | — | — | |||||||
Additions (reductions) related to prior period tax returns | (14 | ) | 240 | 163 | |||||||
Reductions (additions) relating to business combinations | — | (400 | ) | 7,443 | |||||||
Reductions relating to settlements with tax authorities | — | — | (550 | ) | |||||||
Balance, end of year | $ | 12,088 | $ | 10,561 | $ | 9,271 | |||||
Integer and its subsidiaries file income tax returns in the U.S. federal jurisdiction and various state and foreign jurisdictions. The tax years that remain open and subject to tax audits varies depending on the tax jurisdiction. The Internal Revenue Service finalized an audit of the 2012 and 2013 U.S. Federal income tax returns of the Company in the first quarter of 2015. The impact to the income tax expense was not material. The U.S. subsidiaries of the Company are still subject to a U.S. federal examination for the taxable years 2014 - 2017. The U.S. subsidiaries of the former LRM are still subject to U.S. federal, state, and local examinations for the taxable years 2006 to 2014.
It is reasonably possible that a reduction of approximately $1.1 million of the balance of unrecognized tax benefits may occur within the next twelve months as a result of the lapse of the statute of limitations and/or audit settlements. As of December 29, 2017, approximately $11.8 million of unrecognized tax benefits would favorably impact the effective tax rate (net of federal impact on state issues), if recognized.
The Company recognizes interest related to unrecognized tax benefits as a component of Provision (Benefit) for Income Taxes on the Consolidated Statements of Operations and Comprehensive Income (Loss). During 2017, 2016 and 2015, the recorded amounts for interest and penalties, respectively, were not significant.
- 92 -
INTEGER HOLDINGS CORPORATION
NOTES TO CONSOLIDATED FINANCIAL STATEMENTS
(13.) COMMITMENTS AND CONTINGENCIES
Litigation
In April 2013, the Company commenced an action against AVX Corporation and AVX Filters Corporation (collectively “AVX”) alleging that AVX had infringed on the Company’s patents by manufacturing and selling filtered feedthrough assemblies used in implantable pacemakers and cardioverter defibrillators that incorporate the Company’s patented technology. On January 26, 2016, a jury in the U.S. District Court for the District of Delaware returned a verdict finding that AVX infringed on two of the Company’s patents and awarded the Company $37.5 million in damages. On August 10, 2017, a second jury found that AVX infringed an additional Integer patent. That matter is subject to post-trial proceedings. The Company has recorded no gains in connection with this litigation as no cash has been received.
The Company is a party to various other legal actions arising in the normal course of business. The Company does not expect that the ultimate resolution of any other pending legal actions will have a material effect on its consolidated results of operations, financial position, or cash flows. However, litigation is subject to inherent uncertainties. As such, there can be no assurance that any pending legal action, which the Company currently believes to be immaterial, will not become material in the future.
Environmental Matters
The Company’s Collegeville, PA facility, which was acquired as part of the LRM acquisition, is subject to an administrative consent order entered into with the U.S. Environmental Protection Agency (the “EPA”), that requires ongoing groundwater treatment and monitoring at the site as a result of leaks from underground storage tanks. Upon approval by the EPA of the Company’s proposed post remediation care plan, which requires a continuation of the groundwater treatment and monitoring process at the site, the Company expects that the consent order will be terminated. The Company believes a decision from the EPA on whether the Company’s post remediation care plan has been approved and the consent order removed will be made by the end of 2018. The Company does not expect this environmental matter will have a material effect on its consolidated results of operations, financial position or cash flows.
In January 2015, LRM was notified by the New Jersey Department of Environmental Protection (“NJDEP”) of NJDEP’s intent to revoke a no further action determination made by NJDEP in favor of LRM in 2002 pertaining to a property on which a subsidiary of LRM operated a manufacturing facility in South Plainfield, New Jersey beginning in 1971. LRM sold the property in 2004 and vacated the facility in 2007. In response to NJDEP’s notice, the Company further investigated the matter and submitted a technical report to NJDEP in August of 2015 that concluded that NJDEP’s notice of intent to revoke was unwarranted. After reviewing the Company’s technical report, NJDEP issued a draft response in May 2016, stating that NJDEP would not revoke the no further action determination at that time, but would require some additional site investigation to support the Company’s conclusion. The Company met with NJDEP representatives to discuss the appropriate scope of the requested additional investigation, and it has begun that work. The Company does not expect this environmental matter will have a material effect on its consolidated results of operations, financial position or cash flows.
As of December 29, 2017 and December 30, 2016, there was $1.0 million recorded in Other Long-Term Liabilities in the Consolidated Balance Sheets in connection with these environmental matters.
License Agreements
The Company is a party to various license agreements for technology that is utilized in certain of its products. The most significant of these agreements are the licenses for basic technology used in the production of wet tantalum capacitors, filtered feedthroughs and MRI compatible lead systems. Expenses related to license agreements were $2.0 million, $2.0 million, and $2.4 million, for 2017, 2016 and 2015, respectively, and are primarily included in Cost of Sales.
Product Warranties
The Company generally warrants that its products will meet customer specifications and will be free from defects in materials and workmanship. The change in product warranty liability for fiscal years 2017 and 2016 was comprised of the following (in thousands):
2017 | 2016 | ||||||
Beginning balance | $ | 3,911 | $ | 3,316 | |||
Additions to warranty reserve, net of reversals | 3,449 | 3,238 | |||||
Warranty claims settled | (2,615 | ) | (2,643 | ) | |||
Ending balance | $ | 4,745 | $ | 3,911 | |||
- 93 -
INTEGER HOLDINGS CORPORATION
NOTES TO CONSOLIDATED FINANCIAL STATEMENTS
(13.) COMMITMENTS AND CONTINGENCIES (Continued)
Operating Leases
The Company is a party to various operating lease agreements for buildings, machinery, equipment and software. The Company primarily leases buildings, which accounts for the majority of the future lease payments. Lease expense includes the effect of escalation clauses and leasehold improvement incentives which are accounted for ratably over the lease term. Operating lease expense for fiscal years 2017, 2016 and 2015 was as follows (in thousands):
2017 | 2016 | 2015 | |||||||||
Operating lease expense | $ | 17,513 | $ | 15,357 | $ | 6,516 | |||||
At December 29, 2017, the Company had the following future minimum lease payments under non-cancelable operating leases (in thousands):
2018 | 2019 | 2020 | 2021 | 2022 | After 2022 | |||||||||||||
Future minimum lease payments | $ | 12,815 | 11,468 | 8,912 | 7,798 | 5,512 | 18,043 | |||||||||||
Self-Insurance Liabilities
As of December 29, 2017, and at various times in the past, the Company self-funded its workers' compensation and employee medical and dental expenses. The Company has established reserves to cover these self-insured liabilities and also maintains stop-loss insurance to limit its exposures under these programs. Claims reserves represent accruals for the estimated uninsured portion of reported claims, including adverse development of reported claims, as well as estimates of incurred but not reported claims. Claims incurred but not reported are estimated based on the Company’s historical experience, which is continually monitored, and accruals are adjusted when warranted by changes in facts and circumstances. The Company’s actual experience may be different than its estimates, sometimes significantly. Changes in assumptions, as well as changes in actual experience could cause these estimates to change. Insurance and claims expense will vary from period to period based on the severity and frequency of claims incurred in a given period. The Company’s self-insurance reserves totaled $7.6 million and $7.7 million as of December 29, 2017 and December 30, 2016, respectively. These accruals are recorded in Accrued Expenses and Other Long-Term Liabilities in the Consolidated Balance Sheets.
Foreign Currency Contracts
The Company enters into foreign currency forward contracts to hedge exposure to foreign currency exchange rate fluctuations in its international operations. In connection with the LRM acquisition, the Company terminated its outstanding forward contracts resulting in a $2.4 million payment to the foreign currency contract counterparty during 2015. As of the date the contracts were terminated, the Company had $1.6 million recorded in Accumulated Other Comprehensive Income (Loss) related to these contracts. This amount was fully amortized to Cost of Sales during 2016 as the inventory, which the contracts were hedging the cash flows to produce, was sold.
The impact to the Company’s results of operations from its forward contracts for fiscal years 2017, 2016 and 2015 was as follows (in thousands):
2017 | 2016 | 2015 | |||||||||
Increase in sales | $ | 1,327 | $ | — | $ | — | |||||
Increase in cost of sales | 84 | 3,516 | 1,948 | ||||||||
Ineffective portion of change in fair value | — | — | — | ||||||||
Information regarding outstanding foreign currency contracts designated as cash flow hedges as of December 29, 2017 is as follows (dollars in thousands):
Aggregate Notional Amount | Start Date | End Date | $/Foreign Currency | Fair Value | Balance Sheet Location | |||||||||||
$ | 4,625 | Jan 2018 | Jun 2018 | 0.0514 | Peso | $ | (127 | ) | Accrued Expenses | |||||||
30,398 | Jan 2018 | Dec 2018 | 0.0507 | Peso | (879 | ) | Accrued Expenses | |||||||||
30,344 | Jan 2018 | Dec 2018 | 1.2089 | Euro | 145 | Accrued Expenses | ||||||||||
- 94 -
(14.) EARNINGS (LOSS) PER SHARE
The following table illustrates the calculation of Basic and Diluted EPS for fiscal years 2017, 2016 and 2015 (in thousands, except per share amounts):
2017 | 2016 | 2015 | |||||||||
Numerator: | |||||||||||
Net income (loss) | $ | 66,679 | $ | 5,961 | $ | (7,594 | ) | ||||
Denominator for basic EPS: | |||||||||||
Weighted average shares outstanding | 31,402 | 30,778 | 26,363 | ||||||||
Effect of dilutive securities: | |||||||||||
Stock options, restricted stock and restricted stock units | 486 | 195 | — | ||||||||
Denominator for diluted EPS | 31,888 | 30,973 | 26,363 | ||||||||
Basic EPS | $ | 2.12 | $ | 0.19 | $ | (0.29 | ) | ||||
Diluted EPS | $ | 2.09 | $ | 0.19 | $ | (0.29 | ) | ||||
The diluted weighted average share calculations do not include the following securities for fiscal years 2017, 2016 and 2015, which are not dilutive to the EPS calculations or the performance criteria have not been met (in thousands):
2017 | 2016 | 2015 | ||||||
Time-vested stock options, restricted stock and restricted stock units | 676 | 657 | 1,718 | |||||
Performance-vested stock options and restricted stock units | 285 | 357 | 578 | |||||
- 95 -
INTEGER HOLDINGS CORPORATION
NOTES TO CONSOLIDATED FINANCIAL STATEMENTS
(15.) ACCUMULATED OTHER COMPREHENSIVE INCOME (LOSS)
Accumulated Other Comprehensive Income (Loss) is comprised of the following (in thousands):
Defined Benefit Plan Liability | Cash Flow Hedges | Foreign Currency Translation Adjustment | Total Pre-Tax Amount | Tax | Net-of-Tax Amount | ||||||||||||||||||
December 30, 2016 | $ | (1,475 | ) | $ | 1,420 | $ | (15,660 | ) | $ | (15,715 | ) | $ | (285 | ) | $ | (16,000 | ) | ||||||
Unrealized gain on cash flow hedges | — | 3,707 | — | 3,707 | (353 | ) | 3,354 | ||||||||||||||||
Realized gain on foreign currency hedges | — | (1,243 | ) | — | (1,243 | ) | 435 | (808 | ) | ||||||||||||||
Realized gain on interest rate swap hedges | — | (466 | ) | — | (466 | ) | 163 | (303 | ) | ||||||||||||||
Net defined benefit plan adjustments | 53 | — | — | 53 | 23 | 76 | |||||||||||||||||
Foreign currency translation gain | — | — | 65,860 | 65,860 | — | 65,860 | |||||||||||||||||
December 29, 2017 | $ | (1,422 | ) | $ | 3,418 | $ | 50,200 | $ | 52,196 | $ | (17 | ) | $ | 52,179 | |||||||||
Defined Benefit Plan Liability | Cash Flow Hedges | Foreign Currency Translation Adjustment | Total Pre-Tax Amount | Tax | Net-of-Tax Amount | ||||||||||||||||||
January 1, 2016 | $ | (1,179 | ) | $ | (2,392 | ) | $ | 3,609 | $ | 38 | $ | 1,332 | $ | 1,370 | |||||||||
Unrealized gain on cash flow hedges | — | 210 | — | 210 | (73 | ) | 137 | ||||||||||||||||
Realized loss on foreign currency hedges | — | 3,516 | — | 3,516 | (1,231 | ) | 2,285 | ||||||||||||||||
Realized loss on interest rate swap hedges | — | 86 | — | 86 | (30 | ) | 56 | ||||||||||||||||
Net defined benefit plan adjustments | (296 | ) | — | — | (296 | ) | (283 | ) | (579 | ) | |||||||||||||
Foreign currency translation loss | — | — | (19,269 | ) | (19,269 | ) | — | (19,269 | ) | ||||||||||||||
December 30, 2016 | $ | (1,475 | ) | $ | 1,420 | $ | (15,660 | ) | $ | (15,715 | ) | $ | (285 | ) | $ | (16,000 | ) | ||||||
The realized loss (gain) relating to the Company’s foreign currency hedges were reclassified from Accumulated Other Comprehensive Income (Loss) and included in Cost of Sales or Sales as the transactions they are hedging occur. The realized (gain) loss relating to the Company’s interest rate swap hedges were reclassified from Accumulated Other Comprehensive Income (Loss) and included in Interest Expense as interest on the corresponding debt being hedged is accrued. Refer to Note 9 “Benefit Plans” for details on the change in net defined benefit plan adjustments.
(16.) FAIR VALUE MEASUREMENTS
Assets and Liabilities Measured at Fair Value on a Recurring Basis
Fair value measurement standards apply to certain financial assets and liabilities that are measured at fair value on a recurring basis (each reporting period). For the Company, these financial assets and liabilities include its derivative instruments. The Company does not have any nonfinancial assets or liabilities that are measured at fair value on a recurring basis.
Foreign Currency Contracts
The fair value of foreign currency contracts are determined through the use of cash flow models that utilize observable market data inputs to estimate fair value. These observable market data inputs include foreign exchange rate and credit spread curves. In addition to the above, the Company received fair value estimates from the foreign currency contract counterparty to verify the reasonableness of the Company’s estimates. The Company’s foreign currency contracts are categorized in Level 2 of the fair value hierarchy. The fair value of the Company’s foreign currency contracts will be realized as Sales or Cost of Sales as the inventory, which the contracts are hedging, is sold. The estimated Accumulated Other Comprehensive Income related to the Company’s foreign currency contracts that is expected to be reclassified into earnings within the next twelve months is a net gain of $0.9 million.
- 96 -
INTEGER HOLDINGS CORPORATION
NOTES TO CONSOLIDATED FINANCIAL STATEMENTS
(16.) FAIR VALUE MEASUREMENTS (Continued)
Interest Rate Swap
The fair value of the Company’s interest rate swap outstanding at December 29, 2017 was determined through the use of a cash flow model that utilized observable market data inputs. These observable market data inputs included LIBOR, swap rates, and credit spread curves. In addition to the above, the Company received a fair value estimate from the interest rate swap counterparty to verify the reasonableness of the Company’s estimate. This fair value calculation was categorized in Level 2 of the fair value hierarchy. The fair value of the Company’s interest rate swap will be realized as a component of Interest Expense as interest on the corresponding borrowings is accrued.
The following tables provide information regarding assets and liabilities recorded at fair value on a recurring basis (in thousands):
Fair Value | Quoted Prices in Active Markets (Level 1) | Significant Other Observable Inputs (Level 2) | Significant Unobservable Inputs (Level 3) | ||||||||||||
December 29, 2017 | |||||||||||||||
Assets: Interest rate swap (Note 8) | $ | 4,279 | $ | — | $ | 4,279 | $ | — | |||||||
Liabilities: Foreign currency contracts (Note 13) | $ | 861 | $ | — | $ | 861 | $ | — | |||||||
December 30, 2016 | |||||||||||||||
Assets: Interest rate swaps (Note 8) | $ | 3,482 | $ | — | $ | 3,482 | $ | — | |||||||
Liabilities: Foreign currency contracts (Note 13) | $ | 2,063 | $ | — | $ | 2,063 | $ | — | |||||||
Assets and Liabilities Measured at Fair Value on a Nonrecurring Basis
Fair value standards also apply to certain assets and liabilities that are measured at fair value on a nonrecurring basis. The carrying amounts of cash, accounts receivable, accounts payable and accrued expenses approximate fair value due to the short-term nature of these items. Refer to Note 8 “Debt” for further discussion regarding the fair value of the Company’s Senior Secured Credit Facilities and Senior Notes.
The following table provides information regarding assets recorded at fair value on a nonrecurring basis (in thousands):
Fair Value | Quoted Prices in Active Markets (Level 1) | Significant Other Observable Inputs (Level 2) | Significant Unobservable Inputs (Level 3) | ||||||||||||
December 29, 2017 | |||||||||||||||
Assets: Cost method investment | $ | 180 | $ | — | $ | 180 | $ | — | |||||||
Assets: Assets Held for Sale | 490 | — | 490 | — | |||||||||||
December 30, 2016 | |||||||||||||||
Assets: Cost method investment | $ | 430 | $ | — | $ | 430 | $ | — | |||||||
Assets: Assets Held for Sale | 794 | — | 794 | — | |||||||||||
- 97 -
INTEGER HOLDINGS CORPORATION
NOTES TO CONSOLIDATED FINANCIAL STATEMENTS
(16.) FAIR VALUE MEASUREMENTS (Continued)
A summary of the valuation methodologies for assets and liabilities measured on a nonrecurring basis is as follows:
Cost and Equity Method Investments
The Company holds investments in equity and other securities that are accounted for as either cost or equity method investments. The aggregate recorded amount of cost and equity method investments at December 29, 2017 and December 30, 2016 was $20.8 million and $22.8 million, respectively. The Company’s equity method investment is in a Chinese venture capital fund focused on investing in life sciences companies. As of December 29, 2017 and December 30, 2016, the Company’s recorded amount of this equity method investment was $13.8 million and $10.7 million, respectively. This fund accounts for its investments at fair value with the unrealized change in fair value of these investments recorded as income or loss to the fund in the period of change. As of December 29, 2017, the Company owned 6.8% of this fund.
During 2017, 2016 and 2015, the Company recognized impairment charges related to its cost method investments of $5.3 million, $1.6 million and $1.4 million, respectively. The fair value of these investments were determined by reference to recent sales data of similar shares to independent parties in an inactive market. This fair value calculation is categorized in Level 2 of the fair value hierarchy. During 2017, 2016 and 2015, the Company recognized net gains on equity method investments of $3.7 million, $0.1 million, and $4.7 million, respectively. During 2017, 2016 and 2015, the Company received $1.7 million, $0 and $3.6 million cash distributions, respectively, from its equity method investment, which was classified as a cash flow from operating activities in the Consolidated Statements of Cash Flows as it represented a return on investment.
Long-Lived Assets Held for Sale
A long-lived asset, which includes PP&E, is considered held for sale when it meets certain criteria described in ASC Topic 360, Property, Plant, and Equipment. A long-lived asset classified as held for sale is initially measured at the lower of its carrying amount or fair value less cost to sell, and a loss is recognized for any initial adjustment of the asset's carrying amount to its fair value less cost to sell in the period the held for sale criteria are met. In the period that a long-lived asset is considered held for sale it is presented within Prepaid Expenses and Other Current Assets where it remains until it is either sold or no longer meets the held for sale criteria. The Company reviews the carrying amount of its long-lived assets to be held and used for potential impairment whenever certain indicators are present as described in Note 1 “Summary of Significant Accounting Policies.”
During 2017 and 2016, the Company recorded impairment charges of $0.3 million and $0.2 million, respectively, related to its Orvin, Switzerland property in OOE. The fair value of these assets were determined based upon recent sales data of similar assets and discussions with potential buyers, and was categorized in Level 2 of the fair value hierarchy. Long-lived assets held for sale totaled $1.3 million and $0.8 million at December 29, 2017 and December 30, 2016, respectively.
Fair Value of Other Financial Instruments
Pension Plan Assets
The fair value of the Company’s pension plan assets disclosed in Note 9 “Benefit Plans” are determined based upon quoted market prices in inactive markets or valuation models with observable market data inputs to estimate fair value. These observable market data inputs include benchmark yields, reported trades, broker/dealer quotes, issuer spreads, benchmark securities, bids, offers and reference data. The Company’s pension plan assets are categorized Level 2 of the fair value hierarchy.
- 98 -
INTEGER HOLDINGS CORPORATION
NOTES TO CONSOLIDATED FINANCIAL STATEMENTS
(17.) SEGMENT AND GEOGRAPHIC INFORMATION
The Company organizes its business into two reportable segments: (1) Medical and (2) Non-Medical. This segment structure reflects the financial information and reports used by the Company’s management, specifically its Chief Operating Decision Maker (“CODM”), to make decisions regarding the Company’s business, including resource allocations and performance assessments. This segment structure reflects the Company’s current operating focus in compliance with ASC 280, Segment Reporting.
The two reportable segments, along with their related product lines, are described below:
Medical - includes the (i) Cardio & Vascular product line, which includes introducers, steerable sheaths, guidewires, catheters, and stimulation therapy components, subassemblies and finished devices that deliver therapies for various markets such as coronary and neurovascular disease, peripheral vascular disease, interventional radiology, vascular access, atrial fibrillation, and interventional cardiology, plus products for medical imaging and pharmaceutical delivery; (ii) Cardiac & Neuromodulation product line, which includes batteries, capacitors, filtered and unfiltered feed-throughs, engineered components, implantable stimulation leads, and enclosures used in implantable medical devices; and (iii) Advanced Surgical, Orthopedics & Portable Medical product line, which includes components, sub-assemblies, finished devices, implants, instruments and delivery systems for a range of surgical technologies to the advanced surgical market, including laparoscopy, orthopedics and general surgery, biopsy and drug delivery, joint preservation and reconstruction, arthroscopy, and engineered tubing solutions. Products also include life-saving and life-enhancing applications comprising of automated external defibrillators, portable oxygen concentrators, ventilators, and powered surgical tools.
Non-Medical - includes primary (lithium) cells, and primary and secondary battery packs for applications in the energy, military and environmental markets.
The Company defines segment income from operations as sales less cost of sales including amortization and expenses attributable to segment-specific selling, general, administrative, research, development, engineering and other operating activities. The remaining unallocated operating and other expenses are primarily administrative corporate headquarter expenses and capital costs that are not allocated to reportable segments. Transactions between the two segments are not significant.
During the first quarter of 2017, the Company revised the method used to present sales by product line in order to align the legacy Greatbatch and LRM methodologies. The Company believes the revised presentation will provide improved reporting and better transparency into the operational results of its business and markets. Prior period amounts have been reclassified to conform to the new product line sales reporting presentation.
The following table presents sales by product line for fiscal years 2017, 2016 and 2015 (in thousands).
2017 | 2016 | 2015 | |||||||||
Segment sales by product line: | |||||||||||
Medical | |||||||||||
Cardio & Vascular | $ | 536,794 | $ | 490,857 | $ | 131,299 | |||||
Cardiac & Neuromodulation | 428,349 | 439,541 | 361,722 | ||||||||
Advanced Surgical, Orthopedics & Portable Medical | 439,810 | 414,701 | 247,944 | ||||||||
Total Medical | 1,404,953 | 1,345,099 | 740,965 | ||||||||
Non-Medical | 56,968 | 41,679 | 59,449 | ||||||||
Total sales | $ | 1,461,921 | $ | 1,386,778 | $ | 800,414 | |||||
- 99 -
INTEGER HOLDINGS CORPORATION
NOTES TO CONSOLIDATED FINANCIAL STATEMENTS
(17.) SEGMENT AND GEOGRAPHIC INFORMATION (Continued)
A significant portion of the Company’s sales for fiscal years 2017, 2016 and 2015 and accounts receivable at December 29, 2017 and December 30, 2016 were to four customers as follows:
Sales | Accounts Receivable | ||||||||
2017 | 2016 | 2015 | December 29, 2017 | December 30, 2016 | |||||
Customer A | 17% | 18% | 17% | 9% | 7% | ||||
Customer B | 17% | 17% | 18% | 18% | 20% | ||||
Customer C | 12% | 12% | 12% | 8% | 4% | ||||
Customer D | 9% | 9% | 5% | 17% | 14% | ||||
55% | 56% | 52% | 52% | 45% | |||||
The following table presents income from operations for the Company’s reportable segments for fiscal years 2017, 2016 and 2015 (in thousands).
2017 | 2016 | 2015 | |||||||||
Segment income from operations: | |||||||||||
Medical | $ | 211,002 | $ | 185,448 | $ | 83,784 | |||||
Non-Medical | 11,335 | 1,513 | 7,289 | ||||||||
Total segment income from operations | 222,337 | 186,961 | 91,073 | ||||||||
Unallocated operating expenses | (82,898 | ) | (78,691 | ) | (77,927 | ) | |||||
Operating income | 139,439 | 108,270 | 13,146 | ||||||||
Unallocated expenses, net | (117,612 | ) | (107,085 | ) | (28,846 | ) | |||||
Income (loss) before benefit for income taxes | $ | 21,827 | $ | 1,185 | $ | (15,700 | ) | ||||
The following table presents depreciation and amortization expense for the Company’s reportable segments for fiscal years 2017, 2016 and 2015 (in thousands).
2017 | 2016 | 2015 | |||||||||
Segment depreciation and amortization: | |||||||||||
Medical | $ | 93,927 | $ | 83,184 | $ | 61,618 | |||||
Non-Medical | 2,675 | 2,346 | 2,503 | ||||||||
Total depreciation and amortization included in segment income from operations | 96,602 | 85,530 | 64,121 | ||||||||
Unallocated depreciation and amortization | 6,194 | 4,994 | 3,497 | ||||||||
Total depreciation and amortization | $ | 102,796 | $ | 90,524 | $ | 67,618 | |||||
The following table presents total assets for the Company’s reportable segments as of December 29, 2017 and December 30, 2016 (in thousands).
December 29, 2017 | December 30, 2016 | ||||||
Identifiable assets: | |||||||
Medical | $ | 2,687,227 | $ | 2,638,180 | |||
Non-Medical | 54,071 | 60,988 | |||||
Total reportable segments | 2,741,298 | 2,699,168 | |||||
Unallocated assets | 107,047 | 133,375 | |||||
Total assets | $ | 2,848,345 | $ | 2,832,543 | |||
- 100 -
INTEGER HOLDINGS CORPORATION
NOTES TO CONSOLIDATED FINANCIAL STATEMENTS
(17.) SEGMENT AND GEOGRAPHIC INFORMATION (Continued)
The following table presents capital expenditures for the Company’s reportable segments for fiscal years 2017, 2016 and 2015 (in thousands).
2017 | 2016 | 2015 | |||||||||
Expenditures for tangible long-lived assets, excluding acquisitions: | |||||||||||
Medical | $ | 37,740 | $ | 44,670 | $ | 40,931 | |||||
Non-Medical | 661 | 1,451 | 600 | ||||||||
Total reportable segments | 38,401 | 46,121 | 41,531 | ||||||||
Unallocated long-lived tangible assets | 8,783 | 8,251 | 6,523 | ||||||||
Total expenditures | $ | 47,184 | $ | 54,372 | $ | 48,054 | |||||
Geographic Area Information
The following table presents sales by significant country for fiscal years 2017, 2016 and 2015. In these tables, sales are allocated based on where the products are shipped (in thousands).
2017 | 2016 | 2015 | |||||||||
Sales by geographic area: | |||||||||||
United States | $ | 862,290 | $ | 805,742 | $ | 401,380 | |||||
Non-Domestic locations: | |||||||||||
Puerto Rico | 133,752 | 159,243 | 136,898 | ||||||||
Rest of world | 465,879 | 421,793 | 262,136 | ||||||||
Total sales | $ | 1,461,921 | $ | 1,386,778 | $ | 800,414 | |||||
The following table presents PP&E by geographic area as of December 29, 2017 and December 30, 2016. In these tables, PP&E is aggregated based on the physical location of the tangible long-lived assets (in thousands).
December 29, 2017 | December 30, 2016 | ||||||
Long-lived tangible assets by geographic area: | |||||||
United States | $ | 252,767 | $ | 258,899 | |||
Rest of world | 117,608 | 113,143 | |||||
Total | $ | 370,375 | $ | 372,042 | |||
- 101 -
INTEGER HOLDINGS CORPORATION
NOTES TO CONSOLIDATED FINANCIAL STATEMENTS
(18.) QUARTERLY SALES AND EARNINGS DATA—UNAUDITED
(in thousands, except per share data) | Fourth Quarter | Third Quarter | Second Quarter | First Quarter | |||||||||||
Fiscal Year 2017 | |||||||||||||||
Sales | $ | 390,481 | $ | 363,308 | $ | 362,719 | $ | 345,413 | |||||||
Gross profit | 104,818 | 98,235 | 99,272 | 91,226 | |||||||||||
Net income (loss) | 54,338 | 13,690 | 2,990 | (4,339 | ) | ||||||||||
EPS—basic | 1.71 | 0.43 | 0.10 | (0.14 | ) | ||||||||||
EPS—diluted | 1.68 | 0.43 | 0.09 | (0.14 | ) | ||||||||||
Fiscal Year 2016 | |||||||||||||||
Sales | $ | 359,591 | $ | 346,567 | $ | 348,382 | $ | 332,238 | |||||||
Gross profit | 92,891 | 97,909 | 96,031 | 91,468 | |||||||||||
Net income (loss) | 7,933 | 11,458 | (770 | ) | (12,660 | ) | |||||||||
EPS—basic | 0.26 | 0.37 | (0.03 | ) | (0.41 | ) | |||||||||
EPS—diluted | 0.25 | 0.37 | (0.03 | ) | (0.41 | ) | |||||||||
During the fourth quarter 2017, the Company recognized a $39.4 million net tax benefit as a result of the Tax Reform Act, which was signed into law on December 22, 2017. Further information on the impact of the Tax Reform Act is presented in Note 12 “Income Taxes.”
- 102 -
ITEM 9. CHANGES IN AND DISAGREEMENTS WITH ACCOUNTANTS ON ACCOUNTING AND
FINANCIAL DISCLOSURE
None.
ITEM 9A. CONTROLS AND PROCEDURES
Management’s Report on Internal Control Over Financial Reporting appears in Part II, Item 8, “Financial Statements and Supplementary Data” of this report and is incorporated into this Item 9A by reference.
a. | Evaluation of Disclosure Controls and Procedures |
Our management, including the principal executive officer and principal financial officer, evaluated our disclosure controls and procedures (as defined in Rules 13a-15(e) and 15d-15(e) under the Securities Exchange Act of 1934) related to the recording, processing, summarization and reporting of information in our reports that we file with the Securities and Exchange Commission as of December 29, 2017. These disclosure controls and procedures have been designed to provide reasonable assurance that material information relating to us, including our subsidiaries, is made known to our management, including these officers, by our employees, and that this information is recorded, processed, summarized, evaluated and reported, as applicable, within the time periods specified in the Securities and Exchange Commission’s rules and forms. Based on their evaluation, as of December 29, 2017, our principal executive officer and principal financial officer have concluded that our disclosure controls and procedures are effective.
b. Changes in Internal Control Over Financial Reporting
There were no changes in our internal control over financial reporting during our last fiscal quarter to which this Annual Report on Form 10-K relates that have materially affected, or are reasonably likely to materially affect, internal control over financial reporting.
ITEM 9B. OTHER INFORMATION
None.
- 103 -
PART III
ITEM 10. DIRECTORS, EXECUTIVE OFFICERS AND CORPORATE GOVERNANCE
Information regarding the Company’s directors appearing under the caption “Election of Directors” in the Company’s Proxy Statement for its 2018 Annual Meeting of Stockholders is incorporated herein by reference.
Information regarding the Company’s executive officers is presented under the caption “Executive Officers of the Company” in Part I of this Annual Report on Form 10-K.
The other information required by Item 10 is incorporated herein by reference from the Company’s Proxy Statement for its 2018 Annual Meeting of Stockholders.
ITEM 11. EXECUTIVE COMPENSATION
Information regarding executive compensation appearing under the captions “Compensation Discussion and Analysis”, “Executive Compensation” and “Compensation Committee Interlocks and Insider Participation” in the Company’s Proxy Statement for the 2018 Annual Meeting of Stockholders is incorporated herein by reference.
ITEM 12. SECURITY OWNERSHIP OF CERTAIN BENEFICIAL OWNERS AND MANAGEMENT AND
RELATED STOCKHOLDER MATTERS
Information regarding security ownership of certain beneficial owners and management and related stockholder matters, including the table titled “Equity Compensation Plan Information” and under the caption “Stock Ownership by Directors and Officers” in the Company’s Proxy Statement for the 2018 Annual Meeting of Stockholders is incorporated herein by reference.
ITEM 13. CERTAIN RELATIONSHIPS AND RELATED TRANSACTIONS, AND DIRECTOR INDEPENDENCE
Information regarding certain relationships and related transactions, and director independence under the captions “Related Person Transactions” and “Board Independence” in the Company’s Proxy Statement for the 2018 Annual Meeting of Stockholders is incorporated herein by reference.
ITEM 14. PRINCIPAL ACCOUNTANT FEES AND SERVICES
Information regarding the fees paid to and services provided by Deloitte & Touche LLP, the Company’s independent registered public accounting firm under the caption “Ratification of the Appointment of Independent Registered Public Accounting Firm” in the Company’s Proxy Statement for the 2018 Annual Meeting of Stockholders is incorporated herein by reference.
- 104 -
PART IV
ITEM 15. EXHIBITS AND FINANCIAL STATEMENT SCHEDULES
(a) LIST OF DOCUMENTS FILED AS PART OF THIS REPORT
(1) | Financial statements and financial statement schedules filed as part of this Annual Report on Form 10-K. Refer to Part II, Item 8. “Financial Statements and Supplementary Data.” |
(2) | The following financial statement schedule is included in this Annual Report on Form 10-K (in thousands): |
Schedule II—Valuation and Qualifying Accounts
Col. C—Additions | ||||||||||||||||||||
Column A Description | Col. B Balance at Beginning of Period | Charged to Costs & Expenses | Charged to Other Accounts- Describe | Col. D Deductions - Describe | Col. E Balance at End of Period | |||||||||||||||
December 29, 2017 | ||||||||||||||||||||
Allowance for doubtful accounts | $ | 742 | $ | 151 | $ | 31 | (4) | $ | (100 | ) | (2) | $ | 824 | |||||||
Valuation allowance for deferred tax assets | $ | 35,391 | $ | 3,284 | (1) | $ | — | $ | (2,195 | ) | (2)(5) | $ | 36,480 | |||||||
December 30, 2016 | ||||||||||||||||||||
Allowance for doubtful accounts | $ | 954 | $ | 140 | $ | 245 | (4) | $ | (597 | ) | (2) | $ | 742 | |||||||
Valuation allowance for deferred tax assets | $ | 39,171 | $ | 641 | (1) | $ | (5,135 | ) | (3)(4) | $ | 714 | (5) | $ | 35,391 | ||||||
January 1, 2016 | ||||||||||||||||||||
Allowance for doubtful accounts | $ | 1,411 | $ | (70 | ) | $ | 459 | (3)(4) | $ | (846 | ) | (2) | $ | 954 | ||||||
Valuation allowance for deferred tax assets | $ | 10,709 | $ | 788 | (1) | $ | 27,836 | (3)(4) | $ | (162 | ) | (5) | $ | 39,171 | ||||||
(1) | Valuation allowance recorded in the provision for income taxes for certain net operating losses and tax credits. The increase in 2017 includes the impact of the adoption of the U.S. Tax Cuts and Jobs Act which increased the value of our state deferred tax assets to which a corresponding valuation allowance was recorded. |
(2) | Accounts written off. |
(3) | Balance recorded as a part of our 2015 acquisition of LRM. 2016 amount represents measurement-period adjustments related to the acquisition of LRM. |
(4) | Includes foreign currency translation effect. |
(5) | Includes return to provision adjustments for prior years. |
Schedules not listed above have been omitted because the information required to be set forth therein is not applicable or is shown in the financial statements or notes thereto.
(3) | See exhibits listed under Part (b) below. |
(b) EXHIBITS:
EXHIBIT NUMBER | DESCRIPTION | |
2.1 | ||
2.2 | ||
3.1 | ||
- 105 -
EXHIBIT NUMBER | DESCRIPTION | |
3.2 | ||
4.1 | ||
4.2 | ||
10.1# | ||
10.2# | ||
10.3# | ||
10.4# | ||
10.5 | ||
10.6 | ||
10.7 | ||
10.8 | ||
10.9# | ||
10.10# | ||
10.11# | ||
10.12# | ||
10.13# | ||
10.14# | ||
10.15# | ||
10.16# | ||
- 106 -
EXHIBIT NUMBER | DESCRIPTION | |
10.17# | ||
10.18# | ||
10.19# | ||
10.20# | ||
10.21# | ||
10.22# | ||
10.23# | ||
10.24# | ||
10.25 | ||
10.26 | ||
10.27 | ||
10.28 | ||
10.29# | ||
10.30# | ||
10.31#* | ||
10.32#* | ||
10.33#* | ||
12.1* | ||
21.1* | ||
23.1* | ||
31.1* | ||
31.2* | ||
32.1** | ||
101.INS* | XBRL Instance Document | |
- 107 -
EXHIBIT NUMBER | DESCRIPTION | |
101.SCH* | XRBL Taxonomy Extension Schema Document | |
101.CAL* | XBRL Taxonomy Extension Calculation Linkbase Document | |
101.LAB* | XBRL Taxonomy Extension Labels Linkbase Document | |
101.PRE* | XBRL Taxonomy Extension Presentation Linkbase Document | |
101.DEF* | XBRL Taxonomy Extension Definition Linkbase Document | |
* - | Filed herewith. |
** - | Furnished herewith. |
# - | Indicates exhibits that are management contracts or compensation plans or arrangements required to be filed pursuant to Item 15(b) of Form 10-K. |
ITEM 16. FORM 10-K SUMMARY
None.
- 108 -
SIGNATURES
Pursuant to the requirements of Sections 13 or 15(d) of the Securities Exchange Act of 1934, the registrant has duly caused this report to be signed on its behalf by the undersigned, thereunto duly authorized.
INTEGER HOLDINGS CORPORATION | |||
Dated: | February 22, 2018 | By | /s/ Joseph W. Dziedzic |
Joseph W. Dziedzic (Principal Executive Officer) | |||
President and Chief Executive Officer | |||
Pursuant to the requirements of the Securities Exchange Act of 1934, this report has been signed below by the following persons on behalf of the registrant and in the capacities and on the date indicated.
Signature | Title | Date | ||
/s/ Joseph W. Dziedzic | President, Chief Executive Officer and Director | February 22, 2018 | ||
Joseph W. Dziedzic | (Principal Executive Officer) | |||
/s/ Gary J. Haire | Executive Vice President and Chief Financial Officer | February 22, 2018 | ||
Gary J. Haire | (Principal Financial Officer) | |||
/s/ Tom P. Thomas | Vice President, Corporate Controller | February 22, 2018 | ||
Tom P. Thomas | (Principal Accounting Officer) | |||
/s/ Bill R. Sanford | Chairman | February 22, 2018 | ||
Bill R. Sanford | ||||
/s/ Pamela G. Bailey | Director | February 22, 2018 | ||
Pamela G. Bailey | ||||
Director | February 22, 2018 | |||
James F. Hinrichs | ||||
/s/ Jean M. Hobby | Director | February 22, 2018 | ||
Jean M. Hobby | ||||
/s/ M. Craig Maxwell | Director | February 22, 2018 | ||
M. Craig Maxwell | ||||
/s/ Filippo Passerini | Director | February 22, 2018 | ||
Filippo Passerini | ||||
/s/ Peter H. Soderberg | Director | February 22, 2018 | ||
Peter H. Soderberg | ||||
/s/ Donald J. Spence | Director | February 22, 2018 | ||
Donald J. Spence | ||||
/s/ William B. Summers, Jr. | Director | February 22, 2018 | ||
William B. Summers, Jr. | ||||
- 109 -