Attached files
| file | filename |
|---|---|
| EX-99.2 - EX-99.2 - CNL Healthcare Properties, Inc. | d530261dex992.htm |
| 8-K - 8-K - CNL Healthcare Properties, Inc. | d530261d8k.htm |
Exhibit 99.1

Estimated Net Asset Value Presentation
February 2018
CHP-0218-00375-005-BD
© 2018 CNL Healthcare Corp. All Rights Reserved. CNL® and the Squares Within Squares
design trademarks are used under license from CNL Intellectual Properties, Inc.
General Notices
This is
not an offer to sell nor a solicitation of an offer to buy shares of the REIT.
This piece is for general information purposes only and does not constitute legal,
tax, investment or other professional advice on any subject matter. Information provided is not all-inclusive and should not be relied upon as being all-inclusive.
This presentation may include forward-looking statements. Forward-looking statements are based on current expectations and may be identified by words such as
believes, expects, may, could and terms of similar substance, and speak only as of the date made. Actual results could differ materially from those expressed or implied in the REIT’s forward-looking statements. Important factors, among others,
that could cause the REIT’s actual results to differ materially from those in its forward-looking statements include those identified in the Risk Factors described below. Investors should not place undue reliance on forward-looking statements.
The REIT is under no obligation to, and expressly disclaims any obligation to, update or alter its forward-looking statements, whether as a result of new information, subsequent events or otherwise, except as required by law.
An investment in the REIT the REIT is subject to significant risks, some of which are summarized below in the “Risk Factors” section of this piece. See also, “Risk
Factors” in the REIT’s public filings for a more detailed description of the risks associated with an investment in the REIT.
© 2018 CNL Healthcare
Corp. All Rights Reserved. CNL® and the Squares Within Squares design trademarks are used under license from CNL Intellectual Properties, Inc.
CNL Healthcare
Properties 2
Risk Factors
Investing in
a non-traded REIT is a higher-risk, longer term investment and is not suitable for all investors. Due to the risks involved in the ownership of real estate, there is no guarantee of any return on investment.
The shares may lose value or investors could lose their entire investment. The shares are not FDIC-insured, nor bank guaranteed.
Non-traded REITs are illiquid. There is no public trading market for the shares. The REIT has no obligation to list on any
public securities market and does not expect to list the shares in the near future. Stockholders will bear the economic risks of an investment in the shares for a substantial and indefinite period. If investors are able to sell their shares, it
would likely be at a substantial loss of the amount invested.
There are significant limitations on the redemption of investors’ shares under the REIT’s
Amended and Restated Redemption Plan. Funds available for redemption, if any, are within the REIT’s sole discretion and are not expected to exceed the proceeds of the REIT’s Distribution Reinvestment Plan, unless the board of directors
chooses to use other sources to redeem shares. The REIT can determine not to redeem any shares, or only a portion of the shares for which redemption is requested. In no event will more than 5 percent of the outstanding shares be redeemed in any
12-month period. The REIT may suspend, terminate or modify the redemption plan at any time.
If the REIT fails to maintain
its qualification as a REIT for any taxable year, it will be subject to federal income tax on taxable income at regular corporate rates. In such event, net earnings available for investment or distributions would be reduced.
© 2018 CNL Healthcare Corp. All Rights Reserved. CNL® and the Squares Within Squares design trademarks are used under license from CNL Intellectual Properties, Inc.
CNL Healthcare Properties 3
Risk Factors
Since
April 1, 2013, the advisor and its affiliated property manager have provided expense support to the REIT, and foregoing the payment of fees in cash in exchange for shares of restricted stock for services as defined in the Expense Support and
Restricted Stock Agreement. The expense support amount is calculated and determined on a cumulative year-to-date basis and may be terminated at any time by the advisor.
Decreases in the support amount from the advisor will reduce our cash flow available for distributions and other costs.
The use of leverage to acquire assets may
hinder the REIT’s ability to pay distributions and/or decrease the value of stockholders’ investment in the event income from or the value of the property securing the debt declines.
There are significant risks associated with the senior housing and healthcare sectors including market risk impacting demand, litigation risk and the cost of being responsive to
changing government regulations. The REIT’s success in these sectors is dependent, in part, upon the ability to evaluate local conditions, identify appropriate opportunities, and find qualified tenants or, where properties are acquired through
a taxable REIT subsidiary, to engage and retain qualified independent managers.
The REIT relies on its advisor and the advisor’s affiliates to select the
REIT’s properties and to conduct the REIT’s operations. The REIT is obligated to pay substantial fees to its advisor, managing dealer, property manager and their respective affiliates based upon agreements which have not been negotiated at
arm’s length, and some of which are payable based upon factors other than the quality of services. These fees could influence their advice and judgment in performing services. Currently, the REIT is incurring fees and expenses, some of which
will need to be reimbursed to its advisor and affiliates.
Certain officers and directors of the advisor also serve as the REIT’s officers and directors, as
well as officers and directors of competing programs, resulting in conflicts of interest. Those persons could take actions more favorable to other entities.
©
2018 CNL Healthcare Corp. All Rights Reserved. CNL® and the Squares Within Squares design trademarks are used under license from CNL Intellectual Properties, Inc.
CNL Healthcare Properties 4

Risk Factors
The REIT has
paid and intends to continue to pay distributions on a quarterly basis; however, there is no guarantee of the amount of future distributions, or if distributions can be sustained at all. The amount and basis of distributions are determined by and at
the discretion of the board of directors and are dependent upon a number of factors, including but not limited to, expected and actual net operating cash flow, funds from operations, financial condition, capital requirements, avoidance of volatility
of distributions, and retaining qualification as a REIT for federal income tax purposes. To date, the REIT has experienced cumulative net losses, and accordingly, not all distributions have been funded from earnings. Until the REIT generates
sufficient operating cash flow or funds from operations, the REIT may continue to pay distributions from other sources and/or in stock. Funding distributions from offering proceeds or borrowings will reduce cash available for investment, may lower
investors’ overall return, and is not sustainable. Stock distributions paid to earlier investors will be dilutive to later investors. The REIT has not established a limit on the extent to which it may use borrowings, offering proceeds or stock
to pay distributions.
Development properties initially reduced the portfolio’s cash flows including funds available for distributions, increased financing
expenses and were subject to greater risks for obtaining government permits and staying on schedule for construction deadlines. CNL Healthcare Properties has experienced net operating losses, which are improving and expected to be temporary. It is
believed the strategy to invest in development properties will ultimately result in a better long-term investment outcome for the portfolio.
© 2018 CNL
Healthcare Corp. All Rights Reserved. CNL® and the Squares Within Squares design trademarks are used under license from CNL Intellectual Properties, Inc.
CNL
Healthcare Properties 5
Valuation Disclosures
Our
estimated net asset value per share is based upon subjective judgments, assumptions and opinions which may or may not turn out to be correct. You should not rely upon our estimated net asset value as representative of the amount that might be paid
to you for your shares in a market transaction, or in a liquidity event.
In determining our estimated net asset value per share, we relied upon a valuation of our
portfolio of properties as of Dec. 31, 2017. Valuations and appraisals of our properties are estimates of fair value and may not necessarily correspond to realizable value upon the sale of such properties. Therefore, the estimated present value to
the REIT of our equity in our portfolio may not reflect the amount that would be realized upon a sale of each of our properties.
We intend to conduct annual year
end valuations in accordance with our valuation policy. If we do not perform a subsequent calculation of the net asset value per share of our shares, you may not be able to determine the net asset value of your shares on an ongoing basis.
The estimated net asset value (NAV) per share is only an estimate and is based on numerous assumptions and estimates with respect to industry, business, economic
and regulatory conditions, all of which are subject to changes. Throughout the valuation process, the valuation committee, the REIT’s advisor and senior members of management reviewed, confirmed and approved the processes and methodologies and
their consistency with real estate industry standards and best practices.
© 2018 CNL Healthcare Corp. All Rights Reserved. CNL® and the Squares Within
Squares design trademarks are used under license from CNL Intellectual Properties, Inc.
CNL Healthcare Properties 6
Welcome
Historical NAV
Recap
Portfolio Overview
Estimated NAV Details
Next Steps
CNL Healthcare Properties 7
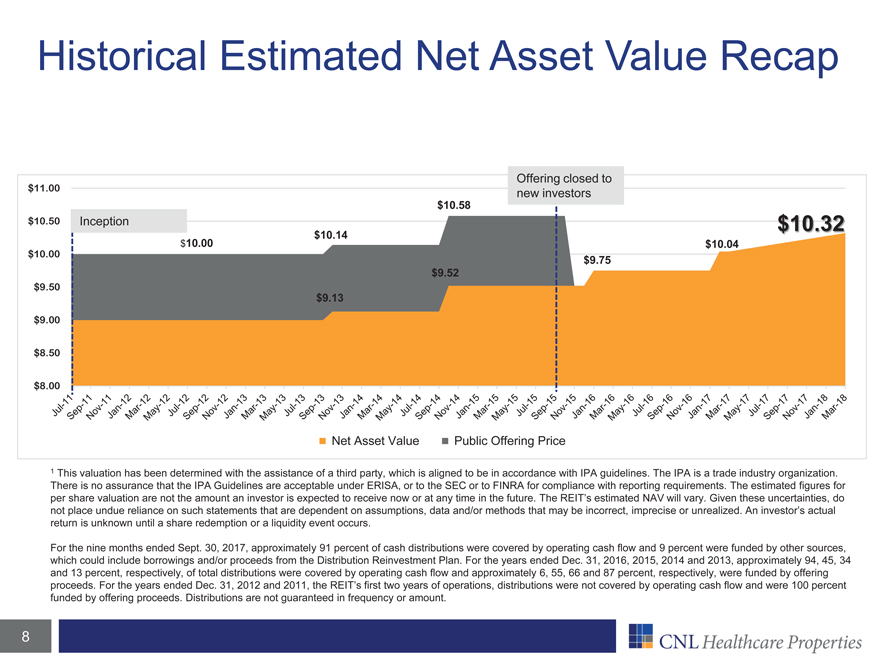
Historical Estimated Net Asset Value Recap
$11.00 $10.50 $10.00 $9.50 $9.00 $8.50 $8.00 $10.58
Offering closed to new investors Net Asset
Value Public Offering Price
1 This valuation has been determined with the assistance of a third party, which is aligned to be in accordance with IPA guidelines.
The IPA is a trade industry organization. There is no assurance that the IPA Guidelines are acceptable under ERISA, or to the SEC or to FINRA for compliance with reporting requirements. The estimated figures for per share valuation are not the
amount an investor is expected to receive now or at any time in the future. The REIT’s estimated NAV will vary. Given these uncertainties, do not place undue reliance on such statements that are dependent on assumptions, data and/or methods
that may be incorrect, imprecise or unrealized. An investor’s actual return is unknown until a share redemption or a liquidity event occurs.
For the nine
months ended Sept. 30, 2017, approximately 91 percent of cash distributions were covered by operating cash flow and 9 percent were funded by other sources, which could include borrowings and/or proceeds from the Distribution Reinvestment
Plan. For the years ended Dec. 31, 2016, 2015, 2014 and 2013, approximately 94, 45, 34 and 13 percent, respectively, of total distributions were covered by operating cash flow and approximately 6, 55, 66 and 87 percent, respectively, were
funded by offering proceeds. For the years ended Dec. 31, 2012 and 2011, the REIT’s first two years of operations, distributions were not covered by operating cash flow and were 100 percent funded by offering proceeds. Distributions are
not guaranteed in frequency or amount.
$10.58 Inception $10.14 $10.00 $9.52 $9.13 $10.32 $10.04 $9.75
CNL Healthcare Properties 8
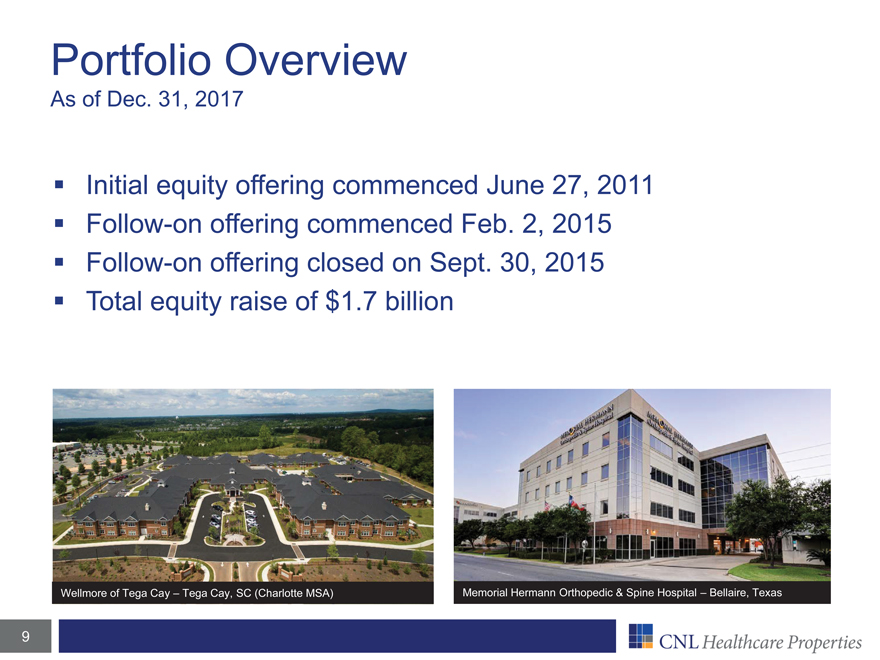
Portfolio Overview
As of
Dec. 31, 2017
Initial equity offering commenced June 27, 2011
Follow-on offering commenced Feb. 2, 2015
Follow-on offering closed on Sept. 30, 2015
Total equity raise of $1.7 billion
Wellmore of Tega Cay – Tega Cay,
SC (Charlotte MSA) Memorial Hermann Orthopedic & Spine Hospital – Bellaire, Texas
CNL Healthcare Properties 9
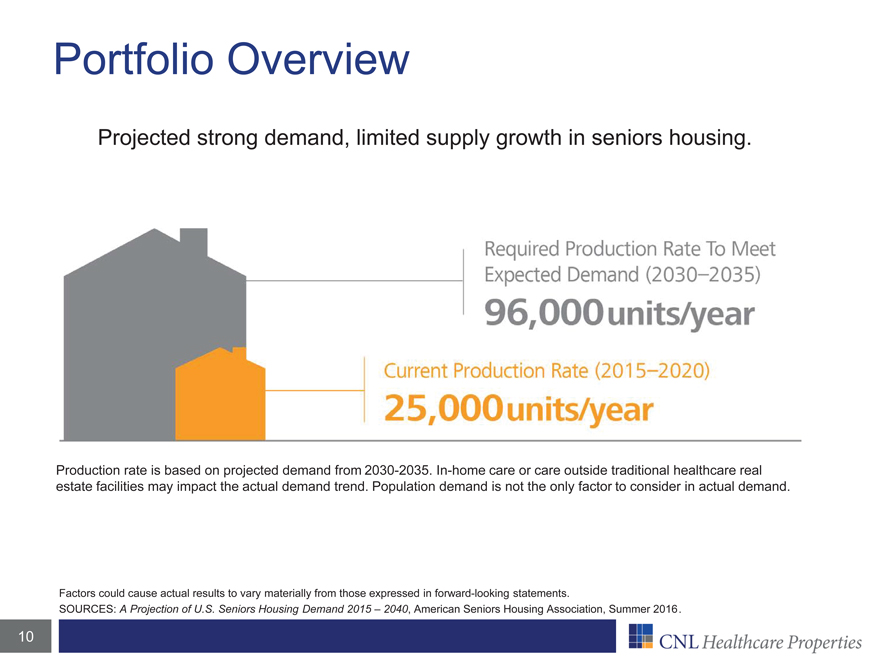
Portfolio Overview
Projected strong demand, limited supply growth in seniors housing.
Required
Production Rate To Meet Expected Demand (2030-2035)
96,000units/year
Current
Production Rate (2015-2020)
25,000units/year
Production rate is based on
projected demand from 2030-2035. In-home care or care outside traditional healthcare real estate facilities may impact the actual demand trend. Population demand is not the only factor to consider in actual
demand.
Factors could cause actual results to vary materially from those expressed in forward-looking statements.
SOURCES: A Projection of U.S. Seniors Housing Demand 2015 - 2040, American Seniors Housing Association, Summer 2016.
CNL Healthcare Properties 10
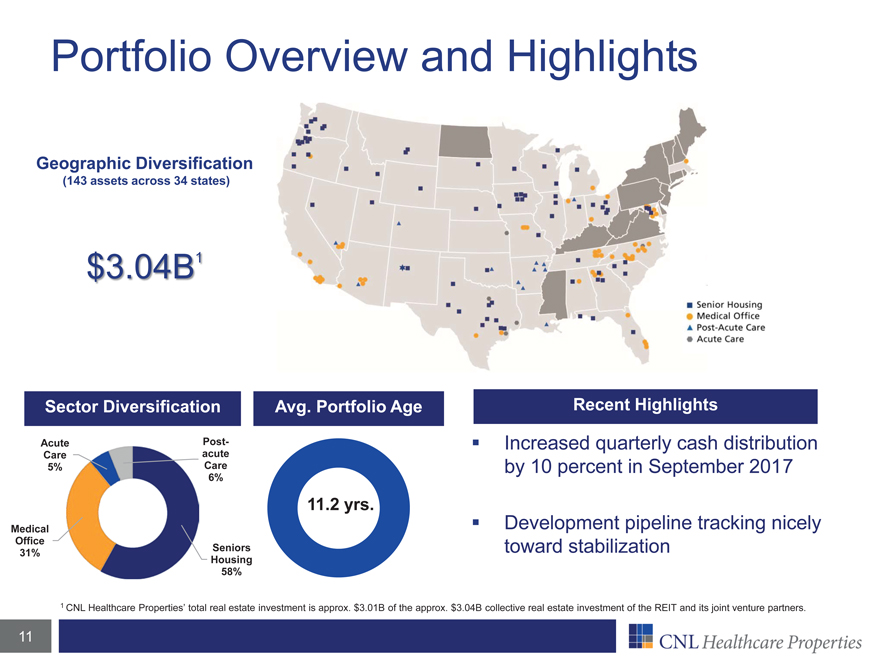
Portfolio Overview and Highlights
Geographic Diversification
(143 assets across 34 states)
$3.04B1
Sector Diversification Avg. Portfolio Age
Acute Post-Care acute
5% Care 6%
11.2 yrs.
Medical Office
31% Seniors Housing 58%
Recent Highlights
Increased quarterly cash distribution by 10 percent in September 2017
Development
pipeline tracking nicely toward stabilization
1 CNL Healthcare Properties’ total real estate investment is approx. $3.01B of the approx. $3.04B collective
real estate investment of the REIT and its joint venture partners.
CNL Healthcare Properties 11
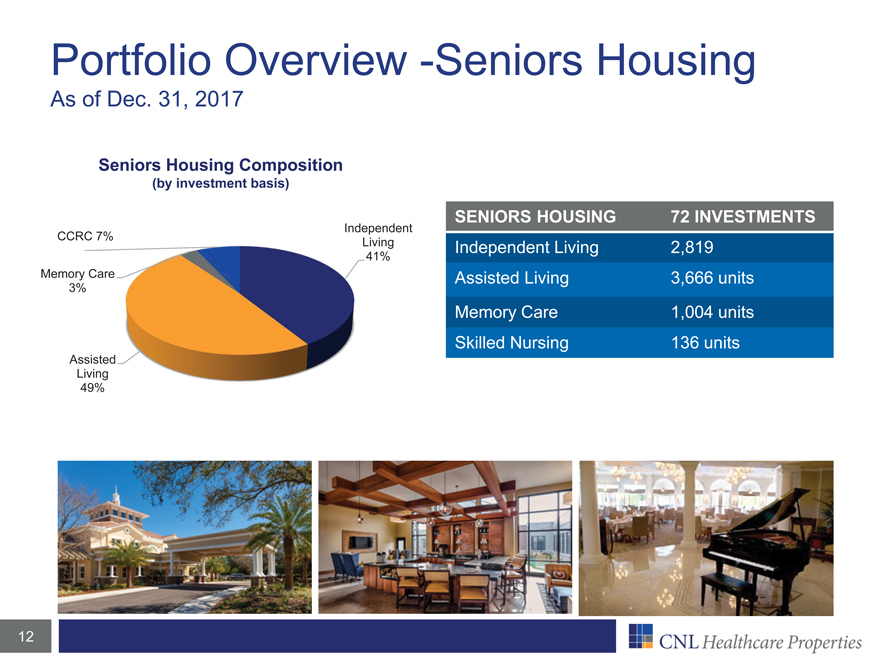
Portfolio Overview -Seniors Housing
As of Dec. 31, 2017
Seniors Housing Composition
(by investment basis)
Independent CCRC 7% Living 41% Memory Care 3%
Assisted Living 49%
SENIORS HOUSING 72 INVESTMENTS
Independent Living 2,819 Assisted Living 3,666 units Memory Care 1,004 units Skilled Nursing 136 units
CNL Healthcare Properties 12
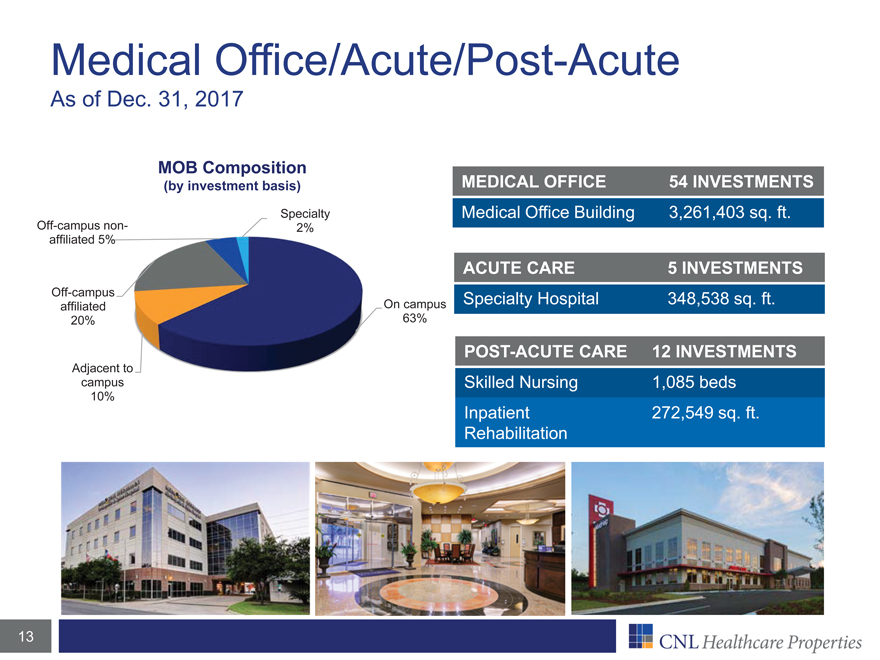
Medical Office/Acute/Post-Acute
As of Dec. 31, 2017
MOB Composition
(by investment basis)
Specialty Off-campus non- 2% affiliated 5%
Off-campus affiliated On campus 20% 63%
Adjacent to campus 10%
MEDICAL OFFICE 54 INVESTMENTS
Medical Office Building 3,261,403 sq. ft.
ACUTE CARE 5 INVESTMENTS
Specialty Hospital 348,538 sq. ft.
POST-ACUTE CARE 12 INVESTMENTS
Skilled Nursing 1,085 beds Inpatient 272,549 sq. ft. Rehabilitation
CNL Healthcare Properties
13
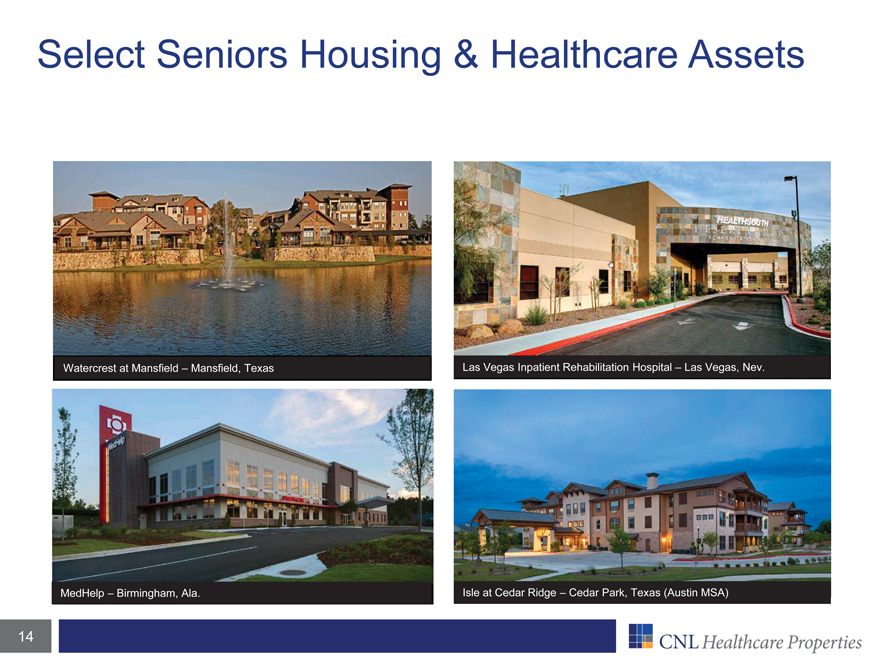
Select Seniors Housing & Healthcare Assets
Watercrest at Mansfield – Mansfield, Texas Las Vegas Inpatient Rehabilitation Hospital – Las Vegas, Nev.
MedHelp – Birmingham, Ala. Isle at Cedar Ridge – Cedar Park, Texas (Austin MSA)
CNL
Healthcare Properties 14
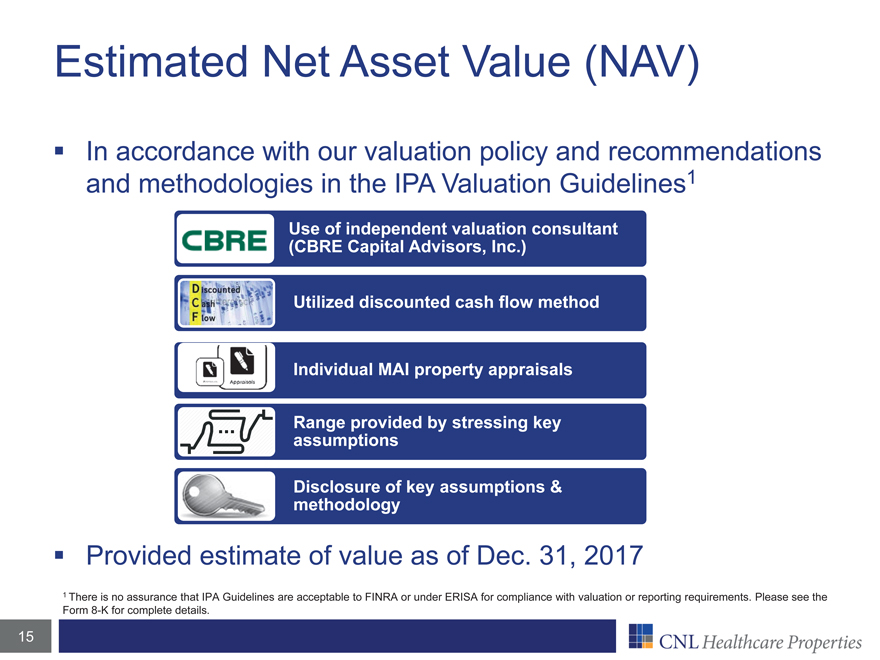
Estimated Net Asset Value (NAV)
In accordance with our valuation policy and recommendations and methodologies in the IPA Valuation Guidelines1
Use (CBRE of independent Capital Advisors, valuation Inc.) consultant Utilized discounted cash flow method
Individual MAI property appraisals
Range assumptions provided by stressing key Disclosure
methodology of key assumptions &
Provided estimate of value as of Dec. 31, 2017
1 There is no assurance that IPA Guidelines are acceptable to FINRA or under ERISA for compliance with valuation or reporting requirements. Please see the Form 8-K for complete details.
CNL Healthcare Properties 15
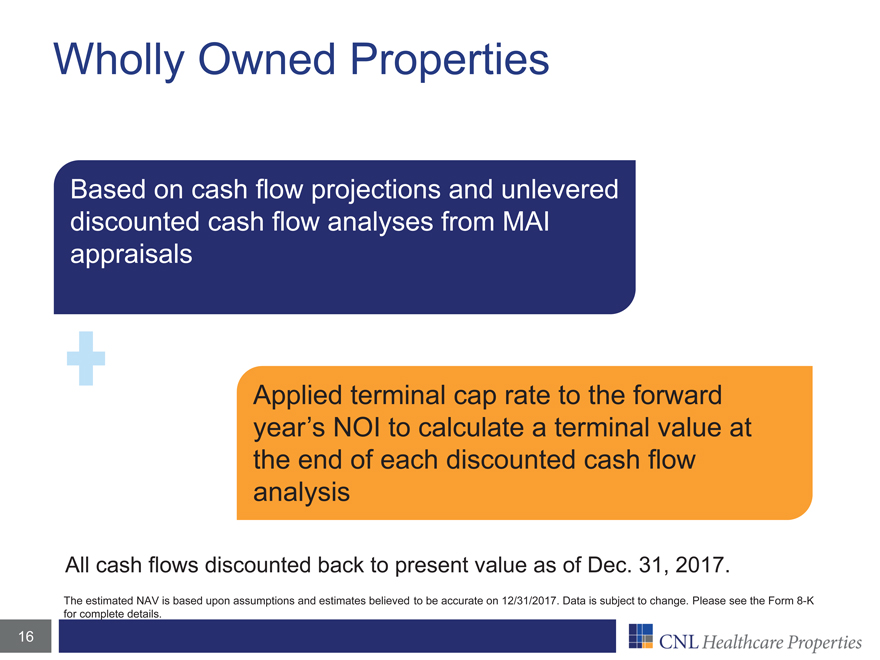
Wholly Owned Properties
Based on cash flow projections and unlevered discounted cash flow analyses from MAI appraisals
Applied terminal cap rate to the forward year’s NOI to calculate a terminal value at the end of each discounted cash flow analysis
All cash flows discounted back to present value as of Dec. 31, 2017.
The estimated NAV is
based upon assumptions and estimates believed to be accurate on 12/31/2017. Data is subject to change. Please see the Form 8-K for complete details.
CNL Healthcare Properties 16
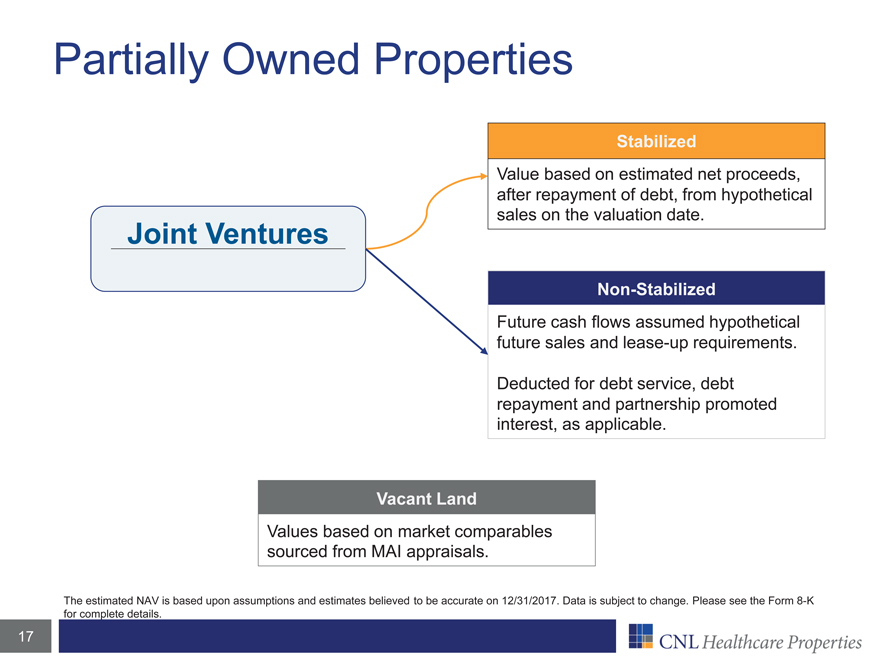
Partially Owned Properties
Stabilized
Value based on estimated net proceeds, after repayment of debt,
from hypothetical sales on the valuation date.
Joint Ventures
Non-Stabilized
Future cash flows assumed hypothetical future sales and lease-up
requirements.
Deducted for debt service, debt repayment and partnership promoted interest, as applicable.
Vacant Land
Values based on market comparables sourced from MAI appraisals.
The estimated NAV is based upon assumptions and estimates believed to be accurate on 12/31/2017. Data is subject to change. Please see the Form
8-K for complete details.
CNL Healthcare Properties 17
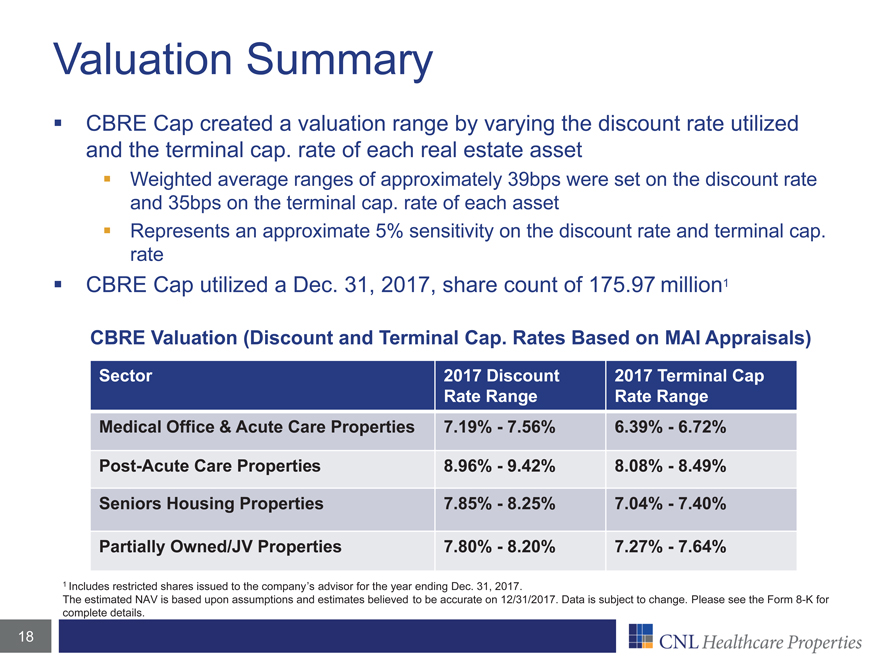
Valuation Summary
CBRE
Cap created a valuation range by varying the discount rate utilized and the terminal cap. rate of each real estate asset
Weighted average ranges of approximately
39bps were set on the discount rate and 35bps on the terminal cap. rate of each asset Represents an approximate 5% sensitivity on the discount rate and terminal cap. rate
CBRE Cap utilized a Dec. 31, 2017, share count of 175.97 million1
CBRE Valuation (Discount and
Terminal Cap. Rates Based on MAI Appraisals)
Sector 2017 Discount 2017 Terminal Cap
Rate Range Rate Range
Medical Office & Acute Care Properties 7.19% - 7.56% 6.39% -
6.72%
Post-Acute Care Properties 8.96% - 9.42% 8.08% - 8.49%
Seniors Housing
Properties 7.85% - 8.25% 7.04% - 7.40%
Partially Owned/JV Properties 7.80% - 8.20% 7.27% - 7.64%
1 Includes restricted shares issued to the company’s advisor for the year ending Dec. 31, 2017.
The estimated NAV is based upon assumptions and estimates believed to be accurate on 12/31/2017. Data is subject to change. Please see the Form
8-K for
complete details.
CNL
Healthcare Properties 18
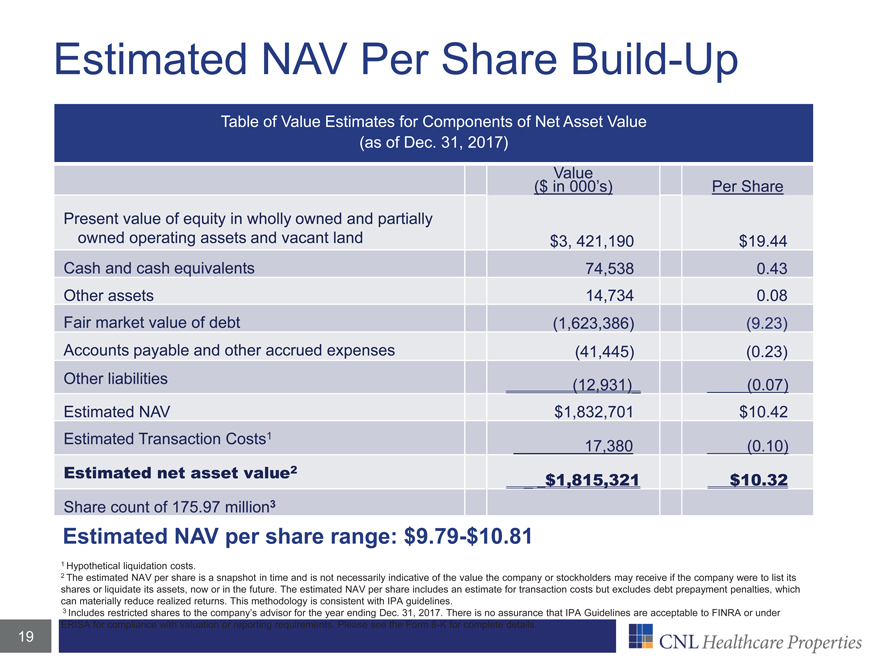
Estimated NAV Per Share Build-Up
Table of Value Estimates for Components of Net Asset Value (as of Dec. 31, 2017)
Value
($ in 000’s) Per Share
Present value of equity in wholly owned and
partially
owned operating assets and vacant land $3, 421,190 $19.44
Cash and
cash equivalents 74,538 0.43
Other assets 14,734 0.08
Fair market value of
debt (1,623,386) (9.23)
Accounts payable and other accrued expenses (41,445) (0.23)
Other liabilities (12,931)_ (0.07)
Estimated NAV $1,832,701 $10.42
Estimated Transaction Costs1 17,380 (0.10)
Estimated net asset value2 _ _$1,815,321 $10.32
Share count of 175.97 million3
Estimated NAV per share range: $9.79-$10.81
1 Hypothetical liquidation costs.
2 The estimated NAV per share is a snapshot in time and is not necessarily indicative of the value the company or stockholders may receive if the company were to list its shares or
liquidate its assets, now or in the future. The estimated NAV per share includes an estimate for transaction costs but excludes debt prepayment penalties, which can materially reduce realized returns. This methodology is consistent with IPA
guidelines.
3 Includes restricted shares to the company’s advisor for the year ending Dec. 31, 2017. There is no assurance that IPA Guidelines are acceptable
to FINRA or under
CNL Healthcare Properties 19
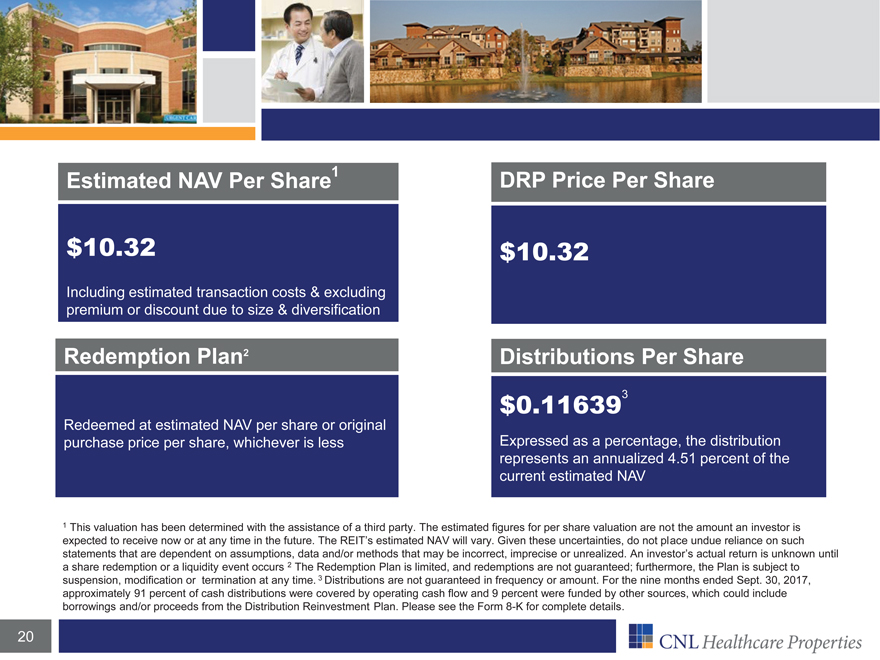
Estimated NAV Per Share1
$10.32
Including estimated transaction costs & excluding premium or
discount due to size & diversification
Redemption Plan2
Redeemed at
estimated NAV per share or original purchase price per share, whichever is less
DRP Price Per Share
$10.32
Distributions Per Share $0.116393
Expressed as a percentage, the distribution represents an annualized 4.51 percent of the current estimated NAV
1 This valuation has been determined with the assistance of a third party. The estimated figures for per share valuation are not the amount an investor is expected to receive now
or at any time in the future. The REIT’s estimated NAV will vary. Given these uncertainties, do not place undue reliance on such statements that are dependent on assumptions, data and/or methods that may be incorrect, imprecise or unrealized.
An investor’s actual return is unknown until a share redemption or a liquidity event occurs 2 The Redemption Plan is limited, and redemptions are not guaranteed; furthermore, the Plan is subject to suspension, modification or termination at any
time. 3 Distributions are not guaranteed in frequency or amount. For the nine months ended Sept. 30, 2017, approximately 91 percent of cash distributions were covered by operating cash flow and 9 percent were funded by other sources, which
could include borrowings and/or proceeds from the Distribution Reinvestment Plan. Please see the Form 8-K for complete details.
CNL Healthcare Properties 20
What’s Next?1
Maximize cash flow2 and operating performance Drive positive leasing momentum Early stage strategic alternatives process
1 There is no assurance these objectives will be met. Forward-looking statements are based on current expectations and may be identified by words such as “believes,”
“expects,” “may,” “could” and terms of similar substance, and speak only as of the date made. Actual results could differ materially due to risks and uncertainties that are beyond the company’s ability to control
or accurately predict. Investors should not place undue reliance on forward-looking statements.
2 For the nine months ended Sept. 30, 2017, approximately
91 percent of cash distributions were covered by operating cash flow and nine percent were funded by other sources. The REIT has experienced losses that are anticipated to be temporary and due to several properties that were under development.
Distributions paid from sources other than operating cash flow, now and in the future, are not sustainable and can reduce stockholders’ overall return.
CNL
Healthcare Properties 21

Thank you! Investors Please consult your financial advisor or visit cnlhealthcareproperties.com. Financial
Advisors Please contact our managing dealer, CNL Securities, Member FINRA/SIPC at 866-650-0650 or visit cnlsecurities.com. © 2018 CNL Healthcare Corp. All Rights
Reserved. CNL® and the Squares Within Squares design trademarks are used under license from CNL Intellectual Properties, Inc.
CNL Healthcare Properties 22