Attached files
| file | filename |
|---|---|
| EX-32.1 - EX-32.1 - CNL Healthcare Properties, Inc. | chp-ex321_6.htm |
| EX-31.1 - EX-31.1 - CNL Healthcare Properties, Inc. | chp-ex311_8.htm |
| EX-31.2 - EX-31.2 - CNL Healthcare Properties, Inc. | chp-ex312_7.htm |
UNITED STATES
SECURITIES AND EXCHANGE COMMISSION
Washington, D.C. 20549
FORM 10-Q
|
x |
QUARTERLY REPORT PURSUANT TO SECTION 13 OR 15 (d) OF THE SECURITIES EXCHANGE ACT OF 1934 |
For the quarterly period ended September 30, 2015
OR
|
o |
TRANSITION REPORT PURSUANT TO SECTION 13 OR 15 (d) OF THE SECURITIES EXCHANGE ACT OF 1934 |
For the transition period from to
Commission file number: 000-54685
CNL Healthcare Properties, Inc.
(Exact name of registrant as specified in its charter)
|
Maryland |
|
27-2876363 |
|
(State or other jurisdiction of incorporation or organization) |
|
(I.R.S. Employer Identification No.) |
|
|
|
|
|
CNL Center at City Commons 450 South Orange Avenue Orlando, Florida |
|
32801 |
|
(Address of principal executive offices) |
|
(Zip Code) |
Registrant’s telephone number, including area code (407) 650-1000
Indicate by check mark whether the registrant (1) has filed all reports required to be filed by Section 13 or 15(d) of the Securities Exchange Act of 1934 during the preceding 12 months (or for such shorter period that the registrant was required to file such reports), and (2) has been subject to such filing requirements for the past 90 days. Yes x No o
Indicate by check mark whether the registrant has submitted electronically and posted on its corporate Web site, if any, every Interactive Data File required to be submitted and posted pursuant to Rule 405 of Regulation S-T (§232.405 of this chapter) during the preceding 12 months (or for such shorter period that the registrant was required to submit and post such files). Yes x No o
Indicate by check mark whether the registrant is a large accelerated filer, an accelerated filer, a non-accelerated filer, or a smaller reporting company. See the definitions of “large accelerated filer,” “accelerated filer” and “smaller reporting company” in Rule 12b-2 of the Exchange Act.
|
Large accelerated filer |
o |
Accelerated filer |
o |
|
|
|
|
|
|
Non-accelerated filer |
x (Do not check if a smaller reporting company) |
Smaller reporting company |
o |
Indicate by check mark whether the registrant is a shell company (as defined in Rule 12b-2 of the Exchange Act). Yes o No x
The number of shares of common stock of the registrant outstanding as of November 11, 2015 was 173,657,093.
CNL HEALTHCARE PROPERTIES, INC. AND SUBSIDIARIES
INDEX
|
|
|
Page |
|
PART I. FINANCIAL INFORMATION |
|
|
|
|
|
|
|
Item 1. Condensed Consolidated Financial Information (unaudited): |
|
|
|
|
2 |
|
|
|
3 |
|
|
|
4 |
|
|
Condensed Consolidated Statements of Stockholders’ Equity and Redeemable Noncontrolling Interest |
|
5 |
|
|
6 |
|
|
|
7 |
|
|
Item 2. Management’s Discussion and Analysis of Financial Condition and Results of Operations |
|
31 |
|
Item 3. Quantitative and Qualitative Disclosures about Market Risk |
|
52 |
|
|
53 |
|
|
|
|
|
|
PART II. OTHER INFORMATION |
|
|
|
|
|
|
|
|
54 |
|
|
|
54 |
|
|
Item 2. Unregistered Sales of Equity Securities and Use of Proceeds |
|
54 |
|
|
54 |
|
|
|
54 |
|
|
|
54 |
|
|
|
54 |
|
|
|
|
|
|
|
55 |
|
|
|
56 |
CNL HEALTHCARE PROPERTIES, INC. AND SUBSIDIARIES
CONDENSED CONSOLIDATED BALANCE SHEETS (UNAUDITED)
(in thousands, except per share data)
|
|
|
September 30, |
|
|
December 31, |
|
||
|
|
|
2015 |
|
|
2014 |
|
||
|
ASSETS |
|
|
|
|
|
|
|
|
|
Real estate assets: |
|
|
|
|
|
|
|
|
|
Real estate investment properties, net (including VIEs $192,663 and $174,449, respectively) |
|
$ |
2,251,200 |
|
|
$ |
1,657,500 |
|
|
Real estate under development, including land (including VIEs $67,350 and $47,153, respectively) |
|
|
69,478 |
|
|
|
47,153 |
|
|
Total real estate assets, net |
|
|
2,320,678 |
|
|
|
1,704,653 |
|
|
Intangibles, net (including VIEs $24,426 and $25,519, respectively) |
|
|
163,538 |
|
|
|
140,264 |
|
|
Cash (including VIEs $1,462 and $6,280, respectively) |
|
|
51,185 |
|
|
|
91,355 |
|
|
Other assets (including VIEs $862 and $511, respectively) |
|
|
22,024 |
|
|
|
19,738 |
|
|
Deferred rent and lease incentives (including VIEs $6,330 and $2,978, respectively) |
|
|
21,244 |
|
|
|
8,240 |
|
|
Loan costs, net (including VIEs $2,497 and $2,300, respectively) |
|
|
12,604 |
|
|
|
14,012 |
|
|
Restricted cash (including VIEs $2,053 and $5,304, respectively) |
|
|
8,816 |
|
|
|
10,753 |
|
|
Total assets |
|
$ |
2,600,089 |
|
|
$ |
1,989,015 |
|
|
LIABILITIES AND EQUITY |
|
|
|
|
|
|
|
|
|
Liabilities: |
|
|
|
|
|
|
|
|
|
Mortgages and other notes payable, net (including VIEs $172,537 and $137,754, respectively) |
|
$ |
865,263 |
|
|
$ |
853,561 |
|
|
Credit facilities |
|
|
390,000 |
|
|
|
206,403 |
|
|
Accounts payable and accrued liabilities (including VIEs $10,351 and $10,268, respectively) |
|
|
39,862 |
|
|
|
26,444 |
|
|
Other liabilities (including VIEs $4,551 and $4,949, respectively) |
|
|
37,880 |
|
|
|
27,448 |
|
|
Due to related parties (including VIEs $171 and $219, respectively) |
|
|
5,620 |
|
|
|
2,999 |
|
|
Total liabilities |
|
|
1,338,625 |
|
|
|
1,116,855 |
|
|
Commitments and contingencies (Note 14) |
|
|
|
|
|
|
|
|
|
Redeemable noncontrolling interest |
|
|
568 |
|
|
|
568 |
|
|
Stockholders' equity: |
|
|
|
|
|
|
|
|
|
Preferred stock, $0.01 par value per share, 200,000 shares authorized; none issued or outstanding |
|
― |
|
|
― |
|
||
|
Excess shares, $0.01 par value per share, 300,000 shares authorized; none issued or outstanding |
|
― |
|
|
― |
|
||
|
Common stock, $0.01 par value per share, 1,120,000 shares authorized, 172,682 and 116,672 shares issued, and 171,575 and 116,256 shares outstanding, respectively |
|
|
1,715 |
|
|
|
1,163 |
|
|
Capital in excess of par value |
|
|
1,501,420 |
|
|
|
1,007,326 |
|
|
Accumulated loss |
|
|
(133,725 |
) |
|
|
(83,091 |
) |
|
Accumulated distributions |
|
|
(94,233 |
) |
|
|
(49,342 |
) |
|
Accumulated other comprehensive loss |
|
|
(14,649 |
) |
|
|
(4,864 |
) |
|
Total stockholders' equity |
|
|
1,260,528 |
|
|
|
871,192 |
|
|
Noncontrolling interest |
|
|
368 |
|
|
|
400 |
|
|
Total equity |
|
|
1,261,464 |
|
|
|
872,160 |
|
|
Total liabilities and equity |
|
$ |
2,600,089 |
|
|
$ |
1,989,015 |
|
|
The abbreviation VIEs above means variable interest entities. |
|
|
|
|
|
|
|
|
See accompanying notes to condensed consolidated financial statements
2
CNL HEALTHCARE PROPERTIES, INC. AND SUBSIDIARIES
CONDENSED CONSOLIDATED STATEMENTS OF OPERATIONS (UNAUDITED)
(in thousands, except per share data)
|
|
|
Quarter Ended |
|
|
Nine Months Ended |
|
||||||||||
|
|
|
September 30, |
|
|
September 30, |
|
||||||||||
|
|
|
2015 |
|
|
2014 |
|
|
2015 |
|
|
2014 |
|
||||
|
Revenues: |
|
|
|
|
|
|
|
|
|
|
|
|
|
|
|
|
|
Rental income from operating leases |
|
$ |
28,435 |
|
|
$ |
13,393 |
|
|
$ |
72,306 |
|
|
$ |
33,478 |
|
|
Resident fees and services |
|
|
47,505 |
|
|
|
34,162 |
|
|
|
129,262 |
|
|
|
86,636 |
|
|
Tenant reimbursement income |
|
|
3,964 |
|
|
|
1,957 |
|
|
|
10,845 |
|
|
|
4,787 |
|
|
Interest income on note receivable from related party |
|
― |
|
|
|
148 |
|
|
― |
|
|
|
498 |
|
||
|
Total revenues |
|
|
79,904 |
|
|
|
49,660 |
|
|
|
212,413 |
|
|
|
125,399 |
|
|
Operating expenses: |
|
|
|
|
|
|
|
|
|
|
|
|
|
|
|
|
|
Property operating expenses |
|
|
39,923 |
|
|
|
25,716 |
|
|
|
105,088 |
|
|
|
64,703 |
|
|
General and administrative |
|
|
2,239 |
|
|
|
1,997 |
|
|
|
6,823 |
|
|
|
5,689 |
|
|
Acquisition fees and expenses |
|
|
9,073 |
|
|
|
3,729 |
|
|
|
15,939 |
|
|
|
15,726 |
|
|
Asset management fees |
|
|
5,085 |
|
|
|
2,753 |
|
|
|
13,426 |
|
|
|
5,572 |
|
|
Property management fees |
|
|
3,923 |
|
|
|
2,358 |
|
|
|
10,539 |
|
|
|
6,118 |
|
|
Contingent purchase price consideration adjustment |
|
|
(268 |
) |
|
|
1,800 |
|
|
|
(589 |
) |
|
|
479 |
|
|
Impairment provision |
|
― |
|
|
― |
|
|
|
4,661 |
|
|
― |
|
|||
|
Loss on lease terminations |
|
― |
|
|
― |
|
|
|
863 |
|
|
― |
|
|||
|
Depreciation and amortization |
|
|
27,854 |
|
|
|
17,550 |
|
|
|
75,147 |
|
|
|
44,111 |
|
|
Total operating expenses |
|
|
87,829 |
|
|
|
55,903 |
|
|
|
231,897 |
|
|
|
142,398 |
|
|
Operating loss |
|
|
(7,925 |
) |
|
|
(6,243 |
) |
|
|
(19,484 |
) |
|
|
(16,999 |
) |
|
Other income (expense): |
|
|
|
|
|
|
|
|
|
|
|
|
|
|
|
|
|
Interest and other income |
|
|
28 |
|
|
|
7 |
|
|
|
138 |
|
|
|
27 |
|
|
Interest expense and loan cost amortization |
|
|
(10,990 |
) |
|
|
(8,549 |
) |
|
|
(30,369 |
) |
|
|
(21,654 |
) |
|
Equity in loss of unconsolidated entities |
|
|
(151 |
) |
|
|
(180 |
) |
|
|
(656 |
) |
|
|
(1,193 |
) |
|
Gain on purchase of controlling interest of investment in unconsolidated entity |
|
― |
|
|
|
2,798 |
|
|
― |
|
|
|
2,798 |
|
||
|
Total other expense |
|
|
(11,113 |
) |
|
|
(5,924 |
) |
|
|
(30,887 |
) |
|
|
(20,022 |
) |
|
Loss before income taxes |
|
|
(19,038 |
) |
|
|
(12,167 |
) |
|
|
(50,371 |
) |
|
|
(37,021 |
) |
|
Income tax expense |
|
|
(193 |
) |
|
|
(37 |
) |
|
|
(279 |
) |
|
|
(9 |
) |
|
Net loss |
|
|
(19,231 |
) |
|
|
(12,204 |
) |
|
|
(50,650 |
) |
|
|
(37,030 |
) |
|
Less: Net loss attributable to noncontrolling interest |
|
|
(6 |
) |
|
― |
|
|
|
(16 |
) |
|
― |
|
||
|
Net loss attributable to common stockholders |
|
$ |
(19,225 |
) |
|
$ |
(12,204 |
) |
|
$ |
(50,634 |
) |
|
$ |
(37,030 |
) |
|
Net loss per share of common stock (basic and diluted) |
|
$ |
(0.12 |
) |
|
$ |
(0.14 |
) |
|
$ |
(0.34 |
) |
|
$ |
(0.47 |
) |
|
Weighted average number of shares of common stock outstanding (basic and diluted) |
|
|
162,730 |
|
|
|
89,597 |
|
|
|
147,075 |
|
|
|
78,296 |
|
See accompanying notes to condensed consolidated financial statements.
3
CNL HEALTHCARE PROPERTIES, INC. AND SUBSIDIARIES
CONDENSED CONSOLIDATED STATEMENTS OF COMPREHENSIVE LOSS (UNAUDITED)
(in thousands)
|
|
|
Quarter Ended |
|
|
Nine Months Ended |
|
||||||||||
|
|
|
September 30, |
|
|
September 30, |
|
||||||||||
|
|
|
2015 |
|
|
2014 |
|
|
2015 |
|
|
2014 |
|
||||
|
Net loss attributable to common stockholders |
|
$ |
(19,225 |
) |
|
$ |
(12,204 |
) |
|
$ |
(50,634 |
) |
|
$ |
(37,030 |
) |
|
Other comprehensive income (loss): |
|
|
|
|
|
|
|
|
|
|
|
|
|
|
|
|
|
Unrealized income (loss) on derivative financial instruments, net |
|
|
(6,435 |
) |
|
|
224 |
|
|
|
(10,060 |
) |
|
|
(872 |
) |
|
Reclassification of cash flow hedges upon derecognition |
|
|
— |
|
|
|
— |
|
|
|
236 |
|
|
|
— |
|
|
Reclassification of cash flow hedges due to ineffectiveness |
|
|
48 |
|
|
|
— |
|
|
|
48 |
|
|
|
— |
|
|
Unrealized income (loss) on derivative financial instruments of equity method investments |
|
|
(1 |
) |
|
|
(2 |
) |
|
|
(9 |
) |
|
|
21 |
|
|
Total other comprehensive income (loss) |
|
|
(6,388 |
) |
|
|
222 |
|
|
|
(9,785 |
) |
|
|
(851 |
) |
|
Comprehensive loss |
|
|
(25,613 |
) |
|
|
(11,982 |
) |
|
|
(60,419 |
) |
|
|
(37,881 |
) |
|
Less: Comprehensive loss attributable to noncontrolling interest |
|
|
— |
|
|
|
— |
|
|
|
— |
|
|
|
— |
|
|
Comprehensive loss attributable to common stockholders |
|
$ |
(25,613 |
) |
|
$ |
(11,982 |
) |
|
$ |
(60,419 |
) |
|
$ |
(37,881 |
) |
See accompanying notes to condensed consolidated financial statements.
4
CNL HEALTHCARE PROPERTIES, INC. AND SUBSIDIARIES
CONDENSED CONSOLIDATED STATEMENTS OF STOCKHOLDERS’ EQUITY AND REDEEMABLE NONCONTROLLING INTEREST
Nine Months Ended September 30, 2015 (Unaudited) and the Year Ended December 31, 2014
(in thousands, except per share data)
|
|
|
|
|
|
|
|
|
|
|
|
|
|
|
|
|
|
|
|
|
|
|
|
|
|
|
Accumulated |
|
|
|
|
|
|
|
|
|
|
|
|
|
|
|
|
|
Redeemable |
|
|
Common Stock |
|
|
Capital in |
|
|
|
|
|
|
|
|
|
|
Other |
|
|
Total |
|
|
Non- |
|
|
|
|
|
||||||||||
|
|
|
Noncontrolling |
|
|
Number |
|
|
Par |
|
|
Excess of |
|
|
Accumulated |
|
|
Accumulated |
|
|
Comprehensive |
|
|
Stockholders' |
|
|
controlling |
|
|
Total |
|
||||||||||
|
|
|
Interest |
|
|
of Shares |
|
|
Value |
|
|
Par Value |
|
|
Loss |
|
|
Distributions |
|
|
Loss |
|
|
Equity |
|
|
Interest |
|
|
Equity |
|
||||||||||
|
Balance at December 31, 2013 |
|
$ |
— |
|
|
|
58,218 |
|
|
$ |
582 |
|
|
$ |
500,361 |
|
|
$ |
(30,580 |
) |
|
$ |
(17,423 |
) |
|
$ |
(959 |
) |
|
$ |
451,981 |
|
|
$ |
— |
|
|
$ |
451,981 |
|
|
Subscriptions received for common stock through public offering and reinvestment plan |
|
|
— |
|
|
|
56,006 |
|
|
|
560 |
|
|
|
571,764 |
|
|
|
— |
|
|
|
— |
|
|
|
— |
|
|
|
572,324 |
|
|
|
— |
|
|
|
572,324 |
|
|
Stock distributions |
|
|
— |
|
|
|
2,356 |
|
|
|
24 |
|
|
|
(24 |
) |
|
|
— |
|
|
|
— |
|
|
|
— |
|
|
|
— |
|
|
|
— |
|
|
|
— |
|
|
Redemptions of common stock |
|
|
— |
|
|
|
(324 |
) |
|
|
(3 |
) |
|
|
(2,993 |
) |
|
|
— |
|
|
|
— |
|
|
|
— |
|
|
|
(2,996 |
) |
|
|
— |
|
|
|
(2,996 |
) |
|
Stock issuance and offering costs |
|
|
— |
|
|
|
— |
|
|
|
— |
|
|
|
(59,782 |
) |
|
|
— |
|
|
|
— |
|
|
|
— |
|
|
|
(59,782 |
) |
|
|
— |
|
|
|
(59,782 |
) |
|
Net loss |
|
|
— |
|
|
|
— |
|
|
|
— |
|
|
|
— |
|
|
|
(52,511 |
) |
|
|
— |
|
|
|
— |
|
|
|
(52,511 |
) |
|
|
— |
|
|
|
(52,511 |
) |
|
Other comprehensive loss |
|
|
— |
|
|
|
— |
|
|
|
— |
|
|
|
— |
|
|
|
— |
|
|
|
— |
|
|
|
(3,905 |
) |
|
|
(3,905 |
) |
|
|
— |
|
|
|
(3,905 |
) |
|
Distribution to holder of promoted interest |
|
|
— |
|
|
|
— |
|
|
|
— |
|
|
|
(2,000 |
) |
|
|
— |
|
|
|
— |
|
|
|
— |
|
|
|
(2,000 |
) |
|
|
— |
|
|
|
(2,000 |
) |
|
Cash distributions declared and paid or reinvested ($0.4071 per share) |
|
|
— |
|
|
|
— |
|
|
|
— |
|
|
|
— |
|
|
|
— |
|
|
|
(31,919 |
) |
|
|
— |
|
|
|
(31,919 |
) |
|
|
— |
|
|
|
(31,919 |
) |
|
Contribution from noncontrolling interests |
|
|
568 |
|
|
|
— |
|
|
|
— |
|
|
|
— |
|
|
|
— |
|
|
|
— |
|
|
|
— |
|
|
― |
|
|
|
400 |
|
|
|
968 |
|
|
|
Balance at December 31, 2014 |
|
|
568 |
|
|
|
116,256 |
|
|
|
1,163 |
|
|
|
1,007,326 |
|
|
|
(83,091 |
) |
|
|
(49,342 |
) |
|
|
(4,864 |
) |
|
|
871,192 |
|
|
|
400 |
|
|
|
872,160 |
|
|
Subscriptions received for common stock through public offering and reinvestment plan |
|
|
— |
|
|
|
52,815 |
|
|
|
528 |
|
|
|
555,629 |
|
|
|
— |
|
|
|
— |
|
|
|
— |
|
|
|
556,157 |
|
|
|
— |
|
|
|
556,157 |
|
|
Stock distributions |
|
|
— |
|
|
|
3,196 |
|
|
|
31 |
|
|
|
(31 |
) |
|
|
— |
|
|
|
— |
|
|
|
— |
|
|
|
— |
|
|
|
— |
|
|
|
— |
|
|
Redemptions of common stock |
|
|
— |
|
|
|
(692 |
) |
|
|
(7 |
) |
|
|
(6,627 |
) |
|
|
— |
|
|
|
— |
|
|
|
— |
|
|
|
(6,634 |
) |
|
|
— |
|
|
|
(6,634 |
) |
|
Stock issuance and offering costs |
|
|
— |
|
|
|
— |
|
|
|
— |
|
|
|
(54,877 |
) |
|
|
— |
|
|
|
— |
|
|
|
— |
|
|
|
(54,877 |
) |
|
|
— |
|
|
|
(54,877 |
) |
|
Net loss |
|
|
— |
|
|
|
— |
|
|
|
— |
|
|
|
— |
|
|
|
(50,634 |
) |
|
|
— |
|
|
|
— |
|
|
|
(50,634 |
) |
|
|
(16 |
) |
|
|
(50,650 |
) |
|
Other comprehensive loss |
|
|
— |
|
|
|
— |
|
|
|
— |
|
|
|
— |
|
|
|
— |
|
|
|
— |
|
|
|
(9,785 |
) |
|
|
(9,785 |
) |
|
|
— |
|
|
|
(9,785 |
) |
|
Distribution to holder of noncontrolling interest |
|
|
— |
|
|
|
— |
|
|
|
— |
|
|
|
— |
|
|
|
— |
|
|
|
— |
|
|
|
— |
|
|
|
— |
|
|
|
(16 |
) |
|
|
(16 |
) |
|
Cash distributions declared and paid or reinvested ($0.3177 per share) |
|
|
— |
|
|
|
— |
|
|
|
— |
|
|
|
— |
|
|
|
— |
|
|
|
(44,891 |
) |
|
|
— |
|
|
|
(44,891 |
) |
|
|
|
|
|
|
(44,891 |
) |
|
Balance at September 30, 2015 |
|
$ |
568 |
|
|
|
171,575 |
|
|
$ |
1,715 |
|
|
$ |
1,501,420 |
|
|
$ |
(133,725 |
) |
|
$ |
(94,233 |
) |
|
$ |
(14,649 |
) |
|
$ |
1,260,528 |
|
|
$ |
368 |
|
|
$ |
1,261,464 |
|
See accompanying notes to condensed consolidated financial statements.
5
CNL HEALTHCARE PROPERTIES, INC. AND SUBSIDIARIES
CONDENSED CONSOLIDATED STATEMENTS OF CASH FLOWS (UNAUDITED)
(in thousands)
|
|
|
Nine Months Ended |
|
|||||
|
|
|
September 30, |
|
|||||
|
|
|
2015 |
|
|
2014 |
|
||
|
Operating activities: |
|
|
|
|
|
|
|
|
|
Net cash flows provided by operating activities |
|
$ |
32,393 |
|
|
$ |
18,673 |
|
|
Investing activities: |
|
|
|
|
|
|
|
|
|
Acquisition of properties |
|
|
(647,538 |
) |
|
|
(524,654 |
) |
|
Development of properties |
|
|
(54,411 |
) |
|
|
(32,893 |
) |
|
Capital expenditures |
|
|
(5,840 |
) |
|
|
(2,570 |
) |
|
Issuance of note receivable to related party |
|
― |
|
|
|
(2,065 |
) |
|
|
Collection of note receivable from related party |
|
― |
|
|
|
5,591 |
|
|
|
Distribution from unconsolidated entities |
|
― |
|
|
|
2,206 |
|
|
|
Purchase of controlling interest in unconsolidated entity |
|
― |
|
|
|
(1,584 |
) |
|
|
Investment in unconsolidated entities |
|
― |
|
|
|
(220 |
) |
|
|
Changes in restricted cash |
|
|
1,937 |
|
|
|
(3,539 |
) |
|
Payment of tenant improvements |
|
― |
|
|
|
(797 |
) |
|
|
Payment of leasing costs |
|
|
(1,904 |
) |
|
|
(324 |
) |
|
Deposits on real estate |
|
|
(1,900 |
) |
|
|
(2,950 |
) |
|
Net cash used in investing activities |
|
|
(709,656 |
) |
|
|
(563,799 |
) |
|
Financing activities: |
|
|
|
|
|
|
|
|
|
Subscriptions received for common stock through public offering |
|
|
530,083 |
|
|
|
333,960 |
|
|
Payment of stock issuance and offering costs |
|
|
(55,626 |
) |
|
|
(36,575 |
) |
|
Distributions to stockholders, net of distribution reinvestments |
|
|
(18,816 |
) |
|
|
(9,782 |
) |
|
Distribution to holder of promoted interest |
|
― |
|
|
|
(2,000 |
) |
|
|
Contribution from redeemable noncontrolling interest |
|
― |
|
|
|
568 |
|
|
|
Distributions to holder of noncontrolling interest |
|
|
(16 |
) |
|
― |
|
|
|
Redemptions of common stock |
|
|
(4,725 |
) |
|
|
(1,068 |
) |
|
Draws under revolving credit facility |
|
|
215,000 |
|
|
|
112,115 |
|
|
Repayment on revolving credit facility |
|
|
(31,403 |
) |
|
|
(30,000 |
) |
|
Proceeds from mortgage and other notes payable |
|
|
84,888 |
|
|
|
245,587 |
|
|
Principal payments on mortgage and other notes payable |
|
|
(80,270 |
) |
|
|
(24,096 |
) |
|
Lender deposits |
|
|
(36 |
) |
|
|
(335 |
) |
|
Payment of loan costs |
|
|
(1,986 |
) |
|
|
(3,974 |
) |
|
Net cash flows provided by financing activities |
|
|
637,093 |
|
|
|
584,400 |
|
|
Net increase (decrease) in cash |
|
|
(40,170 |
) |
|
|
39,274 |
|
|
Cash at beginning of period |
|
|
91,355 |
|
|
|
44,209 |
|
|
Cash at end of period |
|
$ |
51,185 |
|
|
$ |
83,483 |
|
|
Supplemental disclosure of non-cash investing and financing activities: |
|
|
|
|
|
|
|
|
|
Amounts incurred but not paid (including amounts due to related parties): |
|
|
|
|
|
|
|
|
|
Accrued development costs |
|
$ |
9,100 |
|
|
$ |
4,683 |
|
|
Redemptions payable |
|
$ |
2,781 |
|
|
$ |
1,178 |
|
|
Contingent purchase price consideration |
|
$ |
3,000 |
|
|
$ |
— |
|
|
Unrealized loss on derivative financial instruments, net |
|
$ |
14,699 |
|
|
$ |
1,798 |
|
|
Assumption of liabilities on acquisition of property |
|
$ |
2,502 |
|
|
$ |
— |
|
|
Assumption of mortgage note payable on acquisition of property |
|
$ |
7,128 |
|
|
$ |
27,657 |
|
See accompanying notes to condensed consolidated financial statements.
6
CNL HEALTHCARE PROPERTIES, INC. AND SUBSIDIARIES
NOTES TO CONDENSED CONSOLIDATED FINANCIAL STATEMENTS
NINE MONTHS ENDED SEPTEMBER 30, 2015 (UNAUDITED)
CNL Healthcare Properties, Inc. (“Company”) is a Maryland corporation incorporated on June 8, 2010 that elected to be taxed as a real estate investment trust (“REIT”) for U.S. federal income tax purposes beginning with the year ended December 31, 2012. The Company is externally advised by CNL Healthcare Corp. (“Advisor”) and its property manager is CNL Healthcare Manager Corp. (“Property Manager”), each of which is a Florida corporation and a wholly owned subsidiary of CNL Financial Group, LLC (“Sponsor”). The Sponsor is an affiliate of CNL Financial Group, Inc. (“CNL”) and CNL Securities Corp., the managing dealer of the Offerings and a wholly owned subsidiary of CNL (“Managing Dealer”). The Advisor is responsible for managing the Company’s affairs on a day-to-day basis and for identifying and making acquisitions and investments on behalf of the Company pursuant to an advisory agreement among the Company, the operating partnership and the Advisor. Substantially all of the Company’s acquisition, operating, administrative and certain property management services are provided by affiliates of the Advisor and the Property Manager. In addition, third-party sub-property managers have been engaged to provide certain property management services.
The Company conducts substantially all of its operations either directly or indirectly through: (1) an operating partnership, CHP Partners, LP, in which the Company is the sole limited partner and its wholly owned subsidiary, CHP GP, LLC, is the sole general partner; (2) a wholly owned taxable REIT subsidiary (“TRS”), CHP TRS Holding, Inc.; (3) property owner subsidiaries and lender subsidiaries, which are single purpose entities; and (4) investments in joint ventures.
On June 27, 2011, the Company commenced its initial public offering (“Initial Offering”), including shares being offered through its distribution reinvestment plan (“Reinvestment Plan”), pursuant to a registration statement on Form S-11 under the Securities Act of 1933 with the Securities and Exchange Commission (“SEC”). In addition, the Company filed a follow-on registration statement on Form S-11 under the Securities Act of 1933 with the SEC in connection with the proposed offering of up to $1 billion in shares of common stock (“Follow-On Offering”), which was declared effective on February 2, 2015. Accordingly, the Company closed its Initial Offering and commenced its Follow-On Offering (collectively, the “Offerings”). The Company closed its Follow-On Offering on September 30, 2015 and discontinued its stock distributions concurrently.
The Company’s investment focus is on acquiring a diversified portfolio of healthcare real estate or real estate-related assets, primarily in the United States, within the seniors housing, medical office, post-acute care and acute care asset classes. The types of seniors housing that the Company may acquire include active adult communities (age-restricted and age-targeted housing), independent and assisted living facilities, continuing care retirement communities, and Alzheimer’s / memory care facilities. The types of medical offices that the Company may acquire include medical office buildings, specialty medical and diagnostic service facilities, surgery centers, outpatient rehabilitation facilities, and other facilities designed for clinical services. The types of post-acute care facilities that the Company may acquire include skilled nursing facilities, long-term acute care hospitals and inpatient rehabilitative hospitals. The types of acute care facilities that the Company may acquire include general acute care hospitals and specialty surgical hospitals. The Company views, manages and evaluates its portfolio homogeneously as one collection of healthcare assets with a common goal of maximizing revenues and property income regardless of the asset class or asset type.
The Company is committed to investing the remaining proceeds of its Offerings through strategic investment types aimed to maximize stockholder value by generating sustainable cash flow growth and increasing the value of its healthcare assets. The Company expects to primarily lease its seniors housing properties to wholly owned TRS entities and engage independent third-party managers under management agreements to operate the properties under REIT Investment Diversification and Empowerment Act of 2007 (“RIDEA”) structures; however, the Company may also lease its properties to third-party tenants under triple-net or similar lease structures, where the tenant bears all or substantially all of the costs (including cost increases, for real estate taxes, utilities, insurance and ordinary repairs). Medical office, post-acute care and acute care properties will be leased on a triple-net, net or modified gross basis to third-party tenants. In addition, the Company expects most investments will be wholly owned, although, it has and may continue to invest through partnerships with other entities where it is believed to be appropriate and beneficial.
The Company has and may continue to invest in new property developments or properties that have not reached full stabilization. Finally, the Company also may invest in and originate mortgage, bridge or mezzanine loans or in entities that make investments similar to the foregoing investment types. The Company generally makes loans to the owners of properties to enable them to acquire land, buildings, or to develop property. In exchange, the owner generally grants the Company a first lien or collateralized interest in a participating mortgage collateralized by the property or by interests in the entity that owns the property.
7
CNL HEALTHCARE PROPERTIES, INC. AND SUBSIDIARIES
NOTES TO CONDENSED CONSOLIDATED FINANCIAL STATEMENTS
NINE MONTHS ENDED SEPTEMBER 30, 2015 (UNAUDITED)
|
2. |
Summary of Significant Accounting Policies |
Basis of Presentation and Consolidation — The accompanying unaudited condensed consolidated financial statements have been prepared in accordance with the instructions to Form 10-Q and do not include all of the information and note disclosures required by generally accepted accounting principles in the United States (“GAAP”). The unaudited condensed consolidated financial statements reflect all normal recurring adjustments, which, in the opinion of management, are necessary for the fair statement of the Company’s results for the interim period presented. Operating results for the quarter and nine months ended September 30, 2015 may not be indicative of the results that may be expected for the year ending December 31, 2015. Amounts as of December 31, 2014 included in the unaudited condensed consolidated financial statements have been derived from audited consolidated financial statements as of that date but do not include all disclosures required by GAAP. These unaudited condensed consolidated financial statements should be read in conjunction with the audited consolidated financial statements and notes thereto included in the Company’s Annual Report on Form 10-K for the year ended December 31, 2014.
The accompanying unaudited condensed consolidated financial statements include the Company’s accounts and the accounts of its wholly owned subsidiaries or subsidiaries for which the Company has a controlling financial interest, including the accounts of variable interest entities (“VIEs”) in which the Company is the primary beneficiary. All material intercompany accounts and transactions have been eliminated in consolidation.
In accordance with the guidance for the consolidation of VIEs, the Company analyzes its variable interests, including loans, leases, guarantees, and equity investments, to determine if the entity in which it has a variable interest is a variable interest entity (“VIE”). The Company’s analysis includes both quantitative and qualitative reviews. The Company bases its quantitative analysis on the forecasted cash flows of the entity, and its qualitative analysis on its review of the design of the entity, its organizational structure including decision-making ability and financial agreements. The Company also uses its quantitative and qualitative analyses to determine if it is the primary beneficiary of the VIE, and if such determination is made, it includes the accounts of the VIE in its consolidated financial statements.
Use of Estimates — The preparation of financial statements in conformity with GAAP requires management to make estimates and assumptions that affect the reported amounts of assets and liabilities as of the date of the financial statements, the reported amounts of revenues and expenses during the reporting periods and the disclosure of contingent liabilities. For example, significant assumptions are made in the allocation of purchase price, the analysis of real estate impairments, the valuation of contingent assets and liabilities, and the valuation of restricted stock shares issued. Accordingly, actual results could differ from those estimates.
Adopted Accounting Pronouncements — In April 2014, the Financial Accounting Standards Board (“FASB”) issued Accounting Standard Update (“ASU”) No. 2014-08, “Presentation of Financial Statements (Topic 205) and Property, Plant, and Equipment (Topic 360): Reporting Discontinued Operations and Disclosures of Disposals of Components of an Entity.” This update changes the criteria for reporting discontinued operations where only disposals representing a strategic shift that has (or will have) a major effect on an entity’s operations and financial results, such as a major line of business or geographical area, should be presented as a discontinued operation. This ASU is effective prospectively for all disposals (or classifications as held for sale) of components of an entity that occur within annual periods beginning on or after December 15, 2014 with early adoption permitted. The Company has determined that the amendments will impact the Company’s determinations of which future property disposals, if any, qualify as discontinued operations and will require additional disclosure about discontinued operations for future property disposals, if any.
Recent Accounting Pronouncements — In May 2014, the FASB issued ASU No. 2014-09, “Revenue from Contracts with Customers,” as a new Accounting Standard Concept (“ASC”) topic (Topic 606). The core principle of this amendment is that an entity should recognize revenue to depict the transfer of promised goods or services to customers in an amount that reflects the consideration to which the entity expects to be entitled in exchange for those goods or services. The standard further provides guidance for any entity that either enters into contracts with customers to transfer goods or services or enters into contracts for the transfer of nonfinancial assets, unless those contracts are within the scope of other standards (for example, lease contracts). The FASB subsequently issued ASU 2015-14 to defer the effective date of ASU 2014-09 until annual reporting periods beginning after December 15, 2017, including interim periods within that reporting period, with earlier adoption permitted. ASU 2014-09 can be adopted using one of two retrospective transition methods: 1) retrospectively to each prior reporting period presented or 2) as a cumulative-effect adjustment as of the date of adoption. The Company has not yet selected a transition method and is currently evaluating the impact of ASU 2014-09; however, its adoption could potentially have a significant effect on the Company’s consolidated financial position, results of operations or cash flows.
8
CNL HEALTHCARE PROPERTIES, INC. AND SUBSIDIARIES
NOTES TO CONDENSED CONSOLIDATED FINANCIAL STATEMENTS
NINE MONTHS ENDED SEPTEMBER 30, 2015 (UNAUDITED)
|
2. |
Summary of Significant Accounting Policies (continued) |
In February 2015, the FASB issued ASU 2015-02, “Consolidation (Topic 810): Amendments to the Consolidation Analysis,” which requires amendments to both the variable interest entity and voting models. The amendments (i) modify the identification of variable interests (fees paid to a decision maker or service provider), the VIE characteristics for a limited partnership or similar entity and primary beneficiary determination under the VIE model, and (ii) eliminate the presumption within the current voting model that a general partner controls a limited partnership or similar entity. The new guidance is effective for annual reporting periods, and interim periods within those annual periods, beginning after December 15, 2015 with early adoption permitted. The amendments may be applied using either a modified retrospective or full retrospective approach. The Company has determined that it will not early adopt this ASU and is currently evaluating the effect the guidance will have on its consolidated financial position, results of operations or cash flows.
In April 2015, the FASB issued ASU 2015-03, “Interest-Imputation of Interest (Subtopic 835-30): Simplifying the Presentation of Debt Issuance Costs,” which requires that loan costs related to a recognized debt liability be presented in the balance sheet as a direct deduction from the carrying amount of that debt liability, consistent with debt discounts or premiums. The new guidance is effective for annual reporting periods, and interim periods within those annual periods, beginning after December 15, 2015 with early adoption permitted. The ASU is to be applied retrospectively for each period presented. Upon adoption, an entity is required to comply with the applicable disclosures for a change in an accounting principle. The FASB subsequently issued ASU 2015-15, “Presentation and Subsequent Measurement of Debt Issuance Costs Associated with Line-of-Credit Arrangements,” which clarifies that, given the absence of authoritative guidance in ASU 2015-03 regarding presentation and subsequent measurement of loan costs related to line-of-credit arrangements, the SEC Staff would not object to an entity deferring and presenting loan costs as an asset and subsequently amortizing the loan costs ratably over the term of the line-of-credit arrangement, regardless of whether there are any outstanding borrowings on the line-of-credit arrangement. The Company has determined that it will not early adopt this ASU and that the amendments will materially impact the presentation of the Company’s consolidated financial position but will not have a material impact on the Company’s consolidated results of operations or cash flows.
In September 2015, the FASB issued ASU 2015-16, “Business Combinations (Topic 805): Simplifying the Accounting for Measurement-Period Adjustments,” which requires an acquirer to recognize provisional amounts that are identified during the measurement period in the reporting period in which the adjustment amounts are determined. The amendments require that the acquirer record, in the same period’s financial statements, the effect on earnings of changes in depreciation, amortization, or other income effects, if any, as a result of the change to the provisional amounts, calculated as if the accounting had been completed at the acquisition date. The new guidance is effective for annual reporting periods, and interim periods within those annual periods, beginning after December 15, 2015 with early adoption permitted. The Company has determined that it will not early adopt this ASU and does not expect that adopting this guidance will have a material impact on its consolidated financial position, results of operations or cash flows.
9
CNL HEALTHCARE PROPERTIES, INC. AND SUBSIDIARIES
NOTES TO CONDENSED CONSOLIDATED FINANCIAL STATEMENTS
NINE MONTHS ENDED SEPTEMBER 30, 2015 (UNAUDITED)
|
3. |
Acquisitions |
Real Estate Investment Properties — During the nine months ended September 30, 2015, the Company acquired the following 30 properties, which were comprised of one acute care hospital, 17 medical office buildings (“MOB”) and 12 seniors housing communities:
|
|
|
|
|
|
|
Purchase Price |
|
|
|
Name and Location |
|
Structure |
|
Date Acquired |
|
(in thousands) |
|
|
|
Acute care |
|
|
|
|
|
|
|
|
|
Triangle Orthopaedic |
|
|
|
|
|
|
|
|
|
North Carolina Specialty Hospital |
|
Modified Lease |
|
6/29/2015 |
|
$ |
31,830 |
|
|
Durham, NC |
|
|
|
|
|
|
|
|
|
Medical Office |
|
|
|
|
|
|
|
|
|
Novi Orthopaedic Center |
|
Modified Lease |
|
2/13/2015 |
|
|
30,500 |
(1) |
|
Novi, MI |
|
|
|
|
|
|
|
|
|
Southeast Medical Office Properties |
|
|
|
|
|
|
|
|
|
UT Cancer Institute |
|
Modified Lease |
|
2/20/2015 |
|
|
33,660 |
|
|
Knoxville, TN |
|
|
|
|
|
|
|
|
|
Bend Memorial Clinic Medical Office Building |
|
Modified Lease |
|
5/11/2015 |
|
|
34,612 |
(1) |
|
Bend, OR |
|
|
|
|
|
|
|
|
|
Stoneterra Medical Plaza |
|
Modified Lease |
|
5/29/2015 |
|
|
15,050 |
(1) |
|
San Antonio, TX |
|
|
|
|
|
|
|
|
|
Triangle Orthopaedic |
|
|
|
|
|
|
|
|
|
Triangle Orthopaedic Durham |
|
Modified Lease |
|
6/29/2015 |
|
|
21,275 |
|
|
Durham, NC |
|
|
|
|
|
|
|
|
|
Triangle Orthopaedic Oxford |
|
Modified Lease |
|
6/29/2015 |
|
|
4,728 |
|
|
Oxford, NC |
|
|
|
|
|
|
|
|
|
Triangle Orthopaedic Chapel Hill |
|
Modified Lease |
|
6/29/2015 |
|
|
3,257 |
|
|
Chapel Hill, NC |
|
|
|
|
|
|
|
|
|
Triangle Orthopaedic Roxboro |
|
Modified Lease |
|
6/29/2015 |
|
|
2,067 |
|
|
Roxboro, NC |
|
|
|
|
|
|
|
|
|
Doctor's Park |
|
|
|
|
|
|
|
|
|
Doctor's Park Building B |
|
Modified Lease |
|
6/30/2015 |
|
|
5,000 |
(1) |
|
Chula Vista, CA ("San Diego") |
|
|
|
|
|
|
|
|
|
Doctor's Park Building C |
|
Modified Lease |
|
6/30/2015 |
|
|
10,000 |
(1) |
|
Chula Vista, CA ("San Diego") |
|
|
|
|
|
|
|
|
|
540 New Waverly Place |
|
Modified Lease |
|
7/20/2015 |
|
|
15,000 |
(1) |
|
Cary, NC ("Raleigh") |
|
|
|
|
|
|
|
|
|
MedHelp |
|
Modified Lease |
|
7/31/2015 |
|
|
14,076 |
(1) |
|
Birmingham, AL |
|
|
|
|
|
|
|
|
|
Maryland MOBs |
|
|
|
|
|
|
|
|
|
Patriot Professional Center |
|
Modified Lease |
|
7/31/2015 |
|
|
16,900 |
(1) |
|
Frederick, MD ("Baltimore") |
|
|
|
|
|
|
|
|
|
Liberty Professional Center |
|
Modified Lease |
|
7/31/2015 |
|
|
7,350 |
(1) |
|
Frederick, MD ("Baltimore") |
|
|
|
|
|
|
|
|
|
Columbia MOBs |
|
|
|
|
|
|
|
|
|
Broadway Medical Plaza 1 |
|
Modified Lease |
|
8/21/2015 |
|
|
10,619 |
(1) |
|
Columbia, MO |
|
|
|
|
|
|
|
|
|
Broadway Medical Plaza 2 |
|
Modified Lease |
|
8/21/2015 |
|
|
13,014 |
(1) |
|
Columbia, MO |
|
|
|
|
|
|
|
|
|
Broadway Medical Plaza 4 |
|
Modified Lease |
|
8/21/2015 |
|
|
14,091 |
(1) |
|
Columbia, MO |
|
|
|
|
|
|
|
|
10
CNL HEALTHCARE PROPERTIES, INC. AND SUBSIDIARIES
NOTES TO CONDENSED CONSOLIDATED FINANCIAL STATEMENTS
NINE MONTHS ENDED SEPTEMBER 30, 2015 (UNAUDITED)
|
3. |
Acquisitions (continued) |
|
|
|
|
|
|
|
Purchase Price |
|
|
|
Name and Location |
|
Structure |
|
Date Acquired |
|
(in thousands) |
|
|
|
Seniors Housing |
|
|
|
|
|
|
|
|
|
Fieldstone Memory Care (2) |
|
Managed |
|
3/31/2015 |
|
|
12,400 |
(1) |
|
Yakima, WA |
|
|
|
|
|
|
|
|
|
Primrose III Communities |
|
|
|
|
|
|
|
|
|
Primrose Retirement Community of Anderson |
|
Triple-net Lease |
|
5/29/2015 |
|
|
21,086 |
|
|
Anderson, IN ("Muncie") |
|
|
|
|
|
|
|
|
|
Primrose Retirement Community of Lancaster |
|
Triple-net Lease |
|
5/29/2015 |
|
|
25,657 |
|
|
Lancaster, OH ("Columbus") |
|
|
|
|
|
|
|
|
|
Primrose Retirement Community of Wausau |
|
Triple-net Lease |
|
5/29/2015 |
|
|
20,307 |
|
|
Wausau, WI ("Green Bay") |
|
|
|
|
|
|
|
|
|
Superior Residences of Panama City |
|
Managed |
|
7/15/2015 |
|
|
20,000 |
(1) |
|
Panama City Beach, FL |
|
|
|
|
|
|
|
|
|
Southeast Seniors Housing Communities |
|
|
|
|
|
|
|
|
|
Parc at Duluth |
|
Triple-net Lease |
|
7/31/2015 |
|
|
52,800 |
|
|
Duluth, GA ("Atlanta") |
|
|
|
|
|
|
|
|
|
Parc at Piedmont |
|
Triple-net Lease |
|
7/31/2015 |
|
|
50,800 |
|
|
Marietta, GA ("Atlanta") |
|
|
|
|
|
|
|
|
|
The Pavilion at Great Hills |
|
Managed |
|
7/31/2015 |
|
|
35,000 |
|
|
Austin, TX |
|
|
|
|
|
|
|
|
|
The Hampton at Meadows Place |
|
Managed |
|
7/31/2015 |
|
|
28,400 |
|
|
Fort Bend, TX ("Houston") |
|
|
|
|
|
|
|
|
|
The Beacon at Gulf Breeze |
|
Managed |
|
7/31/2015 |
|
|
28,000 |
|
|
Gulf Breeze, FL ("Pensacola") |
|
|
|
|
|
|
|
|
|
Palmilla Senior Living |
|
Managed |
|
9/30/2015 |
|
|
47,600 |
|
|
Albuquerque, NM |
|
|
|
|
|
|
|
|
|
Cedar Lake Assisted Living and Memory Care |
|
Managed |
|
9/30/2015 |
|
|
30,000 |
|
|
Lake Zurich, IL ("Chicago") |
|
|
|
|
|
|
|
|
|
|
|
|
|
|
|
$ |
655,079 |
|
FOOTNOTES:
|
(1) |
This represents a single property or portfolio acquisition that is not considered material to the Company and as such no pro forma financial information has been included related to this property or portfolio. |
|
(2) |
This property was purchased from a related party of the Company’s Sponsor; refer to Note 11. “Related Party Arrangements” for additional information. |
11
CNL HEALTHCARE PROPERTIES, INC. AND SUBSIDIARIES
NOTES TO CONDENSED CONSOLIDATED FINANCIAL STATEMENTS
NINE MONTHS ENDED SEPTEMBER 30, 2015 (UNAUDITED)
|
3. |
Acquisitions (continued) |
During the nine months ended September 30, 2014, the Company acquired the following 22 properties, which were comprised of three acute care hospitals, three MOBs, three post-acute care hospitals and, 13 seniors housing communities:
|
|
|
|
|
|
|
Purchase Price |
|
|
|
Name and Location |
|
Structure |
|
Date Acquired |
|
(in thousands) |
|
|
|
Acute Care |
|
|
|
|
|
|
|
|
|
Memorial Hermann Orthopedic & Spine Hospital ("MHOSH") |
|
Triple-net Lease |
|
6/2/2014 |
|
$ |
49,000 |
|
|
Bellaire, TX ("Houston") |
|
|
|
|
|
|
|
|
|
Medical Portfolio II Properties |
|
|
|
|
|
|
|
|
|
Hurst Specialty Hospital |
|
Modified Lease |
|
8/15/2014 |
|
|
29,465 |
|
|
Hurst, TX ("Dallas/Fort Worth") |
|
|
|
|
|
|
|
|
|
Beaumont Specialty Hospital |
|
Modified Lease |
|
8/15/2014 |
|
|
33,600 |
|
|
Beaumont, TX ("Houston") |
|
|
|
|
|
|
|
|
|
Medical Office |
|
|
|
|
|
|
|
|
|
Chula Vista Medical Arts Center - Plaza I |
|
Modified Lease |
|
1/21/2014 |
|
|
17,863 |
(1) |
|
Chula Vista, CA ("San Diego") |
|
|
|
|
|
|
|
|
|
MHOSH Medical Office Building |
|
Modified Lease |
|
6/2/2014 |
|
|
27,000 |
|
|
Bellaire, TX ("Houston") |
|
|
|
|
|
|
|
|
|
Lee Hughes Medical Building |
|
Modified Lease |
|
9/29/2014 |
|
|
29,870 |
(1) |
|
Glendale, CA ("Los Angeles") |
|
|
|
|
|
|
|
|
|
Post-Acute Care |
|
|
|
|
|
|
|
|
|
Medical Portfolio II Properties |
|
|
|
|
|
|
|
|
|
Oklahoma City Inpatient Rehabilitation Hospital |
|
Modified Lease |
|
7/15/2014 |
|
|
25,504 |
|
|
Oklahoma City, OK |
|
|
|
|
|
|
|
|
|
Las Vegas Inpatient Rehabilitation Hospital |
|
Modified Lease |
|
7/15/2014 |
|
|
22,292 |
|
|
Las Vegas, NV |
|
|
|
|
|
|
|
|
|
South Bend Inpatient Rehabilitation Hospital |
|
Modified Lease |
|
7/15/2014 |
|
|
20,240 |
|
|
Mishawaka, IN ("South Bend") |
|
|
|
|
|
|
|
|
|
Seniors Housing |
|
|
|
|
|
|
|
|
|
Pacific Northwest II Communities |
|
|
|
|
|
|
|
|
|
Prestige Senior Living Auburn Meadows |
|
Managed |
|
2/3/2014 |
|
|
21,930 |
|
|
Auburn, WA ("Seattle") |
|
|
|
|
|
|
|
|
|
Prestige Senior Living Bridgewood |
|
Managed |
|
2/3/2014 |
|
|
22,096 |
|
|
Vancouver, WA ("Portland") |
|
|
|
|
|
|
|
|
|
Prestige Senior Living Monticello Park |
|
Managed |
|
2/3/2014 |
|
|
27,360 |
|
|
Longview, WA |
|
|
|
|
|
|
|
|
|
Prestige Senior Living Rosemont |
|
Managed |
|
2/3/2014 |
|
|
16,877 |
|
|
Yelm, WA |
|
|
|
|
|
|
|
|
|
Prestige Senior Living West Hills |
|
Managed |
|
3/3/2014 |
|
|
14,986 |
|
|
Corvallis, OR |
|
|
|
|
|
|
|
|
12
CNL HEALTHCARE PROPERTIES, INC. AND SUBSIDIARIES
NOTES TO CONDENSED CONSOLIDATED FINANCIAL STATEMENTS
NINE MONTHS ENDED SEPTEMBER 30, 2015 (UNAUDITED)
|
3. |
Acquisitions (continued) |
|
|
|
|
|
|
|
Purchase Price |
|
|
|
Name and Location |
|
Structure |
|
Date Acquired |
|
(in thousands) |
|
|
|
South Bay II Communities |
|
|
|
|
|
|
|
|
|
Isle at Cedar Ridge |
|
Managed |
|
2/28/2014 |
|
|
21,630 |
|
|
Cedar Park, TX ("Austin") |
|
|
|
|
|
|
|
|
|
HarborChase of Plainfield |
|
Managed |
|
3/28/2014 |
|
|
26,500 |
|
|
Plainfield, IL |
|
|
|
|
|
|
|
|
|
Legacy Ranch Alzheimer’s Special Care Center |
|
Managed |
|
3/28/2014 |
|
|
11,960 |
|
|
Midland, TX |
|
|
|
|
|
|
|
|
|
The Springs Alzheimer’s Special Care Center |
|
Managed |
|
3/28/2014 |
|
|
10,920 |
|
|
San Angelo, TX |
|
|
|
|
|
|
|
|
|
Isle at Watercrest – Bryan |
|
Managed |
|
4/21/2014 |
|
|
22,050 |
|
|
Bryan, TX |
|
|
|
|
|
|
|
|
|
Watercrest at Bryan |
|
Managed |
|
4/21/2014 |
|
|
28,035 |
|
|
Bryan, TX |
|
|
|
|
|
|
|
|
|
Isle at Watercrest – Mansfield |
|
Managed |
|
5/5/2014 |
|
|
31,300 |
|
|
Mansfield, TX ("Dallas/Fort Worth") |
|
|
|
|
|
|
|
|
|
Watercrest at Mansfield |
|
Managed |
|
6/30/2014 |
|
|
49,000 |
|
|
Mansfield, TX ("Dallas/Fort Worth") |
|
|
|
|
|
|
|
|
|
|
|
|
|
|
|
$ |
559,478 |
|
FOOTNOTE:
|
(1) |
This represents a single property acquisition that is not considered material to the Company and as such no pro forma financial information has been included related to this property. |
The following summarizes the purchase price allocation for the above properties, and the estimated fair values of the assets acquired and liabilities assumed (in thousands):
|
|
September 30, |
|
|||||
|
|
2015 |
|
|
2014 |
|
||
|
Land and land improvements |
$ |
66,583 |
|
|
$ |
46,064 |
|
|
Buildings and building improvements |
|
523,103 |
|
|
|
442,887 |
|
|
Furniture, fixtures and equipment |
|
9,469 |
|
|
|
10,014 |
|
|
Intangibles (1) |
|
65,126 |
|
|
|
67,431 |
|
|
Other liabilities |
|
(3,765 |
) |
|
|
(8,718 |
) |
|
Liabilities assumed |
|
(2,589 |
) |
|
― |
|
|
|
Assumed mortgage note payable (2) |
|
(6,976 |
) |
|
|
(27,657 |
) |
|
Net assets acquired |
|
650,951 |
|
|
|
530,021 |
|
|
Contingent purchase price consideration |
|
(3,000 |
) |
|
|
(12,395 |
) |
|
Total purchase price consideration |
$ |
647,951 |
|
|
$ |
517,626 |
|
FOOTNOTE:
|
(1) |
At the acquisition date, the weighted-average amortization period on the acquired lease intangibles for the nine months ended September 30, 2015 and 2014 was approximately 7.9 years and 7.1 years, respectively. The acquired lease intangibles during the nine months ended September 30, 2015 were comprised of approximately $60.7 million and $4.4 million of in-place lease intangibles and other lease intangibles, respectively, and the acquired lease intangibles during the nine months ended September 30, 2014 were comprised of approximately $61.4 million and $6.0 million of in-place lease intangibles and other lease intangibles, respectively. |
|
(2) |
At the acquisition date, the fair value of the mortgage note payable assumed reflects an approximate $0.2 million discount on the below-market mortgage note payable assumed. |
13
CNL HEALTHCARE PROPERTIES, INC. AND SUBSIDIARIES
NOTES TO CONDENSED CONSOLIDATED FINANCIAL STATEMENTS
NINE MONTHS ENDED SEPTEMBER 30, 2015 (UNAUDITED)
|
3. |
Acquisitions (continued) |
The revenues and net loss (including deductions for acquisition fees and expenses, and depreciation and amortization expense) attributable to the acquired properties considered to be material were approximately $7.1 million and $4.7 million, respectively, and $8.6 million and $7.6 million, respectively, for the quarter and nine months ended September 30, 2015; and approximately $19.8 million and $4.7 million, respectively, and $36.5 million and $15.3 million, respectively, for the quarter and nine months ended September 30, 2014.
The following table presents the unaudited pro forma results of operations for the Company as if the 2015 acquisitions noted as material in Note 3. “Acquisitions” above were acquired as of January 1, 2014 and the unaudited pro forma results of operations for the Company assuming the 2014 acquisitions noted as material in Note 3. “Acquisitions” above were acquired as of January 1, 2013 (in thousands except per share data):
|
|
|
(Unaudited) |
|
|
(Unaudited) |
|
||||||||||
|
|
|
Quarter Ended September 30, |
|
|
Nine Months Ended September 30, |
|
||||||||||
|
|
|
2015 |
|
|
2014 |
|
|
2015 |
|
|
2014 |
|
||||
|
Revenues |
|
$ |
86,793 |
|
|
$ |
64,136 |
|
|
$ |
245,650 |
|
|
$ |
187,170 |
|
|
Net income (loss) (1) |
|
$ |
(16,244 |
) |
|
$ |
(11,332 |
) |
|
$ |
(48,601 |
) |
|
$ |
(45,370 |
) |
|
Loss per share of common stock (basic and diluted) |
|
$ |
(0.09 |
) |
|
$ |
(0.10 |
) |
|
$ |
(0.29 |
) |
|
$ |
(0.46 |
) |
|
Weighted average number of shares of common stock outstanding (basic and diluted) (2) |
|
|
171,102 |
|
|
|
109,212 |
|
|
|
165,408 |
|
|
|
97,911 |
|
FOOTNOTES:
|
(1) |
The unaudited pro forma results for the quarter and nine months ended September 30, 2015, were adjusted to exclude approximately $6.1 million and $9.8 million, respectively, of acquisition related expenses directly attributable to the properties acquired during the quarter and nine months ended September 30, 2015. The unaudited pro forma results for the nine months ended September 30, 2014 were adjusted to include approximately $9.8 million of acquisition related expenses, as if the properties had been acquired on January 1, 2014. The unaudited pro forma results for the quarter and nine months ended September 30, 2014 were adjusted to exclude approximately $3.1 million and $13.8 million, respectively, of acquisition related expenses directly attributable to the properties acquired during the quarter and nine months ended September 30, 2014, as if the properties had been acquired on January 1, 2013. |
|
(2) |
As a result of the acquired properties being treated as operational since January 1, 2014, the Company assumed approximately 19.0 million shares were issued as of January 1, 2014. Consequently the weighted average shares outstanding was adjusted to reflect this amount of shares being issued on January 1, 2014 instead of actual dates on which the shares were issued, and such shares were treated as outstanding as of the beginning of the period presented. |
Real Estate Under Development — In August 2015, the Company acquired a tract of land in Greenville, South Carolina for $2.3 million (“Waterstone at Greenville”). In connection with the acquisition, the Company entered into a development agreement with a third-party developer for the construction and development of an assisted living and memory care community with a maximum development budget of approximately $27.0 million, including the allocated purchase price of the land. The Company determined that Waterstone at Greenville is a VIE because it believes there is insufficient equity at risk due to the development nature of the property. The Company is the primary beneficiary while the developer or its affiliates manage the development, construction and certain day-to-day operations of the property subject to the Company’s oversight. Under a promoted interest agreement with the developer, certain net operating income targets have been established which, upon meeting such targets, result in the developer being entitled to additional payments based on enumerated percentages of the assumed net proceeds of a deemed sale, subject to achievement of an established internal rate of return on the Company’s investment in the development.
In September 2015, the Company acquired a tract of land in Grand Junction, Colorado for $1.1 million (“Wellbrook Senior Living Grand Junction”). In connection with the acquisition, the Company entered into a development agreement with a third-party developer for the construction and development of a transitional rehabilitation facility with a maximum development budget of approximately $13.1 million, including the allocated purchase price of the land. The Company determined that Wellbrook Senior Living Grand Junction is not a VIE because the Company’s equity investment is sufficient to finance the activities of the entity without a construction loan and the Company will receive substantially all expected residual returns.
14
CNL HEALTHCARE PROPERTIES, INC. AND SUBSIDIARIES
NOTES TO CONDENSED CONSOLIDATED FINANCIAL STATEMENTS
NINE MONTHS ENDED SEPTEMBER 30, 2015 (UNAUDITED)
|
3. |
Acquisitions (continued) |
In September 2015, the Company acquired a tract of land in Lexington, South Carolina for $2.3 million (“Wellmore of Lexington”), which is a suburb of Columbia, South Carolina. In connection with the acquisition, the Company entered into a development agreement with a third-party developer for the construction and development of a continuing care retirement facility with a maximum development budget of approximately $53.9 million, including the allocated purchase price of the land. The Company determined that Wellmore of Lexington is a VIE because it believes there is insufficient equity at risk due to the development nature of the property. The Company is the primary beneficiary while the developer or its affiliates manage the development, construction and certain day-to-day operations of the property subject to the Company’s oversight. Under a promoted interest agreement with the developer, certain net operating income targets have been established which, upon meeting such targets, result in the developer being entitled to additional payments based on enumerated percentages of the assumed net proceeds of a deemed sale, subject to achievement of an established internal rate of return on the Company’s investment in the development.
Purchase of Controlling Interest in Montecito Joint Venture — In January 2013, the Company acquired a 90% membership interest in a two-story MOB in Claremont, California for approximately $7.0 million in equity through a joint venture (“Montecito Joint Venture”) formed by the Company and its co-venture partner, an unrelated party, that initially held the remaining 10% interest. The Montecito Joint Venture was previously recorded under the equity method of accounting because the decisions that significantly impacted the entity were shared between the Company and its co-venture partner.
In August 2014, the Company acquired its co-venture partner’s 10% interest in the Montecito Joint Venture for approximately $1.6 million. As a result of this transaction, the Company owns 100% of the Montecito Joint Venture, and began consolidating all of the assets, liabilities and results of operations in the Company’s consolidated financial statements upon acquisition. Accordingly, the Company recorded a step up from its carrying value of the investment in the Montecito Joint Venture to the estimated fair value of the net assets acquired and liabilities assumed. The following summarizes the allocation of the purchase price, and the estimated fair values of the assets acquired and liabilities assumed as of the acquisition date (in thousands):
|
Land and land improvements |
|
$ |
6,324 |
|
|
Buildings and building improvements |
|
|
13,533 |
|
|
Intangibles (1) |
|
|
2,691 |
|
|
Working capital, net |
|
|
87 |
|
|
Other liabilities |
|
|
(175 |
) |
|
Mortgage note payable assumed (2) |
|
|
(12,331 |
) |
|
Net assets acquired |
|
$ |
10,129 |
|
FOOTNOTES:
|
(1) |
At the acquisition date, the weighted-average amortization period on the acquired lease intangibles was approximately 5.1 years and was comprised of approximately $1.9 million and $0.8 million of in-place lease intangibles and other lease intangibles, respectively. |
|
(2) |
At the acquisition date, the fair value of the mortgage note payable assumed reflects an approximate $0.6 million discount on the below-market mortgage note payable assumed. |
The fair value of the Company’s equity interest in the Montecito Joint Venture immediately before the acquisition date was approximately $5.7 million. The Company recorded a gain of approximately $2.8 million based on the acquisition-date fair value of its equity interest in the Montecito Joint Venture. The following summarizes the gain that resulted from the change of control in the equity method investment for the quarter and nine months ended September 30, 2014 (in thousands):
|
Fair value of net assets acquired |
$ |
10,129 |
|
|
Less: Previous investment in Montecito Joint Venture |
|
(5,747 |
) |
|
Less: Cash paid to acquire co-venture partner's interest |
|
(1,584 |
) |
|
Gain on purchase of controlling interest of investment in unconsolidated entity |
$ |
2,798 |
|
15
CNL HEALTHCARE PROPERTIES, INC. AND SUBSIDIARIES
NOTES TO CONDENSED CONSOLIDATED FINANCIAL STATEMENTS
NINE MONTHS ENDED SEPTEMBER 30, 2015 (UNAUDITED)
|
4. |
Real Estate Assets, net |
The gross carrying amount and accumulated depreciation of the Company’s real estate assets as of September 30, 2015 and December 31, 2014 are as follows (in thousands):
|
|
|
September 30, |
|
|
December 31, |
|
||
|
|
|
2015 |
|
|
2014 |
|
||
|
Land and land improvements |
|
$ |
200,763 |
|
|
$ |
128,662 |
|
|
Building and building improvements |
|
|
2,094,128 |
|
|
|
1,545,614 |
|
|
Furniture, fixtures and equipment |
|
|
54,284 |
|
|
|
36,319 |
|
|
Less: accumulated depreciation |
|
|
(97,975 |
) |
|
|
(53,095 |
) |
|
Real estate investment properties, net |
|
|
2,251,200 |
|
|
|
1,657,500 |
|
|
Real estate under development, including land |
|
|
69,478 |
|
|
|
47,153 |
|
|
Total real estate assets, net |
|
$ |
2,320,678 |
|
|
$ |
1,704,653 |
|
Depreciation expense on the Company’s real estate investment properties, net was approximately $16.9 million and $44.8 million for the quarter and nine months ended September 30, 2015, respectively, and approximately $10.8 million and $27.4 million for the quarter and nine months ended September 30, 2014, respectively.
In June 2015, the Company completed the construction and development of a seniors housing community in Tega Cay, South Carolina (“Wellmore of Tega Cay”), which is a suburb of Charlotte, North Carolina. Wellmore of Tega Cay opened to residents beginning in July 2015 and was considered placed into service as of June 30, 2015. As such, the asset values related to Tega Cay are included in real estate investment properties, net in the accompanying condensed consolidated balance sheet as of September 30, 2015.
As of September 30, 2015, six of the Company’s properties have real estate under development with third-party developers as follows (in thousands):
|
Property Name (and Location) |
|
Developer |
|
Real Estate Development Costs Incurred (1) |
|
|
Remaining Development Budget (2) |
|
||
|
HarborChase of Shorewood (Shorewood, WI) |
|
Harbor Shorewood Development, LLC |
|
$ |
22,034 |
|
|
$ |
5,776 |
|
|
Raider Ranch (Lubbock, TX) |
|
South Bay Partners, Ltd |
|
|
13,464 |
|
|
|
3,460 |
|
|
Watercrest at Katy (Katy, TX) (3) |
|
South Bay Partners, Ltd |
|
|
20,049 |
|
|
|
22,342 |
|
|
Welbrook Senior Living Grand Junction (Grand Junction, CO) |
|
Embree Asset Group, Inc. |
|
|
2,128 |
|
|
|
11,473 |
|
|
Waterstone at Greenville (Greenville, SC) |
|
The Balance Group, Inc. |
|
|
5,298 |
|
|
|
22,401 |
|
|
Wellmore of Lexington (Lexington, SC) |
|
Maxwell Group, Inc. |
|
|
6,505 |
|
|
|
48,698 |
|
|
|
|
|
|
$ |
69,478 |
|
|
$ |
114,150 |
|
FOOTNOTES:
|
(1) |
This amount represents land and total capitalized costs for GAAP purposes for the acquisition, development and construction of the seniors housing or post-acute care communities as of September 30, 2015. Amounts include investment services fees, asset management fees, interest expense and other costs capitalized during the development period. |
|
(2) |
This amount includes preleasing and marketing costs which will be expensed as incurred. |
|
(3) |
This property is owned through a joint venture in which the Company’s initial ownership interest is 95%. |
The development budgets include the cost of the land, construction costs, development fees, financing costs, start-up costs and initial operating deficits of the respective properties. An affiliate of the developer of the respective community coordinates and supervises the management and administration of the development and construction. Each developer is responsible for any cost overruns beyond the approved development budget for the applicable project pursuant to a cost overrun guarantee. Some of these developments were deemed to be VIEs; refer to Note 7. “Variable Interest Entities” for additional information.
16
CNL HEALTHCARE PROPERTIES, INC. AND SUBSIDIARIES
NOTES TO CONDENSED CONSOLIDATED FINANCIAL STATEMENTS
NINE MONTHS ENDED SEPTEMBER 30, 2015 (UNAUDITED)
|
5. |
Intangibles, net |
The gross carrying amount and accumulated amortization of the Company’s intangible assets and liabilities as of September 30, 2015 and December 31, 2014 are as follows (in thousands):
|
|
|
September 30, |
|
|
December 31, |
|
||
|
|
|
2015 |
|
|
2014 |
|
||
|
In-place lease intangibles |
|
$ |
199,815 |
|
|
$ |
148,880 |
|
|
Above-market lease intangibles |
|
|
13,586 |
|
|
|
11,320 |
|
|
Below-market ground lease intangibles |
|
|
12,470 |
|
|
|
10,314 |
|
|
Less: accumulated amortization |
|
|
(62,333 |
) |
|
|
(30,250 |
) |
|
Intangible assets, net |
|
$ |
163,538 |
|
|
$ |
140,264 |
|
|
Below-market lease intangibles |
|
$ |
(10,685 |
) |
|
$ |
(13,243 |
) |
|
Above-market ground lease intangibles |
|
|
(3,488 |
) |
|
|
(2,273 |
) |
|
Less: accumulated amortization |
|
|
2,177 |
|
|
|
1,014 |
|
|
Intangible liabilities, net (1) |
|
$ |
(11,996 |
) |
|
$ |
(14,502 |
) |
FOOTNOTE:
|
(1) |
Intangible liabilities, net are included in other liabilities in the accompanying condensed consolidated balance sheets. |
Amortization on the Company’s intangible assets was approximately $11.6 million and $32.1 million for the quarter and nine months ended September 30, 2015, of which approximately $0.6 million and $1.5 million, respectively, were treated as a reduction of rental income from operating leases, approximately $0.08 million and $0.2 million, respectively, were treated as an increase of property operating expenses and approximately $10.9 million and $30.3 million, respectively, were included in depreciation and amortization. Amortization on the Company’s intangible assets was approximately $7.1 million and $17.4 million for the quarter and nine months ended September 30, 2014, of which approximately $0.3 million and $0.7 million, respectively, were treated as a reduction of rental income from operating leases, approximately $0.02 million and $0.1 million, respectively, were treated as an increase of property operating expenses and approximately $6.7 million and $16.7 million, respectively, were included in depreciation and amortization.
Amortization on the Company’s intangible liabilities was approximately $0.4 million and $1.2 million for the quarter and nine months ended September 30, 2015, of which approximately $0.4 million and $1.1 million, respectively, were treated as an increase of rental income from operating leases and approximately $0.02 million and $0.06 million, respectively, were treated as a reduction of property operating expenses. For the quarter and nine months ended September 30, 2014, amortization on the Company’s intangible liabilities was approximately $0.3 million and $0.5 million, of which approximately $0.3 million and $0.5 million, respectively, were treated as an increase of rental income from operating leases and approximately two thousand and six thousand dollars, respectively, was treated as a reduction of property operating expenses.
During the nine months ended September 30, 2015, due to the uncertainty of a tenant’s ability to meet its future obligations under the leases at two of the Company’s specialty hospitals, the Company recorded an impairment provision of approximately $4.7 million related to the lease intangibles as it was determined that the carrying value of these assets would more than likely not be recoverable. In September 2015, the Company signed an amended and restated lease agreement with a new tenant at one of the specialty hospitals, which included similar economic terms and the collection of approximately $1.0 million in rents owed under the lease. In addition, the Company assessed the underlying real estate assets on the second specialty hospital for impairment and concluded that no adjustment to the carrying value was necessary based on the Company’s expected holding period and the estimated undiscounted cash flows and estimated net sales proceeds that could be generated by the property.
17
CNL HEALTHCARE PROPERTIES, INC. AND SUBSIDIARIES
NOTES TO CONDENSED CONSOLIDATED FINANCIAL STATEMENTS
NINE MONTHS ENDED SEPTEMBER 30, 2015 (UNAUDITED)
|
5. |
Intangibles, net (continued) |
The estimated future amortization on the Company’s intangibles for the remainder of 2015, each of the next four years and thereafter, in the aggregate, as of September 30, 2015 is as follows (in thousands):
|
|
|
In-place Lease Intangibles |
|
|
Above- market Leases |
|
|
Below- market Ground Leases |
|
|
Total Assets |
|
|
Below- market Leases |
|
|
Above- market Ground Leases |
|
|
Total Liabilities |
|
|||||||
|
2015 |
|
$ |
11,859 |
|
|
|
524 |
|
|
|
80 |
|
|
$ |
12,463 |
|
|
$ |
(379 |
) |
|
|
(22 |
) |
|
$ |
(401 |
) |
|
2016 |
|
|
38,280 |
|
|
|
1,797 |
|
|
|
320 |
|
|
|
40,397 |
|
|
|
(1,449 |
) |
|
|
(89 |
) |
|
|
(1,538 |
) |
|
2017 |
|
|
24,845 |
|
|
|
1,636 |
|
|
|
320 |
|
|
|
26,801 |
|
|
|
(1,299 |
) |
|
|
(89 |
) |
|
|
(1,388 |
) |
|
2018 |
|
|
14,685 |
|
|
|
1,469 |
|
|
|
320 |
|
|
|
16,474 |
|
|
|
(1,146 |
) |
|
|
(89 |
) |
|
|
(1,235 |
) |
|
2019 |
|
|
10,537 |
|
|
|
1,168 |
|
|
|
320 |
|
|
|
12,025 |
|
|
|
(982 |
) |
|
|
(89 |
) |
|
|
(1,071 |
) |
|
Thereafter |
|
|
40,374 |
|
|
|
4,282 |
|
|
|
10,722 |
|
|
|
55,378 |
|
|
|
(3,321 |
) |
|
|
(3,042 |
) |
|
|
(6,363 |
) |
|
|
|
$ |
140,580 |
|
|
|
10,876 |
|
|
|
12,082 |
|
|
$ |
163,538 |
|
|
$ |
(8,576 |
) |
|
|
(3,420 |
) |
|
$ |
(11,996 |
) |
Weighted average remaining useful life as of September 30, 2015 (in years):
|
|
|
In-place Lease Intangibles |
|
|
Above- market Leases |
|
|
Below- market Ground Leases |
|
|
Below- market Leases |
|
|
Above- market Ground Leases |
|
|||||
|
|
|
|
4.6 |
|
|
|
6.2 |
|
|
|
37.8 |
|
|
|
4.9 |
|
|
|
38.3 |
|
|
6. |
Operating Leases |
As of September 30, 2015, the Company owned 78 properties that were leased to tenants on a triple-net, net or modified gross basis, and accounted for as operating leases; of which, 37 are single-tenant properties that are 100% leased under operating leases and the remaining 41 are multi-tenant properties that are leased under operating leases. The Company’s leases had a weighted average remaining lease term of 7.5 years based on annualized base rents expiring between 2015 and 2038, subject to the tenants’ options to extend the lease periods ranging from two to 10 years. In addition, certain tenants hold options to extend their leases for multiple periods.
Under the terms of the Company’s triple-net lease agreements, each tenant is responsible for the payment of property taxes, general liability insurance, utilities, and repairs and maintenance, including structural and roof maintenance expenses. Each tenant is expected to pay real estate taxes directly to taxing authorities. However, if the tenant does not pay, the Company will be liable. The total annualized property tax assessed on these properties is approximately $2.8 million.
Under the terms of the multi-tenant lease agreements that have third-party property managers, each tenant is responsible for the payment of their proportionate share of property taxes, general liability insurance, utilities, repairs and common area maintenance. These amounts are billed monthly and recorded as tenant reimbursement income in the accompanying condensed consolidated statements of operations.
The following are future minimum lease payments to be received under non-cancellable operating leases for the remainder of 2015, each of the next four years and thereafter, as of September 30, 2015 (in thousands):
|
2015 |
|
$ |
26,253 |
|
|
2016 |
|
|
103,139 |
|
|
2017 |
|
|
97,240 |
|
|
2018 |
|
|
89,806 |
|
|
2019 |
|
|
81,268 |
|
|
Thereafter |
|
|
442,941 |
|
|
|
|
$ |
840,647 |
|
The above future minimum lease payments to be received excludes tenant reimbursements, straight-line rent adjustments, amortization of above- and below-market lease intangibles and base rent attributable to any renewal options exercised by the tenants in the future. In addition, future minimum lease payments related to one of the two specialty hospitals discussed in Note 5. “Intangibles, net” have been excluded.
18
CNL HEALTHCARE PROPERTIES, INC. AND SUBSIDIARIES
NOTES TO CONDENSED CONSOLIDATED FINANCIAL STATEMENTS
NINE MONTHS ENDED SEPTEMBER 30, 2015 (UNAUDITED)
|
7. |
Variable Interest Entities |
Consolidated VIEs – As of September 30, 2015, the Company has 15 subsidiaries, which are VIEs due to the following factors and circumstances:
|
|
(1) |
Two of these subsidiaries are single property entities, designed to own and lease their respective properties to single tenants, for which buy-out options are held by the respective tenants that are formula based. |
|
|
(2) |
Four of these subsidiaries are single property entities, designed to own and lease their respective properties to multiple tenants, which are subject to either a ground lease or an air rights lease that include buy-out and put options held by either the tenant or landlord under the applicable lease. |
|
|
(3) |
Seven of these subsidiaries are entities with real estate under development or completed developments in which the third-party developers have an opportunity to earn promoted interest payments after certain net operating income targets and internal rate of return targets have been met. |
|
|
(4) |
One of these subsidiaries is a joint venture with real estate under development in which the third-party developer has an opportunity to earn promoted interest payments after certain net operating income targets and internal rate of return targets have been met. |
|
|
(5) |
One of these subsidiaries is a joint venture with equity interest that consists of non-substantive voting rights. |
The Company determined it is the primary beneficiary and holds a controlling financial interest in each of the aforementioned property and development entities due to its power to direct the activities that most significantly impact the economic performance of the entities, as well as its obligation to absorb the losses and its right to receive benefits from these entities that could potentially be significant to these entities. As such, the transactions and accounts of these VIEs are included in the accompanying condensed consolidated financial statements.
The aggregate carrying amount and major classifications of the consolidated assets that can be used to settle obligations of the VIEs and liabilities of the consolidated VIEs that are non-recourse to the Company as of September 30, 2015 and December 31, 2014 are as follows (in thousands):
|
|
|
September 30, |
|
|
December 31, |
|
||
|
|
|
2015 |
|
|
2014 |
|
||
|
Assets: |
|
|
|
|
|
|
|
|
|
Real estate investment properties, net |
|
$ |
192,663 |
|
|
$ |
174,449 |
|
|
Real estate under development, including land |
|
$ |
67,350 |
|
|
$ |
47,153 |
|
|
Intangibles, net |
|
$ |
24,426 |
|
|
$ |
25,519 |
|
|
Cash |
|
$ |
1,462 |
|
|
$ |
6,280 |
|
|
Other assets |
|
$ |
862 |
|
|
$ |
511 |
|
|
Deferred rent and lease incentives |
|
$ |
6,330 |
|
|
$ |
2,978 |
|
|
Loan costs, net |
|
$ |
2,497 |
|
|
$ |
2,300 |
|
|
Restricted cash |
|
$ |
2,053 |
|
|
$ |
5,304 |
|
|
Liabilities: |
|
|
|
|
|
|
|
|
|
Mortgages and other notes payable |
|
$ |
172,537 |
|
|
$ |
137,754 |
|
|
Accounts payable and accrued liabilities |
|
$ |
1,497 |
|
|
$ |
2,317 |
|
|
Accrued development costs |
|
$ |
8,854 |
|
|
$ |
7,951 |
|
|
Due to related parties |
|
$ |
171 |
|
|
$ |
219 |
|
|
Other liabilities |
|
$ |
4,551 |
|
|
$ |
4,949 |
|
The Company’s maximum exposure to loss as a result of its involvement with these VIEs is limited to its net investment in these entities which totaled approximately $109.0 million as of September 30, 2015. The Company’s exposure is limited because of the non-recourse nature of the borrowings of the VIEs.
19
CNL HEALTHCARE PROPERTIES, INC. AND SUBSIDIARIES
NOTES TO CONDENSED CONSOLIDATED FINANCIAL STATEMENTS
NINE MONTHS ENDED SEPTEMBER 30, 2015 (UNAUDITED)
|
8. |
Ground and Air Rights Leases |
During the nine months ended September 30, 2015, in conjunction with the Novi Orthopaedic Center, UT Cancer Institute, and Columbia MOBs detailed in Note 3. “Acquisitions,” the Company acquired interests in five additional ground leases. The Novi Orthopaedic Center, UT Cancer Institute, and Columbia MOBs ground leases represent operating leases with scheduled payments over the life of the respective lease expiring in 2045 to 2076.
Overall, under the terms of its ground and air rights lease agreements, the Company is responsible for the monthly rental payments. These amounts are billed monthly and recorded as property operating expenses in the accompanying condensed consolidated statements of operations. In some cases, the Company is able to pass this expense through to its tenants as tenant reimbursement income. For the quarter and nine months ended September 30, 2015, the Company incurred approximately $0.7 million and $1.8 million, respectively, in ground and air rights lease expense, including any straight-line rent adjustments. For the quarter and nine months ended September 30, 2014, the Company incurred approximately $0.04 million and $0.1 million, respectively, in ground and air rights lease expense, including any straight-line rent adjustments.
The following is a schedule of future minimum lease payments to be paid under the ground and air rights leases for the remainder of 2015, each of the next four years and thereafter, in the aggregate, as of September 30, 2015 (in thousands):
|
2015 |
|
$ |
484 |
|
|
2016 |
|
|
1,957 |
|
|
2017 |
|
|
1,984 |
|
|
2018 |
|
|
2,016 |
|
|
2019 |
|
|
2,041 |
|
|
Thereafter |
|
|
115,515 |
|
|
|
|
$ |
123,997 |
|
|
9. |
Contingent Purchase Price Consideration |
Capital Health Communities
In connection with the acquisition of the Capital Health Communities in 2012, the Company required that approximately $7.0 million of the purchase price be placed in an escrow account as the seller guaranteed the Company an annual return of at least $6.9 million, $7.0 million, and $7.1 million of net operating income on the acquired properties during 2013, 2014 and 2015, respectively (“Yield Guaranty”). As of September 30, 2015, the Company determined the fair value of the Yield Guaranty to be $1.8 million, which was recorded as other assets in the accompanying condensed consolidated balance sheet. The following table provides a roll-forward of the fair value of the contingent purchase price consideration related to the Yield Guaranty on the Capital Health Communities for the quarter and nine months ended September 30, 2015 and 2014 (in thousands):
|
|
|
Quarter ended |
|
|
Nine Months Ended |
|
||||||||||
|
|
|
September 30, |
|
|
September 30, |
|
||||||||||
|
|
|
2015 |
|
|
2014 |
|
|
2015 |
|
|
2014 |
|
||||
|
Beginning balance |
|
$ |
1,820 |
|
|
$ |
3,509 |
|
|
$ |
4,078 |
|
|
$ |
4,488 |
|
|
Yield Guaranty payment received from seller |
|
|
— |
|
|
|
(301 |
) |
|
|
(2,579 |
) |
|
|
(2,601 |
) |
|
Change in fair value |
|
|
— |
|
|
|
— |
|
|
|
321 |
|
|
|
1,321 |
|
|
Ending balance |
|
$ |
1,820 |
|
|
$ |
3,208 |
|
|
$ |
1,820 |
|
|
$ |
3,208 |
|
20
CNL HEALTHCARE PROPERTIES, INC. AND SUBSIDIARIES
NOTES TO CONDENSED CONSOLIDATED FINANCIAL STATEMENTS
NINE MONTHS ENDED SEPTEMBER 30, 2015 (UNAUDITED)
|
9. |
Contingent Purchase Price Consideration (continued) |
Medical Portfolio I
During 2013, in conjunction with the acquisition of Medical Portfolio I, the Company entered into an earn-out agreement with the seller related to Cleveland Clinic, the tenant at Chestnut Commons, whereby the tenant maintains an exercisable right to expand the leased space by an additional 10,000 square feet within 24 months of the property acquisition closing (“Chestnut Commons Earn-Out”). The Chestnut Commons Earn-Out fee was equal to (a) the base rent due for the first full year of the lease applicable to the expansion space divided by 8% minus (b) the costs incurred by the Company in connection with the exercise by Cleveland Clinic of its option for the expansion space, including tenant improvement costs, multiplied by 50%. The Chestnut Commons Earn-Out expired in August 2015. The following table provides a roll-forward of the fair value of the contingent purchase price consideration related to the Chestnut Commons Earn-Out for the quarter and nine months ended September 30, 2015 and 2014 (in thousands):
|
|
|
Quarter Ended |
|
|
Nine Months Ended |
|
||||||||||
|
|
|
September 30, |
|
|
September 30, |
|
||||||||||
|
|
|
2015 |
|
|
2014 |
|
|
2015 |
|
|
2014 |
|
||||
|
Beginning balance |
|
$ |
(268 |
) |
|
$ |
(507 |
) |
|
$ |
(268 |
) |
|
$ |
(507 |
) |
|
Contingent consideration in connection with acquisition |
|
|
— |
|
|
|
— |
|
|
|
— |
|
|
|
— |
|
|
Change in fair value |
|
|
268 |
|
|
|
— |
|
|
|
268 |
|
|
|
— |
|
|
Ending balance |
|
$ |
— |
|
|
$ |
(507 |
) |
|
$ |
— |
|
|
$ |
(507 |
) |
South Bay II Communities
In conjunction with the acquisition of the South Bay II Communities, the Company entered into an agreement with the sellers whereby the purchase price is adjusted in the event that certain net operating income targets are met. The additional consideration was determined within three months of the acquisition date and is equal to (a) the baseline net operating income divided by the baseline capitalization rates (as defined in the purchase and sale agreement) less (b) the purchase price paid at closing. The following table provides a roll-forward of the fair value of the estimated contingent purchase price consideration related to the South Bay II Communities for the quarter and nine months ended September 30, 2015 and 2014 (in thousands):
|
|
|
Quarter ended |
|
|
Nine Months Ended |
|
||||||||||
|
|
|
September 30, |
|
|
September 30, |
|
||||||||||
|
|
|
2015 |
|
|
2014 |
|
|
2015 |
|
|
2014 |
|
||||
|
Beginning balance |
|
$ |
— |
|
|
$ |
(8,500 |
) |
|
$ |
— |
|
|
$ |
— |
|
|
Contingent consideration in connection with acquisition |
|
|
— |
|
|
|
— |
|
|
|
— |
|
|
|
(12,395 |
) |
|
Contingent consideration payment |
|
|
— |
|
|
|
10,300 |
|
|
|
— |
|
|
|
14,195 |
|
|
Change in fair value |
|
|
— |
|
|
|
(1,800 |
) |
|
|
— |
|
|
|
(1,800 |
) |
|
Ending balance |
|
$ |
— |
|
|
$ |
— |
|
|
$ |
— |
|
|
$ |
— |
|
Superior Residences of Panama City
In connection with the purchase of Superior Residences of Panama City, the Company entered into an earn-out agreement with the seller whereby additional consideration is owed in the event that certain performance targets are met (“Panama City Earn-Out”). Under the earn-out agreement, the seller has an opportunity of earning up to $4.0 million in additional purchase price consideration during the immediate 36 months post-closing. At the acquisition date and as of September 30, 2015, the Company determined the fair value of the Panama City Earn-Out to be $3.0 million, which was recorded as other liabilities in the accompanying condensed consolidated balance sheet.
Fair Value Measurements
The fair value of the contingent purchase price consideration was based on a then-current income approach that is primarily determined based on the present value and probability of future cash flows using internal underwriting models. The income approach further includes estimates of risk-adjusted rate of return and capitalization rates for each property. Since this methodology includes inputs that are less observable by the public and are not necessarily reflected in active markets, the measurements of the estimated fair value related to the Company’s contingent purchase price consideration are categorized as Level 3 on the three-level fair value hierarchy.
21
CNL HEALTHCARE PROPERTIES, INC. AND SUBSIDIARIES
NOTES TO CONDENSED CONSOLIDATED FINANCIAL STATEMENTS
NINE MONTHS ENDED SEPTEMBER 30, 2015 (UNAUDITED)
|
10. |
Indebtedness |
The following table provides details of the Company’s indebtedness as of September 30, 2015 and December 31, 2014 (in thousands):
|
|
|
September 30, |
|
|
December 31, |
|
||
|
|
|
2015 |
|
|
2014 |
|
||
|
Mortgages payable and other notes payable: |
|
|
|
|
|
|
|
|
|
Fixed rate debt |
|
$ |
395,783 |
|
|
$ |
370,854 |
|
|
Variable rate debt (1) |
|
|
469,739 |
|
|
|
482,922 |
|
|
Mortgages and other notes payable |
|
|
865,522 |
|
|
|
853,776 |
|
|
Premium (discount), net (2) |
|
|
(259 |
) |
|
|
(215 |
) |
|
Total mortgages and other notes payable, net |
|
|
865,263 |
|
|
|
853,561 |
|
|
Credit facilities: |
|
|
|
|
|
|
|
|
|
Term Loan Facility (1) |
|
|
175,000 |
|
|
|
175,000 |
|
|
Revolving Credit Facility (3) |
|
|
215,000 |
|
|
|
31,403 |
|
|
Total borrowings |
|
$ |
1,255,263 |
|
|
$ |
1,059,964 |
|
FOOTNOTES:
|
(1) |
As of September 30, 2015 and December 31, 2014, the Company had entered into interest rate swaps with notional amounts of approximately $342.7 million and $182.1 million, respectively, which were settling on a monthly basis. In addition, as of September 30, 2015 and December 31, 2014, the Company had entered into forward-starting interest rate swaps for total notional amounts of approximately $187.1 million and $269.4 million, respectively, in order to hedge its exposure to variable rate debt in future periods. The remaining forward-starting interest rate swaps have a range of effective dates beginning in 2015 and continuing through the maturity date of the loans being hedged. |
|
(2) |
Premium (discount), net is reflective of the Company recording mortgage notes payable assumed at fair value on the respective acquisition date. |
|
(3) |
As of September 30, 2015 and December 31, 2014, availability under the Revolving Credit Facility was approximately $15.0 million and $14.0 million, respectively, based on the value of the properties in the unencumbered collateral pool of assets supporting the loan. |
Maturities of indebtedness for the remainder of 2015, each of the next four years and thereafter, in the aggregate, as of September 30, 2015 are as follows (in thousands):
|
2015 |
|
$ |
4,769 |
|
|
2016 |
|
|
37,730 |
|
|
2017 |
|
|
261,106 |
|
|
2018 |
|
|
299,180 |
|
|
2019 |
|
|
487,724 |
|
|
Thereafter |
|
|
164,754 |
|
|
|
|
$ |
1,255,263 |
|
As a result of the tenant default discussed in Note 5. “Intangibles, net,” the lender on the mortgage loan secured by the two specialty hospitals elected to accelerate the required debt service payments related to these properties from a 25-year to a 15-year amortization period given that the tenant did not meet the required lease coverage thresholds. In September 2015, the Company signed an amended and restated lease agreement with a new tenant at one of the specialty hospitals and the lender re-adjusted the required debt service payments for the property back to a 25-year amortization period. The above maturities of indebtedness have been updated to reflect the amortization adjustments made by the lender effective November 2015.
22
CNL HEALTHCARE PROPERTIES, INC. AND SUBSIDIARIES
NOTES TO CONDENSED CONSOLIDATED FINANCIAL STATEMENTS
NINE MONTHS ENDED SEPTEMBER 30, 2015 (UNAUDITED)
|
10. |
Indebtedness (continued) |
The Company financed a portion of the acquisitions described in Note 3. “Acquisitions” through additional borrowings and loan assumptions. The following table provides details of new indebtedness during the nine months ended September 30, 2015 as of September 30, 2015 (in thousands):
|
|
|
Interest Rate at |
|
|
|
|
|
|
|
|
|
|
|
September 30, |
|
|
|
Maturity |
|
September 30, |
|
|
|
Property and Loan Type |
|
2015 (1) |
|
Payment Terms |
|
Date (2) |
|
2015 |
|
|
|
Novi Orthopaedic Center; Mortgage Loan |
|
3.61% per annum |
|
Monthly interest only payments through June 2018; principal and interest payments thereafter based on a 25-year amortization schedule |
|
6/15/20 |
|
$ |
19,825 |
|
|
ProMed Medical Building I; Mortgage Loan |
|
3.64% per annum (3) |
|
Monthly principal and interest payments based upon a 30-year amortization schedule |
|
1/15/22 |
|
|
7,095 |
|
|
540 New Waverly Place; Mortgage Loan |
|
4.08% per annum |
|
Monthly principal and interest payments based upon a 25-year amortization schedule |
|
5/31/28 |
|
|
7,096 |
|
|
|
|
|
|
Total fixed rate debt |
|
|
|
|
34,016 |
|
|
Raider Ranch Development; Construction Loan |
|
30-day LIBOR plus 3.50% at 0.5% LIBOR floor |
|
Monthly interest only payments through October 2017; principal and interest payments thereafter based on a 25-year amortization schedule |
|
10/27/17 |
|
|
5,914 |
|
|
HarborChase of Shorewood; Construction Loan |
|
30-day LIBOR plus 3%; 2% all in floor |
|
Monthly interest only payments through July 2017; principal and interest payments thereafter based on a 25-year amortization schedule |
|
7/15/19 |
|
|
10,117 |
|
|
UT Cancer Institute; Mortgage Loan |
|
30-day LIBOR plus 2.00% per annum |
|
Monthly interest only payments through July 2017; principal and interest payments thereafter based on a 25-year amortization schedule |
|
12/22/19 |
|
|
21,672 |
|
|
Watercrest at Katy; Construction Loan |
|
30-day LIBOR plus 2.75% per annum |
|
Monthly interest only payments through December 2017; principal and interest payments thereafter based on a 30-year amortization schedule |
|
12/27/19 |
|
|
4,505 |
|
|
|
|
|
|
Total variable rate debt |
|
|
|
|
42,208 |
|
|
|
|
|
|
Fixed and variable rate debt |
|
|
|
|
76,224 |
|
|
|
|
|
|
Premium (discount), net |
|
|
|
|
(150 |
) |
|
|
|
|
|
Total debt |
|
|
|
$ |
76,074 |
|
FOOTNOTES:
|
(1) |
The 30-day LIBOR was approximately 0.19% as September 30, 2015. |
|
(2) |
Represents the initial maturity date (or, as applicable, the maturity date as extended). The maturity date may be extended beyond the date shown subject to certain lender conditions. |
|
(3) |
Beginning January 2020, the interest rate transitions to variable rate based on 30-day LIBOR plus 2.20% per annum. |
23
CNL HEALTHCARE PROPERTIES, INC. AND SUBSIDIARIES
NOTES TO CONDENSED CONSOLIDATED FINANCIAL STATEMENTS
NINE MONTHS ENDED SEPTEMBER 30, 2015 (UNAUDITED)
|
10. |
Indebtedness (continued) |
The fair market value and carrying value of the mortgage and other notes payable was approximately $876.3 million and $865.5 million, respectively, and both the fair market value and carrying value of the Credit Facilities was $390.0 million as of September 30, 2015. The fair market value and carrying value of the mortgage and other notes payable was approximately $868.5 million and $853.6 million, respectively, and both the fair market value and carrying value of the Credit Facilities was $206.4 million as of December 31, 2014. These fair market values are based on current rates and spreads the Company would expect to obtain for similar borrowings. Since this methodology includes inputs that are less observable by the public and are not necessarily reflected in active markets, the measurement of the estimated fair values related to the Company’s mortgage notes payable is categorized as Level 3 on the three-level valuation hierarchy. The estimated fair value of accounts payable and accrued liabilities approximates the carrying value as of September 30, 2015 and December 31, 2014 because of the relatively short maturities of the obligations.
In March 2015, the Company repaid its $30.0 million outstanding mortgage loan on the Perennial Communities prior to its scheduled maturity. In connection therewith, the Company wrote-off approximately $0.2 million in unamortized loan costs as interest expense and loan cost amortization in the accompanying condensed consolidated statements of operations. In addition, the corresponding interest rate swap was terminated and approximately $0.1 million related to the derecognition of the cash flow hedge was reclassified from other comprehensive loss to interest expense and loan cost amortization in the accompanying condensed consolidated financial statements.
In April 2015, the Company repaid its $34.5 million outstanding mortgage loan on the Medical Portfolio I Properties prior to its scheduled maturity. In connection therewith, the Company wrote-off approximately $0.2 million in unamortized loan costs as interest expense and loan cost amortization in the accompanying condensed consolidated statements of operations. In addition, the corresponding interest rate swap was terminated and approximately $0.2 million related to the derecognition of the cash flow hedge was reclassified from other comprehensive loss to interest expense and loan cost amortization in the accompanying condensed consolidated financial statements.
In December 2014, the Company amended and restated the terms of its credit agreement with KeyBank, as administrative agent, by entering into a $230 million Revolving Credit Facility and a $175 million Term Loan Facility. Pursuant to the Amended Credit Agreement, the Company has the ability to increase the collective borrowings under the Credit Facilities to $700 million. Moreover, the Revolving Credit Facility has an initial term of 36 months plus two 12-month extension options; whereas, the Term Loan Facility has an initial term of 50 months plus one 12-month extension option. The Credit Facilities bear interest based on LIBOR and a spread that varies with the Company’s leverage ratio. In addition, the Company is required to make interest only payments until the respective maturity dates of the Credit Facilities as well as to pay fees ranging from 0.15% to 0.25% for unused commitments on the Revolving Credit Facility.
The Credit Facilities contain affirmative, negative, and financial covenants which are customary for loans of this type, including (but not limited to): (i) maximum leverage, (ii) minimum fixed charge coverage ratio, (iii) minimum consolidated net worth, (iv) restrictions on payments of cash distributions except if required by REIT requirements, (v) maximum secured and unsecured indebtedness, and (vi) limitations on certain types of investments and with respect to the pool of properties supporting borrowings under the Credit Facilities, minimum debt service coverage ratio, and remaining lease terms, as well as property type, MSA, operator, and asset value concentration limits. The limitations on distributions includes a limitation on the extent of allowable distributions, which are not to exceed the greater of 95% of adjusted FFO (as defined per the Credit Facilities) and the minimum amount of distributions required to maintain the Company’s REIT status.
All of the Company’s mortgage and construction loans contain customary financial covenants and ratios; including (but not limited to): debt service coverage ratio, minimum occupancy levels, limitations on incurrence of additional indebtedness, etc. As of September 30, 2015, the Company was in compliance with all financial covenants and ratios.
24
CNL HEALTHCARE PROPERTIES, INC. AND SUBSIDIARIES
NOTES TO CONDENSED CONSOLIDATED FINANCIAL STATEMENTS
NINE MONTHS ENDED SEPTEMBER 30, 2015 (UNAUDITED)
|
11. |
Related Party Arrangements |
In March 2013, the Company entered into the Advisor Expense Support Agreement, whereby commencing on April 1, 2013, the Advisor agreed to provide expense support to the Company through forgoing the payment of fees in cash and acceptance of restricted stock for services rendered and specified expenses incurred in an amount equal to the positive excess, if any, of (a) aggregate stockholder cash distributions declared for the applicable quarter, over (b) the Company’s aggregate modified funds from operations (as defined in the Advisor Expense Support Agreement). The Advisor expense support amount is determined for each calendar quarter of the Company, on a non-cumulative basis, each quarter-end date (“Determination Date”). In August 2013, the Company entered into the Property Manager Expense Support Agreement, whereby commencing on July 1, 2013, the Property Manager agreed to provide expense support to the Company through forgoing the payment of fees in cash and accepting restricted stock for services in an amount equal to the positive excess, if any, of (a) aggregate stockholder cash distributions declared for the applicable quarter, over (b) the Company’s aggregate modified funds from operations (as defined in the Property Manager Expense Support Agreement). The Property Manager expense support amount shall be determined, on a non-cumulative basis, after the calculation of the Advisor expense support amount pursuant to the Property Manager Expense Support Agreement on each Determination Date. The terms of both the Advisor Expense Support Agreement and the Property Manager Expense Support Agreement (‘the Expense Support Agreements”) automatically renew for consecutive one year periods, subject to the right of the Advisor or Property Manager to terminate their respective agreements upon 30 days’ written notice to the Company.
In exchange for services rendered and in consideration of the expense support provided, the Company will issue, within 45 days following each Determination Date, a number of shares of restricted stock equal to the quotient of the expense support amount provided by the Advisor and Property Manager for the preceding quarter divided by either: (1) the then-current public offering price per share of common stock during the Offerings or (2) the Company’s then-current net asset value (“NAV”) per share of common stock subsequent to the Offerings. Any amounts settled, and for which restricted stock shares are issued, pursuant to the Expense Support Agreements will be permanently waived and the Company will have no obligation to pay such amounts to the Advisor or the Property Manager. The Restricted Stock is subordinated and forfeited to the extent that stockholders do not receive their original invested capital back with at least a 6% annualized return on investment upon ultimate liquidity of the Company. Since the vesting criteria is outside the control of the Advisor and Property Manager and involves both market conditions and counterparty performance conditions, the restricted stock shares will be treated as unissued for financial reporting purposes until the vesting criteria, as defined in the Expense Support Agreements, are met.
The following fees were settled and paid in the form of Restricted Stock in connection with the Expense Support Agreements for the quarter and nine months ended September 30, 2015 and 2014, and cumulatively as of September 30, 2015 (in thousands, except offering price):
|
|
|
Quarter ended |
|
|
Nine Months Ended |
|
|
As of |
|
|||||||||||
|
|
|
September 30, |
|
|
September 30, |
|
|
September 30, |
|
|||||||||||
|
|
|
2015 |
|
|
2014 |
|
|
2015 |
|
|
2014 |
|
|
2015 |
|
|||||
|
Asset management fees (1) |
|
$ |
885 |
|
|
$ |
884 |
|
|
$ |
2,298 |
|
|
$ |
3,764 |
|
|
$ |
8,566 |
|
|
Then-current offering price (2) |
|
$ |
10.58 |
|
|
$ |
10.14 |
|
|
$ |
10.58 |
|
|
$ |
10.14 |
|
|
$ |
10.58 |
|
|
Restricted stock shares (3) |
|
|
84 |
|
|
|
87 |
|
|
|
217 |
|
|
|
371 |
|
|
|
828 |
|
|
Cash distributions on Restricted Stock (4) |
|
$ |
75 |
|
|
$ |
30 |
|
|
$ |
197 |
|
|
$ |
48 |
|
|
$ |
300 |
|
|
Stock distributions on Restricted Stock (5) |
|
|
5 |
|
|
|
2 |
|
|
|
14 |
|
|
|
4 |
|
|
|
21 |
|
FOOTNOTES:
|
(1) |
No other amounts have been settled in accordance with the Expense Support Agreements for the quarter and nine months ended September 30, 2015 and 2014, and cumulatively as of September 30, 2015. |
|
(2) |
During the Offerings, the then-current offering prices were based on the Company’s NAV per share as of the Determination Date, plus selling commissions and marketing support fees. Subsequent to the close of the Company’s Offerings, the then-current offering prices are based on the Company’s NAV per share as of the Determination Date. |
|
(3) |
Restricted stock shares are comprised of approximately 0.08 million issuable to the Advisor as of September 30, 2015. No fair value was assigned to the restricted stock shares as the shares were valued at zero, which represents the lowest possible value estimated at vesting. In addition, the restricted stock shares were treated as unissued for financial reporting purposes because the vesting criteria had not been met through September 30, 2015. |
25
CNL HEALTHCARE PROPERTIES, INC. AND SUBSIDIARIES
NOTES TO CONDENSED CONSOLIDATED FINANCIAL STATEMENTS
NINE MONTHS ENDED SEPTEMBER 30, 2015 (UNAUDITED)
|
11. |
Related Party Arrangements (continued) |
|
(4) |
The cash distributions have been recognized as compensation expense as issued and included in general and administrative expense in the accompanying condensed consolidated statements of operations. |
|
(5) |
The par value of the stock distributions has been recognized as compensation expense as issued and included in general and administrative expense in the accompanying condensed consolidated statements of operations. |
The Company maintains accounts totaling approximately $0.1 million as of both September 30, 2015 and December 31, 2014, at a bank in which the Company’s chairman serves as a director.
In March 2015, the Company acquired Fieldstone Memory Care, a 40-unit memory care community located in Yakima, Washington for a purchase price of $12.4 million from a related party of the Company’s Sponsor. The board of directors, including all of the independent directors, concluded that substantial justification existed to consummate the Fieldstone Memory Care acquisition. In determining whether to approve the Fieldstone Transaction, the board of directors reviewed and took into account, among other factors it deemed appropriate, the following information, facts and circumstances: an affiliate of CNL is the majority interest holder and managing member of the seller; the purchase price exceeds the seller’s acquisition and development costs; a March 2015 independent appraisal; and a prospective value upon reaching stabilization.
In June 2013, the Company originated an acquisition, development and construction loan (“ADC Loan”) to C4 Development, LLC (“Crosland Southeast”), a related party by virtue of a family relationship between a principal of the borrower and the Company’s vice chairman who recused himself from review and approval of the investment, for the development of an MOB in Rutland, Virginia that will function as an out-patient emergency and imaging center and was leased to Hospital Corporation of America (“HCA”). As of December 31, 2014, the Company’s ADC Loan had been fully repaid. For the quarter and nine months ended September 30, 2014, the Company recorded interest income of approximately $0.2 million and $0.5 million, respectively, which is included in interest income on note receivable from related party in the accompanying condensed consolidated statements of operations.
The Company incurs operating expenses which, in general, relate to administration of the Company on an ongoing basis. Pursuant to the advisory agreement, the Advisor shall reimburse the Company the amount by which the total operating expenses paid or incurred by the Company exceed, in any four consecutive fiscal quarters (“Expense Year”) commencing with the Expense Year ending June 30, 2013, the greater of 2% of average invested assets or 25% of net income (as defined in the advisory agreement) (“Limitation”), unless a majority of the Company’s independent directors determines that such excess expenses are justified based on unusual and non-recurring factors (“Expense Cap Test”). In performing the Expense Cap Test, the Company uses operating expenses on a GAAP basis after making adjustments for the benefit of expense support under the Expense Support Agreements. For the Expense Year ended September 30, 2015, the Company did not incur operating expenses in excess of the Limitation.
The fees incurred by and reimbursable to the Managing Dealer in connection with the Company’s Offerings for the quarter and nine months ended September 30, 2015 and 2014, and related amounts unpaid as of September 30, 2015 and December 31, 2014 are as follows (in thousands):
|
|
|
Quarter ended |
|
|
Nine Months Ended |
|
|
Unpaid amounts as of (1) |
|
|||||||||||||||
|
|
|
September 30, |
|
|
September 30, |
|
|
September 30, |
|
|
December 31, |
|
||||||||||||
|
|
|
2015 |
|
|
2014 |
|
|
2015 |
|
|
2014 |
|
|
2015 |
|
|
2014 |
|
||||||
|
Selling commissions (2) |
|
$ |
4,085 |
|
|
$ |
6,689 |
|
|
$ |
12,076 |
|
|
$ |
12,285 |
|
|
$ |
340 |
|
|
$ |
388 |
|
|
Marketing support fees (2) |
|
|
5,232 |
|
|
|
4,524 |
|
|
|
15,851 |
|
|
|
9,937 |
|
|
|
300 |
|
|
|
555 |
|
|
|
|
$ |
9,317 |
|
|
$ |
11,213 |
|
|
$ |
27,927 |
|
|
$ |
22,222 |
|
|
$ |
640 |
|
|
$ |
943 |
|
26
CNL HEALTHCARE PROPERTIES, INC. AND SUBSIDIARIES
NOTES TO CONDENSED CONSOLIDATED FINANCIAL STATEMENTS
NINE MONTHS ENDED SEPTEMBER 30, 2015 (UNAUDITED)
|
11. |
Related Party Arrangements (continued) |
The expenses and fees incurred by and reimbursable to the Company’s related parties for the quarter and nine months ended September 30, 2015 and 2014, and related amounts unpaid as of September 30, 2015 and December 31, 2014 are as follows (in thousands):
|
|
|
Quarter ended |
|
|
Nine Months Ended |
|
|
Unpaid amounts as of (1) |
|
|||||||||||||||
|
|
|
September 30, |
|
|
September 30, |
|
|
September 30, |
|
|
December 31, |
|
||||||||||||
|
|
|
2015 |
|
|
2014 |
|
|
2015 |
|
|
2014 |
|
|
2015 |
|
|
2014 |
|
||||||
|
Reimbursable expenses: |
|
|
|
|
|
|
|
|
|
|
|
|
|
|
|
|
|
|
|
|
|
|
|
|
|
Offering costs (2) |
|
$ |
919 |
|
|
$ |
1,075 |
|
|
$ |
2,785 |
|
|
$ |
3,442 |
|
|
$ |
266 |
|
|
$ |
713 |
|
|
Operating expenses (3) |
|
|
1,119 |
|
|
|
918 |
|
|
|
3,140 |
|
|
|
2,402 |
|
|
|
1,305 |
|
|
|
479 |
|
|
Acquisition fees and expenses |
|
|
156 |
|
|
|
130 |
|
|
|
461 |
|
|
|
463 |
|
|
|
14 |
|
|
|
80 |
|
|
|
|
|
2,194 |
|
|
|
2,123 |
|
|
|
6,386 |
|
|
|
6,307 |
|
|
|
1,585 |
|
|
|
1,272 |
|
|
Investment services fees (4) |
|
|
8,624 |
|
|
|
3,651 |
|
|
|
13,645 |
|
|
|
11,875 |
|
|
|
1,434 |
|
|
― |
|
|
|
Financing coordination fees (5) |
|
― |
|
|
― |
|
|
― |
|
|
|
220 |
|
|
― |
|
|
― |
|
|||||
|
Property management fees (6) |
|
|
1,128 |
|
|
|
728 |
|
|
|
2,844 |
|
|
|
1,763 |
|
|
|
726 |
|
|
|
429 |
|
|
Asset management fees (7) |
|
|
6,075 |
|
|
|
3,696 |
|
|
|
16,127 |
|
|
|
9,510 |
|
|
|
1,235 |
|
|
|
355 |
|
|
|
|
$ |
18,021 |
|
|
$ |
10,198 |
|
|
$ |
39,002 |
|
|
$ |
29,675 |
|
|
$ |
4,980 |
|
|
$ |
2,056 |
|
FOOTNOTES:
|
(1) |
Amounts are recorded as due to related parties in the accompanying condensed consolidated balance sheets. |
|
(2) |
Amounts are recorded as stock issuance and offering costs in the accompanying condensed consolidated statements of stockholders’ equity and redeemable noncontrolling interest. |
|
(3) |
Amounts are recorded as general and administrative expenses in the accompanying condensed consolidated statements of operations. |
|
(4) |
For the quarter and nine months ended September 30, 2015, the Company incurred approximately $8.6 million and $13.6 million, respectively, in investment service fees, of which approximately $1.5 million and $1.5 million, respectively, were capitalized and included in real estate under development in the accompanying condensed consolidated balance sheets. For the quarter and nine months ended September 30, 2014, Company incurred approximately $3.7 million and $11.9 million, respectively, in investment service fees, of which approximately $0.4 million and $1.6 million, respectively, were capitalized and included in real estate under development in the accompanying condensed consolidated balance sheets. Investment services fees, that are not capitalized, are recorded as acquisition fees and expenses in the accompanying condensed consolidated statements of operations. |
|
(5) |
There were no financing coordination fees for the quarter and nine months ended September 30, 2015. For the nine months ended September 30, 2014, the Company incurred approximately $0.2 million in financing coordination fees which was capitalized and included in its investment in the Windsor Manor Joint Venture. |
|
(6) |
For the quarter and nine months ended September 30, 2015, the Company incurred approximately $1.1 million and $2.8 million, respectively, in property and construction management fees payable to the Property Manager of which approximately $0.3 million and $0.6 million, respectively, in construction management fees were capitalized and included in real estate under development in the accompanying condensed consolidated balance sheets. For the quarter and nine months ended September 30, 2014, the Company incurred approximately $0.7 million and $1.8 million, respectively, in property and construction management fees payable to the Property Manager of which approximately $0.2 million and $0.3 million, respectively, in construction management fees were capitalized and included in real estate under development in the accompanying condensed consolidated balance sheets. |
|
(7) |
For the quarter and nine months ended September 30, 2015, the Company incurred approximately $6.1 million and $16.1 million, respectively, in asset management fees payable to the Advisor of which approximately $0.9 million and $2.3 million, respectively, was settled in accordance with the terms of the Advisor Expense Support Agreement and approximately $0.1 million and $0.4 million, respectively, was capitalized and included in real estate under development in the accompanying condensed consolidated balance sheets. For the quarter and nine months ended September 30, 2014, the Company incurred approximately $3.7 million and $9.5 million, respectively, in asset management fees payable to the Advisor of which approximately $0.9 million and $3.8 million, respectively, was settled in accordance with the terms of the Advisor Expense Support Agreement and approximately $0.1 million and $0.2 million, respectively, was capitalized for each period and included in real estate under development in the accompanying condensed consolidated balance sheets. |
27
CNL HEALTHCARE PROPERTIES, INC. AND SUBSIDIARIES
NOTES TO CONDENSED CONSOLIDATED FINANCIAL STATEMENTS
NINE MONTHS ENDED SEPTEMBER 30, 2015 (UNAUDITED)
|
12. |
Derivative Financial Instruments |
The following table summarizes the terms of the derivative financial instruments held by the Company or through its joint venture and the asset (liability) that has been recorded (in thousands):
|
Initial |
|
|
|
|
|
|
|
|
|
|
|
|
|
|
|
|
|
|
Fair value asset (liability) as of |
|
||||||
|
Notional |
|
|
|
|
|
|
Credit |
|
|
Trade |
|
Forward |
|
Maturity |
|
|
September 30, |
|
|
December 31, |
|
|||||
|
Amount |
|
|
Strike (1) |
|
|
Spread (1) |
|
|
date |
|
date |
|
date |
|
|
2015 |
|
|
2014 |
|
||||||
|
$ |
12,421 |
(2) |
|
|
1.3 |
% |
|
|
2.6 |
% |
|
1/17/2013 |
|
1/15/2015 |
|
1/16/2018 |
|
|
$ |
(170 |
) |
|
$ |
(71 |
) |
|
|
$ |
38,255 |
(2) |
|
|
2.7 |
% |
|
|
2.5 |
% |
|
9/6/2013 |
|
8/17/2015 |
|
7/10/2018 |
|
|
$ |
(1,906 |
) |
|
$ |
(1,228 |
) |
|
|
$ |
26,067 |
(2) |
|
|
2.8 |
% |
|
|
2.5 |
% |
|
9/6/2013 |
|
8/17/2015 |
|
8/29/2018 |
|
|
$ |
(1,396 |
) |
|
$ |
(906 |
) |
|
|
$ |
30,000 |
(2) |
|
|
1.1 |
% |
|
|
2.7 |
% |
|
10/22/2013 |
|
8/5/2015 |
|
|
(4) |
|
|
$ |
— |
|
|
$ |
(82 |
) |
|
$ |
29,952 |
(2) |
|
|
0.9 |
% |
|
|
4.3 |
% |
|
11/13/2013 |
|
5/11/2015 |
|
|
(4) |
|
|
$ |
— |
|
|
$ |
(74 |
) |
|
$ |
11,000 |
(3) |
|
|
3.0 |
% |
|
― |
% |
|
6/27/2014 |
|
6/30/2014 |
|
6/30/2017 |
|
|
$ |
1 |
|
|
$ |
10 |
|
||
|
$ |
48,415 |
(2) |
|
|
2.4 |
% |
|
|
2.9 |
% |
|
8/15/2014 |
|
6/1/2016 |
|
6/2/2019 |
|
|
$ |
(1,360 |
) |
|
$ |
(270 |
) |
|
|
$ |
84,251 |
(2) |
|
|
2.3 |
% |
|
|
2.4 |
% |
|
9/12/2014 |
|
8/1/2015 |
|
7/15/2019 |
|
|
$ |
(3,315 |
) |
|
$ |
(1,326 |
) |
|
|
$ |
7,129 |
(2) |
|
|
1.2 |
% |
|
|
2.3 |
% |
|
11/12/2014 |
|
11/15/2014 |
|
10/15/2017 |
|
|
$ |
(79 |
) |
|
$ |
(35 |
) |
|
|
$ |
175,000 |
(2) |
|
|
1.6 |
% |
|
|
2.0 |
% |
|
12/23/2014 |
|
12/19/2014 |
|
2/19/2019 |
|
|
$ |
(3,526 |
) |
|
$ |
(881 |
) |
|
|
$ |
138,698 |
(2) |
|
|
1.7 |
% |
|
|
2.0 |
% |
|
1/9/2015 |
|
12/10/2015 |
|
12/22/2019 |
|
|
$ |
(2,946 |
) |
|
$ |
— |
|
|
FOOTNOTES:
|
(1) |
The all-in rates are equal to the sum of the Strike and Credit Spread detailed above. |
|
(2) |
Amounts related to interest rate swaps held by the Company, or its equity method investments, which are recorded at fair value and included in either other assets or other liabilities in the accompanying condensed consolidated balance sheets. |
|
(3) |
Amounts related to the interest rate cap held by the Windsor Manor Joint Venture for which the proportionate amounts of fair value relative to the Company’s ownership percentage are included in investments in unconsolidated entities in the accompanying condensed consolidated balance sheets. |
|
(4) |
The loans associated with these derivatives were repaid during the nine months ended September 30, 2015. Refer to Note 10. “Indebtedness” for additional information. |
Although the Company has determined that the majority of the inputs used to value its derivative financial instruments fall within Level 2 of the fair value hierarchy, the credit valuation adjustments associated with its derivatives utilize Level 3 inputs, such as estimates of current credit spreads, to evaluate the likelihood of default by the Company and its counterparties. The Company has assessed the significance of the impact of the credit valuation adjustments on the overall valuation of its derivative financial instruments and has determined that the credit valuation adjustments on the overall valuation adjustments are not significant to the overall valuation of its derivative financial instruments. As a result, the Company determined that its derivative financial instruments valuation in its entirety is classified in Level 2 of the fair value hierarchy. Determining fair value requires management to make certain estimates and judgments. Changes in assumptions could have a positive or negative impact on the estimated fair values of such instruments which could, in turn, impact the Company’s or its joint venture’s results of operations.
13.Equity
Stockholders’ Equity:
Public Offerings — The following table details the Company’s aggregate proceeds from its Offerings as of September 30, 2015 and December 31, 2014 (in millions):
|
|
|
September 30, 2015 |
|
|
December 31, 2014 |
|
||||||||||||||||||||||||||
|
|
|
Subscriptions |
|
|
Reinvestment Plan |
|
|
Subscriptions |
|
|
Reinvestment Plan |
|
||||||||||||||||||||
|
|
|
Proceeds |
|
|
Shares |
|
|
Proceeds |
|
|
Shares |
|
|
Proceeds |
|
|
Shares |
|
|
Proceeds |
|
|
Shares |
|
||||||||
|
Initial Offering |
|
$ |
1,271.4 |
|
|
|
125.1 |
|
|
$ |
27.1 |
|
|
|
2.8 |
|
|
$ |
1,114.2 |
|
|
|
110.2 |
|
|
$ |
27.1 |
|
|
|
2.8 |
|
|
Follow-on Offering |
|
|
372.9 |
|
|
|
35.3 |
|
|
|
26.0 |
|
|
|
2.6 |
|
|
― |
|
|
― |
|
|
― |
|
|
― |
|
||||
|
|
|
$ |
1,644.3 |
|
|
|
160.4 |
|
|
$ |
53.1 |
|
|
|
5.4 |
|
|
$ |
1,114.2 |
|
|
|
110.2 |
|
|
$ |
27.1 |
|
|
|
2.8 |
|
28
CNL HEALTHCARE PROPERTIES, INC. AND SUBSIDIARIES
NOTES TO CONDENSED CONSOLIDATED FINANCIAL STATEMENTS
NINE MONTHS ENDED SEPTEMBER 30, 2015 (UNAUDITED)
|
13. |
Equity (continued) |
Distributions — The following table details the Company’s historical share prices in its Offerings, including the prices pursuant to the Reinvestment Plan and the Company’s monthly cash and stock distributions per share:
|
Period |
|
Offering Price per Share |
|
|
Reinvestment Plan Price per Share |
|
|
Monthly Cash Distributions (1) |
|
|
Monthly Stock Distributions |
|
||||
|
December 11, 2013 through November 3, 2014 |
|
$ |
10.14 |
|
|
$ |
9.64 |
|
|
$ |
0.0338 |
|
|
|
0.0025 |
|
|
November 4, 2014 through September 30, 2015 |
|
$ |
10.58 |
|
|
$ |
10.06 |
|
|
$ |
0.0353 |
|
|
|
0.0025 |
|
FOOTNOTE:
|
(1) |
Monthly cash distributions were effective and payable to all common stockholders of record as of the close of business on the first business day in the month subsequent to the announcement of the Company’s NAV (i.e. December 1, 2014 for the current Offering price). |
During the nine months ended September 30, 2015 and 2014, the Company declared cash distributions of $44.9 million and $21.7 million, respectively, of which $18.8 million and $9.8 million, were paid in cash to stockholders and $26.1 million and $11.9 million, respectively, were reinvested pursuant to the Reinvestment Plan. In addition, for the nine months ended September 30, 2015 and 2014, the Company declared and made stock distributions of approximately 3.2 million and 1.6 million shares of common stock, respectively. The Company closed its Follow-On Offering on September 30, 2015 and discontinued its stock distributions concurrently.
The tax composition of the Company’s distributions declared for the nine months ended September 30, 2015 and 2014 were as follows:
|
|
|
Nine Months Ended September 30, |
|
|||||
|
Distribution Type |
|
2015 |
|
|
2014 |
|
||
|
Taxable as ordinary income |
|
|
30.1 |
% |
|
|
21.5 |
% |
|
Return of capital |
|
|
69.9 |
% |
|
|
78.5 |
% |
Redemptions — During the nine months ended September 30, 2015 and 2014, the Company received requests for the redemption of common stock of approximately 0.7 million and 0.2 million shares, respectively, all of which were approved for redemption at an average price of $9.51 and $9.13, respectively, and for a total of approximately $6.6 million and $2.1 million, respectively.
Other comprehensive income (loss) — The following table reflects the effect of derivative financial instruments held by Company, or its equity method investments, and included in the condensed consolidated statements of comprehensive loss for the quarter and nine months ended September 30, 2015 and 2014 (in thousands):
|
Derivative Financial Instrument |
|
Gain (loss) recognized in other comprehensive loss on derivative financial instrument |
|
|
Location of gain (loss) reclassified into earnings |
|
Loss reclassified from AOCI into earnings |
|
||||||||||
|
|
|
Quarter Ended |
|
|
|
|
Quarter Ended |
|
||||||||||
|
|
|
September 30, |
|
|
|
|
September 30, |
|
||||||||||
|
|
|
2015 |
|
|
2014 |
|
|
|
|
2015 |
|
|
2014 |
|
||||
|
Interest rate swaps |
|
$ |
(6,435 |
) |
|
$ |
224 |
|
|
Interest expense and loan cost amortization |
|
$ |
(1,078 |
) |
|
$ |
— |
|
|
Reclassification of interest rate swaps upon derecognition |
|
|
— |
|
|
|
— |
|
|
Interest expense and loan cost amortization |
|
|
— |
|
|
|
— |
|
|
Reclassification of interest rate swaps due to ineffectiveness |
|
|
48 |
|
|
|
— |
|
|
Interest expense and loan cost amortization |
|
|
(48 |
) |
|
|
— |
|
|
Interest rate cap held by unconsolidated joint venture |
|
|
(1 |
) |
|
|
(2 |
) |
|
Not applicable |
|
― |
|
|
|
— |
|
|
|
Total |
|
$ |
(6,388 |
) |
|
$ |
222 |
|
|
|
|
$ |
(1,126 |
) |
|
$ |
— |
|
29
CNL HEALTHCARE PROPERTIES, INC. AND SUBSIDIARIES
NOTES TO CONDENSED CONSOLIDATED FINANCIAL STATEMENTS
NINE MONTHS ENDED SEPTEMBER 30, 2015 (UNAUDITED)
|
13. |
Equity (continued) |
|
|
|
Nine Months Ended |
|
|
|
|
Nine Months Ended |
|
||||||||||
|
|
|
September 30, |
|
|
|
|
September 30, |
|
||||||||||
|
|
|
2015 |
|
|
2014 |
|
|
|
|
2015 |
|
|
2014 |
|
||||
|
Interest rate swaps |
|
$ |
(10,060 |
) |
|
$ |
(872 |
) |
|
Interest expense and loan cost amortization |
|
$ |
(2,411 |
) |
|
$ |
— |
|
|
Reclassification of interest rate swaps upon derecognition |
|
|
236 |
|
|
|
— |
|
|
Interest expense and loan cost amortization |
|
|
(236 |
) |
|
|
— |
|
|
Reclassification of interest rate swaps due to ineffectiveness |
|
|
48 |
|
|
|
— |
|
|
Interest expense and loan cost amortization |
|
|
(48 |
) |
|
|
— |
|
|
Interest rate cap held by unconsolidated joint venture |
|
|
(9 |
) |
|
|
21 |
|
|
Not applicable |
|
― |
|
|
|
— |
|
|
|
Total |
|
$ |
(9,785 |
) |
|
$ |
(851 |
) |
|
|
|
$ |
(2,695 |
) |
|
$ |
— |
|
|
14. |
Commitments and Contingencies |
From time to time the Company may be exposed to litigation arising from operations of its business in the ordinary course of business. Management is not aware of any litigation that it believes will have a material adverse impact on the Company’s financial condition or results of operations.
Refer to Note 4. “Real Estate Assets, net” for additional information on the remaining development budgets for the Company’s seniors housing developments.
Refer to Note 8. “Ground and Air Rights Leases” for information on commitments under its ground and air rights lease agreements.
Refer to Note 9. “Contingent Purchase Price Consideration” for information on potential contingent purchase price consideration related to the purchase of Superior Residences of Panama City.
Refer to Note 11. “Related Party Arrangements” for information on contingent restricted stock shares due to the Company’s Advisor and Property Manager in connection with the Expense Support Agreements.
|
15. |
Subsequent Events |
During the period from October 1, 2015 through October 30, 2015, the Company received additional subscription proceeds of approximately $21.9 million (2.1 million shares). While the Follow-On Offering closed on September 30, 2015, the Company accepted subscriptions proceeds for agreements that were received in good order on or before September 30, 2015 and for which subscription proceeds were received by the transfer agent through October 30, 2015.
The Company’s board of directors declared a monthly cash distribution of $0.0353 on each outstanding share of common stock on October 1, 2015 and November 1, 2015. These distributions are to be paid and distributed by December 31, 2015.
30
Item 2. Management’s Discussion and Analysis of Financial Condition and Results of Operations
Caution Concerning Forward-Looking Statements
Statements contained in this Quarterly Report on Form 10-Q for the nine months and the quarter ended September 30, 2015 may constitute “forward-looking statements” within the meaning of the Federal Private Securities Litigation Reform Act of 1995. The Company intends that such forward-looking statements be subject to the safe harbor created by Section 21E of the Securities Exchange Act of 1934, as amended (the “Exchange Act”). Forward-looking statements are statements that do not relate strictly to historical or current facts, but reflect management’s current understandings, intentions, beliefs, plans, expectations, assumptions and/or predictions regarding the future of the Company’s business and its performance, the economy, and other future conditions and forecasts of future events, and circumstances. Forward-looking statements are typically identified by words such as “believes,” “expects,” “anticipates,” “intends,” “estimates,” “plans,” “continues,” “pro forma,” “may,” “will,” “seeks,” “should” and “could,” and words and terms of similar substance in connection with discussions of future operating or financial performance, business strategy and portfolios, projected growth prospects, cash flows, costs and financing needs, legal proceedings, amount and timing of anticipated future distributions, estimated per share net asset value of the Company’s common stock, and/or other matters. The Company’s forward-looking statements are not guarantees of future performance. While the Company’s management believes its forward-looking statements are reasonable, such statements are inherently susceptible to uncertainty and changes in circumstances. As with any projection or forecast, forward-looking statements are necessarily dependent on assumptions, data and/or methods that may be incorrect or imprecise, and may not be realized. The Company’s forward-looking statements are based on management’s current expectations and a variety of risks, uncertainties and other factors, many of which are beyond the Company’s ability to control or accurately predict. Although the Company believes that the expectations reflected in such forward-looking statements are based upon reasonable assumptions, the Company’s actual results could differ materially from those set forth in the forward-looking statements due to a variety of risks, uncertainties and other factors.
Important factors that could cause the Company's actual results to vary materially from those expressed or implied in its forward-looking statements include, but are not limited to, government regulation, economic, strategic, political and social conditions, and the following: a worsening economic environment in the U.S. or globally, including financial market fluctuations; risks associated with the Company’s investment strategy, including its concentration in the healthcare sector; the illiquidity of an investment in the Company’s stock; liquidation at less than the subscription price of the Company’s stock; the impact of regulations requiring periodic valuation of the Company on a per share basis, including the uncertainties inherent in such valuations and that the amount that a stockholder would ultimately realize upon liquidation may vary significantly from the Company’s estimated net asset value; risks associated with real estate markets, including declining real estate values; risks associated with reliance on the Company’s advisor and its affiliates, including conflicts of interest; the Company’s failure to obtain, renew or extend necessary financing or to access the debt or equity markets; the use of debt to finance the Company’s business activities, including refinancing and interest rate risk and the Company’s failure to comply with debt covenants; the Company’s inability to identify and close on suitable investments; failure to successfully manage growth or integrate acquired properties and operations; the Company’s inability to make necessary improvements to properties on a timely or cost-efficient basis; risks related to property expansions and renovations; risks related to development projects or acquired property value-add conversions, if applicable, including construction delays, cost overruns, the Company’s inability to obtain necessary permits, and/or public opposition to these activities; competition for properties and/or tenants; defaults on or non-renewal of leases by tenants; failure to lease properties on favorable terms or at all; the impact of current and future environmental, zoning and other governmental regulations affecting the Company’s properties; the impact of changes in accounting rules; inaccuracies of the Company’s accounting estimates; unknown liabilities of acquired properties or liabilities caused by property managers or operators; material adverse actions or omissions by any joint venture partners; consequences of the Company’s net operating losses; increases in operating costs and other expenses; uninsured losses or losses in excess of the Company’s insurance coverage; the impact of outstanding and/or potential litigation; risks associated with the Company’s tax structuring; failure to qualify for and maintain the Company’s qualification as a REIT for federal income tax purposes; and the Company’s inability to protect its intellectual property and the value of its brand. Given these uncertainties, the Company cautions you not to place undue reliance on forward-looking information.
For further information regarding risks and uncertainties associated with the Company’s business, and other important factors that could cause the Company’s actual results to vary materially from those expressed or implied in its forward-looking statements, please refer to the factors listed and described in the Company’s reports filed from time to time with the Securities and Exchange Commission, including, but not limited to, the Company’s quarterly reports on Form 10-Q and the Company’s annual report on Form 10-K, copies of which may be obtained from the Company’s website at www.cnlhealthcareproperties.com.
All written and oral forward-looking statements attributable to the Company or persons acting on its behalf are qualified in their entirety by this cautionary note. Forward-looking statements speak only as of the date on which they are made, and the Company undertakes no obligation to, and expressly disclaims any obligation to, publicly release the results of any revisions to its forward-looking statements to reflect new information, changed assumptions, the occurrence of unanticipated subsequent events or circumstances, or changes to future operating results over time, except as otherwise required by law.
31
Introduction
The following discussion is based on the condensed consolidated financial statements as of September 30, 2015 (unaudited) and December 31, 2014. Amounts as of December 31, 2014, included in the unaudited condensed consolidated balance sheets have been derived from the audited consolidated financial statements as of that date. This information should be read in conjunction with the accompanying unaudited condensed consolidated balance sheets and the notes thereto, as well as the audited consolidated financial statements, notes and management’s discussion and analysis included in our annual report on Form 10-K for the year ended December 31, 2014.
Overview
CNL Healthcare Properties, Inc. is a Maryland corporation incorporated on June 8, 2010 that elected to be taxed as a REIT beginning with the year ended December 31, 2012 for U.S. federal income tax purposes. The terms “us,” “we,” “our,” “Company” and “CNL Healthcare Properties” include CNL Healthcare Properties, Inc. and each of its subsidiaries.
We are externally managed and advised by CNL Healthcare Corp. Our Advisor is responsible for managing our day-to-day affairs and for identifying and making acquisitions and investments on our behalf. We have also retained CNL Healthcare Manager Corp. to manage our properties under a six year property management agreement, which is effective through June 8, 2017.
We had no operations prior to the commencement of our Initial Offering. The net proceeds from our Offerings are contributed to CHP Partners, LP, our operating partnership, in exchange for partnership interests. Substantially all of our assets are held by, and substantially all of our operations are conducted through, the operating partnership.
Our investment focus is on acquiring a diversified portfolio of healthcare real estate or real estate-related assets, primarily in the United States, within the seniors housing, medical office, post-acute care and acute care asset classes. The types of seniors housing that we may acquire include active adult communities (age-restricted and age-targeted housing), independent and assisted living facilities, continuing care retirement communities, and Alzheimer's / memory care facilities. The types of medical office facilities that we may acquire include medical office buildings, specialty medical and diagnostic service facilities, surgery centers, outpatient rehabilitation facilities, and other facilities designed for clinical services. The types of post-acute care facilities that we may acquire include skilled nursing facilities, long-term acute care hospitals and inpatient rehabilitative facilities. The types of acute care facilities that we may acquire include general acute care hospitals and specialty surgical hospitals. We view, manage and evaluate our portfolio homogeneously as one collection of healthcare assets with a common goal of maximizing revenues and property income regardless of the asset class or asset type.
We are committed to investing the remaining proceeds of our Offerings through strategic investment types aimed to maximize stockholder value by generating sustainable cash flow growth and increasing the value of our healthcare assets. We expect to primarily lease seniors housing properties to wholly owned TRS entities and engage independent third-party managers under management agreements to operate the properties as permitted under RIDEA structures; however, we may also lease our properties to third-party tenants under triple-net or similar lease structures, where the tenant bears all or substantially all of the costs (including cost increases, for real estate taxes, utilities, insurance and ordinary repairs). Medical office, post-acute care and acute care properties will be leased on a triple-net, net or modified gross basis to third-party tenants. In addition, we expect most investments will be wholly owned, although, we have and may continue to invest through partnerships with other entities where we believe it is appropriate and beneficial. We have and may continue to invest in new property developments or properties which have not reached full stabilization. Finally, we also may invest in and originate mortgage, bridge or mezzanine loans or in entities that make investments similar to the foregoing investment types. We generally make loans to the owners of properties to enable them to acquire land, buildings, or to develop property. In exchange, the owner generally grants us a first lien or collateralized interest in a participating mortgage collateralized by the property or by interests in the entity that owns the property.
32
Portfolio Overview
We believe recent demographic trends and compelling supply and demand indicators present a strong case for an investment focus on the acquisition of healthcare real estate or real estate-related assets. We believe that the healthcare sector will continue to provide attractive opportunities as compared to other asset sectors over the long-term. Our healthcare investment portfolio is geographically diversified with properties in 33 states. The map below shows our current property allocations across geographic regions as of November 11, 2015:
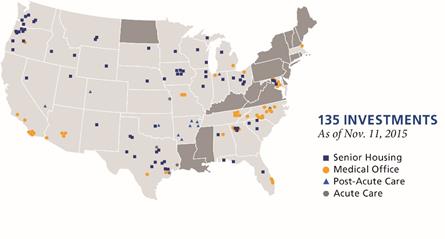
As of November 11, 2015, our healthcare investment portfolio consisted of interests in 135 properties, including 71 seniors housing communities, 49 medical offices, 10 post-acute care facilities and five acute care hospitals. Of our properties held at November 11, 2015, six of our 71 seniors housing communities currently have real estate under development and five were owned through an unconsolidated joint venture. One of our 10 post-acute care facilities currently have real estate under development. The following table summarizes our healthcare portfolio by asset class and investment structure as of November 11, 2015:
|
|
|
|
|
|
|
Amount of |
|
|
Percentage |
|
||
|
Type of Investment |
|
Number of Investments |
|
|
Investments (in millions) |
|
|
of Total Investments |
|
|||
|
Consolidated investments: |
|
|
|
|
|
|
|
|
|
|
|
|
|
Seniors housing leased (1) |
|
|
15 |
|
|
$ |
327.7 |
|
|
|
12.2 |
% |
|
Seniors housing managed (2) |
|
|
45 |
|
|
|
1,150.2 |
|
|
|
42.8 |
% |
|
Seniors housing developments (3) |
|
|
6 |
|
|
|
67.4 |
|
|
|
2.5 |
% |
|
Medical office leased (1) |
|
|
49 |
|
|
|
830.1 |
|
|
|
30.9 |
% |
|
Post-acute care leased (1) |
|
|
9 |
|
|
|
124.3 |
|
|
|
4.6 |
% |
|
Post-acute care development (3) |
|
|
1 |
|
|
|
2.1 |
|
|
|
0.1 |
% |
|
Acute care leased (1) |
|
|
5 |
|
|
|
153.9 |
|
|
|
5.7 |
% |
|
Unconsolidated investments: |
|
|
|
|
|
|
|
|
|
|
|
|
|
Seniors housing managed (4) |
|
|
5 |
|
|
|
31.1 |
|
|
|
1.2 |
% |
|
|
|
|
135 |
|
|
$ |
2,686.8 |
|
|
|
100.0 |
% |
FOOTNOTES:
|
(1) |
Properties that are leased to third-party tenants for which we report rental income from operating leases. |
|
(2) |
Seniors housing communities are leased to TRSs and managed pursuant to third-party management contracts (i.e. RIDEA structure) where we report resident fees and services, and the corresponding property operating expenses. |
|
(3) |
Investments herein represent funded and accrued development costs as of September 30, 2015. |
|
(4) |
Properties that are owned through an unconsolidated joint venture and are leased to TRSs and managed pursuant to third-party management contracts (i.e. RIDEA structure). The joint venture is accounted for using the equity method. |
33
Portfolio Evaluation
We monitor the performance of our tenants and third-party operators to stay abreast of any material changes in the operations of the underlying properties by (1) reviewing the current, historical and prospective operating margins (measured by a tenant’s earnings before interest, taxes, depreciation, amortization and facility rent), (2) monitoring trends in the source of our tenants’ revenue, including the relative mix of public payors (including Medicare, Medicaid, etc.) and private payors (including commercial insurance and private pay patients), (3) evaluating the effect of evolving healthcare legislation and other regulations on our tenants’ profitability and liquidity, and (4) reviewing the competition and demographics of the local and surrounding areas in which the tenants operate.
In addition to operating statistics of the underlying properties, when evaluating the performance of our healthcare portfolio within the seniors housing and post-acute care asset classes, management reviews occupancy levels and monthly revenue per occupied unit (“RevPOU”), which we define as total revenue divided by average number of occupied units or beds during a month and is considered a performance metric within these asset classes. Similarly, within the medical office and acute care asset classes, management reviews operating statistics of the underlying properties, including occupancy levels and monthly rent per square foot. Lastly, when evaluating the performance of our third-party operators or developers, management reviews monthly financial statements, property level operating performance versus budgeted expectations, conducts periodic operational review calls with operators and conducts periodic property inspections or site visits. All of the aforementioned metrics assist us in determining the ability of our properties or operators to achieve market rental rates, to assess the overall performance of our diversified healthcare portfolio, and to review compliance with leases, debt, licensure, real estate taxes, and other collateral.
Furthermore, in our evaluation of the properties that we have purchased and additional properties that we expect to purchase, we consider the operating stage of the investments within the following stages: development, value-add or stabilizing and stabilized. Development properties are those in which we or our joint venture have purchased land for the development of new operating properties. We typically hold rights as the owner or managing member of the development properties while a third-party or our joint venture partner manages the development, construction and certain day-to-day operations of the property subject to our oversight. Stabilizing properties are either developed properties that have been fully constructed and in lease-up phase (typically 18 months post-construction) or existing (“value-add”) properties in which we expect to make capital investments to upgrade or expand. A property is considered stabilized upon the earlier of (i) when the property reaches 85% occupancy for a trailing three month period, or (ii) a two year period from acquisition or completion of development. For those assets that are above an 85% occupancy level and subsequently drop below 85%, they are reclassified to stabilizing until they hit the trailing three month 85% occupancy metric.
We have increased the level of our investment in new ground up development and value-add or stabilizing properties. During the construction and lease up phase, these types of investments are expected to generate limited cash flows or losses from operations and may result in near term downward pressure on our net asset valuation. However, we believe that investing a portion of our capital into these types of properties is beneficial because they are expected to provide a higher yield on cost and higher net asset valuations in the long-term as compared to similar stabilized acquisitions. Additionally, these types of assets will result in our portfolio having a lower average age, which we believe will enhance our overall market value over the long-term.
Based on revenues as of September 30, 2015, the Company’s portfolio is comprised of 66.0% stabilized properties, of which 1.4% are completed developments that are still in the lease-up phase and 34.0% value-add or stabilizing properties, of which 2.1% are recently completed developments that are currently in the lease-up phase.
The following table lists our occupancy, RevPOU and rent per square feet by asset class within our healthcare portfolio as of September 30, 2015:
|
Operating Stage |
|
Occupancy % |
|
|
RevPOU |
|
|
Rent per Square Feet |
|
|||
|
Value-add or Stabilizing: |
|
|
|
|
|
|
|
|
|
|
|
|
|
Seniors Housing |
|
|
81.5 |
% |
|
$ |
3,545 |
|
|
$ |
— |
|
|
Medical Office |
|
|
79.8 |
% |
|
$ |
— |
|
|
$ |
2.90 |
|
|
Stabilized: |
|
|
|
|
|
|
|
|
|
|
|
|
|
Seniors Housing |
|
|
91.3 |
% |
|
$ |
4,388 |
|
|
$ |
— |
|
|
Medical Office |
|
|
95.6 |
% |
|
$ |
— |
|
|
$ |
2.55 |
|
|
Acute (1) |
|
|
100.0 |
% |
|
$ |
— |
|
|
$ |
3.07 |
|
|
Post-Acute (2) |
|
|
99.9 |
% |
|
$ |
6,565 |
|
|
$ |
2.73 |
|
FOOTNOTES:
|
(1) |
Rent per square feet related to one of the two specialty hospitals discussed in Note 5. “Intangibles, net” has been excluded. |
34
|
(2) |
Post-acute is comprised of skilled nursing facilities, which are evaluated based on RevPOU, and inpatient rehab hospitals, which are evaluated based on rent per square feet. |
Real Estate Under Development
As of November 11, 2015, we had interests in seven developments that will provide us with 815 additional units upon completion as follows:
|
Property Name (and Location) |
|
Developer |
|
Number of Units upon Completion |
|
Development Costs Incurred (in millions) (1) |
|
|
Remaining Development Budget (in millions) (2) |
|
|
Maximum Construction Loans Available (in millions) |
|
|
Estimated Completion Date |
|||
|
HarborChase of Shorewood (Shorewood, WI) |
|
Harbor Shorewood Development, LLC |
|
94 units |
|
$ |
22.0 |
|
|
$ |
5.8 |
|
|
$ |
8.9 |
|
|
4th quarter 2015 |
|
Raider Ranch (Lubbock, TX) |
|
South Bay Partners, Ltd |
|
72 units |
|
|
13.5 |
|
|
|
3.5 |
|
|
|
6.6 |
|
|
1st quarter 2016 |
|
Watercrest at Katy (Katy, TX) (3) |
|
South Bay Partners, Ltd |
|
210 units |
|
|
20.1 |
|
|
|
22.3 |
|
|
|
24.9 |
|
|
2nd quarter 2016 |
|
Welbrook Senior Living Grand Junction (Grand Junction, CO) |
|
Embree Asset Group, Inc. |
|
50 units |
|
|
2.1 |
|
|
|
11.5 |
|
|
― |
|
|
3rd quarter 2016 |
|
|
Fieldstone at Pear Orchard (Yakima, WA)(4) |
|
Cascadia Development, LLC |
|
75 units |
|
― |
|
|
|
15.3 |
|
|
|
10.9 |
|
|
4th quarter 2016 |
|
|
Waterstone at Greenville (Greenville, SC) |
|
The Balance Group, Inc. |
|
114 units |
|
|
5.3 |
|
|
|
22.4 |
|
|
|
18.9 |
|
|
1st quarter 2017 |
|
Wellmore of Lexington (Lexington, SC) |
|
Maxwell Group, Inc. |
|
200 units |
|
|
6.5 |
|
|
|
48.7 |
|
|
|
35.7 |
|
|
2nd quarter 2017 |
|
|
|
Total |
|
815 units |
|
$ |
69.5 |
|
|
$ |
129.5 |
|
|
$ |
105.9 |
|
|
|
FOOTNOTES:
|
(1) |
This amount represents land and total capitalized costs for GAAP purposes for the acquisition, development and construction of the seniors housing community or post–acute care facility as of September 30, 2015. Amounts include investment services fees, asset management fees, interest expense and other costs capitalized during the development period. |
|
(2) |
This amount includes preleasing and marketing costs which will be expensed as incurred. |
|
(3) |
This property is owned through a joint venture in which the Company’s initial ownership interest is 95%. |
|
(4) |
This property is owned through a joint venture in which the Company’s initial ownership interest is 75%. |
The development budgets of the developments include the cost of the land, construction costs, development fees, financing costs, start-up costs and initial operating deficits of the respective properties. An affiliate of the developer of the respective community coordinates and supervises the management and administration of the development and construction. Each developer is responsible for any cost overruns beyond the approved development budget for the applicable project.
Significant Tenants and Operators
Our real estate portfolio is operated by a mix of national or regional operators and the following represents the significant tenants and operators that lease or manage 5% or more of our rentable space as of September 30, 2015:
|
Tenants |
|
Number of Properties |
|
|
Rentable Square Feet (in thousands) |
|
|
Percentage of Rentable Square Feet |
|
|
Lease Expiration Year |
|
|||||
|
TSMM Management, LLC |
|
|
13 |
|
|
|
1,261 |
|
|
|
25.3 |
% |
|
|
2025 |
|
|
|
Parc Communities, LLC |
|
|
2 |
|
|
|
385 |
|
|
|
7.7 |
% |
|
|
2017 |
|
|
|
Novant Medical Group, Inc. |
|
|
5 |
|
|
|
276 |
|
|
|
5.5 |
% |
|
|
2025 |
|
|
|
Senior Living Centers |
|
|
6 |
|
|
|
261 |
|
|
|
5.2 |
% |
|
|
2023 |
|
|
|
Other tenants (1) |
|
|
52 |
|
|
|
2,797 |
|
|
|
56.3 |
% |
|
|
2015-2033 |
|
|
|
|
|
|
78 |
|
|
|
4,980 |
|
|
|
100.0 |
% |
|
|
|
|
|
35
|
Operators |
|
Number of Properties |
|
|
Rentable Square Feet (in thousands) |
|
|
Percentage of Rentable Square Feet |
|
|
Operator Expiration Year |
|
|||||
|
Integrated Senior Living, LLC |
|
|
5 |
|
|
|
1,319 |
|
|
|
27.5 |
% |
|
|
2019 |
|
|
|
Prestige Senior Living, LLC |
|
|
13 |
|
|
|
895 |
|
|
|
18.6 |
% |
|
|
2019 |
|
|
|
MorningStar Senior Management, LLC |
|
|
4 |
|
|
|
834 |
|
|
|
17.4 |
% |
|
|
2018 |
|
|
|
Harbor Retirement Associates, LLC |
|
|
3 |
|
|
|
246 |
|
|
|
5.1 |
% |
|
|
2018-2023 |
|
|
|
Other operators (1) |
|
|
19 |
|
|
|
1,507 |
|
|
|
31.4 |
% |
|
|
2017-2025 |
|
|
|
|
|
|
44 |
|
|
|
4,801 |
|
|
|
100.0 |
% |
|
|
|
|
|
FOOTNOTE:
|
(1) |
Comprised of various tenants or operators each of which comprise less than 5% of our rentable square footage. |
While we are not directly impacted by the performance of the underlying properties leased to third-party tenants, we believe that the financial and operational performance of our tenants provides an indication about the health of our tenants and their ability to pay rent. To the extent that our tenants, managers or joint venture partners experience operating difficulties and become unable to generate sufficient cash to make rent payments to us, there could be a material adverse impact on our consolidated results of operations, liquidity and/or financial condition. Our tenants and managers are contractually required to provide this information to us in accordance with their respective lease, management and joint venture agreements. Therefore, in order to mitigate the aforementioned risk, we monitor our investments through a variety of methods determined by the type of property.
We monitor the credit of our tenants to stay abreast of any material changes in quality. We monitor tenant credit quality by (1) reviewing financial statements that are publicly available or that are required to be delivered to us under the applicable lease, (2) direct interaction with onsite property managers, (3) monitoring news and rating agency reports regarding our tenants (or their parent companies) and their underlying businesses, (4) monitoring the timeliness of rent collections and (5) monitoring lease coverage.
In July 2015, an anchor tenant at two of our medical office buildings filed for chapter 11 bankruptcy and is in the process of marketing the sale of the health system and its affiliated operations to potential buyers. For the nine months ended September 30, 2015, the revenues attributable to this tenant represented approximately 1.0% of our total revenues and, as of September 30, 2015, the related lease intangibles represented approximately 0.2% of our total assets. As of September 30, 2015, the tenant was delinquent on approximately $0.3 million of rent for certain suites it occupies in the two buildings. We continue to monitor developments relating to the tenant’s planned reorganization and as of the date of this filing, the tenant had neither affirmed nor rejected our leases under its plan of reorganization.
Tenant Lease Expirations
During the nine months ended September 30, 2015, our rental revenues from operating leases represented approximately 34.0% of our total revenues. As of September 30, 2015, approximately 66.0% of our rental revenues from operating leases were scheduled to expire in 2020 or later. Based on this, we do not expect lease turnover or any increases in property operating expenses to have a significant impact on our cash flow from operations in the near term.
Our asset management team collaborates with existing tenants to understand their current and anticipated space needs in advance of their lease term renewal date. We work with and begin lease-related negotiations well in advance of the lease expirations or renewal period options in order for us to maintain a balanced lease rollover schedule and high occupancy levels, as well as to enhance the value of our properties through extended lease terms. Lease extensions are likely to create an obligation to pay lease commissions, lease incentives and/or tenant improvements and may also provide our tenants with some periods of reduced and/or “free rent.” Certain amendments or modifications to the terms of existing leases could require lender approval.
36
The following table lists, on an aggregate basis, scheduled expirations for the remainder of 2015, each of the next nine years and thereafter on our consolidated healthcare investment portfolio (excludes real estate under development), assuming that none of the tenants exercise any of their renewal options as of September 30, 2015 (in thousands, except for number of tenants and percentages):
|
Year of Expiration (1) |
|
Number of Tenants |
|
|
Expiring Rentable Square Feet |
|
|
Expiring Annualized Base Rents (2) |
|
|
Percentage of Expiring Annual Base Rents |
|
||||
|
2015 |
|
|
34 |
|
|
|
117 |
|
|
$ |
3,003 |
|
|
|
2.9 |
% |
|
2016 |
|
|
59 |
|
|
|
209 |
|
|
|
5,143 |
|
|
|
4.9 |
% |
|
2017 |
|
|
66 |
|
|
|
626 |
|
|
|
10,880 |
|
|
|
10.5 |
% |
|
2018 |
|
|
96 |
|
|
|
393 |
|
|
|
9,962 |
|
|
|
9.5 |
% |
|
2019 |
|
|
61 |
|
|
|
265 |
|
|
|
6,521 |
|
|
|
6.2 |
% |
|
2020 |
|
|
45 |
|
|
|
279 |
|
|
|
6,444 |
|
|
|
6.2 |
% |
|
2021 |
|
|
14 |
|
|
|
118 |
|
|
|
2,728 |
|
|
|
2.6 |
% |
|
2022 |
|
|
22 |
|
|
|
1,020 |
|
|
|
14,757 |
|
|
|
14.1 |
% |
|
2023 |
|
|
57 |
|
|
|
582 |
|
|
|
13,653 |
|
|
|
13.1 |
% |
|
2024 |
|
|
7 |
|
|
|
224 |
|
|
|
5,250 |
|
|
|
5.0 |
% |
|
Thereafter |
|
|
44 |
|
|
|
1,147 |
|
|
|
26,095 |
|
|
|
25.0 |
% |
|
Total |
|
|
505 |
|
|
|
4,980 |
|
|
$ |
104,436 |
|
|
|
100.0 |
% |
|
|
|
|
|
|
|
|
|
|
||||||||
|
Weighted Average Remaining Lease Term: (3) |
|
|
7.5 years |
|
|
|
|
|
||||||||
FOOTNOTES:
|
(1) |
Represents current lease expiration and does not take into consideration lease renewals available under existing leases at the option of the tenants. |
|
(2) |
Represents the current base rent, excluding tenant reimbursements and the impact of future rent escalations included in leases, multiplied by 12 and included in the year of expiration. |
|
(3) |
Weighted average remaining lease term is the average remaining term weighted by annualized current base rents. |
Liquidity and Capital Resources
General
Our primary source of capital, through the close of our Follow-on Offering on September 30, 2015, was proceeds we received from our Offerings. Our principal demands for funds will be for:
|
|
· |
the acquisition of real estate and real estate-related assets, |
|
|
· |
the payment of offering costs (through the close of our Offerings) and operating expenses, |
|
|
· |
the payment of debt service on our outstanding indebtedness, and |
|
|
· |
the payment of distributions. |
Generally, we expect to meet short-term capital needs from our cash flows from operations and proceeds from our Reinvestment Plan. In addition, we expect to meet long-term capital needs from net proceeds remaining from our Offerings and additional borrowings. However, until such time as we are fully invested, we may continue to use the remaining proceeds from our Offerings and borrowings to pay a portion of our operating expenses, distributions and debt service.
We intend to strategically leverage our real properties and possibly other assets and use debt as a means of providing additional funds for the acquisition of properties and the diversification of our portfolio. Our ability to increase our diversification through borrowing could be adversely affected by credit market conditions which result in lenders reducing or limiting funds available for loans, including loans collateralized by real estate. We may also be negatively impacted by rising interest rates on any unhedged variable rate debt or the timing of when we seek to refinance existing debt. During times when interest rates on mortgage loans are high or financing is otherwise unavailable on a timely basis, we may purchase certain properties for cash with the intention of obtaining a mortgage loan for a portion of the purchase price at a later time. In addition, we will continue to evaluate the need for additional interest rate swaps on unhedged variable rate debt.
37
Potential future sources of capital include proceeds from collateralized or uncollateralized financings from banks or other lenders, proceeds from the sale of properties, other assets and undistributed operating cash flows. If necessary, we may use financings or other sources of capital in the event of unforeseen significant capital expenditures.
Sources of Liquidity and Capital Resources
Common Stock Offerings
For the nine months ended September 30, 2015 and 2014, we received proceeds from our Offerings of approximately $530.1 million (50.2 million shares) and $334.0 million (33.0 million shares), respectively. We closed our Follow-On Offering on September 30, 2015 and discontinued our stock distributions concurrently.
During the period from October 1, 2015 through October 30, 2015, the Company received additional subscription proceeds of approximately $21.9 million (2.1 million shares). While the Follow-On Offering closed on September 30, 2015, we accepted subscriptions proceeds for agreements that were received in good order on or before September 30, 2015 and for which subscription proceeds were received by our transfer agent through October 30, 2015.
As of September 30, 2015, we had unused proceeds from our Follow-on Offering of approximately $51.2 million as cash on hand and we had fully invested the proceeds from our Initial Offering. We plan to use the available uncommitted cash on hand as of September 30, 2015, as well as additional borrowings and offering proceeds obtained subsequently, to acquire additional healthcare real estate and real estate-related assets.
Borrowings
We have borrowed and intend to continue borrowing money to acquire properties, make loans and other permitted investments, fund ongoing enhancements to our portfolio, and to cover periodic shortfalls between distributions paid and cash flows from operating activities. During the nine months ended September 30, 2015 and 2014, we borrowed approximately $299.9 million and $357.7 million, respectively. These amounts were primarily used to fund real estate under development and acquire additional properties, respectively.
In May 2015, we executed an amendment to our credit agreement with KeyBank, as administrative agent, related to the Credit Facilities, which adjusts certain criteria and terms for the unencumbered collateral pool of assets supporting our Revolving Credit Facility. The amendment allowed us to include the Perennial Communities and Medical Portfolio I Properties in the unencumbered collateral pool, which increased our availability under the Revolving Credit Facility in future periods. Refer to “Uses of Liquidity and Capital Resources – Debt Repayments” for additional information related to the repayment of the secured mortgage loans on these properties.
As of September 30, 2015, we had availability under the Revolving Credit Facility of approximately $15.0 million, based on the value of the properties in the unencumbered collateral pool of assets supporting the loan. In addition, we had an aggregate debt leverage ratio of approximately 48.3%, based on the aggregate carrying value of our assets. We may borrow money to pay distributions to stockholders, for working capital and for other corporate purposes. See “Uses of Liquidity and Capital Resources – Distributions” below for additional information related to the payment of distributions with other sources for GAAP purposes. In many cases, we have pledged our assets in connection with our borrowings and intend to encumber assets in connection with additional borrowings. The aggregate amount of long-term financing is not expected to exceed 60% of our total assets on an annual basis.
While our Revolving Credit Facility provides us flexibility with regards to managing our capital resources in the short-term, we may refinance all or a portion of the balance outstanding on our Revolving Credit Facility with a term loan, which may result in a lower interest rate on the amount thereof. In addition, the refinancing of amounts outstanding under our Revolving Credit Facility would allow us to finance the acquisition of additional properties with further borrowings on the Revolving Credit Facility. We currently intend to maintain amounts outstanding under our long-term debt arrangements, so that we will have adequate funds available for working capital and potential future investment whether in capital improvements to our existing properties or in acquisitions of additional properties.
As a result of the tenant default discussed in Note 5. “Intangibles, net,” the lender on the mortgage loan secured by the two specialty hospitals elected to accelerate the required debt service payments related to these properties from a 25-year to a 15-year amortization period given that the tenant did not meet the required lease coverage thresholds. In September 2015, we signed an amended and restated lease agreement with a new tenant at one of the specialty hospitals and the lender re-adjusted the required debt service payments for the property back to a 25-year amortization period effective November 2015.
38
Distributions from Unconsolidated Entities
As of September 30, 2015, we had an investment in five unconsolidated properties through a joint venture. Pursuant to the joint venture agreement, we are entitled to receive quarterly preferred cash distributions to the extent there is cash available to distribute. These distributions are generally received within 45 days after each quarter end. During the nine months ended September 30, 2015, we received approximately $0.7 million of operating distributions from our investment in these unconsolidated entities.
For the nine months ended September 30, 2014, we received approximately $1.5 million of operating distributions from our two investments in unconsolidated entities. In August 2014, we acquired our co-venture partner’s 10% interest in the Montecito Joint Venture for approximately $1.6 million. As a result, we own 100% of the Montecito Joint Venture and began consolidating all of the assets, liabilities and results of operations in our consolidated financial statements upon acquisition.
Net Cash Provided by Operating Activities
We generally expect to meet future cash needs for general and administrative expenses, debt service and distributions from the net operating income from our properties (“Property-level NOI”). We define Property-level NOI, a non-GAAP measure, as rental income from operating leases, resident fees and services, tenant reimbursement income and interest income less the property operating expenses and property management fees from managed properties. We experienced positive cash flow from operating activities for the nine months ended September 30, 2015 and 2014 of approximately $32.4 million and $18.7 million, respectively.
The increase in cash flows from operating activities for the nine months ended September 30, 2015 as compared to the same period in 2014 was primarily the result of the following:
|
|
· |
an increase in total revenues and Property-level NOI for the nine months ended September 30, 2015, as compared to the nine months ended September 30, 2014, primarily as the result of having 122 consolidated operating properties in 2015 as compared with 78 consolidated operating properties in 2014; and |
|
|
· |
offset by the payment of approximately $11.6 million in lease incentives (discussed below); |
|
|
· |
an increase in interest expense paid resulting from additional borrowings on properties acquired subsequent to September 30, 2014 and properties acquired during the nine months ended September 30, 2014 being owned for the entire period; |
|
|
· |
an increase in asset management fees resulting from the continued growth and increased total assets under management net of amounts related to asset management fees that were foregone by our Advisor under the Advisor Expense Support Agreement (discussed below), which is primarily reflective of our growth in Property-level NOI outpacing the growth in our distributions, interest expense and other expenses; and |
|
|
· |
an increase in general and administrative expenses paid resulting from our continued portfolio growth. |
As we continue to acquire additional properties we expect that cash flows provided by operating activities will continue to grow.
Expense Support Agreements
As discussed above, during the nine months ended September 30, 2015, our cash from operating activities was positively impacted by the Expense Support Agreements, which we entered into with our Advisor and Property Manager commencing on April 1, 2013 and July 1, 2013, respectively, and which automatically renew for successive one-year periods thereafter, subject to the right of the Advisor or Property Manager to terminate their respective agreements upon 30 days’ written notice. Pursuant to the Expense Support Agreements, our Advisor and Property Manager have agreed to forgo the payment of fees in cash and accept restricted forfeitable stock for services in an amount equal to the positive excess, if any, of (a) aggregate stockholder cash distributions declared for the applicable quarter, over (b) our aggregate modified funds from operations (as defined in the Expense Support Agreements). The Advisor expense support amount is determined for each calendar quarter, on a non-cumulative basis, on each quarter-end date. The Property Manager expense support amount is determined for each calendar quarter, on a non-cumulative basis, after the calculation of the Advisor expense support amount pursuant to the Property Manager Expense Support Agreement on each quarter-end date. For the quarter and nine months ended September 30, 2015, our Advisor had settled approximately $0.9 million and $2.3 million, respectively, in asset management fees in accordance with the terms of the Advisor Expense Support Agreement. For the quarter and nine months ended September 30, 2014, our Advisor had settled approximately $0.9 million and $3.8 million, respectively, in asset management fees in accordance with the terms of the Advisor Expense Support Agreement. There were no amounts settled under the Property Manager expense support agreement through September 30, 2015.
39
In exchange for services rendered and in consideration of the expense support provided, the Company will issue, within 45 days following each Determination Date, a number of shares of restricted stock equal to the quotient of the expense support amount provided by to the Advisor and Property Manager for the preceding quarter divided by the then-current public offering price per share of common stock, on the terms and conditions and subject to the restrictions set forth in the Expense Support Agreements. Any amounts deferred, and for which restricted stock shares are issued, pursuant to the Expense Support Agreements will be permanently waived and the Company will have no obligation to pay such amounts to the Advisor or the Property Manager. The Restricted Stock is subordinated and forfeited to the extent that shareholders do not receive their original invested capital back with at least a 6% annualized return on investment upon ultimate liquidity of the company.
Refer to Note 11. “Related Party Arrangements” for additional information.
Uses of Liquidity and Capital Resources
Acquisitions
During the nine months ended September 30, 2015 and 2014, we acquired 30 and 22 consolidated operating properties for an aggregate purchase price paid of approximately $647.5 million and $524.7 million, respectively, net of liabilities assumed. The acquired operating properties were spread across our targeted asset classes and located in 17 and eight different states, respectively, which allowed us to expand both the variety of our asset classes and the geographical diversification of our healthcare investment portfolio. In addition, the operating properties acquired during the nine months ended September 30, 2015 and 2014 increased our total units by 1,314 and 1,303, respectively. Furthermore, during the nine months ended September 30, 2015 and 2014, our total leasable square footage increased by approximately 1.5 million and 0.7 million, respectively. We expect to continue to expand our healthcare investment portfolio in the near term through additional acquisitions.
Development Properties
In connection with our various seniors housing developments, we funded approximately $54.4 million and $32.9 million in development costs during the nine months ended September 30, 2015 and 2014, respectively. Pursuant to the development agreements for the other active properties under development as of September 30, 2015, we expect to fund approximately $114.2 million of additional development and other costs. Furthermore, we expect to fund an additional $15.3 million related to an additional seniors housing development acquired in October 2015. We expect to fund the remaining development and other costs primarily from construction loans on each development or with the remaining proceeds from our Offerings. Our Advisor continues to evaluate additional development opportunities.
Debt Repayments
During the nine months ended September 30, 2015, we paid approximately $111.7 million of total repayments which is comprised of $31.4 million in repayments on our Revolving Credit Facility, $64.5 million in repayments on our mortgage loans for the Perennial Communities and Medical Portfolio I Properties prior to their scheduled maturities, $2.6 million of prepayments on our mortgage loan for the Capital Health Communities related to monies received under the Yield Guaranty and $13.2 million of scheduled repayments. During the nine months ended September 30, 2014, we had total repayments of $54.1 million.
Stock Issuance and Offering Costs
Under the terms of the Offerings, certain affiliates and third-party broker dealers are entitled to receive selling commissions of up to 7% of gross offering proceeds on all shares sold, a marketing support fee of up to 3% of gross offering proceeds, and reimbursement of actual expenses incurred in connection with the Offerings. In accordance with our articles of incorporation and the advisory agreement, the total amount of selling commissions, marketing support fees, due diligence expense reimbursements, and organizational and other offering costs to be paid by us may not exceed 15% of the gross aggregate proceeds of our Offerings.
During the nine months ended September 30, 2015 and 2014, we paid approximately $55.6 million and $36.6 million, respectively, of stock issuance and offering costs.
Lease Incentives
During the nine months ended September 30, 2015, we paid approximately $1.9 million of lease incentives in connection with the build-out of space for certain tenants at our medical office buildings. There were no lease incentives paid during the quarter and nine months ended September 30, 2014. Lease incentives are capitalized as deferred rent and amortized over the respective lease terms.
40
In April 2015, we paid approximately $1.7 million of lease incentives in connection with the build-out of approximately 25,000 square feet of space for a new tenant at Physicians Plaza B at North Knoxville Medical Center. The related lease commenced in April 2015 upon completion of the build-out and includes an initial 10-year lease term that also provides the tenant with two 5-year renewal options.
In addition, in April 2015, we executed a lease modification with the tenant at Memorial Hermann Orthopedic & Spine Hospital (“MHOSH”), which included an extension of the lease term from 2023 to 2038 and provides the tenant with three 10-year renewal options. In connection therewith, the tenant agreed to extend the lease term of its current space in the MHOSH MOB from 2023 to 2038 and lease approximately 7,000 square feet of additional space by the end 2015 that would be co-terminus with lease terms through 2038. We paid the tenant approximately $3.0 million of aggregate lease incentives in connection with the lease modifications and leasing of additional space.
In August 2015, we executed a lease modification with the tenant at Batesville Healthcare Center, Searcy Healthcare Center and Mine Creek Healthcare Center that included the termination of the tenant’s options to purchase the leased properties. We paid approximately $5.0 million of lease incentives in connection with the modification, of which $3.0 million was treated as an adjustment to the lease basis and will increase rental income from these operating leases in future periods.
While we expect the impact of these lease incentives to adversely impact our cash flows from operations in the near term, we anticipate that the new leasing activity will contribute to same-store NOI growth in future periods and that the extension of existing lease terms could increase the value of our properties.
Distributions
In order to qualify as a REIT, we are required to make distributions, other than capital gain distributions, to our stockholders each year in the amount of at least 90% of our taxable income. We may make distributions in the form of cash or other property, including distributions of our own securities. Until we have sufficient cash flow from operating activities or funds from operations, we have decided and may continue to make stock distributions or to fund all or a portion of the payment of distributions from other sources; such as from cash flows generated by financing activities, a component of which includes our borrowings and the remaining proceeds of our Offerings.
In November 2014, in connection with the determination of our estimated NAV per share, we announced that our board of directors increased the amount of monthly cash distributions to $0.0353 per share (from $0.0338 per share) together with monthly stock distributions of 0.0025 shares of common stock payable to all common stockholders of record as of the close of business on the first business day of each month beginning December 1, 2014. This change allowed us to maintain our historical annual distribution rate of 4.0% in cash (based on our current $10.58 offering price) and 3% in stock (based on three shares for each 100 outstanding shares of our common stock). The new distribution rates were payable to all common stockholders of record as of the close of business of the first day of each month beginning December 1, 2014. We closed our Follow-On Offering on September 30, 2015 and discontinued our stock distribution concurrently.
41
The following table represents total cash distributions declared, distributions reinvested and cash distributions per share for quarter and nine months ended September 30, 2015 and 2014 (in thousands, except per share data):
|
|
|
|
|
|
|
Distributions Paid (1) |
|
|
|
|
|
|
|
|
|
|
|
|
|
|
|
|
|
|||||||||
|
Periods |
|
Cash Distributions per Share |
|
|
Total Cash Distributions Declared |
|
|
Reinvested via Reinvestment Plan |
|
|
Cash Distributions net of Reinvestment Proceeds |
|
|
Stock Distributions Declared (Shares) |
|
|
Stock Distributions Declared (at then-current offering price) |
|
|
Total Cash and Stock Distributions Declared (2) |
|
|
Cash Flows Provided by Operating Activities (3) |
|
||||||||
|
2015 Quarters |
|
|
|
|
|
|
|
|
|
|
|
|
|
|
|
|
|
|
|
|
|
|
|
|
|
|
|
|
|
|
|
|
|
First |
|
$ |
0.1059 |
|
|
$ |
13,248 |
|
|
$ |
7,648 |
|
|
$ |
5,600 |
|
|
|
943 |
|
|
$ |
9,977 |
|
|
$ |
23,225 |
|
|
$ |
11,317 |
|
|
Second |
|
|
0.1059 |
|
|
|
14,895 |
|
|
|
8,619 |
|
|
|
6,276 |
|
|
|
1,060 |
|
|
|
11,215 |
|
|
|
26,110 |
|
|
|
10,757 |
|
|
Third |
|
|
0.1059 |
|
|
|
16,748 |
|
|
|
9,808 |
|
|
|
6,940 |
|
|
|
1,193 |
|
|
|
12,620 |
|
|
|
29,368 |
|
|
|
10,319 |
|
|
Total |
|
$ |
0.3177 |
|
|
$ |
44,891 |
|
|
$ |
26,075 |
|
|
$ |
18,816 |
|
|
|
3,196 |
|
|
$ |
33,812 |
|
|
$ |
78,703 |
|
|
$ |
32,393 |
|
|
|
|
|
|
|
|
|
|
|
|
|
|
|
|
|
|
|
|
|
|
|
|
|
|
|
|
|
|
|
|
|
|
|
|
2014 Quarters |
|
|
|
|
|
|
|
|
|
|
|
|
|
|
|
|
|
|
|
|
|
|
|
|
|
|
|
|
|
|
|
|
|
First |
|
$ |
0.1014 |
|
|
$ |
6,147 |
|
|
$ |
3,349 |
|
|
$ |
2,798 |
|
|
|
455 |
|
|
$ |
4,614 |
|
|
$ |
10,761 |
|
|
$ |
6,277 |
|
|
Second |
|
|
0.1014 |
|
|
|
7,145 |
|
|
|
3,916 |
|
|
|
3,229 |
|
|
|
529 |
|
|
|
5,364 |
|
|
|
12,509 |
|
|
|
5,035 |
|
|
Third |
|
|
0.1014 |
|
|
|
8,385 |
|
|
|
4,630 |
|
|
|
3,755 |
|
|
|
621 |
|
|
|
6,295 |
|
|
|
14,680 |
|
|
|
7,361 |
|
|
Total |
|
$ |
0.3042 |
|
|
$ |
21,677 |
|
|
$ |
11,895 |
|
|
$ |
9,782 |
|
|
|
1,605 |
|
|
$ |
16,273 |
|
|
$ |
37,950 |
|
|
$ |
18,673 |
|
____________________________
FOOTNOTES:
|
(1) |
Represents the amount of cash used to fund distributions and the amount of distributions paid which were reinvested in additional shares through our Reinvestment Plan. |
|
(2) |
For the nine months ended September 30, 2015 and 2014, our net loss was approximately $50.6 million and $37.0 million, respectively, while cash distributions declared were approximately $44.9 million and $21.7 million, respectively, and total distributions declared were approximately $78.7 million, and $38.0 million, respectively. For the nine months ended September 30, 2015 and 2014, approximately 72% and 86%, respectively, of cash distributions declared to stockholders were considered to be funded with cash provided by operating activities as calculated on a quarterly basis for GAAP purposes and approximately 28% and 14%, respectively, were considered to be funded with other sources (i.e., Offering proceeds). For the nine months ended September 30, 2015 and 2014, approximately 41% and 49%, respectively, of total distributions declared to stockholders were considered to be funded with cash provided by operating activities as calculated on a quarterly basis for GAAP purposes and approximately 59% and 51%, respectively, of total distributions declared to stockholders were considered to be funded with other sources (i.e., Offering proceeds). |
|
(3) |
Cash flows from operating activities calculated in accordance with GAAP are not necessarily indicative of the amount of cash available to pay distributions. For example, GAAP requires that the payment of acquisition fees and costs related to business combinations be classified as a use of cash in operating activities in the statement of cash flows, which directly reduces the measure of cash flows from operations. However, acquisition fees and costs are paid for with proceeds from our Offerings as opposed to operating cash flows. For the nine months ended September 30, 2015 and 2014, we expensed approximately $15.9 million and $15.7 million, respectively, in acquisition fees and expenses, which were paid from the proceeds of our Offerings. Additionally, the board of directors also uses other measures such as FFO and MFFO in order to evaluate the level of distributions. |
42
The tax composition of our distributions declared for the nine months ended September 30, 2015 and 2014 were as follows:
|
|
|
Nine Months Ended September 30, |
|
|||||
|
Distribution Type |
|
2015 |
|
|
2014 |
|
||
|
Taxable as ordinary income |
|
|
30.1 |
% |
|
|
21.5 |
% |
|
Return of capital |
|
|
69.9 |
% |
|
|
78.5 |
% |
No amounts distributed to stockholders for the nine months ended September 30, 2015 and 2014 were required to be or have been treated as return of capital for purposes of calculating the stockholders’ return on their invested capital as described in our advisory agreement.
The following tables present a summary of requests received and shares redeemed pursuant to our redemption plan during the nine months ended September 30, 2015 and 2014:
|
2015 Quarters |
|
First |
|
|
Second |
|
|
Third |
|
|
Total |
|
||||
|
Redemptions requested |
|
|
204,184 |
|
|
|
195,873 |
|
|
|
292,429 |
|
|
|
692,486 |
|
|
Shares redeemed |
|
|
(204,184 |
) |
|
|
(195,873 |
) |
|
|
(292,429 |
) |
|
|
(692,486 |
) |
|
Pending redemption requests |
|
― |
|
|
― |
|
|
― |
|
|
― |
|
||||
|
Average price paid per share |
|
$ |
9.51 |
|
|
$ |
9.51 |
|
|
$ |
9.51 |
|
|
$ |
9.51 |
|
|
2014 Quarters |
|
First |
|
|
Second |
|
|
Third |
|
|
Total |
|
||||
|
Redemptions requested |
|
|
28,343 |
|
|
|
75,313 |
|
|
|
129,022 |
|
|
|
232,678 |
|
|
Shares redeemed |
|
|
(28,343 |
) |
|
|
(75,313 |
) |
|
|
(129,022 |
) |
|
|
(232,678 |
) |
|
Pending redemption requests |
|
― |
|
|
― |
|
|
― |
|
|
― |
|
||||
|
Average price paid per share |
|
$ |
9.13 |
|
|
$ |
9.13 |
|
|
$ |
9.13 |
|
|
$ |
9.13 |
|
Common Stock Redemptions
We have adopted a redemption plan that allows our stockholders who hold shares for at least one year to request that we redeem between 25% and 100% of their shares. If we have sufficient funds available to do so and if we choose, in our sole discretion, to redeem shares, the number of shares we may redeem in any calendar year and the price at which they are redeemed are subject to conditions and limitations, including:
|
|
· |
If we elect to redeem shares, some or all of the proceeds from the sale of shares under our distribution reinvestment plan attributable to any quarter may be used to redeem shares presented for redemption during such quarter. In addition, we may use the unused amount of any offering proceeds available for use in future quarters to the extent not used to invest in assets or for other purposes; |
|
|
· |
No more than 5% of the weighted average number of shares of our common stock outstanding during such 12-month period may be redeemed during such 12-month period; and |
|
|
· |
Redemption pricing shall not exceed an amount equal to the lesser of (i) the then-current public offering price for our shares of common stock (other than the price at which the shares are sold under our Reinvestment Plan); and (ii) the purchase price paid by the stockholder. |
Our board of directors has the ability, in its sole discretion, to amend or suspend the redemption plan or to waive any specific conditions if it is deemed to be in our best interest.
During the nine months ended September 30, 2015, we received redemption requests for 0.7 million shares at a redemption price of $9.51 per share of which approximately $4.7 million was paid and approximately $2.8 million was payable as of September 30, 2015. During the nine months ended September 30, 2014, we received redemption requests for 0.2 million shares at a redemption price of $9.13 per share of which approximately $1.1 million was paid and approximately $1.2 million was payable as of September 30, 2014.
43
Results of Operations
The following discussion and analysis should be read in conjunction with the consolidated financial statements and the notes thereto of our Annual Report on Form 10-K for the year ended December 31, 2014.
As of September 30, 2015, we owned 122 consolidated operating properties and our portfolio consisted of 4,781 units operated under management agreements with third-party operators under RIDEA structures and approximately 4.9 million leasable square feet that was 95.9% leased to third-party tenants.
In understanding our operating results in the accompanying condensed consolidated financial statements, it is important to understand how the growth in our assets has impacted our results. We use Property-level NOI, a non-GAAP measure, as a key performance metric for internal monitoring and planning purposes, including the preparation of annual operating budgets and monthly operating reviews, as well as to facilitate analysis of future investment and business decisions. It does not represent cash generated from operating activities in accordance with GAAP and should not be considered to be an alternative to net income or loss (determined in accordance with GAAP) as an indication of our operating performance or to be an alternative to cash flows from operating activities (determined in accordance with GAAP) as a measure of our liquidity. We believe the presentation of this non-GAAP measure is important to the understanding of our operating results for the periods presented because it is an indicator of the return on property investment and provides a method of comparing property performance over time. In addition, we have aggregated Property-level NOI on a “same-store” basis only for comparable properties that we have owned during the entirety of all periods presented. Non-same-store NOI represents aggregated Property-level NOI from acquisitions made after July 1, 2014 or January 1, 2014, which are excluded as we did not own those properties during the entirety of all periods presented. The chart below illustrates our net losses, Property-level NOI and same-store NOI for the quarter and nine months ended September 30, 2015 and 2014 (in thousands), and the amount invested in properties as of September 30, 2015 and 2014 (in thousands):
|
|
|
Quarter Ended |
|
|
|
|
|
|
|
|
|
|
Nine Months Ended |
|
|
|
|
|
|
|
|
|
||||||||||
|
|
|
September 30, |
|
|
Change |
|
|
September 30, |
|
|
Change |
|
||||||||||||||||||||
|
|
|
2015 |
|
|
2014 |
|
|
$ |
|
|
% |
|
|
2015 |
|
|
2014 |
|
|
$ |
|
|
% |
|
||||||||
|
Net loss |
|
$ |
(19,231 |
) |
|
$ |
(12,204 |
) |
|
|
|
|
|
|
|
|
|
$ |
(50,650 |
) |
|
$ |
(37,030 |
) |
|
|
|
|
|
|
|
|
|
Adjusted to exclude: |
|
|
|
|
|
|
|
|
|
|
|
|
|
|
|
|
|
|
|
|
|
|
|
|
|
|
|
|
|
|
|
|
|
General and administrative expenses |
|
|
2,239 |
|
|
|
1,997 |
|
|
|
|
|
|
|
|
|
|
|
6,823 |
|
|
|
5,689 |
|
|
|
|
|
|
|
|
|
|
Acquisition fees and expenses |
|
|
9,073 |
|
|
|
3,729 |
|
|
|
|
|
|
|
|
|
|
|
15,939 |
|
|
|
15,726 |
|
|
|
|
|
|
|
|
|
|
Asset management fees |
|
|
5,085 |
|
|
|
2,753 |
|
|
|
|
|
|
|
|
|
|
|
13,426 |
|
|
|
5,572 |
|
|
|
|
|
|
|
|
|
|
Contingent purchase price consideration adjustment |
|
|
(268 |
) |
|
|
1,800 |
|
|
|
|
|
|
|
|
|
|
|
(589 |
) |
|
|
479 |
|
|
|
|
|
|
|
|
|
|
Impairment provision |
|
― |
|
|
― |
|
|
|
|
|
|
|
|
|
|
|
4,661 |
|
|
― |
|
|
|
|
|
|
|
|
|
|||
|
Loss on lease terminations |
|
― |
|
|
― |
|
|
|
|
|
|
|
|
|
|
|
863 |
|
|
― |
|
|
|
|
|
|
|
|
|
|||
|
Depreciation and amortization |
|
|
27,854 |
|
|
|
17,550 |
|
|
|
|
|
|
|
|
|
|
|
75,147 |
|
|
|
44,111 |
|
|
|
|
|
|
|
|
|
|
Other expenses, net of other income |
|
|
11,113 |
|
|
|
5,924 |
|
|
|
|
|
|
|
|
|
|
|
30,887 |
|
|
|
20,022 |
|
|
|
|
|
|
|
|
|
|
Income tax expense |
|
|
193 |
|
|
|
37 |
|
|
|
|
|
|
|
|
|
|
|
279 |
|
|
|
9 |
|
|
|
|
|
|
|
|
|
|
Property-level NOI |
|
|
36,058 |
|
|
|
21,586 |
|
|
|
|
|
|
|
|
|
|
|
96,786 |
|
|
|
54,578 |
|
|
|
|
|
|
|
|
|
|
Less: Non-same-store NOI |
|
|
(14,552 |
) |
|
|
(1,540 |
) |
|
|
|
|
|
|
|
|
|
|
(51,703 |
) |
|
|
(13,049 |
) |
|
|
|
|
|
|
|
|
|
Same-store NOI |
|
$ |
21,506 |
|
|
$ |
20,046 |
|
|
$ |
1,460 |
|
|
|
7.3 |
% |
|
$ |
45,083 |
|
|
$ |
41,529 |
|
|
$ |
3,554 |
|
|
|
8.6 |
% |
|
Invested in operating properties, end of period (in millions) |
|
$ |
2,521 |
|
|
$ |
1,455 |
|
|
|
|
|
|
|
|
|
|
$ |
2,521 |
|
|
$ |
1,455 |
|
|
|
|
|
|
|
|
|
We anticipate using our cash on hand as of September 30, 2015, additional borrowings as well as remaining net proceeds received through our Offerings to invest in additional properties. As such, we anticipate additional operating income will be generated in subsequent periods.
We are not aware of any material trends or uncertainties, favorable or unfavorable, that may be reasonably anticipated to have a material impact on either capital resources or the revenues or income to be derived from the acquisition and operation of properties, loans and other permitted investments, other than those referred to in the risk factors identified in “Part II, Item 1A” of this report and the “Risk Factors” section of our Annual Report on Form 10-K for the year ended December 31, 2014.
44
Quarter and nine months ended September 30, 2015 as compared to the quarter and nine months ended September 30, 2014
Rental Income from Operating Leases. Rental income from operating leases was approximately $28.4 million and $72.3 million for the quarter and nine months ended September 30, 2015, respectively, as compared to $13.4 million and $33.5 million for the quarter and nine months ended September 30, 2014, respectively. The increase in rental income from operating leases resulted from our acquisition of 29 medical office buildings, one acute care hospital and five leased seniors housing communities subsequent to September 30, 2014 as well as three medical office buildings, three post-acute care facilities and three acute care hospitals acquired during the nine months ended September 30, 2014 being owned for the entire period. We expect this revenue stream to increase as these investments are held in future periods and we acquire additional properties with operating leases.
Resident Fees and Services. Resident fees and services income was approximately $47.5 million and $129.3 million for the quarter and nine months ended September 30, 2015, respectively, as compared to $34.2 million and $86.6 million for the quarter and nine months ended September 30, 2014, respectively. The increase in resident fees and services is a result of the eight managed seniors housing communities acquired subsequent to September 30, 2014, 13 managed seniors housing communities acquired during the nine months ended September 30, 2014 being owned for the entire period. In addition, Wellmore of Tega Cay, Dogwood Forest of Acworth and HarborChase of Villages Crossing were placed into service in June 2015, June 2014 and December 2013, respectively, which further contributed to the increase as operations began or continued to ramp-up across periods. We expect this revenue stream to increase as these investments are held in future periods, our value-add and completed development properties stabilize and we acquire additional managed seniors housing communities.
Tenant Reimbursement Income. Tenant reimbursement income was approximately $4.0 million and $10.8 million for the quarter and nine months ended September 30, 2015, respectively, as compared to $2.0 million and $4.8 million for the quarter and nine months ended September 30, 2014, respectively. This amount is comprised of common area maintenance (“CAM”) revenue and the increase resulted from our acquisition of 29 medical office buildings, and one acute care hospitals subsequent to September 30, 2014 as well as three medical office buildings, three post-acute care facilities and three acute care hospitals acquired during the nine months ended September 30, 2014 being owned for the entire period. We expect this revenue stream to increase as these investments are held in future periods and we acquire additional properties with modified operating leases.
Interest Income on Note Receivable from Related Party. Interest income on note receivable from related party was approximately $0.2 million and $0.5 million for the quarter and nine months ended September 30, 2014. This amount is comprised of interest income on the outstanding ADC loan made to Crosland Southeast for the HCA Rutland development beginning in June 2013. Interest income from this loan ceased once the ADC loan was repaid in August 2014.
Property Operating Expenses. Property operating expenses were approximately $39.9 million and $105.1 million for the quarter and nine months ended September 30, 2015, respectively, as compared to $25.7 million and $64.7 million for the quarter and nine months ended September 30, 2014, respectively. This increase is a result of our acquisition of eight managed seniors housing communities, 29 medical office buildings, and one acute care hospital subsequent to September 30, 2014 as well as 13 managed seniors housing communities, three medical office buildings, three post-acute care facilities and three acute care hospitals acquired during the nine months ended September 30, 2014 being owned for the entire period. In addition, Wellmore of Tega Cay, Dogwood Forest of Acworth and HarborChase of Villages Crossing were placed into service in June 2015, June 2014 and December 2013, respectively, which further contributed to the increase as operations began or continued to ramp-up across periods. We expect property operating expenses to increase as these investments are held in future periods, our value-add and completed development properties stabilize and we acquire additional properties.
General and Administrative. General and administrative expenses were approximately $2.2 million and $6.8 million for the quarter and nine months ended September 30, 2015, respectively, as compared to $2.0 million and $5.7 million for the quarter and nine months ended September 30, 2014, respectively. General and administrative expenses were comprised primarily of personnel expenses of affiliates of our Advisor, directors’ and officers’ insurance, franchise taxes, accounting and legal fees, and board of director fees and will continue to grow as our asset base increases. The increase in general and administrative expense was primarily attributed to increased costs as a result of the growth of our portfolio. Specifically, we incurred increased personnel expenses reimbursable to the Advisor due to increased accounting, legal and administrative activity as a result of the growth of the portfolio and related reporting. We expect increases in general and administrative expenses in the future as we purchase additional real estate properties and the properties acquired during the nine months ended September 30, 2015 are operational for a full period.
45
Acquisition Fees and Expenses. Acquisition fees and expenses were approximately $11.3 million and $18.1 million for the quarter and nine months ended September 30, 2015, respectively, of which $2.2 million were capitalized as real estate under development for both the quarter and nine months ended September 30, 2015. We incurred approximately $4.3 million and $19.0 million for the quarter and nine months ended September 30, 2014, respectively, of which $0.5 million and $3.3 million were capitalized as real estate under development. The net increase in acquisition fees and expenses is a result of having acquired 30 operating properties totaling approximately $655.1 million during the nine months ended September 30, 2015, as compared with the acquisition of 22 operating properties totaling approximately $559.5 million, which included a large value add acquisition, during the nine months ended September 30, 2014. We expect to incur additional acquisition fees and expenses in the future as we purchase additional real estate or real estate-related assets.
Asset Management Fees. We incurred asset management fees payable to our Advisor of approximately $6.1 million and $16.1 million for the quarter and nine months ended September 30, 2015, respectively, as compared to $3.7 million and $9.5 million for the quarter and nine months ended September 30, 2014, respectively. For the quarter and nine months ended September 30, 2015, approximately $0.9 million and $2.3 million, respectively, in asset management fees were settled in accordance with the terms of the Expense Support Agreements and approximately $0.1 million and $0.4 million, respectively, were capitalized as real estate under development. For the quarter and nine months ended September 30, 2014, approximately $0.9 million and $3.8 million, respectively, in asset management fees were settled in accordance with the terms of the Expense Support Agreements and approximately $0.1 million and $0.2 million, respectively, were capitalized as real estate under development. As described in Note 11. “Related Party Arrangements,” during the quarter and nine months ended September 30, 2015, asset management fees were reduced by $0.9 million and $2.3 million, respectively, because the shares of restricted stock, which will be accepted by the Advisor as payment for asset management services rendered, were valued at zero— the lowest possible value estimated at vesting. For the quarter and nine months ended September 30, 2014, approximately $0.9 million and $3.8 million in asset management fees were settled with issuance of restricted stock in accordance with the Expense Support Agreements. Monthly asset management fees equal to 0.08334% of invested assets are paid to the Advisor for management of our real estate assets, including our pro rata share of our investments in unconsolidated entities, loans and other permitted investments. We expect increases in asset management fees in the future as we purchase additional real estate or real estate-related assets and the properties owned as of September 30, 2015 are operational for a full period; however, a portion of such fees may be settled in the form of forfeitable restricted stock under the Expense Support Agreements.
Property Management Fees. We incurred property and construction management fees of approximately $4.9 million and $13.1 million for the quarter and nine months ended September 30, 2015, respectively, as compared to $3.0 million and $7.0 million for the quarter and nine months ended September 30, 2014, respectively. For the quarter and nine months ended September 30, 2015, approximately $1.0 million and $2.6 million, respectively, as compared to $0.6 million and $0.9 million for the quarter and nine months ended September 30, 2014, respectively, were capitalized as real estate under development. Property management fees generally range from 2% to 5% of property revenues for leased properties, depending on the type of property, and are paid to third-party managers. However, an oversight fee equal to 1% of property revenues is paid to the Property Manager for those properties managed by a third-party. Overall property management fees increased as a result of the increases in rental income from operating leases and resident fees and services from acquisitions subsequent to September 30, 2014, as well as the properties acquired during the quarter ended September 30, 2014 being owned for the entire nine months ended September 30, 2015. Although we expect total property management fees will increase during the remainder of 2015, a portion of such fees may be settled in the form of forfeitable restricted stock under the Expense Support Agreements.
Impairment Provision. During the nine months ended September 30, 2015, we recorded an impairment provision of $4.7 million to write-off the lease intangibles related to two of our specialty hospitals, as it was determined that the carrying value of these assets would not be recoverable; refer to Note 5. “Intangibles, net” for additional information. There were no impairments during the quarter ended September 30, 2015 or the quarter and nine months ended September 30, 2014.
Loss on Lease Termination. During the nine months ended September 30, 2015, we recorded a loss on lease termination of $0.9 million related to two of our specialty hospitals, as it was determined that the carrying value of certain deferred rent and lease incentives would not be recoverable. There were no losses on lease terminations during the quarter ended September 30, 2015 or the quarter and nine months ended September 30, 2014.
46
Contingent Purchase Price Consideration Adjustment. During the quarter and nine months ended September 30, 2015, we recorded fair value adjustments of approximately $0.3 million and $0.6 million, respectively, related to two separate acquisitions. Based on lower than expected occupancy and revised projections of future net operating income, we revised our fair value estimate of our Capital Health Yield Guaranty receivable by approximately $0.3 million for the nine months ended September 30, 2015. In addition, as a result of the expiration of the Chestnut Commons Earn-Out agreement, we recorded a fair value adjustment of approximately $0.3 million during the quarter and nine months ended September 30, 2015. During the quarter and nine months ended September 30, 2014, we recorded fair value adjustments of approximately $1.8 million and $0.5 million, respectively, relating to two separate acquisitions. Based on lower than expected occupancy and revised projections of future net operating income, we revised our fair value estimate of our Capital Health Yield Guaranty receivable by approximately $1.3 million and recorded as a reduction to our operating loss in the accompanying consolidated statements of operations for nine months ended September 30, 2014. In addition, based on exceeding certain net operating income targets on one of the South Bay II communities, we have recognized $1.8 million of expense during the quarter and nine months ended September 30, 2014.
Depreciation and Amortization. Depreciation and amortization expenses were approximately $27.9 million and $75.1 million for the quarter and nine months ended September 30, 2015, respectively, as compared to approximately $17.6 million and $44.1 million for the quarter and nine months ended September 30, 2014, respectively. Depreciation and amortization expenses are comprised of depreciation and amortization of the buildings, equipment, land improvements and in-place leases related to our real estate portfolio. The increase in depreciation and amortization expense across periods resulted from our acquisition of eight managed seniors housing communities, five leased seniors housing communities, 29 medical office buildings, and one acute care hospital subsequent to September 30, 2014, as well as 13 managed seniors housing communities, three medical office buildings, three post-acute care facilities and three acute care hospitals acquired during the nine months ended September 30, 2014 being owned for the entire period. In addition, Wellmore of Tega Cay, Dogwood Forest of Acworth and HarborChase of Villages Crossing were placed into service in June 2015, June 2014 and December 2013, respectively, which further contributed to the increase. We expect depreciation and amortization expense to increase as these investments are held in future periods and we acquire additional properties.
Interest Expense and Loan Cost Amortization. Interest expense and loan cost amortization were approximately $11.5 million and $32.2 million for the quarter and nine months ended September 30, 2015, respectively, as compared to approximately $8.7 million and $22.3 million for the quarter and nine months ended September 30, 2014, respectively. For the quarter and nine months ended September 30, 2015, approximately $0.5 million and $1.8 million, respectively, were capitalized as development costs relating to our real estate under development, as compared to approximately $0.2 million and $0.6 million for the quarter and nine months ended September 30, 2014, respectively. Approximately $2.1 million and $6.8 million of the increase for the quarter and nine months ended September 30, 2015, respectively, was primarily the result of an increase in our average debt outstanding to approximately $1.2 billion for both the quarter and nine months ended September 30, 2015, as compared with approximately $0.8 billion and $0.7 billion for the quarter and nine months ended September 30, 2014, respectively. In addition, during the quarter and nine months ended September 30, 2015, we incurred approximately $0.2 million and $0.5 million, respectively, in additional loan cost amortization relating to debt obtained subsequent to September 30, 2014. Moreover, during the nine months ended September 30, 2015, we recorded a write-off of approximately $0.5 million in loan costs and paid approximately $0.3 million on the derecognition of cash flow hedges in connection with the early extinguishment of debt on the Perennial Communities and Medical Portfolio I Properties.
Equity in Loss of Unconsolidated Entities. Our unconsolidated entities generated losses of approximately $0.2 million and $0.7 million for quarter and nine months ended September 30, 2015, respectively, relating to our investment in the Windsor Manor joint venture, as compared to losses of approximately $0.2 million and $1.2 million for the quarter and nine months ended September 30, 2014 relating to our investments in the Windsor Manor and Montecito joint ventures. Equity in earnings (loss) from unconsolidated entities is determined using the hypothetical liquidation book value (“HLBV”) method of accounting, which can create significant variability in earnings or loss from the joint venture while the preferred cash distributions that we anticipate to receive from the joint venture may be more consistent as a result of our distribution preferences.
Gain from Purchase of Controlling Interest of Investment in Unconsolidated Entity. During the quarter and nine months ended September 30, 2014, we recognized a gain of approximately $2.8 million related to the purchase of our co-venture partner’s 10% interest in the Montecito Joint Venture, which resulted in us controlling and consolidating the property. There was no change in the controlling interest of unconsolidated entities during the quarter and nine months ended September 30, 2013 nor do we currently expect future changes in control of investments in unconsolidated entities.
Income Tax Expense. During the quarter and nine months ended September 30, 2015, we recognized state income tax expense related to our properties of approximately $0.2 million and $0.3 million, respectively, as compared to approximately $0.04 million and $0.01 million of benefit for the quarter and nine months ended September 30, 2014, respectively.
47
Funds from Operations and Modified Funds from Operations
Due to certain unique operating characteristics of real estate companies, as discussed below, National Association Real Estate Investment Trust (“NAREIT”) promulgated a measure known as funds from operations (“FFO”), which we believe to be an appropriate supplemental measure to reflect the operating performance of a REIT. The use of FFO is recommended by the REIT industry as a supplemental performance measure. FFO is not equivalent to net income or loss as determined under GAAP.
We define FFO, a non-GAAP measure, consistent with the standards approved by the Board of Governors of NAREIT. NAREIT defines FFO as net income or loss computed in accordance with GAAP, excluding gains or losses from sales of property, real estate asset impairment write-downs, plus depreciation and amortization of real estate related assets, and after adjustments for unconsolidated partnerships and joint ventures. Our FFO calculation complies with NAREIT’s policy described above.
The historical accounting convention used for real estate assets requires straight-line depreciation of buildings and improvements, which implies that the value of real estate assets diminishes predictably over time, especially if such assets are not adequately maintained or repaired and renovated as required by relevant circumstances and/or is requested or required by lessees for operational purposes in order to maintain the value of the property. We believe that, because real estate values historically rise and fall with market conditions, including inflation, interest rates, the business cycle, unemployment and consumer spending, presentations of operating results for a REIT using historical accounting for depreciation may be less informative. Historical accounting for real estate involves the use of GAAP. Any other method of accounting for real estate such as the fair value method cannot be construed to be any more accurate or relevant than the comparable methodologies of real estate valuation found in GAAP. Nevertheless, we believe that the use of FFO, which excludes the impact of real estate related depreciation and amortization, provides a more complete understanding of our performance to investors and to management, and when compared year over year, reflects the impact on our operations from trends in occupancy rates, rental rates, operating costs, general and administrative expenses, and interest costs, which may not be immediately apparent from net income or loss. However, FFO and modified funds from operations (“MFFO”), as described below, should not be construed to be more relevant or accurate than the current GAAP methodology in calculating net income or loss in its applicability in evaluating operating performance. The method utilized to evaluate the value and performance of real estate under GAAP should be construed as a more relevant measure of operational performance and considered more prominently than the non-GAAP FFO and MFFO measures and the adjustments to GAAP in calculating FFO and MFFO.
Changes in the accounting and reporting promulgations under GAAP (for acquisition fees and expenses for business combinations from a capitalization/depreciation model) to an expensed-as-incurred model that were put into effect in 2009, and other changes to GAAP accounting for real estate subsequent to the establishment of NAREIT’s definition of FFO, have prompted an increase in cash-settled expenses, specifically acquisition fees and expenses, as items that are expensed under GAAP and accounted for as operating expenses. Our management believes these fees and expenses do not affect our overall long-term operating performance. Publicly registered, non-listed REITs typically have a significant amount of acquisition activity and are substantially more dynamic during their initial years of investment and operation. While other start up entities may also experience significant acquisition activity during their initial years, we believe that non-listed REITs are unique in that they have a limited life with targeted exit strategies within a relatively limited time frame after its acquisition activity ceases. Due to the above factors and other unique features of publicly registered, non-listed REITs, the Investment Program Association (“IPA”), an industry trade group, has standardized a measure known as MFFO which the IPA has recommended as a supplemental measure for publicly registered non-listed REITs and which we believe to be another appropriate supplemental measure to reflect the operating performance of a non-listed REIT. MFFO is not equivalent to our net income or loss as determined under GAAP, and MFFO may not be a useful measure of the impact of long-term operating performance on value if we do not continue to operate with a limited life and targeted exit strategy, as currently intended. We believe that because MFFO excludes costs that we consider more reflective of investing activities and other non-operating items included in FFO and also excludes acquisition fees and expenses that affect our operations only in periods in which properties are acquired, MFFO can provide, on a going forward basis, an indication of the sustainability (that is, the capacity to continue to be maintained) of our operating performance after the period in which we acquired our properties and once our portfolio is in place. By providing MFFO, we believe we are presenting useful information that assists investors and analysts to better assess the sustainability of our operating performance after our properties have been acquired. We also believe that MFFO is a recognized measure of sustainable operating performance by the non-listed REIT industry.
48
We define MFFO, a non-GAAP measure, consistent with the IPA’s Guideline 2010-01, Supplemental Performance Measure for Publicly Registered, Non-Listed REITs: MFFO, or the Practice Guideline, issued by the IPA in November 2010. The Practice Guideline defines MFFO as FFO further adjusted for the following items, as applicable, included in the determination of GAAP net income or loss: acquisition fees and expenses; amounts relating to deferred rent receivables and amortization of above and below market leases and liabilities (which are adjusted in order to remove the impact of GAAP straight-line adjustments from rental revenues); accretion of discounts and amortization of premiums on debt investments, mark-to-market adjustments included in net income; nonrecurring gains or losses included in net income from the extinguishment or sale of debt, hedges, foreign exchange, derivatives or securities holdings where trading of such holdings is not a fundamental attribute of the business plan, and unrealized gains or losses resulting from consolidation from, or deconsolidation to, equity accounting and after adjustments for consolidated and unconsolidated partnerships and joint ventures, with such adjustments calculated to reflect MFFO on the same basis. The accretion of discounts and amortization of premiums on debt investments, nonrecurring unrealized gains and losses on hedges, foreign exchange, derivatives or securities holdings, unrealized gains and losses resulting from consolidations, as well as other listed cash flow adjustments are adjustments made to net income in calculating the cash flows provided by operating activities and, in some cases, reflect gains or losses which are unrealized and may not ultimately be realized.
Our MFFO calculation complies with the IPA’s Practice Guideline described above. In calculating MFFO, we exclude acquisition related expenses. Under GAAP, acquisition fees and expenses are characterized as operating expenses in determining operating net income or loss. These expenses are paid in cash by us. All paid and accrued acquisition fees and expenses will have negative effects on returns to investors, the potential for future distributions, and cash flows generated by us, unless earnings from operations or net sales proceeds from the disposition of other properties are generated to cover the purchase price of the property.
Our management uses MFFO and the adjustments used to calculate it in order to evaluate our performance against other non-listed REITs which have limited lives with short and defined acquisition periods and targeted exit strategies shortly thereafter. As noted above, MFFO may not be a useful measure of the impact of long-term operating performance on value if we do not continue to operate in this manner. We believe that our use of MFFO and the adjustments used to calculate it allow us to present our performance in a manner that reflects certain characteristics that are unique to non-listed REITs, such as their limited life, limited and defined acquisition period and targeted exit strategy, and hence that the use of such measures is useful to investors. For example, acquisition costs are funded from our subscription proceeds and other financing sources and not from operations. By excluding expensed acquisition costs, the use of MFFO provides information consistent with management’s analysis of the operating performance of the properties.
Presentation of this information is intended to provide useful information to investors as they compare the operating performance of different non-listed REITs, although it should be noted that not all REITs calculate FFO and MFFO the same way and as such comparisons with other REITs may not be meaningful. Furthermore, FFO and MFFO are not necessarily indicative of cash flows available to fund cash needs and should not be considered as an alternative to net income (loss) or income (loss) from continuing operations as an indication of our performance, as an alternative to cash flows from operations, as an indication of our liquidity, or indicative of funds available to fund our cash needs including our ability to make distributions to our stockholders. FFO and MFFO should be reviewed in conjunction with other GAAP measurements as an indication of our performance. Now that our NAV is disclosed and updated at least annually, MFFO is useful in assisting management and investors in assessing the sustainability of operating performance in future operating periods, and in particular, after the offering and acquisition stages are complete. FFO and MFFO are not useful measures in evaluating net asset value because impairments are taken into account in determining net asset value but not in determining FFO and MFFO.
Neither the SEC, NAREIT nor any other regulatory body has passed judgment on the acceptability of the adjustments we use to calculate FFO or MFFO. In the future, the SEC, NAREIT or another regulatory body may decide to standardize the allowable adjustments across the non-listed REIT industry and we would have to adjust our calculation and characterization of FFO or MFFO.
49
The following table presents a reconciliation of net loss to FFO and MFFO for the quarter and nine months ended September 30, 2015 and 2014 (in thousands, except per share data):
|
|
|
Quarter Ended September 30, |
|
|
Nine Months Ended September 30, |
|
||||||||||
|
|
|
2015 |
|
|
2014 |
|
|
2015 |
|
|
2014 |
|
||||
|
Net loss attributable to common stockholders |
|
$ |
(19,225 |
) |
|
$ |
(12,204 |
) |
|
$ |
(50,634 |
) |
|
$ |
(37,030 |
) |
|
Adjustments: |
|
|
|
|
|
|
|
|
|
|
|
|
|
|
|
|
|
Depreciation and amortization |
|
|
27,854 |
|
|
|
17,550 |
|
|
|
75,147 |
|
|
|
44,111 |
|
|
Impairment provision on real estate assets |
|
― |
|
|
― |
|
|
|
4,661 |
|
|
― |
|
|||
|
FFO adjustments from unconsolidated entities (1) |
|
|
380 |
|
|
|
551 |
|
|
|
1,338 |
|
|
|
2,570 |
|
|
Gain from change in control of investment in unconsolidated entity |
|
― |
|
|
|
(2,798 |
) |
|
― |
|
|
|
(2,798 |
) |
||
|
Total funds from operations |
|
|
9,009 |
|
|
|
3,099 |
|
|
|
30,512 |
|
|
|
6,853 |
|
|
Acquisition fees and expenses (2) |
|
|
9,073 |
|
|
|
3,729 |
|
|
|
15,939 |
|
|
|
15,726 |
|
|
Straight-line adjustments for leases (3) |
|
|
(1,324 |
) |
|
|
(323 |
) |
|
|
(3,118 |
) |
|
|
(1,595 |
) |
|
Amortization of above/below market intangible assets and liabilities (4) |
|
|
285 |
|
|
|
71 |
|
|
|
685 |
|
|
|
188 |
|
|
Unrealized gains from mark-to-market adjustments on swaps (5) |
|
|
48 |
|
|
― |
|
|
|
48 |
|
|
― |
|
||
|
Loss on extinguishment of debt (6) |
|
― |
|
|
― |
|
|
|
749 |
|
|
― |
|
|||
|
Loss on lease terminations (7) |
|
― |
|
|
― |
|
|
|
863 |
|
|
― |
|
|||
|
Adjustments to contingent purchase price consideration (8) |
|
|
(268 |
) |
|
|
1,800 |
|
|
|
(589 |
) |
|
|
479 |
|
|
MFFO adjustments from unconsolidated entities (1) |
|
― |
|
|
|
12 |
|
|
― |
|
|
|
46 |
|
||
|
Modified funds from operations |
|
$ |
16,823 |
|
|
$ |
8,388 |
|
|
$ |
45,089 |
|
|
$ |
21,697 |
|
|
Weighted average number of shares of common |
|
|
|
|
|
|
|
|
|
|
|
|
|
|
|
|
|
stock outstanding (basic and diluted) (9) |
|
|
162,730 |
|
|
|
89,597 |
|
|
|
147,075 |
|
|
|
78,296 |
|
|
Net loss per share (basic and diluted) |
|
$ |
(0.12 |
) |
|
$ |
(0.14 |
) |
|
$ |
(0.34 |
) |
|
$ |
(0.47 |
) |
|
FFO per share (basic and diluted) |
|
$ |
0.06 |
|
|
$ |
0.03 |
|
|
$ |
0.21 |
|
|
$ |
0.09 |
|
|
MFFO per share (basic and diluted) |
|
$ |
0.10 |
|
|
$ |
0.09 |
|
|
$ |
0.31 |
|
|
$ |
0.28 |
|
FOOTNOTES:
|
(1) |
This amount represents our share of the FFO or MFFO adjustments allowable under the NAREIT or IPA definitions, respectively, calculated using the HLBV method. |
|
(2) |
In evaluating investments in real estate, management differentiates the costs to acquire the investment from the operations derived from the investment. By adding back acquisition expenses, management believes MFFO provides useful supplemental information of its operating performance and will also allow comparability between different real estate entities regardless of their level of acquisition activities. Acquisition expenses include payments to our Advisor or third parties. Acquisition expenses for business combinations under GAAP are considered operating expenses and as expenses included in the determination of net income (loss) and income (loss) from continuing operations, both of which are performance measures under GAAP. All paid or accrued acquisition expenses will have negative effects on returns to investors, the potential for future distributions, and cash flows generated by us, unless earnings from operations or net sales proceeds from the disposition of properties are generated to cover the purchase price of the property. |
|
(3) |
Under GAAP, rental receipts are allocated to periods using various methodologies. This may result in income recognition that is significantly different than underlying contract terms. By adjusting for these items (to reflect such payments from a GAAP accrual basis to a cash basis of disclosing the rent and lease payments), MFFO provides useful supplemental information on the realized economic impact of lease terms and debt investments, providing insight on the contractual cash flows of such lease terms and debt investments, and aligns results with management’s analysis of operating performance. |
|
(4) |
Under GAAP, certain intangibles are accounted for at cost and reviewed at least annually for impairment, and certain intangibles are assumed to diminish predictably in value over time and are amortized, similar to depreciation and amortization of other real estate-related assets that are excluded from FFO. However, because real estate values and market lease rates historically rise or fall with market conditions, management believes that by excluding charges relating to amortization of these intangibles, MFFO provides useful supplemental information on the performance of the real estate. |
50
|
(5) |
Management believes that adjusting for the unrealized gains from mark-to-market adjustments on swaps is appropriate because the non-cash adjustment that is not reflective of our ongoing operating performance and aligns results with management’s analysis of operating performance. |
|
(6) |
Management believes that adjusting for the realized loss on the early extinguishment of debt is appropriate because the write-off of unamortized loan costs is a non-cash adjustment that is not reflective of our ongoing operating performance and aligns results with management’s analysis of operating performance. |
|
(7) |
Management believes that adjusting for impairment provisions on lease related costs is appropriate because they are non-cash adjustments that are not reflective of our ongoing operating performance and aligns results with management’s analysis of operating performance. We recorded an impairment provision for deferred rent from prior GAAP straight-lining adjustments which resulted from a change in our expected holding periods for those properties. |
|
(8) |
Management believes that the elimination of the adjustments to contingent purchase price consideration included in operating income (expense) for GAAP purposes is appropriate because the adjustment is not reflective of our ongoing operating performance and aligns results with management’s analysis of operating performance. |
|
(9) |
For purposes of determining the weighted average number of shares of common stock outstanding, stock distributions are treated as if they were outstanding as of the beginning of the periods presented. |
Off-Balance Sheet Arrangements
In May 2015, it was determined that the Windsor Manor joint venture did not meet the debt service coverage requirement per the loan agreement as the debt service coverage ratio fell below the 1.35 minimum requirement for the reporting period ending March 31, 2015. As a result, a waiver was obtained from the lender as of March 31, 2015. It was determined that the Windsor Manor joint venture did not meet the same debt service coverage requirement for the reporting periods ending June 30, 2015 and September 30, 2015 and additional waivers were obtained from the lender. As of September 30, 2015, approximately $21.5 million remained outstanding under the loan agreement. We are actively monitoring this portfolio and note that there has been improvement in operating performance quarter over quarter during the nine months ended September 30, 2015.
Contractual Obligations
The following table presents our contractual obligations and the related payment periods as of September 30, 2015:
|
|
|
Payments Due by Period |
|
|||||||||||||||||
|
|
|
2015 |
|
|
2016-2017 |
|
|
2018-2019 |
|
|
Thereafter |
|
|
Total |
|
|||||
|
Mortgage and other notes payable (principal and interest) |
|
$ |
12,544 |
|
|
$ |
146,768 |
|
|
$ |
654,916 |
|
|
$ |
179,326 |
|
|
$ |
993,554 |
|
|
Credit Facilities (principal and interest) |
|
|
1,981 |
|
|
|
230,846 |
|
|
|
179,116 |
|
|
― |
|
|
|
411,943 |
|
|
|
Development contracts on development properties (1) |
|
|
28,772 |
|
|
|
85,378 |
|
|
― |
|
|
― |
|
|
|
114,150 |
|
||
|
Ground and air rights leases (2) |
|
|
484 |
|
|
|
3,941 |
|
|
|
4,057 |
|
|
|
115,515 |
|
|
|
123,997 |
|
|
|
|
$ |
43,781 |
|
|
$ |
466,933 |
|
|
$ |
838,089 |
|
|
$ |
294,841 |
|
|
$ |
1,643,644 |
|
FOOTNOTES:
|
(1) |
The amounts presented above represent accrued development costs as of September 30, 2015 and development costs not yet incurred of the aggregate budgeted development costs, including start-up costs, in accordance with the development agreements, and the expected timing of such costs. The amounts include approximately $105.3 million of contractual obligations with third-party developers and approximately $8.9 million of additional expected development costs that have been included in the respective development budgets. |
|
(2) |
Ground and air rights leases are operating leases with scheduled payments over the life of the respective leases and with expirations ranging from 2045 to 2082. |
Critical Accounting Policies and Estimates
See Item 1. “Financial Statements” and our Annual Report on Form 10-K for the year ended December 31, 2014 for a summary of our critical accounting policies and estimates.
Recent Accounting Pronouncements
See Item 1. “Financial Information” for a summary of the impact of recent accounting pronouncements.
51
Item 3. Quantitative and Qualitative Disclosures about Market Risks
We may be exposed to interest rate changes primarily as a result of long-term debt used to acquire properties and to make loans and other permitted investments. Our management objectives related to interest rate risk will be to limit the impact of interest rate changes on earnings and cash flows and to lower our overall borrowing costs. To achieve our objectives, we expect to borrow primarily at fixed rates or variable rates with the lowest margins available, and in some cases, with the ability to convert variable rates to fixed rates. With regard to variable rate financing, we will assess interest rate cash flow risk by continually identifying and monitoring changes in interest rate exposures that may adversely impact expected future cash flows and by evaluating hedging opportunities.
The following is a schedule as of September 30, 2015, of our fixed and variable rate debt maturities for the remainder of 2015, and each of the next four years and thereafter (principal maturities only) (in thousands):
|
|
|
Expected Maturities |
|
|
|
|
|
|
|
|
|
|||||||||||||||||||||
|
|
|
2015 |
|
|
2016 |
|
|
2017 |
|
|
2018 |
|
|
2019 |
|
|
Thereafter |
|
|
Total |
|
|
Fair Value (1) |
|
||||||||
|
Fixed rate debt |
|
$ |
2,317 |
|
|
$ |
9,557 |
|
|
$ |
9,983 |
|
|
$ |
204,191 |
|
|
$ |
5,152 |
|
|
$ |
164,754 |
|
|
$ |
395,954 |
|
|
$ |
397,000 |
|
|
Weighted average interest rate on fixed debt |
|
|
4.26 |
% |
|
|
4.25 |
% |
|
|
4.25 |
% |
|
|
4.30 |
% |
|
|
4.14 |
% |
|
|
4.12 |
% |
|
|
4.22 |
% |
|
|
|
|
|
Variable rate debt |
|
$ |
2,452 |
|
|
$ |
28,173 |
|
|
$ |
251,123 |
|
|
$ |
94,989 |
|
|
$ |
482,572 |
|
|
― |
|
|
$ |
859,309 |
|
|
$ |
869,000 |
|
|
|
Average interest rate on variable rate debt |
|
LIBOR + 2.22 |
% |
|
LIBOR + 2.22 |
% |
|
LIBOR + 2.23 |
% |
|
LIBOR + 2.33 |
% |
|
LIBOR + 2.28 |
% |
|
― |
% |
|
LIBOR + 2.27 |
% |
|
|
|
|
|||||||
FOOTNOTE:
|
(1) |
The estimated fair value of our fixed and variable rate debt was determined using discounted cash flows based on market interest rates as of September 30, 2015. We determined market rates through discussions with our existing lenders pricing our loans with similar terms and current rates and spreads. |
Management estimates that a one-percentage point increase or decrease in LIBOR in 2015, compared to LIBOR rates as of September 30, 2015, would result in fluctuation of interest expense on our variable rate debt of approximately $8.6 million for the year ending December 31, 2015. This sensitivity analysis contains certain simplifying assumptions, and although it gives an indication of our exposure to changes in interest rates, it is not intended to predict future results and actual results will likely vary given that our sensitivity analysis on the effects of changes in LIBOR does not factor in a potential change in variable rate debt levels, any offsetting gains on interest rate swap contracts, or the impact of any LIBOR floors or caps.
As of September 30, 2015, the Company’s debt is comprised of approximately 31.5% in fixed rate debt, approximately 44.1% in variable rate debt with current or forward-starting interest rate swaps and approximately 24.4% of unhedged variable rate debt. The remaining unhedged variable rate debt primarily relates to our construction loans and Revolving Credit Facility. Overall, we believe longer term fixed rate debt could be beneficial in a rising interest rate or rising inflation rate environment and as such we continue to evaluate the need for additional interest rate swaps on unhedged variable rate debt.
52
Item 4.Controls and Procedures
Evaluation of Disclosure Controls and Procedures
Pursuant to Rule 13a-15(b) under the Securities Exchange Act of 1934, as amended (“Exchange Act”), under the supervision and with the participation of our management, including our principal executive officer and principal financial officer, we conducted an evaluation of the effectiveness of our disclosure controls and procedures (as defined under Rule 13a-15(e) under the Exchange Act) as of the end of the period covered by this report. Based upon that evaluation, our management, including our principal executive officer and principal financial officer, concluded that our disclosure controls and procedures are effective at the reasonable assurance level as of the end of the period covered by this report.
Changes in Internal Control over Financial Reporting
During the most recent fiscal quarter, there were no changes in our internal controls over financial reporting (as defined under Rule 13a-15(f) under the Exchange Act) that have materially affected, or are reasonably likely to materially affect, our internal controls over financial reporting.
53
Item 1. Legal Proceedings - None
There have been no material changes in our assessment of our risk factors from those set forth in our Annual Report on Form 10-K for the fiscal year ended December 31, 2014.
Item 2. Unregistered Sales of Equity Securities and Use of Proceeds
Unregistered Sales of Equity Securities
During the period covered by this quarterly report, we did not sell any equity securities that were not registered under the Securities Act of 1933, and we did not repurchase any of our securities.
Secondary Sales of Registered Shares between Investors
We are not aware of any other transfers of shares by investors for the quarter and nine months ended September 30, 2015 and we are not aware of any other trades of our shares, other than previous purchases made in our public offerings and redemptions of shares by us.
Use of Proceeds from Registered Securities
As of June 30, 2015, all offering proceeds from our Initial Offering had been deployed. Please see the Form 10-Q for the quarter and six months ended June 30, 2015 filed on August 13, 2015 for additional detail.
Issuer Purchases of Equity Securities
The following table presents details regarding our repurchase of securities between July 1, 2015 and September 30, 2015:
|
Period |
|
Total number of shares purchased |
|
|
Average price paid per share |
|
|
Total number of shares purchased as part of a publically announced plan |
|
|
Maximum number of shares that may yet be purchased under the plan (1) |
|
||||
|
July 1, 2015 through July 31, 2015 |
|
― |
|
|
― |
|
|
― |
|
|
|
3,077,250 |
|
|||
|
August 1, 2015 through August 31, 2015 |
|
― |
|
|
― |
|
|
― |
|
|
|
3,190,138 |
|
|||
|
September 1, 2015 through September 30, 2015 |
|
|
292,429 |
|
|
$ |
9.51 |
|
|
|
292,429 |
|
|
|
3,130,629 |
|
|
Total |
|
|
292,429 |
|
|
$ |
9.51 |
|
|
|
292,429 |
|
|
|
|
|
FOOTNOTES:
|
(1) |
This represents the maximum number of shares which can be redeemed under the redemption plan and is subject to a five percent limitation in a rolling 12-month period as described above. However, we are not obligated to redeem such amounts and this does not take into account the amount the board of directors has determined to redeem or whether there are sufficient proceeds under the redemption plan. Under the redemption plan, we can, at our discretion, use the full amount of the proceeds from the sale of shares under our Reinvestment Plan attributable to any month to redeem shares presented for redemption during such month. Any amount of proceeds from our Offerings which is available for redemptions but which is unused may be carried over to the next succeeding calendar quarter for use in addition to the amount of proceeds from our Offerings and Reinvestment Plan proceeds that would otherwise be available for redemptions. |
Item 3. Defaults Upon Senior Securities - None
Item 4. Mine Safety Disclosure – Not Applicable
Item 5. Other Information - None
The exhibits required by this item are set forth in the Exhibit Index attached hereto and are filed or incorporated as part of this report.
54
Pursuant to the requirements of the Securities Exchange Act of 1934, the registrant has duly caused this report to be signed on its behalf by the undersigned thereunto duly authorized, on the 12th day of November 2015.
|
CNL HEALTHCARE PROPERTIES, INC. |
|
|
|
|
|
By: |
/s/ Stephen H. Mauldin |
|
|
STEPHEN H. MAULDIN |
|
|
Chief Executive Officer and President |
|
|
(Principal Executive Officer) |
|
|
|
|
By: |
/s/ Kevin R. Maddron |
|
|
KEVIN R. MADDRON |
|
|
Chief Financial Officer, Treasurer and Chief Operating Officer |
|
|
(Principal Financial Officer) |
55
Exhibits
The following exhibits are included, or incorporated by reference in this Quarterly Report on Form 10-Q for the quarter ended September 30, 2015 (and are numbered in accordance with Item 601 of Regulation S-K).
|
Exhibit No. |
|
Description |
|
|
|
|
|
10.59 |
|
Purchase and Sale Agreement dated as of January 9, 2015, by and among UT Cancer Institute Building L.P., CHP Partners, LP and First American Title Insurance Company. (Previously filed as Exhibit 10.1 to the Current Report on Form 8-K filed January 15, 2015 and incorporated herein by reference.) |
|
|
|
|
|
31.1 |
|
Certification of Chief Executive Officer of CNL Healthcare Properties, Inc., Pursuant to Rule 13a-14(a), as Adopted Pursuant to Section 302 of the Sarbanes-Oxley Act of 2002. (Filed herewith.) |
|
|
|
|
|
31.2 |
|
Certification of Chief Financial Officer of CNL Healthcare Properties, Inc., Pursuant to Rule 13a-14(a), as Adopted Pursuant to Section 302 of the Sarbanes-Oxley Act of 2002. (Filed herewith.) |
|
|
|
|
|
32.1 |
|
Certification of Chief Executive Officer and Chief Financial Officer of CNL Healthcare Properties, Inc., Pursuant to 18 U.S.C. Section 1350, as Adopted Pursuant to Section 906 of the Sarbanes-Oxley Act of 2002. (Filed herewith.) |
|
|
|
|
|
101 |
|
The following materials from CNL Healthcare Properties, Inc. Quarterly Report on Form 10-Q for the quarter and nine months ended September 30, 2015, formatted in XBRL (Extensible Business Reporting Language); (i) Condensed Consolidated Balance Sheets, (ii) Condensed Consolidated Statement of Operations, (iii) Condensed Consolidated Statement of Comprehensive Loss, (iv) Condensed Consolidated Statements of Stockholders’ Equity and Redeemable Noncontrolling Interest, (v) Condensed Consolidated Statement of Cash Flows, and (vi) Notes to the Condensed Consolidated Financial Statements. |
56