Attached files
| file | filename |
|---|---|
| EX-32.1 - EX-32.1 - CNL Healthcare Properties, Inc. | chp-ex321_7.htm |
| EX-31.2 - EX-31.2 - CNL Healthcare Properties, Inc. | chp-ex312_6.htm |
| EX-31.1 - EX-31.1 - CNL Healthcare Properties, Inc. | chp-ex311_8.htm |
UNITED STATES
SECURITIES AND EXCHANGE COMMISSION
Washington, D.C. 20549
|
FORM 10-Q |
|
☒ |
QUARTERLY REPORT PURSUANT TO SECTION 13 OR 15 (d) OF THE SECURITIES EXCHANGE ACT OF 1934 |
For the quarterly period ended June 30, 2020
OR
|
☐ |
TRANSITION REPORT PURSUANT TO SECTION 13 OR 15 (d) OF THE SECURITIES EXCHANGE ACT OF 1934 |
For the transition period from to
Commission file number: 000-54685
|
CNL Healthcare Properties, Inc. (Exact name of registrant as specified in its charter) |
|
Maryland |
|
27-2876363 |
|
(State or other jurisdiction of incorporation or organization) |
|
(I.R.S. Employer Identification No.) |
|
CNL Center at City Commons |
|
|
|
(Address of principal executive offices) |
|
(Zip Code) |
|
Registrant’s telephone number, including area code (407) 650-1000 |
||
Indicate by check mark whether the registrant (1) has filed all reports required to be filed by Section 13 or 15(d) of the Securities Exchange Act of 1934 during the preceding 12 months (or for such shorter period that the registrant was required to file such reports), and (2) has been subject to such filing requirements for the past 90 days. Yes ☒ No☐
Indicate by check mark whether the registrant has submitted electronically every Interactive Data File required to be submitted pursuant to Rule 405 of Regulation S-T (§232.405 of this chapter) during the preceding 12 months (or for such shorter period that the registrant was required to submit such files). Yes ☒ No ☐
Indicate by check mark whether the registrant is a large accelerated filer, an accelerated filer, a non-accelerated filer, a smaller reporting company, or an emerging growth company. See the definitions of “large accelerated filer,” “accelerated filer,” “smaller reporting company” and “emerging growth company” in Rule 12b-2 of the Exchange Act.
|
Large accelerated filer |
☐ |
Accelerated filer |
☐ |
|
Non-accelerated filer |
☒ |
Smaller reporting company |
☐ |
|
Emerging growth company |
☐ |
|
|
If an emerging growth company, indicate by check mark if the registrant has elected not to use the extended transition period for complying with any new or revised financial accounting standards provided pursuant to Section 13(a) of the Exchange Act. ☐
Indicate by check mark whether the registrant is a shell company (as defined in Rule 12b-2 of the Exchange Act). Yes ☐ No ☒
Securities registered pursuant to Section 12(b) of the Act:
|
Title of each class |
Trading Symbol(s) |
Name of each exchange on which registered |
|
None |
N/A |
N/A |
The number of shares of common stock of the registrant outstanding as of August 13, 2020 was 173,960,540.
CNL HEALTHCARE PROPERTIES, INC. AND SUBSIDIARIES
INDEX
Item 1. Condensed Consolidated Financial Information
CNL HEALTHCARE PROPERTIES, INC. AND SUBSIDIARIES
CONDENSED CONSOLIDATED BALANCE SHEETS (UNAUDITED)
(in thousands, except per share data)
|
|
|
June 30, |
|
|
December 31, |
|
||
|
ASSETS |
|
2020 |
|
|
2019 |
|
||
|
Real estate investment properties, net (including VIEs $44,590 and $45,329, respectively) |
|
$ |
1,391,537 |
|
|
$ |
1,412,595 |
|
|
Cash and cash equivalents (including VIEs $575 and $1,024, respectively) |
|
|
143,856 |
|
|
|
42,350 |
|
|
Assets held for sale, net |
|
|
30,704 |
|
|
|
111,894 |
|
|
Other assets (including VIEs $504 and $577, respectively) |
|
|
29,033 |
|
|
|
27,049 |
|
|
Deferred rent and lease incentives |
|
|
14,398 |
|
|
|
15,331 |
|
|
Restricted cash (including VIEs $105 and $76, respectively) |
|
|
6,172 |
|
|
|
5,997 |
|
|
Intangibles, net |
|
|
1,023 |
|
|
|
1,220 |
|
|
Total assets |
|
$ |
1,616,723 |
|
|
$ |
1,616,436 |
|
|
LIABILITIES AND EQUITY |
|
|
|
|
|
|
|
|
|
Liabilities: |
|
|
|
|
|
|
|
|
|
Mortgages and other notes payable, net (including VIEs $29,183 and $29,148, respectively) |
|
$ |
350,191 |
|
|
$ |
375,928 |
|
|
Credit facilities |
|
|
343,187 |
|
|
|
302,950 |
|
|
Accounts payable and accrued liabilities (including VIEs $900 and $1,286, respectively) |
|
|
23,532 |
|
|
|
24,530 |
|
|
Other liabilities (including VIEs $269 and $219, respectively) |
|
|
8,939 |
|
|
|
8,609 |
|
|
Due to related parties |
|
|
1,747 |
|
|
|
2,275 |
|
|
Liabilities associated with assets held for sale |
|
|
900 |
|
|
|
1,113 |
|
|
Total liabilities |
|
|
728,496 |
|
|
|
715,405 |
|
|
Commitments and contingencies (Note 12) |
|
|
|
|
|
|
|
|
|
Redeemable noncontrolling interest |
|
|
544 |
|
|
|
558 |
|
|
Stockholders' equity: |
|
|
|
|
|
|
|
|
|
Preferred stock, $0.01 par value per share, |
|
|
|
|
|
|
|
|
|
200,000 shares authorized; none issued or outstanding |
|
― |
|
|
― |
|
||
|
Excess shares, $0.01 par value per share, |
|
|
|
|
|
|
|
|
|
300,000 shares authorized; none issued or outstanding |
|
― |
|
|
― |
|
||
|
Common stock, $0.01 par value per share, 1,120,000 shares authorized,186,626 and 186,626 shares issued, and 173,960 and 173,960 shares outstanding, respectively |
|
|
1,740 |
|
|
|
1,740 |
|
|
Capital in excess of par value |
|
|
1,516,926 |
|
|
|
1,516,926 |
|
|
Accumulated income |
|
|
125,793 |
|
|
|
120,831 |
|
|
Accumulated distributions |
|
|
(758,052 |
) |
|
|
(740,239 |
) |
|
Accumulated other comprehensive loss |
|
|
(41 |
) |
|
|
(36 |
) |
|
Total stockholders' equity |
|
|
886,366 |
|
|
|
899,222 |
|
|
Noncontrolling interest |
|
|
1,317 |
|
|
|
1,251 |
|
|
Total equity |
|
|
888,227 |
|
|
|
901,031 |
|
|
Total liabilities and equity |
|
$ |
1,616,723 |
|
|
$ |
1,616,436 |
|
The abbreviation VIEs above means variable interest entities.
See accompanying notes to condensed consolidated financial statements
2
CNL HEALTHCARE PROPERTIES, INC. AND SUBSIDIARIES
CONDENSED CONSOLIDATED STATEMENTS OF OPERATIONS (UNAUDITED)
(in thousands, except per share data)
|
|
|
Quarter Ended |
|
|
Six Months Ended |
|
||||||||||
|
|
|
June 30, |
|
|
June 30, |
|
||||||||||
|
|
|
2020 |
|
|
2019 |
|
|
2020 |
|
|
2019 |
|
||||
|
Revenues: |
|
|
|
|
|
|
|
|
|
|
|
|
|
|
|
|
|
Rental income and related revenues |
|
$ |
6,418 |
|
|
$ |
8,259 |
|
|
$ |
14,166 |
|
|
$ |
17,182 |
|
|
Resident fees and services |
|
|
71,577 |
|
|
|
71,888 |
|
|
|
145,199 |
|
|
|
143,163 |
|
|
Total revenues |
|
|
77,995 |
|
|
|
80,147 |
|
|
|
159,365 |
|
|
|
160,345 |
|
|
Operating expenses: |
|
|
|
|
|
|
|
|
|
|
|
|
|
|
|
|
|
Property operating expenses |
|
|
48,551 |
|
|
|
46,568 |
|
|
|
96,793 |
|
|
|
92,583 |
|
|
General and administrative expenses |
|
|
2,592 |
|
|
|
5,225 |
|
|
|
4,685 |
|
|
|
8,184 |
|
|
Asset management fees |
|
|
4,415 |
|
|
|
4,589 |
|
|
|
8,927 |
|
|
|
9,182 |
|
|
Property management fees |
|
|
3,336 |
|
|
|
3,410 |
|
|
|
6,864 |
|
|
|
6,878 |
|
|
Financing coordination fees |
|
― |
|
|
|
1,878 |
|
|
― |
|
|
|
1,878 |
|
||
|
Depreciation and amortization |
|
|
12,454 |
|
|
|
12,347 |
|
|
|
24,998 |
|
|
|
24,681 |
|
|
Total operating expenses |
|
|
71,348 |
|
|
|
74,017 |
|
|
|
142,267 |
|
|
|
143,386 |
|
|
Gain on sale of real estate |
|
― |
|
|
|
228 |
|
|
|
1,074 |
|
|
|
228 |
|
|
|
Operating income |
|
|
6,647 |
|
|
|
6,358 |
|
|
|
18,172 |
|
|
|
17,187 |
|
|
Other income (expense): |
|
|
|
|
|
|
|
|
|
|
|
|
|
|
|
|
|
Interest and other income |
|
|
101 |
|
|
|
593 |
|
|
|
125 |
|
|
|
1,046 |
|
|
Interest expense and loan cost amortization |
|
|
(6,108 |
) |
|
|
(11,359 |
) |
|
|
(13,184 |
) |
|
|
(22,648 |
) |
|
Equity in earnings of unconsolidated entity |
|
|
200 |
|
|
|
98 |
|
|
|
406 |
|
|
|
194 |
|
|
Total other expense |
|
|
(5,807 |
) |
|
|
(10,668 |
) |
|
|
(12,653 |
) |
|
|
(21,408 |
) |
|
Income (loss) before income taxes |
|
|
840 |
|
|
|
(4,310 |
) |
|
|
5,519 |
|
|
|
(4,221 |
) |
|
Income tax expense |
|
|
(764 |
) |
|
|
(533 |
) |
|
|
(1,317 |
) |
|
|
(1,188 |
) |
|
Income (loss) from continuing operations |
|
|
76 |
|
|
|
(4,843 |
) |
|
|
4,202 |
|
|
|
(5,409 |
) |
|
Income from discontinued operations |
|
|
170 |
|
|
|
333,370 |
|
|
|
822 |
|
|
|
343,844 |
|
|
Net income |
|
|
246 |
|
|
|
328,527 |
|
|
|
5,024 |
|
|
|
338,435 |
|
|
Less: Amounts attributable to noncontrolling interests |
|
|
|
|
|
|
|
|
|
|
|
|
|
|
|
|
|
Net income (loss) from continuing operations |
|
|
26 |
|
|
|
(2 |
) |
|
|
62 |
|
|
|
(2 |
) |
|
Net income from discontinued operations |
|
― |
|
|
|
257 |
|
|
― |
|
|
|
265 |
|
||
|
Net income attributable to common stockholders |
|
$ |
220 |
|
|
$ |
328,272 |
|
|
$ |
4,962 |
|
|
$ |
338,172 |
|
|
Net income (loss) per share of common stock (basic and diluted) |
|
|
|
|
|
|
|
|
|
|
|
|
|
|
|
|
|
Continuing operations |
|
$ |
0.00 |
|
|
$ |
(0.03 |
) |
|
$ |
0.03 |
|
|
$ |
(0.03 |
) |
|
Discontinued operations |
|
$ |
0.00 |
|
|
$ |
1.92 |
|
|
$ |
0.00 |
|
|
$ |
1.98 |
|
|
Weighted average number of shares of |
|
|
|
|
|
|
|
|
|
|
|
|
|
|
|
|
|
common stock outstanding (basic and diluted) |
|
|
173,960 |
|
|
|
173,963 |
|
|
|
173,960 |
|
|
|
173,963 |
|
See accompanying notes to condensed consolidated financial statements.
3
CNL HEALTHCARE PROPERTIES, INC. AND SUBSIDIARIES
CONDENSED CONSOLIDATED STATEMENTS OF COMPREHENSIVE INCOME (LOSS) (UNAUDITED)
(in thousands)
|
|
|
Quarter Ended |
|
|
Six Months Ended |
|
||||||||||
|
|
|
June 30, |
|
|
June 30, |
|
||||||||||
|
|
|
2020 |
|
|
2019 |
|
|
2020 |
|
|
2019 |
|
||||
|
Net income |
|
$ |
246 |
|
|
$ |
328,527 |
|
|
$ |
5,024 |
|
|
$ |
338,435 |
|
|
|
|
|
|
|
|
|
|
|
|
|
|
|
|
|
|
|
|
Other comprehensive income (loss): |
|
|
|
|
|
|
|
|
|
|
|
|
|
|
|
|
|
Unrealized gain (loss) on derivative financial instruments, net |
|
|
5 |
|
|
|
(130 |
) |
|
|
9 |
|
|
|
(1,036 |
) |
|
Reclassification of interest rate swaps upon derecognition |
|
|
— |
|
|
|
(509 |
) |
|
|
— |
|
|
|
(509 |
) |
|
Reclassification of interest rate caps upon derecognition |
|
|
— |
|
|
|
265 |
|
|
|
— |
|
|
|
265 |
|
|
Unrealized (loss) gain on derivative financial instruments of equity method investments |
|
|
— |
|
|
|
(2 |
) |
|
|
(14 |
) |
|
|
12 |
|
|
Total other comprehensive income (loss) |
|
|
5 |
|
|
|
(376 |
) |
|
|
(5 |
) |
|
|
(1,268 |
) |
|
|
|
|
|
|
|
|
|
|
|
|
|
|
|
|
|
|
|
Comprehensive income |
|
|
251 |
|
|
|
328,151 |
|
|
|
5,019 |
|
|
|
337,167 |
|
|
Less: Comprehensive income attributable to noncontrolling interest |
|
|
26 |
|
|
|
255 |
|
|
|
62 |
|
|
|
263 |
|
|
Comprehensive income attributable to common stockholders |
|
$ |
225 |
|
|
$ |
327,896 |
|
|
$ |
4,957 |
|
|
$ |
336,904 |
|
See accompanying notes to condensed consolidated financial statements.
4
CNL HEALTHCARE PROPERTIES, INC. AND SUBSIDIARIES
CONDENSED CONSOLIDATED STATEMENTS OF STOCKHOLDERS’ EQUITY AND REDEEMABLE NONCONTROLLING INTEREST
QUARTER AND SIX MONTHS ENDED JUNE 30, 2020 (UNAUDITED)
(in thousands, except per share data)
|
|
|
|
|
|
|
|
|
|
|
|
|
|
|
|
|
|
|
|
|
|
|
|
|
|
|
Accumulated |
|
|
|
|
|
|
|
|
|
|
|
|
|
||
|
|
|
Redeemable |
|
|
|
Common Stock |
|
|
Capital in |
|
|
|
|
|
|
|
|
|
|
Other |
|
|
Total |
|
|
Non- |
|
|
|
|
|
||||||||||
|
|
|
Noncontrolling |
|
|
|
Number |
|
|
Par |
|
|
Excess of |
|
|
Accumulated |
|
|
Accumulated |
|
|
Comprehensive |
|
|
Stockholders' |
|
|
controlling |
|
|
Total |
|
||||||||||
|
|
|
Interest |
|
|
|
of Shares |
|
|
Value |
|
|
Par Value |
|
|
Income |
|
|
Distributions |
|
|
Income (Loss) |
|
|
Equity |
|
|
Interest |
|
|
Equity |
|
||||||||||
|
Balance at March 31, 2020 |
|
$ |
549 |
|
|
|
|
173,960 |
|
|
$ |
1,740 |
|
|
$ |
1,516,926 |
|
|
$ |
125,573 |
|
|
$ |
(749,145 |
) |
|
$ |
(46 |
) |
|
$ |
895,048 |
|
|
$ |
1,276 |
|
|
$ |
896,873 |
|
|
Net income |
|
|
5 |
|
|
|
|
— |
|
|
|
— |
|
|
|
— |
|
|
|
220 |
|
|
|
— |
|
|
|
— |
|
|
|
220 |
|
|
|
21 |
|
|
|
246 |
|
|
Other comprehensive income |
|
|
— |
|
|
|
|
— |
|
|
|
— |
|
|
|
— |
|
|
|
— |
|
|
|
— |
|
|
|
5 |
|
|
|
5 |
|
|
|
— |
|
|
|
5 |
|
|
Distributions to noncontrolling interests |
|
|
(10 |
) |
|
|
|
— |
|
|
|
— |
|
|
|
— |
|
|
|
— |
|
|
|
— |
|
|
|
— |
|
|
|
— |
|
|
|
(55 |
) |
|
|
(65 |
) |
|
Cash distributions declared ($0.05120 per share) |
|
|
— |
|
|
|
|
— |
|
|
|
— |
|
|
|
— |
|
|
|
— |
|
|
|
(8,907 |
) |
|
|
— |
|
|
|
(8,907 |
) |
|
|
— |
|
|
|
(8,907 |
) |
|
Contributions from noncontrolling interests |
|
|
— |
|
|
|
|
— |
|
|
|
— |
|
|
|
— |
|
|
|
— |
|
|
|
— |
|
|
|
— |
|
|
|
— |
|
|
|
75 |
|
|
|
75 |
|
|
Balance at June 30, 2020 |
|
$ |
544 |
|
|
|
|
173,960 |
|
|
$ |
1,740 |
|
|
$ |
1,516,926 |
|
|
$ |
125,793 |
|
|
$ |
(758,052 |
) |
|
$ |
(41 |
) |
|
$ |
886,366 |
|
|
$ |
1,317 |
|
|
$ |
888,227 |
|
|
|
|
|
|
|
|
|
|
|
|
|
|
|
|
|
|
|
|
|
|
|
|
|
|
|
|
|
|
|
|
|
|
|
|
|
|
|
|
|
|
|
|
|
Balance at December 31, 2019 |
|
$ |
558 |
|
|
|
|
173,960 |
|
|
$ |
1,740 |
|
|
$ |
1,516,926 |
|
|
$ |
120,831 |
|
|
$ |
(740,239 |
) |
|
$ |
(36 |
) |
|
$ |
899,222 |
|
|
$ |
1,251 |
|
|
$ |
901,031 |
|
|
Net income |
|
|
16 |
|
|
|
|
— |
|
|
|
— |
|
|
|
— |
|
|
|
4,962 |
|
|
|
— |
|
|
|
— |
|
|
|
4,962 |
|
|
|
46 |
|
|
|
5,024 |
|
|
Other comprehensive loss |
|
|
— |
|
|
|
|
— |
|
|
|
— |
|
|
|
— |
|
|
|
— |
|
|
|
— |
|
|
|
(5 |
) |
|
|
(5 |
) |
|
|
— |
|
|
|
(5 |
) |
|
Distributions to noncontrolling interest |
|
|
(30 |
) |
|
|
|
— |
|
|
|
— |
|
|
|
— |
|
|
|
— |
|
|
|
— |
|
|
|
— |
|
|
|
— |
|
|
|
(55 |
) |
|
|
(85 |
) |
|
Cash distributions declared ($0.1024 per share) |
|
|
— |
|
|
|
|
— |
|
|
|
— |
|
|
|
— |
|
|
|
— |
|
|
|
(17,813 |
) |
|
|
— |
|
|
|
(17,813 |
) |
|
|
— |
|
|
|
(17,813 |
) |
|
Contributions from noncontrolling interests |
|
|
— |
|
|
|
|
— |
|
|
|
— |
|
|
|
— |
|
|
|
— |
|
|
|
— |
|
|
|
— |
|
|
|
— |
|
|
|
75 |
|
|
|
75 |
|
|
Balance at June 30, 2020 |
|
$ |
544 |
|
|
|
|
173,960 |
|
|
$ |
1,740 |
|
|
$ |
1,516,926 |
|
|
$ |
125,793 |
|
|
$ |
(758,052 |
) |
|
$ |
(41 |
) |
|
$ |
886,366 |
|
|
$ |
1,317 |
|
|
$ |
888,227 |
|
See accompanying notes to condensed consolidated financial statements.
5
CNL HEALTHCARE PROPERTIES, INC. AND SUBSIDIARIES
CONDENSED CONSOLIDATED STATEMENTS OF STOCKHOLDERS’ EQUITY AND REDEEMABLE NONCONTROLLING INTEREST
QUARTER AND SIX MONTHS ENDED JUNE 30, 2019 (UNAUDITED)
(in thousands, except per share data)
|
|
|
|
|
|
|
|
|
|
|
|
|
|
|
|
|
|
|
|
|
|
|
|
|
|
|
Accumulated |
|
|
|
|
|
|
|
|
|
|
|
|
|
||
|
|
|
Redeemable |
|
|
|
Common Stock |
|
|
Capital in |
|
|
|
|
|
|
|
|
|
|
Other |
|
|
Total |
|
|
Non- |
|
|
|
|
|
||||||||||
|
|
|
Noncontrolling |
|
|
|
Number |
|
|
Par |
|
|
Excess of |
|
|
Accumulated |
|
|
Accumulated |
|
|
Comprehensive |
|
|
Stockholders' |
|
|
controlling |
|
|
Total |
|
||||||||||
|
|
|
Interest |
|
|
|
of Shares |
|
|
Value |
|
|
Par Value |
|
|
Income (Loss) |
|
|
Distributions |
|
|
Income (Loss) |
|
|
Equity |
|
|
Interest |
|
|
Equity |
|
||||||||||
|
Balance at March 31, 2019 |
|
$ |
574 |
|
|
|
|
173,963 |
|
|
$ |
1,740 |
|
|
$ |
1,516,949 |
|
|
$ |
(220,765 |
) |
|
$ |
(365,593 |
) |
|
$ |
285 |
|
|
$ |
932,616 |
|
|
$ |
1,154 |
|
|
$ |
934,344 |
|
|
Net income |
|
|
13 |
|
|
|
|
— |
|
|
|
— |
|
|
|
— |
|
|
|
328,272 |
|
|
|
— |
|
|
|
— |
|
|
|
328,272 |
|
|
|
242 |
|
|
|
328,527 |
|
|
Other comprehensive loss |
|
|
— |
|
|
|
|
— |
|
|
|
— |
|
|
|
— |
|
|
|
— |
|
|
|
— |
|
|
|
(376 |
) |
|
|
(376 |
) |
|
|
— |
|
|
|
(376 |
) |
|
Distributions to holder of noncontrolling interests |
|
|
— |
|
|
|
|
— |
|
|
|
— |
|
|
|
— |
|
|
|
— |
|
|
|
— |
|
|
|
— |
|
|
|
— |
|
|
|
(530 |
) |
|
|
(530 |
) |
|
Cash distributions declared ($2.0512 per share) |
|
|
— |
|
|
|
|
— |
|
|
|
— |
|
|
|
— |
|
|
|
— |
|
|
|
(356,832 |
) |
|
|
— |
|
|
|
(356,832 |
) |
|
|
— |
|
|
|
(356,832 |
) |
|
Contributions from noncontrolling interests |
|
|
— |
|
|
|
|
— |
|
|
|
— |
|
|
|
— |
|
|
|
— |
|
|
|
— |
|
|
|
— |
|
|
|
— |
|
|
|
531 |
|
|
|
531 |
|
|
Balance at June 30, 2019 |
|
$ |
587 |
|
|
|
|
173,963 |
|
|
$ |
1,740 |
|
|
$ |
1,516,949 |
|
|
$ |
107,507 |
|
|
$ |
(722,425 |
) |
|
$ |
(91 |
) |
|
$ |
903,680 |
|
|
$ |
1,397 |
|
|
$ |
905,664 |
|
|
|
|
|
|
|
|
|
|
|
|
|
|
|
|
|
|
|
|
|
|
|
|
|
|
|
|
|
|
|
|
|
|
|
|
|
|
|
|
|
|
|
|
|
Balance at December 31, 2018 |
|
$ |
579 |
|
|
|
|
173,963 |
|
|
$ |
1,740 |
|
|
$ |
1,516,543 |
|
|
$ |
(233,847 |
) |
|
$ |
(345,347 |
) |
|
$ |
1,177 |
|
|
$ |
940,266 |
|
|
$ |
1,081 |
|
|
$ |
941,926 |
|
|
Adoption of Lease ASU (refer to Note 2) |
|
|
— |
|
|
|
|
— |
|
|
|
— |
|
|
|
— |
|
|
|
3,182 |
|
|
|
— |
|
|
|
— |
|
|
|
3,182 |
|
|
|
— |
|
|
|
3,182 |
|
|
Net income |
|
|
8 |
|
|
|
|
— |
|
|
|
— |
|
|
|
— |
|
|
|
338,172 |
|
|
|
— |
|
|
|
— |
|
|
|
338,172 |
|
|
|
255 |
|
|
|
338,435 |
|
|
Other comprehensive loss |
|
|
— |
|
|
|
|
— |
|
|
|
— |
|
|
|
— |
|
|
|
— |
|
|
|
— |
|
|
|
(1,268 |
) |
|
|
(1,268 |
) |
|
|
— |
|
|
|
(1,268 |
) |
|
Distributions to holders of promoted interest |
|
|
― |
|
|
|
|
— |
|
|
|
— |
|
|
|
406 |
|
|
|
— |
|
|
|
— |
|
|
|
— |
|
|
|
406 |
|
|
|
— |
|
|
|
406 |
|
|
Distributions to holder noncontrolling interest |
|
|
— |
|
|
|
|
— |
|
|
|
— |
|
|
|
— |
|
|
|
— |
|
|
|
— |
|
|
|
— |
|
|
|
— |
|
|
|
(530 |
) |
|
|
(530 |
) |
|
Cash distributions declared ($2.16759 per share) |
|
|
— |
|
|
|
|
— |
|
|
|
— |
|
|
|
— |
|
|
|
— |
|
|
|
(377,078 |
) |
|
|
— |
|
|
|
(377,078 |
) |
|
|
— |
|
|
|
(377,078 |
) |
|
Contributions from noncontrolling interests |
|
|
— |
|
|
|
|
— |
|
|
|
— |
|
|
|
— |
|
|
|
— |
|
|
|
— |
|
|
|
— |
|
|
|
— |
|
|
|
591 |
|
|
|
591 |
|
|
Balance at June 30, 2019 |
|
$ |
587 |
|
|
|
|
173,963 |
|
|
$ |
1,740 |
|
|
$ |
1,516,949 |
|
|
$ |
107,507 |
|
|
$ |
(722,425 |
) |
|
$ |
(91 |
) |
|
$ |
903,680 |
|
|
$ |
1,397 |
|
|
$ |
905,664 |
|
See accompanying notes to condensed consolidated financial statements.
6
CNL HEALTHCARE PROPERTIES, INC. AND SUBSIDIARIES
CONDENSED CONSOLIDATED STATEMENTS OF CASH FLOWS (UNAUDITED)
(in thousands)
|
|
|
Six Months Ended |
|
|||||
|
|
|
June 30, |
|
|||||
|
|
|
2020 |
|
|
2019 |
|
||
|
Operating activities: |
|
|
|
|
|
|
|
|
|
Net cash flows provided by operating activities – continuing operations |
|
$ |
30,792 |
|
|
$ |
23,084 |
|
|
Net cash flows provided by operating activities – discontinued operations |
|
|
1,219 |
|
|
|
13,906 |
|
|
Net cash flows provided by operating activities |
|
|
32,011 |
|
|
|
36,990 |
|
|
Investing activities: |
|
|
|
|
|
|
|
|
|
Proceeds from sale of real estate |
|
|
53,712 |
|
|
|
246 |
|
|
Capital expenditures |
|
|
(3,734 |
) |
|
|
(2,025 |
) |
|
Investment in short term securities |
|
|
(4,997 |
) |
|
― |
|
|
|
Other investing activities |
|
― |
|
|
956 |
|
||
|
Net cash provided by (used in) investing activities – continuing operations |
|
|
44,981 |
|
|
|
(823 |
) |
|
Capital expenditures |
|
― |
|
|
|
(1,674 |
) |
|
|
Proceeds from sale of real estate |
|
|
28,398 |
|
|
|
1,312,479 |
|
|
Other investing activities |
|
― |
|
|
|
(801 |
) |
|
|
Net cash provided by investing activities – discontinued operations |
|
|
28,398 |
|
|
|
1,310,004 |
|
|
Net cash provided by investing activities |
|
|
73,379 |
|
|
|
1,309,181 |
|
|
Financing activities: |
|
|
|
|
|
|
|
|
|
Distributions to stockholders, net of distribution reinvestments |
|
|
(17,813 |
) |
|
|
(377,078 |
) |
|
Draws under credit facilities |
|
|
40,000 |
|
|
|
25,000 |
|
|
Payment of loan costs |
|
|
(40) |
|
|
|
(6,015 |
) |
|
Proceeds from mortgages and other notes payable |
|
― |
|
|
|
178 |
|
|
|
Principal payments on mortgages and other notes payable |
|
|
(26,065 |
) |
|
|
(558,156 |
) |
|
Repayments on credit facilities |
|
― |
|
|
|
(434,125 |
) |
|
|
Other financing activities |
|
|
43 |
|
|
|
(730 |
) |
|
Net cash flows used in by financing activities |
|
|
(3,875 |
) |
|
|
(1,350,926 |
) |
|
Net increase (decrease) in cash and restricted cash |
|
|
101,515 |
|
|
|
(4,755 |
) |
|
Cash and restricted cash at beginning of period, including assets held for sale |
|
|
48,537 |
|
|
|
65,501 |
|
|
Cash and restricted cash at end of period, including assets held for sale |
|
$ |
150,052 |
|
|
$ |
60,746 |
|
See accompanying notes to condensed consolidated financial statements.
7
CNL HEALTHCARE PROPERTIES, INC. AND SUBSIDIARIES
NOTES TO CONDENSED CONSOLIDATED FINANCIAL STATEMENTS
SIX MONTHS ENDED JUNE 30, 2020 (UNAUDITED)
|
1. |
Organization |
CNL Healthcare Properties, Inc. (“Company”) is a Maryland corporation that incorporated on June 8, 2010 and elected to be taxed as a real estate investment trust (“REIT”) for United States (“U.S.”) federal income tax purposes beginning with the year ended December 31, 2012. The Company’s intention is to be organized and operate in a manner that allows it to remain qualified as a REIT for U.S. federal income tax purposes. The Company conducts substantially all of its operations either directly or indirectly through: (1) an operating partnership, CHP Partners, LP (“Operating Partnership”), in which the Company is the sole limited partner and its wholly-owned subsidiary, CHP GP, LLC, is the sole general partner; (2) a wholly-owned taxable REIT subsidiary (“TRS”), CHP TRS Holding, Inc.; (3) property owner and lender subsidiaries, which are single purpose entities; and (4) investments in joint ventures.
The Company is externally managed and advised by CNL Healthcare Corp. (“Advisor”), which is an affiliate of CNL Financial Group, LLC (“Sponsor”). The Sponsor is an affiliate of CNL Financial Group, Inc. (“CNL”). The Advisor is responsible for managing the Company’s day-to-day operations, serving as a consultant in connection with policy decisions to be made by the board of directors, and for identifying, recommending and executing on possible strategic alternatives and dispositions on the Company’s behalf pursuant to an advisory agreement among the Company, the Operating Partnership and the Advisor. Substantially all of the Company’s operating, administrative and certain property management services are, provided by affiliates of the Advisor. In addition, certain property management services are provided by third-party property managers.
On September 30, 2015, the Company completed its public offerings (“Offerings”) having received aggregate subscription proceeds of approximately $1.7 billion. In October 2015, the Company deregistered the unsold shares of its common stock under its previous registration statement on Form S-11, except for 20 million shares that it registered on Form S-3 under the Securities Exchange Act of 1933 with the Securities and Exchange Commission (“SEC”) for the sale of additional shares of common stock through its distribution reinvestment plan (“Reinvestment Plan”). Effective July 11, 2018, the Company suspended both its Reinvestment Plan and its stock redemption plan (“Redemption Plan”).
In 2017, the Company began evaluating possible strategic alternatives to provide liquidity to the Company’s stockholders. In April 2018, the Company’s board of directors formed a special committee consisting solely of its independent directors (“Special Committee”) to consider possible strategic alternatives, including, but not limited to (i) the listing of the Company’s or one of its subsidiaries’ common stock on a national securities exchange, (ii) an orderly disposition of the Company’s assets or one or more of the Company’s asset classes and the distribution of the net sale proceeds thereof to the stockholders of the Company and (iii) a potential business combination or other transaction with a third party or parties that provides the stockholders of the Company with cash and/or securities of a publicly traded company (collectively, among other options, “Possible Strategic Alternatives”). During 2018, the Special Committee engaged HFF Securities L.P. (through June 2019) and KeyBanc Capital Markets Inc. to act as financial advisors to the aforementioned Special Committee. As of December 2018, as part of executing on Possible Strategic Alternatives, the Company had committed to a plan to sell a total of 70 properties including the sale of 63 properties consisting of 53 medical office buildings (“MOBs”), five post-acute care facilities and five acute care hospitals across the US (collectively, the “MOB/Healthcare Portfolio”), a skilled nursing facility in Colorado (“Welbrook Senior Living Grand Junction”) and six skilled nursing facilities in Arkansas (the “Perennial Communities”). During the year ended December 31, 2019, the Company sold 61 of the properties and during the six months ended June 30, 2020, the Company sold seven additional properties. As of June 30, 2020, the Company had two remaining acute care properties classified as held for sale.
8
CNL HEALTHCARE PROPERTIES, INC. AND SUBSIDIARIES
NOTES TO CONDENSED CONSOLIDATED FINANCIAL STATEMENTS
SIX MONTHS ENDED JUNE 30, 2020 (UNAUDITED)
As of June 30, 2020, the Company’s healthcare investment portfolio was geographically diversified with properties in 27 states and consisted of interests in 74 properties, including 71 senior housing communities, one vacant land parcel and two acute care hospitals classified as held for sale. The Company has primarily leased its seniors housing properties to wholly-owned TRS entities and engaged independent third-party managers under management agreements to operate the properties under the REIT Investment Diversification and Empowerment Act of 2007 (“RIDEA”) structures; however, the Company has also leased its properties to third-party tenants under triple-net or similar lease structures, where the tenant bears all or substantially all of the costs (including cost increases, for real estate taxes, utilities, insurance and ordinary repairs). In addition, although most of the Company’s investments are wholly owned, it invested in three properties through partnerships with other entities where it is believed to be appropriate and beneficial.
|
2. |
Summary of Significant Accounting Policies |
Basis of Presentation and Consolidation — The accompanying unaudited condensed consolidated financial statements have been prepared in accordance with the instructions to Form 10-Q and do not include all of the information and note disclosures required by generally accepted accounting principles in the U.S. (“GAAP”). The unaudited condensed consolidated financial statements reflect all normal recurring adjustments, which, in the opinion of management, are necessary for the fair statement of the Company’s results for the interim period presented. Operating results for the six months ended June 30, 2020 may not be indicative of the results that may be expected for the year ending December 31, 2020. Amounts as of December 31, 2019 included in the unaudited condensed consolidated financial statements have been derived from audited consolidated financial statements as of that date but do not include all disclosures required by GAAP. These unaudited condensed consolidated financial statements should be read in conjunction with the audited consolidated financial statements and notes thereto included in the Company’s Annual Report on Form 10-K for the year ended December 31, 2019.
The accompanying unaudited condensed consolidated financial statements include the Company’s accounts, the accounts of wholly owned subsidiaries or subsidiaries for which the Company has a controlling interest, the accounts of two variable interest entities (“VIEs”) in which the Company is the primary beneficiary, and the accounts of other subsidiaries over which the Company has a controlling financial interest. All material intercompany accounts and transactions have been eliminated in consolidation.
Risks and Uncertainties — The recent outbreak of the novel coronavirus (“COVID-19”) pandemic around the globe continues to adversely impact global commercial activity and has contributed to significant volatility in financial markets. The global impact of the outbreak has been rapidly evolving and many countries, including the United States, have reacted by, among other things, instituting quarantines, mandating business and school closures and restricting travel. Such actions are creating significant disruption in global supply chains, and adversely impacting a number of industries.
The major disruption caused by COVID-19 brought to a halt most economic activity in most of the United States resulting in a significant increase in unemployment claims and will likely result in a significant decline in the U.S. Gross Domestic Product. COVID-19 could have a continued and prolonged adverse impact on economic and market conditions and trigger a period of global economic slowdown which could have a material adverse effect on the Company’s results and financial condition.
The full impact of COVID-19 on the financial and credit markets and consequently on the Company’s financial condition and results of operations is uncertain and cannot be predicted at the current time as it depends on several factors beyond the control of the Company including, but not limited to (i) the uncertainty around the severity and duration of the outbreak, (ii) the effectiveness of the United States public health response, (iii) the pandemic’s impact on the U.S. and global economies, (iv) the timing, scope and effectiveness of additional governmental responses to the pandemic and (v) the timing and speed of economic recovery, including the availability of a treatment or vaccination for COVID-19.
9
CNL HEALTHCARE PROPERTIES, INC. AND SUBSIDIARIES
NOTES TO CONDENSED CONSOLIDATED FINANCIAL STATEMENTS
SIX MONTHS ENDED JUNE 30, 2020 (UNAUDITED)
Use of Estimates — The preparation of financial statements in conformity with U.S. GAAP requires management to make estimates and assumptions that affect the reported amounts of assets and liabilities as of the date of the consolidated financial statements, the reported amounts of revenues and expenses during the reporting periods and the disclosure of contingent liabilities. For example, significant assumptions are made in the analysis of real estate impairments, the valuation of contingent assets and liabilities, and the valuation of restricted common stock (“Restricted Stock”) shares issued to the Advisor. The uncertainty surrounding the COVID-19 pandemic may materially impact the accuracy of the estimates and assumptions used in the financial statements and related footnotes and accordingly, actual results could differ from those estimates.
Adopted Accounting Pronouncements — In June 2016, the FASB issued ASU No. 2016-13, “Measurement of Credit Losses on Financial Instruments (Topic 326),” which requires a new forward-looking expected loss model to be used for receivables, held-to-maturity debt, loans and other financial instruments. Previously, when credit losses were measured under current GAAP, an entity generally only considered past events and current conditions in measuring the incurred loss. The amendments eliminate the probable initial threshold for recognition of credit losses in current GAAP and, instead, reflect an entity’s current estimate of all expected credit losses over the life of the financial instrument. The ASU is effective for annual reporting periods, and interim periods within those annual periods, beginning after December 15, 2019. The Company adopted this ASU prospectively on January 1, 2020, the adoption of which did not have a material impact on the Company’s consolidated results of operations.
Impact of Recent Accounting Pronouncements - In Q1 2020, the Financial Accounting Standards Board issued ASU 2020-04, Reference Rate Reform (Topic 848). ASU 2020-04 contains practical expedients for reference rate reform related activities that impact debt, leases, derivatives and other contracts. The guidance in ASU 2020-04 is optional and may be elected over time as reference rate reform activities occur. During the six months ended June 30, 2020, the Company has elected to apply the hedge accounting expedients related to probability and the assessments of effectiveness for future LIBOR-indexed cash flows to assume that the index upon which future hedged transactions will be based matches the index on the corresponding derivatives. Application of these expedients preserves the presentation of derivatives consistent with past presentation. The Company continues to evaluate the impact of the guidance and may apply other elections as applicable as additional changes in the market occur.
In April 2020, the FASB issued a Staff Question-and-Answer (“Q&A”) to clarify whether lease concessions related to the effects of COVID-19 require the application of the lease modification guidance under the new lease standard, which we adopted on January 1, 2019. Under the new leasing standard, an entity would have to determine, on a lease by lease basis, if a lease concession was the result of a new arrangement reached with the tenant, which would be accounted for under the lease modification framework, or if the lease concession was under the enforceable rights and obligations that existed in the original lease, which would be accounted for outside the lease modification framework. The Q&A provides entities with the option to elect to account for lease concessions as though the enforceable rights and obligations existed in the original lease as long as the total cash flows from the modified lease are substantially similar to the cash flows in the original lease. We have elected this option and therefore, to the extent that rent concession is granted as a deferral of payments but total payments are substantially the same, we will account for the concession as if no change has been made to the original lease.
10
CNL HEALTHCARE PROPERTIES, INC. AND SUBSIDIARIES
NOTES TO CONDENSED CONSOLIDATED FINANCIAL STATEMENTS
SIX MONTHS ENDED JUNE 30, 2020 (UNAUDITED)
The following table presents disaggregated revenue related to the Company’s resident fees and services during the six months ended June 30, 2020 and 2019:
|
|
|
Number of Units |
|
Revenues (in millions) |
|
Percentage of Revenues |
||||||||||
|
Resident fees and services: |
|
2020 |
|
2019 |
|
2020 |
|
2019 |
|
2020 |
|
2019 |
||||
|
Independent living |
|
2,261 |
|
2,261 |
|
$ |
37.4 |
|
$ |
37.0 |
|
25.7 |
% |
|
25.8 |
% |
|
Assisted living |
|
2,966 |
|
2,966 |
|
|
72.0 |
|
|
69.6 |
|
49.6 |
% |
|
48.6 |
% |
|
Memory care |
|
853 |
|
853 |
|
|
28.7 |
|
|
29.7 |
|
19.8 |
% |
|
20.8 |
% |
|
Other revenues |
|
― |
|
― |
|
|
7.1 |
|
|
6.9 |
|
4.9 |
% |
|
4.8 |
% |
|
|
|
6,080 |
|
6,080 |
|
$ |
145.2 |
|
$ |
143.2 |
|
100.0 |
% |
|
100.0 |
% |
|
4. |
Real Estate Assets, net |
The gross carrying amount and accumulated depreciation of the Company’s real estate assets as of June 30, 2020 and December 31, 2019 are as follows, excluding assets held for sale (in thousands):
|
|
|
June 30, |
|
|
December 31, |
|
||
|
|
|
2020 |
|
|
2019 |
|
||
|
Land and land improvements |
|
$ |
130,407 |
|
|
$ |
130,371 |
|
|
Building and building improvements |
|
|
1,480,438 |
|
|
|
1,478,111 |
|
|
Furniture, fixtures and equipment |
|
|
87,356 |
|
|
|
85,977 |
|
|
Less: accumulated depreciation |
|
|
(306,664 |
) |
|
|
(281,864 |
) |
|
Real estate investment properties, net |
|
$ |
1,391,537 |
|
|
$ |
1,412,595 |
|
Depreciation expense on the Company’s real estate investment properties, net was approximately $12.4 million and $24.8 million for the quarter and six months ended June 30, 2020, respectively, and approximately $12.2 million and $24.5 million for the quarter and six months ended June 30, 2019, respectively. These amounts include depreciation through the determination date on assets held for sale; refer to Note 6. “Assets and Associated Liabilities Held For Sale and Discontinued Operations” for additional information.
|
5. |
Intangibles, net |
The gross carrying amount and accumulated amortization of the Company’s intangible assets as of June 30, 2020 and December 31, 2019 are as follows (in thousands):
|
|
|
As of |
|
|||||
|
|
|
June 30, |
|
|
December 31, |
|
||
|
|
|
2020 |
|
|
2019 |
|
||
|
In-place lease intangibles |
|
$ |
3,943 |
|
|
$ |
83,113 |
|
|
Less: accumulated amortization |
|
|
(2,920 |
) |
|
|
(81,893 |
) |
|
Intangible assets, net |
|
$ |
1,023 |
|
|
$ |
1,220 |
|
For the quarter and six months ended June 30, 2020 and 2019, amortization on the Company’s intangible assets was approximately $0.1 million and $0.2 million, respectively, all of which were included in depreciation and amortization.
11
CNL HEALTHCARE PROPERTIES, INC. AND SUBSIDIARIES
NOTES TO CONDENSED CONSOLIDATED FINANCIAL STATEMENTS
SIX MONTHS ENDED JUNE 30, 2020 (UNAUDITED)
As part of executing on Possible Strategic Alternatives, during 2018, the Company committed to a plan to sell a total of 70 properties, including: (1) the 63 property MOB/Healthcare Portfolio, (2) the six properties in the Perennial Communities and (3) Welbrook Senior Living Grand Junction. As such, the Company classified the 70 properties as held for sale. The Company believed the sale of the MOB/Healthcare Portfolio would cause a strategic shift in the Company’s operations and therefore classified the operations of those properties as discontinued operations. The sale of the other seven properties would not cause a strategic shift in the Company’s operations and were not considered individually significant; therefore, those properties did not qualify as discontinued operations.
During the year ended December 31, 2019, the Company sold 61 of the properties and as of December 31, 2019, had nine properties classified as held for sale. As of December 31, 2019, the Company had entered into a purchase and sale agreement for its acute care property in New Orleans (the “New Orleans Sale Agreement”) and had entered into a purchase and sale agreement for the Perennial Communities (the “Perennial Sale Agreement”) with unrelated third party buyers. During the six months ended June 30, 2020, the Company sold the seven properties in accordance with the New Orleans Sale Agreement and the Perennial Sale Agreement and recorded gain on sale of $1.1 million for financial reporting purposes. As of June 30, 2020, the Company had two acute care properties remaining from the MOB/Healthcare Portfolio classified as assets held for sale. The two assets held for sale, and the liabilities associated with those assets held for sale, consisted of the following (in thousands):
|
|
|
As of June 30, 2020 |
|
|||||||
|
|
|
MOB/Healthcare Portfolio |
|
Other |
|
Total |
|
|||
|
Real estate investment properties, net |
|
$ |
25,981 |
|
$ |
― |
|
$ |
25,981 |
|
|
Intangibles, net |
|
|
1,583 |
|
|
― |
|
|
1,583 |
|
|
Deferred rent and lease incentives |
|
|
1,813 |
|
|
― |
|
|
1,813 |
|
|
Other assets |
|
|
1,303 |
|
|
― |
|
|
1,303 |
|
|
Restricted cash |
|
|
24 |
|
|
― |
|
|
24 |
|
|
Assets held for sale, net |
|
$ |
30,704 |
|
$ |
― |
|
$ |
30,704 |
|
|
Other liabilities |
|
$ |
504 |
|
$ |
― |
|
$ |
504 |
|
|
Accounts payable and accrued liabilities |
|
|
396 |
|
|
― |
|
|
396 |
|
|
Liabilities associated with assets held for sale |
|
$ |
900 |
|
$ |
― |
|
$ |
900 |
|
As of December 31, 2019, the nine properties classified as assets held for sale, and the liabilities associated with those assets held for sale, consisted of the following (in thousands):
|
|
|
As of December 31, 2019 |
|
|||||||
|
|
|
MOB/Healthcare Portfolio |
|
Other |
|
Total |
|
|||
|
Real estate held for sale, net |
|
$ |
48,366 |
|
$ |
46,908 |
|
$ |
95,274 |
|
|
Intangibles, net |
|
|
6,252 |
|
|
800 |
|
|
7,052 |
|
|
Deferred rent and lease incentives |
|
|
3,158 |
|
|
4,952 |
|
|
8,110 |
|
|
Other assets |
|
|
1,200 |
|
|
68 |
|
|
1,268 |
|
|
Restricted cash |
|
|
118 |
|
|
72 |
|
|
190 |
|
|
Assets held for sale, net |
|
$ |
59,094 |
|
$ |
52,800 |
|
$ |
111,894 |
|
|
Accounts payable and accrued liabilities |
|
$ |
34 |
|
$ |
3 |
|
$ |
37 |
|
|
Other liabilities |
|
|
392 |
|
|
684 |
|
|
1,076 |
|
|
Liabilities associated with assets held for sale |
|
$ |
426 |
|
$ |
687 |
|
$ |
1,113 |
|
|
|
|
|
|
|
|
|
|
|
|
|
12
CNL HEALTHCARE PROPERTIES, INC. AND SUBSIDIARIES
NOTES TO CONDENSED CONSOLIDATED FINANCIAL STATEMENTS
SIX MONTHS ENDED JUNE 30, 2020 (UNAUDITED)
The Company classified the revenues and expenses related to the Company’s MOB/Healthcare Portfolio, which consisted of 63 properties, as discontinued operations in the accompanying condensed consolidated statements of operations, as it believed the sale of these properties represented a strategic shift in the Company’s operations. The following table is a summary of the Company’s income from discontinued operations for the quarter and six months ended June 30, 2020 and 2019 (in thousands):
|
|
|
Quarter Ended |
|
Six Months Ended |
||||||||
|
|
|
June 30, |
|
June 30, |
||||||||
|
|
|
2020 |
|
2019 |
|
2020 |
|
2019 |
||||
|
Revenues: |
|
|
|
|
|
|
|
|
|
|
|
|
|
Rental income and related revenues |
|
$ |
653 |
|
$ |
14,997 |
|
$ |
1,625 |
|
$ |
44,593 |
|
Operating expenses: |
|
|
|
|
|
|
|
|
|
|
|
|
|
Property operating expenses |
|
|
338 |
|
|
4,192 |
|
|
344 |
|
|
11,054 |
|
General and administrative expenses |
|
|
33 |
|
|
256 |
|
|
205 |
|
|
549 |
|
Asset management fees |
|
|
99 |
|
|
1,508 |
|
|
237 |
|
|
4,504 |
|
Property management fees |
|
|
8 |
|
|
482 |
|
|
16 |
|
|
1,240 |
|
Total operating expenses |
|
|
478 |
|
|
6,438 |
|
|
802 |
|
|
17,347 |
|
Gain on sale of real estate |
|
|
― |
|
|
331,663 |
|
|
― |
|
|
331,663 |
|
Operating income |
|
|
175 |
|
|
340,222 |
|
|
823 |
|
|
358,909 |
|
Other income (expense): |
|
|
|
|
|
|
|
|
|
|
|
|
|
Interest and other income |
|
|
― |
|
|
2 |
|
|
7 |
|
|
11 |
|
Interest expense and loan cost amortization(1)(2) |
|
|
― |
|
|
(6,629) |
|
|
― |
|
|
(14,831) |
|
Total other income (expense) |
|
|
― |
|
|
(6,627) |
|
|
7 |
|
|
(14,820) |
|
Income before income taxes |
|
|
175 |
|
|
333,595 |
|
|
830 |
|
|
344,089 |
|
Income tax expense |
|
|
(5) |
|
|
(225) |
|
|
(8) |
|
|
(245) |
|
Income from discontinued operations |
|
$ |
170 |
|
$ |
333,370 |
|
$ |
822 |
|
$ |
343,844 |
FOOTNOTES:
|
(1) |
Interest expense and loan cost amortization directly relates to either: (1) expense on mortgages and other notes payable collateralized by properties classified as discontinued operations; or (2) expense on the Company’s credit facilities that is allocated based on the value of the properties, which are classified as discontinued operations and included in the credit facilities’ unencumbered pool of assets, and the related indebtedness is required to be repaid upon sale of the properties. |
|
(2) |
In connection the IRF Sale and the MOB Sale, the Company wrote off approximately $3.3 million in unamortized loan costs as a loss on the early extinguishment of debt, which is included in interest expense and loan cost amortization herein for the quarter and six months ended June 30, 2019. |
13
CNL HEALTHCARE PROPERTIES, INC. AND SUBSIDIARIES
NOTES TO CONDENSED CONSOLIDATED FINANCIAL STATEMENTS
SIX MONTHS ENDED JUNE 30, 2020 (UNAUDITED)
As of June 30, 2020 and December 31, 2019, the Company had two subsidiaries classified as VIEs. These subsidiaries are joint ventures with completed real estate under development in which their equity interest consists of non-substantive protective voting rights. Additionally, one of the subsidiaries has insufficient equity at risk due to the development nature of the joint venture. The Company determined it is the primary beneficiary and holds a controlling financial interest in each of these subsidiaries due to its power to direct the activities that most significantly impact the economic performance of the entities, as well as its obligation to absorb the losses and its right to receive benefits from these entities that could potentially be significant to these entities. As such, the transactions and accounts of these VIEs are included in the accompanying consolidated financial statements. The Company’s maximum exposure to loss as a result of its involvement with these VIEs is limited to its net investment in these entities which totaled approximately $13.5 million as of June 30, 2020. The Company’s exposure is limited because of the non-recourse nature of the borrowings of the VIEs.
|
8. |
Indebtedness |
During the six months ended June 30, 2020, the Company repaid the Primrose II Communities outstanding mortgage loan balance of approximately $20.5 million, which was scheduled to mature in June 2020. In addition, in April 2020, the Company borrowed $40 million under its Revolving Credit Facility as a precautionary measure to increase liquidity and preserve financial flexibility in light of COVID-19.
The following table provides the details of the fair market value and carrying value of the Company’s indebtedness as of June 30, 2020 and December 31, 2019 (in millions):
|
|
|
June 30, 2020 |
|
December 31, 2019 |
||||||||
|
|
|
Fair Value |
|
Carrying Value |
|
Fair Value |
|
Carrying Value |
||||
|
Mortgages and other notes payable, net |
|
$ |
354.9 |
|
$ |
350.2 |
|
$ |
381.2 |
|
$ |
375.9 |
|
Credit facilities |
|
$ |
345.0 |
|
$ |
343.2 |
|
$ |
305.0 |
|
$ |
303.0 |
These fair market values are based on current rates and spreads the Company would expect to obtain for similar borrowings. Since this methodology includes inputs that are less observable by the public and are not necessarily reflected in active markets, the measurement of the estimated fair values related to the Company’s mortgage notes payable is categorized as Level 3 on the three-level valuation hierarchy. The estimated fair value of accounts payable and accrued liabilities approximates the carrying value as of June 30, 2020 and December 31, 2019 because of the relatively short maturities of the obligations.
All of the Company’s mortgage loans contain customary financial covenants and ratios, including (but not limited to) debt service coverage ratio, minimum occupancy levels, limitations on incurrence of additional indebtedness, etc.
The credit facilities contain affirmative, negative, and financial covenants which are customary for loans of this type, including (but not limited to): (i) maximum leverage, (ii) minimum fixed charge coverage ratio, (iii) minimum consolidated net worth, (iv) restrictions on payments of cash distributions except if required by REIT requirements, (v) maximum secured indebtedness, (vi) maximum secured recourse debt, (vii) minimum unsecured interest coverage, (viii) maximum unsecured indebtedness ratio, and (ix) limitations on certain types of investments and with respect to the pool of properties supporting borrowings under the credit facilities, minimum weighted average occupancy, and remaining lease terms, as well as property type, MSA, operator, and asset value concentration limits. The limitations on distributions generally include a limitation on the extent of allowable distributions, which are not to exceed the greater of 95% of adjusted FFO (as defined per the credit facilities) and the minimum amount of distributions required to maintain the Company’s REIT status. As of June 30, 2020, the Company was in compliance with all financial covenants.
14
CNL HEALTHCARE PROPERTIES, INC. AND SUBSIDIARIES
NOTES TO CONDENSED CONSOLIDATED FINANCIAL STATEMENTS
SIX MONTHS ENDED JUNE 30, 2020 (UNAUDITED)
During the quarter and six months ended June 30, 2020, the Company paid approximately $0.07 million and $0.14 million, respectively, of cash distributions on restricted stock issued through March 2017 pursuant to the Advisor expense support agreement. During the quarter and six months ended June 30, 2019, the Company paid approximately $2.7 million and $2.9 million, respectively, of cash distributions on restricted stock issued pursuant to the Advisor expense support agreement, which included a special cash distribution in May 2019 funded with sales proceeds from the sale of real estate. These amounts have been recognized as compensation expense and included in general and administrative expenses in the accompanying condensed consolidated statements of operations.
In May 2020, the Company’s board of directors approved the renewal of its advisory agreement with the Advisor through June 2021. The expenses and fees incurred by and reimbursable to the Company’s related parties, including amounts included in income from discontinued operations, for the quarter and six months ended June 30, 2020 and 2019, and related amounts unpaid as of June 30, 2020 and December 31, 2019 are as follows (in thousands):
|
|
|
Quarter Ended |
|
|
Six Months Ended |
|
|
Unpaid amounts as of (1) |
|
|||||||||||||||
|
|
|
June 30, |
|
|
June 30, |
|
|
June 30, |
|
|
December 31, |
|
||||||||||||
|
|
|
2020 |
|
|
2019 |
|
|
2020 |
|
|
2019 |
|
|
2020 |
|
|
2019 |
|
||||||
|
Reimbursable expenses: |
|
|
|
|
|
|
|
|
|
|
|
|
|
|
|
|
|
|
|
|
|
|
|
|
|
Operating expenses (2) |
|
$ |
1,062 |
|
|
$ |
1,472 |
|
|
$ |
1,730 |
|
|
$ |
2,739 |
|
|
$ |
243 |
|
|
$ |
698 |
|
|
|
|
|
1,062 |
|
|
|
1,472 |
|
|
|
1,730 |
|
|
|
2,739 |
|
|
243 |
|
|
698 |
|
||
|
|
|
|
|
|
|
|
|
|
|
|
|
|
|
|
|
|
|
|
|
|
|
|
|
|
|
Disposition fee (3) |
|
― |
|
|
|
2,957 |
|
|
143 |
|
|
|
2,957 |
|
|
― |
|
|
― |
|
||||
|
Financing coordination fees (4) |
|
― |
|
|
|
5,150 |
|
|
― |
|
|
|
5,351 |
|
|
― |
|
|
― |
|
||||
|
Asset management fees |
|
|
4,513 |
|
|
|
6,088 |
|
|
|
9,163 |
|
|
|
13,685 |
|
|
|
1,504 |
|
|
|
1,577 |
|
|
|
|
$ |
5,575 |
|
|
$ |
15,667 |
|
|
$ |
11,036 |
|
|
$ |
24,732 |
|
|
$ |
1,747 |
|
|
$ |
2,275 |
|
FOOTNOTES:
|
(1) |
Amounts are recorded as due to related parties in the accompanying condensed consolidated balance sheets. |
|
(2) |
Amounts are recorded as general and administrative expenses in the accompanying condensed consolidated statements of operations unless such amounts represent prepaid expenses, which are capitalized in the accompanying condensed consolidated balance sheets. |
|
(3) |
Amounts are recorded as a reduction to gain on sale of real estate in the accompanying condensed consolidated statements of operations. |
|
(4) |
There were no financing coordination fees for the quarter and six months ended June 30, 2020. For the quarter and six months ended June 30, 2019, Company incurred financing coordination fees of approximately $5.2 million and $5.4 million, respectively, primarily related to the 2019 Credit Facilities of which approximately $3.3 million and $3.5 million were capitalized in the accompanying condensed consolidated balance sheets. |
|
10. |
Equity |
Stockholders’ Equity:
Distributions — During the quarter and six months ended June 30, 2020, the Company declared cash distributions of approximately $8.9 million and $17.8 million, respectively. During the quarter and six months ended June 30, 2019, the Company declared cash distributions of approximately $356.8 million and $377.1 million, respectively, which included a special cash distribution of $347.9 million funded in May 2019 with proceeds from the sale of real estate.
15
CNL HEALTHCARE PROPERTIES, INC. AND SUBSIDIARIES
NOTES TO CONDENSED CONSOLIDATED FINANCIAL STATEMENTS
SIX MONTHS ENDED JUNE 30, 2020 (UNAUDITED)
The accompanying condensed consolidated financial statements include an interim tax provision for the quarter and six months ended June 30, 2020 and 2019. The Company recorded a total provision for income taxes of approximately $0.8 million and $1.3 million for the quarter and six months ended June 30, 2020, respectively, and $0.5 million and $1.2 million for the quarter and six months ended June 30, 2019, respectively. Of the total provision for income taxes for the quarter and six months ended June 30, 2020, approximately $0.2 million and $0.3 million, respectively, represents current income tax expense, and approximately $0.6 million and $1.0 million, respectively, represents a decrease to the Company’s net deferred tax assets which is primarily due to the utilization of a portion of the Company’s TRS’s federal and state net operating loss carry-forwards. Of the total provision for income taxes for the quarter and six months ended June 30, 2019, approximately $0.2 million and $0.3 million, respectively, represented current income tax expense, and approximately $0.3 million and $0.9 million, respectively, represented a decrease to the Company’s net deferred tax assets which is primarily due to the utilization of a portion of the Company’s TRS’s federal and state net operating loss carry-forwards.
On March 27, 2020, the Coronavirus Aid, Relief, and Economic Security Act (the “CARES Act”) was enacted into law. Although the CARES Act contains many income tax relief provisions, they are not estimated to have a material impact on the Company. As required under U.S. GAAP, the effects of tax law changes are recognized in the period of enactment.
|
12. |
Commitments and Contingencies |
From time to time, the Company may be a party to legal proceedings in the ordinary course of, or incidental to the normal course of, its business, including proceedings to enforce its contractual or statutory rights. While the Company cannot predict the outcome of these legal proceedings with certainty, based upon currently available information, the Company does not believe the final outcome of any pending or threatened legal proceeding will have a material adverse effect on its results of operations or financial condition.
As a result of the Company’s completed seniors housing developments continuing to move towards or achieving stabilization, the Company monitors the lease-up of these properties to determine whether the established performance metrics have been met as of each reporting period. The Company has six remaining promoted interest agreements with third-party developers pursuant to which certain operating targets have been established that, upon meeting such targets, result in the developer being entitled to additional payments based on enumerated percentages of the assumed net proceeds of a deemed sale, subject to achievement of an established internal rate of return on the Company’s investment in the development. As of June 30, 2020, one property had met its established performance metrics, but no promoted interest obligation was currently owed pursuant to the distribution calculation. For the remaining five promoted interest agreements, the established performance metrics were not met nor probable of being met as of June 30, 2020.
The Company’s Advisor has approximately 1.3 million contingently issuable Restricted Stock shares for financial reporting purposes that were issued pursuant to the Advisor expense support agreement. Refer to Note 9. “Related Party Arrangements” for information on distributions declared related to these Restricted Stock shares.
In March 2020, the World Health Organization declared the outbreak of COVID-19 as a pandemic. The COVID-19 pandemic has had a significant effect on global markets, supply chains, businesses and communities. It has impacted various parts of the Company’s operations and financial results, including but not limited to, loss of revenue from reductions in occupancy levels and the incurrence of additional costs for emergency preparedness, disease control and containment and additional labor costs of healthcare personnel.
16
CNL HEALTHCARE PROPERTIES, INC. AND SUBSIDIARIES
NOTES TO CONDENSED CONSOLIDATED FINANCIAL STATEMENTS
SIX MONTHS ENDED JUNE 30, 2020 (UNAUDITED)
The Company remains focused on maintaining a strong balance sheet, liquidity and financial flexibility and continues to monitor developments as it deals with the disruptions and uncertainties from a business and financial perspective relating to COVID-19. However, the full impact of COVID-19 is unknown and cannot be reasonably estimated. The ultimate extent of the impact of COVID-19 on the financial performance of the Company will depend on future developments, which are highly uncertain and cannot be predicted with confidence, including the scope, severity and duration of the outbreak of the pandemic, the actions taken to contain the pandemic or mitigate its impact, and the direct and indirect economic effects of the pandemic and containment measures, among others.
17
Caution Concerning Forward-Looking Statements
Statements contained under “Management’s Discussion and Analysis of Financial Condition and Results of Operations” and elsewhere in this Quarterly Report on Form 10-Q for the quarter and six months ended June 30, 2020 that are not statements of historical or current fact may constitute “forward-looking statements” within the meaning of the Federal Private Securities Litigation Reform Act of 1995. The Company intends that such forward-looking statements be subject to the safe harbor created by Section 21E of the Securities Exchange Act of 1934, as amended (the “Exchange Act”). Forward-looking statements are statements that do not relate strictly to historical or current facts, but reflect management’s current understandings, intentions, beliefs, plans, expectations, assumptions and/or predictions regarding the future of the Company’s business and its performance, the economy, and other future conditions and forecasts of future events and circumstances. Forward-looking statements are typically identified by words such as “believes,” “expects,” “anticipates,” “intends,” “estimates,” “plans,” “continues,” “pro forma,” “may,” “will,” “seeks,” “should,” and “could” and words and terms of similar substance in connection with discussions of future operating or financial performance, business strategy and portfolios, projected growth prospects, cash flows, costs and financing needs, legal proceedings, amount and timing of anticipated future distributions, estimated net asset value per share of the Company’s common stock, and/or other matters. The Company’s forward-looking statements are not guarantees of future performance. While the Company’s management believes its forward-looking statements are reasonable, such statements are inherently susceptible to uncertainty and changes in circumstances. As with any projection or forecast, forward-looking statements are necessarily dependent on assumptions, data and/or methods that may be incorrect or imprecise, and may not be realized. The Company’s forward-looking statements are based on management’s current expectations and a variety of risks, uncertainties and other factors, many of which are beyond the Company’s ability to control or accurately predict. Although the Company believes that the expectations reflected in such forward-looking statements are based upon reasonable assumptions, the Company’s actual results could differ materially from those set forth in the forward-looking statements due to a variety of risks, uncertainties and other factors.
Important factors that could cause the Company's actual results to vary materially from those expressed or implied in its forward-looking statements include, but are not limited to government regulation, economic, strategic, political and social conditions and the following:
|
|
• |
the severity and duration of the COVID-19 pandemic; |
|
|
• |
actions that may be taken by governmental authorities to contain the COVID-19 outbreak or to treat its impact; |
|
|
• |
the impact of the COVID-19 pandemic and health and safety measures taken to slow its spread; |
|
|
• |
a worsening economic environment in the U.S. or globally, including financial market fluctuations; |
|
|
• |
risks associated with the Company’s investment strategy, including its concentration in the healthcare sector; |
|
|
• |
the illiquidity of an investment in the Company’s stock; |
|
|
• |
liquidation at less than the subscription price of the Company’s stock; |
|
|
• |
the impact of regulations requiring periodic valuation of the Company on a per share basis, including the uncertainties inherent in such valuations and that the amount that a stockholder would ultimately realize upon liquidation may vary significantly from the Company’s estimated net asset value; |
|
|
• |
risks associated with real estate markets, including declining real estate values; |
|
|
• |
risks associated with reliance on the Company’s advisor and its affiliates, including conflicts of interest; |
|
|
• |
the Company’s failure to obtain, renew or extend necessary financing or to access the debt or equity markets; |
|
|
• |
the use of debt to finance the Company’s business activities, including refinancing and interest rate risk and the Company’s failure to comply with debt covenants; |
|
|
• |
failure to successfully manage growth or integrate acquired properties and operations; |
18
|
|
• |
the Company’s inability to make necessary improvements to properties on a timely or cost-efficient basis; |
|
|
• |
competition for properties and/or tenants; defaults on or non-renewal of leases by tenants; |
|
|
• |
failure to lease properties on favorable terms or at all; |
|
|
• |
the impact of current and future environmental, zoning and other governmental regulations affecting the Company’s properties; |
|
|
• |
the impact of changes in accounting rules; |
|
|
• |
inaccuracies of the Company’s accounting estimates; |
|
|
• |
unknown liabilities of acquired properties or liabilities caused by property managers or operators; |
|
|
• |
material adverse actions or omissions by any joint venture partners; |
|
|
• |
consequences of the Company’s net operating losses; |
|
|
• |
increases in operating costs and other expenses; |
|
|
• |
uninsured losses or losses in excess of the Company’s insurance coverage; |
|
|
• |
the impact of outstanding and/or potential litigation; |
|
|
• |
risks associated with the Company’s tax structuring; |
|
|
• |
failure to qualify for and maintain the Company’s qualification as a REIT for federal income tax purposes; and |
|
|
• |
the Company’s inability to protect its intellectual property and the value of its brand. |
Given these uncertainties, the Company cautions you not to place undue reliance on forward-looking information.
For further information regarding risks and uncertainties associated with the Company’s business and other important factors that could cause the Company’s actual results to vary materially from those expressed or implied in its forward-looking statements, please refer to the factors listed and described in the Company’s reports filed from time to time with the SEC, including, but not limited to, the Company’s quarterly reports on Form 10-Q and the Company’s annual reports on Form 10-K, copies of which may be obtained from the Company’s website at www.cnlhealthcareproperties.com. One of the most significant factors is the ongoing and potential impact of the current outbreak of the COVID-19 pandemic on the economy and the broader financial markets, which may have a significant negative impact on the Company's financial condition, results of operations and cash flows. The Company is unable to predict whether the continuing effects of the COVID-19 pandemic will trigger a further economic slowdown or a recession and to what extent the Company will experience disruptions related to the COVID-19 pandemic during the remainder of 2020 or thereafter.
All written and oral forward-looking statements attributable to the Company or persons acting on its behalf are qualified in their entirety by this cautionary note. Forward-looking statements speak only as of the date on which they are made, and the Company undertakes no obligation to, and expressly disclaims any obligation to, publicly release the results of any revisions to its forward-looking statements to reflect new information, changed assumptions, the occurrence of unanticipated subsequent events or circumstances, or changes to future operating results over time, except as otherwise required by law.
Introduction
The following discussion is based on the condensed consolidated financial statements as of June 30, 2020 (unaudited) and December 31, 2019. Amounts as of December 31, 2019 included in the unaudited condensed consolidated balance sheets have been derived from the audited consolidated financial statements as of that date. This information should be read in conjunction with the accompanying unaudited condensed consolidated balance sheets and the notes thereto, as well as the audited consolidated financial statements, notes and management’s discussion and analysis included in our Annual Report on Form 10-K for the year ended December 31, 2019.
19
CNL Healthcare Properties, Inc. is a Maryland corporation that incorporated on June 8, 2010. We elected to be taxed as a REIT for U.S. federal income tax purposes beginning with the year ended December 31, 2012 and our intention is to be organized and operate in a manner that allows us to remain qualified as a REIT for federal income tax purposes. The terms “us,” “we,” “our,” “Company” and “CNL Healthcare Properties” include CNL Healthcare Properties, Inc. and each of its subsidiaries.
Substantially all of our assets are held by, and all operations are conducted, either directly or indirectly, through: (1) the Operating Partnership in which we are the sole limited partner and our wholly owned subsidiary, CHP GP, LLC, is the sole general partner; (2) a wholly owned TRS, CHP TRS Holding, Inc.; (3) property owner subsidiaries and lender subsidiaries, which are single purpose entities; and (4) investments in joint ventures.
We are externally managed and advised by CNL Healthcare Corp. (the “Advisor”). Our Advisor has responsibility for our day-to-day operations, serving as our consultant in connection with policy decisions to be made by our board of directors, and for identifying, recommending and executing on Possible Strategic Alternatives (as described below under “Possible Strategic Alternatives”), and dispositions on our behalf pursuant to an advisory agreement. In May 2020, we extended the advisory agreement with our Advisor through June 2021. For additional information on our Advisor, its affiliates or other related parties, as well as the fees and reimbursements we pay, see Note 9. “Related Party Arrangements.”
On September 30, 2015, we completed our Offerings having received aggregate subscription proceeds of approximately $1.7 billion. In October 2015, we deregistered the unsold shares of our common stock under our previous registration statement on Form S-11, except for 20 million shares that we registered on Form S-3 under the Securities Exchange Act of 1933 with the SEC for the sale of additional shares of common stock through our Reinvestment Plan. As part of moving forward with the consideration of Possible Strategic Alternatives, effective July 11, 2018 we suspended our Reinvestment Plan and stockholders who were participants in our Reinvestment Plan now receive cash distributions instead of additional shares of our common stock.
COVID-19
In March 2020, the World Health Organization declared the outbreak of COVID-19 as a pandemic which has resulted in significant effects on global markets, supply chains, businesses and communities. The outbreak of the COVID-19 pandemic around the globe continues to adversely impact global commercial activity and has contributed to significant volatility in financial markets. The global impact of the outbreak has been rapidly evolving and many countries, including the United States, have reacted by, among other things, instituting quarantines, mandating business and school closures and restricting travel. Such actions are creating significant disruption in global supply chains, and adversely impacting a number of industries.
The major disruption caused by COVID-19 brought to a halt most economic activity in most of the United States resulting in a significant increase in unemployment claims and will likely result in a significant decline in the U.S. Gross Domestic Product. COVID-19 could have a continued and prolonged adverse impact on economic and market conditions and trigger a period of global economic slowdown which could have a material adverse effect on our Company’s results and financial condition.
The full impact of COVID-19 on the financial and credit markets and consequently on our business, financial condition and results of operations is uncertain and cannot be predicted at the current time as it depends on several factors beyond our control including, but not limited to (i) the uncertainty around the severity and duration of the outbreak, (ii) the effectiveness of the United States public health response, (iii) the pandemic’s impact on the U.S. and global economies, (iv) the timing, scope and effectiveness of additional governmental responses to the pandemic and (v) the timing and speed of economic recovery, including the availability of a treatment or vaccination for COVID-19.
20
Since March 13, 2020, there have been a number of federal, state and local government initiatives to manage the spread of the virus and its impact on the economy, financial markets and continuity of businesses of all sizes and industries. For example, on March 27, 2020, the current administration signed into law the CARES Act, an approximately $2 trillion stimulus package responding to the economic harms of COVID-19. The CARES Act, among other things, provides certain measures to support individuals and businesses in maintaining solvency through monetary relief, which includes a form of financing and loan forgiveness/forbearance. In addition, the current administration has indicated that it may sign additional legislation relating to the COVID-19 pandemic. It is currently unclear how or if any future legislation would impact or benefit us, but we continue to analyze the relevant legislative and regulatory developments and the potential impact they may have on our business, results of operations, financial condition and liquidity.
The Advisor began its contingency and process planning for the potential pandemic and transitioned swiftly to a remote working environment in early March for all the personnel that support our Company’s operations in advance of the issuance of stay at home orders from state and local governmental agencies. In March, we proactively increased our engagement with our property managers and our communities. Even though we already had influenza protocols at each of our seniors housing communities, we immediately enhanced the influenza protocols to incorporate new guidelines issued by the CDC to address the increased exposure from COVID-19.
As of June 30, 2020, our healthcare investment portfolio consisted of interests in 74 properties, comprising 71 senior housing communities, one vacant land parcel and two acute care hospitals classified as held for sale. Of our 71 senior housing communities, we owned 15 properties leased to third party tenants under triple-net leases (“NNN”), and the remaining 56 properties were managed through third party operators, including five senior housing communities owned through our unconsolidated joint venture. While March average occupancy was not materially impacted, occupancy began to decline starting in the second half of March. Occupancy continued to trend lower during the second quarter as a result of move in restrictions, intensified screening and other measures enacted at our communities to address the spread of COVID-19. However, the rate at which occupancy declined trended lower during the quarter with each month having a lower rate, as compared to each previous month in the quarter. Nonetheless, we expect to continue to experience a negative impact in occupancy rates during the COVID-19 pandemic. Starting in the last half of March, we began incurring unanticipated COVID-19 related operating expenses, including higher labor costs, costs to obtain personal protective equipment and other costs related to disease control and containment. We expect to continue incurring higher operating expenses during the COVID-19 pandemic.
Our 71 seniors housing communities are located throughout the United States in 26 states with a population of nearly 7,000 residents and approximately 5,700 community-level staff. As of August 13, 2020, as reported by our senior housing operators and tenants, we had 122 active, confirmed positive cases among our residents and staff members in 25 of our communities located in 12 states. The number of confirmed cases in our senior housing communities may continue to increase depending on the duration, scope and depth of the COVID-19 pandemic as well as the timing and extent of ceasing stay at home and other social distancing restrictions from state and local governmental agencies.
As described below in “Liquidity and Capital Resources”, as of June 30, 2020, we had approximately $143.9 million in cash and cash equivalents, which included net sales proceeds of approximately $82.1 million from the sale of seven properties during the six months ended June 30, 2020, net sales proceeds from the sale of two properties during the last half of 2019 and $40 million under our Revolving Credit Facility that we borrowed in April 2020 as a precautionary measure to increase liquidity and preserve financial flexibility in light of COVID-19. As of June 30, 2020, we had approximately $125.0 million of availability under our Revolving Credit Facility. The majority of our cash and cash equivalents are invested in short-term highly liquid investments. We remain focused on maintaining liquidity and financial flexibility and continue to monitor developments as we deal with the disruptions and uncertainties from a business and financial perspective relating to COVID-19.
We granted a three-month rent payment deferral of approximately $2 million to one of our senior housing tenants relating to eight properties for the periods May, June and July. We did not provide any rent concessions to this tenant and repayment of the deferred amounts will be collected over twelve monthly installments beginning in January 2021. Deferred amounts related to this tenant were $1.3 million as of June 30, 2020. We deferred an additional $0.7 million in July in accordance with the three-month payment deferral agreement and in early August, collected 100% of the August rents in accordance with their lease agreements. As of August 13, 2020, we had collected 100% of all rental amounts due through August 2020 in accordance with the lease terms for the remaining seven properties leased under NNN leases to third party seniors housing tenants.
21
We believe we are taking appropriate actions to manage through the COVID-19 pandemic. As described above, we began to see a reduction in our operating results in the last half of March which has continued through the date of this filing. However, the full impact of COVID-19 is unknown and cannot be reasonably estimated. The ultimate extent of the impact of COVID-19 on the financial performance of our Company will depend on future developments, including the duration and spread of COVID-19 and its effects on the overall economy, all of which are highly uncertain and cannot be predicted.
Possible Strategic Alternatives
In 2017, we began evaluating possible strategic alternatives to provide liquidity to the Company’s stockholders. In April 2018, our board of directors formed a special committee consisting solely of our independent directors (“Special Committee”) to consider possible strategic alternatives, including, but not limited to (i) the listing of the Company’s or one of its subsidiaries’ common stock on a national securities exchange, (ii) an orderly disposition of the Company’s assets or one or more of the Company’s asset classes and the distribution of the net sale proceeds thereof to the stockholders of the Company and (iii) a potential business combination or other transaction with a third-party or parties that provides the stockholders of the Company with cash and/or securities of a publicly traded company (collectively, among other options, “Possible Strategic Alternatives”). During 2018, the Special Committee engaged HFF Securities L.P. (through June 2019) and KeyBanc Capital Markets Inc. to act as financial advisors in connection with exploring our Possible Strategic Alternatives.
In connection with our consideration of the Possible Strategic Alternatives, our board of directors suspended both our Reinvestment Plan and our Redemption Plan effective July 11, 2018. As part of executing on Possible Strategic Alternatives, in September 2018, our board of directors committed to a plan to sell the MOB/Healthcare Portfolio, a portfolio of 63 properties consisting of 53 MOBs, five post-acute care facilities and five acute care hospitals across the US. In December 2018, we also committed to a plan to sell our Welbrook Senior Living Grand Junction property, our skilled nursing facility in Grand Junction, Colorado. We had also previously committed to a plan to sell our six skilled nursing facilities in Arkansas. As of December 31, 2018, we had a total of 70 properties classified as held for sale and had classified the operations of the 63 properties in the MOB/Healthcare Portfolio as discontinued operations because the sale of these properties represented a strategic shift in our operations.
In April 2019, we completed the sale of four post-acute care properties (“IRF Sale”) to an unrelated third party. In May 2019, we completed the sale of 55 medical office buildings and related properties (“MOB Sale”), to a subsidiary of Welltower Inc. and received approximately $1,321.2 million in net sales proceeds. Both the IRF Sale and the MOB Sale were in furtherance of our efforts to sell the MOB/Healthcare Portfolio. We used the net sales proceeds to: (1) repay indebtedness secured by or allocated to the 59 properties comprising the MOB Sale and the IRF Sale; (2) strategically rebalance other corporate borrowings; (3) make a special cash distribution of $347.9 million ($2.00 per share) to our stockholders and (4) for other corporate purposes. Additionally, as a result of the IRF Sale and the MOB Sale, our board of directors adjusted our regular quarterly cash distribution to an amount equal to $0.0512 per share, compared to $0.1164 per share that had been in effect since the third quarter of 2017. The adjustment to our regular cash distributions was the result of a reduction in our remaining earnings base and operating cash flows given the associated impact of the sale of real estate on our operating cash flows. In June 2019 subsequent to the consummation of the MOB Sale, we terminated our engagement of HFF Securities L.P., one of the financial advisors to our Special Committee in connection with exploring Possible Strategic Alternatives, subject to a 12-month tail of certain fees and obligations under the terminated engagement letter, which expired in June 2020. During the last half of 2019, we sold one acute care hospital from the MOB/Healthcare Portfolio plus the Welbrook Senior Living Grand Junction property to unrelated third parties and received net sales proceeds of $39.0 million. As of December 31, 2019, we had nine properties classified as held for sale.
22
In December 2019, we entered into a purchase and sale agreement for the sale of our six skilled nursing facilities in Arkansas (the “Perennial Communities Sale Agreement”) with an unrelated third party for a gross sales price of $55.0 million, subject to certain pro-rations and other adjustments, as described in the Perennial Communities Sale Agreement. In addition, in December 2019, we entered into a purchase and sale agreement with an unrelated third party for our acute care hospital in New Orleans (the “New Orleans Sale Agreement”) for a gross sales price of $28.65 million. We recorded an impairment provision of $0.1 million related to the property in New Orleans to write-off the associated assets in excess of the estimated net sales proceeds, as it was determined that the carrying value of this property would not be recoverable. During the six months ended June 30, 2020, we sold the property related to the New Orleans Sale Agreement and the six properties related to the Perennial Communities Sale Agreement, respectively. During 2020, as market conditions permit in light of COVID-19, we will continue executing on our plan to sell the remaining two properties that we had classified as held for sale as of June 30, 2020.
Portfolio Overview
As of June 30, 2020, our healthcare investment portfolio consisted of interests in 74 properties, comprising 71 senior housing communities, one vacant land parcel and two acute care hospitals classified as held for sale. Of our properties held as of June 30, 2020, five of our 71 seniors housing properties were owned through an unconsolidated joint venture. During 2020, as market conditions permit in light of the market disruptions from COVID-19, we intend to continue executing on our plan to sell the two remaining properties classified as held for sale.
We believe demographic trends and compelling supply and demand indicators presented a strong case for an investment focus on healthcare real estate and real estate-related assets. Including our two acute care properties classified as held for sale, our remaining healthcare investment portfolio is geographically diversified with properties in 27 states. The map below shows our remaining healthcare investment portfolio across geographic regions as of August 13, 2020:
|
|
|
|
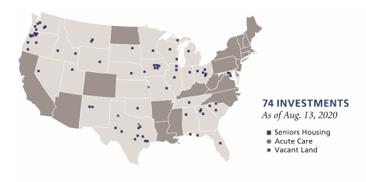
23
The following table summarizes our remaining healthcare investment portfolio by asset class and investment structure as of August 13, 2020:
|
Type of Investment |
|
Number of Investments |
|
|
Amount of Investments (in millions) |
|
|
Percentage of Total Investments |
|
|||
|
Consolidated investments: |
|
|
|
|
|
|
|
|
|
|
|
|
|
Seniors housing leased (1) |
|
|
15 |
|
|
$ |
311.0 |
|
|
|
17.2 |
% |
|
Seniors housing managed (2) |
|
|
51 |
|
|
|
1,427.8 |
|
|
|
78.9 |
% |
|
Seniors housing unimproved land |
|
|
1 |
|
|
|
1.1 |
|
|
|
0.1 |
% |
|
Acute care leased (1) (3) |
|
|
2 |
|
|
|
39.5 |
|
|
|
2.1 |
% |
|
Unconsolidated investments: |
|
|
|
|
|
|
|
|
|
|
|
|
|
Seniors housing managed (4) |
|
|
5 |
|
|
|
31.1 |
|
|
|
1.7 |
% |
|
|
|
|
74 |
|
|
$ |
1,810.5 |
|
|
|
100.0 |
% |
FOOTNOTES:
|
(1) |
Properties that are leased to third-party tenants for which we report rental income and related revenues. |
|
(2) |
Properties that are leased to TRS entities and managed pursuant to third-party management contracts (i.e. RIDEA structure) where we report resident fees and services, and the corresponding property operating expenses. |
|
(3) |
Properties held for sale as of June 30, 2020. |
|
(4) |
Properties that are owned through an unconsolidated joint venture and are leased to TRS entities and managed pursuant to third-party management contracts (i.e. RIDEA structure). The joint venture is accounted for using the equity method. |
Seniors Housing Portfolio Evaluation
While we are not directly impacted by the performance of the underlying properties leased to third-party tenants, we believe that the financial and operational performance of our tenants provides an indication about the stability of our tenants and their ability to pay rent. To the extent that our tenants, managers or joint venture partners experience operating difficulties and become unable to generate sufficient cash to make rent payments to us, there could be a material adverse impact on our consolidated results of operations, liquidity and/or financial condition. Our tenants and managers are generally contractually required to provide this information to us in accordance with their respective lease, management and/or joint venture agreements. Therefore, in order to mitigate the aforementioned risk, we monitor our investments through a variety of methods determined by the type of property.
We monitor the performance of our tenants and third-party operators to stay abreast of any material changes in the operations of the underlying properties by (1) reviewing the current, historical and prospective operating margins (measured by a tenant’s earnings before interest, taxes, depreciation, amortization and facility rent), (2) monitoring trends in the source of our tenants’ revenue, including the relative mix of public payors (including Medicare, Medicaid, etc.) and private payors (including commercial insurance and private pay patients), (3) evaluating the effect of evolving healthcare legislation and other regulations on our tenants’ profitability and liquidity, and (4) reviewing the competition and demographics of the local and surrounding areas in which the tenants operate. As described above under COVID-19, we provided a $2 million three-month payment deferral to one of our tenants for May, June and July 2020, of which $1.3 million related to the quarter and six months ended June 30, 2020. We did not provide any rent concessions. Repayment of the deferred amounts are scheduled to be collected over twelve monthly installments beginning in January 2021. We are proactively working closely with our tenants and third-party operators to monitor the impact from COVID-19 on the operations of our seniors housing communities.
We monitor the credit of our tenants to stay abreast of any material changes in quality. We monitor tenant credit quality by (1) reviewing financial statements that are publicly available or that are required to be delivered to us under the applicable lease, (2) direct interaction with onsite property managers, (3) monitoring news and rating agency reports regarding our tenants (or their parent companies) and their underlying businesses, (4) monitoring the timeliness of rent collections and (5) monitoring lease coverage.
24
When evaluating the performance of our senior housing portfolio, management reviews occupancy levels and monthly revenue per occupied unit, which we define as total revenue divided by average number of occupied units or beds and is considered a performance metric within these asset classes. Similarly, when evaluating the performance of our third-party operators, management reviews monthly financial statements, property-level operating performance versus budgeted expectations, conducts periodic operational review calls with operators and conducts periodic property inspections or site visits. All of the aforementioned operating and statistical metrics assist us in determining the ability of our properties or operators to achieve market rental rates, to assess the overall performance of our diversified healthcare portfolio, and to review compliance with leases, debt, licensure, real estate taxes, and other collateral.
Significant Seniors Housing Tenants and Operators
Our real estate portfolio is operated by a mix of national or regional operators and the following represent the significant tenants and operators that lease or manage 5% or more of our rentable space as of June 30, 2020, excluding the two properties comprising our MOB/Healthcare Portfolio which were classified as discontinued operations:
|
Tenants |
|
Number of Properties |
|
|
Rentable Square Feet (in thousands) |
|
|
Percentage of Rentable Square Feet |
|
|
Lease Expiration Year |
|||
|
TSMM Management, LLC(1) |
|
|
13 |
|
|
|
1,261 |
|
|
|
77.5 |
% |
|
2022-2025 |
|
Wellmore, LLC |
|
|
2 |
|
|
|
366 |
|
|
|
22.5 |
% |
|
2026-2027 |
|
|
|
|
15 |
|
|
|
1,627 |
|
|
|
100.0 |
% |
|
|
FOOTNOTES:
|
(1) |
We granted a three-month payment deferral (May – July 2020) relating to eight properties under this tenant. |
|
Operators |
|
Number of Properties |
|
|
Rentable Square Feet (in thousands) |
|
|
Percentage of Rentable Square Feet |
|
|
Operator Expiration Year |
|
||||
|
Integrated Senior Living, LLC |
|
|
7 |
|
|
|
1,948 |
|
|
|
31.1 |
% |
|
2021-2024 |
|
|
|
Prestige Senior Living, LLC |
|
|
13 |
|
|
|
895 |
|
|
|
14.3 |
% |
|
2023-2024 |
|
|
|
Morningstar Senior Management, LLC |
|
|
4 |
|
|
|
834 |
|
|
|
13.3 |
% |
|
|
2023 |
|
|
SLH Austin Manager, LLC |
|
|
3 |
|
|
|
431 |
|
|
|
6.9 |
% |
|
|
2021 |
|
|
Parc Communities, LLC |
|
|
2 |
|
|
|
385 |
|
|
|
6.2 |
% |
|
|
2023 |
|
|
Harborchase Retirement, LLC |
|
|
4 |
|
|
|
380 |
|
|
|
6.1 |
% |
|
2023-2029 |
|
|
|
Other operators (1) |
|
|
18 |
|
|
|
1,382 |
|
|
|
22.1 |
% |
|
2020-2027 |
|
|
|
|
|
|
51 |
|
|
|
6,255 |
|
|
|
100.0 |
% |
|
|
|
|
FOOTNOTES:
|
(1) |
Comprised of various tenants or operators each of which comprise less than 5% of our consolidated rentable square footage. |
Seniors Housing Tenant Lease Expirations
As of June 30, 2020, excluding the two properties classified as discontinued operations and the five properties owned through an unconsolidated investment, we owned 66 seniors housing properties. During the six months ended June 30, 2020, our rental income from continuing operations represented approximately 8.2% of our total revenues from continuing operations.
Under the terms of our triple-net lease agreements, each tenant is responsible for payment of property taxes, general liability insurance, utilities, repairs and maintenance, including structural and roof expenses. Each tenant is expected to pay real estate taxes directly to the taxing authorities. However, if the tenant does not pay the real estate taxes, we would be liable.
25
Our asset management team collaborates with existing tenants to understand their current and anticipated space needs in advance of their lease term renewal date. As of June 30, 2020, none of our rental income from continuing operations was scheduled to expire until 2022. Therefore, we do not expect lease turnover to have a significant impact on our cash flows from operations in the near term. We work with and begin lease-related negotiations well in advance of the lease expirations or renewal period options in order for us to maintain a balanced lease rollover schedule and high occupancy levels, as well as to enhance the value of our properties through extended lease terms. Lease extensions are likely to create an obligation to pay lease commissions, lease incentives and/or tenant improvements and may also provide our tenants with some periods of reduced and/or “free rent.” Certain amendments or modifications to the terms of existing leases could require lender approval.
The following table lists, on an aggregate basis, scheduled expirations for the remainder of 2020, each of the next nine years and thereafter on our consolidated healthcare investment portfolio, excluding the two properties classified as discontinued operations, assuming that none of the tenants exercise any of their renewal options (in thousands, except for number of tenants and percentages) as of June 30, 2020:
|
Year of Expiration (1) |
|
|
Number of Tenants |
|
|
Expiring Leased Square Feet |
|
|
Expiring Annualized Base Rents (2) |
|
|
Percentage of Expiring Annual Base Rents |
|
|||||
|
|
2020 |
|
|
|
― |
|
|
|
― |
|
|
$ |
― |
|
|
|
― |
|
|
|
2021 |
|
|
|
― |
|
|
|
― |
|
|
|
― |
|
|
|
― |
|
|
|
2022 |
|
|
|
5 |
|
|
|
518 |
|
|
|
8,397 |
|
|
|
30.0 |
% |
|
|
2023 |
|
|
|
— |
|
|
|
— |
|
|
|
— |
|
|
|
— |
|
|
|
2024 |
|
|
|
— |
|
|
|
— |
|
|
― |
|
|
― |
|
||
|
|
2025 |
|
|
|
8 |
|
|
|
743 |
|
|
|
11,778 |
|
|
|
42.2 |
% |
|
|
2026 |
|
|
|
1 |
|
|
|
137 |
|
|
|
3,296 |
|
|
|
11.8 |
% |
|
|
2027 |
|
|
|
1 |
|
|
|
229 |
|
|
|
4,467 |
|
|
|
16.0 |
% |
|
|
2028 |
|
|
|
— |
|
|
|
— |
|
|
― |
|
|
― |
|
||
|
|
2029 |
|
|
|
— |
|
|
|
— |
|
|
|
— |
|
|
|
— |
|
|
Thereafter |
|
|
|
— |
|
|
|
— |
|
|
|
— |
|
|
|
— |
|
|
|
Total |
|
|
|
15 |
|
|
|
1,627 |
|
|
$ |
27,938 |
|
|
|
100.0 |
% |
|
|
|
|
|
|
|
|
|
|
|
|
|
|
|
|
|
|
|
|
|
|
Weighted Average Remaining Lease Term: (3) |
|
|
4.6 years |
|
|
|
|
|
||||||||||
FOOTNOTES:
|
(1) |
Represents current lease expiration and does not take into consideration lease renewals available under existing leases at the option of the tenants. |
|
(2) |
Represents the current base rent, excluding tenant reimbursements and the impact of future rent bumps included in leases, multiplied by 12 and included in the year of expiration. |
|
(3) |
Weighted average remaining lease term is the average remaining term weighted by annualized current base rents. |
Liquidity and Capital Resources
General
Our ongoing primary sources of capital include proceeds from collateralized or uncollateralized financings from banks or other lenders, other assets and undistributed operating cash flows, and as part of executing on Possible Strategic Alternatives as described above under “Possible Strategic Alternatives,” proceeds from the sales of real estate. Our primary use of capital includes the payment of distributions, payment of operating expenses, funding capital improvements to existing properties and payment of debt service. Our ongoing sources and uses of capital will be impacted by the COVID-19 pandemic as described above in “COVID-19”. As necessary, we may use financings or other sources of capital in the event of unforeseen significant capital expenditures or to cover periodic shortfalls between distributions paid and cash flows from operating activities.
26
As of June 30, 2020, we had approximately $268.9 million of liquidity (consisting of approximately $143.9 million in cash and cash equivalents on hand and approximately $125.0 million of undrawn availability under our Revolving Credit Facility) with only approximately $13.6 million of debt obligations coming due during the remainder of 2020. We remain focused on maintaining liquidity and financial flexibility and continue to monitor developments as we deal with the disruptions and uncertainties from a business and financial perspective relating to COVID-19. However, the full impact of COVID-19 is unknown and cannot be reasonably estimated. The ultimate extent of the impact of COVID-19 on the financial performance of our Company will depend on future developments, which are highly uncertain and cannot be predicted with confidence, including the scope, severity and duration of the outbreak of the pandemic, the actions taken to contain the pandemic or mitigate its impact, and the direct and indirect economic effects of the pandemic and containment measures, among others.
We have pledged our properties in connection with our borrowings and may continue to strategically leverage our real estate and use debt financing as a means of providing additional funds for the payment of distributions to stockholders, working capital and for other corporate purposes. Our ability to increase our borrowings could be adversely affected by credit market conditions, including the COVID-19 pandemic, which could result in lenders reducing or limiting funds available for loans, including loans collateralized by real estate. We may also be negatively impacted by rising interest rates on our unhedged variable rate debt or the timing of when we seek to refinance existing debt. In addition, we continue to evaluate the need for additional interest rate protection in the form of interest rate swaps or caps on unhedged variable rate debt.
Our cash flows from operating and investing activities as described within “Sources of Liquidity and Capital Resources” and “Uses of Liquidity and Capital Resources” represent cash flows from continuing operations and exclude the results from the 63 properties from our MOB/Healthcare Portfolio classified as discontinued operations, of which 61 were sold subsequent to June 30, 2019 and of which two properties were classified as held for sale as of June 30, 2020.
Sources of Liquidity and Capital Resources
Proceeds from Sale of Real Estate – Continuing Operations
During the six months ended June 30, 2020, we closed on the sale of six properties under the Perennial Communities Sales Agreement and received net sales proceeds of $53.7 million. We retained the net sales proceeds for corporate purposes as we are focused on maintaining a strong balance sheet, liquidity and financial flexibility given the uncertainty relating to COVID-19. In June 2019 we sold a small parcel of vacant land at our Brookridge Heights Assisted Living & Memory Care property and received net sales proceeds of approximately $0.2 million.
Proceeds from Sale of Real Estate – Discontinued Operations
As part of executing under our Possible Strategic Alternatives, during the six months ended June 30, 2020, we closed on the sale of our property under the New Orleans Sale Agreement and received net sales proceeds of $28.4 million. We retained these net sales proceeds, along with the net sales proceeds received from the sale of an acute-care property during the last half of 2019, for corporate purposes as we are focused on maintaining a strong balance sheet, liquidity and financial flexibility given the uncertainty relating to COVID-19. During the six months ended June 30, 2019, as part of executing under our Possible Strategic Alternatives, we sold 59 of the 63 properties in our MOB/Healthcare Portfolio and received net sales proceeds of approximately $1,321.5 million, which were used to: (1) repay indebtedness secured by the properties sold; (2) rebalance other corporate borrowings (3) make a special cash distribution to the Company’s stockholders and (4) for other corporate purposes.
Borrowings
On an ongoing basis, we monitor our debt maturities, engage in dialogue with third-party lenders about various financing scenarios and analyze our overall portfolio borrowings in advance of scheduled maturity dates of the debt obligations to determine the optimal borrowing strategy. During the six months ended June 30, 2019, we borrowed proceeds of approximately $25.2 million. In May 2019, as part of executing under our Possible Strategic Alternatives, we completed the sale of 55 properties and in conjunction therewith, refinanced our Credit Facilities (including the payment of amounts outstanding under our Credit Facilities as described further in “Uses of Liquidity and Capital Resources – Debt Repayments”) and entered into new financings, which were comprised of a 2019 Revolving Line of Credit Facility of approximately $250 million and a 2019 Term Loan Facility of approximately $265 million (collectively, the “2019 Credit Facilities”).
27
In April 2020, we borrowed $40 million from our 2019 Credit Facilities as a precautionary measure to increase liquidity and preserve financial flexibility in light of COVID-19. We have borrowed money and intend to continue borrowing money, to fund other enhancements to our portfolio, as well as to cover periodic shortfalls between distributions paid and cash flows from operating activities, to the extent impacted by the disruption and uncertainties from COVID-19. Our principal demand for funds is expected to be for the payment of debt service on our outstanding indebtedness and the payment of distributions. Generally, we expect to meet short-term working capital needs from our cash flows from operations.
The aggregate amount of long-term financing is not expected to exceed 60% of our gross asset values (as defined in our Credit Facilities) on an annual basis. As of June 30, 2020 and December 31, 2019, we had an aggregate debt leverage ratio of approximately 35.7% and 35.5%, respectively, of the aggregate carrying value of our assets. As described above under “Possible Strategic Alternatives,” during 2019 and through the six months ended June 30, 2020, we sold 68 of the 70 properties we had classified as held for sale, used a portion of the 2019 net sales proceeds to pay off indebtedness related to those properties and to pay down a portion of the amounts outstanding on our mortgages and notes payable and our Credit Facilities. We retained a portion of the net sales proceeds to maintain liquidity and a strong balance sheet in light of COVID-19. Refer to “Uses of Liquidity and Capital Resources – Debt Repayments” for additional information.
Net Cash Provided by Operating Activities – Continuing Operations
We experienced positive cash flow from operating activities for the six months ended June 30, 2020 and 2019 of approximately $30.8 million and $23.1 million, respectively. The increase in cash flows from operating activities for the six months ended June 30, 2020 as compared to the same period in 2019 was primarily the result of the following:
|
|
• |
a decrease in general and administrative expenses which were primarily attributable to the decrease in expenses related to the execution of Possible Strategic Alternatives, |
|
|
• |
lower interest expense resulting from the refinancing of our 2014 Credit Facilities in May 2019, as well as our decision to use proceeds from the sale of real estate to strategically pay down debt secured by other properties, partially offset by; |
|
|
• |
a decrease in rental income from the sale of the Perennial Communities in March 2020; and |
|
|
• |
a decline in property net operating income (“NOI”) related to our seniors housing properties due to the COVID-19 pandemic, caused by lower occupancy revenues and incurring COVID-19 related operating expenses, including higher labor costs, costs to obtain personal protective equipment and other costs related to disease control and containment. |
Uses of Liquidity and Capital Resources
Capital Expenditures
We paid approximately $3.7 million and $2.0 million in capital expenditures during the six months ended June 30, 2020 and 2019, respectively.
Debt Repayments
During the six months ended June 30, 2020, we paid approximately $26.1 million of debt obligations, which included approximately $20.5 million of debt obligations that were scheduled to mature in June 2020 and $5.6 million of scheduled repayments on our mortgages and other notes payable. During the six months ended June 30, 2019, we paid approximately $992.3 million of total repayments, which was comprised of approximately $457.3 million of repayments in connection with indebtedness secured by the 59 properties that were part of the IRF Sale and the MOB Sale, approximately $83.7 million of indebtedness secured by other properties that we strategically paid down using net sales proceeds received in connection with the IRF Sale and MOB Sale, approximately $434.1 million in repayments related to the refinancing of our 2014 Credit Facilities, and approximately $17.2 million in scheduled repayments on our mortgages and other notes payable. In connection with the refinancing of our 2014 Credit Facilities, we paid approximately $7.6 million in lender fees and other loan-related costs.
28
As of June 30, 2020, we have approximately $8.1 million of debt obligations coming due in October 2020 relating to one of our consolidated VIEs. We are working with our joint venture partner and our lender and are evaluating refinancing opportunities, including the repayment of the debt upon maturity in October 2020.
Distributions
In order to qualify as a REIT, we are required to make distributions, other than capital gain distributions, to our stockholders each year in the amount of at least 90% of our taxable income. We may make distributions in the form of cash or other property, including distributions of our own securities. While we generally expect to pay distributions from cash flows provided by operating activities, we have and may continue to cover periodic shortfalls between distributions paid and cash flows from operating activities with proceeds from other sources; such as from cash flows provided by financing activities (“Other Sources”), a component of which could include borrowings, whether collateralized by our properties or unsecured, or net sales proceeds from the sale of real estate. We will continue to monitor the extent of the impact of the disruptions from the COVID-19 pandemic on our cash flows from operations in determining the level of distributions going forward.
As part of executing our Possible Strategic Alternatives, in May 2019 we used a portion of the net sales proceeds received from the MOB Sale to pay a special cash distribution. Our board of directors declared a special cash distribution of $2.00 per share to the holders of record of our common stock, for an aggregate total distribution of approximately $347.9 million. Additionally, as a result of the sales of these properties, our board of directors adjusted our regular quarterly cash distribution to an amount equal to $0.0512 per share compared to $0.1164 per share in effect since the third quarter of 2017. The adjustment to our regular cash distributions was the result of a reduction in our remaining earnings base and operating cash flows given the associated impact of the sale of real estate on our operating cash flows. No amounts distributed to stockholders during the quarter and six months ended June 30, 2020 and 2019 were required to be or have been treated as a return of capital for purposes of calculating the stockholders’ return on their invested capital as described in the advisory agreement.
The following table represents total cash distributions declared and cash distributions per share for quarter and six months ended June 30, 2020 and 2019 (in thousands, except per share data):
|
Periods |
|
Cash Distributions per Share |
|
|
Total Cash Distributions Declared (1) |
|
|
Cash Flows Provided by Operating Activities (2) |
|
|||
|
2020 Quarters |
|
|
|
|
|
|
|
|
|
|
|
|
|
First |
|
$ |
0.05120 |
|
|
$ |
8,906 |
|
|
$ |
17,860 |
|
|
Second |
|
|
0.05120 |
|
|
|
8,907 |
|
|
|
14,151 |
|
|
Total |
|
$ |
0.10240 |
|
|
$ |
17,813 |
|
|
$ |
32,011 |
|
|
|
|
|
|
|
|
|
|
|
|
|
|
|
|
2019 Quarters |
|
|
|
|
|
|
|
|
|
|
|
|
|
First |
|
$ |
0.11639 |
|
|
$ |
20,246 |
|
|
$ |
26,155 |
|
|
Second(3) |
|
|
2.05120 |
|
|
|
356,832 |
|
|
|
10,835 |
|
|
Total |
|
$ |
2.16759 |
|
|
$ |
377,078 |
|
|
$ |
36,990 |
|
FOOTNOTES:
|
(1) |
For the six months ended June 30, 2020 and 2019, our net income attributable to common stockholders was approximately $5.0 million and $338.2 million, respectively, while cash distributions declared were approximately $17.8 million and $377.1 million, respectively, of which approximately $347.9 million for the six months ended June 30, 2019 represented special cash distributions that were considered to be funded with proceeds from the sale of real estate. For the six months ended June 30, 2020 and 2019, 100% of cash distributions declared to stockholders were considered to be funded with cash provided by operating activities as calculated on a quarterly basis for GAAP purposes. |
|
(2) |
Amounts herein include cash flows from discontinued operations. Cash flows from operating activities calculated in accordance with GAAP are not necessarily indicative of the amount of cash available to pay distributions and as such our board of directors uses other measures such as FFO and MFFO in order to evaluate the level of distributions. |
|
(3) |
As a result of the MOB Sale, our board of directors adjusted our regular quarterly cash distributions to an amount equal to $0.0512 per share, compared to $0.1164 per share in effect since the third quarter of 2017. |
29
Except for the impact from the COVID-19 pandemic as described above in “COVID-19”, we are not aware of other material trends or uncertainties, favorable or unfavorable, that may be reasonably anticipated to have a material impact on either capital resources or the revenues or income to be derived from the operation of properties, other than those referred to in the risk factors identified in “Part II, Item 1A” of this report and the “Risk Factors” section of our Annual Report.
The following discussion and analysis should be read in conjunction with the accompanying unaudited condensed consolidated financial statements and the notes thereto.
Quarter and six months ended June 30, 2020 as compared to the quarter and six months ended June 30, 2019
As of June 30, 2020, excluding properties classified as discontinued operations, unconsolidated investments and unimproved land, we owned 66 consolidated operating investment properties.
|
|
|
Investment count as of |
|
|||||
|
|
|
June 30, |
|
|||||
|
Consolidated operating investment types: |
|
2020 |
|
|
2019 |
|
||
|
Seniors housing leased |
|
|
15 |
|
|
|
15 |
|
|
Seniors housing managed |
|
|
51 |
|
|
|
51 |
|
|
Post-acute care leased |
|
|
— |
|
|
|
7 |
|
|
|
|
|
66 |
|
|
|
73 |
|
Rental Income and Related Revenues. Rental income and related revenues were approximately $6.4 million and $14.2 million for the quarter and six months ended June 30, 2020, respectively, as compared to approximately $8.3 million and $17.2 million for the quarter and six months ended June 30, 2019, respectively. This decrease was primarily due to sale of the Grand Junction property in December 2019 and the six skilled nursing facilities located in Arkansas (“Perennial Communities”)
Resident Fees and Services. Resident fees and services income were approximately $71.6 million and $145.2 million for the quarter and six months ended June 30, 2020, respectively, as compared to approximately $71.9 million and $143.2 million for the quarter and six months ended June 30, 2019, respectively. As described above in “Liquidity and Capital Resources - COVID-19”, average occupancy trended lower starting in the second half of March and continued to decline further during the quarter ended June 30, 2020 as a result of move in restrictions, intensified screening and other measures enacted at our communities to address the spread of COVID-19. As a result of the disruptions and uncertainty from COVID-19, we expect to experience reduced occupancy levels and resident fees and services during the remainder of 2020 as compared to levels experienced during 2019.
Property Operating Expenses. Property operating expenses were approximately $48.6 million and $96.8 million for the quarter and six months ended June 30, 2020, respectively, as compared to approximately $46.6 million and $92.6 million for the quarter and six months ended June 30, 2019, respectively. The increase in property operating expenses is primarily a result of increases in COVID-19 related expenses. We expect property operating expenses to continue at higher levels during the remainder of 2020 as compared to 2019 due to incurring additional costs for emergency preparedness, disease control and containment, and labor costs of healthcare personnel as a result of COVID-19.
General and Administrative Expenses. General and administrative expenses were approximately $2.6 million and $4.7 million for the quarter and six months ended June 30, 2020, respectively, as compared to approximately $5.2 million and $8.2 million for the quarter and six months ended June 30, 2019, respectively. General and administrative expenses during the quarter and six months ended June 30, 2019 included additional expenses related to the execution of Possible Strategic Alternatives and also included stock compensation expense incurred related to the special cash distribution declared in May 2019 on restricted stock issued pursuant to the Advisor expense support agreement. No such expenses were incurred during the quarter and six months ended June 30, 2020.
30
Asset Management Fees. We incurred asset management fees of approximately $4.4 million and $8.9 million for the quarter and six months ended June 30, 2020, respectively, as compared to approximately $4.6 million and $9.2 million for the quarter and six months ended June 30, 2019, respectively. Monthly asset management fees equal to 0.08334% of invested assets are paid to our Advisor for the management of our real estate assets, including our pro rata share of investments in unconsolidated entities, loans and other permitted investments.
Property Management Fees. We incurred property management fees of approximately $3.3 million and $6.9 million for the quarter and six months ended June 30, 2020, respectively, payable to our third-party property managers, as compared to approximately $3.4 million and $6.9 million payable to both our third-party property managers as well as our Property Manager, an affiliate of our Advisor for the quarter and six months ended June 30, 2019, respectively.
Financing Coordination Fees. No financing coordination fees were incurred during the quarter and six months ended June 30, 2020. We incurred financing coordination fees primarily related to the refinancing of our credit facilities of approximately $5.2 million and $5.4 million, of which approximately $3.3 million and $3.5 million, respectively, were capitalized in the accompanying condensed consolidated balance sheets for the quarter and six months ended June 30, 2019.
Depreciation and Amortization. Depreciation and amortization expenses were approximately $12.5 million and $25.0 million for the quarter and six months ended June 30, 2020, respectively, as compared to approximately $12.3 million and $24.7 million for the quarter and six months ended June 30, 2019, respectively. Depreciation and amortization expenses are comprised of depreciation and amortization of the buildings, equipment, land improvements and in-place leases related to our real estate portfolio.
Gain on Sale of Real Estate. Gain on sale of real estate was approximately $1.1 million for the six months ended June 30, 2020, as compared to $0.2 million for the quarter and six months ended June 30, 2019. In March 2020, we sold the Perennial Communities and in June 2019 we sold a small parcel of vacant land at our Brookridge Heights Assisted Living & Memory Care property.
Interest Expense and Loan Cost Amortization. Interest expense and loan cost amortization were approximately $6.1 million and $13.2 million for the quarter and six months ended June 30, 2020, respectively, as compared to approximately $11.4 million and $22.6 million for the quarter and six months ended June 30, 2019, respectively. The decrease in interest expense and loan cost amortization was primarily the result of the repayment of approximately $1.1 billion of indebtedness from the refinancing of our credit facilities and the strategic repayment of other property related indebtedness using net sales proceeds from the sales of properties during the quarter and six months ended June 30, 2019.
Income from Discontinued Operations. As discussed above under “Possible Strategic Alternatives,” we classified the revenues and expenses related to our MOB/Healthcare Portfolio, which consisted of 63 properties, as discontinued operations because we believed the sale of these properties would cause a strategic shift in our operations. We had income from discontinued operations of approximately $0.2 million and $0.8 million for the quarter and six months ended June 30, 2020, respectively, related to three properties, as compared to approximately $333.4 million and $343.8 million for the quarter and six months ended June 30, 2019 related to 63 properties, respectively. Income from discontinued operations included gain on sale of approximately $331.6 million during the quarter and six months ended June 30, 2019 from the sale of 59 properties within our MOB/Healthcare Portfolio during April and May 2019. Refer to Note 6. “Assets and Associated Liabilities Held For Sale and Discontinued Operations” for additional information.
Net Operating Income
We generally expect to meet future cash needs for general and administrative expenses, debt service and distributions from NOI. We define NOI, a non-GAAP measure, as total revenues less the property operating expenses and property management fees from managed properties. We use NOI as a key performance metric for internal monitoring and planning purposes, including the preparation of annual operating budgets and monthly operating reviews, as well as to facilitate analysis of future investment and business decisions. It does not represent cash flows from operating activities in accordance with GAAP and should not be considered to be an alternative to net income loss (determined in accordance with GAAP) as an indication of our operating performance or to be an alternative to cash flows from operating activities (determined in accordance with GAAP) as a measure of our liquidity. We believe the presentation
31
of this non-GAAP measure is important to the understanding of our operating results for the periods presented because it is an indicator of the return on property investment and provides a method of comparing property performance over time. In addition, we have aggregated NOI on a “same-store” basis only for comparable properties that we have owned during the entirety of all periods presented. Non-same-store NOI represents NOI from a property that was sold in December 2019 and six properties that were sold in March 2020. The chart below presents a reconciliation of net income to NOI for the quarter and six months ended June 30, 2020 and 2019 (in thousands) and the amount invested in properties as of June 30, 2020 and 2019 (in millions), excluding the two properties classified as discontinued operations:
|
|
|
Quarter Ended |
|
|
|
|
|
|
|
|
|
|
Six Months Ended |
|
|
|
|
|
|
|
|
|
||||||||||
|
|
|
June 30, |
|
|
Change |
|
|
June 30, |
|
|
Change |
|
||||||||||||||||||||
|
|
|
2020 |
|
|
2019 |
|
|
$ |
|
|
% |
|
|
2020 |
|
|
2019 |
|
|
$ |
|
|
% |
|
||||||||
|
Net income |
|
$ |
246 |
|
|
$ |
328,527 |
|
|
|
|
|
|
|
|
|
|
$ |
5,024 |
|
|
$ |
338,435 |
|
|
|
|
|
|
|
|
|
|
Adjusted to exclude: |
|
|
|
|
|
|
|
|
|
|
|
|
|
|
|
|
|
|
|
|
|
|
|
|
|
|
|
|
|
|
|
|
|
General and administrative expenses |
|
|
2,592 |
|
|
|
5,225 |
|
|
|
|
|
|
|
|
|
|
|
4,685 |
|
|
|
8,184 |
|
|
|
|
|
|
|
|
|
|
Asset management fees |
|
|
4,415 |
|
|
|
4,589 |
|
|
|
|
|
|
|
|
|
|
|
8,927 |
|
|
|
9,182 |
|
|
|
|
|
|
|
|
|
|
Financing coordination fees |
|
|
— |
|
|
|
1,878 |
|
|
|
|
|
|
|
|
|
|
|
— |
|
|
|
1,878 |
|
|
|
|
|
|
|
|
|
|
Depreciation and amortization |
|
|
12,454 |
|
|
|
12,347 |
|
|
|
|
|
|
|
|
|
|
|
24,998 |
|
|
|
24,681 |
|
|
|
|
|
|
|
|
|
|
Gain on sale of real estate |
|
|
— |
|
|
|
(228 |
) |
|
|
|
|
|
|
|
|
|
|
(1,074 |
) |
|
|
(228 |
) |
|
|
|
|
|
|
|
|
|
Other expenses, net of other income |
|
|
5,807 |
|
|
|
10,668 |
|
|
|
|
|
|
|
|
|
|
|
12,653 |
|
|
|
21,408 |
|
|
|
|
|
|
|
|
|
|
Income tax expense |
|
|
764 |
|
|
|
533 |
|
|
|
|
|
|
|
|
|
|
|
1,317 |
|
|
|
1,188 |
|
|
|
|
|
|
|
|
|
|
Income from discontinued operations |
|
|
(170 |
) |
|
|
(333,370 |
) |
|
|
|
|
|
|
|
|
|
|
(822 |
) |
|
|
(343,844 |
) |
|
|
|
|
|
|
|
|
|
NOI |
|
|
26,108 |
|
|
|
30,169 |
|
|
$ |
(4,061 |
) |
|
|
(13.5 |
)% |
|
|
55,708 |
|
|
|
60,884 |
|
|
$ |
(5,176 |
) |
|
|
(8.5 |
)% |
|
Less: Non-same-store NOI |
|
|
— |
|
|
|
(1,317 |
) |
|
|
|
|
|
|
|
|
|
|
(986 |
) |
|
|
(3,426 |
) |
|
|
|
|
|
|
|
|
|
Same-store NOI |
|
$ |
26,108 |
|
|
$ |
28,852 |
|
|
$ |
(2,744 |
) |
|
|
(9.5 |
)% |
|
$ |
54,722 |
|
|
$ |
57,458 |
|
|
$ |
(2,736 |
) |
|
|
(4.8 |
)% |
|
Invested in operating properties, end of period (in millions) |
|
$ |
1,498 |
|
|
$ |
1,809 |
|
|
|
|
|
|
|
|
|
|
$ |
1,498 |
|
|
$ |
1,809 |
|
|
|
|
|
|
|
|
|
The decrease in same-store NOI for the quarter and six months ended June 30, 2020 and 2019, is due to decreased occupancy revenues and increased expenses related to the COVID-19 pandemic.
Funds from Operations and Modified Funds from Operations
Due to certain unique operating characteristics of real estate companies, as discussed below, the National Association of Real Estate Investment Trusts, (“NAREIT”) promulgated a measure known as funds from operations (“FFO”), which we believe to be an appropriate supplemental measure to reflect the operating performance of a REIT. The use of FFO is recommended by the REIT industry as a supplemental performance measure. FFO is not equivalent to net income or loss as determined under GAAP.
We define FFO, a non-GAAP measure, consistent with the standards approved by the Board of Governors of NAREIT. NAREIT defines FFO as net income or loss computed in accordance with GAAP, excluding gains or losses from sales of property, real estate asset impairment write-downs, plus depreciation and amortization of real estate related assets, and after adjustments for unconsolidated partnerships and joint ventures. Our FFO calculation complies with NAREIT’s policy described above.
The historical accounting convention used for real estate assets requires straight-line depreciation of buildings and improvements, which implies that the value of real estate assets diminishes predictably over time, especially if such assets are not adequately maintained or repaired and renovated as required by relevant circumstances and/or is requested or required by lessees for operational purposes in order to maintain the value of the property. We believe that, because real estate values historically rise and fall with market conditions, including inflation, interest rates, the business cycle, unemployment and consumer spending, presentations of operating results for a REIT using historical accounting for depreciation may be less informative. Historical accounting for real estate involves the use of GAAP. Any other method of accounting for real estate such as the fair value method cannot be construed to be any more accurate or relevant than the comparable methodologies of real estate valuation found in GAAP. Nevertheless,
32
we believe that the use of FFO, which excludes the impact of real estate related depreciation and amortization, provides a more complete understanding of our performance to investors and to management, and when compared year over year, reflects the impact on our operations from trends in occupancy rates, rental rates, operating costs, general and administrative expenses, and interest costs, which may not be immediately apparent from net income or loss. However, FFO and MFFO, as described below, should not be construed to be more relevant or accurate than the current GAAP methodology in calculating net income or loss in its applicability in evaluating operating performance. The method utilized to evaluate the value and performance of real estate under GAAP should be construed as a more relevant measure of operational performance and considered more prominently than the non-GAAP FFO and MFFO measures and the adjustments to GAAP in calculating FFO and MFFO.
Changes in the accounting and reporting promulgations under GAAP (for acquisition fees and expenses for business combinations from a capitalization/depreciation model) to an expensed-as-incurred model that were put into effect in 2009, and other changes to GAAP accounting for real estate subsequent to the establishment of NAREIT’s definition of FFO, have prompted an increase in cash-settled expenses, specifically acquisition fees and expenses, as items that are expensed under GAAP and accounted for as operating expenses. Our management believes these fees and expenses do not affect our overall long-term operating performance. Publicly registered, non-listed REITs typically have a significant amount of acquisition activity and are substantially more dynamic during their initial years of investment and operation. While other start up entities may also experience significant acquisition activity during their initial years, we believe that non-listed REITs are unique in that they have a limited life with targeted exit strategies within a relatively limited time frame after acquisition activity ceases. Due to the above factors and other unique features of publicly registered, non-listed REITs, the IPA has standardized a measure known as modified funds from operations (“MFFO”) which the IPA has recommended as a supplemental measure for publicly registered non-listed REITs and which we believe to be another appropriate supplemental measure to reflect the operating performance of a non-listed REIT. MFFO is not equivalent to our net income or loss as determined under GAAP, and MFFO may not be a useful measure of the impact of long-term operating performance on value if we do not continue to operate with a limited life and targeted exit strategy, as currently intended. We believe that because MFFO excludes costs that we consider more reflective of investing activities and other non-operating items included in FFO and also excludes acquisition fees and expenses that affect our operations only in periods in which properties are acquired, MFFO can provide, on a going forward basis, an indication of the sustainability (that is, the capacity to continue to be maintained) of our operating performance after the period in which we acquired our properties and once our portfolio is in place. By providing MFFO, we believe we are presenting useful information that assists investors and analysts to better assess the sustainability of our operating performance after our properties have been acquired. We also believe that MFFO is a recognized measure of sustainable operating performance by the non-listed REIT industry.
We define MFFO, a non-GAAP measure, consistent with the IPA’s Guideline 2010-01, Supplemental Performance Measure for Publicly Registered, Non-Listed REITs: MFFO, or the Practice Guideline, issued by the IPA in November 2010. The Practice Guideline defines MFFO as FFO further adjusted for the following items, as applicable, included in the determination of GAAP net income or loss: acquisition fees and expenses; amounts relating to deferred rent receivables and amortization of above and below market leases and liabilities (which are adjusted from a GAAP accrual basis in order to reflect such payments on a cash basis of amounts expected to be received for such lease and rental payments); contingent purchase price consideration adjustments; accretion of discounts and amortization of premiums on debt investments; mark-to-market adjustments included in net income or loss; gains or losses included in net income from the extinguishment or sale of debt, hedges, foreign exchange, derivatives or securities holdings where trading of such holdings is not a fundamental attribute of the business plan; and unrealized gains or losses resulting from consolidation from, or deconsolidation to, equity accounting and after adjustments for consolidated and unconsolidated partnerships and joint ventures, with such adjustments calculated to reflect MFFO on the same basis. The accretion of discounts and amortization of premiums on debt investments, unrealized gains and losses on hedges, foreign exchange, derivatives or securities holdings, unrealized gains and losses resulting from consolidations, as well as other listed cash flow adjustments are adjustments made to net income or loss in calculating the cash flows provided by operating activities and, in some cases, reflect gains or losses which are unrealized and may not ultimately be realized.
33
Our MFFO calculation complies with the IPA’s Practice Guideline described above. In calculating MFFO, we exclude acquisition related expenses. Under GAAP, acquisition fees and expenses are characterized as operating expenses in determining operating net income or loss. These expenses are paid in cash by us. All paid and accrued acquisition fees and expenses will have negative effects on returns to investors, the potential for future distributions, and cash flows generated by us, unless earnings from operations or net sales proceeds from the disposition of other properties are generated to cover the purchase price of the property.
Our management uses MFFO and the adjustments used to calculate it in order to evaluate our performance against other non-listed REITs which have limited lives with short and defined acquisition periods and targeted exit strategies shortly thereafter. As noted above, MFFO may not be a useful measure of the impact of long-term operating performance on value if we do not continue to operate in this manner. We believe that our use of MFFO and the adjustments used to calculate it allow us to present our performance in a manner that reflects certain characteristics that are unique to non-listed REITs, such as their limited life, limited and defined acquisition period and targeted exit strategy, and hence that the use of such measures is useful to investors. For example, acquisition costs are funded from our subscription proceeds and other financing sources and not from operations.
By excluding expensed acquisition costs, the use of MFFO provides information consistent with management’s analysis of the operating performance of the properties.
Presentation of this information is intended to provide useful information to investors as they compare the operating performance of different non-listed REITs, although it should be noted that not all REITs calculate FFO and MFFO the same way and as such comparisons with other REITs may not be meaningful. Furthermore, FFO and MFFO are not necessarily indicative of cash flows available to fund cash needs and should not be considered as an alternative to net income (or loss) or income (or loss) from continuing operations as an indication of our performance, as an alternative to cash flows from operations, as an indication of our liquidity, or indicative of funds available to fund our cash needs including our ability to make distributions to our stockholders. FFO and MFFO should be reviewed in conjunction with other GAAP measurements as an indication of our performance. MFFO is useful in assisting management and investors in assessing the sustainability of operating performance in future operating periods, and in particular, now that the offering and acquisition stages are complete and NAV is disclosed. FFO and MFFO are not useful measures in evaluating NAV because impairments are taken into account in determining NAV but not in determining FFO and MFFO.
Neither the SEC, NAREIT nor any other regulatory body has passed judgment on the acceptability of the adjustments we use to calculate FFO or MFFO. In the future, the SEC, NAREIT or another regulatory body may decide to standardize the allowable adjustments across the non-listed REIT industry and we would have to adjust our calculation and characterization of FFO or MFFO.
34
The following table presents a reconciliation of net income to FFO and MFFO for the quarter and six months ended June 30, 2020 and 2019 (in thousands, except per share data):
|
|
|
Quarter Ended June 30, |
|
|
Six Months Ended June 30, |
|
||||||||||
|
|
|
2020 |
|
|
2019 |
|
|
2020 |
|
|
2019 |
|
||||
|
Net income attributable to common stockholders |
|
$ |
220 |
|
|
$ |
328,272 |
|
|
$ |
4,962 |
|
|
$ |
338,172 |
|
|
Adjustments: |
|
|
|
|
|
|
|
|
|
|
|
|
|
|
|
|
|
Depreciation and amortization: |
|
|
|
|
|
|
|
|
|
|
|
|
|
|
|
|
|
Continuing operations |
|
|
12,454 |
|
|
|
12,347 |
|
|
|
24,998 |
|
|
|
24,681 |
|
|
Gain on sale of real estate: |
|
|
|
|
|
|
|
|
|
|
|
|
|
|
|
|
|
Continuing operations |
|
|
— |
|
|
|
(228 |
) |
|
|
(1,074 |
) |
|
|
(228 |
) |
|
Discontinued operations |
|
|
— |
|
|
|
(331,663 |
) |
|
|
— |
|
|
|
(331,663 |
) |
|
FFO adjustments attributable to noncontrolling interests: |
|
|
|
|
|
|
|
|
|
|
|
|
|
|
|
|
|
Continuing operations |
|
|
(48 |
) |
|
|
(47 |
) |
|
|
(95 |
) |
|
|
(95 |
) |
|
Discontinued operations |
|
― |
|
|
|
261 |
|
|
|
— |
|
|
|
261 |
|
|
|
FFO adjustments from unconsolidated entities (1) |
|
|
81 |
|
|
|
276 |
|
|
|
89 |
|
|
|
609 |
|
|
FFO attributable to common stockholders |
|
|
12,707 |
|
|
|
9,218 |
|
|
|
28,880 |
|
|
|
31,737 |
|
|
Straight-line rent adjustments: (2) |
|
|
|
|
|
|
|
|
|
|
|
|
|
|
|
|
|
Continuing operations |
|
|
412 |
|
|
|
(37 |
) |
|
|
813 |
|
|
|
(219 |
) |
|
Discontinued operations |
|
|
— |
|
|
|
(433 |
) |
|
|
— |
|
|
|
(1,199 |
) |
|
Amortization of premium for debt investments: |
|
|
|
|
|
|
|
|
|
|
|
|
|
|
|
|
|
Continuing operations |
|
|
(11 |
) |
|
|
(11 |
) |
|
|
(21) |
|
|
|
(21 |
) |
|
Realized income (loss) on extinguishment of hedges or other derivatives: (3) |
|
|
|
|
|
|
|
|
|
|
|
|
|
|
|
|
|
Continuing operations |
|
|
— |
|
|
|
(197 |
) |
|
|
— |
|
|
|
(197 |
) |
|
Discontinued operations |
|
|
— |
|
|
|
441 |
|
|
|
— |
|
|
|
441 |
|
|
Loss on extinguishment of debt: (4) |
|
|
|
|
|
|
|
|
|
|
|
|
|
|
|
|
|
Continuing operations |
|
|
— |
|
|
|
654 |
|
|
|
35 |
|
|
|
654 |
|
|
Discontinued operations |
|
|
— |
|
|
|
3,340 |
|
|
|
— |
|
|
|
3,340 |
|
|
Unrealized gain on investment in short term securities: (5) |
|
|
|
|
|
|
|
|
|
|
|
|
|
|
|
|
|
Continuing operations |
|
|
16 |
|
|
|
— |
|
|
|
16 |
|
|
|
— |
|
|
MFFO adjustments attributable to noncontrolling interests: |
|
|
|
|
|
|
|
|
|
|
|
|
|
|
|
|
|
Continuing operations |
|
|
(10 |
) |
|
|
(3 |
) |
|
|
(5 |
) |
|
|
(5 |
) |
|
Discontinued operations |
|
|
— |
|
|
|
(10 |
) |
|
|
— |
|
|
|
(9 |
) |
|
MFFO attributable to common stockholders |
|
$ |
13,114 |
|
|
$ |
12,962 |
|
|
$ |
29,718 |
|
|
$ |
34,522 |
|
|
Weighted average number of shares of common |
|
|
|
|
|
|
|
|
|
|
|
|
|
|
|
|
|
stock outstanding (basic and diluted) |
|
|
173,960 |
|
|
|
173,963 |
|
|
|
173,960 |
|
|
|
173,963 |
|
|
Net income per share (basic and diluted) |
|
$ |
0.00 |
|
|
$ |
1.89 |
|
|
$ |
0.03 |
|
|
$ |
1.94 |
|
|
FFO per share (basic and diluted) |
|
$ |
0.07 |
|
|
$ |
0.05 |
|
|
$ |
0.17 |
|
|
$ |
0.18 |
|
|
MFFO per share (basic and diluted) |
|
$ |
0.08 |
|
|
$ |
0.07 |
|
|
$ |
0.17 |
|
|
$ |
0.20 |
|
______________
FOOTNOTES:
|
(1) |
This amount represents our share of the FFO or MFFO adjustments allowable under the NAREIT or IPA definitions, respectively, calculated using the HLBV method. |
35
|
(3) |
Management believes that adjusting for the realized gain on the extinguishment of debt, hedges or other derivatives is appropriate because the adjustments are not reflective of our ongoing operating performance and, as a result, the adjustments better align results with management’s analysis of operating performance. |
|
(4) |
Management believes that adjusting for the realized loss on the early extinguishment of debt is appropriate because the adjustments are not reflective of our ongoing operating performance and, as a result, the adjustments better align results with management’s analysis of operating performance. |
|
(5) |
Management believes that adjusting for the unrealized gain on investment in short term securities is appropriate because the adjustment is not reflective of our ongoing operating performance and, as a result, the adjustments better align results with management’s analysis of operating performance. |
Contractual Obligations
The following table presents our contractual obligations by payment periods as of June 30, 2020, including liabilities associated with assets held for sale (in thousands):
|
|
|
Payments Due by Period |
|
|||||||||||||||||
|
|
|
2020 |
|
|
2021-2022 |
|
|
2023-2024 |
|
|
Thereafter |
|
|
Total |
|
|||||
|
Mortgages and other notes payable (principal and interest) |
|
$ |
20,899 |
|
|
$ |
311,636 |
|
|
$ |
45,909 |
|
|
$ |
— |
|
|
$ |
378,444 |
|
|
Credit facilities (principal and interest) |
|
|
2,985 |
|
|
|
11,940 |
|
|
|
352,072 |
|
|
|
— |
|
|
|
366,997 |
|
|
|
|
$ |
23,884 |
|
|
$ |
323,576 |
|
|
$ |
397,981 |
|
|
$ |
— |
|
|
$ |
745,441 |
|
Off-Balance Sheet Arrangements
As of June 30, 2020, our off-balance sheet and other arrangements were not materially different from the amounts reported for the year ended December 31, 2019. Refer to our annual report on Form 10-K for the year ended December 31, 2019 for a summary of our off-balance sheet and other arrangements.
Related-Party Transactions
See Item 1. “Condensed Consolidated Financial Information” in this Form 10-Q and our Annual Report on Form 10-K for the year ended December 31, 2019 for a summary of our related party transactions.
Critical Accounting Policies and Estimates
See Item 1. “Condensed Consolidated Financial Information” in this Form 10-Q and our Annual Report on Form 10-K for the year ended December 31, 2019 for a summary of our critical accounting policies and estimates.
Recent Accounting Pronouncements
See Item 1. “Condensed Consolidated Financial Information” in this Form 10-Q for a summary of the impact of recent accounting pronouncements.
36
We may be exposed to interest rate changes primarily as a result of the long-term debt we used to acquire properties and other permitted investments. Our management objectives related to interest rate risk is to limit the impact of interest rate changes on earnings and cash flows and to lower our overall borrowing costs. To achieve our objectives, we borrow at fixed rates or variable rates with the lowest margins available, and in some cases, with the ability to convert from variable rates to fixed rates. With regard to variable rate financing, we assess interest rate cash flow risk by continually identifying and monitoring changes in interest rate exposures that may adversely impact expected future cash flows and by evaluating hedging opportunities.
The following is a schedule as of June 30, 2020 of our fixed and variable rate debt maturities for the remainder of 2020, and each of the next four years and thereafter (principal maturities only), including liabilities associated with assets held for sale (in thousands):
|
|
|
Expected Maturities |
|
|
|
|
|
|
|
|
|
|||||||||||||||||||||
|
|
|
2020 |
|
|
2021 |
|
|
2022 |
|
|
2023 |
|
|
2024 |
|
|
Thereafter |
|
|
Total |
|
|
Fair Value (1) |
|
||||||||
|
Fixed rate debt |
|
$ |
5,471 |
|
|
$ |
11,311 |
|
|
$ |
282,220 |
|
|
$ |
23,417 |
|
|
$ |
20,665 |
|
|
$ |
— |
|
|
$ |
343,084 |
|
|
$ |
347,000 |
|
|
Weighted average interest rate on fixed rate debt |
|
|
4.29 |
% |
|
|
4.29 |
% |
|
|
4.27 |
% |
|
|
4.65 |
% |
|
|
3.25 |
% |
|
|
— |
|
|
|
4.23 |
% |
|
|
|
|
|
Variable rate debt |
|
$ |
8,108 |
|
|
$ |
— |
|
|
$ |
— |
|
|
$ |
80,000 |
|
|
$ |
265,000 |
|
|
$ |
— |
|
|
$ |
353,108 |
|
|
$ |
353,000 |
|
|
Average interest rate on variable rate debt |
|
1.58%+ LIBOR |
|
|
|
— |
|
|
|
— |
|
|
1.55% + LIBOR |
|
|
1.55% + LIBOR |
|
|
|
— |
|
|
1.55% + LIBOR |
|
|
|
|
|
||||
_____________
FOOTNOTE:
|
(1) |
The estimated fair value of our fixed and variable rate debt was determined using discounted cash flows based on market interest rates as of June 30, 2020. We determined market rates through discussions with our existing lenders by pricing our loans with similar terms and current rates and spreads. |
Assuming no interest rate protection, management estimates that a one-percentage point increase or decrease in LIBOR in 2020, compared to LIBOR rates as of June 30, 2020, would result in fluctuation of interest expense on our variable rate debt of approximately $3.5 million for the year ending December 31, 2020. This sensitivity analysis contains certain simplifying assumptions, and although it gives an indication of our exposure to changes in interest rates, it is not intended to predict future results and actual results will likely vary given that our sensitivity analysis on the effects of changes in LIBOR does not factor in a potential change in variable rate debt levels, any offsetting gains on interest rate swap contracts, or the impact of any LIBOR floors or caps.
As of June 30, 2020, the Company’s debt is comprised of approximately 49.3% in fixed rate debt, approximately 40.4% in variable rate debt with current interest rate protection and approximately 10.3% of unhedged variable rate debt. The remaining unhedged variable rate debt primarily relates to our construction loans and the Revolving Credit Facility. Overall, we believe longer term fixed rate debt could be beneficial in a rising interest rate or rising inflation rate environment and as such we continue to evaluate the need for additional interest rate protection on unhedged variable rate debt or variable rate debt with interest rate protection scheduled to mature.
37
Evaluation of Disclosure Controls and Procedures
Pursuant to Rule 13a-15(b) under the Exchange Act, under the supervision and with the participation of our management, including our principal executive officer and principal financial officer, we conducted an evaluation of the effectiveness of our disclosure controls and procedures (as defined under Rule 13a-15(e) under the Exchange Act) as of the end of the period covered by this report. Based upon that evaluation, our management, including our principal executive officer and principal financial officer, concluded that our disclosure controls and procedures are effective as of the end of the period covered by this report to provide reasonable assurance that material information required to be included in our periodic SEC reports is recorded, processed, summarized and reported within the time periods specified in the relevant SEC rules and forms.
Changes in Internal Control over Financial Reporting
During the most recent fiscal quarter, there were no changes in our internal controls over financial reporting (as defined under Rule 13a-15(f) under the Exchange Act) that have materially affected, or are reasonably likely to materially affect, our internal controls over financial reporting.
From time to time, we may be a party to legal proceedings in the ordinary course of, or incidental to the normal course of, our business, including proceedings to enforce our contractual or statutory rights. While we cannot predict the outcome of these legal proceedings with certainty, based upon currently available information, we do not believe the final outcome of any pending or threatened legal proceeding will have a material adverse effect on our results of operations or financial condition.
There have been no material changes in our assessment of our risk factors from those set forth in our Annual Report on Form 10-K for the fiscal year ended December 31, 2019.
Unregistered Sales of Equity Securities - None
Issuer Purchases of Equity Securities – None
Secondary Sales of Registered Shares between Investors
During the six months ended June 30, 2020 and 2019, there were approximately 50,000 shares and 121,000 shares transferred between investors, respectively, at an average sales price per share of approximately $5.80 and $7.85, respectively. We are not aware of any other trades of our shares.
The exhibits required by this item are set forth in the Exhibit Index attached hereto and are filed or incorporated as part of this report.
38
Exhibits
The following exhibits are included or incorporated by reference in this Quarterly Report on Form 10-Q for the quarter and six months ended June 30, 2020 (and are numbered in accordance with Item 601 of Regulation S-K).
|
Exhibit No. |
|
Description |
|
|
|
|
|
31.1 |
|
|
|
|
|
|
|
31.2 |
|
|
|
|
|
|
|
32.1 |
|
|
|
|
|
|
|
101 |
|
The following materials from CNL Healthcare Properties, Inc. Quarterly Report on Form 10-Q for the quarter and six months ended June 30, 2020, formatted in XBRL (Extensible Business Reporting Language); (i) Condensed Consolidated Balance Sheets, (ii) Condensed Consolidated Statements of Operations, (iii) Condensed Consolidated Statements of Comprehensive Loss, (iv) Condensed Consolidated Statements of Stockholders’ Equity and Redeemable Noncontrolling Interest, (v) Condensed Consolidated Statements of Cash Flows, and (vi) Notes to the Condensed Consolidated Financial Statements. |
39
Pursuant to the requirements of the Securities Exchange Act of 1934, the registrant has duly caused this report to be signed on its behalf by the undersigned thereunto duly authorized, on the 13th day of August 2020.
|
CNL HEALTHCARE PROPERTIES, INC. |
|
|
|
|
|
By: |
/s/ Stephen H. Mauldin |
|
|
STEPHEN H. MAULDIN |
|
|
Chief Executive Officer and President |
|
|
(Principal Executive Officer) |
|
|
|
|
|
|
|
By: |
/s/ Ixchell C. Duarte |
|
|
IXCHELL C. DUARTE |
|
|
Chief Financial Officer, Senior Vice President and Treasurer |
|
|
(Principal Financial Officer) |
40