Attached files
| file | filename |
|---|---|
| EX-32 - EX-32 - HANGER, INC. | a17-25118_1ex32.htm |
| EX-31.2 - EX-31.2 - HANGER, INC. | a17-25118_1ex31d2.htm |
| EX-31.1 - EX-31.1 - HANGER, INC. | a17-25118_1ex31d1.htm |
| EX-21 - EX-21 - HANGER, INC. | a17-25118_1ex21.htm |
SECURITIES AND EXCHANGE COMMISSION
WASHINGTON, D.C. 20549
FORM 10-K
x ANNUAL REPORT PURSUANT TO SECTION 13 OR 15(d) OF THE SECURITIES EXCHANGE ACT OF 1934.
For the fiscal year ended December 31, 2016
OR
¨ TRANSITION REPORT PURSUANT TO SECTION 13 OR 15(d) OF THE SECURITIES EXCHANGE ACT OF 1934.
For the transition period from
to
Commission File Number 1-10670
HANGER, INC.
(Exact name of registrant as specified in its charter.)
|
Delaware |
|
84-0904275 |
|
|
|
|
|
10910 Domain Drive, Suite 300, Austin, TX |
|
78758 |
Registrant’s phone number, including area code: (512) 777-3800
Securities registered pursuant to Section 12(b) of the Act:
|
Title of class |
|
Name of exchange on which registered |
|
Common Stock, par value $0.01 per share |
|
OTC Pink (operated by OTC Markets Group Inc.) |
Securities registered pursuant to Section 12(g) of the Act: None.
Indicate by check mark if the registrant is a well-known seasoned issuer, as defined in Rule 405 of the Securities Act. Yes ¨ No x
Indicate by check mark if the registrant is not required to file reports pursuant to Section 13 or Section 15(d) of the Act. Yes ¨ No x
Indicate by check mark whether the registrant (1) has filed all reports required to be filed by Section 13 or 15(d) of the Securities Exchange Act of 1934 during the preceding 12 months (or for such shorter period that the registrant was required to file such reports), and (2) has been subject to such filing requirements for the past 90 days: Yes ¨ No x
Indicate by check mark whether the registrant has submitted electronically and posted on its corporate Web site, if any, every Interactive Data File required to be submitted and posted pursuant to Rule 405 of Regulation S-T (232.405 of this chapter) during the preceding 12 months (or for such shorter period that the registrant was required to submit and post such files). Yes ¨ No x
Indicate by check mark if disclosure of delinquent filers pursuant to Item 405 of Regulation S-K (229.405 of this chapter) is not contained herein, and will not be contained, to the best of registrant’s knowledge, in definitive proxy or information statements incorporated by reference in Part III of this Form 10-K or any amendment to this Form 10-K. ¨
Indicate by check mark whether the registrant is a large accelerated filer, an accelerated filer, a non-accelerated filer, smaller reporting company, or an emerging growth company. See the definitions of “large accelerated filer,” “accelerated filer,” “smaller reporting company,” and “emerging growth company” in Rule 12b-2 of the Exchange Act.
|
Large accelerated filer ¨ |
|
Accelerated filer x |
|
Non-accelerated filer ¨ |
|
Smaller reporting company ¨ |
|
|
|
Emerging growth company ¨ |
If an emerging growth company, indicate by check mark if the registrant has elected not to use the extended transition period for complying with any new or revised financial accounting standards provided pursuant to Section 13(a) of the Exchange Act. ¨
Indicate by check mark whether the registrant is a shell company (as defined in Rule 12b-2 of the Exchange Act). Yes ¨ No x
State the aggregate market value of the voting and non-voting common equity held by non-affiliates computed by reference to the price at which the common equity was last sold, or the average bid and asked price of such common equity, as of the last business day of the registrant’s most recently completed second fiscal quarter which was June 30, 2017, $425.8 million.
As of January 12, 2018 the registrant had 36,328,678 shares of its Common Stock issued and outstanding.
DOCUMENTS INCORPORATED BY REFERENCE: None
|
Hanger, Inc. |
|
|
|
|
|
ii | |
|
|
|
|
| |
|
|
|
|
1 | |
|
|
|
|
12 | |
|
|
|
|
24 | |
|
|
|
|
25 | |
|
|
|
|
26 | |
|
|
|
|
28 | |
|
|
|
|
| |
|
|
|
|
29 | |
|
|
|
|
31 | |
|
|
|
|
Item 7. Management’s Discussion and Analysis of Financial Condition and Results of Operations |
33 |
|
|
|
|
Item 7A. Quantitative and Qualitative Disclosures about Market Risk |
96 |
|
|
|
|
97 | |
|
|
|
|
Item 9. Changes in and Disagreements with Accountants on Accounting and Financial Disclosure |
98 |
|
|
|
|
99 | |
|
|
|
|
109 | |
|
|
|
|
| |
|
|
|
|
Item 10. Directors, Executive Officers and Corporate Governance |
110 |
|
|
|
|
117 | |
|
|
|
|
171 | |
|
|
|
|
Item 13. Certain Relationships and Related Transactions, and Director Independence |
174 |
|
|
|
|
175 | |
|
|
|
|
| |
|
|
|
|
177 | |
|
|
|
|
181 | |
|
|
|
|
182 | |
|
|
|
|
F-1 | |
|
|
|
|
E-1 |
We filed our Annual Report on Form 10-K for the year ended December 31, 2014 (the “2014 Form 10-K”) on May 12, 2017. The 2014 Form 10-K contained our consolidated financial statements and related footnotes for the year ended December 31, 2014, as well as consolidated financial statements for the third and fourth quarters of 2014. The 2014 Form 10-K also included a restatement of our previously issued consolidated financial statements and related footnotes for (i) the fiscal years ended December 31, 2013 and 2012; (ii) the first two quarters of fiscal year 2014 and (iii) each of the quarterly periods in fiscal year 2013 (the “Restatement”). The 2014 Form 10-K also contained restated financial results for the fiscal years ended December 31, 2011 and 2010 (each unaudited), as summarized in Item 6. “Selected Financial Data” to the 2014 Form 10-K. The Restatement resulted in a cumulative reduction to our previously reported income before taxes through June 30, 2014 of approximately $175.1 million due to prior misstatements.
The filing of this Annual Report on Form 10-K for the year ended December 31, 2016 has been delayed significantly as a result of the delay in our filing of the 2014 Form 10-K, the number of accounting periods encompassed within this filing, as well as the additional review, analysis and substantive procedures performed due to the material weaknesses in our internal control over financial reporting identified in connection with the completion and filing of the 2014 Form 10-K. See Item 9A. “Controls and Procedures” in this Annual Report on Form 10-K for information regarding the identified material weaknesses. Due to the delay in our 2017 quarterly filings and changes that have occurred in our business since December 31, 2016, certain of the information contained in this Annual Report on Form 10-K is presented in a manner that, where appropriate, reflects current or more recent information regarding our business.
We have not filed our Annual Report on Form 10-K for the year ended December 31, 2015 (the “2015 Form 10-K”) or Quarterly Reports on Form 10-Q for 2016 and 2015. In lieu of filing a 2015 Form 10-K and Quarterly Reports for 2016 and 2015, we have included in this Annual Report on Form 10-K all material information required to be included in the 2015 Form 10-K and Quarterly Reports on Form 10-Q for 2016 and 2015.
We have made significant progress in our efforts to remediate material weaknesses that have prevented us from reporting our financial results on a timely basis. To date, we have taken and continue to take the actions described in the section titled “Remediation Plans” included in Item 9A. “Controls and Procedures” in this Annual Report on Form 10-K to address previously identified material weaknesses. Our remediation efforts are ongoing. As we continue to evaluate and work to improve our internal control over financial reporting, we may implement additional measures or modify the currently identified remedial actions to remediate our material weaknesses.
Despite the substantial time and resources we have directed at our remediation efforts, we are unable to estimate at this time when these remediation efforts will be completed. Until the remediation efforts, including any additional remediation efforts that our management identifies as necessary, are completed, the material weaknesses described in “Item 9A. Controls and Procedures” will continue to exist.
We intend to provide additional information regarding our remediation efforts with respect to the material weaknesses in future filings with the SEC.
Business Overview
General
Hanger, Inc. (“the Company,” “we,” “our,” or “us”) is a leading national provider of products and services that assist in enhancing or restoring the physical capabilities of patients with disabilities or injuries. Built on the legacy of James Edward Hanger, the first amputee of the American Civil War, we and our predecessor companies have provided orthotic and prosthetic (“O&P”) services for over 150 years. We provide O&P services, distribute O&P devices and components, manage O&P networks and provide therapeutic solutions to patients and businesses in acute, post-acute and clinic settings. We operate through two segments - Patient Care and Products & Services.
Our Patient Care segment is primarily comprised of Hanger Clinic, which specializes in the design, fabrication and delivery of custom O&P devices through 706 patient care clinics and 115 satellite locations in 45 states and the District of Columbia, as of December 31, 2016. We also provide payor network contracting services to other O&P providers through this segment.
Our Products & Services segment is comprised of our distribution and therapeutic solutions businesses. As a leading provider of O&P products in the United States, we coordinate through our distribution business the procurement and distribution of a broad catalog of O&P parts, componentry and devices to independent O&P providers nationwide. To facilitate speed and convenience, we deliver these products through our five distribution facilities that are located in Nevada, Georgia, Illinois, Pennsylvania and Texas. The other business in our Products & Services segment is our therapeutic solutions business, which develops specialized rehabilitation technologies and provides evidence-based clinical programs for post-acute rehabilitation patients at approximately 4,000 skilled nursing and post-acute providers nationwide.
For the years ended December 31, 2016, 2015 and 2014, our net revenues were $1,042.1 million, $1,067.2 million and $1,012.1 million, respectively. We recorded a loss from continuing operations of $107.4 million, $319.1 million and $3.0 million for the years ended December 31, 2016, 2015 and 2014, respectively.
The following table summarizes the percentage of net revenues derived from each of our two operating segments:
|
|
|
For the Years Ended December 31, |
| ||||
|
|
|
2016 |
|
2015 |
|
2014 |
|
|
Patient Care |
|
80.6 |
% |
82.0 |
% |
82.7 |
% |
|
Products & Services |
|
19.4 |
% |
18.0 |
% |
17.3 |
% |
See Note R - “Segment and Related Information” to our consolidated financial statements in this Annual Report on Form 10-K for additional information about our segments.
Industry Overview
We estimate that approximately $4.0 billion is spent in the United States each year for prescription-based O&P products and services through O&P clinics. Orthotic devices, or “orthoses” are externally applied devices used to modify the structural and functional characteristics of the neuromuscular and skeletal system. These devices typically are provided to patients suffering from musculoskeletal disorders, such as ailments of the back, extremities or joints; injuries from sports; or conditions such as cerebral palsy, scoliosis and stroke. Prosthetic devices, or “prostheses” are artificial devices that replace a missing limb or portion of a limb. These devices are normally provided to patients with amputated or congenitally absent limbs to replace the function and appearance of a limb so that patients can resume activities of daily living and work. The most prevalent causes for amputations are from complications due to diabetes, trauma associated with accidents, or physical injury, tumor or infection.
The industry derives its primary revenue from the evaluation, fabrication and fitting of custom O&P devices to serve patients needing both new and replacement devices. Additionally, O&P clinics typically provide patients with other non-custom orthotic products, diabetic shoes and inserts, and support patients through the repair and adjustment of their devices.
We believe our Patient Care segment currently serves approximately 20% of the O&P clinic market. We understand that the next largest provider of O&P services in the United States is the Veterans Administration (the “VA”), which operates 79 O&P clinics on behalf of its covered veteran patients. In addition to serving veterans through their own facilities, in certain markets the VA is also a client of Hanger Clinic. Approximately 9% of Hanger Clinic’s revenue is derived from services provided to veteran patients through contracts with the VA.
The balance of the O&P patient care market is highly fragmented and is typically characterized by regional and local independent O&P businesses. We estimate that our top ten competitors have an average of approximately 25 clinics each, with the smallest having 16 and the largest having 36 clinics. The remainder of the market is served by individual practitioners and smaller regional or market-based firms with approximately 10 or fewer clinics. Based on this, we do not believe that any single competitor accounts for more than approximately 2% of the nation’s total estimated O&P clinic revenues.
We anticipate that the demand for O&P services will continue to grow as the nation’s population increases, and as a result of several trends, including the aging of the U.S. population, there will be an increase in the prevalence of disease associated disability and the demand for new and advanced devices. We believe the typical replacement time for prosthetic devices is three to five years, while the typical replacement time for orthotic devices varies, depending on the device.
We estimate that approximately $1.7 billion is spent in the United States each year by providers of O&P patient care services for the O&P products, components, devices and supplies used in their businesses. Our Products & Services segment distributes O&P products, components, devices and supplies to independent providers of O&P services and to our own patient care clinics. We estimate that our distribution sales account for approximately 8% of the market for O&P products, components, devices and supplies (excluding sales to our Patient Care segment).
We estimate the market for rehabilitation technologies, integrated clinical programs and therapist training in skilled nursing facilities (“SNFs”) to be approximately $150 million annually. We currently provide these products and services to approximately 30% of the estimated 15,000 SNFs located in the U.S. We estimate the market for rehabilitation technologies, clinical programs and training within the broader post-acute rehabilitation markets to be approximately $400 million annually. We do not currently provide a meaningful amount of products and services to this broader market.
Business Strategy
Our goal is to be the provider of choice for patients, referring physicians and customers seeking products and services that enhance human physical capabilities. Our strategy is to pursue the creation of an integrated therapeutic solutions model that will have a strong focus in custom O&P and immediately adjacent markets to provide our patients and customers with a spectrum of services that address their individual needs. To foster growth and gain further market share, we intend to focus on initiatives that will differentiate Hanger from our competitors.
Government led health care reform is driving significant changes to our business environment, with focus on lowering health care costs while improving patient outcomes and satisfaction. As a result, our strategy is focused on enhancing the quality of care to elevate patient satisfaction, investing in processes and technologies to measure and report on patient outcomes and satisfaction, and further increasing our profile with referring health care providers and payors. In addition, we are committed to reducing the cost of this care by undertaking several initiatives that include establishing device standards that provide the highest function, durability and comfort at the lowest cost, reconfiguring our supply chain and fabrication processes, streamlining internal administrative processes and reducing back-office functions performed within patient care clinic locations.
Business Description
Patient Care
Our Patient Care segment , which specializes in patient evaluation and the fabrication, fitting and delivery of O&P devices through our nationwide patient care clinic locations employs approximately 1,600 clinical prosthetists, orthotists and pedorthists, which we refer to as clinicians, substantially all of which are certified by either the American Board for Certification (“ABC”) or the Board of Certification of Orthotists and Prosthetists, which are the two boards that certify O&P clinicians. To facilitate timely service to our patients, we also employ technicians, fitters and other ancillary providers to
assist its clinicians in the performance of their duties. Through this segment, we additionally provide network contracting services to independent providers of O&P through our “Linkia” business.
To complement and enhance our O&P business, we have provided certain non-custom orthotics directly to patients of hospital systems and other providers through our CARES patient care services unit (“CARES”) and Dosteon product group (“Dosteon”). We completed the exit of our Dosteon businesses with the sale of the businesses in 2015. The operating results and cash flows of Dosteon have been presented separately as discontinued operations in the consolidated financial statements. We completed the exit of our CARES business through the closure of these operations during 2015.
Patients are typically referred to Hanger Clinic by an attending physician who determines a patient’s treatment and writes a prescription. Our clinicians then consult with both the referring physician and the patient with a view toward assisting in the design of an orthotic or prosthetic device to meet the patient’s needs. O&P devices are increasingly technologically advanced and custom designed to add functionality and comfort to patients’ lives, shorten the rehabilitation process and lower the cost of rehabilitation. When providing custom orthoses, we design, fabricate, fit and maintain a wide range of custom-made braces and other devices (such as spinal, knee and other braces) that provide external support to patients suffering from musculoskeletal disorders, such as ailments of the back, extremities or joints and injuries from sports or other activities. We also provide and fit non-custom, including “off the shelf” orthoses to patients with similar, though typically less severe, disorders, ailments and injuries.
Based on the prescription written by a referring physician, our clinicians examine and evaluate the patient and either design a custom device or, in the case of certain orthotic needs, utilize a non-custom device, including, in appropriate circumstances, an “off the shelf” device, to address the patient’s needs. When fabricating a device, our clinicians ascertain the specific requirements, componentry and measurements necessary for the construction of the device. Custom devices are constructed using componentry provided by a variety of third party manufacturers who specialize in O&P, coupled with sockets and other elements that are fabricated by our clinicians and technicians, to meet the individual patient’s physical and ambulatory needs. Our clinicians and technicians typically utilize castings, electronic scans and other techniques to fabricate items that are specialized for the patient. After fabricating the device, a fitting process is undertaken and adjustments are made to ensure the achievement of proper alignment, fit and patient comfort. The fitting process often involves several stages to successfully achieve desired functional and cosmetic results.
Given the differing physical weight and size characteristics, location of injury or amputation, capability for physical activity and mobility, cosmetic and other needs of each individual patient, each fabricated prosthesis and orthosis is customized for each particular patient. These custom devices are commonly fabricated at one of our regional or national fabrication facilities.
We have earned a reputation within the O&P industry for the development and use of innovative technology in our products, which has increased patient comfort and capability and can significantly enhance the rehabilitation process. Frequently, our proprietary Insignia scanning system is used in the fabrication process. The Insignia system scans the patient and produces an accurate computer generated image, resulting in a faster turnaround for the patient’s device and a more professional overall experience.
Our patient care clinics are typically managed by one of our clinicians, and also employ technical personnel who assist in the provision of services to patients and who fabricate various O&P devices, as well as office administrators who schedule patient visits, obtain approvals from payors and bill and collect for services rendered. In recent years, we have established a centralized revenue cycle management organization that assists our clinics in pre-authorization, patient eligibility, denial management, collections, payor audit coordination and other accounts receivable processes.
The principal reimbursement sources for our services are:
· Commercial private payors and other non-governmental organizations, which consist of individuals, rehabilitation providers, commercial insurance companies, health management organizations (“HMOs”), preferred provider organizations (“PPOs”), hospitals, vocational rehabilitation centers, workers’ compensation programs, third party administrators and similar sources;
· Medicare, a federally funded health insurance program providing health insurance coverage for persons aged 65 or older and certain disabled persons, which provides reimbursement for O&P products and services based on
prices set forth in published fee schedules with ten regional pricing areas for prosthetics and orthotics and by state for Durable Medical Equipment (“DME”);
· Medicaid, a health insurance program jointly funded by federal and state governments providing health insurance coverage for certain persons based upon financial need, regardless of age, which may supplement Medicare benefits for financially needy persons aged 65 or older; and
· U.S. Department of Veterans Affairs.
We typically enter into contracts with third party payors that allow us to perform O&P services for a referred patient and to be paid under the contract with the third party payor. These contracts usually have a stated term of one to three years. These contracts generally may be terminated without cause by either party on 60 to 90 days’ notice or on 30 days’ notice if we have not complied with certain licensing, certification, program standards, Medicare or Medicaid requirements or other regulatory requirements. Reimbursement for services is typically based on a fee schedule negotiated with the third party payor that reflects various factors, including market conditions, geographic area and number of persons covered. Many of our commercial contracts are indexed to the commensurate Medicare fee schedule that relates to the products or services being provided.
Government reimbursement, comprised of Medicare, Medicaid and the U.S. Department of Veterans Affairs, in the aggregate, accounted for approximately, 54.1%, 53.4% and 50.9% of our net revenue in 2016, 2015 and 2014, respectively. These payors set maximum reimbursement levels for O&P services and products. Medicare prices are adjusted each year based on the Consumer Price Index for All Urban Consumers (“CPI-U”) unless Congress acts to change or eliminate the adjustment. The CPI-U is adjusted further by an efficiency factor (the “Productivity Adjustment” or the “Multi-Factor Productivity Adjustment”) in order to determine the final rate adjustment each year. The Medicare price adjustments for 2016, 2015, 2014, 2013 and 2012 were (0.4%), 1.5%, 1.0%, 0.8% and 2.4%, respectively. There can be no assurance that future adjustments will not reduce reimbursements for O&P services and products from these sources.
We, and the O&P industry in general, are subject to various Medicare compliance audits, including Recovery Audit Contractor (“RAC”) audits, Comprehensive Error Rate Testing (“CERT”) audits, Targeted Probe and Educate (“TPE”) audits and Zone Program Integrity Contractor (“ZPIC”) audits. TPE audits are generally pre-payment audits, while RAC, CERT and ZPIC audits are generally post-payment audits. The recently implemented TPE audits have replaced the previous Medicare Administrative Contractor (“MAC”) audits. Adverse post-payment audit determinations generally require Hanger to reimburse Medicare for payments previously made, while adverse pre-payment audit determinations generally result in the denial of payment. In either case, we can request a redetermination or appeal, if we believe the adverse determination is unwarranted, which can take an extensive period of time to resolve, currently up to six years or more.
Products & Services
Our Products & Services segment was established through the combination of our previously reported Distribution segment and Therapeutic Solutions segment. Through our wholly-owned subsidiary, Southern Prosthetic Supply, Inc. (“SPS”), we distribute O&P components both to independent customers and to our own clinics in the Patient Care segment. SPS purchases, warehouses and distributes over 400,000 SKUs from more than 300 different manufacturers. By locating warehousing and distribution facilities in Nevada, Georgia, Illinois, Pennsylvania and Texas, we are able to deliver products to the vast majority of our distribution customers in the United States within two business days. Through its SureFit subsidiary, SPS also manufactures and sells therapeutic footwear for diabetic patients in the podiatric market, and through its National Labs subsidiary it is a fabricator of O&P devices both for our patient care clinics and competitor clinics.
Our distribution business enables us to:
· centralize our purchasing and thus lower our material costs by negotiating purchasing discounts from manufacturers;
· better manage our patient care clinic inventory levels and improve inventory turns;
· improve inventory quality control;
· encourage our patient care clinics to use the most clinically appropriate products; and
· coordinate new product development efforts with key vendors.
Through our wholly-owned subsidiaries, Accelerated Care Plus Corp. and Accelerated Care Plus Leasing, Inc. (together, “ACP”), our therapeutic solutions business is a leading provider of rehabilitation technologies and integrated clinical programs to rehabilitation providers. Our unique value proposition is to provide our customers with a full-service “total solutions” approach encompassing proven medical technology, evidence based clinical programs, and ongoing therapist education and training. Our services support increasingly advanced treatment options for a broader patient population and more medically complex conditions. We serve approximately 4,000 skilled nursing and post-acute providers nationwide.
Competition
The O&P services industry is highly fragmented, consisting mainly of smaller regional and local firms. We estimate that our top ten competitors have an average of approximately 25 clinics each, with the smallest having 16 clinics each and the largest having 36 clinics each. The balance of the market is served by individual practitioners and smaller regional or market-based firms with approximately 10 or fewer clinics. Based on this, we do not believe that any single competitor accounts for more than approximately 2% of the nation’s total estimated O&P clinic revenues.
The business of providing O&P patient care services is highly competitive in the markets in which we operate. In the prosthetic business, we compete with numerous small independent O&P providers for referrals from physicians, therapists, employers, HMOs, PPOs, hospitals, rehabilitation centers, out-patient clinics and insurance companies on both a local and regional basis. In the orthotic business, we compete with other patient care service providers, including device manufacturers that have independent sales forces, on the basis of quality and timeliness of patient care, location of patient care clinics and pricing for services.
Although we serve a significant portion of the O&P patient care market, referral decisions made by surgeons, physicians and other medical providers are generally made on a local basis, based on their individual evaluation of the relative quality of care provided by us and our local market competitors. Therefore, our national scale may not provide a competitive advantage in any particular market in which we operate.
We also compete with independent O&P providers for the retention and recruitment of qualified O&P clinicians. In some markets, the demand for clinicians exceeds the supply of qualified personnel.
Our Products & Services segment competes with other distributors, manufacturers who sell their products directly and providers of equipment and services on a regional and national basis that have similar sales forces and products. Some of our distributor competitors are also dedicated to the O&P industry, but many others are large medical product distributors who also distribute O&P products, particularly orthotic products.
Competitive Strengths
We believe that the combination of the following competitive strengths will help us to grow our businesses by increasing our net revenues, net income and market share:
· Leading market position both in the O&P market place and in the post-acute rehabilitation markets;
· National scale of operations, which better enables us to:
· establish our brand name and generate economies of scale;
· identify and implement best practices throughout our organization;
· collect, aggregate and publish our statistically significant clinical outcomes and patient satisfaction data and metrics;
· offer a single network solution to national and regional shared fabrication facilities;
· identify, test and deploy emerging technology; and
· increase our influence on, and input into, regulatory trends;
· Distribution of, and purchasing power for, O&P components and finished O&P products, which enables us to:
· negotiate greater purchasing discounts from manufacturers and freight providers;
· reduce patient care clinic inventory levels and improve inventory turns through centralized purchasing control;
· access prefabricated and finished O&P products;
· promote the usage by our patient care clinics of clinically appropriate products that also enhance our profit margins; and
· expand the external client base of the distribution business in our Products & Services segment;
· Proven ability to rapidly incorporate technological advances in the fitting and fabrication of O&P devices;
· History of integrating small and medium sized O&P business acquisitions, including 139 O&P businesses between 1997 and 2015, representing over 365 patient care clinics;
· Highly trained clinicians, whom we provide with the highest level of continuing education and training through programs designed to inform them of the latest technological developments in the O&P industry;
· Experienced and committed management team; and
· Beneficial government relations efforts which enables us to educate legislators on the medical benefits and cost effectiveness of O&P services.
Suppliers
We purchase prefabricated O&P devices, components and materials from hundreds of suppliers across the country, which are utilized by our clinicians and technicians in the fabrication of O&P products. These devices, components and materials are used in the products we offer in our patient care clinics throughout the United States. Our Products & Services segment purchases, warehouses and distributes over 24,000 individual products from more than 300 different manufacturers. As of December 31, 2016, only three of our third party suppliers individually accounted for more than 5% of our total annual purchases. These three suppliers accounted for a combined total of 29% of annual purchases.
Sales and Marketing
In our Patient Care segment, primarily through their interaction with and provision of prosthetic or orthotic services to the patients of referring surgeons, physicians and other providers, our individual clinicians in local patient care clinics historically have conducted our sales and marketing efforts. Due primarily to the fragmented nature of the O&P industry, the success of a particular patient care clinic has been largely a function of its local reputation for quality of care, responsiveness and length of service in the local communities.
To augment the efforts of the business segment personnel, we have developed a centralized sales and marketing department, whose efforts target the following:
· Marketing and Public Relations. Our objective is to increase the visibility of the “Hanger” name by building relationships with major referral sources. We also continue to explore creating alliances with certain vendors to market products and services on a nationwide basis.
· Business Development. We have dedicated personnel in most of our operating regions who are responsible for arranging seminars, clinics and forums to educate and consult with patients and to increase the local
community’s awareness of the “Hanger” name. These business development managers also meet with local referral and contract sources to help our clinicians develop new relationships in their markets.
· Insurance Contracts. Our specialty health care company, Linkia, works with national insurance companies to help manage their O&P networks. Linkia is a network management organization dedicated solely to the O&P industry to improve the interface between payors and O&P providers by simplifying network management and administration, in-depth industry expertise and scalability to payors.
Marketing of our services is conducted on a national basis through a dedicated sales force, print and e-commerce catalogs and exhibits at industry and medical meetings and conventions. We use directed marketing to segments of the health care industry, such as orthopedic surgeons, physical and occupational therapists, patient care managers and podiatrists, by providing specialized catalogs focused on their medical specialty.
In our Products & Services segment, we employ dedicated sales professionals that generally are responsible for a geographic region or specific product line.
Acquisition Strategy
Our strategy is to achieve long-term growth through disciplined diversification of our revenue streams, including geographic expansion or the broadening of our continuum of care through acquisitions. One of the primary drivers in executing our acquisition strategy is expanding our ability to serve new patients in new geographic markets.
Once an acquisition is consummated, we integrate and generally centralize certain key functions including IT, marketing, sales, finance and administration to ensure that we can optimize cross-selling opportunities and realize cost efficiencies.
In some of our historical acquisitions, in addition to cash paid at closing, the purchase price has included unsecured subordinated promissory notes (“Seller Notes”) and contingent consideration terms (“earnouts”) associated with the achievement of certain designated collection targets for the acquired business. Earnouts can be used to compromise between our valuation and seller’s expectations regarding purchase price, while providing protection from our overpayment if historical collections are not an accurate indicator of post-closing financial performance of the acquired business.
Our evaluation of the acquired business is based on various factors, including specialized know-how, reputation, geographic coverage, competitive position and service and product offerings, as well as our experience and judgment. Our acquisition strategy is focused on acquiring the expertise of an assembled workforce to continue to build upon the core capabilities of our strategic business platforms and agency brands through the expansion of our service area or service capabilities to better serve our clients.
Acquisition Activity
We stopped making acquisitions subsequent to the first quarter of 2015, both due to the necessity of our utilizing available operating cash flow to fund accounting, legal and other professional fees in connection with our preparation and review of the financial statements, efforts to remediate material weaknesses, and related legal matters, as well as due to the effect of our non-compliance with certain of our debt covenants relating to our failure to meet financial statement reporting requirements. Once we regain timely filing status, and provided no other events or factors emerge that would prevent our use of capital for the purposes of acquisitions, we currently intend to recommence acquisitions of O&P businesses similar to those that we have consummated in prior years.
In 2015, we acquired three O&P businesses with approximately $11.8 million in revenue, operating a total of 15 patient care clinics located in three states. The aggregate purchase price for these businesses was approximately $15.3 million, including approximately $10.2 million in cash, approximately $4.7 million in Seller Notes, approximately $0.4 million working capital adjustments and no contingent consideration. We allocated the purchase price for 2015 acquisitions to the individual net assets acquired and liabilities assumed. The excess of purchase price over the aggregate fair values of the net assets acquired and liabilities assumed was recorded as goodwill. We incurred minimal legal costs and other acquisition related expenses in connection with our 2015 acquisition activity. Acquisition related expenses are included within “General and administrative expenses” in our consolidated statements of operations and comprehensive (loss) income in the period incurred.
Government Regulation
The operations of our business are subject to a variety of federal, state and local governmental regulations. We make every effort to comply with all applicable regulations through compliance programs, policies and procedures, manuals and personnel training. Despite these efforts, we cannot guarantee that we will be in absolute compliance with all regulations at all times. Failure to comply with applicable governmental regulations may result in significant penalties, including exclusion from the Medicare and Medicaid programs, which would have a material adverse effect on our business and financial results.
Fraud and Abuse. Violations of fraud and abuse laws are punishable by criminal and/or civil sanctions, including, in some instances, False Claims Act liability (discussed below), imprisonment and exclusion from participation in federal health care programs, including Medicare, Medicaid, U.S. Department of Veterans Affairs health programs and the Department of Defense’s TRICARE program, formerly known as CHAMPUS. These laws, which include but are not limited to federal and state anti-kickback laws, false claims laws, physician self-referral laws and federal criminal health care fraud laws, are discussed in further detail below. We believe our billing practices, operations and compensation and financial arrangements with referral sources and others materially comply with applicable federal and state requirements. However, we cannot assure that such requirements will always be interpreted by a governmental authority in a manner consistent with our interpretation and application. The failure to comply, even if inadvertent, with any of these requirements could require us to alter our operations with and/or refund payments to the government. Such refunds could be significant and could also lead to the imposition of significant penalties. Even if we successfully defend against any action against us for violation of these laws or regulations, we would likely be forced to incur significant legal expenses and divert our management’s attention from the operation of our business. Any of these actions, individually or in the aggregate, could have a material adverse effect on our business and financial results.
Anti-Kickback Laws. Our operations are subject to federal and state anti-kickback laws. The federal Anti-Kickback Statute (Section 1128B(b) of the Social Security Act) prohibits persons or entities from knowingly and willfully soliciting, offering, receiving or paying any remuneration in any form (including any kickback, bribe or rebate) in return for, or to induce, the referral of persons eligible for benefits under a federal health care program (including Medicare, Medicaid, the U.S. Department of Veterans Affairs health programs and TRICARE), or the ordering, purchasing, leasing, or arranging for, or the recommendation of purchasing, leasing or ordering of, items or services that may be paid for, in whole or in part, by a federal health care program. Courts have held that the statute may be violated when even one purpose (as opposed to a primary or sole purpose) of the remuneration is to induce referrals or other business.
Recognizing that the Anti-Kickback Statute is broad and may technically prohibit beneficial commercial arrangements, the Office of Inspector General of the Department of Health and Human Services has developed regulations addressing certain business arrangements that will offer protection from scrutiny under the Anti-Kickback Statute. These “Safe Harbors” describe activities which may be protected from prosecution under the Anti-Kickback Statute, provided that they meet all of the requirements of the applicable Safe Harbor regulation. For example, the Safe Harbors cover activities such as offering discounts to health care providers and contracting with physicians or other individuals or entities that have the potential to refer business to us that would ultimately be billed to a federal health care program, so long as the discount is properly disclosed and appropriately reflected in any claims or charges.
Failure to qualify for Safe Harbor protection does not automatically mean that an arrangement is illegal. Rather, the facts and circumstances of the arrangement must be analyzed to determine whether there is improper intent to pay or receive remuneration in return for referrals. Conduct and business arrangements that do not fully satisfy one of the Safe Harbors may result in increased scrutiny by government enforcement authorities. In addition, some states have anti-kickback laws that vary in scope and may apply regardless of whether a federal health care program is involved.
Our operations and business arrangements include, for example, discount programs or other financial arrangements with individuals and entities, such as lease arrangements with hospitals and certain participation agreements. Therefore, our operations and business arrangements are required to comply with the anti-kickback laws. Although our business arrangements and operations may not always satisfy all the criteria of a Safe Harbor, we believe that our operations are in material compliance with federal and state anti-kickback statutes. Nonetheless, we cannot ensure that the government’s interpretation of a Safe Harbor provision will always be consistent with our own, and our arrangements may be subject to scrutiny under anti-kickback laws. Noncompliance with such laws can result in a number of enforcement actions, including the imposition of civil monetary penalties and exclusion from federal health care programs.
Medical Device Regulation. We provide, distribute and lease products that are subject to regulation as medical devices by the U.S. Food and Drug Administration (“FDA”) under the Federal Food, Drug and Cosmetic Act (“FDCA”) and accompanying regulations. In our Patient Care segment, with the exception of two products which have been cleared for marketing as prescription medical devices under section 510(k) of the FDCA, we believe that the products we provide, including O&P medical devices, accessories and components, are not Class III devices and thus are exempt from the FDA’s regulations for pre-market clearance or approval requirements and from most requirements relating to the quality system regulation (except for certain record keeping and complaint handling requirements). In our Products & Services segment, ACP manufactures, leases and sells a number of rehabilitation devices that have been cleared or approved for marketing under section 510(k) of the FDCA, and are subject to the requirements of the quality system regulation. All of our device businesses are required to adhere to regulations for medical devices regarding adverse event reporting, establishment registration and product listing, and we are subject to inspection by the FDA for compliance with all applicable requirements. Labeling and promotional materials also are subject to scrutiny by the FDA and, in certain circumstances, by the Federal Trade Commission. Our medical device operations are subject to inspection by the FDA for compliance with applicable FDA requirements, and the FDA has in the past raised compliance concerns in connection with these investigations. We have addressed these concerns and believe we are in compliance with applicable FDA requirements, but we cannot assure that we will be found to be in compliance at all times. Non-compliance could result in a variety of civil and/or criminal enforcement actions, including issuance of a Warning Letter, seizure, examination and inspection of our products and a civil injunction or criminal prosecution, which could have a material adverse effect on our business and results of operations.
Physician Self-Referral Laws. We are also subject to federal and state physician self-referral laws. With certain exceptions, the federal Medicare physician self-referral law (the “Stark Law”) (Section 1877 of the Social Security Act) prohibits a physician from referring Medicare beneficiaries to an entity for “designated health services” including DME and supplies, and prosthetic and orthotic devices and supplies, if the physician or the physician’s immediate family member has a financial relationship with the entity. A financial relationship includes both ownership or investment interests and compensation arrangements. An entity that furnishes designated health services pursuant to a prohibited referral may not present or cause to be presented a claim or bill for such designated health services. Penalties for violating the Stark Law include denial of payment for the service, an obligation to refund any payments received, civil monetary penalties, potential False Claims Act litigation and the possibility of being excluded from the Medicare or Medicaid programs.
Despite the general prohibition on such physician financial relationships, the Stark Law does provide a number of exceptions from liability. For example, with respect to ownership/investment interests, there is an exception under the Stark Law for referrals made to a publicly traded entity in which the physician or the physician’s immediate family member has an investment interest if the entity’s shares are generally available to the public at the time of the designated health service referral, and are traded on certain exchanges, including among others the New York Stock Exchange (“NYSE”) as well as over-the-counter quotation systems including the OTC Markets Group, Inc. (“OTC”) and/or the investment entity had shareholders’ equity exceeding $75.0 million for its most recent fiscal year or as an average during the three previous fiscal years. We meet these tests and, therefore, believe that referrals from physicians who have ownership interests in our stock, or whose immediate family members have ownership interests in our stock, should not result in liability under the Stark Law.
With respect to compensation arrangements, there are exceptions under the Stark Law that permit physicians to maintain certain business arrangements, such as personal service contracts and equipment or space leases, with health care entities to which they refer patients for designated health services. All of the elements of a Stark Law exception must be met in order for the exception to apply. Further, unlike the Anti-Kickback Statute, under the Stark Law liability can result without specific intent to induce referrals. We believe that our compensation arrangements with physicians comply with the Stark Law, either because the physician’s relationship fits fully within a Stark Law exception or because the physician does not generate prohibited referrals. If, however, we receive a prohibited referral, our submission of a bill for services rendered pursuant to such a referral could subject us to sanctions under the Stark Law and applicable state self-referral laws, including false claims liability, potential exclusion and imposition of civil monetary penalties. State self-referral laws may extend the prohibitions of the Stark Law to Medicaid beneficiaries, and there are some indications that the federal government may similarly expand the reach of the law.
False Claims Laws. We are also subject to federal and state laws prohibiting individuals or entities from knowingly presenting, or causing to be presented, claims for payment to third party payors (including Medicare and Medicaid) that are false or fraudulent, are for items or services not provided as claimed, or otherwise contain misleading information. Each of our patient care clinics is responsible for the preparation and submission of reimbursement claims to third party payors for items and services furnished to patients. In addition, our personnel may, in some instances, provide advice on billing and
reimbursement to purchasers of our products. Also, prosecutors and so-called “qui tam” relators (whistleblowers) may claim that a regulatory violation or wrongfully-retained overpayment may be the basis of False Claims Act litigation. Successful relators can receive a share of the recovery in a False Claims Act case ranging from 15% to 30%, depending on whether the government “intervenes” in the case. Penalties in a False Claims Act case may include double or triple damages plus penalties ranging from $10,957 to $21,916 per claim. These penalties are nearly double what they were in prior years. While we endeavor to assure that our billing practices comply with applicable laws, if claims submitted to payors are deemed to be false, fraudulent or for items or services not provided as claimed, we may face liability for presenting or causing to be presented such claims.
Certification and Licensure. Our clinicians and/or certain operating units may be subject to certification or licensure requirements under the laws of some states. Most states do not require separate licensure for clinicians. However, several states currently require clinicians to be certified by an organization such as the ABC. The ABC conducts a certification program for clinicians and an accreditation program for patient care clinics. The minimum requirements for new certified clinicians are a college degree, completion of an accredited master’s degree program, one to four years of residency at a patient care clinic under the supervision of a certified clinician and successful completion of certain examinations. Minimum requirements for an accredited patient care clinic include the presence of a certified clinician and specific plant and equipment requirements.
While we endeavor to comply with all state licensure requirements, we cannot assure that we will be in compliance at all times with these requirements, or how they may be interpreted or re-interpreted by the various state and local agencies. Failure to comply with state licensure requirements could result in suspension or termination of licensure, civil penalties, termination of our Medicare and Medicaid agreements, and repayment of amounts received from Medicare and Medicaid for services and supplies furnished by an unlicensed individual or entity.
HIPAA Violations. The Health Insurance Portability and Accountability Act (“HIPAA”) provides criminal penalties for, among other offenses: health care fraud; theft or embezzlement with respect to a health care benefit program; false statements in connection with the delivery of or payment for health care benefits, items or services; and obstruction of criminal investigation of health care offenses. Unlike other federal laws, these offenses are not limited to federal health care programs.
In addition, HIPAA authorizes the imposition of civil monetary penalties where a person offers or pays remuneration to any individual eligible for benefits under a federal health care program that such person knows or should know is likely to influence the individual to order or receive covered items or services from a particular provider, clinician or supplier. Excluded from the definition of “remuneration” are incentives given to individuals to promote the delivery of preventive care (excluding cash or cash equivalents), incentives of nominal value and certain differentials in or waivers of coinsurance and deductible amounts.
These laws may apply to certain of our operations. As noted above, we have established various types of discount programs and other financial arrangements with individuals and entities. We also bill third party payors and other entities for items and services provided at our patient care clinics. While we endeavor to ensure that our discount programs and other financial arrangements and billing practices comply with applicable laws, such programs, arrangements and billing practices could be subject to scrutiny and challenge under HIPAA.
Confidentiality and Privacy Laws. The Administrative Simplification Provisions of HIPAA, and their implementing regulations, set forth privacy standards and implementation specifications concerning the use and disclosure of individually identifiable health information (referred to as “protected health information”) by health plans, health care clearinghouses and health care providers that transmit health information electronically in connection with certain standard transactions (“Covered Entities”). HIPAA further requires Covered Entities to protect the confidentiality of protected health information by meeting certain security standards and implementation specifications. In addition, under HIPAA, Covered Entities that electronically transmit certain administrative and financial transactions must utilize standardized formats and data elements (the “transactions/code sets standards”). HIPAA imposes civil monetary penalties for non-compliance, and, with respect to knowing violations of the privacy standards, or violations of such standards committed under false pretenses or with the intent to sell, transfer or use protected health information for commercial advantage, criminal penalties. Certain agents of Covered Entities (“business associates”) also have HIPAA responsibilities and liabilities. We have business associates and are business associates to other Covered Entities. We believe that we are subject to the Administrative Simplification Provisions of HIPAA and are taking steps to meet applicable standards and implementation specifications. The new requirements have had a significant effect on the manner in which we handle health data and communicate with payors.
In addition, state confidentiality and privacy laws may impose civil and/or criminal penalties for certain unauthorized or other uses or disclosures of protected health information. We are also subject to these laws. While we endeavor to assure that our operations comply with applicable laws governing the confidentiality and privacy of protected health information, we could face liability in the event of a use or disclosure of protected health information in violation of one or more of these laws.
Personnel and Training
None of our employees are subject to a collective bargaining agreement. We believe that we have satisfactory relationships with our employees and strive to maintain these relationships by offering competitive benefit packages, training programs and opportunities for advancement. We have approximately 4,800 employees of which approximately 1,500 are clinicians.
We provide a series of ongoing training programs to improve the professional knowledge of our clinicians. For example, we have an annual education fair that is attended by our clinicians, leaders and other employees. This annual meeting consists of lectures and seminars covering many clinical topics including the latest technology and process improvements, business courses and other courses that allow the clinicians to fulfill their ongoing continuing education requirements.
Insurance
We currently maintain insurance coverage for professional liability, product liability, general liability, directors’ and officers’ liability, workers’ compensation, executive protection, property damage and other lines of insurance. Our general liability insurance coverage is $1.0 million per occurrence, with a $25.0 million umbrella insurance policy. The coverage for professional liability, product liability and workers’ compensation is self-insured with both individual specific claim and aggregate stop-loss policies to protect us from either significant individual claims or dramatic changes in our loss experience. Based on our experience and prevailing industry practices, we believe our coverage is adequate as to risks and amount.
Our Website
Our website is http://www.hanger.com. We make available free of charge, on or through our website, our Annual Report on Form 10-K, Quarterly Reports on Form 10-Q, Current Reports on Form 8-K, Section 16 filings (i.e. Forms 3, 4 and 5), proxy statements and other documents as required by applicable law and regulations as soon as reasonably practicable after electronically filing such reports with the SEC at http://www.sec.gov. The public may read and copy any materials that we file with the SEC at the SEC’s Public Reference Room at 100 F Street N.E., Washington, DC 20549. The public may obtain information on the operation of the Public Reference Room by calling the SEC at 1-800-SEC-0330 (1-800-732-0330). The SEC maintains an Internet site (http://www.sec.gov) that contains reports, proxy and information statements and other information regarding issuers that file electronically with the SEC. Our website also contains the charters of the Audit Committee, Corporate Governance and Nominating Committee, Compensation Committee and Quality and Technology Committee of our Board of Directors; our Code of Business Conduct and Ethics for Directors and Employees, which includes our principal executive, financial and accounting officers; as well as our Corporate Governance Guidelines. Information contained on our website is not part of this report.
Set forth below are certain risk factors that could adversely affect our business, results of operations and financial condition. You should carefully read the following risk factors, together with the consolidated financial statements, related notes and other information contained in this Annual Report on Form 10-K. This Annual Report on Form 10-K contains forward-looking statements that contain risks and uncertainties. Please read the cautionary notice regarding forward-looking statements in Item 7. under the heading “Management’s Discussion and Analysis of Financial Condition and Results of Operations” in connection with your consideration of the risk factors and other important factors that may affect future results described below.
The restatement of our previously issued consolidated financial statements was time-consuming and expensive and could expose us to additional risks that would adversely affect our financial position, results of operations and cash flows and, as a result, the value of our common stock.
As described in our 2014 Form 10-K, we restated our previously issued consolidated financial statements for the first two quarters in fiscal year 2014, for the fiscal years ended December 31, 2013 and 2012 and each of the quarters in fiscal year 2013. We also restated our financial results for the fiscal years ended December 31, 2011 and 2010 (each unaudited), as summarized in Item 6. “Selected Financial Data” to our 2014 Form 10-K. The Restatement was time-consuming and expensive and could expose us to a number of additional risks that would adversely affect our financial position, results of operations and cash flows as well as investor confidence and, as a result, the value of our common stock.
In particular, we incurred, and continue to incur, significant expense, including audit, legal, consulting and other professional fees, in connection with the Restatement and the ongoing remediation of material weaknesses in our internal control over financial reporting. We have taken a number of steps that we have deemed appropriate and reasonable to strengthen our accounting function and reduce the risk of future restatements, including adding internal personnel and hiring outside consultants, as described in more detail in Item 9A. “Controls and Procedures” contained in this Annual Report on Form 10-K. To the extent these steps are not successful, we may need to incur additional time and expense to address accounting issues that could arise in the future. Our management’s attention has also been, and may further be, diverted from the operation of our business as a result of the time and attention required to address the ongoing remediation of material weaknesses in our internal controls.
We are also subject to claims, investigations and proceedings arising out of the misstatements contained in our previously issued financial statements. For additional information regarding this litigation, see Item 3. “Legal Proceedings” in this Annual Report on Form 10-K.
We have identified material weaknesses in our internal control over financial reporting which could, if not remediated, adversely affect our ability to report our financial condition and results of operations in a timely and accurate manner, negatively impacting investor confidence and, as a result, the value of our common stock.
Our management is responsible for establishing and maintaining adequate internal control over financial reporting, as defined in Rule 13a-15(f) under the Securities Exchange Act of 1934 (the “Exchange Act”), and is required to evaluate the effectiveness of these controls and procedures on a periodic basis and publicly disclose the results of these evaluations and related matters in accordance with the requirements of Section 404 of the Sarbanes-Oxley Act of 2002. Management has identified numerous material weaknesses that existed as of December 31, 2015 and December 31, 2016, including material weaknesses relating to the ineffectiveness of the control environment. See Item 9A. “Controls and Procedures” in this Annual Report on Form 10-K. As a result of these material weaknesses, our management concluded that our internal controls and procedures were not effective as of December 31, 2015 and December 31, 2016.
A “material weakness” is a deficiency, or a combination of deficiencies, in internal control over financial reporting, such that there is a reasonable possibility that a material misstatement of our annual or interim consolidated financial statements will not be prevented or detected on a timely basis. We are actively engaged in developing and implementing remedial measures designed to address these material weaknesses. Our remedial measures are not complete and are ongoing. Although we are working to remedy the ineffectiveness of our internal control over financial reporting, there can be no assurance as to when the remedial measures will be fully developed, the timing and effectiveness of our implementation of such remedial measures or the aggregate cost of implementation. Until our remedial measures are fully implemented, our management will continue to devote significant time and attention to these efforts. If we do not complete our remediation in a timely fashion, or at all, or if our remedial measures are inadequate, there will continue to be an increased risk that we will be unable to timely file
future periodic reports with the SEC and that our future consolidated financial statements could contain misstatements that will be undetected. If we are unable to report our results in a timely and accurate manner, then we may not be able to comply with the applicable covenants in our credit agreements, and may be required to seek additional amendments or waivers under these credit agreements, which could adversely impact our liquidity and financial condition. Further and continued determinations that there are material weaknesses in the effectiveness of our internal control over financial reporting could reduce our ability to obtain financing or could increase the cost of any financing we obtain and require additional expenditures of both money and our management’s time to comply with applicable requirements.
Any failure to implement or maintain required new or improved controls, or any difficulties we encounter in their implementation, could result in additional material weaknesses or material misstatements in our consolidated financial statements. Any new misstatement could result in a further restatement of our consolidated financial statements, cause us to fail to meet timely our periodic reporting obligations with the SEC, cause us to violate debt covenants, reduce our ability to obtain financing or cause investors to lose confidence in our reported financial information, leading to a decline in the value of our common stock. We cannot assure you that we will not discover additional weaknesses in our internal control over financial reporting.
Furthermore, as we grow our business, our disclosure controls and internal controls over financial reporting will become more complex, and we may require significantly more resources to ensure the effectiveness of these controls. If we are unable to continue upgrading our internal controls, reporting systems and IT in a timely and effective fashion, then we may require additional management time and attention and other resources to be devoted to assist in compliance with the disclosure and financial reporting requirements and other rules that apply to public companies, which could adversely affect our business, financial position and results of operations.
The restatement of our previously issued financial results has resulted in private litigation and could result in private litigation judgments that could have a material adverse impact on our results of operations and financial condition.
We are subject to shareholder derivative litigation relating to certain of our previous public disclosures. For additional discussion of this litigation, see Item 3. “Legal Proceedings” in this Annual Report on Form 10-K. Our management has been and may be required in the future to devote significant time and attention to this litigation, and this and any additional matters that arise could have a material adverse impact on our results of operations and financial condition as well as on our reputation. While we cannot estimate our potential exposure in these matters at this time, we have already incurred significant expense defending this litigation and expect to continue to need to incur significant expense in the defense.
The existence of the litigation may have an adverse effect on our reputation with referral sources and our patients themselves, which could have an adverse effect on our results of operations and financial condition.
Our failure to prepare and timely file our periodic reports with the SEC limits our access to the public markets to raise debt or equity capital, impacts our ability to obtain alternative financing and could have negative consequences under the terms of our existing credit agreements.
We have not made timely periodic reporting filings with the SEC since the filing of our Quarterly Report on Form 10-Q for the quarter ended June 30, 2014. We did not file our Annual Reports on Form 10-K for 2014, 2015 or 2016, or our Quarterly Reports on Form 10-Q for 2015, 2016 or 2017, within the time frame required by the SEC. As a result of our late SEC filings, we are limited in our ability to access the public markets to raise debt or equity capital, which could prevent us from pursuing transactions or implementing business strategies that we believe would be beneficial to our business.
As disclosed in the 2014 Form 10-K, we entered into amendments to the Credit Agreement, dated as of June 17, 2013, among us, the lenders from time to time party thereto and Bank of America, N.A. (the “Credit Agreement”), that waived certain actual or potential defaults and amended various covenants and other provisions. We entered into the Sixth Amendment and Waiver, effective as of June 22, 2017, with respect to our Credit Agreement (the “Sixth Amendment and Waiver”), which waives defaults and events of default under the Credit Agreement and also modifies certain of the terms and covenants contained in the Credit Agreement, including increasing the applicable interest rates, with some of the modifications terminating at such time as we meet various conditions. The Sixth Amendment also extended the deadline by which we must deliver to the Agent under the Credit Agreement our audited financial statements and related audit report for the fiscal year ended December 31, 2016, from August 15, 2017 to February 15, 2018. On August 1, 2016, we entered a Term B Credit Agreement that provides for a $280 million senior unsecured term loan facility under which all outstanding principal is due at
maturity on August 1, 2019 (the “Term B Credit Agreement,” and together with the Credit Agreement the “Credit Agreements”) and all borrowings bear interest at a fixed rate per annum equal to 11.50% payable quarterly in arrears.
We entered into the Term B Amendment, effective as of June 23, 2017, with respect to our Term B Credit Agreement (the “Term B Amendment”) which extended the deadline by which we must deliver to Wilmington Trust, National Association, as the Term B agent our audited financial statements, the related audit report and a consolidated budget for the fiscal year ended December 31, 2016, from August 15, 2017 to February 15, 2018. The Amendment also extends the deadline by which the Compliance Date must occur from August 15, 2017 until February 15, 2018.
If we fail to comply with the terms of our Credit Agreement as amended by the Fifth Amendment and Waiver and the Sixth Amendment and Waiver or the terms of our Term B Credit Agreement, as amended by the Term B Amendment, which include financial ratio covenants and the obligation to provide audited financial statements for the year ended December 31, 2017 by March 31, 2018, or if we are unsuccessful at further amending or waiving the Credit Agreement when the existing amendments and waivers expire (if such further amendment and waivers become necessary), then we may be subject to numerous penalties, including but not limited to the acceleration of all of our debt outstanding pursuant to the Credit Agreements. In the event that the debt was to be accelerated, then we may need to seek alternative financing to satisfy our financial obligations. This alternative financing may not be available to us on terms that are favorable to us, or at all.
In addition, the Credit Agreement expires on June 17, 2018. At the time the Credit Agreement expires, we will need to seek a new credit agreement with current or new lenders to satisfy our ongoing liquidity needs and financial obligations. This new credit agreement may not be available to us at favorable terms or at all.
See Note N - “Long-Term Debt” to our consolidated financial statements for additional information regarding the Credit Agreements and our long-term debt.
We have substantial indebtedness, and our failure to comply with the covenants and payment requirements of that indebtedness may subject us to increased interest expenses, lender consent and amendment costs or adverse financial consequences.
As of September 30, 2017, we had approximately $487.6 million in indebtedness. This current level of indebtedness is comprised of approximately $191.7 million of borrowings under our Credit Agreement, approximately $270.7 million of borrowings under our Term B Credit Agreement and approximately $25.2 million of indebtedness related to other financing obligations and seller notes. Under these Credit Agreements, we are required to comply with certain financial covenants and other provisions. In addition to other requirements, these provisions include requirements that we timely prepare our financial statements and timely receive audits on our annual financial statements, meet certain financial ratio requirements and timely pay interest and principal when due. Due to our material weaknesses and other factors, we did not file our 2014 annual financial statements until May 12, 2017. Additionally, we have failed in our compliance with certain of our financial covenants. These failures on our part have resulted in defaults under our debt agreements. To remedy these defaults, we have had to provide lenders with consent and amendment fees, have experienced increasing constraints on our ability to borrow under our debt agreements, have been required to pay higher interest costs and have been required to adhere to increased restrictions on the use of the funds we borrow. To the extent that we fail to meet our financial statement requirements in future periods, our operating trends do not enable us to meet our financial covenant requirements, we are unable to pay interest or principal when due or we are unable to meet other covenants and requirements contained within our Credit Agreements, we may default under one or both of our Credit Agreements. A default under one or both of these agreements could result in further increases in consent or amendment fees to lenders, further increases in interest costs, the imposition of additional constraints on borrowing by our lenders or potentially more serious liquidity constraints and adverse financial consequences, including reductions in the value of our common stock or the necessity of seeking protection from creditors under bankruptcy laws. See the “Liquidity and Capital Resources” section in this Management’s Discussion and Analysis for further discussion.
Additionally, our current Credit Agreements include variable interest rates. In the event that interest rates rise, we will be required to pay greater interest expenses, which will have an adverse effect on our income from operations and financial condition.
To remedy issues we may encounter with meeting our debt obligations, or for other purposes, we may find it necessary to seek further refinancing of our indebtedness, and may do so with debt instruments that are more costly than our existing instruments (and which will rank senior to our equity securities), or we may issue additional equity securities which may
dilute the ownership interests or value of our existing shareholders. These actions may decrease the value of our equity securities.
Health care reform has initiated significant changes to the United States health care system and we expect to see further changes in the health care system in the future.
Various health care reform provisions became law upon enactment of the Patient Protection and Affordable Care Act, Pub. L. No. 111-148, on March 23, 2010 (the “Affordable Care Act”). The reforms contained in the Affordable Care Act have impacted our business. Continued political, economic and regulatory influences are subjecting the health care industry in the United States to fundamental change. Further changes relating to the health care industry and in health care spending may adversely affect our revenue. We anticipate that Congress will continue to review and assess alternative health care delivery and payment systems and may in the future propose and adopt legislation effecting additional fundamental changes in the health care system. Although efforts at replacing the Affordable Care Act and overhauling the health care system have currently stalled in Congress, health care reform remains a priority for the Trump Administration and for many members of Congress. We cannot assure you as to the ultimate content, timing or effect of changes, nor is it possible at this time to estimate the impact of potential legislation on our business. However, although the specific reforms to the current health care system cannot be accurately predicted at this time, such changes could have a considerable impact on how health care is reimbursed, particularly on the coverage for certain types of services and on the reimbursement levels provided by government sources.
Changes in government reimbursement levels could adversely affect our Patient Care segment’s net revenue, cash flows and profitability.
We derived approximately 54.1%, 53.4% and 50.9% of our net revenue for the years ended December 31, 2016, 2015 and 2014, respectively, of our net revenue from reimbursements for O&P services and products from programs administered by Medicare, Medicaid and the U.S. Department of Veterans Affairs. Each of these programs set reimbursement levels for the O&P services and products provided under their program. If these agencies reduce reimbursement levels for O&P services and products in the future, our net revenues could substantially decline. In addition, the percentage of our net revenues derived from these sources may increase as the portion of the U.S. population over age 65 continues to grow, making us more vulnerable to reimbursement reductions by these organizations. Reduced government reimbursement levels could result in reduced private payor reimbursement levels because fee schedules of certain third party payors are indexed to Medicare reimbursement levels. Furthermore, the health care industry is experiencing a trend towards cost containment as government and other third party payors seek to impose lower reimbursement rates and negotiate reduced contract rates with service providers. This trend could adversely affect our net revenues. For example, a number of states have reduced their Medicaid reimbursement rates for O&P services and products, or have reduced Medicaid eligibility, and others are in the process of reviewing Medicaid reimbursement policies generally, including for prosthetic and orthotic devices.
Medicare provides for reimbursement for O&P products and services based on prices set forth in fee schedules for ten regional service areas. Medicare prices are adjusted each year based on the CPI-U unless Congress acts to change or eliminate the adjustment. The Medicare price (decreases)/increases for 2016, 2015, and 2014 were (0.4%), 1.5%, and 1.0%, respectively. The Affordable Care Act (“ACA”) changed the Medicare inflation factors applicable to O&P (and other) suppliers. The annual updates for years subsequent to 2011 are based on the percentage increase in the CPI-U for the 12-months ended in June of the previous year. Section 3401(m) of the ACA required that for 2011 and each subsequent year, the fee schedule update factor based on the CPI-U for the 12-months ended in June of the previous year is to be adjusted by the annual change in economy-wide private nonfarm business multifactor productivity (the “MFP Adjustment”). The MFP Adjustment may result in the percentage increase being less than zero for a year and may result in payment rates for a year being less than such payment rates for the preceding year. Although the decrease in the Medicare O&P fee schedule for 2016 is not unprecedented, it is the first time that there has been a decrease since 2011, when the Productivity Adjustment was first introduced following the ACA. The Centers for Medicare & Medicaid Services (“CMS”) has not yet issued a final rule implementing these adjustments for years beyond 2011, but has indicated in a proposed rule that it will do so as part of the annual program instructions to the O&P fee schedule updates. See 75 Fed. Reg. 40040, 40122-25 (July 13, 2010). If the U.S. Congress were to legislate additional modifications to the Medicare fee schedules, our net revenues from Medicare and other payors could be adversely and materially affected.
Alternative models of reimbursement for durable medical equipment, prosthetics, orthotics and supplies (“DMEPOS”) may also affect our business. The Medicare Prescription Drug, Improvement, and Modernization Act of 2003 requires that Medicare replace the current fee schedule payment methodology for certain DMEPOS items and services with “single
payment amounts” determined through a competitive bidding process, and CMS has issued regulations finalizing the methodology for adjusting fee schedule amounts for such items. See 79 Fed, Reg. 66120, 66123 (November 6, 2014). The types of DMEPOS subject to competitive bidding under the statute include: oxygen and oxygen equipment; continuous positive airway pressure devices, single and bi-level; standard manual and power wheelchairs, scooters and walkers; Group 2 complex rehabilitative power wheelchairs; hospital beds, commode chairs, patient lifts and seat lifts; support surfaces or pressure reducing mattresses and overlays; enteral nutrients, supplies and equipment; negative pressure wound therapy pumps; infusion pumps; transcutaneous electrical nerve stimulation devices; standard nebulizers; and certain mail-order diabetic testing supplies. Under the DMEPOS Competitive Bidding Program, suppliers compete to submit bids for selected products, and the Medicare suppliers offering the best price, in addition to meeting applicable quality and financial standards, are awarded contracts to supply the designated products and services to Medicare beneficiaries in specified competitive bidding areas. Although our product offerings currently subject to competitive bidding do not comprise a significant portion of our business, it is possible that the DMEPOS Competitive Bidding Program may expand to include other types of products we offer, or that other payors will adopt similar models for reimbursement, which may negatively affect our net revenue.
The Budget Control Act of 2011 required, among other things, mandatory across-the-board reductions in Federal spending, or “sequestration”. While delayed by the American Taxpayer Relief Act of 2012, President Obama issued a sequestration order on March 1, 2013. For services provided on or after April 1, 2013, Medicare fee-for-service claim payments, including those for DMEPOS as well as claims under the DMEPOS Competitive Bidding Program, are reduced by 2 percent. On November 2, 2015, President Obama signed the Bipartisan Budget Act of 2015 into law, which provided for two years of increases to discretionary spending to be offset by an additional year of Medicare sequestration, through 2025. This is a claims payment adjustment with limited impact on us; no permanent reductions in the Medicare DMEPOS fee schedule have been made as a result of sequestration, therefore additional reimbursements from Medicaid, the VA and commercial payors who use the Medicare fee schedule as a basis for reimbursement have not been impacted.
CMS may also develop policies to limit Medicare coverage of specific products and services. Medical administrative contractors may issue local coverage determinations (“LCD”) that limit coverage for a particular item or service in their jurisdiction only. This can lead to state-by-state variation in Medicare coverage for some items and services. Any LCD that negatively impacts orthotic or prosthetic reimbursement would negatively affect our revenue.
Finally, patients may continue to move to Medicare Advantage plans from traditional Medicare plans, which will change the nature of the reimbursement received by us from the traditional Medicare program and negatively affect our net revenue.
If the average rates that commercial payors pay us decline significantly, then it would have a material adverse effect on our net revenues, earnings and cash flows.
We derived approximately 39.2%, 39.6% and 41.4% of our net revenue for the years ended December 31, 2016, 2015 and 2014, respectively, from reimbursements for O&P services and products for patients who have commercial payors as their primary payor. We continue to experience downward pressure on some of our commercial payment rates as a result of general conditions in the market, recent and future consolidations among commercial payors, increased focus on O&P services and products and other factors. There is no guarantee that commercial payment rates will not be materially lower in the future, particularly given the fluctuations in government reimbursement rates.
We are continuously in the process of negotiating new agreements and renegotiating agreements that are up for renewal with commercial payors, who tend to be aggressive in their negotiations with us. Sometimes many significant agreements are up for renewal or being renegotiated at the same time. In the event that our continual negotiations result in overall commercial rate reductions in excess of overall commercial rate increases, the cumulative effect could have a material adverse effect on our financial results. Consolidations in the commercial payor market have significantly increased the negotiating leverage of commercial payors. Our negotiations with payors are also influenced by competitive pressures, and we may experience decreased contracted rates with commercial payors or experience decreases in patient volume as our negotiations with commercial payors continue. If the average rates that commercial payors pay us decline significantly, or if we see a decline in commercial patients, it would have a material adverse effect on our revenues, earnings and cash flows.
Changes in government reimbursement levels could adversely affect our Products & Services segment’s net revenues, cash flows and profitability.
In addition to the risks to our Patient Care segment businesses discussed previously, changes in government reimbursement levels could also adversely affect the net revenues, cash flows and profitability of the businesses in our Products & Services
segment. In particular, a significant majority of our therapeutic services sales involve devices and related services provided to SNFs and similar businesses. Reductions in government reimbursement levels to SNFs have caused, and could continue to cause, such SNFs to reduce or cancel their use of our therapeutic service devices and modalities, negatively impacting net revenues, cash flows and profitability. For example, in July 2011 CMS announced an across the board reduction of approximately 11% in SNF reimbursement levels, which negatively impacted the demand for our devices and treatment modalities. Although CMS has announced increases in SNF reimbursement levels in the years since (the agency announced an increase of 1.3% for FY 2014, 2.0% for FY 2015, 1.4% for FY 2016, 2.4% for FY 2017, and 1.0% for FY 2018), we cannot predict whether any other changes to reimbursement levels will be implemented, or if implemented what form any changes might take. Further, the Department of Health & Human Services Office of Inspector General (“OIG”) has indicated concerns with the Medicare payment system for SNFs and has suggested that the payment system needs to be reevaluated. OIG’s specific concerns relate to issues such as Medicare payments that exceed SNFs’ costs, how Medicare pays for therapy based primarily on the volume of services rather than beneficiary characteristics, and the high error rate for SNF billing. Concerns such as these may result in further changes to SNF reimbursement levels and processes, even if they do not directly relate to O&P services.
We depend on reimbursements by third party payors, as well as payments by individuals, which could lead to delays and uncertainties in the reimbursement process.
We receive a substantial portion of our payments for health care services on a fee for service basis from third party payors, including Medicare and Medicaid, private insurers and managed care organizations. We estimate that we have received approximately 93.3%, 93.0% and 92.3% of our net revenues from such third party payors during 2016, 2015 and 2014, respectively. We estimate that such amounts included approximately 30.5%, 30.3% and 29.4% from Medicare in 2016, 2015 and 2014, respectively, 14.8%, and 14.2% and 12.8% from Medicaid programs in 2016, 2015 and 2014, respectively. In addition, we estimate net revenues from the U.S. Department of Veterans Affairs (“VA”) were 8.8%, 8.9% and 8.7% in 2016, 2015 and 2014, respectively.
The reimbursement process is complex and can involve lengthy delays. Third party payors continue their efforts to control expenditures for health care, including proposals to revise reimbursement policies. While we recognize revenue when health care services are provided, there can be delays before we receive payment. In addition, third party payors may disallow, in whole or in part, requests for reimbursement based on determinations that certain amounts are not reimbursable under plan coverage, that services provided were not medically necessary or that additional supporting documentation is necessary. Retroactive adjustments may change amounts realized from third party payors. Third party payors may require pre-authorizations for certain services and/or devices, which may result in a delay in our ability to provide services or to provide services at all. Additionally, we may see an increase in bundled payment models, which can result in delays before we receive payment or no payment at all for certain services.
Changes in government reimbursement levels and policies such as those described above may also contribute to uncertainties surrounding the reimbursement process. We are subject to governmental audits of our reimbursement claims under Medicare, Medicaid, the VA and other governmental programs and may be required to repay these agencies if found that we were incorrectly reimbursed. Delays and uncertainties in the reimbursement process may adversely affect accounts receivable, increase the overall costs of collection and cause us to incur additional borrowing costs.
We also may not be paid with respect to co-payments and deductibles that are the patient’s financial responsibility. Many of the plans offered on the state health insurance exchanges have high deductibles and require coinsurance that patients cannot afford to pay. Amounts not covered by third party payors are the obligations of individual patients from whom we may not receive whole or partial payment. We also may not receive whole or partial payments from uninsured and underinsured individuals. In such an event, our earnings and cash flow would be adversely affected, potentially affecting our ability to maintain our restrictive debt covenant ratios and meet our financial obligations.
Additionally, employer based plans and other individual plans are increasingly relying on “high deductible” plan designs. As their participation in health plans with these high deductible designs increases, our patients will face greater financial burdens and participatory costs that may affect their decisions regarding the timing of their replacement of their devices. Due to cost considerations, they may seek to repair or refurbish their existing devices and delay the purchase of new replacement devices, which will adversely affect our revenues and our profitability.
The risks associated with third party payors, co-payments and deductibles and the inability to monitor and manage accounts receivable successfully could still have a material adverse effect on our business, financial condition and results of
operations. Furthermore, our collection policies or our provisions for allowances for Medicare, Medicaid and contractual discounts and doubtful accounts receivable may not be adequate.
Due to constraints in the growth of our rates of reimbursement, we may face cost pressures that adversely affect our profitability.
Due to increased pressures on governmental and commercial payors to seek ways of reducing the costs of care, those payors have and may continue to seek ways to reduce growth in the rate of our reimbursement for the services we provide. This constraint in the rate of growth in reimbursement may adversely affect our profitability as we experience increases in the wages, materials and other costs necessary to the conduct of our business. These cost increases may adversely affect our profitability and our profit margins.
Given the complexities and demands related to reimbursement, we may fail to adequately provide the staffing and systems necessary to ensure we effectively manage our reimbursement processes.
The nature of our business requires that we are effective in the assessment of patient eligibility, the process of pre-authorization, the recordation and collection of provider documentation, the timely and complete submission of claims for reimbursement, the application of cash receipts to patient accounts, the timely response to payor denials and the conduct of collection activities. If we fail to provide adequate or qualified staffing, we could incur reductions in the amount of reimbursement we receive for the O&P services that we provide.
We face periodic reviews, audits and investigations under our contracts with federal and state government agencies, and these audits could have adverse findings that may negatively impact our business.
We contract with various federal and state governmental agencies to provide O&P services. Pursuant to these contracts, we are subject to various governmental reviews, audits and investigations to verify our compliance with the contracts and applicable laws and regulations. Any adverse review, audit or investigation could result in:
· refunding of amounts we have been paid pursuant to our government contracts;
· imposition of fines, penalties and other sanctions on us;
· loss of our right to participate in various federal programs;
· damage to our reputation in various markets; or
· material and/or adverse effects on our business, financial condition and results of operations.
In recent years we have seen a significant increase in Medicare audits, including RAC audits, CERT audits and MAC prepayment audits. In addition, ZPICs are responsible for the identification of suspected fraud through medical record review. Medicare has also recently implemented the new TPE prepayment audit. We believe that Medicare audits, inquiries and investigations will continue to occur from time to time in the ordinary course of our business. Medicare audits could have a material and adverse effect on our business financial condition and results of operations, particularly if we are unsuccessful at final adjudication.
Consolidation of manufacturers within the O&P industry may adversely affect our business by increasing prices we pay for certain devices and components.
We depend on a limited number of manufacturers who supply us with certain key devices and components used in the prostheses we provide to our patients, particularly with respect to high technology components. These manufacturers are subject to a consolidation trend within the O&P industry. To the extent this trend continues, consolidation amongst certain manufacturers could result in a sole or limited source for certain high technology devices and components used in the devices we provide to patients. Any such consolidation could require us to pay increased prices for such devices and components, which could significantly reduce our gross margin and profitability and have a material adverse effect on our business.
We are subject to numerous federal, state and local governmental regulations, noncompliance with which could result in significant penalties that could have a material adverse effect on our business.
A failure by us to comply with the numerous federal, state and/or local health care and other governmental regulations to which we are subject, including the regulations discussed under “Government Regulation” in Item 1. “Business” above, could result in significant penalties and adverse consequences, including exclusion from the Medicare and Medicaid programs, which could have a material adverse effect on our business.
Within our Products & Services segment, we provide certain equipment and consultative services to SNFs, who, due to reimbursement pressures, may choose to discontinue our services or seek alternative arrangements for the provision of this equipment.
Approximately $57.4 million of our net revenue in 2016 related to recurring revenues derived from providing therapeutic equipment and related consultative services to SNFs. SNFs have been experiencing reimbursement pressures which could adversely impact our business with them. To reduce costs, these facilities could choose to forgo our services, or seek alternative arrangements for the provision of the equipment we provide them, thereby reducing our revenue, earnings and could adversely impact the carrying value of our goodwill and other intangible assets.
Completing the implementation of NextGen, our comprehensive clinic management system, could interfere with our patient care clinic operations and adversely affect our business, financial condition and results of operations.
We depend on our IT infrastructure to achieve our business objectives. Beginning in late 2013, we commenced the roll-out of a new patient management and electronic health record system in our patient care clinics. In the third quarter of 2014, we halted the roll-out due to the negative impact the roll-out had on revenue cycle management. We have revised, updated and reduced the amount of customizations made to the system, which we now refer to as NextGen. We have also substantially improved our revenue cycle management function, and are currently in the process of completing the roll-out of NextGen, and anticipate the roll-out to continue through the first half of 2019. Any disruptions, delays or complications in the implementation process, or any deficiencies in the design, operation or expected performance of the NextGen system, could result in higher than expected implementation costs, the diversion of management’s and other employees’ attention from the day-to-day operations of our patient care clinics, including scheduling patient visits, and other disruptions to our patient care business. Any of these consequences could have an adverse impact on our revenue or costs, billing and related accounts receivable collections, all of which impacts cash flow and could materially and adversely affect our business, financial condition and results of operations.
To address our business needs and weaknesses in financial controls, we will likely be required to upgrade certain of our operational and financial systems in future years. If we fail in the selection or implementation of such systems, or fail to maintain our existing systems, our business and financial results could be adversely affected.
We are highly dependent on our ability to procure materials and componentry, manage our inventories, support our patient encounters and to otherwise support the administrative requirements associated with our human resource, financial and other needs. We may not have sufficient financial capacity to implement such systems, or may fail in our selection and implementation of such systems. The failure to implement systems in a timely manner may adversely affect our ability to establish an effective control environment. If we are delayed in the implementation of systems, and existing systems are not adequately maintained, we could experience adverse interruptions in our ability to operate, or experience excessive costs associated with the remediation of consequential systems issues. Additionally, our failure to correctly select and implement systems could cause operational disruptions, delays, duplicative operating costs or other financial burdens which could adversely affect our business and financial condition.
Our products and services face the risk of technological obsolescence, which, if realized, could have a material adverse effect on our business.
The medical device industry is characterized by rapid and significant technological change. There can be no assurance that third parties will not succeed in developing and marketing technologies, products or services that are more effective than ours or that would render our products and services obsolete or noncompetitive. Additionally, new surgical procedures and medications could be developed for diabetes, trauma associated with accidents or physical injury, tumors, infection or musculoskeletal disorders of the back, extremities or joints that would replace or reduce the importance of our prosthetic and orthotic products and services. Accordingly, our success will depend upon our ability to respond to future medical and technological changes that may impact the demand for our prosthetic and orthotic products and services.
Our failure to economically procure necessary components and to conduct timely and effective inventories of the materials and components we use in our business could result in an adverse effect on our business, financial condition and results of operations.
Our business involves the use of materials and componentry we acquire from third party manufacturers. If manufacturers critical to our business substantially increase the cost of the components they sell to us, then our inability to acquire the necessary materials and components on a cost effective basis may adversely affect revenues and earnings. Additionally, to successfully perform our business, it is necessary that we conduct timely and thorough inventories of our raw materials and Work in Process (“WIP”). The conduct of these inventories are costly and time consuming. If we encounter issues in their conduct, given that our clinicians oversee the inventory processes which occur in our clinic locations, remedial procedures can disrupt our ability to see and treat patients, and thereby adversely affect our revenues and profitability.
Our common stock was delisted from the NYSE and moved to the OTC, affecting the trading of our common stock and reputation.
Our common stock was delisted from the NYSE in February 2016 as a result of our failure to file our Annual Report on Form 10-K for the year ended December 31, 2014 within the extended compliance period required by the NYSE. After the delisting, our common stock began trading on the OTC. There can be no assurance whether or when our common stock will be relisted for trading on the NYSE or another national securities exchange. Our shareholders may continue to face material adverse consequences as a result of our trading on the OTC rather than a national securities exchange, including, but not limited to, a decrease in the price of our common stock, increased volatility, decreased trading activity or liquidity, a lack of analyst research and a further decline in institutional holders whose charters do not allow them to hold securities in unlisted companies. In addition, the delisting from the NYSE may have had and may continue to have a negative impact on our reputation and, as a consequence, our business and the price of our common stock.
If we are unable to retain our senior management and key employees, then our business and results of operations and financial position could be harmed.
Our ability to maintain our competitive position is largely dependent on the services of our senior management, clinicians and other key employees. Although we have employment agreements with our senior management, these agreements do not prevent those individuals from ceasing their employment with us at any time. Additionally, adverse publicity and increased demands associated with the Restatement and associated litigation and regulatory investigations could increase our key employee retention risks. If we are unable to retain existing senior management, clinicians and other key employees, or to attract other such qualified employees on terms satisfactory to us, then our business could be adversely affected.
Our non-compete agreements and other restrictive covenants involving clinicians may not be enforceable.
We have contracts with clinicians in many states. Some of these contracts include provisions preventing these clinicians from competing with us both during and after the term of our relationship with them. The law governing non-compete agreements and other forms of restrictive covenants varies from state to state. Some states are reluctant to strictly enforce non-compete agreements and restrictive covenants applicable to health care providers. There can be no assurance that our non-compete agreements related to affiliated clinicians will not be successfully challenged as unenforceable in certain states. In such event, we would be unable to prevent former affiliated clinicians from competing with us, potentially resulting in the loss of some of our patients, reducing our revenues and earnings.
Cyber-attacks, system security risks, data breaches and other technology failures could adversely affect our ability to conduct business, our results of operations and our financial position.
A technology failure could occur and potentially disrupt our business, damage our reputation and adversely affect our profitability. Our information technology (“IT”) systems are subject to the risk of computer viruses or other malicious codes, unauthorized access or cyber-attacks. The administrative and technical controls and other preventive actions that we take to reduce the risk of cyber incidents and protect our IT systems may be insufficient to prevent physical and electronic break-ins, cyber-attacks or other security breaches to our computer systems. In addition, disruptions or breaches could occur as a result of natural disasters, man-made disasters, epidemic/pandemic, industrial accident, blackout, criminal activity, technological changes or events, terrorism or other unanticipated events beyond our control. While we have insurance intended to provide coverage from certain losses related to such incidents and a variety of preventative security measures such as risk management, information protection, disaster recovery and business continuity plans, we cannot predict the method or
outcome of every possible cyber incident or ensure that we have protected ourselves against every possible cyber threat in light of the varied and increasingly complex breaches faced by companies on a regular basis. Unanticipated problems with our systems or recovery plans could have a material adverse impact on our ability to conduct business, our results of operations and our financial position.
A cybersecurity incident could cause a violation of HIPAA and other privacy laws and regulations or result in a loss of confidential data.
A cyber-attack that bypasses our IT security systems causing an IT security breach, loss of protected health information or other data subject to privacy laws, loss of proprietary business information, or a material disruption of our IT business systems, could have a material adverse impact on our business, financial condition or results of operations. In addition, our future results of operations, as well as our reputation, could be adversely impacted by theft, destruction, loss, or misappropriation of protected health information, other confidential data or proprietary business information.
Insurance coverage for some of our losses may be inadequate and may be subject to the credit risk of commercial insurance companies.
Some of our insurance coverage is through various third-party insurers. To the extent we hold policies to cover certain groups of claims or rely on insurance coverage obtained by third parties to cover such claims, but either we or such third parties did not obtain sufficient insurance limits, did not buy an extended reporting period policy, where applicable, or the issuing insurance company is unable or unwilling to pay such claims, we may be responsible for those losses. Furthermore, for our losses that are insured or reinsured through commercial insurance companies, we are subject to the “credit risk” of those insurance companies. While we believe our commercial insurance company providers currently are creditworthy, there can be no assurance that such insurance companies will remain so in the future.
We have made and may continue to make acquisitions, which could divert the attention of management and which may not be integrated successfully into our existing business. We may not find suitable acquisitions in the future, which could adversely affect our ability to penetrate new markets and achieve our growth objectives.
In past years we have pursued, and may continue to pursue, acquisitions to increase our market penetration, enter new geographic markets and expand the scope of services we provide. We cannot assure that we will identify suitable acquisition candidates, acquisitions will be completed on acceptable terms or at all, our due diligence process will uncover all potential liabilities or issues affecting our integration process, we will not incur breakup, termination or similar fees and expenses, or we will be able to integrate successfully the operations of any acquired business. Furthermore, acquisitions in new geographic markets and services may require us to comply with new and unfamiliar legal and regulatory requirements, which could impose substantial obligations on us and our management, cause us to expend additional time and resources and increase our exposure to penalties or fines for noncompliance with such requirements. The acquisitions could be of significant size and involve operations in multiple jurisdictions. The acquisition and integration of another business could divert management attention from other business activities. This diversion, together with other difficulties we may incur in integrating an acquired business, could have a material adverse effect on our business, financial condition and results of operations. In addition, we may incur debt to finance acquisitions. Such borrowings may not be available on terms as favorable to us as our current borrowing terms and may increase our leverage.
In order to remain competitive, we are required to make capital expenditures relating to our leaseholds and our equipment.
A substantial portion of our capital expenditure requirements relate to maintaining and upgrading the appearance and function of our patient care clinic and satellite locations. If we do not maintain our facilities, their relative appearance to that of our competitors could adversely affect our ability to attract and retain patients. In addition, changing competitive conditions or the emergence of any significant advances in O&P technology could require us to invest significant capital in additional equipment or capacity in order to remain competitive. If we are unable to fund any such investment or otherwise fail to invest in such items, our business, financial condition or results of operations could be materially and adversely affected.
We may not be able to adequately protect our intellectual property and other proprietary rights that are material to our business or to defend successfully against intellectual property infringement claims by third parties.
Our ability to compete effectively depends in part upon our intellectual property rights, including but not limited to our trademarks and copyrights, and our proprietary technology. Our use of contractual provisions, confidentiality procedures and agreements, and trademark, copyright, unfair competition, trade secret and other laws to protect our intellectual property rights and proprietary technology may not be adequate. Litigation may be necessary to enforce our intellectual property rights and protect our proprietary technology, or to defend against claims by third parties that the conduct of our businesses or our use of intellectual property infringes upon such third-party’s intellectual property rights. Any intellectual property litigation or claims brought against us, whether or not meritorious, could result in substantial costs and diversion of our resources, and there can be no assurances that favorable final outcomes will be obtained in all cases. The terms of any settlement or judgment may require us to pay substantial amounts to the other party or cease exercising our rights in such intellectual property, including ceasing the use of certain trademarks used by us to distinguish our services from those of others or ceasing the exercise of our rights in copyrightable works. In addition, we may have to seek a license to continue practices found to be in violation of a third-party’s rights, which may not be available on reasonable terms, or at all. Our business, financial condition or results of operations could be adversely affected as a result.
The market price of our common stock may fluctuate significantly.
The market price of our common stock may fluctuate significantly. Among the factors that could affect our stock price are:
· industry or general market conditions;
· domestic and international economic factors unrelated to our performance;
· changes in our referral sources’ or customers’ preferences;
· new regulatory pronouncements and changes in regulatory guidelines;
· lawsuits, enforcement actions and other claims by third parties or governmental authorities;
· actual or anticipated fluctuations in our quarterly operating results;
· changes in securities analysts’ estimates of our financial performance or lack of research and reports by industry analysts;
· action by institutional shareholders or other large shareholders, including future sales of our common stock;
· speculation in the press or investment community;
· investor perception of us and our industry;
· changes in market valuations or earnings of similar companies;
· announcements by us or our competitors of significant contracts, acquisitions or strategic partnerships;
· any future sales of our common stock or other securities;
· additions or departures of key personnel; and
· ability to get current and file future filings timely.
The stock markets have experienced extreme volatility in recent years that has been unrelated to the operating performance of particular companies. These broad market fluctuations may adversely affect the market price of our common stock. In the past, following periods of volatility in the market price of a company’s securities, class action litigation has often been instituted against such company. Any litigation of this type brought against us could result in substantial costs and a diversion of management’s attention and resources, which would harm our business, results of operations and financial condition.
If securities or industry analysts do not publish research or publish misleading or unfavorable research about our business, our stock price and trading volume could decline.
The trading market for our common stock will depend in part on the research and reports that securities or industry analysts publish about us or our business, especially after our stock is no longer traded on the OTC and is once again traded on a national securities exchange. If one or more analysts downgrade our stock or publishes misleading or unfavorable research about our business, our stock price would likely decline. If one or more of these analysts ceases coverage of us or fails to publish reports on us regularly, demand for our stock could decrease, which could cause our stock price or trading volume to decline.
We do not intend to pay dividends on our common stock and, consequently, your ability to achieve a return on your investment will depend on appreciation in the price of our common stock.
We do not intend to declare and pay dividends on our common stock for the foreseeable future. We currently intend to invest our future earnings, if any, to fund our growth, to develop our business, and to potentially fund future share repurchases. Therefore, you are not likely to receive any dividends on your common stock for the foreseeable future, and the success of an investment in shares of our common stock will depend upon any future appreciation in their value. There is no guarantee that shares of our common stock will appreciate in value or even maintain the price at which shareholders have purchased their shares.
Disruptions in our disaster recovery systems, management continuity planning or information systems could limit our ability to operate our business effectively, or adversely affect our financial condition and results of operations.
Our IT systems facilitate our ability to conduct our business. While we have disaster recovery systems and business continuity plans in place, any disruptions in our disaster recovery systems or the failure of these systems to operate as expected could, depending on the magnitude of the problem, adversely affect our operating results by limiting our capacity to effectively monitor and control our operations. Despite our implementation of a variety of security measures, our technology systems could be subject to physical or electronic break-ins and similar disruptions from unauthorized tampering. In addition, in the event that a significant number of our management personnel were unavailable in the event of a disaster, our ability to effectively conduct business could be adversely affected.
As of December 31, 2016, we operated 821 patient care locations, comprised of 706 patient care clinics and 115 satellite locations, in 45 states and the District of Columbia. We own twelve buildings, including ten buildings that house a patient care clinic and two buildings that are currently unoccupied. Our patient care clinics occupied under leases have terms expiring between 2017 and 2027. Our patient care clinics average approximately 3,000 square feet in size. In total, including locations relating to our non-patient care businesses, administrative and fabrication locations, as well as storage and other non-occupied space, we currently have 951 locations, of which, 939 are under lease.
We believe our leased and owned facilities are adequate for carrying out our current and anticipated future O&P operations. We believe we will be able to renew such leases as they expire or find comparable or alternative space on commercially suitable terms. See Note M - “Leases” to our consolidated financial statements in this Annual Report on Form 10-K for additional information regarding our facilities leases.
The following table sets forth the number of our patient care clinics located in each state as of December 31, 2016:
|
State |
|
Patient |
|
|
|
|
|
Alabama |
|
12 |
|
Arizona |
|
40 |
|
Arkansas |
|
6 |
|
California |
|
73 |
|
Colorado |
|
27 |
|
Connecticut |
|
14 |
|
District of Columbia |
|
2 |
|
Florida |
|
53 |
|
Georgia |
|
42 |
|
Idaho |
|
1 |
|
Illinois |
|
22 |
|
Indiana |
|
11 |
|
Iowa |
|
18 |
|
Kansas |
|
18 |
|
Kentucky |
|
8 |
|
Louisiana |
|
14 |
|
Maine |
|
9 |
|
Maryland |
|
13 |
|
Massachusetts |
|
7 |
|
Michigan |
|
14 |
|
Minnesota |
|
22 |
|
Mississippi |
|
12 |
|
Missouri |
|
27 |
|
Montana |
|
3 |
|
Nebraska |
|
13 |
|
Nevada |
|
5 |
|
New Hampshire |
|
2 |
|
New Jersey |
|
7 |
|
New Mexico |
|
13 |
|
New York |
|
30 |
|
North Carolina |
|
23 |
|
North Dakota |
|
5 |
|
Ohio |
|
41 |
|
Oklahoma |
|
11 |
|
Oregon |
|
10 |
|
Pennsylvania |
|
41 |
|
South Carolina |
|
16 |
|
South Dakota |
|
2 |
|
Tennessee |
|
22 |
|
Texas |
|
46 |
|
Utah |
|
8 |
|
Virginia |
|
14 |
|
Washington |
|
21 |
|
West Virginia |
|
6 |
|
Wisconsin |
|
12 |
|
Wyoming |
|
5 |
Other leased real estate holdings include our distribution facilities in Texas, Nevada, Georgia, Illinois and Pennsylvania, our corporate headquarters in Austin, Texas, the headquarters for our therapeutic solutions in Reno, Nevada, which is co-located with our Nevada distribution facility and the headquarters for our distribution business in Alpharetta, Georgia, which is co-located with our Georgia distribution facility. We additionally operate eighteen leased fabrication facilities that assist our patient care locations in the fabrication of devices. Seven of these locations are co-located with a patient care clinic location. The fabrication facilities are located in the states of Alabama, Arizona, California, Colorado, Connecticut, Florida, Georgia, Kansas, Maryland, Minnesota, New York, Ohio, Pennsylvania, Tennessee and Texas. Substantially all of our owned properties are pledged to collateralize bank indebtedness. See Note N - “Long-Term Debt” to our consolidated financial statements in this Annual Report on Form 10-K for additional information regarding our outstanding debt and related collateral.
Securities and Derivative Litigation
In November 2014, a securities class action complaint, City of Pontiac General Employees’ Retirement System v. Hanger, et al., C.A. No. 1:14-cv-01026-SS, was filed against us in the United States District Court for the Western District of Texas. The complaint named us and certain of our current and former officers for allegedly making materially false and misleading statements regarding, inter alia, our financial statements, RAC audit success rate, the implementation of new financial systems, same-store sales growth, and the adequacy of our internal processes and controls. The complaint alleged violations of Sections 10(b) and 20(a) of the Exchange Act and Rule 10b-5 promulgated thereunder. The complaint sought unspecified damages, costs, attorneys’ fees, and equitable relief.
On April 1, 2016, the court granted our motion to dismiss the lawsuit for failure to state a claim upon which relief can be granted, and permitted plaintiffs to file an amended complaint. On July 1, 2016, plaintiffs filed an amended complaint. On September 15, 2016, we and certain of the individual defendants filed motions to dismiss the lawsuit. On January 26, 2017, the court granted the defendants’ motions and dismissed with prejudice all claims against all defendants for failure to state a claim. On February 24, 2017, plaintiffs filed a notice of appeal to the United States Court of Appeals for the Fifth Circuit. Appellate briefing was completed on August 18, 2017 and the appeal remains pending. The Court of Appeals has scheduled oral argument for the appeal the week of March 5, 2018.
In February and August of 2015, two separate shareholder derivative suits were filed in Texas state court against us related to the announced restatement of certain of our financial statements. The cases were subsequently consolidated into Judy v. Asar, et. al., Cause No. D-1-GN-15-000625. On October 25, 2016, plaintiffs in that action filed an amended complaint, and the case is currently pending before the 345th Judicial District Court of Travis County, Texas.
The amended complaint in the consolidated derivative action names us and certain of our current and former officers and directors as defendants. It alleges claims for breach of fiduciary duty based, inter alia, on the defendants’ alleged failure to exercise good faith to ensure that we had in place adequate accounting and financial controls and that disclosures regarding our business, financial performance and internal controls were truthful and accurate. The complaint seeks unspecified damages, costs, attorneys’ fees, and equitable relief.
As disclosed in our Current Report on Form 8-K filed with the SEC on June 6, 2016, the Board of Directors appointed a Special Litigation Committee of the Board (the “Special Committee”). The Board delegated to the Special Committee the authority to (1) determine whether it is in our best interests to pursue any of the allegations made in the derivative cases filed in Texas state court (which cases were consolidated into the Judy case discussed above), (2) determine whether it is in our best interests to pursue any remedies against any of our current or former employees, officers or directors as a result of the conduct discovered in the Audit Committee investigation concluded on June 6, 2016 (the “Investigation”), and (3) otherwise resolve claims or matters relating to the findings of the Investigation. The Special Committee retained independent legal counsel to assist and advise it in carrying out its duties and reviewed and considered the evidence and various factors relating to our best interests. In accordance with its findings and conclusions, the Special Committee determined that it is not in our best interest to pursue any of the claims in the Judy derivative case. Also in accordance with its findings and conclusions, the Special Committee determined that it is not in our best interests to pursue legal remedies against any of our current or former employees, officers, or directors.
On April 14, 2017, we filed a motion to dismiss the consolidated derivative action based on the resolution by the Special Committee that it is not in our best interest to pursue the derivative claims. Counsel for the derivative plaintiffs opposed that motion and moved to compel discovery. In a hearing held on June 12, 2017, the Travis County court denied plaintiffs’ motion to compel, and held that the motion to dismiss would be considered only after appropriate discovery was concluded.
The plaintiffs have since subpoenaed counsel for the Special Committee, seeking a copy of the full report prepared by the Special Committee and its independent counsel. Counsel for the Special Committee, as well as our counsel, take the position that the full report is not discoverable under Texas law. Plaintiffs’ counsel has indicated it will file a motion to compel the Special Committee’s counsel to produce the report, but it has not yet done so. Upon resolution of the discovery dispute and completion of discovery, we intend to file a motion to dismiss the consolidated derivative action.
Management intends to vigorously defend against the shareholder derivative action and the appeal in the securities class action. At this time, we cannot predict how the Courts will rule on the merits of the claims and/or the scope of the potential
loss in the event of an adverse outcome. Should we ultimately be found liable, the resulting damages could have a material adverse effect on our consolidated financial position, liquidity or results of our operations.
Other Matters
In May 2015, one of our clinics received a civil investigative demand for records relating to a sample of claims submitted to Medicare and Medicaid for reimbursement, and we provided records in response to the subpoena. In May 2017, we were informed by an Assistant United States Attorney that it was investigating whether we properly provided and claimed reimbursement for prosthesis skins and covers from July 2013 (after an industry announcement) to the present. We have reviewed the claims, and have cooperated with the government’s investigation. We anticipate this matter will be resolved in 2018 and that any resolution will not have a material impact on any future periods.
From time to time we are subject to legal proceedings and claims which arise in the ordinary course of our business, including additional payments under business purchase agreements. In the opinion of management, the amount of ultimate liability, if any, with respect to these actions will not have a materially adverse effect on our consolidated financial position, liquidity or results of our operations.
We are in a highly regulated industry and receive regulatory agency inquiries from time to time in the ordinary course of our business, including inquiries relating to our billing activities. No assurance can be given that any discrepancies identified during a regulatory review will not have a material adverse effect on our consolidated financial statements.
ITEM 5. MARKET FOR REGISTRANT’S COMMON EQUITY, RELATED STOCKHOLDER MATTERS AND ISSUER PURCHASES OF EQUITY SECURITIES
The following information in this Item 5 of this Annual Report on Form 10-K is not deemed to be “soliciting material” or to be “filed” with the SEC or subject to Regulation 14A or 14C under the Exchange Act or to the liabilities of Section 18 of the Exchange Act, and will not be deemed to be incorporated by reference into any filing under the Securities Act of 1933 or the Exchange Act, except to the extent we specifically incorporate it by reference into such a filing.
Market Information
Our common stock was listed and traded on the NYSE from December 15, 1998 to February 26, 2016 under the symbol “HGR.” On February 29, 2016, our common stock began trading on the OTC under the symbol “HNGR” after the NYSE notified us on February 26, 2016 of immediate suspension of trading of and the initiation of delisting procedures against our common stock for failing to file our 2014 Annual Report Form 10-K for the year ended December 31, 2014 within the extended compliance period granted by the NYSE. The following table sets forth the high and low closing sale prices for our common stock for the periods indicated as reported on the NYSE (through February 26, 2016) and the OTC (beginning on February 29, 2016):
|
Year ended December 31, 2016 |
|
High |
|
Low |
| ||
|
First Quarter |
|
$ |
15.67 |
|
$ |
2.49 |
|
|
Second Quarter |
|
7.97 |
|
6.25 |
| ||
|
Third Quarter |
|
11.00 |
|
7.43 |
| ||
|
Fourth Quarter |
|
11.50 |
|
7.75 |
| ||
|
Year ended December 31, 2015 |
|
High |
|
Low |
| ||
|
First Quarter |
|
$ |
26.52 |
|
$ |
20.49 |
|
|
Second Quarter |
|
25.07 |
|
22.13 |
| ||
|
Third Quarter |
|
23.59 |
|
13.54 |
| ||
|
Fourth Quarter |
|
17.53 |
|
13.55 |
| ||
|
Year ended December 31, 2014 |
|
High |
|
Low |
| ||
|
First Quarter |
|
$ |
40.47 |
|
$ |
32.25 |
|
|
Second Quarter |
|
35.12 |
|
29.01 |
| ||
|
Third Quarter |
|
32.31 |
|
20.52 |
| ||
|
Fourth Quarter |
|
24.19 |
|
19.58 |
| ||
Holders
At January 12, 2018, there were approximately 171 holders of record of our 36,328,678 shares of outstanding common stock.
Dividend Policy
We have never paid cash dividends on our common stock and intend to continue this policy for the foreseeable future. We plan to retain earnings for use in our business. The terms of our credit agreements and certain other agreements limit the payment of dividends on our common stock and such agreements are expected to continue to limit the payment of dividends in the future.
Any future determination to pay cash dividends will be at the discretion of our Board of Directors and will be dependent on our results of operations, financial condition, contractual and legal restrictions and any other factors deemed to be relevant.
Sales of Unregistered Securities
During the period January 1, 2015 through December 31, 2017, we did not sell any securities that were unregistered under the Securities Act of 1933.
Issuer Purchases of Equity Securities
During the years ended December 31, 2015 and 2016, and through December 31, 2017, we have not made any purchases of our common stock.
STOCK PERFORMANCE CHART
The annual changes in the cumulative total shareholder return on our common stock for the five-year period shown in the graph below are based on the assumption that $100 had been invested in our common stock, the Standard & Poor’s 500 Stock Index, the Standard & Poor’s Small Cap 600 Stock Index, the Russell 2000 Stock Index, the Standard & Poor’s 500 Health Care Services Index and the Standard & Poor’s 500 Health Care Facilities Index on December 31, 2011, and that all quarterly dividends were reinvested at the average of the closing stock prices at the beginning and end of the quarter. The total cumulative dollar returns shown on the graph represent returns that such investments would have had on December 31, 2016.
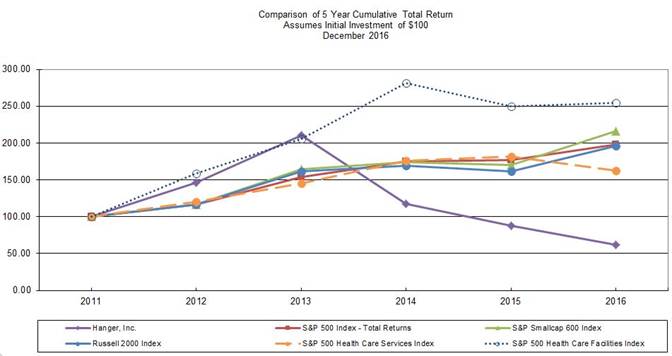
|
|
|
As of December 31, |
| ||||||||||||||||
|
|
|
2011 |
|
2012 |
|
2013 |
|
2014 |
|
2015 |
|
2016 |
| ||||||
|
Hanger, Inc. |
|
$ |
100.00 |
|
$ |
146.39 |
|
$ |
210.49 |
|
$ |
117.17 |
|
$ |
88.01 |
|
$ |
61.53 |
|
|
S&P 500 Index - Total Returns |
|
$ |
100.00 |
|
$ |
116.00 |
|
$ |
153.57 |
|
$ |
174.60 |
|
$ |
177.01 |
|
$ |
198.18 |
|
|
S&P Small Cap 600 Index |
|
$ |
100.00 |
|
$ |
116.33 |
|
$ |
164.38 |
|
$ |
173.84 |
|
$ |
170.41 |
|
$ |
215.67 |
|
|
Russell 2000 Index |
|
$ |
100.00 |
|
$ |
116.35 |
|
$ |
161.52 |
|
$ |
169.42 |
|
$ |
161.95 |
|
$ |
196.45 |
|
|
S&P 500 Health Care Services Index |
|
$ |
100.00 |
|
$ |
120.37 |
|
$ |
145.31 |
|
$ |
175.54 |
|
$ |
181.27 |
|
$ |
162.03 |
|
|
S&P 500 Health Care Facilities Index |
|
$ |
100.00 |
|
$ |
158.24 |
|
$ |
205.26 |
|
$ |
281.04 |
|
$ |
249.76 |
|
$ |
254.13 |
|
Our stock price in 2016 was negatively impacted by our common stock’s suspension on February 26, 2016 and subsequent delisting from trading on the NYSE and the commencement of trading on February 29, 2016 on the OTC.
ITEM 6. SELECTED FINANCIAL DATA
The following tables set forth certain selected consolidated financial data for each of the years in the five-year period ended December 31, 2016, and is derived from the consolidated financial statements of Hanger, Inc. and its subsidiaries. The Consolidated Financial Statements for each of the years in the three-year period ended December 31, 2016 are included in this Annual Report on Form 10-K. The selected consolidated balance sheet data as of December 31, 2014, 2013 and 2012 and the consolidated statements of operations data for the years ended December 31, 2013 and 2012 are derived from our consolidated financial statements, which are not included in this Annual Report on Form 10-K. The selected consolidated financial data set forth below is qualified in its entirety by, and should be read in conjunction with, the consolidated financial statements and notes thereto and “Management’s Discussion and Analysis of Financial Condition and Results of Operations” in this Annual Report on Form 10-K.
|
Consolidated Statements of Operations and |
|
Year Ended December 31, |
| |||||||||||||
|
Comprehensive (Loss) Income: |
|
2016 |
|
2015 |
|
2014 |
|
2013 |
|
2012 |
| |||||
|
|
|
(in thousands, except per share amounts) |
| |||||||||||||
|
Net revenue |
|
$ |
1,042,054 |
|
$ |
1,067,172 |
|
$ |
1,012,100 |
|
$ |
975,769 |
|
$ |
923,521 |
|
|
Material costs |
|
332,071 |
|
336,283 |
|
324,284 |
|
302,003 |
|
285,873 |
| |||||
|
Personnel costs |
|
363,537 |
|
367,094 |
|
353,586 |
|
325,780 |
|
299,004 |
| |||||
|
Other operating costs |
|
139,024 |
|
140,839 |
|
136,885 |
|
115,767 |
|
110,881 |
| |||||
|
General and administrative expenses |
|
107,224 |
|
111,761 |
|
86,115 |
|
78,658 |
|
81,182 |
| |||||
|
Professional accounting and legal fees |
|
41,233 |
|
28,647 |
|
44,798 |
|
5,821 |
|
4,907 |
| |||||
|
Depreciation and amortization |
|
44,887 |
|
46,343 |
|
38,929 |
|
34,185 |
|
32,589 |
| |||||
|
Impairment of intangible assets |
|
86,164 |
|
385,807 |
|
223 |
|
— |
|
— |
| |||||
|
(Loss) income from operations |
|
(72,086 |
) |
(349,602 |
) |
27,280 |
|
113,555 |
|
109,085 |
| |||||
|
Interest expense, net |
|
45,199 |
|
29,892 |
|
28,277 |
|
30,576 |
|
34,620 |
| |||||
|
Loss on extinguishment of debt |
|
6,031 |
|
7,237 |
|
— |
|
6,645 |
|
— |
| |||||
|
(Loss) income from continuing operations before income taxes |
|
(123,316 |
) |
(386,731 |
) |
(997 |
) |
76,334 |
|
74,465 |
| |||||
|
(Benefit) provision for income taxes |
|
(15,910 |
) |
(67,614 |
) |
2,023 |
|
30,455 |
|
26,206 |
| |||||
|
(Loss) income from continuing operations |
|
(107,406 |
) |
(319,117 |
) |
(3,020 |
) |
45,879 |
|
48,259 |
| |||||
|
Income (loss) from discontinued operations, net of income taxes |
|
935 |
|
(7,974 |
) |
(15,946 |
) |
(5,368 |
) |
(235 |
) | |||||
|
Net (loss) income |
|
$ |
(106,471 |
) |
$ |
(327,091 |
) |
$ |
(18,966 |
) |
$ |
40,511 |
|
$ |
48,024 |
|
|
|
|
|
|
|
|
|
|
|
|
|
| |||||
|
Other comprehensive (loss) income, net |
|
(27 |
) |
474 |
|
(868 |
) |
899 |
|
(734 |
) | |||||
|
Comprehensive (loss) income |
|
$ |
(106,498 |
) |
$ |
(326,617 |
) |
$ |
(19,834 |
) |
$ |
41,410 |
|
$ |
47,290 |
|
|
|
|
|
|
|
|
|
|
|
|
|
| |||||
|
Basic Per Common Share Data: |
|
|
|
|
|
|
|
|
|
|
| |||||
|
(Loss) income from continuing operations |
|
$ |
(2.99 |
) |
$ |
(8.96 |
) |
$ |
(0.09 |
) |
$ |
1.32 |
|
$ |
1.41 |
|
|
Income (loss) from discontinued operations, net of income taxes |
|
0.03 |
|
(0.22 |
) |
(0.45 |
) |
(0.16 |
) |
(0.01 |
) | |||||
|
Basic (loss) income per share |
|
$ |
(2.96 |
) |
$ |
(9.18 |
) |
$ |
(0.54 |
) |
$ |
1.16 |
|
$ |
1.40 |
|
|
Shares used to compute basic per common share amounts |
|
35,933 |
|
35,635 |
|
35,309 |
|
34,826 |
|
34,274 |
| |||||
|
|
|
|
|
|
|
|
|
|
|
|
| |||||
|
Diluted Per Common Share Data: |
|
|
|
|
|
|
|
|
|
|
| |||||
|
(Loss) income from continuing operations |
|
$ |
(2.99 |
) |
$ |
(8.96 |
) |
$ |
(0.09 |
) |
$ |
1.30 |
|
$ |
1.39 |
|
|
Income (loss) from discontinued operations, net of income taxes |
|
0.03 |
|
(0.22 |
) |
(0.45 |
) |
(0.15 |
) |
(0.01 |
) | |||||
|
Diluted (loss) income per share |
|
$ |
(2.96 |
) |
$ |
(9.18 |
) |
$ |
(0.54 |
) |
$ |
1.15 |
|
$ |
1.38 |
|
|
Shares used to compute diluted per common share amounts |
|
35,933 |
|
35,635 |
|
35,309 |
|
35,209 |
|
34,737 |
| |||||
|
|
|
|
|
|
|
|
|
|
|
|
| |||||
|
|
|
Year Ended December 31, |
| |||||||||||||
|
Consolidated Balance Sheet Data: |
|
2016 |
|
2015 |
|
2014 |
|
2013 |
|
2012 |
| |||||
|
(in thousands) |
|
|
|
|
|
|
|
|
|
|
| |||||
|
Cash and cash equivalents |
|
$ |
7,157 |
|
$ |
58,753 |
|
$ |
11,699 |
|
$ |
1,613 |
|
$ |
13,130 |
|
|
Working capital |
|
$ |
55,014 |
|
$ |
139,824 |
|
$ |
75,197 |
|
$ |
112,910 |
|
$ |
130,636 |
|
|
Total assets |
|
$ |
755,104 |
|
$ |
973,084 |
|
$ |
1,235,733 |
|
$ |
1,141,163 |
|
$ |
1,120,766 |
|
|
Total debt |
|
$ |
472,650 |
|
$ |
566,433 |
|
$ |
522,336 |
|
$ |
479,050 |
|
$ |
523,000 |
|
|
Shareholders’ equity |
|
$ |
65,414 |
|
$ |
165,246 |
|
$ |
483,536 |
|
$ |
491,313 |
|
$ |
437,055 |
|
ITEM 7. MANAGEMENT’S DISCUSSION AND ANALYSIS OF FINANCIAL CONDITION AND RESULTS OF OPERATIONS
Forward Looking Statements
This Annual Report on Form 10-K including this “Management’s Discussion and Analysis of Financial Condition and Results of Operations” (or “Management’s Discussion and Analysis”) contains statements that are forward-looking statements within the meaning of the federal securities laws. Forward-looking statements include information concerning our liquidity and our possible or assumed future results of operations, including descriptions of our business strategies. These statements often include words such as “believe,” “expect,” “project,” “potential,” “anticipate,” “intend,” “plan,” “estimate,” “seek,” “will,” “may,” “would,” “should,” “could,” “forecasts” or similar words. These statements are based on certain assumptions that we have made in light of our experience in the industry as well as our perceptions of historical trends, current conditions, expected future developments and other factors we believe are appropriate in these circumstances. We believe these judgments are reasonable, but you should understand that these statements are not guarantees of performance or results, and our actual results could differ materially from those expressed in the forward-looking statements due to a variety of important factors, both positive and negative, that may be revised or supplemented in subsequent reports.
These statements involve risks, estimates, assumptions and uncertainties that could cause actual results to differ materially from those expressed in these statements as described in this Annual Report on Form 10-K, and any claims, investigations or proceedings arising as a result, as well as our ability to remediate the material weaknesses in our internal control over financial reporting described in Item 9A. “Controls and Procedures” contained in this Annual Report on Form 10-K, changes in the demand for our O&P products and services, uncertainties relating to the results of operations or recently acquired O&P patient care clinics, our ability to enter into and derive benefits from managed-care contracts, our ability to successfully attract and retain qualified O&P clinicians, federal laws governing the health care industry, uncertainties inherent in investigations and legal proceedings, governmental policies affecting O&P operations and other risks and uncertainties generally affecting the health care industry.
Readers are cautioned that all forward-looking statements involve known and unknown risks and uncertainties including, without limitation, those described in Item 1A. “Risk Factors” contained in this Annual Report on Form 10-K, some of which are beyond our control. Although we believe that the assumptions underlying the forward-looking statements contained herein are reasonable, any of the assumptions could be inaccurate. Therefore, there can be no assurance that the forward-looking statements included in this report will prove to be accurate. Actual results could differ materially and adversely from those contemplated by any forward-looking statement. In light of the significant risks and uncertainties inherent in the forward-looking statements included herein, the inclusion of such information should not be regarded as a representation by us or any other person that our objectives and plans will be achieved. We undertake no obligation to publicly release any revisions to any forward-looking statements in this discussion to reflect events and circumstances occurring after the date hereof or to reflect unanticipated events. Forward-looking statements and our liquidity, financial condition and results of operations may be affected by the risks set forth in Item 1A. “Risk Factors” or by other unknown risks and uncertainties.
Restatement of Prior Financial Information
In our Annual Report on Form 10-K for the year ended December 31, 2014 (the “2014 Form 10-K”), which we filed on May 12, 2017, we restated our prior financial filings. In that filing, we restated:
(a) our Consolidated Balance Sheet as of December 31, 2013 and the related Statements of Operations and Comprehensive (Loss) Income, Consolidated Statements of Changes in Shareholders’ Equity and Consolidated Statements of Cash Flows for the fiscal years ended December 31, 2013 and December 31, 2012;
(b) our “Selected Financial Data” in Item 6. for fiscal years 2013, 2012, 2011 (unaudited) and 2010 (unaudited); and
(c) our “Quarterly Financial Information (Unaudited)” for the first two quarters in the fiscal year ended December 31, 2014 and each of the quarters in the fiscal year ended December 31, 2013.
Accordingly, investors should not rely upon any consolidated financial statements for these periods and any earnings releases or other communications relating to these periods that occurred prior to our filing the 2014 Form 10-K. For information regarding the nature and effects of our restatement of prior financial reports, in addition to information which we have provided you in this Annual Report on Form 10-K, we encourage you to also refer to our 2014 Form 10-K.
Effect of Delay in Financial Filings
Due to our detection of the material weaknesses and the necessity of our correction of previously issued financial information, we have been undergoing extensive delays in the filing of our periodic reports with the SEC. Our 2014 Form 10-K included consolidated financial statements for the years ended December 31, 2014, December 31, 2013 and December 31, 2012, financial information pertaining to quarterly periods in 2014 and 2013, as well as selected financial data for the years ended December 31, 2011 and December 31, 2010 (both unaudited). We also presented the effects of our restatement of the previously filed financial statements.
Upon the completion of that filing, we commenced the preparation and review of the financial statements provided in this Annual Report on Form 10-K. The delay in our completion of this filing relates primarily to the effects of our delay in the completion of the 2014 Form 10-K, the number of accounting periods encompassed within this filing and, importantly, due to the necessity of our performance of additional review, analysis and substantive procedures related to the material weaknesses, to ensure that our consolidated financial statements for the periods encompassed by this report are complete and accurate in all material respects.
With the completion and filing of this Annual Report on Form 10-K, we are now focused on the preparation, review and filing of our financial information for interim periods in 2017, and in preparing and commencing our work relating to our annual financial statements for the year ended December 31, 2017.
Our efforts to remediate our material weaknesses, restate our historical financial statements, prepare this Annual Report and other factors have come at a cost in excess of the amount we estimate we would otherwise have incurred. The estimated professional fees associated with these efforts are as follows:
|
( in millions) |
|
|
|
|
|
|
| |||
|
|
|
|
|
|
|
Balance to be Paid |
| |||
|
Year |
|
Expensed |
|
Paid |
|
in Future Periods |
| |||
|
|
|
|
|
|
|
|
| |||
|
2014 |
|
$ |
37.9 |
|
$ |
(1.8 |
) |
$ |
36.1 |
|
|
2015 |
|
23.5 |
|
(26.0 |
) |
33.6 |
| |||
|
2016 |
|
37.2 |
|
(47.9 |
) |
22.9 |
| |||
|
2017 |
|
30.3 |
|
(38.0 |
) |
15.2 |
| |||
In 2018, we currently estimate that we will incur an additional $11.8 million of such excess fees. Of the $11.8 million in excess fees estimated to be incurred in 2018, we estimate that we will pay approximately $10.3 million, such that total payments for excess fees in 2018 will total $25.5 million, which includes $15.2 million related to prior periods. See the “Liquidity and Capital Resources” section in this Management’s Discussion and Analysis for further discussion.
Unless otherwise stated, this Management’s Discussion and Analysis has been written to provide you with pertinent information regarding our performance during the periods encompassed by this report. Accordingly, we have not provided information regarding our performance during subsequent periods. Nevertheless, for certain information and events, which relate primarily to our indebtedness, capital structure and liquidity, we have provided disclosure regarding subsequent periods or have included further information in Note U - “Subsequent Events” to our consolidated financial statements. Additionally, we have referenced certain trends and events occurring subsequent to December 31, 2016 as forward-looking items within this Management’s Discussion and Analysis.
Non-GAAP Measures
In this Management’s Discussion and Analysis, we refer to certain financial measures and statistics (or “metrics”) that are not prescribed under generally accepted accounting principles (“GAAP”) as applied in the United States. We utilize these non-GAAP measures in order to evaluate the underlying factors that affect our business performance and trends. These non-GAAP measures should not be considered in isolation and should not be considered superior to, or a substitute for, financial measures calculated in accordance with GAAP. We have defined and provided a reconciliation of these non-GAAP measures
to their most comparable GAAP measures. The non-GAAP measures used in this Management’s Discussion and Analysis are as follows:
Adjusted Gross Revenue and Disallowed Revenue - “Adjusted gross revenue” reflects our gross billings after their adjustment to reflect estimated discounts established in our contracts with payors of health care claims. As discussed in “Reimbursement Trends” below, pursuant to our contracts with payors, a portion of our adjusted gross billings may be disallowed based on factors including physician documentation, patient eligibility, plan design, prior authorization, timeliness of filings or appeal, coding selection, failure by certain patients to pay their portion of claims, computational errors associated with sequestration and other factors. We refer to these and other amounts as being “disallowed revenue.” Our net revenue reflects adjusted gross revenue after reduction for the estimated aggregate amount of disallowed revenue for the applicable period. To facilitate analysis of the comparability of our results, we provide these non-GAAP measures due to the significant changes that we have experienced in recent years in disallowed revenue which are further discussed below. In addition, we provide measures of material costs, personnel costs, other operating costs, general and administrative expenses, professional accounting and legal fees, depreciation and amortization and operating expenses as a percentage of adjusted gross revenue because we believe these percentages provide an investor with another meaningful measure to compare our results with prior periods. These measures are non-GAAP and unaudited.
Overview
We are a leading national provider of products and services that assist in enhancing or restoring the physical capabilities of patients with disabilities or injuries. Built on the legacy of James Edward Hanger, the first amputee of the American Civil War, Hanger and its predecessor companies have provided O&P services for over 150 years. We provide O&P services, distribute O&P devices and components, manage O&P networks and provide therapeutic solutions to patients and businesses in acute, post-acute and clinic settings. We operate through two segments - Patient Care and Products & Services. For further descriptions of our segments, see the Business Description section of Item 1. “Business” in this Annual Report on Form 10-K.
Our Patient Care segment is primarily comprised of Hanger Clinic which specializes in the design, fabrication and delivery of custom O&P devices. As of December 31, 2016, we provided these services through 706 patient care clinics and 115 satellite locations in 45 states and the District of Columbia. We also provide payor network contracting services to other O&P providers through this segment.
Our Products & Services segment is comprised of our distribution and our therapeutic solutions businesses. As a leading supplier of O&P products in the United States, we coordinate through our distribution business the procurement and distribution of a broad catalog of O&P parts, componentry and devices to independent O&P providers nationwide. To facilitate speed and convenience, we deliver these products through our five distribution facilities that are located in Nevada, Georgia, Illinois, Pennsylvania and Texas. The other business in our Products & Services segment is our therapeutic solutions business, which develops specialized rehabilitation technologies and provides evidence-based clinical programs for post-acute rehabilitation to patients at approximately 4,000 skilled nursing and post-acute providers nationwide.
In each of 2015 and 2016, we incurred a material impairment of our goodwill. These non-cash charges were the most significant contributing factor to our reported loss from operations and net loss in each period. We performed a step one intangible valuation as of October 1, 2016, December 31, 2015 and September 30, 2015. We discuss the causes and manner of our determination of these impairment charges in Note H - “Goodwill and Other Intangible Assets” to our consolidated financial statements in this Annual Report on Form 10-K.
See Note R - “Segment and Related Information” to our consolidated financial statements in this Annual Report on Form 10-K for disclosure of financial information by operating segment for 2016, 2015 and 2014.
Reimbursement Trends
In our Patient Care segment, we are reimbursed primarily through employer-based plans offered by commercial insurance carriers, Medicare, Medicaid and the VA. The following is a summary of our payor mix, expressed as an approximate percentage of net revenues for the periods indicated:
|
|
|
For the Years Ended December 31, |
| ||||
|
|
|
2016 |
|
2015 |
|
2014 |
|
|
|
|
|
|
|
|
|
|
|
Medicare |
|
30.5 |
% |
30.3 |
% |
29.4 |
% |
|
Medicaid |
|
14.8 |
% |
14.2 |
% |
12.8 |
% |
|
Commercial Insurance/Managed Care (excluding Medicare and Medicaid Managed Care) |
|
39.2 |
% |
39.6 |
% |
41.4 |
% |
|
Veterans Administration |
|
8.8 |
% |
8.9 |
% |
8.7 |
% |
|
Private Pay |
|
6.7 |
% |
7.0 |
% |
7.7 |
% |
|
Patient Care |
|
100.0 |
% |
100.0 |
% |
100.0 |
% |
Patient Care constitutes 80.6%, 82.0% and 82.7% of our net revenue for 2016, 2015 and 2014, respectively. Our remaining revenue is produced in our Products & Services segment which derives its revenue from commercial transactions with independent O&P providers, healthcare facilities and other customers. In contrast to revenues from our Patient Care segment, payment for these products and services are not directly subject to third party reimbursement from health care payors.
The amount of our reimbursement varies based on the nature of the O&P device we fabricate for our patients. Given the particular physical weight and size characteristics, location of injury or amputation, capability for physical activity and mobility, cosmetic and other needs of each individual patient, each fabricated prostheses and orthoses is customized for each particular patient. The nature of this customization and the manner by which our claims submissions are reviewed by payors makes our reimbursement process administratively difficult.
To receive reimbursement for our work, we must ensure that our clinical, administrative and billing personnel receive and verify certain medical and health plan information, record detailed documentation regarding the services we provide and accurately and timely perform a number of claims submission and related administrative tasks. Traditionally, we have performed these tasks in a manual fashion and on a decentralized basis. In recent years, due to increases in payor pre-authorization processes, documentation requirements, pre-payment reviews and pre- and post-payment audits, our ability to successfully undertake these tasks using our traditional approach has become increasingly challenging. We believe these changes in industry trends have been brought about in part by increased nationwide efforts to reduce health care costs.
A measure of our effectiveness in securing reimbursement for our services can be found in the degree to which payors ultimately disallow payment of our claims. Payors can deny claims due to their determination that a physician who referred a patient to us did not sufficiently document that a device was medically necessary or clearly establish the ambulatory (or “activity”) level of a patient. Claims can also be denied based on our failure to ensure that a patient was currently eligible under a payor’s health plan, that the plan provides full O&P benefits, that we received prior authorization, that we filed or appealed the payor’s determination timely, on the basis of our coding, failure by certain classes of patients to pay their portion of a claim and for various other reasons. If any portion of, or administrative factor within, our claim is found by the payor to be lacking, then the entirety of the claim amount may be denied reimbursement. Due to the increasing demands of these processes, the level and capability of our staffing, as well as our material weaknesses and other considerations, our consolidated disallowed revenue and bad debt expense, and their relationship to consolidated adjusted gross revenue increased over historical levels to a peak level in 2014. In 2016 and 2015, due to initiatives discussed below, we achieved decreases in our disallowed revenue. Disallowed revenue and bad debt expense over the past five years has been as follows (dollars in millions, unaudited):
|
|
|
For the Years Ended December 31, |
| |||||||||||||
|
(dollars in millions) |
|
2016 |
|
2015 |
|
2014 |
|
2013 |
|
2012 |
| |||||
|
|
|
|
|
|
|
|
|
|
|
|
| |||||
|
Net revenue |
|
$ |
1,042.1 |
|
$ |
1,067.2 |
|
$ |
1,012.1 |
|
$ |
975.8 |
|
$ |
923.5 |
|
|
Disallowed revenue |
|
49.3 |
|
60.6 |
|
82.3 |
|
65.6 |
|
46.3 |
| |||||
|
Adjusted gross revenue |
|
$ |
1,091.4 |
|
$ |
1,127.8 |
|
$ |
1,094.4 |
|
$ |
1,041.4 |
|
$ |
969.8 |
|
|
|
|
|
|
|
|
|
|
|
|
|
| |||||
|
Disallowed revenue |
|
$ |
49.3 |
|
$ |
60.6 |
|
$ |
82.3 |
|
$ |
65.6 |
|
$ |
46.3 |
|
|
Bad debt expense |
|
13.8 |
|
12.9 |
|
11.6 |
|
5.1 |
|
4.4 |
| |||||
|
Disallowed revenue & bad debt expense |
|
$ |
63.1 |
|
$ |
73.5 |
|
$ |
93.9 |
|
$ |
70.7 |
|
$ |
50.7 |
|
|
|
|
|
|
|
|
|
|
|
|
|
| |||||
|
Disallowed revenue % |
|
4.5 |
% |
5.4 |
% |
7.5 |
% |
6.3 |
% |
4.8 |
% | |||||
|
Bad debt expense % |
|
1.3 |
% |
1.1 |
% |
1.1 |
% |
0.5 |
% |
0.4 |
% | |||||
|
Disallowed revenue & bad debt expense % |
|
5.8 |
% |
6.5 |
% |
8.6 |
% |
6.8 |
% |
5.2 |
% | |||||
Adjusted gross revenue in the above chart reflects our gross billings after reduction for estimated contractual discounts. As can be seen by the chart, the percentage of our gross billings that have been disallowed increased to 7.5% in 2014 from 4.8% in 2012. Due to industry trends and our specific administrative factors, our collection experience degraded and disallowed revenue increased during those periods. Industry trends included an increased level of payor audits and more stringent requests by payors that referring physician documentation be provided in connection with claims. During that period of time, we utilized a decentralized billing and collections approach, where invoicing and collections were undertaken at individual patient care locations. Our typical locations have an average of two office administrators who are required to handle patient administration, purchasing, and clinician support tasks. Due to increasing payor documentation demands and budgetary limitations on staffing, administrative staff were increasingly unable to successfully address the growing levels of payor denials. In 2014, our accounts receivable trends were further complicated due to issues encountered with our implementation of a new patient management and electronic health record system. Due to system customizations that were subsequently determined to not be adequately tested, staffing deficiencies in cash application functions and other related procedural issues, billing and collections were further adversely affected due to this system implementation during that year as can be seen by the increase in the disallowed revenue rate and bad debt expense in that year. Throughout this period, our processes were also impeded due to the subsequently identified underlying material control weakness in the administration of our contracts. As contracts were negotiated or amended with payors, our procedures did not provide adequate assurance of timely documented reconciliation of updated terms and conditions with those loaded into our remote billing systems.
Commencing in late 2014 and continuing through 2015 and 2016, we took a number of actions to halt and reverse these disallowed revenue and bad debt trends. These initiatives included: (i) the retention of consultants and constitution of a central revenue cycle management function; (ii) the halting of the roll-out of our new patient management and electronic health record system to address the identified issues; and (iii) the establishment of new clinic-level procedures and training regarding the collection of supporting documentation and the importance of diligence in our claims submission processes. The percentage of our gross billings that have been disallowed decreased to 4.5% in 2016 from 7.5% in 2014. These initiatives are each discussed more fully in sections provided for each of them below. In addition to the declines in disallowed revenue experienced in 2015 and 2016, through these initiatives, we currently believe we will experience a further decrease in disallowed revenue in 2017.
In 2016, we experienced a $2.7 million increase in bad debt expense in our Products & Services segment as compared with 2015 resulting from the bankruptcy of one large customer of our distribution business and financial difficulties encountered by another.
These adverse trends also resulted in increases to our consolidated accounts receivable allowances during the period of 2012 through 2014. In a manner similar to the improvements achieved in disallowance trends, the initiatives undertaken in establishing a revenue cycle management function, addressing weaknesses in our new patient management and electronic health record system and in improving our procedures and standards for clinic-level documentation have had a favorable effect on our accounts receivable balances in 2015 and 2016. Our accounts receivable balances for 2012 through 2016 were as follows (dollars in millions, unaudited):
|
|
|
As of December 31, |
| |||||||||||||
|
(dollars in millions) |
|
2016 |
|
2015 |
|
2014 |
|
2013 |
|
2012 |
| |||||
|
|
|
|
|
|
|
|
|
|
|
|
| |||||
|
Accounts receivable, before allowance |
|
$ |
221.2 |
|
$ |
270.9 |
|
$ |
271.3 |
|
$ |
213.5 |
|
$ |
185.3 |
|
|
Allowance for disallowed revenue |
|
(61.1 |
) |
(81.3 |
) |
(87.2 |
) |
(52.3 |
) |
(31.5 |
) | |||||
|
Accounts receivable, gross |
|
160.1 |
|
189.6 |
|
184.1 |
|
161.2 |
|
153.8 |
| |||||
|
Allowance for doubtful accounts |
|
(15.5 |
) |
(15.0 |
) |
(9.9 |
) |
(6.5 |
) |
(4.9 |
) | |||||
|
Accounts receivable, net |
|
$ |
144.6 |
|
$ |
174.6 |
|
$ |
174.2 |
|
$ |
154.7 |
|
$ |
148.9 |
|
|
|
|
|
|
|
|
|
|
|
|
|
| |||||
|
Allowance for disallowed revenue % |
|
27.6 |
% |
30.0 |
% |
32.1 |
% |
24.5 |
% |
17.0 |
% | |||||
|
Allowance for doubtful accounts % |
|
7.0 |
% |
5.5 |
% |
3.6 |
% |
3.0 |
% |
2.6 |
% | |||||
|
Total allowance % |
|
34.6 |
% |
35.5 |
% |
35.7 |
% |
27.5 |
% |
19.6 |
% | |||||
Revenue Cycle Management
Prior to 2014, we performed our eligibility, patient pre-authorization, patient documentation, claims coding, claims submission, collection, cash application and claims audit support activities (our “revenue cycle management” functions) primarily on a decentralized location by location basis. Due to the increases experienced in disallowed revenue, as well as to address certain procedural requirements of our new patient management and electronic health record system and to otherwise improve the effectiveness of our revenue cycle management functions, during 2014 we commenced the process of establishing a centralized revenue cycle management organization with the strategy to gradually transition these functions from our decentralized clinic locations to a centralized organization. We continued and expanded this initiative in 2015 and 2016.
As discussed in the “Reimbursement Trends” section above, we experienced decreases in our disallowed revenue in 2015 and 2016, as compared with 2014. In addition to other training and claims documentation initiatives, we believe that decreases we have experienced in disallowed revenue (as well as our overall accounts receivables balances) are due in part to our revenue cycle management initiative.
New System Implementation
In 2014, in our Patient Care segment, we commenced the implementation of a new patient management and electronic health record system at our patient care clinics. A key purpose of the system was to automate clinician documentation, claims coding and other increasingly complex clinic administrative requirements. In connection with the system implementation, we customized certain templates and software code within a system developed by NextGen. In 2014, as the system was installed at increasing numbers of clinics, we encountered difficulties in clinic workload, were unable to timely apply cash we received from payors to patient accounts and experienced a marked increase in our accounts receivable balance. Due to these issues, we halted the implementation at the end of the third quarter of 2014, after the system had been installed at approximately one-third of our sites.
We believe the implementation issues we encountered related primarily to inadequate testing of the system, a failure to successfully establish and effectively staff a central cash applications function, insufficient training and other difficulties associated with our customizations of the software code.
We subsequently resolved the issues we encountered with the system and our implementation process, and recommenced implementation in 2016. We currently estimate approximately two-thirds of our clinic locations will be utilizing this system by the end of 2017, and we will convert the remaining one-third of our locations to this system by mid-2019.
Clinic-Level Claims Documentation
In addition to our revenue cycle management initiatives and resolution of the aforementioned issues associated with our implementation of our new electronic health record and patient management system, in 2016 we commenced more intensive training and increased our internal clinic-level emphasis on the importance of adherence to procedural and documentation
standards. The absence of sufficient documentation establishing medical necessity and a patient’s degree of ability for future activity is a key factor utilized by payors when denying our claims for reimbursement. Irrespective of a patient’s need and the existence of a referral from the treating physician, we have found it increasingly necessary to retrieve other supporting documentation and notes from referring physicians themselves to further justify and document their medical determinations relating to the patients they refer to us. Given that these referring physicians do not work for us, the retrieval of this additional information to suit payors can be difficult and time-consuming.
In 2016, we believe our efforts to increase our discipline through this clinic-level claims documentation initiative assisted us in further reducing the level of our disallowed sales. However, we also believe these efforts had a one-time indirect effect of reducing our overall revenue growth rate during that year. In addition to other factors affecting our same clinic sales trends in 2016, as clinicians and their office administrators increased their attention on achieving higher documentation standards, we believe we were able to see and treat fewer patients, thereby contributing to our reduced same clinic patient care revenue.
We are continuing to apply this documentation discipline in 2017. With the initial start up impact behind us, we do not believe it will be a significant factor in our year over year revenue growth trends for 2017.
Increasing Patient Responsibility for the Cost of Devices
The majority of our devices are provided as replacement devices to patients with devices that are broken or have become worn with age. Prosthetic devices are typically replaced every three to five years. In recent years, an increasing number of employers have been shifting the cost burdens in their health plans to employees through use of “high deductible” or “consumer-driven” health plans. These plan designs typically require the patient to bear a greater portion of the cost of their care in exchange for a lower monthly premium. We believe the increased use of these plans has and will continue to have the effect of causing patients to delay the replacement of their devices and could accordingly adversely impact our revenue.
Products & Services Segment Trends
Within our Products & Services segment, we provide therapeutic equipment and services to patients at SNFs and other healthcare provider locations. In late 2016, a number of our clients, including several of our larger SNF clients elected to discontinue their use of our therapeutic services. We believe these discontinuances relate primarily to their overall efforts to reduce the costs they bear for therapy-related services within their facilities. As a part of those terminations of service, in a number of cases, we elected to sell terminating clients the equipment which we had utilized for their locations which resulted in our recognition of $6.7 million in equipment sales in this segment during 2016 as compared with $2.9 million in 2015 and $2.4 million in 2014. In 2017, we anticipate that we will experience a decrease of approximately $11.0 million in services and supplies revenue associated with customer discontinuances of their therapy services and that our equipment sales will decrease to levels similar to those experienced in 2015 and 2014, resulting in approximately a $15.0 million decrease in revenue from therapeutic services in 2017 as compared with 2016. We also currently believe that our revenues from these therapeutic services will continue to decline in 2018. Within this portion of our business, we have responded to these trends through increases in our marketing programs which convey the value we believe our services have to patients at SNFs and have begun to increase our focus on sales of our therapeutic services to other adjacent health services provider markets.
Discontinuance of the Dosteon and CARES Businesses
On November 5, 2014, the Audit Committee of our Board of Directors approved a plan to sell or otherwise dispose of Dosteon and CARES, both part of our Patient Care segment. This action was taken as a result of our strategic evaluation of these businesses. As of December 31, 2014, Dosteon qualified as assets held for sale and discontinued operations. As such the assets, operating results and cash flows of the Dosteon disposal group have been presented separately as discontinued operations within our consolidated financial statements. The CARES business did not qualify as assets held for sale and was ultimately wound down in 2015. Accordingly, the CARES business has been classified as a continuing operation in our consolidated financial statements for all financial periods through 2015, the year of its cessation of operations. The information provided herein is for continuing operations, unless otherwise indicated. See Note S - “Discontinued Operations” to our consolidated financial statements in this Annual Report on Form 10-K for additional discussion of our discontinued operations.
Acquisitions
Since the first quarter of 2015, we have made no acquisitions. We halted our acquisitions at that time both due to the necessity of our utilizing available operating cash flow to fund accounting, legal and other professional fees in connection with our preparation and review of the financial statements, efforts to remediate Material Weaknesses, and related legal matters, as well as due to the effect of our non-compliance with certain of our debt covenants relating to our failure to meet financial statement reporting requirements. Once we regain timely filing status, and provided no other events or factors emerge that would prevent our use of capital for the purposes of acquisitions, we currently intend to recommence acquisitions of O&P businesses similar to those that we have consummated in prior years.
In the first quarter of 2015, we acquired three O&P businesses with approximately $11.8 million in revenue, operating a total of 15 patient care clinics located in three states. The aggregate purchase price for these businesses was $15.3 million, including $10.2 million in net cash, $4.7 million of Seller Notes and $0.4 million of working capital adjustments and other.
In 2014, we acquired twelve O&P businesses and one distribution business with approximately $55.7 million in revenue, operating a total of 37 patient care clinics and one distribution center located in eleven states. The aggregate purchase price for these businesses was $52.7 million, including $38.1 million in net cash, $14.0 million of Seller Notes and $0.6 million of working capital adjustments and other.
WalkAide System Coverage Decision
Our WalkAide system is a device manufactured and sold through our Products & Services segment that is designed to use functional electrical stimulation, or “FES”, to improve ambulation in people experiencing a condition known as “foot drop.” Foot drop is a gait abnormality in which patients have difficulty lifting the front part of their foot as they walk due to weakness, irritation or damage to the common fibular nerve in the lower leg.
In 2006, CMS issued a National Coverage Determination (“NCD”) that provided limited Medicare coverage for the WalkAide system in specific cases where the foot drop condition was caused by partial spinal injury. In an effort to seek expanded Medicare coverage, in 2012 and 2013 we conducted randomized clinical trials involving a use of the WalkAide system for patients with foot drop caused by stroke. Based on the outcomes of those studies, in late 2013 we requested that CMS reopen the 2006 NCD to include coverage under Medicare for foot drop caused by stroke. However, in the fourth quarter of 2014, after reviewing the results of the clinical trial, CMS determined that they would not reopen the NCD to expand coverage.
The WalkAide system remains a steady, but not significant, part of our overall business.
Seasonality
We believe our business is affected by the degree to which patients have otherwise met the deductibles for which they are responsible in their medical plans during the course of the year. The first quarter is normally our lowest relative net revenue quarter, followed by the second and third quarters, which are somewhat higher and consistent with one another, and, due to the general fulfillment by patients of their health plan co-payments and deductible requirements towards the year’s end, our fourth quarter is normally our highest revenue producing quarter.
Our results are also affected, to a lesser extent, by our holding of an education fair in the first quarter of each year. This one week event is conducted to assist our clinicians in maintaining their training and certification requirements and to facilitate a national meeting with our clinical leaders. We also invite manufacturers of the componentry for the devices we fabricate to these annual events so they can demonstrate their products and otherwise assist in our training process. During the first quarters of 2016, 2015 and 2014, we spent approximately $2.1 million, $2.0 million and $2.1 million, respectively, on travel and other costs associated with this one week event. In addition to the costs we incur associated with this annual event, we also lose the productivity of a significant portion of our clinicians during the one week period in which this event occurs, which contributes to the lower seasonal revenue level we experience during the first quarter of each year.
Business Environment and Outlook
We have a positive view of the long-term need for prosthetic and orthotic devices and services within the markets that we serve. To address the debilitating effects of injuries and medical conditions such as diabetes, vascular disease, cancer and
congenital disorders, we believe patients will have a continuing need for the O&P services that we provide. As the population grows and ages, we also believe there will be a gradual underlying increase in market demand.
To ensure we maintain and grow our share of this market, we believe that it will be necessary for us to find effective means to automate and better organize our business processes, improve our reimbursement capabilities and lower our cost structure in the longer term. Our size may afford us the ability to achieve economies of scale through purchasing and process automation initiatives that would be difficult for our smaller competitors. However, our size can work against us if we do not succeed in effectively serving our referring physicians and in competing with our individual competitors in each of the markets that we serve.
Additionally, we will need to overcome the adverse effects which the material weaknesses, Restatement and Investigation have had on our reputation.
Critical Accounting Policies
Our analysis and discussion of our financial condition and results of operations is based upon the consolidated financial statements that have been prepared in accordance with GAAP. The preparation of consolidated financial statements in conformity with GAAP requires management to make estimates and assumptions that affect the reported amounts of assets and liabilities, disclosure of contingent assets and liabilities at the date of the consolidated financial statements and the reported amounts of revenues and expenses during the reporting period. GAAP provides the framework from which to make these estimates, assumptions and disclosures. We have chosen accounting policies within GAAP that management believes are appropriate to fairly present, in all material respects, our operating results and financial position. Our significant accounting policies are stated in Note B - “Significant Accounting Policies” to the consolidated financial statements included in this Annual Report on Form 10-K. We believe the following accounting policies are critical to understanding our results of operations and the more significant judgments and estimates used in the preparation of our consolidated financial statements.
Revenue Recognition
Patient Care Segment
Revenues in our Patient Care segment are primarily derived from the sale of O&P devices and are recognized when the patient has received the device or service. At or subsequent to delivery, we issue an invoice to a third party payor, which primarily consists of commercial insurance companies, Medicare, Medicaid, the VA and private or patient pay (“Private Pay”). We recognize revenue for the amounts we expect to receive from payors based on expected contractual reimbursement rates, which are net of estimated contractual discounts. Government reimbursement, comprised of Medicare, Medicaid and the U.S. Department of Veterans Affairs, in the aggregate, accounted for approximately, 54.1%, 53.4% and 50.9% of our net revenue in 2016, 2015 and 2014, respectively.
These revenue amounts are further revised as claims are adjudicated, which may result in disallowances, or decreases to revenue. We believe that adjustments related to write-offs of receivables should predominantly be recorded as a reduction of revenues, which we refer to as disallowed revenue. This is due to the majority of our revenues being collected from commercial insurance companies, Medicare, Medicaid and the VA, most of which are under contractual reimbursement rates. As such, adjustments do not relate to an inability to pay, but to contractual allowances, lack of timely claims submission, insufficient medical documentation or other administrative errors. Amounts recorded to bad debt expense, which are presented within “Other operating costs,” generally relate to commercial payor bankruptcies and private pay balances for which there was an assessment of collectability and collection attempts were made. At the end of each period, we establish allowances for estimated disallowances relating to that period based on prior adjudication experience and record such amounts as an adjustment to revenue. In a similar fashion, we estimate and record allowances for doubtful accounts on unpaid receivables at each period end. We also record a liability, with a corresponding adjustment to revenue, for refunds expected to be paid to our patients or third party payors.
Medicare and Medicaid regulations and the various agreements we have with other third party payors, including commercial healthcare providers under which these contractual adjustments and disallowed revenue are calculated, are complex and are subject to interpretation and adjustment and may include multiple reimbursement mechanisms for different types of services. Therefore, the particular O&P devices and related services authorized and provided, and the related reimbursement, are subject to interpretation and adjustment that could result in payments that differ from our estimates. Additionally, updated regulations and reimbursement schedules, and contract renegotiations occur frequently, necessitating regular review and
assessment of the estimation process by management. As a result, there is a reasonable possibility that recorded estimates will change materially in the short-term and any related adjustments will be recorded as changes in estimates when they become known.
For more information on our use of estimates to calculate allowances for disallowed revenue and doubtful accounts, refer to the “Accounts Receivable, Net” section below.
We often invoice patients or payors after a device is delivered. To account for this delay, we record an estimated revenue accrual for devices delivered but not yet invoiced at period end. This estimate is based on a historical look-back analysis of lag times between delivery and invoicing that occur over a period end.
Products & Services Segment
Revenues in our Products & Services segment are derived from the distribution of O&P components and the leasing and sale of rehabilitation equipment and ancillary consumable supplies combined with equipment maintenance, education, and training. Distribution revenues are recorded upon the delivery of products, net of estimated returns.
Equipment leasing and related services revenue are recognized over the applicable term as the customer has the right to use the equipment and as the services are provided. Equipment sales revenue is recognized upon delivery, with any related services revenue deferred and recognized as the services are performed. Sales of consumables are recognized upon delivery.
Accounts Receivable, Net
Patient Care Segment
We establish allowances for accounts receivable to reduce the carrying value of such receivables to their estimated net realizable value. The Patient Care segment’s accounts receivables are recorded net of unapplied cash, estimated allowance for disallowed revenue and estimated allowance for doubtful accounts, as described in the Revenue Recognition accounting policy above.
Both the allowance for disallowed revenue and the allowance for doubtful accounts estimates consider historical collection experience by each of the Medicare and non-Medicare (commercial insurance, Medicaid, Veteran’s Administration and Private Pay) primary payor class groupings. For each payor class grouping, liquidation analysis of historical period end receivable balances are performed to ascertain collections experience by aging category. We believe the use of historical collection experience applied to current period end receivable balances is reasonable. In the absence of an evident adverse trend, we use historical experience rates calculated using an average of four quarters of data with at least twelve months of adjudication. We believe the time periods analyzed provide sufficient time for most balances to adjudicate in the normal course of operations. We will modify the time periods analyzed when significant trends indicate that adjustments should be made. In addition, estimates are adjusted when appropriate for information available up through the issuance of the consolidated financial statements.
Products & Services Segment
Products & Services segment’s allowance for doubtful accounts is estimated based on the analysis of the segment’s historical write-offs experience, accounts receivable aging and economic status of its customers. Accounts receivable that are deemed uncollectible are written-off to the allowance for doubtful accounts. Accounts receivable are also recorded net of an allowance for estimated sales returns.
Inventories
Inventories are valued at the lower of estimated cost or net realizable value, with cost determined on a first-in, first-out (“FIFO”) basis. Provisions have also been made to reduce the carrying value of inventories for excess, obsolete, or otherwise impaired inventory on hand at period-end.
Patient Care Segment
Substantially all of our Patient Care segment inventories are recorded through a periodic approach whereby inventory quantities are adjusted on the basis of a quarterly physical count. Segment inventories relate primarily to raw materials and WIP at Hanger Clinics. Inventories at Hanger Clinics totaled $29.1 million and $30.1 million at December 31, 2016 and 2015, respectively, with WIP inventory representing $9.0 million and $8.9 million of the total inventory, respectively.
Raw materials consists of purchased parts, components, and supplies which are used in the assembly of O&P devices for delivery to patients. In some cases, purchased parts and components are also sold directly to patients. Raw materials are valued based on recent vendor invoices, reduced by estimated vendor rebates. Such rebates are recognized as a reduction of cost of materials in the consolidated statements of operations and comprehensive (loss) income when the related devices or components are delivered to the patient. Approximately 69% and 52% of materials at December 31, 2016 and 2015, respectively were purchased from our Products & Services segment. Raw material inventory was $20.1 million and $21.2 million at December 31, 2016 and 2015 respectively.
WIP consists of devices which are in the process of assembly at our clinics or fabrication centers. WIP quantities were determined by the physical count of patient orders at the end of every quarter of 2016 and 2015 while the related stage of completion of each order was established by clinic personnel. We do not have an inventory costing system and as a result, the identified WIP quantities were valued on the basis of estimated raw materials, labor, and overhead costs. To estimate such costs, we develop bills of materials for certain categories of devices that we assemble and deliver to patients. Within each bill of material, we estimate (i) the typical types of component parts necessary to assemble each device; (ii) the points in the assembly process when such component parts are added; (iii) the estimated cost of such parts based on historical purchasing data; (iv) the estimated labor costs incurred at each stage of assembly; and (v) the estimated overhead costs applicable to the device.
Products & Services Segment
Product & Service segment inventories consist primarily of finished goods at its distribution centers as well as raw materials at fabrication facilities, and totaled $39.1 million and $38.4 million as of December 31, 2016 and 2015, respectively. Finished goods include products that are available for sale to third party customers as well as to our Patient Care segment as described above. Such inventories were determined on the basis of perpetual records and a physical count at year end. Inventories in connection with therapeutic services are valued at a weighted average cost.
Business Combinations
We record tangible and intangible assets acquired and liabilities assumed in business combinations under the acquisition method of accounting. For consideration of the net assets acquired, we typically pay cash and issue a Seller Note. We may also include contingent consideration with payment terms associated with the achievement of designated collection targets of the acquired business. Amounts paid for each acquisition are allocated to the assets acquired and liabilities assumed based on their estimated fair values at the date of acquisition inclusive of identifiable intangible assets. The estimated fair value of identifiable assets and liabilities are based on detailed valuations performed internally or by external valuation specialists that use information and assumptions provided by management. We allocate any excess purchase price over the fair value of the net tangible and identifiable assets acquired and liabilities assumed to goodwill. Significant management judgments and assumptions are required in determining the fair value of acquired assets and liabilities, particularly acquired intangible assets, including estimated useful lives. The valuation of purchased intangible assets is based upon estimates of the future performance and discounted cash flows from the acquired business. Each asset acquired or liability assumed is measured at estimated fair value from the perspective of a market participant. Subsequent changes in estimated fair value of contingent consideration are recognized as “General and administrative expenses” within the consolidated statements of operations and comprehensive (loss) income.
Goodwill and Other Intangible Assets, Net
Goodwill represents the excess of the purchase price over the estimated fair value of net identifiable assets acquired and liabilities assumed from purchased businesses. We assess goodwill for impairment annually during the fourth quarter, and between annual tests if an event occurs or circumstances change that would more likely than not reduce the fair value of a reporting unit below its carrying amount. We have the option to first assess qualitative factors to determine whether it is more likely than not that the fair value of a reporting unit is less than its carrying amount as a basis for determining whether it is necessary to perform the two-step goodwill impairment test. If it is determined that a two-step goodwill impairment test is necessary or more efficient than a qualitative approach, we will measure the fair value of the reporting units using a
combination of income and market approaches. Any impairment would be recognized by a charge to income from operations and a reduction in the carrying value of the goodwill.
If the fair value of the reporting unit exceeds its carrying amount, goodwill of the reporting unit is considered not impaired, and the second step of the impairment test is not required. The second step, if required, compares the implied fair value of the reporting unit goodwill with the carrying amount of that goodwill. The fair value of a reporting unit is allocated to all of the assets and liabilities of that unit (including any unrecognized intangible assets) as if the reporting unit had been acquired in a business combination. If the carrying amount of the reporting unit’s goodwill exceeds its implied fair value, an impairment charge is recognized in an amount equal to that excess.
We apply judgment in determining the fair value of our reporting units and the implied fair value of goodwill which is dependent on significant assumptions and estimates regarding expected future cash flows, terminal value, changes in working capital requirements, and discount rates.
The fair value of acquired customer intangibles is estimated using an excess earnings model. Key assumptions utilized in the valuation model include pro-forma projected cash flows adjusted for market-participant assumptions, forecasted customer retention curve, and discount rate. Customer intangibles are amortized, using the straight-line method over an estimated useful life of four to ten years. The fair value of non-compete agreements are estimated using a discounted cash flow model. The related intangible assets are amortized, using the straight-line method, over their term which ranges from two to five years. Other definite-lived intangible assets are recorded at cost and are amortized, using the straight-line method, over their estimated useful lives of up to seventeen years. The fair value associated with trade names is estimated using the relief-from-royalty method with the primary assumptions being the royalty rate and expected revenues associated with the trade names. These assets, some of which have indefinite lives, are primarily included in the Products & Services segment. Indefinite lived trade name intangible assets are assessed for impairment in the fourth quarter of each year, or more frequently if events or changes in circumstances indicate that the asset might be impaired. Trade name intangible assets with definite lives are amortized over their estimated useful lives of one to ten years.
For the years ended December 31, 2016 and 2015, we recorded impairments of our goodwill totaling $86.0 million and $382.9 million, respectively. See Note H - “Goodwill and Other Intangible Assets” to our consolidated financial statements in this Annual Report on Form 10-K for additional information regarding these charges.
In conjunction with our Goodwill impairment testing at December 31, 2015, we reevaluated the estimated useful life of our customer list intangibles. In the fourth quarter of 2015, the estimated useful life of our customer list intangibles was reduced from 10 years to four years in our Patient Care segment and from 14 years to 10 years in our Products & Services segment. This change in the estimated useful lives increased amortization for the years ended December 31, 2015 and 2016 by approximately $6.0 million and $7.0 million, respectively.
As described, we apply judgment in the selection of key assumptions used in both steps of the goodwill impairment test and as part of our evaluation of intangible assets tested annually and at interim testing dates as necessary. If these assumptions differ from actual, we could incur additional impairment charges and those charges could be material.
Income Taxes
We recognize deferred tax assets and liabilities for net operating loss and other credit carry forwards and the expected tax consequences of temporary differences between the tax basis of assets and liabilities and their reported amounts using enacted tax rates in effect for the year the differences are expected to reverse. The ultimate realization of deferred tax assets is dependent upon the generation of future taxable income during the periods in which those temporary differences become deductible. The evaluation of deferred tax assets requires judgment in assessing the likely future tax consequences of events that have been recognized in our financial statements or tax returns, and future profitability by tax jurisdiction.
We provide a valuation allowance to reduce our deferred tax assets to the amount that is more likely than not to be realized. We have experienced losses in the past three years due to impairments of our intangible assets, increased professional fees in relation to our restatement and related remediation procedures for identified material weaknesses, and increased interest and bank fees. These losses have necessitated that we evaluate the sufficiency of our valuation allowance. We are able to carry back our tax losses generated in 2016 and 2015 to prior years and recoup all the losses without increasing our net operating loss carryforwards for federal tax purposes. Even though these credit carry forwards did not increase, we have $94.2 million of net deferred tax assets as of December 31, 2016. We expect to generate income before taxes in future periods at a level that
would allow for the full realization of the majority of our net deferred tax assets. We continue to maintain a valuation allowance of approximately $6.9 million as of December 31, 2016, against net deferred tax assets, primarily related to various state jurisdictions where we do not currently believe that the full realization of our deferred tax assets is more likely than not.
We evaluate our deferred tax assets quarterly to determine whether adjustments to the valuation allowance are appropriate in light of changes in facts or circumstances, such as changes in expected future pre-tax earnings, tax law, interactions with taxing authorities and developments in case law. In making this evaluation, we rely on our history of pre-tax earnings. Our material assumptions are our forecasts of future pre-tax earnings and the nature and timing of future deductions and income represented by the deferred tax assets and liabilities, all of which involve the exercise of significant judgment.
Although we believe our estimates are reasonable, the ultimate determination of the appropriate amount of valuation allowance involves significant judgment. If expected future taxable income is not achieved a larger valuation allowance against our deferred tax assets could be required and could be significant.
We believe that our tax positions are consistent with applicable tax law, but certain positions may be challenged by taxing authorities. In the ordinary course of business, there are transactions and calculations where the ultimate tax outcome is uncertain. In addition, we are subject to periodic audits and examinations by the Internal Revenue Service and other state and local taxing authorities. In these cases, we record the financial statement effects of a tax position when it is more-likely-than-not, based on the technical merits, that the position will be sustained upon examination. We record the largest amount of tax benefit that is greater than fifty percent likely of being realized upon settlement with a taxing authority that has full knowledge of all relevant information. If not paid, the liability for uncertain tax positions is generally recorded as a reduction of income tax expense at the earlier of the period when the position is effectively settled or when the statute of limitations has expired. Although we believe our estimates are reasonable, actual results could differ from these estimates.
Recent Accounting Pronouncements
Refer to the “Recent Accounting Pronouncements” section in Note B - “Significant Accounting Policies” in this Annual Report on Form 10-K for disclosure of recent accounting pronouncements that are either expected to have more than a minimal impact on our consolidated financial position and results of operation, or that we are still assessing to determine their impact.
Results of Operations - Year Ended December 31, 2016 Compared to Year Ended December 31, 2015
From 2015 through 2016, our annual consolidated results of operations were as follows:
|
|
|
For the Years Ended |
|
Percent |
| ||||
|
(dollars in millions) |
|
2016 |
|
2015 |
|
2016 v 2015 |
| ||
|
|
|
|
|
|
|
|
| ||
|
Net revenue |
|
$ |
1,042.1 |
|
$ |
1,067.2 |
|
(2.4 |
)% |
|
Material costs |
|
332.1 |
|
336.3 |
|
(1.2 |
)% | ||
|
Personnel costs |
|
363.5 |
|
367.1 |
|
(1.0 |
)% | ||
|
Other operating costs |
|
139.1 |
|
140.9 |
|
(1.3 |
)% | ||
|
General and administrative expenses |
|
107.2 |
|
111.8 |
|
(4.1 |
)% | ||
|
Professional accounting and legal fees |
|
41.2 |
|
28.6 |
|
44.1 |
% | ||
|
Depreciation and amortization |
|
44.9 |
|
46.3 |
|
(3.0 |
)% | ||
|
Impairment of intangible assets |
|
86.2 |
|
385.8 |
|
(77.7 |
)% | ||
|
Loss from operations |
|
(72.1 |
) |
(349.6 |
) |
(79.4 |
)% | ||
|
|
|
|
|
|
|
|
| ||
|
Interest expense, net |
|
45.2 |
|
29.9 |
|
51.2 |
% | ||
|
Extinguishment of debt |
|
6.0 |
|
7.2 |
|
(16.7 |
)% | ||
|
Loss from continuing operations before income taxes |
|
(123.3 |
) |
(386.7 |
) |
(68.1 |
)% | ||
|
Benefit for income taxes |
|
(15.9 |
) |
(67.6 |
) |
(76.5 |
)% | ||
|
Loss from continuing operations |
|
(107.4 |
) |
(319.1 |
) |
(66.3 |
)% | ||
|
Income (loss) from discontinued operations, net of income taxes |
|
0.9 |
|
(8.0 |
) |
(111.3 |
)% | ||
|
Net loss |
|
$ |
(106.5 |
) |
$ |
(327.1 |
) |
(67.4 |
)% |
Material costs, personnel costs and other operating costs reflect expenses we incur in connection with our delivery of care through our clinic locations and other patient care operations, or distribution of products and services, and exclude expenses incurred in connection with general and administrative activities. General and administrative expenses reflect expenses we incur in the general management and administration of our businesses that are not directly attendant to the operation of our clinics or provision of products and services.
Due to the substantial amount and increase in the expenses we incur for professional accounting and legal services, we separately disclose these expenses within operating expenses. We have incurred increases in these expenses primarily in connection with the Restatement, the Investigation and in connection with our accounting and remedial activities associated with the material weaknesses. We currently anticipate that these expenses will remain significant in comparison to a normal level of expenditure at least through 2018.
When the financial statement carrying amount of a long-lived asset or asset group exceeds its fair value and is not recoverable, an asset impairment is recognized. The significant decline in the trading value of our stock impaired assets in the Patient Care, Distribution and Therapeutic reporting units. Impairment losses are separately disclosed within (Loss) income from operations in this Annual Report on Form 10-K.
During the years 2015 through 2016, our operating expenses as a percentage of net revenue were as follows:
|
|
|
For the Years Ended December 31, |
| ||
|
|
|
2016 |
|
2015 |
|
|
|
|
|
|
|
|
|
Material costs |
|
31.9 |
% |
31.5 |
% |
|
Personnel costs |
|
34.9 |
% |
34.4 |
% |
|
Other operating costs |
|
13.2 |
% |
13.2 |
% |
|
General and administrative expenses |
|
10.3 |
% |
10.5 |
% |
|
Professional accounting and legal fees |
|
4.0 |
% |
2.7 |
% |
|
Depreciation and amortization |
|
4.3 |
% |
4.3 |
% |
|
Impairment of intangible assets |
|
8.3 |
% |
36.2 |
% |
|
Operating expenses |
|
106.9 |
% |
132.8 |
% |
Due to the significance of disallowed revenue as discussed above in Reimbursement Trends, the rate of disallowed revenue experienced during the periods encompassed by this Annual Report on Form 10-K and to assist in evaluating the comparability of expense trends, the following table provides our adjusted gross revenue, disallowed revenue and net revenue for each year as well as our expenses as a percentage of adjusted gross revenue:
|
|
|
For the Years Ended December 31, |
| ||||
|
(dollars in millions) |
|
2016 |
|
2015 |
| ||
|
|
|
|
|
|
| ||
|
Net revenue |
|
$ |
1,042.1 |
|
$ |
1,067.2 |
|
|
Disallowed revenue |
|
49.3 |
|
60.6 |
| ||
|
Adjusted gross revenue |
|
$ |
1,091.4 |
|
$ |
1,127.8 |
|
|
|
|
|
|
|
| ||
|
Material costs |
|
30.4 |
% |
29.8 |
% | ||
|
Personnel costs |
|
33.3 |
% |
32.6 |
% | ||
|
Other operating costs |
|
12.8 |
% |
12.5 |
% | ||
|
General and administrative expenses |
|
9.8 |
% |
9.9 |
% | ||
|
Professional accounting and legal fees |
|
3.8 |
% |
2.5 |
% | ||
|
Depreciation and amortization |
|
4.1 |
% |
4.1 |
% | ||
|
Impairment of intangible assets |
|
7.9 |
% |
34.2 |
% | ||
|
Operating expenses |
|
102.1 |
% |
125.6 |
% | ||
During the previous two years, the number of patient care clinics and satellite clinics we operated have been as follows:
|
|
|
As of December 31, |
| ||
|
|
|
2016 |
|
2015 |
|
|
|
|
|
|
|
|
|
Patient Care Clinics |
|
706 |
|
721 |
|
|
Satellite Clinics |
|
115 |
|
116 |
|
|
Total Clinics |
|
821 |
|
837 |
|
Patient care clinics reflect locations that are licensed as a primary location to provide O&P services and which are fully-staffed and open throughout a typical operating week. To facilitate patient convenience, we also operate satellite clinics. These are remote locations associated with a primary care clinic, utilized to see patients and are open for operation on less than a full-time basis during a typical operating week.
Net revenue. Net revenue for the year ended December 31, 2016 was $1,042.1 million, a decrease of $25.1 million, or 2.4%, from $1,067.2 million for the year ended December 31, 2015. Net revenue by operating segment, after elimination of intersegment activity, was as follows:
|
|
|
For the Years Ended December 31, |
|
|
|
Percent |
| |||||
|
(dollars in millions) |
|
2016 |
|
2015 |
|
Change |
|
Change |
| |||
|
|
|
|
|
|
|
|
|
|
| |||
|
Patient Care |
|
$ |
840.1 |
|
$ |
875.0 |
|
$ |
(34.9 |
) |
(4.0 |
)% |
|
Products & Services |
|
202.0 |
|
192.2 |
|
9.8 |
|
5.1 |
% | |||
|
Net revenue |
|
$ |
1,042.1 |
|
$ |
1,067.2 |
|
$ |
(25.1 |
) |
(2.4 |
)% |
Patient Care net revenue decreased $34.9 million or 4.0% to $840.1 million for the year ended December 31, 2016 from $875.0 million for the year ended December 31, 2015. Patient care clinic net revenue declined $27.9 million primarily due to increased time spent processing submissions of claims coupled with the consolidation and closure of lower performing clinics. CARES net revenue declined $6.4 million in 2016 as the business unit was closed in 2015, and network contract management revenue declined $0.6 million for the year ended December 31, 2016 compared with the year ended December 31, 2015. Products & Services net revenue increased $9.8 million or 5.1% for year ended December 31, 2016 to $202.0 million from $192.2 million for year ended December 31, 2015. Net revenue from our distribution products increased $6.3 million from higher prosthetic sales, and therapeutic services net revenue increased $3.5 million primarily from sale of equipment to customers who discontinued our services as described in “Products & Services Segment Trends” section above.
Material costs. Material costs for the year ended December 31, 2016 were $332.1 million, a decrease of $4.2 million, or 1.2%, from $336.3 million for the year ended December 31, 2015. Material costs by operating segment, after elimination of intersegment activity, were as follows:
|
|
|
For the Years Ended December 31, |
|
|
|
Percent |
| |||||
|
(dollars in millions) |
|
2016 |
|
2015 |
|
Change |
|
Change |
| |||
|
|
|
|
|
|
|
|
|
|
| |||
|
Patient Care |
|
$ |
256.0 |
|
$ |
262.3 |
|
$ |
(6.3 |
) |
(2.4 |
)% |
|
Products & Services |
|
76.1 |
|
74.0 |
|
2.1 |
|
2.8 |
% | |||
|
Material costs |
|
$ |
332.1 |
|
$ |
336.3 |
|
$ |
(4.2 |
) |
(1.2 |
)% |
|
|
|
|
|
|
|
|
|
|
| |||
|
Percent of net revenue |
|
31.9 |
% |
31.5 |
% |
|
|
|
| |||
|
Percent of adjusted gross revenue |
|
30.4 |
% |
29.8 |
% |
|
|
|
| |||
Material costs increased to 31.9% of net revenue in 2016 compared to 31.5% in 2015, and increased to 30.4% of adjusted gross revenue in 2016 compared to 29.8% in 2015. With the shutdown of the CARES business in 2015, material costs were lower by $3.6 million in 2016. In addition, Hanger Clinic’s material costs decreased $2.7 million for the year ended December 31, 2016 from lower revenue. Material costs in Products & Services increased $2.1 million from higher net revenue for distribution products for the year ended December 31, 2016 compared to the year ended December 31, 2015. Material costs were also impacted by product mix and vendor rebates.
Personnel costs. Personnel costs for the year ended December 31, 2016 decreased $3.6 million to $363.5 million from $367.1 million for the year ended December 31, 2015. Personnel costs by operating segment were as follows:
|
|
|
For the Years Ended December 31, |
|
|
|
Percent |
| |||||
|
(dollars in millions) |
|
2016 |
|
2015 |
|
Change |
|
Change |
| |||
|
|
|
|
|
|
|
|
|
|
| |||
|
Patient Care |
|
$ |
315.9 |
|
$ |
317.9 |
|
$ |
(2.0 |
) |
(0.6 |
)% |
|
Products & Services |
|
47.6 |
|
49.2 |
|
(1.6 |
) |
(3.3 |
)% | |||
|
Personnel costs |
|
$ |
363.5 |
|
$ |
367.1 |
|
$ |
(3.6 |
) |
(1.0 |
)% |
|
|
|
|
|
|
|
|
|
|
| |||
|
Percent of net revenue |
|
34.9 |
% |
34.4 |
% |
|
|
|
| |||
|
Percent of adjusted gross revenue |
|
33.3 |
% |
32.6 |
% |
|
|
|
| |||
Although we experienced an overall decline in personnel costs of $3.6 million in 2016 as compared to 2015, due to the decline in net revenue, personnel costs increased to 34.9% of net revenue in 2016 compared to 34.4% in 2015, and increased to 33.3% of adjusted gross revenue in 2016 compared to 32.6% in 2015. For the year ended December 31, 2016, personnel costs for our Patient Care segment decreased $2.0 million, or 0.6%, as compared to the year ended December 31, 2015. The shutdown of the CARES business decreased personnel costs $3.4 million. To address the increased time demand on processing revenue reimbursements, additional billing and collection personnel were added. Excluding CARES, this increase in personnel, coupled with an annual merit increase for employees added $10.5 million in higher salary, benefits and payroll taxes costs. Within patient care personnel costs, bonus and commissions were $8.9 million lower for 2016 compared to 2015 driven by lower segment revenue. Excluding CARES, temporary labor and other costs were $0.2 million lower in 2016 compared to the prior year. Personnel costs in the Products & Services segment declined $1.6 million, or 3.3%, primarily from lower bonuses and commissions of $3.6 million, partially offset by $2.0 million of increases in salary, benefit and other employee compensation for 2016 compared to 2015.
Other operating costs. Other operating costs were $139.1 million in 2016, a $1.8 million, or 1.3%, decrease compared to the $140.9 million incurred in 2015. The shutdown of the CARES business decreased other operating costs by $4.4 million. Rent, utilities, occupancy, office and other operating costs increased $1.5 million in 2016 as compared to 2015. Bad debt expense increased $1.1 million primarily from the bankruptcy of one large customer in our distribution area.
General and administrative expenses. For the year ended December 31, 2016, general and administrative expenses decreased $4.6 million, or 4.1% to $107.2 million from $111.8 million for the year ended December 31, 2015. Decreases in bonus and other personnel costs lowered personnel compensation by $3.3 million in 2016 compared to 2015, partially offset by $3.0 million of additional salary, benefits and payroll taxes that included an annual merit increase coupled with additional personnel hired in the accounting and finance function to help mitigate the material weakness and support the Restatement effort. Facility, other related office personnel costs and casual labor were lower by $4.3 million for 2016 compared to 2015.
Professional accounting and legal fees. Professional accounting and legal fees increased 44.1% to $41.2 million for the year ended December 31, 2016 from $28.6 million for the year ended December 31, 2015 from the restatement of prior financial periods and costs related to our financial accounting remediation process. Accounting related fees increased $10.7 million, legal fees increased $2.6 million and other related expenses decreased $0.7 million for the comparative twelve months.
Depreciation and amortization. Depreciation and amortization for the year ended December 31, 2016 decreased to $44.9 million from $46.3 million for the year ended December 31, 2015. The $1.4 million, or 3.0%, decrease included a $1.0 million decline in depreciation from therapeutic program equipment sold to customers as discussed above in “Products & Services Segment Trends” and assets becoming fully depreciated. In addition, the decline in depreciation and amortization expenses in 2016 compared to the 2015 included $0.5 million lower leasehold improvements and building depreciation from the closing and consolidation of low performing clinics, a decline of $0.4 million in amortization from the complete amortization in 2015 of non-compete agreements in therapeutic services, and $0.3 million lower software depreciation. Declines in depreciation and amortization were partially offset by a $0.8 million increase in customer list intangible amortization primarily from the change in estimated useful lives during the fourth quarter of 2015.
Impairment of intangible assets. As more fully explained in Note H - “Goodwill and Intangible Assets” to our consolidated financial statements in this Annual Report on Form 10-K, we recorded an impairment of intangible assets of $86.2 million for the year ended December 31, 2016 and $385.8 million for the year ended December 31, 2015. In 2016, we recorded a total goodwill impairment charge of $86.0 million, of which $64.9 million related to our Therapeutic reporting unit and $21.1
million related to our Distribution reporting unit. In 2015, we recorded a goodwill impairment charge of $382.9 million related to our Patient Care reporting unit. Other intangible asset impairments of $0.2 million in 2016 and $2.9 million in 2015 related to our Therapeutic reporting unit’s indefinite life tradename.
Loss from operations. Loss from operations was $72.1 million for the year ended December 31, 2016 compared with a loss from operations of $349.6 million for the year ended December 31, 2015, a decrease of $277.5 million or 79.4%. The decrease in the loss from continuing operations was the result of lower impairment of intangible assets partially offset by higher professional accounting and legal fees.
Interest expense, net. Interest expense for the year ended December 31, 2016 increased to $45.2 million from $29.9 million for the year ended December 31, 2015. The $15.3 million increase included $10.8 million of additional interest cost associated with early extinguishment of the senior notes and $4.8 million of higher interest expense associated with debt refinancing in the third quarter of 2016 as more fully disclosed in Note N - “Long-term Debt” in this Annual Report on Form 10-K. This is offset by $0.3 million lower interest mainly associated with a reduction in outstanding borrowings.
Extinguishment of debt. We recorded charges of $6.0 million in 2016 in conjunction with covenant violations, amendments and waivers related to two debt agreements. Charges for extinguishment of debt for the year ended December 31, 2016 were $1.2 million lower than the year ended December 31, 2015 from the write-off of previously unamortized debt issuance costs. In 2015, seven agreements were entered into that included debt waivers and amendments resulting in charges of $7.2 million. See Note N - “Long-Term Debt” in this Annual Report on Form 10-K for more details.
Benefit for income taxes. An income tax benefit of $15.9 million was recognized for the year ended December 31, 2016, compared to a benefit of $67.6 million for the year ended December 31, 2015. This reduction in tax benefit was primarily due to lower losses from continuing operations before income taxes. Our effective tax rate from continuing operations was 12.9% and 17.5% for 2016 and 2015, respectively. The effective tax rates differ from the statutory rate due primarily to non-deductible goodwill impairments and other non-deductible expenses.
Income (loss) from discontinued operations, net of income taxes. Net income from the discontinued operations of Dosteon for the year ended December 31, 2016 was $0.9 million compared to a net loss of $8.0 million for the year ended December 31, 2015. Components of the Dosteon business were either sold or ceased operations by the end of the second quarter of 2015. Net income recognized in 2016 relates to contingent consideration resulting from the disposal.
Net loss. Our net loss for year ended December 31, 2016 was $106.5 million as compared to a net loss of $327.1 million for year ended December 31, 2015. Changes in net loss from period to period were driven by a lower impairment charge in 2016 as compared to 2015, offset by lower tax benefits and higher expenses in 2016 primarily including professional fees and interest expense.
Results of Operations - Quarterly Periods December 31, 2016 Compared to Quarterly Periods December 31, 2015
Quarterly results of operations for 2016 and the comparative quarters in 2015 were as follows:
|
|
|
For the Quarters Ended, |
| ||||||||||||||||||||||
|
|
|
Unaudited |
| ||||||||||||||||||||||
|
|
|
2016 |
|
2015 |
| ||||||||||||||||||||
|
(dollars in millions) |
|
Dec 31 |
|
Sep 30 |
|
Jun 30 |
|
Mar 31 |
|
Dec 31 |
|
Sep 30 |
|
Jun 30 |
|
Mar 31 |
| ||||||||
|
|
|
|
|
|
|
|
|
|
|
|
|
|
|
|
|
|
| ||||||||
|
Net revenue |
|
$ |
281.0 |
|
$ |
260.1 |
|
$ |
264.5 |
|
$ |
236.5 |
|
$ |
285.7 |
|
$ |
275.2 |
|
$ |
272.8 |
|
$ |
233.5 |
|
|
Material costs |
|
87.0 |
|
85.4 |
|
83.0 |
|
76.7 |
|
88.1 |
|
85.5 |
|
85.9 |
|
76.8 |
| ||||||||
|
Personnel costs |
|
96.9 |
|
89.1 |
|
88.4 |
|
89.1 |
|
95.6 |
|
95.2 |
|
89.9 |
|
86.4 |
| ||||||||
|
Other operating costs |
|
36.1 |
|
34.3 |
|
31.9 |
|
36.8 |
|
34.0 |
|
32.9 |
|
37.6 |
|
36.4 |
| ||||||||
|
General and administrative expenses |
|
23.7 |
|
25.7 |
|
30.2 |
|
27.6 |
|
27.1 |
|
29.7 |
|
29.1 |
|
25.9 |
| ||||||||
|
Professional accounting and legal fees |
|
9.8 |
|
9.0 |
|
10.7 |
|
11.7 |
|
9.6 |
|
9.3 |
|
4.9 |
|
4.8 |
| ||||||||
|
Depreciation and amortization |
|
10.2 |
|
11.3 |
|
11.7 |
|
11.7 |
|
16.0 |
|
10.2 |
|
9.9 |
|
10.2 |
| ||||||||
|
Impairment of intangible assets |
|
86.2 |
|
— |
|
— |
|
— |
|
385.0 |
|
0.8 |
|
— |
|
— |
| ||||||||
|
Operating expenses |
|
349.9 |
|
254.8 |
|
255.9 |
|
253.6 |
|
655.4 |
|
263.6 |
|
257.3 |
|
240.5 |
| ||||||||
|
(Loss) income from operations |
|
(68.9 |
) |
5.3 |
|
8.6 |
|
(17.1 |
) |
(369.7 |
) |
11.6 |
|
15.5 |
|
(7.0 |
) | ||||||||
|
|
|
|
|
|
|
|
|
|
|
|
|
|
|
|
|
|
| ||||||||
|
Interest expense, net |
|
13.7 |
|
12.8 |
|
9.8 |
|
8.9 |
|
8.0 |
|
7.4 |
|
7.3 |
|
7.2 |
| ||||||||
|
Extinguishment of debt |
|
— |
|
6.0 |
|
— |
|
— |
|
7.2 |
|
— |
|
— |
|
— |
| ||||||||
|
(Loss) income from continuing operations before income taxes |
|
(82.6 |
) |
(13.5 |
) |
(1.2 |
) |
(26.0 |
) |
(384.9 |
) |
4.2 |
|
8.2 |
|
(14.2 |
) | ||||||||
|
(Benefit) provision for income taxes |
|
(1.5 |
) |
(5.6 |
) |
(0.3 |
) |
(8.5 |
) |
(69.8 |
) |
1.1 |
|
0.3 |
|
0.8 |
| ||||||||
|
(Loss) income from continuing operations |
|
(81.1 |
) |
(7.9 |
) |
(0.9 |
) |
(17.5 |
) |
(315.1 |
) |
3.1 |
|
7.9 |
|
(15.0 |
) | ||||||||
|
(Loss) income from discontinued operations, net of income taxes |
|
(0.1 |
) |
0.4 |
|
0.6 |
|
— |
|
(0.7 |
) |
— |
|
(6.3 |
) |
(1.0 |
) | ||||||||
|
Net (loss) income |
|
$ |
(81.2 |
) |
$ |
(7.5 |
) |
$ |
(0.3 |
) |
$ |
(17.5 |
) |
$ |
(315.8 |
) |
$ |
3.1 |
|
$ |
1.6 |
|
$ |
(16.0 |
) |
During these periods, our operating expenses as a percentage of net revenue were as follows:
|
|
|
For the Quarters Ended, |
| ||||||||||||||
|
|
|
Unaudited |
| ||||||||||||||
|
|
|
2016 |
|
2015 |
| ||||||||||||
|
|
|
Dec 31 |
|
Sep 30 |
|
Jun 30 |
|
Mar 31 |
|
Dec 31 |
|
Sep 30 |
|
Jun 30 |
|
Mar 31 |
|
|
|
|
|
|
|
|
|
|
|
|
|
|
|
|
|
|
|
|
|
Material costs |
|
31.0 |
% |
32.8 |
% |
31.4 |
% |
32.4 |
% |
30.8 |
% |
31.1 |
% |
31.5 |
% |
32.9 |
% |
|
Personnel costs |
|
34.5 |
% |
34.3 |
% |
33.4 |
% |
37.7 |
% |
33.5 |
% |
34.6 |
% |
33.0 |
% |
37.0 |
% |
|
Other operating costs |
|
12.8 |
% |
13.2 |
% |
12.1 |
% |
15.6 |
% |
11.8 |
% |
11.9 |
% |
13.7 |
% |
15.5 |
% |
|
General and administrative expenses |
|
8.4 |
% |
9.9 |
% |
11.4 |
% |
11.7 |
% |
9.5 |
% |
10.8 |
% |
10.7 |
% |
11.1 |
% |
|
Professional accounting and legal fees |
|
3.5 |
% |
3.5 |
% |
4.0 |
% |
4.9 |
% |
3.4 |
% |
3.4 |
% |
1.8 |
% |
2.1 |
% |
|
Depreciation and amortization |
|
3.6 |
% |
4.3 |
% |
4.4 |
% |
4.9 |
% |
5.6 |
% |
3.7 |
% |
3.6 |
% |
4.4 |
% |
|
Impairment of intangible assets |
|
30.7 |
% |
— |
% |
— |
% |
— |
% |
134.8 |
% |
0.3 |
% |
— |
% |
— |
% |
|
Operating expenses |
|
124.5 |
% |
98.0 |
% |
96.7 |
% |
107.2 |
% |
229.4 |
% |
95.8 |
% |
94.3 |
% |
103.0 |
% |
Material costs, personnel costs and other operating costs reflect expenses we incur in connection with our delivery of care through our clinic locations and other patient care operations, or distribution of products and services, and exclude any
expenses incurred in connection with general and administrative activities. General and administrative expenses reflect expenses we incur in the general management and administration of our businesses that are not directly attendant to our operation of our clinics or provision of products and services.
Due to the substantial expenses we incurred for professional accounting and legal services, we separately disclose these expenses within operating expenses. We have incurred increases in these expenses primarily in connection with the Restatement, the Investigation and in connection with our accounting and remediation activities associated with the Material Weaknesses. We currently anticipate that these expenses will remain significant at least through 2018.
When the financial statement carrying amount of a long-lived asset or asset group exceeds its fair value and is not recoverable, an asset impairment is recognized. The significant decline in the trading value of our stock impaired assets in the Patient Care, Distribution and Therapeutic reporting units. Impairment of intangible assets is separately disclosed within operating expenses.
Due to the volatility of disallowed revenue experienced during the periods encompassed by this Annual Report on Form 10-K, to assist in evaluating the comparability of expense trends, the following table provides our adjusted gross revenue, disallowed revenue and net revenue for each year, as well as our expenses as a percentage of adjusted gross revenue:
|
|
|
For the Quarters Ended, |
| ||||||||||||||||||||||
|
|
|
Unaudited |
| ||||||||||||||||||||||
|
|
|
2016 |
|
2015 |
| ||||||||||||||||||||
|
(dollars in millions) |
|
Dec 31 |
|
Sep 30 |
|
Jun 30 |
|
Mar 31 |
|
Dec 31 |
|
Sep 30 |
|
Jun 30 |
|
Mar 31 |
| ||||||||
|
|
|
|
|
|
|
|
|
|
|
|
|
|
|
|
|
|
| ||||||||
|
Net revenue |
|
$ |
281.0 |
|
$ |
260.1 |
|
$ |
264.5 |
|
$ |
236.5 |
|
$ |
285.7 |
|
$ |
275.2 |
|
$ |
272.8 |
|
$ |
233.5 |
|
|
Disallowed revenue |
|
12.2 |
|
14.2 |
|
13.2 |
|
9.7 |
|
15.1 |
|
13.2 |
|
16.0 |
|
16.3 |
| ||||||||
|
Adjusted gross revenue |
|
$ |
293.2 |
|
$ |
274.3 |
|
$ |
277.7 |
|
$ |
246.2 |
|
$ |
300.8 |
|
$ |
288.4 |
|
$ |
288.8 |
|
$ |
249.8 |
|
|
|
|
|
|
|
|
|
|
|
|
|
|
|
|
|
|
|
| ||||||||
|
Material costs |
|
29.7 |
% |
31.1 |
% |
29.9 |
% |
31.2 |
% |
29.3 |
% |
29.6 |
% |
29.7 |
% |
30.7 |
% | ||||||||
|
Personnel costs |
|
33.0 |
% |
32.5 |
% |
31.8 |
% |
36.2 |
% |
31.8 |
% |
33.0 |
% |
31.1 |
% |
34.6 |
% | ||||||||
|
Other operating costs |
|
12.3 |
% |
12.5 |
% |
11.4 |
% |
14.8 |
% |
11.3 |
% |
11.5 |
% |
13.1 |
% |
14.6 |
% | ||||||||
|
General and administrative expenses |
|
8.1 |
% |
9.4 |
% |
10.9 |
% |
11.2 |
% |
9.0 |
% |
10.3 |
% |
10.1 |
% |
10.4 |
% | ||||||||
|
Professional accounting and legal fees |
|
3.3 |
% |
3.3 |
% |
3.9 |
% |
4.8 |
% |
3.2 |
% |
3.2 |
% |
1.7 |
% |
1.9 |
% | ||||||||
|
Depreciation and amortization |
|
3.5 |
% |
4.1 |
% |
4.2 |
% |
4.8 |
% |
5.3 |
% |
3.5 |
% |
3.4 |
% |
4.1 |
% | ||||||||
|
Impairment of intangible assets |
|
29.4 |
% |
— |
% |
— |
% |
— |
% |
128.0 |
% |
0.3 |
% |
— |
% |
— |
% | ||||||||
|
Operating expenses |
|
119.3 |
% |
92.9 |
% |
92.1 |
% |
103.0 |
% |
217.9 |
% |
91.4 |
% |
89.1 |
% |
96.3 |
% | ||||||||
Results of operations - three months ended March 31, 2016 compared to three months ended March 31, 2015
Net revenue. Net revenue for the three months ended March 31, 2016 increased $3.0 million, or 1.3%, to $236.5 million from $233.5 million for the three months ended March 31, 2015. Net revenue by operating segment, after elimination of intersegment activity was as follows:
|
|
|
For the Three Months Ended March 31, |
|
|
|
Percent |
| |||||
|
(dollars in millions) |
|
2016 |
|
2015 |
|
Change |
|
Change |
| |||
|
|
|
|
|
|
|
|
|
|
| |||
|
Patient Care |
|
$ |
188.1 |
|
$ |
189.3 |
|
$ |
(1.2 |
) |
(0.6 |
)% |
|
Products & Services |
|
48.4 |
|
44.2 |
|
4.2 |
|
9.5 |
% | |||
|
Net revenue |
|
$ |
236.5 |
|
$ |
233.5 |
|
$ |
3.0 |
|
1.3 |
% |
The net revenue increase of $4.2 million, or 9.5%, in the Products & Services segment was partially offset by $1.2 million, or 0.6% decrease in Patient Care net revenue. The $4.2 million increase in Products & Services revenue was comprised of $3.0 million increase in net revenue from our distribution products and $1.2 million increase from therapeutic services. The $1.2 million decrease in Patient Care revenue resulted from an increase of $3.0 million from same center clinic sales and from $0.7 million of revenue from clinics acquired in 2015, offset by $1.7 million of lower net revenue from the closing of low performing clinics coupled with $3.0 million year over year decline in net revenue from the CARES business which closed operations in 2015 and $0.2 million lower network contract management net revenue.
Material costs. Material costs for the three months ended March 31, 2016 were $76.7 million, a decrease of $0.1 million, or 0.1%, from $76.8 million for the three months ended March 31, 2015. Material costs by operating segment, after elimination of intersegment activity, were as follows:
|
|
|
For the Three Months Ended March 31, |
|
|
|
Percent |
| |||||
|
(dollars in millions) |
|
2016 |
|
2015 |
|
Change |
|
Change |
| |||
|
|
|
|
|
|
|
|
|
|
| |||
|
Patient Care |
|
$ |
59.6 |
|
$ |
60.5 |
|
$ |
(0.9 |
) |
(1.5 |
)% |
|
Products & Services |
|
17.1 |
|
16.3 |
|
0.8 |
|
4.9 |
% | |||
|
Material costs |
|
$ |
76.7 |
|
$ |
76.8 |
|
$ |
(0.1 |
) |
(0.1 |
)% |
|
|
|
|
|
|
|
|
|
|
| |||
|
Percent of net revenue |
|
32.4 |
% |
32.9 |
% |
|
|
|
| |||
|
Percent of adjusted gross revenue |
|
31.2 |
% |
30.7 |
% |
|
|
|
| |||
Material costs as a percentage of net revenue decreased to 32.4% for the three months ended March 31, 2016 compared with 32.9% for the three months ended March 31, 2015, the result of a favorable decline of $6.7 million in disallowed revenue during the March 2016 quarter. Excluding the effects of disallowed revenue, material costs increased to 31.2% of adjusted gross revenue compared with 30.7% in the prior year period. Products & Services material costs as a percent of net revenue decreased to 35.3% for the three months ended March 31, 2016 as compared to 36.9% of net revenue in the prior year period driven by product mix. Patient Care material costs as a percent of net revenue decreased to 31.7% for the three months ended March 31, 2016 as compared to 32.0% in the same period in the prior year due to the impact of disallowed revenue. Material costs were also impacted by product mix and vendor rebates.
Personnel costs. Personnel costs for the three months ended March 31, 2016 increased by $2.7 million to $89.1 million or 37.7% of net revenue from $86.4 million or 37.0% of net revenue for the three months ended March 31, 2015. Personnel costs by operating segment were as follows:
|
|
|
For the Three Months Ended March 31, |
|
|
|
Percent |
| |||||
|
(dollars in millions) |
|
2016 |
|
2015 |
|
Change |
|
Change |
| |||
|
|
|
|
|
|
|
|
|
|
| |||
|
Patient Care |
|
$ |
76.6 |
|
$ |
75.0 |
|
$ |
1.6 |
|
2.1 |
% |
|
Products & Services |
|
12.5 |
|
11.4 |
|
1.1 |
|
9.6 |
% | |||
|
Personnel costs |
|
$ |
89.1 |
|
$ |
86.4 |
|
$ |
2.7 |
|
3.1 |
% |
|
|
|
|
|
|
|
|
|
|
| |||
|
Percent of net revenue |
|
37.7 |
% |
37.0 |
% |
|
|
|
| |||
|
Percent of adjusted gross revenue |
|
36.2 |
% |
34.6 |
% |
|
|
|
| |||
Personnel costs in Patient Care segment increased $1.6 million, or 2.1%, to $76.6 million for the three months ended March 31, 2016 from $75.0 million for the three months ended March 31, 2015. The closure of CARES resulted in $1.2 million lower personnel costs. Increased payor documentation demands and an annual salary merit increase added $4.8 million in salary, benefits and payroll taxes partially offset by a $2.0 million decrease in bonus, commission and other personnel costs exclusive of CARES. Personnel costs in Products & Services segment for the three months ended March 31, 2016 increased to $12.5 million, an increase of $1.1 million or 9.6% compared to $11.4 million for the same period in 2015. The costs of salaries, benefits, taxes, bonus, commission and other personnel costs increased as the result of additional supply chain staffing and an annual salary merit increase.
Other operating costs. Other operating costs increased $0.4 million, or 1.1% to $36.8 million for the three months ended March 31, 2016 from $36.4 million for three months ended March 31, 2015. CARES business wind down in the first quarter of 2015 decreased other operating costs $0.8 million. Rent, utilities, occupancy, office and other costs excluding CARES increased $0.6 million in the first quarter of 2016 compared with the first quarter of 2015. For the first three months of 2016, bad debt expense was $0.6 million higher than the first three months of 2015.
General and administrative expenses. For the three months ended March 31, 2016, general and administrative expenses were $27.6 million from $25.9 million for the three months ended March 31, 2015, an increase of $1.7 million, or 6.6%. The increase included higher salaries and compensatory costs resulting from additional professional accounting personnel to support the 2014 Restatement and related material weaknesses of $1.2 million. Facility and other office related expenses increased $0.5 million for the three months ended March 31, 2016 compared to the first quarter of 2015.
Professional accounting and legal fees. Professional accounting and legal fees were $11.7 million for the three months ended March 31, 2016 compared with $4.8 million in the prior year period. The increase of $6.9 million related to the 2014 Restatement as discussed in the “Effect of Delay in Financial Filings” section of the Management Discussion and Analysis. Fees from other professional accounting companies and legal firms in connection with our financial accounting remediation were recognized primarily in periods at the time the services were provided. For the three months ended March 31, 2016, $4.1 million of additional restatement related legal fees and $2.9 million of additional professional advisory services were incurred compared to the three months ended March 31, 2015 partially offset by $0.1 million decrease in external audit fees.
Depreciation and amortization. Depreciation and amortization for the three months ended March 31, 2016 was $11.7 million, an increase of $1.5 million, or 14.7%, from $10.2 million reported during the same period in the prior year. Amortization of customer list intangibles increased $2.0 million due to a change in the estimated useful lives in the fourth quarter of 2015. Decreases in depreciation and amortization from therapeutic services reduced depreciation by $0.2 million, non-compete agreements becoming fully amortized decreased amortization by $0.1 million and the closure and consolidation of low performing clinics decreased leasehold improvements and buildings depreciation by $0.2 million.
Loss from operations. Loss from operations was $17.1 million for the three months ended March 31, 2016 compared to a loss from operations of $7.0 million for the three months ended March 31, 2015. The $10.1 million increase included higher personnel costs, depreciation and amortization and additional professional accounting and legal fees.
Interest expense, net. Interest expense increased to $8.9 million from $7.2 million for the three months ended March 31, 2016 compared with the three months ended March 31, 2015. The $1.7 million increase was from increased borrowings and the higher interest rates on our credit facility.
(Benefit) provision for income taxes. The benefit for income taxes for the three months ended March 31, 2016 was $8.5 million, or 32.4% of loss from continuing operations before taxes, compared to a provision of $0.8 million, or (5.6)% of loss from continuing operations before taxes for the three months ended March 31, 2015. The effective tax rate consists principally of the 35% federal statutory tax rate in addition to state income taxes, less permanent tax differences. The higher benefit was largely driven by increased loss from continuing operations before taxes, increased estimated effective tax rate, combined with change in valuation allowance. The increase in estimated effective tax rate was driven by increased annual forecasted loss from continuing operations before taxes, coupled with a decrease in state tax expense.
Income (loss) from discontinued operations, net of income taxes. There was zero net income from the discontinued Dosteon operations for the three months ended March 31, 2016 compared to a net loss of $1.0 million for the three months ended March 31, 2015. The Dosteon operations incurred operating and disposal costs and was shut down by June 30, 2015. See “Discontinuance of the Dosteon and CARES Business” section in Management Discussion & Analysis.
Net loss. Net loss for the three months ended March 31, 2016 was $17.5 million compared to a net loss of $16.0 million for the three months ended March 31, 2015, that included higher personnel costs, depreciation and amortization and additional professional accounting and legal fees associated with the 2014 financial Restatement.
Results of operations - three months ended June 30, 2016 compared to three months ended June 30, 2015
Net revenue. Net revenue for the three months ended June 30, 2016 was $264.5 million from $272.8 million for the three months ended June 30, 2015, a decrease of $8.3 million. Net revenue by operating segment, after elimination of intersegment activity was as follows:
|
|
|
For the Three Months Ended June 30, |
|
|
|
Percent |
| |||||
|
(dollars in millions) |
|
2016 |
|
2015 |
|
Change |
|
Change |
| |||
|
|
|
|
|
|
|
|
|
|
| |||
|
Patient Care |
|
$ |
214.3 |
|
$ |
224.8 |
|
$ |
(10.5 |
) |
(4.7 |
)% |
|
Products & Services |
|
50.2 |
|
48.0 |
|
2.2 |
|
4.6 |
% | |||
|
Net revenue |
|
$ |
264.5 |
|
$ |
272.8 |
|
$ |
(8.3 |
) |
(3.0 |
)% |
Patient Care net revenue declined $10.5 million and Products & Services net revenue increased $2.2 million in the same period. Net revenue in our clinic business declined by $7.9 million for the three months ended June 30, 2016 compared to the same period in the prior year due to our claims documentation initiative that began in Q2 2016 as described in “Clinic-Level Claims Documentation,” along with clinic consolidation and closures and revenue impact of lower year-over-year acquisitions. The CARES business was no longer operational in the second quarter of 2016 but operated in the second quarter of 2015 which lowered Patient Care’s net revenue $2.5 million in the current quarter. Network contract management net revenue declined $0.1 million. Lower Patient Care net revenue was partially offset by a $2.2 million increase in the Products & Services segment net revenue for the three months ended June 30, 2016 compared to the three months ended June 30, 2015 from distribution products.
Material costs. Material costs for the three months ended June 30, 2016 were $83.0 million, a decrease of $2.9 million, or 3.4%, from $85.9 million for the three months ended June 30, 2015. Material costs by operating segment, after elimination of intersegment activity, were as follows:
|
|
|
For the Three Months Ended June 30, |
|
|
|
Percent |
| |||||
|
(dollars in millions) |
|
2016 |
|
2015 |
|
Change |
|
Change |
| |||
|
|
|
|
|
|
|
|
|
|
| |||
|
Patient Care |
|
$ |
63.0 |
|
$ |
67.3 |
|
$ |
(4.3 |
) |
(6.4 |
)% |
|
Products & Services |
|
20.0 |
|
18.6 |
|
1.4 |
|
7.5 |
% | |||
|
Material costs |
|
$ |
83.0 |
|
$ |
85.9 |
|
$ |
(2.9 |
) |
(3.4 |
)% |
|
|
|
|
|
|
|
|
|
|
| |||
|
Percent of net revenue |
|
31.4 |
% |
31.5 |
% |
|
|
|
| |||
|
Percent of adjusted gross revenue |
|
29.9 |
% |
29.7 |
% |
|
|
|
| |||
Material costs as a percentage of net revenue decreased to 31.4% for the three months ended June 30, 2016 compared with 31.5% for the three months ended June 30, 2015. Excluding the effects of disallowed revenue, material costs increased to 29.9% of adjusted gross revenue compared with 29.7% in the prior year period. The decline in Patient Care material costs of $4.3 million included the exit of the CARES business in 2015, which decreased material costs by $1.0 million and $3.3 million lower material costs from lower revenue in our clinic business. Material costs increased in the Products & Services segment by $1.4 million for the three months ended June 30, 2016 from higher revenue compared to the three months ended June 30, 2015. Material costs were also impacted by product mix and vendor rebates.
Personnel costs. Personnel costs for the three months ended June 30, 2016 decreased $1.5 million to $88.4 million from $89.9 million for the three months ended June 30, 2015. Personnel costs by operating segment were as follows:
|
|
|
For the Three Months Ended June 30, |
|
|
|
Percent |
| |||||
|
(dollars in millions) |
|
2016 |
|
2015 |
|
Change |
|
Change |
| |||
|
|
|
|
|
|
|
|
|
|
| |||
|
Patient Care |
|
$ |
77.1 |
|
$ |
78.1 |
|
$ |
(1.0 |
) |
(1.3 |
)% |
|
Products & Services |
|
11.3 |
|
11.8 |
|
(0.5 |
) |
(4.2 |
)% | |||
|
Personnel costs |
|
$ |
88.4 |
|
$ |
89.9 |
|
$ |
(1.5 |
) |
(1.7 |
)% |
|
|
|
|
|
|
|
|
|
|
| |||
|
Percent of net revenue |
|
33.4 |
% |
33.0 |
% |
|
|
|
| |||
|
Percent of adjusted gross revenue |
|
31.8 |
% |
31.1 |
% |
|
|
|
| |||
The $1.5 million decrease in personnel costs included $1.0 million lower personnel costs associated with the CARES business exit in 2015, $0.7 million decrease in the costs of therapeutic services personnel and $0.2 million increase in costs for personnel providing distribution products.
Other operating costs. Other operating costs decreased $5.7 million, or 15.2% to $31.9 million for the three months ended June 30, 2016 from $37.6 million for the three months ended June 30, 2015. The exit of the CARES business in 2015 eliminated $2.8 million of other operating costs in the quarter. Rent, utilities, occupancy, office and other costs excluding CARES were $1.2 million lower in the second quarter of 2016 as compared to the same period in the prior year primarily due to consolidation and closure of patient clinic locations. For the three months ended June 30, 2016, bad debt expense was $1.7 million lower than the three months ended June 30, 2015 as the centralization of the revenue cycle management function improved bad debt collection trends.
General and administrative expenses. For the three months ended June 30, 2016, general and administrative expenses were $30.2 million compared with $29.1 million for the three months ended June 30, 2015, an increase of $1.1 million, or 3.8%. Professional fees of $0.7 million incurred in the second quarter of 2016 for systems evaluation of advisory supply chain operations and compensation consulting services coupled with increases in personnel compensatory costs and casual labor of $0.9 million during the three months ended June 30, 2016 were partially offset by $0.5 million decreases in facility and other office related expenses.
Professional accounting and legal fees. Professional accounting and legal fees were $10.7 million for the three months ended June 30, 2016 compared with $4.9 million for the three months ended June 30, 2015. The increase of $5.8 million related to professional fees incurred for the 2014 Restatement as discussed in the “Effect of Delay in Financial Filings” section above. For the three months ended June 30, 2016, $5.5 million of additional Restatement related accounting and legal fees were incurred compared to the same period in the prior year. Fees associated with the audit of financial statements were $0.3 million higher in the second quarter of 2016 compared to the second quarter of 2015.
Depreciation and amortization. Depreciation and amortization for the three months ended June 30, 2016 was $11.7 million, an increase of $1.8 million, or 18.2%, from $9.9 million for the three months ended June 30, 2015. Amortization of customer list intangibles increased $2.1 million due to a change in the estimated useful lives in the fourth quarter of 2015. This increase was partially offset by therapeutic services having sold equipment to customers and equipment becoming full depreciated, reduced depreciation $0.3 million.
Income from operations. Income from operations decreased $6.9 million to $8.6 million for the three months ended June 30, 2016 compared to income from operations of $15.5 million for the three months ended June 30, 2015 from higher professional accounting and legal fees and depreciation and amortization.
Interest expense, net. Interest expense for the three months ended June 30, 2016 increased to $9.8 million from $7.3 million for the three months ended June 30, 2015, an increase of $2.5 million resulting from higher borrowings on our credit facility and higher interest rates compared with the prior year period.
(Benefit) Provision for income taxes. The benefit for income taxes for the three months ended June 30, 2016 was $0.3 million or 26.3% of loss from continuing operations before taxes, compared to a provision for income taxes of $0.3 million, or 2.8% of income from continuing operations before taxes for the three months ended June 30, 2015. The effective tax rate consists principally of the 35% federal statutory tax rate in addition to state income taxes, less permanent tax differences. The
higher benefit was largely driven by increased loss from continuing operations before taxes, increased estimated effective tax rate, combined with change in valuation allowance. The increase in estimated effective tax rate was driven by increased annual forecasted loss from continuing operations before taxes, coupled with a decrease in state tax expense.
Income (loss) from discontinued operations, net of income taxes. For the three months ended June 30, 2016, net income from discontinued Dosteon operations was $0.6 million, compared to a net loss of $6.3 million for the three months ended June 30, 2015. Components of the Dosteon business ceased operations or were sold by the end of the second quarter of 2015. Net income from discontinued operations in the three months ended June 30, 2016 related to income from contingent consideration from the sale of the Dosteon business in previous periods.
Net (loss) income. For the three months ended June 30, 2016, we incurred a net loss of $0.3 million compared with net income of $1.6 million for the three months ended June 30, 2015. The net income decline was from higher professional accounting and legal fees partially offset by lower other expenses.
Results of operations - three months ended September 30, 2016 compared to three months ended September 30, 2015
Net revenue. Net revenue decreased $15.1 million, or 5.5% to $260.1 million for the three months ended September 30, 2016 from $275.2 million for the three months ended September 30, 2015. Net revenue by operating segment, after elimination of intersegment activity was as follows:
|
|
|
For the Three Months Ended |
|
|
|
Percent |
| |||||
|
(dollars in millions) |
|
2016 |
|
2015 |
|
Change |
|
Change |
| |||
|
|
|
|
|
|
|
|
|
|
| |||
|
Patient Care |
|
$ |
208.4 |
|
$ |
224.8 |
|
$ |
(16.4 |
) |
(7.3 |
)% |
|
Products & Services |
|
51.7 |
|
50.4 |
|
1.3 |
|
2.6 |
% | |||
|
Net revenue |
|
$ |
260.1 |
|
$ |
275.2 |
|
$ |
(15.1 |
) |
(5.5 |
)% |
Net revenue for the Patient Care segment declined $16.4 million or 7.3%. Net revenue of Patient Cares clinical operations declined $14.2 million from lower same clinic sales net of disallowed revenue, and declined $1.2 million from closures or consolidations of clinics. With the exit of the CARES business in 2015 and lower net revenue in our network contract management services, the three months ended September 30, 2016 had $1.0 million lower net revenue compared to the same period in the prior year. The Products & Services segment had net revenue increase of $1.3 million, or 2.6% in the three months ended September 30, 2016 versus the same period the prior year from $1.5 million net revenue increases in the distribution products, partially offset by $0.2 million decrease in therapeutic services.
Material costs. Material costs for the three months ended September 30, 2016 were $85.4 million, a decrease of $0.1 million, or 0.1%, from $85.5 million for the three months ended September 30, 2015. Material costs by operating segment, after elimination of intersegment activity, were as follows:
|
|
|
For the Three Months Ended |
|
|
|
Percent |
| |||||
|
(dollars in millions) |
|
2016 |
|
2015 |
|
Change |
|
Change |
| |||
|
|
|
|
|
|
|
|
|
|
| |||
|
Patient Care |
|
$ |
64.6 |
|
$ |
65.6 |
|
$ |
(1.0 |
) |
(1.5 |
)% |
|
Products & Services |
|
20.8 |
|
19.9 |
|
0.9 |
|
4.5 |
% | |||
|
Material costs |
|
$ |
85.4 |
|
$ |
85.5 |
|
$ |
(0.1 |
) |
(0.1 |
)% |
|
|
|
|
|
|
|
|
|
|
| |||
|
Percent of net revenue |
|
32.8 |
% |
31.1 |
% |
|
|
|
| |||
|
Percent of adjusted gross revenue |
|
31.1 |
% |
29.6 |
% |
|
|
|
| |||
Material costs as a percentage of net revenue increased to 32.8% for the quarter ended September 30, 2016 compared with 31.1% in the prior year period. Disallowed revenue increased $1.0 million during the September 2016 quarter compared to
the same period in the prior year. Excluding the effects of disallowed revenue, material costs increased to 31.1% of adjusted gross revenue compared with 29.6% in the prior year period. The Products & Services segment increase included higher material costs per unit and the effect of a vendor rebate of $0.5 million recorded in the third quarter of 2015. In the Products & Services segment, material costs grew to 40.2% of net revenue for the three months ended September 2016 compared to 39.5% for the same period in the prior year. Material costs were also impacted by product mix.
Personnel costs. Personnel costs for the three months ended September 30, 2016 decreased $6.1 million to $89.1 million from $95.2 million for the three months ended September 30, 2015. Personnel costs by operating segment were as follows:
|
|
|
For the Three Months Ended |
|
|
|
Percent |
| |||||
|
(dollars in millions) |
|
2016 |
|
2015 |
|
Change |
|
Change |
| |||
|
|
|
|
|
|
|
|
|
|
| |||
|
Patient Care |
|
$ |
77.5 |
|
$ |
83.3 |
|
$ |
(5.8 |
) |
(7.0 |
)% |
|
Products & Services |
|
11.6 |
|
11.9 |
|
(0.3 |
) |
(2.5 |
)% | |||
|
Personnel costs |
|
$ |
89.1 |
|
$ |
95.2 |
|
$ |
(6.1 |
) |
(6.4 |
)% |
|
|
|
|
|
|
|
|
|
|
| |||
|
Percent of net revenue |
|
34.3 |
% |
34.6 |
% |
|
|
|
| |||
|
Percent of adjusted gross revenue |
|
32.5 |
% |
33.0 |
% |
|
|
|
| |||
The Patient Care segment personnel costs decreased $5.8 million in the third quarter of 2016 compared to the same period in the prior year. Bonus, commissions and other personnel costs were lower by $3.8 million from decreased bonus expense associated with lower income from operations for fiscal year 2016 compared to fiscal year 2015. The exit of the CAREs business in 2015 lowered salaries, benefits and payroll taxes by $0.9 million for the three months ended September 30, 2016 coupled with a decrease in contract labor of $1.1 million. Personnel costs in the Products & Services segment decreased by $0.3 million for the three months ended September 30, 2016 compared to the same period in the prior year. Salaries, benefits and payroll taxes were $0.4 million higher partially offset by lower bonus, commissions and other personnel costs of $0.7 million.
Other operating costs. Other operating costs were $34.3 million for the three months ended September 30, 2016 compared to $32.9 million for the three months ended September 30, 2015, an increase of $1.4 million. Bad debt expense declined by $1.2 million to $1.8 million for the third quarter of 2016, compared with $3.0 million in the same period of the prior year due to initiatives described in the “Reimbursement Trends” section above, offset by higher rent, utilities, occupancy, office and other operating costs of $2.6 million for the three months ended September 30, 2016.
General and administrative expenses. For the three months ended September 30, 2016, general and administrative expenses decreased $4.0 million, or 13.5% to $25.7 million from $29.7 million for the three months ended September 30, 2015. Non-personnel related expenses decreased $4.4 million in the third quarter of 2016 including a one-time expense of $1.0 million for database software incurred in September 2015 partially offset by $0.4 million of increased personnel compensatory costs.
Professional accounting and legal fees. Professional accounting and legal fees were $9.0 million in the third quarter of 2016, a $0.3 million decrease from $9.3 million incurred in the same period of the prior year. Fees in both periods related to the Restatement.
Depreciation and amortization. Depreciation and amortization for the three months ended September 30, 2016 was $11.3 million, an increase of $1.1 million from $10.2 million for the three months ended September 30, 2015. Amortization of customer list intangibles increased $1.8 million primarily due to a change in the estimated useful lives in the fourth quarter of 2015. This increase was partially offset by lower depreciation of $0.4 million of leasehold improvements and computers and $0.3 million lower depreciation of equipment and amortization of non-compete agreements.
Impairment of intangible assets. There was no impairment of intangible assets for the three months ended September 30, 2016. For three months ended September 30, 2015, we recorded in impairment of intangible assets of $0.8 million related to our Therapeutic reporting unit’s indefinite life tradename.
Income from operations. Income from operations decreased $6.3 million, to $5.3 million, for the three months ended September 30, 2016 compared to income from operations of $11.6 million for the three months ended September 30, 2015 primarily due to lower revenue in our Patient Care segment.
Interest expense, net and extinguishment of debt. Interest expense increased to $12.8 million from $7.4 million for the three months ended September 30, 2016 compared with the prior year period from higher interest rates and increased revolver borrowings. During the third quarter of 2016, we refinanced our debt with a portion of the proceeds used to redeem the Senior Notes. We expensed $5.6 million of debt costs offset by a $0.2 million decrease in interest expense in the quarter ended September 30, 2016 from less debt outstanding. Fees of $6.0 million were incurred in the three months ended September 30, 2016 in connection with our debt extinguishment.
(Benefit) provision for income taxes. The benefit for income taxes for the three months ended September 30, 2016 was $5.6 million, or 42.0% of loss from continuing operations before taxes, compared to a tax provision of $1.1 million, or 26.9% of income from continuing operations before taxes, for the three months ended September 30, 2015. The effective tax rate consists principally of the 35% federal statutory tax rate in addition to state income taxes and less permanent tax differences. The higher benefit was largely driven by increased loss from continuing operations before taxes, increased estimated effective tax rate, combined with change in valuation allowance. The increase in estimated effective tax rate was driven by increased annual forecasted loss from continuing operations before taxes, coupled with a decrease in state tax expense.
Income from discontinued operations, net of income taxes. Net income from the discontinued Dosteon operations during the three months ended September 30, 2016 was $0.4 million, compared to zero for the three months ended September 30, 2015. The Dosteon operations were shut down by June 30, 2015 and included in the net income for the three months ended September 30, 2016 were adjustments for purchase agreement contingent consideration.
Net (loss) income. For the three months ended September 30, 2016, we incurred a net loss of $7.5 million compared with net income of $3.1 million for the three months ended September 30, 2015 from higher interest expense and extinguishment of debt fees incurred in the three months ended September 30, 2016.
Results of operations - three months ended December 31, 2016 compared to three months ended December 31, 2015
Net revenue. Net revenue for the three months ended December 31, 2016 decreased $4.7 million, or 1.6%, to $281.0 million from $285.7 million for the three months ended December 31, 2015. Net revenue by operating segment, after elimination of intersegment activity, was as follows:
|
|
|
For the Three Months Ended |
|
|
|
Percent |
| |||||
|
(dollars in millions) |
|
2016 |
|
2015 |
|
Change |
|
Change |
| |||
|
|
|
|
|
|
|
|
|
|
| |||
|
Patient Care |
|
$ |
229.4 |
|
$ |
236.1 |
|
$ |
(6.7 |
) |
(2.8 |
)% |
|
Products & Services |
|
51.6 |
|
49.6 |
|
2.0 |
|
4.0 |
% | |||
|
Net revenue |
|
$ |
281.0 |
|
$ |
285.7 |
|
$ |
(4.7 |
) |
(1.6 |
)% |
Net revenue declined $6.7 million, or 2.8%, in the Patient Care segment and increased $2.0 million, or 4.0% in the Products & Services segment. The decrease in the Patient Care segment’s net revenue included $4.7 million lower same clinic sales and $1.9 million lower revenue due to acquisitions and related closures and consolidation of clinic locations. Network contract management revenue declined $0.1 million. Products & Service’s net revenue increased $2.0 million for the three months ended December 31, 2016 compared to the three months ended December 31, 2015, the result of equipment sales revenue in therapeutic services offset by cancellations and slower growth.
Material costs. Material costs for the three months ended December 31, 2016 were $87.0 million, a decrease of $1.1 million, or 1.2%, from $88.1 million for the three months ended December 31, 2015. Material costs by operating segment, after elimination of intersegment activity, were as follows:
|
|
|
For the Three Months Ended |
|
|
|
Percent |
| |||||
|
(dollars in millions) |
|
2016 |
|
2015 |
|
Change |
|
Change |
| |||
|
|
|
|
|
|
|
|
|
|
| |||
|
Patient Care |
|
$ |
68.8 |
|
$ |
69.0 |
|
$ |
(0.2 |
) |
(0.3 |
)% |
|
Products & Services |
|
18.2 |
|
19.1 |
|
(0.9 |
) |
(4.7 |
)% | |||
|
Material costs |
|
$ |
87.0 |
|
$ |
88.1 |
|
$ |
(1.1 |
) |
(1.2 |
)% |
|
|
|
|
|
|
|
|
|
|
| |||
|
Percent of net revenue |
|
31.0 |
% |
30.8 |
% |
|
|
|
| |||
|
Percent of adjusted gross revenue |
|
29.7 |
% |
29.3 |
% |
|
|
|
| |||
In the fourth quarter of 2015, rebates recorded from a major vendor lowered material costs $0.4 million more than rebates recorded in the fourth quarter of 2016. Material costs as a percentage of net revenue increased to 31.0% for the quarter ended December 31, 2016 compared with 30.8% in the prior year quarter. We had a favorable decrease of $2.9 million in disallowed revenue during the December 2016 quarter compared to the same quarter in the prior year. Excluding the effects of disallowed revenue, material costs increased to 29.7% of adjusted gross revenue compared with 29.3% in the prior year period. Material costs were also impacted by product mix and vendor rebates.
Personnel costs. Personnel costs for the three months ended December 31, 2016 increased $1.3 million to $96.9 million from $95.6 million for the three months ended December 31, 2015. Personnel costs by operating segment were as follows:
|
|
|
For the Three Months Ended |
|
|
|
Percent |
| |||||
|
(dollars in millions) |
|
2016 |
|
2015 |
|
Change |
|
Change |
| |||
|
|
|
|
|
|
|
|
|
|
| |||
|
Patient Care |
|
$ |
84.7 |
|
$ |
81.5 |
|
$ |
3.2 |
|
3.9 |
% |
|
Products & Services |
|
12.2 |
|
14.1 |
|
(1.9 |
) |
(13.5 |
)% | |||
|
Personnel costs |
|
$ |
96.9 |
|
$ |
95.6 |
|
$ |
1.3 |
|
1.4 |
% |
|
|
|
|
|
|
|
|
|
|
| |||
|
Percent of net revenue |
|
34.5 |
% |
33.5 |
% |
|
|
|
| |||
|
Percent of adjusted gross revenue |
|
33.0 |
% |
31.8 |
% |
|
|
|
| |||
Personnel costs increased $3.2 million in the Patient Care segment with $5.2 million in salaries, benefits and other personnel costs increases primarily from an increase in health care related costs, partially offset by $2.0 million decrease in bonuses, commissions, temporary labor and related payroll taxes. A net decrease of $1.9 million in personnel costs in the Products & Services segment included $2.9 million lower bonus, commissions and other personnel costs in the fourth quarter of 2016 as compared to the fourth quarter of 2015, partially offset by $1.0 million higher salary, benefit and related payroll taxes associated with annual merit increases.
Other operating costs. Other operating costs increased $2.1 million, or 6.2% to $36.1 million for the three months ended December 31, 2016 from $34.0 million for the three months ended December 31, 2015. The net increase of $2.1 million included $3.3 million increase in bad debt expense related to the bankruptcy of one large customer and financial difficulties encountered by another in our Products & Services distribution area partially offset by $0.3 million lower other operating costs for CARES which ceased operations in 2015 and $0.9 million of lower office and occupancy costs in areas other than CARES.
General and administrative expenses. For the three months ended December 31, 2016, general and administrative expenses were $23.7 million compared with $27.1 million for the three months end December 31, 2015, a decrease of $3.4 million. Personnel compensatory costs declined $2.8 million primarily due to a decrease in benefit costs. Facility, travel, education and other expenses declined $0.6 million.
Professional accounting and legal fees. Professional accounting and legal fees for the three months ended December 31, 2016 were $0.2 million higher compared to the three months ended December 31, 2015. Professional accounting and legal
fees were $9.8 million for the three months ended December 31, 2016 compared with $9.6 million for the three months ended December 31, 2015.
Depreciation and amortization. Depreciation and amortization for the three months ended December 31, 2016 was $10.2 million, a decrease of $5.8 million, or 36.3%, from $16.0 million for the three months ended December 31, 2015. Amortization of customer list intangibles decreased $5.2 million due to a change in the estimated useful lives in the fourth quarter of 2015. Selling therapeutic equipment to customers who discontinued our services and therapeutic assets becoming fully depreciated, reduced depreciation $0.3 million. Non-compete agreements becoming fully amortized decreased depreciation $0.1 million and lower leasehold improvements and buildings depreciation of $0.2 million resulted from the closure and consolidation of clinic locations.
Impairment of intangible assets. As more fully explained in Note H - “Goodwill and Intangible Assets” to our consolidated financial statements in this Annual Report on Form 10-K, we recorded an impairment of intangible assets of $86.2 million for the three months ended December 31, 2016 and $385.0 million for the three months ended December 31, 2015. For the three months ended December 31, 2016, we recorded a total goodwill impairment charge of $86.0 million, of which $64.9 million related to our Therapeutic reporting unit and $21.1 million related to our Distribution reporting unit. For the three months ended December 31, 2015, we recorded a goodwill impairment charge of $382.9 million related to our Patient Care reporting unit. Other intangible asset impairments of $0.2 million in 2016 and $2.1 million in 2015 related to our Therapeutic reporting unit’s indefinite life tradename.
Loss from operations. Loss from operations was $68.9 million for the three months ended December 31, 2016 compared with a loss from operations of $369.7 million for the three months ended December 31, 2015, due primarily to a lower impairment of intangible assets in the fourth quarter of 2016 compared with the fourth quarter of 2015.
Interest expense, net. Interest expense increased to $13.7 million from $8.0 million for the three months ended December 31, 2016 compared with the three months ended December 31, 2015. An increase in interest expense of $5.7 million in the fourth quarter resulted from higher interest rates associated with debt restructuring in the third quarter of 2016. See Note N - “Long-Term Debt” to our consolidated financial statements in this Annual Report on Form 10-K.
Extinguishment of debt. For the three months ended December 31, 2015, we incurred $7.2 million of costs accounted for as Extinguishment of debt under the Fifth Supplemental Indenture. There was no similar expense incurred in the three months ended December 31, 2016. See Note N - “Long-Term Debt” to our consolidated financial statements in this Annual Report on Form 10-K.
Benefit for income taxes. The benefit for income taxes for the three months ended December 31, 2016 was $1.5 million, or 1.8% of loss from continuing operations before taxes, compared to a benefit of $69.8 million, or 18.1% of loss from continuing operations before taxes for the three months ended December 31, 2015. The effective tax rate consists principally of the 35% federal statutory tax rate in addition to state income taxes and less permanent tax differences. The decrease in the tax benefit was largely driven by the impact of the intangible asset impairment, non-deductible expenses, change in uncertain tax positions and change in valuation allowance.
Loss from discontinued operations, net of income taxes. Net loss from the discontinued Dosteon operations declined $0.6 million for the three months ended December 31, 2016 as compared to the three months ended December 31, 2015. The Dosteon operations shut down by June 30, 2015.
Net loss. For the three months ended December 31, 2016, we incurred a net loss of $81.2 million compared with a net loss of $315.8 million for the three months ended December 31, 2015 from a decrease in impairment of intangible assets and no debt extinguishment costs recorded in the fourth quarter of 2016.
Results of Operations - Year-to-Date Periods 2016 Compared to 2015
Our year-to-date results of operations for 2016 and the comparative quarters in 2015 were as follows:
|
|
|
For the Six Months Ended |
|
Percent |
|
For the Nine Months Ended |
|
Percent |
| ||||||||
|
(dollars in millions) |
|
2016 |
|
2015 |
|
2016 v 2015 |
|
2016 |
|
2015 |
|
2016 v 2015 |
| ||||
|
|
|
|
|
|
|
|
|
|
|
|
|
|
| ||||
|
Net revenue |
|
$ |
501.0 |
|
$ |
506.3 |
|
(1.0 |
)% |
$ |
761.1 |
|
$ |
781.5 |
|
(2.6 |
)% |
|
Material costs |
|
159.7 |
|
162.7 |
|
(1.8 |
)% |
245.1 |
|
248.2 |
|
(1.2 |
)% | ||||
|
Personnel costs |
|
177.5 |
|
176.3 |
|
0.7 |
% |
266.6 |
|
271.5 |
|
(1.8 |
)% | ||||
|
Other operating costs |
|
68.7 |
|
74.0 |
|
(7.2 |
)% |
103.0 |
|
106.9 |
|
(3.6 |
)% | ||||
|
General and administrative expenses |
|
57.8 |
|
55.0 |
|
5.1 |
% |
83.5 |
|
84.7 |
|
(1.4 |
)% | ||||
|
Professional accounting and legal fees |
|
22.4 |
|
9.7 |
|
130.9 |
% |
31.4 |
|
19.0 |
|
65.3 |
% | ||||
|
Depreciation and amortization |
|
23.4 |
|
20.1 |
|
16.4 |
% |
34.7 |
|
30.3 |
|
14.5 |
% | ||||
|
Impairment of intangible assets |
|
— |
|
— |
|
— |
|
— |
|
0.8 |
|
(100.0 |
)% | ||||
|
(Loss) income from operations |
|
(8.5 |
) |
8.5 |
|
(200.0 |
)% |
(3.2 |
) |
20.1 |
|
(115.9 |
)% | ||||
|
|
|
|
|
|
|
|
|
|
|
|
|
|
| ||||
|
Interest expense, net |
|
18.7 |
|
14.5 |
|
29.0 |
% |
31.5 |
|
21.9 |
|
43.8 |
% | ||||
|
Extinguishment of debt |
|
— |
|
— |
|
— |
% |
6.0 |
|
— |
|
100.0 |
% | ||||
|
Loss from continuing operations before income taxes |
|
(27.2 |
) |
(6.0 |
) |
353.3 |
% |
(40.7 |
) |
(1.8 |
) |
* |
| ||||
|
Benefit (provision) for income taxes |
|
(8.8 |
) |
1.1 |
|
(900.0 |
)% |
(14.4 |
) |
2.2 |
|
* |
| ||||
|
Loss from continuing operations |
|
(18.4 |
) |
(7.1 |
) |
159.2 |
% |
(26.3 |
) |
(4.0 |
) |
* |
| ||||
|
Income (loss) from discontinued operations, net of income taxes |
|
0.6 |
|
(7.3 |
) |
(108.2 |
)% |
1.0 |
|
(7.3 |
) |
(113.7 |
)% | ||||
|
Net loss |
|
$ |
(17.8 |
) |
$ |
(14.4 |
) |
23.6 |
% |
$ |
(25.3 |
) |
$ |
(11.3 |
) |
123.9 |
% |
* Not a meaningful percentage
During these periods, our operating expenses as a percentage of net revenue were as follows:
|
|
|
For the Six Months Ended |
|
For the Nine Months Ended |
| ||||
|
|
|
2016 |
|
2015 |
|
2016 |
|
2015 |
|
|
|
|
|
|
|
|
|
|
|
|
|
Material costs |
|
31.9 |
% |
32.1 |
% |
32.2 |
% |
31.8 |
% |
|
Personnel costs |
|
35.4 |
% |
34.8 |
% |
35.0 |
% |
34.7 |
% |
|
Other operating costs |
|
13.7 |
% |
14.6 |
% |
13.5 |
% |
13.7 |
% |
|
General and administrative expenses |
|
11.5 |
% |
10.9 |
% |
11.0 |
% |
10.8 |
% |
|
Professional accounting and legal fees |
|
4.5 |
% |
1.9 |
% |
4.1 |
% |
2.4 |
% |
|
Depreciation and amortization |
|
4.7 |
% |
4.0 |
% |
4.6 |
% |
3.9 |
% |
|
Impairment of intangible assets |
|
— |
% |
— |
% |
— |
% |
0.1 |
% |
|
Operating expenses |
|
101.7 |
% |
98.3 |
% |
100.4 |
% |
97.4 |
% |
Material costs, personnel costs and other operating costs reflect expenses we incur in connection with our delivery of care through our clinic locations and other patient care operations, or distribution of products and services, and exclude any expenses incurred in connection with general and administrative activities. General and administrative expenses reflect expenses we incur in the general management and administration of our businesses that are not directly attendant to our operation of our clinics or provision of products and services.
Due to the substantial expenses we incurred for professional accounting and legal services, we separately reflect this category. We have incurred increases in these expenses primarily in connection with the Restatement, the Investigation and in connection with our accounting and remediation activities associated with the material weaknesses. We currently anticipate that these expenses will remain significant at least through 2018.
An asset impairment is recognized when the financial statement carrying amount of a long-lived asset or asset group exceed its fair value and is not recoverable. The significant decline in the trading value of our stock impaired assets in the Patient Care and Therapeutic reporting units. Impairment losses are separately stated in this Annual Report on Form 10-K.
Due to the volatility of disallowed revenue experienced during the periods encompassed by this Annual Report on Form 10-K, to assist in evaluating the comparability of expense trends, the following table provides our adjusted gross revenue, disallowed revenue and net revenue for each year, as well as our expenses as a percentage of adjusted gross revenue:
|
|
|
For the Six Months Ended |
|
For the Nine Months Ended |
| ||||||||
|
(dollars in millions) |
|
2016 |
|
2015 |
|
2016 |
|
2015 |
| ||||
|
|
|
|
|
|
|
|
|
|
| ||||
|
Net revenue |
|
$ |
501.0 |
|
$ |
506.3 |
|
$ |
761.1 |
|
$ |
781.5 |
|
|
Disallowed revenue |
|
22.9 |
|
32.3 |
|
37.1 |
|
45.5 |
| ||||
|
Adjusted gross revenue |
|
$ |
523.9 |
|
$ |
538.6 |
|
$ |
798.2 |
|
$ |
827.0 |
|
|
|
|
|
|
|
|
|
|
|
| ||||
|
Material costs |
|
30.5 |
% |
30.2 |
% |
30.7 |
% |
30.0 |
% | ||||
|
Personnel costs |
|
33.9 |
% |
32.7 |
% |
33.4 |
% |
32.8 |
% | ||||
|
Other operating costs |
|
13.1 |
% |
13.8 |
% |
13.0 |
% |
13.0 |
% | ||||
|
General and administrative expenses |
|
11.0 |
% |
10.2 |
% |
10.5 |
% |
10.2 |
% | ||||
|
Professional accounting and legal fees |
|
4.3 |
% |
1.8 |
% |
3.9 |
% |
2.3 |
% | ||||
|
Depreciation and amortization |
|
4.5 |
% |
3.7 |
% |
4.3 |
% |
3.7 |
% | ||||
|
Impairment of intangible assets |
|
— |
% |
— |
% |
— |
% |
0.1 |
% | ||||
|
Operating expenses |
|
97.3 |
% |
92.4 |
% |
95.8 |
% |
92.1 |
% | ||||
Results of operations - six months ended June 30, 2016 compared to six months ended June 30, 2015
Net revenue. Net revenue for the six months ended June 30, 2016 decreased $5.3 million, or 1.0%, to $501.0 million from $506.3 million for the six months ended June 30, 2015. Net revenue by operating segment, after elimination of intersegment activity was as follows:
|
|
|
For the Six Months Ended June 30, |
|
|
|
Percent |
| |||||
|
(dollars in millions) |
|
2016 |
|
2015 |
|
Change |
|
Change |
| |||
|
|
|
|
|
|
|
|
|
|
| |||
|
Patient Care |
|
$ |
402.4 |
|
$ |
414.1 |
|
$ |
(11.7 |
) |
(2.8 |
)% |
|
Products & Services |
|
98.6 |
|
92.2 |
|
6.4 |
|
6.9 |
% | |||
|
Net revenue |
|
$ |
501.0 |
|
$ |
506.3 |
|
$ |
(5.3 |
) |
(1.0 |
)% |
Net revenue in the Patient Care segment decreased $11.7 million, or 2.8%, from the first six months of 2015. Hanger Clinic operations net revenue decreased $5.9 million from lower same clinic sales from increased demands on payor documentation, coupled with clinic closures and consolidations. Net revenue for CARES was $5.5 million for the six months ended June 30, 2015. CARES was exited by June 30, 2015 and there was no revenue for the six months ended June 30, 2016. The Patient Care network contract management services’ net revenue decreased $0.3 million for the six months ended June 30, 2016 versus the six months ended June 30, 2015. In the Products & Services segment, net revenue for the first six months of 2016 compared to the first six months 2015 increased $6.4 million or 6.9%. For the same comparative periods, distribution net revenue increased $5.1 million or 8.9% from higher sales in prosthetic and orthotic product lines and therapeutic services revenue increased $1.3 million for the six months ended June 30, 2016 compared to the first six months of 2015.
Material costs. Material costs decreased $3.0 million, or 1.8% for the six months ended June 30, 2016 compared to the six months ended June 30, 2015. Material costs by operating segment, after elimination of intersegment activity, were as follows:
|
|
|
For the Six Months Ended June 30, |
|
|
|
Percent |
| |||||
|
(dollars in millions) |
|
2016 |
|
2015 |
|
Change |
|
Change |
| |||
|
|
|
|
|
|
|
|
|
|
| |||
|
Patient Care |
|
$ |
122.6 |
|
$ |
127.8 |
|
$ |
(5.2 |
) |
(4.1 |
)% |
|
Products & Services |
|
37.1 |
|
34.9 |
|
2.2 |
|
6.3 |
% | |||
|
Material costs |
|
$ |
159.7 |
|
$ |
162.7 |
|
$ |
(3.0 |
) |
(1.8 |
)% |
|
|
|
|
|
|
|
|
|
|
| |||
|
Percent of net revenue |
|
31.9 |
% |
32.1 |
% |
|
|
|
| |||
|
Percent of adjusted gross revenue |
|
30.5 |
% |
30.2 |
% |
|
|
|
| |||
Material costs were $159.7 million for the first six months of 2016 compared to $162.7 million for the first six months of 2015. Material costs as a percentage of net revenue decreased to 31.9% for the first six months of 2016 compared with 32.1% in the prior year period. For the six months ended June 30, 2016, we had a favorable decrease of $9.4 million in disallowed revenue. Excluding the effects of disallowed revenue, material costs as a percent of revenue was 30.5% for the first six months of 2016 as compared to 30.2% for the first six months of 2015. Material costs were also impacted by product mix and vendor rebates.
Personnel costs. Personnel costs for the six months ended June 30, 2016 increased by $1.2 million or 0.7% to $177.5 million from $176.3 million for the six months ended June 30, 2015. Personnel costs by operating segment were as follows:
|
|
|
For the Six Months Ended June 30, |
|
|
|
Percent |
| |||||
|
(dollars in millions) |
|
2016 |
|
2015 |
|
Change |
|
Change |
| |||
|
|
|
|
|
|
|
|
|
|
| |||
|
Patient Care |
|
$ |
153.7 |
|
$ |
153.1 |
|
$ |
0.6 |
|
0.4 |
% |
|
Products & Services |
|
23.8 |
|
23.2 |
|
0.6 |
|
2.6 |
% | |||
|
Personnel costs |
|
$ |
177.5 |
|
$ |
176.3 |
|
$ |
1.2 |
|
0.7 |
% |
|
|
|
|
|
|
|
|
|
|
| |||
|
Percent of net revenue |
|
35.4 |
% |
34.8 |
% |
|
|
|
| |||
|
Percent of adjusted gross revenue |
|
33.9 |
% |
32.7 |
% |
|
|
|
| |||
Personnel costs in our Patient Care segment increased $0.6 million for the six months ended June 30, 2016 as compared to the same period in the prior year. For the six months ended June 30, 2016, salaries, benefits and payroll taxes increased $4.6 million partially offset by $4.0 million of lower bonuses, commissions and other personnel costs associated with decreased revenue. The Products & Services segment’s personnel costs increased $0.6 million for the six months ended June 30, 2016 compared to the first six months of 2015 from increased salary, benefits and payroll taxes.
Other operating costs. Other operating costs decreased $5.3 million to $68.7 million for the six months ended June 30, 2016 from $74.0 million for the six months ended June 30, 2015. Bad debt expense decreased $1.1 million to $5.8 million from $6.9 million as actions were taken to improve billing and collections. During the exit of CARES in the first six months of 2015, $2.0 million of payments were made to terminate service contracts relating to equipment utilized. Facility costs, office expenses, travel and other expenses decreased by $2.2 million for the first six months of 2016 compared to the first six months of 2015.
General and administrative expenses. For the six months ended June 30, 2016, general and administrative expenses were $57.8 million from $55.0 million for the six months ended June 30, 2015, an increase of $2.8 million, or 5.1%. In the first six months of 2016 as compared to the first six months of 2015, professional fees increased $1.2 million from consultants who assisted in addressing adverse disallowance and bad debt trends. For the six months ended June 30, 2016, salary, benefits and payroll taxes increased by $3.5 million from additional staffing in accounting to support our remediation of prior financial statements and material weaknesses and compensatory costs of an annual merit increase. Increases in salaries, benefits and
payroll taxes were partially offset by decreases in bonus and commissions of $1.5 million related to lower Patient Care revenue and $0.4 million lower office, travel, education and other personnel costs.
Professional accounting and legal fees. Professional accounting and legal fees in the first six months of 2016 compared to the first six months of 2015 increased $12.7 million, or 130.9% to $22.4 million from $9.7 million from costs incurred assisting with the Restatement.
Depreciation and amortization. Depreciation and amortization for the six months ended June 30, 2016 was $23.4 million, an increase of $3.3 million, or 16.4%, from $20.1 million for the six months ended June 30, 2015. Amortization of customer list intangibles increased $4.2 million primarily due to a change in the estimated useful lives in the fourth quarter of 2015. Partially offsetting this increase was a reduction of $0.4 million of depreciation for equipment sold to customers, $0.4 million for decrease in tradename amortization and non-compete agreements fully amortized, and a $0.1 million decrease in depreciation of leasehold improvements and buildings.
(Loss) income from operations. We incurred a loss from operations of $8.5 million for the six months ended June 30, 2016 compared to income from operations of $8.5 million for the six months ended June 30, 2015. This $17.0 million decrease in income from continuing operations was from lower revenue coupled with higher professional accounting and legal fees.
Interest expense, net. Interest expense increased to $18.7 million from $14.5 million for the six months ended June 30, 2016 compared with the six months ended June 30, 2015. This $4.2 million increase resulted from an increase in average outstanding balances on our debt and higher interest rates during the six months ended June 30, 2016 compared with the same period in the prior year.
(Benefit) provision for income taxes. The benefit for income taxes for the six months ended June 30, 2016 was $8.8 million from continuing operations, compared to a provision of $1.1 million for the six months ended June 30, 2015 from continuing operations. The effective tax rate consists principally of the 35% federal statutory tax rate in addition to state income taxes, less permanent tax differences. The increased tax benefit was largely driven by increased loss from continuing operations before taxes, increased estimated effective tax rate combined with change in valuation allowance. The increase in estimated effective tax rate was driven by increased annual forecasted loss from continuing operations before taxes, coupled with a decrease in state tax expense.
Income (loss) from discontinued operations, net of income taxes. Net income from the discontinued Dosteon operations for the six months ended June 30, 2016 was $0.6 million, compared to a net loss of $7.3 million incurred during the six months ended June 30, 2015. The Dosteon operations incurred operating and disposal costs and were shut down by June 30, 2015 with only contingent consideration gains recorded in 2016 as a result of the disposal of Dosteon assets in prior years.
Net loss. For the six months ended June 30, 2016, we incurred a net loss of $17.8 million compared with a net loss of $14.4 million for the six months ended June 30, 2015 from an increase in professional accounting and legal fees and higher interest expense.
Results of operations - nine months ended September 30, 2016 compared to nine months ended September 30, 2015
Net revenue. Net revenue decreased $20.4 million, or 2.6% for the first nine months of 2016 compared to the first nine months of 2015. For the nine months ended September 30, 2016, net revenue was $761.1 million compared to $781.5 million for the nine months ended September 30, 2015. Net revenue by operating segment, after elimination of intersegment activity was as follows:
|
|
|
For the Nine Months Ended |
|
|
|
Percent |
| |||||
|
(dollars in millions) |
|
2016 |
|
2015 |
|
Change |
|
Change |
| |||
|
|
|
|
|
|
|
|
|
|
| |||
|
Patient Care |
|
$ |
610.8 |
|
$ |
638.9 |
|
$ |
(28.1 |
) |
(4.4 |
)% |
|
Products & Services |
|
150.3 |
|
142.6 |
|
7.7 |
|
5.4 |
% | |||
|
Net revenue |
|
$ |
761.1 |
|
$ |
781.5 |
|
$ |
(20.4 |
) |
(2.6 |
)% |
The net revenue decrease in the Patient Care segment of $28.1 million was partially offset by $7.7 million increase in the Products & Services segment revenue. Patient Care segment’s net revenue decline included $15.8 million decrease in same clinic sales in Hanger clinic operations, $4.6 million revenue decrease from clinic closures and consolidations, decrease in revenue of $1.6 million from acquisitions, $6.4 million decrease of net revenue from CARES which we exited during 2015, partially offset by a net increase of $0.3 million of other revenue. The net revenue in the Products & Services segment increased $7.7 million from net revenue increases in distribution products of $6.7 million which had higher sales in the prosthetic product line. Therapeutic services net revenue increased $1.0 million from sales of equipment.
Material costs. Material costs decreased by $3.1 million, or 1.2%, for the nine months ended September 30, 2016 to $245.1 million from $248.2 million for the nine months ended September 30, 2015. Material costs by operating segment, after elimination of intersegment activity, were as follows:
|
|
|
For the Nine Months Ended |
|
|
|
Percent |
| |||||
|
(dollars in millions) |
|
2016 |
|
2015 |
|
Change |
|
Change |
| |||
|
|
|
|
|
|
|
|
|
|
| |||
|
Patient Care |
|
$ |
187.2 |
|
$ |
193.4 |
|
$ |
(6.2 |
) |
(3.2 |
)% |
|
Products & Services |
|
57.9 |
|
54.8 |
|
3.1 |
|
5.7 |
% | |||
|
Material costs |
|
$ |
245.1 |
|
$ |
248.2 |
|
$ |
(3.1 |
) |
(1.2 |
)% |
|
|
|
|
|
|
|
|
|
|
| |||
|
Percent of net revenue |
|
32.2 |
% |
31.8 |
% |
|
|
|
| |||
|
Percent of adjusted gross revenue |
|
30.7 |
% |
30.0 |
% |
|
|
|
| |||
Material costs as a percentage of net revenue increased to 32.2% for the nine months ended September 30, 2016 compared with 31.8% for the nine months ended September 30, 2015. Excluding the effects of disallowed revenue, material costs increased to 30.7% of adjusted gross revenue in the nine months ended September 30, 2016 compared to 30.0% for the same period in the prior year primarily driven by 0.6% increase in materials as a percent of adjusted gross revenue in the Patient Care segment. We had a favorable decrease of $8.3 million in disallowed revenue during the nine months ended September 30, 2016 compared with the same period in the prior year. Material costs were also impacted by product mix and vendor rebates.
Personnel costs. Personnel costs for the nine months ended September 30, 2016 decreased $4.9 million to $266.6 million from $271.5 million for the nine months ended September 30, 2015. Personnel costs by operating segment were as follows:
|
|
|
For the Nine Months Ended |
|
|
|
Percent |
| |||||
|
(dollars in millions) |
|
2016 |
|
2015 |
|
Change |
|
Change |
| |||
|
|
|
|
|
|
|
|
|
|
| |||
|
Patient Care |
|
$ |
231.2 |
|
$ |
236.4 |
|
$ |
(5.2 |
) |
(2.2 |
)% |
|
Products & Services |
|
35.4 |
|
35.1 |
|
0.3 |
|
0.9 |
% | |||
|
Personnel costs |
|
$ |
266.6 |
|
$ |
271.5 |
|
$ |
(4.9 |
) |
(1.8 |
)% |
|
|
|
|
|
|
|
|
|
|
| |||
|
Percent of net revenue |
|
35.0 |
% |
34.7 |
% |
|
|
|
| |||
|
Percent of adjusted gross revenue |
|
33.4 |
% |
32.8 |
% |
|
|
|
| |||
Patient Care segment personnel costs decreased $5.2 million to $231.2 million for the nine months ended September 30, 2016 compared with $236.4 million in the prior year. The decline in personnel costs included $7.6 million lower commissions and bonuses from lower nine month revenue, $2.9 million lower personnel costs from the exit of CARES, $0.3 million lower temporary labor partially offset by $5.6 million higher salaries, benefits and payroll taxes related to additional personnel to support the centralization of billing and collection functions as discussed in the “Revenue Cycle Management” section and an annual merit increase. Personnel costs in the Products & Services segment including salaries, benefits and payroll taxes were $1.4 million higher for the nine months ended September 30, 2016 compared with the same period in the prior year, partially offset by $1.1 million lower bonus expense and other personnel costs.
Other operating costs. Other operating costs decreased $3.9 million to $103.0 million for the nine months ended September 30, 2016 from $106.9 million for the nine months ended September 30, 2015. Bad debt expense decreased $2.3 million from $9.9 million to $7.6 million primarily due to improvements in revenue cycle management. With the exit of CARES in 2015, $4.0 million of CARES other operating expense in the first nine months of 2015 did not occur in the first nine months of 2016. Facility costs, office expenses, travel and other expenses not related to CARES increased $2.4 million for the nine months ended September 30, 2016 compared to the same period in the prior year.
General and administrative expenses. For the nine months ended September 30, 2016, general and administrative expenses decreased $1.2 million to $83.5 million from $84.7 million for the nine months ended September 30, 2015. The decrease of lower office, travel, education and professional fee expenses and in addition lower commissions and bonuses of $5.7 million was partially offset by an increase in personnel compensatory costs of $4.5 million in accounting to support the restatement of previously issued financial information.
Professional accounting and legal fees. Professional accounting and legal fees incurred were $31.4 million in the nine months ended September 30, 2016 compared to $19.0 million in the nine months ended September 30, 2015. The increase of $12.4 million or 65.3% resulted from the 2014 financial Restatement and remediation process.
Depreciation and amortization. Depreciation and amortization for the nine months ended September 30, 2016 was $34.7 million, an increase of $4.4 million, or 14.5%, compared with $30.3 million for the nine months ended September 30, 2015. Amortization of customer list intangibles increased $6.0 million primarily due to a change in the estimated useful lives in the fourth quarter of 2015. Partially offsetting this increase included reduced depreciation of $0.7 million in therapeutic services selling equipment to customers and equipment becoming fully depreciated, $0.4 million lower amortization of non-compete agreements, $0.2 million decreased amortization of customer related intangibles and $0.3 million decreased depreciation of leasehold improvements and buildings.
Impairment of intangible assets. There was no impairment of intangible assets for the nine months ended September 30, 2016. For nine months ended September 30, 2015, we recorded in impairment of intangible assets of $0.8 million related to our Therapeutic reporting unit’s indefinite life tradename.
(Loss) income from operations. We incurred a loss from operations of $3.2 million for the nine months ended September 30, 2016 compared to income from operations of $20.1 million for the nine months ended September 30, 2015 from lower revenue combined with higher professional accounting and legal fees.
Interest expense, net. Interest expense increased to $31.5 million for the nine months ended September 30, 2016 from $21.9 million for the nine months ended September 30, 2015. The $9.6 million increase resulted from the additional interest expense and early extinguishment of debt expense associated with the debt refinancing that occurred in the third quarter of 2016, partially offset by a reduction in outstanding borrowings.
Extinguishment of debt. Fees of $6.0 million were incurred in the nine months ended September 30, 2016 in connection with the redemption of our Senior Notes. There was no similar expense incurred in the nine months ended September 30, 2015. See Note N - “Long-Term Debt” to our consolidated financial statements in this Annual Report on Form 10-K for further details.
(Benefit) provision for income taxes. The benefit for income taxes for the nine months ended September 30, 2016 was $14.4 million compared to a provision of $2.2 million for the nine months ended September 30, 2015. The effective tax rate consists principally of the 35% federal statutory tax rate in addition to state income taxes, less permanent tax differences. The increased benefit was largely driven by increased loss from continuing operations before taxes, increased estimated effective tax rate combined with change in valuation allowance. The increase in estimated effective tax rate was driven by increased annual forecasted loss from continuing operations before taxes.
Income (loss) from discontinued operations, net of income taxes. For the nine months ended September 30, 2016, net income from discontinued operations, net of taxes was $1.0 million compared to a net loss from discontinued operations, net of taxes of $7.3 million for the nine months ended September 30, 2015. The Dosteon operations incurred operating and disposal costs and was completely shut down or sold by June 30, 2015 with only contingent consideration gains recorded in 2016 resulting from the disposal of Dosteon assets in prior years.
Net loss. For the nine months ended September 30, 2016, we incurred a net loss of $25.3 million compared with a net loss of $11.3 million for the nine months ended September 30, 2015 from an increase in professional accounting and legal fees, depreciation and amortization and higher interest expense.
Results of Operations - Year Ended December 31, 2015 Compared to Year Ended December 31, 2014
From 2014 through 2015, our annual consolidated results of operations were as follows:
|
|
|
For the Years Ended December 31, |
|
Percent Change |
| ||||
|
(dollars in millions) |
|
2015 |
|
2014 |
|
2015 v 2014 |
| ||
|
|
|
|
|
|
|
|
| ||
|
Net revenue |
|
$ |
1,067.2 |
|
$ |
1,012.1 |
|
5.4 |
% |
|
Material costs |
|
336.3 |
|
324.3 |
|
3.7 |
% | ||
|
Personnel costs |
|
367.1 |
|
353.6 |
|
3.8 |
% | ||
|
Other operating costs |
|
140.9 |
|
136.9 |
|
2.9 |
% | ||
|
General and administrative expenses |
|
111.8 |
|
86.1 |
|
29.8 |
% | ||
|
Professional accounting and legal fees |
|
28.6 |
|
44.8 |
|
(36.2 |
)% | ||
|
Depreciation and amortization |
|
46.3 |
|
38.9 |
|
19.0 |
% | ||
|
Impairment of intangible assets |
|
385.8 |
|
0.2 |
|
* |
| ||
|
(Loss) income from operations |
|
(349.6 |
) |
27.3 |
|
* |
| ||
|
|
|
|
|
|
|
|
| ||
|
Interest expense, net |
|
29.9 |
|
28.3 |
|
5.7 |
% | ||
|
Extinguishment of debt |
|
7.2 |
|
— |
|
100.0 |
% | ||
|
Loss from continuing operations before income taxes |
|
(386.7 |
) |
(1.0 |
) |
* |
| ||
|
(Benefit) provision for income taxes |
|
(67.6 |
) |
2.0 |
|
* |
| ||
|
Loss from continuing operations |
|
(319.1 |
) |
(3.0 |
) |
* |
| ||
|
Loss from discontinued operations, net of income taxes |
|
(8.0 |
) |
(16.0 |
) |
(50.0 |
)% | ||
|
Net loss |
|
$ |
(327.1 |
) |
$ |
(19.0 |
) |
* |
|
* Not a meaningful percentage
Material costs, personnel costs and other operating costs reflect expenses we incur in connection with our delivery of care through our clinic locations and other patient care operations, or distribution of products and services, and exclude expenses incurred in connection with general and administrative activities. General and administrative expenses reflect expenses we incur in the general management and administration of our businesses that are not directly attendant to the operation of our clinics or provision of products and services.
Due to the substantial amount and increase in the expenses we incur for professional accounting and legal services, we separately reflect this category. We have incurred increases in these expenses primarily in connection with the Restatement, the Investigation and in connection with our accounting and remedial activities associated with the material weaknesses. We currently anticipate that these expenses will remain significant in comparison to a normal level of expenditure at least through 2018.
Impairment of intangible assets are reported as a separate line item within (loss) income from continuing operations in this Annual Report on Form 10-K. An intangible asset impairment is recognized when the financial statement carrying amount of a long-lived asset or asset group exceeds its fair value and is not recoverable. These amounts are significant in relation to the financial statements.
During the years 2014 through 2015, our operating expenses as a percentage of net revenue were as follows:
|
|
|
For the Years Ended December 31, |
| ||
|
|
|
2015 |
|
2014 |
|
|
|
|
|
|
|
|
|
Material costs |
|
31.5 |
% |
32.0 |
% |
|
Personnel costs |
|
34.4 |
% |
34.9 |
% |
|
Other operating costs |
|
13.2 |
% |
13.7 |
% |
|
General and administrative expenses |
|
10.5 |
% |
8.5 |
% |
|
Professional accounting and legal fees |
|
2.7 |
% |
4.4 |
% |
|
Depreciation and amortization |
|
4.3 |
% |
3.8 |
% |
|
Impairment of intangible assets |
|
36.2 |
% |
— |
% |
|
Operating expenses |
|
132.8 |
% |
97.3 |
% |
Due to the volatility of disallowed revenue experienced during the periods encompassed by this Annual Report on Form 10-K and to assist in evaluating the comparability of expense trends, the following table provides our adjusted gross revenue, disallowed revenue and net revenue for each year, as well as our expenses as a percentage of adjusted gross revenue:
|
|
|
For the Years Ended December 31, |
| ||||
|
(dollars in millions) |
|
2015 |
|
2014 |
| ||
|
|
|
|
|
|
| ||
|
Net revenue |
|
$ |
1,067.2 |
|
$ |
1,012.1 |
|
|
Disallowed revenue |
|
60.6 |
|
82.3 |
| ||
|
Adjusted gross revenue |
|
$ |
1,127.8 |
|
$ |
1,094.4 |
|
|
|
|
|
|
|
| ||
|
Material costs |
|
29.8 |
% |
29.6 |
% | ||
|
Personnel costs |
|
32.6 |
% |
32.3 |
% | ||
|
Other operating costs |
|
12.5 |
% |
12.5 |
% | ||
|
General and administrative expenses |
|
9.9 |
% |
7.9 |
% | ||
|
Professional accounting and legal fees |
|
2.5 |
% |
4.1 |
% | ||
|
Depreciation and amortization |
|
4.1 |
% |
3.6 |
% | ||
|
Impairment of intangible assets |
|
34.2 |
% |
— |
% | ||
|
Operating expenses |
|
125.6 |
% |
90.0 |
% | ||
During the previous two years, the number of patient care clinics and satellite clinics we operated have been as follows:
|
|
|
As of December 31, |
| ||
|
|
|
2015 |
|
2014 |
|
|
|
|
|
|
|
|
|
Patient Care Clinics |
|
721 |
|
767 |
|
|
Satellite Clinics |
|
116 |
|
120 |
|
|
Total Clinics |
|
837 |
|
887 |
|
Patient care clinics reflect locations that are licensed as a primary location to provide O&P services and which are fully-staffed and open throughout a typical operating week. To facilitate patient convenience, we also operate satellite clinics. These are remote locations associated with a primary care clinic, utilized to see patients and are open for operation on less than a full-time basis during a typical operating week.
Net revenue. Net revenue for the year ended December 31, 2015 increased $55.1 million or 5.4%, to $1,067.2 million compared to $1,012.1 million for year ended December 31, 2014. Our net revenue by operating segment, after elimination of intersegment activity, was as follows:
|
|
|
For the Years Ended December 31, |
|
|
|
Percent |
| |||||
|
(dollars in millions) |
|
2015 |
|
2014 |
|
Change |
|
Change |
| |||
|
|
|
|
|
|
|
|
|
|
| |||
|
Patient Care |
|
$ |
875.0 |
|
$ |
837.1 |
|
$ |
37.9 |
|
4.5 |
% |
|
Products & Services |
|
192.2 |
|
175.0 |
|
17.2 |
|
9.8 |
% | |||
|
Net revenue |
|
$ |
1,067.2 |
|
$ |
1,012.1 |
|
$ |
55.1 |
|
5.4 |
% |
Net revenue in the Patient Care segment for the year ended December 31, 2015 compared to the year ended December 31, 2014 increased $37.9 million or 4.5% to $875.0 million from 2014 net revenue of $837.1 million. Hanger Clinic operations net revenue increased both organically and through acquisitions by $55.6 million, partially offset by the consolidation and closure of clinics reducing revenue by $9.0 million. Exit of the Patient Care CARES business in 2015 resulted in $8.3 million net revenue decrease in 2015 compared to 2014. Network contract management revenue declined year over year by $0.4 million. Products & Services segment net revenue for the year ended December 31, 2015 was $192.2 million compared to $175.0 million for year ended December 31, 2014, an increase of $17.2 million, or 9.8%. Year over year net revenue increased in therapeutic services by $3.9 million and $13.3 million in distribution.
Material costs. Material costs as a percentage of net revenue decreased to 31.5% for the year ended December 31, 2015 compared with 32.0% for the year ended December 31, 2014. Material costs for the year ended December 31, 2015 were $336.3 million, an increase of $12.0 million, or 3.7%, from $324.3 million for the same period in the prior year. Material costs by operating segment, after elimination of intersegment activity, were as follows:
|
|
|
For the Years Ended December 31, |
|
|
|
Percent |
| |||||
|
(dollars in millions) |
|
2015 |
|
2014 |
|
Change |
|
Change |
| |||
|
|
|
|
|
|
|
|
|
|
| |||
|
Patient Care |
|
$ |
262.3 |
|
$ |
260.3 |
|
$ |
2.0 |
|
0.8 |
% |
|
Products & Services |
|
74.0 |
|
64.0 |
|
10.0 |
|
15.6 |
% | |||
|
Material costs |
|
$ |
336.3 |
|
$ |
324.3 |
|
$ |
12.0 |
|
3.7 |
% |
|
|
|
|
|
|
|
|
|
|
| |||
|
Percent of net revenue |
|
31.5 |
% |
32.0 |
% |
|
|
|
| |||
|
Percent of adjusted gross revenue |
|
29.8 |
% |
29.6 |
% |
|
|
|
| |||
Excluding the effects of $21.7 million year over year lower disallowed revenue, material costs increased to 29.8% of adjusted gross revenue for the year ended December 31, 2015 compared with 29.6% in the prior year period. Material costs were also impacted by product mix and vendor rebates.
Personnel costs. Personnel costs for the year ended December 31, 2015 increased by $13.5 million to $367.1 million from $353.6 million for the year ended December 31, 2014. Personnel costs by operating segment were as follows:
|
|
|
For the Years Ended December 31, |
|
|
|
Percent |
| |||||
|
(dollars in millions) |
|
2015 |
|
2014 |
|
Change |
|
Change |
| |||
|
|
|
|
|
|
|
|
|
|
| |||
|
Patient Care |
|
$ |
317.9 |
|
$ |
305.7 |
|
$ |
12.2 |
|
4.0 |
% |
|
Products & Services |
|
49.2 |
|
47.9 |
|
1.3 |
|
2.7 |
% | |||
|
Personnel costs |
|
$ |
367.1 |
|
$ |
353.6 |
|
$ |
13.5 |
|
3.8 |
% |
|
|
|
|
|
|
|
|
|
|
| |||
|
Percent of net revenue |
|
34.4 |
% |
34.9 |
% |
|
|
|
| |||
|
Percent of adjusted gross revenue |
|
32.6 |
% |
32.3 |
% |
|
|
|
| |||
Personnel costs for our Patient Care segment for the year ended December 31, 2015 increased $12.2 million to $317.9 million, or 4.0%, from $305.7 million for the year ended December 31, 2014. This increase included $7.1 million in temporary labor and $6.8 million of additional compensation, benefits and payroll taxes for resources added in collections and office administration functions, partially offset by $1.7 million lower personnel costs from the shutdown of CARES. These collection and office administration personnel were added primarily to increase the effectiveness of our patient eligibility processes and to improve the effectiveness of our preparation of claims for submission. In our Products & Services segment, personnel costs increased $1.3 million, or 2.7% from higher commission, bonus and other personnel costs of $0.9 million. Salaries, benefits, payroll taxes and contract labor in this segment increased $0.4 million year over year, the result of additional personnel and an annual merit increase.
Other operating costs. Other operating costs were $140.9 million for the year ended December 31, 2015, $4.0 million, or 2.9% higher from $136.9 million for the year ended December 31 2014. Bad debt expenses increased $1.3 million for the year ended December 31, 2015 as compared to the prior year as discussed in the “Reimbursement Trends” section. Other operating expenses, excluding bad debt expenses increased $4.9 million for the twelve months ended December 31, 2015 as compared to the twelve months ended December 31, 2014 from additional expenditures on professional consultants to assist in the establishment of a centralized revenue cycle management organization. Discontinuance of CARES in 2014 resulted in $2.2 million impairment of related property, plant and equipment in 2014 that did not occur in 2015.
General and administrative expenses. For the year ended December 31, 2015, general and administrative expenses increased $25.7 million, or 29.8% to $111.8 million from $86.1 million for the year ended December 31, 2014. Salaries, benefits, payroll taxes, temporary labor and other personnel costs increased $11.5 million from the hiring of accounting personnel with appropriate degree of knowledge, experience and training commensurate with the accounting and reporting requirements of our organization and an annual merit increase. Bonus and commission costs increased $5.4 million year over year from higher 2015 operating income compared with 2014 operating income. Facilities and other office related expenses increased $8.4 million for the year ended December 31, 2015 from professional advisory fees for supply chain systems and additional expenses for data warehousing. Additionally, we established a reserve for 2015 related to a civil investigative demand that included $0.4 million to facilitate an anticipated settlement.
Professional accounting and legal fees. Professional accounting and legal fees decreased $16.2 million, or 36.2%, for the year ended December 31, 2015 to $28.6 million, from $44.8 million for the year ended December 31, 2014. We recognize the costs related to our independent audits in the year to which the audit work pertains. The audit fees for the 2015 audit were $30.1 million lower than the audit fees for the 2014 audit. Expenses for consultants in conjunction with the Restatement of prior periods, remediation of material weaknesses and our research and reconstruction of prior accounting records were reported when incurred. These expenses increased $13.9 million to $22.5 million for the year ended December 31, 2015 from $8.6 for the year ended December 31, 2014.
Depreciation and amortization. Depreciation and amortization for the year ended December 31, 2015 was $46.3 million compared with $38.9 million for the year ended December 31, 2014, an increase of $7.4 million, or 19.0%. Amortization of customer list intangibles increased $6.9 million primarily due to a change in the estimated useful lives in the fourth quarter of 2015. Depreciation and amortization increased $2.3 million in 2015 from acquisitions and the implementation of the new patient management and electronic health care record system. Depreciation and amortization for machinery and equipment not related to CARES increased $0.6 million. These increases were partially offset by $2.1 million lower machinery and equipment depreciation from the shutdown of CARES and $0.3 million lower depreciation related to the sale of therapeutic equipment and assets becoming fully depreciated.
Impairment of intangible assets. For the year ended December 31, 2015, impairment of intangible assets was $385.8 million compared to $0.2 million for the year ended December 31, 2014. In 2015, we recorded a goodwill impairment charge of $382.9 million related to our Patient Care reporting unit. Other intangible asset impairments of $2.9 million in 2015 and $0.2 million in 2014 related to our Therapeutic reporting unit’s indefinite life tradename. See Note H - “Goodwill and Other Intangible Assets” to our consolidated financial statements in this Annual Report on Form 10-K for additional information.
(Loss) income from operations. We incurred a loss from operations of $349.6 million for the year ended December 31, 2015 compared to income from operations of $27.3 million for the year ended December 31, 2014 resulting from the increase in intangible assets impairment, partially offset by lower professional accounting and legal fees.
Interest expense, net. Interest expense for the year ended December 31, 2015 increased to $29.9 million from $28.3 million for the year ended December 31, 2014 related to an increase in borrowings and higher interest rates on our revolving line of credit.
Extinguishment of debt. In conjunction with our bank credit facility refinancing in 2015, we incurred a charge of $7.2 million related to the write-off of existing debt issuance cost associated with previous credit agreements that was not incurred in 2014.
(Benefit) provision for income taxes. An income tax benefit of $67.6 million was recognized for year ended December 31, 2015, compared to a provision of $2.0 million for the year ended December 31, 2014. The increase in the tax benefit was largely driven by the increase in pre-tax book loss offset by non-deductible impairment of intangible assets. The effective tax rate consists principally of the 35% federal statutory tax rate in addition to state income taxes, less permanent tax differences.
Loss from discontinued operations, net of income taxes. Net loss from the discontinued operations of Dosteon for the year ended December 31, 2015 was $8.0 million compared with a net loss of $16.0 million for the year ended December 31, 2014. The decrease of $8.0 million results from the discontinuance and sale of Dosteon beginning in 2014 with the remainder sold or closed in 2015.
Net loss. Net loss of $327.1 million for the year ended December 31, 2015 was $308.1 million higher than the net loss of $19.0 million for year ended December 31, 2014, from impairment of goodwill and other intangible assets partially offset by higher revenue and lower professional accounting and legal fees.
Results of Operations - Quarterly Periods December 31, 2015 Compared to Quarterly Periods December 31, 2014
The quarterly results of operations for 2015 and the comparative quarters in 2014 were as follows:
|
|
|
For the Quarters Ended, |
| ||||||||||||||||||||||
|
|
|
Unaudited |
| ||||||||||||||||||||||
|
|
|
2015 |
|
2014 |
| ||||||||||||||||||||
|
(dollars in millions) |
|
Dec 31 |
|
Sep 30 |
|
Jun 30 |
|
Mar 31 |
|
Dec 31 |
|
Sep 30 |
|
Jun 30 |
|
Mar 31 |
| ||||||||
|
|
|
|
|
|
|
|
|
|
|
|
|
|
|
|
|
|
| ||||||||
|
Net revenue |
|
$ |
285.7 |
|
$ |
275.2 |
|
$ |
272.8 |
|
$ |
233.5 |
|
$ |
278.9 |
|
$ |
261.7 |
|
$ |
255.6 |
|
$ |
215.9 |
|
|
Material costs |
|
88.1 |
|
85.5 |
|
85.9 |
|
76.8 |
|
86.4 |
|
86.2 |
|
81.1 |
|
70.6 |
| ||||||||
|
Personnel costs |
|
95.6 |
|
95.2 |
|
89.9 |
|
86.4 |
|
93.5 |
|
89.1 |
|
88.7 |
|
82.2 |
| ||||||||
|
Other operating costs |
|
34.0 |
|
32.9 |
|
37.6 |
|
36.4 |
|
35.5 |
|
34.6 |
|
34.4 |
|
32.3 |
| ||||||||
|
General and administrative expenses |
|
27.1 |
|
29.7 |
|
29.1 |
|
25.9 |
|
22.2 |
|
21.8 |
|
22.5 |
|
19.6 |
| ||||||||
|
Professional accounting and legal fees |
|
9.6 |
|
9.3 |
|
4.9 |
|
4.8 |
|
19.8 |
|
21.0 |
|
2.6 |
|
1.5 |
| ||||||||
|
Depreciation and amortization |
|
16.0 |
|
10.2 |
|
9.9 |
|
10.2 |
|
10.0 |
|
9.8 |
|
9.8 |
|
9.3 |
| ||||||||
|
Impairment of intangible assets |
|
385.0 |
|
0.8 |
|
— |
|
— |
|
0.2 |
|
— |
|
— |
|
— |
| ||||||||
|
Operating expenses |
|
655.4 |
|
263.6 |
|
257.3 |
|
240.5 |
|
267.6 |
|
262.5 |
|
239.1 |
|
215.5 |
| ||||||||
|
(Loss) income from operations |
|
(369.7 |
) |
11.6 |
|
15.5 |
|
(7.0 |
) |
11.3 |
|
(0.8 |
) |
16.5 |
|
0.4 |
| ||||||||
|
|
|
|
|
|
|
|
|
|
|
|
|
|
|
|
|
|
| ||||||||
|
Interest expense, net |
|
8.0 |
|
7.4 |
|
7.3 |
|
7.2 |
|
7.2 |
|
7.3 |
|
7.1 |
|
6.8 |
| ||||||||
|
Extinguishment of debt |
|
7.2 |
|
— |
|
— |
|
— |
|
— |
|
— |
|
— |
|
— |
| ||||||||
|
(Loss) income from continuing operations before income taxes |
|
(384.9 |
) |
4.2 |
|
8.2 |
|
(14.2 |
) |
4.1 |
|
(8.1 |
) |
9.4 |
|
(6.4 |
) | ||||||||
|
(Benefit) provision for income taxes |
|
(69.8 |
) |
1.1 |
|
0.3 |
|
0.8 |
|
1.3 |
|
(10.1 |
) |
10.8 |
|
(0.1 |
) | ||||||||
|
(Loss) income from continuing operations |
|
(315.1 |
) |
3.1 |
|
7.9 |
|
(15.0 |
) |
2.8 |
|
2.0 |
|
(1.4 |
) |
(6.3 |
) | ||||||||
|
(Loss) income from discontinued operations, net of income taxes |
|
(0.7 |
) |
— |
|
(6.3 |
) |
(1.0 |
) |
(6.2 |
) |
(10.8 |
) |
4.6 |
|
(3.7 |
) | ||||||||
|
Net (loss) income |
|
$ |
(315.8 |
) |
$ |
3.1 |
|
$ |
1.6 |
|
$ |
(16.0 |
) |
$ |
(3.4 |
) |
$ |
(8.8 |
) |
$ |
3.2 |
|
$ |
(10.0 |
) |
During these periods, our operating expenses as a percentage of net revenue were as follows:
|
|
|
For the Quarters Ended, |
| ||||||||||||||
|
|
|
Unaudited |
| ||||||||||||||
|
|
|
2015 |
|
2014 |
| ||||||||||||
|
|
|
Dec 31 |
|
Sep 30 |
|
Jun 30 |
|
Mar 31 |
|
Dec 31 |
|
Sep 30 |
|
Jun 30 |
|
Mar 31 |
|
|
|
|
|
|
|
|
|
|
|
|
|
|
|
|
|
|
|
|
|
Material costs |
|
30.8 |
% |
31.1 |
% |
31.5 |
% |
32.9 |
% |
31.0 |
% |
32.9 |
% |
31.7 |
% |
32.7 |
% |
|
Personnel costs |
|
33.5 |
% |
34.6 |
% |
33.0 |
% |
37.0 |
% |
33.5 |
% |
34.0 |
% |
34.7 |
% |
38.1 |
% |
|
Other operating costs |
|
11.8 |
% |
11.9 |
% |
13.7 |
% |
15.5 |
% |
12.7 |
% |
13.3 |
% |
13.5 |
% |
14.9 |
% |
|
General and administrative expenses |
|
9.5 |
% |
10.8 |
% |
10.7 |
% |
11.1 |
% |
7.9 |
% |
8.3 |
% |
8.8 |
% |
9.1 |
% |
|
Professional accounting and legal fees |
|
3.4 |
% |
3.4 |
% |
1.8 |
% |
2.1 |
% |
7.1 |
% |
8.0 |
% |
1.0 |
% |
0.7 |
% |
|
Depreciation and amortization |
|
5.6 |
% |
3.7 |
% |
3.6 |
% |
4.4 |
% |
3.6 |
% |
3.8 |
% |
3.8 |
% |
4.3 |
% |
|
Impairment of intangible assets |
|
134.8 |
% |
0.3 |
% |
— |
% |
— |
% |
0.1 |
% |
— |
% |
— |
% |
— |
% |
|
Operating expenses |
|
229.4 |
% |
95.8 |
% |
94.3 |
% |
103.0 |
% |
95.9 |
% |
100.3 |
% |
93.5 |
% |
99.8 |
% |
Material costs, personnel costs and other operating costs reflect expenses we incur in connection with our delivery of care through our clinic locations and other patient care operations, or distribution of products and services, and exclude any expenses incurred in connection with general and administrative activities. General and administrative expenses reflect expenses we incur in the general management and administration of our businesses that are not directly attendant to our operation of our clinics or provision of products and services.
Due to the substantial expenses we incurred for professional accounting and legal services, we separately reflect this category. We have incurred increases in these expenses primarily in connection with the Restatement, the Investigation and in connection with our accounting and remediation activities associated with the material weaknesses. We currently anticipate that these expenses will remain significant at least through 2018.
When the financial statement carrying amount of a long-lived asset or asset group exceeds its fair value and is not recoverable an asset impairment is recognized. The significant decline in the trading value of our stock impaired assets in the Patient Care and Therapeutic reporting units. Impairment of intangible assets are separately disclosed within (loss) income from continuing operations in this Annual Report on Form 10-K.
Due to the volatility of disallowed revenue experienced during the periods encompassed by this Annual Report on Form 10-K, to assist in evaluating the comparability of expense trends, the following table provides our adjusted gross revenue, disallowed revenue and net revenue for each year, as well as our expenses as a percentage of adjusted gross revenue:
|
|
|
For the Quarters Ended, |
| ||||||||||||||||||||||
|
|
|
Unaudited |
| ||||||||||||||||||||||
|
|
|
2015 |
|
2014 |
| ||||||||||||||||||||
|
(dollars in millions) |
|
Dec 31 |
|
Sep 30 |
|
Jun 30 |
|
Mar 31 |
|
Dec 31 |
|
Sep 30 |
|
Jun 30 |
|
Mar 31 |
| ||||||||
|
|
|
|
|
|
|
|
|
|
|
|
|
|
|
|
|
|
| ||||||||
|
Net revenue |
|
$ |
285.7 |
|
$ |
275.2 |
|
$ |
272.8 |
|
$ |
233.5 |
|
$ |
278.9 |
|
$ |
261.7 |
|
$ |
255.6 |
|
$ |
215.9 |
|
|
Disallowed revenue |
|
15.1 |
|
13.2 |
|
16.0 |
|
16.3 |
|
18.8 |
|
19.9 |
|
23.9 |
|
19.7 |
| ||||||||
|
Adjusted gross revenue |
|
$ |
300.8 |
|
$ |
288.4 |
|
$ |
288.8 |
|
$ |
249.8 |
|
$ |
297.7 |
|
$ |
281.6 |
|
$ |
279.5 |
|
$ |
235.6 |
|
|
|
|
|
|
|
|
|
|
|
|
|
|
|
|
|
|
|
| ||||||||
|
Material costs |
|
29.3 |
% |
29.6 |
% |
29.7 |
% |
30.7 |
% |
29.0 |
% |
30.6 |
% |
29.0 |
% |
30.0 |
% | ||||||||
|
Personnel costs |
|
31.8 |
% |
33.0 |
% |
31.1 |
% |
34.6 |
% |
31.4 |
% |
31.6 |
% |
31.7 |
% |
34.9 |
% | ||||||||
|
Other operating costs |
|
11.3 |
% |
11.5 |
% |
13.1 |
% |
14.6 |
% |
12.0 |
% |
12.3 |
% |
12.3 |
% |
13.8 |
% | ||||||||
|
General and administrative expenses |
|
9.0 |
% |
10.3 |
% |
10.1 |
% |
10.4 |
% |
7.5 |
% |
7.7 |
% |
8.1 |
% |
8.3 |
% | ||||||||
|
Professional accounting and legal fees |
|
3.2 |
% |
3.2 |
% |
1.7 |
% |
1.9 |
% |
6.6 |
% |
7.5 |
% |
0.9 |
% |
0.6 |
% | ||||||||
|
Depreciation and amortization |
|
5.3 |
% |
3.5 |
% |
3.4 |
% |
4.1 |
% |
3.4 |
% |
3.5 |
% |
3.5 |
% |
3.9 |
% | ||||||||
|
Impairment of intangible assets |
|
128.0 |
% |
0.3 |
% |
— |
% |
— |
% |
— |
% |
— |
% |
— |
% |
— |
% | ||||||||
|
Operating expenses |
|
217.9 |
% |
91.4 |
% |
89.1 |
% |
96.3 |
% |
89.9 |
% |
93.2 |
% |
85.5 |
% |
91.5 |
% | ||||||||
Results of operations - three months ended March 31, 2015 compared to three months ended March 31, 2014
Net Revenue. Net revenue for the three months ended March 31, 2015 increased $17.6 million, or 8.2%, to $233.5 million from $215.9 million for the three months ended March 31, 2014. Our net revenue by operating segment, after elimination of intersegment activity, was as follows:
|
|
|
For the Three Months Ended March 31, |
|
|
|
Percent |
| |||||
|
(dollars in millions) |
|
2015 |
|
2014 |
|
Change |
|
Change |
| |||
|
|
|
|
|
|
|
|
|
|
| |||
|
Patient Care |
|
$ |
189.3 |
|
$ |
175.7 |
|
$ |
13.6 |
|
7.7 |
% |
|
Products & Services |
|
44.2 |
|
40.2 |
|
4.0 |
|
10.0 |
% | |||
|
Net revenue |
|
$ |
233.5 |
|
$ |
215.9 |
|
$ |
17.6 |
|
8.2 |
% |
Patient Care segment net revenue increased $13.6 million, or 7.7% increase for the three months ended March 31, 2015 compared to the same period in 2014. Patient Care’s clinical operations increased $8.5 million in same clinic revenue and increased $5.7 million from non-same clinic revenue, which includes clinics acquired during 2014 and 2015. CARES revenue was $3.0 million of Patient Care net revenue in the first quarter of 2015 compared with $3.6 million in the first quarter of 2014, a decrease of $0.6 million between those periods. For the three months ended March 31, 2015, net revenue in the Products & Services segment increased $4.0 million, or 10.0% compared with the same period in 2014. Distribution products net revenue increased $3.3 million and therapeutic services increased $0.7 million for the three months ended March 31, 2015 compared to the three months ended March 31, 2014.
Material costs. For the three months ended March 31, 2015, material costs were $76.8 million, an increase of $6.2 million, or 8.8%, from $70.6 million for the three months ended March 31, 2014. Material costs by operating segment for the three months ended March 31, 2015 and March 31, 2014 were as follows:
|
|
|
For the Three Months Ended March 31, |
|
|
|
Percent |
| |||||
|
(dollars in millions) |
|
2015 |
|
2014 |
|
Change |
|
Change |
| |||
|
|
|
|
|
|
|
|
|
|
| |||
|
Patient Care |
|
$ |
60.5 |
|
$ |
56.6 |
|
$ |
3.9 |
|
6.9 |
% |
|
Products & Services |
|
16.3 |
|
14.0 |
|
2.3 |
|
16.4 |
% | |||
|
Material costs |
|
$ |
76.8 |
|
$ |
70.6 |
|
$ |
6.2 |
|
8.8 |
% |
|
|
|
|
|
|
|
|
|
|
| |||
|
Percent of net revenue |
|
32.9 |
% |
32.7 |
% |
|
|
|
| |||
|
Percent of adjusted gross revenue |
|
30.7 |
% |
30.0 |
% |
|
|
|
| |||
Material costs as a percentage of net revenue increased to 32.9% for the quarter ended March 31, 2015 compared with 32.7% in the prior year period. We had a favorable decrease of $3.4 million in disallowed revenue during the March 2015 quarter compared to the same period in the prior year. Material costs increased to 30.7% of adjusted gross revenue compared with 30.0% in the prior year period excluding the effects of disallowed revenue. The shutdown of CARES in 2015 resulted in $0.8 million write-off of related inventory in the first quarter of 2015. Material costs were also impacted by product mix and vendor rebates.
Personnel costs. Personnel costs for the three months ended March 31, 2015 increased by $4.2 million to $86.4 million from $82.2 million for the three months ended March 31, 2014. Personnel costs by operating segment were as follows:
|
|
|
For the Three Months Ended March 31, |
|
|
|
Percent |
| |||||
|
(dollars in millions) |
|
2015 |
|
2014 |
|
Change |
|
Change |
| |||
|
|
|
|
|
|
|
|
|
|
| |||
|
Patient Care |
|
$ |
75.0 |
|
$ |
70.6 |
|
$ |
4.4 |
|
6.2 |
% |
|
Products & Services |
|
11.4 |
|
11.6 |
|
(0.2 |
) |
(1.7 |
)% | |||
|
Personnel costs |
|
$ |
86.4 |
|
$ |
82.2 |
|
$ |
4.2 |
|
5.1 |
% |
|
|
|
|
|
|
|
|
|
|
| |||
|
Percent of net revenue |
|
37.0 |
% |
38.1 |
% |
|
|
|
| |||
|
Percent of adjusted gross revenue |
|
34.6 |
% |
34.9 |
% |
|
|
|
| |||
Patient Care personnel costs increased $4.4 million in the first quarter of 2015 compared to the first quarter of 2014. For the three months ended March 31, 2015 salaries increased $1.2 million from additional clinic staffing related to acquisitions and an annual salary merit increase, contract labor increased $2.7 million in support of increased payor documentation and receivable collections, benefits and taxes in the segment decreased $0.6 million and commissions, bonus, and other personnel costs increased $1.1 million. Products & Service personnel costs declined $0.2 million or 1.7% for three months ended March 31, 2015 compared to March 31, 2014. Salaries, benefits, taxes and other personnel costs increased $0.2 million from an annual merit increase, offset by a decrease in commissions and bonuses of $0.4 million.
Other operating costs. Other operating costs increased $4.1 million, or 12.7% to $36.4 million for the three months ended March 31, 2015 from $32.3 million for the three months ended March 31, 2014. Bad debt expense increased $1.7 million to $3.7 million in the first quarter of 2015 from $2.0 million in the first quarter of 2014. Rent expense increased $0.7 million quarter over quarter, consulting fees increased $0.6 million to support revenue cycle management, and other related expenses including professional education for clinicians increased $1.1 million for the three months ended March 31, 2015.
General and administrative expenses. General and administrative expenses increased 32.1% or $6.3 million to $25.9 million for the three months ended March 31, 2015 from $19.6 million for the three months ended March 31, 2014. Salaries, benefits and related payroll taxes for additional accounting personnel increased $4.3 million, facility and other office related expenses increased $2.0 million in the 2015 quarter.
Professional accounting and legal fees. Professional accounting and legal fees were $4.8 million for the three months ended March 31, 2015 compared with $1.5 million for the three months ended March 31, 2014. The increase of $3.3 million related
to the increased professional fees associated with the 2014 Restatement as discussed in the “Effect of Delay in Financial Filings” section of the Management Discussion and Analysis. Fees from other professional accounting companies and legal firms in connection with the financial accounting remediation were recognized in periods the services were provided. We recognize the fees related to our annual audit in the year in which the audit services pertain, which increased $1.0 million in the first quarter of 2015 from the first quarter of 2014. The fees for other professional accounting and legal firms who performed services in connection with the financial accounting remediation and the Investigation, were recognized in periods subsequent to 2014, at the time the services were provided. Those fees increased $2.3 million from the first quarter of 2014 to the first quarter of 2015.
Depreciation and amortization. Depreciation and amortization for the three months ended March 31, 2015 was $10.2 million, an increase of $0.9 million, or 9.7%, from $9.3 million for the three months ended March 31, 2014. With the commencement of our new patient management and electronic health record system in our Patient Care segment, depreciation increased $0.3 million. The shutdown of CARES decreased equipment deprecation by $0.7 million for the three months ended March 31, 2015. Depreciation for buildings, leasehold improvements and other items increased $0.8 million for the first quarter of 2015 related to acquisitions completed throughout 2014 and the first quarter of 2015. Also related to acquisitions, customer list amortization increased by $0.5 million over the same periods.
(Loss) income from operations. We incurred a loss from operations of $7.0 million for the three months ended March 31, 2015 compared to income from operations of $0.4 million for the three months ended March 31, 2014. The $7.4 million decrease resulted from increased personnel costs and professional fees related to the financial accounting remediation and Restatement, material weaknesses, research and reconstruction of prior accounting records and preparation of the 2014 consolidated financial statements.
Interest expense, net. Interest expense increased to $7.2 million from $6.8 million for the three months ended March 31, 2015 compared with the three months ended March 31, 2014, from higher interest rates increased borrowings on our credit facility.
Provision (benefit) for income taxes. The provision for income taxes for the three months ended March 31, 2015 was $0.8 million, or (5.6)% of loss from continuing operations before taxes, compared to a benefit of $0.1 million, or 0.3% of loss from continuing operations before taxes for the three months ended March 31, 2014. The increase in provision was largely driven by non-deductible expenses, change in uncertain tax positions and change in valuation allowance. The effective tax rate consists principally of the 35% federal statutory tax rate in addition to state income taxes, less permanent tax differences.
Loss from discontinued operations, net of income taxes. Net loss from the discontinued Dosteon operations for the three months ended March 31, 2015 was $1.0 million compared to net loss of $3.7 million during the three months ended March 31, 2014.
Net loss. Net loss for the three months ended March 31, 2015 was $16.0 million compared to a net loss of $10.0 million for the three months ended March 31, 2015, from an increase in professional accounting and legal fees associated with the Restatement and additional accounting personnel.
Results of operations - three months ended June 30, 2015 compared to three months ended June 30, 2014
Net revenue. Net revenue for the three months ended June 30, 2015 increased $17.2 million, or 6.7%, to $272.8 million from $255.6 million for the three months ended June 30, 2014. Net revenue by operating segment, after elimination of intersegment activity were as follows:
|
|
|
For the Three Months Ended June 30, |
|
|
|
Percent |
| |||||
|
(dollars in millions) |
|
2015 |
|
2014 |
|
Change |
|
Change |
| |||
|
|
|
|
|
|
|
|
|
|
| |||
|
Patient Care |
|
$ |
224.8 |
|
$ |
211.5 |
|
$ |
13.3 |
|
6.3 |
% |
|
Products & Services |
|
48.0 |
|
44.1 |
|
3.9 |
|
8.8 |
% | |||
|
Net revenue |
|
$ |
272.8 |
|
$ |
255.6 |
|
$ |
17.2 |
|
6.7 |
% |
Patient care segment net revenue increased $13.3 million, or 6.3%, and Products & Services segment increased $3.9 million, or 8.8% for the three months ended June 30, 2015 compared to the prior year quarter. Patient Care clinic operations net
revenue increased $12.7 million from higher same clinic sales positively impacted by lower disallowed sales and $4.9 million from 2014 and first quarter 2015 acquisitions. Hanger Clinic closures, consolidations and other related factors decreased the net revenue increases in the clinic operations by $2.6 million. A decline in net revenue from CARES decreased revenue by $1.7 million for the three months ended June 30, 2015. Revenue for Products & Services segment’s distribution products increased $2.9 million in the second quarter 2015 compared to second quarter of 2014. Products & Services segment’s therapeutic services increased $1.0 million for the three months ended June 30, 2015 compared with the three months ended June 30, 2014.
Material costs. Material costs increased $4.8 million, or a 5.9% for the three months ended June 30, 2015 compared to the three months ended June 30, 2014. Material costs by operating segment, after elimination of intersegment activity, were as follows:
|
|
|
For the Three Months Ended June 30, |
|
|
|
Percent |
| |||||
|
(dollars in millions) |
|
2015 |
|
2014 |
|
Change |
|
Change |
| |||
|
|
|
|
|
|
|
|
|
|
| |||
|
Patient Care |
|
$ |
67.3 |
|
$ |
64.9 |
|
$ |
2.4 |
|
3.7 |
% |
|
Products & Services |
|
18.6 |
|
16.2 |
|
2.4 |
|
14.8 |
% | |||
|
Material costs |
|
$ |
85.9 |
|
$ |
81.1 |
|
$ |
4.8 |
|
5.9 |
% |
|
|
|
|
|
|
|
|
|
|
| |||
|
Percent of net revenue |
|
31.5 |
% |
31.7 |
% |
|
|
|
| |||
|
Percent of adjusted gross revenue |
|
29.7 |
% |
29.0 |
% |
|
|
|
| |||
Material costs for the second quarter of 2015 was $85.9 million compared with $81.1 million for the second quarter of 2014. As a percentage of net revenue, material costs were 31.5% for the three months ended June 30, 2015 compared with 31.7% in the prior year period. We had a favorable decrease of $7.9 million in disallowed revenue during the June 2015 quarter compared to the same period in the prior year. Excluding the effects of disallowed revenue, material costs increased to 29.7% of adjusted gross revenue for the three months ended June 30, 2015 compared with 29.0% for the three months ended June 30, 2014 due to product mix.
Personnel costs. For the three months ended June 30, 2015, personnel costs were $89.9 million compared to $88.7 million for the three months ended June 30, 2014, a $1.2 million increase. Personnel costs by operating segment were as follows:
|
|
|
For the Three Months Ended June 30, |
|
|
|
Percent |
| |||||
|
(dollars in millions) |
|
2015 |
|
2014 |
|
Change |
|
Change |
| |||
|
|
|
|
|
|
|
|
|
|
| |||
|
Patient Care |
|
$ |
78.1 |
|
$ |
76.6 |
|
$ |
1.5 |
|
2.0 |
% |
|
Products & Services |
|
11.8 |
|
12.1 |
|
(0.3 |
) |
(2.5 |
)% | |||
|
Personnel costs |
|
$ |
89.9 |
|
$ |
88.7 |
|
$ |
1.2 |
|
1.4 |
% |
|
|
|
|
|
|
|
|
|
|
| |||
|
Percent of net revenue |
|
33.0 |
% |
34.7 |
% |
|
|
|
| |||
|
Percent of adjusted gross revenue |
|
31.1 |
% |
31.7 |
% |
|
|
|
| |||
Personnel costs within the Patient Care segment increased $1.5 million for the three months ended June 30, 2015 compared to the same period in 2014. Patient Care contract labor increased $1.8 million to support payor documentation and accounts receivable collection demands. Salary, benefits, payroll taxes and other personnel costs increased $1.1 million, offset by $1.4 million lower bonus and commissions from 2015 lower second quarter operating income compared to second quarter 2014. The Products & Services segment’s personnel costs decreased $0.3 million or 2.5% for the three months ended June 30, 2015 compared to the same period in the prior year from lower bonus and commission expense.
Other operating costs. Other operating costs increased $3.2 million, or 9.3% to $37.6 million for the three months ended June 30, 2015 from $34.4 million for the three months ended June 30, 2014. A $2.0 million early termination fee on contractually leased equipment was incurred during the second quarter of 2015 due to the shutdown of CARES. Increases of
$0.7 million in bad debt expense and $1.0 million professional fees for revenue cycle management consulting partially offset by $0.5 million decrease other operating costs for the three months ended June 30, 2015.
General and administrative expenses. General and administrative expenses were $29.1 million for the three months ended June 30, 2015 compared with $22.5 million for the three months ended June 30, 2014, an increase of $6.6 million, or 29.3%. Personnel compensatory costs increased $3.6 million from additional personnel in the accounting and information technology departments related to material weakness remediation and 2014 financial restatement, increase in bonus expense and an annual merit increase. Facilities, contract labor and other office related expenses increased $3.0 million for the three months ended June 30, 2015 compared with the three months ended June 30, 2014.
Professional accounting and legal fees. Professional accounting and legal fees were $4.9 million for the three months ended June 30, 2015 compared to $2.6 million for the three months ended June 30, 2014, an increase of $2.3 million, or 88.5%. Professional fees increased $1.5 million for three months ended June 30, 2015 compared to the same period in the prior year and legal fees increased $1.5 million for the same comparative periods due to the commencement of the Investigation in 2015. Second quarter 2015 professional fees related to the 2015 annual audit decreased $0.7 million compared to the second quarter 2014 audit fees.
Depreciation and amortization. Depreciation and amortization for the three months ended June 30, 2015 was $9.9 million, an increase of $0.1 million, or 1.0%, from $9.8 million for the three months ended June 30, 2014. Depreciation of machinery and equipment was $0.5 million lower from the shutdown of the CARES operations offset by $0.6 million increased depreciation and amortization from 2014 and the first quarter of 2015 acquisitions.
Income from operations. Income from operations decreased $1.0 million, to $15.5 million for the three months ended June 30, 2015 from $16.5 million for the three months ended June 30, 2014.
Interest expense, net. Interest expense increased to $7.3 million from $7.1 million for the three months ended June 30, 2015 compared with the three months ended June 30, 2014 from higher interest rates and increased borrowings on our revolving line of credit.
Provision for income taxes. The provision for income taxes for the three months ended June 30, 2015 was $0.3 million, or 2.8% of income from continuing operations before taxes, compared to a provision of $10.8 million, or 115.2% of income from continuing operations before taxes, for the three months ended June 30, 2014. The decreased provision was largely impacted by changes in non-deductible expenses, uncertain tax positions and valuation allowance adjustments. The effective tax rate consists principally of the 35% federal statutory tax rate in addition to state income taxes, less permanent tax differences.
(Loss) income from discontinued operations, net of income taxes. Net loss from the discontinued Dosteon operations during the three months ended June 30, 2015 was $6.3 million compared to net income of $4.6 million during the three months ended June 30, 2014 as a result of disposal costs incurred to shut down and dispose of the business which was completed as of June 30, 2015.
Net income. Net income for the three months ended June 30, 2015 was $1.6 million compared to net income of $3.2 million for the three months ended June 30, 2014.
Results of operations - three months ended September 30, 2015 compared to three months ended September 30, 2014
Net revenue. Net revenue increased $13.5 million or 5.2% to $275.2 million for the three months ended September 30, 2015 from $261.7 million for the three months ended September 30, 2014. Net revenue by operating segment, after elimination of intersegment activity was as follows:
|
|
|
For the Three Months Ended |
|
|
|
Percent |
| |||||
|
(dollars in millions) |
|
2015 |
|
2014 |
|
Change |
|
Change |
| |||
|
|
|
|
|
|
|
|
|
|
| |||
|
Patient Care |
|
$ |
224.8 |
|
$ |
216.2 |
|
$ |
8.6 |
|
4.0 |
% |
|
Products & Services |
|
50.4 |
|
45.5 |
|
4.9 |
|
10.8 |
% | |||
|
Net revenue |
|
$ |
275.2 |
|
$ |
261.7 |
|
$ |
13.5 |
|
5.2 |
% |
Patient care net revenue increased $8.6 million, or 4.0%, and Products & Services revenue increased $4.9 million, or 10.8% for the three months ended September 30, 2015 compared with the three months ended September 30, 2014. Patient Care segment’s net revenue from clinical operations increased $11.5 million from clinics that operated in both periods, partially offset by $2.6 million decline in net revenue from CARES winding down in 2015, and a $0.3 million decrease in network contracting services revenue. Products & Services distribution products net revenue increased $3.4 million increase and therapeutic services net revenue increased $1.5 million for the three months ended September 30, 2015 compared to the three months ended September 30, 2014.
Material costs. Material costs for the three months ended September 30, 2015 were $85.5 million, decrease of $0.7 million, or 0.8%, from $86.2 million for the three months ended September 30, 2014. Material costs by operating segment, after elimination of intersegment activity, were as follows:
|
|
|
For the Three Months Ended |
|
|
|
Percent |
| |||||
|
(dollars in millions) |
|
2015 |
|
2014 |
|
Change |
|
Change |
| |||
|
|
|
|
|
|
|
|
|
|
| |||
|
Patient Care |
|
$ |
65.6 |
|
$ |
68.0 |
|
$ |
(2.4 |
) |
(3.5 |
)% |
|
Products & Services |
|
19.9 |
|
18.2 |
|
1.7 |
|
9.3 |
% | |||
|
Material costs |
|
$ |
85.5 |
|
$ |
86.2 |
|
$ |
(0.7 |
) |
(0.8 |
)% |
|
|
|
|
|
|
|
|
|
|
| |||
|
Percent of net revenue |
|
31.1 |
% |
32.9 |
% |
|
|
|
| |||
|
Percent of adjusted gross revenue |
|
29.6 |
% |
30.6 |
% |
|
|
|
| |||
Material costs as a percentage of net revenue decreased to 31.1% for the quarter ended September 30, 2015 compared with 32.9% in the prior year period. We had a favorable decrease of $6.7 million in disallowed revenue during the September 2015 quarter compared to the same period in the prior year. Excluding the effects of disallowed revenue, material costs decreased to 29.6% of adjusted gross revenue compared with 30.6% in the prior year period from a major vendor rebate of $0.5 million recorded in the third quarter of 2015. Material costs were also impacted by product mix and vendor rebates.
Personnel costs. Personnel costs for the three months ended September 30, 2015 increased $6.1 million, or 6.8% to $95.2 million from $89.1 million for the three months ended September 30, 2014. Personnel costs by operating segment were as follows:
|
|
|
For the Three Months Ended |
|
|
|
Percent |
| |||||
|
(dollars in millions) |
|
2015 |
|
2014 |
|
Change |
|
Change |
| |||
|
|
|
|
|
|
|
|
|
|
| |||
|
Patient Care |
|
$ |
83.3 |
|
$ |
76.9 |
|
$ |
6.4 |
|
8.3 |
% |
|
Products & Services |
|
11.9 |
|
12.2 |
|
(0.3 |
) |
(2.5 |
)% | |||
|
Personnel costs |
|
$ |
95.2 |
|
$ |
89.1 |
|
$ |
6.1 |
|
6.8 |
% |
|
|
|
|
|
|
|
|
|
|
| |||
|
Percent of net revenue |
|
34.6 |
% |
34.0 |
% |
|
|
|
| |||
|
Percent of adjusted gross revenue |
|
33.0 |
% |
31.6 |
% |
|
|
|
| |||
Patient Care personnel costs increased $6.4 million and Products & Services personnel costs declined $0.3 million for the three months ended September 30, 2015 compared with the three months ended September 30, 2014. Patient Care salaries, benefits and payroll taxes increased $1.8 million from additional administrative personnel, increased personnel related to acquisitions and an annual merit increase. Patient care temporary labor to focus on central revenue cycle management increased personnel costs $2.3 million in the third quarter of 2015 compared with the same prior year period and with bonuses and commissions increased $1.8 million. Products & Services bonus and commission expenses declined $0.5 million, partially offset by $0.2 million higher salaries, benefits and payroll taxes during the comparative periods.
Other operating costs. Other operating costs decreased $1.7 million to $32.9 million for the three months ended September 30, 2015 from $34.6 million for the three months ended September 30, 2014. Rent, utilities, occupancy and other costs increased $1.4 million for the three months ended September 30, 2015 compared to the same period in the prior year due to operating cost increases of clinics acquired offset by a $1.5 million third quarter 2014 property, plant and equipment impairment related to the shutdown of CARES that did not occur in 2015, and a decrease of $1.6 million in bad debt expense in the three months ended September 30, 2015 compared to the three months ended September 30, 2014.
General and administrative expenses. General and administrative expenses increased $7.9 million or 36.2% for the three months ended September 30, 2015 to $29.7 million from $21.8 million for the three months ended September 30, 2014. General and administrative personnel compensatory costs increased $4.8 million in the accounting and information technology departments, contract labor increased $0.5 million associated with our financial accounting remediation process, technology related expenses increased $1.5 million related to data warehouse software, and facilities and other office related costs increased $1.1 million for the three months ended September 30, 2015 compared to the three months ended September 30, 2014.
Professional accounting and legal fees. Professional accounting and legal fees decreased $11.7 million to $9.3 million for the three months ended September 30, 2015 from $21.0 million for the three months ended September 30, 2014. We recognized fees related to our audit in the year in which the audit services relate. The fees recorded for the audit of our 2015 financial statements as compared to our 2014 financial statements were $15.0 million lower. The fees for other professional accounting and legal services in connection with the financial accounting remediation and the Investigation were recognized at the time the services were provided. For the three months ended September 30, 2015 fees for other professional services were $3.3 million higher compared to the three months ended September 30, 2014.
Depreciation and amortization. Depreciation and amortization for the three months ended September 30, 2015 was $10.2 million, an increase of $0.4 million, or 4.1%, compared with $9.8 million for the three months ended September 30, 2014. Depreciation increase of leasehold improvements of $0.6 million from acquisitions was partially offset by lower machinery and equipment depreciation of $0.2 million in CARES that closed in 2015.
Impairment of intangible assets. We incurred a $0.8 million intangible asset impairment of our Therapeutic reporting unit’s indefinite life trade name in the third quarter of 2015. There was no impairment charge in the third quarter of 2014.
Income (loss) from operations. We had income from operations of $11.6 million for the three months ended September 30, 2015 compared to a loss from operations of $0.8 million for the three months ended September 30, 2014 from higher net revenue in the quarter and lower professional accounting and legal fees.
Interest expense, net. Interest expense increased to $7.4 million from $7.3 million for the three months ended September 30, 2015 compared with the three months ended September 30, 2014.
Provision (benefit) for income taxes. The provision for income taxes for the three months ended September 30, 2015 was $1.1 million, or 26.9% of income from continuing operations before taxes, compared to a benefit of $10.1 million, or 124.1% of loss from continuing operations before taxes for the three months ended September 30, 2014. The provision increase was largely driven by the change in income from continuing operations before taxes for the period, which increased from $8.1 million loss for the three months ended September 30, 2014 to income of $4.2 million for the three months ended September 30, 2015, combined with the decrease in estimated effected tax rate. The change in estimated effected tax rate was driven by increase in annual forecasted loss from continuing operations before taxes. The effective tax rate consists principally of the 35% federal statutory tax rate in addition to state income taxes, less permanent tax differences.
Income (loss) from discontinued operations, net of income taxes. Net loss for the discontinued Dosteon operations during the three months ended September 30, 2014 was $10.8 million. Dosteon operations were shut down or sold as of the end of the second quarter of 2015 and there was no income for the three months ended September 30, 2015.
Net income (loss). Net income for the three months ended September 30, 2015 was $3.1 million compared to a net loss of $8.8 million for the three months ended September 30, 2014 from higher net revenue and lower professional accounting and legal fees for the three months ended September 30, 2015.
Results of operations - three months ended December 31, 2015 compared to three months ended December 31, 2014
Net revenue. Net revenue for the three months ended December 31, 2015 increased $6.8 million to $285.7 million from $278.9 million for the three months ended December 31, 2014. Patient care segment net revenue increased $2.5 million, or 1.1% and Products & Services net revenue increased $4.3 million, or 9.5%.
|
|
|
For the Three Months Ended |
|
|
|
Percent |
| |||||
|
(dollars in millions) |
|
2015 |
|
2014 |
|
Change |
|
Change |
| |||
|
|
|
|
|
|
|
|
|
|
| |||
|
Patient Care |
|
$ |
236.1 |
|
233.6 |
|
$ |
2.5 |
|
1.1 |
% | |
|
Products & Services |
|
49.6 |
|
45.3 |
|
4.3 |
|
9.5 |
% | |||
|
Net revenue |
|
$ |
285.7 |
|
$ |
278.9 |
|
$ |
6.8 |
|
2.4 |
% |
Patient Care segment net revenue increase of $2.5 million included $8.4 million increase from same clinic net sales in the Hanger Clinic operations and $1.4 million revenue increase from acquisitions, partially offset by $3.9 million revenue reduction from the closure and consolidations of clinics and $3.4 million decreased net revenue from CARES for the three months ended December 31, 2015 compared to the three months ended December 31, 2014. Products & Services segment net revenue increased $4.3 million in the fourth quarter of 2015 including $3.6 million increase from distribution products and $0.7 million increase from therapeutic services.
Material costs. Material costs for the three months ended December 31, 2015 were $88.1 million, an increase of $1.7 million, or 2.0% from $86.4 million of material costs incurred for the three months ended December 31, 2014. Material costs by operating segment, after elimination of intersegment activity, were as follows:
|
|
|
For the Three Months Ended |
|
|
|
Percent |
| |||||
|
(dollars in millions) |
|
2015 |
|
2014 |
|
Change |
|
Change |
| |||
|
|
|
|
|
|
|
|
|
|
| |||
|
Patient Care |
|
$ |
69.0 |
|
$ |
71.0 |
|
$ |
(2.0 |
) |
(2.8 |
)% |
|
Products & Services |
|
19.1 |
|
15.4 |
|
3.7 |
|
24.0 |
% | |||
|
Material costs |
|
$ |
88.1 |
|
$ |
86.4 |
|
$ |
1.7 |
|
2.0 |
% |
|
|
|
|
|
|
|
|
|
|
| |||
|
Percent of net revenue |
|
30.8 |
% |
31.0 |
% |
|
|
|
| |||
|
Percent of adjusted gross revenue |
|
29.3 |
% |
29.0 |
% |
|
|
|
| |||
Material costs as a percentage of net revenue decreased to 30.8% for the quarter ended December 31, 2015 compared with 31.0% in the prior year period. We had a favorable decrease of $3.7 million in disallowed revenue during the December 2015 quarter compared to the same period in the prior year. Material costs increased to 29.3% of adjusted gross revenue compared with 29.0% in the prior year period when excluding disallowed revenue. Material costs were also impacted by product mix and vendor rebates.
Personnel costs. Personnel costs for the three months ended December 31, 2015 increased by $2.1 million, or 2.2% to $95.6 million from $93.5 million for the three months ended December 31, 2014. Personnel costs by operating segment were as follows:
|
|
|
For the Three Months Ended |
|
|
|
Percent |
| |||||
|
(dollars in millions) |
|
2015 |
|
2014 |
|
Change |
|
Change |
| |||
|
|
|
|
|
|
|
|
|
|
| |||
|
Patient Care |
|
$ |
81.5 |
|
$ |
81.5 |
|
$ |
— |
|
— |
% |
|
Products & Services |
|
14.1 |
|
12.0 |
|
2.1 |
|
17.5 |
% | |||
|
Personnel costs |
|
$ |
95.6 |
|
$ |
93.5 |
|
$ |
2.1 |
|
2.2 |
% |
|
|
|
|
|
|
|
|
|
|
| |||
|
Percent of net revenue |
|
33.5 |
% |
33.5 |
% |
|
|
|
| |||
|
Percent of adjusted gross revenue |
|
31.8 |
% |
31.4 |
% |
|
|
|
| |||
Patient Care segment personnel costs remained unchanged quarter over quarter. Patient care personnel costs were impacted by a decrease of $0.7 million from the shutdown of CARES. Excluding CARES, salaries, benefits and taxes increased $1.2 million of annual merit compensatory costs and bonus, commissions and other personnel costs decreased $0.9 million in the fourth quarter of 2015 versus same quarter in the prior year. Contract labor increased $0.4 million in support of increased accounts receivable collection efforts. Products & Services’ personnel costs increased $2.1 million including $1.8 million of increase in bonus and commission expenses and salaries, benefits, payroll taxes increasing $0.3 million in the fourth quarter of 2015.
Other operating costs. Other operating costs decreased $1.5 million, to $34.0 million for the three months ended December 31, 2015 from $35.5 million for the three months ended December 31, 2014. The shutdown of CARES decreased other operating costs in 2015 by $2.5 million. Other occupancy costs increased by $0.7 million and bad debt expense increased by $0.3 million for the three months ended December 31, 2015 compared to the same quarter in 2014.
General and administrative expenses. General and administrative expenses for the three months ended December 31, 2015 were $27.1 million compared with $22.2 million for the three months ended December 31, 2014, an increase of $4.9 million, or 22.1%. Personnel compensatory expenses increased $3.4 million in the fourth quarter of 2015 from additional personnel in accounting and information technology combined with an annual merit increase. Facilities, contract labor, office related and other related expenses were $1.5 million higher for the three months ended December 31, 2015 compared with the same quarter in the prior year.
Professional accounting and legal fees. Professional accounting and legal fees for the three months ended December 31, 2015 decreased $10.2 million to $9.6 million from $19.8 million for the three months ended December 31, 2014. Audit related expenses were recorded in the year in which the audit services relate and were $15.5 million lower in the three months ended December 31, 2015 compared to three months ended December 31, 2014. Fees for other professional accounting and legal firms who performed services in connection with the financial accounting remediation and the Investigation were recognized at the time the services were incurred. The fourth quarter 2015 fees were $5.3 million higher than the fees in the fourth quarter of 2014.
Depreciation and amortization. Depreciation and amortization for the three months ended December 31, 2015 was $16.0 million, an increase of $6.0 million from the $10.0 million for the three months ended December 31, 2014. Amortization of customer list intangibles increased $6.1 million primarily due to a change in the estimated useful lives in the fourth quarter of 2015 offset by $0.1 million decrease in other smaller items.
Impairment of intangible assets. Impairment of intangible assets was $385.0 million for the three months ended December 31, 2015 compared to $0.2 million for the three months ended December 31, 2014. In 2015, we recorded a goodwill impairment charge of $382.9 million related to our Patient Care reporting unit. Other intangible asset impairments of $2.1 million in 2015 and $0.2 million in 2014 related to our Therapeutic reporting unit’s indefinite life tradename. See Note H - “Goodwill and Other Intangible Assets” to our consolidated financial statements in this Annual Report on Form 10-K for additional information.
(Loss) income from operations. We had a loss from operations of $369.7 million for the three months ended December 31, 2015 compared to income from operations of $11.3 million for the three months ended December 31 2015 from the impairment of intangible assets partially offset by higher net revenue in the quarter and lower professional accounting and legal fees.
Interest expense, net. Interest expense increased to $8.0 million from $7.2 million for the three months ended December 31, 2015 compared with the three months ended December 31, 2014 from higher interest rates and increased borrowings on our revolving line of credit.
Extinguishment of debt. In conjunction with our bank credit facility refinancing in December 2015, we incurred a charge of $7.2 million related to the write-off existing debt issuance cost associated with previous credit agreements that was not incurred in 2014.
(Benefit) provision for income taxes. The benefit for income taxes for the three months ended December 31, 2015 was $69.8 million, or 18.1% loss from continuing operations before taxes, compared to a provision of $1.3 million, or 31.1% income from operations, for the three months ended December 31, 2014. The increased benefit was largely driven by the impact of impairment of intangible assets. The effective tax rate consists principally of the 35% federal statutory tax rate in addition to state income taxes, less permanent tax differences.
Loss from discontinued operations, net of income taxes. Net loss from discontinued Dosteon operations for the three months ended December 31, 2015 was $0.7 million compared to a net loss of $6.2 million for the three months ended December 31, 2014. The Dosteon operations were shut down or sold by the end of the second quarter of 2015, with $0.7 million of tax provision recorded in the three months ended December 31, 2015.
Net loss. For the three months ended December 31, 2015, we incurred a net loss of $315.8 million compared with a net loss of $3.4 million for the three months ended December 31, 2014 from an increase in impairment of intangible assets and extinguishment of debt expense, partially offset by lower professional accounting and legal fees.
Results of Operations - Year-to-Date Periods 2015 compared to 2014
Our year-to-date results of operations for 2015 and the comparative periods in 2014 were as follows:
|
|
|
For the Six Months Ended |
|
Percent |
|
For the Nine Months |
|
Percent |
| ||||||||
|
(dollars in millions) |
|
2015 |
|
2014 |
|
2015 v 2014 |
|
2015 |
|
2014 |
|
2015 v 2014 |
| ||||
|
|
|
|
|
|
|
|
|
|
|
|
|
|
| ||||
|
Net revenue |
|
$ |
506.3 |
|
$ |
471.5 |
|
7.4 |
% |
$ |
781.5 |
|
$ |
733.2 |
|
6.6 |
% |
|
Material costs |
|
162.7 |
|
151.7 |
|
7.3 |
% |
248.2 |
|
237.9 |
|
4.3 |
% | ||||
|
Personnel costs |
|
176.3 |
|
170.9 |
|
3.2 |
% |
271.5 |
|
260.0 |
|
4.4 |
% | ||||
|
Other operating costs |
|
74.0 |
|
66.7 |
|
10.9 |
% |
106.9 |
|
101.3 |
|
5.5 |
% | ||||
|
General and administrative expenses |
|
55.0 |
|
42.1 |
|
30.6 |
% |
84.7 |
|
63.9 |
|
32.6 |
% | ||||
|
Professional accounting and legal fees |
|
9.7 |
|
4.1 |
|
136.6 |
% |
19.0 |
|
25.1 |
|
(24.3 |
)% | ||||
|
Depreciation and amortization |
|
20.1 |
|
19.1 |
|
5.2 |
% |
30.3 |
|
28.9 |
|
4.8 |
% | ||||
|
Impairment of intangible assets |
|
— |
|
— |
|
— |
% |
0.8 |
|
— |
|
— |
% | ||||
|
Income from operations |
|
8.5 |
|
16.9 |
|
(49.7 |
)% |
20.1 |
|
16.1 |
|
24.8 |
% | ||||
|
|
|
|
|
|
|
|
|
|
|
|
|
|
| ||||
|
Interest expense, net |
|
14.5 |
|
13.9 |
|
4.3 |
% |
21.9 |
|
21.2 |
|
3.3 |
% | ||||
|
(Loss) income from continuing operations before income taxes |
|
(6.0 |
) |
3.0 |
|
(300.0 |
)% |
(1.8 |
) |
(5.1 |
) |
(64.7 |
)% | ||||
|
Provision for income taxes |
|
1.1 |
|
10.7 |
|
(89.7 |
)% |
2.2 |
|
0.6 |
|
266.7 |
% | ||||
|
Loss from continuing operations |
|
(7.1 |
) |
(7.7 |
) |
(7.8 |
)% |
(4.0 |
) |
(5.7 |
) |
(29.8 |
)% | ||||
|
(Loss) income from discontinued operations, net of income taxes |
|
(7.3 |
) |
0.9 |
|
(911.1 |
)% |
(7.3 |
) |
(9.9 |
) |
(26.3 |
)% | ||||
|
Net loss |
|
$ |
(14.4 |
) |
$ |
(6.8 |
) |
111.8 |
% |
$ |
(11.3 |
) |
$ |
(15.6 |
) |
(27.6 |
)% |
During these periods, our operating expenses as a percentage of net revenue were as follows:
|
|
|
For the Six Months Ended |
|
For the Nine Months |
| ||||
|
|
|
2015 |
|
2014 |
|
2015 |
|
2014 |
|
|
|
|
|
|
|
|
|
|
|
|
|
Material costs |
|
32.1 |
% |
32.2 |
% |
31.8 |
% |
32.4 |
% |
|
Personnel costs |
|
34.8 |
% |
36.2 |
% |
34.7 |
% |
35.5 |
% |
|
Other operating costs |
|
14.6 |
% |
14.1 |
% |
13.7 |
% |
13.9 |
% |
|
General and administrative expenses |
|
10.9 |
% |
8.9 |
% |
10.8 |
% |
8.7 |
% |
|
Professional accounting and legal fees |
|
1.9 |
% |
0.9 |
% |
2.4 |
% |
3.4 |
% |
|
Depreciation and amortization |
|
4.0 |
% |
4.1 |
% |
3.9 |
% |
3.9 |
% |
|
Impairment of intangible assets |
|
— |
% |
— |
% |
0.1 |
% |
— |
% |
|
Operating expenses |
|
98.3 |
% |
96.4 |
% |
97.4 |
% |
97.8 |
% |
Material costs, personnel costs and other operating costs reflect expenses we incur in connection with our delivery of care through our clinic locations and other patient care operations, or distribution of products and services, and exclude any expenses incurred in connection with general and administrative activities. General and administrative expenses reflect expenses we incur in the general management and administration of our businesses that are not directly attendant to our operation of our clinics or provision of products and services.
Due to the substantial expenses we incurred for professional accounting and legal services, we separately reflect this category. We have incurred increases in these expenses primarily in connection with the Restatement, the Investigation and in connection with our accounting and remediation activities associated with the material weaknesses. We currently anticipate that these expenses will remain significant at least through 2018.
In this financial report, impairment of intangible assets are separately stated. An asset impairment is recognized when the financial statement carrying amount of a long-lived asset or asset group exceed its fair value and is not recoverable. The significant decline in the trading value of our stock impaired assets in the Patient Care, Distribution and Therapeutic reporting units.
Due to the volatility of disallowed revenue experienced during the periods encompassed by this Annual Report on Form 10-K, to assist in evaluating the comparability of expense trends, the following table provides our adjusted gross revenue, disallowed revenue and net revenue for each year, as well as our expenses as a percentage of adjusted gross revenue:
|
|
|
For the Six Months Ended |
|
For the Nine Months |
| ||||||||
|
(dollars in millions) |
|
2015 |
|
2014 |
|
2015 |
|
2014 |
| ||||
|
|
|
|
|
|
|
|
|
|
| ||||
|
Net revenue |
|
$ |
506.3 |
|
$ |
471.5 |
|
$ |
781.5 |
|
$ |
733.2 |
|
|
Disallowed revenue |
|
32.3 |
|
43.6 |
|
45.5 |
|
63.5 |
| ||||
|
Adjusted gross revenue |
|
$ |
538.6 |
|
$ |
515.1 |
|
$ |
827.0 |
|
$ |
796.7 |
|
|
|
|
|
|
|
|
|
|
|
| ||||
|
Material costs |
|
30.2 |
% |
29.5 |
% |
30.0 |
% |
29.9 |
% | ||||
|
Personnel costs |
|
32.7 |
% |
33.2 |
% |
32.8 |
% |
32.6 |
% | ||||
|
Other operating costs |
|
13.8 |
% |
12.9 |
% |
13.0 |
% |
12.7 |
% | ||||
|
General and administrative expenses |
|
10.2 |
% |
8.2 |
% |
10.2 |
% |
8.0 |
% | ||||
|
Professional accounting and legal fees |
|
1.8 |
% |
0.8 |
% |
2.3 |
% |
3.2 |
% | ||||
|
Depreciation and amortization |
|
3.7 |
% |
3.7 |
% |
3.7 |
% |
3.6 |
% | ||||
|
Impairment of intangible assets |
|
— |
% |
— |
% |
0.1 |
% |
— |
% | ||||
|
Operating expenses |
|
92.4 |
% |
88.3 |
% |
92.1 |
% |
90.0 |
% | ||||
Results of operations - six months ended June 30, 2015 compared to six months ended June 30, 2014
Net revenue. Net revenue for the six months ended June 30, 2015 increased $34.8 million, or 7.4%, to $506.3 million from $471.5 million for the six months ended December 31 2014. Net revenue by operating segment, after elimination of intersegment activity was as follows:
|
|
|
For the Six Months Ended June 30, |
|
|
|
Percent |
| |||||
|
(dollars in millions) |
|
2015 |
|
2014 |
|
Change |
|
Change |
| |||
|
|
|
|
|
|
|
|
|
|
| |||
|
Patient Care |
|
$ |
414.1 |
|
$ |
387.3 |
|
$ |
26.8 |
|
6.9 |
% |
|
Products & Services |
|
92.2 |
|
84.2 |
|
8.0 |
|
9.5 |
% | |||
|
Net revenue |
|
$ |
506.3 |
|
$ |
471.5 |
|
$ |
34.8 |
|
7.4 |
% |
Patient Care segment net revenue increased $26.8 million, or a 6.9% increase to $414.1 million for the six months ended June 30, 2015 from $387.3 million for the six months ended June 30, 2014. Patient Care’s clinical operations increased $21.2 million in same clinic revenue and $9.8 million from acquisitions acquired in 2015, offset by a $1.8 million net revenue decline from Patient Care clinic closures and consolidations. CARES revenue decreased $2.4 million in the first six months of 2015 compared with the first six months of 2014. Products & Services segment net revenue increased $8.0 million or 9.5% to $92.2 million for the first six months of 2015 from $84.2 million in the first six months of 2014. The net revenue increased for Products & Services distribution products by $6.5 million and for therapeutic services by $1.5 million for the six months ended June 30, 2015.
Material costs. Material costs increased $11.0 million, or 7.3% to $162.7 million for the six months ended June 30, 2015 from $151.7 million for the six months ended June 30, 2014. Material costs by operating segment, after elimination of intersegment activity, were as follows:
|
|
|
For the Six Months Ended June 30, |
|
|
|
Percent |
| |||||
|
(dollars in millions) |
|
2015 |
|
2014 |
|
Change |
|
Change |
| |||
|
|
|
|
|
|
|
|
|
|
| |||
|
Patient Care |
|
$ |
127.8 |
|
$ |
121.5 |
|
$ |
6.3 |
|
5.2 |
% |
|
Products & Services |
|
34.9 |
|
30.2 |
|
4.7 |
|
15.6 |
% | |||
|
Material costs |
|
$ |
162.7 |
|
$ |
151.7 |
|
$ |
11.0 |
|
7.3 |
% |
|
|
|
|
|
|
|
|
|
|
| |||
|
Percent of net revenue |
|
32.1 |
% |
32.2 |
% |
|
|
|
| |||
|
Percent of adjusted gross revenue |
|
30.2 |
% |
29.5 |
% |
|
|
|
| |||
Material costs as a percentage of net revenue increased to 32.1% for the half year ended June 30, 2015 compared with 32.2% in the same prior year period. We had a favorable decrease of $11.3 million in disallowed revenue for the six months ended June 30, 2015 compared to the same period in the prior year. Excluding the effects of disallowed revenue, material costs increased to 30.2% of adjusted gross revenue compared with 29.5% in the prior year period. Material costs were also impacted by product mix and vendor rebates.
Personnel costs. Personnel costs for the six months ended June 30, 2015 increased by $5.4 million to $176.3 million from $170.9 million for the six months ended June 30, 2014. Personnel costs by operating segment were as follows:
|
|
|
For the Six Months Ended June 30, |
|
|
|
Percent |
| |||||
|
(dollars in millions) |
|
2015 |
|
2014 |
|
Change |
|
Change |
| |||
|
|
|
|
|
|
|
|
|
|
| |||
|
Patient Care |
|
$ |
153.1 |
|
$ |
147.2 |
|
$ |
5.9 |
|
4.0 |
% |
|
Products & Services |
|
23.2 |
|
23.7 |
|
(0.5 |
) |
(2.1 |
)% | |||
|
Personnel costs |
|
$ |
176.3 |
|
$ |
170.9 |
|
$ |
5.4 |
|
3.2 |
% |
|
|
|
|
|
|
|
|
|
|
| |||
|
Percent of net revenue |
|
34.8 |
% |
36.2 |
% |
|
|
|
| |||
|
Percent of adjusted gross revenue |
|
32.7 |
% |
33.2 |
% |
|
|
|
| |||
Personnel costs increased in the Patient Care segment for the six months ended June 30, 2015 by $5.9 million or 4.0% to $153.1 million from $147.2 million for the six months ended June 30, 2014. Temporary labor increased $4.4 million to improve our revenue cycle management and personnel compensatory costs increased $1.5 million from additional personnel and the compensatory costs of an annual merit increase. Personnel costs in the Products & Services segment for the six months ended June 30, 2015 decreased by $0.5 million or 2.1% to $23.2 million from $23.7 million for the first six months of 2014 from lower bonus expense.
Other operating costs. Other operating costs increased $7.3 million to $74.0 million for the six months ended June 30, 2015 from $66.7 million for the six months ended June 30, 2014. Bad debt expense increased $2.4 million for the first six months of 2015, consulting expenses increased $1.5 million related to revenue cycle management and a one-time $2.0 million early termination fee on leased equipment was incurred in the second quarter of 2015 related to the shutdown of CARES.
General and administrative expenses. For the six months ended June 30, 2015, general and administrative expenses were $55.0 million compared with $42.1 million for the six months ended June 30, 2014, an increase of $12.9 million, or 30.6%. Personnel compensatory costs including salaries, benefits, payroll taxes, commissions and bonuses increased $7.2 million from the hiring of additional personnel in accounting related to the remediation of material weaknesses, the hiring of additional personnel in information technology and an annual merit increase. Temporary labor increased $1.0 million in support of the 2014 financial restatement, office expenses, rent and occupancy costs increased $1.5 million and facilities and other office related costs increased $3.2 million for the first six months of 2015 compared to the first six months of 2014.
Professional accounting and legal fees. Professional accounting and legal fees were $9.7 million for the six months ended June 30, 2015 compared with $4.1 million for the six months ended June 30, 2014. The increase of $5.6 million related to the 2014 financial restatement as discussed in the “Effect of Delay in Financial Filings” section of the Management Discussion and Analysis. Fees from other professional accounting companies and legal firms in connection with the financial accounting and material weakness remediation were recognized in periods at the time the services were provided.
Depreciation and amortization. Depreciation and amortization for the six months ended June 30, 2015 was $20.1 million as compared to $19.1 million for the six months ended June 30, 2014, an increase of $1.0 million, or 5.2%. Depreciation and amortization increased $1.5 million in the clinic operations in the first half of 2015 compared to the first half of 2014 from clinic acquisitions. The shutdown of CARES in 2014 resulted in no related depreciation expense recorded in the first six months of 2015 compared to $1.3 million of CARES depreciation in the first half of 2014. Capitalized computer software and other lesser depreciable additions increased depreciation expense by $0.8 million for the six months ended June 30, 2015 compared with the same period in 2014.
Income from operations. Income from operations decreased $8.4 million to $8.5 million, for the six months ended June 30, 2015 compared to income from operations of $16.9 million for the six months ended June 30, 2014, from increased personnel expenses and professional accounting and legal fees related to the 2014 financial restatement and material weakness remediation.
Interest expense, net. Interest expense increased to $14.5 million from $13.9 million for the six months ended June 30, 2015 compared with the six months ended June 30, 2014 from increased revolving line of credit borrowings.
Provision for income taxes. The provision for income taxes for the six months ended June 30, 2015 was $1.1 million from continuing operations compared to a provision of $10.7 million from continuing operations for the six months ended June 30, 2014. The decrease in provision was largely driven by the impact of change in income from continuing operations before taxes, non-deductible expenses, change in uncertain tax positions and change in valuation allowance. The effective tax rate consists principally of the 35% federal statutory tax rate in addition to state income taxes, less permanent tax differences.
(Loss) income from discontinued operations, net of income taxes. The net loss from the discontinued Dosteon operations during the six months ended June 30, 2015 was $7.3 million, compared to a net income of $0.9 million during the six months ended June 30, 2014 related to disposal costs incurred to complete the sale and shutdown of Dosteon as of June 30, 2015.
Net loss. For the six months ended June 30, 2015, we incurred a net loss of $14.4 million compared with a net loss of $6.8 million for the six months ended June 30, 2014 from an increase in general and administrative expenses and professional accounting and legal fees incurred, both in connection with the 2014 financial restatement and material weakness remediation process.
Results of operations - nine months ended September 30, 2015 compared to nine months ended September 30, 2014
Net revenue. Net revenue for the nine months ended September 30, 2015 increased $48.3 million, or 6.6%, to $781.5 million from $733.2 million for the nine months ended September 30, 2014. Net revenue by operating segment, after elimination of intersegment activity was as follows:
|
|
|
For the Nine Months Ended |
|
|
|
Percent |
| |||||
|
(dollars in millions) |
|
2015 |
|
2014 |
|
Change |
|
Change |
| |||
|
|
|
|
|
|
|
|
|
|
| |||
|
Patient Care |
|
$ |
638.9 |
|
$ |
603.4 |
|
$ |
35.5 |
|
5.9 |
% |
|
Products & Services |
|
142.6 |
|
129.8 |
|
12.8 |
|
9.9 |
% | |||
|
Net revenue |
|
$ |
781.5 |
|
$ |
733.2 |
|
$ |
48.3 |
|
6.6 |
% |
Patient Care segment net revenue increased $35.5 million or 5.9% to $638.9 million for the nine months ended September 30, 2015 from $603.4 million for the nine months ended September 30, 2014. The increase included $34.1 million of additional same clinic net revenue and $11.7 million of increased revenue generated from new clinics acquired in 2014 and the first quarter of 2015, partially offset with net revenue decreases including $4.7 million from closures and consolidations of lower performing clinics, $5.0 million lower revenue in CARES, $0.3 million decline in network contract management revenue and other revenue decreases of $0.3 million. Products & Services segment net revenue increased $12.8 million or 9.9% to $142.6 million from $129.8 million for the first nine months of 2015 compared to the first nine months of 2014. The increase included $9.7 million from distribution products and $3.1 million from the therapeutic services.
Material costs. For the nine months ended September 30, 2015, material costs were $248.2 million as compared with $237.9 million for the nine months ended September 30, 2014, an increase of $10.3 million or 4.3%. Material costs by operating segment, after elimination of intersegment activity, were as follows:
|
|
|
For the Nine Months Ended |
|
|
|
Percent |
| |||||
|
(dollars in millions) |
|
2015 |
|
2014 |
|
Change |
|
Change |
| |||
|
|
|
|
|
|
|
|
|
|
| |||
|
Patient Care |
|
$ |
193.4 |
|
$ |
189.5 |
|
$ |
3.9 |
|
2.1 |
% |
|
Products & Services |
|
54.8 |
|
48.4 |
|
6.4 |
|
13.2 |
% | |||
|
Material costs |
|
$ |
248.2 |
|
$ |
237.9 |
|
$ |
10.3 |
|
4.3 |
% |
|
|
|
|
|
|
|
|
|
|
| |||
|
Percent of net revenue |
|
31.8 |
% |
32.4 |
% |
|
|
|
| |||
|
Percent of adjusted gross revenue |
|
30.0 |
% |
29.9 |
% |
|
|
|
| |||
Material costs as a percentage of net revenue decreased to 31.8% for the nine months ended September 30, 2015 compared with 32.4% in the prior year period. We had a favorable decrease of $18.0 million in disallowed revenue during the first nine months of 2015 compared to the same period in the prior year. Excluding the effects of disallowed revenue, material costs increased to 30.0% of adjusted gross revenue compared with 29.9% in the prior year period. Material costs were also impacted by product mix and vendor rebates.
Personnel costs. Personnel costs for the nine months ended September 30, 2015 increased by $11.5 million or 4.4% to $271.5 million from $260.0 million for the nine months ended September 30, 2014. Personnel costs by operating segment were as follows:
|
|
|
For the Nine Months Ended |
|
|
|
Percent |
| |||||
|
(dollars in millions) |
|
2015 |
|
2014 |
|
Change |
|
Change |
| |||
|
|
|
|
|
|
|
|
|
|
| |||
|
Patient Care |
|
$ |
236.4 |
|
$ |
224.1 |
|
$ |
12.3 |
|
5.5 |
% |
|
Products & Services |
|
35.1 |
|
35.9 |
|
(0.8 |
) |
(2.2 |
)% | |||
|
Personnel costs |
|
$ |
271.5 |
|
$ |
260.0 |
|
$ |
11.5 |
|
4.4 |
% |
|
|
|
|
|
|
|
|
|
|
| |||
|
Percent of net revenue |
|
34.7 |
% |
35.5 |
% |
|
|
|
| |||
|
Percent of adjusted gross revenue |
|
32.8 |
% |
32.6 |
% |
|
|
|
| |||
Patient Care segment increased $12.3 million, a 5.5% increase to $236.4 million for nine months ended September 30, 2015 from $224.1 million for nine months ended September 30, 2014. Personnel compensatory costs including salaries, benefits, payroll taxes, commissions and bonuses increased $5.6 million from the hiring of additional personnel in accounting related to the remediation of material weaknesses, the hiring of additional personnel in information technology and an annual merit increase. Temporary labor increased $6.7 million in support of the 2014 financial restatement and material weakness remediation and for increased levels of patient documentation and related claims processing activity for the first nine months of 2015 compared to the first nine months of 2014. Products & Services segment personnel costs were $0.8 million lower the first nine months of 2015 compared to same period in the prior year from a decline in bonus expense and commissions for the nine months ended September 30, 2015 compared to the same period in the prior year.
Other operating costs. Other operating costs, which are composed primarily of facility costs, bad debt expense and office-related expenses, increased $5.6 million, or 5.5% to $106.9 million for the nine months ended September 30, 2015 from $101.3 million for the nine months ended September 30, 2014. Bad debt expense increased $0.8 million to $9.9 million from $9.1 million, professional fees increased $3.0 million to reverse adverse bad debt and disallowed revenue trends and other operating expenses including rent, travel, occupancy costs and professional education increased $3.3 million, partially offset by CARES shutdown related property plant and equipment impairment charge of $1.5 million in the first nine months of 2014 that did not reoccur in the first nine months ended September 30, 2015.
General and administrative expenses. General and administrative expenses increased $20.8 million or 32.6% to $84.7 million for the nine months ended September 30, 2015 from $63.9 million for the nine months ended September 30, 2014. Personnel compensatory costs including salaries, benefits, payroll taxes, commissions and bonuses increased $7.1 million from the hiring of additional personnel in accounting related to the remediation of material weaknesses, the hiring of additional personnel in information technology and an annual merit increase. Temporary labor increased $1.5 million in support of the 2014 financial restatement, increased technology costs of $2.2 million with the implementation of the new patient and electronic health record system, $5.0 million higher commissions and bonus expense, $1.8 million of increased professional fees, rent and other occupancy costs and $3.2 million increased facilities and other office related expenses.
Professional accounting and legal fees. Professional accounting and legal fees were $19.0 million for the nine months ended September 30, 2015 compared with $25.1 million for the nine months ended September 30, 2014, a decrease of $6.1 million. We recognize audit fees in the year in which the audit services relate. The cost of the 2015 audit was $14.7 million lower than the cost of the 2014 financial restatement audit. The fees for other professional accounting and legal firms who performed services in connection with the financial accounting remediation and the Investigation were recognized at the time the services were provided increased $8.6 million for the nine months ended September 30, 2015 compared with the nine months ended September 30, 2014.
Depreciation and amortization. Depreciation and amortization for the nine months ended September 30, 2015 was $30.3 million, an increase of $1.4 million, or 4.8%, from $28.9 million for the nine months ended September 30, 2014. Acquisitions completed in 2014 and the first quarter of 2015 coupled with the implementation of a new electronic health and record management system increased depreciation expense $3.3 million in the nine months ended September 30, 2015 compared with the same prior year period. The increase in depreciation and amortization was partially offset by $1.9 million of lower depreciation recorded in the first nine months of 2015 related to the shutdown of CARES.
Impairment of intangibles. Impairment of intangible assets of $0.8 million for the nine months ended September 30, 2015 related to the impairment of our Therapeutic reporting unit’s indefinite life trade name. No impairment of intangible assets was recorded for the nine months ended September 30, 2014.
Income from operations. Income from operations increased $4.0 million, to $20.1 million for the nine months ended September 30, 2015 compared to $16.1 million for the nine months ended September 30, 2014 from higher revenue partially offset by higher operating costs and decreased professional accounting and legal fees.
Interest expense, net. Interest expense increased to $21.9 million from $21.2 million for the nine months ended September 30, 2015 compared with the nine months ended September 30, 2014 from increased revolving line of credit borrowings.
Provision for income taxes. A provision for income taxes for the nine months ended September 30, 2015 was $2.2 million from continuing operations, compared to a provision of $0.6 million for the nine months ended September 30, 2014. The increase of the provision was largely driven by the impact of non-deductible expenses, change in uncertain tax positions and change in valuation allowance. The effective tax rate consists principally of the 35% federal statutory tax rate in addition to state income taxes, less permanent tax differences.
Loss from discontinued operations, net of income taxes. For the nine months ended September 30, 2015, the net loss from the discontinued Dosteon operations was $7.3 million, compared with a net loss of $9.9 million for the nine months ended September 30, 2014. The Dosteon business was completely sold or shut down as of June 30, 2015.
Net loss. For the nine months ended September 30, 2015, we incurred a net loss of $11.3 million compared with a net loss of $15.6 million for the nine months ended September 30, 2014 from higher revenue partially offset by higher operating costs and decreased professional accounting and legal fees.
Liquidity and Capital Resources
In this section, we provide a discussion of our liquidity and capital resources as of December 31, 2016 and December 31, 2015. Due to the passage of time since December 31, 2016, we additionally provide information regarding our liquidity as of September 30, 2017.
Liquidity and Capital Resources as of December 31, 2016 and 2015
In 2015 and 2016, due primarily to our inability to meet financial reporting covenant requirements within our Credit Agreement and Senior Notes Indenture, as well as other difficulties we encountered in meeting certain other financial covenants within those agreements, in order to maintain sufficient liquidity to operate through continued access to our revolving credit facility and to remedy or avoid defaults under our credit agreements, it became necessary that we enter into a series of nine amendments and waivers with our lenders. These modifications to our agreements, and other information regarding our indebtedness and our liquidity is provided in Note N - “Long-Term Debt” to our consolidated financial statements in this Annual Report on Form 10-K.
Liquidity
To provide cash for our operations and capital expenditures, our immediate source of liquidity is our cash and investment balances and any amounts we have available for borrowing under our revolving credit facility. We refer to the sum of these two amounts as our “liquidity.” Our credit agreements define cash and cash equivalents available to us in our bank accounts which differs from our financial statement presentation. If we are not compliant with our debt covenants in any period, absent a waiver or amendment of our Credit Agreement, we may be unable to access funds in our revolving credit facility. As discussed below, during 2015 and 2016, due to the issues we encountered in preparing and issuing our financial statements, and other factors, our lenders, with our agreement, decreased the size of our available revolving credit facility by $99.0 million, which had a significant bearing on our overall liquidity. The nature of this decrease and our corresponding management of our liquidity are discussed below.
As of December 31, 2014, we had liquidity of $138.1 million, which was comprised of cash of $11.7 million and revolver availability of $126.4 million, under our $200.0 million revolving credit facility. During 2015, due to the financial statement and related covenant issues described above, our lenders, with our agreement, reduced the size of our total revolving credit facility from $200.0 million to $146.3 million, which had the effect of reducing our liquidity by $53.7 million. Our net uses
of cash during the year also contributed to further reductions in our liquidity during 2015. While we produced $57.3 million of net cash from operating activities, we utilized $35.2 million for capital expenditures and other investing activities, and $37.0 million for reductions in our long-term term indebtedness, payments to lenders and other non-revolver related financing activities, and increased our letters of credit by $0.7 million. The net effect of these items was a further net reduction of $15.6 million in our liquidity. In total, due to the reduction in the size of our revolving facility and the net effect of our operating, investing and financing activities, our liquidity declined by $69.3 million during 2015, to $68.8 million. This was comprised of $58.8 million in cash and cash equivalents and $10.0 million of available capacity under our revolving credit facility.
In 2016, our liquidity increased by $33.3 million from $68.8 million to $102.1 million. In the aggregate, this improvement in liquidity was the result of an increase in net proceeds from our long-term indebtedness of $44.6 million, which was partially offset by $11.3 million in net cash flows from operating activities, investing activities, debt issuance costs and fees and further reductions in the borrowing capacity under our revolving credit facility. More specifically, excluding the proceeds from our long-term indebtedness, the $33.3 million net increase in liquidity was comprised of $68.8 million in operating cash flow (of which $34.1 million related to net refunds of previously remitted federal taxes) offset by a further reduction of $45.3 million in the total available size of our revolving credit facility, $17.2 million in capital expenditures and other investing activities, the payment of $15.8 million in debt issuance costs and fees and a $1.8 million increase in our outstanding letters of credit. Our resulting liquidity of $102.1 million as of December 31, 2016, was comprised of $7.2 million in cash and cash equivalents, and $94.9 million in available borrowing capacity under our reduced $101.0 million total revolving facility.
We discuss the sufficiency of our liquidity to fund our future operations and capital needs in the “Planned Re-Financing, Liquidity Outlook and Going Concern Evaluation” section provided below.
Working Capital and Days Sales Outstanding
At December 31, 2016, we had working capital of $55.0 million, which compared to $139.8 million and $75.2 million as of December 31, 2015 and December 31, 2014, respectively. Our working capital decreased $84.8 million in 2016 compared to 2015 due to several factors, including the reduction in cash of $51.6 million primarily due to repayments of long-term debt and a reduction in our accounts receivable of $30.0 million. The decrease in accounts receivable was primarily the result of improved rates of collection, increases in our coordination of collections efforts on accounts receivable through our use of our newly established revenue cycle management group and through the remediation of issues we had encountered in our implementation of the patient management and electronic health record system.
With respect to our current liabilities, as of December 31, 2016, we had $79.0 million in accrued expenses and other current liabilities, which compares with $79.9 million as of December 31, 2015. This relates primarily to a decrease in accrued professional fees and other current liabilities of $8.0 million, partially offset by an increase in patient prepaid deposits and refunds of $4.7 million and an increase in insurance accruals of $2.4 million.
Our working capital increased by $64.6 million in 2015 compared to 2014, driven primarily by an increase in cash of $47.1 million and an increase in income tax receivables of $34.7 million. The increase in cash resulted primarily from a $27.9 million decrease in acquisitions and an increase in current liabilities of $7.0 million.
Days sales outstanding (“DSO”) is a calculation that approximates the average number of days between the billing for our services and the date of our receipt of payment, which we estimate using a 90 day rolling period of net revenue. This computation can provide a relative measure of the effectiveness of our billing and collections activities. As of December 31, 2016, 2015 and 2014, our DSO was 46, 55 and 54 days, respectively. The DSO reduction of nine days from 2015 to 2016 primarily related to changes in our management of accounts receivable through our increased centralization of our revenue cycle management responsibilities, and the positive effects resulting from our remediation of issues we encountered in 2014 relating to the implementation of our new patient management and electronic health record system.
Sources and Uses of Cash
Cash flows provided by operating activities increased $11.5 million, or 20.1%, from $57.3 million for the year ended December 31, 2015 to $68.8 million for the year ended December 31, 2016. This was due to an increase in the amount of cash provided by working capital in 2016 compared to 2015 with improved accounts receivable balances.
Cash flows used in investing activities decreased $18.0 million, or 51.1%, from $35.2 million for the year ended December 31, 2015 to $17.2 million for the year ended December 31, 2016. This decrease included $6.5 million decline in purchases of property, plant and equipment, a decrease in net cash expended on acquisitions of $10.2 million, and a $1.3 million net decrease in other investing activities.
Cash flows used in financing activities for the year ended December 31, 2016 totaled $103.2 million. On August 31, 2016, we used approximately $205.3 million of proceeds from the a new Term B Credit Agreement and existing cash on hand to (i) redeem $200.0 million of Senior Notes, (ii) to pay down approximately $81.0 million outstanding under the revolving credit facility and (iii) to pay approximately $7.9 million of Term B issuance costs and bank consent fees. This compares with a net cash flows provided by financing activities of $24.9 million for the year ended December 31, 2015 from additional borrowings under our revolving credit facility.
Cash flows provided by operating activities increased $7.7 million, or 15.5%, from $49.6 million for the year ended December 31, 2014 to $57.3 million for the year ended December 31, 2015.
Cash flows used in investing activities decreased $31.3 million, or 47.1%, from $66.5 million for the year ended December 31, 2014 to $35.2 million for the year ended December 31, 2015. This decrease related primarily to fewer acquisitions in 2015 compared to 2014.
Cash flows provided by financing activities decreased $2.0 million, or 7.4%, from $26.9 million for the year ended December 31, 2014 to $24.9 million for the year ended December 31, 2015.
Effect of Indebtedness
Under the Credit Agreement we are subject to a number of covenants, including covenants that (i) limit the relative amount of our debt as compared to Adjusted EBITDA (a “leverage ratio” limitation); (ii) provide a minimum threshold for our Adjusted EBITDA relative to our interest expense (an “interest coverage ratio” minimum); and (iii) require us to provide audited financial statements for year ended December 31, 2017 by March 31, 2018. Due to the Restatement and our efforts to remediate misstatements we have detected in our financial records and reports, and to otherwise address our accounting policies and material weaknesses in controls, we have been significantly delayed in the timeliness of our financial reporting. After the filing of this report relating to the years ended December 31, 2015 and December 31, 2016, it will be necessary for us to prepare and provide to our lenders the audited financial statements for the year ended December 31, 2017 prior to March 31, 2018 in order to be in compliance with this financial reporting covenant. In the event that we are unable to do so, the agreement provides for a thirty-day cure period which would expire on April 30, 2018, at which time we would have an event of default under our Credit Agreement. Should we fail to deliver those audited financial statements by that date, in accordance with their rights and remedies under the Credit Agreement, a majority of the holders of our debt would have the right to accelerate the maturity of our indebtedness.
As disclosed in Note N - “Long-Term Debt,” from January 1, 2015 through December 31, 2016, we have entered into seven agreements related to our Credit Agreement that waived certain actual or potential defaults and amended various covenants and other provisions. We additionally entered into two supplemental indentures relating to our then outstanding Senior Notes. Amongst other actual or potential defaults, these waivers, amendments and supplemental indentures addressed our continuing failure to be timely in our financial statements at the times that they were entered into. To date, lenders have been willing to accommodate our filing delays and other covenant issues. Nevertheless, we have found it necessary to compensate our lenders for certain of these amendments and waivers through the payment of consent fees and increases in the rates of our interest. In securing these amendments and waivers relating to the Credit Agreement and the Senior Notes Indenture, we have paid $10.4 million of fees in 2016 and $6.1 million of fees in 2015 to respective lenders and Senior Note holders. Please refer to Note N - “Long-Term Debt” to our consolidated financial statements in this Annual Report on Form 10-K for further information regarding the individual waivers and amendments and the composition of fees we paid in connection with our securing these agreements.
We are currently in the process of refinancing the amounts outstanding under the Credit Facility and repaying the $280.0 million Term Loan B indebtedness, which would otherwise mature on August 1, 2019. As a part of this refinancing, our new indebtedness is currently being structured as a $505.0 million term loan and $100.0 million revolving credit facility. This refinancing would also extend the financial reporting requirement relating to delivery of our audited financial statements for
the year ended December 31, 2017 until July 1, 2018 and would contain affirmative and negative covenants that we believe are usual and customary for a credit agreement. We currently expect to consummate this financing late in the first quarter of 2018. We cannot give assurance that the refinancing will be completed on its currently structured terms, on favorable terms or at all.
The Credit Agreement matures in accordance with its terms on June 17, 2018 and our indebtedness under the Term B Credit Agreement becomes due and payable on August 1, 2019. Due to our current position as a delayed filer of financial statements, these instruments bear rates of interest that we do not believe would constitute market rates of interest once we achieve current filing status. As of January 1, 2017, the facilities under the Credit Agreement were subject to a LIBOR margin of 5.25% per annum or a base rate margin of 4.25% per annum. Those rates of interest increased by the terms of the Agreement to a LIBOR margin of 5.75% or a base rate margin of 4.75% per annum effective on July 1, 2017. Interest on the Term B Credit Agreement bears interest of 11.5% per annum. For additional information, refer to Note N - “Long-Term Debt” to our consolidated financial statements in this Annual Report on Form 10-K. As discussed below and in those notes to our financial statements, upon the filing of this report, it is our current intention to commence the refinancing of these instruments.
If we are unsuccessful in (a) completing the refinancing by April 30, 2018, (b) delivering the 2017 audited financial statements to the existing lenders by that date, or (c) obtaining a waiver to the related debt covenant by that date, it could have a material adverse effect on our business, financial condition and operating results.
Liquidity and Availability of Capital as of September 30, 2017
Due to the passage of time since December 31, 2016, we have provided the additional disclosure regarding our current liquidity in this section of our Management’s Discussion and Analysis.
Current Liquidity and Capital Obligations
At September 30, 2017 we had total liquidity of $57.0 million, which reflected a decrease of $45.1 million, from the $102.1 million in liquidity we had as of December 31, 2016. Our liquidity at September 30, 2017 was comprised of cash and cash equivalents of $0.5 million and $56.5 million in available borrowing capacity under our $97.6 million revolving credit facility. This decrease in liquidity primarily relates to our repayment of $24.9 million in long-term indebtedness, capital expenditures and other investing activities of $13.2 million, payments of costs and fees to lenders of $1.2 million and a decrease in our revolver capacity of $3.4 million. Additionally we had a net use of approximately $2.4 million in cash flow from operating activities during the first nine months of 2017. Our cash flow from operating activities has been affected in the first nine months of 2017 due to our payment of third party professional fees incurred in our financial statement remediation activities, higher interest expense arising from the August 2016 amendments to our Credit Facility and issuance of Term B indebtedness and other seasonal and working capital related factors.
In addition to our typical requirements for operating capital and capital expenditures, in the period subsequent to December 31, 2016, we have continued to expend a significantly increased amount of professional accounting and legal fees related to the remediation of our financial statements and legal activities incurred in connection with the Restatement. For the years ended December 31, 2016 and December 31, 2015, we paid $47.9 million and $26.0 million, respectively, in professional accounting and legal fees related to these activities. During 2017 and 2018, to meet our financial reporting obligations, we believe it likely that we will continue to incur substantial fees for these services in connection with our financial statement preparation. We currently estimate that our cash payments for these professional fees during 2017 will be approximately $38.0 million.
Due to the substantial costs of the professional accounting and legal fees that we have been incurring, and anticipate continuing to incur, in connection with our financial reporting remediation activities, and due to the status of our covenant compliance with our lenders, we halted our acquisition activity after the first quarter of 2015. As of the date of this report, we do not currently have any pending acquisitions for which we anticipate the need to expend capital.
Our capital expenditures are primarily comprised of the replacement of furniture, fixtures and equipment in our clinics and other facilities, the construction of leasehold improvements, and the purchase of computer equipment and related software. In 2018, to replace certain older equipment reaching the end of its useful life, we currently believe that it may be necessary for us to expend amounts additional to our normal levels in connection with the purchase of replacement therapeutic
equipment for use in our therapy business in the approximate amount of $7.4 million. We may choose to delay or defer these or other capital expenditures in the event that business or financial conditions warrant.
Planned Re-Financing, Liquidity Outlook and Going Concern Evaluation
Our Credit Facility, which had $180.0 million in principal outstanding at December 31, 2016, matures on June 17, 2018. Given that we do not produce operating cash flow sufficient to retire this obligation through cash sources arising from our normal operations, it will be necessary for us to raise new indebtedness to repay the $143.4 million in remaining principal amount that will become due as of the maturity date, any borrowings under our revolving credit commitment outstanding at that time, and any associated fees and expenses associated with the new borrowings. At December 31, 2017, we had borrowings of $5.0 million outstanding and remaining availability of $86.4 million under the revolving credit commitment of our Credit Facility. Our ability to continue as a going concern is dependent on our ability to refinance such debt.
Additionally, our existing Credit Agreement requires that we provide lenders with our audited financial statements for the year ended December 31, 2017 no later than March 31, 2018. In the event that we are unable to do so, the agreement provides for a thirty-day cure period which would expire on April 30, 2018, at which time we would have an event of default under our Credit Agreement. Should we fail to deliver those audited financial statements by that date, in accordance with their rights and remedies under the Credit Agreement, a majority of the holders of our debt would have the right to accelerate the maturity of our indebtedness.
We are currently in the process of refinancing the amounts outstanding under our Credit Facility as well as the $280 million Term Loan B indebtedness, which would otherwise mature on August 1, 2019. As part of this refinancing, our new indebtedness is being structured as a $505.0 million term loan and $100.0 million revolving credit facility. This financing would extend the financial reporting requirement relating to delivery of our audited financial statements for the year ended December 31, 2017 until July 1, 2018, and would contain affirmative and negative covenants that we believe are usual and customary for a credit agreement. We currently expect to consummate this financing late in the first quarter of 2018. We cannot give assurance that the refinancing will be completed on its currently structured terms.
We have had a history of refinancing our debt including as recently as August 2016 in which we issued $280.0 million of Term B debt to refinance our existing Senior Notes and to pay down on our revolving credit facility. This history, coupled with our relative level of indebtedness to cash flows which will enable us to service the debt we intend to issue has led us to conclude that the successful completion of our refinancing is probable.
ASU 2014-15 Disclosure of Uncertainties about an Entity’s Ability to Continue as a Going Concern requires that we evaluate whether there is substantial doubt about our ability to meet our financial obligations when they become due during the twelve month period from the date these financial statements are available to be issued. Given that we do not believe we will have access to sufficient cash from our operating sources to meet our maturing debt obligation under our Credit Facility, we must then evaluate whether our planned refinancing is probable of being executed prior to our Credit Facility maturity date, and if executed, that such refinancing is probable of mitigating such substantial doubt. We have performed such an evaluation and based on the results of that assessment we believe it is probable that our plan for the refinancing of our indebtedness will be effectively executed late in the first quarter of 2018 which therefore mitigates the relevant conditions or events that raise substantial doubt regarding our ability to continue as a going concern within one year of the date the financial statements are issued.
If we are unsuccessful in (a) completing the refinancing by April 30, 2018, (b) delivering the 2017 audited financial statements to the existing lenders by that date, or (c) obtaining a waiver to the related debt covenant by that date, it could have a material adverse effect on our business, financial condition and operating results.
Off-Balance Sheet Arrangements
We have no off-balance sheet arrangements that may or could have a current or future material effect on our financial condition, revenues or expenses, results of operations, liquidity, capital expenditures or capital resources, except for $6.1 million of letters of credit outstanding as of December 31, 2016.
Contractual Obligations
The following table sets forth our contractual obligations and commercial commitments as of December 31, 2016 for each of the indicated periods:
|
(in thousands) |
|
2017 |
|
2018 |
|
2019 |
|
2020 |
|
2021 |
|
Thereafter |
|
Total |
| |||||||
|
Debt |
|
$ |
34,472 |
|
$ |
155,749 |
|
$ |
285,294 |
|
$ |
1,961 |
|
$ |
1,209 |
|
$ |
10,670 |
|
$ |
489,355 |
|
|
Interest payments on debt (1) |
|
45,215 |
|
38,936 |
|
18,128 |
|
1,776 |
|
1,536 |
|
6,064 |
|
111,655 |
| |||||||
|
Operating leases |
|
39,581 |
|
32,507 |
|
25,192 |
|
17,226 |
|
11,556 |
|
16,147 |
|
142,209 |
| |||||||
|
Other obligations (2) |
|
7,034 |
|
6,379 |
|
3,124 |
|
2,093 |
|
2,062 |
|
11,813 |
|
32,505 |
| |||||||
|
Total contractual cash obligations |
|
$ |
126,302 |
|
$ |
233,571 |
|
$ |
331,738 |
|
$ |
23,056 |
|
$ |
16,363 |
|
$ |
44,694 |
|
$ |
775,724 |
|
(1) Interest projections were based on the assumptions that the future interest rate for the Revolving Credit Facility and Term Loan will remain at the current rate of 6.02%.
(2) Other long-term obligations include commitments under our SERP plan, a non-cancellable purchase commitment related to our Southern Prosthetic Supplies (“SPS”) subsidiary and IT related and telephone contracts. Refer to Note K - “Employee Benefits” for additional disclosure on the SERP plan and Note Q - “Commitments and Contingent Liabilities” for additional disclosure on the SPS non-cancellable purchase commitment to our consolidated financial statements in this Annual Report on Form 10-K.
Dividends
It is our policy to not pay cash dividends on our common stock, and given our capital needs we currently do not foresee a change in this policy. Certain of our agreements relating to indebtedness limit our ability to pay dividends, and we currently anticipate that these restrictions will continue to exist in future agreements that we may enter.
Supplemental Executive Retirement Plan (DB SERP)
In 2004, we implemented an unfunded noncontributory defined benefit plan that covers certain of our current and former senior executives (“DB SERP”). We have engaged an actuary to calculate the benefit obligation and net benefits cost as of December 31, 2016, 2015 and 2014 and utilized such to establish our benefit obligation liability.
The following weighted average assumptions were used to determine the benefit obligation and net benefit cost at December 31:
|
|
|
2016 |
|
2015 |
|
2014 |
|
2013 |
|
|
Discount rate |
|
3.54 |
% |
3.64 |
% |
3.34 |
% |
4.03 |
% |
|
Average rate of increase in compensation |
|
3.00 |
% |
3.00 |
% |
3.00 |
% |
3.00 |
% |
The discount rate at December 31, 2016 of 3.54% decreased 0.10 basis points compared to the discount rate used at December 31, 2015 due to changes in the pension discount curve rate available on the open market at December 31, 2015. The discount rate at December 31, 2015 of 3.64% increased 0.30 basis points compared to the 3.34% used at December 31, 2014 due to changes in the pension discount curve rate available on the open market at December 31, 2014. The average rate of increase in compensation was 3.00% at December 31, 2016, 2015 and 2014.
Future payments under the DB SERP as of December 31, 2016 are as follows:
|
(in thousands) |
|
|
| |
|
2017 |
|
$ |
1,913 |
|
|
2018 |
|
1,913 |
| |
|
2019 |
|
1,913 |
| |
|
2020 |
|
1,913 |
| |
|
2021 |
|
1,913 |
| |
|
Thereafter |
|
11,739 |
| |
|
|
|
$ |
21,304 |
|
ITEM 7A. QUANTITATIVE AND QUALITATIVE DISCLOSURES ABOUT MARKET RISK
Our future financial results are subject to a variety of risks, including interest rate risk. As of December 31, 2016, the interest expense arising from the $180.0 million of outstanding borrowings under both our term loan facility under our Credit Agreement and our revolving credit facility under our Credit Agreement was subject to variable interest rates, partially offset by interest income subject to variable interest rates generated from our $7.2 million of cash equivalents as of that date. As of December 31, 2016, we had $309.4 million of fixed rate debt which included subordinated Seller Notes and Financing Leases.
Set forth below is an analysis of our financial instruments as of December 31, 2016 that were sensitive to changes in interest rates. The table demonstrates the changes in estimated annual cash flow related to the outstanding balance under the revolving and term loan facilities, calculated for an instantaneous shift in interest rates, plus or minus 50 BPS, 100 BPS and 150 BPS. As of December 31, 2016, the interest rate on the revolving and term loan facilities was 5.52% based on a LIBOR rate of .77% and the applicable margin of 4.75%.
|
Cash Flow Risk |
|
Annual Interest Expense Given an |
|
No Change in |
|
Annual Interest Expense Given an |
| ||||||||
|
(in thousands) |
|
(150 BPS) |
|
(100 BPS) |
|
(50 BPS) |
|
|
|
50 BPS |
|
100 BPS |
|
150 BPS |
|
|
Term Loan and Revolver |
|
8,550 |
(a) |
8,550 |
(a) |
9,036 |
|
9,936 |
|
10,836 |
|
11,736 |
|
12,636 |
|
(a) The term loan facility and the revolving credit facility under our Credit Agreement are subject to a LIBOR margin of 4.75%, which will serve as the floor on the applicable interest rate.
In August 2016, we entered into the Term B Credit Agreement by and among the various lenders party thereto and Wilmington Trust, National Association, as administrative agent, which provides for a $280.0 million senior unsecured term loan facility under which all outstanding principal is due at maturity on August 1, 2019 and all borrowings bear interest at a fixed rate per annum equal to 11.50% payable quarterly in arrears. Additionally, we have entered into multiple amendments and waivers to our Credit Agreement, the most recent of which is the Sixth Amendment and Waiver, dated June 22, 2017. At the closing of the Term B Credit Agreement, the weighted average interest rate on the term loan facility and revolving facility under our Credit Agreement was 5.27% based on a weighted average LIBOR rate of 0.52% and the applicable margin of 4.75%.
ITEM 8. FINANCIAL STATEMENTS AND SUPPLEMENTARY DATA
The information required by this Item is incorporated herein by reference to the financial statements set forth in Item 15 “Exhibits and Financial Statement Schedules” of Part IV of this Form 10-K.
ITEM 9A. CONTROLS AND PROCEDURES
Evaluation of Disclosure Controls and Procedures
Disclosure controls and procedures (as defined in Rules 13a-15(e) and 15d-15(e) under the Exchange Act) are designed to ensure that information required to be disclosed in reports filed or submitted under the Exchange Act is recorded, processed, summarized, and reported within the time periods specified in the SEC rules and forms, and that such information is accumulated and communicated to management, including the Chief Executive Officer and the Chief Financial Officer, to allow timely decisions regarding required disclosures.
Management, under the supervision and with the participation of our Chief Executive Officer and current Chief Financial Officer, conducted an evaluation of the effectiveness of the design and effectiveness of our disclosure controls and procedures as of December 31, 2015 and December 31, 2016. Based on those evaluations, our Chief Executive Officer and current Chief Financial Officer have concluded that our disclosure controls and procedures were not effective as of those dates because of the material weaknesses in our internal control over financial reporting described below.
Management’s Report on Internal Control over Financial Reporting
Management, under the supervision of our Chief Executive Officer and Chief Financial Officer, is responsible for establishing and maintaining adequate internal control over financial reporting. Internal control over financial reporting (as defined in Rules 13a-15(f) and 15d-15(f) under the Exchange Act) is a process designed by, or under the supervision of our Chief Executive Officer and Chief Financial Officer and effected by our board of directors, management and other personnel to provide reasonable assurance regarding the reliability of financial reporting and the preparation of financial statements for external purposes in accordance with GAAP.
Internal control over financial reporting includes those policies and procedures which (a) pertain to the maintenance of records that, in reasonable detail, accurately and fairly reflect the transactions and dispositions of assets, (b) provide reasonable assurance that transactions are recorded as necessary to permit preparation of financial statements in accordance with generally accepted accounting principles, (c) provide reasonable assurance that receipts and expenditures are being made only in accordance with appropriate authorization of management and the board of directors, and (d) provide reasonable assurance regarding prevention or timely detection of unauthorized acquisition, use or disposition of assets that could have a material effect on the financial statements.
Internal control over financial reporting has inherent limitations. Internal control over financial reporting is a process that involves human diligence and compliance and is subject to lapses in judgment and breakdowns resulting from human failures. Internal control over financial reporting also can be circumvented by collusion or improper management override. Because of such limitations, there is a risk that material misstatements will not be prevented or detected on a timely basis. However, these inherent limitations are known features of the financial reporting process. Therefore, it is possible to design into the process safeguards to reduce, though not eliminate, this risk. Also, projections of any evaluation of effectiveness to future periods are subject to the risk that controls may become inadequate because of changes in conditions, or that the degree of compliance with the policies or procedures may deteriorate in the future.
Our management, under the supervision and with the participation of our Chief Executive Officer and current Chief Financial Officer, conducted an evaluation of the effectiveness of our internal control over financial reporting as of December 31, 2015 and as of December 31, 2016, based on the criteria established in Internal Control - Integrated Framework (2013) issued by the Committee of Sponsoring Organizations of the Treadway Commission, and has concluded that we did not maintain effective internal control over financial reporting as of December 31, 2015 and as of December 31, 2016 because of the material weaknesses identified below.
A material weakness is a deficiency, or a combination of deficiencies, in internal control over financial reporting such that there is a reasonable possibility that a material misstatement of the annual or interim financial statements will not be prevented or detected on a timely basis.
2015 Material Weaknesses
Control Environment
Inappropriate Tone at the Top
Our former senior management did not set an appropriate tone at the top. Specifically, the emphasis placed by former senior management on achieving or exceeding financial targets created an environment in which inappropriate accounting practices resulted in misstatements of several management estimates and accruals. By placing an inappropriate emphasis on achieving these targets, former senior management permitted a culture that did not appropriately emphasize compliance with our accounting policies and procedures and the adherence to GAAP.
Inadequate Investment in Personnel and Managerial Oversight
We did not maintain a sufficient complement of personnel with an appropriate degree of knowledge, experience, and training, commensurate with our accounting and reporting requirements.
We also did not design and maintain effective controls with respect to establishing and assigning authority and responsibility over accounting operations, including the consolidation process, and the preparation and review of financial statements.
Risk Assessment
We did not design and maintain effective internal controls to identify, assess and address risks that significantly impact our financial statements or the effectiveness of our internal controls over financial reporting. Specifically, our insufficient complement of personnel caused certain existing controls to become inadequate to identify and address the risk of material misstatement.
Information and Communication
We did not design and maintain effective controls to obtain, generate and communicate relevant and accurate information to support the function of internal control over financial reporting. Specifically, we did not implement or maintain sufficient information systems in support of our accounting and financial reporting processes.
Monitoring
We did not design and maintain effective monitoring of compliance with established accounting policies, procedures and controls. This weakness included our failure to design and operate effective procedures and controls whose purpose is to evaluate and monitor the effectiveness of our individual control activities.
The material weaknesses in our control environment, risk assessment, information and communication, and monitoring controls contributed to the following additional material weaknesses.
Control Activities
· Inventory
We did not design and maintain effective controls over the accounting for inventory. Specifically, we did not design and maintain effective controls over:
· raw materials to ensure items are priced using the FIFO method, resulting from the identification of inaccurate prices utilized in the valuation of our inventory quantities on hand based on physical observation;
· the accuracy of the stage of completion in valuing WIP, resulting from the identification of data input errors from our physical inventory observation used in the valuation of our WIP;
· certain key assumptions used in the valuation of WIP, resulting from the identification of inaccurate or imprecise data used in the development of these assumptions; and
· the existence, completeness, accuracy, valuation and presentation and disclosure of raw materials and WIP.
· Accounting for Leases
We did not design and maintain effective controls over our accounting for leases. Specifically, we did not design and maintain effective controls over the completeness, accuracy, existence, presentation and disclosure of our real property leases.
· Revenue
We did not design and maintain effective controls over our accounting for revenue. Specifically, we did not design and maintain effective controls over the completeness, accuracy, occurrence, and valuation of revenue.
· Accounts Receivable and Allowances
We did not design and maintain effective controls over accounts receivable and allowances. Specifically, we did not design and maintain effective controls over the completeness, accuracy, existence and valuation of amounts recorded to accounts receivable, including allowances.
· Property, Plant and Equipment and Depreciation
We did not design and maintain effective controls over property, plant and equipment, including depreciation. Specifically, we did not design and maintain effective controls over the completeness, accuracy, existence, valuation, presentation and disclosure over property, plant and equipment including capitalized software and related depreciation expense.
· Accounts Payable and Accruals
We did not design and maintain effective controls over accounts payable and accruals. Specifically, we did not design and maintain effective controls over the completeness, accuracy, existence, and rights and obligations related to purchased goods and services and liabilities for other items, accurately reflecting the receipt of such goods or services and the related liability in the proper period.
· Account Reconciliations
We did not design and maintain effective controls over the preparation, review and approval of account reconciliations. Specifically, we did not design and maintain controls to ensure that account reconciliations were completed timely and accurately, and that reconciling items were properly resolved on a timely basis.
· Journal Entries
We did not design and maintain effective controls over the preparation and recording of journal entries. Specifically, certain recurring and non-recurring journal entries were not consistently and adequately reviewed and approved. Additionally, we did not design and maintain user access controls to ensure appropriate segregation of duties as it relates to the preparation and review of journal entries.
· Business Combinations, Goodwill and Intangible Assets
We did not design and maintain effective controls over the accounting for business combinations, goodwill and intangible assets. Specifically, we did not design and maintain effective controls over the completeness, accuracy, existence, valuation and presentation and disclosure related to our accounting for business combinations, goodwill and intangible assets.
· Share-based Compensation
We did not design and maintain effective controls over the completeness, accuracy, valuation and presentation and disclosure of our accounting for share-based compensation.
· Income Taxes
We did not design and maintain effective controls over our accounting for income taxes. Specifically, we did not design and maintain effective controls over the completeness, existence, accuracy and presentation of our accounting for income taxes, including the income tax provision and related assets and liabilities.
· Information Technology General Controls
We did not design and maintain effective controls over certain IT systems, which could result in misstatements potentially impacting all financial statement accounts and disclosures. Specifically, we did not design and maintain (i) user access controls to appropriately segregate duties and adequately restrict user and privileged access to financial applications and data to the appropriate personnel, (ii) effective controls to monitor, document and approve data changes, and (iii) effective controls related to monitoring of critical jobs.
2016 Material Weaknesses
Control Environment
We did not design and maintain effective controls with respect to establishing and assigning authority and responsibility over accounting operations, including the consolidation process, and the preparation and review of financial statements.
Risk Assessment
We did not design and maintain effective internal controls to identify, assess and address risks that significantly impact our financial statements or the effectiveness of our internal controls over financial reporting.
Information and Communication
We did not design and maintain effective controls to obtain, generate and communicate relevant and accurate information to support the function of internal control over financial reporting. Specifically, we did not implement or maintain sufficient information systems in support of our accounting and financial reporting processes.
Monitoring
We did not design and maintain effective monitoring of compliance with established accounting policies, procedures and controls. This weakness included our failure to design and operate effective procedures and controls whose purpose is to evaluate and monitor the effectiveness of our individual control activities.
The material weaknesses in our control environment, risk assessment, information and communication, and monitoring controls contributed to the following additional material weaknesses.
Control Activities
· Inventory
We did not design and maintain effective controls over the accounting for inventory. Specifically, we did not operate effective controls over:
· raw materials to ensure items are priced using the FIFO method, resulting from the identification of inaccurate prices utilized in the valuation of our inventory quantities on hand based on physical observation;
· the accuracy of the stage of completion in valuing WIP, resulting from the identification of data input errors from our physical inventory observation used in the valuation of our WIP;
· certain key assumptions used in the valuation of WIP, resulting from the identification of inaccurate or imprecise data used in the development of these assumptions; and
· the existence, completeness, accuracy, valuation and presentation and disclosure of raw materials and WIP.
· Accounting for Leases
We did not design and maintain effective controls over our accounting for leases. Specifically, we did not design and maintain effective controls over the completeness, accuracy, existence, presentation and disclosure of our real property leases.
· Revenue
We did not design and maintain effective controls over our accounting for revenue. Specifically, we did not design and maintain effective controls over the completeness, accuracy, occurrence, and valuation of revenue.
· Accounts Receivable and Allowances
We did not design and maintain effective controls over accounts receivable and allowances. Specifically, we did not design and maintain effective controls over the completeness, accuracy, existence and valuation of amounts recorded to accounts receivable, including allowances.
· Property, Plant and Equipment and Depreciation
We did not design and maintain effective controls over property, plant and equipment, including depreciation. Specifically, we did not design and maintain effective controls over the completeness, accuracy, existence, valuation, presentation and disclosure over property, plant and equipment including capitalized software and related depreciation expense.
· Accounts Payable and Accruals
We did not design and maintain effective controls over accounts payable and accruals. Specifically, we did not design and maintain effective controls over the completeness, accuracy, existence, and rights and obligations related to purchased goods and services and liabilities for other items, accurately reflecting the receipt of such goods or services and the related liability in the proper period.
· Account Reconciliations
We did not design and maintain effective controls over the preparation, review and approval of account reconciliations. Specifically, we did not design and maintain controls to ensure that account reconciliations were completed timely and accurately, and that reconciling items were properly resolved on a timely basis.
· Journal Entries
We did not design and maintain effective controls over the preparation and recording of journal entries. Specifically, certain recurring and non-recurring journal entries were not consistently and adequately reviewed and approved. Additionally, we did not design and maintain user access controls to ensure appropriate segregation of duties as it relates to the preparation and review of journal entries.
· Business Combinations, Goodwill and Intangible Assets
There were no acquisitions in 2016 and therefore controls related to the initial recording of Business Combinations did not operate in 2016. We will evaluate the design and operating effectiveness over controls related to Business Combinations when and if we enter into another acquisition.
We did not design and maintain effective controls over the accounting for goodwill and intangible assets. Specifically, we did not design and maintain effective controls over the completeness, accuracy, existence, valuation and presentation and disclosure related to our accounting for goodwill and intangible assets.
· Share-based Compensation
We did not design and maintain effective controls over the completeness, accuracy, valuation and presentation and disclosure of our accounting for share-based compensation.
· Income Taxes
We did not design and maintain effective controls over our accounting for income taxes. Specifically, we did not design and maintain effective controls over the completeness, existence, accuracy and presentation of our accounting for income taxes, including the income tax provision and related assets and liabilities.
· Information Technology General Controls
We did not design and maintain effective controls over certain IT systems, which could result in misstatements potentially impacting all financial statement accounts and disclosures. Specifically, we did not design and maintain (i) user access controls to appropriately segregate duties and adequately restrict user and privileged access to financial applications and data to the appropriate personnel, (ii) effective controls to monitor, document and approve data changes, and (iii) effective controls related to monitoring of critical jobs.
These material weaknesses could result in a misstatement of the aforementioned account balances or disclosures that would result in a material misstatement to the annual or interim financial statements that would not be prevented or detected.
The effectiveness of our internal control over financial reporting as of December 31, 2015 and December 31, 2016 has been audited by PricewaterhouseCoopers LLP, an independent registered public accounting firm, as stated in their report which appears herein.
Remediation Plans
Since the end of 2013, under the oversight of our Audit Committee and Board of Directors, we have been, and continue to be, actively engaged in the design and implementation of remedial measures to address the material weaknesses in our internal control over financial reporting. We are committed to improving our internal control processes and resolving our control deficiencies, including the material weaknesses we have presented above, and will continue to review our effectiveness in accomplishing this critical objective.
To date, we have taken and continue to take the actions described below to remediate the identified material weaknesses. Our remediation efforts are ongoing. As we continue to evaluate and work to improve our internal control over financial reporting, we may implement additional measures or modify the remedial actions described below, as considered appropriate, to remediate our material weaknesses.
Control Environment
We made significant strides in improving our overall control environment, particularly as it relates to our FY 2016 remediation of the prior year material weaknesses related to the tone at the top and our investment in personnel. However, we believe the evidence that we have appropriately established and assigned authority and responsibility over accounting operations, including the consolidation process, and the preparation and review of financial statements will be that we have the ability to file our financial statements on a timely basis and have remediated substantially all other material weaknesses. The combination of these factors will indicate that our internal controls over financial reporting are designed and operating effectively as a whole.
Risk Assessment
In our efforts toward remediation of our material weakness in risk assessment, we intend to strengthen our annual risk assessment and to develop programmatic approaches towards the mitigation of risks identified through this process.
Information and Communication
In our efforts toward remediation of our Material Weakness in information and communication, we have implemented a new lease accounting system, a new payroll and time keeping system, and a new accounting controls administration system. We have also commenced an evaluation of a potential change in our primary general ledger system and accounting subsystems.
Monitoring
In our efforts toward remediation of our material weakness in monitoring and oversight we have:
· Changed the leadership of and expanded our Internal Audit organization.
· Realigned the reporting structure of our accounting organization to have divisional accounting personnel report into our corporate accounting group.
Control Activities
· Inventory
In our efforts toward remediation of our material weaknesses in inventory accounting, we have:
· Hired a Vice President of Inventory and Product Accounting and additional personnel with appropriate technical knowledge to support our inventory accounting requirements;
· Begun implementing measures to strengthen controls, including:
· The performance of quarterly physical inventory counts within our patient care reporting segment commencing December 31, 2014.
· The introduction of new controls for the aggregation and review of inventory information collected in connection with our physical inventory processes. This included the implementation of controls to ensure that the physical count results are recorded accurately.
· The implementation of a new inventory valuation process to establish FIFO valuation of our raw materials.
· The design of new processes and controls to establish and govern estimates of the value of our WIP.
· The development of procedures and controls to ensure reserves are appropriately recorded and intercompany profits in ending inventories are appropriately eliminated at the end of each period.
· Accounting for Leases
In our efforts toward remediation of our material weakness related to our real property leases, we have:
· Hired a controller devoted to lease accounting and have added additional personnel with appropriate technical knowledge to support our lease accounting requirements under GAAP;
· Implemented a new lease accounting software system;
· Adopted new procedures and controls with respect to our determination of whether leases should be considered operating or capital for financial reporting purposes;
· Established a process and controls for evaluating new leases and lease renewals for build-to-suit accounting treatment;
· Established a policy for the consistent determination and application of lease terms; and
· Developed new lease accounting procedures and controls in order to calculate deferred rent, asset retirement obligations, and tenant improvement allowances.
We have also adopted procedures to promote effective communication between our real estate group and our lease accounting group to ensure timely, accurate and complete exchange of information.
· Revenue
In our efforts toward remediation of our material weakness in revenue accounting, we have:
· Improved our contract management function and controls to ensure adherence to procedures relating to the updating of our payor contract information in our billing systems;
· Commenced the migration of legacy billing systems utilized by acquired clinics to one of our two primary billing platforms, enabling these sites to be incorporated into our standard contract administration and other controls and processes;
· Established processes and controls to improve the accuracy of invoices;
· Commenced the design and implementation of controls to monitor data input and transfers of data across systems and reporting tools;
· Commenced the evaluation and establishment of policies and procedures, including various controls, to ensure that revenue is recorded in the appropriate period, consistent with the timing of delivery of products and services and the retention of certain risks of ownership; and
· Established a separate, centralized revenue cycle management function to oversee critical aspects of our claims submission and payor reimbursement processes.
· Accounts Receivable and Allowances
In our efforts toward remediation of our material weakness in accounts receivable allowances, we have commenced new preparation and review procedures and controls for allowances for disallowed revenue, bad debts and sales returns.
· Property, Plant and Equipment and Depreciation
In our efforts toward remediation of our material weakness in fixed asset accounting, we have:
· Centralized and updated our fixed asset procedures and controls, including the manner in which we establish the in-service date of assets, our asset capitalization policies and thresholds, and the manner in which we record fixed asset disposals;
· Refined our internal use software development processes and controls to more precisely define and monitor the capitalization of labor, including the enhancement of our timekeeping tools;
· Implemented a formal communications process between real estate, lease accounting, and fixed asset functions to ensure proper accounting and recording of fixed asset related transactions; and
· Commenced procedures and controls to periodically validate the existence of fixed assets.
· Accounts Payable and Accruals
In our efforts toward remediation of our material weakness in our accounts payable process, we have revised our procedures and controls to improve our manner of recording accounts payable and estimating certain period-end accrual balances.
· Account Reconciliations
In our efforts toward remediation of our material weakness around account reconciliations, we have developed policies, procedures and controls regarding the timely preparation and documentation of reconciliations of our general ledger accounts. In connection with the implementation of these policies, procedures and controls, we have improved our training regarding our account reconciliation processes and have adopted review procedures in accordance with job responsibilities.
· Journal Entries
In our efforts toward remediation of our material weakness around our journal entry process, we have developed policies, procedures and controls regarding the manner in which journal entries are prepared, reviewed and approved for entry into our systems. Our policies have also incorporated changes designed to strengthen segregation of duties.
· Business Combinations, Goodwill and Intangible Assets
There were no acquisitions in 2016 and therefore controls related to the initial recording of Business Combinations did not operate in 2016. We will evaluate the design and operating effectiveness over controls related to Business Combinations when and if the we enter into another acquisition.
Additionally, in our efforts toward remediation of our material weakness in business combinations, goodwill and intangible assets, we have:
· Hired new personnel to support our accounting for these transactions;
· Adopted improved policies, procedures and controls regarding the manner in which we identify and value working capital assets and liabilities assumed at the time of acquisitions, as well as measurement period adjustments; and
· Incorporated controls designed to improve the coordination between our business development group and our acquisition accounting personnel.
· Share-based Compensation
In our efforts toward remediation of our material weakness in share-based compensation, we have developed new policies, procedures and controls regarding the accounting for our grants of restricted stock units and performance based restricted stock units. In connection with these new policies, procedures and controls, we have revised and strengthened our processes and controls over grant information, assumptions, expense recognition, modifications and forfeitures.
· Income Taxes
In our efforts toward remediation of our Material Weakness in income taxes, we intend to improve our controls over accounting for income taxes by redesigning control procedures to create a more structured and uniform process including enhancing the formality and rigor of review and reconciliation procedures.
· Information Technology General Controls
In our efforts toward remediation of our material weaknesses in IT, we have:
· Updated IT policies and procedures and conducted training with process and control owners to clearly communicate IT general control requirements;
· Begun implementing measures to strengthen controls, including:
· The enforcement of adequate segregation of duties and implementing associated monitoring controls;
· The implementation of a more robust process for provisioning, terminating and periodically reviewing user and privileged access;
· The design of new processes and controls to monitor, document and approve direct data changes; and
· The development of procedures and controls to monitor and review critical jobs.
Despite the substantial time and resources we have directed at remediation efforts discussed in this section, we are unable to estimate at this time when these remediation efforts will be completed. Until the remediation efforts, including any additional remediation efforts that our management identifies as necessary, are completed, the material weaknesses described above will continue to exist.
We intend to provide additional information regarding our remediation efforts with respect to the material weaknesses in future filings with the SEC.
Changes in Internal Control over Financial Reporting
As outlined above, during the year ended December 31, 2016, management remediated the material weakness that existed related to the tone at the top and our investment in personnel. As such, certain changes related to our tone at the top and personnel materially affected, or are reasonably likely to materially affect, our internal control over financial reporting.
Therefore, in accordance with Rule 13a-15(d) of the Exchange Act, management, with the participation of our Chief Executive Officer and our Chief Financial Officer, determined that elements of the changes listed above to our internal control over financial reporting occurred during the years ended December 31, 2015 and December 31, 2016 and have materially affected or are reasonably likely to materially affect our internal control over financial reporting.
ITEM 10. DIRECTORS, EXECUTIVE OFFICERS AND CORPORATE GOVERNANCE
Directors
As of December 31, 2016 and 2015, our Board of Directors consisted of nine members (ages provided as of December 31, 2016):
|
Name |
|
Position with our Company |
|
Age |
|
Became |
|
Vinit K. Asar |
|
Chief Executive Officer and Director |
|
50 |
|
2012 |
|
Asif Ahmad |
|
Director |
|
49 |
|
2014 |
|
Christopher B. Begley |
|
Director |
|
64 |
|
2013 |
|
Thomas P. Cooper, M.D. |
|
Chairman of the Board |
|
72 |
|
1991 |
|
Cynthia L. Feldmann |
|
Director |
|
64 |
|
2003 |
|
Stephen E. Hare |
|
Director |
|
63 |
|
2010 |
|
Cynthia L. Lucchese |
|
Director |
|
56 |
|
2015 |
|
Richard R. Pettingill |
|
Director |
|
68 |
|
2014 |
|
Kathryn M. Sullivan |
|
Director |
|
60 |
|
2015 |
As of the date hereof, our Board of Directors consists of nine members:
|
Name |
|
Position with our Company |
|
Age |
|
Became |
|
Vinit K. Asar |
|
Chief Executive Officer and Director |
|
51 |
|
2012 |
|
Asif Ahmad |
|
Director |
|
50 |
|
2014 |
|
Christopher B. Begley |
|
Chairman of the Board |
|
65 |
|
2013 |
|
John T. Fox |
|
Director |
|
65 |
|
November 2017 |
|
Thomas C. Freyman |
|
Director |
|
63 |
|
November 2017 |
|
Stephen E. Hare |
|
Director |
|
64 |
|
2010 |
|
Cynthia L. Lucchese |
|
Director |
|
57 |
|
2015 |
|
Richard R. Pettingill |
|
Director |
|
69 |
|
2014 |
|
Kathryn M. Sullivan |
|
Director |
|
61 |
|
2015 |
Mr. Fox and Mr. Freyman joined our Board of Directors on November 14, 2017. Dr. Cooper and Ms. Feldmann retired from our Board of Directors effective January 1, 2018.
Vinit K. Asar has been our Chief Executive Officer and President since May 2012, and served as our President and Chief Operating Officer from September 2011 to May 2012. Mr. Asar also served as our Executive Vice President and Chief Growth Officer from December 2008 to September 2011. Mr. Asar came to Hanger from the Medical Device & Diagnostic sector at Johnson & Johnson, having worked at the Ethicon, Ethicon Endo Surgery, Cordis and Biosense Webster franchises. During his eighteen year career at Johnson & Johnson, Mr. Asar held various roles of increasing responsibility in Finance, Product Development, Manufacturing, and Marketing and Sales in the United States and in Europe. Prior to joining Hanger, Mr. Asar was the Worldwide Vice President at Biosense Webster, the Electrophysiology division of Johnson & Johnson, responsible for the Worldwide Sales, Marketing and Services organizations. Mr. Asar has a B.S.B.A from Aquinas College and a M.B.A. from Lehigh University. Mr. Asar’s service as our Chief Executive Officer, extensive knowledge of our Company, and diverse experience in health care finance, product development, manufacturing, marketing and sales, led to the conclusion he should serve as a director of our Company.
Asif Ahmad, an independent healthcare consultant, served as the Chief Executive Officer of Anthelio Healthcare Solutions, Inc. from July 2013 to April 2017. Anthelio is one of the largest providers of information technology and business process services to hospitals, physician practice groups and other health care providers. Mr. Ahmad served as a Senior Vice President and General Manager of Information and Technology Services at McKesson Specialty Health between 2010 and 2013. From 2003 to 2010, he served as the Vice President of Diagnostic Services for the Duke University Health System and Medical Center, and he also held various faculty appointments at Duke University from 2004 to 2011. Prior to that,
Mr. Ahmad served in various positions with Ohio State University Health System and Medical Center between 1992 and 2003, serving as Administrator and Chief Information Officer, Chief Technology Officer and the Chair of the Clinical Technology Council at the time of his departure. Mr. Ahmad earned a bachelor’s degree in electrical engineering from the University of Engineering and Technology in Pakistan, a master’s degree in biomedical engineering from Ohio State University, and a M.B.A. from Ohio State University. Mr. Ahmad’s experience as the former Chief Executive Officer of Anthelio Healthcare Solutions, Inc., a large independent health care company, as well as his background in information technology and business processes, led to the conclusion that he should serve as a director of our Company.
Christopher B. Begley serves as our non-executive Chairman of the Board, a role he has held since January 2018. He is the retired Executive Chairman and Chief Executive Officer of Hospira, Inc., a global provider of injectable drugs and infusion technology. Mr. Begley served as Executive Chairman of the Board of Hospira from May 2007 until January 2012, and served as Chief Executive Officer from April 30, 2004, when Hospira was spun off from Abbott Laboratories, to March 2011. Prior to that, Mr. Begley served in various positions at Abbott from 1986 to April 2004, leaving Abbott as Senior Vice President of its Hospital Products division. Mr. Begley also serves as a director of Zimmer/Biomet Holdings Inc., a medical device company. Mr. Begley served as non-executive Chairman of the Board of Adtalem Global Education Inc. (formerly known as DeVry Education Group Inc.), from November 2014 to November 2017, and as a director of Adtalem from November 2011 to November 2017. Mr. Begley previously served as non-executive Chairman of the Board of The Hillshire Brands Company from June 2012 to August 2014, and served as a director of the Sara Lee Corporation from October 2006 to May 2012. Mr. Begley earned a bachelor’s degree from Western Illinois University and an M.B.A. from Northern Illinois University. Mr. Begley’s experience as a former Chief Executive Officer of Hospira, Inc., a publicly traded health care company, as well as his experience as a director of other public companies and his background in health care companies generally, led to the conclusion that he should serve as Chairman of the Board of our Company.
Thomas P. Cooper, M.D. served as our non-executive Chairman of the Board from May 2013 to January 1, 2018, when he retired from our Board. He is a partner of Aperture Venture Partners, a venture capital firm. He served as an Adjunct Professor at the Columbia University School of Business. From 1991 to 2006, Dr. Cooper was the Chief Executive Officer of VeriCare Management, Inc., which provides mental health services to patients in long term care facilities. From May 1989 to January 1997, Dr. Cooper served as the President and Chief Executive Officer of Mobilex U.S.A., a provider of mobile diagnostic services to long term care facilities. Dr. Cooper was the founder of Spectrum Emergency Care, a provider of contract emergency physicians to hospitals. Dr. Cooper’s background as a medical doctor, his extensive experience in health care management, venture capital and leading start-up companies, and his knowledge of our Company, led to the conclusion he should serve as a director of our Company.
Cynthia L. Feldmann, retired CPA, served as member of the board of directors until January 1, 2018. She also served on the compliance committee and the audit committee of STERIS Corporation, a company engaged in the development, manufacture and marketing of sterilization and decontamination equipment, consumables and services for health care, scientific, research, industrial and governmental customers throughout the world. She also serves as a member of the board of directors, the nominating committee and the audit committee of UFP Technologies, Inc., a producer of innovative custom-engineered components, products and specialty packaging. Ms. Feldmann also served as a member of the board of directors and chaired the audit committee of HeartWare International, Inc., a medical device company engaged in the development of devices intended to treat advanced heart failure, from 2012 through August 2016. Ms. Feldmann is further on the board of directors and chairs the finance committee of Falmouth Academy, an academically rigorous, coed college preparatory day school for grades 7 to 12. Ms. Feldmann also served on the board of and chaired the audit and compliance committees of Atrius Health, a non-profit organization comprised of six leading Boston Area physician groups representing more than 1,000 physicians serving nearly 1 million adult and pediatric patients from 2012 to 2013. Ms. Feldmann was also a member of the board of Hayes Lemmerz International Inc., a worldwide producer of aluminum and steel wheels for passenger cars, trucks and trailers and a supplier of brakes and powertrain components from 2006 to 2009. Previously, Ms. Feldmann served as Business Development Officer at Palmer & Dodge LLP, a Boston based law firm, with a specialty in serving life sciences companies. From 1994 to 2002, she was a Partner at KPMG LLP, holding various leadership roles in the firm’s Medical Technology and Health Care & Life Sciences industry groups. Ms. Feldmann also was National Partner in Charge of Coopers & Lybrand’s Life Sciences practice from 1989 to 1994, among other leadership positions she held during her 19 year career there. Ms. Feldmann was a founding board member of Mass Medic, a Massachusetts trade association for medical technology companies, where she also served as treasurer and as a member of the board’s Executive Committee during her tenure from 1997 to 2001. Ms. Feldmann holds a Masters Professional Director Certification from the American College of Corporate Directors. Ms. Feldmann’s extensive expertise in auditing and accounting, particularly her experience in the health care and life sciences industries, led to the conclusion she should serve as a director of our Company.
John T. Fox, since 2015, has held the position of Chief Executive Officer and President of Beaumont Health, Michigan’s largest healthcare system. Prior to joining Beaumont Health, Mr. Fox held positions at Emory Healthcare, the largest and most comprehensive health system in Georgia. He joined Emory as Chief Operating Officer in 1999 and assumed the role of Chief Executive Officer and President in 2002. Throughout his 30+ year career, Mr. Fox has held various roles within the healthcare sector, including Executive Vice President of IU Health (formerly Clarian Health), a large health system and academic medical center in Indianapolis, and Vice President and Chief Financial Officer at The John Hopkins Hospital in Baltimore, Maryland. After obtaining a bachelor’s degree and a master’s degree in business administration, Mr. Fox began his career as an MBA/CPA at Coopers & Lybrand. Mr. Fox was a director at HealthSpring, Inc. from 2010 until its acquisition by Cigna in 2012. Mr. Fox’s extensive experience in the healthcare industry, particularly as an executive officer of multiple healthcare systems and hospitals, his accounting and finance background including experience in public accounting, as well as his experience as a director for another public company in the healthcare industry, led to the conclusion that he should serve as a director of our Company.
Thomas C. Freyman retired from Abbott Laboratories in February 2017 after serving as Executive Vice President of Finance and Administration, and prior to that, Chief Financial Officer. Mr. Freyman served in a number of other key roles throughout his 38-year tenure at Abbott Laboratories, a publicly held company that engages in the discovery, development, manufacture and sale of a broad and diversified line of healthcare products. Earlier in his career, Mr. Freyman held various accounting, financial planning, treasury and controllership roles. Since 2013, Mr. Freyman has been a member of the Board of Directors and a member of the Audit Committee of Tenneco, Inc. Mr. Freyman earned a bachelor’s degree in accounting from University of Illinois, Urbana-Champaign and a master’s degree in management from Kellogg Graduate School of Management, Northwestern University. Mr. Freyman’s extensive experience in the healthcare industry, including as a senior executive officer at a publicly traded company, as well as his significant background in accounting and finance and his experience as a director for another large public company, led to the conclusion that he should serve as a director of our Company.
Stephen E. Hare is a senior advisor at Office Depot, Inc., having previously served as Executive Vice President and Chief Financial Officer of Office Depot, Inc. from December 2013 to January 2018. Prior to that, he served as Senior Vice President and Chief Financial Officer of The Wendy’s Company from July 2011 to September 2013, and prior to that served as Senior Vice President and Chief Financial Officer of Wendy’s/Arby’s Group, Inc. from 2008 to July 2011. Mr. Hare served as Senior Vice President and Chief Financial Officer of Triarc Companies, Inc. from 2007 to the 2008 merger of Triarc and Wendy’s in 2008, and as Chief Financial Officer of Arby’s Restaurant Group, Inc. from 2006 until July 2011. Previously, Mr. Hare served as Executive Vice President of Cadmus Communications Corporation and as the President of Publisher Services Group, a division of Cadmus, from 2003 to 2006. Mr. Hare served as Executive Vice President and Chief Financial Officer of Cadmus from 2001 to 2003. From 1996 to 2001, Mr. Hare was Executive Vice President and Chief Financial Officer of AMF Bowling Worldwide, where he was also a member of the board of directors. From 1990 to 1996, Mr. Hare was Senior Vice President and Chief Financial Officer of James River Corporation. Mr. Hare was also a member of the board of directors of Pasta Pomodoro, Inc., the operator of Pasta Pomodoro restaurants, from 2008 to 2009, and was a member of the board of directors and chair of the audit committee of Wolverine Tube Inc. from 2005 to 2007. Mr. Hare’s accounting and auditing expertise, including his experience as Chief Financial Officer of large, public companies, as well as his extensive experience in distributed retailing business models, led to the conclusion he should serve as a director of our Company.
Cynthia L. Lucchese is the Chief Administrative Officer and Chief Financial Officer of Hulman & Company, a privately held company headquartered in Indianapolis, Indiana, which owns and operates the Indianapolis Motor Speedway, INDYCAR racing league, Indianapolis Motor Speedway Productions, Clabber Girl Corporation and various real estate holdings. Prior to joining Hulman, Ms. Lucchese was Senior Vice President and Chief Financial Officer of Hillenbrand, Inc., where from 2008 to 2014 she was a key member of the leadership team that transformed Hillenbrand from a $650 million North American business to a $1.6 billion global diversified industrial company. She also has extensive experience in the medical device industry, including serving from 2005 to 2007 as Senior Vice President and Chief Financial Officer of Thoratec Corporation, a medical device company focused on treating advanced stage heart failure. Ms. Lucchese also held various senior financial positions with Guidant Corporation, now a part of Boston Scientific Corporation, from 1994 to 2005, including Vice President and Treasurer, Vice President of Finance and Administration - Guidant Sales Corporation, and Vice President - Controller and Chief Accounting Officer. Since July 2014, Ms. Lucchese has served as a member of the Board of Directors, a member of the Nominating & Corporate Governance Committee and Chairman of the Audit Committee of Intersect ENT, Inc. In June 2017, she joined the Board of Directors of Beaver-Visitec, Inc., and serves as Chairman of the Audit Committee. She previously served as a member of the Board of Directors of Brightpoint, Inc. from 2009 to 2012, serving as Chairman of the Audit Committee. In addition, she currently also serves as a member of the Dean’s Council for
the Kelley School of Business of Indiana University. Ms. Lucchese, a Certified Public Accountant, earned a bachelor’s degree in accounting and a master’s degree in business administration from Kelley School of Business of Indiana University. Ms. Lucchese’s extensive experience in accounting and financial leadership roles at public companies, and her experience in the medical device industry, as well as her experience as a director of other public companies, led to the conclusion she should serve as a director of our Company.
Richard R. Pettingill is the retired President and Chief Executive Officer of Allina Hospitals and Clinics, a network of health care providers in Minneapolis, Minnesota, serving in this role from 2002 until 2009. During that time he also served on the board of directors of the Minnesota Hospital Association and the Minnesota Business Partnership. Prior to joining Allina Hospitals and Clinics, Mr. Pettingill served as Executive Vice President and Chief Operating Officer of Kaiser Foundation Health Plans and Hospitals from 1996 to 2002. From 1991 to 1995, Mr. Pettingill served as President and Chief Executive Officer of Camino Healthcare. Mr. Pettingill serves on the board of directors of two other public companies, Accuray Incorporated, a radiation oncology company, and Tenet Healthcare Corporation, a medical services provider. Mr. Pettingill received a bachelor’s degree from San Diego State University and a master’s degree in health care administration from San Jose State University. Mr. Pettingill’s experience as a former Chief Executive Officer of Allina, a not for profit health care company, as well as his experience as a director of other public companies and his background in health care companies generally, led to the conclusion he should serve as a director of our Company.
Kathryn M. Sullivan is the Chief Executive Officer of UnitedHealthcare Employer and Individual, Local Markets, which is an operating division of UnitedHealth Group, since March 2015. She joined UnitedHealthcare in July 2008, as Chief Executive Officer of UnitedHealthcare, Central Region. Prior to joining UnitedHealthcare, Ms. Sullivan served from 2004 to 2008 as Senior Vice President and Chief Financial Officer of Blue Cross Blue Shield Association. Presently, Ms. Sullivan serves as a director for UnitedHealthcare Children’s Foundation and for the Executives’ Club of Chicago and YMCA of Metro Chicago. Ms. Sullivan, a Certified Public Accountant, earned a bachelor’s degree in business administration from Northeast Louisiana University and a master’s degree in business administration from Louisiana State University. Ms. Sullivan’s experience in the health care industry, especially with respect to the payor perspective, led to the conclusion she should serve as a director of our Company. Ms. Sullivan was originally recommended as a director nominee by a third party search firm.
There are no family relationships between any of the members of the Board of Directors.
Executive Officers
The following tables set forth information as of December 31, 2016 and the current date regarding executive officers of the Company and certain of its subsidiaries. The ages listed for all executive officers are current as of the date of this filing. The titles listed and biographies of current executive officers Company is updated through the date of this filing.
|
Name |
|
Age |
|
Office with the Company |
|
Vinit K. Asar |
|
51 |
|
President and Chief Executive Officer |
|
Samuel M. Liang |
|
55 |
|
Executive Vice President of Hanger, Inc., President and Chief Operating Officer of Hanger Prosthetics & Orthotics, Inc. (dba Hanger Clinic) |
|
Thomas E. Kiraly |
|
57 |
|
Executive Vice President and Chief Financial Officer |
|
Kenneth W. Wilson |
|
54 |
|
Executive Vice President of Hanger, Inc., President and Chief Operating Officer of Southern Prosthetic Supply, Inc. |
|
Thomas E. Hartman |
|
55 |
|
Senior Vice President, Secretary and General Counsel |
|
Scott Ranson |
|
53 |
|
Senior Vice President and Chief Information Officer |
|
Rebecca J. Hast |
|
67 |
|
Senior Vice President and Chief Compliance Officer |
|
Andrew C. Morton |
|
52 |
|
Senior Vice President and Chief Human Resources Officer |
|
Gabrielle B. Adams |
|
49 |
|
Vice President and Chief Accounting Officer |
Vinit K. Asar has been our Chief Executive Officer and President since May 2012, and served as our President and Chief Operating Officer from September 2011 to May 2012. Mr. Asar also served as our Executive Vice President and Chief Growth Officer from December 2008 to September 2011. Mr. Asar came to Hanger from the Medical Device & Diagnostic sector at Johnson & Johnson, having worked at the Ethicon, Ethicon-Endo-Surgery, Cordis and Biosense Webster franchises. During his eighteen year career at Johnson & Johnson, Mr. Asar held various roles of increasing responsibility in Finance, Product Development, Manufacturing, and Marketing and Sales in the United States and in Europe. Prior to joining Hanger, Mr. Asar was the Worldwide Vice-President at Biosense Webster, the Electrophysiology division of Johnson & Johnson,
responsible for the Worldwide Sales, Marketing and Services organizations. Mr. Asar has a B.S.B.A from Aquinas College and a M.B.A. from Lehigh University.
Thomas E. Hartman is our Senior Vice President, General Counsel and Secretary. He was appointed Senior Vice President in 2015 and Secretary in 2014, and has served as Vice President and General Counsel since 2009. Mr. Hartman joined Hanger from Foley & Lardner, LLP where he was a partner in Foley’s Business Law Department. Mr. Hartman’s practice at Foley was focused on securities transactions, securities law compliance, mergers and acquisitions, and corporate governance. Prior to joining Foley in 1995, Mr. Hartman was a business law associate at Jones Day. Mr. Hartman received his J.D. from the University of Wisconsin in Madison, and a Bachelor of Science in Engineering (Industrial & Operations Engineering) from the University of Michigan in Ann Arbor.
Rebecca J. Hast has been our Senior Vice President and Chief Compliance Officer since June 2015. She served as President of Linkia, LLC from 2005 to June 2016. Prior to joining Linkia, Ms. Hast was with United Health Group Incorporated, a health care company that offers a broad spectrum of products and services through two distinct platforms: UnitedHealthcare, which provides health care coverage and benefits services; and Optum, which provides information and technology-enabled health services. Ms. Hast held a variety of positions from 1999 to 2004, leaving United Healthgroup as Senior Vice President, Account Development for the Dental Benefit Providers, a wholly-owned subsidiary of United Healthgroup’s Specialty Services Division (now Optum). Prior to joining United Healthgroup, Ms. Hast held management and leadership positions with Magellan Health Services, Inc., a specialty health care management company, and other health care insurance and services providers. Ms. Hast holds a Bachelor of Science degree from University of Pittsburgh.
Thomas E. Kiraly has been our Executive Vice President and Chief Financial Officer since January 2015. Mr. Kiraly joined the Company in October 2014 as Executive Vice President. Prior to joining the Company, Mr. Kiraly served as the Executive Vice President, Chief Financial Officer and Treasurer of Sheridan Healthcare, Inc., a provider of anesthesia, radiology, emergency department, and neonatology services from 2013 to 2014. From 1999 to 2011, Mr. Kiraly served as Executive Vice President, Chief Financial Officer and Treasurer and led the financial accounting, procurement and real estate functions of Concentra, Inc., a provider of urgent care, occupational health care, and other health care services. In 2010, when Concentra, Inc. was acquired by Humana, Inc., a Fortune 100 provider of insurance, health and wellbeing and related health care services, Mr. Kiraly transitioned to the position of Vice President of Finance, responsible for corporate financial forecasting, analysis, internal reporting, and accounting operations. From 1988 to 1999, Mr. Kiraly served as Executive Vice President and Chief Financial Officer of BRC Holdings, Inc., where he led the financial accounting, human resources and legal functions of this publicly-traded provider of information technology services to health care firms and local governments. Mr. Kiraly earned his Master of Business Administration from the University of Texas in Austin, Texas and his Bachelor of Arts in Speech Communication from California State University in Northridge, California.
Samuel M. Liang has been our Executive Vice President since May 2016, and has been the President and Chief Operating Officer of Hanger Prosthetics & Orthotics, Inc. (dba Hanger Clinic), the Company’s patient care subsidiary, since September 2014. Mr. Liang joined the Company in May 2014. Between May 2010 and May 2014, Mr. Liang was a Senior Vice President of Bayer HealthCare where he served as President and CEO of MEDRAD, Inc. and Head of the Radiology & Interventional business. Prior to that, he served as President and Chief Executive Officer of Vascular Therapies, LLC, a company that created a combination drug and device product for vascular surgery. Mr. Liang also held numerous leadership positions over 24 years at Cordis Corporation, a Johnson & Johnson company. Mr. Liang earned a B.S.E. degree in mechanical engineering and material sciences from Duke University, North Carolina, and a master’s degree in management from the Kellogg Graduate School of Management, Northwestern University, Illinois.
Andrew C. Morton is our Senior Vice President and Chief Human Resources Officer. He was appointed Senior Vice President in 2015, and served as Vice President and Chief Human Resources Officer since 2010. Prior to joining Hanger, Mr. Morton worked for Freescale Semiconductor since 2006 in two capacities; first as Vice President Talent and Corporate Services, and then Vice President Human Resources Supply Chain. From 1992 to 2006, Mr. Morton worked at IBM and held various global field and corporate HR executive roles of increasing responsibility across its software, hardware and sales businesses. Mr. Morton has a B.S. degree in Finance from the University of Colorado at Boulder, and an MBA from Syracuse University. In between degrees, he worked for Baxter Healthcare in Finance roles from 1988 to 1989.
Scott Ranson has been our Senior Vice President and Chief Information Officer since July 2015. Mr. Ranson joined our Company after 14 years of service as the Chief Information Officer for Brookdale Senior Living Inc., a publicly traded senior housing solution provider, from 2001 to June 2015. Previously, Mr. Ranson served as the Director of Software for Marketing Specialists Company, where he led the successful implementation of an ERP system and e-commerce strategies, and as Vice President of Information Technology for Atlas Marketing Company, Inc. Mr. Ranson earned his Bachelor of
Science degree in Business Administration, Business Management, Computer Information Systems from Ashland University in Ohio.
Kenneth W. Wilson has been an Executive Vice President since May 2016, and has been President and Chief Operating Officer of Southern Prosthetic Supply, Inc. since September 2011. Mr. Wilson was previously employed by Cardinal Health Inc., the largest distributor of pharmaceuticals and medical products in the United States, for 22 years, serving as Senior Vice President/General Manager of its Ambulatory Care business from 2008 until September 2011, as Vice President/General Manager of its Onsite business from 2006 to 2008, and as Senior Vice President-Group Purchasing Accounts from 2004 to 2006. Prior to joining Cardinal Health, he worked at Allegiance Healthcare Corporation, a manufacturer of medical products, including surgical apparel and drapes, surgical instruments and respiratory care products. Allegiance Healthcare was a 1997 spin-off of Baxter Healthcare Corporation that was acquired by Cardinal Health in 1999. Mr. Wilson served Allegiance Healthcare as Head of Allegiance National Account and Health Systems from 2002 to 2004, and as Vice President-Health Systems from 1997 to 2002. From 1988 to 1997, Mr. Wilson was with Baxter Healthcare, a manufacturer of a wide variety of medical products across three divisions, including drugs and vaccines, dialysis equipment and intravenous (IV) supplies. Mr. Wilson left Baxter in 1997 as a Regional Director in Encinitas, California. Prior to joining Baxter, he also worked for PepsiCo, USA and Proctor & Gamble in a variety of sales roles. Mr. Wilson received his Bachelor of Science degree in Economics and Social Science from Davidson College in 1984.
Gabrielle B. Adams has been our Vice President and Chief Accounting Officer since April 2017. Ms. Adams joined Hanger as its Vice President - Accounting in February 2015. Prior to joining Hanger Ms. Adams served as Chief Financial Officer at the Texas Bankers Association, a trade association supporting the banking industry in Texas, from 2012 to 2015. Previously, Ms. Adams served in various roles of increasing responsibility at EZCorp, Inc., a publicly traded provider of pawn loans and operator of pawn stores, from 1999 to 2012, including serving as Vice President of Financial Planning and Analysis, Director of Internal Audit, and Assistant Controller. Ms. Adams holds a degree in accounting from the University of Texas at Austin and is a licensed CPA in the State of Texas.
There are no family relationships between any of the executive officers.
Section 16(a) Beneficial Ownership Reporting Compliance
Section 16(a) of the Exchange Act, as amended, requires our officers and directors, and persons who beneficially own more than 10% of a registered class of our equity securities, to file initial reports of securities ownership on Form 3 and reports of changes in such ownership on Forms 4 and 5 with the SEC. Based solely on a review of the copies of such reports furnished to us during the fiscal years ended December 31, 2016 and 2015, we believe that all reports of securities ownership and changes in such ownership required to be filed during 2016 and 2015 were timely filed, except for a Form 4 for Mr. Ranson, which was filed late in August 2015 due to administrative error.
Corporate Governance Guidelines and Code of Business Conduct and Ethics for Directors and Employees
Our Board of Directors has adopted Corporate Governance Guidelines and a Code of Business Conduct and Ethics for directors, officers and employees in accordance with NYSE corporate governance listing standards, which were also in effect in their current form as of December 31, 2016. Copies of these documents are set forth on our website, www.hanger.com.
Policy Regarding Director Nominating Process
The Corporate Governance and Nominating Committee has adopted a policy, which was also in effect in its current form as of December 31, 2016, pursuant to which a shareholder who has owned at least 2% of our outstanding shares of Common Stock for at least one year may recommend a director candidate that the Corporate Governance and Nominating Committee will consider when there is a vacancy on our Board of Directors either as a result of a director resignation or an increase in the size of our Board of Directors. Such recommendation must be made in writing addressed to the Chairperson of the Corporate Governance and Nominating Committee at our principal executive offices and must be received by the Chairperson at least 120 days prior to the anniversary date of the release of the prior year’s proxy statement. Although the Corporate Governance and Nominating Committee has not formulated any specific minimum qualifications that it believes must be met by a nominee that the Corporate Governance and Nominating Committee recommends to our Board of Directors, the factors it will take into account will include strength of character, mature judgment, career specialization, relevant technical skills or financial acumen, diversity of viewpoint and industry knowledge, as set forth in the Corporate Governance and Nominating Committee’s charter. There will not be any difference between the manner in which the
committee evaluates a nominee recommended by a shareholder and the manner in which the committee evaluates any other nominee.
While the Corporate Governance and Nominating Committee does not have a formal policy relating specifically to the consideration of diversity in its process to select and evaluate director nominees, the Corporate Governance and Nominating Committee does consider diversity as part of its overall evaluation of candidates for director nominees. Specifically, the “Selection of Board Members” section of our Corporate Governance Guidelines provides that the selection of potential directors should be based on all the factors the Corporate Governance and Nominating Committee considers appropriate, which may include diversity of viewpoints.
Audit Committee
The Audit Committee (as used in this section, the “Committee”) of our Board of Directors, which as of December 31, 2016 consisted of Stephen E. Hare (Chair), Christopher B. Begley and Cynthia L. Feldmann, was formed in accordance with Section 3(a)(58)(A) of the Exchange Act, as amended. It is, and as of December 31, 2016 was, governed by its charter, a copy of which is available on our website, www.hanger.com.
The current members of the Committee are Stephen E. Hare (Chair), Christopher B. Begley, Cynthia L. Lucchese and Thomas C. Freyman. Ms. Lucchese and Mr. Freyman were added as members of the Committee in November 2017. Ms. Feldmann retired from our Board on January 1, 2018.
All the members of the Committee were, as of December 31, 2016, and currently all of the members are “independent” under the rules of the SEC and the listing standards of the NYSE, which means that they did not and have not received any consulting, advisory or other compensatory fee from other than board or committee fees, they were not “affiliated persons” of us and they had no relationship to us that may have interfered with the exercise of their independence from our management. Furthermore, each Committee member was, as of December 31, 2016, and as of the current date has been, deemed by our Board of Directors to be financially literate and at least one member has accounting or related financial management expertise, as called for by NYSE listing standards. Our Board of Directors has determined that Mr. Hare and Mr. Begley are considered to be an “audit committee financial expert” within the meaning of the rules of the SEC. Ms. Feldmann was also considered to be an “audit committee financial expert” when she was serving on the Committee.
ITEM 11. EXECUTIVE COMPENSATION
2016 COMPENSATION DISCUSSION & ANALYSIS
Overview
The following narrative and tables provide the required disclosures with respect to our fiscal year ended December 31, 2016.
Objectives of Our Executive Compensation Program
The compensation program covering our named executive officers is designed to drive our Company’s success, which will be achieved primarily through the actions of talented employees. Our executive compensation program covering named executive officers has specific primary objectives which include:
· attracting qualified and talented executives who are capable of providing the appropriate leadership to our Company;
· retaining executives who have the critical skills our Company needs to meet our strategic and operational objectives; and
· motivating our executives to drive outstanding Company performance.
These objectives reflect our belief, that programs that support the attraction and retention of a highly qualified executive management team-coupled with appropriate incentive programs to motivate performance-serve the long-term interests of our investors.
Compensation arrangements for our named executive officers are designed to reward long-term commitment to our Company’s success. The following principles guide our compensation decisions:
|
Guiding Principle |
|
Hanger Philosophy / Approach |
|
|
|
|
|
Pay for performance |
|
Our compensation program is designed to align executive compensation with the Company’s overall performance and business strategy. The design of our short- and long-term compensation programs is driven by business objectives and performance measures which we believe provide a direct link to the creation of shareholder value. We support a structural pay for performance philosophy by significantly emphasizing variable or at-risk compensation in the overall executive pay program. |
|
Facilitate alignment with shareholders |
|
Our long-term incentives are delivered in the form of equity to provide executives with a direct interest in the performance of our stock. We have adopted and implemented stock ownership guidelines for our executives which reinforce this principle. |
|
Be internally equitable |
|
Our executive compensation programs are designed to provide compensation that is fair and equitable based on the performance of the executive and the Company. In addition to conducting analyses of market pay levels, we consider the pay of the named executive officers relative to one another and relative to other members of the management team. |
|
Promote sound corporate governance objectives |
|
We seek broad compliance with all applicable legal, regulatory and financial regulations and requirements in the context of our executive compensation program. In addition, when designing and implementing our executive compensation programs, we give due consideration to the impact such programs have on shareholders and any relevant tax and accounting implications that may arise in connection with such programs. |
|
Provide leadership stability and continuity |
|
Our executive programs are designed to reward both long-term contributions to the Company, as well as attract new executive talent and reward commitment of our executives to our Company regardless of their length of service with the Company. We recognize that the stability of the leadership team enhances our business. |
|
Be competitive |
|
We conduct market pay analyses to ensure the compensation we pay our executives is competitive in terms of the elements and mix of pay, program design and resulting actual levels of pay. |
|
Reflect factors of role and individual |
|
We use the information from market pay analyses and apply it to the individual situation of each of our executives to ensure we are compensating for the officer’s responsibilities and the individual’s skills and performance. |
|
Encourage long-term executive service |
|
We provide our named executive officers with tax effective savings opportunities. Our savings and retirement plans, along with a market competitive offering of other pay elements, encourage employees to join and remain at our Company. In addition, the vesting provisions established for all of our long-term incentive vehicles support this objective. |
Named Executive Officers
Based on their compensation for the fiscal year ended December 31, 2016, the following individuals have been identified as the named executive officers for purposes of disclosure in this Annual Report on Form 10-K:
· Vinit K. Asar, our President and Chief Executive Officer;
· Thomas E. Kiraly, our Executive Vice President and Chief Financial Officer;
· Samuel M. Liang, our President of Hanger Clinic;
· Kenneth W. Wilson, our former President and Chief Operating Officer of Southern Prosthetic Supply, Inc. and our current President of Products & Services; and
· Thomas E. Hartman, our Senior Vice-President, General Counsel and Secretary.
Overview of Our Executive Compensation Programs
Below are the purpose and key elements of our executive compensation program.
|
Element |
|
Purpose and Characteristics |
|
|
|
|
|
Base Salary |
|
· Fixed pay element to compensate for an individual’s competencies, skills and experience as valued in the marketplace and within the Company and to reward continued performance. |
|
|
|
|
|
|
|
· Base salary may be adjusted annually/periodically based on changes in job responsibilities, market conditions and individual performance. |
|
|
|
|
|
Short-Term Incentives |
|
· Performance-based annual cash opportunity to motivate and reward the achievement of annual financial results relative to business specific targets and individual goals tied to strategic initiatives. |
|
|
|
|
|
|
|
· Incentive goals are aligned with stakeholders’ interests. |
|
|
|
|
|
|
|
· Awards, if earned, are payable based on actual results. |
|
|
|
|
|
Long-Term Incentives |
|
· Performance-based equity opportunity to motivate and reward financial performance and stock price appreciation. |
|
|
|
|
|
|
|
· Amounts earned and realized will vary from the grant date fair value based on actual stock price performance. |
|
|
|
|
|
Retirement Benefits |
|
· Component of compensation that accrues each year to encourage employment stability of our executive leadership. |
|
|
|
|
|
|
|
· Benefits are payable upon or after retirement. |
|
|
|
|
|
Other Benefits and Perquisites |
|
· Generally certain pay elements which provide for life and income security needs; the actual cost to the Company is based on participation/usage. |
|
|
|
|
|
Severance Benefits |
|
· Contingent component to provide a bridge to future employment in the event an executive’s employment is terminated. |
|
|
|
|
|
|
|
· Payable only if an executive’s employment is terminated in certain predefined situations. |
Consideration of Advisory Shareholder Vote on Executive Compensation
As a result of the Company’s delay in filing periodic reports with the SEC, we have not held an annual meeting of shareholders since May 2014. Though no shareholder meeting was conducted in 2015 to 2017 given the delay in our periodic reporting with the SEC, our Compensation Committee appreciates and values the compensation views of shareholders. Without the ability to respond to shareholders’ vote on our pay proposals, our Compensation Committee relied more heavily on the benchmarking and advice provided by the Committee’s independent compensation advisors for input into the Company’s pay practices. Our Compensation Committee concluded that the compensation paid to our executive officers and the Company’s overall pay practices continue to align with competitive marketplace practices and ranges. As a result, our Compensation Committee decided to retain our general approach to executive compensation, with an emphasis on performance-based annual and long-term incentive compensation that rewards our most senior executives when they successfully implement our business plan and, in turn, deliver value for our shareholders.
Our Compensation Committee recognizes that executive pay practices and notions of sound governance principles continue to evolve. Consequently, our Compensation Committee intends to continue paying close attention to competitive market practices and the advice and counsel of its independent compensation advisors and invites our shareholders to communicate any concerns or opinions on executive pay directly to our Compensation Committee or our Board of Directors.
At the annual meeting of shareholders held on May 12, 2011, our shareholders expressed a preference that advisory votes on executive compensation occur every year. In accordance with the results of this vote, our Board of Directors determined to implement an advisory vote on executive compensation every year until the next vote on the frequency of shareholder votes on executive compensation, which is scheduled to occur at our 2018 annual meeting of shareholders.
Pay Setting Process
Our Compensation Committee has used Korn Ferry Hay Group (“KFHG”) as its compensation consultant on executive compensation matters. In 2016, our Compensation Committee decided to evaluate services for consulting support by formally requesting proposals from six compensation consulting firms. After proposal reviews and interviews, the Compensation Committee decided to continue the engagement with KFHG. Our Compensation Committee also assessed the independence of KFHG and concluded that the work performed by the consultants for our Compensation Committee did not raise any conflict of interest under NYSE listing standards or SEC rules. For 2016, KFHG was paid $113,413 for executive compensation consulting services. For other executive search and management consulting services provided to our Company in 2016, KFHG was paid $492,237.
Our Compensation Committee works closely with our compensation consultant to understand general market practices, prevalence and trend information on the levels of salary, target annual incentives and long-term incentives, the relative mix of short- and long-term incentives and the mix of cash and stock-based pay for our executive roles. To determine competitive market pay, our Compensation Committee periodically analyzes the annual proxy statements of a peer group of companies and published survey data. In setting pay for our named executive officers, our Compensation Committee has established the target for compensation, by element and in the aggregate, as the competitive market pay median (50th percentile). Our competitive market pay median (the “Median”) is determined by averaging the in-depth peer group analysis and the published survey data. The design of our annual and long-term incentive plans provides our executives with the opportunity to exceed the Median for total direct compensation (the sum of base salary, annual bonus and long term incentives) based on Company performance. Actual compensation on a yearly basis, based on Company and individual performance, can vary widely, as our history has demonstrated.
Peer Group
Our Compensation Committee reviews and approves annually a peer group that it believes best reflects the competitive market for talent in our industry. In August 2015, our Compensation Committee approved the peer group listed below (the “2016 Peer Group”) to benchmark the overall executive pay program for our named executive officers. Our peer group construction methodology generally utilizes the following selection parameters to select peer companies: (1) company revenue size within a specified range of our historic revenue; (2) healthcare services, facilities or services industry sector; (3) similar healthcare payment models; (4) similar executive talent market; (5) national or global presence of business; and (6) demographics of customers.
When our Compensation Committee re-examined the peer group for 2016, it used a number of specific factors as criteria for inclusion including organization size and scope, industry and sector competitors, business model and executive talent market. The Compensation Committee chose to add four companies to the peer group for 2016: (1) Acadia Healthcare Co. Inc., (2) Air Methods Corp., (3) Civitas Solutions Inc., and (4) Providence Service Corp. The 2016 Peer Group does not include Gentiva Health Services Inc., Skilled Healthcare Group Inc. and IPC The Hospitalist Co. Inc., which were part of our Peer Group for 2015, as a result of acquisitions.
Our Compensation Committee believes that the 2016 Peer Group was reflective of the market we faced in 2016 and positioned our executive compensation benchmarking appropriately. Our Compensation Committee believes that, while they are not specific to the orthotics and prosthetics area of health care, the companies in the peer group reflect the range of business sectors where we are active. The sub-industry mix of these companies is 25% in Health Care Equipment, 31% in Health Care Facilities and 44% in Health Care Services. Our Compensation Committee further believes that these companies have executive talent who possess comparable skills and face similar business challenges common to our industry.
|
Peer Companies (1) |
|
Sub-Industry |
|
Acadia Healthcare Co. Inc. |
|
Health Care Facilities |
|
Air Methods Corp. |
|
Health Care Services |
|
Amedisys Inc. |
|
Health Care Services |
|
AmSurg Corp. |
|
Health Care Facilities |
|
Civitas Solutions Inc. |
|
Health Care Services |
|
Five Star Quality Care Inc. |
|
Health Care Facilities |
|
Healthsouth Corp. |
|
Health Care Facilities |
|
Healthways Inc. (rebranded to become Tivity Health) |
|
Health Care Services |
|
Integra LifeSciences Holdings Corporation |
|
Health Care Equipment |
|
LHC Group Inc. |
|
Health Care Services |
|
MEDNAX, Inc. |
|
Health Care Services |
|
National Healthcare Corp. |
|
Health Care Facilities |
|
Orthofix International N.V. |
|
Health Care Equipment |
|
Providence Service Corp. |
|
Health Care Services |
|
Teleflex Incorporated |
|
Health Care Equipment |
|
Wright Medical Group Inc. |
|
Health Care Equipment |
(1) The 2016 Peer Group’s 50th percentile revenue for fiscal year 2014, which was the data available to the Compensation Committee at the time that the peer group was selected, was $1,105 million.
Our Compensation Committee reviewed and considered KFHG’s analysis of the 2016 Peer Group pay practices for similarly situated executives to each named executive officer. KFHG’s analysis included, but was not limited to, a review of pay levels (base salary, annual incentives, total cash compensation, long-term incentives and total direct compensation) and pay structure (allocation of pay among base salary, annual incentives and long-term incentives).
Compensation Survey Data
In addition to the 2016 Peer Group data, our Compensation Committee also considered published survey data for a broader market perspective on executive compensation pay levels and practices. We believe that an alternative lens into the executive labor market is appropriate and meaningful in that survey data provides a robust data set, can be utilized for other executives who are not named executive officers and is consistent with our holistic approach to benchmarking executive compensation. For purposes of this year’s assessment, we used KFHG’s 2015 Industrial Industry Survey. The cash compensation data was aged to November 1, 2015. Our Compensation Committee was provided a specific list of companies underlying the survey data, but did not select or otherwise have input on the companies participating in the survey.
Factors to Set or Adjust Pay
For each named executive officer, our Compensation Committee considers the relevant data regarding our peer group and the salary survey data. For each individual, we also focus specifically on:
· The transferability of professional and managerial skills;
· The depth of knowledge and experience in orthotics and prosthetics and related industries;
· The relevance of the named executive officer’s experience to other potential employers; and
· The readiness of the named executive officer to assume a different or more significant role either within our Company or with another organization.
The following factors are also considered in setting and adjusting pay for our named executive officers:
· The Company’s financial performance;
· The individual’s past and expected future performance;
· Peer group pay practices and broader market developments/trends; and
· Our business and people needs.
Focus on Pay-for-Performance
Our Compensation Committee sets each officer’s total direct compensation to approximate Median practices.
Consistent with our compensation philosophy and objectives, our Compensation Committee emphasizes performance-based incentive opportunities, particularly long-term incentives, over base salary when determining the mix of elements that constitute an officer’s total direct compensation. The following tables show the targeted and actual 2016 pay mix for our Chief Executive Officer and for our other named executive officers as a group.
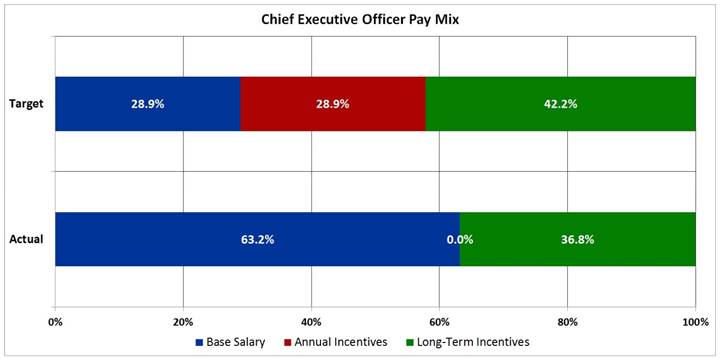
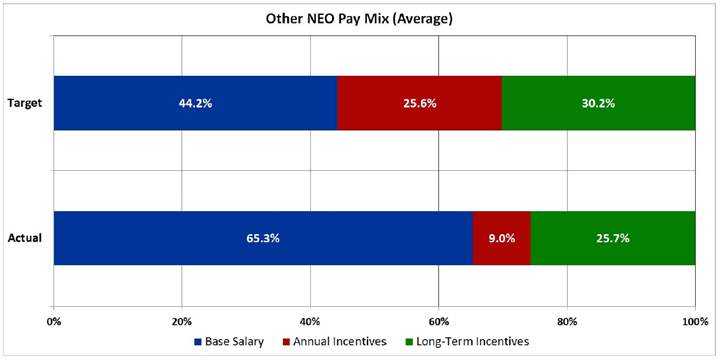
Determination of Pay Elements
In developing the pay programs and levels for our named executive officers, our Compensation Committee reviews peer group pay practices, survey data and other relevant benchmarks provided by the compensation consultant. Any changes to base salary and annual incentive target amounts generally become effective in March of each year.
Annually, our Chief Executive Officer reviews the performance of each of the other named executive officers and shares his perspective with our Compensation Committee. Our Compensation Committee considers this performance information in setting the pay for our named executive officers other than our Chief Executive Officer. All decisions regarding any adjustment to the compensation of our Chief Executive Officer are made solely by our Compensation Committee based on both competitive pay practices as well as our Compensation Committee’s assessment of his performance.
Our Compensation Committee considers previous compensation earned by the named executive officers and current Company stock holdings when making compensation decisions. We believe that our named executive officers should be fairly and competitively compensated, both for annual and long-term compensation opportunities, based on the Company’s performance and each individual’s performance.
Our Compensation Committee may meet in executive session without the presence of any member of management and/or the consultant in making its decisions regarding the compensation of any of our named executive officers.
When making any executive compensation decision, our Compensation Committee follows a deliberate, multiple-step process:
1. Information review;
2. Evaluation and deliberation; and
3. Decision making.
First, our Compensation Committee collects all essential information that may be necessary to make an educated decision from our compensation consultant, our Chief Executive Officer or other sources. Next, our Compensation Committee members discuss the information and a deliberation of possible options ensues. After discussion, our Compensation Committee takes time for reflection and, where appropriate, consultation with other members of our Board of Directors. Finally, our Compensation Committee reconvenes for additional discussion, if needed, before a final decision is made. As a result, some compensation decisions require two or more Compensation Committee meetings before any final decisions are made.
Additional information about the role and processes of our Compensation Committee is outlined in our Compensation Committee charter, which is available on the Company’s website at www.hanger.com.
Base Salary
As discussed above, our Compensation Committee targets base salary levels for our named executive officers at the Median. Currently, our named executive officers’ base salaries fall within the competitive range of the Median, which we broadly define as within 85% to 115% of the Median for each position. Individual increases to base salary are based upon several considerations, including individual performance and contributions, internal equity considerations, as well as competitive market factors and practices.
Base salary compensates a named executive officer for the individual’s competencies, skills, experience and performance. When considering a candidate for a named executive officer role, our Compensation Committee considers all of these factors. For annual adjustments to the base salary of a named executive officer, our Compensation Committee primarily considers the Median, information set forth in general industry surveys, the Company’s performance, the individual’s performance and internal equity amongst our officers. Changes in the scope of a named executive officer’s role and responsibilities could result in an adjustment being considered and approved by our Compensation Committee at any time during the year.
For 2017 base salary adjustments, our Compensation Committee considered the peer group analysis and published survey data described earlier. In consultation with the Compensation Committee, the timing of the merit cycle review was delayed until June 2017 for the entire Company, including our named executive officers, as part of our Company’s expense prioritization for 2017. Our Compensation Committee believes that appropriate adjustments to base salary should continue to position the pay of our named executive officers within the competitive range of the Median.
Short-Term Incentive Compensation
Our Compensation Committee designs the short-term incentive compensation program to motivate and reward the achievement of annual financial results and individual goals. Currently, our philosophy for short-term incentive compensation is to generally target the Median and to provide the opportunity to earn in the range of the 75th percentile compared to peer group and published survey data with the achievement of exceptional Company and individual performance. In other words, when we reach target performance for the goals discussed below, then short-term incentive compensation should be close to the Median. If our Company and our named executive officers have exceptional performance based on the established performance goals, then short-term incentive compensation should exceed the Median and could approach the 75th percentile compared to the peer group and published survey data.
In 2016, our Compensation Committee approved the continuation of the short-term incentive program comprised of two financial metrics which are leveraged by individual operational and strategic performance. The two metrics are revenue and “Adjusted EBITDA” which is defined as earnings before interest, taxes, depreciation, amortization, impairment of intangible assets, fees paid to third parties for Remediation and other miscellaneous non-recurring items. Revenue is weighted 35% and Adjusted EBITDA is weighted 65% to provide more emphasis on profitability to align with the current strategic initiatives of the Company while maintaining an appropriate emphasis on top-line growth. This was a change from the 2015 short-term incentive program where the metrics were equally weighted 50%. To receive any payment, the minimum threshold must be met for Adjusted EBITDA. If the results of the financial metrics are within the performance ranges established for the plan, the amounts actually earned by the named executive officer are determined on the basis of individual performance against individual goals. Each financial metric is calculated independently with a potential funding for each metric that ranges from 35% of the target at threshold to 100% if financial goals are achieved at the target level and 200% if the financial goals are achieved at or above the maximum levels. The financial performance measures for our 2016 annual incentive program were:
|
Performance Measure |
|
Percentage |
|
|
Revenue |
|
35 |
% |
|
Earnings Before Interest, Taxes, Depreciation, Amortization and other items (“Adjusted EBITDA”) |
|
65 |
% |
The financial results used for the short-term incentive are for all of Hanger (enterprise) for all named executive officers except the President of Hanger Clinic. The table below shows the business unit mix for each executive.
Business Unit Mix for Financial Measures
|
Named Executive Officers |
|
Enterprise |
|
Hanger Clinic |
|
|
Vinit K. Asar |
|
100 |
% |
|
|
|
Thomas E. Kiraly |
|
100 |
% |
|
|
|
Samuel M. Liang |
|
75 |
% |
25 |
% |
|
Kenneth W. Wilson |
|
100 |
% |
|
|
|
Thomas E. Hartman |
|
100 |
% |
|
|
The financial goals for our 2016 short-term incentive program at threshold, target and maximum are presented in the table below. As noted in a footnote to the table, audited results for 2016 were not available to our Compensation Committee at the time of determination of bonuses (in millions):
|
|
|
Threshold |
|
Target |
|
Maximum |
|
Actual Results(1) |
| |||
|
Enterprise Measures |
|
|
|
|
|
|
|
|
| |||
|
Revenue |
|
$ |
1,064.9 |
|
$ |
1,116.2 |
|
$ |
1,196.6 |
|
N/A |
|
|
Adjusted EBITDA |
|
$ |
123.9 |
|
$ |
134.0 |
|
$ |
150.0 |
|
N/A |
|
|
|
|
|
|
|
|
|
|
|
| |||
|
Hanger Clinic Measures |
|
|
|
|
|
|
|
|
| |||
|
Revenue |
|
$ |
875.0 |
|
$ |
916.2 |
|
$ |
970.4 |
|
N/A |
|
|
Adjusted EBITDA |
|
$ |
145.5 |
|
$ |
155.5 |
|
$ |
171.1 |
|
N/A |
|
|
(1) Actual results for 2016 were not available until the completion of our audited 2016 financial statements in January 2018. Accordingly, these are not disclosed in this table as they were not available to the Compensation Committee for purposes of determining bonuses. |
Our Compensation Committee sets the performance measure targets for a given year based on the Company’s strategic budgeting and goal setting process that begins in October of the previous year and is finalized in February of the year for which the targets will apply. In the first quarter of each year, our Compensation Committee approves the specific objectives for threshold, target and maximum levels for each of the performance measures used for the short-term incentive program for our named executive officers.
In addition to these financial goals, our named executive officers have individual goals that they must achieve for their individual performance which are focused on the Company’s strategic and operational initiatives. Individual performance is measured on initiatives such as cost reductions, process improvement, business development opportunities and people initiatives. An executive’s individual objectives may be qualitative and/or quantitative. The individual goals are typically developed to be stretch goals that are challenging for the executive to achieve. The overall results took into consideration our unaudited financial results where applicable.
|
Named Executive Officer |
|
2016 Individual Performance Goals/Results |
|
|
|
|
|
Mr. Asar |
|
Goals: financial growth objectives, culture evolution, accounting and shareholder accountability, strategic growth and key leadership development. |
|
|
|
Results: in total, Mr. Asar’s results were near target. |
|
|
|
|
|
Mr. Kiraly |
|
Goals: accounting organization and processes, business and field process improvements, revenue cycle and accounts receivable and stakeholder credibility. |
|
|
|
Results: in total, Mr. Kiraly’s results were above target. |
|
|
|
|
|
Mr. Liang |
|
Goals: financial growth objectives, field process improvements, clinic strategic value initiatives and talent engagement and retention. |
|
|
|
Results: in total, Mr. Liang’s results were near target. |
|
|
|
|
|
Mr. Wilson |
|
Goals: financial growth objectives, supply chain transformation, strategic growth plan and customer satisfaction improvements. |
|
|
|
Results: in total, Mr. Wilson’s results were at target. |
|
|
|
|
|
Mr. Hartman |
|
Goals: regulatory initiatives, securities litigation, material weakness remediation and compliance programs. |
|
|
|
Results: in total, Mr. Hartman’s results were above target. |
After year end, our Compensation Committee assesses the attainment of the performance measures for the most recently completed year for the short-term incentive program against both financial and individual goals. Typically, the Compensation Committee makes the final assessment of the year-end results in February, at which time bonuses, if any, are approved for payment by March 15th. In February 2017, we did not have final, audited financial results for the 2016
performance year as a result of our ongoing financial restatement process, and so the Compensation Committee used unaudited financial results to assess attainment of bonuses. Given that the financial results were well below the minimum funding threshold, the Compensation Committee concluded there would be no performance measure-based payouts to any employees, including the named executive officers, under the 2016 short-term incentive program.
Nevertheless, the Compensation Committee decided that it would consider the payment of discretionary bonuses under the 2016 short-term incentive program to Company employees based on individual employee performance and other criteria. However, prior to the Compensation Committee’s actual determination regarding discretionary bonuses, certain executive officers of the Company, including the named executive officers, requested that they be excluded from consideration for discretionary bonuses that may otherwise have been awarded to them in order to increase the aggregate amount available to fund discretionary bonuses under the 2016 short-term incentive program for other employees. Accordingly, the Compensation Committee did not award discretionary bonuses to these executive officers.
The target and maximum annual incentive awards for 2016 expressed as a percentage of base salary for our named executive officers are included in the below table. Our Compensation Committee sets these targets for annual incentives based on the Median of the annual incentives of our peer group and published survey data provided by our compensation consultant as discussed previously. Our Compensation Committee used the same percentages of base salary for our continuing officers in the 2017 short-term incentive plan.
|
Incentive Awards Expressed as a Percentage of Base Salary |
|
Target |
|
Maximum |
|
|
Vinit K. Asar |
|
100 |
% |
200 |
% |
|
President and Chief Executive Officer |
|
|
|
|
|
|
Thomas E. Kiraly |
|
70 |
% |
140 |
% |
|
Executive Vice President and Chief Financial Officer |
|
|
|
|
|
|
Samuel M. Liang |
|
60 |
% |
120 |
% |
|
President, Hanger Clinic |
|
|
|
|
|
|
Kenneth W. Wilson |
|
50 |
% |
100 |
% |
|
President, Products & Services |
|
|
|
|
|
|
Thomas E. Hartman |
|
50 |
% |
100 |
% |
|
Senior Vice President, General Counsel and Secretary |
|
|
|
|
|
Long Term Incentive Compensation
Long term incentive compensation opportunities are provided to our named executive officers to encourage the executives’ continued commitment to our Company by motivating and rewarding financial performance and stock price appreciation. Our Compensation Committee believes this is an important component of their pay which directly aligns the interests of our executives with the interests of our shareholders since amounts granted, earned and realized are dependent on actual stock price performance.
Our Compensation Committee approved 2016 grants in April 2016 rather than March (which historically has been the month of grant) to give the Compensation Committee additional time to review with its compensation consultants various long-term incentive alternatives as a result of the February 2016 delisting of the Company’s common stock from the NYSE and related relisting on the OTC. Based on updated benchmarking data, the Compensation Committee agreed to change its grant value planning using 60-day trailing averages to the practice of using a single date grant value (i.e., the closing price of the stock preceding the grant date). As a result of the significant drop in the Company’s common stock price at the end of February 2016, the Compensation Committee also reviewed carefully the burn rate and dilution implications of grants. With the assistance of the Compensation Committee’s independent compensation advisors, the Compensation Committee determined grant sizes taking into account factors, including value on grant date, dilution, burn rate, and the Company’s recent and expected financial performance. The Compensation Committee approved grants for management, employees and non-employee directors that did not exceed a 2.5% annual burn rate. For purposes of this discussion, references to “burn rate” are generally intended to mean the number of equity awards granted divided by the Company’s weighted average shares outstanding.
As with the other elements of our compensation program, our Compensation Committee targets the Median of competitive market data to set our long term incentive awards with the potential to earn above the Median if the Company has
exceptional performance. Our Compensation Committee also considers each individual’s performance and contributions to the Company’s performance as well as the contributions that are expected to be made in the future based on the executive’s role. Our Compensation Committee approves all grants to named executive officers.
Our Compensation Committee continued in 2016 its focus on the use of performance-based restricted share units by granting 50% of the shares as performance-based restricted share units and 50% as time-based restricted share units for all named executive officers with the exception of Mr. Asar, who has a 60/40 split of performance-based/time-based restricted share units, respectively. The time-based restricted share units granted to our named executive officers vest 25% annually over four years on the anniversary of the grant date commencing on the first anniversary. The performance-based restricted share units are only earned if the Company achieves the adjusted Earnings Per Share (“EPS”) performance goal established at the time of the grant and the related service conditions are met. If performance-based restricted share units are earned, the earned shares will vest 25% annually over four years on the anniversary of the grant date commencing on the first anniversary. The adjusted EPS goal for the 2016 grant was to achieve $0.85 per share for the twelve month period from January 2016 through December 2016. Our Compensation Committee created an additional incentive for the named executive officers if this adjusted EPS target was exceeded. Specifically, if the Company achieved an adjusted EPS goal of $0.95, then the named executive officers would receive 150% of their target performance-based awards. In February 2017, we did not have final, audited financial results for the 2016 performance year. Nevertheless, since the unaudited financial results for EPS were well below the threshold, the Compensation Committee cancelled all performance-based restricted share units granted in 2016.
Our restricted share unit awards are generally taxable income to the named executive officer when the award vests in the amount equal to the number of share units vested multiplied by our stock price on the vesting date. We generally receive a tax deduction in the same amount at the same time. The grants are valued as of the grant date for accounting purposes in accordance with FASB Accounting Standards Codification 718 (“ASC 718”).
Our Compensation Committee approved the 2017 grants in March 2017 using a 50/50 split between performance-based and time-based grants for all named executive officers with the exception of Mr. Asar, who received his grants using a 60/40 split because of the Compensation Committee’s desire to have a higher performance mix for his performance-based compensation. Like the approach for the 2016 grant cycle, the Compensation Committee agreed to use a single date grant value (i.e., the closing price of the stock preceding the grant date) and the burn rate and dilution implications of grants. With the assistance of the Committee’s independent compensation advisors, the Compensation Committee determined grant sizes taking into account factors including value on grant date, dilution, burn rate, and the Company’s recent and expected financial performance. The Compensation Committee approved grants for management and employees, and when combined with the non-employee director grants in May, the grants did not exceed a 2.5% annual burn rate. The grant date for management and employees was March 8, 2017, with four year vesting. The Compensation Committee had multiple discussions with its independent compensation advisors about additional long-term retention strategies beyond the annual long-term incentive program for key leaders, including the named executive officers, given the contributions made and still required through this stabilization and preparation for growth phases of the Company. The Compensation Committee agreed it would consider deploying a special one-time grant for both recognition and retention after the Company filed its 2014 Form 10-K.
Other Pay Elements
Off-Cycle Incentive Awards
The Compensation Committee, in concert with Mr. Asar, our President and Chief Executive Officer, approved special off-cycle bonus and equity awards in the second half of 2016 in order to provide recognition for key achievements, and program and process improvements, and to further improve retention. These awards were made to a number of executive and other officers of the Company, including certain named executive officers, but at his request, did not include Mr. Asar. The named executive officers received the following discretionary cash bonus awards: Mr. Hartman received $100,000, Mr. Liang received $75,000 and Messrs. Kiraly and Wilson each received $25,000. Additionally, Messrs. Kiraly, Liang, Wilson, and Hartman also each received a discretionary equity award of 5,000 restricted stock units with a four-year vesting period.
General Employee Benefits
Our Compensation Committee provides our executives, and all of our employees who qualify, with a benefits program that includes health, dental, disability and life insurance as well as a 401k savings plan with a Company match. This basic yet comprehensive approach provides our named executive officers with a broad umbrella of coverage.
Employment Agreements
Our Company has entered into employment agreements with all of our named executive officers. The agreements generally provide for compensation and benefits such as:
· Base salary;
· Annual and long-term incentive opportunities;
· Benefits that are provided to all of our employees who meet the eligibility requirements;
· Various executive benefits such as a company provided automobile;
· Severance benefits; and
· Change in control severance protection which may only be triggered upon a change in control and a material change in the terms of employment or responsibilities.
Our Company currently provides no other special benefits not outlined in the agreements. In January 2012, our Compensation Committee amended the agreements to eliminate all excise tax gross-ups for executive benefits. The excise tax gross-up provisions were replaced with a provision that provides that the payments made to an executive officer under the agreement, and any other payments made in connection with the change of control of the Company, will either be capped as necessary to avoid the officer incurring any excess parachute payment excise tax or be paid in full (with the officer paying any excise taxes due), whichever places him or her in the best after-tax position.
We believe these employment agreements provide clarity as to the terms and conditions of employment as well as protect the Company’s interests through the non-compete provisions. Further, we intend for the change in control benefits to provide some economic stability to our named executive officers to enable them to focus on the performance of their duties without undue concern over their personal circumstances if there is a potential change of control of our Company.
The employment agreement of each named executive officer is described below.
Employment Agreement with Mr. Vinit K. Asar
The employment and non-compete agreement between the Company and Vinit K. Asar, our President and Chief Executive Officer, as amended and restated August 27, 2012, provides for the continued employment of Mr. Asar unless the employment agreement is terminated by either party pursuant to the terms therein.
The employment agreement entitles Mr. Asar to certain perquisites that were offered to him to complete his overall annual compensation package. These benefits include:
· Premiums for supplemental life insurance equal to two times his salary; and
· An automobile allowance in the amount of $1,250 per month and the provision of, or reimbursement for, parking of such automobile at our main office.
Mr. Asar is a participant in our Supplemental Executive Retirement Plan. Pursuant to the agreement, his benefit under this plan is equal to 65% of his final average base salary based on the three highest years of the last five years of his employment assuming normal retirement age of 65.
Mr. Asar’s employment agreement contains a severance provision which provides that upon the termination of his employment without cause, Mr. Asar will receive severance compensation equal to 24 months of his base salary then in effect plus two years of his annual target bonus, as well as continuation of certain welfare and perquisite benefits for a period of eighteen months. In addition, Mr. Asar will be eligible for outplacement services commensurate with those available to other senior corporate officers of the Company for a period of 24 months following such termination.
Mr. Asar’s employment agreement further provides that upon the occurrence of a material and negative alteration of the scope of Mr. Asar’s position, duties or title, or upon the occurrence of a material reduction of his compensation or benefits, Mr. Asar may provide the Company with notice of his intent to resign and, if the Company does not cure such alteration or
reduction within 30 days thereafter, Mr. Asar may resign and receive severance compensation equal to 24 months of his base salary then in effect plus two years of his annual target bonus, as well as continuation of certain welfare and perquisite benefits for a period of eighteen months. In addition, Mr. Asar will be eligible for outplacement services commensurate with those available to other senior corporate officers of the Company for a period of 24 months following such resignation.
Mr. Asar’s employment agreement further provides that if his employment is terminated within two years after a change in control of the Company and the occurrence of a material diminution of his responsibilities, a reduction of his compensation or benefits, a relocation of his principal site of employment more than 50 miles from his then current location or any material breach of his employment agreement by the Company, then within 90 days after the occurrence of any such triggering events, Mr. Asar may resign and receive a continuation of certain welfare and perquisite benefits for a period of eighteen months and severance compensation equal to 24 months of his base pay then in effect plus two years of his annual target bonus. In addition, Mr. Asar will be eligible for outplacement services commensurate with those available to other senior corporate officers of the Company for a period of 24 months following such termination.
All restricted share units granted to Mr. Asar will immediately vest on the date of his termination, if such termination is by reason of his death or disability, termination without cause, a voluntary termination following the occurrence of certain material alterations or reductions which are not timely corrected by the Company, retirement upon or after age 65 or following a change in control.
Mr. Asar’s agreement also contains non-compete and non-solicitation provisions that provide that upon the termination of his employment, he will be unable to engage in any business that is competitive with the Company anywhere in the continental United States, and he will be unable to solicit any of the Company’s employees or customers for a period of 24 months.
Employment Agreement with Mr. Thomas E. Kiraly
The employment and non-compete agreement between the Company and Thomas E. Kiraly, our Executive Vice President and Chief Financial Officer, dated as of September 5, 2014, provides for the continued employment of Mr. Kiraly unless the employment agreement is terminated by either party pursuant to the terms therein.
The employment agreement entitles Mr. Kiraly to certain perquisites that were offered to him to complete his overall annual compensation package. These benefits include:
· Life insurance equal to whatever the Company provides to its employees, plus additional life insurance in an amount equal to $450,000;
· The option to participate in the Company’s supplemental life and accidental death and dismemberment insurance policies; and
· An automobile allowance in the amount of $1,000 per month and the provision of, or reimbursement for, parking of such automobile at our main office.
Mr. Kiraly is also entitled to participate in our Supplemental Executive Retirement Plan.
Mr. Kiraly’s employment agreement contains a severance provision which provides that upon the termination of his employment without cause, Mr. Kiraly will receive severance compensation equal his base salary at the annual amount then in effect and vacation accrued through the termination date and his bonus for the termination year. In addition, on the date that is six months and one day after the termination date, a lump sum equal to eighteen months his base salary then in effect plus an additional bonus payment equal to one and one-half times the target bonus for the termination year, as well as continuation of certain welfare and perquisite benefits for a period of eighteen months. In addition, Mr. Kiraly will be eligible for outplacement services commensurate with those available to other senior corporate officers of the Company for a period of eighteen months following such termination.
Mr. Kiraly’s employment agreement further provides that if his employment is terminated within two years after a change in control of the Company and the occurrence of a material diminution of his responsibilities, a reduction of his compensation or benefits, a relocation of his principal site of employment more than 50 miles from his then current location or any material breach of his employment agreement by the Company, then within 90 days after the occurrence of any such triggering events, Mr. Kiraly may resign and receive a continuation of certain welfare and perquisite benefits for a period of eighteen months and his severance compensation. In addition, Mr. Kiraly will be eligible for outplacement services
commensurate with those available to other senior corporate officers of the Company for a period of eighteen months following such termination. In the event of his death or disability, Mr. Kiraly or his estate will receive a payment equal to his base salary at the annual rate in effect and vacation as accrued through the termination date and his bonus.
All restricted share units granted to Mr. Kiraly will immediately vest on the date of his termination, if such termination is by reason of his death or disability, termination without cause, a voluntary termination following the occurrence of certain material alterations or reductions which are not timely corrected by the Company, retirement upon or after age 65 or following a change in control.
Mr. Kiraly’s agreement also contains non-compete and non-solicitation provisions that provide that upon the termination of his employment, he will be unable to engage in any business that is competitive with the Company anywhere in the continental United States, and he will be unable to solicit any of the Company’s employees or customers for a period of 24 months.
Employment Agreement with Mr. Samuel M. Liang
The employment and non-compete agreement between the Company and Samuel M. Liang, President of Hanger Clinic, dated September 1, 2014, provides for the continued employment of Mr. Liang unless the employment agreement is terminated by either party pursuant to the terms therein.
The employment agreement entitles Mr. Liang to certain perquisites that have been offered to him to complete his overall annual compensation package. These benefits include:
· Premiums for supplemental life insurance equal to $450,000; and
· An automobile allowance in the amount of $1,000 per month and the provision of, or reimbursement for, parking of such automobile at our headquarters.
Mr. Liang is entitled to participate in our Supplemental Executive Retirement Plan. Mr. Liang’s contribution in the Supplemental Executive Retirement Plan shall be determined annually by the Board of Directors or a committee thereof.
Mr. Liang’s employment agreement contains a severance provision which provides that upon the termination of his employment without cause, Mr. Liang will receive severance compensation equal to eighteen months of his base salary then in effect plus a bonus payment of one and one-half times his annual target bonus plus reimbursement for the costs of his benefits for a period of eighteen months. In addition, Mr. Liang will be eligible for outplacement services commensurate with those available to other senior corporate officers of the Company for a period of eighteen months following such termination.
Mr. Liang’s employment agreement further provides that if his employment is terminated within two years after a change in control of the Company and the occurrence of any termination, a material diminution of his responsibilities, a reduction of his compensation, a failure to provide benefits, a relocation of his principal place of employment more than 50 miles from his then current location, or any material breach of his employment agreement by the Company, then within 90 days after the occurrence of any such triggering events, Mr. Liang may resign and receive a payment equal to his base salary then in effect, his accrued vacation and his annual target bonus. In addition, he will receive reimbursement for the costs of his benefits for a period of eighteen months and severance compensation equal to eighteen months of his base salary then in effect plus a bonus payment of one and one-half times his annual target bonus.
All restricted share units granted to Mr. Liang will immediately vest on the date of his termination, if such termination is by reason of his death or disability, termination without cause, retirement upon or after age 65 or following a change in control.
Mr. Liang’s agreement also contains non-compete and non-solicitation provisions that provide that during Mr. Liang’s employment and for a period of 24 months thereafter, he will be unable to engage in any business that is competitive with the Company at any location within the contiguous United States and he will be unable to solicit any of the Company’s employees or customers during such period.
Employment Agreement with Mr. Kenneth W. Wilson
The employment and non-compete agreement between the Company and Kenneth W. Wilson, President of Products & Services, as amended and restated February 25, 2013, provides for the continued employment of Mr. Wilson unless the employment agreement is terminated by either party pursuant to the terms therein.
The employment agreement entitles Mr. Wilson to certain perquisites that were offered to him to complete his overall annual compensation package. These benefits included:
· Premiums for supplemental life insurance equal to one times his salary; and
· An automobile allowance in the amount of $700 per month.
Mr. Wilson’s employment agreement contains a severance provision that provides that upon the termination of his employment without cause, Mr. Wilson will receive severance compensation equal to eighteen months of his base salary then in effect plus one and one-half years of his annual target bonus, as well as continuation of certain welfare and perquisite benefits for a period of eighteen months. In addition, Mr. Wilson will be eligible for outplacement services commensurate with those available to other senior corporate officers of the Company for a period of eighteen months following such termination.
Mr. Wilson’s employment agreement further provides that if his employment is terminated within two years after a change in control of the Company and the occurrence of a material diminution of his responsibilities, a reduction of his compensation or benefits, a relocation of his principal site of employment more than 50 miles from his then current location or any material breach of his employment agreement by the Company, then within 90 days after the occurrence of any such triggering events, Mr. Wilson may resign and receive a continuation of certain welfare and perquisite benefits for a period of eighteen months and severance compensation equal to eighteen months of his base pay then in effect plus one and one-half years of his annual target bonus. In addition, Mr. Wilson will be eligible for outplacement services commensurate with those available to other senior corporate officers of the Company for a period of eighteen months following such termination.
All restricted share units granted to Mr. Wilson will immediately vest on the date of his termination, if such termination is by reason of his death or disability, termination without cause, retirement upon or after age 65 or following a change in control.
Mr. Wilson’s agreement also contains non-compete and non-solicitation provisions that provide that during Mr. Wilson’s employment and for a period of two years thereafter, he will be unable to engage in any business that is competitive with the Company at any location within the contiguous United States at which he performed services or had oversight management responsibility and unable to solicit any of the Company’s employees or customers during such period.
Employment Agreement with Mr. Thomas E. Hartman
The employment and non-compete agreement between Hanger and Thomas E. Hartman, our Senior Vice President, General Counsel and Secretary, as amended and restated as of March 30, 2012, provides for the continued employment of Mr. Hartman unless the employment agreement is terminated by either party pursuant to the terms therein.
The employment agreement entitles Mr. Hartman to certain perquisites that were offered to him to complete his overall annual compensation package. These benefits included an automobile allowance in the amount of $700 per month and the provision of, or reimbursement for, parking of such automobile at our main office. Mr. Hartman is a participant in our Supplemental Executive Retirement Plan. Pursuant to the agreement, his benefit under this plan is equal to 40% of his final average base salary on the three highest years of the last five years of his employment, assuming normal retirement age of 65.
Mr. Hartman’s employment agreement contains a severance provision that provides that upon the termination of his employment without cause, Mr. Hartman will receive severance compensation equal to one year of his base salary then in effect, plus an additional bonus payment equal to his target bonus for the year in which his employment is terminated, as well as continuation of certain welfare and perquisite benefits for a period of one year. Mr. Hartman’s employment agreement further provides that if his employment is terminated within two years after a change in control of the Company and the occurrence of a material diminution of his responsibilities, a reduction of his compensation or benefits, a relocation of his principal site of employment more than 50 miles from his then current location, or any material breach of his
employment agreement by the Company, then within 90 days after the occurrence of any such triggering events, Mr. Hartman may resign and receive the severance compensation and continuation of benefits described above for a period of one year.
Retirement Benefits
Messrs. Asar and Hartman participate in the Company’s nonqualified defined benefit Supplemental Executive Retirement Plan (the “DB SERP”). This benefit is intended to encourage and reward the long-term commitment of our named executive officers to the Company. The DB SERP is a nonqualified, unfunded plan that provides retirement benefits for executive officers and key employees of the Company as designated by our Compensation Committee. The plan contains provisions to ensure its compliance with Internal Revenue Code Section 409A. An outline of the plan provisions is included in the narrative following the Pension Benefits table.
The estimated present value of these benefits at age 65 for each of our named executive officers is shown in the Pension Benefits Table. The projected change (December 2016 versus December 2015) in the present value of this benefit is shown in the Summary Compensation Table.
In May 2013, our Board of Directors, upon the recommendation of our Compensation Committee, adopted the Hanger, Inc. Defined Contribution Supplemental Retirement Plan (the “DC SERP”). The DC SERP is a nonqualified defined contribution plan in which certain executive officers and other senior employees are eligible to participate. Under the terms of the DC SERP, we may credit a participant’s account with either an amount equal to a specified percentage of the participant’s base salary or a stated flat dollar amount. Although contributions are discretionary, we currently intend to contribute annually an amount to each participant’s account equal to 10-20% of the participant’s base salary. Our Compensation Committee recommended establishing the DC SERP as a means of providing a retirement benefit for certain executive officers who are not covered by the DB SERP. Messrs. Liang, Wilson and Kiraly are the only named executive officers currently participating in the DC SERP. The first credits under the DC SERP for Mr. Kiraly and Mr. Liang were made in the first quarter of 2015.
Other Compensation Related Policies
Securities Trading Policy
Our Company has a policy that executive officers and directors may not purchase or sell our stock when they may be in possession of nonpublic material information. In addition, this policy provides that no director or officer may sell short or engage in transactions in put or call options relating to our securities.
Stock Ownership Guidelines
Our Compensation Committee adopted formal stock ownership guidelines for the named executive officers and other key senior managers at the end of 2007, and amended those stock ownership guidelines in 2009 and 2013. These guidelines require the executives to hold a multiple of their base salary in company shares. The President and Chief Executive Officer is required to hold five times his base salary, the Chief Financial Officer and those named executive officers managing a P&L are required to hold three times their base salary, and the named executive officers in staff executive positions other than the Chief Financial Officer are required to hold one time their base salary. Individuals who are newly promoted or newly hired into a named executive officer position have up to five years to reach this level of ownership. Individuals who do not meet this requirement are subject to an evaluation by our Compensation Committee to review individual circumstances, including but not limited to retirement needs of individual officers.
Due to the significant drop in the Company’s stock price following the Company’s delisting from the NYSE in February 2016, a number of our named executive officers did not meet the stock ownership requirements as of December 31, 2016. Our Compensation Committee evaluated the ownership of each of our named executive officers and determined that no action was necessary to either amend the stock ownership guidelines or to require additional holdings by the named executive officers. This determination was made in large part due to the Company’s unusual situation with respect to its NYSE delisting as well as its delay in filing periodic reports with the SEC, which resulted in our named executive officers’ inability to trade in the Company’s securities - including to purchase additional shares. Our Compensation Committee will continue to monitor the stock ownership guidelines to determine if any changes in the future are warranted.
Impact of Tax and Accounting Considerations
When determining compensation packages for 2015 and 2016, we considered all factors that may impact financial performance, including tax and accounting rules and regulations under Section 162(m) of the Internal Revenue Code, or Code. For each of the 2015, 2016 and 2017 fiscal years, the Code limits the Company from deducting compensation in excess of $1 million paid to the Chief Executive Officer or to the other three highest-paid executive officers (other than the Chief Financial Officer) for those fiscal years. However, compensation paid during those fiscal years that qualifies as performance-based compensation under Section 162(m) will be fully deductible. Our compensation philosophy for 2015, 2016 and 2017 fiscal years emphasizes performance-based compensation for executive officers, thus minimizing the consequences of the Section 162(m) limitation described above. Nevertheless, certain of our performance-based awards, including awards granted under our 2016 Omnibus Incentive Plan, do not qualify for deductibility under Section 162(m) because the plan was not approved by our shareholders.
As a result of changes made by the Tax Cuts and Jobs Act, starting with compensation paid in 2018, Section 162(m) will limit us from deducting compensation, including performance-based compensation, in excess of $1 million paid to anyone who, starting in 2018, serves as the Chief Executive Officer or Chief Financial Officer, or who is among the three most highly compensated executive officers for any fiscal year. The only exception to this rule is for compensation that is paid pursuant to a binding contract in effect on November 2, 2017 that would have otherwise been deductible under the prior Section 162(m) rules. Accordingly, any compensation paid in the future pursuant to new compensation arrangements entered into after November 2, 2017, even if performance-based, will count towards the $1 million fiscal year deduction limit if paid to a covered executive.
Because many different factors influence a well-rounded, comprehensive executive compensation program, and as a result of the changes made to Code Section 162(m) by the Tax Cuts and Jobs Act, some of the compensation we provide to our executive officers may not be deductible as a result of Code Section 162(m) if our Committee believes it will contribute to the achievement of our business objectives.
Our Compensation Committee considers the impact of other tax provisions, such as Internal Revenue Code Section 409A’s restrictions on deferred compensation, and attempts to structure compensation in a tax-efficient manner for both the named executive officers and for our Company.
In adopting various executive compensation plans and packages as well as in making certain executive compensation decisions, particularly with respect to grants of equity based long-term incentive awards, our Compensation Committee considers the accounting treatment and the anticipated financial statement impact of such decisions, as well as the anticipated dilutive impact to our shareholders.
Compensation Committee Report
Our Compensation Committee of our Board of Directors has reviewed and discussed the above 2016 Compensation Discussion & Analysis with management and, based on such review and discussion, has recommended to the Board of Directors that the 2016 Compensation Discussion & Analysis be included in our Annual Report on Form 10-K for the year ended December 31, 2016.
Christopher B. Begley (Chair)
Asif Ahmad
John T. Fox
Stephen E. Hare
2015 COMPENSATION DISCUSSION & ANALYSIS
Overview
The following narrative and tables provide the required disclosures with respect to our fiscal year ended December 31, 2015.
Objectives of Our Executive Compensation Program
Please see discussion under “2016 Compensation Discussion & Analysis - Objectives of Our Executive Compensation Program.”
Named Executive Officers
Based on their compensation for the fiscal year ended December 31, 2015, the following individuals have been identified as the named executive officers for purposes of disclosure in this Annual Report on Form 10-K:
· Vinit K. Asar, our President and Chief Executive Officer;
· Thomas E. Kiraly, our Executive Vice President and Chief Financial Officer;
· Samuel M. Liang, our President of Hanger Clinic;
· Kenneth W. Wilson, our President and Chief Operating Officer of Southern Prosthetic Supply, Inc.; and
· Thomas E. Hartman, our Senior Vice-President, General Counsel and Secretary.
Overview of Our Executive Compensation Programs
Below are the purpose and key elements of our executive compensation program.
|
Element |
|
Purpose and Characteristics |
|
|
|
|
|
Base Salary |
|
· Fixed pay element to compensate for an individual’s competencies, skills and experience as valued in the marketplace and within the Company and to reward continued performance. |
|
|
|
|
|
|
|
· Base salary may be adjusted annually/periodically based on changes in job responsibilities, market conditions and individual performance. |
|
|
|
|
|
Short-Term Incentives |
|
· Performance-based annual cash opportunity to motivate and reward the achievement of annual financial results relative to business specific targets and individual goals tied to strategic initiatives. |
|
|
|
|
|
|
|
· Incentive goals are aligned with stakeholders’ interests. |
|
|
|
|
|
|
|
· Awards, if earned, are payable based on actual results. |
|
|
|
|
|
Long-Term Incentives |
|
· Performance-and time-based equity opportunity to motivate and reward financial performance and stock price appreciation. |
|
|
|
|
|
|
|
· Amounts earned and realized will vary from the grant date fair value based on actual stock price performance. |
|
|
|
|
|
Retirement Benefits |
|
· Component of compensation that accrues each year to encourage employment stability of our executive leadership. |
|
|
|
|
|
|
|
· Benefits are payable upon or after retirement. |
|
|
|
|
|
Other Benefits and Perquisites |
|
· Generally certain pay elements which provide for life and income security needs; the actual cost to the Company is based on participation/usage. |
|
|
|
|
|
Severance Benefits |
|
· Contingent component to provide a bridge to future employment in the event an executive’s employment is terminated. |
|
|
|
|
|
|
|
· Payable only if an executive’s employment is terminated in certain predefined situations. |
Consideration of Advisory Shareholder Vote on Executive Compensation
Please see discussion under “2016 Compensation Discussion & Analysis - Consideration of Advisory Shareholder Vote on Executive Compensation.”
Pay Setting Process
Our Compensation Committee uses Korn Ferry Hay Group (“KFHG”) as its compensation consultant on executive compensation matters. Our Compensation Committee works closely with our compensation consultant to understand general market practices, prevalence and trend information on the levels of salary, target annual incentives and long-term incentives, the relative mix of short- and long-term incentives and the mix of cash and stock-based pay for our executive roles. To determine competitive market pay, our Compensation Committee periodically analyzes the annual proxy statements of a peer group of companies and published survey data. In setting pay for our named executive officers, our Compensation Committee has established the target for compensation, by element and in the aggregate, as the competitive market pay median (50th percentile). Our competitive market pay median (the “Median”) is determined by averaging the
in-depth peer group analysis and the published survey data. The design of our annual and long-term incentive plans provides our executives with the opportunity to exceed the Median for total direct compensation (the sum of base salary, annual bonus and long term incentives) based on Company performance. Actual compensation on a yearly basis, based on Company and individual performance, can vary widely, as our history has demonstrated.
In 2015, KFHG was formed when Hay Group merged with Korn Ferry. Our Compensation Committee assessed the independence of KFHG and concluded that the work performed by the consultants for our Compensation Committee does not raise any conflict of interest under then applicable NYSE listing standards or SEC rules. For 2015, KFHG was paid $98,765 for executive compensation consulting services. For other executive search and management consulting services provided to our Company in 2015, KFHG was paid $428,003.
Peer Group
Our Compensation Committee reviews and approves annually a peer group that it believes best reflects the competitive market for talent in our industry. In December 2014, our Compensation Committee approved the peer group listed below (the “2015 Peer Group”) to benchmark the overall executive pay program for our named executive officers. Our peer group construction methodology generally utilizes the following selection parameters to select peer companies: (1) company revenue size within a specified range of our historic revenue; (2) healthcare services, facilities or services industry sector; (3) similar healthcare payment models; (4) similar executive talent market; (5) national or global presence of business; and (6) demographics of customers.
The 2015 Peer Group does not include Emeritus Corp. that was part of our peer group for 2014 as a result of its acquisition. When our Compensation Committee re-examined the peer group for 2015, it used a number of specific factors as criteria for inclusion including organization size and scope, industry and sector competitors, business model and executive talent market. The Compensation Committee determined that there were no other companies that fit these criteria for inclusion and, accordingly, did not add new companies to the 2015 Peer Group to replace those that were eliminated.
Our Compensation Committee believes that the 2015 Peer Group was reflective of the market we faced in 2015 and positioned our executive compensation benchmarking appropriately. Our Compensation Committee believes that, while they are not specific to the orthotics and prosthetics area of health care, the companies in the peer group reflect the range of business sectors where we are active. The sub-industry mix of these companies is 26% in Health Care Equipment, 27% in Health Care Facilities and 47% in Health Care Services. Our Compensation Committee further believes that these companies have executive talent who possess comparable skills and face similar business challenges common to our industry.
|
Peer Companies (1) |
|
Sub-Industry |
|
MEDNAX, Inc. |
|
Health Care Services |
|
Gentiva Health Services Inc. |
|
Health Care Services |
|
Skilled Healthcare Group Inc. |
|
Health Care Services |
|
IPC The Hospitalist Co Inc. |
|
Health Care Services |
|
Teleflex Incorporated |
|
Health Care Equipment |
|
AmSurg Corp. |
|
Health Care Facilities |
|
Five Star Quality Care Inc. |
|
Health Care Facilities |
|
Amedisys Inc. |
|
Health Care Services |
|
Integra LifeSciences Holdings Corporation |
|
Health Care Equipment |
|
National Healthcare Corp. |
|
Health Care Facilities |
|
Healthways Inc. (rebranded to become Tivity Health) |
|
Health Care Services |
|
Healthsouth Corp. |
|
Health Care Facilities |
|
LHC Group Inc. |
|
Health Care Services |
|
Orthofix International N.V. |
|
Health Care Equipment |
|
Wright Medical Group Inc. |
|
Health Care Equipment |
(1) The 2015 Peer Group’s 50th percentile revenue for fiscal year 2013, which was the data available to the Compensation Committee at the time that the peer group was selected was $842 million.
Our Compensation Committee reviewed and considered KFHG’s analysis of the 2015 Peer Group pay practices for similarly situated executives to each named executive officer. KFHG’s analysis included, but was not limited to, a review of pay levels (base salary, annual incentives, total cash compensation, long-term incentives and total direct compensation) and pay structure (allocation of pay among base salary, annual incentives and long-term incentives).
Compensation Survey Data
In addition to the 2015 Peer Group data, our Compensation Committee also considered published survey data for a broader market perspective on executive compensation pay levels and practices. We believe that an alternative lens into the executive labor market is appropriate and meaningful in that survey data provides a robust data set, can be utilized for other executives who are not named executive officers and is consistent with our holistic approach to benchmarking executive compensation. For purposes of this year’s assessment, we used KFHG’s 2014 Industrial Total Remuneration Survey (171 industrial companies from various industries and sectors). The cash compensation data was aged to January 1, 2015. Our Compensation Committee was provided a specific list of companies underlying the survey data, but did not select or otherwise have input on the companies participating in the survey.
Factors to Set or Adjust Pay
For each named executive officer, our Compensation Committee considers the relevant data regarding our peer group and the salary survey data. For each individual, we also focus specifically on:
· The transferability of professional and managerial skills;
· The depth of knowledge and experience in orthotics and prosthetics and related industries;
· The relevance of the named executive officer’s experience to other potential employers; and
· The readiness of the named executive officer to assume a different or more significant role either within our Company or with another organization.
The following factors are also considered in setting and adjusting pay for our named executive officers:
· The Company’s financial performance;
· The individual’s past and expected future performance;
· Peer group pay practices and broader market developments/trends; and
· Our business and people needs.
Focus on Pay-for-Performance
Our Compensation Committee sets each officer’s total direct compensation to approximate Median practices.
Consistent with our compensation philosophy and objectives, our Compensation Committee emphasizes performance-based incentive opportunities, particularly long-term incentives, over base salary when determining the mix of elements that constitute an officer’s total direct compensation. The following tables show the targeted and actual 2015 pay mix for our Chief Executive Officer and for our other named executive officers as a group.
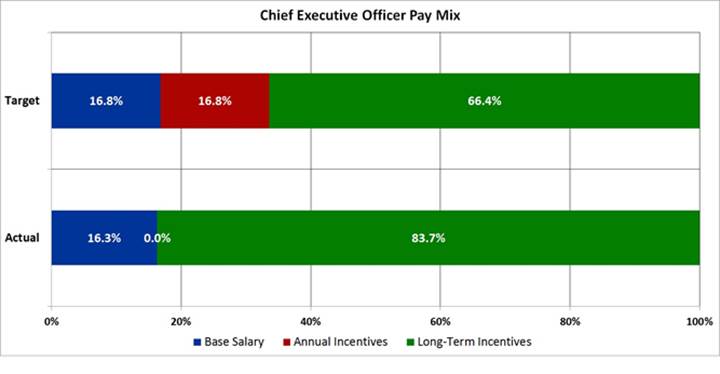
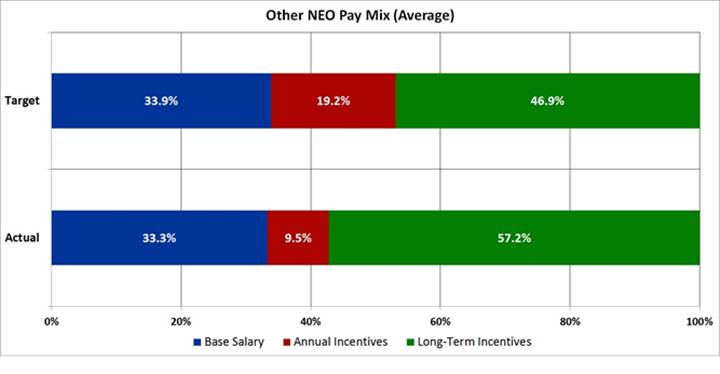
Determination of Pay Elements
In developing the pay programs and levels for our named executive officers, our Compensation Committee reviews peer group pay practices, survey data and other relevant benchmarks provided by the compensation consultant. Any changes to base salary and annual incentive target amounts generally become effective in March of each year.
Annually, our Chief Executive Officer reviews the performance of each of the other named executive officers and shares his perspective with our Compensation Committee. Our Compensation Committee considers this performance information in setting the pay for our named executive officers other than our Chief Executive Officer. All decisions regarding any adjustment to the compensation of our Chief Executive Officer are made solely by our Compensation Committee based on both competitive pay practices as well as our Compensation Committee’s assessment of his performance.
Our Compensation Committee considers previous compensation earned by the named executive officers and current Company stock holdings when making compensation decisions. We believe that our named executive officers should be fairly and competitively compensated, both for annual and long-term compensation opportunities, based on the Company’s performance and each individual’s performance.
Our Compensation Committee may meet in executive session without the presence of any member of management and/or the consultant in making its decisions regarding the compensation of any of our named executive officers.
When making any executive compensation decision, our Compensation Committee follows a deliberate, multiple-step process:
1. Information review;
2. Evaluation and deliberation; and
3. Decision making.
First, our Compensation Committee collects all essential information that may be necessary to make an educated decision from our compensation consultant, our Chief Executive Officer or other sources. Next, our Compensation Committee members discuss the information and a deliberation of possible options ensues. After discussion, our Compensation Committee takes time for reflection and, consultation with other members of our Board of Directors. Finally, our Compensation Committee reconvenes for additional discussion, if needed, before a final decision is made. As a result, some compensation decisions require two or more Compensation Committee meetings before any final decisions are made.
Additional information about the role and processes of our Compensation Committee is outlined in our Compensation Committee charter, which is available on the Company’s website at www.hanger.com.
Base Salary
As discussed above, our Compensation Committee targets base salary levels for our named executive officers at the Median. Currently, our named executive officers’ base salaries fall within the competitive range of the Median, which we broadly define as within 85% to 115% of the Median for each position. Individual increases to base salary are based upon several considerations, including individual performance and contributions, internal equity considerations, as well as competitive market factors and practices.
Base salary compensates a named executive officer for the individual’s competencies, skills, experience and performance. When considering a candidate for a named executive officer role, our Compensation Committee considers all of these factors. For annual adjustments to the base salary of a named executive officer, our Compensation Committee primarily considers the Median, information set forth in general industry surveys, the Company’s performance, the individual’s performance and internal equity amongst our officers. Changes in the scope of a named executive officer’s role and responsibilities could result in an adjustment being considered and approved by our Compensation Committee at any time during the year.
For 2016 base salary adjustments, our Compensation Committee considered the peer group analysis and published survey data described earlier. Our Compensation Committee increased the base salaries of our named executive officers effective March 2016 by an average of 2.8%. Individual adjustments ranged from 2% to 4%, based on an analysis of past individual performance as well as market adjustments given the respective base pay versus the Median for the position. Our Compensation Committee believes that these adjustments to base salary continue to position the pay of our named executive officers within the competitive range of the Median.
Short-Term Incentive Compensation
Our Compensation Committee designs the short-term incentive compensation program to motivate and reward the achievement of annual financial results and individual goals. Currently, our philosophy for short-term incentive compensation is to generally target the Median and to provide the opportunity to earn in the range of the 75th percentile compared to peer group and published survey data with the achievement of exceptional Company and individual performance. In other words, when we reach target performance for the goals discussed below, then short-term incentive compensation should be close to the Median. If our Company and our named executive officers have exceptional
performance based on the established performance goals, then short-term incentive compensation should exceed the Median and could approach the 75th percentile compared to the peer group and published survey data.
In 2015, our Compensation Committee approved the continuation of short-term incentive design comprised of two interdependent financial metrics which are leveraged by individual operational and strategic performance. The two interdependent metrics are revenue and Adjusted EBITDA which is defined as earnings before interest, taxes, depreciation, amortization, impairment of intangible assets, fees paid to third parties for Remediation and other miscellaneous non-recurring items. They are equally weighted 50%. To receive any payment, minimum thresholds must be met for both metrics. If the goals for the financial metrics are met, then the amounts actually earned are determined on the basis of individual performance against individual goals. When both financial thresholds are met, potential bonuses of up to 25% of the target amount are available. The potential bonuses increase to 100% if financial goals are achieved at the target level and 200% if the financial goals are achieved at or above the maximum levels. The financial performance measures for our 2015 annual incentive program were:
|
Performance Measure |
|
Percentage |
|
|
Revenue |
|
50 |
% |
|
Earnings Before Interest, Taxes, Depreciation and Amortization and other items (“Adjusted EBITDA”) |
|
50 |
% |
The financial results used for the short-term incentive are for all of Hanger (enterprise) for all named executive officers except the President of Hanger Clinic and the President of Southern Prosthetic Supply, Inc. The table below shows the business unit mix for each executive.
Business Unit Mix for Financial Measures
|
Named Executive Officer |
|
Enterprise |
|
Hanger Clinic |
|
Products & Services |
|
|
Vinit K. Asar |
|
100 |
% |
|
|
|
|
|
Thomas E. Kiraly |
|
100 |
% |
|
|
|
|
|
Samuel M. Liang |
|
75 |
% |
25 |
% |
|
|
|
Kenneth W. Wilson |
|
75 |
% |
|
|
25 |
% |
|
Thomas E. Hartman |
|
100 |
% |
|
|
|
|
The financial goals for our 2015 short-term incentive program at threshold, target and maximum are presented in the table below. As noted in a footnote to the table, actual audited results for 2015 were not available to our Compensation Committee at the time of determination of bonuses (in millions):
|
Enterprise Measures |
|
Threshold |
|
Target |
|
Maximum |
|
Actual Results(1) |
| |||
|
Revenue |
|
$ |
947.2 |
|
$ |
1,052.4 |
|
$ |
1,157.7 |
|
N/A |
|
|
Adjusted EBITDA |
|
$ |
130.1 |
|
$ |
144.5 |
|
$ |
158.9 |
|
N/A |
|
|
|
|
|
|
|
|
|
|
|
| |||
|
Hanger Clinic Measures |
|
|
|
|
|
|
|
|
| |||
|
Revenue |
|
$ |
782.2 |
|
$ |
869.2 |
|
$ |
956.1 |
|
N/A |
|
|
Adjusted EBITDA |
|
$ |
158.7 |
|
$ |
176.4 |
|
$ |
194.0 |
|
N/A |
|
|
|
|
|
|
|
|
|
|
|
| |||
|
Products & Services Measures |
|
|
|
|
|
|
|
|
| |||
|
Revenue |
|
$ |
172.6 |
|
$ |
184.5 |
|
$ |
196.5 |
|
N/A |
|
|
Adjusted EBITDA(SPS)/Adjusted EBIT(ACP) |
|
$ |
48.0 |
|
$ |
54.4 |
|
$ |
60.8 |
|
N/A |
|
(1) Actual results for 2015 were not available until the completion of our audited 2015 financial statements in January 2018. Accordingly, these are not disclosed in this table as they were not available to the Compensation Committee for purposes of determining bonuses.
Our Compensation Committee sets the performance measure targets for a given year based on the Company’s strategic budgeting and goal setting process that begins in October of the previous year and is finalized in February of the year for
which the targets will apply. In the first quarter of each year, our Compensation Committee approves the specific objectives for threshold, target and maximum levels for each of the performance measures used for the short-term incentive program for our named executive officers.
In addition to these financial goals, our named executive officers have individual goals that they must achieve for their individual performance which are focused on the Company’s strategic and operational initiatives. Individual performance is measured on initiatives such as cost reductions, process improvement, business development opportunities and people initiatives. An executive’s individual objectives may be qualitative and/or quantitative. The individual goals are typically developed to be stretch goals that are challenging for the executive to achieve. The overall results took into consideration our unaudited financial results where applicable.
|
Named Executive Officer |
|
2015 Individual Performance Goals/Results |
|
|
|
|
|
Mr. Asar |
|
Goals: financial growth objectives, strategic growth plan, accounting and shareholder accountability and key leadership development and succession. |
|
|
|
|
|
|
|
Results: in total, Mr. Asar’s results were at target. |
|
|
|
|
|
Mr. Kiraly |
|
Goals: accounting controls and effectiveness, business and field process improvements, revenue cycle and accounts receivable, long-term planning. |
|
|
|
|
|
|
|
Results: in total, Mr. Kiraly’s results were above target. |
|
|
|
|
|
Mr. Liang |
|
Goals: financial growth objectives, field process improvements and clinic strategic value initiatives. |
|
|
|
|
|
|
|
Results: in total, Mr. Liang’s results were above target. |
|
|
|
|
|
Mr. Wilson |
|
Goals: financial growth objectives, portfolio diversification, business development, enterprise purchasing strategy. |
|
|
|
|
|
|
|
Results: in total, Mr. Wilson’s results were above target. |
|
|
|
|
|
Mr. Hartman |
|
Goals: securities litigation, material weakness remediation, regulatory initiatives and compliance programs. |
|
|
|
|
|
|
|
Results: in total, Mr. Hartman’s results were above target. |
After year end, our Compensation Committee assesses the attainment of the performance measures for the most recently completed year for the short-term incentive program against both financial and individual goals. Typically, the Compensation Committee makes the final assessment of the year-end results in February, at which time bonuses, if any, are approved for payment by March 15th. In February 2016, we did not have final, audited financial results for the 2015 performance year as a result of our ongoing financial restatement process, and so the Compensation Committee used unaudited financial results to assess attainment of bonuses.
Prior to our Compensation Committee’s consideration of potential bonuses for the 2015 performance year, Messrs. Asar and Kiraly each individually requested that they be excluded from consideration for the 2015 bonus that may otherwise have been awarded to them in order to increase the aggregate amount available to fund bonuses for other employees under the 2015 short-term incentive program. Accordingly, our Compensation Committee did not award bonuses to Messrs. Asar and Kiraly under the 2015 short-term incentive program.
When determining the pool of funding for bonuses to the named executive officers and other senior management, the Compensation Committee exercised negative discretion to reduce the funding calculation for the financial performance measures by over 20% to reflect the uncertainty inherent in the unaudited financial results and to share more of the bonus pool with employees. Taking into account mixed financial and individual results and the need to retain key executives throughout our financial reporting challenges, as well as the reduction in the funding calculations for financial performance measures, our named executive officers (other than Messrs. Asar and Kiraly) received payouts ranging from 75% to 84% of their respective targets.
See the Non-Equity Incentive Plan Compensation column of the Summary Compensation Table for the short-term incentive payments for the 2015 performance period as paid to each named executive officer in March 2016.
The target and maximum annual incentive awards for 2015 expressed as a percentage of base salary for our named executive officers are included in the below table. Our Compensation Committee sets these targets for annual incentives based on the Median of the annual incentives of our peer group and published survey data provided by our compensation consultant as
discussed previously. Our Compensation Committee used the same percentages of base salary for our continuing officers in the 2016 short-term incentive plan, with the exception of Mr. Hartman whose target increased from 40% to 50% April 2016 to reflect what the Compensation Committee believed was market practice for his position.
|
Incentive Awards Expressed as a Percentage of Base Salary |
|
Target |
|
Maximum |
|
|
Vinit K. Asar |
|
100 |
% |
200 |
% |
|
President and Chief Executive Officer |
|
|
|
|
|
|
Thomas E. Kiraly |
|
70 |
% |
140 |
% |
|
Executive Vice President and Chief Financial Officer |
|
|
|
|
|
|
Samuel M. Liang |
|
60 |
% |
120 |
% |
|
President, Hanger Clinic |
|
|
|
|
|
|
Kenneth W. Wilson |
|
50 |
% |
100 |
% |
|
President, Products & Services |
|
|
|
|
|
|
Thomas E. Hartman |
|
40 |
% |
80 |
% |
|
Senior Vice President, General Counsel and Secretary |
|
|
|
|
|
Long Term Incentive Compensation
Long term incentive compensation opportunities are provided to our named executive officers to encourage the executives’ continued commitment to our Company by motivating and rewarding financial performance and stock price appreciation. Our Compensation Committee believes this is an important component of their pay which directly aligns the interests of our executives with the interests of our shareholders since amounts granted, earned and realized are dependent on actual stock price performance.
When determining the value of individual grants, consistent with the other elements of our compensation program, our Compensation Committee considers the results of the assessment of competitive market data described above. For years prior to 2015, our Compensation Committee reviewed the appreciation of the Company’s stock price and made adjustments to the grant sizes in order to keep the grant values competitive. In 2015, our Compensation Committee adopted a formal approach to this market adjustment, using a 60 trading day average ended on the Thursday before the week of the determinative Compensation Committee meeting to convert the target dollar value of the individual grant into a number of shares. If the Company’s stock price were to change more than 10% between that Thursday and the day of our Compensation Committee meeting, then our Compensation Committee would discuss whether an adjustment to the 60 trading day average should be made. Our Compensation Committee believes that this more formal annual process of adjusting grant sizes based on recent stock value provides a more accurate competitive compensation package at the time of grant.
As with the other elements of our compensation program, our Compensation Committee targets the Median of competitive market data to set our long term incentive awards with the potential to earn above the Median if the Company has exceptional performance. Our Compensation Committee also considers each individual’s performance and contributions to the Company’s performance as well as the contributions that are expected to be made in the future based on the executive’s role. Our Compensation Committee approves all grants to named executive officers.
Our Compensation Committee continued in 2015 its focus on the use of performance-based restricted share units by granting 50% of the shares as performance-based restricted share units and 50% as time-based restricted share units for all named executive officers with the exception of Mr. Asar, who has a 60/40 split of performance-based/time-based restricted share units, respectively. The time-based restricted share units granted to our named executive officers vest 25% annually over four years on the anniversary of the grant date commencing on the first anniversary. The performance-based restricted share units are only earned if the Company achieves the adjusted EPS performance goal established at the time of the grant and the related service conditions are met. If performance-based restricted share units are earned, the earned shares will vest 25% annually over four years on the anniversary of the grant date commencing on the first anniversary. The adjusted EPS goal for the 2015 grant was to achieve $1.20 per share for the twelve month period from January 2015 through December 2015. Our Compensation Committee created an additional incentive for the named executive officers if this adjusted EPS target was exceeded. Specifically, if the Company achieved an adjusted EPS goal of $1.30, then the named executive officers would receive 150% of their target performance-based awards. In February 2016, we did not have financial results for the 2015 performance year; therefore, our Compensation Committee agreed to wait for the results to determine if any performance-based restricted share units granted in 2015 were earned. Based on the actual results and required adjustments to the EPS performance goal, the adjusted EPS is $1.47, resulting in a 150% attainment of the target performance-based awards. The required adjustments under the terms of the performance-based restricted share unit grants were in the
categories of asset write downs, changes in tax or accounting principles, regulations or laws, and extraordinary, unusual and/or non-recurring items of gain or loss.
Our restricted share unit awards are generally taxable income to the named executive officer when the award vests in the amount equal to the number of share units vested multiplied by our stock price on the vesting date. We generally receive a tax deduction in the same amount at the same time. The grants are valued as of the grant date for accounting purposes in accordance with ASC 718.
Other Pay Elements
General Employee Benefits
Please see discussion under “2016 Compensation Discussion & Analysis - Other Pay Elements: General Employee Benefits.”
Employment Agreements
Please see discussion under “2016 Compensation Discussion & Analysis - Other Pay Elements: Employment Agreements.”
Retirement Benefits
Please see discussion under “2016 Compensation Discussion & Analysis - Other Pay Elements: Retirement Benefits.”
Other Compensation Related Policies
Securities Trading Policy
Please see discussion under “2016 Compensation Discussion & Analysis - Other Compensation Related Policies: Securities Trading Policy.”
Stock Ownership Guidelines
Our Compensation Committee adopted formal stock ownership guidelines for the named executive officers and other key senior managers at the end of 2007, and amended those stock ownership guidelines in 2009 and 2013. These guidelines require the executives to hold a multiple of their base salary in company shares. The President and Chief Executive Officer is required to hold five times his base salary, the Chief Financial Officer and those named executive officers managing a P&L are required to hold three times their base salary, and the named executive officers in staff executive positions other than the Chief Financial Officer are required to hold one time their base salary. Individuals who are newly promoted or newly hired into a named executive officer position have up to five years to reach this level of ownership. Individuals who do not meet this requirement are subject to an evaluation by our Compensation Committee to review individual circumstances, including but not limited to retirement needs of individual officers.
Our named executive officers currently either met (or were within $5,000 of meeting) these requirements as of December 31, 2015, or still had time to reach the necessary level of ownership as a result of promotion or hire dates.
Impact of Tax and Accounting Considerations
Please see discussion under “2016 Compensation Discussion & Analysis - Other Compensation Related Policies: Impact of Tax and Accounting Considerations.”
Compensation Committee Report
Our Compensation Committee of our Board of Directors has reviewed and discussed the above 2015 Compensation Discussion & Analysis with management and, based on such review and discussion, has recommended to the Board of Directors that the 2015 Compensation Discussion & Analysis be included in our Annual Report on Form 10-K for the year ended December 31, 2016.
Christopher B. Begley (Chair)
Asif Ahmad
John T. Fox
Stephen E. Hare
EXECUTIVE COMPENSATION
SUMMARY COMPENSATION TABLE FOR 2016
The following table sets forth for each of the named executive officers: (i) the dollar value of base salary and bonus earned during the year indicated; (ii) the grant date fair value of stock and option awards granted in the years indicated; (iii) the dollar value of awards granted during the year under non-equity incentive plans; (iv) the change in the actuarial present value of the accumulated pension benefit during the year; (v) all other compensation for the year; and, finally, (vi) the dollar value of total compensation for the year.
|
Name and Principal Position |
|
Year |
|
Salary |
|
Bonus (1) |
|
Stock |
|
Non-Equity |
|
Change in |
|
All Other |
|
Total |
| |||||||
|
Vinit K. Asar |
|
2016 |
|
$ |
711,311 |
|
$ |
— |
|
$ |
1,035,000 |
|
$ |
— |
|
$ |
264,017 |
|
$ |
31,092 |
|
$ |
2,041,420 |
|
|
Chief Executive Officer |
|
2015 |
|
$ |
695,195 |
|
$ |
— |
|
$ |
2,750,025 |
|
$ |
— |
|
$ |
168,055 |
|
$ |
30,791 |
|
$ |
3,644,066 |
|
|
of the Company |
|
2014 |
|
$ |
666,130 |
|
$ |
— |
|
$ |
1,340,426 |
|
$ |
— |
|
$ |
428,291 |
|
$ |
29,614 |
|
$ |
2,464,461 |
|
|
|
|
|
|
|
|
|
|
|
|
|
|
|
|
|
|
|
| |||||||
|
Thomas E. Kiraly |
|
2016 |
|
$ |
461,843 |
|
$ |
25,000 |
|
$ |
386,650 |
|
$ |
— |
|
$ |
— |
|
$ |
113,169 |
|
$ |
986,662 |
|
|
Executive Vice President |
|
2015 |
|
$ |
453,635 |
|
$ |
— |
|
$ |
825,002 |
|
$ |
— |
|
$ |
— |
|
$ |
120,746 |
|
$ |
1,399,383 |
|
|
and Chief Financial Officer |
|
2014 |
|
$ |
109,039 |
|
$ |
22,898 |
|
$ |
1,019,023 |
|
$ |
— |
|
$ |
— |
|
$ |
53,300 |
|
$ |
1,204,260 |
|
|
of the Company |
|
|
|
|
|
|
|
|
|
|
|
|
|
|
|
|
| |||||||
|
|
|
|
|
|
|
|
|
|
|
|
|
|
|
|
|
|
| |||||||
|
Samuel M. Liang |
|
2016 |
|
$ |
465,062 |
|
$ |
75,000 |
|
$ |
352,150 |
|
$ |
— |
|
$ |
— |
|
$ |
120,263 |
|
$ |
1,012,475 |
|
|
Executive Vice President of |
|
2015 |
|
$ |
445,602 |
|
$ |
— |
|
$ |
715,026 |
|
$ |
200,000 |
|
$ |
— |
|
$ |
113,371 |
|
$ |
1,473,999 |
|
|
the Company and Chief |
|
2014 |
|
$ |
261,538 |
|
$ |
83,750 |
|
$ |
608,969 |
|
$ |
— |
|
$ |
— |
|
$ |
69,596 |
|
$ |
1,023,853 |
|
|
Operating Officer of Hanger |
|
|
|
|
|
|
|
|
|
|
|
|
|
|
|
|
| |||||||
|
Prosthetics & Orthotics, Inc. |
|
|
|
|
|
|
|
|
|
|
|
|
|
|
|
|
| |||||||
|
and HPO, Inc. |
|
|
|
|
|
|
|
|
|
|
|
|
|
|
|
|
| |||||||
|
|
|
|
|
|
|
|
|
|
|
|
|
|
|
|
|
|
| |||||||
|
Kenneth W. Wilson |
|
2016 |
|
$ |
353,689 |
|
$ |
25,000 |
|
$ |
193,450 |
|
$ |
— |
|
$ |
— |
|
$ |
57,803 |
|
$ |
629,942 |
|
|
President of Products and |
|
2015 |
|
$ |
339,728 |
|
$ |
— |
|
$ |
330,032 |
|
$ |
142,000 |
|
$ |
— |
|
$ |
46,571 |
|
$ |
858,331 |
|
|
Services |
|
2014 |
|
$ |
315,043 |
|
$ |
35,442 |
|
$ |
273,075 |
|
$ |
50,824 |
|
$ |
— |
|
$ |
46,444 |
|
$ |
720,828 |
|
|
|
|
|
|
|
|
|
|
|
|
|
|
|
|
|
|
|
| |||||||
|
Thomas E. Hartman |
|
2016 |
|
$ |
346,064 |
|
$ |
100,000 |
|
$ |
179,650 |
|
$ |
— |
|
$ |
96,978 |
|
$ |
9,854 |
|
$ |
732,546 |
|
|
Senior Vice President, |
|
2015 |
|
$ |
328,273 |
|
$ |
— |
|
$ |
295,019 |
|
$ |
105,000 |
|
$ |
65,310 |
|
$ |
10,022 |
|
$ |
803,624 |
|
|
General Counsel and |
|
2014 |
|
$ |
297,638 |
|
$ |
35,303 |
|
$ |
129,098 |
|
$ |
— |
|
$ |
86,231 |
|
$ |
10,478 |
|
$ |
558,748 |
|
|
Secretary |
|
|
|
|
|
|
|
|
|
|
|
|
|
|
|
|
| |||||||
(1) The following named executive officers received off-cycle discretionary bonuses in the second half of 2016 in the indicated amounts: Messrs. Kiraly and Wilson: $25,000; Mr. Liang: $75,000; Mr. Hartman $100,000.
(2) All restricted stock units vest 25% per year, commencing one year after the date of issuance. The amount reported in this column represents the aggregate grant date fair value of all time-based and performance-based awards granted during each calendar year as calculated in accordance with ASC 718. For 2016, the executives received 0% of performance-based restricted stock units subject to the award; see “Grants of Plan-Based Awards”. For awards of performance-based restricted stock units, the amounts shown in the column are the grant date fair values calculated based on the probable outcome of the performance conditions on the date of grant. For 2016, the probable outcome on the date of grant was the target outcome. The value of the performance-based restricted stock units based on the probable outcome was for Mr. Asar: $621,000, Mr. Kiraly: $172,500, Mr. Liang: $155,250, Mr. Wilson: $75,900, and Mr. Hartman: $69,000. The value of the performance-based restricted stock units assuming the highest level of performance was for Mr. Asar: $931,500, Mr. Kiraly: $258,750, Mr. Liang: $232,875, Mr. Wilson: $113,850, and Mr. Hartman: $103,500.
(3) The annual short-term awards for 2016 were based on 2016 performance, for which no amounts were paid to named executive officers.
(4) The above amounts represent the change in actuarial present value of the accumulated pension benefit for each named executive officer who participates in our defined benefit Supplemental Executive Retirement Plan (the “DB SERP”). Details of the DB SERP are described after the Pension Benefits table below and in the Compensation Discussion and Analysis section. We did not provide above-market earnings in our defined contribution Supplemental Executive Retirement Plan (the “DC SERP”), and therefore we have not included any earnings on the DC SERP in this table.
(5) For 2016, Mr. Asar, this total includes: premiums for additional life and disability insurance ($9,732), Company contributions to the Company’s defined contribution plan ($6,360), and non-business related automobile expenses ($15,000). For 2016, Messrs. Kiraly, Liang, Wilson and Hartman, these totals include: premiums for additional life and disability insurance, non-business related automobile expenses, Company contributions to the individual’s health savings account, and/or Company contributions to the Company’s defined contribution plan. Additionally, for 2016, Mr. Liang received relocation of $2,839 and contributions were made by the Company to non-qualified deferred compensation plans for Messrs. Kiraly ($90,727), Liang ($89,120) and Wilson ($44,165).
GRANTS OF PLAN-BASED AWARDS IN 2016
The following table sets forth information regarding all incentive plan awards that were granted to the named executive officers during 2016, including incentive plan awards (equity based and non-equity based) and other plan-based awards. Disclosure on a separate line item is provided for each grant of an award made to a named executive officer during the year. Non-equity incentive plan awards are awards that are not subject to ASC 718 and are intended to serve as an incentive for
performance to occur over a specified period. Non-Equity Awards are prorated for changes in base salary and/or target bonus percentages that occur throughout the year.
|
|
|
|
|
|
|
|
|
|
|
|
|
|
|
|
|
All Other |
|
|
| ||||
|
|
|
|
|
|
|
|
|
|
|
|
|
|
|
|
|
Stock |
|
Full Grant |
| ||||
|
|
|
|
|
|
|
|
|
|
|
|
|
|
|
|
|
Awards: |
|
Date Fair |
| ||||
|
|
|
|
|
Estimated Future Payouts |
|
Estimated Future Payouts |
|
Number of |
|
Value of |
| ||||||||||||
|
|
|
|
|
Under Non-Equity Incentive |
|
Under Equity Incentive |
|
Shares of |
|
Stock or |
| ||||||||||||
|
|
|
Grant |
|
Plan Awards(1) |
|
Plan Awards(2) |
|
Stock or |
|
Option |
| ||||||||||||
|
Name |
|
Date |
|
Threshold |
|
Target |
|
Maximum |
|
Threshold |
|
Target |
|
Maximum |
|
Units (3) |
|
Awards |
| ||||
|
Vinit K. Asar |
|
4/29/2016 |
|
|
|
|
|
|
|
|
|
|
|
|
|
60,000 |
|
$ |
414,000 |
| |||
|
Vinit K. Asar |
|
4/29/2016 |
|
|
|
|
|
|
|
— |
|
90,000 |
|
135,000 |
|
|
|
$ |
621,000 |
| |||
|
Vinit K. Asar |
|
1/1/2016 |
|
$ |
— |
|
$ |
711,311 |
|
$ |
1,422,622 |
|
|
|
|
|
|
|
|
|
|
| |
|
|
|
|
|
|
|
|
|
|
|
|
|
|
|
|
|
|
|
|
| ||||
|
Thomas E. Kiraly |
|
10/11/2016 |
|
|
|
|
|
|
|
|
|
|
|
|
|
5,000 |
|
$ |
41,650 |
| |||
|
Thomas E. Kiraly |
|
4/29/2016 |
|
|
|
|
|
|
|
|
|
|
|
|
|
25,000 |
|
$ |
172,500 |
| |||
|
Thomas E. Kiraly |
|
4/29/2016 |
|
|
|
|
|
|
|
— |
|
25,000 |
|
37,500 |
|
|
|
$ |
172,500 |
| |||
|
Thomas E. Kiraly |
|
1/1/2016 |
|
$ |
— |
|
$ |
323,290 |
|
$ |
646,580 |
|
|
|
|
|
|
|
|
|
|
| |
|
|
|
|
|
|
|
|
|
|
|
|
|
|
|
|
|
|
|
|
| ||||
|
Samuel M. Liang |
|
10/11/2016 |
|
|
|
|
|
|
|
|
|
|
|
|
|
5,000 |
|
$ |
41,650 |
| |||
|
Samuel M. Liang |
|
4/26/2016 |
|
|
|
|
|
|
|
|
|
|
|
|
|
22,500 |
|
$ |
155,250 |
| |||
|
Samuel M. Liang |
|
4/29/2016 |
|
|
|
|
|
|
|
— |
|
22,500 |
|
33,750 |
|
|
|
$ |
155,250 |
| |||
|
Samuel M. Liang |
|
1/1/2016 |
|
$ |
— |
|
$ |
279,037 |
|
$ |
558,075 |
|
|
|
|
|
|
|
|
|
|
| |
|
|
|
|
|
|
|
|
|
|
|
|
|
|
|
|
|
|
|
|
| ||||
|
Kenneth W. Wilson |
|
10/11/2016 |
|
|
|
|
|
|
|
|
|
|
|
|
|
5,000 |
|
$ |
41,650 |
| |||
|
Kenneth W. Wilson |
|
4/26/2016 |
|
|
|
|
|
|
|
|
|
|
|
|
|
11,000 |
|
$ |
75,900 |
| |||
|
Kenneth W. Wilson |
|
4/29/2016 |
|
|
|
|
|
|
|
— |
|
11,000 |
|
16,500 |
|
|
|
$ |
75,900 |
| |||
|
Kenneth W. Wilson |
|
1/1/2016 |
|
$ |
— |
|
$ |
176,845 |
|
$ |
353,689 |
|
|
|
|
|
|
|
|
|
|
| |
|
|
|
|
|
|
|
|
|
|
|
|
|
|
|
|
|
|
|
|
| ||||
|
Thomas E. Hartman |
|
10/11/2016 |
|
|
|
|
|
|
|
|
|
|
|
|
|
5,000 |
|
$ |
41,650 |
| |||
|
Thomas E. Hartman |
|
4/26/2016 |
|
|
|
|
|
|
|
|
|
|
|
|
|
10,000 |
|
$ |
69,000 |
| |||
|
Thomas E. Hartman |
|
4/29/2016 |
|
|
|
|
|
|
|
— |
|
10,000 |
|
15,000 |
|
|
|
$ |
69,000 |
| |||
|
Thomas E. Hartman |
|
1/1/2016 |
|
$ |
— |
|
$ |
164,388 |
|
$ |
328,776 |
|
|
|
|
|
|
|
|
|
|
| |
(1) Terms of compensation under the Non-Equity Incentive Plan are discussed in detail in the Compensation Discussion and Analysis section.
(2) The restricted stock detailed above is awarded as performance-based shares. The restricted stock was awarded on April 29, 2016 and vests to the extent of 25% per year, commencing approximately one year after the date of issuance, assuming the pro forma performance goal is achieved. Release of the restrictions on this award was subject to achieving pro forma EPS targets for the performance period of January 1, 2016 through December 31, 2016 per the schedule below. Results in between Threshold and Target, and between Target and Maximum will use straight line calculations for payouts:
|
EPS Result (Q1 2016 through |
|
Percent of Performance Shares |
| |
|
$ |
0.75 |
|
25 |
% |
|
$ |
0.85 |
|
100 |
% |
|
$ |
0.95 |
|
150 |
% |
In February 2017, our Compensation Committee approved, based on the terms of the plan and related award agreements, payment of 0% of the target performance-based awards based on its final assessment of the Company’s preliminary financial results for 2016, which indicated that the threshold of $0.75 would not be achieved.
(3) The time-based restricted stock units detailed above were awarded on April 29, 2016 (Messrs. Asar, Kiraly, Liang, Wilson and Hartman), and October 11, 2016 (Messrs. Kiraly, Liang, Wilson and Hartman). The share price at time of award was $6.90 on April 29, 2016, and $8.33 on October 11, 2016. All shares of restricted stock units vest 25% per year, commencing approximately one year after the date of issuance.
(4) Mr. Hartman’s variable compensation target increased on April 4, 2016 from 40% of base pay to 50% of base pay. This annual target was prorated for 2016.
OUTSTANDING EQUITY AWARDS AT 2016 FISCAL YEAR-END
The following table sets forth information on outstanding equity awards held by the named executive officers at December 31, 2016, including the number and market value of restricted stock units and performance based restricted stock units that have not vested.
|
|
|
Option Awards |
|
Stock Awards |
| |||||||||||||||
|
Name |
|
Number of |
|
Number of |
|
Equity |
|
Option |
|
Option |
|
Number of |
|
Market |
|
Equity |
|
Equity |
| |
|
Vinit K. Asar (2) |
|
|
|
|
|
|
|
|
|
|
|
60,000 |
|
$ |
689,958 |
|
|
|
|
|
|
Vinit K. Asar (4) |
|
|
|
|
|
|
|
|
|
|
|
31,793 |
|
$ |
365,597 |
|
|
|
|
|
|
Vinit K. Asar (5) |
|
|
|
|
|
|
|
|
|
|
|
71,532 |
|
$ |
822,568 |
|
|
|
|
|
|
Vinit K. Asar (8) |
|
|
|
|
|
|
|
|
|
|
|
8,987 |
|
$ |
103,344 |
|
|
|
|
|
|
Vinit K. Asar (9) |
|
|
|
|
|
|
|
|
|
|
|
4,625 |
|
$ |
53,184 |
|
|
|
|
|
|
Vinit K. Asar (10) |
|
|
|
|
|
|
|
|
|
|
|
2,698 |
|
$ |
31,025 |
|
|
|
|
|
|
Thomas E. Kiraly (1) |
|
|
|
|
|
|
|
|
|
|
|
5,000 |
|
$ |
57,497 |
|
|
|
|
|
|
Thomas E. Kiraly (2) |
|
|
|
|
|
|
|
|
|
|
|
25,000 |
|
$ |
287,483 |
|
|
|
|
|
|
Thomas E. Kiraly (4) |
|
|
|
|
|
|
|
|
|
|
|
11,922 |
|
$ |
137,095 |
|
|
|
|
|
|
Thomas E. Kiraly (5) |
|
|
|
|
|
|
|
|
|
|
|
17,883 |
|
$ |
205,642 |
|
|
|
|
|
|
Thomas E. Kiraly (6) |
|
|
|
|
|
|
|
|
|
|
|
14,898 |
|
$ |
171,317 |
|
|
|
|
|
|
Thomas E. Kiraly (6) |
|
|
|
|
|
|
|
|
|
|
|
9,932 |
|
$ |
114,211 |
|
|
|
|
|
|
Samuel M. Liang (1) |
|
|
|
|
|
|
|
|
|
|
|
5,000 |
|
$ |
57,497 |
|
|
|
|
|
|
Samuel M. Liang (2) |
|
|
|
|
|
|
|
|
|
|
|
22,500 |
|
$ |
258,734 |
|
|
|
|
|
|
Samuel M. Liang (4) |
|
|
|
|
|
|
|
|
|
|
|
10,333 |
|
$ |
118,822 |
|
|
|
|
|
|
Samuel M. Liang (5) |
|
|
|
|
|
|
|
|
|
|
|
15,500 |
|
$ |
178,239 |
|
|
|
|
|
|
Samuel M. Liang (7) |
|
|
|
|
|
|
|
|
|
|
|
2,949 |
|
$ |
33,911 |
|
|
|
|
|
|
Samuel M. Liang (7) |
|
|
|
|
|
|
|
|
|
|
|
4,424 |
|
$ |
50,873 |
|
|
|
|
|
|
Kenneth W. Wilson (1) |
|
|
|
|
|
|
|
|
|
|
|
5,000 |
|
$ |
57,497 |
|
|
|
|
|
|
Kenneth W. Wilson (2) |
|
|
|
|
|
|
|
|
|
|
|
11,000 |
|
$ |
126,492 |
|
|
|
|
|
|
Kenneth W. Wilson (4) |
|
|
|
|
|
|
|
|
|
|
|
4,770 |
|
$ |
54,852 |
|
|
|
|
|
|
Kenneth W. Wilson (5) |
|
|
|
|
|
|
|
|
|
|
|
7,155 |
|
$ |
82,277 |
|
|
|
|
|
|
Kenneth W. Wilson (8) |
|
|
|
|
|
|
|
|
|
|
|
1,831 |
|
$ |
21,055 |
|
|
|
|
|
|
Kenneth W. Wilson (9) |
|
|
|
|
|
|
|
|
|
|
|
1,275 |
|
$ |
14,662 |
|
|
|
|
|
|
Kenneth W. Wilson (10) |
|
|
|
|
|
|
|
|
|
|
|
744 |
|
$ |
8,555 |
|
|
|
|
|
|
Thomas E. Hartman (1) |
|
|
|
|
|
|
|
|
|
|
|
5,000 |
|
$ |
57,497 |
|
|
|
|
|
|
Thomas E. Hartman (2) |
|
|
|
|
|
|
|
|
|
|
|
10,000 |
|
$ |
114,993 |
|
|
|
|
|
|
Thomas E. Hartman (3) |
|
|
|
|
|
|
|
|
|
|
|
3,719 |
|
$ |
42,766 |
|
|
|
|
|
|
Thomas E. Hartman (4) |
|
|
|
|
|
|
|
|
|
|
|
3,180 |
|
$ |
36,568 |
|
|
|
|
|
|
Thomas E. Hartman (5) |
|
|
|
|
|
|
|
|
|
|
|
4,770 |
|
$ |
54,852 |
|
|
|
|
|
|
Thomas E. Hartman (8) |
|
|
|
|
|
|
|
|
|
|
|
866 |
|
$ |
9,958 |
|
|
|
|
|
|
Thomas E. Hartman (9) |
|
|
|
|
|
|
|
|
|
|
|
513 |
|
$ |
5,899 |
|
|
|
|
|
|
Thomas E. Hartman (10) |
|
|
|
|
|
|
|
|
|
|
|
299 |
|
$ |
3,438 |
|
|
|
|
|
(1) These time-based restricted stock units were granted on October 11, 2016 and vest 25% annually.
(2) These time-based restricted stock units were granted on April 29, 2016 and vest 25% annually.
(3) These time-based restricted stock units were granted on November 10, 2015 and vest 25% annually.
(4) These time-based restricted stock units were granted on March 6, 2015 and vest 25% annually.
(5) These performance-based restricted stock units (conditions discussed in the Compensation Discussion and Analysis section of this Annual Report on Form 10-K) were granted on March 6, 2015 and vest 25% annually as the performance goal was achieved as of December 31, 2015.
(6) These time-based restricted stock units were granted on October 1, 2014 and vest 25% annually.
(7) These time-based restricted stock units were granted on May 19, 2014 and vest 25% annually.
(8) These time-based restricted stock units were granted on March 7, 2014 and vest 25% annually.
(9) These time-based restricted stock units were granted on March 11, 2013 and vest 25% annually.
(10) These performance-based restricted stock units were granted on March 11, 2013 and vest 25% annually as the performance goal was achieved as of December 31, 2013.
(11) The market value of the stock units reported was computed by multiplying the closing market price of the stock on December 31, 2016 ($11.4993) by the number of unvested restricted stock units.
OPTION EXERCISES AND STOCK VESTED IN 2016
The following table sets forth information regarding stock options exercised and restricted share units vested during 2016 for each of the named executive officers on an aggregated basis:
|
|
|
Option Awards |
|
Stock Awards |
| |||||
|
Name |
|
Number of Shares |
|
Value Realized on |
|
Number of Shares |
|
Value Realized on |
| |
|
Vinit K. Asar |
|
|
|
|
|
33,626 |
|
$ |
169,875 |
|
|
Thomas E. Kiraly |
|
|
|
|
|
16,389 |
|
$ |
121,463 |
|
|
Samuel M. Liang |
|
|
|
|
|
7,131 |
|
$ |
37,850 |
|
|
Kenneth W. Wilson |
|
|
|
|
|
7,973 |
|
$ |
34,786 |
|
|
Thomas E. Hartman |
|
|
|
|
|
4,742 |
|
$ |
25,124 |
|
(1) The value of restricted stock units was calculated by multiplying the number of shares vesting by the closing market price of our common stock on the date of vesting.
(2) The 2015 PSU attainment calculation was not finalized until 2018. Although the shares were earned in 2016, the executives did not take possession of the shares during 2016, and therefore those shares are not included in this table. For Mr. Asar, 23,844 shares were earned but did not release in 2016. For Messrs. Kiraly, Liang, Wilson and Hartman, those numbers are 5,961 shares, 5,166 shares, 2,384 shares and 1,589 shares, respectively.
2016 PENSION BENEFITS
The following table sets forth the actuarial present value of each named executive officer’s accumulated benefit under our DB SERP, if any, assuming benefits are paid at normal retirement age based on current levels of compensation. The table also shows the number of years of credited service under each such plan, computed as of the same pension plan measurement date used in the Company’s audited financial statements for the year ended December 31, 2016. Only Messrs. Asar and Hartman were participants in our DB SERP during 2016.
|
Name |
|
Plan Name |
|
Number of Years |
|
Present Value of |
|
Payments During Last |
| ||
|
Vinit K. Asar |
|
DB SERP |
|
8 |
|
$ |
1,277,607 |
|
$ |
— |
|
|
Thomas E. Hartman |
|
DB SERP |
|
6 |
|
$ |
380,220 |
|
$ |
— |
|
The DB SERP is a nonqualified, unfunded plan that provides retirement benefits for executive officers; it contains provisions to ensure its compliance with Internal Revenue Code Section 409A.
Benefits accrue pro rata over the number of years (not to exceed 20) from a participant’s initial coverage by the DB SERP until the participant reaches the age of 65. The DB SERP was implemented in January 2004; credited service for the benefit accrual started at that time.
The DB SERP benefit is determined by the benefit percentage assigned by our Compensation Committee to an executive and is not primarily determined on the basis of average base compensation and years of service. The current benefit percentage for each named executive officer is Vinit Asar: 65%; Tom Hartman: 40%.
Vesting is at the rate of 20% per year of employment with the Company. All named executive officers who are participants in the plan are fully vested.
The present value of the accumulated benefit was determined using the following assumptions, which are the same as used for financial reporting, except where noted:
· Measurement date: December 31, 2016 (December 31, 2015 for amounts calculated to determine year-over-year increase in actuarial present values)
· Fiscal year end: December 31, 2016
· Discount rate: 3.54% (3.64% for present values calculated as of December 31, 2015)
· Mortality table (pre-retirement): None
· Mortality table (post-retirement): Not applicable
· Normal retirement age for DB SERP: Age 65
· Withdrawal rates: None*
· Retirement rates: None prior to normal retirement age, 100% at normal retirement date*
· Accumulated benefit is calculated based on retirement percentage, credited service and pay as of the respective measurement dates
· Present value is the present value of fifteen years certain annuity payable at normal retirement date
* Assumes executive will not terminate, become disabled, die or retire prior to normal retirement age.
The DB SERP benefit, once calculated, is paid out annually for a fifteen year period, commencing after a participant’s retirement at age 65 from the Company, with no social security reduction or other offset. Upon the death of a participant, any unpaid vested benefits will be paid to the designated beneficiary of the participant. If a participant retires from the Company before reaching the age of 65, then the benefits of such participant under the DB SERP will be subject to a reduction for early commencement.
Upon the occurrence of a change in control of the Company, as defined in the DB SERP, all actively employed participants will be deemed to be 100% vested and the vested, accrued benefit will be funded via a Rabbi Trust in an amount equal to the present value of the accrued benefits. Periodic payments may be made to the trust so the trust’s assets continue to equal the present value of the accrued benefits. The trust is subject to the Company’s creditors’ claims in the event of the Company’s insolvency. Alternatively, the Company may, in its discretion, pay the present value of the DB SERP in a lump sum following a change in control.
2016 NONQUALIFIED DEFERRED COMPENSATION
The following table sets forth the contributions, earnings and aggregate balances under our DC SERP for those executive officers who participated in the plan in 2016 and received credits under our DC SERP in 2016. Messrs. Kiraly, Liang and
Wilson are the only named executive officers currently participating in our DC SERP. Messrs. Asar and Hartman do not participate in our DC SERP.
|
Name |
|
Executive |
|
Registrant |
|
Aggregate |
|
Aggregate |
|
Aggregate |
| |||||
|
Thomas E. Kiraly |
|
$ |
— |
|
$ |
90,727 |
|
$ |
— |
|
$ |
— |
|
$ |
190,159 |
|
|
Samuel M. Liang |
|
$ |
— |
|
$ |
89,120 |
|
$ |
— |
|
$ |
— |
|
$ |
188,086 |
|
|
Kenneth W. Wilson |
|
$ |
— |
|
$ |
44,165 |
|
|
|
|
|
$ |
136,414 |
| ||
(1) Amounts included in this column are reflected in the Summary Compensation Table.
(2) The Aggregate Earnings are not “above-market or preferential earnings” and are therefore not required to be reported in the Summary Compensation Table.
(3) Amounts included in this column that have been reported in the Summary Compensation Table since 2014 for each named executive officer are: Mr. Kiraly - $180,727; Mr. Liang - $174,120; Mr. Wilson - $125,106.
In May 2013, our Board of Directors, upon the recommendation of our Compensation Committee, adopted the DC SERP. The DC SERP is a nonqualified defined contribution plan in which certain executive officers and other senior employees are eligible to participate. Under the terms of the DC SERP, we may credit a participant’s account with either an amount equal to a specified percentage of the participant’s base salary or a stated flat dollar amount. Our Compensation Committee recommended establishing the DC SERP as a means of providing a retirement benefit for certain executive officers who are not covered by the DB SERP. The first credits under the DC SERP were made in 2014.
Unless specified otherwise in writing to a participant, a participant becomes 100% vested in his or her account upon the earlier of: (a) death; (b) disability; (c) five years of participation: (d) becoming retirement eligible (age 60 or greater with at least five years of service; or (e) if the participant’s employment is terminated upon or following a change in control and (1) the participant becomes entitled to severance benefits under any applicable employment, severance or similar agreement with the Company, or (2) within one year of the change in control, the Company terminates the participant for reasons other than cause, death, or disability, or the participant terminates employment because of the occurrence of a material diminution of his or her responsibilities, a reduction of his or her base salary or bonus plan targets, or a relocation of his or her principal place of employment more than 25 miles from his or her current location.
Benefits under the DC SERP are payable upon a termination from employment in either a lump sum or in annual installments (up to fifteen years), as previously elected by the participant, or upon death or disability as soon as administratively practicable thereafter (but in no event more than 90 days later).
TERMINATION AND CHANGE OF CONTROL PROVISIONS
The following tables set forth potential payments upon any termination of employment, including resignation, other types of separation or retirement of the named executive officer or change in control of the Company, assuming the triggering event took place on December 31, 2016 (i.e., the last business day of the Company’s last completed fiscal year) and the price per share of the Company’s common stock was $11.4993, which was the closing market price as of that date. To the extent that the form and amount of any payment or benefit that would be provided in connection with any triggering event is fully disclosed in the foregoing Pension Benefits table, footnote reference is made to that disclosure.
As discussed in our 2016 Compensation Discussion and Analysis section, our Company has entered into employment and non-compete agreements with each of our named executive officers. The agreements provide for compensation and benefits in the termination and change in control scenarios discussed in the tables below.
Vinit K. Asar
|
|
|
Voluntary |
|
Retirement |
|
Involuntary |
|
Involuntary |
|
Death |
|
Disability |
| ||||||
|
Death Benefit (including life insurance) (1) |
|
$ |
— |
|
$ |
— |
|
$ |
— |
|
$ |
— |
|
$ |
1,428,007 |
|
$ |
— |
|
|
Severance Payments (2) |
|
$ |
— |
|
$ |
— |
|
$ |
2,856,013 |
|
$ |
2,856,013 |
|
$ |
— |
|
$ |
— |
|
|
Restricted Share Units (Unvested and Accelerated) (3) |
|
$ |
— |
|
$ |
2,065,676 |
|
$ |
2,065,676 |
|
$ |
2,065,676 |
|
$ |
2,065,676 |
|
$ |
2,065,676 |
|
|
DB SERP Benefit (4) |
|
$ |
— |
|
$ |
— |
|
$ |
— |
|
$ |
— |
|
$ |
— |
|
$ |
— |
|
|
DC SERP Benefit (5) |
|
$ |
— |
|
$ |
— |
|
$ |
— |
|
$ |
— |
|
$ |
— |
|
$ |
— |
|
|
Benefits Continuation (6) |
|
$ |
— |
|
$ |
— |
|
$ |
74,644 |
|
$ |
74,644 |
|
$ |
— |
|
$ |
— |
|
|
Outplacement (7) |
|
$ |
— |
|
$ |
— |
|
$ |
30,000 |
|
$ |
30,000 |
|
$ |
— |
|
$ |
— |
|
|
Cutback (8) |
|
$ |
— |
|
$ |
— |
|
$ |
— |
|
$ |
— |
|
$ |
— |
|
$ |
— |
|
(1) The death benefit includes a supplemental life insurance benefit equal to 2 times base salary. Mr. Asar is also eligible for the Company’s standard life insurance.
(2) The severance benefit is equal to 2 times base salary and target bonus.
(3) This calculation is based on the accelerated vesting of all earned but unvested restricted share units, as shown on the Outstanding Equity Awards at Fiscal Year-End table.
(4) This amount reflects the present value of the additional benefit which would accrue based on providing additional credited service for the duration of any severance period. This is in addition to the present value of the DB SERP benefit as of December 31, 2016 as shown in the Pension Benefits table.
(5) Mr. Asar is not a participant in the DC SERP.
(6) This amount represents the cost of providing the continuation of certain benefits (e.g., health insurance, life and disability insurance, financial planning).
(7) Assumed value for providing outplacement services following a termination.
(8) Based on an estimated calculation, Mr. Asar’s separation payments upon termination following a change in control would trigger an excise tax payment in accordance with Internal Revenue Code Sections 280G and 4999.
Thomas E. Kiraly
|
|
|
Voluntary |
|
Retirement |
|
Involuntary |
|
Involuntary |
|
Death |
|
Disability |
| ||||||
|
Death Benefit (including life insurance) (1) |
|
$ |
— |
|
$ |
— |
|
$ |
— |
|
$ |
— |
|
$ |
450,000 |
|
$ |
— |
|
|
Severance Payments (2) |
|
$ |
— |
|
$ |
— |
|
$ |
1,182,157 |
|
$ |
1,182,157 |
|
$ |
— |
|
$ |
— |
|
|
Restricted Share Units (Unvested and Accelerated) (3) |
|
$ |
— |
|
$ |
973,245 |
|
$ |
973,245 |
|
$ |
973,245 |
|
$ |
973,245 |
|
$ |
973,245 |
|
|
DB SERP Benefit (4) |
|
$ |
— |
|
$ |
— |
|
$ |
— |
|
$ |
— |
|
$ |
— |
|
$ |
— |
|
|
DC SERP Benefit (5) |
|
$ |
— |
|
$ |
190,159 |
|
$ |
— |
|
$ |
190,159 |
|
$ |
190,159 |
|
$ |
190,159 |
|
|
Benefits Continuation (6) |
|
$ |
— |
|
$ |
— |
|
$ |
61,669 |
|
$ |
61,669 |
|
$ |
— |
|
$ |
— |
|
|
Outplacement (7) |
|
$ |
— |
|
$ |
— |
|
$ |
22,500 |
|
$ |
22,500 |
|
$ |
— |
|
$ |
— |
|
|
Cutback (8) |
|
$ |
— |
|
$ |
— |
|
$ |
— |
|
$ |
— |
|
$ |
— |
|
$ |
— |
|
(1) Mr. Kiraly is also eligible for the Company’s standard life insurance.
(2) The severance benefit is equal to 1.5 times base salary and target bonus.
(3) This calculation is based on the accelerated vesting of all earned but unvested restricted share units, as shown on the Outstanding Equity Awards at Fiscal Year-End table.
(4) Mr. Kiraly is not a participant in the DB SERP.
(5) This amount reflects the full amount Mr. Kiraly would be entitled to on the corresponding event.
(6) This amount represents the cost of providing the continuation of certain benefits (e.g., health insurance, life and disability insurance, financial planning).
(7) Assumed value for providing outplacement services following a termination.
(8) Based on an estimated calculation, Mr. Kiraly’s separation payments upon termination following a change in control would not trigger an excise tax payment in accordance with Internal Revenue Code Sections 280G and 4999.
Samuel M. Liang
|
|
|
Voluntary |
|
Retirement |
|
Involuntary |
|
Involuntary |
|
Death |
|
Disability |
| ||||||
|
Death Benefit (including life insurance) (1) |
|
$ |
— |
|
$ |
— |
|
$ |
— |
|
$ |
— |
|
$ |
450,000 |
|
$ |
— |
|
|
Severance Payments (2) |
|
$ |
— |
|
$ |
— |
|
$ |
1,124,466 |
|
$ |
1,124,466 |
|
$ |
— |
|
$ |
— |
|
|
Restricted Share Units (Unvested and Accelerated) (3) |
|
$ |
— |
|
$ |
698,076 |
|
$ |
698,076 |
|
$ |
698,076 |
|
$ |
698,076 |
|
$ |
698,076 |
|
|
DB SERP Benefit (4) |
|
$ |
— |
|
$ |
— |
|
$ |
— |
|
$ |
— |
|
$ |
— |
|
$ |
— |
|
|
DC SERP Benefit (5) |
|
$ |
— |
|
$ |
188,086 |
|
$ |
— |
|
$ |
188,086 |
|
$ |
188,086 |
|
$ |
188,086 |
|
|
Benefits Continuation (6) |
|
$ |
— |
|
$ |
— |
|
$ |
61,965 |
|
$ |
61,965 |
|
$ |
— |
|
$ |
— |
|
|
Outplacement (7) |
|
$ |
— |
|
$ |
— |
|
$ |
22,500 |
|
$ |
22,500 |
|
$ |
— |
|
$ |
— |
|
|
Cutback (8) |
|
$ |
— |
|
$ |
— |
|
$ |
— |
|
$ |
— |
|
$ |
— |
|
$ |
— |
|
(1) Mr. Liang is also eligible for the Company’s standard life insurance.
(2) The severance benefit is equal to 1.5 times base salary and target bonus.
(3) This calculation is based on the accelerated vesting of all earned but unvested restricted share units, as shown on the Outstanding Equity Awards at Fiscal Year-End table.
(4) Mr. Liang is not a participant in the DB SERP.
(5) This amount reflects the full amount Mr. Liang would be entitled to on the corresponding event.
(6) This amount represents the cost of providing the continuation of certain benefits (e.g., health insurance, life and disability insurance, financial planning).
(7) Assumed value for providing outplacement services following a termination.
(8) Based on an estimated calculation, Mr. Liang’s separation payments upon termination following a change in control would not trigger an excise tax payment in accordance with Internal Revenue Code Sections 280G and 4999.
Kenneth W. Wilson
|
|
|
Voluntary |
|
Retirement |
|
Involuntary |
|
Involuntary |
|
Death |
|
Disability |
| ||||||
|
Death Benefit (including life insurance) (1) |
|
$ |
— |
|
$ |
— |
|
$ |
— |
|
$ |
— |
|
$ |
355,681 |
|
$ |
— |
|
|
Severance Payments (2) |
|
$ |
— |
|
$ |
— |
|
$ |
800,283 |
|
$ |
800,283 |
|
$ |
— |
|
$ |
— |
|
|
Restricted Share Units (Unvested and Accelerated) (3) |
|
$ |
— |
|
$ |
365,390 |
|
$ |
365,390 |
|
$ |
365,390 |
|
$ |
365,390 |
|
$ |
365,390 |
|
|
DB SERP Benefit (4) |
|
$ |
— |
|
$ |
— |
|
$ |
— |
|
$ |
— |
|
$ |
— |
|
$ |
— |
|
|
DC SERP Benefit (5) |
|
$ |
— |
|
$ |
136,414 |
|
$ |
— |
|
$ |
136,414 |
|
$ |
136,414 |
|
$ |
136,414 |
|
|
Benefits Continuation (6) |
|
$ |
— |
|
$ |
— |
|
$ |
52,671 |
|
$ |
52,671 |
|
$ |
— |
|
$ |
— |
|
|
Outplacement (7) |
|
$ |
— |
|
$ |
— |
|
$ |
22,500 |
|
$ |
22,500 |
|
$ |
— |
|
$ |
— |
|
|
Cutback (8) |
|
$ |
— |
|
$ |
— |
|
$ |
— |
|
$ |
— |
|
$ |
— |
|
$ |
— |
|
(1) The death benefit includes a payment equal to 1 times base salary. Mr. Wilson is also eligible for the Company’s standard life insurance.
(2) The severance benefit is equal to 1.5 times base salary and target bonus.
(3) This calculation is based on the accelerated vesting of all earned but unvested restricted share units, as shown on the Outstanding Equity Awards at Fiscal Year-End table.
(4) Mr. Wilson is not a participant in the DB SERP.
(5) This amount reflects the full amount Mr. Wilson would be entitled to on the corresponding event.
(6) This amount represents the cost of providing the continuation of certain benefits (e.g., health insurance, life and disability insurance, financial planning).
(7) Assumed value for providing outplacement services following a termination.
(8) Based on an estimated calculation, Mr. Wilson’s separation payments upon termination following a change in control would not trigger an excise tax payment in accordance with Internal Revenue Code Sections 280G and 4999.
Thomas E. Hartman
|
|
|
Voluntary |
|
Retirement |
|
Involuntary |
|
Involuntary |
|
Death |
|
Disability |
| ||||||
|
Death Benefit (including life insurance) (1) |
|
$ |
— |
|
$ |
— |
|
$ |
— |
|
$ |
— |
|
$ |
— |
|
$ |
— |
|
|
Severance Payments (2) |
|
$ |
— |
|
$ |
— |
|
$ |
514,081 |
|
$ |
514,081 |
|
$ |
— |
|
$ |
— |
|
|
Restricted Share Units (Unvested and Accelerated) (3) |
|
$ |
— |
|
$ |
325,971 |
|
$ |
325,971 |
|
$ |
325,971 |
|
$ |
325,971 |
|
$ |
325,971 |
|
|
DB SERP Benefit (4) |
|
$ |
— |
|
$ |
— |
|
$ |
138,914 |
|
$ |
138,914 |
|
$ |
— |
|
$ |
— |
|
|
DC SERP Benefit (5) |
|
$ |
— |
|
$ |
— |
|
$ |
— |
|
$ |
— |
|
$ |
— |
|
$ |
— |
|
|
Benefits Continuation (6) |
|
$ |
— |
|
$ |
— |
|
$ |
27,386 |
|
$ |
27,386 |
|
$ |
— |
|
$ |
— |
|
|
Outplacement (7) |
|
$ |
— |
|
$ |
— |
|
$ |
— |
|
$ |
— |
|
$ |
— |
|
$ |
— |
|
|
Cutback (8) |
|
$ |
— |
|
$ |
— |
|
$ |
— |
|
$ |
— |
|
$ |
— |
|
$ |
— |
|
(1) Mr. Hartman is eligible for the Company’s standard life insurance.
(2) The severance benefit is equal to 1.0 times base salary and target bonus.
(3) This calculation is based on the accelerated vesting of all earned but unvested restricted share units, as shown on the Outstanding Equity Awards at Fiscal Year-End table.
(4) This amount reflects the present value of the additional benefit which would accrue based on providing additional credited service for the duration of any severance period. This is in addition to the present value of the DB SERP benefit as of December 31, 2016 as shown in the Pension Benefits table.
(5) Mr. Hartman is not a participant in the DC SERP.
(6) This amount represents the cost of providing the continuation of certain benefits (e.g., health insurance, life and disability insurance, financial planning).
(7) Mr. Hartman does not receive outplacement services following a termination.
(8) Based on an estimated calculation, Mr. Hartman’s separation payments upon termination following a change in control would not trigger an excise tax payment in accordance with Internal Revenue Code Sections 280G and 4999.
COMPENSATION RISK ASSESSMENT
We monitor and assess periodically our enterprise risks, including risks from our compensation policies and practices for our employees. Based on our periodic assessments, we believe that risks arising from our compensation policies and practices for our employees, including our named executive officers, are not reasonably likely to have a material adverse effect on our Company. We believe our compensation policies and practices provide an appropriate balance between short-term and long-term incentives, encourage our employees to produce superior results for our company without having to take excessive or inappropriate risks to do so, and continue to serve the best interests of our Company and our shareholders.
DIRECTOR COMPENSATION
The compensation structure for 2016 for non-employee directors included the following:
· An annual cash retainer of $60,000 paid in four equal installments.
· An annual grant of 8,875 restricted stock units. These units have a one year vesting cycle.
· A $1,000 honorarium for any committee meeting, whether attended in person or via conference call.
· A $15,000 cash retainer for the chairpersons of the Audit Committee and Compensation Committee and a $10,000 cash retainer for the chairpersons of the Corporate Governance & Nominating and Quality & Technology Committees, paid at the same time as the first installment of the annual cash retainer.
· A $75,000 cash retainer for the non-employee Chairman of the Board of Directors.
· A substantial target for stock ownership by each director, in a pre-determined time frame, has been established. Each director is expected to own $300,000 of the Company’s common stock within five years of joining our Board of Directors.
· Each non-employee director may choose to defer all or a portion of his or her annual restricted stock grant. At the time of deferral, the deferring director may elect to have the deferred restricted stock delivered to the director in the form of shares of common stock on or about January 15th of the year following the calendar year in which the director’s deferral period ends.
The following table sets forth information regarding the compensation received by each of our Company’s non-employee directors for their services as a director during the year ended December 31, 2016.
|
Name |
|
Fees Earned |
|
Stock |
|
Option |
|
Total |
| ||||
|
Asif Ahmad |
|
$ |
77,000 |
|
$ |
57,954 |
|
$ |
— |
|
$ |
134,954 |
|
|
Christopher B. Begley |
|
$ |
86,000 |
|
$ |
57,954 |
|
$ |
— |
|
$ |
143,954 |
|
|
Thomas P. Cooper, M.D. |
|
$ |
167,000 |
|
$ |
57,954 |
|
$ |
— |
|
$ |
224,954 |
|
|
Cynthia L. Feldmann |
|
$ |
85,000 |
|
$ |
57,954 |
|
$ |
— |
|
$ |
142,954 |
|
|
Stephen E. Hare |
|
$ |
87,000 |
|
$ |
57,954 |
|
$ |
— |
|
$ |
144,954 |
|
|
Cynthia L. Lucchese |
|
$ |
69,000 |
|
$ |
57,954 |
|
$ |
— |
|
$ |
126,954 |
|
|
Richard R. Pettingill |
|
$ |
78,000 |
|
$ |
57,954 |
|
$ |
— |
|
$ |
135,954 |
|
|
Kathryn M. Sullivan |
|
$ |
72,329 |
|
$ |
57,954 |
|
$ |
— |
|
$ |
130,283 |
|
(1) Amounts shown include all fees earned for services as a director, including annual retainer fees, committee and/or chairmanship fees, and meeting fees.
(2) The restricted shares for the annual award had a grant date fair value of $6.53 based on the May 24, 2016 closing price of our common stock. The amount reported in this column represents the aggregate grant date fair value of all restricted stock awards granted to each director during the 2016 calendar year as calculated in accordance with ASC 718.
Aggregate number of unvested restricted share units as of December 31, 2016 for each non-employee director in office as of such date is as follows:
|
Name |
|
Aggregate Number of Unvested Restricted Share |
|
|
Asif Ahmad |
|
8,875 |
|
|
Christopher B. Begley |
|
8,875 |
|
|
Thomas P. Cooper, M.D. |
|
8,875 |
|
|
Cynthia L. Feldmann |
|
8,875 |
|
|
Stephen E. Hare |
|
8,875 |
|
|
Cynthia L. Lucchese |
|
8,875 |
|
|
Richard R, Pettingill |
|
9,340 |
|
|
Kathryn M. Sullivan |
|
8,875 |
|
(3) No stock options were awarded to any directors during the 2016 calendar year. Additionally, there were no option awards outstanding as of December 31, 2016 for each non-employee director in office as of such date.
Compensation Committee Interlocks and Insider Participation
None of our executive officers or directors had relationships in the year ended December 31, 2016 that would require disclosure as a “compensation committee interlock” or “insider participation.”
EXECUTIVE COMPENSATION
SUMMARY COMPENSATION TABLE FOR 2015
The following table sets forth for each of the named executive officers: (i) the dollar value of base salary and bonus earned during the year indicated; (ii) the grant date fair value of stock and option awards granted in the years indicated; (iii) the dollar value of awards granted during the year under non-equity incentive plans; (iv) the change in the actuarial present value of the accumulated pension benefit during the year; (v) all other compensation for the year; and, finally, (vi) the dollar value of total compensation for the year.
|
Name and Principal Position |
|
Year |
|
Salary |
|
Bonus |
|
Stock |
|
Non-Equity |
|
Change in |
|
All Other |
|
Total |
| |||||||
|
Vinit K. Asar |
|
2015 |
|
$ |
695,195 |
|
$ |
— |
|
$ |
2,750,025 |
|
$ |
— |
|
$ |
168,055 |
|
$ |
30,791 |
|
$ |
3,644,066 |
|
|
Chief Executive Officer |
|
2014 |
|
$ |
666,130 |
|
$ |
— |
|
$ |
1,340,426 |
|
$ |
— |
|
$ |
428,291 |
|
$ |
29,614 |
|
$ |
2,464,461 |
|
|
of the Company |
|
2013 |
|
$ |
620,438 |
|
$ |
— |
|
$ |
1,097,420 |
|
$ |
199,841 |
|
$ |
96,287 |
|
$ |
26,948 |
|
$ |
2,040,934 |
|
|
|
|
|
|
|
|
|
|
|
|
|
|
|
|
|
|
|
| |||||||
|
Thomas E. Kiraly |
|
2015 |
|
$ |
453,635 |
|
$ |
— |
|
$ |
825,002 |
|
$ |
— |
|
$ |
— |
|
$ |
120,746 |
|
$ |
1,399,384 |
|
|
Executive Vice President |
|
2014 |
|
$ |
109,039 |
|
$ |
22,898 |
|
$ |
1,019,023 |
|
$ |
— |
|
$ |
— |
|
$ |
53,300 |
|
$ |
1,204,260 |
|
|
and Chief Financial |
|
|
|
|
|
|
|
|
|
|
|
|
|
|
|
|
| |||||||
|
Officer of the Company |
|
|
|
|
|
|
|
|
|
|
|
|
|
|
|
|
| |||||||
|
|
|
|
|
|
|
|
|
|
|
|
|
|
|
|
|
|
| |||||||
|
Samuel M. Liang |
|
2015 |
|
$ |
445,602 |
|
$ |
— |
|
$ |
715,026 |
|
$ |
200,000 |
|
$ |
— |
|
$ |
113,371 |
|
$ |
1,474,000 |
|
|
Executive Vice President |
|
2014 |
|
$ |
261,538 |
|
$ |
83,750 |
|
$ |
608,969 |
|
$ |
— |
|
$ |
— |
|
$ |
69,596 |
|
$ |
1,023,853 |
|
|
of the Company and |
|
|
|
|
|
|
|
|
|
|
|
|
|
|
|
|
| |||||||
|
Chief Operating Officer |
|
|
|
|
|
|
|
|
|
|
|
|
|
|
|
|
| |||||||
|
of Hanger Prosthetics & |
|
|
|
|
|
|
|
|
|
|
|
|
|
|
|
|
| |||||||
|
Orthotics, Inc. and |
|
|
|
|
|
|
|
|
|
|
|
|
|
|
|
|
| |||||||
|
HPO, Inc. |
|
|
|
|
|
|
|
|
|
|
|
|
|
|
|
|
| |||||||
|
|
|
|
|
|
|
|
|
|
|
|
|
|
|
|
|
|
| |||||||
|
Kenneth W. Wilson |
|
2015 |
|
$ |
339,728 |
|
$ |
— |
|
$ |
330,032 |
|
$ |
142,000 |
|
$ |
— |
|
$ |
46,571 |
|
$ |
858,331 |
|
|
President and Chief |
|
2014 |
|
$ |
315,043 |
|
$ |
35,442 |
|
$ |
273,075 |
|
$ |
50,824 |
|
$ |
— |
|
$ |
46,444 |
|
$ |
720,828 |
|
|
Operating Officer of |
|
2013 |
|
$ |
307,577 |
|
$ |
— |
|
$ |
302,532 |
|
$ |
46,463 |
|
$ |
— |
|
$ |
5,045 |
|
$ |
661,617 |
|
|
Southern Prosthetic |
|
|
|
|
|
|
|
|
|
|
|
|
|
|
|
|
| |||||||
|
Supply, Inc. |
|
|
|
|
|
|
|
|
|
|
|
|
|
|
|
|
| |||||||
|
|
|
|
|
|
|
|
|
|
|
|
|
|
|
|
|
|
| |||||||
|
Thomas E. Hartman |
|
2015 |
|
$ |
328,273 |
|
$ |
— |
|
$ |
295,019 |
|
$ |
105,000 |
|
$ |
65,310 |
|
$ |
10,022 |
|
$ |
803,624 |
|
|
Senior Vice President, |
|
2014 |
|
$ |
297,638 |
|
$ |
35,303 |
|
$ |
129,098 |
|
$ |
— |
|
$ |
86,231 |
|
$ |
10,478 |
|
$ |
558,748 |
|
|
General Counsel and |
|
2013 |
|
$ |
289,850 |
|
$ |
— |
|
$ |
121,606 |
|
$ |
36,285 |
|
$ |
33,425 |
|
$ |
9,854 |
|
$ |
491,020 |
|
|
Secretary |
|
|
|
|
|
|
|
|
|
|
|
|
|
|
|
|
| |||||||
(1) All restricted stock units vest 25% per year, commencing one year after the date of issuance. The amount reported in this column represents the aggregate grant date fair value of all time-based and performance-based awards granted during each calendar year as calculated in accordance with ASC 718. For 2015, the executives received 150% of performance-based restricted stock units subject to the award; see “Grants of Plan-Based Awards”. For awards of performance-based restricted stock units, the amounts shown in the column are the grant date fair values calculated based on the probable outcome of the performance conditions on the date of grant. For 2015, the probable outcome on the date of grant was the maximum outcome. The value of the performance-based restricted stock units based on the probable outcome was for Mr. Asar: $1,650,005, Mr. Kiraly: $412,501, Mr. Liang: $357,513, Mr. Wilson: $165,016 and Mr. Hartman: $110,002. The value of the performance-based restricted stock units assuming the highest level of performance was for Mr. Asar: $2,475,007, Mr. Kiraly: $618,752, Mr. Liang: $536,270, Mr. Wilson: $247,524 and Mr. Hartman: $165,003.
(2) The annual incentive awards for 2015 were based on 2015 performance and paid on March 11, 2016.
(3) The above amounts represent the change in actuarial present value of the accumulated pension benefit for each named executive officer who participates in our DB SERP. Details of the DB SERP are described after the Pension Benefits table below and in the 2015 Compensation Discussion and Analysis section. We did not provide above-market earnings in our DC SERP, and, therefore, we have not included any earnings on the DC SERP in this table.
(4) For Mr. Asar, this total includes: premiums for additional life and disability insurance ($9,431), Company contributions to the Company’s defined contribution plan ($6,360), and non-business related automobile expenses ($15,000). For Messrs. Kiraly, Liang, Wilson and Hartman, these totals include: premiums for additional life and disability insurance, non-business related automobile expenses, Company contributions to the individual’s health savings account, and/or Company contributions to the Company’s defined contribution plan. Additionally, Mr. Kiraly received relocation of $8,464 and contributions were made by the Company to non-qualified deferred compensation plans for Messrs. Kiraly ($90,000), Liang ($85,000) and Wilson ($40,956).
GRANTS OF PLAN-BASED AWARDS IN 2015
The following table sets forth information regarding all incentive plan awards that were granted to the named executive officers during 2015, including incentive plan awards (equity based and non-equity based) and other plan-based awards. Disclosure on a separate line item is provided for each grant of an award made to a named executive officer during the year. Non-equity incentive plan awards are awards that are not subject to ASC 718 and are intended to serve as an incentive for performance to occur over a specified period. Non-Equity Awards are prorated for changes in base salary and/or target bonus percentages that occur throughout the year.
|
|
|
|
Estimated Future Payouts |
|
Estimated Future Payouts |
|
|
|
|
| |||||||||||||
|
Name |
|
Grant |
|
Threshold |
|
Target |
|
Maximum |
|
Threshold |
|
Target |
|
Maximum |
|
All Other |
|
Full |
| ||||
|
Vinit K. Asar |
|
3/6/2015 |
|
|
|
|
|
|
|
|
|
|
|
|
|
42,390 |
|
$ |
1,100,021 |
| |||
|
Vinit K. Asar |
|
3/6/2015 |
|
|
|
|
|
|
|
— |
|
63,584 |
|
95,376 |
|
|
|
$ |
1,650,005 |
| |||
|
Vinit K. Asar |
|
1/1/2015 |
|
$ |
— |
|
$ |
695,195 |
|
$ |
1,390,390 |
|
|
|
|
|
|
|
|
|
|
| |
|
|
|
|
|
|
|
|
|
|
|
|
|
|
|
|
|
|
|
|
| ||||
|
Thomas E. Kiraly |
|
3/6/2015 |
|
|
|
|
|
|
|
|
|
|
|
|
|
15,896 |
|
$ |
412,501 |
| |||
|
|
|
3/6/2015 |
|
|
|
|
|
|
|
— |
|
15,896 |
|
23,844 |
|
|
|
$ |
412,501 |
| |||
|
|
|
1/1/2015 |
|
$ |
— |
|
$ |
317,545 |
|
$ |
635,090 |
|
|
|
|
|
|
|
|
|
|
| |
|
|
|
|
|
|
|
|
|
|
|
|
|
|
|
|
|
|
|
|
| ||||
|
Samuel M. Liang |
|
3/6/2015 |
|
|
|
|
|
|
|
|
|
|
|
|
|
13,777 |
|
$ |
357,513 |
| |||
|
|
|
3/6/2015 |
|
|
|
|
|
|
|
— |
|
13,777 |
|
20,666 |
|
|
|
$ |
357,513 |
| |||
|
|
|
1/1/2015 |
|
$ |
— |
|
$ |
267,361 |
|
$ |
534,722 |
|
|
|
|
|
|
|
|
|
|
| |
|
|
|
|
|
|
|
|
|
|
|
|
|
|
|
|
|
|
|
|
| ||||
|
Kenneth W. Wilson |
|
3/6/2015 |
|
|
|
|
|
|
|
|
|
|
|
|
|
6,359 |
|
$ |
165,016 |
| |||
|
|
|
3/6/2015 |
|
|
|
|
|
|
|
— |
|
6,359 |
|
9,539 |
|
|
|
$ |
165,016 |
| |||
|
|
|
1/1/2015 |
|
$ |
— |
|
$ |
169,864 |
|
$ |
339,728 |
|
|
|
|
|
|
|
|
|
|
| |
|
|
|
|
|
|
|
|
|
|
|
|
|
|
|
|
|
|
|
|
| ||||
|
Thomas E. Hartman |
|
11/10/2015 |
|
|
|
|
|
|
|
|
|
|
|
|
|
4,958 |
|
$ |
75,015 |
| |||
|
|
|
3/6/2015 |
|
|
|
|
|
|
|
|
|
|
|
|
|
4,239 |
|
$ |
110,002 |
| |||
|
|
|
3/6/2015 |
|
|
|
|
|
|
|
— |
|
4,239 |
|
6,359 |
|
|
|
$ |
110,002 |
| |||
|
|
|
1/1/2015 |
|
$ |
— |
|
$ |
131,309 |
|
$ |
262,618 |
|
|
|
|
|
|
|
|
|
|
| |
(1) Terms of compensation under the Non-Equity Incentive Plan are discussed in detail in the Compensation Discussion and Analysis section.
(2) The restricted stock described above was awarded as performance-based shares. The restricted units were awarded on March 6, 2015 and vests to the extent of 25% per year, commencing one year after the date of issuance, assuming the pro forma performance goal is achieved. Release of the restrictions on this award was subject to achieving pro forma EPS targets for the performance period of January 1, 2015 through December 31, 2015 per the schedule below. Results in between Threshold and Target, and between Target and Maximum will use straight line calculations for payouts:
|
EPS Result (Q1 2015 through |
|
Percent of Performance |
| |
|
$ |
1.10 |
|
25 |
% |
|
$ |
1.20 |
|
100 |
% |
|
$ |
1.30 |
|
150 |
% |
Our Company’s EPS was $1.47.
(3) The time-based restricted stock units detailed above were awarded on March 6, 2015 (Messrs. Asar, Kiraly, Liang, Wilson and Hartman), and November 10, 2015 (Mr. Hartman). The share price at time of award was $25.95 on March 6, 2015, and $15.13 on November 10, 2015. All shares of restricted stock units vest 25% per year, commencing one year after the date of issuance.
OUTSTANDING EQUITY AWARDS AT 2015 FISCAL YEAR-END
The following table sets forth information on outstanding equity awards held by the named executive officers at December 31, 2015, including the number and market value of restricted stock units and performance based restricted stock units that have not vested.
|
|
|
Option Awards |
|
Stock Awards |
| |||||||||||||||
|
Name |
|
Number of |
|
Number of |
|
Equity |
|
Option |
|
Option |
|
Number of |
|
Market |
|
Equity |
|
Equity |
| |
|
Vinit K. Asar (2) |
|
|
|
|
|
|
|
|
|
|
|
42,390 |
|
$ |
697,316 |
|
|
|
|
|
|
Vinit K. Asar (3) |
|
|
|
|
|
|
|
|
|
|
|
95,376 |
|
$ |
1,568,935 |
|
|
|
|
|
|
Vinit K. Asar (6) |
|
|
|
|
|
|
|
|
|
|
|
13,480 |
|
$ |
221,746 |
|
|
|
|
|
|
Vinit K. Asar (7) |
|
|
|
|
|
|
|
|
|
|
|
9,250 |
|
$ |
152,163 |
|
|
|
|
|
|
Vinit K. Asar (8) |
|
|
|
|
|
|
|
|
|
|
|
5,396 |
|
$ |
88,764 |
|
|
|
|
|
|
Vinit K. Asar (9) |
|
|
|
|
|
|
|
|
|
|
|
938 |
|
$ |
15,430 |
|
|
|
|
|
|
Vinit K. Asar (10) |
|
|
|
|
|
|
|
|
|
|
|
3,375 |
|
$ |
55,519 |
|
|
|
|
|
|
Vinit K. Asar (11) |
|
|
|
|
|
|
|
|
|
|
|
1,500 |
|
$ |
24,675 |
|
|
|
|
|
|
Vinit K. Asar (12) |
|
|
|
|
|
|
|
|
|
|
|
5,400 |
|
$ |
88,830 |
|
|
|
|
|
|
Thomas E. Kiraly (2) |
|
|
|
|
|
|
|
|
|
|
|
15,896 |
|
$ |
261,489 |
|
|
|
|
|
|
Thomas E. Kiraly (3) |
|
|
|
|
|
|
|
|
|
|
|
23,844 |
|
$ |
392,234 |
|
|
|
|
|
|
Thomas E. Kiraly (4) |
|
|
|
|
|
|
|
|
|
|
|
22,347 |
|
$ |
367,608 |
|
|
|
|
|
|
Thomas E. Kiraly (5) |
|
|
|
|
|
|
|
|
|
|
|
14,898 |
|
$ |
245,072 |
|
|
|
|
|
|
Samuel M. Liang (2) |
|
|
|
|
|
|
|
|
|
|
|
13,777 |
|
$ |
226,632 |
|
|
|
|
|
|
Samuel M. Liang (3) |
|
|
|
|
|
|
|
|
|
|
|
20,666 |
|
$ |
339,956 |
|
|
|
|
|
|
Samuel M. Liang (5) |
|
|
|
|
|
|
|
|
|
|
|
4,424 |
|
$ |
72,775 |
|
|
|
|
|
|
Samuel M. Liang (5) |
|
|
|
|
|
|
|
|
|
|
|
6,636 |
|
$ |
109,162 |
|
|
|
|
|
|
Kenneth W. Wilson (2) |
|
|
|
|
|
|
|
|
|
|
|
6,359 |
|
$ |
104,606 |
|
|
|
|
|
|
Kenneth W. Wilson (3) |
|
|
|
|
|
|
|
|
|
|
|
9,539 |
|
$ |
156,917 |
|
|
|
|
|
|
Kenneth W. Wilson (6) |
|
|
|
|
|
|
|
|
|
|
|
2,746 |
|
$ |
45,172 |
|
|
|
|
|
|
Kenneth W. Wilson (7) |
|
|
|
|
|
|
|
|
|
|
|
2,550 |
|
$ |
41,948 |
|
|
|
|
|
|
Kenneth W. Wilson (8) |
|
|
|
|
|
|
|
|
|
|
|
1,488 |
|
$ |
24,478 |
|
|
|
|
|
|
Kenneth W. Wilson (11) |
|
|
|
|
|
|
|
|
|
|
|
750 |
|
$ |
12,338 |
|
|
|
|
|
|
Kenneth W. Wilson (12) |
|
|
|
|
|
|
|
|
|
|
|
2,700 |
|
$ |
44,415 |
|
|
|
|
|
|
Thomas E. Hartman (1) |
|
|
|
|
|
|
|
|
|
|
|
4,958 |
|
$ |
81,559 |
|
|
|
|
|
|
Thomas E. Hartman (2) |
|
|
|
|
|
|
|
|
|
|
|
4,239 |
|
$ |
69,732 |
|
|
|
|
|
|
Thomas E. Hartman (3) |
|
|
|
|
|
|
|
|
|
|
|
6,359 |
|
$ |
104,606 |
|
|
|
|
|
|
Thomas E. Hartman (6) |
|
|
|
|
|
|
|
|
|
|
|
1,299 |
|
$ |
21,369 |
|
|
|
|
|
|
Thomas E. Hartman (7) |
|
|
|
|
|
|
|
|
|
|
|
1,025 |
|
$ |
16,861 |
|
|
|
|
|
|
Thomas E. Hartman (8) |
|
|
|
|
|
|
|
|
|
|
|
598 |
|
$ |
9,837 |
|
|
|
|
|
|
Thomas E. Hartman (11) |
|
|
|
|
|
|
|
|
|
|
|
1,200 |
|
$ |
19,740 |
|
|
|
|
|
(1) These time-based restricted stock units were granted on November 10, 2015 and vest 25% annually.
(2) These time-based restricted stock units were granted on March 6, 2015 and vest 25% annually.
(3) These performance-based restricted stock units (conditions discussed in the 2015 Compensation Discussion and Analysis section of this Annual Report on Form 10-K) were granted on March 6, 2015 and vest 25% annually as the performance goal was achieved as of December 31, 2015.
(4) These time-based restricted stock units were granted on October 1 27, 2014 and vest 25% annually.
(5) These time-based restricted stock units were granted on May 19, 2014 and vest 25% annually.
(6) These time-based restricted stock units were granted on March 7, 2014 and vest 25% annually.
(7) These time-based restricted stock units were granted on March 11, 2013 and vest 25% annually.
(8) These performance-based restricted stock units were granted on March 11, 2013 and vest 25% annually as the performance goal was achieved as of December 31, 2013.
(9) These time-based restricted stock units were granted on August 27, 2012 and vest 25% annually.
(10) These performance-based restricted stock units were granted on August 27, 2012 and vest 25% annually as the performance goal was achieved as of December 31, 2012.
(11) These time-based restricted stock units were granted on March 7, 2012 and vest 25% annually.
(12) These performance-based restricted stock units were granted on March 7, 2012 and vest 25% annually as the performance goal was achieved as of December 31, 2012.
(13) The market value of the stock units reported was computed by multiplying the closing market price of the stock on December 31, 2015 ($16.45) by the number of unvested restricted stock units.
OPTION EXERCISES AND STOCK VESTED IN 2015
The following table sets forth information regarding stock options exercised and restricted share units vested during 2015 for each of the named executive officers on an aggregated basis:
|
|
|
Option Awards |
|
Stock Awards |
| |||||
|
Name |
|
Number of Shares |
|
Value Realized on |
|
Number of Shares |
|
Value Realized on |
| |
|
Vinit K. Asar |
|
|
|
|
|
27,009 |
|
$ |
645,743 |
|
|
Thomas E. Kiraly |
|
|
|
|
|
12,415 |
|
$ |
168,223 |
|
|
Samuel M. Liang |
|
|
|
|
|
3,685 |
|
$ |
82,765 |
|
|
Kenneth W. Wilson |
|
|
|
|
|
10,134 |
|
$ |
221,229 |
|
|
Thomas E. Hartman |
|
|
|
|
|
3,594 |
|
$ |
89,451 |
|
(1) The value of restricted stock units was calculated by multiplying the number of shares vesting by the closing market price of our common stock on the date of vesting.
2015 PENSION BENEFITS
The following table sets forth the actuarial present value of each named executive officer’s accumulated benefit under our DB SERP, if any, assuming benefits are paid at normal retirement age based on current levels of compensation. The table also shows the number of years of credited service under each such plan, computed as of the same pension plan measurement date used in the Company’s audited financial statements for the year ended December 31, 2015. Only Messrs. Asar and Hartman were participants in our DB SERP during 2015.
|
Name |
|
Plan Name |
|
Number of Years |
|
Present Value of |
|
Payments During Last |
| ||
|
Vinit K. Asar |
|
DB SERP |
|
7 |
|
$ |
1,013,590 |
|
$ |
— |
|
|
Thomas E. Hartman |
|
DB SERP |
|
5 |
|
$ |
283,242 |
|
$ |
— |
|
The DB SERP is a nonqualified, unfunded plan that provides retirement benefits for executive officers; it contains provisions to ensure its compliance with Internal Revenue Code Section 409A.
Benefits accrue pro rata over the number of years (not to exceed 20) from a participant’s initial coverage by the DB SERP until the participant reaches the age of 65. The DB SERP was implemented in January 2004; credited service for the benefit accrual started at that time.
The DB SERP benefit is determined by the benefit percentage assigned by the Compensation Committee to an executive and is not primarily determined on the basis of average base compensation and years of service. The current benefit percentage for each named executive officer is Mr. Asar: 65%; Mr. Hartman: 40%.
Vesting is at the rate of 20% per year of employment with the Company. All named executive officers who are participants in the plan are fully vested.
The present value of the accumulated benefit was determined using the following assumptions, which are the same as used for financial reporting, except where noted:
· Measurement date: December 31, 2015 (December 31, 2014 for amounts calculated to determine year-over-year increase in actuarial present values)
· Fiscal year end: December 31, 2015
· Discount rate: 3.64% (3.34% for present values calculated as of December 31, 2014)
· Mortality table (pre-retirement): None*
· Mortality table (post-retirement): Not applicable
· Normal retirement age for DB SERP: Age 65
· Withdrawal rates: None*
· Retirement rates: None prior to normal retirement age, 100% at normal retirement date*
· Accumulated benefit is calculated based on retirement percentage, credited service and pay as of the respective measurement dates
· Present value is the present value of fifteen years certain annuity payable at normal retirement date
* Assumes executive will not terminate, become disabled, die or retire prior to normal retirement age.
The DB SERP benefit, once calculated, is paid out annually for a 15 year period, commencing after a participant’s retirement at age 65 from the Company, with no social security reduction or other offset. Upon the death of a participant, any unpaid vested benefits will be paid to the designated beneficiary of the participant. If a participant retires from the Company before reaching the age of 65, then the benefits of such participant under the DB SERP will be subject to a reduction for early commencement.
Upon the occurrence of a change in control of the Company, as defined in the DB SERP, all actively employed participants will be deemed to be 100% vested and the vested, accrued benefit will be funded via a Rabbi Trust in an amount equal to the present value of the accrued benefits. Periodic payments may be made to the trust so the trust’s assets continue to equal the present value of the accrued benefits. The trust is subject to the Company’s creditors’ claims in the event of the Company’s insolvency. Alternatively, the Company may, in its discretion, pay the present value of the DB SERP in a lump sum following a change in control.
2015 NONQUALIFIED DEFERRED COMPENSATION
The following table sets forth the contributions, earnings and aggregate balances under our DC SERP for those executive officers who participated in the plan in 2015. Messrs. Asar and Hartman do not participate in our DC SERP.
|
Name |
|
Executive |
|
Registrant |
|
Aggregate |
|
Aggregate |
|
Aggregate |
| |||||
|
Thomas E. Kiraly |
|
$ |
— |
|
$ |
90,000 |
|
$ |
— |
|
$ |
— |
|
$ |
85,798 |
|
|
Samuel M. Liang |
|
$ |
— |
|
$ |
85,000 |
|
$ |
— |
|
$ |
— |
|
$ |
82,661 |
|
|
Kenneth W. Wilson |
|
$ |
— |
|
$ |
40,956 |
|
$ |
— |
|
$ |
— |
|
$ |
81,371 |
|
(1) Amounts included in this column are reflected in the Summary Compensation Table.
(2) The Aggregate Earnings are not “above-market or preferential earnings” and are therefore not required to be reported in the Summary Compensation Table.
(3) Amounts included in this column that have been reported in the Summary Compensation Table since 2014 for each named executive officer are Mr. Kiraly: $90,000; Mr. Liang: $85,000; Mr. Wilson: $80,941.
In May 2013, our Board of Directors, upon the recommendation of our Compensation Committee, adopted the DC SERP. The DC SERP is a nonqualified defined contribution plan in which certain executive officers and other senior employees are eligible to participate. Under the terms of the DC SERP, we may credit a participant’s account with either an amount equal to a specified percentage of the participant’s base salary or a stated flat dollar amount. Our Compensation Committee recommended establishing the DC SERP as a means of providing a retirement benefit for certain executive officers who are not covered by the DB SERP. The first credits under the DC SERP were made in 2014.
Unless specified otherwise in writing to a participant, a participant becomes 100% vested in his or her account upon the earlier of: (a) death; (b) disability; (c) five years of participation: (d) becoming retirement eligible (age 60 or greater with at least five years of service; or (e) if the participant’s employment is terminated upon or following a change in control and (1) the participant becomes entitled to severance benefits under any applicable employment, severance or similar agreement with the Company, or (2) within one year of the change in control, the Company terminates the participant for reasons other than cause, death, or disability, or the participant terminates employment because of the occurrence of a material diminution of his or her responsibilities, a reduction of his or her base salary or bonus plan targets, or a relocation of his or her principal place of employment more than 25 miles from his or her current location.
Benefits under the DC SERP are payable upon a termination from employment in either a lump sum or in annual installments (up to fifteen years), as previously elected by the participant, or upon death or disability as soon as administratively practicable thereafter (but in no event more than 90 days later).
TERMINATION AND CHANGE OF CONTROL PROVISIONS
The following tables set forth potential payments upon any termination of employment, including resignation, other types of separation or retirement of the named executive officer or change in control of the Company, assuming the triggering event took place on December 31, 2015 (i.e., the last business day of the Company’s last completed fiscal year) and the price per share of the Company’s common stock was $16.45, which was the closing market price as of that date. To the extent that the form and amount of any payment or benefit that would be provided in connection with any triggering event is fully disclosed in the foregoing Pension Benefits table, footnote reference is made to that disclosure.
As discussed in our 2015 Compensation Discussion and Analysis section, our Company has entered into employment and non-compete agreements with each of our named executive officers. The agreements provide for compensation and benefits in the termination and change in control scenarios discussed in the tables below.
Vinit K. Asar
|
|
|
Voluntary |
|
Retirement |
|
Involuntary |
|
Involuntary |
|
Death |
|
Disability |
| ||||||
|
Death Benefit (including life insurance) (1) |
|
$ |
— |
|
$ |
— |
|
$ |
— |
|
$ |
— |
|
$ |
1,400,006 |
|
$ |
— |
|
|
Severance Payments (2) |
|
$ |
— |
|
$ |
— |
|
$ |
2,800,013 |
|
$ |
2,800,013 |
|
$ |
— |
|
$ |
— |
|
|
Restricted Share Units (Unvested and Accelerated) (3) |
|
$ |
— |
|
$ |
2,913,378 |
|
$ |
2,913,378 |
|
$ |
2,913,378 |
|
$ |
2,913,378 |
|
$ |
2,913,378 |
|
|
DB SERP Benefit (4) |
|
$ |
— |
|
$ |
— |
|
$ |
403,618 |
|
$ |
403,618 |
|
$ |
— |
|
$ |
— |
|
|
DC SERP Benefit (5) |
|
$ |
— |
|
$ |
— |
|
$ |
— |
|
$ |
— |
|
$ |
— |
|
$ |
— |
|
|
Benefits Continuation (6) |
|
$ |
— |
|
$ |
— |
|
$ |
80,243 |
|
$ |
80,243 |
|
$ |
— |
|
$ |
— |
|
|
Outplacement (7) |
|
$ |
— |
|
$ |
— |
|
$ |
30,000 |
|
$ |
30,000 |
|
$ |
— |
|
$ |
— |
|
|
Cutback (8) |
|
$ |
— |
|
$ |
— |
|
$ |
— |
|
$ |
— |
|
$ |
— |
|
$ |
— |
|
(1) The death benefit includes a supplemental life insurance benefit equal to 2 times base salary. Mr. Asar is also eligible for the Company’s standard life insurance.
(2) The severance benefit is equal to 2 times base salary and target bonus.
(3) This calculation is based on the accelerated vesting of all earned but unvested restricted share units, as shown on the Outstanding Equity Awards at Fiscal Year-End table.
(4) This amount reflects the present value of the additional benefit which would accrue based on providing additional credited service for the duration of any severance period. This is in addition to the present value of the DB SERP benefit as of December 31, 2015 as shown in the Pension Benefits table.
(5) Mr. Asar is not a participant in the DC SERP.
(6) This amount represents the cost of providing the continuation of certain benefits (e.g., health insurance, life and disability insurance, financial planning).
(7) Assumed value for providing outplacement services following a termination.
(8) Based on an estimated calculation, Mr. Asar’s separation payments upon termination following a change in control would trigger an excise tax payment in accordance with Internal Revenue Code Sections 280G and 4999.
Thomas E. Kiraly
|
|
|
Voluntary |
|
Retirement |
|
Involuntary or Change in |
|
Involuntary |
|
Death |
|
Disability |
| ||||||
|
Death Benefit (including life insurance) (1) |
|
$ |
— |
|
$ |
— |
|
$ |
— |
|
$ |
— |
|
$ |
450,000 |
|
$ |
— |
|
|
Severance Payments (2) |
|
$ |
— |
|
$ |
— |
|
$ |
1,158,977 |
|
$ |
1,158,977 |
|
$ |
— |
|
$ |
— |
|
|
Restricted Share Units (Unvested and Accelerated) (3) |
|
$ |
— |
|
$ |
1,266,403 |
|
$ |
1,266,403 |
|
$ |
1,266,403 |
|
$ |
1,266,403 |
|
$ |
1,266,403 |
|
|
DB SERP Benefit (4) |
|
$ |
— |
|
$ |
— |
|
$ |
— |
|
$ |
— |
|
$ |
— |
|
$ |
— |
|
|
DC SERP Benefit (5) |
|
$ |
— |
|
$ |
85,798 |
|
$ |
— |
|
$ |
85,798 |
|
$ |
85,798 |
|
$ |
85,798 |
|
|
Benefits Continuation (6) |
|
$ |
— |
|
$ |
— |
|
$ |
67,481 |
|
$ |
67,481 |
|
$ |
— |
|
$ |
— |
|
|
Outplacement (7) |
|
$ |
— |
|
$ |
— |
|
$ |
22,500 |
|
$ |
22,500 |
|
$ |
— |
|
$ |
— |
|
|
Cutback (8) |
|
$ |
— |
|
$ |
— |
|
$ |
— |
|
$ |
(125,445 |
) |
$ |
— |
|
$ |
— |
|
(1) Mr. Kiraly is also eligible for the Company’s standard life insurance.
(2) The severance benefit is equal to 1.5 times base salary and target bonus.
(3) This calculation is based on the accelerated vesting of all earned but unvested restricted share units, as shown on the Outstanding Equity Awards at Fiscal Year-End table.
(4) Mr. Kiraly is not a participant in the DB SERP.
(5) This amount reflects the full amount Mr. Kiraly would be entitled to on the corresponding event.
(6) This amount represents the cost of providing the continuation of certain benefits (e.g., health insurance, life and disability insurance, financial planning).
(7) Assumed value for providing outplacement services following a termination.
(8) Based on an estimated calculation, Mr. Kiraly’s separation payments upon termination following a change in control would trigger an excise tax payment in accordance with Internal Revenue Code Sections 280G and 4999. As a result, Mr. Kiraly would be in a better after-tax position by having his payments reduced by the cutback amount shown, so that the excise tax would not apply, than he would be if he received all of his payments and had to pay the excise tax.
Samuel M. Liang
|
|
|
Voluntary |
|
Retirement |
|
Involuntary |
|
Involuntary |
|
Death |
|
Disability |
| ||||||
|
Death Benefit (including life insurance) (1) |
|
$ |
— |
|
$ |
— |
|
$ |
— |
|
$ |
— |
|
$ |
450,000 |
|
$ |
— |
|
|
Severance Payments (2) |
|
$ |
— |
|
$ |
— |
|
$ |
1,081,217 |
|
$ |
1,081,217 |
|
$ |
— |
|
$ |
— |
|
|
Restricted Share Units (Unvested and Accelerated) (3) |
|
$ |
— |
|
$ |
748,525 |
|
$ |
748,525 |
|
$ |
748,525 |
|
$ |
748,525 |
|
$ |
748,525 |
|
|
DB SERP Benefit (4) |
|
$ |
— |
|
$ |
— |
|
$ |
— |
|
$ |
— |
|
$ |
— |
|
$ |
— |
|
|
DC SERP Benefit (5) |
|
$ |
— |
|
$ |
82,661 |
|
$ |
— |
|
$ |
82,661 |
|
$ |
82,661 |
|
$ |
82,661 |
|
|
Benefits Continuation (6) |
|
$ |
— |
|
$ |
— |
|
$ |
69,198 |
|
$ |
69,198 |
|
$ |
— |
|
$ |
— |
|
|
Outplacement (7) |
|
$ |
— |
|
$ |
— |
|
$ |
22,500 |
|
$ |
22,500 |
|
$ |
— |
|
$ |
— |
|
|
Cutback (8) |
|
$ |
— |
|
$ |
— |
|
$ |
— |
|
$ |
— |
|
$ |
— |
|
$ |
— |
|
(1) Mr. Liang is also eligible for the Company’s standard life insurance.
(2) The severance benefit is equal to 1.5 times base salary and target bonus.
(3) This calculation is based on the accelerated vesting of all earned but unvested restricted share units, as shown on the Outstanding Equity Awards at Fiscal Year-End table.
(4) Mr. Liang is not a participant in the DB SERP.
(5) This amount reflects the full amount Mr. Liang would be entitled to on the corresponding event.
(6) This amount represents the cost of providing the continuation of certain benefits (e.g., health insurance, life and disability insurance, financial planning).
(7) Assumed value for providing outplacement services following a termination.
(8) Based on an estimated calculation, Mr. Liang’s separation payments upon termination following a change in control would not trigger an excise tax payment in accordance with Internal Revenue Code Sections 280G and 4999.
Kenneth W. Wilson
|
|
|
Voluntary |
|
Retirement |
|
Involuntary |
|
Involuntary |
|
Death |
|
Disability |
| ||||||
|
Death Benefit (including life insurance) (1) |
|
$ |
— |
|
$ |
— |
|
$ |
— |
|
$ |
— |
|
$ |
345,322 |
|
$ |
— |
|
|
Severance Payments (2) |
|
$ |
— |
|
$ |
— |
|
$ |
776,974 |
|
$ |
776,974 |
|
$ |
— |
|
$ |
— |
|
|
Restricted Share Units (Unvested and Accelerated) (3) |
|
$ |
— |
|
$ |
429,874 |
|
$ |
429,874 |
|
$ |
429,874 |
|
$ |
429,874 |
|
$ |
429,874 |
|
|
DB SERP Benefit (4) |
|
$ |
— |
|
$ |
— |
|
$ |
— |
|
$ |
— |
|
$ |
— |
|
$ |
— |
|
|
DC SERP Benefit (5) |
|
$ |
— |
|
$ |
81,371 |
|
$ |
— |
|
$ |
81,371 |
|
$ |
81,371 |
|
$ |
81,371 |
|
|
Benefits Continuation (6) |
|
$ |
— |
|
$ |
— |
|
$ |
49,992 |
|
$ |
49,992 |
|
$ |
— |
|
$ |
— |
|
|
Outplacement (7) |
|
$ |
— |
|
$ |
— |
|
$ |
22,500 |
|
$ |
22,500 |
|
$ |
— |
|
$ |
— |
|
|
Cutback (8) |
|
$ |
— |
|
$ |
— |
|
$ |
— |
|
$ |
— |
|
$ |
— |
|
$ |
— |
|
(1) The death benefit includes a payment equal to 1 times base salary. Mr. Wilson is also eligible for the Company’s standard life insurance.
(2) The severance benefit is equal to 1.5 times base salary and target bonus.
(3) This calculation is based on the accelerated vesting of all earned but unvested restricted share units, as shown on the Outstanding Equity Awards at Fiscal Year-End table.
(4) Mr. Wilson is not a participant in the DB SERP.
(5) This amount reflects the full amount Mr. Wilson would be entitled to on the corresponding event.
(6) This amount represents the cost of providing the continuation of certain benefits (e.g., health insurance, life and disability insurance, financial planning).
(7) Assumed value for providing outplacement services following a termination.
(8) Based on an estimated calculation, Mr. Wilson’s separation payments upon termination following a change in control would not trigger an excise tax payment in accordance with Internal Revenue Code Sections 280G and 4999.
Thomas E. Hartman
|
|
|
Voluntary |
|
Retirement |
|
Involuntary |
|
Involuntary |
|
Death |
|
Disability |
| ||||||
|
Death Benefit (including life insurance) (1) |
|
$ |
— |
|
$ |
— |
|
$ |
— |
|
$ |
— |
|
$ |
— |
|
$ |
— |
|
|
Severance Payments (2) |
|
$ |
— |
|
$ |
— |
|
$ |
469,327 |
|
$ |
469,327 |
|
$ |
— |
|
$ |
— |
|
|
Restricted Share Units (Unvested and Accelerated) (3) |
|
$ |
— |
|
$ |
323,713 |
|
$ |
323,713 |
|
$ |
323,713 |
|
$ |
323,713 |
|
$ |
323,713 |
|
|
DB SERP Benefit (4) |
|
$ |
— |
|
$ |
— |
|
$ |
100,484 |
|
$ |
100,484 |
|
$ |
— |
|
$ |
— |
|
|
DC SERP Benefit (5) |
|
$ |
— |
|
$ |
— |
|
$ |
— |
|
$ |
— |
|
$ |
— |
|
$ |
— |
|
|
Benefits Continuation (6) |
|
$ |
— |
|
$ |
— |
|
$ |
25,434 |
|
$ |
25,434 |
|
$ |
— |
|
$ |
— |
|
|
Outplacement (7) |
|
$ |
— |
|
$ |
— |
|
$ |
— |
|
$ |
— |
|
$ |
— |
|
$ |
— |
|
|
Cutback (8) |
|
$ |
— |
|
$ |
— |
|
$ |
— |
|
$ |
— |
|
$ |
— |
|
$ |
— |
|
(1) Ms. Hartman is eligible for the Company’s standard life insurance.
(2) The severance benefit is equal to 1 times base salary and target bonus.
(3) This calculation is based on the accelerated vesting of all earned but unvested restricted share units, as shown on the Outstanding Equity Awards at Fiscal Year-End table.
(4) This amount reflects the present value of the additional benefit which would accrue based on providing additional credited service for the duration of any severance period. This is in addition to the present value of the DB SERP benefit as of December 31, 2015 as shown in the Pension Benefits table.
(5) Mr. Hartman is not a participant in the DC SERP.
(6) This amount represents the cost of providing the continuation of certain benefits (e.g., health insurance, life and disability insurance, financial planning).
(7) Mr. Hartman does not receive outplacement services following a termination.
(8) Based on an estimated calculation, Mr. Hartman’s separation payments upon termination following a change in control would not trigger an excise tax payment in accordance with Internal Revenue Code Sections 280G and 4999.
COMPENSATION RISK ASSESSMENT
We monitor and assess periodically our enterprise risks, including risks from our compensation policies and practices for our employees. Based on our periodic assessments, we believe that risks arising from our compensation policies and practices for our employees, including our named executive officers, are not reasonably likely to have a material adverse effect on our Company. We believe our compensation policies and practices provide an appropriate balance between short-term and long-term incentives, encourage our employees to produce superior results for our company without having to take excessive or inappropriate risks to do so, and continue to serve the best interests of our Company and our shareholders.
DIRECTOR COMPENSATION
The compensation structure for 2015 for non-employee directors included the following:
· An annual cash retainer of $60,000 paid in four equal installments.
· An annual grant of restricted stock units valued at $140,000. These units have a one-year vesting cycle. These restricted stock units, awarded in November 2015, vested in full on May 21, 2016, which vesting date was tied to the previously scheduled 2016 annual meeting of shareholders.
· A $1,000 honorarium for any committee meeting, whether attended in person or via conference call.
· A $15,000 cash retainer for the chairpersons of the Audit Committee and Compensation Committee and a $10,000 cash retainer for the chairpersons of the Corporate Governance & Nominating and Quality & Technology Committees, paid at the same time as the first installment of the annual cash retainer.
· A $75,000 cash retainer for the non-employee Chairman of the Board of Directors.
· A substantial target for stock ownership by each director, in a pre-determined time frame, has been established. Each director is expected to own $300,000 of the Company’s common stock within five years of joining our Board of Directors.
· Each non-employee director may choose to defer all or a portion of his or her annual restricted stock grant. At the time of deferral, the deferring director may elect to have the deferred restricted stock delivered to the director in the form of shares of common stock on or about January 15th of the year following the calendar year in which the director’s deferral period ends.
The following table sets forth information regarding the compensation received by each of our Company’s non-employee directors for their services as a director during the year ended December 31, 2015, and includes two directors who served for a portion of the year but were not directors as of December 31, 2015. Eric Green and Patricia Shrader retired from the Board of Directors on December 17, 2015.
Cynthia Lucchese joined the Board of Directors in May 2015 and Kathryn Sullivan joined the Board of Directors in December 2015.
|
Name |
|
Fees Earned |
|
Stock |
|
Option |
|
Total |
| ||||
|
Asif Ahmad |
|
$ |
65,500 |
|
$ |
140,013 |
|
$ |
— |
|
$ |
205,513 |
|
|
Christopher Begley |
|
$ |
77,500 |
|
$ |
140,013 |
|
$ |
— |
|
$ |
217,513 |
|
|
Thomas Cooper |
|
$ |
147,500 |
|
$ |
140,013 |
|
$ |
— |
|
$ |
287,513 |
|
|
Cynthia L. Feldmann |
|
$ |
85,500 |
|
$ |
140,013 |
|
$ |
— |
|
$ |
225,513 |
|
|
Eric A. Green |
|
$ |
72,500 |
|
$ |
140,013 |
|
$ |
— |
|
$ |
212,513 |
|
|
Stephen E. Hare |
|
$ |
95,500 |
|
$ |
140,013 |
|
$ |
— |
|
$ |
235,513 |
|
|
Cynthia Lucchese |
|
$ |
45,000 |
|
$ |
140,013 |
|
$ |
— |
|
$ |
185,013 |
|
|
Richard Pettingill |
|
$ |
78,500 |
|
$ |
140,013 |
|
$ |
— |
|
$ |
218,513 |
|
|
Patricia B. Shrader |
|
$ |
63,500 |
|
$ |
140,013 |
|
$ |
— |
|
$ |
203,513 |
|
|
Kathryn Sullivan |
|
$ |
— |
|
$ |
69,647 |
|
$ |
— |
|
$ |
69,647 |
|
(1) Amounts shown include all fees earned for services as a director, including annual retainer fees, committee and/or chairmanship fees, and meeting fees.
(2) The restricted shares for the annual award had a grant date fair value of $14.29 based on the November 18, 2015 closing price of our common stock. Kathryn Sullivan received a prorated award on December 18, 2015, with a grant date fair value of $17.53, for her initial service on our Board of Directors as a non-employee director. The amount reported in this column represents the aggregate grant date fair value of all restricted stock awards granted to each director during the 2015 calendar year as calculated in accordance with ASC 718.
Aggregate number of unvested restricted share units as of December 31, 2015 for each non-employee director in office as of such date is as follows:
|
Name |
|
Aggregate Number of Unvested Restricted Share |
|
|
Asif Ahmad |
|
11,291 |
|
|
Christopher Begley |
|
13,654 |
|
|
Thomas Cooper |
|
14,983 |
|
|
Cynthia L. Feldmann |
|
13,681 |
|
|
Eric A. Green |
|
— |
|
|
Stephen E. Hare |
|
14,021 |
|
|
Cynthia Lucchese |
|
9,798 |
|
|
Richard Pettingill |
|
12,768 |
|
|
Patricia B. Shrader |
|
— |
|
|
Kathryn Sullivan |
|
3,973 |
|
(3) No stock options were awarded to any directors during the 2015 calendar year. Additionally, there were no options outstanding as of December 31, 2015 for each non-employee director as of such date.
Compensation Committee Interlocks and Insider Participation
None of our executive officers or directors had relationships in the years ended December 31, 2016 and 2015 that would require disclosure as a “compensation committee interlock” or “insider participation.”
ITEM 12. SECURITY OWNERSHIP OF CERTAIN BENEFICIAL OWNERS AND MANAGEMENT AND RELATED STOCKHOLDER MATTERS
Equity Compensation Plans
The following table sets forth information as of December 31, 2016 regarding our equity compensation plans:
|
Plan Category |
|
Number of securities to be |
|
Weighted average exercise |
|
Number of securities |
|
|
|
|
(a) |
|
(b) |
|
(c) |
|
|
Equity Compensation Plans: |
|
|
|
|
|
|
|
|
Approved by security holders |
|
120,178 |
|
— |
|
— |
|
|
Not approved by security holders |
|
— |
|
— |
|
1,520,564 |
|
|
Total |
|
120,178 |
|
|
|
1,520,564 |
|
Principal Shareholders
As of October 31, 2017, Hanger had a total of 36,299,087 shares of common stock issued and outstanding. The following table sets forth the number of shares of common stock beneficially owned as of October 31, 2017 by: (i) each director and nominee for director of Hanger, (ii) each of the named executive officers; (iii) all directors, nominees and executive officers of Hanger as a group; and (iv) each person known by Hanger to be the beneficial owner of 5% or more of Hanger’s common stock. The list of beneficial owners of 5% or more of Hanger’s common stock is derived from filings of Schedule 13G and Schedule 13D, which we have assumed represent all current 5% or more beneficial owners.
|
Directors and Officers: |
|
Number of |
|
Percent of |
|
|
Asif Ahmad (2) |
|
21,659 |
|
* |
|
|
Vinit K. Asar (3) |
|
153,287 |
|
* |
|
|
Christopher B. Begley (4) |
|
27,236 |
|
* |
|
|
Thomas P. Cooper, M.D. (5) |
|
54,885 |
|
* |
|
|
Cynthia L. Feldmann (6) |
|
86,083 |
|
* |
|
|
Stephen E. Hare (7) |
|
25,254 |
|
* |
|
|
Rebecca Hast (8) |
|
22,270 |
|
* |
|
|
Thomas E. Kiraly (9) |
|
42,655 |
|
* |
|
|
Samuel M. Liang (10) |
|
23,592 |
|
* |
|
|
Cynthia L. Lucchese (11) |
|
18,673 |
|
* |
|
|
Richard R. Pettingill (12) |
|
28,957 |
|
* |
|
|
Kathryn M. Sullivan (13) |
|
12,848 |
|
* |
|
|
Kenneth W. Wilson (14) |
|
25,195 |
|
* |
|
|
All directors, nominees and officers as a group (17 persons) (15) |
|
595,042 |
|
1.6 |
% |
|
5% Shareholders: |
|
|
|
|
|
|
FMR LLC (16) |
|
5,293,641 |
|
14.6 |
% |
|
Hotchkis and Wiley Capital Management, LLC (17) |
|
4,770,359 |
|
13.1 |
% |
|
Invesco Ltd. (18) |
|
4,917,180 |
|
13.6 |
% |
|
Dimensional Fund Advisors LP (19) |
|
1,807,506 |
|
5.0 |
% |
|
KKR North America Fund XI L.P. (20) |
|
3,220,476 |
|
8.9 |
% |
|
BlueMountain Capital Management, LLC (21) |
|
3,225,000 |
|
8.9 |
% |
|
Welsh, Carson, Anderson & Stowe XII, L.P. (22) |
|
2,399,385 |
|
6.6 |
% |
|
The Vanguard Group (23) |
|
2,498,217 |
|
6.9 |
% |
*Less than 1%
(1) Assumes in the case of each shareholder listed above that all shares of restricted stock vesting within 60 days were vested, and the related shares were owned by such shareholder. With respect to each company listed above, the amounts represent the number of shares beneficially owned, as disclosed in company reports regarding beneficial ownership filed with the SEC. To our knowledge, except as noted above, no person or entity is the beneficial owner of more than 5% of the voting power of the Company’s stock.
(2) Includes 21,659 shares owned directly by Mr. Ahmad. Does not include 10,964 shares subject to unvested restricted stock.
(3) Includes 153,287 shares owned directly by Mr. Asar. Does not include 130,688 shares subject to unvested restricted stock.
(4) Includes 27,236 shares owned directly by Mr. Begley. Does not include 10,964 shares subject to unvested restricted stock.
(5) Includes 54,885 shares owned directly by Dr. Cooper. Does not include 10,964 shares subject to unvested restricted stock. Also does not include 14,515 shares subject to vested restricted stock units that Dr. Cooper has elected to defer. Such deferred restricted stock units will be delivered to Dr. Cooper in the form of whole shares of common stock on or about the fifth anniversary of the annual meeting date set forth on the election form for the year of issuance of the restricted stock units.
(6) Includes 86,083 shares owned directly by Ms. Feldmann. Does not include 10,964 shares subject to unvested restricted stock. Also does not include 12,025 shares subject to vested restricted stock units that Ms. Feldmann has elected to defer. Such deferred restricted stock units will be delivered to Ms. Feldmann in the form of whole shares of common stock either (i) on or about the fifth anniversary of the meeting date set forth on the election form for the year of issuance of the restricted stock units, or (ii) on or about January 15th of the year following the calendar year in which Ms. Feldmann’s service as a director terminates, as applicable.
(7) Includes 25,254 shares owned directly by Mr. Hare. Does not include 10,964 shares subject to unvested restricted stock. Also does not include 32,577 shares subject to vested restricted stock units that Mr. Hare has elected to defer. Such deferred restricted stock units will be delivered to Mr. Hare in the form of whole shares of common stock on or about January 15th of the year following the calendar year in which Mr. Hare’s service as a director terminates.
(8) Includes 22,270 shares owned directly by Ms. Hast. Does not include 19,131 shares subject to unvested restricted stock.
(9) Includes 42,655 shares owned directly by Mr. Kiraly. Does not include 67,863 shares subject to unvested restricted stock.
10) Includes 23,592 shares owned directly by Mr. Liang. Does not include 53,700 shares subject to unvested restricted stock.
(11) Includes 18,673 shares owned directly by Ms. Lucchese. Does not include 10,964 shares subject to unvested restricted stock units.
(12) Includes 28,957 shares owned directly by Mr. Pettingill. Does not include 10,964 shares subject to unvested restricted stock.
(13) Includes 12,848 shares owned directly by Ms. Sullivan. Does not include 10,964 shares subject to unvested restricted stock.
(14) Includes 25,195 shares owned directly by Mr. Wilson. Does not include 27,095 shares subject to unvested restricted stock.
(15) Includes 595,042 shares owned directly or controlled by directors and officers of our Company. Does not include 542,814 shares subject to unvested restricted stock, or to unvested or deferred restricted stock units, issued to directors and officers of our Company.
(16) The address of FMR LLC is 245 Summer Street, Boston, Massachusetts 02210. FMR LLC has sole voting power with respect to 3,136,644 of these shares and sole dispositive power with respect to 5,293,641 shares. Fidelity Low-Priced Stock Fund has sole voting power with respect to 1,833,400 of these shares. Edward C. Johnson III, the Director and Chairman of FMR LLC, has sole dispositive power with respect to 5,293,641 shares. Abigail P. Johnson, the Director and Vice-Chairman, Chief Executive Officer and President of FMR LLC, has sole dispositive power with respect to 5,293,641 shares.
(17) The address of Hotchkis and Wiley Capital Management, LLC (“Hotchkis”) is 725 South Figueroa Street, 39th Floor, Los Angeles, California 90017. Hotchkis has sole voting power with respect to 4,019,376 of these shares and sole dispositive power with respect to 4,770,359 shares. Hotchkis and Wiley Small Cap Value Fund has sole voting power and sole dispositive power with respect to 1,996,200 shares.
(18) The address of Invesco Ltd. is 1555 Peachtree Street NE, Atlanta, Georgia 30309. Invesco Ltd. has sole voting power and sole dispositive power with respect to all of these shares.
(19) The address of Dimensional Fund Advisors LP (“Dimensional”) is Building One, 6300 Bee Cave Road, Austin, Texas 78746. Dimensional has sole voting power with respect to 1,715,962 of these shares and sole dispositive power with respect to 1,807,506 of these shares.
(20) The address of KKR North America Fund XI L.P. (“KKR”) is c/o Kohlberg Kravis Roberts & Co. L.P., 9 West 57th Street, Suite 4200, New York, New York 10019. KKR has sole voting power and sole dispositive power with respect to 3,220,476 shares.
(21) The address of BlueMountain Capital Management, LLC (“BlueMountain”) is 280 Park Avenue, 12th Floor, New York, New York 10017. Blue Mountain has shared voting power and shared dispositive power with respect to 3,225,000 shares. BlueMountain Credit Alternatives Master Fund L.P. has shared voting power and shared dispositive power with respect to 2,238,842 shares.
(22) The address of Welsh, Carson, Anderson & Stowe XII, L.P. (“WCAS XII”) is c/o Welsh, Carson, Anderson & Stowe, 320 Park Avenue, Suite 2500, New York, New York 10022. WCAS XII has sole voting and sole dispositive power with respect to 1,710,282 of these shares. Welsh, Carson, Anderson & Stowe XII Delaware, L.P. has sole voting and sole dispositive power with respect to 301,484 of these shares. Welsh Carson, Anderson & Stowe XII Delaware II, L.P. has sole voting and sole dispositive power with respect to 50,026 of these shares. Welsh, Carson, Anderson & Stowe XII Cayman, L.P. has sole voting and sole dispositive power with respect to 312,039 of these shares. WCAS XII Co-Investors LLC has sole voting and sole dispositive power with respect to 25,554 of these shares.
(23) The address of The Vanguard Group is 100 Vanguard Boulevard, Malvern, Pennsylvania 19355. The Vanguard Group has sole voting power with respect to 44,423 of these shares, and shared voting power with respect to 4,600 of these shares. The Vanguard Group has sole dispositive power with respect to 2,451,294 of these shares and shared dispositive power with respect to 46,923 of these shares.
ITEM 13. CERTAIN RELATIONSHIPS AND RELATED TRANSACTIONS, AND DIRECTOR INDEPENDENCE
Policies and Procedures Regarding Related Person Transactions
Our Board of Directors has adopted written policies and procedures, which were in effect in their current form as of December 31, 2016, 2015 and 2014 regarding related person transactions. For purposes of these policies and procedures:
· a “related person” means any of our directors, executive officers or nominees for director, and any of their immediate family members; and
· a “related person transaction” generally is a transaction in which we were or are to be a participant and the amount involved exceeds $120,000, and in which any related person had or will have a direct or indirect interest.
The related person, or the director, executive officer or nominee who is an immediate family member of a related person, must notify our Corporate Governance and Nominating Committee of certain information relating to proposed related person transactions. The Corporate Governance and Nominating Committee will consider all of the relevant facts and circumstances available regarding the proposed related person transaction and will ratify or approve only those related person transactions that are in, or are not inconsistent with, the best interests of our company and our shareholders.
In the 2016, 2015 and 2014 fiscal years, there were no proposed, pending or ongoing related person transactions subject to review by the Corporate Governance and Nominating Committee under the policy.
Board Independence
For the fiscal years ended December 31, 2016, 2015 and 2014 and as of the current date, our Board of Directors has determined that all of the members of the Board of Directors except for Vinit K. Asar, including each of the members of the Audit Committee, Compensation Committee, and Corporate Governance & Nominating Committee, were independent directors within the meaning of NYSE listing standards and rules even though the Company was no longer listed on the NYSE as of December 31, 2016. Further, for the fiscal year ended December 31, 2016, 2015 and 2014 and as of the current date, our Board of Directors had determined that each of the members of the Audit Committee qualified as “independent” under Rule 10A-3 of the Exchange Act, as amended, and that each of Messrs. Hare and Begley, and Ms. Feldmann qualified as an “audit committee financial expert” as defined in the U.S. Securities and Exchange Commission’s (“SEC”) rules. For a director to be deemed independent under NYSE rules, our Board of Directors must affirmatively determine that the director has no material relationship with our Company (either directly or as a partner, shareholder, or officer of an organization that has a relationship with our Company). In addition, the director (and any member of his or her immediate family) must meet the technical independence requirements of the NYSE’s listing standards.
ITEM 14. PRINCIPAL ACCOUNTANT FEES AND SERVICES
Audit and Non-Audit Fees
|
(in thousands) |
|
2016 |
|
2015 |
|
2014 |
| |||
|
|
|
|
|
|
|
|
| |||
|
Audit fees |
|
$ |
5,981 |
|
$ |
5,717 |
|
$ |
36,649 |
|
|
Audit-related fees |
|
— |
|
— |
|
— |
| |||
|
Tax fees |
|
— |
|
— |
|
— |
| |||
|
All other fees |
|
4 |
|
3 |
|
10 |
| |||
|
|
|
$ |
5,985 |
|
$ |
5,720 |
|
$ |
36,659 |
|
Audit Fees
The aggregate fees by PricewaterhouseCoopers LLP (“PwC”) for each of the 2016, 2015 and 2014 fiscal years for professional services rendered for audit services totaled $6.0 million in 2016, $5.7 million in 2015 and $36.7 million in 2014, including fees associated with the audit of our annual financial statements, the audit of our internal control over financial reporting and the review of financial statements included in our Quarterly Reports on Form 10-Q in 2014.
Audit-Related Fees
There were no aggregate fees billed by PwC for the 2016, 2015 and 2014 fiscal years for assurance and related services reasonably related to the performance of audit or review of our financial statements.
Tax Fees
In each of the 2016, 2015 and 2014 fiscal years, PwC was not engaged to supply any professional services for tax compliance, tax advice and tax planning.
All Other Fees
The aggregate fees billed by PwC in 2016, 2015 and 2014 for all other services were related to accounting research tools obtained by us.
The following describes the Audit Committee’s policies and procedures regarding pre-approval of the engagement of our independent auditor to perform audit as well as permissible non-audit services, all of which were in effect in their current form as of December 31, 2016, 2015 and 2014. For audit services, the independent auditor was to provide the Audit Committee with an engagement letter during the second calendar quarter of each year outlining the scope and cost of the audit services proposed to be performed in connection with the audit of the current fiscal year. If agreed to by the Audit Committee, the engagement letter will be formally accepted by the Audit Committee at an Audit Committee meeting held as practicably as possible following receipt of the engagement letter and fee estimate.
For non-audit services, our management may submit to the Audit Committee for approval the list of non-audit services that it recommends the Audit Committee allow us to engage the independent auditor to provide for the fiscal year. The list of services must be detailed as to the particular service and may not call for broad categorical approvals. Our management and the independent auditor will each confirm to the Audit Committee that each non-audit service on the list is permissible under all applicable legal requirements. In addition to the list of planned non-audit services, a budget estimating non-audit service spending for the fiscal year may be provided. The Audit Committee will consider for approval both the list of permissible non-audit services and the budget for such services. The Audit Committee will be informed routinely as to the non-audit services actually provided by the independent auditor pursuant to this pre-approval process.
To ensure prompt handling of unexpected matters, the Audit Committee delegates to its Chairperson the authority to approve the auditor’s engagement for non-audit services with fees that do not exceed 5% of total fees paid to the independent auditors during the fiscal year, and to amend or modify the list of approved permissible non-audit services and fees of up to 5% of
total fees paid to the independent auditors during the fiscal year. The Chairperson will report any action taken pursuant to this delegation to the Audit Committee at its next Audit Committee meeting.
All audit and non-audit services provided to us are required to be pre-approved by the Audit Committee. Our Chief Financial Officer will be responsible for tracking all independent auditor fees against the budget for such services and report at least annually to the Audit Committee.
All of the audit and non-audit services during the years ended December 31, 2016, 2015 and 2014 and the related professional engagement periods were pre-approved by the Audit Committee, with the exception of the following. In reliance on the de minimis exception from pre-approval, the Audit Committee approved certain non-audit services that were performed without pre-approval. These non-audit services were approved later in the audit engagement period and include: (i) our use of PwC’s automated disclosure checklist for 2014 and (ii) PwC’s performance of certain 2015 inventory count related procedures. The aggregate estimated fees paid by us to PwC for these services were $40,020. These fees comprised less than 1% of the total fees paid by us to PwC for 2014 services.
ITEM 15. EXHIBITS AND FINANCIAL STATEMENT SCHEDULES
(a) Financial Statements and Financial Statement Schedules:
(1) Financial Statements:
|
Hanger, Inc. |
|
|
|
|
F-2 | |
|
Consolidated Balance Sheets as of December 31, 2016 and 2015 |
|
F-4 |
|
|
F-5 | |
|
|
F-6 | |
|
Consolidated Statements of Cash Flows for the Three Years Ended December 31, 2016 |
|
F-7 |
|
|
F-8 |
(2) Exhibits:
See Part (b) of this Item 15.
(b) Exhibits: The following exhibits are filed herewith or incorporated herein by reference:
|
Exhibit |
|
Document |
|
3.1 |
|
Restated Certificate of Incorporation of Hanger, Inc., dated August 27, 2012. (Incorporated herein by reference to Exhibit 3.1 to the Current Report on Form 8-K filed by the Registrant on August 29, 2012.) |
|
3.2 |
|
Amended and Restated By-Laws of Hanger Orthopedic Group, Inc., as amended effective February 2, 2012. (Incorporated herein by reference to Exhibit 3.1 to the Current Report on Form 8-K filed by the Registrant on February 6, 2012.) |
|
3.3 |
|
Certificate of Designations, Preferences and Rights of Series A Junior Participating Preferred Stock of Hanger, Inc., effective February 28, 2016. (Incorporated herein by reference to Exhibit 3.1 to the Current Report on Form 8-K filed by the Registrant on March 2, 2016.) |
|
4.1 |
|
Indenture, dated November 2, 2010, by and among Hanger Orthopedic Group, Inc., each of the Subsidiary Guarantors party thereto and Wilmington Trust Company, as trustee. (Incorporated herein by reference to Exhibit 4.1 to the Registrant’s Current Report on Form 8-K filed on November 4, 2010.) |
|
4.2 |
|
First Supplemental Indenture, dated December 13, 2010, by and among Hanger Orthopedic Group, Inc., each of the Subsidiary Guarantors party thereto and Wilmington Trust Company, as trustee. (Incorporated herein by reference to Exhibit 4.3 to the Registrant’s Annual Report on Form 10-K for the year ended December 31, 2010.) |
|
4.3 |
|
Second Supplemental Indenture, dated February 15, 2011, by and among Hanger Orthopedic Group, Inc., and Wilmington Trust Company, as trustee. (Incorporated herein by reference to Exhibit 4.2 to the Registrant’s Quarterly Report on Form 10-Q for the quarter ended March 31, 2011.) |
|
4.4 |
|
Third Supplemental Indenture, dated June 27, 2013, by and among Hanger, Inc., each of the Guaranteeing Subsidiaries party thereto and Wilmington Trust Company, as trustee. (Incorporated herein by reference to Exhibit 4.2 to the Registrant’s Quarterly Report on Form 10-Q for the quarter ended June 30, 2013.) |
|
4.5 |
|
Fourth Supplemental Indenture, dated July 9, 2015, by and among Hanger, Inc., each of the Subsidiary Guarantors party thereto and Wilmington Trust Company, as trustee. (Incorporated herein by reference to Exhibit 10.1 to the Registrant’s Current Report on Form 8-K filed on July 9, 2015.) |
|
4.6 |
|
Fifth Supplemental Indenture, dated December 11, 2015, by and among Hanger, Inc., each of the Subsidiary Guarantors party thereto and Wilmington Trust Company, as trustee. (Incorporated herein by reference to Exhibit 10.1 to the Registrant’s Current Report on Form 8-K filed on December 15, 2015.) |
|
4.7 |
|
Credit Agreement, dated June 17, 2013, among Hanger, Inc. and the lenders and agents party thereto. (Incorporated herein by reference to Exhibit 4.1 to the Current Report on Form 8-K filed by the Registrant on June 19, 2013.) |
|
4.8 |
|
Waiver No. 1 to the Credit Agreement, dated December 12, 2014, among Hanger, Inc. and the lenders and agents party thereto. (Incorporated herein by reference to Exhibit 4.8 to the Annual Report on Form 10-K for the year ended December 31, 2014.) |
|
4.9 |
|
Waiver No. 2 to the Credit Agreement, dated January 14, 2015, among Hanger, Inc. and the lenders and agents party thereto. (Incorporated herein by reference to Exhibit 4.9 to the Annual Report on Form 10-K for the year ended December 31, 2014.) |
|
4.10 |
|
Waiver No. 3 to the Credit Agreement, dated March 17, 2015, among Hanger, Inc. and the lenders and agents party thereto. (Incorporated herein by reference to Exhibit 10.1 to the Current Report on Form 8-K filed by the Registrant on March 23, 2015.) |
|
4.11 |
|
First Amendment and Waiver, dated June 19, 2015, by and among Hanger, Inc., the guarantors party thereto and the lenders and agents party thereto (Incorporated herein by reference to Exhibit 10.1 to the Current Report on Form 8-K filed by the Registrant on June 22, 2015.) |
|
4.12 |
|
Second Amendment and Waiver, dated September 11, 2015, by and among Hanger, Inc., the guarantors party thereto and the lenders and agents party thereto (Incorporated herein by reference to Exhibit 10.1 to the Current Report on Form 8-K filed by the Registrant on September 14, 2015.) |
|
4.13 |
|
Third Amendment and Waiver, dated November 13, 2015, by and among Hanger, Inc., the guarantors party thereto and the lenders and agents party thereto (Incorporated herein by reference to Exhibit 10.1 to the Current Report on Form 8-K filed by the Registrant on November 13, 2015.) |
|
4.14 |
|
Fourth Amendment and Waiver, dated February 10, 2016, by and among Hanger, Inc., the guarantors party thereto and the lenders and agents party thereto (Incorporated herein by reference to Exhibit 10.1 to the Current Report on Form 8-K filed by the Registrant on February 10, 2016.) |
|
4.15 |
|
Fifth Amendment and Waiver, dated July 15, 2016, by and among Hanger, Inc., the guarantors party thereto and the lenders and agents party thereto (Incorporated herein by reference to Exhibit 10.2 to the Current Report on Form 8-K filed by the Registrant on August 2, 2016.) |
|
4.16 |
|
Sixth Amendment and Waiver, dated June 22, 2017, by and among Hanger, Inc., the guarantors party thereto and the lenders and agents party thereto (Incorporated herein by reference to Exhibit 10.2 to the Current Report on Form 8-K filed by the Registrant on June 23, 2017.) |
|
4.17 |
|
Rights Agreement, dated February 28, 2016, by and among Hanger, Inc. and Computershare, Inc. as rights agent. (Incorporated herein by reference to Exhibit 4.1 to the Current Report on Form 8-K filed by the Registrant on March 2, 2016.) |
|
4.18 |
|
Amendment No. 1 to Rights Agreement, dated June 23, 2017, by and among Hanger, Inc. and Computershare, Inc. as rights agent. (Incorporated herein by reference to Exhibit 4.1 to the Current Report on Form 8-K filed by the Registrant on June 23, 2017.) |
|
4.19 |
|
Credit Agreement, dated August 1, 2016, by and among Hanger, Inc. and the lenders and agents party thereto. (Incorporated herein by reference to Exhibit 10.1 to the Current Report on Form 8-K filed by the Registrant on August 2, 2016.) |
|
4.20 |
|
Amendment No. 1 to Credit Agreement, dated June 2, 2017, by and among Hanger, Inc. and the lenders and agents party thereto. (Incorporated herein by reference to Exhibit 10.1 to the Current Report on Form 8-K filed by the Registrant on June 23, 2017.) |
|
10.1 |
|
Amended and Restated 2002 Stock Incentive Plan, as amended through May 10, 2007. (Incorporated herein by reference to Appendix 1 to the Registrant’s Proxy Statement, dated April 10, 2007, relating to the Registrant’s Annual Meeting of Stockholders held on May 10, 2007.)* |
|
10.2 |
|
Amended and Restated 2003 Non-Employee Directors’ Stock Incentive Plan, as amended through May 10, 2007. (Incorporated herein by reference to Appendix 2 to the Registrant’s Proxy Statement, dated April 10, 2007, relating to the Registrant’s Annual Meeting of Stockholders held on May 10, 2007.) |
|
10.3 |
|
Form of Stock Option Agreement (Non-Executive Employees), Stock Option Agreement (Executive Employees), Restricted Stock Agreement (Non-Executive Employees) and Restricted Stock Agreement (Executive Employees). (Incorporated herein by reference to Exhibits 10.1, 10.2, 10.3 and 10.4, respectively, to the Registrant’s Current Report on Form 8-K filed on February 24, 2005.)* |
|
10.4 |
|
Supplemental Executive Retirement Plan, as amended and restated effective January 1, 2011 (Incorporated herein by reference to Exhibit 10.4 to the Registrant’s Annual Report on Form 10-K for the year ended December 31, 2010.)* |
|
10.5 |
|
Fourth Amended and Restated Employment Agreement, effective as of January 1, 2012, by and between George E. McHenry and Hanger, Inc.. (Incorporated herein by reference to Exhibit 10.3 to the Registrant’s Current Report on Form 8-K filed on January 27, 2012.)* |
|
10.6 |
|
Letter Agreement, dated April 7, 2014, by and between George E. McHenry, Hanger Prosthetics & Orthotics, Inc. and Hanger, Inc. (Incorporated herein by reference to Exhibit 10.1 to the Current Report on Form 8-K filed by the Registrant on April 7, 2014.) |
|
10.7 |
|
Fourth Amended and Restated Employment Agreement, effective as of January 1, 2012, by and between Richmond L. Taylor and Hanger, Inc.. (Incorporated herein by reference to Exhibit 10.4 to the Registrant’s Current Report on Form 8-K filed on January 27, 2012.)* |
|
10.8 |
|
Hanger Orthopedic Group, Inc. 2010 Omnibus Incentive Plan. (Incorporated herein by reference to Annex A to Registrant’s Proxy Statement, dated April 2, 2010, relating to the Registrant’s Annual Meeting of Stockholders held on May 13, 2010)* |
|
10.9 |
|
Form of Restricted Stock Agreement for Non-Employee Directors. (Incorporated herein by reference to Exhibit 10.2 to the Registrant’s Quarterly Report on Form 10-Q for the quarter ended June 30, 2010.)* |
|
10.10 |
|
Form of Restricted Stock Agreement for Executives. (Incorporated herein by reference to Exhibit 10.3 to the Registrant’s Quarterly Report on Form 10-Q for the quarter ended June 30, 2010.)* |
|
10.11 |
|
Form of Restricted Stock Agreement for Employees Executives. (Incorporated herein by reference to Exhibit 10.4 to the Registrant’s Quarterly Report on Form 10-Q for the quarter ended June 30, 2010.)* |
|
10.12 |
|
Form of Non-Employee Director Non-Qualified Stock Option Agreement. (Incorporated herein by reference to Exhibit 10.5 to the Registrant’s Quarterly Report on Form 10-Q for the quarter ended June 30, 2010.)* |
|
10.13 |
|
Form of Executive Non-Qualified Stock Option Agreement. (Incorporated herein by reference to Exhibit 10.6 to the Registrant’s Quarterly Report on Form 10-Q for the quarter ended June 30, 2010.)* |
|
10.14 |
|
Form of Non-Qualified Stock Option Agreement. (Incorporated herein by reference to Exhibit 10.7 to the Registrant’s Quarterly Report on Form 10-Q for the quarter ended June 30, 2010.)* |
|
10.15 |
|
Amended and Restated Employment Agreement, dated as of March 30, 2012, between Thomas E. Hartman and Hanger Prosthetics & Orthotics, Inc. (Incorporated herein by reference to Exhibit 10.22 to the Registrant’s Annual Report on Form 10-K for the year ended December 31, 2012.)* |
|
10.16 |
|
Second Amended and Restated Employment Agreement, dated August 27, 2012, by and between Vinit K. Asar and Hanger, Inc. (Incorporated herein by reference to Exhibit 10.1 to the Current Report on Form 8-K filed by the Registrant on August 29, 2012.)* |
|
10.17 |
|
Amended and Restated Employment Agreement, dated as of February 25, 2013, by and between Kenneth W. Wilson and Southern Prosthetic Supply, Inc. (Incorporated herein by reference to Exhibit 10.24 to the Registrant’s Annual Report on Form 10-K for the year ended December 31, 2012.)* |
|
10.18 |
|
Defined Contribution Supplemental Retirement Plan, dated May 1, 2013. (Incorporated herein by reference to Exhibit 10.1 to the Current Report on Form 8-K filed by the Registration on May 13, 2013.) |
|
10.19 |
|
Employment and Non-Compete Agreement, dated August 25, 2014, by and between Melissa Debes and Hanger Prosthetics & Orthotics, Inc. (Incorporated herein by reference to Exhibit 10.1 to the Current Report on Form 8-K filed by the Registrant on September 3, 2014.) |
|
10.20 |
|
Employment Agreement, dated September 1, 2014, by and between Samuel M. Liang and Hanger Prosthetics & Orthotics, Inc. (Incorporated herein by reference to Exhibit 10.1 to the Current Report on Form 8-K filed by the Registrant on September 2, 2014.) |
|
10.21 |
|
Employment Agreement, dated September 5, 2014, by and between Thomas E. Kiraly and Hanger Prosthetics & Orthotics, Inc. (Incorporated herein by reference to Exhibit 10.1 to the Current Report on Form 8-K filed by the Registrant on January 5, 2015.) |
|
10.22 |
|
Assignment of Employment Agreement, effective March 1, 2017, by and among Hanger Prosthetics & Orthotics, Inc., Hanger, Inc. and Vinit K. Asar. (Incorporated herein by reference to Exhibit 10.22 to the Annual Report on Form 10-K for the year ended December 31, 2014.)* |
|
10.23 |
|
Assignment of Employment Agreement, effective March 1, 2017, by and among Hanger Prosthetics & Orthotics, Inc., Hanger, Inc. and Thomas E. Kiraly. (Incorporated herein by reference to Exhibit 10.23 to the Annual Report on Form 10-K for the year ended December 31, 2014.)* |
|
10.24 |
|
Hanger, Inc. 2016 Omnibus Incentive Plan. (Incorporated herein by reference to Exhibit 10.1 to the Registrant’s Current Report on Form 8-K filed by the Registrant on April 18, 2016.)* |
|
10.25 |
|
Form of Executive Non-Qualified Stock Option Agreement under the 2016 Omnibus Incentive Plan. (Incorporated herein by reference to Exhibit 10.2 to the Registrant’s Current Report on Form 8-K filed by the Registrant on April 18, 2016.)* |
|
10.26 |
|
Form of Non-Qualified Stock Option Agreement under the 2016 Omnibus Incentive Plan. (Incorporated herein by reference to Exhibit 10.3 to the Registrant’s Current Report on Form 8-K filed by the Registrant on April 18, 2016.)* |
|
10.27 |
|
Form of Non-Employee Director Non-Qualified Stock Option Agreement under the 2016 Omnibus Incentive Plan. (Incorporated herein by reference to Exhibit 10.4 to the Registrant’s Current Report on Form 8-K filed by the Registrant on April 18, 2016.)* |
|
10.28 |
|
Form of Restricted Stock Unit Agreement for Executives under the 2016 Omnibus Incentive Plan. (Incorporated herein by reference to Exhibit 10.5 to the Registrant’s Current Report on Form 8-K filed by the Registrant on April 18, 2016.)* |
|
10.29 |
|
Form of Restricted Stock Unit Agreement for Employees under the 2016 Omnibus Incentive Plan. (Incorporated herein by reference to Exhibit 10.6 to the Registrant’s Current Report on Form 8-K filed by the Registrant on April 18, 2016.)* |
|
10.30 |
|
Form of Restricted Stock Unit Agreement for Non-Employee Directors under the 2016 Omnibus Incentive Plan. (Incorporated herein by reference to Exhibit 10.7 to the Registrant’s Current Report on Form 8-K filed by the Registrant on April 18, 2016.)* |
|
10.31 |
|
Hanger, Inc. 2017 Special Equity Plan. (Incorporated herein by reference to Exhibit 10.1 to the Registrant’s Current Report on Form 8-K filed by the Registrant on May 23, 2017.)* |
|
10.32 |
|
Form of Non-Qualified Stock Option Agreement for Executives under the 2017 Special Equity Plan. (Incorporated herein by reference to Exhibit 10.2 to the Registrant’s Current Report on Form 8-K filed by the Registrant on May 23, 2017.)* |
|
10.33 |
|
Form of Non-Qualified Stock Option Agreement for Employees under the 2017 Special Equity Plan. (Incorporated herein by reference to Exhibit 10.3 to the Registrant’s Current Report on Form 8-K filed by the Registrant on May 23, 2017.)* |
|
10.34 |
|
Form of Performance Share Unit Agreement for Executives under the 2017 Special Equity Plan. (Incorporated herein by reference to Exhibit 10.4 to the Registrant’s Current Report on Form 8-K filed by the Registrant on May 23, 2017.)* |
|
10.35 |
|
Form of Performance Share Unit Agreement for Employees under the 2017 Special Equity Plan. (Incorporated herein by reference to Exhibit 10.5 to the Registrant’s Current Report on Form 8-K filed by the Registrant on May 23, 2017.)* |
|
21 |
|
List of Subsidiaries of the Registrant. (Filed herewith.) |
|
31.1 |
|
Written Statement of the Chief Executive Officer Pursuant to Section 302 of the Sarbanes Oxley Act of 2002. (Filed herewith.) |
|
31.2 |
|
Written Statement of the Chief Financial Officer Pursuant to Section 302 of the Sarbanes Oxley Act of 2002. (Filed herewith.) |
|
32 |
|
Written Statement of the Chief Executive Officer and Chief Financial Officer Pursuant to 18 U.S.C. Section 1350, as adopted Pursuant to Section 906 of the Sarbanes Oxley Act of 2002. (Filed herewith.) |
|
101.INS |
|
XBRL Instance Document. (Filed herewith.) |
|
101.SCH |
|
XBRL Taxonomy Extension Schema. (Filed herewith.) |
|
101.CAL |
|
XBRL Taxonomy Extension Calculation Linkbase. (Filed herewith.) |
|
101.LAB |
|
XBRL Taxonomy Extension Label Linkbase. (Filed herewith.) |
|
101.PRE |
|
XBRL Taxonomy Extension Presentation Linkbase. (Filed herewith.) |
|
101.DEF |
|
XBRL Taxonomy Extension Definition Linkbase. (Filed herewith.) |
* Management contract or compensatory plan
Pursuant to the requirements of Section 13 or 15(d) of the Securities Exchange Act of 1934, the Registrant has duly caused this report to be signed on its behalf by the undersigned, thereunto duly authorized.
|
|
HANGER, INC. | |
|
|
| |
|
Dated: January 19, 2018 |
By: |
/s/ VINIT K. ASAR |
|
|
|
Vinit K. Asar |
|
|
|
Chief Executive Officer |
Pursuant to the requirements of the Securities Exchange Act of 1934, this report has been signed below by the following persons on behalf of the Registrant and in the capacities and on the dates indicated.
|
Dated: January 19, 2018 |
|
/s/ VINIT K. ASAR |
|
|
|
Vinit K. Asar |
|
|
|
|
|
Dated: January 19, 2018 |
|
/s/ THOMAS E. KIRALY |
|
|
|
Thomas E. Kiraly |
|
|
|
|
|
Dated: January 19, 2018 |
|
/s/ GABRIELLE B. ADAMS |
|
|
|
Gabrielle B. Adams |
|
|
|
|
|
Dated: January 19, 2018 |
|
/s/ ASIF AHMAD |
|
|
|
Asif Ahmad |
|
|
|
|
|
Dated: January 19, 2018 |
|
/s/ CHRISTOPHER B. BEGLEY |
|
|
|
Christopher B. Begley |
|
|
|
|
|
Dated: January 19, 2018 |
|
/s/ JOHN T. FOX |
|
|
|
John T. Fox |
|
|
|
|
|
Dated: January 19, 2018 |
|
/s/ THOMAS C. FREYMAN |
|
|
|
Thomas C. Freyman |
|
|
|
|
|
Dated: January 19, 2018 |
|
/s/ STEPHEN E. HARE |
|
|
|
Stephen E. Hare |
|
|
|
|
|
Dated: January 19, 2018 |
|
/s/ CYNTHIA L. LUCCHESE |
|
|
|
Cynthia L. Lucchese |
|
|
|
Director |
|
|
|
|
|
Dated: January 19, 2018 |
|
/s/ RICHARD R. PETTINGILL |
|
|
|
Richard R. Pettingill |
|
|
|
|
|
Dated: January 19, 2018 |
|
/s/ KATHRYN M. SULLIVAN |
|
|
|
Kathryn M. Sullivan |
|
Hanger, Inc. |
|
|
F-2 | |
|
Consolidated Balance Sheets as of December 31, 2016 and 2015 |
F-4 |
|
F-5 | |
|
F-6 | |
|
Consolidated Statements of Cash Flows for the Three Years Ended December 31, 2016 |
F-7 |
|
F-8 |
Report of Independent Registered Public Accounting Firm
To the Board of Directors and Shareholders of Hanger, Inc.
In our opinion, the accompanying consolidated balance sheets and the related consolidated statements of operations and comprehensive (loss) income, of changes in shareholders’ equity and of cash flows present fairly, in all material respects, the financial position of Hanger, Inc. and its subsidiaries as of December 31, 2016 and 2015, and the results of their operations and their cash flows for each of the three years in the period ended December 31, 2016 in conformity with accounting principles generally accepted in the United States of America.
Also in our opinion, the Company did not maintain, in all material respects, effective internal control over financial reporting as of December 31, 2016, based on criteria established in Internal Control - Integrated Framework (2013) issued by the Committee of Sponsoring Organizations of the Treadway Commission (COSO) because material weaknesses in internal control over financial reporting existed as of that date. The material weaknesses related to (1) an ineffective control environment due to ineffective controls with respect to establishing and assigning authority and responsibility over accounting operations; (2) risk assessment as the Company did not design and maintain effective internal controls to identify, assess and address risks that significantly impact the financial statements; (3) information and communication as the Company did not design and maintain effective controls to obtain, generate and communicate relevant and accurate information necessary for the function of internal control, including not implementing or maintaining sufficient information systems; (4) monitoring as the Company did not design and maintain effective controls to monitor compliance with established accounting policies, procedures and controls. The material weaknesses in control environment, risk assessment, information and communication and monitoring contributed to additional material weaknesses as the Company did not design and maintain effective controls over (5) the preparation, review and approval of account reconciliations; (6) the preparation, review and approval of journal entries; (7) certain information technology systems that are relevant to the preparation of the consolidated financial statements; and (8) the accounting for (a) inventory, (b) leases, (c) revenue, (d) accounts receivable, and related accounts, (e) property, plant and equipment, including capitalized software and depreciation expense, (f) accounts payable and related accruals, (g) business combinations, goodwill and intangible assets, (h) share-based compensation and (i) income taxes.
Also in our opinion, the Company did not maintain, in all material respects, effective internal control over financial reporting as of December 31, 2015, based on criteria established in Internal Control - Integrated Framework (2013) issued by the Committee of Sponsoring Organizations of the Treadway Commission (COSO) because material weaknesses in internal control over financial reporting existed as of that date. The material weaknesses related to (1) an ineffective control environment due to (a) an inappropriate tone at the top, which permitted a culture that did not appropriately emphasize compliance with the Company’s accounting policies and procedures; (b) an insufficient complement of personnel with an appropriate degree of knowledge, experience, and training, commensurate with the Company’s accounting and reporting requirements and (c) ineffective controls with respect to establishing and assigning authority and responsibility over accounting operations; (2) risk assessment as the Company did not design and maintain effective internal controls to identify, assess and address risks that significantly impact the financial statements; (3) information and communication as the Company did not design and maintain effective controls to obtain, generate and communicate relevant and accurate information necessary for the function of internal control, including not implementing or maintaining sufficient information systems; (4) monitoring as the Company did not design and maintain effective controls to monitor compliance with established accounting policies, procedures and controls. The material weaknesses in control environment, risk assessment, information and communication and monitoring contributed to additional material weaknesses as the Company did not design and maintain effective controls over (5) the preparation, review and approval of account reconciliations; (6) the preparation, review and approval of journal entries; (7) certain information technology systems that are relevant to the preparation of the consolidated financial statements; and (8) the accounting for (a) inventory, (b) leases, (c) revenue, (d) accounts receivable, and related accounts, (e) property, plant and equipment, including capitalized software and depreciation expense, (f) accounts payable and related accruals, (g) business combinations, goodwill and intangible assets, (h) share-based compensation and (i) income taxes.
A material weakness is a deficiency, or a combination of deficiencies, in internal control over financial reporting, such that there is a reasonable possibility that a material misstatement of the annual or interim financial statements will not be prevented or detected on a timely basis. The material weaknesses referred to above are described in Management’s Report
on Internal Control over Financial Reporting appearing under Item 9A. We considered these material weaknesses in determining the nature, timing, and extent of audit tests applied in our audits of the 2016 and 2015 consolidated financial statements, and our opinions regarding the effectiveness of the Company’s internal control over financial reporting does not affect our opinions on those consolidated financial statements.
The Company’s management is responsible for these financial statements, for maintaining effective internal control over financial reporting and for its assessment of the effectiveness of internal control over financial reporting included in management’s report referred to above. Our responsibility is to express opinions on these financial statements and on the Company’s internal control over financial reporting based on our integrated audits. We conducted our audits in accordance with the standards of the Public Company Accounting Oversight Board (United States). Those standards require that we plan and perform the audits to obtain reasonable assurance about whether the financial statements are free of material misstatement and whether effective internal control over financial reporting was maintained in all material respects. Our audits of the financial statements included examining, on a test basis, evidence supporting the amounts and disclosures in the financial statements, assessing the accounting principles used and significant estimates made by management, and evaluating the overall financial statement presentation. Our audits of internal control over financial reporting included obtaining an understanding of internal control over financial reporting, assessing the risk that a material weakness exists, and testing and evaluating the design and operating effectiveness of internal control based on the assessed risk. Our audits also included performing such other procedures as we considered necessary in the circumstances. We believe that our audits provide a reasonable basis for our opinions.
As discussed in Note N to the consolidated financial statements, the Company’s Credit Agreement matures on June 17, 2018. Additionally, the Company is required to provide the lenders under the Credit Agreement with audited financial statements for the year ended December 31, 2017 by March 31, 2018. Management’s evaluation of the events and conditions and management’s plans to mitigate these matters are also described in Note N.
A company’s internal control over financial reporting is a process designed to provide reasonable assurance regarding the reliability of financial reporting and the preparation of financial statements for external purposes in accordance with generally accepted accounting principles. A company’s internal control over financial reporting includes those policies and procedures that (i) pertain to the maintenance of records that, in reasonable detail, accurately and fairly reflect the transactions and dispositions of the assets of the company; (ii) provide reasonable assurance that transactions are recorded as necessary to permit preparation of financial statements in accordance with generally accepted accounting principles, and that receipts and expenditures of the company are being made only in accordance with authorizations of management and directors of the company; and (iii) provide reasonable assurance regarding prevention or timely detection of unauthorized acquisition, use, or disposition of the company’s assets that could have a material effect on the financial statements.
Because of its inherent limitations, internal control over financial reporting may not prevent or detect misstatements. Also, projections of any evaluation of effectiveness to future periods are subject to the risk that controls may become inadequate because of changes in conditions, or that the degree of compliance with the policies or procedures may deteriorate.
/s/ PricewaterhouseCoopers LLP
Austin, Texas
January 19, 2018
HANGER, INC.
(dollars in thousands, except par value and share amounts)
|
|
|
As of December 31, |
| ||||
|
|
|
2016 |
|
2015 |
| ||
|
ASSETS |
|
|
|
|
| ||
|
Current assets: |
|
|
|
|
| ||
|
Cash and cash equivalents |
|
$ |
7,157 |
|
$ |
58,753 |
|
|
Net accounts receivable, less allowance for doubtful accounts of $15,521 and $15,027 in 2016 and 2015, respectively |
|
144,562 |
|
174,592 |
| ||
|
Inventories |
|
68,225 |
|
68,478 |
| ||
|
Income taxes receivable |
|
13,200 |
|
34,735 |
| ||
|
Other current assets |
|
19,137 |
|
21,070 |
| ||
|
Total current assets |
|
252,281 |
|
357,628 |
| ||
|
|
|
|
|
|
| ||
|
Non-current assets: |
|
|
|
|
| ||
|
Property, plant and equipment, net |
|
100,467 |
|
113,274 |
| ||
|
Goodwill |
|
249,678 |
|
335,642 |
| ||
|
Other intangible assets, net |
|
32,941 |
|
47,128 |
| ||
|
Deferred income taxes |
|
94,223 |
|
98,254 |
| ||
|
Other assets |
|
25,514 |
|
21,158 |
| ||
|
Total assets |
|
$ |
755,104 |
|
$ |
973,084 |
|
|
|
|
|
|
|
| ||
|
LIABILITIES AND SHAREHOLDERS’ EQUITY |
|
|
|
|
| ||
|
Current liabilities: |
|
|
|
|
| ||
|
Current portion of long-term debt |
|
$ |
30,944 |
|
$ |
30,385 |
|
|
Accounts payable |
|
50,549 |
|
56,099 |
| ||
|
Accrued expenses and other current liabilities |
|
78,950 |
|
79,860 |
| ||
|
Accrued interest payable |
|
662 |
|
3,292 |
| ||
|
Accrued compensation related costs |
|
36,162 |
|
48,168 |
| ||
|
Total current liabilities |
|
197,267 |
|
217,804 |
| ||
|
|
|
|
|
|
| ||
|
Long-term liabilities: |
|
|
|
|
| ||
|
Long-term debt, less current portion |
|
441,706 |
|
536,048 |
| ||
|
Other liabilities |
|
50,717 |
|
53,986 |
| ||
|
Total liabilities |
|
689,690 |
|
807,838 |
| ||
|
Commitments and contingent liabilities (Note Q) |
|
|
|
|
| ||
|
Shareholders’ Equity: |
|
|
|
|
| ||
|
Common stock, $.01 par value; 60,000,000 shares authorized; 36,183,894 shares issued and 36,041,073 shares outstanding in 2016, and 35,854,106 shares issued and 35,711,285 shares outstanding in 2015 |
|
362 |
|
359 |
| ||
|
Additional paid-in capital |
|
322,191 |
|
315,529 |
| ||
|
Accumulated other comprehensive loss |
|
(1,440 |
) |
(1,414 |
) | ||
|
Retained deficit |
|
(255,003 |
) |
(148,532 |
) | ||
|
Treasury stock, at cost; 142,821 shares at 2016 and 2015, respectively |
|
(696 |
) |
(696 |
) | ||
|
Total shareholders’ equity |
|
65,414 |
|
165,246 |
| ||
|
Total liabilities and shareholders’ equity |
|
$ |
755,104 |
|
$ |
973,084 |
|
The accompanying notes are an integral part of the consolidated financial statements.
HANGER, INC.
CONSOLIDATED STATEMENTS OF OPERATIONS
AND COMPREHENSIVE (LOSS) INCOME
(dollars in thousands, except share and per share amounts)
|
|
|
For the Years Ended December 31, |
| |||||||
|
|
|
2016 |
|
2015 |
|
2014 |
| |||
|
Net revenue |
|
$ |
1,042,054 |
|
$ |
1,067,172 |
|
$ |
1,012,100 |
|
|
Material costs |
|
332,071 |
|
336,283 |
|
324,284 |
| |||
|
Personnel costs |
|
363,537 |
|
367,094 |
|
353,586 |
| |||
|
Other operating costs |
|
139,024 |
|
140,839 |
|
136,885 |
| |||
|
General and administrative expenses |
|
107,224 |
|
111,761 |
|
86,115 |
| |||
|
Professional accounting and legal fees |
|
41,233 |
|
28,647 |
|
44,798 |
| |||
|
Depreciation and amortization |
|
44,887 |
|
46,343 |
|
38,929 |
| |||
|
Impairment of intangible assets |
|
86,164 |
|
385,807 |
|
223 |
| |||
|
(Loss) income from operations |
|
(72,086 |
) |
(349,602 |
) |
27,280 |
| |||
|
Interest expense, net |
|
45,199 |
|
29,892 |
|
28,277 |
| |||
|
Loss on extinguishment of debt |
|
6,031 |
|
7,237 |
|
— |
| |||
|
Loss from continuing operations before income taxes |
|
(123,316 |
) |
(386,731 |
) |
(997 |
) | |||
|
(Benefit) provision for income taxes |
|
(15,910 |
) |
(67,614 |
) |
2,023 |
| |||
|
Loss from continuing operations |
|
(107,406 |
) |
(319,117 |
) |
(3,020 |
) | |||
|
Income (loss) from discontinued operations, net of income taxes |
|
935 |
|
(7,974 |
) |
(15,946 |
) | |||
|
Net loss |
|
$ |
(106,471 |
) |
$ |
(327,091 |
) |
$ |
(18,966 |
) |
|
|
|
|
|
|
|
|
| |||
|
Other comprehensive (loss) income: |
|
|
|
|
|
|
| |||
|
Unrealized (loss) gain on SERP, net of income tax (benefit) provision of $(16), $81 and $(525) for 2016, 2015 and 2014, respectively |
|
$ |
(26 |
) |
$ |
474 |
|
$ |
(868 |
) |
|
Comprehensive loss |
|
$ |
(106,497 |
) |
$ |
(326,617 |
) |
$ |
(19,834 |
) |
|
|
|
|
|
|
|
|
| |||
|
Basic and Diluted Per Common Share Data: |
|
|
|
|
|
|
| |||
|
Loss from continuing operations |
|
$ |
(2.99 |
) |
$ |
(8.96 |
) |
$ |
(0.09 |
) |
|
Income (loss) from discontinued operations, net of income taxes |
|
0.03 |
|
(0.22 |
) |
(0.45 |
) | |||
|
Basic and diluted loss per share |
|
$ |
(2.96 |
) |
$ |
(9.18 |
) |
$ |
(0.54 |
) |
|
Shares used to compute basic and diluted per common share amounts |
|
35,933,222 |
|
35,635,448 |
|
35,309,478 |
| |||
The accompanying notes are an integral part of the consolidated financial statements.
HANGER, INC.
CONSOLIDATED STATEMENTS OF CHANGES IN SHAREHOLDERS’ EQUITY
For the Three Years Ended December 31, 2016
(dollars and share amounts in thousands)
|
|
|
Common |
|
Common |
|
Additional |
|
Accumulated |
|
Retained |
|
Treasury |
|
Total |
| ||||||
|
Balance, December 31, 2013 |
|
35,017 |
|
$ |
351 |
|
$ |
295,113 |
|
$ |
(1,020 |
) |
$ |
197,525 |
|
$ |
(656 |
) |
$ |
491,313 |
|
|
Net loss |
|
— |
|
— |
|
— |
|
— |
|
(18,966 |
) |
— |
|
(18,966 |
) | ||||||
|
Issuance of common stock upon vesting of restricted stock units |
|
377 |
|
4 |
|
(4 |
) |
— |
|
— |
|
— |
|
— |
| ||||||
|
Issuance of common stock in connection with the exercise of stock options |
|
5 |
|
— |
|
87 |
|
— |
|
— |
|
— |
|
87 |
| ||||||
|
Stock-based compensation expense |
|
— |
|
— |
|
9,773 |
|
— |
|
— |
|
— |
|
9,773 |
| ||||||
|
Tax benefit associated with vesting of restricted stock units |
|
— |
|
— |
|
2,197 |
|
— |
|
— |
|
— |
|
2,197 |
| ||||||
|
Tax benefit on unrealized loss on SERP |
|
— |
|
— |
|
— |
|
525 |
|
— |
|
— |
|
525 |
| ||||||
|
Total other comprehensive loss |
|
— |
|
— |
|
— |
|
(1,393 |
) |
— |
|
— |
|
(1,393 |
) | ||||||
|
Balance, December 31, 2014 |
|
35,399 |
|
355 |
|
307,166 |
|
(1,888 |
) |
178,559 |
|
(656 |
) |
483,536 |
| ||||||
|
Net loss |
|
— |
|
— |
|
— |
|
— |
|
(327,091 |
) |
— |
|
(327,091 |
) | ||||||
|
Issuance of common stock upon vesting of restricted stock units |
|
306 |
|
3 |
|
(3 |
) |
— |
|
— |
|
— |
|
— |
| ||||||
|
Issuance of common stock in connection with the exercise of stock options |
|
8 |
|
1 |
|
— |
|
— |
|
— |
|
— |
|
1 |
| ||||||
|
Purchase of treasury stock |
|
(2 |
) |
— |
|
40 |
|
— |
|
— |
|
(40 |
) |
— |
| ||||||
|
Stock-based compensation expense |
|
— |
|
— |
|
11,134 |
|
— |
|
— |
|
— |
|
11,134 |
| ||||||
|
Tax expense associated with vesting of restricted stock units |
|
— |
|
— |
|
(596 |
) |
— |
|
— |
|
— |
|
(596 |
) | ||||||
|
Effect of shares withheld to cover taxes |
|
— |
|
— |
|
(2,212 |
) |
— |
|
— |
|
— |
|
(2,212 |
) | ||||||
|
Tax benefit on unrealized gain on SERP |
|
— |
|
— |
|
— |
|
(81 |
) |
— |
|
— |
|
(81 |
) | ||||||
|
Total other comprehensive income |
|
— |
|
— |
|
— |
|
555 |
|
— |
|
— |
|
555 |
| ||||||
|
Balance, December 31, 2015 |
|
35,711 |
|
359 |
|
315,529 |
|
(1,414 |
) |
(148,532 |
) |
(696 |
) |
165,246 |
| ||||||
|
Net loss |
|
— |
|
— |
|
— |
|
— |
|
(106,471 |
) |
— |
|
(106,471 |
) | ||||||
|
Issuance of common stock upon vesting of restricted stock units |
|
330 |
|
3 |
|
(3 |
) |
— |
|
— |
|
— |
|
— |
| ||||||
|
Stock-based compensation expense |
|
— |
|
— |
|
9,763 |
|
— |
|
— |
|
— |
|
9,763 |
| ||||||
|
Tax expense associated with vesting of restricted stock units |
|
— |
|
— |
|
(2,810 |
) |
— |
|
— |
|
— |
|
(2,810 |
) | ||||||
|
Effect of shares withheld to cover taxes |
|
— |
|
— |
|
(288 |
) |
— |
|
— |
|
— |
|
(288 |
) | ||||||
|
Tax benefit on unrealized loss on SERP |
|
— |
|
— |
|
— |
|
16 |
|
— |
|
— |
|
16 |
| ||||||
|
Total other comprehensive loss |
|
— |
|
— |
|
— |
|
(42 |
) |
— |
|
— |
|
(42 |
) | ||||||
|
Balance, December 31, 2016 |
|
36,041 |
|
$ |
362 |
|
$ |
322,191 |
|
$ |
(1,440 |
) |
$ |
(255,003 |
) |
$ |
(696 |
) |
$ |
65,414 |
|
The accompanying notes are an integral part of the consolidated financial statements.
HANGER, INC.
CONSOLIDATED STATEMENTS OF CASH FLOWS
(dollars in thousands)
|
|
|
For the Years Ended December 31, |
| |||||||
|
|
|
2016 |
|
2015 |
|
2014 |
| |||
|
|
|
|
|
|
|
|
| |||
|
Cash flows from operating activities: |
|
|
|
|
|
|
| |||
|
Net loss |
|
$ |
(106,471 |
) |
$ |
(327,091 |
) |
$ |
(18,966 |
) |
|
Income (loss) from discontinued operations, net of income taxes |
|
935 |
|
(7,974 |
) |
(15,946 |
) | |||
|
Loss from continuing operations |
|
(107,406 |
) |
(319,117 |
) |
(3,020 |
) | |||
|
|
|
|
|
|
|
|
| |||
|
Adjustments to reconcile net loss to net cash provided by operating activities: |
|
|
|
|
|
|
| |||
|
Depreciation and amortization |
|
44,887 |
|
46,343 |
|
38,929 |
| |||
|
Provision for doubtful accounts |
|
13,727 |
|
12,854 |
|
11,639 |
| |||
|
Impairment of long-lived and intangible assets |
|
86,164 |
|
385,807 |
|
2,425 |
| |||
|
Stock-based compensation expense |
|
9,763 |
|
11,134 |
|
9,642 |
| |||
|
Provision (benefit) for deferred income taxes |
|
4,031 |
|
(48,926 |
) |
(39,214 |
) | |||
|
Amortization of debt issuance costs |
|
4,921 |
|
3,371 |
|
2,663 |
| |||
|
Loss on extinguishment of debt |
|
6,031 |
|
7,237 |
|
— |
| |||
|
Gain on sale and disposal of fixed assets |
|
(5,055 |
) |
(2,384 |
) |
(293 |
) | |||
|
Contingent consideration gains |
|
— |
|
— |
|
(85 |
) | |||
|
|
|
|
|
|
|
|
| |||
|
Changes in operating assets and liabilities, net of effects of acquired companies: |
|
|
|
|
|
|
| |||
|
Net accounts receivable |
|
17,612 |
|
(13,625 |
) |
(28,797 |
) | |||
|
Inventories |
|
253 |
|
2,520 |
|
6,917 |
| |||
|
Other current assets |
|
849 |
|
3,913 |
|
2,917 |
| |||
|
Income taxes |
|
18,725 |
|
(40,152 |
) |
6,434 |
| |||
|
Accounts payable |
|
(3,133 |
) |
8,084 |
|
(777 |
) | |||
|
Accrued expenses and accrued interest payable |
|
(3,333 |
) |
(8,475 |
) |
40,186 |
| |||
|
Accrued compensation related costs |
|
(12,006 |
) |
6,877 |
|
(483 |
) | |||
|
Other liabilities |
|
(5,797 |
) |
6,940 |
|
978 |
| |||
|
Net cash provided by operating activities - continuing operations |
|
70,233 |
|
62,401 |
|
50,061 |
| |||
|
Net cash used in operating activities - discontinued operations |
|
(1,425 |
) |
(5,098 |
) |
(442 |
) | |||
|
Net cash provided by operating activities |
|
68,808 |
|
57,303 |
|
49,619 |
| |||
|
|
|
|
|
|
|
|
| |||
|
Cash flows from investing activities: |
|
|
|
|
|
|
| |||
|
Purchase of property, plant and equipment |
|
(21,148 |
) |
(27,620 |
) |
(27,096 |
) | |||
|
Purchase of equipment leased to third parties under operating leases |
|
(2,476 |
) |
(4,632 |
) |
(4,012 |
) | |||
|
Acquisitions, net of cash acquired |
|
— |
|
(10,215 |
) |
(38,097 |
) | |||
|
Restricted cash |
|
1,615 |
|
(54 |
) |
— |
| |||
|
Purchase of company-owned life insurance investment |
|
(2,543 |
) |
(2,544 |
) |
(2,294 |
) | |||
|
Proceeds from sale of property, plant and equipment |
|
5,960 |
|
4,954 |
|
2,518 |
| |||
|
Other investing activities, net |
|
(10 |
) |
(50 |
) |
— |
| |||
|
Net cash used in investing activities - continuing operations |
|
(18,602 |
) |
(40,161 |
) |
(68,981 |
) | |||
|
Net cash provided by investing activities - discontinued operations |
|
1,425 |
|
4,987 |
|
2,507 |
| |||
|
Net cash used in investing activities |
|
(17,177 |
) |
(35,174 |
) |
(66,474 |
) | |||
|
|
|
|
|
|
|
|
| |||
|
Cash flows from financing activities: |
|
|
|
|
|
|
| |||
|
Borrowings under term loan |
|
274,400 |
|
— |
|
— |
| |||
|
Repayment of term loan |
|
(19,688 |
) |
(14,063 |
) |
(8,438 |
) | |||
|
Borrowings under revolving credit agreement |
|
23,000 |
|
155,000 |
|
331,000 |
| |||
|
Repayments under revolving credit agreement |
|
(155,000 |
) |
(93,000 |
) |
(286,000 |
) | |||
|
Payment of senior notes |
|
(200,000 |
) |
— |
|
— |
| |||
|
Payment on seller’s note and other contingent consideration |
|
(9,128 |
) |
(13,561 |
) |
(10,260 |
) | |||
|
Payment of capital lease obligations |
|
(979 |
) |
(1,111 |
) |
(1,687 |
) | |||
|
Payment of debt issuance costs and fees |
|
(15,832 |
) |
(8,340 |
) |
— |
| |||
|
Excess tax benefit from stock-based compensation |
|
— |
|
— |
|
2,249 |
| |||
|
Proceeds from issuance of common stock |
|
— |
|
— |
|
87 |
| |||
|
Net cash (used in) provided by financing activities - continuing operations |
|
(103,227 |
) |
24,925 |
|
26,951 |
| |||
|
Net cash used in financing activities - discontinued operations |
|
— |
|
— |
|
(10 |
) | |||
|
Net cash (used in) provided by financing activities |
|
(103,227 |
) |
24,925 |
|
26,941 |
| |||
|
|
|
|
|
|
|
|
| |||
|
(Decrease) increase in cash and cash equivalents |
|
(51,596 |
) |
47,054 |
|
10,086 |
| |||
|
Cash and cash equivalents, at beginning of year |
|
58,753 |
|
11,699 |
|
1,613 |
| |||
|
Cash and cash equivalents, at end of year |
|
$ |
7,157 |
|
$ |
58,753 |
|
$ |
11,699 |
|
Supplemental cash flow information is disclosed in Note T to the consolidated financial statements.
The accompanying notes are an integral part of the consolidated financial statements.
HANGER, INC.
NOTES TO CONSOLIDATED FINANCIAL STATEMENTS
As of and for the Years Ended December 31, 2016, 2015 and 2014
NOTE A — THE COMPANY
Hanger, Inc. (“the Company,” “we,” “our,” or “us”) is a leading national provider of products and services that assist in enhancing or restoring the physical capabilities of patients with disabilities or injuries. We provide orthotic and prosthetic (“O&P”) services, distribute O&P devices and components, manage O&P networks and provide therapeutic solutions to patients and businesses in acute, post-acute and clinic settings. We operate through two segments, Patient Care and Products & Services.
Our Patient Care segment is primarily comprised of Hanger Clinic, which specializes in the design, fabrication and delivery of custom O&P devices through 706 patient care clinics and 115 satellite locations in 45 states and the District of Columbia as of December 31, 2016. On a regular basis, we have been opening, closing and merging patient care clinics and satellite locations. For the two years ended December 31, 2016, we have opened 68 and closed or consolidated 129 patient care clinics, and opened 28 and closed 33 satellite locations. In addition, our Patient Care segment no longer has a clinic or satellite location in the State of Delaware.
Our Products & Services segment is comprised of our distribution and therapeutic solutions businesses. As a leading provider of O&P products in the United States, we coordinate through our distribution business the procurement and distribution of a broad catalog of O&P parts, componentry and devices to independent O&P providers nationwide. The other business in our Products & Services segment is our therapeutic solutions business, which develops specialized rehabilitation technologies and provides evidence-based clinical programs for post-acute rehabilitation to patients at approximately 4,000 skilled nursing and post-acute providers nationwide.
NOTE B — SIGNIFICANT ACCOUNTING POLICIES
Principles of Consolidation
Our consolidated financial statements include our accounts and those of our wholly-owned subsidiaries. All material intercompany transactions and balances have been eliminated in the accompanying consolidated financial statements.
Use of Estimates and Assumptions
The preparation of consolidated financial statements in conformity with accounting principles generally accepted in the United States of America (“GAAP”) requires the use of estimates and assumptions that affect the reported amounts of revenues, expenses, assets, liabilities and contingencies. Although actual results in subsequent periods may differ from these estimates, such estimates are developed based on the best information available to management and based on management’s best judgments at the time. We base our estimates on historical experience, observable trends and various other assumptions that we believe are reasonable under the circumstances. All significant assumptions and estimates underlying the amounts reported in the consolidated financial statements and accompanying notes are regularly reviewed and updated when necessary. Changes in estimates are reflected prospectively in the consolidated financial statements based upon on-going actual trends, or subsequent settlements and realizations depending on the nature and predictability of the estimates and contingencies. Interim changes in estimates related to annual operating costs are applied prospectively within annual periods. Although we believe that our estimates are reasonable, actual results could differ from these estimates.
The most significant assumptions and estimates underlying these consolidated financial statements and accompanying notes involve revenue recognition and accounts receivable valuation, inventories, accounts payable and accrued liabilities (including self-insurance reserves and contingencies), impairments of long-lived assets including goodwill, income taxes, business combinations, leases and stock-based compensation.
Revenue Recognition
Patient Care Segment
Revenues in our Patient Care segment are primarily derived from the sale of O&P devices and are recognized when the patient has received the device or service. At or subsequent to delivery, we issue an invoice to a third party payor, which primarily consists of commercial insurance companies, Medicare, Medicaid, the Veterans Administration and private or patient pay (“Private Pay”). We recognize revenue for the amounts we expect to receive from payors based on expected contractual reimbursement rates, which are net of estimated contractual discounts. Government reimbursement, comprised of Medicare, Medicaid and the U.S. Department of Veterans Affairs, in the aggregate, accounted for approximately, 54.1%, 53.4% and 50.9% of our net revenue in 2016, 2015 and 2014, respectively.
These revenue amounts are further revised as claims are adjudicated, which may result in disallowances, or decreases to revenue. We believe that adjustments related to write-offs of receivables should predominantly be recorded as a reduction of revenues, which we refer to as disallowed revenue. This is due to the majority of our revenues being collected from commercial insurance companies, Medicare, Medicaid and the Veterans Administration, most of which are under contractual reimbursement rates. As such, adjustments do not relate to an inability to pay, but to contractual allowances, lack of timely claims submission, insufficient medical documentation or other administrative errors. Amounts recorded to bad debt expense, which are presented within “Other operating costs,” generally relate to commercial payor bankruptcies and private pay balances for which there was an assessment of collectability and collection attempts were made. At the end of each period, we establish allowances for estimated disallowances relating to that period based on prior adjudication experience and record such amounts as an adjustment to revenue. In a similar fashion, we estimate and record allowances for doubtful accounts on unpaid receivables at each period end. We also record a liability, with a corresponding adjustment to revenue, for refunds expected to be paid to our patients or third party payors.
Medicare and Medicaid regulations and the various agreements we have with other third party payors, including commercial healthcare providers under which these contractual adjustments and disallowed revenue are calculated, are complex and are subject to interpretation and adjustment and may include multiple reimbursement mechanisms for different types of services. Therefore, the particular O&P devices and related services authorized and provided, and the related reimbursement, are subject to interpretation and adjustment that could result in payments that differ from our estimates. Additionally, updated regulations and reimbursement schedules, and contract renegotiations occur frequently, necessitating regular review and assessment of the estimation process by management. As a result, there is a reasonable possibility that recorded estimates will change materially in the short-term and any related adjustments will be recorded as changes in estimates when they become known.
For more information on our use of estimates to calculate allowances for disallowed revenue and doubtful accounts, refer to the “Accounts Receivable, Net” section below.
We often invoice patients or payors after a device is delivered. To account for this delay, we record an estimated revenue accrual for devices delivered but not yet invoiced at period end. This estimate is based on a historical look-back analysis of lag times between delivery and invoicing that occur over a period end.
Products & Services Segment
Revenues in our Products & Services segment are derived from the distribution of O&P components and the leasing and sale of rehabilitation equipment and ancillary consumable supplies combined with equipment maintenance, education, and training. Distribution revenues are recorded upon the delivery of products, net of estimated returns.
Equipment leasing and related services revenue are recognized over the applicable term as the customer has the right to use the equipment and as the services are provided. Equipment sales revenue is recognized upon delivery, with any related services revenue deferred and recognized as the services are performed. Sales of consumables are recognized upon delivery.
Material Costs
Material costs in our Patient Care segment reflect purchases of orthotics and prosthetic componentry and other related costs in connection with the delivery of care through our clinic locations and other patient care operations. Material costs in our
Products & Services segment reflect purchases of orthotics and prosthetic materials and other related costs in connection with the distribution of products and services to third party customers.
Personnel Costs
Personnel costs reflect salaries, benefits, incentive compensation, contract labor, and other personnel costs we incur in connection with our delivery of care through our clinic locations and other patient care operations, or distribution of products and services, and exclude similar costs incurred in connection with general and administrative activities.
Other Operating Costs
Other operating costs reflect costs we incur in connection with our delivery of care through our clinic locations and other patient care operations or distribution of products and services. Marketing costs, including advertising, are expensed as incurred and are presented within this financial statement caption. We incurred approximately $4.0 million, $3.9 million, and $3.4 million in advertising costs during the years ended December 31, 2016, 2015 and 2014, respectively. Other costs include rent, utilities, and other occupancy costs, general office expenses, bad debt expense, and travel and clinical professional education costs, and exclude similar costs incurred in connection with general and administrative activities.
General and Administrative Expenses
General and administrative expenses reflect costs we incur in the management and administration of our businesses that are not directly related to the operation of our clinics or provision of products and services. These include personnel costs and other operating costs supporting our general and administrative functions. We incurred approximately $0.6 million, $0.6 million, and $0.7 million in advertising costs during the years ended December 31, 2016, 2015 and 2014, respectively.
Professional Accounting and Legal Fees
We recognize fees associated with audits of our financial statements in the fiscal period to which the audit relates. All other professional fees are generally recognized as expense in the periods in which services are performed. Please see the “Accounts Payable and Accrued Liabilities” section for legal fees associated with legal contingencies.
Depreciation and Amortization
Depreciation and amortization expenses reflect all depreciation and amortization expenses, whether incurred in connection with our delivery of care through clinic locations, our distribution of products and services, or in the general management and administration of our business.
Cash and Cash Equivalents
We consider all highly liquid investments with original maturities of three months or less at the date of purchase to be cash equivalents. We maintain cash balances in excess of Federal Deposit Insurance Corporation (“FDIC”) limits at certain financial institutions. We manage this credit risk by concentrating our cash balances in high quality financial institutions and by periodically evaluating the credit quality of the primary financial institutions holding such deposits. With short maturities, the investments present insignificant risk of changes in value because of interest rate changes and are readily convertible to cash. Historically, no losses have been incurred due to such cash concentrations. Restricted cash balances are presented within “Other current assets” in the consolidated balance sheets. See Note I - “Other Current Assets and Other Assets” within these consolidated financial statements.
Accounts Receivable, Net
Patient Care Segment
We establish allowances for accounts receivable to reduce the carrying value of such receivables to their estimated net realizable value. The Patient Care segment’s accounts receivables are recorded net of unapplied cash, estimated allowance for disallowed revenue and estimated allowance for doubtful accounts, as described in the revenue recognition accounting policy above.
Both the allowance for disallowed revenue and the allowance for doubtful accounts estimates consider historical collection experience by each of the Medicare and non-Medicare (commercial insurance, Medicaid, Veteran’s Administration and Private Pay) primary payor class groupings. For each payor class grouping, liquidation analysis of historical period end receivable balances are performed to ascertain collections experience by aging category. We believe the use of historical collection experience applied to current period end receivable balances is reasonable. In the absence of an evident adverse trend, we use historical experience rates calculated using an average of four quarters of data with at least twelve months of adjudication. We believe the time periods analyzed provide sufficient time for most balances to adjudicate in the normal course of operations. We will modify the time periods analyzed when significant trends indicate that adjustments should be made. In addition, estimates are adjusted when appropriate for information available up through the issuance of the consolidated financial statements.
Products & Services Segment
Products & Services segment’s allowance for doubtful accounts is estimated based on the analysis of the segment’s historical write-offs experience, accounts receivable aging and economic status of its customers. Accounts receivable that are deemed uncollectible are written-off to the allowance for doubtful accounts. Accounts receivable are also recorded net of an allowance for estimated sales returns.
Inventories
Inventories are valued at the lower of estimated cost or net realizable value with cost determined on a first-in, first out (“FIFO”) basis. Provisions have also been made to reduce the carrying value of inventories for excess, obsolete, or otherwise impaired inventory on hand at period-end.
Patient Care Segment
Substantially all of our Patient Care segment inventories are recorded through a periodic approach whereby inventory quantities are adjusted on the basis of a quarterly physical count. Segment inventories relate primarily to raw materials and work-in-process (“WIP”) at Hanger Clinics. Inventories at Hanger Clinics totaled $29.1 million and $30.1 million at December 31, 2016 and 2015, respectively, with WIP inventory representing $9.0 million and $8.9 million of the total inventory, respectively.
Raw materials consists of purchased parts, components, and supplies which are used in the assembly of O&P devices for delivery to patients. In some cases, purchased parts and components are also sold directly to patients. Raw materials are valued based on recent vendor invoices, reduced by estimated vendor rebates. Such rebates are recognized as a reduction of cost of materials in the Consolidated Statements of Operations and Comprehensive (Loss) Income when the related devices or components are delivered to the patient. Approximately 69% and 52% of raw materials at December 31, 2016 and 2015, respectively were purchased from our Products & Services segment. Raw material inventory was $20.1 million and $21.2 million at December 31, 2016 and 2015 respectively.
WIP consists of devices which are in the process of assembly at our clinics or fabrication centers. WIP quantities were determined by the physical count of patient orders at the end of every quarter of 2016 and 2015 while the related stage of completion of each order was established by clinic personnel. We do not have an inventory costing system and as a result, the identified WIP quantities were valued on the basis of estimated raw materials, labor, and overhead costs. To estimate such costs, we develop bills of materials for certain categories of devices that we assemble and deliver to patients. Within each bill of material, we estimate (i) the typical types of component parts necessary to assemble each device; (ii) the points in the assembly process when such component parts are added; (iii) the estimated cost of such parts based on historical purchasing data; (iv) the estimated labor costs incurred at each stage of assembly; and (v) the estimated overhead costs applicable to the device.
Products & Services Segment
Product & Service segment inventories consist primarily of finished goods at its distribution centers as well as raw materials at fabrication facilities, and totaled $39.1 million and $38.4 million as of December 31, 2016 and 2015, respectively. Finished goods include products that are available for sale to third party customers as well as to our Patient Care segment as described above. Such inventories were determined on the basis of perpetual records and a physical count at year end. Inventories in connection with therapeutic services are valued at a weighted average cost.
Fair Value Measurements
We follow the authoritative guidance for financial assets and liabilities, which establishes a framework for measuring fair value and requires enhanced disclosures about fair value measurements. The authoritative guidance requires disclosure about how fair value is determined for assets and liabilities and establishes a hierarchy by which these assets and liabilities must be categorized, based on significant levels of inputs as follows:
Level 1 consists of securities for which there are quoted prices in active markets for identical securities;
Level 2 consists of securities for which observable inputs other than Level 1 inputs are used, such as quoted prices for similar securities in active markets or quoted prices for identical securities in less active markets and model-derived valuations for which the variables are derived from, or corroborated by, observable market data; and
Level 3 consists of securities for which there are no observable inputs to the valuation methodology that are significant to the measurement of the fair value.
The determination of where assets and liabilities fall within this hierarchy is based upon the lowest level of input that is significant to the fair value measurement.
Financial Instruments
We hold investments in money market funds which are measured at fair value on a recurring basis. As of December 31, 2016 and 2015, $2.3 million and $3.9 million, respectively of money market funds which are restricted from general use are presented within “Other current assets.” The fair values of our money market funds are based on Level 1 observable market prices and are equivalent to one dollar per share. The carrying value of accounts receivable and accounts payable, approximate their fair values based on the short-term nature of these instruments.
The carrying value of our outstanding term loan as of December 31, 2016 and 2015, was $180.0 million and $199.7 million compared to its fair value of $172.6 million and $186.2 million, respectively. The carrying values of our outstanding Term Loan B as of December 31, 2016 was $280.0 million compared to its fair value of $278.6 million. There was no Term Loan B outstanding as of December 31, 2015. Our estimates of fair value are based on debt with similar terms and remaining maturities as of December 31, 2016 and 2015, which represent Level 2 measurements.
We had no balances outstanding under revolving credit facilities as of December 31, 2016. The carrying value of the amount outstanding on our revolving credit facilities as of December 31, 2015, was $132.0 million compared to its fair value of $121.6 million. Our estimates of fair value are based on debt with similar terms and remaining maturities as of December 31, 2015, which represent a Level 2 measurement.
Our senior notes were redeemed during 2016. The carrying value of the senior notes was $200.0 million as of December 31, 2015 compared to their fair value of $179.2 million. Our estimates of fair value are based on observable market inputs which represent Level 2 measurements.
The carrying value of our outstanding subordinated promissory notes issued in connection with acquisitions (“Seller Notes”) as of December 31, 2016 and 2015 was $11.1 million and $19.8 million, respectively. We believe that the carrying value of the Seller Notes approximates their fair values based on a discounted cash flow model using unobservable inputs, primarily, our credit spread for subordinated debt, which represents a Level 3 measurement.
Insurance Recoveries Receivable
We incur legal and other costs with respect to a variety of issues on an ongoing basis. We record a related receivable when costs are reimbursable under applicable insurance policies, we believe it is probable such costs will be reimbursed and such reimbursements can be reasonably estimated. We record the benefit of related receivables from the insurer as a reduction of costs in the same financial statement caption in which the related loss was recognized in our consolidated statements of operations and comprehensive (loss) income. Loss contingency reserves, which are recorded within accrued liabilities, are not reduced by estimated insurance recoveries.
Property, Plant and Equipment, Net
Property, plant and equipment are recorded at cost less accumulated depreciation and amortization, with the exception of assets acquired through acquisitions, which are initially recorded at estimated fair value. Equipment acquired under a capital lease is recorded at the present value of the future minimum lease payments. The cost and related accumulated depreciation of assets sold, retired or otherwise disposed of are removed from the respective accounts, and any resulting gains or losses are included in the consolidated statements of operations and comprehensive (loss) income. Depreciation is computed for financial reporting purposes using the straight-line method over the useful lives of the related assets estimated as follows: furniture and fixtures, equipment and information systems, principally five years, buildings ten to forty years, capital leases over the lease term, and leasehold improvements over the shorter of ten years or the lease term. We record maintenance and repairs, including the cost of minor replacements, to maintenance expense. Costs of major repairs that extend the effective useful life of property are capitalized and depreciated accordingly.
We capitalize the costs of obtaining or developing internal use software, including external direct costs of materials and services and directly related payroll costs. Amortization begins when the internal use software is ready for its intended use. Costs incurred during the preliminary project and post-implementation stages, as well as maintenance and training costs, are expensed as incurred.
Business Combinations
We record tangible and intangible assets acquired and liabilities assumed in business combinations under the acquisition method of accounting. Acquisition consideration typically includes cash payments, the issuance of Sellers Notes and in certain instances contingent consideration with payment terms associated with the achievement of designated collection targets of the acquired business. Amounts paid for each acquisition are allocated to the assets acquired and liabilities assumed based on their estimated fair values at the date of acquisition inclusive of identifiable intangible assets. The estimated fair value of identifiable assets and liabilities, including intangibles, are based on detailed valuations that use information and assumptions available to management. We allocate any excess purchase price over the fair value of the tangible and identifiable intangible assets acquired and liabilities assumed to goodwill. Significant management judgments and assumptions are required in determining the fair value of assets acquired and liabilities assumed, particularly acquired intangible assets, including estimated useful lives. The valuation of purchased intangible assets is based upon estimates of the future performance and discounted cash flows from the acquired business. Each asset acquired or liability assumed is measured at estimated fair value from the perspective of a market participant. Subsequent changes in the estimated fair value of contingent consideration are recognized as “General and administrative expenses” within the consolidated statements of operations and comprehensive (loss) income.
Goodwill and Other Intangible Assets, Net
Goodwill represents the excess of the purchase price over the estimated fair value of net identifiable assets acquired and liabilities assumed from purchased businesses. We assess goodwill for impairment annually during the fourth quarter, and between annual tests if an event occurs or circumstances change that would more likely than not reduce the fair value of a reporting unit below its carrying amount. We have the option to first assess qualitative factors to determine whether it is more likely than not that the fair value of a reporting unit is less than its carrying amount as a basis for determining whether it is necessary to perform the two-step goodwill impairment test. If it is determined that a two-step goodwill impairment test is necessary or more efficient than a qualitative approach, we will measure the fair value of the reporting units using a combination of income and market approaches. Any impairment would be recognized by a charge to income from operations and a reduction in the carrying value of the goodwill.
If the fair value of the reporting unit exceeds its carrying amount, goodwill of the reporting unit is considered not impaired, and the second step of the impairment test is not required. The second step, if required, compares the implied fair value of the reporting unit goodwill with the carrying amount of that goodwill. The fair value of a reporting unit is allocated to all of the assets and liabilities of that unit (including any unrecognized intangible assets) as if the reporting unit had been acquired in a business combination. If the carrying amount of the reporting unit’s goodwill exceeds its implied fair value, an impairment charge is recognized in an amount equal to that excess.
We apply judgment in determining the fair value of our reporting units and the implied fair value of goodwill which is dependent on significant assumptions and estimates regarding expected future cash flows, terminal value, changes in working capital requirements, and discount rates.
The fair value of acquired customer intangibles is estimated using an excess earnings model. Key assumptions utilized in the valuation model include pro-forma projected cash flows adjusted for market-participant assumptions, forecasted customer retention curve, and discount rate. Customer intangibles are amortized, using the straight-line method over an estimated useful life of four to ten years. The fair value of non-compete agreements are estimated using a discounted cash flow model. The related intangible assets are amortized, using the straight-line method, over their term which ranges from two to five years. Other definite-lived intangible assets are recorded at cost and are amortized, using the straight-line method, over their estimated useful lives of up to seventeen years. The fair value associated with trade names is estimated using the relief-from-royalty method with the primary assumptions being the royalty rate and expected revenues associated with the trade names. These assets, some of which have indefinite lives, are primarily included in the Products & Services segment. Indefinite lived trade name intangible assets are assessed for impairment in the fourth quarter of each year, or more frequently if events or changes in circumstances indicate that the asset might be impaired. Trade name intangible assets with definite lives are amortized over their estimated useful lives of one to ten years.
For the years ended December 31, 2016 and 2015, we recorded impairments of our goodwill totaling $86.0 million and $382.9 million, respectively. See Note H - “Goodwill and Other Intangible Assets” to our consolidated financial statements in this Annual Report on Form 10-K for additional information regarding these charges.
In conjunction with our Goodwill impairment testing at December 31, 2015, we reevaluated the estimated useful life of our customer list intangibles. In the fourth quarter of 2015, the estimated useful life of our customer list intangibles was reduced from 10 years to four years in our Patient Care segment and from 14 years to 10 years in our Products & Services segment. This change in the estimated useful lives increased amortization for the years ended December 31, 2015 and 2016 by approximately $6.0 million and $7.0 million, respectively.
As described, we apply judgment in the selection of key assumptions used in both steps of the goodwill impairment test and as part of our evaluation of intangible assets tested annually and at interim testing dates as necessary. If these assumptions differ from actual, we could incur additional impairment charges and those charges could be material.
Long-Lived Asset Impairment
We evaluate the carrying value of long-lived assets to be held and used for impairment whenever events or changes in circumstance indicate that the carrying amount may not be recoverable. The carrying value of a long-lived asset group is not recoverable if it exceeds the sum of the undiscounted cash flows expected to result from the use and eventual disposition of the asset group. We measure impairment as the amount by which the carrying value exceeds the estimated fair value. Estimated fair value is determined primarily using the projected future cash flows discounted at a rate commensurate with the risk involved. Long-lived assets to be disposed of by sale are classified as held for sale when the applicable criteria are met, and recognized within the consolidated balance sheet at the lower of carrying value or fair value less cost to sell. Depreciation on such assets is ceased.
Debt Issuance Costs, Net
Debt issuance costs incurred in connection with long-term debt are amortized, on a straight-line basis, which is not materially different from the effective interest method, through the maturity of the related debt instrument. Debt issuance costs are classified as a reduction of debt in the consolidated balance sheets. Amortization of these costs is included within “Interest expense, net” in the consolidated statements of operations and comprehensive (loss) income.
Accounts Payable and Accrued Liabilities
Accounts payable relating to goods or services received is estimated using various factors including payments made subsequent to period end, vendor invoice dates, shipping terms confirmed by certain vendors or other third party documentation. Accrued liabilities are recorded based on estimates of services received or amounts expected to be paid to third parties. Accrued legal costs for legal contingencies are recorded when they are probable and estimable.
Self-Insurance Reserves
We maintain insurance programs which include employee health insurance, workers’ compensation, product, professional and general liability. Our employee health insurance program is self-funded, with a stop-loss coverage on claims that exceed $0.4 million for any individually covered claim. We are responsible for workers’ compensation, product, professional and general liability claims up to $0.5 million per individual incident. The insurance and self-insurance accruals reflect the estimate of incurred but not reported losses, historical claims experience and expected costs to settle unpaid claims and are undiscounted. We record amounts due from insurance policies in “Other assets” while recording the estimated liability in self-insurance accruals in our consolidated balance sheets.
Leases
We lease a majority of our patient care clinics under lease arrangements, certain of which contain renewal options, rent escalation clauses, and/or landlord incentives. Rent expense for noncancellable leases with scheduled rent increases and/or landlord incentives is recognized on a straight-line basis over the lease term, including any applicable rent holidays, beginning on the earlier of the lease commencement date or the date we take control of the leased space.
We have certain building leases that are accounted for as financing transactions. In these instances, pursuant to ASC 840-40-55, The Effect of Lessee Involvement in Asset Construction, we are the deemed owner of the property during the construction phase and the associated building assets and financing obligations are recognized on our consolidated balance sheet. Subsequent to construction, the arrangement is evaluated in accordance with ASC 840-40 to determine whether the arrangement qualifies as a sale leaseback. Sale leasebacks of real estate require an analysis to identify indicators of continuing involvement and other factors. If no indicators of continuing involvement are found, the lease is considered to have passed the sales-leaseback criteria and both the asset and the related financing obligation are derecognized. These leases are then assessed for classification at lease inception and reported in accordance with ASC 840.
If indicators of continuing involvement are present, these transactions do not qualify for sale accounting and are accounted for as a failed sale-leaseback. In accordance with ASC 840-40, Leases - Sale-Leaseback Transactions, the buildings and related assets, as well as their associated financing obligations, continue to be reflected in our consolidated balance sheet, with the assets depreciated over their remaining useful lives. Payments required under the arrangement are recognized as reductions of the financing obligation and interest expense. At the end of the lease term, the corresponding financing obligation and the remaining net book value of the building are derecognized. When applicable, any associated gain is recognized within “Other operating costs” in our consolidated statements of operations and comprehensive (loss) income.
Income Taxes
We use the liability method of accounting for income taxes as set forth in the authoritative guidance for accounting for income taxes. Under this method, we recognize deferred tax liabilities and assets for the expected future tax consequences of temporary differences between the respective carrying amounts and tax basis of our assets and liabilities. We recognize a valuation allowance on deferred tax assets if it is more likely than not that the assets will not be realized in future years. Significant accounting judgment is required in determining the provision for income taxes and related consolidated balance sheet accounts.
We believe that our tax positions are consistent with applicable tax law, but certain positions may be challenged by taxing authorities. In the ordinary course of business, there are transactions and calculations where the ultimate tax outcome is uncertain. In addition, we are subject to periodic audits and examinations by the Internal Revenue Service and other state and local taxing authorities. In these cases, we record the financial statement effects of a tax position when it is more-likely-than-not, based on the technical merits, that the position will be sustained upon examination. We record the largest amount of tax benefit that is greater than fifty percent likely of being realized upon settlement with a taxing authority that has full
knowledge of all relevant information. If not paid, the liability for uncertain tax positions is reversed as a reduction of income tax expense at the earlier of the period when the position is effectively settled or when the statute of limitations has expired. Although we believe that our estimates are reasonable, actual results could differ from these estimates. Interest and penalties, when applicable, are recorded within the income tax provision.
Interest Expense, Net
We record interest expense net of interest income which was $0.1 million in each of the years ended December 31, 2016, 2015 and 2014 in our consolidated statements of operations and comprehensive (loss) income.
Stock-Based Compensation
We primarily issue restricted common stock units under one active stock-based compensation plan. Shares of common stock issued under this plan are issued from our authorized and unissued shares.
We measure and recognize compensation expense, net of estimated forfeiture, for all stock-based payments at fair value. Our outstanding awards are primarily comprised of restricted stock units and performance-based restricted stock units. All employee stock options are fully vested as of December 31, 2016 and 2015, and all associated compensation expense has been recognized in prior years. The restricted stock units are subject to a service condition or vesting period ranging from one to four years. The performance-based restricted stock units include both performance and service conditions. The performance conditions are based on annual earnings per share targets.
Compensation expense associated with restricted stock units is recognized on a straight-line basis over the requisite service period. Compensation expense associated with performance-based restricted stock units is recognized on a graded vesting or accelerated basis over the requisite service period when the performance condition is probable of being achieved.
Segment Information
We have two segments, Patient Care and Products & Services. Except for the segment specific policies described above, the segments follow the same accounting policies as followed in the consolidated financial statements. We apply the “management approach” to disclosure of segment information. The management approach designates the internal organization that is used by management for making operating decisions and assessing performance as the basis of our reportable segments. The description of our reportable segments and the disclosure of segment information are presented in Note R “Segment and Related Information” to these consolidated financial statements.
Intersegment revenue represents sales of O&P components from our Products & Services segment to our Patient Care segment and are recorded at prices that approximate material cost plus overhead.
In 2014, intersegment revenues reflect prices which we believed approximated market values but has been reclassed to eliminate intercompany profit to be consistent with intersegment revenue in 2015 and 2016. The reclassification adjustment to eliminate intersegment profit in 2014 approximates $21.0 million.
Discontinued Operations
We reported our Dosteon product group as a discontinued operation in accordance with ASC 205-20, Presentation of Financial Statements-Discontinued Operations, ASC 360-10 Property, Plant and Equipment-Overall, and ASC 350-20, Intangibles -Goodwill and Other - Goodwill as of December 31, 2014 and all subsequent periods. Proceeds from the sale of Dosteon businesses are recorded in the consolidated statement of cash flows within the “Net cash provided by investing activities - discontinued operations” caption. Also included within this caption are any impairments and losses on disposal.
See Note S - “Discontinued Operations” within these consolidated financial statements.
Recent Accounting Pronouncements
In May 2017, the Financial Accounting Standards Board (“FASB”) issued Accounting Standards Update (“ASU”) No. 2017-09, Compensation - Stock Compensation (Topic 718): Scope of Modification Accounting, which clarifies what constitutes a modification of a share-based payment award. The ASU is intended to provide clarity and reduce both diversity in practice and
cost and complexity when applying the guidance in Topic 718 to a change to the terms or conditions of a share-based payment award. ASU 2017-09 is effective for public entities for annual periods beginning after December 15, 2017, and interim periods within those fiscal years. We plan to adopt ASU 2017-09 on January 1, 2018, and we do not anticipate that the adoption of ASU 2017-09 will have a material impact on our financial conditions or results of operations.
In March 2017, the FASB issued ASU No. 2017-7, Compensation - Retirement Benefits (Topic 715): Improving the Presentation of Net Periodic Pension Cost and Net Periodic Postretirement Benefit Cost. This ASU requires that an employer report the service cost component in the same line item or items as other compensation costs arising from services rendered by the pertinent employees during the period. The other components of net benefit cost, which include interest cost and prior service cost or credit, among others, are required to be presented in the income statement separately from the service cost component and outside a subtotal of income from operations, if one is presented. This ASU is effective for our fiscal year 2018, including interim periods. We are currently evaluating the effects that the adoption of this ASU will have on our consolidated financial statements.
In January 2017, the FASB issued ASU No. 2017-4, Intangibles-Goodwill and Other (Topic 350): Simplifying the Test for Goodwill Impairment. This ASU simplifies how an entity is required to test goodwill for impairment by eliminating Step Two from the goodwill impairment test. Step Two measures a goodwill impairment loss by comparing the implied fair value of a reporting unit’s goodwill with the carrying amount of that goodwill. Under this standard, an entity will recognize an impairment charge for the amount by which the carrying value of a reporting unit exceeds it fair value. The amendments in this ASU are effective for us in fiscal year 2020 with early adoption permitted beginning in 2017. We plan to adopt ASU 2017-04 on January 1, 2017. Future impairments, if any, of our goodwill will be impacted by our adoption of this ASU, however any impact cannot be estimated at this time.
In January 2017, the FASB issued ASU No. 2017-3, Accounting Changes and Error Corrections (Topic 250) and Investments-Equity Method and Joint Ventures (Topic 323): Amendments to SEC Paragraphs Pursuant to Staff Announcements at the September 22, 2016 and November 17, 2016 EITF Meetings. This ASU expands disclosures regarding potential material effects to our consolidated financial statements that may occur when adopting ASU’s in the future. When a company cannot reasonably estimate the impact of adopting an ASU, disclosures are to be expanded to include qualitative disclosures including a description to the effect to the company’s accounting policies, a comparison to the existing policies, the status of its process to implement the new standard and any significant implementation matters yet to be addressed. This standard will generally require more disclosure in the consolidated financial statements when adopted.
In January 2017, the FASB issued ASU No. 2017-1, Business Combinations (Topic 805): Clarifying the Definition of a Business. This ASU clarifies the definition of a business with the objective of adding guidance to assist entities with evaluating whether transactions should be accounted for as acquisitions (or disposals) of assets or businesses. This ASU is effective for our fiscal year 2018, including interim periods. The adoption of this standard is not expected to have a material impact on our consolidated financial statements, but may have an impact to the conclusion of future acquisitions.
In November 2016, the FASB issued ASU No. 2016-18, Statement of Cash Flows (Topic 230): Restricted Cash. This ASU provides guidance on presenting restricted cash in the statement of cash flows. Restricted cash and cash equivalents are to be included in cash and cash equivalents when reconciling the changes during the period, while separately identifying the changes in restricted cash and cash equivalents. This ASU is effective for our fiscal year 2018, including interim periods and will require a retrospective transition. Early adoption is permitted. The adoption of this standard will result in restricted cash being included in cash and cash equivalents.
In October 2016, the FASB issued ASU No. 2016-16, Income Taxes (Topic 740): Intra-Entity Transfers of Assets Other Than Inventory. This ASU requires the recognition of the income tax consequences of an intra-entity transfer of an asset other than inventory when the transfer occurs. This ASU is effective for fiscal years beginning after December 15, 2017, and interim periods within those fiscal years, with early adoption permitted. The amendments in this ASU should be applied on a modified retrospective basis through a cumulative-effect adjustment directly to retained earnings as of the beginning of the period of adoption. The adoption of this standard is not expected to have a material impact on our consolidated financial statements.
In August 2016, the FASB issued ASU 2016-15, Statement of Cash Flows (Topic 230): Classification of Certain Cash Receipts and Cash Payments. The purpose of this ASU is to reduce the diversity in practice regarding how certain cash receipts and cash payments are presented and classified in the statement of cash flows. This ASU is effective for fiscal year 2018. Early adoption is permitted. A retrospective transition method is to be used in the application of this amendment. The adoption of this standard is not expected to have a material impact on our consolidated financial statements.
In March 2016, the FASB issued ASU No. 2016-9, Compensation-Stock Compensation (Topic 718): Improvements to Employee Share-Based Payment Accounting. This ASU simplifies several aspects of the accounting for share-based payment transactions, including the income tax consequences, classification of awards as either equity or liabilities and classification on the statement of cash flows. This ASU is effective for fiscal years beginning after December 15, 2016, although early adoption is permitted. We plan to adopt ASU No. 2016-9 on January 1, 2017, and once effective, we anticipate the primary impact of adopting ASU 2016-9 will be the recognition of excess tax benefits and tax deficiencies resulting from our stock awards to be included in our provision for income taxes, whereas previously these amounts were taken directly to additional paid-in capital. Additionally, these amounts are required to appear in the statement of cash flow under operating activities, whereas previously these amounts were reported as financing activities. We do not anticipate any impact to our classification of awards as either equity or liabilities. Upon the adoption of this ASU, we will elect to account for forfeitures as they occur.
In February 2016, the FASB issued ASU No. 2016-2, Leases (Topic 842). The amendments in this ASU revise the accounting for leases. Under the new guidance, lessees will be required to recognize a lease liability and a right-of-use asset for all leases that extend beyond 12 months. The asset and liability will initially be measured at the present value of the lease payments. The new lease guidance also simplified the accounting for sale and leaseback transactions primarily because lessees must recognize lease assets and lease liabilities. The amendments in this ASU are effective for fiscal year 2019 and will be applied through a modified retrospective transition approach for leases existing at, or entered into after, the beginning of the earliest comparative period presented in the consolidated financial statements. Early adoption is permitted. We are currently evaluating the effects that the adoption of this ASU will have on our consolidated financial statements. We have not yet concluded how the new standard will impact the consolidated financial statements. Nonetheless, it is anticipated that there will be a material increase to assets and lease liabilities for existing property leases representing our nationwide retail locations that are not already included on our consolidated balance sheet through failed sale-leaseback accounting treatment.
In January 2016, the FASB issued ASU No. 2016-1, Financial Instruments - Overall (Subtopic 825-10): Recognition and Measurement of Financial Assets and Financial Liabilities. The amendments in this ASU revise the accounting related to (i) the classification and measurement of investments in equity securities and (ii) the presentation of certain fair value changes for financial liabilities at fair value. The amendments in this ASU are effective for us beginning on January 1, 2018 and should be applied through a cumulative-effect adjustment to the consolidated balance sheet. Early adoption is permitted under certain circumstances. The adoption of this standard is not expected to have a material impact on our consolidated financial statements.
In November 2015, the FASB issued ASU No. 2015-17, Income Taxes (Topic 740): Balance Sheet Classification of Deferred Taxes, which requires that all deferred income tax assets and liabilities be presented as noncurrent in the Company’s consolidated balance sheet. Prior to the issuance of ASU 2015-17, deferred tax liabilities and assets were required to be separately classified into a current amount and a noncurrent amount in the balance sheet. ASU 2015-17 represents a change in accounting principle and is effective for fiscal years, and the interim periods within those years, beginning after December 15, 2016. Early adoption is permitted and the Company elected to early adopt ASU 2015-17 as of December 31, 2015 and applied the guidance retrospectively to all periods presented. The adoption of this guidance resulted in the reclassification of deferred income taxes from a current asset to being reported as a non-current asset.
In September 2015, the FASB issued ASU No. 2015-16, Business Combinations (Topic 805): Simplifying the Accounting for Measurement-Period Adjustments, which eliminates the requirement for an acquirer in a business combination to account for measurement-period adjustments retrospectively. The acquirer must record, in the same period’s financial statements, the effect on earnings of changes in depreciation, amortization, or other income effects, if any, as a result of the change to the provisional amounts, calculated as if the accounting had been completed at the acquisition date. This guidance is effective for fiscal years beginning after December 15, 2015, and early adoption is permitted. We adopted ASU 2015-16 prospectively effective January 1, 2015. Adoption of ASU 2015-16 did not have a material effect on our consolidated financial statements.
In July 2015, the FASB issued ASU No. 2015-11, Inventory (Topic 330): Simplifying the Measurement of Inventory. This ASU simplifies the measurement of inventory. Under this new standard, inventory should be measured using the lower of cost or net realizable value. Net realizable value is the estimated selling price in the ordinary course of business, less reasonable predictable costs of completion, disposal and transportation. Early adoption is permitted and this ASU was implemented effective January 1, 2015. The adoption of this standard did not have a material impact on our consolidated financial statements.
In May 2015, the FASB issued ASU No. 2015-7, Fair Value Measurement (Topic 820): Disclosures for Investments in Certain Entities That Calculate Net Asset Value per Share (or Its Equivalent). This ASU removes certain requirements related to valuing assets where fair value is measured using the net asset value per share practical expedient. This ASU was effective on January 1, 2016. The adoption of this standard did not have a material impact on our consolidated financial statements.
In April 2015, the FASB issued ASU No. 2015-05, Intangibles — Goodwill and Other — Internal-Use Software — Customer’s Accounting for Fees Paid in a Cloud Computing Arrangement (“ASU 2015-05”). ASU 2015-05 provides guidance to customers about whether a cloud computing arrangement includes a software license. If a cloud computing arrangement includes a software license, then the customer should account for the software license element of the arrangement consistent with the acquisition of other software licenses. If a cloud computing arrangement does not include a software license, the customer should account for the arrangement as a service contract. The guidance does not change the accounting for a customer’s service contracts. We adopted ASU 2015-05 prospectively effective January 1, 2015. Adoption of ASU 2015-05 did not have a material effect on our consolidated financial statements.
In August 2014, the FASB issued ASU No. 2014-15, Presentation of Financial Statements-Going Concern (Subtopic 205-40: Disclosure of Uncertainties about an Entity’s Ability to Continue as a Going Concern. The amendments in this ASU provide guidance on management’s responsibility to evaluate whether there is substantial doubt about an entity’s ability to continue as a going concern. We adopted this pronouncement on December 31, 2016, see Note N - “Long-term Debt” for additional information. The adoption of this standard did not have a material effect on our consolidated financial statements.
In May 2014, the FASB issued ASU No. 2014-9, Revenue from Contracts with Customers (Topic 606). This ASU provides a comprehensive new revenue recognition model that requires a company to recognize revenue to depict the transfer of goods or services to a customer in an amount that reflects the consideration it expects to receive in exchange for those goods or services. Additional disclosures are required regarding the nature, amount, timing and uncertainty of revenue and cash flows arising from customer contracts, including significant judgments and changes in judgments and assets recognized from costs incurred to obtain or fulfill a contract. The FASB issued additional related ASU’s providing guidance on principal versus agent considerations, identification of performance obligations and the implementation guidance for licensing. The two permitted transition methods under the new standard are the full retrospective method, in which case the standard would be applied to each prior reporting period presented, or the modified retrospective method, in which case the cumulative effect of applying the standard would be recognized at the date of initial adoption. In August 2015, the FASB issued ASU No. 2015-14, Revenue from Contracts with Customers (Topic 606): Deferral of the Effective Date which deferred the effective date until fiscal year 2018. We have assembled a revenue task forced composed of internal employees and external consultants to evaluate the impact on the different revenue streams in our consolidated financial statements and related disclosures. We continue to evaluate the impact that the adoption of this new standard may have on our consolidated financial statements and the related disclosures. We expect to adopt any changes resulting from these guidelines effective January 1, 2018.
In April 2014, the FASB issued ASU 2014-8, Presentation of Financial Statements (Topic 205) and Property, Plant, and Equipment (Topic 360): Reporting Discontinued Operations and Disclosures of Disposals of Components of an Entity. This ASU changed the requirements for reporting discontinued operations to include a strategic shift that has a major effect on an entity’s operations and financial results. Entities are required to provide additional disclosures about individually significant components that are disposed of, or held for sale, but do not meet the discontinued operations criteria. The ASU was effective prospectively for all disposals or classifications as held for sale that occur within annual periods beginning January 1, 2015. The adoption of this standard did not have a material impact on our consolidated financial statements.
NOTE C — EARNINGS PER SHARE
Basic earnings per common share is computed using the weighted average number of common shares outstanding during the period. Diluted earnings per common share is computed using the weighted average number of common shares outstanding during the period plus any potentially dilutive common shares, such as stock options, restricted stock units and performance-based units calculated using the treasury stock method. Total anti-dilutive shares excluded from the diluted earnings per share were 342,369 of as December 31, 2016 and 46,870 and 8,088 as of December 31, 2015 and 2014, respectively.
Our credit agreement restricts the payment of dividends or other distributions to our shareholders with respect to the parent company or any of its subsidiaries. See Note N - “Long-Term Debt” within these consolidated financial statements.
The reconciliation of the numerators and denominators used to calculate basic and diluted net (loss) income per share are as follows:
|
|
|
Year Ended December 31, |
| |||||||
|
(in thousands, except share and per share data) |
|
2016 |
|
2015 |
|
2014 |
| |||
|
|
|
|
|
|
|
|
| |||
|
Loss from continuing operations applicable to common shareholders |
|
$ |
(107,406 |
) |
$ |
(319,117 |
) |
$ |
(3,020 |
) |
|
Income (loss) from discontinued operations, net of income taxes |
|
935 |
|
(7,974 |
) |
(15,946 |
) | |||
|
Net loss applicable to common shareholders |
|
$ |
(106,471 |
) |
$ |
(327,091 |
) |
$ |
(18,966 |
) |
|
|
|
|
|
|
|
|
| |||
|
Shares of common stock outstanding used to compute basic per common share amounts |
|
35,933,222 |
|
35,635,448 |
|
35,309,478 |
| |||
|
Effect of dilutive restricted stock units and options (1) |
|
— |
|
— |
|
— |
| |||
|
Shares used to compute diluted per common share amounts |
|
35,933,222 |
|
35,635,448 |
|
35,309,478 |
| |||
|
|
|
|
|
|
|
|
| |||
|
Basic and Diluted: |
|
|
|
|
|
|
| |||
|
Loss from continuing operations per share applicable to common stock |
|
$ |
(2.99 |
) |
$ |
(8.96 |
) |
$ |
(0.09 |
) |
|
Income (loss) from discontinued operations per share applicable to common stock |
|
0.03 |
|
(0.22 |
) |
(0.45 |
) | |||
|
Net loss per share applicable to common shareholders |
|
$ |
(2.96 |
) |
$ |
(9.18 |
) |
$ |
(0.54 |
) |
(1) Given that we are recognizing a loss from continuing operations, shares used to compute diluted per common share amounts excludes 145,497 shares for 2016, 102,288 shares for 2015, and 256,880 shares for 2014 of potentially dilutive shares related to unvested restricted stock units and unexercised options in accordance with ASC260 - Earnings Per Share.
NOTE D — ACCOUNTS RECEIVABLE, NET
Accounts receivable are principally from Medicare and Medicaid programs and commercial insurance plans. Our accounts receivables are recorded net of contractual discounts and net of estimated allowances for disallowed revenue and sales returns. These allowances are presented as a reduction of gross accounts receivable. We also record an allowance for doubtful accounts which is deducted from gross accounts receivable to arrive at “Accounts receivable, net.” Accounts receivable, net as of December 31, 2016, and 2015 is comprised of the following:
|
|
|
As of December 31, 2016 |
|
As of December 31, 2015 |
| ||||||||||||||
|
(in thousands) |
|
Patient Care |
|
Products & |
|
Consolidated |
|
Patient Care |
|
Products & |
|
Consolidated |
| ||||||
|
|
|
|
|
|
|
|
|
|
|
|
|
|
| ||||||
|
Accounts receivable, before allowances |
|
$ |
193,835 |
|
$ |
27,385 |
|
$ |
221,220 |
|
$ |
245,923 |
|
$ |
25,002 |
|
$ |
270,925 |
|
|
Allowance for disallowed revenue |
|
(61,137 |
) |
— |
|
(61,137 |
) |
(81,306 |
) |
— |
|
(81,306 |
) | ||||||
|
Accounts receivable, gross |
|
132,698 |
|
27,385 |
|
160,083 |
|
164,617 |
|
25,002 |
|
189,619 |
| ||||||
|
Allowance for doubtful accounts |
|
(10,575 |
) |
(4,946 |
) |
(15,521 |
) |
(13,371 |
) |
(1,656 |
) |
(15,027 |
) | ||||||
|
Accounts receivable, net |
|
$ |
122,123 |
|
$ |
22,439 |
|
$ |
144,562 |
|
$ |
151,246 |
|
$ |
23,346 |
|
$ |
174,592 |
|
Approximately 48.3% and 49.6% of accounts receivable, before allowances, is due from the Federal Government (Medicare, Medicaid and Veterans Administration) at December 31, 2016 and 2015, respectively.
The following tables represent accounts receivable, before allowances, by major payor classification and by aging categories reduced by the allowance for disallowed revenue and allowance for doubtful accounts to accounts receivable, net as of December 31, 2016 and 2015, respectively:
December 31, 2016
|
(in thousands) |
|
0-60 |
|
61-120 |
|
121-180 |
|
Over 180 |
|
Total |
| |||||
|
Patient Care |
|
|
|
|
|
|
|
|
|
|
| |||||
|
Commercial insurance |
|
$ |
48,568 |
|
$ |
11,677 |
|
$ |
6,050 |
|
$ |
17,453 |
|
$ |
83,748 |
|
|
Private pay |
|
897 |
|
547 |
|
441 |
|
1,034 |
|
2,919 |
| |||||
|
Medicaid |
|
13,937 |
|
3,554 |
|
2,110 |
|
5,415 |
|
25,016 |
| |||||
|
VA |
|
3,638 |
|
875 |
|
395 |
|
721 |
|
5,629 |
| |||||
|
Non-Medicare |
|
67,040 |
|
16,653 |
|
8,996 |
|
24,623 |
|
117,312 |
| |||||
|
|
|
|
|
|
|
|
|
|
|
|
| |||||
|
Medicare |
|
32,980 |
|
4,813 |
|
3,055 |
|
35,675 |
|
76,523 |
| |||||
|
|
|
|
|
|
|
|
|
|
|
|
| |||||
|
Products & Services |
|
16,126 |
|
6,690 |
|
3,031 |
|
1,538 |
|
27,385 |
| |||||
|
Accounts receivable, before allowances |
|
116,146 |
|
28,156 |
|
15,082 |
|
61,836 |
|
221,220 |
| |||||
|
Allowance for disallowed revenue |
|
|
|
|
|
|
|
|
|
(61,137 |
) | |||||
|
Allowance for doubtful accounts |
|
|
|
|
|
|
|
|
|
(15,521 |
) | |||||
|
Accounts receivable, net |
|
|
|
|
|
|
|
|
|
$ |
144,562 |
| ||||
December 31, 2015
|
(in thousands) |
|
0-60 |
|
61-120 |
|
121-180 |
|
Over 180 |
|
Total |
| |||||
|
Patient Care |
|
|
|
|
|
|
|
|
|
|
| |||||
|
Commercial insurance |
|
$ |
55,173 |
|
$ |
14,744 |
|
$ |
7,663 |
|
$ |
28,492 |
|
$ |
106,072 |
|
|
Private pay |
|
1,193 |
|
715 |
|
641 |
|
2,718 |
|
5,267 |
| |||||
|
Medicaid |
|
14,714 |
|
4,534 |
|
2,309 |
|
7,510 |
|
29,067 |
| |||||
|
VA |
|
4,347 |
|
1,077 |
|
589 |
|
2,022 |
|
8,035 |
| |||||
|
Non-Medicare |
|
75,427 |
|
21,070 |
|
11,202 |
|
40,742 |
|
148,441 |
| |||||
|
|
|
|
|
|
|
|
|
|
|
|
| |||||
|
Medicare |
|
39,423 |
|
8,765 |
|
5,285 |
|
44,009 |
|
97,482 |
| |||||
|
|
|
|
|
|
|
|
|
|
|
|
| |||||
|
Products & Services |
|
15,343 |
|
6,434 |
|
2,193 |
|
1,032 |
|
25,002 |
| |||||
|
Accounts receivable, before allowances |
|
130,193 |
|
36,269 |
|
18,680 |
|
85,783 |
|
270,925 |
| |||||
|
Allowance for disallowed revenue |
|
|
|
|
|
|
|
|
|
(81,306 |
) | |||||
|
Allowance for doubtful accounts |
|
|
|
|
|
|
|
|
|
(15,027 |
) | |||||
|
Accounts receivable, net |
|
|
|
|
|
|
|
|
|
$ |
174,592 |
| ||||
The following table summarizes activities by year for the allowance for disallowed revenue and the allowance for doubtful accounts:
|
(in thousands) |
|
Allowance for |
|
Allowance for |
| ||
|
|
|
|
|
|
| ||
|
Balance at December 31, 2013 |
|
$ |
52,277 |
|
$ |
6,472 |
|
|
Additions (1) |
|
95,464 |
|
14,241 |
| ||
|
Reductions |
|
(60,549 |
) |
(10,769 |
) | ||
|
Balance at December 31, 2014 |
|
87,192 |
|
9,944 |
| ||
|
Additions (1) |
|
60,076 |
|
14,515 |
| ||
|
Reductions |
|
(65,962 |
) |
(9,432 |
) | ||
|
Balance at December 31, 2015 |
|
81,306 |
|
15,027 |
| ||
|
Additions (1) |
|
48,961 |
|
13,727 |
| ||
|
Reductions |
|
(69,130 |
) |
(13,233 |
) | ||
|
Balance at December 31, 2016 |
|
$ |
61,137 |
|
$ |
15,521 |
|
(1)The accounts receivables associated with the Dosteon businesses, which are classified as discontinued operations as of each respective date of the consolidated financial statements, were not a part of the disposal transactions. Therefore the associated allowances, additions, and reductions are included in the above table. Dosteon’s bad debt expense included in “Income (loss) from discontinued operations, net of income taxes” were $0 million in 2016, $1.7 million in 2015, and $2.6 million in 2014. Dosteon’s disallowed revenue included in “Income (loss) from discontinued operations, net of income taxes” were $0 million in 2016, $(0.2) million in 2015, and $14.0 million in 2014.
NOTE E — INVENTORIES
Our inventories are comprised of the following:
|
|
|
As of December 31, |
| ||||
|
(in thousands) |
|
2016 |
|
2015 |
| ||
|
Raw materials |
|
$ |
21,277 |
|
$ |
22,134 |
|
|
Work in process |
|
9,009 |
|
8,914 |
| ||
|
Finished goods |
|
37,939 |
|
37,430 |
| ||
|
Total inventories |
|
$ |
68,225 |
|
$ |
68,478 |
|
NOTE F — PROPERTY PLANT AND EQUIPMENT, NET
Property, plant and equipment, net were comprised of the following:
|
|
|
December 31, |
| ||||
|
(in thousands) |
|
2016 |
|
2015 |
| ||
|
Land |
|
$ |
704 |
|
$ |
704 |
|
|
Buildings |
|
28,160 |
|
30,689 |
| ||
|
Furniture and fixtures |
|
12,312 |
|
12,057 |
| ||
|
Machinery and equipment |
|
26,173 |
|
25,678 |
| ||
|
Equipment leased to third parties under operating leases |
|
32,669 |
|
38,712 |
| ||
|
Leasehold improvements |
|
95,376 |
|
86,733 |
| ||
|
Computers and software |
|
87,147 |
|
85,779 |
| ||
|
Total property, plant, and equipment, gross |
|
282,541 |
|
280,352 |
| ||
|
Less: Accumulated depreciation |
|
(182,074 |
) |
(167,078 |
) | ||
|
Total property, plant, and equipment, net |
|
$ |
100,467 |
|
$ |
113,274 |
|
Total depreciation expense was approximately $31.0 million, $32.5 million, and $32.8 million for the years ended December 31, 2016, 2015 and 2014, respectively.
Included within Buildings was $23.8 million and $26.4 million recorded as an asset for certain build-to-suit leases as of December 31, 2016 and 2015, respectively. Accumulated depreciation on these assets was $7.7 million and $7.2 million as of December 31, 2016 and 2015, respectively.
The following table summarizes our investment in equipment leased to third parties under operating leases:
|
|
|
December 31, |
| ||||
|
(in thousands) |
|
2016 |
|
2015 |
| ||
|
Program equipment |
|
$ |
32,669 |
|
$ |
38,712 |
|
|
Less: Accumulated depreciation |
|
(22,850 |
) |
(24,428 |
) | ||
|
Net book value |
|
$ |
9,819 |
|
$ |
14,284 |
|
NOTE G — ACQUISITIONS
In the first quarter of 2015, we acquired three O&P businesses operating a total of 15 patient care clinics located in three states. The aggregate purchase price for these businesses was $15.3 million, including $10.2 million in cash, $4.7 million in Seller Notes and $0.4 million of working capital adjustments and other.
The assets acquired and liabilities assumed for all acquisitions were recorded at their estimated fair values at the dates of the acquisitions and the results of their operations are included in our consolidated financial statements from their effective dates. The excess of purchase price over the estimated fair values of assets acquired and liabilities assumed was recorded as goodwill. The value of goodwill from acquisitions can be attributed to a number of business factors including, but not limited to, synergies associated with combining the acquired businesses with our existing business. We have made an election to treat the majority of these acquisitions as asset purchases for income tax purposes resulting in approximately $8.2 million of acquired goodwill being deductible for income tax purposes for acquisitions completed in 2015.
Acquisition-related expenses for the year ended December 31, 2015 which are included in “General and administrative expenses” in our consolidated statements of operations and comprehensive (loss) income are not significant.
We made no acquisitions in 2016.
In 2014, we acquired twelve O&P businesses and one distribution business operating a total of 37 patient care clinics and one distribution center located in 11 states. The aggregate purchase price for these businesses was $52.7 million, including $38.1 million in net cash, $14.0 million of Seller Notes and $0.6 million of working capital adjustments and other.
The following table summarizes for 2015 acquisitions, the components of the aggregated purchase price the assets acquired and liabilities assumed in the above transactions and recognized at their respective acquisition dates at estimated fair
|
|
|
Year Ended |
| |
|
|
|
December 31, |
| |
|
(in thousands) |
|
2015 |
| |
|
|
|
|
| |
|
Net cash |
|
$ |
10,215 |
|
|
Issuance of seller notes |
|
4,662 |
| |
|
Other working capital adjustments |
|
376 |
| |
|
Aggregate purchase price |
|
15,253 |
| |
|
|
|
|
| |
|
Net accounts receivable |
|
1,045 |
| |
|
Inventories |
|
481 |
| |
|
Intangible assets, excluding goodwill |
|
5,455 |
| |
|
Other assets |
|
112 |
| |
|
Liabilities assumed |
|
(15 |
) | |
|
Net assets acquired |
|
7,078 |
| |
|
Goodwill |
|
$ |
8,175 |
|
NOTE H — GOODWILL AND OTHER INTANGIBLE ASSETS
Goodwill Impairment Testing
Under the provisions of ASC 350-10, Intangibles-Goodwill and Other, goodwill is not amortized. Rather, an entity’s goodwill is subject to periodic impairment testing. ASC 350 requires that an entity assign its goodwill to reporting units and test each reporting unit’s goodwill for impairment at least on an annual basis and between annual tests if an event occurs or circumstances change that would more likely than not reduce the fair value of a reporting unit below its carrying amount.
Accordingly, we perform our goodwill test annually as of October 1 and between annual tests whenever we identify certain triggering events or circumstances that would more likely than not reduce the fair value of any of our reporting units below its respective carrying value.
Step One
The first step of the goodwill impairment test compares a reporting unit’s fair value to its carrying amount to identify any potential impairment.
In performing step one, we apply judgment in determining the fair value of our reporting units for purposes of performing the goodwill impairment test. We rely on widely accepted valuation techniques, including discounted cash flow and market multiple analyses approaches, which capture both the future income potential of the reporting unit and the market behaviors and actions of market participants in the industry that includes the reporting unit. These types of analyses require us to make assumptions and estimates regarding future cash flows, industry-specific economic factors and the profitability of future business strategies. The discounted cash flow approach uses a projection of estimated operating results and cash flows that are discounted using a weighted average cost of capital. Under the discounted cash flow approach, the projection uses management’s best estimates of the amount and timing of expected future cash flows impacted by economic and market conditions over the projected period for each reporting unit. Significant estimates and assumptions include terminal value growth rates, changes in working capital requirements and weighted average cost of capital. The market multiple analysis estimates fair value by applying revenue and earnings multiples to the reporting unit’s operating results. The multiples are derived from comparable publicly traded companies with similar operating and investment characteristics to the reporting units.
We evaluate the reasonableness of the estimated fair value of our reporting units by reconciling the aggregate fair value of all three of our reporting units to our total market capitalization as of our impairment testing date, taking into account an appropriate control premium. The determination of a control premium requires the use of judgment and is based upon control premiums observed in comparable market transactions.
If the estimated fair value of a reporting unit exceeds its carrying amount, goodwill of the reporting unit is not considered impaired and the second step of the goodwill impairment test is not necessary. If the carrying amount of a reporting unit is positive and exceeds the reporting unit’s fair value, the second step of the impairment test must be completed to measure the amount of the reporting unit’s goodwill impairment loss, if any.
Step Two
The second step of the goodwill impairment test requires an assignment of the reporting unit’s fair value to the reporting unit’s assets and liabilities, including any unrecognized intangible assets, using the acquisition method accounting guidance in ASC 805, to determine the implied fair value of the reporting unit’s goodwill. The difference between the reporting unit’s fair value and the fair values assigned to the reporting unit’s individual assets and liabilities, is the implied fair value of the reporting unit’s goodwill. The implied fair value of the reporting unit’s goodwill is then compared with the carrying amount of the reporting unit’s goodwill to determine the goodwill impairment loss to be recognized, if any. An impairment charge is recognized for the excess of the carrying value of goodwill over its implied fair value.
The changes in the carrying value of goodwill for the years ended December 31, 2016 and 2015 are as follows:
|
|
|
Patient Care |
|
Products & Services |
|
|
| |||||||||
|
(in thousands) |
|
Gross |
|
Accumulated |
|
Gross |
|
Accumulated |
|
Total |
| |||||
|
Balance at December 31, 2014 |
|
$ |
616,572 |
|
$ |
(45,808 |
) |
$ |
139,289 |
|
$ |
— |
|
$ |
710,053 |
|
|
Additions due to acquisitions |
|
8,175 |
|
— |
|
— |
|
— |
|
8,175 |
| |||||
|
Adjustments to pre-2015 acquisitions |
|
264 |
|
— |
|
10 |
|
— |
|
274 |
| |||||
|
Goodwill impairment |
|
— |
|
(382,860 |
) |
— |
|
— |
|
(382,860 |
) | |||||
|
Balance at December 31, 2015 |
|
625,011 |
|
(428,668 |
) |
139,299 |
|
— |
|
335,642 |
| |||||
|
Goodwill impairment |
|
— |
|
— |
|
— |
|
(85,964 |
) |
(85,964 |
) | |||||
|
Balance at December 31, 2016 |
|
$ |
625,011 |
|
$ |
(428,668 |
) |
$ |
139,299 |
|
$ |
(85,964 |
) |
$ |
249,678 |
|
2016 Goodwill
As of October 1, 2016, we tested each of our three reporting units as part of our annual goodwill impairment test. We concluded that the carrying amounts of the Therapeutic and Distribution reporting units within our Products & Services segment exceeded their respective estimated fair values. The second step of the test was then performed to measure the impairment loss, resulting in non-cash goodwill impairment charges of $64.9 million for our Therapeutic reporting unit and $21.1 million for our Distribution reporting unit which is included in “Impairment of intangible assets” in the consolidated statements of operations and comprehensive (loss) income. The fair value of our Patient Care reporting unit exceeded its carrying amount.
These goodwill impairment charges had no impact on our cash flow or compliance with debt covenants for 2016.
2015 Goodwill
In the fourth quarter of 2015, it became likely that our 2014 financial statements would not be filed by March 19, 2016, our extended due date granted to us by the NYSE. Upon informing the NYSE of a further delay, we were delisted in February 2016. In addition to the decrease in market value due to the delisting, we also anticipated a significant increase in the time and cost for us to recover from these adverse events, and considered this to be a triggering event. We tested each of our three reporting units as of December 31, 2015. We concluded that the carrying amount of the Patient Care reporting unit exceeded its estimated fair value. The second step of the test was then performed to measure the impairment loss, resulting in a non-cash goodwill impairment charge for our Patient Care reporting unit of $382.9 million as of December 31, 2015, which is included in “Impairment of intangible assets” in the consolidated statements of operations and comprehensive (loss) income. The fair value of our Distribution and Therapeutic reporting units exceeded their respective carrying amounts.
This goodwill impairment charge had no impact on our cash flow or compliance with debt covenants for 2015.
During the third quarter of 2015, we noted a significant decline in our stock price and market capitalization coupled with changes in our earnings expectations that were identified during our 2016 budget process which we considered to be a triggering event. We tested each of our three reporting units as of September 30, 2015. The fair value of each of our three reporting units exceeded their respective carrying amounts.
2014 Goodwill
In connection with the restatement of our previously issued consolidated financial statements, we considered the significant impact of the restatement adjustments to be a triggering event. We tested each of our three reporting units as of December 31, 2014, and determined that the fair value of each reporting unit exceeded its respective carrying amount.
In the fourth quarter of 2014, our Patient Care reporting unit’s Dosteon businesses met assets held for sale criteria and the requirements to be classified as a discontinued operation. Accordingly, we allocated $8.4 million of the Patient Care reporting unit goodwill to the businesses to be sold based upon the relative fair value of the businesses to be sold to the estimated fair value of the reporting unit.
As of October 1, 2014, we tested each of our three reporting units as part of our annual goodwill impairment test, and determined that the fair value of each reporting unit exceeded its respective carrying amount.
Intangible Asset Impairment Testing
Under the provisions of ASC 360-10, Property, plant, and equipment, an intangible asset that has a finite life should be amortized over its estimated useful life and should be tested for recoverability by comparing the net carrying value of the asset or asset group to the undiscounted net cash flows to be generated from the use and eventual disposition of that asset or asset group when events or changes in circumstances indicate that its carrying amount may not be recoverable. If the carrying amount of a definite-lived asset or asset group is not recoverable, the fair value of the asset or asset group is measured and if the carrying amount exceeds the fair value, an impairment loss is recognized.
Under the provisions of ASC 350, Intangibles-goodwill and other, an indefinite-lived intangible asset is not amortized but should be tested for impairment annually and between annual tests if events or changes in circumstances indicate that it is more likely than not that the asset is impaired. The indefinite-lived intangible asset impairment standard allows an entity first to assess qualitative factors to determine if a quantitative impairment test is necessary. Further testing is only required if the entity determines, based on the qualitative assessment, that it is more likely than not that an indefinite-lived intangible asset’s fair value is less than its carrying amount.
The fair value of acquired customer intangibles is estimated using an excess earnings model. Key assumptions utilized in the valuation model include pro-forma projected cash flows adjusted for market-participant assumptions, forecasted customer retention curve, and discount rate. Customer intangibles are amortized, using the straight-line method over an estimated useful life of four to ten years. The fair value of non-compete agreements are estimated using a discounted cash flow model. The related intangible assets are amortized, using the straight-line method, over their term which ranges from two to five years. Other definite-lived intangible assets are recorded at cost and are amortized, using the straight-line method, over their estimated useful lives of up to seventeen years. The fair value associated with trade names is estimated using the relief-from-royalty method with the primary assumptions being the royalty rate and expected revenues associated with the trade names. These assets, some of which have indefinite lives, are primarily included in the Products & Services segment. Indefinite lived trade name intangible assets are assessed for impairment in the fourth quarter of each year, or more frequently if events or changes in circumstances indicate that the asset might be impaired. Trade name intangible assets with definite lives are amortized over their estimated useful lives of one to ten years.
The balances related to intangible assets as of December 31, 2016 and 2015 are as follows:
|
|
|
December 31, 2016 |
| ||||||||||
|
(in thousands) |
|
Gross Carrying |
|
Accumulated |
|
Accumulated |
|
Net Carrying |
| ||||
|
Customer Lists |
|
$ |
43,380 |
|
$ |
(23,051 |
) |
$ |
— |
|
$ |
20,329 |
|
|
Trade Name |
|
462 |
|
(248 |
) |
— |
|
214 |
| ||||
|
Patents and Other Intangibles |
|
15,358 |
|
(8,660 |
) |
— |
|
6,698 |
| ||||
|
Definite-lived intangible assets |
|
59,200 |
|
(31,959 |
) |
— |
|
27,241 |
| ||||
|
Indefinite life - Trade Name |
|
9,070 |
|
— |
|
(3,370 |
) |
5,700 |
| ||||
|
Total other intangible assets |
|
$ |
68,270 |
|
$ |
(31,959 |
) |
$ |
(3,370 |
) |
$ |
32,941 |
|
|
|
|
December 31, 2015 |
| ||||||||||
|
(in thousands) |
|
Gross Carrying |
|
Accumulated |
|
Accumulated |
|
Net Carrying |
| ||||
|
Customer Lists |
|
$ |
51,031 |
|
$ |
(18,422 |
) |
$ |
— |
|
$ |
32,609 |
|
|
Trade Name |
|
1,103 |
|
(693 |
) |
— |
|
410 |
| ||||
|
Patents and Other Intangibles |
|
15,422 |
|
(7,213 |
) |
— |
|
8,209 |
| ||||
|
Definite-lived intangible assets |
|
67,556 |
|
(26,328 |
) |
— |
|
41,228 |
| ||||
|
Indefinite life - Trade Name |
|
9,070 |
|
— |
|
(3,170 |
) |
5,900 |
| ||||
|
Total other intangible assets |
|
$ |
76,626 |
|
$ |
(26,328 |
) |
$ |
(3,170 |
) |
$ |
47,128 |
|
2016 Intangible Assets
As of October 1, 2016, we tested our Therapeutic reporting unit’s indefinite lived tradename as part of our annual impairment test which compared the estimated fair value with the carrying amount of the tradename. The fair value of the intangible asset was estimated using an income approach, specifically the relief-from-royalty method. The cash flows used contain management’s best estimates using appropriate assumptions and projections as of the testing date. The royalty rate was estimated using rates applicable to similar business acquisition transactions. The fair value of the tradename was determined to be less than the carrying amount, resulting in a $0.2 million impairment charge recorded in the fourth quarter of 2016. This charge is included in “Impairment of intangible assets” in the consolidated statements of operations and comprehensive (loss) income.
This intangible asset impairment charge had no impact on our cash flow or compliance with debt covenants for 2016.
2015 Intangible Assets
In connection with our goodwill impairment testing as of September 30, 2015 and December 31, 2015 due to the triggering events discussed above, we tested our Therapeutic reporting unit’s indefinite-lived tradename intangible asset for impairment as of those dates. The fair value of the tradename was determined to be less than the carrying amount at both dates, resulting in a $0.8 million impairment charge recorded in the third quarter of 2015 and a $2.1 million impairment charge in the fourth quarter of 2015. These charges are included in “Impairment of intangible assets” in the consolidated statements of operations and comprehensive (loss) income.
These intangible asset impairment charges had no impact on our cash flow or compliance with debt covenants for 2015.
In conjunction with our Goodwill impairment testing at December 31, 2015, we reevaluated the estimated useful life of our customer list intangibles. In the fourth quarter of 2015, the estimated useful life of our customer list intangibles was reduced from 10 years to four years in our Patient Care segment and from 14 years to 10 years in our Products & Services segment. This change in the estimated useful lives increased amortization for the years ended December 31, 2015 and 2016 by approximately $6.0 million and $7.0 million, respectively.
Total intangible amortization expense was approximately $13.9 million, $13.8 million, and $7.4 million for the years ended December 31, 2016, 2015 and 2014, respectively, and reflects the impact of our change in the estimated useful lives of our customer list intangible assets beginning in the fourth quarter of 2015.
Estimated aggregate amortization expense for definite lived intangible assets for each of the next five years ended December 31 and thereafter is as follows:
|
(in thousands) |
|
December 31, |
| |
|
2017 |
|
$ |
9,587 |
|
|
2018 |
|
6,749 |
| |
|
2019 |
|
3,763 |
| |
|
2020 |
|
3,513 |
| |
|
2021 |
|
927 |
| |
|
Thereafter |
|
2,702 |
| |
|
Total |
|
$ |
27,241 |
|
As described, we apply judgment in the selection of key assumptions used in both steps of the goodwill impairment test and as part of our evaluation of intangible assets tested annually and at interim testing dates as necessary. If these assumptions differ from actual, we could incur additional impairment charges and those charges could be material.
NOTE I — OTHER CURRENT ASSETS AND OTHER ASSETS
Other current assets consists of the following:
|
|
|
As of December 31, |
| ||||
|
(in thousands) |
|
2016 |
|
2015 |
| ||
|
|
|
|
|
|
| ||
|
Non-trade receivables |
|
$ |
6,223 |
|
$ |
9,961 |
|
|
Prepaid rent |
|
4,070 |
|
73 |
| ||
|
Prepaid maintenance |
|
3,914 |
|
3,567 |
| ||
|
Restricted cash |
|
2,255 |
|
3,870 |
| ||
|
Prepaid other |
|
1,542 |
|
1,247 |
| ||
|
Prepaid education and training |
|
398 |
|
1,186 |
| ||
|
Prepaid insurance |
|
447 |
|
344 |
| ||
|
Other |
|
288 |
|
822 |
| ||
|
Total other current assets |
|
$ |
19,137 |
|
$ |
21,070 |
|
Non-trade receivables primarily relate to vendor rebate receivables, tenant improvement allowance receivables, and other non-trade receivables. Prepaid rent relates to amounts of future rent expense paid in advance of the rental period. Prepaid maintenance primarily relates to prepaid software and hardware maintenance and software license fees. Restricted cash relates to funds held by our captive insurance subsidiary and whose use for general purposes is restricted by Nevada state insurance regulations. Prepaid other includes the employer’s portion of health savings accounts, board member fees and tax and accounting services. Prepaid education and training our annual Education Fair event held in the first quarter of each fiscal year. Prepaid insurance are for product and general liability insurance. Other includes prepaid expenses for telecommunication, broker fees and other miscellaneous prepaid expenses.
Other assets consists of the following:
|
|
|
As of December 31, |
| ||||
|
(in thousands) |
|
2016 |
|
2015 |
| ||
|
|
|
|
|
|
| ||
|
Cash surrender value of COLI |
|
$ |
17,573 |
|
$ |
14,386 |
|
|
Non-trade receivables |
|
3,401 |
|
4,574 |
| ||
|
Deposits |
|
2,038 |
|
2,196 |
| ||
|
Other |
|
2,502 |
|
2 |
| ||
|
Total other assets |
|
$ |
25,514 |
|
$ |
21,158 |
|
Company owned life insurance (“COLI”) policies represents the combined cash surrender values of both the policies associated with our Defined Benefit Supplemental Executive Retirement Plan (“SERP”) and our Defined Contribution Supplemental Executive Retirement Plan (“DC SERP”). See Note K - “Employee Benefits” for additional information. Non-trade receivables primarily relate to estimated receivables due from our various business insurance policies. Deposits primarily relate to security deposits made in connection with property leases. Other relates to cash collateral posted for surety bonds.
NOTE J — INCOME TAXES
Components of (benefit) provision for income taxes are as follows:
|
|
|
Year Ended December 31, |
| |||||||
|
(in thousands) |
|
2016 |
|
2015 |
|
2014 |
| |||
|
Current: |
|
|
|
|
|
|
| |||
|
Federal |
|
$ |
(18,812 |
) |
$ |
(21,721 |
) |
$ |
36,147 |
|
|
State |
|
694 |
|
1,720 |
|
5,479 |
| |||
|
Total Current |
|
(18,118 |
) |
(20,001 |
) |
41,626 |
| |||
|
Deferred: |
|
|
|
|
|
|
| |||
|
Federal |
|
3,008 |
|
(41,372 |
) |
(39,712 |
) | |||
|
State |
|
(800 |
) |
(6,241 |
) |
109 |
| |||
|
Total Deferred |
|
2,208 |
|
(47,613 |
) |
(39,603 |
) | |||
|
(Benefit) provision for income taxes from continuing operations |
|
$ |
(15,910 |
) |
$ |
(67,614 |
) |
$ |
2,023 |
|
|
|
|
|
|
|
|
|
| |||
|
Income tax provision (benefit) attributable to discontinued operations |
|
$ |
490 |
|
$ |
(3,249 |
) |
$ |
(8,914 |
) |
A reconciliation of the federal statutory tax rate to our effective tax rate applicable to continuing operations is as follows:
|
|
|
Year Ended December 31, |
| ||||
|
|
|
2016 |
|
2015 |
|
2014 |
|
|
Federal statutory tax rate- (benefit) provision |
|
(35.0 |
)% |
(35.0 |
)% |
(35.0 |
)% |
|
State and local income taxes |
|
(0.4 |
)% |
(1.6 |
)% |
(53.2 |
)% |
|
Change in valuation allowance |
|
— |
% |
0.3 |
% |
455.6 |
% |
|
Domestic manufacturing deduction |
|
— |
% |
— |
% |
(206.9 |
)% |
|
Research and development credit |
|
— |
% |
— |
% |
(14.3 |
)% |
|
Change in uncertain tax positions |
|
(0.9 |
)% |
(0.2 |
)% |
54.6 |
% |
|
Goodwill impairment |
|
22.3 |
% |
18.4 |
% |
— |
% |
|
Other |
|
1.1 |
% |
0.6 |
% |
2.1 |
% |
|
Effective tax rate applicable to continuing operations |
|
(12.9 |
)% |
(17.5 |
)% |
202.9 |
% |
The significant components of the net deferred income tax asset are as follows:
|
|
|
As of December 31, |
| ||||
|
(in thousands) |
|
2016 |
|
2015 |
| ||
|
Deferred tax liabilities: |
|
|
|
|
| ||
|
Goodwill amortization |
|
$ |
4,962 |
|
$ |
4,405 |
|
|
Intangible amortization |
|
3,580 |
|
8,078 |
| ||
|
Prepaid expenses |
|
1,581 |
|
1,638 |
| ||
|
Sec. 481(a) adjustments |
|
172 |
|
360 |
| ||
|
Other |
|
— |
|
32 |
| ||
|
|
|
10,295 |
|
14,513 |
| ||
|
Deferred tax assets: |
|
|
|
|
| ||
|
Deferred benefit plan compensation |
|
8,816 |
|
8,807 |
| ||
|
Provision for doubtful accounts and disallowed revenues |
|
30,203 |
|
37,927 |
| ||
|
Property, plant and equipment |
|
14,596 |
|
9,867 |
| ||
|
Net operating loss carryforwards |
|
11,157 |
|
9,933 |
| ||
|
Accrued expenses |
|
30,307 |
|
35,255 |
| ||
|
Inventory reserves |
|
3,318 |
|
5,126 |
| ||
|
Restricted stock |
|
4,286 |
|
4,417 |
| ||
|
Capital leases |
|
439 |
|
557 |
| ||
|
Deferred rent |
|
2,117 |
|
1,994 |
| ||
|
Refund liabilities |
|
3,456 |
|
3,438 |
| ||
|
Interest on seller notes |
|
1,408 |
|
1,190 |
| ||
|
Other |
|
1,310 |
|
1,109 |
| ||
|
|
|
111,413 |
|
119,620 |
| ||
|
Valuation allowance |
|
(6,895 |
) |
(6,853 |
) | ||
|
|
|
104,518 |
|
112,767 |
| ||
|
Net deferred tax asset |
|
$ |
94,223 |
|
$ |
98,254 |
|
We have $8.9 million and $8.9 million of U.S. federal and $185.3 million and $156.1 million of state net operating loss carryforwards available at December 31, 2016 and 2015, respectively. These carryforwards will be used to offset future income but may be limited by the change in ownership rules in Section 382 of the Internal Revenue Code. These net operating loss carryforwards will expire in varying amounts between 2017 and 2036. U.S. Federal net operating losses generated in 2016 and 2015 were carried back to tax years 2014 and 2013 and, therefore, were not carried forward.
As of December 31, 2016, we had approximately $94.2 million in net deferred tax assets (“DTAs”). These DTAs can be used to offset taxable income in future periods and reduce our income taxes payable in those future periods. At this time, we consider it more likely than not that we will have sufficient taxable income in the future that will allow us to realize these DTAs. However, it is possible that some or all of these DTAs may not be realized unless we are able to generate sufficient taxable income from our operations. If we do not generate sufficient taxable income in the future a substantial valuation allowance to reduce our DTAs may be required, which could materially increase our expenses in the period the allowance is recognized and materially adversely affect our results of operations and statement of financial condition. As of December 31, 2016, we had a valuation allowance of approximately $6.9 million, related primarily to certain state loss carryforwards, which are expected to expire before utilization. We monitor our cumulative loss position and other evidence each quarter to determine the appropriateness of our valuation allowance. Although we believe our estimates are reasonable, the ultimate determination of the appropriate amount of valuation allowance involves significant judgment.
The following schedule presents the activity in the valuation allowance:
|
(in thousands) |
Year |
|
|
Balance at |
|
Acquisitions |
|
Provision |
|
Released |
|
Balance at |
| |||||
|
|
|
|
|
|
|
|
|
|
|
|
|
|
| |||||
|
|
2016 |
|
|
$ |
6,853 |
|
$ |
— |
|
$ |
377 |
|
$ |
335 |
|
$ |
6,895 |
|
|
|
2015 |
|
|
$ |
5,692 |
|
$ |
— |
|
$ |
1,195 |
|
$ |
34 |
|
$ |
6,853 |
|
|
|
2014 |
|
|
$ |
1,259 |
|
$ |
— |
|
$ |
5,365 |
|
$ |
932 |
|
$ |
5,692 |
|
A reconciliation of our liability for unrecognized tax benefits is as follows:
|
(in thousands) |
|
2016 |
|
2015 |
|
2014 |
| |||
|
|
|
|
|
|
|
|
| |||
|
Unrecognized tax benefits, at beginning of the year |
|
$ |
7,567 |
|
$ |
7,605 |
|
$ |
7,475 |
|
|
Additions for tax positions related to the current year |
|
47 |
|
279 |
|
623 |
| |||
|
Additions for tax positions of prior years |
|
— |
|
1,415 |
|
— |
| |||
|
Decrease related to prior year positions |
|
— |
|
(1,472 |
) |
(476 |
) | |||
|
Decrease for lapse of applicable statute of limitations |
|
(2,950 |
) |
(260 |
) |
(17 |
) | |||
|
Unrecognized tax benefits, at end of the year |
|
$ |
4,664 |
|
$ |
7,567 |
|
$ |
7,605 |
|
As of December 31, 2016, the total amount of unrecognized tax benefits that, if recognized, would affect the effective tax rate is approximately $2.9 million. We expect the amount of unrecognized tax benefits will change by approximately $3.8 million within the next twelve months due primarily to the lapse of statute limitations. We recognize accrued interest and penalties related to unrecognized tax benefits as a component of income tax expense. As of December 31, 2016, 2015 and 2014, the amount of accrued interest and penalties was approximately $0.4 million, $0.5 million and $0.5 million, respectively.
We are subject to income tax in the U.S. federal, state and local jurisdictions. With few exceptions, we are no longer subject to U.S. Federal income tax examinations for years prior to 2013, as the statute of limitations has lapsed for 2012 and all preceding years. However, due to acquired net operating losses, tax authorities have the ability to adjust those net operating losses related to closed years. We are currently under income tax audits in various U.S. jurisdictions for the originally filed tax returns for tax years ended 2013-2015. Certain of these returns will be amended, and we believe we have adequate accruals for additional taxes and related interest expense which could result. We believe the ultimate resolution of income tax examinations will not have a material adverse effect on our consolidated financial position, results of operations, or liquidity.
On December 22, 2017, President Trump signed the Tax Cuts and Jobs Act (“Tax Reform”) into legislation. Under ASC 740, the effects of changes in tax rates and laws are recognized in the period in which the new legislation is enacted. In the case of US federal income taxes, the enactment date is the date the bill becomes law (i.e., upon presidential signature). With respect to this legislation, we expect a one-time increase in tax expense of $25 million to $35 million, due to a re-measurement of deferred tax assets and liabilities resulting from the decrease in the corporate Federal income tax rate from 35% to 21%. We are in the process of analyzing certain other provisions of this legislation, including the repeal of IRC Section 199, which may result in an overall increase to our effective tax rate. Consistent with the guidance under ASC 740, we will record any impacts from enactment of the Tax Cuts and Jobs Act in the fourth quarter of 2017 subject to Staff Accounting Bulletin (“SAB”) 118 which provides for a measurement period to complete the accounting for certain elements of the tax reform.
NOTE K — EMPLOYEE BENEFITS
Savings Plan
We maintain a 401(k) Savings and Retirement plan that covers all of our employees. Under the plan, employees may defer a portion of their compensation up to the levels permitted by the Internal Revenue Service. We recorded matching contributions of approximately $6.7 million, $6.6 million and $6.2 million under this plan during 2016, 2015 and 2014,
respectively, which were included within “Personnel costs” and “General and administrative expenses” in our consolidated statements of operations and comprehensive (loss) income.
Supplemental Executive Retirement Plan (“SERP”)
Effective January 2004, we implemented an unfunded noncontributory defined benefit plan (the “Plan”) for certain senior executives. The Plan, which we administer, calls for fifteen annual payments upon retirement with the payment amount based on years of service and final average salary. Benefit costs and liabilities balances are calculated based on certain assumptions including benefits earned, discount rates, interest costs, mortality rates and other factors. We engaged an independent actuary to calculate the related benefit obligation at December 31, 2016 and 2015 as well as net periodic benefit plan expense for the years ended December 31, 2016, 2015, and 2014. As of December 31, 2016 and 2015, the average remaining service period of plan participants is 12.5 and 9.6 years, respectively. We believe the assumptions used are appropriate; however, changes in assumptions or differences in actual experience may affect our benefit obligation and future expenses. Actual results that differ from the assumptions are accumulated and amortized over future periods, affecting the recorded obligation and expense in future periods.
The Plan’s net benefit cost is as follows:
|
Change in Benefit Obligation |
|
Benefit |
| |
|
(in thousands) |
|
Obligation |
| |
|
Benefit obligation at December 31, 2014 |
|
$ |
23,054 |
|
|
Service cost |
|
386 |
| |
|
Interest cost |
|
703 |
| |
|
Payments |
|
(1,853 |
) | |
|
Actuarial gain |
|
(405 |
) | |
|
Benefit obligation at December 31, 2015 |
|
21,885 |
| |
|
Service cost |
|
390 |
| |
|
Interest cost |
|
740 |
| |
|
Payments |
|
(1,847 |
) | |
|
Actuarial loss |
|
136 |
| |
|
Benefit obligation at December 31, 2016 |
|
$ |
21,304 |
|
|
|
|
|
| |
|
Unfunded status |
|
$ |
21,304 |
|
|
Unamortized net (gain) loss |
|
— |
| |
|
Net amount recognized |
|
$ |
21,304 |
|
Amounts Recognized in the Consolidated Balance Sheets:
|
|
|
As of December 31, |
| ||||
|
(in thousands) |
|
2016 |
|
2015 |
| ||
|
Current accrued expenses and other current liabilities |
|
$ |
1,913 |
|
$ |
1,847 |
|
|
Non-current other liabilities |
|
19,391 |
|
20,038 |
| ||
|
Total accrued liabilities |
|
$ |
21,304 |
|
$ |
21,885 |
|
We recorded gross actuarial (losses) gains under the Plan of approximately $(0.1) million, $0.4 million, and $(1.4) million in 2016, 2015, and 2014, respectively, in other comprehensive (loss) income. Immaterial amounts were recognized within the consolidated statement of operations from accumulated other comprehensive income during 2016, 2015, and 2014. As of December 31, 2016, we do not expect to recognize amounts from accumulated other comprehensive income as a component of net periodic benefit cost in fiscal years 2017. Gain (loss) amounts to be amortized from accumulated other comprehensive income in fiscal year 2017 is immaterial. There were no other components such as prior service costs or transition obligations relating to the Plan costs recorded within accumulated other comprehensive (loss) income during 2016, 2015 or 2014.
The following weighted average assumptions were used to determine the benefit obligation as of December 31 of each year. Net periodic benefit cost for each year was determined using the weighted average assumptions as of the prior year. We used a third party actuarial specialist to assist in determining, among other things, the discount rate for all three years presented.
Our assumed weighted average discount rate for the defined benefit plan reflects the hypothetical rate at which the projected benefit obligation could be effectively settled or paid out to participants. We determine our discount rate based on a range of factors, including a yield curve composed of rates of return on high-quality, fixed income corporate bonds
|
|
|
2016 |
|
2015 |
|
2014 |
|
2013 |
|
|
Discount rate |
|
3.54 |
% |
3.64 |
% |
3.34 |
% |
4.03 |
% |
|
Average rate of increase in compensation |
|
3.00 |
% |
3.00 |
% |
3.00 |
% |
3.00 |
% |
At December 31, 2016, the estimated accumulated benefit obligation is $21.3 million. Future payments under the Plan are as follows:
|
(in thousands) |
|
|
| |
|
2017 |
|
$ |
1,913 |
|
|
2018 |
|
1,913 |
| |
|
2019 |
|
1,913 |
| |
|
2020 |
|
1,913 |
| |
|
2021 |
|
1,913 |
| |
|
Thereafter |
|
11,739 |
| |
|
Total |
|
$ |
21,304 |
|
In connection with the SERP obligation, we maintain a COLI policy. The carrying value of the COLI is measured at its cash surrender value and is presented within “Other assets” in our consolidated balance sheets. See Note I - “Other Current Assets and Other Assets” for additional information.
Defined Contribution Supplemental Executive Retirement Plan
In 2013, we established a Defined Contribution Supplemental Executive Retirement Plan that covers certain of our senior executives. We have a corresponding investment in a company owned life insurance policy. We have not made any explicit or implicit commitments to maintain life insurance on any specific executive that would benefit the executive or his or her beneficiaries. Each participant is given a notional account to manage his or her annual distributions and allocate the funds among various investment options (e.g. mutual funds). These accounts are tracking accounts only for the purpose of calculating the participant’s benefit. The participant does not have ownership of the underlying mutual funds. When a participant initiates or changes the allocation of his or her notional account, we will generally make an allocation of our investments, to match those chosen by the participant. While the allocation of our sub accounts is generally intended to mirror the participant’s account records (i.e. the distributions and gains or losses on those funds), the employee does not have legal ownership of any funds until payout upon retirement. The underlying investments are owned by the insurance company (and we own an insurance policy).
As of December 31, 2016 and 2015, the estimated accumulated obligation benefit is $2.0 million and $1.4 million, respectively, of which $1.4 million and $0.8 million is funded and $0.6 million and $0.6 million is unfunded at December 31, 2016 and 2015, respectively.
NOTE L — STOCK-BASED COMPENSATION
On April 15, 2016, our Board of Directors approved the Hanger, Inc. 2016 Omnibus Incentive Plan (the “2016 Plan”). The 2016 Plan authorizes the issuance of (a) up to 2.3 million shares of Common Stock, plus (b) 0.4 million shares available for issuance under the 2010 Plan that had not been subject to outstanding awards as of the effective date of the 2016 Plan and (c) any shares that would have become available again for new grants under the terms of the 2010 Omnibus Plan (“2010 Plan”) if such plan were still in effect.
Upon approval of the 2016 Plan, our 2010 Plan was no longer available for future awards.
As of December 31, 2016, approximately 2.1 million shares were available for future issuance. The available shares consisted of (a) 2.3 million shares of common stock authorized for issuance under the 2016 Plan plus (b) 0.4 million shares rolled forward from the 2010 Plan plus (c) 0.3 million shares forfeited and added back to the pool less (d) 0.9 million shares issued for awards. In 2016, shares issued under equity plans are issued from authorized and unissued shares. Total unrecognized stock-based compensation cost related to unvested restricted stock unit awards is approximately $7.6 million as of December 31, 2016, and is expected to be recognized as compensation expense over approximately 2.3 years.
On May 13, 2010, our shareholders approved the 2010 Plan and prohibited future awards under the Amended and Restated 2002 Stock Incentive and Bonus Plan (the “2002 Plan”) and 2003 Non-Employee Directors’ Stock Incentive Plan (the “2003 Plan”).
For the years ended December 31, 2016, 2015 and 2014, we recognized a total of approximately $9.8 million, $11.1 million and $9.8 million, respectively, of stock-based compensation expense for the 2002, 2003, 2010 and 2016 plans. Of these amounts, approximately $0.2 million, for the year ended December 31, 2014 is associated with the Dosteon business and is included within “Loss from discontinued operations, net of income taxes.” Stock compensation expense, net of estimate forfeiture rate, relates to restricted stock units and performance-based restricted stock units.
Restricted Stock Units
The summary of restricted stock units, performance-based stock units, and weighted average grant date fair values are as follows:
|
|
|
Employee Service-Based |
|
Employee Performance- |
|
Director Awards |
| |||||||||
|
|
|
Units |
|
Weighted |
|
Units |
|
Weighted |
|
Units |
|
Weighted |
| |||
|
|
|
|
|
|
|
|
|
|
|
|
|
|
| |||
|
Nonvested at December 31, 2014 |
|
670,735 |
|
$ |
28.99 |
|
75,661 |
|
$ |
24.70 |
|
72,832 |
|
$ |
29.46 |
|
|
|
|
|
|
|
|
|
|
|
|
|
|
|
| |||
|
Granted |
|
474,108 |
|
24.48 |
|
120,178 |
|
25.95 |
|
92,155 |
|
14.46 |
| |||
|
Vested |
|
(281,587 |
) |
27.46 |
|
(49,775 |
) |
24.37 |
|
(56,797 |
) |
26.17 |
| |||
|
Forfeited |
|
(52,416 |
) |
28.73 |
|
(613 |
) |
29.66 |
|
(14,021 |
) |
19.48 |
| |||
|
|
|
|
|
|
|
|
|
|
|
|
|
|
| |||
|
Nonvested at December 31, 2015 |
|
810,840 |
|
26.90 |
|
145,451 |
|
25.83 |
|
94,169 |
|
18.25 |
| |||
|
|
|
|
|
|
|
|
|
|
|
|
|
|
| |||
|
Granted |
|
631,011 |
|
6.90 |
|
192,600 |
|
6.90 |
|
71,000 |
|
6.53 |
| |||
|
Vested |
|
(279,421 |
) |
26.64 |
|
(19,722 |
) |
23.99 |
|
(93,704 |
) |
18.16 |
| |||
|
Forfeited |
|
(95,832 |
) |
20.69 |
|
(192,600 |
) |
6.90 |
|
— |
|
— |
| |||
|
|
|
|
|
|
|
|
|
|
|
|
|
|
| |||
|
Nonvested at December 31, 2016 |
|
1,066,598 |
|
$ |
16.30 |
|
125,729 |
|
$ |
26.11 |
|
71,465 |
|
$ |
6.72 |
|
During the years ended December 31, 2016, 2015 and 2014, approximately 0.4 million, 0.4 million, and 0.4 million of restricted common stock units with an intrinsic value of $2.1 million, $9.0 million and $12.8 million, respectively, became fully vested. As of December 31, 2016, total unrecognized compensation expense related to unvested restricted stock units and unvested performance based restricted stock units for which we have concluded the performance condition was probable of achievement was approximately $11.2 million and the related weighted-average period over which it is expected to be recognized is approximately 2.3 years. The aggregate granted units have vesting dates through March 2017. The 2016, 2015 and 2014 aggregate grants had total estimated grant date fair values of $6.2 million, $16.1 million and $12.2 million, respectively.
Options
The summary of option activity and weighted average exercise prices are as follows:
|
(dollars in thousands) |
|
Director Awards |
| ||||||||
|
Weighted Average Exercise Price |
|
Shares |
|
Weighted Average |
|
Aggregate |
|
Weighted Average |
| ||
|
|
|
|
|
|
|
|
|
|
| ||
|
Outstanding at December 31, 2014 |
|
7,947 |
|
$ |
5.09 |
|
$ |
— |
|
— |
|
|
Exercised |
|
(7,947 |
) |
5.09 |
|
— |
|
— |
| ||
|
Outstanding at December 31, 2015 |
|
— |
|
$ |
— |
|
$ |
— |
|
— |
|
The intrinsic value for options exercised for year ended December 31, 2014 was approximately $0.1 million. No options were exercisable under our stock-based compensation plans at December 31, 2016 and 2015. At December 31, 2014, 7,947 shares were exercisable with a weighted average exercise price of $5.09, average remaining contractual terms of 0.4 years and aggregate intrinsic values of approximately $0.1 million. Cash received related to the exercise of options during the years ended December 31, 2014 amounted to $0.1 million. As of December 31, 2016, 2015 and 2014, there was no unrecognized compensation cost related to stock option awards.
There were no options outstanding as of December 31, 2016 and 2015.
NOTE M — LEASES
Rent expense under operating leases was approximately $48.1 million, $50.1 million, and $50.1 million, for the years ended December 31, 2016, 2015 and 2014, respectively, which was included within “Other operating costs” and “General and administrative expenses” in our consolidated statements of operations and comprehensive (loss) income. Sublease rental income is not material. The net book value of office equipment under capital leases was approximately $0.8 million and $1.1 million at December 31, 2016 and 2015, respectively. Equipment capital lease obligations are included in long-term debt as a part of “Financing leases and other” in Note N - “Long-Term Debt.”
Future minimum rental payments, by year and in the aggregate, under operating and financing obligations with terms of one year or more at December 31, 2016 are as follows:
|
(in thousands) |
|
Operating |
|
Capital |
| ||
|
|
|
|
|
|
| ||
|
2017 |
|
$ |
39,581 |
|
$ |
467 |
|
|
2018 |
|
32,507 |
|
268 |
| ||
|
2019 |
|
25,192 |
|
121 |
| ||
|
2020 |
|
17,226 |
|
39 |
| ||
|
2021 |
|
11,556 |
|
— |
| ||
|
Thereafter |
|
16,147 |
|
— |
| ||
|
Total |
|
$ |
142,209 |
|
$ |
895 |
|
Future minimum rental payments, by year and in the aggregate, under operating and financing obligations with terms of one year or more at December 31, 2015 are as follows:
|
(in thousands) |
|
Operating |
|
Capital |
| ||
|
|
|
|
|
|
| ||
|
2016 |
|
$ |
39,001 |
|
$ |
489 |
|
|
2017 |
|
32,276 |
|
411 |
| ||
|
2018 |
|
26,081 |
|
188 |
| ||
|
2019 |
|
19,486 |
|
41 |
| ||
|
2020 |
|
12,607 |
|
— |
| ||
|
Thereafter |
|
21,826 |
|
— |
| ||
|
Total |
|
$ |
151,277 |
|
$ |
1,129 |
|
NOTE N — LONG-TERM DEBT
Long-term debt as of December 31 was as follows:
|
(in thousands) |
|
2016 |
|
2015 |
| ||
|
Term loan |
|
$ |
180,000 |
|
$ |
199,688 |
|
|
Term loan B |
|
280,000 |
|
— |
| ||
|
Revolving credit facility |
|
— |
|
132,000 |
| ||
|
Senior notes due 2018 |
|
— |
|
200,000 |
| ||
|
Seller notes |
|
11,110 |
|
19,838 |
| ||
|
Financing leases and other |
|
18,245 |
|
21,134 |
| ||
|
Total debt before unamortized discount and debt issuance costs |
|
489,355 |
|
572,660 |
| ||
|
Unamortized discount |
|
(7,511 |
) |
(1,820 |
) | ||
|
Debt issuance costs, net |
|
(9,194 |
) |
(4,407 |
) | ||
|
Total debt |
|
$ |
472,650 |
|
$ |
566,433 |
|
|
Reported as: |
|
|
|
|
| ||
|
Current portion of long-term debt |
|
$ |
30,944 |
|
$ |
30,385 |
|
|
Long-term debt |
|
441,706 |
|
536,048 |
| ||
|
Total debt |
|
$ |
472,650 |
|
$ |
566,433 |
|
In accordance with ASU Nos. 2015-03 and 2015-15 debt issuance costs, net have been reclassified from other assets to a direct deduction from long-term debt as of December 31, 2015.
We apply ASC No. 470-50, Debt - Modifications and Extinguishments (ASC 470-50), which defines a debt modification. ASC 470-50 establishes that a modification be recorded as a debt discount and amortized to interest expense.
Credit Agreement - Revolving Credit Facility and Term Loan
On June 17, 2013, we entered into a five year credit agreement (as amended from time to time, the “Credit Agreement”) that provided senior secured facilities of up to $425.0 million. The Credit Agreement originally included a $200.0 million revolving credit facility and a $225.0 million term loan facility both of which mature on June 17, 2018 and were subject to a leverage-based pricing grid in which the applicable interest rate is dependent on our leverage ratio.
From January 1, 2015 through December 31, 2016, we entered into seven agreements relating to our Credit Agreement that waived certain actual and potential events of default and amended various covenants and other provisions including, among other things, raising the interest rate and reducing the amounts available pursuant to the revolving credit facility.
The Credit Agreement (giving effect to all amendments and waivers) provides for (i) a revolving credit facility with aggregate revolving commitments of $118.3 million as of December 31, 2016 (subject to the mandatory commitment reductions and usage limitations described below) that matures in June 2018, and (ii) a $225.0 million term loan facility due in quarterly principal installments that began at 0.625% of the initial $225.0 million borrowed and then escalated to 1.25% on September 30, 2014, to 1.875% on September 30, 2015, to 2.5% on September 30, 2016, and will escalate to 3.75% on September 30, 2017. A final principal installment of approximately $143.4 million is due at maturity in June 2018. From time to time, mandatory prepayments may be required as a result of the incurrence of certain types of debt, certain asset sales, or other events as defined in the Credit Agreement. No such mandatory prepayments were required during 2016 and 2015.
We previously received $34.1 million in federal income tax refunds with respect to tax year 2015 or earlier, and the effect of those previous receipts has been incorporated into the determination of our $118.3 million in aggregate revolving commitments. If we receive additional federal income tax refunds related to tax year 2015 or earlier, then 50% of our net cash proceeds in respect of those refunds will be applied as a further permanent reduction of the aggregate revolving commitments under the Credit Agreement, except that in no event shall the commitment be reduced to less than $108.0 million as a result of such refunds.
Until such time as (a) we have achieved a leverage ratio (as described below) for our then most recently ended fiscal quarter, of less than or equal to 4.00 to 1.00, and (b) we have delivered financial information and certain related materials for the fiscal periods ended March 31, 2015, June 30, 2015, September 30, 2015, December 31, 2015 and December 31, 2016, the amount that we can borrow under the Credit Agreement in the form of revolving loans, swing line loans and/or letters of credit is reduced by specified revolving usage limitation amounts depending on the fiscal quarter. The aggregate revolving credit commitment of $118.3 million is reduced by $13.9 million for periods from July 15, 2016 to September 30, 2016; $17.3 million for the three months ending December 31, 2016; $10.7 million for the three months ending March 31, 2017; $20.7 million for the nine months ending December 31, 2017; $10.7 million for the three months ending March 31, 2018; and $20.7 million for periods subsequent to March 31, 2018.
Borrowings under the Credit Agreement now bear interest at a variable rate per annum equal to (i) LIBOR plus 5.75%, or (ii) the base rate (which is the highest of (a) the administrative agent’s prime rate, (b) the federal funds rate plus 0.50% or (c) the sum of 1% plus one-month LIBOR) plus 4.75%. Due to various amendments to the debt agreement as mentioned above, the rates have increased from LIBOR plus 2.00% at December 31, 2015 and December 31, 2014. Interest rates on our debt were 5.52%, 2.43% and 2.17% at December 31, 2016, 2015 and 2014, respectively. Upon (a) our delivering the financial information and certain related materials for the fiscal periods ended March 31, 2015, June 30, 2015, September 30, 2015, December 31, 2015 and December 31, 2016, and (b) achievement of a leverage ratio (as described below), for our then most recently ended fiscal quarter, of less than or equal to 4.00 to 1.00, the margin for borrowings based on LIBOR will decrease to 4.00% per annum and the margin for borrowings based on the base rate will decrease to 3.00% per annum.
The Credit Agreement as amended on June 23, 2017 requires us to maintain a maximum consolidated leverage ratio (defined as, with certain adjustments, the ratio of our consolidated indebtedness to consolidated net income before interest, taxes, depreciation, amortization, non-cash charges and certain other items as of the end of any period of four consecutive fiscal quarters, as follows:
· 5.00 to 1.00 as of the last day of the fiscal quarter ended June 30, 2016;
· 5.75 to 1.00 as of the last day of the fiscal quarter ended September 30, 2016;
· 5.00 to 1.00 as of the last day of each fiscal quarter thereafter.
The minimum interest coverage ratio is, as of the end of our fiscal quarter ending:
· 3.50:1.00 as of the last day of the fiscal quarter ended June 30, 2016;
· 2:25:1:00 as of the last day of the fiscal quarter ended September 30, 2016;
· 2:25:1:00 as of the last day of the fiscal quarter ended December 31, 2016;
· 2:25:1:00 as of the last day of the fiscal quarter ended March 31, 2017;
· 2:25:1:00 as of the last day of the fiscal quarter ended June 30, 2017;
· 2:25:1:00 as of the last day of the fiscal quarter ended September 30, 2017;
· 2:25:1:00 as of the last day of the fiscal quarter ended December 31, 2017;
· 2:00:1:00 as of the last day of each quarter thereafter.
The Credit Agreement also contains other customary events of default and related remedies. Loans outstanding under the Credit Agreement will bear interest at a rate of 2.00% per annum in excess of the otherwise applicable rate (i) upon acceleration of such loans, (ii) while a payment event of default exists or (iii) upon the lenders’ request, during the continuance of any other event of default.
Subject to certain exceptions, the facilities under the Credit Agreement are senior obligations and are secured by first priority perfected liens and security interests in substantially all our personal property and each subsidiary guarantor.
We had approximately $94.9 million and $10.0 million available under the revolving credit facility as of December 31, 2016 and 2015, respectively. We had outstanding letters of credit against the revolving credit facility of $6.1 million and $4.3 million as of December 31, 2016 and 2015, respectively.
We incur an unused commitment fee on the amount of unused commitments under the Credit Agreement in the amount of 0.375% based on average quarterly utilization. The amounts incurred were $0.3 million, $0.2 million and $0.4 million for the years ended December 31, 2016, 2015 and 2014, respectively.
The unamortized loan discount is being recorded as additional interest expense on a quarterly basis over the term of the credit agreement.
Term B Credit Agreement
On August 1, 2016, we entered into a new Term B Credit Agreement (Term B) providing for a new $280.0 million senior unsecured term loan facility due at maturity on August 1, 2019 bearing interest at 11.5% per annum payable quarterly in arrears. On August 31, 2016, we used approximately $205.3 million of the proceeds from the Term B Credit Agreement and from existing cash on hand to redeem all of the Senior Notes (described below) and satisfy and discharge the Indenture, approximately $81.0 million to pay down the revolving credit facility under the Credit Agreement, approximately $7.9 million to pay Term B issuance costs and bank consent fees, and approximately $1.9 million to pay related legal and professional fees. As a result of the repayment of the Senior Notes and the issuance of the Term B debt, we capitalized $6.7 million, which is being amortized to interest expense over the term of the Term B debt and recorded a loss on extinguishment of debt of $6.0 million for the year ended December 31, 2016.
We may prepay borrowings under the Term B Credit Agreement in whole or in part at any time. Any voluntary prepayment, certain mandatory prepayments and prepayments in connection with certain repricing transactions of the loans will be subject to the following prepayment premiums: (i) if such prepayment is made before February 1, 2018, an amount equal to the discounted present value as of the date of prepayment, utilizing a comparable U.S. Treasury note yield plus 50 basis points, of the sum of (A) the remaining payments of interest on the principal amount prepaid through February 1, 2018, plus (B) 3.00% of the principal amount prepaid, (ii) if such prepayment is made on or after February 1, 2018, but prior to February 1, 2019, an amount equal to 3.00% of the principal amount prepaid, and (iii) if such prepayment is made on or after February 1, 2019, an amount equal to 1.50% of the principal amount prepaid.
The Term B Credit Agreement contains various restrictions and covenants, including restrictions on our ability and certain of our subsidiaries to consolidate or merge, create liens, incur additional indebtedness, dispose of assets, consummate acquisitions, make investments and pay dividends and other distributions. The covenants in the Term B Credit Agreement are similar to those contained in the Credit Agreement, except that the Term B Credit Agreement does not contain any separate financial covenants. Subject to a 90-day grace period, an event of default under the Credit Agreement will cause an event of default under the Term B Credit Agreement. An event of default under the Credit Agreement that results in acceleration of the indebtedness thereunder will cause an immediate event of default under the Term B Credit Agreement.
The Term B Credit Agreement also contains customary events of default and related remedies. Loans outstanding under the Term B Credit Agreement will bear interest at a rate of 2.00% per annum in excess of the otherwise applicable rate (i) upon acceleration of such loans, (ii) while a payment event of default exists or (iii) upon the lenders’ request, during the continuance of any other event of default.
Senior Notes due 2018
The Senior Notes (the “Senior Notes”) were scheduled to mature on November 15, 2018. During 2016 and 2015, we entered into various amendments and waivers related to the Senior Notes, which among other things, raised the interest rate to 9.125% at November 15, 2015 and to 10.625% at May 15, 2016 and waived certain actual and potential events of default.
In securing these amendments and waivers relating to the Credit Agreement and the Senior Notes, we paid $16.8 million and $8.0 million of fees in 2016 and 2015, respectively, to the respective lenders, Senior Note holders and legal and professional advisors. $11.0 million and $3.0 million of these payments were capitalized in 2016 and 2015, respectively, are being amortized over the remaining term of the debt, while $5.8 million and $5.0 million was expensed during 2016 and 2015, respectively.
Subsidiary Guarantees
The obligations under the Credit Agreement and the Term B Credit Agreement are guaranteed by our material domestic subsidiaries, which incorporates subsidiaries that both make up no less than 90% of our total net revenues and make up no less than 90% of our total assets. Separate condensed consolidating information is not included as the parent company does not have independent assets or operations, and the guarantees are full and unconditional and joint and several.
Other Restrictions
The Credit Agreement and the Term B Credit Agreement limits our ability to, among other things, purchase capital assets, incur additional indebtedness, create liens, pay dividends on or redeem capital stock, make certain investments, make restricted payments, make certain dispositions of assets, engage in transactions with affiliates, engage in certain business activities, and engage in mergers, consolidations and certain sales of assets.
Seller Notes
We typically issue subordinated promissory notes (“Seller Notes”) as a part of the consideration transferred when making acquisitions. The Seller Notes are unsecured and are presented net of unamortized discount of $0.6 million and $1.1 million as of December 31, 2016 and 2015, respectively. In accordance with ASC 805, Accounting for Business Combinations, we measure these instruments at their estimated fair values as of the respective acquisition dates. The stated interest rates on these instruments range from 2.00% to 4.00% while the effective interest rate is 6.50%. Principal and interest are payable in monthly, quarterly or annual installments and mature through November 2018.
Financing Leases and Other
Financing leases relate to agreements when we are deemed the owner of a leased building, typically due to significant involvement during the construction period, and which do not qualify for de-recognition under the sale-leaseback accounting guidance due to one or more prohibited forms of continuing involvement in the property. Such forms of continuing involvement include us paying for a more than insignificant portion of project construction costs, us providing a security interest in the tenant’s personal property located at the premises, and/or we have renewal options for a term that comprises 90% or more of the remaining economic life of the property at a price other than estimated fair value. These liabilities have remaining terms ranging from 1 to 20 years with an average inherent interest rate of approximately 13%. Other obligations include equipment under capital leases.
The following tables summarizes for the years ended December 31, 2016 and 2015, the aggregate contractual payments associated with the financing leases and other obligations over the next 5 years and thereafter, including both principal and interest. Included in these amounts are payments for optional renewal periods for which management believes we will exercise our rights to renew, as well as the final non-monetary payment made with the return of the property at the end of the financing term:
|
(in thousands) |
|
December 31, 2016 |
| |
|
2017 |
|
$ |
4,836 |
|
|
2018 |
|
3,636 |
| |
|
2019 |
|
5,097 |
| |
|
2020 |
|
2,903 |
| |
|
2021 |
|
2,575 |
| |
|
Thereafter |
|
16,546 |
| |
|
Less: amount representing interest |
|
(17,348 |
) | |
|
Total |
|
$ |
18,245 |
|
|
(in thousands) |
|
December 31, 2015 |
| |
|
2016 |
|
$ |
3,588 |
|
|
2017 |
|
4,771 |
| |
|
2018 |
|
3,548 |
| |
|
2019 |
|
5,013 |
| |
|
2020 |
|
2,864 |
| |
|
Thereafter |
|
19,121 |
| |
|
Less: amount representing interest |
|
(17,771 |
) | |
|
Total |
|
$ |
21,134 |
|
Maturities of long-term debt at December 31, 2016 and the years thereafter are as follows:
|
(in thousands) |
|
December 31, |
| |
|
2017 |
|
$ |
34,472 |
|
|
2018 |
|
155,749 |
| |
|
2019 |
|
285,294 |
| |
|
2020 |
|
1,961 |
| |
|
2021 |
|
1,209 |
| |
|
Thereafter |
|
10,670 |
| |
|
Total debt before unamortized discount and debt issuance costs, net |
|
489,355 |
| |
|
Unamortized discount |
|
(7,511 |
) | |
|
Debt issuance costs, net |
|
(9,194 |
) | |
|
Total long-term debt |
|
$ |
472,650 |
|
Liquidity and Debt Maturity
Our Credit Facility, which had $180.0 million in principal outstanding at December 31, 2016, matures on June 17, 2018. Given that we do not produce operating cash flow sufficient to retire this obligation through cash sources arising from our normal operations, it will be necessary for us to raise new indebtedness to repay the $143.4 million in remaining principal amount that will become due as of the maturity date, any borrowings under our revolving credit commitment outstanding at that time, and any fees and expenses related to the new borrowings. At December 31, 2017, we had borrowings of $5.0 million outstanding and remaining availability of $86.4 million under the revolving credit commitment of our Credit Facility. Our ability to continue as a going concern is dependent on our ability to refinance such debt.
Additionally, our existing Credit Agreement requires that we provide lenders with our audited financial statements for the year ended December 31, 2017 no later than March 31, 2018. In the event that we are unable to do so, the agreement provides for a thirty-day cure period which would expire on April 30, 2018, at which time we would have an event of default under our Credit Agreement. Should we fail to deliver those audited financial statements by that date, in accordance with their rights and remedies under the Credit Agreement, a majority of the holders of our debt would have the right to accelerate the maturity of our indebtedness.
We are currently in the process of refinancing the amounts outstanding under our Credit Facility and repaying the $280.0 million Term Loan B indebtedness, which would otherwise mature on August 1, 2019. As a part of this refinancing, our new indebtedness is currently being structured as a $505.0 million term loan and $100.0 million revolving credit facility. This financing would extend the financial reporting requirement relating to delivery of our audited financial statements for the year ended December 31, 2017 until July 1, 2018 and would contain affirmative and negative covenants that we believe are usual and customary for a credit agreement. We currently expect to consummate this financing late in the first quarter of 2018. We cannot give assurance that the refinancing will be completed on its currently structured terms on favorable terms or at all.
We have had a history of refinancing our debt including as recently as August 2016 in which we issued $280.0 million of Term B debt to refinance our existing Senior Notes and to pay down on our revolving credit facility. This history, coupled with our
relative level of indebtedness to cash flows which will enable us to service the debt we intend to issue has led us to conclude that the successful completion of our refinancing is probable.
ASU 2014-15 Disclosure of Uncertainties about an Entity’s Ability to Continue as a Going Concern requires that we evaluate whether there is substantial doubt about our ability to meet our financial obligations when they become due during the twelve month period from the date these financial statements are available to be issued. Given that we do not believe we will have access to sufficient cash from our operating sources to meet our maturing debt obligation under our Credit Facility, we must then evaluate whether our planned refinancing is probable of being executed prior to our Credit Facility maturity date, and if executed, that such refinancing is probable of mitigating such substantial doubt. We have performed such an evaluation and based on the results of that assessment we believe it is probable that our plan for the refinancing of our indebtedness will be effectively executed late in the first quarter of 2018 which therefore mitigates the relevant conditions or events that raise substantial doubt regarding our ability to continue as a going concern within one year of the date the financial statements are issued.
If we are unsuccessful in (a) completing the refinancing by April 30, 2018, (b) delivering the 2017 audited financial statements to the existing lenders by that date, or (c) obtaining a waiver to the related debt covenant by that date, it could have a material adverse effect on our business, financial condition and operating results.
NOTE O — ACCRUED EXPENSES, OTHER CURRENT LIABILITIES AND OTHER LIABILITIES
Accrued expenses and other current liabilities consists of:
|
|
|
As of December 31, |
| ||||
|
(in thousands) |
|
2016 |
|
2015 |
| ||
|
|
|
|
|
|
|
|
|
|
Patient prepayments deposits and refunds payable |
|
$ |
28,895 |
|
$ |
24,169 |
|
|
Accrued sales taxes and other taxes |
|
5,716 |
|
5,888 |
| ||
|
Accrued professional fees |
|
25,912 |
|
32,824 |
| ||
|
Insurance and self-insurance accruals |
|
9,866 |
|
7,495 |
| ||
|
Other current liabilities |
|
8,561 |
|
9,484 |
| ||
|
Total |
|
$ |
78,950 |
|
$ |
79,860 |
|
Patient prepayment deposits and refunds includes funds received for devices not yet delivered to a patient and refunds for overpayments. Taxes primarily includes accrued sales tax liabilities and other taxes payable. Accrued professional fees primarily relate to accruals for professional accounting and legal fees. Accrued insurance primarily relates to accruals for estimated losses for certain self-insured risks including property, professional liability, general liability and employee health care costs. Other current liabilities are primarily related to accruals for deferred revenue and warranty liabilities.
Other liabilities consist of:
|
|
|
As of December 31, |
| ||||
|
(in thousands) |
|
2016 |
|
2015 |
| ||
|
|
|
|
|
|
|
|
|
|
Supplemental executive retirement plan obligations |
|
$ |
21,478 |
|
$ |
21,419 |
|
|
Unrecognized tax benefits |
|
5,015 |
|
7,961 |
| ||
|
Long-term insurance accruals |
|
9,088 |
|
9,172 |
| ||
|
Deferred tenant improvement allowances |
|
7,345 |
|
6,002 |
| ||
|
Deferred rent |
|
5,433 |
|
5,119 |
| ||
|
Asset retirement obligations |
|
1,464 |
|
1,646 |
| ||
|
Other |
|
894 |
|
2,667 |
| ||
|
Total |
|
$ |
50,717 |
|
$ |
53,986 |
|
Supplemental executive retirement plan obligations includes obligations due on both the Defined Benefit Supplemental Executive Retirement Plan (“SERP”) and the Defined Contribution Supplemental Executive Retirement Plan. See Note K - “Employee Benefits” within these consolidated financial statements. Unrecognized tax benefits represent the difference between tax positions that we expect to take, or take on our income tax returns and the benefit we recognize on our financial statements. Deferred tenant improvement allowance represents deferred credits associated with receiving lease incentives. Deferred rent represents net deferred credits associated with recognizing rent expense on a straight-line basis for property operating leases whose lease payments escalate over the life of the lease. Both deferred credits are recognized as reductions of rent expense over the term of the associated lease. Asset retirement obligations is the liability to return a leased building to the state before it was occupied. Other includes fair market value lease differential liability, build-to-suit tenant interest accrual and other long-term accrued expenses.
NOTE P — SHAREHOLDERS’ EQUITY
Shareholder’s Rights Plan
On February 28, 2016, the Board of Directors declared a dividend of one preferred share purchase right (a “Right”) for each outstanding share of common stock, par value $0.01 per share (the “Common Stock”). The dividend is payable to the shareholders of record on March 10, 2016 (the “Record Date”). The Rights will not be exercisable until after the public announcement that a person or group of affiliated or associated persons has acquired or obtained the right or obligation to acquire beneficial ownership of 10% or more of our outstanding Common Stock (“Acquiring Person”) or following the commencement of a tender offer or exchange offer that, if consummated, would result in a person or group becoming an Acquiring Person. If a shareholder’s beneficial ownership of our Common Stock as of the time of the public announcement of the Rights Agreement and associated dividend declaration is at or above the applicable threshold, as defined by the Rights Agreement (including through entry into certain derivative positions), that shareholder’s then-existing ownership percentage would be grandfathered, but the rights would become exercisable if at any time after such announcement, the shareholder increases its ownership percentage.
Once exercisable, each Right will allow its holder to purchase one one-thousandth of a share of Series A Junior Participating Preferred Stock, par value $0.01 per share (the “Preferred Stock”), for $65.00 (the “Purchase Price”), subject to adjustment. Prior to exercise, the Right does not give its holder any dividend, voting, or liquidation rights. The description and terms of the Rights are set forth in a Rights Agreement, dated as of February 28, 2016, between us and Computershare Inc., as the Rights Agent.
The Rights have certain anti-takeover effects. The Rights will cause a substantial dilution to any person or group that attempts to acquire us without the approval of our Board of Directors. As a result, the overall effect of the Rights may be to render more difficult or discourage any attempt to acquire us even if such acquisition may be favorable to the interests of our shareholders. Because our Board of Directors can redeem the Rights and amend the Rights Agreement in any respect prior to a person or group becoming an Acquiring Person, the Rights should not interfere with a merger or other business combination approved by the Board of Directors. The rights were to expire on August 28, 2017.
Rights Agreement Amendment
On June 23, 2017, we entered into an amendment (the “Rights Agreement Amendment”) to the Rights Agreement to extend the “Final Expiration Date” under the Rights Agreement to December 31, 2018. Pursuant to the terms of the Rights Agreement as amended, we have the ability to redeem the rights prior to the “Final Expiration Date” or to further amend the Rights Agreement to provide for an earlier “Final Expiration Date”.
The “Final Expiration Date” under the Rights Agreement was not extended in response to any specific takeover bid or other proposal to acquire control.
NOTE Q — COMMITMENTS AND CONTINGENT LIABILITIES
Commitments
In April 2014, in connection with the settlement of a patent infringement dispute, our wholly-owned subsidiary, Southern Prosthetic Supply, Inc. (“SPS”), entered into a non-cancellable agreement to purchase a total of $4.5 million of prosthetic gel liners in five installments. We determined that a portion of the prosthetic gel liners should be reserved as excess and slow-moving inventory, and we accrued a liability and expensed $3.4 million in 2014. As of December 31, 2016, our reserve associated with the non-cancellable purchase commitment was $3.2 million. As of December 31, 2016, $2.5 million of the non-cancellable purchase commitment was outstanding with $1.0 million, $1.0 million, and $0.5 million of purchases due by April of 2017, 2018, and 2019, respectively.
Contingencies
Legal Proceedings
In November 2014, a securities class action complaint was filed in federal district court in Texas against us. The case, City of Pontiac General Employees’ Retirement System v. Hanger, et al., C.A. No. 1:14-cv-01026-SS, is currently pending before the United States District Court for the Western District of Texas. The complaint names as defendants us and certain of our current and former officers and directors for allegedly making materially false and misleading statements regarding, among other things, our financial statements, Recovery Audit Contractor (“RAC”) audit success rate, our implementation of new financial systems, same-store sales growth, and the adequacy of our internal processes and controls. The complaint alleges violations of Sections 10(b) and 20(a) of the Exchange Act and Rule 10b-5 promulgated thereunder. The complaint seeks unspecified damages, costs and attorneys’ fees, and equitable relief.
On April 1, 2016, the court granted us motion to dismiss the lawsuit for failure to state a claim upon which relief can be granted, and permitted plaintiffs to file an amended complaint. On July 1, 2016, plaintiffs filed an amended complaint. On September 15, 2016, we and certain of the individual defendants filed motions to dismiss the lawsuit. On January 26, 2017, the court granted the defendants’ motions and dismissed with prejudice all claims against all defendants for failure to state a claim. On February 24, 2017, plaintiffs filed a notice of appeal to the United States Court of Appeals for the Fifth Circuit. Appellate briefing was completed on August 18, 2017 and the appeal remains pending. The Court of Appeals has scheduled oral argument for the appeal the week of March 5, 2018.
In February and August of 2015, two separate shareholder derivative suits were filed against us in Texas state court related to the announced restatement of our certain financial statements. The cases were subsequently consolidated into Judy v. Asar, et. al., Cause No. D-1-GN-15-000625. On October 25, 2016, plaintiffs in that action filed an amended complaint, and the case is currently pending before the 345th Judicial District Court of Travis County, Texas.
The amended complaint in the consolidated derivative action names as defendants us and certain of our current and former officers and directors. It alleges claims for breach of fiduciary duty based, inter alia, on the defendants’ alleged failure to exercise good faith to ensure that adequate accounting and financial controls were in place and that disclosures regarding our business, financial performance and internal controls were truthful and accurate. The complaint seeks unspecified damages, costs, attorneys’ fees, and equitable relief.
As disclosed in our Current Report on Form 8-K filed with the SEC on June 6, 2016, the Board of Directors appointed a Special Litigation Committee of the Board (the “Special Committee”). The Board delegated to the Special Committee the authority to (1) determine whether it is in our best interests to pursue any of the allegations made in the derivative cases filed in Texas state court (which cases were consolidated into the Judy case discussed above), (2) determine whether it is in our best interests to pursue any remedies against any of our current or former employees, officers or directors as a result of the conduct discovered in the Audit Committee investigation concluded on June 6, 2016 (the “Investigation”), and (3) otherwise resolve claims or matters relating to the findings of the Investigation. The Special Committee retained independent legal counsel to assist and advise it in carrying out its duties and reviewed and considered the evidence and various factors relating to our best interests. In accordance with its findings and conclusions, the Special Committee determined that it is not in our best interest to pursue any of the claims in the Judy derivative case. Also in accordance with its findings and conclusions, the Special Committee determined that it is not in our best interests to pursue legal remedies against any of our current or former employees, officers, or directors.
On April 14, 2017, we filed a motion to dismiss the consolidated derivative action based on the resolution by the Special Committee that it is not in our best interest to pursue the derivative claims. Counsel for the derivative plaintiffs opposed that motion and moved to compel discovery. In a hearing held on June 12, 2017, the Travis County court denied plaintiffs’ motion to compel, and held that the motion to dismiss would be considered only after appropriate discovery was concluded.
The plaintiffs have since subpoenaed counsel for the Special Committee, seeking a copy of the full report prepared by the Special Committee and its independent counsel. Counsel for the Special Committee, as well as our counsel, take the position that the full report is not discoverable under Texas law. Plaintiffs’ counsel has indicated it will file a motion to compel the Special Committee’s counsel to produce the report, but it has not yet done so. Upon resolution of the discovery dispute and completion of discovery, we intend to file a motion to dismiss the consolidated derivative action.
Management intends to vigorously defend against the shareholder derivative action and the appeal in the securities class action. At this time, we cannot predict how the Courts will rule on the merits of the claims and/or the scope of the potential loss in the event of an adverse outcome. Should we ultimately be found liable, the resulting damages could have a material adverse effect on our consolidated financial position, liquidity or results of operations.
Other Matters
In May 2015, one of our clinics received a civil investigative demand for records relating to a sample of claims submitted to Medicare and Medicaid for reimbursement, which we provided. In May 2017, we were informed by an Assistant United States Attorney that it was investigating whether we properly provided and claimed reimbursement for prosthesis skins and covers from July 2013 to the present. We have reviewed the claims, and have cooperated with the government’s investigation. We anticipate this matter will be resolved in 2018 and that any resolution will not have a material impact on any future periods.
From time to time we are subject to legal proceedings and claims which arise in the ordinary course of our business, including additional payments under business purchase agreements. In the opinion of management, the amount of ultimate liability, if any, with respect to these actions will not have a materially adverse effect on our consolidated financial position, liquidity or results of our operations.
We are in a highly regulated industry and receive regulatory agency inquiries from time to time in the ordinary course of our business, including inquiries relating to our billing activities. No assurance can be given that any discrepancies identified during a regulatory review will not have a material adverse effect on our consolidated financial statements.
Guarantees and Indemnifications
In the ordinary course of our business, we may enter into service agreements with service providers in which we agree to indemnify or limit the service provider against certain losses and liabilities arising from the service provider’s performance of the agreement. We have reviewed our existing contracts containing indemnification or clauses of guarantees and do not believe that our liability under such agreements is material.
NOTE R — SEGMENT AND RELATED INFORMATION
We have identified two operating segments and both performance evaluation and resource allocation decisions are determined based on each operating segment’s income from operations. The operating segments are described further below:
Patient Care - This segment consists of (i) our owned and operated patient care clinics, Dosteon, and CARES, and (ii) our contracting and network management business. Dosteon is presented as a discontinued operation and has therefore been excluded from the summarized financial information below. See Note S- “Discontinued Operations” within these consolidated financial statements. CARES was closed in 2015. The patient care clinics provide services to design and fit O&P devices to patients. These clinics also instruct patients in the use, care and maintenance of the devices. The principal reimbursement sources for our services are:
· Commercial private payors and other, which consist of individuals, rehabilitation providers, commercial insurance companies, HMOs, PPOs, hospitals, vocational rehabilitation, workers’ compensation programs and similar sources;
· Medicare, a federally funded health insurance program providing health insurance coverage for persons aged 65 or older and certain disabled persons, which provides reimbursement for O&P products and services based on prices set forth in published fee schedules with 10 regional pricing areas for prosthetics and orthotics and by state for durable medical equipment;
· Medicaid, a health insurance program jointly funded by federal and state governments providing health insurance coverage for certain persons in financial need, regardless of age, which may supplement Medicare benefits for financially needy persons aged 65 or older; and
· U.S. Department of Veterans Affairs.
Our contract and network management business, known as Linkia, is the only network management company dedicated solely to serving the O&P market and is focused on managing the O&P services of national and regional insurance companies. We partner with healthcare insurance companies by securing a national or regional contract either as a preferred provider or to manage their O&P network of providers.
Products & Services - This segment consists of our distribution business, which distributes and fabricates O&P products and components to sell to both the O&P industry and our own patient care clinics, and our therapeutic solutions business. The therapeutic solutions business leases and sells rehabilitation equipment and ancillary consumable supplies combined with equipment maintenance, education, and training. This segment also develops emerging neuromuscular technologies for the O&P and rehabilitation markets.
Corporate & Other - This consists of corporate overhead and includes unallocated expense such as personnel costs, professional fees and corporate offices expenses.
The accounting policies of the segments are the same as those described in Note B - “Significant Accounting Policies”.
Summarized financial information concerning our reporting segments is shown in the following tables. Segment performance is evaluated based on each segment’s earnings before interest expense, income taxes, and depreciation & amortization expenses (“EBITDA”).
Intersegment revenue primarily relates to sales of O&P components from the Products & Services segment to the Patient Care segment. The sales are priced at the cost of the related materials plus overhead.
In 2014, intersegment revenue was made at prices which we believe approximate market values but has been reclassified to eliminate intercompany profit to be consistent with intersegment revenue in 2016 and 2015. The reclassification adjustment to eliminate intersegment profit in 2014 is approximately $21.0 million.
We had no foreign and export sales and assets for the years ended December 31, 2016 and 2015. Our foreign and export sales and assets located outside of the United States of America were not significant as of December 31, 2014.
For the Patient Care segment, government reimbursement, comprised of Medicare, Medicaid and the U.S. Department of Veterans Affairs, in the aggregate, accounted for approximately, 54.1%, 53.4% and 50.9% of their net revenue in 2016, 2015 and 2014, respectively.
Additionally, for the Products & Services segment, no single customer accounted for more than 10% of net revenues in 2016, 2015 or 2014, respectively.
|
(in thousands) |
|
Patient Care |
|
Products & |
|
Corporate |
|
Consolidating |
|
Total |
| |||||
|
2016 |
|
|
|
|
|
|
|
|
|
|
| |||||
|
Net revenue |
|
|
|
|
|
|
|
|
|
|
| |||||
|
Third party |
|
$ |
840,130 |
|
$ |
201,924 |
|
$ |
— |
|
$ |
— |
|
$ |
1,042,054 |
|
|
Intersegments |
|
— |
|
175,539 |
|
— |
|
(175,539 |
) |
— |
| |||||
|
Total net revenue |
|
840,130 |
|
377,463 |
|
— |
|
(175,539 |
) |
1,042,054 |
| |||||
|
|
|
|
|
|
|
|
|
|
|
|
| |||||
|
Material costs |
|
|
|
|
|
|
|
|
|
|
| |||||
|
Third party suppliers |
|
230,957 |
|
101,114 |
|
— |
|
— |
|
332,071 |
| |||||
|
Intersegments |
|
25,055 |
|
150,484 |
|
— |
|
(175,539 |
) |
— |
| |||||
|
Total material costs |
|
256,012 |
|
251,598 |
|
— |
|
(175,539 |
) |
332,071 |
| |||||
|
|
|
|
|
|
|
|
|
|
|
|
| |||||
|
Personnel costs |
|
315,892 |
|
47,645 |
|
— |
|
— |
|
363,537 |
| |||||
|
Other expenses |
|
150,604 |
|
32,228 |
|
104,649 |
|
— |
|
287,481 |
| |||||
|
Depreciation & amortization |
|
24,873 |
|
11,600 |
|
8,414 |
|
— |
|
44,887 |
| |||||
|
Impairment of intangible assets |
|
— |
|
86,164 |
|
— |
|
— |
|
86,164 |
| |||||
|
Income (loss) from operations |
|
92,749 |
|
(51,772 |
) |
(113,063 |
) |
— |
|
(72,086 |
) | |||||
|
|
|
|
|
|
|
|
|
|
|
|
| |||||
|
Interest expense (income), net |
|
33,081 |
|
13,097 |
|
(979 |
) |
— |
|
45,199 |
| |||||
|
Extinguishment of debt |
|
— |
|
— |
|
6,031 |
|
— |
|
6,031 |
| |||||
|
Income (loss) from continuing operations before income taxes |
|
59,668 |
|
(64,869 |
) |
(118,115 |
) |
— |
|
(123,316 |
) | |||||
|
|
|
|
|
|
|
|
|
|
|
|
| |||||
|
Benefit for income taxes |
|
— |
|
— |
|
(15,910 |
) |
— |
|
(15,910 |
) | |||||
|
Income (loss) from continuing operations |
|
$ |
59,668 |
|
$ |
(64,869 |
) |
$ |
(102,205 |
) |
$ |
— |
|
$ |
(107,406 |
) |
|
|
|
|
|
|
|
|
|
|
|
|
| |||||
|
EBITDA |
|
$ |
117,622 |
|
$ |
(40,172 |
) |
$ |
(104,649 |
) |
$ |
— |
|
$ |
(27,199 |
) |
|
Total assets |
|
419,895 |
|
159,354 |
|
175,855 |
|
— |
|
755,104 |
| |||||
|
Capital expenditures |
|
14,581 |
|
820 |
|
5,747 |
|
— |
|
21,148 |
| |||||
|
(in thousands) |
|
Patient Care |
|
Products & |
|
Corporate |
|
Consolidating |
|
Total |
| |||||
|
2015 |
|
|
|
|
|
|
|
|
|
|
| |||||
|
Net revenue |
|
|
|
|
|
|
|
|
|
|
| |||||
|
Third party |
|
$ |
874,960 |
|
$ |
192,212 |
|
$ |
— |
|
$ |
— |
|
$ |
1,067,172 |
|
|
Intersegments |
|
— |
|
137,282 |
|
— |
|
(137,282 |
) |
— |
| |||||
|
Total net revenue |
|
874,960 |
|
329,494 |
|
— |
|
(137,282 |
) |
1,067,172 |
| |||||
|
|
|
|
|
|
|
|
|
|
|
|
| |||||
|
Material costs |
|
|
|
|
|
|
|
|
|
|
| |||||
|
Third party suppliers |
|
242,714 |
|
93,569 |
|
— |
|
— |
|
336,283 |
| |||||
|
Intersegments |
|
19,613 |
|
117,669 |
|
— |
|
(137,282 |
) |
— |
| |||||
|
Total material costs |
|
262,327 |
|
211,238 |
|
— |
|
(137,282 |
) |
336,283 |
| |||||
|
|
|
|
|
|
|
|
|
|
|
|
| |||||
|
Personnel costs |
|
317,927 |
|
49,167 |
|
— |
|
— |
|
367,094 |
| |||||
|
Other expenses |
|
163,240 |
|
25,487 |
|
92,520 |
|
— |
|
281,247 |
| |||||
|
Depreciation and amortization |
|
25,674 |
|
11,883 |
|
8,786 |
|
— |
|
46,343 |
| |||||
|
Impairment of intangible assets |
|
382,860 |
|
2,947 |
|
|
|
|
|
385,807 |
| |||||
|
(Loss) income from operations |
|
(277,068 |
) |
28,772 |
|
(101,306 |
) |
— |
|
(349,602 |
) | |||||
|
|
|
|
|
|
|
|
|
|
|
|
| |||||
|
Interest expense (income), net |
|
33,677 |
|
13,114 |
|
(16,899 |
) |
— |
|
29,892 |
| |||||
|
Extinguishment of debt |
|
— |
|
— |
|
7,237 |
|
— |
|
7,237 |
| |||||
|
(Loss) income from continuing operations before income taxes |
|
(310,745 |
) |
15,658 |
|
(91,644 |
) |
— |
|
(386,731 |
) | |||||
|
|
|
|
|
|
|
|
|
|
|
|
| |||||
|
Benefit for income taxes |
|
— |
|
— |
|
(67,614 |
) |
— |
|
(67,614 |
) | |||||
|
(Loss) income from continuing operations |
|
$ |
(310,745 |
) |
$ |
15,658 |
|
$ |
(24,030 |
) |
$ |
— |
|
$ |
(319,117 |
) |
|
|
|
|
|
|
|
|
|
|
|
|
| |||||
|
EBITDA |
|
$ |
(251,394 |
) |
$ |
40,655 |
|
$ |
(92,520 |
) |
$ |
— |
|
$ |
(303,259 |
) |
|
Total assets |
|
468,575 |
|
257,640 |
|
246,869 |
|
— |
|
973,084 |
| |||||
|
Capital expenditures |
|
16,505 |
|
2,937 |
|
8,178 |
|
— |
|
27,620 |
| |||||
|
(in thousands) |
|
Patient |
|
Products & |
|
Corporate |
|
Consolidating |
|
Total |
| |||||
|
2014 |
|
|
|
|
|
|
|
|
|
|
| |||||
|
Net revenue |
|
|
|
|
|
|
|
|
|
|
| |||||
|
Third party |
|
$ |
837,080 |
|
$ |
175,020 |
|
$ |
— |
|
$ |
— |
|
$ |
1,012,100 |
|
|
Intersegments |
|
— |
|
162,636 |
|
— |
|
(162,636 |
) |
— |
| |||||
|
Total net revenue |
|
837,080 |
|
337,656 |
|
— |
|
(162,636 |
) |
1,012,100 |
| |||||
|
|
|
|
|
|
|
|
|
|
|
|
| |||||
|
Material costs |
|
|
|
|
|
|
|
|
|
|
| |||||
|
Third party suppliers |
|
240,685 |
|
83,599 |
|
— |
|
— |
|
324,284 |
| |||||
|
Intersegments |
|
19,587 |
|
143,049 |
|
— |
|
(162,636 |
) |
— |
| |||||
|
Total material costs |
|
260,272 |
|
226,648 |
|
— |
|
(162,636 |
) |
324,284 |
| |||||
|
|
|
|
|
|
|
|
|
|
|
|
| |||||
|
Personnel costs |
|
305,651 |
|
47,935 |
|
— |
|
— |
|
353,586 |
| |||||
|
Other expenses |
|
152,176 |
|
27,498 |
|
88,124 |
|
— |
|
267,798 |
| |||||
|
Depreciation and amortization |
|
18,769 |
|
12,022 |
|
8,138 |
|
— |
|
38,929 |
| |||||
|
Impairment of intangible assets |
|
— |
|
223 |
|
— |
|
— |
|
223 |
| |||||
|
Income (loss) from operations |
|
100,212 |
|
23,330 |
|
(96,262 |
) |
— |
|
27,280 |
| |||||
|
|
|
|
|
|
|
|
|
|
|
|
| |||||
|
Interest expense (income), net |
|
33,465 |
|
13,079 |
|
(18,267 |
) |
— |
|
28,277 |
| |||||
|
Income (loss) from continuing operations before income taxes |
|
66,747 |
|
10,251 |
|
(77,995 |
) |
— |
|
(997 |
) | |||||
|
|
|
|
|
|
|
|
|
|
|
|
| |||||
|
Provision for income taxes |
|
— |
|
— |
|
2,023 |
|
— |
|
2,023 |
| |||||
|
Income (loss) from continuing operations |
|
$ |
66,747 |
|
$ |
10,251 |
|
$ |
(80,018 |
) |
$ |
— |
|
$ |
(3,020 |
) |
|
|
|
|
|
|
|
|
|
|
|
|
| |||||
|
EBITDA |
|
$ |
118,981 |
|
$ |
35,352 |
|
$ |
(88,124 |
) |
$ |
— |
|
$ |
66,209 |
|
|
Total assets |
|
848,092 |
|
262,721 |
|
124,920 |
|
— |
|
1,235,733 |
| |||||
|
Capital expenditures |
|
14,067 |
|
1,305 |
|
11,724 |
|
— |
|
27,096 |
| |||||
NOTE S — DISCONTINUED OPERATIONS
On November 5, 2014, the Audit Committee of the Board of Directors approved a plan to sell and/or otherwise dispose of the Dosteon distribution product group (“Dosteon”), a component of our Patient Care segment. This action was taken following the conclusion of our strategic evaluation of this business in the fourth quarter of 2014. In accordance with ASC 205-20, Presentation of Financial Statements - Discontinued Operations, ASC 360-10 Property, Plant and Equipment - Overall, and ASC 350-20, Intangibles - Goodwill and Other - Goodwill, the operating results and cash flows of Dosteon have been presented separately as discontinued operations in the consolidated statements of operations and comprehensive (loss) income and the consolidated statements of cash flows, respectively, for the years ended December 31, 2016, December 31, 2015 and all comparable periods.
We entered into a definitive agreement in 2014 to sell one of the Dosteon businesses for approximately $2.7 million.
The remaining portions of Dosteon businesses were sold in 2015 for aggregate cash proceeds of approximately $4.9 million. Associated with the disposal of these businesses, we recorded a $1.3 million loss on disposal and a $0.6 million inventory impairment loss associated with writing down the inventory to expected fair value within “Income (loss) from discontinued operations, net of income taxes” in 2015. Costs associated with exit and disposal related to Dosteon were immaterial in 2015 and 2016.
In 2016, $1.4 million of contingent consideration gains resulting from the disposal of Dosteon in prior years was recorded in “Income (loss) from discontinued operations, net of income taxes” in our consolidated statements of operations and comprehensive (loss) income.
The following is a summary of our operating results for discontinued operations:
|
|
|
Year Ended December 31, |
| |||||||
|
(in thousands) |
|
2016 |
|
2015 |
|
2014 |
| |||
|
Net revenue |
|
$ |
— |
|
$ |
5,547 |
|
$ |
37,856 |
|
|
|
|
|
|
|
|
|
| |||
|
Income (loss) before income taxes from discontinued operations |
|
1,425 |
|
(11,223 |
) |
(24,860 |
) | |||
|
Income tax provision (benefit) |
|
490 |
|
(3,249 |
) |
(8,914 |
) | |||
|
Income (loss) from discontinued operations, net of income taxes |
|
$ |
935 |
|
$ |
(7,974 |
) |
$ |
(15,946 |
) |
NOTE T — SUPPLEMENTAL CASH FLOW INFORMATION
The supplemental disclosure requirements for the statements of cash flows are as follows:
|
|
|
Year Ended December 31, |
| |||||||
|
(in thousands) |
|
2016 |
|
2015 |
|
2014 |
| |||
|
Cash paid during the period for: |
|
|
|
|
|
|
| |||
|
Interest paid |
|
$ |
42,345 |
|
$ |
26,070 |
|
$ |
25,341 |
|
|
Income taxes (refunds received) paid |
|
$ |
(35,092 |
) |
$ |
18,106 |
|
$ |
25,433 |
|
|
|
|
|
|
|
|
|
| |||
|
Non-cash financing and investing activities: |
|
|
|
|
|
|
| |||
|
Issuance of seller notes in connection with acquisitions |
|
$ |
— |
|
$ |
4,662 |
|
$ |
13,964 |
|
|
Additions to property, plant and equipment acquired through financing obligations |
|
$ |
374 |
|
$ |
3,743 |
|
$ |
3,461 |
|
|
Retirements of financed property, plant and equipment and related financing obligations |
|
$ |
2,381 |
|
$ |
1,434 |
|
$ |
2,071 |
|
|
Purchase of property, plant and equipment in accounts payable |
|
$ |
728 |
|
$ |
2,746 |
|
$ |
1,588 |
|
NOTE U — SUBSEQUENT EVENTS
Rights Agreement Amendment
On June 23, 2017, we entered into an amendment to the Rights Agreement dated February 28, 2016 to extend the “Final Expiration Date” under the Rights Agreement to December 31, 2018. Pursuant to the terms of the Rights Agreement as amended by the Rights Agreement Amendment, we have the ability to redeem the rights prior to the “Final Expiration Date” or to further amend the Rights Agreement to provide for an earlier “Final Expiration Date.”
See Note P - “Shareholders’ Equity” within these consolidated financial statements.
Amendment to Term B Credit Agreement as of June 23, 2017
On June 2, 2017, we entered into an Amendment (the “Term B Amendment”) to our Credit Agreement. The Term B Amendment became effective on June 23, 2017. The Term B Amendment extends the deadline by which we must deliver to the Term B Agent our audited financial statements, the related audit report and a consolidated budget, in each case, for the fiscal year ended December 31, 2016, from August 15, 2017 to February 15, 2018. The Amendment also extends the deadline by which the Compliance Date (as defined in the Term B Credit Agreement) must occur from August 15, 2017 to February 15, 2018. We are otherwise required to comply with all other obligations and covenants contained in the Term B Credit Agreement, including the timely delivery to our lenders future financial statements and related information.
Sixth Amendment to Credit Agreement as of June 22, 2017
On June 22, 2017, we entered into a Sixth Amendment (the “Sixth Amendment”) to our Credit Agreement that extends the deadline by which we must deliver to the Agent the Required Financial Information from August 15, 2017 to February 15, 2018.
The Sixth Amendment amended the maximum permitted leverage ratio covenant to be as of the end of any period of four consecutive fiscal quarters, as follows:
· 5.00 to 1.00 as of the last day of the fiscal quarter ended June 30, 2016;
· 5.75 to 1.00 as of the last day of the fiscal quarter ended September 30, 2016;
· 5.00 to 1.00 as of the last day of each fiscal quarter thereafter.
The Sixth Amendment also amended the minimum interest coverage ratio covenant to be, as of the end of our fiscal quarter ending:
· 3.50:1.00 as of the last day of the fiscal quarter ended June 30, 2016;
· 2:25:1:00 as of the last day of the fiscal quarter ended September 30, 2016;
· 2:25:1:00 as of the last day of the fiscal quarter ended December 31, 2016;
· 2:25:1:00 as of the last day of the fiscal quarter ended March 31, 2017;
· 2:25:1:00 as of the last day of the fiscal quarter ended June 30, 2017;
· 2:25:1:00 as of the last day of the fiscal quarter ended September 30, 2017;
· 2:25:1:00 as of the last day of the fiscal quarter ended December 31, 2017;
· 2:00:1:00 as of the last day of each quarter thereafter.
We are otherwise required to comply with all the other obligations and covenants contained in the Credit Amendment, as amended through the Sixth Amendment including the timely delivery to our lenders future financial statements and related information.
See Note N - “Long-term Debt” within these consolidated financial statement.
Special Equity Plan
The Compensation Committee of the Board of Directors, with the advice of its compensation consultants, developed the terms of a special equity plan, which was adopted by the Board on May 19, 2017. The Hanger, Inc. Special Equity Plan (the “Special Equity Plan”) has the purpose of retaining and incentivizing key employees and officers. The Special Equity Plan will provide participants the opportunity to acquire shares of our common stock (“Common Stock”) and is intended to operate completely independent from our 2016 Omnibus Incentive Plan.
The Special Equity Plan authorizes the issuance of up to 1,500,000 shares of Common Stock. All awards under the Special Equity Plan were made on May 19, 2017, and no further grants of awards will be authorized under the Special Equity Plan. The total number of awards issued to all officers and employees under the Special Equity Plan was 1,117,228 made up of 728,020 stock options and 319,208 performance-based stock awards. The maximum number of shares issuable under these awards is 1,436,436 shares of Common Stock if certain performance targets are met.
The performance measure will be the three year absolute Common Stock price compounded annual growth rate (“CAGR”). Pursuant to the Executive Restricted Stock Unit Agreement and the Employee Restricted Stock Unit Agreement, participants
will be eligible to earn performance-based Restricted Stock Units based on the following achievement of the performance measure:
|
|
|
|
|
Percent of Target |
|
|
|
CAGR Result on 3rd |
|
Performance-Based |
|
|
|
Anniversary of Grant Date |
|
Restricted Stock Units Earned |
|
|
|
|
|
|
|
Threshold |
|
10% |
|
50% |
|
Target |
|
20% |
|
100% |
|
Maximum |
|
30% or above |
|
200% |
To date no options have been exercised and no performance based awards have vested.
NOTE V — QUARTERLY FINANCIAL INFORMATION (UNAUDITED)
The tables below present summarized unaudited quarterly financial statements for the years ended December 31, 2016 and 2015. In lieu of filing Quarterly Reports on Form 10-Q for each quarter of 2016 and 2015, quarterly financial information is included in this report in the tables that follow. Amounts are computed independently each quarter, therefore, the sum of the quarterly amounts may not equal the total amount for the respective year due to rounding.
HANGER, INC.
QUARTERLY CONSOLIDATED BALANCE SHEETS
(dollars in thousands, except par value and share amounts)
(Unaudited)
|
|
|
As of |
|
As of |
|
As of |
| |||
|
|
|
March 31, |
|
June 30, |
|
September 30, |
| |||
|
|
|
2016 |
|
2016 |
|
2016 |
| |||
|
ASSETS |
|
|
|
|
|
|
| |||
|
Current assets: |
|
|
|
|
|
|
| |||
|
Cash and cash equivalents |
|
$ |
19,962 |
|
$ |
49,011 |
|
$ |
1,003 |
|
|
Net accounts receivable, less allowance for doubtful accounts of $16,296 at March 31, 2016, $15,241 at June 30, 2016, and $14,418 at September 30, 2016 |
|
149,816 |
|
145,605 |
|
139,203 |
| |||
|
Inventories |
|
69,163 |
|
71,092 |
|
74,563 |
| |||
|
Income taxes receivable |
|
41,066 |
|
41,736 |
|
10,999 |
| |||
|
Other current assets |
|
24,014 |
|
19,199 |
|
18,102 |
| |||
|
Total current assets |
|
304,021 |
|
326,643 |
|
243,870 |
| |||
|
|
|
|
|
|
|
|
| |||
|
Non-current assets: |
|
|
|
|
|
|
| |||
|
Property, plant and equipment, net |
|
109,124 |
|
105,286 |
|
102,485 |
| |||
|
Goodwill |
|
335,642 |
|
335,642 |
|
335,642 |
| |||
|
Other intangible assets, net |
|
43,178 |
|
39,232 |
|
35,630 |
| |||
|
Deferred income taxes |
|
98,254 |
|
98,254 |
|
98,254 |
| |||
|
Other assets |
|
23,680 |
|
25,413 |
|
25,582 |
| |||
|
Total assets |
|
$ |
913,899 |
|
$ |
930,470 |
|
$ |
841,463 |
|
|
LIABILITIES AND SHAREHOLDERS’ EQUITY |
|
|
|
|
|
|
| |||
|
Current liabilities: |
|
|
|
|
|
|
| |||
|
Current portion of long-term debt |
|
$ |
29,447 |
|
$ |
29,713 |
|
$ |
28,833 |
|
|
Accounts payable |
|
40,813 |
|
68,909 |
|
59,113 |
| |||
|
Accrued expenses and other current liabilities |
|
81,934 |
|
78,026 |
|
75,443 |
| |||
|
Accrued interest payable |
|
7,636 |
|
5,255 |
|
554 |
| |||
|
Accrued compensation related costs |
|
25,131 |
|
23,772 |
|
22,193 |
| |||
|
Total current liabilities |
|
184,961 |
|
205,675 |
|
186,136 |
| |||
|
|
|
|
|
|
|
|
| |||
|
Long-term liabilities: |
|
|
|
|
|
|
| |||
|
Long-term debt, less current portion |
|
525,521 |
|
519,952 |
|
457,021 |
| |||
|
Other liabilities |
|
55,304 |
|
54,925 |
|
53,803 |
| |||
|
Total liabilities |
|
765,786 |
|
780,552 |
|
696,960 |
| |||
|
|
|
|
|
|
|
|
| |||
|
Shareholders’ Equity: |
|
|
|
|
|
|
| |||
|
Common stock, $.01 par value; 60,000,000 shares authorized, 36,044,247 shares, 36,144,560 shares, and 36,158,347 shares issued and 35,901,426 shares, 36,001,739 shares and 36,015,526 shares outstanding at March 31, June 30, and September 30, 2016, respectively |
|
361 |
|
362 |
|
362 |
| |||
|
Additional paid-in capital |
|
315,908 |
|
318,022 |
|
320,065 |
| |||
|
Accumulated other comprehensive loss |
|
(1,394 |
) |
(1,376 |
) |
(1,356 |
) | |||
|
Retained deficit |
|
(166,066 |
) |
(166,394 |
) |
(173,872 |
) | |||
|
Treasury stock, at cost 142,821 shares at March 31, June 30, and September 30, 2016, respectively |
|
(696 |
) |
(696 |
) |
(696 |
) | |||
|
Total shareholders’ equity |
|
148,113 |
|
149,918 |
|
144,503 |
| |||
|
Total liabilities and shareholders’ equity |
|
$ |
913,899 |
|
$ |
930,470 |
|
$ |
841,463 |
|
HANGER, INC.
QUARTERLY CONSOLIDATED BALANCE SHEETS
(dollars in thousands, except par value and share amounts)
(Unaudited)
|
|
|
As of |
|
As of |
|
As of |
| |||
|
|
|
March 31, |
|
June 30, |
|
September 30, |
| |||
|
|
|
2015 |
|
2015 |
|
2015 |
| |||
|
ASSETS |
|
|
|
|
|
|
| |||
|
Current assets: |
|
|
|
|
|
|
| |||
|
Cash and cash equivalents |
|
$ |
26,403 |
|
$ |
18,178 |
|
$ |
24,632 |
|
|
Net accounts receivable, less allowance for doubtful accounts of $13,225 at March 31, 2015, $14,033 at June 30, 2015, and $14,419 at September 30, 2015 |
|
159,244 |
|
163,635 |
|
166,058 |
| |||
|
Inventories |
|
73,113 |
|
73,041 |
|
74,687 |
| |||
|
Income taxes receivable |
|
9,696 |
|
16,750 |
|
15,899 |
| |||
|
Other current assets |
|
23,242 |
|
20,907 |
|
22,603 |
| |||
|
Assets held for sale |
|
1,201 |
|
— |
|
— |
| |||
|
Total current assets |
|
292,899 |
|
292,511 |
|
303,879 |
| |||
|
Non-current assets: |
|
|
|
|
|
|
| |||
|
Property, plant and equipment, net |
|
113,651 |
|
115,314 |
|
113,510 |
| |||
|
Goodwill |
|
718,343 |
|
718,413 |
|
718,503 |
| |||
|
Other intangible assets, net |
|
61,805 |
|
59,857 |
|
57,109 |
| |||
|
Deferred income taxes |
|
49,701 |
|
49,701 |
|
49,701 |
| |||
|
Other assets |
|
23,069 |
|
22,602 |
|
21,498 |
| |||
|
Total assets |
|
$ |
1,259,468 |
|
$ |
1,258,398 |
|
$ |
1,264,200 |
|
|
LIABILITIES AND SHAREHOLDERS’ EQUITY |
|
|
|
|
|
|
| |||
|
Current liabilities: |
|
|
|
|
|
|
| |||
|
Current portion of long-term debt |
|
$ |
28,577 |
|
$ |
29,904 |
|
$ |
29,384 |
|
|
Accounts payable |
|
54,765 |
|
52,324 |
|
52,957 |
| |||
|
Accrued expenses and other current liabilities |
|
86,465 |
|
91,117 |
|
91,798 |
| |||
|
Accrued interest payable |
|
5,906 |
|
3,065 |
|
6,197 |
| |||
|
Accrued compensation related costs |
|
27,155 |
|
28,010 |
|
41,284 |
| |||
|
Total current liabilities |
|
202,868 |
|
204,420 |
|
221,620 |
| |||
|
Long-term liabilities: |
|
|
|
|
|
|
| |||
|
Long-term debt, less current portion |
|
540,882 |
|
534,012 |
|
516,743 |
| |||
|
Other liabilities |
|
47,918 |
|
48,095 |
|
48,307 |
| |||
|
Total liabilities |
|
791,668 |
|
786,527 |
|
786,670 |
| |||
|
Shareholders’ Equity: |
|
|
|
|
|
|
| |||
|
Common stock, $.01 par value; 60,000,000 shares authorized, 35,765,547 shares, 35,816,784 shares, and 35,825,040 shares issued and 35,622,726 shares, 35,673,963 shares and 35,682,219 shares outstanding at March 31, June 30, and September 30, 2015, respectively |
|
359 |
|
359 |
|
359 |
| |||
|
Additional paid-in capital |
|
307,368 |
|
309,865 |
|
312,418 |
| |||
|
Accumulated other comprehensive loss |
|
(1,862 |
) |
(1,834 |
) |
(1,808 |
) | |||
|
Retained earnings |
|
162,591 |
|
164,177 |
|
167,257 |
| |||
|
Treasury stock, at cost 141,154 shares at March 31, 2015, 142,821 at June 30, 2015 and 142,821 at September 30, 2015 |
|
(656 |
) |
(696 |
) |
(696 |
) | |||
|
Total shareholders’ equity |
|
467,800 |
|
471,871 |
|
477,530 |
| |||
|
Total liabilities and shareholders’ equity |
|
$ |
1,259,468 |
|
$ |
1,258,398 |
|
$ |
1,264,200 |
|
HANGER, INC.
QUARTERLY CONSOLIDATED STATEMENTS OF OPERATIONS
AND COMPREHENSIVE (LOSS) INCOME
(dollars and shares in thousands, except per share amounts)
(Unaudited)
|
|
|
Three Months |
|
Three Months |
|
Six Months |
|
Three Months |
|
Nine Months |
|
Three Months |
| ||||||
|
|
|
March 31, |
|
June 30, |
|
June 30, |
|
September 30, |
|
September 30, |
|
December 31, |
| ||||||
|
|
|
2016 |
|
2016 |
|
2016 |
|
2016 |
|
2016 |
|
2016 |
| ||||||
|
|
|
|
|
|
|
|
|
|
|
|
|
|
| ||||||
|
Net revenue |
|
$ |
236,461 |
|
$ |
264,456 |
|
$ |
500,917 |
|
$ |
260,084 |
|
$ |
761,001 |
|
$ |
281,053 |
|
|
Material costs |
|
76,700 |
|
82,971 |
|
159,671 |
|
85,437 |
|
245,108 |
|
86,963 |
| ||||||
|
Personnel costs |
|
89,138 |
|
88,406 |
|
177,544 |
|
89,113 |
|
266,657 |
|
96,880 |
| ||||||
|
Other operating costs |
|
36,761 |
|
31,970 |
|
68,731 |
|
34,139 |
|
102,870 |
|
36,154 |
| ||||||
|
General and administrative expenses |
|
27,558 |
|
30,170 |
|
57,728 |
|
25,726 |
|
83,454 |
|
23,770 |
| ||||||
|
Professional accounting and legal fees |
|
11,689 |
|
10,692 |
|
22,381 |
|
9,023 |
|
31,404 |
|
9,829 |
| ||||||
|
Depreciation and amortization |
|
11,728 |
|
11,660 |
|
23,388 |
|
11,339 |
|
34,727 |
|
10,160 |
| ||||||
|
Impairment of intangible assets |
|
— |
|
— |
|
— |
|
— |
|
— |
|
86,164 |
| ||||||
|
(Loss) income from operations |
|
(17,113 |
) |
8,587 |
|
(8,526 |
) |
5,307 |
|
(3,219 |
) |
(68,867 |
) | ||||||
|
Interest expense, net |
|
8,838 |
|
9,818 |
|
18,656 |
|
12,809 |
|
31,465 |
|
13,734 |
| ||||||
|
Loss on extinguishment of debt |
|
— |
|
(10 |
) |
(10 |
) |
6,041 |
|
6,031 |
|
— |
| ||||||
|
Loss from continuing operations before income taxes |
|
(25,951 |
) |
(1,221 |
) |
(27,172 |
) |
(13,543 |
) |
(40,715 |
) |
(82,601 |
) | ||||||
|
Benefit for income taxes |
|
(8,414 |
) |
(321 |
) |
(8,735 |
) |
(5,687 |
) |
(14,422 |
) |
(1,488 |
) | ||||||
|
Loss from continuing operations |
|
(17,537 |
) |
(900 |
) |
(18,437 |
) |
(7,856 |
) |
(26,293 |
) |
(81,113 |
) | ||||||
|
Income (loss) from discontinued operations, net of income taxes |
|
— |
|
572 |
|
572 |
|
378 |
|
950 |
|
(15 |
) | ||||||
|
Net loss |
|
$ |
(17,537 |
) |
$ |
(328 |
) |
$ |
(17,865 |
) |
$ |
(7,478 |
) |
$ |
(25,343 |
) |
$ |
(81,128 |
) |
|
|
|
|
|
|
|
|
|
|
|
|
|
|
| ||||||
|
Other comprehensive loss: |
|
|
|
|
|
|
|
|
|
|
|
|
| ||||||
|
Unrealized income (loss) on SERP, net of tax |
|
$ |
19 |
|
$ |
19 |
|
$ |
38 |
|
$ |
19 |
|
$ |
57 |
|
$ |
(84 |
) |
|
Comprehensive loss |
|
$ |
(17,518 |
) |
$ |
(309 |
) |
$ |
(17,827 |
) |
$ |
(7,459 |
) |
$ |
(25,286 |
) |
$ |
(81,212 |
) |
|
|
|
|
|
|
|
|
|
|
|
|
|
|
| ||||||
|
Basic and Diluted Per Common Share Data: |
|
|
|
|
|
|
|
|
|
|
|
|
| ||||||
|
Loss from continuing operations |
|
$ |
(0.49 |
) |
$ |
(0.03 |
) |
$ |
(0.51 |
) |
$ |
(0.22 |
) |
$ |
(0.73 |
) |
$ |
(2.25 |
) |
|
Income from discontinued operations, net of income taxes |
|
— |
|
0.02 |
|
0.01 |
|
0.01 |
|
0.02 |
|
— |
| ||||||
|
Basic loss per share |
|
$ |
(0.49 |
) |
$ |
(0.01 |
) |
$ |
(0.50 |
) |
$ |
(0.21 |
) |
$ |
(0.71 |
) |
$ |
(2.25 |
) |
|
Shares used to compute basic per common share amounts |
|
35,742 |
|
35,949 |
|
35,846 |
|
36,008 |
|
35,900 |
|
36,032 |
| ||||||
HANGER, INC.
QUARTERLY CONSOLIDATED STATEMENTS OF OPERATIONS
AND COMPREHENSIVE (LOSS) INCOME
(dollars and shares in thousands, except per share amounts)
(Unaudited)
|
|
|
Three Months |
|
Three Months |
|
Six Months |
|
Three Months |
|
Nine Months |
|
Three Months |
| ||||||
|
|
|
March 31, |
|
June 30, |
|
June 30, |
|
September 30, |
|
September 30, |
|
December 31, |
| ||||||
|
|
|
2015 |
|
2015 |
|
2015 |
|
2015 |
|
2015 |
|
2015 |
| ||||||
|
|
|
|
|
|
|
|
|
|
|
|
|
|
| ||||||
|
Net revenue |
|
$ |
233,501 |
|
$ |
272,836 |
|
$ |
506,337 |
|
$ |
275,182 |
|
$ |
781,519 |
|
$ |
285,653 |
|
|
Material costs |
|
76,828 |
|
85,901 |
|
162,729 |
|
85,492 |
|
248,221 |
|
88,062 |
| ||||||
|
Personnel costs |
|
86,392 |
|
89,912 |
|
176,304 |
|
95,220 |
|
271,524 |
|
95,570 |
| ||||||
|
Other operating costs |
|
36,431 |
|
37,604 |
|
74,035 |
|
32,764 |
|
106,799 |
|
34,039 |
| ||||||
|
General and administrative expenses |
|
25,857 |
|
29,112 |
|
54,969 |
|
29,689 |
|
84,658 |
|
27,103 |
| ||||||
|
Professional accounting and legal fees |
|
4,800 |
|
4,853 |
|
9,653 |
|
9,348 |
|
19,001 |
|
9,646 |
| ||||||
|
Depreciation and amortization |
|
10,230 |
|
9,916 |
|
20,146 |
|
10,240 |
|
30,386 |
|
15,957 |
| ||||||
|
Impairment of intangible assets |
|
— |
|
— |
|
— |
|
812 |
|
812 |
|
384,996 |
| ||||||
|
(Loss) income from operations |
|
(7,037 |
) |
15,538 |
|
8,501 |
|
11,617 |
|
20,118 |
|
(369,720 |
) | ||||||
|
Interest expense, net |
|
7,173 |
|
7,380 |
|
14,553 |
|
7,404 |
|
21,957 |
|
7,935 |
| ||||||
|
Loss on extinguishment of debt |
|
— |
|
— |
|
— |
|
— |
|
— |
|
7,237 |
| ||||||
|
(Loss) income from continuing operations |
|
(14,210 |
) |
8,158 |
|
(6,052 |
) |
4,213 |
|
(1,839 |
) |
(384,892 |
) | ||||||
|
Provision (benefit) for income taxes |
|
793 |
|
228 |
|
1,021 |
|
1,133 |
|
2,154 |
|
(69,768 |
) | ||||||
|
(Loss) income from continuing operations |
|
(15,003 |
) |
7,930 |
|
(7,073 |
) |
3,080 |
|
(3,993 |
) |
(315,124 |
) | ||||||
|
(Loss) income from discontinued operations, net of income taxes |
|
(967 |
) |
(6,343 |
) |
(7,310 |
) |
— |
|
(7,310 |
) |
(664 |
) | ||||||
|
Net (loss) income |
|
$ |
(15,970 |
) |
$ |
1,587 |
|
$ |
(14,383 |
) |
$ |
3,080 |
|
$ |
(11,303 |
) |
$ |
(315,788 |
) |
|
|
|
|
|
|
|
|
|
|
|
|
|
|
| ||||||
|
Other comprehensive (loss) income: |
|
|
|
|
|
|
|
|
|
|
|
|
| ||||||
|
Unrealized income on SERP, net of tax |
|
$ |
27 |
|
$ |
27 |
|
$ |
54 |
|
$ |
27 |
|
$ |
81 |
|
$ |
393 |
|
|
Comprehensive (loss) income |
|
$ |
(15,943 |
) |
$ |
1,614 |
|
$ |
(14,329 |
) |
$ |
3,107 |
|
$ |
(11,222 |
) |
$ |
(315,395 |
) |
|
|
|
|
|
|
|
|
|
|
|
|
|
|
| ||||||
|
Basic Per Common Share Data: |
|
|
|
|
|
|
|
|
|
|
|
|
| ||||||
|
|
|
|
|
|
|
|
|
|
|
|
|
|
| ||||||
|
(Loss) income from operations |
|
$ |
(0.42 |
) |
$ |
0.22 |
|
$ |
(0.20 |
) |
$ |
0.09 |
|
$ |
(0.11 |
) |
$ |
(8.83 |
) |
|
(Loss) income from discontinued operations, net of income taxes |
|
(0.03 |
) |
(0.18 |
) |
(0.20 |
) |
— |
|
(0.21 |
) |
(0.02 |
) | ||||||
|
Basic (loss) income per share |
|
$ |
(0.45 |
) |
$ |
0.04 |
|
$ |
(0.40 |
) |
$ |
0.09 |
|
$ |
(0.32 |
) |
$ |
(8.85 |
) |
|
Shares used to compute basic per common share amounts |
|
35,498 |
|
35,661 |
|
35,579 |
|
35,678 |
|
35,614 |
|
35,697 |
| ||||||
|
|
|
|
|
|
|
|
|
|
|
|
|
|
| ||||||
|
Diluted Per Common Share Data: |
|
|
|
|
|
|
|
|
|
|
|
|
| ||||||
|
(Loss) income from continuing operations |
|
$ |
(0.42 |
) |
$ |
0.22 |
|
$ |
(0.20 |
) |
$ |
0.09 |
|
$ |
(0.11 |
) |
$ |
(8.83 |
) |
|
(Loss) income from discontinued operations, net of income taxes |
|
(0.03 |
) |
(0.18 |
) |
(0.20 |
) |
— |
|
(0.21 |
) |
(0.02 |
) | ||||||
|
Diluted (loss) income per share |
|
$ |
(0.45 |
) |
$ |
0.04 |
|
$ |
(0.40 |
) |
$ |
0.09 |
|
$ |
(0.32 |
) |
$ |
(8.85 |
) |
|
Shares used to compute diluted per common share amounts |
|
35,498 |
|
35,733 |
|
35,579 |
|
35,748 |
|
35,614 |
|
35,697 |
| ||||||
HANGER, INC.
QUARTERLY CONSOLIDATED STATEMENTS OF CASH FLOWS
(dollars in thousands)
(Unaudited)
|
|
|
Three Months Ended |
|
Six Months Ended |
|
Nine Months Ended |
| |||
|
|
|
March 31, 2016 |
|
June 30, 2016 |
|
September 30, 2016 |
| |||
|
Cash flows from operating activities: |
|
|
|
|
|
|
| |||
|
Net loss |
|
$ |
(17,537 |
) |
$ |
(17,865 |
) |
$ |
(25,343 |
) |
|
Income from discontinued operations, net of income taxes |
|
— |
|
572 |
|
950 |
| |||
|
Loss from continuing operations |
|
(17,537 |
) |
(18,437 |
) |
(26,293 |
) | |||
|
|
|
|
|
|
|
|
| |||
|
Adjustments to reconcile net loss to net cash (used in) provided by operating activities: |
|
|
|
|
|
|
| |||
|
Depreciation and amortization |
|
11,728 |
|
23,388 |
|
34,727 |
| |||
|
Provision for doubtful accounts |
|
4,249 |
|
5,780 |
|
7,546 |
| |||
|
Stock-based compensation expense |
|
2,948 |
|
5,425 |
|
7,552 |
| |||
|
Amortization of debt issuance costs |
|
766 |
|
1,618 |
|
2,845 |
| |||
|
Loss (gain) on extinguishment of debt |
|
— |
|
(10 |
) |
6,031 |
| |||
|
Gain on sale and disposal of fixed assets |
|
(704 |
) |
(1,213 |
) |
(1,901 |
) | |||
|
|
|
|
|
|
|
|
| |||
|
Changes in operating assets and liabilities, net of effects of acquired companies: |
|
|
|
|
|
|
| |||
|
Net accounts receivable |
|
20,522 |
|
23,102 |
|
28,336 |
| |||
|
Inventories |
|
(685 |
) |
(2,614 |
) |
(6,085 |
) | |||
|
Other current assets |
|
(2,055 |
) |
(602 |
) |
421 |
| |||
|
Income taxes |
|
(8,640 |
) |
(9,671 |
) |
20,994 |
| |||
|
Accounts payable |
|
(13,287 |
) |
14,608 |
|
4,259 |
| |||
|
Accrued expenses and accrued interest payable |
|
6,301 |
|
134 |
|
(7,152 |
) | |||
|
Accrued compensation related costs |
|
(23,037 |
) |
(24,396 |
) |
(25,975 |
) | |||
|
Other liabilities |
|
(223 |
) |
(1,230 |
) |
(2,060 |
) | |||
|
Net cash (used in) provided by operating activities - continuing operations |
|
(19,654 |
) |
15,882 |
|
43,245 |
| |||
|
Net cash used in operating activities - discontinued operations |
|
— |
|
(850 |
) |
(1,425 |
) | |||
|
Net cash (used in) provided by operating activities |
|
(19,654 |
) |
15,032 |
|
41,820 |
| |||
|
|
|
|
|
|
|
|
| |||
|
Cash flows from investing activities: |
|
|
|
|
|
|
| |||
|
Purchase of property, plant and equipment |
|
(6,364 |
) |
(9,963 |
) |
(13,943 |
) | |||
|
Purchase of equipment leased to third parties under operating leases |
|
(608 |
) |
(1,190 |
) |
(1,914 |
) | |||
|
Restricted cash |
|
4 |
|
2,676 |
|
2,716 |
| |||
|
Purchase of company-owned life insurance investment |
|
(2,543 |
) |
(2,543 |
) |
(2,543 |
) | |||
|
Proceeds from sale of property, plant and equipment |
|
1,136 |
|
1,922 |
|
2,647 |
| |||
|
Other investing activities, net |
|
(10 |
) |
(10 |
) |
(10 |
) | |||
|
Net cash used in investing activities - continuing operations |
|
(8,385 |
) |
(9,108 |
) |
(13,047 |
) | |||
|
Net cash provided by investing activities - discontinued operations |
|
— |
|
850 |
|
1,425 |
| |||
|
Net cash used in investing activities |
|
(8,385 |
) |
(8,258 |
) |
(11,622 |
) | |||
|
|
|
|
|
|
|
|
| |||
|
Cash flows from financing activities: |
|
|
|
|
|
|
| |||
|
Borrowings under term loan |
|
— |
|
— |
|
274,400 |
| |||
|
Repayment of term loan |
|
(4,219 |
) |
(8,438 |
) |
(14,063 |
) | |||
|
Borrowings under revolving credit agreement |
|
— |
|
— |
|
20,000 |
| |||
|
Repayments under revolving credit agreement |
|
— |
|
— |
|
(144,000 |
) | |||
|
Payment of senior notes |
|
— |
|
— |
|
(200,000 |
) | |||
|
Payment on seller’s note and other contingent consideration |
|
(4,536 |
) |
(5,817 |
) |
(7,751 |
) | |||
|
Payment of capital lease obligations |
|
(230 |
) |
(494 |
) |
(702 |
) | |||
|
Payment of debt issuance costs and fees |
|
(1,767 |
) |
(1,767 |
) |
(15,832 |
) | |||
|
Net cash used in financing activities - continuing operations |
|
(10,752 |
) |
(16,516 |
) |
(87,948 |
) | |||
|
|
|
|
|
|
|
|
| |||
|
Decrease in cash and cash equivalents |
|
(38,791 |
) |
(9,742 |
) |
(57,750 |
) | |||
|
Cash and cash equivalents, at beginning of year |
|
58,753 |
|
58,753 |
|
58,753 |
| |||
|
Cash and cash equivalents, at end of period |
|
$ |
19,962 |
|
$ |
49,011 |
|
$ |
1,003 |
|
|
|
|
|
|
|
|
|
| |||
|
SUPPLEMENTAL CASH FLOW FINANCIAL INFORMATION: |
|
|
|
|
|
|
| |||
|
|
|
|
|
|
|
|
| |||
|
Cash paid during the period for: |
|
|
|
|
|
|
| |||
|
Interest |
|
$ |
3,759 |
|
$ |
15,111 |
|
$ |
30,850 |
|
|
Income taxes paid (refunds received) |
|
168 |
|
1,077 |
|
(33,821 |
) | |||
|
|
|
|
|
|
|
|
| |||
|
Non-cash financing and investing activities: |
|
|
|
|
|
|
| |||
|
Additions to property, plant and equipment acquired through finance obligations |
|
162 |
|
213 |
|
269 |
| |||
|
Retirements of financed property, plant and equipment |
|
1,663 |
|
2,157 |
|
2,228 |
| |||
|
Purchase of property, plant and equipment in accounts payable |
|
747 |
|
998 |
|
1,900 |
| |||
HANGER, INC.
QUARTERLY CONSOLIDATED STATEMENTS OF CASH FLOWS
(dollars in thousands)
(Unaudited)
|
|
|
Three Months Ended |
|
Six Months Ended |
|
Nine Months Ended |
| |||
|
|
|
March 31, 2015 |
|
June 30, 2015 |
|
September 30, 2015 |
| |||
|
Cash flows from operating activities: |
|
|
|
|
|
|
| |||
|
Net loss |
|
$ |
(15,970 |
) |
$ |
(14,383 |
) |
$ |
(11,303 |
) |
|
Loss from discontinued operations, net of income taxes |
|
(967 |
) |
(7,310 |
) |
(7,310 |
) | |||
|
Loss from continuing operations |
|
(15,003 |
) |
(7,073 |
) |
(3,993 |
) | |||
|
|
|
|
|
|
|
|
| |||
|
Adjustments to reconcile net loss to net cash (used in) provided by operating activities: |
|
|
|
|
|
|
| |||
|
Depreciation and amortization |
|
10,230 |
|
20,146 |
|
30,386 |
| |||
|
Provision for doubtful accounts |
|
3,696 |
|
6,935 |
|
9,983 |
| |||
|
Impairment of long-lived and intangible assets |
|
— |
|
— |
|
812 |
| |||
|
Stock-based compensation expense |
|
2,500 |
|
5,069 |
|
7,731 |
| |||
|
Benefit for deferred income taxes |
|
(373 |
) |
(373 |
) |
(373 |
) | |||
|
Amortization of debt issuance costs |
|
580 |
|
1,327 |
|
2,097 |
| |||
|
Gain on sale and disposal of fixed assets |
|
(216 |
) |
(776 |
) |
(1,649 |
) | |||
|
|
|
|
|
|
|
|
| |||
|
Changes in operating assets and liabilities, net of effects of acquired companies: |
|
|
|
|
|
|
| |||
|
Net accounts receivable |
|
10,917 |
|
3,284 |
|
(2,432 |
) | |||
|
Inventories |
|
(2,115 |
) |
(2,043 |
) |
(3,689 |
) | |||
|
Other current assets |
|
(1,251 |
) |
815 |
|
623 |
| |||
|
Income taxes |
|
(14,745 |
) |
(21,896 |
) |
(21,095 |
) | |||
|
Accounts payable |
|
6,647 |
|
5,289 |
|
5,899 |
| |||
|
Accrued expenses and accrued interest payable |
|
1,130 |
|
1,981 |
|
6,079 |
| |||
|
Accrued compensation related costs |
|
(14,136 |
) |
(13,281 |
) |
(7 |
) | |||
|
Other liabilities |
|
7,284 |
|
3,402 |
|
2,717 |
| |||
|
Net cash (used in) provided by operating activities - continuing operations |
|
(4,855 |
) |
2,806 |
|
33,089 |
| |||
|
Net cash used in operating activities - discontinued operations |
|
(3,348 |
) |
(4,425 |
) |
(4,942 |
) | |||
|
Net cash (used in) provided by operating activities |
|
(8,203 |
) |
(1,619 |
) |
28,147 |
| |||
|
|
|
|
|
|
|
|
| |||
|
Cash flows from investing activities: |
|
|
|
|
|
|
| |||
|
Purchase of property, plant and equipment |
|
(8,583 |
) |
(16,150 |
) |
(22,133 |
) | |||
|
Purchase of equipment leased to third parties under operating leases |
|
(1,007 |
) |
(2,525 |
) |
(3,324 |
) | |||
|
Acquisitions, net of cash acquired |
|
(10,215 |
) |
(10,215 |
) |
(10,215 |
) | |||
|
Restricted cash |
|
20 |
|
978 |
|
1,031 |
| |||
|
Purchase of company-owned life insurance investment |
|
(2,544 |
) |
(2,544 |
) |
(2,544 |
) | |||
|
Proceeds from sale of property, plant and equipment |
|
2,087 |
|
2,410 |
|
3,960 |
| |||
|
Other investing activities, net |
|
(4 |
) |
(36 |
) |
(43 |
) | |||
|
Net cash used in investing activities - continuing operations |
|
(20,246 |
) |
(28,082 |
) |
(33,268 |
) | |||
|
Net cash provided by investing activities - discontinued operations |
|
3,286 |
|
4,393 |
|
4,831 |
| |||
|
Net cash used in investing activities |
|
(16,960 |
) |
(23,689 |
) |
(28,437 |
) | |||
|
|
|
|
|
|
|
|
| |||
|
Cash flows from financing activities: |
|
|
|
|
|
|
| |||
|
Repayment of term loan |
|
(2,813 |
) |
(5,626 |
) |
(9,845 |
) | |||
|
Borrowings under revolving credit agreement |
|
72,000 |
|
95,000 |
|
120,000 |
| |||
|
Repayments under revolving credit agreement |
|
(23,000 |
) |
(48,000 |
) |
(83,000 |
) | |||
|
Payment on seller’s note and other contingent consideration |
|
(5,297 |
) |
(7,852 |
) |
(11,314 |
) | |||
|
Payment of capital lease obligations |
|
(305 |
) |
(624 |
) |
(826 |
) | |||
|
Payment of debt issuance costs and fees |
|
(718 |
) |
(1,111 |
) |
(1,792 |
) | |||
|
Net cash provided by financing activities - continuing operations |
|
39,867 |
|
31,787 |
|
13,223 |
| |||
|
|
|
|
|
|
|
|
| |||
|
Increase in cash and cash equivalents |
|
14,704 |
|
6,479 |
|
12,933 |
| |||
|
Cash and cash equivalents, at beginning of year |
|
11,699 |
|
11,699 |
|
11,699 |
| |||
|
Cash and cash equivalents, at end of period |
|
$ |
26,403 |
|
$ |
18,178 |
|
$ |
24,632 |
|
|
|
|
|
|
|
|
|
| |||
|
SUPPLEMENTAL CASH FLOW FINANCIAL INFORMATION: |
|
|
|
|
|
|
| |||
|
|
|
|
|
|
|
|
| |||
|
Cash paid during the period for: |
|
|
|
|
|
|
| |||
|
Interest |
|
$ |
3,077 |
|
$ |
12,584 |
|
$ |
16,102 |
|
|
Income taxes paid |
|
9,665 |
|
17,540 |
|
17,873 |
| |||
|
|
|
|
|
|
|
|
| |||
|
Non-cash financing and investing activities: |
|
|
|
|
|
|
| |||
|
Issuance of seller notes in connection with acquisitions |
|
4,662 |
|
4,662 |
|
4,662 |
| |||
|
Additions to property, plant and equipment acquired through finance obligations |
|
1,835 |
|
3,197 |
|
3,416 |
| |||
|
Retirements of financed property, plant and equipment |
|
171 |
|
374 |
|
1,076 |
| |||
|
Purchase of property, plant and equipment in accounts payable |
|
1,613 |
|
1,153 |
|
1,665 |
| |||
|
Exhibit |
|
Document |
|
3.1 |
|
|
|
3.2 |
|
|
|
3.3 |
|
|
|
4.1 |
|
|
|
4.2 |
|
|
|
4.3 |
|
|
|
4.4 |
|
|
|
4.5 |
|
|
|
4.6 |
|
|
|
4.7 |
|
|
|
4.8 |
|
|
|
4.9 |
|
|
|
4.10 |
|
|
|
4.11 |
|
|
|
4.12 |
|
|
|
4.13 |
|
|
|
4.14 |
|
|
|
4.15 |
|
|
4.16 |
|
|
|
4.17 |
|
|
|
4.18 |
|
|
|
4.19 |
|
|
|
4.20 |
|
|
|
10.1 |
|
|
|
10.2 |
|
|
|
10.3 |
|
|
|
10.4 |
|
|
|
10.5 |
|
|
|
10.6 |
|
|
|
10.7 |
|
|
|
10.8 |
|
|
|
10.9 |
|
|
|
10.10 |
|
|
|
10.11 |
|
|
|
10.12 |
|
|
|
10.13 |
|
|
|
10.14 |
|
|
|
10.15 |
|
|
|
10.16 |
|
|
10.17 |
|
|
|
10.18 |
|
|
|
10.19 |
|
|
|
10.20 |
|
|
|
10.21 |
|
|
|
10.22 |
|
|
|
10.23 |
|
|
|
10.24 |
|
|
|
10.25 |
|
|
|
10.26 |
|
|
|
10.27 |
|
|
|
10.28 |
|
|
|
10.29 |
|
|
|
10.30 |
|
|
|
10.31 |
|
|
|
10.32 |
|
|
|
10.33 |
|
|
|
10.34 |
|
|
|
10.35 |
|
|
|
21 |
|
|
|
31.1 |
|
|
|
31.2 |
|
|
32 |
|
|
|
101.INS |
|
XBRL Instance Document. (Filed herewith.) |
|
101.SCH |
|
XBRL Taxonomy Extension Schema. (Filed herewith.) |
|
101.CAL |
|
XBRL Taxonomy Extension Calculation Linkbase. (Filed herewith.) |
|
101.LAB |
|
XBRL Taxonomy Extension Label Linkbase. (Filed herewith.) |
|
101.PRE |
|
XBRL Taxonomy Extension Presentation Linkbase. (Filed herewith.) |
|
101.DEF |
|
XBRL Taxonomy Extension Definition Linkbase. (Filed herewith.) |
* Management contract or compensatory plan