Attached files
| file | filename |
|---|---|
| EX-32 - EXHIBIT 32 - HANGER, INC. | a2196899zex-32.htm |
| EX-21 - EXHIBIT 21 - HANGER, INC. | a2196899zex-21.htm |
| EX-23.1 - EXHIBIT 23.1 - HANGER, INC. | a2196899zex-23_1.htm |
| EX-10.(D) - EXHIBIT 10(D) - HANGER, INC. | a2196899zex-10_d.htm |
| EX-31.1 - EXHIBIT 31.1 - HANGER, INC. | a2196899zex-31_1.htm |
| EX-31.2 - EXHIBIT 31.2 - HANGER, INC. | a2196899zex-31_2.htm |
Use these links to rapidly review the document
TABLE OF CONTENTS
INDEX TO FINANCIAL STATEMENTS
SECURITIES AND EXCHANGE COMMISSION
WASHINGTON, D.C. 20549
FORM 10-K
ý |
ANNUAL REPORT PURSUANT TO SECTION 13 OR 15(d) OF THE SECURITIES EXCHANGE ACT OF 1934. |
|
For the fiscal year ended December 31, 2009 |
||
OR |
||
o |
TRANSITION REPORT PURSUANT TO SECTION 13 OR 15(d) OF THE SECURITIES EXCHANGE ACT OF 1934. |
|
For the transition period from to |
||
Commission File Number 1-10670
HANGER ORTHOPEDIC GROUP, INC.
(Exact name of registrant as specified in its charter.)
| Delaware (State or other jurisdiction of incorporation or organization) |
84-0904275 (I.R.S. Employer Identification No.) |
|
Two Bethesda Metro Center (Suite 1200), Bethesda, MD (Address of principal executive offices) |
20814 (Zip Code) |
Registrant's phone number, including area code: (301) 986-0701
Securities registered pursuant to Section 12(b) of the Act:
| Title of class | Name of exchange on which registered | |
|---|---|---|
| Common Stock, par value $0.01 per share | New York Stock Exchange |
Securities registered pursuant to Section 12(g) of the Act: None.
Indicate by check mark whether the registrant is a well-known seasoned issuer, as defined in Rule 405 of the Securities Act Yes o No ý
Indicate by check mark if the registrant is not required to file reports pursuant to Section 13 or Section 15(d) of the Act. Yes o No ý
Indicate by check mark whether the registrant (1) has filed all reports required to be filed by Section 13 or 15(d) of the Securities Exchange Act of 1934 during the preceding 12 months (or for such shorter period that the registrant was required to file such reports), and (2) has been subject to such filing requirements for the past 90 days: Yes ý No o
Indicate by check mark if disclosure of delinquent filers pursuant to Item 405 of Regulation S-K is not contained herein, and will not be contained, to the best of registrant's knowledge, in definitive proxy or information statements incorporated by reference in Part III of this Form 10-K or any amendment to this Form 10-K. ý
Indicate by check mark whether the registrant has submitted electronically and posted on its corporate Web site, if any, every Interactive Data File required to be submitted and posted pursuant to Rule 405 of Regulation S-T (232.405 of this chapter) during the preceding 12 months (or for such shorter period that the registrant was required to submit and post such files. Yes o No o
Indicate by check mark whether the registrant is a large accelerated filer, an accelerated filer, or a non-accelerated filer. See definition of "accelerated filer and large accelerated filer" in Rule 12b-2 of the Exchange Act. (Check one).
| Large accelerated filer o | Accelerated filer ý | Non-accelerated filer o | Smaller reporting company o |
Indicate by check mark whether the registrant is a shell company as defined in Rule 12b-2 of the Exchange Act. Yes o No ý
State the aggregate market value of the registrant's voting and non-voting common equity held by non-affiliates of the registrant computed by reference to the price at which the common equity was last sold, or the average bid and asked price of such common equity, as of the last business day of the registrant's most recently completed second fiscal quarter. $428,417,262
As of February 22, 2010 the registrant had 31,901,708 shares of its Common Stock issued and outstanding.
DOCUMENTS INCORPORATED BY REFERENCE
The information called for by Part III of the Form 10-K is incorporated by reference from the registrant's definitive proxy statement or amendment hereto which will be filed not later than 120 days after the end of the fiscal year covered by this report.
INDEX
2
Business Overview
General
We are the largest owner and operator of orthotic and prosthetic ("O&P") patient-care centers ("patient -care centers") in the United States, accounting for approximately 27% of the estimated $2.6 billion O&P patient-care market. At December 31, 2009, we operated 677 O&P patient-care centers in 45 states and the District of Columbia and employed in excess of 1,000 revenue-generating O&P practitioners ("practitioners"). In addition, through our wholly-owned subsidiary, Southern Prosthetic Supply, Inc. ("SPS"), we are the largest distributor of branded and private label O&P devices and components in the United States, all of which are manufactured by third parties. We also create new products, through our wholly-owned subsidiary, Innovative Neurotronics, Inc. ("IN, Inc.") for patients who have had a loss of mobility due to strokes, multiple sclerosis or other similar conditions. Another subsidiary, Linkia LLC ("Linkia"), develops programs to manage all aspects of O&P patient care for large private payors.
For the years ended December 31, 2009, 2008, and 2007, our net sales were $760.1 million, $703.1 million, and $637.4 million, respectively. We recorded net income of $36.1 million, $26.7 million, and $19.3 million, for the years ended December 31, 2009, 2008, and 2007, respectively.
We conduct our operations in two segments—patient care services and distribution. For the year ended December 31, 2009, net sales attributable to our patient-care services segment and distribution segment were $670.4 and $88.0 million, respectively, and for the year ended December 31, 2008, net sales attributable to our patient-care services segment and distribution segment were $620.0 million and $80.7 million, respectively. See Note P to our consolidated financial statements contained herein elsewhere in this Annual Report on Form 10-K for financial information about our segments.
Industry Overview
We estimate that the O&P patient care market in the United States is approximately $2.6 billion, of which we account for approximately 27%. The O&P patient care services market is highly fragmented and is characterized by local, independent O&P businesses, with the majority generally having a single facility with annual revenues of less than $1.0 million. We do not believe that any of our patient care competitors account for a market share of more than 2% of the country's total estimated O&P patient care services revenue.
The care of O&P patients is part of a continuum of rehabilitation services including diagnosis, treatment and prevention of future injury. This continuum involves the integration of several medical disciplines that begins with the attending physician's diagnosis. A patient's course of treatment is generally determined by an orthopedic surgeon, vascular surgeon or physiatrist, who writes a prescription and refers the patient to an O&P patient care services provider for treatment. A practitioner then, using the prescription, consults with both the referring physician and the patient to formulate the design of an orthotic or prosthetic device to meet the patient's needs.
The O&P industry is characterized by stable, recurring revenues, primarily resulting from the need for periodic replacement and modification of O&P devices. Based on our experience, the average replacement time for orthotic devices is one to three years, while the average replacement time for prosthetic devices is three to five years. There is also an attendant need for continuing O&P patient care services. In addition to the inherent need for periodic replacement and modification of O&P
3
devices and continuing care, we expect the demand for O&P services will continue to grow as a result of several key trends, including:
Aging U.S. Population. The growth rate of the over-65 age group is nearly triple that of the under-65 age group. There is a direct correlation between age and the onset of diabetes and vascular disease, which are the leading causes of amputations. With broader medical insurance coverage, increasing disposable income, longer life expectancy, greater mobility expectations and improved technology of O&P devices, we believe the elderly will increasingly seek orthopedic rehabilitation services and products.
Growing Physical Health Consciousness. The emphasis on physical fitness, leisure sports and conditioning, such as running and aerobics, is growing, which has led to increased injuries requiring orthopedic rehabilitative services and products. These trends are evidenced by the increasing demand for new devices that provide support for injuries, prevent further or new injuries or enhance physical performance.
Increased Efforts to Reduce Healthcare Costs. O&P services and devices have enabled patients to become ambulatory more quickly after receiving medical treatment in the hospital. We believe that significant cost savings can be achieved through the early use of O&P services and products. The provision of O&P services and products in many cases reduces the need for more expensive treatments, thus representing a cost savings to third-party payors.
Advancing Technology. The range and effectiveness of treatment options for patients requiring O&P services have increased in connection with the technological sophistication of O&P devices. Advances in design technology and lighter, stronger and more cosmetically acceptable materials have enabled patients to replace older O&P devices with new O&P products that provide greater comfort, protection and patient acceptability. As a result, treatment can be more effective or of shorter duration, giving the patient greater mobility and a more active lifestyle. Advancing technology has also increased the prevalence and visibility of O&P devices in many sports, including skiing, running and tennis.
Competitive Strengths
We believe the combination of the following competitive strengths will help us in growing our business through an increase in our net sales, net income and market share:
- •
- Leading market position, with an approximate 27% share of total industry revenues and operations in 45 states and the
District of Columbia, in an otherwise fragmented industry;
- •
- National scale of operations, which has better enabled us to:
- •
- establish our brand name and generate economies of scale;
- •
- implement best practices throughout the Company;
- •
- utilize shared fabrication facilities;
- •
- contract with national and regional managed care entities;
- •
- identify, test and deploy emerging technology; and
- •
- increase our influence on, and input into, regulatory trends;
- •
- Distribution of, and purchasing power for, O&P components and finished O&P products, which enables us
to:
- •
- negotiate greater purchasing discounts from manufacturers and freight providers;
4
- •
- reduce patient-care center inventory levels and improve inventory turns through centralized purchasing
control;
- •
- quickly access prefabricated and finished O&P products;
- •
- promote the usage by our patient-care centers of clinically appropriate products that also enhance our profit
margins;
- •
- engage in co-marketing and O&P product development programs with suppliers; and
- •
- expand the non-Hanger client base of our distribution segment;
- •
- Development of leading-edge technology to be brought to market through our patient practices and licensed
distributors worldwide;
- •
- Full O&P product offering, with a balanced mix between orthotics services and products and prosthetics services and
products;
- •
- Practitioner compensation plans that financially reward practitioners for their efficient management of accounts
receivable collections, labor, materials, and other costs, and encourage cooperation among our practitioners within the same local market area;
- •
- Proven ability to rapidly incorporate technological advances in the fitting and fabrication of O&P devices;
- •
- History of successful integration of small and medium-sized O&P business acquisitions, including 83 O&P businesses since
1997, representing over 204 patient-care centers;
- •
- Highly trained practitioners, whom we provide with the highest level of continuing education and training through programs
designed to inform them of the latest technological developments in the O&P industry, and our certification program located at the University of Connecticut; and
- •
- Experienced and committed management team; and
- •
- Successful government relations efforts including:
- •
- Supported our patients' efforts to pass "The Prosthetic Parity Act" in 11 states;
- •
- Increased Medicaid reimbursement levels in several states; and
- •
- Created the Hanger Orthopedic Political Action Committee (The Hanger PAC).
Business Strategy
Our goal is to continue to provide superior patient care and to be the most cost-efficient, full service, national O&P operator. The key elements of our strategy to achieve this goal are to:
- •
- Improve our performance by:
- •
- developing and deploying new processes to improve the productivity of our practitioners;
- •
- continuing periodic patient evaluations to gauge patients' device and service satisfaction;
- •
- improving the utilization and efficiency of administrative and corporate support services;
- •
- enhancing margins through continued consolidation of vendors and product offering; and
- •
- leveraging our market share to increase sales and enter into more competitive payor contracts;
5
- •
- Increase our market share and net sales by:
- •
- continued marketing of Linkia to regional and national providers and contracting with national and regional managed care
providers who we believe select us as a preferred O&P provider because of our reputation, national reach, density of our patient-care centers in certain markets and our ability to monitor
quality and outcomes as well as reducing administrative expenses;
- •
- increasing our volume of business through enhanced comprehensive marketing programs aimed at referring physicians and
patients, such as our Patient Evaluation Clinics program, which reminds patients to have their devices serviced or replaced and informs them of technological improvements of which they can take
advantage; and our "People in Motion" program which introduces potential patients to the latest O&P technology;
- •
- expanding the breadth of products being offered out of our patient-care centers; and
- •
- increasing the number of practitioners through our residency program;
- •
- Develop businesses that provide services and products to the broader rehabilitation and post-surgical
healthcare areas;
- •
- Continue to create, license or patent and market devices based on new cutting edge technology. We anticipate bringing new
technology to the market through our IN, Inc. product line. The first new product, the WalkAide System, was released for sale on May 1, 2006;
- •
- Selectively acquire small and medium-sized O&P patient care service businesses and open satellite patient-care
centers primarily to expand our presence within an existing market and secondarily to enter into new markets; and
- •
- Develop new delivery channels for our traditional O&P products; and
- •
- Provide our practitioners with:
- •
- the training necessary to utilize existing technology for different patient service facets, such as the use of our
Insignia scanning system for burns and cranial helmets;
- •
- career development and increased compensation opportunities;
- •
- a wide array of O&P products from which to choose;
- •
- administrative and corporate support services that enable them to focus their time on providing superior patient care; and
- •
- selective application of new technology to improve patient care.
Business Description
Patient Care Services
As of December 31, 2009, we provided O&P patient care services through 677 patient-care centers and over 1,000 practitioners in 45 states and the District of Columbia. Substantially all of our practitioners are certified, or are candidates for formal certification, by the O&P industry certifying boards. One or more practitioners closely manage each of our patient-care centers. Our patient-care centers also employ highly trained technical personnel who assist in the provision of services to patients and who fabricate various O&P devices, as well as office administrators who schedule patient visits, obtain approvals from payors and bill and collect for services rendered.
An attending physician determines a patient's treatment, writes a prescription and refers the patient to one of our patient-care centers. Our practitioners then consult with both the referring
6
physician and the patient with a view toward assisting in the formulation of the prescription for, and design of, an orthotic or prosthetic device to meet the patient's need.
The fitting process often involves several stages in order to successfully achieve desired functional and cosmetic results. The practitioner creates a cast and takes detailed measurements, frequently using our digital imaging system (Insignia), of the patient to ensure an anatomically correct fit. Prosthetic devices are custom fabricated by technicians and fit by skilled practitioners. The majority of the orthotic devices provided by us are custom designed, fabricated and fit; the remainder are prefabricated but custom fit.
Custom devices are fabricated by our skilled technicians using the plaster castings, measurements and designs made by our practitioners as well as utilization of our proprietary Insignia system. The Insignia system replaces plaster casting of a patient's residual limb with the generation of a computer scanned image. Insignia provides a very accurate image, faster turnaround for the patient, and a more professional overall experience. Technicians use advanced materials and technologies to fabricate a custom device under quality assurance guidelines. Custom designed devices that cannot be fabricated at the patient-care centers are fabricated at one of several central fabrication facilities. After final adjustments to the device by the practitioner, the patient is instructed in the use, care and maintenance of the device. Training programs and scheduled follow-up and maintenance visits are used to provide post-fitting treatment, including adjustments or replacements as the patient's physical condition and lifestyle change.
To provide timely service to our patients, we employ technical personnel and maintain laboratories at many of our patient-care centers. We have earned a strong reputation within the O&P industry for the development and use of innovative technology in our products, which has increased patient comfort and capability, and can significantly enhance the rehabilitation process. The quality of our products and the success of our technological advances have generated broad media coverage, building our brand equity among payors, patients and referring physicians.
A substantial portion of our O&P services involves the treatment of a patient in a non-hospital setting, such as our patient-care centers, a physician's office, an out-patient clinic or other facility. In addition, O&P services are increasingly rendered to patients in hospitals, long-term care facilities, rehabilitation centers and other alternate-site healthcare facilities. In a hospital setting, the practitioner works with a physician to provide either orthotic devices or temporary prosthetic devices that are later replaced by permanent prosthetic devices.
Patient-Care Center Administration
We provide all accounting, accounts payable, payroll, sales and marketing, management information systems, real estate, acquisitions and human resources services for our patient-care centers on either a centralized or out-sourced basis. As a result, we are able to provide these services more efficiently and cost-effectively than if these services had to be generated at each patient-care center. Moreover, the centralization or out-sourcing of these services permits our practitioners to allocate a greater portion of their time to patient care activities by reducing their administrative responsibilities.
We also develop and implement programs designed to increase sales and enhance the efficiency of our patient-care centers. These programs include: (i) sales and marketing initiatives to attract new patient referrals by establishing relationships with physicians, therapists, employers, managed care organizations, hospitals, rehabilitation centers, out-patient clinics and insurance companies; (ii) professional management and information systems to improve efficiencies of administrative and operational functions; (iii) professional education programs for practitioners emphasizing new developments in the increasingly sophisticated field of O&P clinical therapy; (iv) the establishment of shared fabrication and centralized purchasing activities, which provide access to component parts and products within two business days at prices that are typically lower than traditional procurement
7
methods; (v) access to virtually every product available at lower cost due to the combined purchasing power of our patient-care centers; and (vi) access to technology, such as Insignia, that is not available to our competitors.
Distribution Services
We distribute O&P components to the O&P market as a whole and to our own patient-care centers through our wholly-owned subsidiary, SPS, which is the nation's largest O&P distributor. We are also a leading manufacturer and distributor of therapeutic footwear for diabetic patients in the podiatric market. For the year ended December 31, 2009, 36.2% or approximately $88.0 million of SPS' distribution sales were to third-party O&P services providers, and the balance of approximately $155.0 million represented intercompany sales to our patient-care centers. SPS maintains in inventory approximately 25,000 O&P related items, all of which are manufactured by other companies. SPS maintains distribution facilities in California, Florida, Georgia, Pennsylvania, and Texas, which allows us to deliver products via ground shipment anywhere in the contiguous United States typically within two business days.
Our distribution business enables us to:
- •
- lower our material costs by negotiating purchasing discounts from manufacturers;
- •
- reduce our patient-care center inventory levels and improve inventory turns through centralized purchasing
control;
- •
- quickly access prefabricated and finished O&P products;
- •
- perform inventory quality control;
- •
- encourage our patient-care centers to use clinically appropriate products that enhance our profit margins; and
- •
- coordinate new product development efforts with key vendor "partners".
This is accomplished at competitive prices as a result of our direct purchases from manufacturers.
Marketing of our distribution services is conducted on a national basis through a dedicated sales force, print and e-commerce catalogues and exhibits at industry and medical meetings and conventions. We direct specialized catalogues to segments of the healthcare industry, such as orthopedic surgeons, physical and occupational therapists, and podiatrists.
Product Development
IN, Inc. specializes in product development principally in the field of functional electrical stimulation. IN, Inc. identifies emerging MyoOrthotics Technologies® developed at research centers and universities throughout the world that use neuromuscular stimulation to improve the functionality of an impaired limb. MyoOrthotics Technologies® represents the merging of orthotic technologies with electrical stimulation. Working with the inventors under licensing and consulting agreements, IN, Inc. commercializes the design, obtains regulatory approvals, develops clinical protocols for the technology, and then introduces the devices to the marketplace through a variety of distribution channels. IN, Inc's. first product, the WalkAide System ("WalkAide"), has received FDA approval, achieved ISO 13485:2004 and ISO 9001:2000 certification, as well as the European CE Mark, which are widely accepted quality management standards for medical devices and related services. Additionally, in September 2007 the WalkAide earned the esteemed da Vinci Award for Adaptive Technologies from the National Multiple Sclerosis Society which honors outstanding engineering achievements in adaptive and assistive technology that provide solutions to accessibility issues for people with disabilities. In November 2008, the Centers for Medicare and Medicaid Services ("CMS") overturned a non-coverage
8
decision and assigned a specific E-code to the WalkAide, which is reimbursable for beneficiaries with foot drop due to incomplete spinal cord injuries. The code was effective January 1, 2009. IN, Inc is pursuing additional coverage for stroke rehabilition which represents the largest potential patient population. CMS has agreed to sponsor additional clinical trials in order to validate the WalkAide's clinical benefits to stroke patients. IN, Inc anticipates that theses trials will be completed in the first half of 2011. In addition to reimbursement from Medicare and Medicaid, IN, Inc has been working with commercial insurance companies and has had limited success in receiving coverage for the WalkAide. The WalkAide is sold in the United States through our patient care centers and SPS. IN, Inc. is also marketing the WalkAide internationally through licensed distributors.
Provider Network Management
Linkia is the first provider network management service company dedicated solely to serving the O&P market. Linkia is dedicated to managing the O&P services of national and regional insurance companies. Linkia partners with healthcare insurance companies by securing a national or regional contract either as a preferred provider or to manage their O&P network of providers. Linkia's network now totals over 1,000 O&P provider locations. As of December 31, 2009, Linkia had 35 contracts with national and regional providers.
Reimbursement
The principal reimbursement sources for our O&P services are:
- •
- private payor/third-party insurer sources, which consist of individuals, private insurance companies, HMOs, PPOs,
hospitals, vocational rehabilitation, workers' compensation programs and similar sources;
- •
- Medicare, a federally funded health insurance program providing health insurance coverage for persons aged 65 or older and
certain disabled persons, which provides reimbursement for O&P products and services based on prices set forth in fee schedules for 10 regional service areas;
- •
- Medicaid, a health insurance program jointly funded by federal and state governments providing health insurance coverage
for certain persons in financial need, regardless of age, which may supplement Medicare benefits for financially needy persons aged 65 or older; and
- •
- the U.S. Department of Veterans Affairs.
We estimate that government reimbursement, comprised of Medicare, Medicaid and the U.S. Department of Veterans Affairs, in the aggregate, accounted for approximately 40.5%, 39.7%, and 40.3% of our net sales in 2009, 2008, and 2007, respectively. These payors have set maximum reimbursement levels for O&P services and products. Medicare prices are adjusted each year based on the Consumer Price Index-Urban ("CPIU") unless congress acts to change or eliminate the adjustment. The Medicare price increases for 2010, 2009, 2008, and 2007 were 0.0%, 5.0%, 2.7%, and 4.3%, respectively. There can be no assurance that future changes will not reduce reimbursements for O&P services and products from these sources.
We enter into contracts with third-party payors that allow us to perform O&P services for a referred patient and be paid under the contract with the third-party payor. These contracts typically have a stated term of one to three years. These contracts generally may be terminated without cause by either party on 60 to 90 days' notice or on 30 days' notice if we have not complied with certain licensing, certification, program standards, Medicare or Medicaid requirements or other regulatory requirements. Reimbursement for services is typically based on a fee schedule negotiated with the third-party payor that reflects various factors, including geographic area and number of persons covered. Renewals can be impacted by competition from small independent O&P providers who from time to time will accept contracts with below market reimbursement in order to gain market share.
9
Through the normal course of business, we receive patient deposits on devices not yet delivered. At December 31, 2009 and 2008, we had received $0.9 million of deposits from our patients.
Suppliers
We purchase prefabricated O&P devices, components and materials that our technicians use to fabricate O&P products from in excess of 400 suppliers across the country. These devices, components and materials are used in the products we offer in our patient-care centers throughout the country. Currently, only four of our third-party suppliers accounted for more than 5% of our total patient care purchases. In addition, four of our purchased products accounted for a significant portion of total purchases from four of our existing suppliers.
Sales and Marketing
The individual practitioners in local patient-care centers historically have conducted our sales and marketing efforts. Due primarily to the fragmented nature of the O&P industry, the success of a particular patient-care center has been largely a function of its local reputation for quality of care, responsiveness and length of service in the local communities. Individual practitioners have relied almost exclusively on referrals from local physicians or physical therapists and typically are not involved in more sophisticated marketing techniques.
We have developed a centralized marketing department the goal of which is to augment the responsibilities of the individual practitioner, enabling the practitioner to focus more of his or her efforts on patient care. Our sales and marketing effort targets the following:
- •
- Marketing and Public Relations. Our objective is to
increase the visibility of the "Hanger" name by building relationships with major referral sources through activities such as co-sponsorship of sporting events and co-branding
of products. We also continue to explore creating alliances with certain vendors to market products and services on a nationwide basis.
- •
- Business Development. We have dedicated personnel in most
of our regions of operation who are responsible for arranging seminars, clinics and forums to educate and consult with patients and to increase the individual communities' awareness of the "Hanger"
name. These business development managers ("BDM") also meet with local referral and contract sources to help our practitioners develop new relationships in their markets.
- •
- Insurance Contracts. Linkia is actively seeking contracts
with national insurance companies to manage their network. We also have regional contract managers who negotiate with hospitals and regional payors.
- •
- Other Initiatives. We are constantly seeking and developing new technology and products to enable us to provide the highest quality patient-oriented care. We continue to use our Insignia laser scanning system, which enables our practitioners to create and modify a computer-based scan of patients' limbs to create more comprehensive patient records and a better prosthetic fit. Due to the improvement Insignia offers to our patient care, it has been an effective marketing tool for our practitioners. During 2006, the Company launched the WalkAide system for treatment of a condition commonly referred to as dropfoot. Management believes the product can broaden our traditional customer base and through distribution agreements will allow the Company to enter international markets.
Acquisitions
In 2009, we acquired seven O&P companies and related businesses, operating a total of 23 patient care centers and one fabrication facility, located in California, Iowa, Nebraska, New York, Pennsylvania, Washington, and Wyoming. The aggregate purchase price for these O&P businesses was $16.6 million.
10
In 2008, we acquired 13 O&P companies and related businesses, operating a total of 19 patient care centers, located in California, Colorado, Florida, Louisiana, Maine, New York, Ohio, and Washington. The aggregate purchase price for these O&P businesses, excluding potential contingent consideration provisions, was $13.5 million.
Competition
The O&P services industry is highly fragmented, consisting mainly of local O&P patient-care centers. The business of providing O&P patient care services is highly competitive in the markets in which we operate. We compete with numerous small independent O&P providers for referrals from physicians, therapists, employers, HMOs, PPOs, hospitals, rehabilitation centers, out-patient clinics and insurance companies on both a local and regional basis. We compete with other patient care service providers, including device manufacturers that have independent sales forces, on the basis of quality and timeliness of patient care, location of patient-care centers and pricing for services.
We also compete with independent O&P providers for the retention and recruitment of qualified practitioners. In certain markets, the demand for practitioners exceeds the supply of qualified personnel.
Government Regulation
We are subject to a variety of federal, state and local governmental regulations. We make every effort to comply with all applicable regulations through compliance programs, policies and procedures, manuals, and personnel training. Despite these efforts, we cannot guarantee that we will be in absolute compliance with all regulations at all times. Failure to comply with applicable governmental regulations may result in significant penalties, including exclusion from the Medicare and Medicaid programs, which would have a material adverse effect on our business.
Medical Device Regulation. We distribute products that are subject to regulation as medical devices by the U.S. Food and Drug Administration ("FDA") under the Federal Food, Drug and Cosmetic Act ("FDCA") and accompanying regulations. With the exception of two products which have been cleared for marketing as prescription medical devices under section 510(k) of the FDCA, we believe that the products we distribute, including O&P medical devices, accessories and components, are exempt from the FDA's regulations for pre-market clearance or approval requirements and from requirements relating to quality system regulation (except for certain recordkeeping and complaint handling requirements). We are required to adhere to regulations regarding adverse event reporting, establishment registration, and product listing; and we are subject to inspection by the FDA for compliance with all applicable requirements. Labeling and promotional materials also are subject to scrutiny by the FDA and, in certain circumstances, by the Federal Trade Commission. Our medical device operations are subject to inspection by the FDA for compliance with applicable FDA requirements, and the FDA has raised compliance concerns in connection with these investigations. We believe we have addressed these concerns and are in compliance with applicable FDA requirements, but we cannot assure that we will be found to be in compliance at all times. Non-compliance could result in a variety of civil and/or criminal enforcement actions, which could have a material adverse effect on our business and results of operations.
Fraud and Abuse. Violations of fraud and abuse laws are punishable by criminal and/or civil sanctions, including, in some instances, imprisonment and exclusion from participation in federal healthcare programs, including Medicare, Medicaid, U.S. Department of Veterans Affairs health programs and the Department of Defense's TRICARE program, formerly known as CHAMPUS. These laws, which include but are not limited to, antikickback laws, false claims laws, physician self-referral laws, and federal criminal healthcare fraud laws, are discussed in further detail below. We believe our billing practices, operations, and compensation and financial arrangements with referral sources and
11
others materially comply with applicable federal and state requirements. However, we cannot assure that such requirements will not be interpreted by a governmental authority in a manner inconsistent with our interpretation and application. The failure to comply, even if inadvertent, with any of these requirements could require us to alter our operations and/or refund payments to the government. Such refunds could be significant and could also lead to the imposition of significant penalties. Even if we successfully defend against any action against us for violation of these laws or regulations, we would likely be forced to incur significant legal expenses and divert our management's attention from the operation of our business. Any of these actions, individually or in the aggregate, could have a material adverse effect on our business and financial results.
Antikickback Laws. Our operations are subject to federal and state antikickback laws. The federal Antikickback Statute (Section 1128B(b) of the Social Security Act) prohibits persons or entities from knowingly and willfully soliciting, offering, receiving, or paying any remuneration in return for, or to induce, the referral of persons eligible for benefits under a federal healthcare program (including Medicare, Medicaid, the U.S. Department of Veterans Affairs health programs and TRICARE), or the ordering, purchasing, leasing, or arranging for, or the recommendation of purchasing, leasing or ordering of, items or services that may be paid for, in whole or in part, by a federal healthcare program. Courts have held that the statute may be violated when even one purpose (as opposed to a primary or sole purpose) of the renumeration is to induce referrals or other business.
Recognizing that the Antikickback Statute is broad and may technically prohibit beneficial arrangements, the Office of Inspector General of the Department of Health and Human Services has developed regulations addressing certain business arrangements that will offer protection from scrutiny under the Antikickback Statute. These "Safe Harbors" describe activities which may be protected from prosecution under the Antikickback Statute, provided that they meet all of the requirements of the applicable Safe Harbor. For example, the Safe Harbors cover activities such as offering discounts to healthcare providers and contracting with physicians or other individuals or entities that have the potential to refer business to us that would ultimately be billed to a federal healthcare program. Failure to qualify for Safe Harbor protection does not mean that an arrangement is illegal. Rather, the arrangement must be analyzed under the Antikickback Statute to determine whether there is an intent to pay or receive remuneration in return for referrals. Conduct and business arrangements that do not fully satisfy one of the Safe Harbors may result in increased scrutiny by government enforcement authorities. In addition, some states have antikickback laws that vary in scope and may apply regardless of whether a federal healthcare program is involved.
Our operations and business arrangements include, for example, discount programs or other financial arrangements with individuals and entities, such as lease arrangements with hospitals and certain participation agreements. Therefore, our operations and business arrangements are required to comply with the antikickback laws. Although our business arrangements and operations may not always satisfy all the criteria of a Safe Harbor, we believe that our operations are in material compliance with federal and state antikickback statutes.
HIPAA Violations. The Health Insurance Portability and Accountability Act ("HIPAA") provides criminal penalties for, among other offenses: health care fraud; theft or embezzlement with respect to a health care benefit program; false statements in connection with the delivery of or payment for health care benefits, items or services; and obstruction of criminal investigation of health care offenses. Unlike other federal laws, these offenses are not limited to Federal health care programs.
In addition, HIPAA authorizes the imposition of civil monetary penalties where a person offers or pays remuneration to any individual eligible for benefits under a federal healthcare program that such person knows or should know is likely to influence the individual to order or receive covered items or services from a particular provider, practitioner or supplier. Excluded from the definition of "remuneration" are incentives given to individuals to promote the delivery of preventive care (excluding
12
cash or cash equivalents), incentives of nominal value and certain differentials in or waivers of coinsurance and deductible amounts.
These laws may apply to certain of our operations. As noted above, we have established various types of discount programs and other financial arrangements with individuals and entities. We also bill third-party payors and other entities for items and services provided at our patient-care centers. While we endeavor to ensure that our discount programs and other financial arrangements, and billing practices comply with applicable laws, such programs, arrangements and billing practices could be subject to scrutiny and challenge under HIPAA.
False Claims Laws. We are also subject to federal and state laws prohibiting individuals or entities from knowingly presenting, or causing to be presented, claims for payment to third-party payors (including Medicare and Medicaid) that are false or fraudulent, are for items or services not provided as claimed, or otherwise contain misleading information. Each of our patient-care centers is responsible for the preparation and submission of reimbursement claims to third-party payors for items and services furnished to patients. In addition, our personnel may, in some instances, provide advice on billing and reimbursement to purchasers of our products. While we endeavor to assure that our billing practices comply with applicable laws, if claims submitted to payors are deemed to be false, fraudulent, or for items or services not provided as claimed, we may face liability for presenting or causing to be presented such claims.
Physician Self-Referral Laws. We are also subject to federal and state physician self-referral laws. With certain exceptions, the federal Medicare physician self-referral law (the "Stark Law") (Section 1877 of the Social Security Act) prohibits a physician from referring Medicare beneficiaries to an entity for "designated health services"—including prosthetic and orthotic devices and supplies—if the physician or the physician's immediate family member has a financial relationship with the entity. A financial relationship includes both ownership or investment interests and compensation arrangements. An entity that furnishes designated health services pursuant to a prohibited referral may not present or cause to be presented a claim or bill for such designated health services. Penalties for violating the Stark Law include denial of payment for the service, an obligation to refund any payments received, civil monetary penalties, and the possibility of being excluded from the Medicare or Medicaid programs.
With respect to ownership/investment interests, there is an exception under the Stark Law for referrals made to a publicly traded entity in which the physician or the physician's immediate family member has an investment interest if the entity's shares are generally available to the public at the time of the designated health service referral, and are traded on certain exchanges, including the New York Stock Exchange, and the entity had shareholders' equity exceeding $75.0 million for its most recent fiscal year or as an average during the three previous fiscal years. We meet these tests and, therefore, believe that referrals from physicians who have ownership interests in our stock, or whose immediate family members have ownership interests in our stock, should not result in liability under the Stark Law.
With respect to compensation arrangements, there are exceptions under the Stark Law that permit physicians to maintain certain business arrangements, such as personal service contracts and equipment or space leases, with healthcare entities to which they refer patients for designated health services. Unlike the Antikickback Statute, all of the elements of a Stark Law exception must be met in order for the exception to apply. We believe that our compensation arrangements with physicians comply with the Stark Law, either because the physician's relationship fits fully within a Stark Law exception or because the physician does not generate prohibited referrals. If, however, we receive a prohibited referral, our submission of a bill for services rendered pursuant to such a referral could subject us to sanctions under the Stark Law and applicable state self-referral laws. State self-referral laws may extend the prohibitions of the Stark Law to Medicaid beneficiaries.
13
Certification and Licensure. Our practitioners and/or certain operating units may be subject to certification or licensure requirements under the laws of some states. Most states do not require separate licensure for practitioners. However, several states currently require practitioners to be certified by an organization such as the American Board for Certification. The American Board for Certification conducts a certification program for practitioners and an accreditation program for patient-care centers. The minimum requirements for a certified practitioner are a college degree, completion of an accredited academic program, one to four years of residency at a patient-care center under the supervision of a certified practitioner and successful completion of certain examinations. Minimum requirements for an accredited patient-care center include the presence of a certified practitioner and specific plant and equipment requirements.
Some states may require licensure or registration of facilities that dispense or distribute prescription medical devices within or from outside of the state. In addition, some states may require a license or registration to provide services such as those offered by Linkia. We are in the process of meeting these requirements.
While we endeavor to comply with all state licensure requirements, we cannot assure that we will be in compliance at all times with these requirements. Failure to comply with state licensure requirements could result in suspension or termination of licensure, civil penalties, termination of our Medicare and Medicaid agreements, and repayment of amounts received from Medicare and Medicaid for services and supplies furnished by an unlicensed individual or entity.
Confidentiality and Privacy Laws. The Administrative Simplification Provisions of HIPAA, and their implementing regulations, set forth privacy standards and implementation specifications concerning the use and disclosure of individually identifiable health information (referred to as "protected health information") by health plans, healthcare clearinghouses and healthcare providers that transmit health information electronically in connection with certain standard transactions ("Covered Entities"). HIPAA further requires Covered Entities to protect the confidentiality of health information by meeting certain security standards and implementation specifications. In addition, under HIPAA, Covered Entities that electronically transmit certain administrative and financial transactions must utilize standardized formats and data elements ("the transactions/code sets standards"). HIPAA imposes civil monetary penalties for non-compliance, and, with respect to knowing violations of the privacy standards, or violations of such standards committed under false pretenses or with the intent to sell, transfer or use individually identifiable health information for commercial advantage, criminal penalties. We believe that we are subject to the Administrative Simplification Provisions of HIPAA and are taking steps to meet applicable standards and implementation specifications. The new requirements have had a significant effect on the manner in which we handle health data and communicate with payors. Our billing system, OPS, was designed to meet these requirements.
In addition, state confidentiality and privacy laws may impose civil and/or criminal penalties for certain unauthorized or other uses or disclosures of individually identifiable health information. We are also subject to these laws. While we endeavor to assure that our operations comply with applicable laws governing the confidentiality and privacy of health information, we could face liability in the event of a use or disclosure of health information in violation of one or more of these laws.
Personnel and Training
None of our employees are subject to a collective-bargaining agreement. We believe that we have satisfactory relationships with our employees and strive to maintain these relationships by offering competitive benefit packages, training programs and opportunities for advancement. During the year
14
ended December 31, 2009, we had an average of 3,636 employees. The following table summarizes our average number of employees for the year:
| |
Practitioners | Residents | Technicians | Administrative | Distribution | Corporate and Shared Services |
|||||||||||||
|---|---|---|---|---|---|---|---|---|---|---|---|---|---|---|---|---|---|---|---|
Hanger Prosthetics & Orthotics, Inc. |
1,106 | 90 | 563 | 1,359 | — | — | |||||||||||||
Southern Prosthetic Supply, Inc. |
— | — | — | — | 201 | — | |||||||||||||
Hanger Orthopedic Group, Inc. |
— | — | — | — | — | 317 | |||||||||||||
We have established an affiliation with the University of Hartford pursuant to which we own and operate a school at the Newington, Connecticut campus that offers a certificate in orthotics and/or prosthetics after the completion of a nine-month course. We believe there are only nine schools of this kind in the United States. The program director is a Hanger employee, and our practitioners teach most of the courses. After completion of the nine-month course, graduates receive a certificate and go on to complete a residency in their area of specialty. After their residency is complete, graduates can choose to complete a course of study in another area of specialty. Most graduates will then sit for a certification exam to either become a certified prosthetist or certified orthotist. We offer exam preparation courses for graduates who agree to become our practitioners to help them prepare for those exams.
We also provide a series of ongoing training programs to improve the professional knowledge of our practitioners. For example, we have an annual Education Fair which is attended by over 750 of our practitioners and consists of lectures and seminars covering many clinical topics including the latest technology and process improvements, basic accounting and business courses and other courses which allow the practitioners to fulfill their ongoing continuing education requirements.
Insurance
We currently maintain insurance coverage for malpractice liability, product liability, workers' compensation, executive protection and property damage. Our general liability insurance coverage is $1.0 million per incident, with a $25.0 million umbrella insurance policy. The coverage for malpractice, product and workers' compensation is self-insured with both individual specific claim and aggregate stop-loss policies to protect us from either significant individual claims or dramatic changes in our loss experience. Based on our experience and prevailing industry practices, we believe our coverage is adequate as to risks and amount. We have not incurred a material amount of expenses in the past as a result of uninsured O&P claims.
Special Note On Forward-Looking Statements
Some of the statements contained in this report discuss our plans and strategies for our business or make other forward-looking statements, as this term is defined in the Private Securities Litigation Reform Act. The words "anticipates," "believes," "estimates," "expects," "plans," "intends" and similar expressions are intended to identify these forward-looking statements, but are not the exclusive means of identifying them. These forward-looking statements reflect the current views of our management; however, various risks, uncertainties and contingencies could cause our actual results, performance or achievements to differ materially from those expressed in, or implied by, these statements, including the following:
- •
- the demand for our orthotic and prosthetic services and products;
15
- •
- our ability to integrate effectively the operations of businesses that we have acquired and plan to acquire in the future;
- •
- our ability to enter into national contracts;
- •
- our ability to maintain the benefits of our performance improvement plans;
- •
- our ability to attract and retain qualified orthotic and prosthetic practitioners;
- •
- changes in federal Medicare reimbursement levels and other governmental policies affecting orthotic and prosthetic
operations;
- •
- our indebtedness, the impact of changes in prevailing interest rates and the availability of favorable terms of equity and
debt financing to fund the anticipated growth of our business;
- •
- changes in, or failure to comply with, federal, state and/or local governmental regulations; and
- •
- liabilities relating to orthotic and prosthetic services and products and other claims asserted against us.
For a discussion of important risk factors affecting our business, including factors that could cause actual results to differ materially from results referred to in the forward-looking statements, see "Item 1A-Risk Factors" and "Management's Discussion and Analysis of Financial Condition and Results of Operations" below. We do not have any obligation to publicly update any forward-looking statements, whether as a result of new information, future events or otherwise.
Changes in government reimbursement levels could adversely affect our net sales, cash flows and profitability.
We derived 40.5%, 39.7%, and 40.3% of our net sales for the years ended December 31, 2009, 2008, and 2007, respectively, from reimbursements for O&P services and products from programs administered by Medicare, Medicaid and the U.S. Department of Veterans Affairs. Each of these programs sets maximum reimbursement levels for O&P services and products. If these agencies reduce reimbursement levels for O&P services and products in the future, our net sales could substantially decline. In addition, the percentage of our net sales derived from these sources may increase as the portion of the U.S. population over age 65 continues to grow, making us more vulnerable to maximum reimbursement level reductions by these organizations. Reduced government reimbursement levels could result in reduced private payor reimbursement levels because fee schedules of certain third-party payors are indexed to Medicare. Furthermore, the healthcare industry is experiencing a trend towards cost containment as government and other third-party payors seek to impose lower reimbursement rates and negotiate reduced contract rates with service providers. This trend could adversely affect our net sales. Medicare provides for reimbursement for O&P products and services based on prices set forth in fee schedules for ten regional service areas. Medicare prices are adjusted each year based on the Consumer Price Index- Urban ("CPIU") unless Congress acts to change or eliminate the adjustment. The Medicare price increases for 2010, 2009, 2008, and 2007 were 0.0%, 5.0%, 2.7%, and 4.3%, respectively. If the U.S. Congress were to legislate additional modifications to the Medicare fee schedules, our net sales from Medicare and other payors could be adversely and materially affected. We cannot predict whether any such modifications to the fee schedules will be enacted or what the final form of any modifications might be.
Changes in payor reimbursements could negatively affect our net sales volume.
Recent years have seen a consolidation of healthcare companies coupled with certain payors terminating contracts, imposing caps or reducing reimbursement for O&P products. Additionally, employers are increasingly pushing healthcare costs down to their employees. These trends could result in decreased O&P revenue.
16
We face periodic reviews, audits and investigations under our contracts with federal and state government agencies, and these audits could have adverse findings that may negatively impact our business.
We contract with various federal and state governmental agencies to provide O&P services. Pursuant to these contracts, we are subject to various governmental reviews, audits and investigations to verify our compliance with the contracts and applicable laws and regulations. Any adverse review, audit or investigation could result in:
- •
- refunding of amounts we have been paid pursuant to our government contracts;
- •
- imposition of fines, penalties and other sanctions on us;
- •
- loss of our right to participate in various federal programs;
- •
- damage to our reputation in various markets; or
- •
- material and/or adverse effects on our business, financial condition and results of operations.
We are subject to numerous federal, state and local governmental regulations, noncompliance with which could result in significant penalties that could have a material adverse effect on our business.
A failure by us to comply with the numerous federal, state and/or local healthcare and other governmental regulations to which we are subject, including the regulations discussed under "Government Regulation" in Item 1 above, could result in significant penalties and adverse consequences, including exclusion from the Medicare and Medicaid programs, which could have a material adverse effect on our business.
If the non-competition agreements we have with our key executive officers and key practitioners were found by a court to be unenforceable, we could experience increased competition resulting in a decrease in our net sales.
We generally enter into employment agreements with our executive officers and a significant number of our practitioners which contain non-compete and other provisions. The laws of each state differ concerning the enforceability of non-competition agreements. State courts will examine all of the facts and circumstances at the time a party seeks to enforce a non-compete covenant. We cannot predict with certainty whether or not a court will enforce a non-compete covenant in any given situation based on the facts and circumstances at that time. If one or more of our key executive officers and/or a significant number of our practitioners were to leave us and the courts refused to enforce the non-compete covenant, we might be subject to increased competition, which could materially and adversely affect our business, financial condition and results of operations.
Funds associated with certain of our auction rate securities are not currently accessible and our auction rate securities have experienced other than temporary decline in value, which could adversely affect our income.
Our investments include an auction rate security ("ARS"), classified as other long term assets, and reported at an aggregate fair value of $1.4 million and an aggregate cost of $1.7 million, as of December 31, 2009. ARS are securities that are structured with short-term interest rate reset dates which generally occur every 28 days, but with contractual maturities that can be well in excess of ten years. At the end of each reset period, investors can attempt to sell via auction or continue to hold the securities at par. The auctions for all of the ARS held by us were unsuccessful as of December 31, 2009. The funds associated with these will not be accessible until a successful auction occurs, a buyer is found outside of the auction process or the underlying securities have matured.
17
Our Website
Our website is http://www.hanger.com. We make available free of charge, on or through our website, our Annual Report on Form 10-K, Quarterly Reports on Form 10-Q, Current Reports on Form 8-K, Section 16 filings (i.e. Forms 3, 4 and 5), proxy statements, and other documents as required by applicable law and regulations as soon as reasonably practicable after electronically filing such reports with the Securities and Exchange Commission at http://www.sec.gov. The public may read and copy any materials that we file with the SEC at the SEC's Public Reference Room at 100 F Street N.E., Washington, DC 20549. The public may obtain information on the operation of the Public Reference Room by calling the SEC at 1-800-SEC-0330 (1800-732-0330). The SEC maintains an Internet site (http://www.sec.gov) that contains reports, proxy and information statements, and other information regarding issuers that file electronically with the SEC. Our website also contains the charters of the Audit Committee, Corporate Governance and Nominating Committee, Compensation Committee and Quality and Technology Committee of our Board of Directors; our Code of Business Conduct and Ethics for Directors and Employees, which includes our principal executive, financial and accounting officers; as well as our Corporate Governance Guidelines. Information contained on our website is not part of this report.
ITEM 1B. UNRESOLVED STAFF COMMENTS.
None.
As of December 31, 2009, we operated 677 patient-care centers and facilities in 45 states and the District of Columbia. We own 16 buildings that house a patient-care center. The remaining centers are occupied under leases expiring between the years of 2010 and 2019. We believe our leased or owned centers are adequate for carrying on our current O&P operations at our existing locations, as well as our anticipated future needs at those locations. We believe we will be able to renew such leases as they expire or find comparable or additional space on commercially suitable terms.
The following table sets forth the number of our patient-care centers located in each state as of December 31, 2009:
| State | Patient- Care Centers |
State | Patient- Care Centers |
State | Patient- Care Centers |
|||||||||
|---|---|---|---|---|---|---|---|---|---|---|---|---|---|---|
Alabama |
12 | Louisiana | 15 | North Carolina | 13 | |||||||||
Arizona |
37 | Maine | 5 | North Dakota | 2 | |||||||||
Arkansas |
5 | Maryland | 10 | Ohio | 35 | |||||||||
California |
73 | Massachusetts | 9 | Oklahoma | 11 | |||||||||
Colorado |
25 | Michigan | 6 | Oregon | 11 | |||||||||
Connecticut |
10 | Minnesota | 6 | Pennsylvania | 30 | |||||||||
Delaware |
1 | Mississippi | 10 | South Carolina | 13 | |||||||||
District of Columbia |
1 | Missouri | 21 | South Dakota | 1 | |||||||||
Florida |
50 | Montana | 5 | Tennessee | 15 | |||||||||
Georgia |
32 | Nebraska | 8 | Texas | 30 | |||||||||
Illinois |
23 | Nevada | 6 | Utah | 3 | |||||||||
Indiana |
11 | New Hampshire | 2 | Virginia | 9 | |||||||||
Iowa |
8 | New Jersey | 8 | Washington | 18 | |||||||||
Kansas |
14 | New Mexico | 7 | West Virginia | 7 | |||||||||
Kentucky |
10 | New York | 33 | Wisconsin | 13 | |||||||||
|
Wyoming | 3 | ||||||||||||
18
We also lease distribution facilities in Texas, California, Georgia, Florida, and Pennsylvania. We lease our corporate headquarters in Bethesda, Maryland. In January 2010, we signed a lease agreement and will relocate our corporate headquarters to Austin, TX. Substantially all of our owned properties are pledged to collateralize bank indebtedness. See Note G to our Consolidated Financial Statements.
The Company is subject to legal proceedings and claims which arise in the ordinary course of its business, including additional payments under business purchase agreements. In the opinion of management, the amount of ultimate liability, if any, with respect to these actions will not have a materially adverse effect on the financial position, liquidity or results of operations of the Company.
The Company is in a highly regulated industry and receives regulatory agency inquiries from time to time in the ordinary course of its business, including inquiries relating to the Company's billing activities. To date these inquiries have not resulted in material liabilities, but no assurance can be given that future regulatory agencies' inquiries will be consistent with the results to date or that any discrepancies identified during a regulatory review will not have a material adverse effect on the Company's consolidated financial statements.
The United States Attorney's Office for the Eastern District of New York (the "US Attorney's Office") initiated an investigation in June 2004 regarding allegations of billing discrepancies at the Company's West Hempstead, New York patient-care center. Based upon communications with the US Attorney's Office, it is the Company's understanding that the US Attorney's Office will not file any criminal charges or pursue any False Claims Act remedies against the Company related to the alleged billing discrepancies.
ITEM 4. SUBMISSION OF MATTERS TO A VOTE OF SECURITY HOLDERS.
[Reserved]
EXECUTIVE OFFICERS OF THE REGISTRANT.
The following table sets forth information regarding current executive officers of the Company and certain of its subsidiaries:
Name
|
Age | Office with the Company | |||
|---|---|---|---|---|---|
Ivan R. Sabel, CPO |
64 | Chairman of the Board | |||
Thomas F. Kirk |
64 | President and Chief Executive Officer | |||
Richmond L. Taylor |
61 | Executive Vice President, President and Chief Operating Officer of Hanger Prosthetics & Orthotics, Inc. | |||
Ron N. May |
63 | Executive Vice President, President and Chief Operating Officer of Southern Prosthetic Supply, Inc. | |||
George E. McHenry |
57 | Executive Vice President, Secretary, and Chief Financial Officer | |||
Vinit K. Asar |
43 | Executive Vice President and Chief Growth Officer | |||
Thomas E. Hartman |
47 | Vice President and General Counsel | |||
Thomas C. Hofmeister |
43 | Vice President and Chief Accounting Officer | |||
Marion L. Mullauer |
57 | Vice President and Chief Information Officer | |||
Sam Reimer |
40 | Vice President and Treasurer | |||
Brian A. Wheeler |
49 | Vice President, Human Resources | |||
19
Ivan R. Sabel, CPO has been our Chairman of the Board of Directors since August 1995 and was our Chief Executive Officer from August 1995 until March 2008. Mr. Sabel was our President from November 1987 to January 2002. Mr. Sabel also served as the Chief Operating Officer from November 1987 until August 1995. Prior to that time, Mr. Sabel had been Vice President, Corporate Development from September 1986 to November 1987. Mr. Sabel was the founder, owner and President of Capital Orthopedics, Inc. from 1968 until that company was acquired by us in 1986. Mr. Sabel is a Certified Prosthetist and Orthotist ("CPO"), a former clinical instructor in orthopedics at the Georgetown University Medical School in Washington, D.C., a member of the Government Relations Committee of the American Orthotic and Prosthetic Association ("AOPA"), a former Chairman of the National Commission for Health Certifying Agencies, a former member of the Strategic Planning Committee, a current member of the U.S. Department of Veterans Affairs Committee of AOPA and a former President of the American Board for Certification in Orthotics and Prosthetics. Mr. Sabel also serves as a member of the Medical Advisory Board of DJ Orthopedics, Inc., a manufacturer of knee braces. Mr. Sabel has been a director since 1986. Mr. Sabel holds a B.S. in Prosthetics and Orthotics from New York University.
Thomas F. Kirk has been our President and Chief Executive Officer since March 2008. Mr. Kirk also served as our Chief Operating Officer from January 2002 until March 2008. From September 1998 to January 2002, Mr. Kirk was a principal with AlixPartners, LLC (formerly Jay Alix & Associates, Inc.), a management consulting company retained by Hanger to facilitate its reengineering process. From May 1997 to August 1998, Mr. Kirk served as Vice President, Planning, Development and Quality for FPL Group, a full service energy provider located in Florida. From April 1996 to April 1997, he served as Vice President and Chief Financial Officer for Quaker Chemical Corporation in Pennsylvania. From December 1987 to March 1996, he served as Senior Vice President and Chief Financial Officer for Rhone-Poulenc, S.A. in Princeton, New Jersey and Paris, France. From March 1977 to November 1987, he was employed by St. Joe Minerals Corp., a division of Fluor Corporation. Prior to this he held positions in sales, commercial development, and engineering with Koppers Co., Inc. Mr. Kirk holds a Ph.D. degree in strategic planning/marketing, and an M.B.A. degree in finance, from the University of Pittsburgh. He also holds a Bachelor of Science degree in mechanical engineering from Carnegie Mellon University. He is a registered professional engineer and a member of the Financial Executives Institute.
Richmond L. Taylor is our Executive Vice President, and the President and Chief Operating Officer of Hanger Prosthetics & Orthotics, Inc. and HPO, Inc., our two wholly-owned subsidiaries which operate all of our patient-care centers. Previously, Mr. Taylor served as the Chief Operating Officer of NovaCare O&P from June 1996 until July 1999, and held the positions of Region Vice-President and Region President of NovaCare O&P for the West Region from 1989 to June 1996. Prior to joining NovaCare O&P, Mr. Taylor spent 20 years in the healthcare industry in a variety of management positions including Regional Manager at American Hospital Supply Corporation, Vice President of Operations at Medtech, Vice President of Sales at Foster Medical Corporation and Vice President of Sales at Integrated Medical Systems.
Ron N. May has been the President and Chief Operating Officer of Southern Prosthetic Supply, Inc., our wholly-owned subsidiary that distributes orthotic and prosthetic products, since December 1998. From January 1984 to December 1998, Mr. May was Executive Vice President of the distribution division of J.E. Hanger, Inc. of Georgia until that company was acquired by us in November 1996. Mr. May also currently serves as a Board Member of the O&P Athletic Fund.
George E. McHenry has been our Executive Vice President and Chief Financial Officer since October 2001. From 1987 until he joined us in October 2001, Mr. McHenry served as Executive Vice President, Chief Financial Officer and Secretary of U.S. Vision, Inc., an optical company with 600 locations in 47 states. Prior to joining U.S. Vision, Inc., he was employed principally as a Senior Manager by the firms of Touche Ross & Co. (now Deloitte & Touche) and Main Hurdman (now
20
KPMG LLP) from 1974 to 1987. Mr. McHenry is a Certified Public Accountant and received a Bachelor of Science degree in accounting from St. Joseph's University.
Vinit K. Asar joined us as our Executive Vice President and Chief Growth Officer in December 2008. Mr. Asar comes to Hanger from the Medical Device & Diagnostic sector at Johnson and Johnson, having worked at the Ethicon, Ethicon-Endo-Surgery, Cordis and Biosense Webster franchises. During his 18 year career at Johnson and Johnson, Mr. Asar held various roles of increasing responsibility in Finance, Product Development, Manufacturing, Marketing and Sales in the US and in Europe. Prior to joining Hanger, Mr. Asar was the Worldwide Vice-President at Biosense Webster, the Electrophysiology division of Johnson and Johnson, responsible for the Worldwide Sales, Marketing and Services organizations. Mr. Asar has a B.S.B.A from Aquinas College and an M.B.A. from Lehigh University.
Thomas E. Hartman has been our Vice President & General Counsel since June 2009. Mr. Hartman joined Hanger from Foley & Lardner, LLP where he was a partner in Foley's Business Law Department. Mr. Hartman's practice at Foley was focused on securities transactions, securities law compliance, mergers and acquisitions, and corporate governance. Prior to joining Foley in 1995, Mr. Hartman was a business law associate at Jones Day. Mr. Hartman received his J.D. from the University of Wisconsin in Madison, and a Bachelor of Science in Engineering (Industrial & Operations Engineering) from the University of Michigan in Ann Arbor.
Thomas C. Hofmeister joined us in October of 2004 as our Vice President of Finance and Chief Accounting Officer and was previously employed as the Chief Financial Officer of Woodhaven Health Services from October 2002 through October 2004. Prior to that, Mr. Hofmeister served as Senior Vice President and Chief Accounting Officer of Magellan Health Services, Inc. from 1999 to 2002; Controller of London Fog Industries, Inc. from 1998 to 1999 and Vice President and Controller of Pharmerica, Inc. from 1995 to 1998. Mr. Hofmeister was also employed as a senior manager at KPMG Peat Marwick from 1988 to 1995. Mr. Hofmeister holds a B.S. degree in accounting from Mount Saint Mary's College.
Marion L. Mullauer has been our Vice President and Chief Information Officer since August 2005. She is an experienced CIO, having previously held that position at the American Chemical Society and Lippincott Williams & Wilkins, Inc., a leading publisher of health care information. She has over 25 years of experience in information technology in senior management positions, much of it with healthcare companies. Ms. Mullauer holds a B.S. degree in Business Administration from Towson University and a Masters in Business Administration from Loyola College.
Sam Reimer has been our Vice President & Treasurer since October 2009 and a Vice President with Hanger since May 2008. Prior to Hanger, Mr. Reimer was with Sprint Nextel from 2003 to 2007, most recently as a Corporate Vice President in Finance and Corporate Development. At Sprint Nextel, he also held additional positions in Operations Finance and Merger Integration. From 2000 to 2003, Mr. Reimer was Director of Corporate Finance with webMethods, Inc. Prior to webMethods, Mr. Reimer held various accounting and finance positions with companies in the software and telecommunications industries. Mr. Reimer received his CPA certificate from the state of Virginia and his Bachelor of Science in Accounting degree from Virginia Tech.
Brian A. Wheeler has been our Vice President, Human Resources since November 2002. Prior to joining Hanger, he was the Vice President of Human Resources for Rhodia Inc., a wholly-owned U.S. subsidiary of the French Specialty Chemicals Company. Mr. Wheeler holds a B.A. degree in Political Science from the University of Florida.
21
ITEM 5. MARKET FOR REGISTRANT'S COMMON EQUITY, RELATED STOCKHOLDER MATTERS AND ISSUER PURCHASES OF EQUITY SECURITIES.
Market Information
Our common stock has been listed and traded on the New York Stock Exchange since December 15, 1998, under the symbol "HGR." The following table sets forth the high and low closing sale prices for the common stock for the periods indicated as reported on the New York Stock Exchange:
Year Ended December 31, 2009
|
High | Low | |||||
|---|---|---|---|---|---|---|---|
First Quarter |
$ | 16.08 | $ | 11.32 | |||
Second Quarter |
15.37 | 11.14 | |||||
Third Quarter |
14.95 | 12.28 | |||||
Fourth Quarter |
14.63 | 13.27 | |||||
Year Ended December 31, 2008
|
High | Low | |||||
|---|---|---|---|---|---|---|---|
First Quarter |
$ | 11.92 | $ | 9.27 | |||
Second Quarter |
16.49 | 10.00 | |||||
Third Quarter |
19.76 | 15.06 | |||||
Fourth Quarter |
17.64 | 12.26 | |||||
Holders
At February 22, 2010, there were approximately 311 holders of record of 31,901,708 shares of our outstanding common stock.
Dividend Policy
We have never paid cash dividends on our common stock and intend to continue this policy for the foreseeable future. We plan to retain earnings for use in our business. The terms of our agreements with our financing sources and certain other agreements limit the payment of dividends on our common stock and such agreements will continue to limit the payment of dividends in the future.
Any future determination to pay cash dividends will be at the discretion of our Board of Directors and will be dependent on our results of operations, financial condition, contractual and legal restrictions and any other factors deemed to be relevant.
Equity Compensation Plans
The following table sets forth information as of December 31, 2009 regarding our equity compensation plans:
Plan Category
|
Number of securities to be issued upon exercise of outstanding options, warrants and rights |
Weighted average exercise price of outstanding options, warrants and rights |
Number of securities remaining available for future issuance (excluding securities reflected in column (a) |
||||||||
|---|---|---|---|---|---|---|---|---|---|---|---|
| |
(a) |
(b) |
(c) |
||||||||
Equity Compensation Plans: |
|||||||||||
Approved by security holders |
859,796 | $ | 13.49 | 936,918 | (a) | ||||||
Not approved by security holders |
406,000 | 5.95 | N/A | ||||||||
Total |
1,265,796 | 936,918 | |||||||||
- (a)
- The number of securities remaining available for future issuance is comprised of 865,991 shares from Employee Plans and 70,927 shares from Directors Plans.
22
Sales of Unregistered and Registered Securities
During the year ended December 31, 2009, we sold no securities that were without registration under the Securities Act of 1933 ("Securities Act").
Issuer Purchases of Equity Securities
During the year ended December 31, 2009, we made no repurchases of our common stock.
The annual changes in the cumulative total shareholder return on Hanger's common stock for the five-year period shown in the graph shown below are based on the assumption that $100 had been invested in Hanger common stock, the Standard & Poor's 500 Stock Index, the Standard & Poor's Small Cap Stock Index, the Russell 2000 Stock Index and a company determined peer group index on December 31, 2004, and that all quarterly dividends were reinvested at the average of the closing stock prices at the beginning and end of the quarter. The total cumulative dollar returns shown on the graph represent returns that such investments would have had on December 31, 2009.
Comparison of 5 Year Cumulative Total Return
Assumes Initial Investment of $100
December 2009
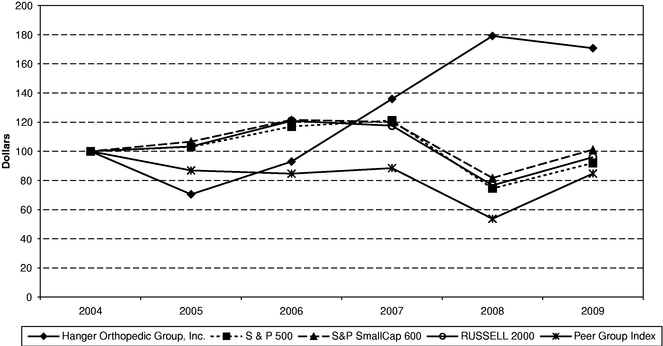
| |
2004 | 2005 | 2007 | 2008 | 2008 | 2009 | |||||||||||||
|---|---|---|---|---|---|---|---|---|---|---|---|---|---|---|---|---|---|---|---|
Hanger Orthopedic Group, Inc. |
$ | 100.00 | $ | 70.49 | $ | 92.96 | $ | 135.93 | $ | 179.14 | $ | 170.74 | |||||||
S & P 500 |
$ | 100.00 | $ | 103.00 | $ | 117.03 | $ | 121.16 | $ | 74.53 | $ | 92.01 | |||||||
S&P SmallCap 600 |
$ | 100.00 | $ | 106.65 | $ | 121.66 | $ | 120.18 | $ | 81.73 | $ | 101.16 | |||||||
RUSSELL 2000 |
$ | 100.00 | $ | 103.32 | $ | 120.89 | $ | 117.57 | $ | 76.65 | $ | 95.98 | |||||||
Peer Group Only |
$ | 100.00 | $ | 86.89 | $ | 84.67 | $ | 88.48 | $ | 53.71 | $ | 84.73 | |||||||
Assumes $100 invested on December 31, 2004.
- (1)
- Total
return assumes reinvestment of dividends and based on market capitalization.
- (2)
- Fiscal
year ending December 31.
- (3)
- The four issuers of common stock included in the peer group index are Odyssey Healthcare, Inc., Continucare Corp., RehabCare Group, Inc. and Medcath Corp.
23
ITEM 6. SELECTED FINANCIAL DATA.
The selected consolidated financial data presented below is derived from the audited Consolidated Financial Statements and Notes thereto that are included in this Annual Report on Form 10-K.
| |
Year Ended December 31, | ||||||||||||||||
|---|---|---|---|---|---|---|---|---|---|---|---|---|---|---|---|---|---|
Statement of Operations Data:
|
2009 | 2008 | 2007 | 2006 | 2005 | ||||||||||||
| (In thousands, except per share data)(1) |
|
|
|
|
|
||||||||||||
Net sales |
$ | 760,070 | $ | 703,129 | $ | 637,350 | $ | 598,766 | $ | 578,241 | |||||||
Cost of goods sold—materials |
228,295 | 210,323 | 184,625 | 180,462 | 163,285 | ||||||||||||
Personnel costs |
264,581 | 248,234 | 225,012 | 210,422 | 204,045 | ||||||||||||
Other operating expenses |
160,355 | 149,661 | 143,857 | 130,773 | 135,715 | ||||||||||||
Depreciation and amortization |
16,319 | 17,183 | 15,876 | 14,670 | 13,920 | ||||||||||||
Income from operations |
90,520 | 77,728 | 67,980 | 62,439 | 61,276 | ||||||||||||
Interest expense |
30,693 | 32,549 | 36,987 | 38,643 | 37,141 | ||||||||||||
Unrealized loss (gain) from interest rate swap(2) |
(167 | ) | 738 | — | — | — | |||||||||||
Extinguishment of debt(3) |
— | — | — | 16,953 | — | ||||||||||||
Income before taxes |
59,994 | 44,441 | 30,993 | 6,843 | 24,135 | ||||||||||||
Provision for income taxes |
23,901 | 17,695 | 11,726 | 3,409 | 6,382 | ||||||||||||
Net income |
36,093 | 26,746 | 19,267 | 3,434 | 17,753 | ||||||||||||
Preferred stock dividends and accretion(4) |
— | 5,670 | 1,665 | 7,518 | 5,892 | ||||||||||||
Net income (loss) applicable to common stock |
$ | 36,093 | $ | 21,076 | $ | 17,602 | $ | (4,084 | ) | $ | 11,861 | ||||||
Basic Per Common Share Data |
|||||||||||||||||
Net income (loss) |
$ | 1.15 | $ | 0.81 | $ | 0.78 | $ | (0.19 | ) | $ | 0.55 | ||||||
Shares used to compute basic per common share amounts |
31,384 | 25,930 | 22,476 | 21,981 | 21,695 | ||||||||||||
Diluted Per Common Share Data(5) |
|||||||||||||||||
Net income (loss) |
$ | 1.13 | $ | 0.78 | $ | 0.64 | $ | (0.19 | ) | $ | 0.53 | ||||||
Shares used to compute diluted per common share amounts |
32,068 | 27,091 | 30,257 | 21,981 | 22,232 | ||||||||||||
- (1)
- As
of January 1, 2009, the Company revised its income statement presentation, including prior periods, to group all personnel costs in one line item
within income from operations. Previously, personnel costs were divided between revenue producing personnel costs, which were included in costs of goods sold, and non-revenue producing
personnel costs, which were included in selling, general and administrative expenses. The new income statement presentation will create better transparency and comparability between current and future
results, as well as provide consistency with management's internal reporting format. The new income statement presentation does not change previously reported income from operations, net income or
earnings per share for prior periods.
- (2)
- The
loss (gain) from interest rate swap results from ineffective portions of the swap that occurred during the year.
- (3)
- The
2006 charge of $17.0 million relates to the debt and preferred stock refinancing.
- (4)
- In June 2008, the average closing price of our common stock exceeded the forced conversion price of the Series A Preferred by 200% for a 20-trading day period, triggering an acceleration, pursuant
24
to the Certificate of Designations of the Series A Preferred, of the Series A Preferred dividends that were otherwise payable through May 26, 2011. The accelerated dividends of $5.3 million were paid in the form of increased stated value of the Series A Preferred, in lieu of cash. On July 25, 2008, the Company notified the holder of the Series A Preferred of its election pursuant to the Certificate of Designations of the Series A Preferred to force the conversion of the Series A Preferred into 7,308,730 shares of common stock. The conversion of the Series A Preferred occurred on August 8, 2008.
- (5)
- For 2006, excludes the effect of all dilutive options and warrants as a result of our net loss for the year ended December 31, 2006.
| |
Year Ended December 31, | |||||||||||||||
|---|---|---|---|---|---|---|---|---|---|---|---|---|---|---|---|---|
Balance Sheet Data:
|
2009 | 2008 | 2007 | 2006 | 2005 | |||||||||||
| (In thousands) |
|
|
|
|
|
|||||||||||
Cash and cash equivalents |
$ | 84,558 | $ | 58,413 | $ | 26,938 | $ | 23,139 | $ | 7,921 | ||||||
Working capital |
216,664 | 200,248 | 165,794 | 157,208 | 135,551 | |||||||||||
Total assets |
875,036 | 813,750 | 759,683 | 719,122 | 704,467 | |||||||||||
Total debt |
410,472 | 422,324 | 410,892 | 410,624 | 378,431 | |||||||||||
Redeemable convertible preferred stock |
— | — | 47,654 | 47,654 | 61,942 | |||||||||||
Shareholders' equity |
315,893 | 266,866 | 190,538 | 167,677 | 165,242 | |||||||||||
| |
Year Ended December 31, | ||||||||||||||||
|---|---|---|---|---|---|---|---|---|---|---|---|---|---|---|---|---|---|
Other Financial Data:
|
2009 | 2008 | 2007 | 2006 | 2005 | ||||||||||||
| (In thousands) |
|
|
|
|
|
||||||||||||
Capital expenditures |
$ | 21,270 | $ | 19,330 | $ | 20,129 | $ | 12,827 | $ | 8,759 | |||||||
Net cash provided by (used in): |
|||||||||||||||||
Operating activities |
$ | 73,131 | $ | 53,220 | $ | 51,687 | $ | 24,037 | $ | 25,741 | |||||||
Investing activities |
(34,152 | ) | (30,168 | ) | (42,096 | ) | (13,212 | ) | (11,247 | ) | |||||||
Financing activities |
(12,834 | ) | 8,423 | (5,792 | ) | 4,393 | (14,924 | ) | |||||||||
25
ITEM 7. MANAGEMENT'S DISCUSSION AND ANALYSIS OF FINANCIAL CONDITION AND RESULTS OF OPERATIONS.
The following is a discussion of our results of operations and financial condition for the periods described below. This discussion should be read in conjunction with our consolidated financial statements included elsewhere in this Form 10-K. Our discussion of our results of operations and financial condition includes various forward-looking statements about, among other things, our markets, the demand for our products and services and our future results. These statements are based on our current expectations, which are inherently subject to risks and uncertainties. Our actual results and the timing of certain events may differ materially from those indicated in the forward looking statements.
Overview
We are the largest owner and operator of orthotic and prosthetic ("O&P") patient-care centers in the United States. Through our subsidiary, Southern Prosthetic Supply, Inc. ("SPS"), we are also the largest distributor of branded and private label O&P devices and components in the United States, all of which are manufactured by third parties. We also create products, through our subsidiary, Innovative Neurotronics, Inc. ("IN, Inc."), for sale in our patient-care centers, internationally through distribution agreements, and through a sales force. The first such product was available for sale starting May 1, 2006 for patients who have had a loss of mobility due to strokes, multiple sclerosis or other similar conditions. Another subsidiary, Linkia LLC ("Linkia"), is a provider network management company.
We have increased our net sales during the past two years through organic growth, acquisitions & opening of new patient care centers, increased distribution revenues though targeted sales efforts and increased product offerings, and continued growth revenue associated with the Linkia contracts. Our operations include two reportable segments—patient-care and distribution.
Patient Care
At December 31, 2009, we operated 677 O&P patient-care centers in 45 states and the District of Columbia and employed in excess of 1,000 revenue-generating O&P practitioners ("practitioners"). For the years ended December 31, 2009 and 2008, net sales attributable to our patient-care services were $670.4 and $620.0 million, respectively
Patients are referred to our local patient-care centers directly by physicians as a result of our reputation with them or through our agreements with managed care providers. In our orthotics business, we design, fabricate, fit and maintain a wide range of standard and custom-made braces and other devices (such as spinal, knee and sports-medicine braces) that provide external support to patients suffering from musculoskeletal disorders, such as ailments of the back, extremities or joints and injuries from sports or other activities. In our prosthetics business, we design, fabricate, fit and maintain custom-made artificial limbs for patients who are without limbs as a result of traumatic injuries, vascular diseases, diabetes, cancer or congenital disorders. O&P devices are increasingly technologically advanced and are custom-designed to add functionality and comfort to patients' lives, shorten the rehabilitation process and lower the cost of rehabilitation.
Our practitioners are also responsible for managing and operating our patient-care centers and are compensated, in part, based on their success in managing costs and collecting accounts receivable. We provide centralized administrative, marketing and materials management services to take advantage of economies of scale and to increase the time practitioners have to provide patient care. In areas where we have multiple patient-care centers, we also utilize shared fabrication facilities where technicians fabricate devices for practitioners in that region.
26
Distribution Services
We distribute O&P components to the O&P market as a whole and to our own patient-care centers through our wholly-owned subsidiary, SPS, which is the nation's largest O&P distributor. We are also a leading manufacturer and distributor of therapeutic footwear for diabetic patients in the podiatric market. For the year ended December 31, 2009, 36.2% or approximately $88.0 million of SPS' distribution sales were to third-party O&P services providers, and the balance of approximately $155.0 million represented intercompany sales to our patient-care centers. SPS maintains in inventory approximately 25,000 O&P related items, all of which are manufactured by other companies. SPS maintains distribution facilities in California, Florida, Georgia, Pennsylvania, and Texas, which allows us to deliver products via ground shipment anywhere in the contiguous United States typically within two business days.
Our distribution business enables us to:
- •
- lower our material costs by negotiating purchasing discounts from manufacturers;
- •
- reduce our patient-care center inventory levels and improve inventory turns through centralized purchasing
control;
- •
- quickly access prefabricated and finished O&P products;
- •
- perform inventory quality control;
- •
- encourage our patient-care centers to use clinically appropriate products that enhance our profit margins; and
- •
- coordinate new product development efforts with key vendor "partners".
This is accomplished at competitive prices as a result of our direct purchases from manufacturers.
Marketing of our distribution services is conducted on a national basis through a dedicated sales force, print and e-commerce catalogues and exhibits at industry and medical meetings and conventions. We direct specialized catalogues to segments of the healthcare industry, such as orthopedic surgeons and physical and occupational therapists and podiatrists.
Product Development
IN, Inc. specializes in product development principally in the field of functional electrical stimulation. IN, Inc. identifies emerging MyoOrthotics Technologies® developed at research centers and universities throughout the world that use neuromuscular stimulation to improve the functionality of an impaired limb. MyoOrthotics Technologies® represents the merging of orthotic technologies with electrical stimulation. Working with the inventors under licensing and consulting agreements, IN, Inc. commercializes the design, obtains regulatory approvals, develops clinical protocols for the technology, and then introduces the devices to the marketplace through a variety of distribution channels. IN, Inc's. first product, the WalkAide System ("WalkAide"), has received FDA approval, achieved ISO 13485:2004 and ISO 9001:2000 certification, as well as the European CE Mark, which are widely accepted quality management standards for medical devices and related services. Additionally, in September 2007 the WalkAide earned the esteemed da Vinci Award for Adaptive Technologies from the National Multiple Sclerosis Society, which honors outstanding engineering achievements in adaptive and assistive technology that provide solutions to accessibility issues for people with disabilities. In November 2008, the Centers for Medicare and Medicaid Services ("CMS") overturned a non-coverage decision and assigned a specific E-code to the WalkAide, which is reimbursable for beneficiaries with foot drop due to incomplete spinal cord injuries. The code was effective January 1, 2009. IN, Inc is pursuing additional coverage for stroke rehabilition which represents the largest potential patient population. CMS has agreed to sponsor additional clinical trials in order to validate the WalkAide's
27
clinical benefits to stroke patients. IN, Inc anticipates that theses trials will be completed in the first half of 2011. In addition to reimbursement from Medicare and Medicaid, IN, Inc has been working with commercial insurance companies and has had limited success in receiving coverage for the WalkAide. The WalkAide is sold in the United States through our patient care centers and SPS. IN, Inc. is also marketing the WalkAide internationally through licensed distributors.
Provider Network Management
Linkia is the first provider network management service company dedicated solely to serving the O&P market. Linkia is dedicated to managing the O&P services of national and regional insurance companies. Linkia partners with healthcare insurance companies by securing a national or regional contract either as a preferred provider or to manage their O&P network of providers. Linkia's network now totals over 1,000 O&P provider locations. As of December 31, 2009, Linkia had 35 contracts with national and regional providers.
Results and Outlook
Net sales for the year ended December 31, 2009 increased by $57.0 million, or 8.1%, to $760.1 million from $703.1 million for the year ended December 31 2008. The sales increase was principally the result of a $29.6 million, or 4.9%, increase in same-center sales in our patient care centers, a $7.3 million, or 9.1%, increase in sales of the Company's distribution segment and a $20.1 million increase principally related to sales from acquired entities.
The growth in sales along with a focus on expense management resulted in income from operations increasing $12.8 million, or 16.5%, to $90.5 million for the year end December 31, 2009 compared to $77.7 million for the year ended December 31, 2008. Income from operations as a percentage of sales improved 80 basis points to 11.9% in 2009 compared to 11.1% in the prior year.
Net income applicable to common stock for the year ended December 31, 2009 increased to $36.1 million, or $1.13 per diluted share, compared to net income applicable to common stock of $21.1 million, or $0.78 per diluted share, for the year ended December 31, 2008. In addition to improved income from operations, net income benefited from lower variable interest costs during 2009.
Cash flows from operations for the year ended December 31, 2009 was $73.1 million, a $19.9 million, or 37.4% increase, compared to 2008. The improvement was primarily the result of improved operating results. As of December 31, 2009, $75.6 million, or 18.4%, of the Company's total debt of $410.5 million was subject to variable interest rates. The Company had total liquidity of $148.5 million, comprised of $84.6 million of cash and $63.9 million available under its revolving credit facility at December 31, 2009. The Company believes that it has sufficient liquidity to conduct its normal operations and fund its acquisition plans through 2010.
For 2010, the Company expects revenues to be between $815 million and $825 million which would result in growth of 7.2% to 8.5% compared to 2009. The Company also expects diluted EPS for 2010 to be in the range of $1.27 to $1.29, which would represent a 12.4% to 14.2% increase over 2009 diluted EPS. We expect to improve operating margins by 20-40 basis points and to generate cash flow from operations of $60 to $70 million.
During 2010, the Company will be relocating its corporate headquarters from Bethesda, Maryland to Austin, Texas and the cost of this move will be reported as a separate component of income from operations. The Company will incur severance and relocation costs of approximately $10.0 million to $12.0 million, as well as, lease exit cost of approximately $3.0 million to $5.0 million. Once complete, the Company anticipates that the move will result in a reduction in operating expenses of approximately $2.5 million to $3.5 million annually.
28
Critical Accounting Policies and Estimates
Our analysis and discussion of our financial condition and results of operations is based upon our Consolidated Financial Statements that have been prepared in accordance with accounting principles generally accepted in the United States of America ("GAAP"). The preparation of financial statements in conformity with GAAP requires management to make estimates and assumptions that affect the reported amounts of assets and liabilities and disclosure of contingent assets and liabilities at the date of the financial statements and the reported amounts of revenues and expenses during the reporting period. GAAP provides the framework from which to make these estimates, assumptions and disclosures. We have chosen accounting policies within GAAP that management believes are appropriate to accurately and fairly report our operating results and financial position in a consistent manner. Management regularly assesses these policies in light of current and forecasted economic conditions. Our accounting policies are stated in Note B to the Consolidated Financial Statements included elsewhere in this Annual Report on Form 10-K. We believe the following accounting policies are critical to understanding our results of operations and the more significant judgments and estimates used in the preparation of our Consolidated Financial Statements.
- •
- Revenue Recognition: Revenues in our patient care centers are derived from the sale of O&P devices and the maintenance and repair of existing devices. The sale of O&P devices includes the design, fabrication, assembly, fitting and delivery of a wide range of braces, limbs and other devices. Revenues from the sale of these devices are recorded when (i) acceptance by and delivery to the patient has occurred; (ii) persuasive evidence of an arrangement exists and there are no further obligations to the patients; (iii) the sales price is fixed or determinable; and (iv) collectibility is reasonably assured. Revenues from maintenance and repairs are recognized when the service is provided. Revenues from the sale of O&P devices to customers by our distribution segment are recorded upon the shipment of products, in accordance with the terms of the invoice, net of merchandise returns received and the amount established for anticipated returns. Discounted sales are recorded at net realizable value.
Revenue at our patient-care centers segment is recorded net of all contractual adjustments and discounts. We employ a systematic process to ensure that our sales are recorded at net realizable value and that any required adjustments are recorded on a timely basis. The contracting module of our centralized, computerized billing system is designed to record revenue at net realizable value based on our contract with the patient's insurance company. Updated billing information is received periodically from payors and is uploaded into our centralized contract module and then disseminated to all patient-care centers electronically.
Disallowed sales generally relate to billings to payors with whom we do not have a formal contract. In these situations, we record the sale at usual and customary rates and simultaneously record an estimate to reduce the sale to net realizable value, based on our historical experience with the payor in question. Disallowed sales may also result if the payor rejects or adjusts certain billing codes. Billing codes are frequently updated within our industry. As soon as updates are received, we reflect the change in our centralized billing system.
As part of our preauthorization process with payors, we validate our ability to bill the payor for the service we are providing before we deliver the device. Subsequent to billing for our devices and services, there may be problems with pre-authorization or other insurance coverage issues with payors. If there has been a lapse in coverage, the patient is financially responsible for the charges related to the devices and services received. If we do not collect from the patient, we record bad debt expense. Occasionally, a portion of a bill is rejected by a payor due to a coding error on our part and we are prevented from pursuing payment from the patient due to the terms of our contract with the insurance company. We appeal these types of decisions and are generally successful. This activity is factored into our methodology to determine the estimate for
29
the allowance for doubtful accounts. We immediately record, as a reduction of sales, a disallowed sale for any claims that we know we will not recover and adjust our future estimates accordingly.
Certain accounts receivable may be uncollectible, even if properly pre-authorized and billed. Regardless of the balance, accounts receivable amounts are periodically evaluated to assess collectibility. In addition to the actual bad debt expense recognized during collection activities, we estimate the amount of potential bad debt expense that may occur in the future. This estimate is based upon our historical experience as well as a review of our receivable balances. On a quarterly basis, we evaluate cash collections, accounts receivable balances and write-off activity to assess the adequacy of our allowance for doubtful accounts. Additionally, a company-wide evaluation of collectibility of receivable balances older than 180 days is performed at least semi-annually, the results of which are used in the next allowance analysis. In these detailed reviews, the account's net realizable value is estimated after considering the customer's payment history, past efforts to collect on the balance and the outstanding balance, and a specific reserve is recorded if needed. From time to time, the Company may outsource the collection of such accounts to collection agencies after internal collection efforts are exhausted. In cases where valid accounts receivable cannot be collected, the uncollectible account is written off to bad debt expense.
The following represents the composition of our accounts receivable balance by payor:
December 31, 2009
|
0-60 days | 61-120 days | Over 120 days | Total | |||||||||
|---|---|---|---|---|---|---|---|---|---|---|---|---|---|
| (In thousands) |
|
|
|
|
|||||||||
Commercial and other |
$ | 52,768 | $ | 9,862 | $ | 5,587 | $ | 68,217 | |||||
Private pay |
3,543 | 2,061 | 1,564 | $ | 7,168 | ||||||||
Medicaid |
9,929 | 2,177 | 1,382 | $ | 13,488 | ||||||||
Medicare |
22,624 | 1,796 | 1,316 | $ | 25,736 | ||||||||
VA |
1,087 | 240 | 71 | $ | 1,398 | ||||||||
|
$ | 89,951 | $ | 16,136 | $ | 9,920 | $ | 116,007 | |||||
December 31, 2008
|
0-60 days | 61-120 days | Over 120 days | Total | |||||||||
|---|---|---|---|---|---|---|---|---|---|---|---|---|---|
| (In thousands) |
|
|
|
|
|||||||||
Commercial and other |
$ | 48,209 | $ | 9,072 | $ | 6,357 | $ | 63,638 | |||||
Private pay |
3,090 | 2,065 | 1,031 | 6,186 | |||||||||
Medicaid |
8,582 | 2,725 | 1,339 | 12,646 | |||||||||
Medicare |
19,304 | 1,876 | 1,176 | 22,356 | |||||||||
VA |
908 | 178 | 48 | 1,134 | |||||||||
|
$ | 80,093 | $ | 15,916 | $ | 9,951 | $ | 105,960 | |||||
- •
- Inventories: Inventories, which consist principally of raw materials, work in process and finished goods, are stated at the lower of cost or market using the first-in, first-out method. At our patient-care centers segment, we calculate cost of goods sold—materials in accordance with the gross profit method for all reporting periods. We base the estimates used in applying the gross profit method on the actual results of the most recently completed physical inventory and other factors, such as sales mix and purchasing trends among other factors. Cost of goods sold—materials is adjusted once the annual physical inventory is taken and the valuation is completed in the fourth quarter. We treat these inventory adjustments as changes in accounting estimates. At our distribution segment, a perpetual inventory is maintained. Management adjusts our reserve for inventory obsolescence whenever the facts and circumstances indicate that the
30
- •
- Fair Value: Effective January 1, 2008, the Company adopted the authoritative guidance for fair value measurements and disclosures, which establishes a framework for measuring fair value and requires enhanced disclosures about fair value measurements. The authoritative guidance requires disclosure about how fair value is determined for assets and liabilities and establishes a hierarchy by which these assets and liabilities must be grouped, based on significant levels of inputs as follows:
carrying cost of certain inventory items is in excess of its market price. Shipping and handling costs are included in cost of goods sold—materials.
| Level 1 | quoted prices in active markets for identical assets or liabilities; | |
Level 2 |
quoted prices in active markets for similar assets and liabilities and inputs that are observable for the asset or liability; |
|
Level 3 |
unobservable inputs, such as discounted cash flow models and valuations. |
The determination of where assets and liabilities fall within this hierarchy is based upon the lowest level of input that is significant to the fair value measurement.
Effective January 1, 2008, the Company adopted the authoritative guidance that permits entities to choose to measure many financial instruments and certain other items at fair value that are not currently required to be measured at fair value. Unrealized gains and losses on items for which the fair value option has been elected are reported in earnings.
Effective January 1, 2009, the Company adopted the authoritative guidance for fair value measurements and disclosures for all non-financial assets and liabilities, except those that are recognized or disclosed at fair value in the financial statements on a recurring basis, noting no impact to the Company's consolidated financial statements.
Investments: Investment securities available-for-sale consist of auction rate securities accounted for in accordance with authoritative guidance for investments in debt and equity securities. Available-for-sale securities are reported at fair value with unrealized gains and losses excluded from earnings and reported in shareholders' equity. Securities purchased to be held for indeterminate periods of time and not intended at the time of purchase to be held until maturity are classified as available-for-sale securities with any unrealized gains and losses reported as a separate component of accumulated other comprehensive loss on our consolidated balance sheets. We continually evaluate whether any marketable investments have been impaired and, if so, whether such impairment is temporary or other than temporary.
Our investments consist of two auction rate securities ("ARS") totaling $7.5 million of par value, $5.0 million is collateralized by Indiana Secondary Market Municipal Bond—1998 ("Indiana ARS") and $2.5 million collateralized by Primus Financial Products Subordinated Deferrable Interest Notes ("Primus ARS"). ARS are securities that are structured with short-term interest rate reset dates which generally occur every 28 days and are linked to LIBOR. At the reset date, investors can attempt to sell via auction or continue to hold the securities at par. As of December 31, 2009, both investments failed at auction due to the absence of a market for the ARS. The Company's ARS are reported at fair value.
The fair values of our ARS were estimated through use of discounted cash flow models. These models consider, among other things, the timing of expected future successful auctions, collateralization of underlying security investments and the credit worthiness of the issuer. Since these inputs are not observable in an active market, they are classified as Level 3 inputs under the fair value accounting rules discussed in the "Fair Value" section above. As a result of the lack of liquidity in the ARS market and not as a result of the quality of the underlying collateral, the Company recorded unrealized losses of $0.1 million and $1.0 million for the years
31
- •
- Interest Rate Swaps: The Company utilizes interest rate swaps to manage its exposure to interest rate risk associated with the Company's variable rate borrowings. The authoritative guidance for derivatives and hedging requires companies to recognize all derivative instruments as either assets or liabilities at fair value in the consolidated balance sheets. In accordance with the authoritative guidance, the Company designates the interest rate swaps as cash flow hedges of variable-rate borrowings. For derivative instruments that are designated and qualify as a cash flow hedge, the effective portion of the gain or loss on the derivative is reported as a component of accumulated other comprehensive loss and reclassified into earnings in the same period or periods during which the hedged transaction affects earnings. Gains and losses on the derivative representing hedge ineffectiveness are recognized in earnings.
ended December 31, 2009 and 2008, respectively, related to the Primus ARS. These losses are reflected in accumulated other comprehensive loss on our consolidated balance sheets. The unrealized losses recognized during the years ended December 31, 2009 and 2008, represent the change in fair value of the auction rate securities. The fair value of the Primus ARS of $1.4 million and $1.5 million as of December 31, 2009 and 2008, respectively, is classified as other long term assets. The funds associated with this security will not be accessible until a successful auction occurs, a buyer is found outside of the auction process, the issuer refinances the underlying debt, or the underlying security matures.
During the year ended December 31, 2009 authoritative guidance was issued to modify the other-than-temporary impairment ("OTTI") analysis for debt securities classified as available-for-sale or held-to-maturity. The revised guidance requires that each reporting period, the Company compare the present value of the cash flows expected to be collected from the security against the amortized cost basis, and identify the portion of the impairment loss representing a credit loss arising from an increase in the credit risk associated with the instrument. The guidance requires the credit loss to be recognized in earnings for debt securities where Companies does not intend to sell the debt security, and it is more likely than not that the entity will be required to sell the debt security before the anticipated recovery of the amortized cost basis. In regards to the OTTI on the Primus ARS, a credit loss of $0.8 million was identified and recognized during the year ended December 31, 2009. This credit loss reduces the amortized cost basis on the Primus ARS to $1.7 million as of December 31, 2009 compared to the $2.5 million par value of the investment as of December 31, 2008.
On November 4, 2008, the Company agreed to accept Auction Rate Security Rights ("the Rights") related to the Indiana ARS from UBS offered through a prospectus filed on October 7, 2008. The Rights permit the Company to sell, or put, the Indiana ARS back to UBS at par value of $5.0 million, at any time during the period from June 30, 2010 through July 2, 2012 and to obtain a credit line from UBS collateralized by the ARS. The Company expects to exercise these Rights and put its auction rate securities back to UBS on June 30, 2010, the earliest date allowable under the Rights. By accepting the Rights, the Company can no longer assert that it has the intent to hold the Indiana ARS until anticipated recovery. The Company elected to classify the Rights and our investments in the Indiana ARS as trading securities in accordance with the authoritative guidance for accounting for investments in debt and equity securities. An OTTI charge of approximately $1.0 million was recognized during the year ended December 31, 2008 due to the reclassification of the Indiana ARS from available for sale to trading securities. Recordation of the Rights asset resulted in a gain of $1.0 million during the year ended December 31, 2008. As of December 31, 2009, the Company determined the fair value of the Rights was $0.3 million and the fair value of the ARS was $4.7 million, while the fair values of the ARS and the Rights as of December 31, 2008 were $4.0 million and $1.0 million, respectively. The change in the fair value of the Rights and the ARS for the year ended December 31, 2009 are reflected as components of earnings.
32
- •
- Goodwill and Other Intangible Assets: Goodwill represents
the excess of purchase price over the value assigned to net identifiable assets of purchased businesses. We assess goodwill for impairment annually on October 1, or when events or circumstances
indicate that the carrying value of the reporting units may not be recoverable. Any impairment would be recognized by a charge to operating results and a reduction in the carrying value of the
intangible asset. Our annual impairment test for goodwill primarily utilizes the income approach and considers the market approach and the cost approach in determining the value of our reporting
units. Non-compete agreements are recorded based on agreements entered into by us and are amortized, using the straight-line method, over their terms ranging from five to seven
years. Other definite-lived intangible assets are recorded at cost and are amortized, using the straight-line method, over their estimated useful lives of up to 17 years. Whenever
the facts and circumstances indicate that the carrying amounts of these intangibles may not be recoverable, management reviews and assesses the future cash flows expected to be generated from the
related intangible for possible impairment. Any impairment would be recognized as a charge to operating results and a reduction in the carrying value of the intangible asset.
- •
- Income Taxes: We recognize deferred income tax liabilities and assets for the expected future tax consequences of events that have been included in the consolidated financial statements or tax returns. We account for income taxes under the liability method, whereby deferred income tax liabilities and assets are determined based on the difference between the financial statement and the tax basis of assets and liabilities using enacted tax rates in effect for the year in which the differences are expected to reverse. Valuation allowances are established, when necessary, to
In May 2008, the Company entered into two interest rate swap agreements under which $150.0 million of the Company's variable rate term loans were converted to a fixed rate of 5.4%. The fair value of each interest rate swap is an estimate of the present value of the expected future cash flows the Company is to receive under the applicable interest rate swap agreement. The valuation models used to determine the fair value of the interest rate swaps are based upon the forward yield curve of one month LIBOR (Level 2 inputs), the hedged interest rate, and other factors including counterparty credit risk. The agreements, which expire April 2011, qualify as cash flow hedges in accordance with the authoritative guidance for derivatives and hedging for the year ended December 31, 2009. The interest rate swaps did not qualify for hedge accounting under the authoritative guidance for hedging and derivatives during the second quarter of 2009 due to changes in counterparty risk factors. As a result, the change in the fair value of the interest rate swap was recognized in earnings during the second quarter of 2009 resulting in the Company recording an unrealized gain of $0.2 million which is reflected in the Company's consolidated income statement for the year ended December 31, 2009. In the first, third, and fourth quarters of 2009, the Company's interest rate swaps qualified for hedge accounting, hence any adjustments in fair value related to the effective portion of the interest rate swaps were not required to be recognized through the income statement in those periods.
Since their inception, the fair value of the interest rate swaps has declined $5.3 million. Of the decline, $4.8 million is related to the effective portion of the interest rate swaps and was reported as a component of accumulated other comprehensive loss on our consolidated balance sheets. The current portion of the liability, $4.4 million, is reported in accrued expenses, while the remainder is reported in other liabilities on the Company's consolidated balance sheets as of December 31, 2009. As of December 31, 2008, liabilities from the interest rate swaps were $7.2 million, with $3.7 million reported in accrued expenses, with the remainder reported in other liabilities. Of the $7.2 million in liabilities reported as of December 31, 2008, $6.5 million related to the effective portion of the interest rate swaps and was reported as a component of accumulated other comprehensive loss on our consolidated balance sheets.
33
- •
- Stock-Based Compensation: Stock-based compensation is
accounted for using the grant-date fair value method. Compensation expense is recognized ratably over the service period. We estimate a 2% forfeiture rate for unvested restricted stock
awards. Based on our history of restricted stock forfeitures, we do not believe future forfeitures will have a material impact on future compensation expense or earnings per share.
- •
- Supplemental Executive Retirement Plan: Benefit costs and liabilities balances are calculated based on certain assumptions including benefits earned, discount rates, interest costs, mortality rates and other factors. Actual results that differ from the assumptions are accumulated and amortized over future periods, affecting the recorded obligation and expense in future periods. The following assumptions were used in the calculation of the net benefit cost and obligation at December 31:
reduce deferred tax assets when we expect the amount of tax benefit to be realized to be less than the carrying value of the deferred tax asset.
| |
2009 | 2008 | |||||
|---|---|---|---|---|---|---|---|
Discount rate |
5.50 | % | 6.25 | % | |||
Average rate of increase in compensation |
3.25 | % | 3.25 | % | |||
We believe the assumptions used are appropriate. However, changes in assumptions or differences in actual experience may affect our benefit obligation and future expenses.
New Accounting Guidance
In August 2009, the FASB issued additional authoritative guidance for measuring the fair value of liabilities, including clarification for circumstances whereby a quoted price in an active market for an identical liability is not available. The additional authoritative guidance was effective for the year ending December 31, 2009, and adoption did not have a material impact on the Company's consolidated financial statements.
Results of Operations
The following table sets forth, for the periods indicated, certain items from our statements of operations as a percentage of our net sales:
| |
For the Year Ended December 31, | |||||||||
|---|---|---|---|---|---|---|---|---|---|---|
| |
2009 | 2008 | 2007 | |||||||
Net sales |
100.0 | % | 100.0 | % | 100.0 | % | ||||
Cost of goods sold—Materials |
30.0 | 29.9 | 29.0 | |||||||
Personnel Costs |
34.9 | 35.3 | 35.3 | |||||||
Other operating expenses |
21.1 | 21.3 | 22.6 | |||||||
Depreciation and amortization |
2.1 | 2.4 | 2.5 | |||||||
Income from operations |
11.9 | 11.1 | 10.7 | |||||||
Interest expense |
4.0 | 4.7 | 5.8 | |||||||
Unrealized gain from interest rate swap |
— | (0.1 | ) | — | ||||||
Income before taxes |
7.9 | 6.3 | 4.9 | |||||||
Provision for income taxes |
3.2 | 2.5 | 1.8 | |||||||
Net income |
4.7 | 3.8 | 3.1 | |||||||
34
Year-ended December 31, 2009 compared with the year ended December 31, 2008
Net Sales. Net sales for the year ended December 31, 2009 increased by $57.0 million, or 8.1%, to $760.1 million from $703.1 million last year. The sales increase was principally the result of a $29.6 million, or 4.9%, increase in same-center sales in our patient care centers, a $7.3 million, or 9.1%, increase in sales of the Company's distribution segment and a $20.1 million increase principally related to sales from acquired entities.
Cost of Goods Sold—Materials. Cost of goods sold—materials for the year ended December 31, 2009 were $228.3 million, an increase of $18.0 million, or 8.6%, over $210.3 million for the same period in the prior year. The increase was the result of the growth in sales. Cost of goods sold—materials as a percentage of net sales increased to 30.0% in 2009 from 29.9% in 2008. The increase in cost of goods sold—materials as a percentage of sales resulted from an increase in sales of the distributions business which have higher materials costs and to a lesser extent increase in materials costs at the patient care centers.
Personnel Costs. Personnel costs for the year ended December 31, 2009 increased by $16.4 million to $264.6 million from $248.2 million for the year ended December 31, 2008. The increase of $16.4 million from the prior year is due primarily to $7.6 million related to merit increases and other compensation, $6.5 million from acquired entities, and $2.3 million increase in employee benefit cost. As a percentage of net sales, personnel costs have decreased by 40 basis points compared to the same period in the prior year.
Other Operating Expenses. Other operating expenses for the year ended December 31, 2009 increased by $10.7 million to $160.4 million from $149.7 million for the year ended December 31, 2008. The increase is due primarily to $6.3 million increase in bonus expense, $4.0 million increase in rent expense, and $0.4 million increase in other operating expenses. Other operating expenses as a percentage of net sales decreased 20 basis points to 21.1% compared to the same period in the prior year.
Depreciation and Amortization. Depreciation and amortization for the year ended December 31, 2009 was $16.3 million versus $17.2 million for the year ended December 31, 2008. The decrease from the prior year was due to certain assets related to our billing system being fully depreciated.
Income from Operations. Income from operations increased $12.8 million to $90.5 million for the year ended December 31, 2009 compared to $77.7 million in the year ended December 31, 2008 due to the combination of increased sales and effective expense management.
Interest Expense. Interest expense for the year ended December 31, 2009 decreased to $30.7 million compared to $32.5 million for the year ended December 31, 2008 primarily due to lower variable interest rates.
Provision for Income Taxes. An income tax provision of $23.9 million was recognized for the year ended December 31, 2009 compared to $17.7 million for the same period of the prior year. The change in the income tax provision was primarily the result of an increase in pretax income. The effective tax rate was 39.8% for the years ended December 31, 2009 and 2008. The effective tax rate consists principally of the federal statutory tax rate of 35.0% and state income taxes.
Net Income. Net income applicable to common stock for year ended December 31, 2009 increased to $36.1 million, or $1.13 per diluted share, compared to net income applicable to common stock of $21.1 million, or $0.78 per diluted share, for the year ended December 31, 2008. In addition to improved income from operations, net income benefited from lower variable interest costs during 2009.
35
Year ended December 31, 2008 compared with the year ended December 31, 2007
Net Sales. Net sales for the year ended December 31, 2008 were $703.1 million, an increase of $65.7 million, or 10.3%, versus net sales of $637.4 million for the year ended December 31, 2007. The net sales growth was the result of a $41.3 million, or 7.3%, increase in same-center sales, an $11.5 million, or 19.1%, increase in external sales of the distribution segment, and $11.9 million contributed from acquired entities.
Cost of Goods Sold—Materials. Cost of goods sold—materials for the year ended December 31, 2008 were $210.3 million, an increase of $25.7 million, or 13.9%, over $184.6 million for the year ended December 31, 2007. The increase was the result of the growth in sales. Cost of goods sold—materials as a percentage of net sales increased to 29.9% in 2008 from 29.0% in 2007. The increase in cost of goods sold—materials was due to the increase in sales of the distribution business which have higher material costs and to a lesser extent increase in material costs at the patient care centers.
Personnel Costs. Personnel costs for the year ended December 31, 2008 increased by $23.2 million to $248.2 million from $225.0 million for the year ended December 31, 2007. As a percentage of net sales, personnel costs did not change compared to the year ended December 31, 2007.
Other Operating Expenses. Other operating expenses for the year ended December 31, 2008 increased by $5.8 million to $149.7 million from $143.9 million for the year ended December 31, 2007. As a percentage of net sales, other operating expenses decreased 130 basis points to 21.3% compared to the year ended December 31, 2007.
Depreciation and Amortization. Depreciation and amortization expense increased $1.3 million for the year to $17.2 million from $15.9 million in prior year. The increase is a result of investments in leasehold improvements, computer hardware, and the computer software over the last 18 months. In addition, as part of acquisitions completed in 2008, the Company recorded customer relationship and other intangibles. Amortization related to current year acquisitions, as well as a full year of amortization of intangibles related to SureFit, which we acquired mid-2007, resulted in an additional $0.2 million of amortization expense.
Income from Operations. Income from operations increased 14.3%, or $9.7 million, to $77.7 million from $68.0 million in the prior year due principally to the increase in net sales. Income from operations as a percentage of net sales increased by 0.4% to 11.1% from 10.7% in the prior year due to leveraging operating costs over increased sales, offset by a slight increase in material costs.
Interest Expense. Interest expense for the year ended December 31, 2008 was $32.5 million, a decrease of $4.5 million from the $37.0 million incurred in 2007. The decrease in interest expense was attributable to more favorable variable interest rates on the Company's loans and credit facilities.
Unrealized loss from Interest Rate Swap. During 2008, the Company entered into two interest rate swap agreements under which $150.0 million of the Company's variable term loans were converted to a fixed rate. These interest rate swaps are accounted for under the authoritative guidance for derivatives and hedging and during the period a portion of the swaps were deemed to be ineffective resulting in the Company recording an unrealized loss of $0.7 million.
Provision for Income Taxes. The provision for income taxes for the year ended December 31, 2008 was $17.7 million, or 39.8% of pretax income, compared to $11.7 million, or 37.8% of pretax income, for the year ended December 31, 2007. The increase in income tax expense as a percentage of pretax income is partially attributable to an increase in state tax expenses and partially offset by a reduction in valuation allowances. The effective tax rate consists principally of the federal statutory tax rate of 35.0% and state income taxes.
36
Net Income. As a result of the above, we recorded net income of $26.7 million for the year ended December 31, 2008, compared to net income of $19.3 million in the prior year.
Financial Condition, Liquidity and Capital Resources
Cash Flows
Our working capital at December 31, 2009 was $216.7 million compared to $200.2 million at December 31, 2008. Working capital increased principally as a result of an increase in cash and short-term investments. Cash on hand increased due to improved cash flow from operations resulting from continued improvements in cash collections. Days sales outstanding ("DSO"), which is the number of days between the billing for our O&P services and the date of our receipt of payment thereof, for the year ended December 31, 2009 decreased to 50 days compared to 51 days for the same period last year. The decrease in DSO was due to a continued effort at our patient-care centers to target collections as well as the implementation of electronic billing and standard workflow protocols. The ratio of current assets to current liabilities was 3.3 to 1 at December 31, 2009 compared to 3.7 to 1 at December 31, 2008. Net cash provided by operating activities was $73.1 million for the year ended December 31, 2009, compared to $53.2 million in the prior year. The current year operating cash flows reflected improved financial performance and improved collections.
Net cash used in investing activities was $34.2 million for the year ended December 31, 2009, compared to $30.2 million in the prior year. In 2009, 2008, and 2007, we invested $21.3 million, $19.3 million and $20.1, million respectively, in improvements to our patient care centers and in upgrades to our computer hardware and software. In addition, during 2009 we acquired seven orthotic and prosthetic companies which had a total of 23 patient care centers and one fabrication facility. In 2008, we acquired 13 orthotic and prosthetic companies which had a total of 19 patient care centers, and we acquired two orthotic and prosthetic companies along with the assets of SureFit, LLC, a manufacturer and distributor of custom footwear in 2007. During 2007, we invested in two auction rate securities with a par value of $7.5 million. Additionally, in 2009, we invested $2.0 million in company owned life insurance policies which cover the executives and certain management of the Company, whereby the Company is the beneficiary.
Net cash used in financing activities was $12.8 million for the year ended December 31, 2009, while net cash provided by financing activities was $8.4 million for the year ended December 31, 2008. This compares to net cash used of $5.8 million for the year ended December 31, 2007. As of December 31, 2009, $75.6 million, or 18.4%, of the Company's total debt of $410.5 million was subject to variable interest rates. The Company had access to funds totaling $148.5 million, comprised of $84.6 million of cash and $63.9 million available under its Revolving Credit Facility at December 31, 2009. The Company believes that it has sufficient liquidity to conduct its normal operations and fund its acquisition plan in 2010.
37
Debt
The following summarizes our debt balance at December 31:
| (In thousands) |
2009 | 2008 | |||||
|---|---|---|---|---|---|---|---|
Revolving Credit Facility |
$ | — | $ | 15,253 | |||
Line of Credit |
3,628 | — | |||||
Term Loan |
221,956 | 223,064 | |||||
101/4% Senior Notes due 2014 |
175,000 | 175,000 | |||||
Subordinated seller notes, non-collateralized, net of unamortized discount with principal and interest payable in either monthly, quarterly or annual installments at effective interest rates ranging from 5.00% to 7.25%, maturing through December 2014 |
9,888 | 9,007 | |||||
|
410,472 | 422,324 | |||||
Less current portion |
(8,835 | ) | (3,794 | ) | |||
|
$ | 401,637 | $ | 418,530 | |||
Revolving Credit Facility
The $75.0 million Revolving Credit Facility matures on May 26, 2011 and bears interest, at the Company's option, at LIBOR plus 2.75% or a Base Rate (as defined in the credit agreement) plus 1.75%. The obligations under the Revolving Credit Facility are guaranteed by the Company's subsidiaries and are secured by a first priority perfected interest in the Company's subsidiaries' shares, all of the Company's assets and all the assets of the Company's subsidiaries. The Revolving Credit Facility requires compliance with various covenants including but not limited to a maximum total leverage ratio of 6.5 times EBITDA (as defined in the credit agreement) and a maximum annual capital expenditures limit of $50.0 million, plus an unused portion of such amount from the previous fiscal year.
In response to the volatility in the current global credit markets, on September 26, 2008, the Company decided to validate its borrowing capacity and availability by submitting a $20.0 million borrowing request under the facility. As anticipated, Lehman Commercial Paper, Inc. ("LCPI"), a subsidiary of Lehman Brothers Holdings, Inc. ("Lehman"), failed to fund its pro-rata commitment of $4.7 million and the Company borrowed a total of $15.3 million under the facility on September 29, 2008. LCPI's total commitment was $17.8 million of our total $75.0 million dollar facility. On July 15, 2009, the Company repaid the outstanding balance on the Revolving Credit Facility.
On October 23, 2009, Barclays Bank PLC replaced $10.0 million of the $17.8 million defaulted LCPI commitment under the Revolving Credit Facility. LCPI's remaining commitment under default is $7.8 million of our total $75.0 million dollar facility. As of December 31, 2009, the Company had $63.9 million available under the revolving credit facility, net of LCPI's $7.8 remaining defaulted million commitment and $3.3 million of outstanding letters of credit.
Line of Credit
On April 6, 2009 the Company obtained a collateralized line of credit from UBS in conjunction with the Rights agreement. The credit line is collateralized by our Indiana ARS and allows the Company to borrow up to the fair market value of the ARS not to exceed its $5.0 million par value. As of December 31, 2009, the Company had drawn $3.6 million, which is the maximum currently allowed under the agreement. The credit line has no net cost to the Company, as it bears interest in the amount equal to the income on the ARS.
38
Term Loan
The $230.0 million Term Loan matures on May 26, 2013 and requires quarterly principal and interest payments that commenced on September 30, 2006. From time to time, mandatory payments may be required as a result of excess cash flows, capital stock issuances, additional debt incurrences, asset sales or other events as defined in the credit agreement. The obligations under the Term Loan are guaranteed by the Company's subsidiaries and are secured by a first priority perfected interest in the Company's subsidiaries' shares, all of the Company's assets and all the assets of the Company's subsidiaries. The Term Loan is subject to covenants that mirror those of the Revolving Credit Facility. The Company secured, effective March 13, 2007, certain amendments to the Term Loan that included reducing the margin over LIBOR that the Company pays as interest under the existing Term Loan from 2.50% to 2.00%. The Term Loan bears interest, at the Company's option, at LIBOR plus 2.00% or a Base Rate (as defined in the credit agreement) plus 1.00%. At December 31, 2009, the interest rate on the Term Loan was 2.24%.
101/4% Senior Notes
The 101/4% Senior Notes, entered into on May 26, 2006, mature June 1, 2014, are senior indebtedness and are guaranteed on a senior unsecured basis by all of the Company's current and future domestic subsidiaries. Interest is payable semi-annually on June 1 and December 1.
The notes are not redeemable at the Company's option prior to June 1, 2010. On or after June 1, 2010, the Company may redeem all or part of the notes upon not less than 30 days and no more than 60 days' notice, for the twelve-month period beginning on June 1 of the following years; at (i) 105.125% during 2010; (ii) 102.563% during 2011; and (iii) 100.0% during 2012 and thereafter through June 1, 2014.
Debt Covenants
The terms of the Senior Notes, the Revolving Credit Facility, and the Term Loan limit the Company's ability to, among other things, incur additional indebtedness, create liens, pay dividends on or redeem capital stock, make certain investments, make restricted payments, make certain dispositions of assets, engage in transactions with affiliates, engage in certain business activities and engage in mergers, consolidations and certain sales of assets. At December 31, 2009, the Company was in compliance with all covenants under these debt agreements.
General
We believe that, based on current levels of operations and anticipated growth, cash generated from operations, together with other available sources of liquidity, including borrowings available under the Revolving Credit Facility, will be sufficient for at least twelve months to fund anticipated capital expenditures and make required payments of principal and interest on our debt, including payments due on our outstanding debt. We also believe that based on the Company's cash and cash equivalents balances of $84.6 million at December 31, 2009 and our expected continued increase in operating cash flows, the current lack of liquidity in the ARS market will not have a material impact on the Company's liquidity, financial condition, results of operations or cash flows. In addition, we will continue to evaluate potential acquisitions and expect to fund such acquisitions from our available sources of liquidity, as discussed above. We are limited to $50.0 million in acquisitions annually by the terms of the Revolving Credit Facility agreement. As of December 31, 2009, the Company had $63.9 million of available credit under the Revolving Credit Facility. Availability under the Company's Revolving Credit Facility is net of LCPI's $7.8 million defaulted commitment and $3.3 million of outstanding letters of credit.
39
Preferred Stock
In June 2008, the average closing price of the Company's common stock exceeded the Company's forced conversion price of the Series A Convertible Preferred Stock by 200% for a 20-trading day period, triggering an acceleration of the Series A Preferred Stock dividends that were otherwise payable through May 26, 2011. The accelerated dividends were paid in the form of increased stated value of preferred stock, in lieu of cash. On July 25, 2008, the Company notified the holder of Series A Preferred Stock of its election to force the conversion of the Series A Preferred into 7,308,730 shares of common stock. The conversion of the Series A Preferred Stock to common stock occurred on August 8, 2008.
Obligations and Commercial Commitments
The following table sets forth our contractual obligations and commercial commitments as of December 31, 2009:
| (In thousands) |
2010 | 2011 | 2012 | 2013 | 2014 | Thereafter | Total | |||||||||||||||
|---|---|---|---|---|---|---|---|---|---|---|---|---|---|---|---|---|---|---|---|---|---|---|
Long-term debt |
$ | 8,835 | $ | 5,324 | $ | 5,221 | $ | 215,985 | $ | 175,107 | $ | — | $ | 410,472 | ||||||||
Interest payments on long-term debt |
28,213 | 27,963 | 27,743 | 22,762 | 8,972 | — | 115,653 | |||||||||||||||
Operating leases |
38,081 | 32,312 | 25,769 | 18,282 | 12,004 | 9,305 | 135,753 | |||||||||||||||
Capital leases |
464 | 389 | 317 | 148 | — | — | 1,318 | |||||||||||||||
Other long-term obligations(1) |
4,089 | 5,432 | 4,438 | 3,018 | 2,748 | 8,477 | 28,202 | |||||||||||||||
Total contractual cash obligations |
$ | 79,832 | $ | 71,420 | $ | 63,488 | $ | 260,195 | $ | 198,831 | $ | 43,471 | $ | 691,398 | ||||||||
- (1)
- Other long-term obligations include commitments under our SERP plan. Refer to Note L of the Company's Annual Repoort on Form 10-K for additional disclosure.
In addition to the table above, the Company has certain other tax liabilities as of December 31, 2009 comprised of $1.4 million of tax effected unrecognized tax benefits, of which $0.8 million is expected to be settled in the fiscal year 2010.
Dividends
We have never paid cash dividends on our common stock and intend to continue this policy for the foreseeable future. We plan to retain earnings for use in our business. The terms of our agreements with our financing sources and certain other agreements limit the payment of dividends on our common stock and such agreements will continue to limit the payment of dividends in the future.
Supplemental Executive Retirement Plan
In 2004, we implemented an unfunded noncontributory defined benefit plan that covers certain of our senior executives. We have engaged an actuary to calculate the benefit obligation and net benefits cost as of December 31, 2009, and 2008 and have utilized the actuarial calculations as a basis for establishing our benefit obligation liability.
The following weighted average assumptions were used to determine the benefit obligation and net benefit cost at December 31:
| |
2009 | 2008 | |||||
|---|---|---|---|---|---|---|---|
Discount rate |
5.50 | % | 6.25 | % | |||
Average rate of increase in compensation |
3.25 | % | 3.25 | % | |||
40
The discount rate at December 31, 2009 of 5.50% decreased 75 basis points compared to the discount rate used at December 31, 2008 due to changes in the pension discount curve rate available on the open market at December 31, 2009. The average rate of increase in compensation was 3.25 percent at December 31, 2009 and 2008.
Future payments under the supplemental executive retirement plan as of December 31, 2009 are as follows:
| |
(In thousands) | |||
|---|---|---|---|---|
2010 |
— | |||
2011 |
1,037 | |||
2012 |
1,218 | |||
2013 |
1,218 | |||
2014 |
1,548 | |||
Thereafter |
8,477 | |||
|
$ | 13,498 | ||
Selected Operating Data
The following table sets forth selected operating data as of the end of the years indicated:
| |
2009 | 2008 | 2007 | 2006 | 2005 | |||||||||||
|---|---|---|---|---|---|---|---|---|---|---|---|---|---|---|---|---|
Patient-care centers |
677 | 668 | 636 | 618 | 624 | |||||||||||
Revenue-generating O&P practitioners |
1,127 | 1,070 | 1,060 | 1,034 | 1,021 | |||||||||||
Number of states (including D.C.) |
46 | 46 | 46 | 46 | 46 | |||||||||||
Same-center net sales growth(1) |
4.9 | % | 7.3 | % | 5.0 | % | 2.2 | % | 0.2 | % | ||||||
- (1)
- Represents the aggregate increase or decrease of our patient-care centers' sales in the current year compared to the preceding year. Patient-care centers that have been owned by the Company for at least one full year are included in the computation.
Market Risk
We are exposed to the market risk that is associated with changes in interest rates. At December 31, 2009, all our outstanding debt, with the exception of the $72.0 million of the Term Loan and the $3.6 million of the Line of Credit, is subject to fixed interest rates. Interest on the $3.6 million outstanding on the Line of Credit has no net cost to the Company, as it bears interest equal to the income on the ARS. (see Item 7A below).
Forward Looking Statements
This report contains forward-looking statements setting forth our beliefs or expectations relating to future revenues, contracts and operations, as well as the results of an internal investigation and certain legal proceedings. Actual results may differ materially from projected or expected results due to changes in the demand for our O&P products and services, uncertainties relating to the results of operations or recently acquired O&P patient-care centers, our ability to enter into and derive benefits from managed-care contracts, our ability to successfully attract and retain qualified O&P practitioners, federal laws governing the health-care industry, uncertainties inherent in incomplete investigations and legal proceedings, governmental policies affecting O&P operations and other risks and uncertainties generally affecting the health-care industry. Readers are cautioned not to put undue reliance on forward-looking statements. Refer to risk factors disclosed in Part I, Item 1A of this filing for discussion of risks and uncertainties. We disclaim any intent or obligation to publicly update these forward-looking statements, whether as a result of new information, future events or otherwise.
41
ITEM 7A. QUANTITATIVE AND QUALITATIVE DISCLOSURES ABOUT MARKET RISK.
We have existing obligations relating to our 101/4% Senior Notes, Term Loan, and Subordinated Seller Notes. As of December 31, 2009, we have cash flow exposure to the changing interest rates on $72.0 million of the Term Loan. We are not subject to changes in interest rates on the $3.6 million outstanding as the Line of Credit has no net cost to the Company, as it bears interest equal to the income on the ARS. The other obligations have fixed interest rates.
In addition, in the normal course of business, we are exposed to fluctuations in interest rates. From time to time, we execute LIBOR contracts to fix interest rate exposure for specific periods of time. At December 31, 2009, we had one contract outstanding which fixed LIBOR at 2.24% , which expired on January 29, 2010.
In May 2008, the Company entered into two interest rate swap agreements under which $150.0 million of the Company's variable rate Term Loans were converted to a fixed rate of 5.4%. The agreements expire in April 2011.
Presented below is an analysis of our financial instruments as of December 31, 2009 that are sensitive to changes in interest rates. The table demonstrates the changes in estimated annual cash flow related to the outstanding balance under the Term Loan and the Interest Rate Swap, calculated for an instantaneous parallel shift in interest rates, plus or minus 50 basis points ("BPS"), 100 BPS, and 150 BPS.
| |
Annual Interest Expense Given an Interest Rate Decrease of X Basis Points |
No Change in Interest Rates |
Annual Interest Expense Given an Interest Rate Increase of X Basis Points |
|||||||||||||||||||
|---|---|---|---|---|---|---|---|---|---|---|---|---|---|---|---|---|---|---|---|---|---|---|
Cash Flow Risk
|
(150 BPS) | (100 BPS) | (50 BPS) | |
50 BPS | 100 BPS | 150 BPS | |||||||||||||||
| (In thousands) |
|
|||||||||||||||||||||
Term Loan |
$ | 1,642 | $ | 2,752 | $ | 3,862 | $ | 4,972 | $ | 6,082 | $ | 7,191 | $ | 8,301 | ||||||||
Interest Rate Swap |
7,005 | 6,255 | 5,505 | 4,755 | 4,005 | 3,255 | 2,505 | |||||||||||||||
|
$ | 8,647 | $ | 9,007 | $ | 9,367 | $ | 9,727 | $ | 10,087 | $ | 10,446 | $ | 10,806 | ||||||||
ITEM 8. FINANCIAL STATEMENTS AND SUPPLEMENTARY DATA.
The consolidated financial statements and schedules required hereunder and contained herein are listed under Item 15(a) below and included beginning at page F-4 of this Annual Report on Form 10-K.
Quarterly Financial Data
| |
Quarter Ended (Unaudited) | ||||||||||||
|---|---|---|---|---|---|---|---|---|---|---|---|---|---|
2009
|
Mar 31 | Jun 30 | Sep 30 | Dec 31(1) | |||||||||
| (Dollars in thousands, except per share amounts) |
|||||||||||||
Net Sales |
$ | 169,146 | $ | 193,523 | $ | 192,296 | $ | 205,104 | |||||
Income from Operations |
$ | 15,131 | $ | 24,156 | $ | 23,762 | $ | 27,471 | |||||
Net Income |
$ | 4,515 | $ | 10,036 | $ | 9,642 | $ | 11,900 | |||||
Basic per Common Share Net Income |
$ | 0.15 | $ | 0.32 | $ | 0.31 | $ | 0.37 | |||||
Diluted per Common Share Net Income |
$ | 0.14 | $ | 0.31 | $ | 0.30 | $ | 0.37 | |||||
42
| |
Quarter Ended (Unaudited) | ||||||||||||
|---|---|---|---|---|---|---|---|---|---|---|---|---|---|
2008
|
Mar 31 | Jun 30 | Sep 30 | Dec 31(1) | |||||||||
| (Dollars in thousands, except per share amounts) |
|||||||||||||
Net Sales |
$ | 157,656 | $ | 181,184 | $ | 178,742 | $ | 185,547 | |||||
Income from Operations |
14,199 | 21,387 | 20,238 | 21,904 | |||||||||
Net Income |
3,565 | 8,005 | 7,340 | 7,836 | |||||||||
Basic per Common Share Net Income |
$ | 0.14 | $ | 0.12 | $ | 0.27 | $ | 0.25 | |||||
Diluted per Common Share Net Income |
$ | 0.12 | $ | 0.11 | $ | 0.23 | $ | 0.24 | |||||
- (1)
- For the three month periods ended December 31, 2009 and 2008 includes: $2.1 million and $0.8 million, respectively, decrease to cost of material resulting from the company's annual physical inventory.
ITEM 9. CHANGES IN AND DISAGREEMENTS WITH ACCOUNTANTS ON ACCOUNTING AND FINANCIAL DISCLOSURE.
None.
ITEM 9A. CONTROLS AND PROCEDURES.
Disclosure Controls and Procedures
The Company's disclosure controls and procedures are designed to provide reasonable assurance that information required to be disclosed by it in its periodic reports filed with the Securities and Exchange Commission is recorded, processed, summarized and reported within the time periods specified in the Commission's rules and forms. Based on an evaluation of the Company's disclosure controls and procedures conducted by the Company's Chief Executive Officer and Chief Financial Officer, such officers concluded that the Company's disclosure controls and procedures were effective as of December 31, 2009. Additionally, the Company's officers concluded that the Company's disclosure controls and procedures were effective as of December 31, 2009 to ensure that information required to be disclosed in the reports filed with the Exchange Act was accumulated and communicated to management, including the Company's Chief Executive Officer and Chief Financial Officer, to allow timely decisions regarding required disclosures.
Internal Control Over Financial Reporting
(a) Management's Annual Report on Internal Control Over Financial Reporting
In accordance with Section 404(a) of the Sarbanes-Oxley Act of 2002 and Item 308(a) of the Commission's Regulation S-K, the report of management on the Company's internal control over financial reporting is set forth immediately preceding the Company's financial statements included in this Annual Report on Form 10-K.
(b) Report of the Registrant's Independent Registered Public Accounting Firm
The effectiveness of the Company's internal control over financial reporting as of December 31, 2009 has been audited by PricewaterhouseCoopers LLP, an independent registered public accounting firm, as stated in their report included in this Annual Report on Form 10-K.
(c) Changes in Internal Control Over Financial Reporting
In accordance with Rule 13a-15(d) under the Securities Exchange Act of 1934, management, with the participation of the Company's Chief Executive Officer and Chief Financial Officer, determined that there was no change in the Company's internal control over financial reporting that occurred during the fourth quarter ended December 31, 2009, that has materially effected, or is reasonably likely to materially effect, the Company's internal control over financial reporting.
43
None.
ITEM 10. DIRECTORS, EXECUTIVE OFFICERS AND CORPORATE GOVERNANCE.
Pursuant to General Instruction G(3) of Form 10-K, the information called for by this item regarding directors is hereby incorporated by reference from our definitive proxy statement or amendment hereto to be filed pursuant to Regulation 14A not later than 120 days after the end of the fiscal year covered by this report. Information regarding our executive officers is set forth at the end of Part I of this Annual Report on Form 10-K.
ITEM 11. EXECUTIVE COMPENSATION.
Pursuant to General Instruction G(3) of Form 10-K, the information called for by this item is hereby incorporated by reference from our definitive proxy statement or amendment hereto to be filed pursuant to Regulation 14A not later than 120 days after the end of the fiscal year covered by this report.
ITEM 12. SECURITY OWNERSHIP OF CERTAIN BENEFICIAL OWNERS AND MANAGEMENT AND RELATED STOCKHOLDER MATTERS.
Pursuant to General Instruction G(3) of Form 10-K, the information called for by this item is hereby incorporated by reference from our definitive proxy statement or amendment hereto to be filed pursuant to Regulation 14A not later than 120 days after the end of the fiscal year covered by this report.
ITEM 13. CERTAIN RELATIONSHIPS AND RELATED TRANSACTIONS, AND DIRECTOR INDEPENDENCE.
Pursuant to General Instruction G(3) of Form 10-K, the information called for by this item is hereby incorporated by reference from our definitive proxy statement or amendment hereto to be filed pursuant to Regulation 14A not later than 120 days after the end of the fiscal year covered by this report.
ITEM 14. PRINCIPAL ACCOUNTING FEES AND SERVICES.
Pursuant to General Instruction G(3) of Form 10-K, the information called for by this item is hereby incorporated by reference from our definitive proxy statement or amendment hereto to be filed pursuant to Regulation 14A not later than 120 days after the end of the fiscal year covered by this report.
44
ITEM 15. EXHIBITS AND FINANCIAL STATEMENT SCHEDULE.
(a) Financial Statements and Financial Statement Schedule:
(1) Financial Statements:
Hanger Orthopedic Group, Inc. |
||||
Management's Annual Report on Internal Control over Financial Reporting |
||||
Report of Independent Registered Public Accounting Firm |
||||
Consolidated Balance Sheets as of December 31, 2009 and 2008 |
||||
Consolidated Income Statements for the Three Years Ended December 31, 2009 |
||||
Consolidated Statements of Changes in Shareholders' Equity for the Three Years Ended December 31, 2009 |
||||
Consolidated Statements of Cash Flows for the Three Years Ended December 31, 2009 |
||||
Notes to Consolidated Financial Statements |
(2) Financial Statements Schedule:
| Schedule II—Valuation and Qualifying Accounts | ||||
All other schedules are omitted either because they are not applicable or required, or because the required information is included in the financial statements or notes thereto. |
(3) Exhibits:
See Part (b) of this Item 15.
- (b)
- Exhibits: The following exhibits are filed herewith or incorporated herein by reference:
| Exhibit No. | Document | ||
|---|---|---|---|
| 3(a) | Certificate of Incorporation, as amended, of the Registrant. (Incorporated herein by reference to Exhibit 3.1 to the Registrant's Annual Report on Form 10-K for the fiscal year ended September 30, 1988). | ||
3(b) |
Certificate of Amendment of the Registrant's Certificate of Incorporation (which, among other things, changed the Registrant's corporate name from Sequel Corporation to Hanger Orthopedic Group, Inc.), as filed on August 11, 1989 with the Office of the Secretary of State of Delaware. (Incorporated herein by reference to Exhibit 3(b) to the Registrant's Current Report on Form 8-K dated February 13, 1990). |
||
3(c) |
Certificate of Agreement of Merger of Sequel Corporation and Delaware Sequel Corporation. (Incorporated herein by reference to Exhibit 3.1(a) to the Registrant's Annual Report on Form 10-K for the fiscal year ended September 30, 1988). |
||
3(d) |
Certificate of Ownership and Merger of Hanger Acquisition Corporation and J. E. Hanger, Inc. as filed with the Office of the Secretary of the State of Delaware on April 11, 1989. (Incorporated herein by reference to Exhibit 2(f) to the Registrant's Current Report on Form 8-K dated May 15, 1989). |
||
45
| Exhibit No. | Document | ||
|---|---|---|---|
| 3(e) | Certificate of Amendment to Certificate of Incorporation of the Registrant, as filed with the Secretary of State of Delaware on September 16, 1999. (Incorporated herein by reference to Exhibit 3 to the Registrant's Quarterly Report on Form 10-Q for the quarter ended September 30, 1999). | ||
3(f) |
Amended and Restated By-Laws of the Registrant. (Incorporated herein by reference to Exhibit 3.2 to the Registrant's Quarterly Report on Form 10-Q for the quarterly period ended September 30, 2008). |
||
10(a) |
Amended and Restated 2002 Stock Incentive Plan, as amended through May 10, 2007. (Incorporated herein by reference to Appendix 1 to the Registrant's Proxy Statement, dated April 10, 2007, relating to the Registrant's Annual Meeting of Stockholders held on May 10, 2007).* |
||
10(b) |
Amended and Restated 2003 Non-Employee Directors' Stock Incentive Plan, as amended through May 10, 2007. (Incorporated herein by reference to Appendix 2 to the Registrant's Proxy Statement, dated April 10, 2007, relating to the Registrant's Annual Meeting of Stockholders held on May 10, 2007). |
||
10(c) |
Form of Stock Option Agreement (Non-Executive Employees), Stock Option Agreement (Executive Employees), Restricted Stock Agreement (Non-Executive Employees) and Restricted Stock Agreement (Executive Employees). (Incorporated herein by reference to Exhibits 10.1, 10.2, 10.3 and 10.4, respectively, to the Registrant's Current Report on Form 8-K filed on February 24, 2005). |
||
10(d) |
Amended and Supplemental Executive Retirement Plan, dated January 1, 2005.* |
||
10(e) |
Purchase Agreement, dated as of May 23, 2006, between the Registrant and the Initial Purchasers named in Schedule I thereto relating to the Registrant's 101/4% Senior Notes due 2014. (Incorporated herein by reference to Exhibit 10.1 to the Current Report on Form 8-K filed by the Registrant on May 30, 2006). |
||
10(f) |
Indenture, dated as of May 26, 2006, among the Registrant, the Registrant's subsidiaries signatory thereto and Wilmington Trust Company, as trustee, relating to the Registrant's 101/4% Senior Notes due 2014. (Incorporated herein by reference to Exhibit 10.2 to the Current Report on Form 8-K filed by the Registrant on May 30, 2006). |
||
10(g) |
Registration Rights Agreement, dated as of May 26, 2006, among the Registrant, the Registrant's subsidiaries signatory thereto and the initial purchasers named therein relating to the Registrant's 101/4% Senior Notes due 2014. (Incorporated herein by reference to Exhibit 10.3 to the Current Report on Form 8-K filed by the Registrant on May 30, 2006). |
||
10(h) |
Registration Rights Agreement, dated as of May 26, 2006, among the Registrant and Ares Corporate Opportunities Fund, L.P. (Incorporated herein by reference to Exhibit 10.5 to the Registrant's Quarterly Report on Form 10-Q for the quarter ended June 30, 2006). |
||
10(i) |
Letter Agreements, dated May 26, 2006, between the Registrant and Ares Corporate Opportunities Fund, L.P. regarding board and management rights. (Incorporated herein by reference to Exhibit 10.6 to the Registrant's Quarterly Report on Form 10-Q for the quarter ended June 30, 2006). |
||
46
| Exhibit No. | Document | ||
|---|---|---|---|
| 10(j) | Credit Agreement, dated as of May 26, 2006, among the Registrant, the Several Lenders identified therein, Lehman Brothers Inc. and Citigroup Global Markets Inc., as Joint Lead Arrangers and Joint Book-Runners, Citicorp North America, Inc., as Administrative Agent, Lehman Commercial Paper Inc., as Syndication Agent, and LaSalle Bank National Association and General Electric Capital Corporation, as Co-Documentation Agents. (Incorporated herein by reference to Exhibit 10.7 to the Registrant's Quarterly Report on Form 10-Q for the quarter ended June 30, 2006). | ||
10(k) |
Guarantee and Collateral Agreement, dated as of May 26, 2006, made by the Registrant, as Borrower, and certain of its subsidiaries, in favor of Citicorp North America, Inc., as Administrative Agent. (Incorporated herein by reference to Exhibit 10.8 to the Registrant's Quarterly Report on Form 10-Q for the quarter ended June 30, 2006). |
||
10(l) |
Assignment and Acceptance dated October 23, 2009 related to Credit Agreement, dated as of May 26, 2006, among the Registrant, the Several Lenders identified therein, Lehman Commercial Paper Inc., as Assignor and Barclays Bank PLC, as Assignee, Citicorp North America, Inc., as Administrative Agent and Swing Line Lender, and Bank of America, N.A., as successor by merger to LaSalle Bank National Association as LC Issuing Bank. (Incorporated herein by reference to Exhibit 10.1 to the Registrant's Quarterly Report on Form 10-Q for the quarter ended September 30, 2009). |
||
10(m) |
First Amendment to Credit Agreement, by and among the Registrant, the Lenders party thereto and Citicorp North America, Inc., dated as of March 12, 2007. (Incorporated herein by reference to Exhibit 10 (cc) to the Registrant's Annual Report on Form 10-K for the year ended December 31, 2006). |
||
10(n) |
Fourth Amended and Restated Employment Agreement, effective as of January 1, 2005, by and between Ivan R. Sabel and the Registrant. (Incorporated herein by reference to Exhibit 10.1 to the Registrant's Quarterly Report on Form 10-Q for the quarter ended September 30, 2007).* |
||
10(o) |
Third Amended and Restated Employment Agreement, effective as of January 1, 2005, by and between George E. McHenry and the Registrant. (Incorporated herein by reference to Exhibit 10.2 to the Registrant's Quarterly Report on Form 10-Q for the quarter ended September 30, 2007).* |
||
10(p) |
Fourth Amended and Restated Employment Agreement, effective as of January 1, 2005, by and between Thomas F. Kirk and the Registrant. (Incorporated herein by reference to Exhibit 10.3 to the Registrant's Quarterly Report on Form 10-Q for the quarter ended September 30, 2007).* |
||
10(q) |
Third Amended and Restated Employment Agreement, effective as of January 1, 2005, by and between Richmond L. Taylor and the Registrant. (Incorporated herein by reference to Exhibit 10.4 to the Registrant's Quarterly Report on Form 10-Q for the quarter ended September 30, 2007).* |
||
10(r) |
Second Amended and Restated Employment Agreement, effective as of September 13, 2007, by and between Ronald N. May and the Registrant. (Incorporated herein by reference to Exhibit 10 to the Current Report on Form 8-K filed by the Registrant on November 13, 2007).* |
||
47
| Exhibit No. | Document | ||
|---|---|---|---|
| 10(s) | Amendment to Fourth Amended and Restated Employment Agreement, dated as of February 5, 2008, by and between Ivan R. Sabel and the Registrant. (Incorporated herein by reference to Exhibit 10.1 to the Current Report on Form 8-K filed by the Registrant on February 6, 2008).* | ||
10(t) |
Amendment to Fourth Amended and Restated Employment Agreement, dated as of February 5, 2008, by and between Thomas F. Kirk and the Registrant. (Incorporated herein by reference to Exhibit 10.2 to the Current Report on Form 8-K filed by the Registrant on February 6, 2008). |
||
10(u) |
Amended and Restated Preferred Stock Purchase Agreement, dated as of May 25, 2006, by and among the Registrant, Ares Corporate Opportunities Fund, L.P. and the Initial Purchasers identified therein. (Incorporated herein by reference to Exhibit 10.4 to the Registrant's Quarterly Report on Form 10-Q for the quarter ended June 30, 2006). |
||
21 |
List of Subsidiaries of the Registrant. (Filed herewith). |
||
23.1 |
Consent of PricewaterhouseCoopers LLP. (Filed herewith). |
||
31.1 |
Written Statement of the Chief Executive Officer Pursuant to Section 302 of the Sarbanes-Oxley Act of 2002. (Filed herewith). |
||
31.2 |
Written Statement of the Chief Financial Officer Pursuant to Section 302 of the Sarbanes-Oxley Act of 2002. (Filed herewith). |
||
32 |
Written Statement of the Chief Executive Officer and Chief Financial Officer Pursuant to 18 U.S.C. Section 1350, as adopted Pursuant to Section 906 of the Sarbanes-Oxley Act of 2002. (Furnished herewith). |
||
- *
- Management contract or compensatory plan
48
Pursuant to the requirements of Section 13 or 15(d) of the Securities Exchange Act of 1934, the Registrant has duly caused this report to be signed on its behalf by the undersigned, thereunto duly authorized.
| HANGER ORTHOPEDIC GROUP, INC. | ||||
Dated: March 3, 2010 |
By: |
/s/ THOMAS F. KIRK Thomas F. Kirk President and Chief Executive Officer (Principal Executive Officer) |
||
Pursuant to the requirements of the Securities Exchange Act of 1934, this report has been signed below by the following persons on behalf of the Registrant and in the capacities and on the dates indicated.
| |
|
|
|---|---|---|
| Dated: March 3, 2010 | /s/ THOMAS F. KIRK Thomas F. Kirk President and Chief Executive Officer (Principal Executive Officer) |
|
Dated: March 3, 2010 |
/s/ GEORGE E. MCHENRY George E. McHenry Executive Vice President and Chief Financial Officer (Principal Financial Officer) |
|
Dated: March 3, 2010 |
/s/ THOMAS C. HOFMEISTER Thomas C. Hofmeister Vice President of Finance (Chief Accounting Officer) |
|
Dated: March 3, 2010 |
/s/ IVAN R. SABEL Ivan R. Sabel, CPO Chairman |
|
Dated: March 3, 2010 |
/s/ PETER NEFF Peter Neff Director |
49
| |
|
|
|---|---|---|
| Dated: March 3, 2010 | /s/ THOMAS P. COOPER, M.D. Thomas P. Cooper, M.D. Director |
|
Dated: March 3, 2010 |
/s/ CYNTHIA L. FELDMANN Cynthia L. Feldmann Director |
|
Dated: March 3, 2010 |
/s/ ERIC GREEN Eric Green Director |
|
Dated: March 3, 2010 |
/s/ ISAAC KAUFMAN Isaac Kaufman Director |
|
Dated: March 3, 2010 |
/s/ H.E. THRANHARDT H.E. Thranhardt, CPO Director |
|
Dated: March 3, 2010 |
/s/ BENNETT ROSENTHAL Bennett Rosenthal Director |
50
INDEX TO FINANCIAL STATEMENTS
Management's Annual Report on Internal Control Over Financial Reporting
The following sets forth, in accordance with Section 404(a) of the Sarbanes-Oxley Act of 2002 and Item 308(a) of the Securities and Exchange Commission's Regulation S-K, the annual report of management of Hanger Orthopedic Group, Inc. (the "Company") on the Company's internal control over financial reporting.
1. Management of the Company is responsible for establishing and maintaining adequate internal control over financial reporting for the Company. Internal control over financial reporting is a process designed by, or under the supervision of, the Company's Chief Executive Officer and Chief Financial Officer, and effected by the Company's Board of Directors, management and other personnel, to provide reasonable assurance regarding the reliability of financial reporting and the preparation of financial statements for external purposes in accordance with generally accepted accounting principles and includes those policies and procedures that:
- •
- Pertain to the maintenance of records that in reasonable detail accurately and fairly reflect the transactions and
dispositions of the assets of the Company;
- •
- Provide reasonable assurance that transactions are recorded as necessary to permit preparation of financial statements in
accordance with generally accepted accounting principles, and that receipts and expenditures of the Company are being made only in accordance with authorizations of management and directors of the
Company; and
- •
- Provide reasonable assurance regarding prevention or timely detection of unauthorized acquisition, use or disposition of the Company's assets that could have a material effect on the financial statements.
2. Management of the Company, in accordance with Rule 13a-15(c) under the Securities Exchange Act of 1934 and with the participation of the Company's Chief Executive Officer and Chief Financial Officer, evaluated the effectiveness of the Company's internal control over financial reporting as of December 31, 2009. The framework on which management's evaluation of the Company's internal control over financial reporting is based is the "Internal Control—Integrated Framework" published in 1992 by the Committee of Sponsoring Organizations ("COSO") of the Treadway Commission.
3. Management has determined that the Company's internal control over financial reporting, as of December 31, 2009, was effective. Because of its inherent limitations, internal control over financial reporting may not prevent or detect misstatements. Also, projections of any evaluation of effectiveness to future periods are subject to the risk that controls may become inadequate because of changes in conditions, or that the degree of compliance with the policies or procedures may deteriorate.
4. The effectiveness of our internal control over financial reporting as of December 31, 2009 has been audited by PricewaterhouseCoopers LLP, an independent registered public accounting firm, as stated in their report which appears herein.
F-1
Report of Independent Registered Public Accounting Firm
To the Board of Directors and Shareholders of Hanger Orthopedic Group, Inc.:
In our opinion, the consolidated financial statements listed in the index appearing under Item 15(a)(1), present fairly, in all material respects, the financial position of Hanger Orthopedic Group, Inc. and its subsidiaries at December 31, 2009 and 2008, and the results of their operations and their cash flows for each of the three years in the period ended December 31, 2009 in conformity with accounting principles generally accepted in the United States of America. In addition, in our opinion, the financial statement schedule listed in the index appearing under Item 15(a)(2), presents fairly, in all material respects, the information set forth therein when read in conjunction with the related consolidated financial statements. Also in our opinion, the Company maintained, in all material respects, effective internal control over financial reporting as of December 31, 2009, based on criteria established in Internal Control—Integrated Framework issued by the Committee of Sponsoring Organizations of the Treadway Commission (COSO). The Company's management is responsible for these financial statements and financial statement schedule, for maintaining effective internal control over financial reporting and for its assessment of the effectiveness of internal control over financial reporting, included in the accompanying Management's Annual Report on Internal Control over Financial Reporting. Our responsibility is to express opinions on these financial statements, on the financial statement schedule and on the Company's internal control over financial reporting based on our integrated audits. We conducted our audits in accordance with the standards of the Public Company Accounting Oversight Board (United States). Those standards require that we plan and perform the audits to obtain reasonable assurance about whether the financial statements are free of material misstatement and whether effective internal control over financial reporting was maintained in all material respects. Our audits of the financial statements included examining, on a test basis, evidence supporting the amounts and disclosures in the financial statements, assessing the accounting principles used and significant estimates made by management, and evaluating the overall financial statement presentation. Our audit of internal control over financial reporting included obtaining an understanding of internal control over financial reporting, assessing the risk that a material weakness exists, and testing and evaluating the design and operating effectiveness of internal control based on the assessed risk. Our audits also included performing such other procedures as we considered necessary in the circumstances. We believe that our audits provide a reasonable basis for our opinions.
As discussed in Note B to the consolidated financial statements, the Company changed the manner in which it accounts for uncertainty in income taxes effective January 1, 2007.
A company's internal control over financial reporting is a process designed to provide reasonable assurance regarding the reliability of financial reporting and the preparation of financial statements for external purposes in accordance with generally accepted accounting principles. A company's internal control over financial reporting includes those policies and procedures that (i) pertain to the maintenance of records that, in reasonable detail, accurately and fairly reflect the transactions and dispositions of the assets of the company; (ii) provide reasonable assurance that transactions are recorded as necessary to permit preparation of financial statements in accordance with generally accepted accounting principles, and that receipts and expenditures of the company are being made only in accordance with authorizations of management and directors of the company; and (iii) provide reasonable assurance regarding prevention or timely detection of unauthorized acquisition, use, or disposition of the company's assets that could have a material effect on the financial statements.
F-2
Because of its inherent limitations, internal control over financial reporting may not prevent or detect misstatements. Also, projections of any evaluation of effectiveness to future periods are subject to the risk that controls may become inadequate because of changes in conditions, or that the degree of compliance with the policies or procedures may deteriorate.
PricewaterhouseCoopers LLP
Baltimore, Maryland
March 3, 2010
F-3
HANGER ORTHOPEDIC GROUP, INC.
CONSOLIDATED BALANCE SHEETS
(Dollars in thousands, except share and per share amounts)
| |
December 31, | ||||||||
|---|---|---|---|---|---|---|---|---|---|
| |
2009 | 2008 | |||||||
ASSETS |
|||||||||
CURRENT ASSETS |
|||||||||
Cash and cash equivalents |
$ | 84,558 | $ | 58,413 | |||||
Short-term investments |
4,976 | 4,968 | |||||||
Accounts receivable, less allowance for doubtful accounts of $10,526 and $6,099 in 2009 and 2008, respectively |
105,480 | 99,861 | |||||||
Inventories |
91,289 | 85,960 | |||||||
Prepaid expenses, other current assets and income taxes receivable |
8,380 | 12,512 | |||||||
Deferred income taxes |
15,167 | 12,312 | |||||||
Total current assets |
309,850 | 274,026 | |||||||
PROPERTY, PLANT AND EQUIPMENT |
|||||||||
Land |
864 | 949 | |||||||
Buildings |
4,599 | 4,967 | |||||||
Furniture and fixtures |
14,007 | 13,310 | |||||||
Machinery and equipment |
45,803 | 32,070 | |||||||
Leasehold improvements |
52,174 | 47,579 | |||||||
Computer and software |
59,980 | 67,802 | |||||||
Total property, plant and equipment, gross |
177,427 | 166,677 | |||||||
Less accumulated depreciation and amortization |
115,116 | 115,943 | |||||||
Total property, plant and equipment, net |
62,311 | 50,734 | |||||||
INTANGIBLE ASSETS |
|||||||||
Excess cost over net assets acquired |
484,422 | 470,411 | |||||||
Patents and other intangible assets, $16,828 and $13,854 in 2009 and 2008 respectively, less accumulated amortization of $9,312 and $8,782 in 2009 and 2008, respectively |
7,516 | 5,072 | |||||||
Total intangible assets, net |
491,938 | 475,483 | |||||||
OTHER ASSETS |
|||||||||
Debt issuance costs, net |
5,660 | 7,482 | |||||||
Other assets |
5,277 | 6,025 | |||||||
Total other assets |
10,937 | 13,507 | |||||||
TOTAL ASSETS |
$ | 875,036 | $ | 813,750 | |||||
The accompanying notes are an integral part of the consolidated financial statements.
F-4
HANGER ORTHOPEDIC GROUP, INC.
CONSOLIDATED BALANCE SHEETS (Continued)
(Dollars in thousands, except share and per share amounts)
| |
December 31, | ||||||||
|---|---|---|---|---|---|---|---|---|---|
| |
2009 | 2008 | |||||||
LIABILITIES AND SHAREHOLDERS' EQUITY |
|||||||||
CURRENT LIABILITIES |
|||||||||
Current portion of long-term debt |
$ | 8,835 | $ | 3,794 | |||||
Accounts payable |
27,552 | 18,764 | |||||||
Accrued expenses |
19,223 | 16,810 | |||||||
Accrued interest payable |
1,776 | 2,074 | |||||||
Accrued compensation related costs |
35,800 | 32,336 | |||||||
Total current liabilities |
93,186 | 73,778 | |||||||
LONG-TERM LIABILITIES |
|||||||||
Long-term debt, less current portion |
401,637 | 418,530 | |||||||
Deferred income taxes |
37,973 | 33,166 | |||||||
Other liabilities |
26,347 | 21,410 | |||||||
Total liabilities |
559,143 | 546,884 | |||||||
COMMITMENTS AND CONTINGENCIES (Note H) |
|||||||||
SHAREHOLDERS' EQUITY |
|||||||||
Common stock, $.01 par value; 60,000,000 shares authorized, 32,992,674 shares and 32,513,190 shares issued and outstanding in 2009 and 2008, respectively |
330 | 325 | |||||||
Additional paid-in capital |
233,111 | 221,623 | |||||||
Accumulated other comprehensive loss |
(3,056 | ) | (4,497 | ) | |||||
Retained earnings |
86,164 | 50,071 | |||||||
|
316,549 | 267,522 | |||||||
Treasury stock at cost (141,154 shares) |
(656 | ) | (656 | ) | |||||
Total shareholders' equity |
315,893 | 266,866 | |||||||
TOTAL LIABILITIES AND SHAREHOLDERS' EQUITY |
$ | 875,036 | $ | 813,750 | |||||
The accompanying notes are an integral part of the consolidated financial statements.
F-5
HANGER ORTHOPEDIC GROUP, INC.
CONSOLIDATED INCOME STATEMENTS
For the Years Ended December 31,
(Dollars in thousands, except share and per share amounts)
| |
2009 | 2008 | 2007 | ||||||||
|---|---|---|---|---|---|---|---|---|---|---|---|
Net sales |
$ | 760,070 | $ | 703,129 | $ | 637,350 | |||||
Cost of goods sold—materials |
228,295 | 210,323 | 184,625 | ||||||||
Personnel costs |
264,581 | 248,234 | 225,012 | ||||||||
Other operating expenses |
160,355 | 149,661 | 143,857 | ||||||||
Depreciation and amortization |
16,319 | 17,183 | 15,876 | ||||||||
Income from operations |
90,520 | 77,728 | 67,980 | ||||||||
Interest expense |
30,693 |
32,549 |
36,987 |
||||||||
Unrealized loss (gain) from interest rate swap |
(167 | ) | 738 | — | |||||||
Income before taxes |
59,994 | 44,441 | 30,993 | ||||||||
Provision for income taxes |
23,901 |
17,695 |
11,726 |
||||||||
Net income |
36,093 | 26,746 | 19,267 | ||||||||
Preferred stock dividend-Series A Convertible Preferred Stock |
— |
5,670 |
1,665 |
||||||||
Net income applicable to common stock |
$ | 36,093 | $ | 21,076 | $ | 17,602 | |||||
Basic Per Common Share Data |
|||||||||||
Net income |
$ | 1.15 | $ | 0.81 | $ | 0.78 | |||||
Shares used to compute basic per common share amounts |
31,383,895 | 25,930,096 | 22,475,513 | ||||||||
Diluted Per Common Share Data |
|||||||||||
Net income |
$ | 1.13 | $ | 0.78 | $ | 0.64 | |||||
Shares used to compute diluted per common share amounts |
32,068,325 | 27,090,817 | 30,257,021 | ||||||||
The accompanying notes are an integral part of the consolidated financial statements.
F-6
HANGER ORTHOPEDIC GROUP, INC.
CONSOLIDATED STATEMENTS OF CHANGES IN SHAREHOLDERS' EQUITY
AND COMPREHENSIVE INCOME
For the Three
Years Ended December 31, 2009
(In thousands)
| |
Common Shares |
Common Stock |
Additional Paid in Capital |
Accumulated Other Comprehensive Loss |
Retained Earnings |
Treasury Stock |
Total | |||||||||||||||||||
|---|---|---|---|---|---|---|---|---|---|---|---|---|---|---|---|---|---|---|---|---|---|---|---|---|---|---|
Balance, December 31, 2006 |
22,378 | $ | 224 | $ | 156,480 | $ | — | $ | 11,629 | $ | (656 | ) | $ | 167,677 | ||||||||||||
Preferred dividends declared |
— |
— |
— |
— |
(1,665 |
) |
— |
(1,665 |
) |
|||||||||||||||||
Net income |
— | — | — | — | 19,267 | — | 19,267 | |||||||||||||||||||
Issuance of Common Stock in connection with the exercise of stock options |
399 | 4 | 1,621 | — | — | — | 1,625 | |||||||||||||||||||
Issuance of restricted stock |
1,686 | 17 | (17 | ) | — | — | — | — | ||||||||||||||||||
Forfeiture of restricted stock |
(30 | ) | (1 | ) | 1 | — | — | — | — | |||||||||||||||||
Adoption of FIN 48 |
— | — | — | — | (236 | ) | — | (236 | ) | |||||||||||||||||
Compensation expense associated with stock options |
— | — | 38 | — | — | — | 38 | |||||||||||||||||||
Compensation expense associated with restricted stock |
— | — | 3,295 | — | — | — | 3,295 | |||||||||||||||||||
Tax benefit associated with vesting of restricted stock |
— | — | 537 | — | — | — | 537 | |||||||||||||||||||
Balance, December 31, 2007 |
24,433 | $ | 244 | $ | 161,955 | $ | — | $ | 28,995 | $ | (656 | ) | $ | 190,538 | ||||||||||||
Comprehensive income |
||||||||||||||||||||||||||
Net income |
— | — | — | — | 26,746 | — | 26,746 | |||||||||||||||||||
Other comprehensive income |
||||||||||||||||||||||||||
Interest rate swaps: |
||||||||||||||||||||||||||
Reclassification of net losses on interest rate swaps from OCI to net income, net of taxes of $295 |
— | — | — | 443 | — | — | 443 | |||||||||||||||||||
Unrealized loss on interest rate swaps, net of taxes of $2,895 |
— | — | — | (4,342 | ) | — | — | (4,342 | ) | |||||||||||||||||
Auction rate securities: |
||||||||||||||||||||||||||
Reclassification of net losses on auction rate securities from OCI to net income, net of taxes of $415 |
— | — | — | 623 | — | — | 623 | |||||||||||||||||||
Unrealized loss on auction rate securities, net of taxes of $814 |
— | — | — | (1,221 | ) | — | — | (1,221 | ) | |||||||||||||||||
Total comprehensive income |
— | — | — | (4,497 | ) | 26,746 | — | 22,249 | ||||||||||||||||||
Preferred dividends declared |
— | — | — | — | (5,670 | ) | — | (5,670 | ) | |||||||||||||||||
Issuance of Common Stock in connection with the exercise of stock options |
206 | 2 | 658 | — | — | — | 660 | |||||||||||||||||||
Issuance of restricted stock |
594 | 6 | (6 | ) | — | — | — | — | ||||||||||||||||||
Forfeiture of restricted stock |
(29 | ) | — | — | — | — | — | — | ||||||||||||||||||
Compensation expense associated with stock options |
— | — | 9 | — | — | — | 9 | |||||||||||||||||||
Compensation expense associated with restricted stock |
— | — | 4,702 | — | — | — | 4,702 | |||||||||||||||||||
Tax benefit associated with vesting of restricted stock |
— | — | 1,470 | — | — | — | 1,470 | |||||||||||||||||||
Conversion of Series A Convertible Preferred Stock |
7,309 | 73 | 52,835 | — | — | — | 52,908 | |||||||||||||||||||
Balance, December 31, 2008 |
32,513 | $ | 325 | $ | 221,623 | $ | (4,497 | ) | $ | 50,071 | $ | (656 | ) | $ | 266,866 | |||||||||||
Comprehensive income |
||||||||||||||||||||||||||
Net income |
— | — | — | — | 36,093 | — | 36,093 | |||||||||||||||||||
Other comprehensive income |
||||||||||||||||||||||||||
Interest rate swaps: |
||||||||||||||||||||||||||
Unrealized gain on interest rate swaps, net of taxes of $687 |
— | — | — | 1,031 | — | — | 1,031 | |||||||||||||||||||
Auction rate securities: |
||||||||||||||||||||||||||
Reclassification of net losses on auction rate securities from OCI to net income, net of taxes of $320 |
— | — | — | 480 | — | — | 480 | |||||||||||||||||||
Unrealized loss on auction rate securities, net of taxes of $47 |
— | — | — | (70 | ) | — | — | (70 | ) | |||||||||||||||||
Total comprehensive income |
— | — | — | 1,441 | 36,093 | — | 37,534 | |||||||||||||||||||
Issuance of Common Stock in connection with the exercise of stock options |
345 | 3 | 2,753 | — | — | — | 2,756 | |||||||||||||||||||
Forfeiture of restricted stock |
(17 | ) | — | — | — | — | — | |||||||||||||||||||
Issuance of restricted stock |
151 | 2 | (2 | ) | — | — | — | — | ||||||||||||||||||
Compensation expense associated with restricted stock |
— | — | 7,430 | — | — | — | 7,430 | |||||||||||||||||||
Tax benefit associated with vesting of restricted stock |
— | — | 1,307 | — | — | — | 1,307 | |||||||||||||||||||
Balance, December 31, 2009 |
32,992 | $ | 330 | $ | 233,111 | $ | (3,056 | ) | $ | 86,164 | $ | (656 | ) | $ | 315,893 | |||||||||||
The accompanying notes are an integral part of the consolidated financial statements.
F-7
HANGER ORTHOPEDIC GROUP, INC.
CONSOLIDATED STATEMENTS OF CASH FLOWS
For the Years Ended December 31,
(Dollars in thousands)
| |
2009 | 2008 | 2007 | |||||||||
|---|---|---|---|---|---|---|---|---|---|---|---|---|
Cash flows from operating activities: |
||||||||||||
Net income |
$ | 36,093 | $ | 26,746 | $ | 19,267 | ||||||
Adjustments to reconcile net income (loss) to net cash provided by operating activities: |
||||||||||||
Unrealized loss (gain) on interest rate swap |
(167 | ) | 738 | — | ||||||||
Unrealized losses on investments |
800 | 32 | — | |||||||||
Loss (Gain) on disposal of assets |
(294 | ) | 60 | 255 | ||||||||
Provision for bad debt |
16,128 | 15,906 | 15,774 | |||||||||
Provision for deferred income taxes |
1,074 | 456 | 1,508 | |||||||||
Depreciation and amortization |
16,319 | 17,183 | 15,877 | |||||||||
Amortization of debt issuance costs |
1,822 | 1,822 | 1,813 | |||||||||
Compensation expense on stock options and restricted stock |
7,430 | 4,712 | 3,332 | |||||||||
Changes in assets and liabilities, net of effects of acquired companies: |
||||||||||||
Accounts receivable |
(20,069 | ) | (15,404 | ) | (13,519 | ) | ||||||
Inventories |
(4,424 | ) | (3,118 | ) | (5,569 | ) | ||||||
Prepaid expenses, other current assets, and income taxes receivable |
971 | 774 | (3,226 | ) | ||||||||
Other assets |
16 | (213 | ) | (114 | ) | |||||||
Accounts payable |
3,287 | 631 | (2,451 | ) | ||||||||
Accrued expenses, accrued interest payable, and income taxes payable |
5,893 | 995 | (65 | ) | ||||||||
Accrued compensation related costs |
3,365 | (769 | ) | 12,346 | ||||||||
Other liabilities |
4,887 | 2,669 | 6,459 | |||||||||
Net cash provided by operating activities |
73,131 | 53,220 | 51,687 | |||||||||
Cash flows from investing activities: |
||||||||||||
Purchase of property, plant and equipment (net of acquisitions) |
(21,270 | ) | (19,330 | ) | (20,129 | ) | ||||||
Acquisitions and contingent considerations (net of cash acquired) |
(11,511 | ) | (10,911 | ) | (14,833 | ) | ||||||
Purchase of short-term investments |
— | — | (7,500 | ) | ||||||||
Purchase of company-owned life insurance investment |
(2,000 | ) | — | — | ||||||||
Proceeds from sale of property, plant and equipment |
629 | 73 | 366 | |||||||||
Net cash used in investing activities |
(34,152 | ) | (30,168 | ) | (42,096 | ) | ||||||
Cash flows from financing activities: |
||||||||||||
Borrowings under revolving credit agreement |
— | 15,253 | — | |||||||||
Repayments under revolving credit agreement |
(15,253 | ) | — | — | ||||||||
Repayment of term loan |
(1,109 | ) | (3,485 | ) | (2,301 | ) | ||||||
Scheduled repayment of long-term debt |
(2,828 | ) | (3,590 | ) | (3,186 | ) | ||||||
Increase in debt issue costs |
— | — | (265 | ) | ||||||||
Proceeds from issuance of Common Stock |
2,756 | 661 | 1,625 | |||||||||
Proceeds from line of credit |
3,600 | — | — | |||||||||
Series A Convertible Preferred Stock dividend payment |
— | (416 | ) | (1,665 | ) | |||||||
Net cash provided by (used in) financing activities |
(12,834 | ) | 8,423 | (5,792 | ) | |||||||
Increase in cash and cash equivalents |
26,145 |
31,475 |
3,799 |
|||||||||
Cash and cash equivalents, at beginning of year |
58,413 | 26,938 | 23,139 | |||||||||
Cash and cash equivalents, at end of year |
$ | 84,558 | $ | 58,413 | $ | 26,938 | ||||||
The accompanying notes are an integral part of the consolidated financial statements.
F-8
HANGER ORTHOPEDIC GROUP, INC.
NOTES TO CONSOLIDATED FINANCIAL STATEMENTS
NOTE A—THE COMPANY
Hanger Orthopedic Group, Inc. is the nation's largest owner and operator of orthotic & prosthetic ("O&P") patient-care centers. In addition to providing patient care services through its operating subsidiaries, the Company also is the largest distributor of branded and private label O&P devices and components in the United States. Hanger's subsidiary, Hanger Prosthetics & Orthotics, Inc., formerly known as J.E. Hanger, Inc., was founded in 1861 by a Civil War amputee and is the oldest company in the O&P industry in the United States of America. The Company also creates products, through its wholly-owned subsidiary Innovative Neurotronics, Inc. ("IN, Inc."), for sale in its patient-care centers and through a sales force, to patients who have had a loss of mobility due to strokes, multiple sclerosis or other similar conditions. Another subsidiary, Linkia LLC ("Linkia"), develops programs to manage all aspects of O&P patient care for large private payors.
NOTE B—SIGNIFICANT ACCOUNTING POLICIES
We have evaluated subsequent events for recognition or disclosure through March 3, 2010, which was the date we filed this Form 10-K with the SEC.
Principles of Consolidation
The consolidated financial statements include the accounts of the Company and its wholly-owned subsidiaries. All intercompany transactions and balances have been eliminated.
Use of Estimates
The preparation of financial statements in conformity with accounting principles generally accepted in the United States of America ("GAAP") requires management to make estimates and assumptions that affect the reported amounts of assets and liabilities, disclosure of contingent assets and liabilities at the date of the financial statements, and the reported amounts of revenues and expenses during the reporting period. Actual results could differ from those estimates.
Cash and Cash Equivalents
The Company considers all highly liquid investments with original maturities of three months or less at the date of purchase to be cash equivalents. At various times throughout the year, the Company maintains cash balances in excess of Federal Deposit Insurance Corporation limits.
Credit Risk
The Company primarily provides customized O&P devices throughout the United States of America and is reimbursed by the patients' third-party insurers or governmentally funded health insurance programs. The Company performs ongoing credit evaluations of its distribution customers. Accounts receivable are not collateralized. The ability of the Company's debtors to meet their obligations is dependent upon the financial stability of the insurers of the Company's customers and future legislation and regulatory actions. Additionally, the Company maintains reserves for potential losses from these receivables that historically have been within management's expectations.
F-9
HANGER ORTHOPEDIC GROUP, INC.
NOTES TO CONSOLIDATED FINANCIAL STATEMENTS (Continued)
NOTE B—SIGNIFICANT ACCOUNTING POLICIES (Continued)
Inventories
Inventories, which consist principally of raw materials, work in process and finished goods, are stated at the lower of cost or market using the first-in, first-out method. For its patient-care centers segment, the Company calculates cost of goods sold—materials in accordance with the gross profit method for all reporting periods. The Company bases the estimates used in applying the gross profit method on the actual results of the most recently completed fiscal year and other factors, such as a change in the sales mix or changes in the trend of purchases. Cost of goods sold—materials during the interim periods are reconciled and adjusted when the annual physical inventory is taken. The Company treats these adjustments as changes in accounting estimates. The Company recorded increases to inventory of $2.1 million, $0.8 million, and $4.2 million in conjunction with our physical inventory during fiscal years 2009, 2008, and 2007, respectively.
For its distribution segment, a perpetual inventory is maintained. Management adjusts the reserve for inventory obsolescence whenever the facts and circumstances indicate that the carrying cost of certain inventory items is in excess of its market price. Shipping and handling activities are reported as part of cost of goods sold—materials.
Fair Value
Effective January 1, 2008, the Company adopted the authoritative guidance for fair value measurements and disclosures, which establishes a framework for measuring fair value and requires enhanced disclosures about fair value measurements. The authoritative guidance requires disclosure about how fair value is determined for assets and liabilities and establishes a hierarchy by which these assets and liabilities must be grouped, based on significant levels of inputs as follows:
| Level 1 | quoted prices in active markets for identical assets or liabilities; | |
Level 2 |
quoted prices in active markets for similar assets and liabilities and inputs that are observable for the asset or liability; |
|
Level 3 |
unobservable inputs, such as discounted cash flow models and valuations. |
The determination of where assets and liabilities fall within this hierarchy is based upon the lowest level of input that is significant to the fair value measurement.
Effective January 1, 2008, the Company adopted the authoritative guidance that permits entities to choose to measure many financial instruments and certain other items at fair value that are not currently required to be measured at fair value. Unrealized gains and losses on items for which the fair value option has been elected are reported in earnings and are immaterial to the Company's financial statements.
Effective January 1, 2009, the Company adopted the authoritative guidance for fair value measurements and disclosures for all non-financial assets and liabilities, except those that are recognized or disclosed at fair value in the financial statements on a recurring basis, noting no impact to the Company's consolidated financial statements.
F-10
HANGER ORTHOPEDIC GROUP, INC.
NOTES TO CONSOLIDATED FINANCIAL STATEMENTS (Continued)
NOTE B—SIGNIFICANT ACCOUNTING POLICIES (Continued)
The following is a listing of the Company's assets measured at fair value on a recurring basis and where they are classified within the hierarchy as of December 31, 2009 and 2008, respectively:
| |
2009 | 2008 | |||||||||||||||||||||||||
|---|---|---|---|---|---|---|---|---|---|---|---|---|---|---|---|---|---|---|---|---|---|---|---|---|---|---|---|
| (in thousands) |
Level 1 | Level 2 | Level 3 | Total | Level 1 | Level 2 | Level 3 | Total | |||||||||||||||||||
Assets |
|||||||||||||||||||||||||||
Current Assets |
|||||||||||||||||||||||||||
Marketable Securities |
$ | 78,590 | $ | — | $ | — | $ | 78,590 | $ | 53,962 | $ | — | $ | — | $ | 53,962 | |||||||||||
Auction Rate Securities |
— | — | 4,660 | 4,660 | — | — | 3,962 | 3,962 | |||||||||||||||||||
Rights on auction rate securities |
— | — | 315 | 315 | — | — | 1,006 | 1,006 | |||||||||||||||||||
Other Assets |
|||||||||||||||||||||||||||
Auction rate securities |
— | — | 1,387 | 1,387 | — | — | 1,503 | 1,503 | |||||||||||||||||||
|
$ | 78,590 | $ | — | $ | 6,362 | $ | 84,952 | $ | 53,962 | $ | — | $ | 6,471 | $ | 60,433 | |||||||||||
| |
Level 1 | Level 2 | Level 3 | Total | Level 1 | Level 2 | Level 3 | Total | |||||||||||||||||||
|---|---|---|---|---|---|---|---|---|---|---|---|---|---|---|---|---|---|---|---|---|---|---|---|---|---|---|---|
Liabilities |
|||||||||||||||||||||||||||
Current Liabilities |
|||||||||||||||||||||||||||
Interest rate swaps |
$ | — | $ | 4,369 | $ | — | $ | 4,369 | $ | — | $ | 3,711 | $ | — | $ | 3,711 | |||||||||||
Other Liabilities |
|||||||||||||||||||||||||||
Interest rate swaps |
— | 887 | — | 887 | — | 3,526 | — | 3,526 | |||||||||||||||||||
|
$ | — | $ | 5,256 | $ | — | $ | 5,256 | $ | — | $ | 7,237 | $ | — | $ | 7,237 | |||||||||||
During the years ended December 31, 2009 and 2008, assets and liabilities that were measured at fair value using level 3 inputs had the following activity:
| |
Auction Rate Securities |
Rights | Total | ||||||||||
|---|---|---|---|---|---|---|---|---|---|---|---|---|---|
For the year ended December 31, 2009 |
|||||||||||||
Balance as of December 31, 2008 |
$ | 5,465 | $ | 1,006 | $ | 6,471 | |||||||
Total unrealized losses |
|||||||||||||
Included in earnings |
(109 | ) | (691 | ) | (800 | ) | |||||||
Included in other comprehensive income |
691 | — | 691 | ||||||||||
Purchases, issuances, and settlements |
— | — | — | ||||||||||
Transfers in and/or out of Level 3 |
— | — | — | ||||||||||
Balance as of December 31, 2009 |
$ | 6,047 | $ | 315 | $ | 6,362 | |||||||
F-11
HANGER ORTHOPEDIC GROUP, INC.
NOTES TO CONSOLIDATED FINANCIAL STATEMENTS (Continued)
NOTE B—SIGNIFICANT ACCOUNTING POLICIES (Continued)
| |
Auction Rate Securities |
Rights | Total | ||||||||||
|---|---|---|---|---|---|---|---|---|---|---|---|---|---|
For the year ended December 31, 2008 |
|||||||||||||
Balance as of December 31, 2007 |
$ | 7,500 | $ | — | $ | 7,500 | |||||||
Total unrealized losses |
|||||||||||||
Included in earnings |
(1,038 | ) | 1,006 | (32 | ) | ||||||||
Included in other comprehensive income |
(997 | ) | — | (997 | ) | ||||||||
Purchases, issuances, and settlements |
— | — | — | ||||||||||
Transfers in and/or out of Level 3 |
— | — | — | ||||||||||
Balance as of December 31, 2008 |
$ | 5,465 | $ | 1,006 | $ | 6,471 | |||||||
Investments
Investment securities available-for-sale consist of auction rate securities accounted for in accordance with authoritative guidance for investments in debt and equity securities. Available-for-sale securities are reported at fair value with unrealized gains and losses excluded from earnings and reported in shareholders' equity. Securities purchased to be held for indeterminate periods of time and not intended at the time of purchase to be held until maturity are classified as available-for-sale securities with any unrealized gains and losses reported as a separate component of accumulated other comprehensive loss on our consolidated balance sheets. We continually evaluate whether any marketable investments have been impaired and, if so, whether such impairment is temporary or other than temporary.
Our investments consist of two auction rate securities ("ARS") totaling $7.5 million of par value, $5.0 million is collateralized by Indiana Secondary Market Municipal Bond—1998 ("Indiana ARS") and $2.5 million collateralized by Primus Financial Products Subordinated Deferrable Interest Notes ("Primus ARS"). ARS are securities that are structured with short-term interest rate reset dates which generally occur every 28 days and are linked to LIBOR. At the reset date, investors can attempt to sell via auction or continue to hold the securities at par. As of December 31, 2009, both investments failed at auction due to the absence of a market for the ARS. The Company's ARS are reported at fair value.
The fair values of our ARS were estimated through use of discounted cash flow models. These models consider, among other things, the timing of expected future successful auctions, collateralization of underlying security investments and the credit worthiness of the issuer. Since these inputs are not observable in an active market, they are classified as Level 3 inputs under the fair value accounting rules discussed in the "Fair Value" section above. For the years ended December 31, 2009 and 2008, the Company recorded unrealized losses of $0.1 million and $1.0 million, respectively, related to the Primus ARS. These losses are reflected in accumulated other comprehensive loss on our consolidated balance sheets. The unrealized losses recognized during the years ended December 31, 2009 and 2008, represent the change in fair value of the auction rate securities. The fair value of the Primus ARS of $1.4 million and $1.5 million as of December 31, 2009 and 2008, respectively, is classified as other long term assets. The funds associated with this security will not be accessible until a successful auction occurs, a buyer is found outside of the auction process, the issuer refinances the underlying debt, or the underlying security matures.
F-12
HANGER ORTHOPEDIC GROUP, INC.
NOTES TO CONSOLIDATED FINANCIAL STATEMENTS (Continued)
NOTE B—SIGNIFICANT ACCOUNTING POLICIES (Continued)
During the year ended December 31, 2009 authoritative guidance was issued to modify the other-than-temporary impairment ("OTTI") analysis for debt securities classified as available-for-sale or held-to-maturity. The revised guidance requires that each reporting period, the Company compare the present value of the cash flows expected to be collected from the security against the amortized cost basis, and identify the portion of the impairment loss representing a credit loss arising from an increase in the credit risk associated with the instrument. The guidance requires the credit loss to be recognized in earnings for debt securities where Companies does not intend to sell the debt security, and it is more likely than not, that the entity will be required to sell the debt security before the anticipated recovery of the amortized cost basis. In regards to the OTTI on the Primus ARS, a credit loss of $0.8 million was identified and recognized during the year ended December 31, 2009. This credit loss reduces the amortized cost basis on the Primus ARS to $1.7 million as of December 31, 2009 compared to the $2.5 million par value of the investment as of December 31, 2008.
On November 4, 2008, the Company agreed to accept Auction Rate Security Rights ("the Rights") related to the Indiana ARS from UBS offered through a prospectus filed on October 7, 2008. The Rights permit the Company to sell, or put, the Indiana ARS back to UBS at par value of $5.0 million, at any time during the period from June 30, 2010 through July 2, 2012 and to obtain a credit line from UBS collateralized by the ARS. The Company expects to exercise these Rights and put its auction rate securities back to UBS on June 30, 2010, the earliest date allowable under the Rights. By accepting the Rights, the Company can no longer assert that it has the intent to hold the Indiana ARS until anticipated recovery. The Company elected to classify the Rights and our investments in the Indiana ARS as trading securities in accordance with the authoritative guidance for accounting for investments in debt and equity securities. An OTTI charge of approximately $1.0 million was recognized during the year ended December 31, 2008 due to the reclassification of the Indiana ARS from available for sale to trading securities. Recordation of the Rights asset resulted in a gain of $1.0 million during the year ended December 31, 2008. As of December 31, 2009, the Company determined the fair value of the Rights was $0.3 million and the fair value of the ARS was $4.7 million, while the fair values of the ARS and the Rights as of December 31, 2008 were $4.0 million and $1.0 million, respectively. The change in the fair value of the Rights and the ARS for the year ended December 31, 2009 are reflected as components of earnings.
Interest Rate Swaps
In May 2008, the Company entered into two interest rate swap agreements under which $150.0 million of the Company's variable rate term loans were converted to a fixed rate of 5.4%. The fair value of each interest rate swap is an estimate of the present value of the expected future cash flows the Company is to receive under the applicable interest rate swap agreement. The valuation models used to determine the fair value of the interest rate swaps are based upon the forward yield curve of one month LIBOR (Level 2 inputs), the hedged interest rate, and other factors including counterparty credit risk. The agreements, which expire April 2011, qualify as cash flow hedges in accordance with the authoritative guidance for derivatives and hedging for the year ended December 31, 2009. The interest rate swaps did not qualify for hedge accounting under the authoritative guidance for hedging and derivatives during the second quarter of 2009 due to changes in counterparty risk factors. As a result, the change in the fair value of the interest rate swap was recognized in earnings during the second quarter of 2009, resulting in the Company recording an unrealized gain of $0.2 million which is reflected in the Company's consolidated income statement for
F-13
HANGER ORTHOPEDIC GROUP, INC.
NOTES TO CONSOLIDATED FINANCIAL STATEMENTS (Continued)
NOTE B—SIGNIFICANT ACCOUNTING POLICIES (Continued)
the year ended December 31, 2009. In the first, third, and fourth quarters of 2009, the Company's interest rate swaps qualified for hedge accounting, hence any adjustments in fair value related to the effective portion of the interest rate swaps were not required to be recognized through the income statement in those periods.
Since their inception, the fair value of the interest rate swaps has declined $5.3 million. Of the decline, $4.8 million is related to the effective portion of the interest rate swaps and was reported as a component of accumulated other comprehensive loss on our consolidated balance sheets. The current portion of the liability, $4.4 million, is reported in accrued expenses, while the remainder is reported in other liabilities on the Company's consolidated balance sheets as of December 31, 2009. As of December 31, 2008, liabilities from the interest rate swaps were $7.2 million, with $3.7 million reported in accrued expenses, and the remainder reported in other liabilities. Of the $7.2 million in liabilities reported as of December 31, 2008, $6.5 million related to the effective portion of the interest rate swaps and was reported as a component of accumulated other comprehensive loss on our consolidated balance sheets.
Fair Value of Financial Instruments
The carrying value of the Company's short-term financial instruments, such as receivables and payables, approximate their fair values, based on the short-term maturities of these instruments. The carrying value of the Company's long-term debt, excluding the Senior Notes, approximates fair value based on rates currently available to the Company for debt with similar terms and remaining maturities. The fair value of the Senior Notes, at December 31, 2009, was $184.8 million, as compared to the carrying value of $175.0 million at that date. The fair values of the Senior Notes were based on quoted market prices at December 31, 2009.
Revenue Recognition
Revenues in our patient care centers are derived from the sale of O&P devices and the maintenance and repair of existing devices. The sale of O&P devices includes the design, fabrication, assembly, fitting and delivery of a wide range of braces, limbs and other devices. Revenues from the sale of these devices are recorded when (i) acceptance by and delivery to the patient has occurred; (ii) persuasive evidence of an arrangement exists and there are no further obligations to the patient; (iii) the sales price is fixed or determinable; and (iv) collectibility is reasonably assured. Revenues from maintenance and repairs are recognized when the service is provided. Revenues on the sale of orthotic and prosthetic devices to customers by the distribution segment are recorded upon the shipment of products, in accordance with the terms of the invoice, net of merchandise returns received and the amount established for anticipated returns. Discounted sales are recorded at net realizable value. Revenue at the patient-care centers segment is recorded net of all contractual adjustments and discounts. A systematic process is employed to ensure that sales are recorded at net realizable value and that any required adjustments are recorded on a timely basis. The contracting module of the Company's centralized, computerized billing system is designed to record revenue at net realizable value based on the Company's contract with the patient's insurance company. Updated billing information is received periodically from payors and is uploaded into the Company's centralized contract module and then disseminated, electronically, to all patient-care centers.
F-14
HANGER ORTHOPEDIC GROUP, INC.
NOTES TO CONSOLIDATED FINANCIAL STATEMENTS (Continued)
NOTE B—SIGNIFICANT ACCOUNTING POLICIES (Continued)
Disallowed sales generally relate to billings to payors with whom the Company does not have a formal contract. In these situations the Company records the sale at usual and customary rates and simultaneously recognizes a disallowed sale to reduce the sale to net value, based on its historical experience with the payor in question. Disallowed sales may also result if the payor rejects or adjusts certain billing codes. Billing codes are frequently updated. As soon as updates are received, the Company reflects the change in its centralized billing system.
As part of the Company's preauthorization process with payors, it validates its ability to bill the payor, if applicable, for the service provided before the delivery of the device. Subsequent to billing for devices and services, there may be problems with pre-authorization or with other insurance coverage issues with payors. If there has been a lapse in coverage, the patient is financially responsible for the charges related to the devices and services received. If the Company is unable to collect from the patient, a bad debt expense is recognized. Occasionally, a portion of a bill is rejected by a payor due to a coding error on the Company's part and the Company is prevented from pursuing payment from the patient due to the terms of its contract with the insurance company. The Company appeals these types of decisions and is generally successful. This activity is factored into the Company's methodology of determining the estimate for the allowance for doubtful accounts. The Company recognizes, as reduction of sales, a disallowed sale for any claims that it believes will not be recovered and adjusts future estimates accordingly.
Certain accounts receivable may be uncollectible, even if properly pre-authorized and billed. Regardless of the balance, accounts receivable amounts are periodically evaluated to assess collectibility. In addition to the actual bad debt expense recognized during collection activities, the Company estimates the amount of potential bad debt expense that may occur in the future. This estimate is based upon historical experience as well as a review of the receivable balances.
On a quarterly basis, the Company evaluates cash collections, accounts receivable balances and write-off activity to assess the adequacy of the allowance for doubtful accounts. Additionally, a company-wide evaluation of collectibility of receivable balances older than 180 days is performed at least semi-annually, the results of which are used in the next allowance analysis. In these detailed reviews, the account's net realizable value is estimated after considering the customer's payment history, past efforts to collect on the balance and the outstanding balance, and a specific reserve is recorded if needed. From time to time, the Company may outsource the collection of such accounts to outsourced agencies after internal collection efforts are exhausted. In the cases when valid accounts receivable cannot be collected, the uncollectible account is written off to bad debt expense.
Property, Plant and Equipment
Property, plant and equipment are recorded at cost, with the exception of assets acquired through acquisitions, which are recorded at fair value. Equipment acquired under capital leases is recorded at the lower of fair market value or the present value of the future lease payments. The cost and related accumulated depreciation of assets sold, retired or otherwise disposed of are removed from the respective accounts, and any resulting gains or losses are included in the Consolidated Income
F-15
HANGER ORTHOPEDIC GROUP, INC.
NOTES TO CONSOLIDATED FINANCIAL STATEMENTS (Continued)
NOTE B—SIGNIFICANT ACCOUNTING POLICIES (Continued)
Statements. Depreciation is computed for financial reporting purposes using the straight-line method over the estimated useful lives of the related assets as follows:
| Furniture and fixtures | 5 years | |
Machinery and equipment |
5 years |
|
Computers and software |
5 years |
|
Buildings |
10 to 40 years |
|
Assets under capital leases |
Shorter of 10 years or term of lease |
|
Leasehold improvements |
Shorter of 10 years or term of lease |
Depreciation expense related to property, plant and equipment was approximately $15.0 million, $16.0 million, and $14.9 million for the years ended December 31, 2009, 2008, and 2007, respectively.
In accordance with the authoritative guidance for Accounting for the Costs of Computer Software Developed or Obtained for Internal Use, the Company capitalizes internally developed computer software costs incurred during the application development stage. At December 31, 2009 and 2008, computers and software included capitalized computer software currently under development of $2.2 million and $1.0 million, respectively.
Repairs and Maintenance
Repairs and maintenance costs are expensed as incurred. During the years ended December 31, 2009, 2008, and 2007, the Company incurred $1.3 million, $1.4 million, and $1.7 million, respectively, in repairs and maintenance costs.
Goodwill and Other Intangible Assets
The authoritative guidance for Accounting for Goodwill and Other Intangible Assets requires that purchased goodwill and certain indefinite-lived intangibles no longer be amortized, but instead be tested for impairment at least annually (the Company has selected October 1 as its annual test date). The Company evaluated its intangible assets, other than goodwill, and determined that all such assets have determinable lives. Refer to Note D for further discussion.
Non-compete agreements are recorded based on agreements entered into by the Company and are amortized, using the straight-line method, over their estimated useful lives ranging from five to seven years. Other definite-lived intangible assets are recorded at cost and are amortized, using the straight-line method, over their estimated useful lives of up to 20 years. The Company periodically evaluates the recoverability of intangible assets and takes into account events or circumstances that may warrant revised estimates of useful lives or that indicate that impairment had occurred.
Amortization expense related to definite-lived intangible assets for the years ended December 31, 2009, 2008, and 2007, was $1.3 million, $1.1 million, and $0.9 million, respectively. Estimated aggregate
F-16
HANGER ORTHOPEDIC GROUP, INC.
NOTES TO CONSOLIDATED FINANCIAL STATEMENTS (Continued)
NOTE B—SIGNIFICANT ACCOUNTING POLICIES (Continued)
amortization expense for definite-lived intangible assets for each of the five years ending December 31, 2014 and thereafter is as follows:
| (In thousands) |
|
|||
|---|---|---|---|---|
2010 |
$ | 1,248 | ||
2011 |
811 | |||
2012 |
811 | |||
2013 |
811 | |||
2014 |
793 | |||
Thereafter |
3,042 | |||
|
$ | 7,516 | ||
Debt Issuance Costs
Debt issuance costs incurred in connection with the Company's long-term debt are amortized, on a straight-line basis, which is not materially different from the effective interest method, through the maturity of the related debt instrument. Amortization of these costs is included in Interest Expense in the Consolidated Income Statements.
Long-Lived Asset Impairment
The Company evaluates the carrying value of long-lived assets to be held and used whenever events or changes in circumstance indicate that the carrying amount may not be recoverable. The carrying value of a long-lived asset is considered impaired when the undiscounted cash flow value is less than the asset's carrying value. The Company measures impairment as the amount by which the carrying value exceeds the fair market value. Fair market value is determined primarily using the projected future cash flows discounted at a rate commensurate with the risk involved. Losses on long-lived assets to be disposed of are determined in a similar manner, except that fair market values are reduced for the cost to dispose. There are no long-lived asset impairments for the year ended December 31, 2009 or 2008.
Supplemental Executive Retirement Plan
Expense and liability balances associated with the Company's Supplemental Executive Retirement Plan are calculated based on certain assumptions including benefits earned, discount rates, interest costs, mortality rates and other factors. Refer to Note L for further discussion.
Marketing
Marketing costs, including advertising, are expensed as incurred. The Company incurred $3.5 million, $4.7 million, and $4.6 million in marketing costs during the years ended December 31, 2009, 2008, and 2007, respectively.
Income Taxes
The Company adopted the authoritative guidance for accounting for uncertainty in income taxes on January 1, 2007. As a result of adoption, the Company recognized a decrease of approximately
F-17
HANGER ORTHOPEDIC GROUP, INC.
NOTES TO CONSOLIDATED FINANCIAL STATEMENTS (Continued)
NOTE B—SIGNIFICANT ACCOUNTING POLICIES (Continued)
$0.2 million to the January 1, 2007 retained earnings balance. The Company recognizes deferred income tax liabilities and assets for the expected future tax consequences of events that have been included in the financial statements or tax returns. Deferred income tax liabilities and assets are determined based on the difference between the financial statement and the tax basis of assets and liabilities using enacted tax rates in effect for the year in which the differences are expected to reverse. The Company recognizes a valuation allowance on the deferred tax assets if it is more likely than not that the assets will not be realized in future years.
Stock-Based Compensation
General
The Company issues options and restricted shares of common stock under two active share-based compensation plans, one for employees and the other for the Board of Directors. At December 31, 2009, 4.7 million shares of common stock were authorized for issuance under the Company's share-based compensation plans. Shares of common stock issued under the share-based compensation plans are issued from the Company's authorized, but unissued shares. Stock option and restricted share awards are granted at the fair market value of the Company's common stock on the date immediately preceding the date of grant. Stock option awards vest over a period determined by the compensation plan, ranging from one to three years, and generally have a maximum term of ten years. Restricted shares of common stock vest over a period of time determined by the compensation plan, ranging from one to four years.
The Company applies the fair value recognition provisions of the authoritative guidance for stock compensation, which require companies to measure and recognize compensation expense for all share-based payments at fair value.
The Company adopted the authoritative guidance using the modified prospective method. Under the modified prospective method, compensation expense related to awards granted prior to and unvested as of the adoption of the authoritative guidance is calculated in accordance with the authoritative guidance and recognized in the consolidated income statements over the requisite remaining service period; compensation expense for all awards granted after the adoption of the authoritative guidance is calculated according to the provisions of such guidance. For the years ended December 31, 2009, 2008, and 2007, the Company recognized $7.4 million, $4.7 million, and $3.3 million, respectively, in compensation expense.
Compensation expense primarily relates to restricted share grants, as the amount of expense related to options is immaterial in all periods presented. The Company calculates the fair value of stock options using the Black-Scholes model. The total value of the stock option awards is expensed ratably over the requisite service period of the employees receiving the awards.
Segment Information
The Company applies a "management" approach to disclosure of segment information. The management approach designates the internal organization that is used by management for making operating decisions and assessing performance as the basis of the Company's reportable segments. The description of the Company's reportable segments and the disclosure of segment information are presented in Note P.
F-18
HANGER ORTHOPEDIC GROUP, INC.
NOTES TO CONSOLIDATED FINANCIAL STATEMENTS (Continued)
NOTE B—SIGNIFICANT ACCOUNTING POLICIES (Continued)
New Accounting Guidance
In August 2009, the FASB issued additional authoritative guidance for measuring the fair value of liabilities, including clarification for circumstances whereby a quoted price in an active market for an identical liability is not available. The additional authoritative guidance was effective for the year ending December 31, 2009, and adoption did not have a material impact on the Company's consolidated financial statements.
NOTE C—SUPPLEMENTAL CASH FLOW FINANCIAL INFORMATION
The supplemental disclosure requirements for the statements of cash flows are as follows:
| (In thousands) |
2009 | 2008 | 2007 | ||||||||
|---|---|---|---|---|---|---|---|---|---|---|---|
Cash paid during the period for: |
|||||||||||
Interest |
$ | 29,497 | $ | 31,339 | $ | 36,312 | |||||
Income taxes |
18,096 | 17,520 | 11,518 | ||||||||
Non-cash financing and investing activities: |
|||||||||||
Non-cash accelerated dividends on preferred stock |
$ | — | $ | 5,254 | $ | — | |||||
Conversion of Series A Convertible Preferred Stock |
— | 52,908 | |||||||||
Purchase of property, plant, and equipment |
7,468 | 2,240 | 2,202 | ||||||||
Unrealized gain (loss) on auction rate securities |
410 | (598 | ) | — | |||||||
Unrealized gain (loss) on interest rate swaps |
1,031 | (3,899 | ) | — | |||||||
Issuance of notes in connection with acquisitions |
3,741 | 3,256 | 5,755 | ||||||||
Issuance of restricted shares of common stock |
2,058 | 9,192 | 14,630 | ||||||||
NOTE D—GOODWILL
The Company completed its annual goodwill impairment analysis in October 2009 and 2008, which did not result in an impairment. In completing the analysis, the Company determined that it had two reporting units with goodwill to be evaluated, which were the same as its reportable segments: (i) patient-care centers and (ii) distribution. The fair value of the Company's reporting units was primarily determined based on the income approach and considered the market and cost approach.
F-19
HANGER ORTHOPEDIC GROUP, INC.
NOTES TO CONSOLIDATED FINANCIAL STATEMENTS (Continued)
NOTE D—GOODWILL (Continued)
The activity related to goodwill for the two years ended December 31, is as follows:
| |
Patient-Care Centers | Distribution | |
||||||||||||||
|---|---|---|---|---|---|---|---|---|---|---|---|---|---|---|---|---|---|
| (In thousands) |
Goodwill | Accumulated Impairment Losses |
Net | Goodwill | Total | ||||||||||||
Balance at December 31, 2007 |
|||||||||||||||||
Goodwill |
$ | 466,982 | $ | (45,808 | ) | $ | 421,174 | $ | 38,388 | $ | 459,562 | ||||||
Additions due to acquisitions |
9,477 | — | 9,477 | — | 9,477 | ||||||||||||
Additions due to contingent consideration |
1,372 | — | 1,372 | — | 1,372 | ||||||||||||
Balance at December 31, 2008 |
477,831 | (45,808 | ) | 432,023 | 38,388 | 470,411 | |||||||||||
Additions due to acquisitions |
13,188 | — | 13,188 | — | 13,188 | ||||||||||||
Additions due to contingent consideration |
823 | — | 823 | — | 823 | ||||||||||||
Balance at December 31, 2009 |
491,842 | (45,808 | ) | 446,034 | 38,388 | 484,422 | |||||||||||
NOTE E—INVENTORY
Inventories, which are recorded at the lower of cost or market using the first-in, first-out method, were as follows at December 31:
| (In thousands) |
2009 | 2008 | |||||
|---|---|---|---|---|---|---|---|
Raw materials |
$ | 34,157 | $ | 31,021 | |||
Work in process |
38,814 | 35,808 | |||||
Finished goods |
18,318 | 19,131 | |||||
|
$ | 91,289 | $ | 85,960 | |||
NOTE F—ACQUISITIONS
Effective January 1, 2009, the Company adopted the revised authoritative guidance for business combinations, which provides revised guidance to improve the relevance, representational faithfulness, and comparability of the information that a reporting entity provides in its financial reports about a business combination and its effects.
During the year ended December 31, 2009, the Company acquired 23 patient care centers and one fabrication facility for an aggregate purchase price of $16.6 million, consisting of $10.9 million in cash, $3.0 million in promissory notes, and $2.7 million in contingent considerations payable within the next two years. Contingent consideration is reported as other liabilities on the Company's consolidated balance sheet. The Company recorded approximately $11.3 million of goodwill and incurred approximately $0.2 million of transaction costs related to these acquisitions. The results of operations for these acquisitions are included in the Company's results of operations from the date of acquisition. Pro forma results would not be materially different.
F-20
HANGER ORTHOPEDIC GROUP, INC.
NOTES TO CONSOLIDATED FINANCIAL STATEMENTS (Continued)
NOTE F—ACQUISITIONS (Continued)
During 2008 and 2007, the Company acquired thirteen and seven orthotic and prosthetic companies and related businesses, respectively. The aggregate purchase price, excluding potential contingent consideration provisions, for 2008 acquisitions was $13.5 million, consisting of $9.6 million in cash, $3.7 million in promissory notes, and $0.2 million in contingent consideration. In 2007, the Company also acquired certain assets of SureFit LLC, a manufacturer and distributor of custom footwear. The aggregate purchase price, excluding potential contingent consideration provisions, for 2007 acquisitions was $20.1 million, consisting of $14.3 million in cash, and $5.8 million in promissory notes.
In connection with contingent consideration agreements with acquisitions completed prior to adoption of the revised authoritative guidance for business combinations becoming effective, the Company made payments of $1.5 million, $1.1 million, and $0.2 million during the years ended December 31, 2009, 2008, and 2007, respectively. The Company has accounted for these amounts as additional purchase price, resulting in an increase in goodwill. The Company estimates that it may pay up to a total of $5.2 million related to contingent consideration provisions of acquisitions in future periods.
NOTE G—LONG-TERM DEBT
Long-term debt as of December 31 was as follows:
| (In thousands) |
2009 | 2008 | |||||
|---|---|---|---|---|---|---|---|
Revolving Credit Facility |
$ | — | $ | 15,253 | |||
Line of Credit |
3,628 | — | |||||
Term Loan |
221,956 | 223,064 | |||||
101/4% Senior Notes due 2014 |
175,000 | 175,000 | |||||
Subordinated seller notes, non-collateralized, net of unamortized discount with principal and interest payable in either monthly, quarterly or annual installments at effective interest rates ranging from 5.00% to 7.25%, maturing through December 2014 |
9,888 | 9,007 | |||||
|
410,472 | 422,324 | |||||
Less current portion |
(8,835 | ) | (3,794 | ) | |||
|
$ | 401,637 | $ | 418,530 | |||
Revolving Credit Facility
The $75.0 million Revolving Credit Facility matures on May 26, 2011 and bears interest, at the Company's option, at LIBOR plus 2.75% or a Base Rate (as defined in the credit agreement) plus 1.75%. The obligations under the Revolving Credit Facility are guaranteed by the Company's subsidiaries and are collateralized by a first priority perfected interest in the Company's subsidiaries' shares, all of the Company's assets and all the assets of the Company's subsidiaries. The Revolving Credit Facility requires compliance with various covenants including but not limited to a maximum total leverage ratio of 6.5 times EBITDA (as defined in the credit agreement) and a maximum annual capital expenditures limit of $50.0 million, plus an unused portion of such amount from the previous fiscal year. As of December 31, 2009, the Company was in compliance with all such covenants.
F-21
HANGER ORTHOPEDIC GROUP, INC.
NOTES TO CONSOLIDATED FINANCIAL STATEMENTS (Continued)
NOTE G—LONG-TERM DEBT (Continued)
In response to the volatility in the current global credit markets, on September 26, 2008, the Company decided to validate its borrowing capacity and availability by submitting a $20.0 million borrowing request under the facility. As anticipated, Lehman Commercial Paper, Inc. ("LCPI"), a subsidiary of Lehman Brothers Holdings, Inc. ("Lehman"), failed to fund its pro-rata commitment of $4.7 million and the Company borrowed a total of $15.3 million under the facility on September 29, 2008. LCPI's total commitment was $17.8 million of our total $75.0 million dollar facility. On July 15, 2009, the Company repaid the outstanding balance on the Revolving Credit Facility.
On October 23, 2009, Barclays Bank PLC replaced $10.0 million of the $17.8 million defaulted LCPI commitment under the Revolving Credit Facility. LCPI's remaining commitment under default is $7.8 million of our total $75.0 million dollar facility. As of December 31, 2009, the Company had $63.9 million available under the revolving credit facility, net of LCPI's $7.8 remaining defaulted million commitment and $3.3 million of outstanding letters of credit.
Line of Credit
On April 6, 2009, the Company obtained a collateralized line of credit from UBS in conjunction with the Rights agreement. The credit line is collateralized by our Indiana ARS and allows the Company to borrow up to the fair market value of the ARS not to exceed its $5.0 million par value. As of December 31, 2009, the Company has drawn $3.6 million, which is the maximum currently allowed under the agreement. The credit line has no net cost to the Company as it bears interest in the amount equal to the income on the ARS.
Term Loan
The $230.0 million Term Loan matures on May 26, 2013 and requires quarterly principal and interest payments that commenced on September 30, 2006. From time to time, mandatory payments may be required as a result of capital stock issuances, additional debt incurrences, asset sales or other events as defined in the credit agreement. The obligations under the Term Loan are guaranteed by the Company's subsidiaries and are collateralized by a first priority perfected interest in the Company's subsidiaries' shares, all of the Company's assets and all the assets of the Company's subsidiaries. The Term Loan is subject to covenants that mirror those of the Revolving Credit Facility. As of December 31, 2009, the Company was in compliance with all such covenants. The Company secured, effective March 13, 2007, certain amendments to the Term Loan that included reducing the margin over LIBOR that the Company pays as interest under the existing Term Loan from 2.50% to 2.00%. As of December 31, 2009, the Term Loan bears interest, at the Company's option, at LIBOR plus 2.00% or a Base Rate (as defined in the credit agreement) plus 1.00%. At December 31, 2009, the interest rate on the Term Loan was 2.24%.
101/4% Senior Notes
The 101/4% Senior Notes, entered into on May 26, 2006, mature June 1, 2014, are senior indebtedness and are guaranteed on a senior unsecured basis by all of the Company's current and future domestic subsidiaries. Interest is payable semi-annually on June 1 and December 1, and commenced on December 1, 2006.
On or prior to June 1, 2009, the Company could have redeemed up to 35% of the aggregate principal amount of the notes at a redemption price of 110.250% of the principal amount thereof, plus
F-22
HANGER ORTHOPEDIC GROUP, INC.
NOTES TO CONSOLIDATED FINANCIAL STATEMENTS (Continued)
NOTE G—LONG-TERM DEBT (Continued)
accrued and unpaid interest and additional interest, if any, with the net cash proceeds of an equity offering; provided that (i) at least 65% of the aggregate principal amount of the notes remained outstanding immediately after the redemption (excluding notes held by the Company and its subsidiaries); and (ii) the redemption occurred within 90 days of the date of the closing of the equity offering.
Except as discussed above, the notes are not redeemable at the Company's option prior to June 1, 2010. On or after June 1, 2010, the Company may redeem all or part of the notes upon not less than 30 days and no more than 60 days' notice, for the twelve-month period beginning on June 1 of the following years; at (i) 105.125% during 2010; (ii) 102.563% during 2011; and (iii) 100.0% during 2012 and thereafter.
Debt Covenants
The terms of the Senior Notes, the Revolving Credit Facility, and the Term Loan limit the Company's ability to, among other things, incur additional indebtedness, create liens, pay dividends on or redeem capital stock, make certain investments, make restricted payments, make certain dispositions of assets, engage in transactions with affiliates, engage in certain business activities and engage in mergers, consolidations and certain sales of assets. At December 31, 2009 and 2008, the Company was in compliance with all covenants under these debt agreements.
Maturities of long-term debt at December 31, 2009 are as follows:
| (In thousands) |
|
|||
|---|---|---|---|---|
2010 |
$ | 8,835 | ||
2011 |
5,324 | |||
2012 |
5,221 | |||
2013 |
215,985 | |||
2014 |
175,107 | |||
Thereafter |
— | |||
|
$ | 410,472 | ||
NOTE H—COMMITMENTS AND CONTINGENT LIABILITIES
Contingencies
The Company is subject to legal proceedings and claims which arise from time to time in the ordinary course of its business, including additional payments under business purchase agreements. In the opinion of management, the amount of ultimate liability, if any, with respect to these actions will not have a materially adverse effect on the financial position, liquidity or results of operations of the Company.
The Company is in a highly regulated industry and receives regulatory agency inquiries from time to time in the ordinary course of its business, including inquiries relating to the Company's billing activities. To date these inquiries have not resulted in material liabilities, but no assurance can be given that future regulatory agencies' inquiries will be consistent with the results to date or that any
F-23
HANGER ORTHOPEDIC GROUP, INC.
NOTES TO CONSOLIDATED FINANCIAL STATEMENTS (Continued)
NOTE H—COMMITMENTS AND CONTINGENT LIABILITIES (Continued)
discrepancies identified during a regulatory review will not have a material adverse effect on the Company's consolidated financial statements.
The United States Attorney's Office for the Eastern District of New York (the "US Attorney's Office") initiated an investigation in June 2004 regarding allegations of billing discrepancies at the Company's West Hempstead, New York patient-care center. Based upon communications with the US Attorney's Office, it is the Company's understanding that the US Attorney's Office will not file any criminal charges or pursue any False Claims Act remedies against the Company related to the alleged billing discrepancies.
Guarantees and Indemnifications
In the ordinary course of its business, the Company may enter into service agreements with service providers in which it agrees to indemnify or limit the service provider against certain losses and liabilities arising from the service provider's performance of the agreement. The Company has reviewed its existing contracts containing indemnification or clauses of guarantees and does not believe that its liability under such agreements will result in any material liability.
NOTE I—REDEEMABLE CONVERTIBLE PREFERRED STOCK
In May 2006, the Company issued 50,000 shares of Series A Convertible Preferred Stock ("Series A Preferred") with a stated value of $1,000 per share to Ares Corporate Opportunities Fund, L.P. ("ACOF"). The Series A Preferred provided for cumulative dividends at a rate of 3.33% per annum, payable quarterly in arrears. In addition, the initial holders of the Series A Preferred were entitled to have representation on the Board of Directors of the Company and were entitled to vote on all matters on which the holders of the Company's common stock are entitled to vote.
The Company separately accounted for the beneficial conversion feature granted to the holders of the Series A Preferred. The value of the beneficial conversion feature was $3.8 million and was comprised of $1.8 million related to the cost paid by the Company on behalf of the holders and $2.0 million related to the difference between the stated conversion price of the preferred shares and the fair market value of the common stock at the commitment date. The beneficial conversion feature was included in the value of the Series A Preferred; and was amortized by a reduction of income available to common stockholders over the 61 day holding period.
In June 2008, the average closing price of the Company's common stock exceeded the forced conversion price of the Series A Preferred by 200% for a 20-trading day period, triggering an acceleration, pursuant to the Certificate of Designations of the Series A Preferred, of the Series A Preferred dividends that were otherwise payable through May 26, 2011. The accelerated dividends were paid in the form of increased stated value of the Series A Preferred, in lieu of cash. On July 25, 2008, the Company notified the holder of the Series A Preferred of its election pursuant to the Certificate of Designations of the Series A Preferred to force the conversion of the Series A Preferred into 7,308,730 shares of common stock. The conversion of the Series A Preferred occurred on August 8, 2008.
NOTE J—NET INCOME PER COMMON SHARE
Basic per common share amounts are computed using the weighted average number of common shares outstanding during the year. Diluted per common share amounts are computed using the
F-24
HANGER ORTHOPEDIC GROUP, INC.
NOTES TO CONSOLIDATED FINANCIAL STATEMENTS (Continued)
NOTE J—NET INCOME PER COMMON SHARE (Continued)
weighted average number of common shares outstanding during the year and dilutive potential common shares. Dilutive potential common shares consist of stock options and restricted shares and are calculated using the treasury stock method.
| In thousands, except share and per share data) |
2009 | 2008 | 2007 | |||||||
|---|---|---|---|---|---|---|---|---|---|---|
Net income |
$ | 36,093 | $ | 26,746 | $ | 19,267 | ||||
Less preferred stock dividends declared-Series A Convertible Preferred Stock(1) |
— | 5,670 | 1,665 | |||||||
Net income applicable to common stock |
$ | 36,093 | $ | 21,076 | $ | 17,602 | ||||
Shares of common stock outstanding used to compute basic per common share amounts |
31,383,895 | 25,930,096 | 22,475,513 | |||||||
Effect of dilutive restricted stock and options |
684,430 | 1,160,721 | 1,167,751 | |||||||
Effect of dilutive convertible preferrred stock |
— | — | 6,613,757 | |||||||
Shares used to compute diluted per common share amounts(2) |
32,068,325 | 27,090,817 | 30,257,021 | |||||||
Basic income per share applicable to common stock |
$ | 1.15 | $ | 0.81 | $ | 0.78 | ||||
Diluted income per share applicable to common stock |
1.13 | 0.78 | 0.64 | |||||||
- (1)
- For
2008, excludes the effect of the conversion of the Redeemable Convertible Preferred Stock as it is considered anti-dilutive.
- (2)
- For 2009, 2008 and 2007, options to purchase 605,728; 570,727; and 1,059,565 shares of common stock, respectively, are not included in the computation of diluted income per share as these options are anti-dilutive because the exercise prices of the options were greater than the average market price of the Company's common stock during the year.
NOTE K—INCOME TAXES
The provision for income taxes is as follows:
| (In thousands) |
2009 | 2008 | 2007 | ||||||||
|---|---|---|---|---|---|---|---|---|---|---|---|
Current: |
|||||||||||
Federal |
$ | 18,470 | $ | 14,124 | $ | 10,371 | |||||
State |
4,357 | 3,115 | 2,131 | ||||||||
Total Current |
22,827 | 17,239 | 12,502 | ||||||||
Deferred: |
|||||||||||
Federal |
1,073 | (58 | ) | (644 | ) | ||||||
State |
1 | 514 | (132 | ) | |||||||
Total Deferred |
1,074 | 456 | (776 | ) | |||||||
Provision for income taxes |
$ | 23,901 | $ | 17,695 | $ | 11,726 | |||||
Through December 31, 2009, the Company continues not to provide deferred taxes on foreign earnings, as such earnings are intended to be indefinitely reinvested outside the United States.
F-25
HANGER ORTHOPEDIC GROUP, INC.
NOTES TO CONSOLIDATED FINANCIAL STATEMENTS (Continued)
NOTE K—INCOME TAXES (Continued)
A reconciliation of the federal statutory tax rate to the Company's effective tax rate is as follows:
| |
2009 | 2008 | 2007 | ||||||||
|---|---|---|---|---|---|---|---|---|---|---|---|
Federal statutory tax rate |
35.0 | % | 35.0 | % | 35.0 | % | |||||
Increase in taxes resulting from: |
|||||||||||
State income taxes (net of federal effect) |
3.7 | 5.3 | 6.5 | ||||||||
Permanent adjustments |
(0.4 | ) | 0.7 | (0.6 | ) | ||||||
Adjustment to prior year's taxes |
1.5 | 0.3 | (3.2 | ) | |||||||
Adjustments to uncertain tax positions |
— | (1.5 | ) | 0.1 | |||||||
Provision for income taxes |
39.8 | % | 39.8 | % | 37.8 | % | |||||
The Company has accumulated state net operating losses as of December 31, 2009 totaling $225.1 million; the Company anticipates utilizing $34.5 million in years 2010 through 2029. The state operating loss carryforwards without a valuation allowance expire in varying amounts between years 2010 and 2029. The following table summarizes the state net operating loss activity for the years ended December 31:
| (In thousands) |
2009 | 2008 | ||||||
|---|---|---|---|---|---|---|---|---|
State net operating losses, at beginning of year |
$ | 229,891 | $ | 237,283 | ||||
Net operating losses generated |
576 | 4,890 | ||||||
Total net operating losses available |
230,467 | 242,173 | ||||||
Expired net operating losses |
(2,653 | ) | (2,818 | ) | ||||
Net operating losses utilized |
(2,672 | ) | (9,464 | ) | ||||
State net operating losses, at end of year |
$ | 225,142 | $ | 229,891 | ||||
The following table summarizes the activity in state net operating losses, for which valuation allowances have been established, for the years ended December 31:
| (In thousands) |
2009 | 2008 | ||||||
|---|---|---|---|---|---|---|---|---|
Beginning of year |
$ | 192,126 | $ | 189,623 | ||||
Net operating loss utilized |
(312 | ) | (1,343 | ) | ||||
Valuation allowance increase (reduction) |
(1,227 | ) | 3,846 | |||||
End of year |
$ | 190,587 | $ | 192,126 | ||||
The valuation allowance reduction in 2009 was due to a release of valuation allowance against deferred tax assets that were determined to have become realizable. The net valuation allowance increase in 2008 was due to the recording of new valuation allowances against deferred tax assets that were determined to have become unlikely to be realizable less the release of other valuation allowance against other deferred tax assets that were determined to have become realizable.
In addition to valuation allowances reported for net operating losses, there were $1.2 and $1.0 million of valuation allowances reported for other state net deferred tax assets as of December 31, 2009 and 2008, respectively.
F-26
HANGER ORTHOPEDIC GROUP, INC.
NOTES TO CONSOLIDATED FINANCIAL STATEMENTS (Continued)
NOTE K—INCOME TAXES (Continued)
The Company's management believes that it is more likely than not that the majority of the deferred tax assets will be realized. Temporary differences and carryforwards which give rise to deferred tax assets and liabilities as of December 31 are as follows:
| (In thousands) |
2009 | 2008 | ||||||
|---|---|---|---|---|---|---|---|---|
Deferred tax liabilities: |
||||||||
Goodwill amortization |
$ | 47,527 | $ | 41,832 | ||||
Patent amortization |
59 | 355 | ||||||
|
47,586 | 42,187 | ||||||
Deferred tax assets: |
||||||||
State net operating loss |
12,038 | 11,990 | ||||||
Accrued expenses |
5,712 | 5,272 | ||||||
Property, plant and equipment |
1,091 | 968 | ||||||
Deferred benefit plan compensation |
5,918 | 4,527 | ||||||
Accrued vacation |
996 | 969 | ||||||
Provision for bad debt allowance |
3,991 | 2,255 | ||||||
Inventory capitalization and reserves |
1,938 | 1,801 | ||||||
Investments in debt and equity securities |
2,294 | 3,311 | ||||||
Restricted stock |
963 | 823 | ||||||
Other |
1,198 | 695 | ||||||
|
36,139 | 32,611 | ||||||
Valuation allowance on NOL |
(11,359 | ) | (11,278 | ) | ||||
|
24,780 | 21,333 | ||||||
Net deferred tax liabilities |
$ | 22,806 | $ | 20,854 | ||||
The Company records a valuation allowance when it is more likely than not that some portion of all the deferred tax assets will not be realized. The ultimate realization of the deferred tax assets depends on the ability to generate sufficient taxable income of the appropriate character in the appropriate jurisdictions. The Company has reported a valuation allowance for state operating loss carryforwards and other state net deferred tax assets for certain subsidiaries.
As discussed in Note B, the Company adopted the authoritative guidance for accounting for uncertainty in income taxes as of January 1, 2007. As of the adoption date, the Company had tax effected unrecognized tax benefits of $3.3 million of which $1.1 million, if recognized, would affect the effective tax rate. Over the next 12 months, the Company may recognize gross tax effected unrecognized tax benefits of up to $1.4 million, of which $0.8 million is expected to impact the effective tax rate, due to the pending expiration of the period of limitations for assessing tax deficiencies for certain income tax returns.
F-27
HANGER ORTHOPEDIC GROUP, INC.
NOTES TO CONSOLIDATED FINANCIAL STATEMENTS (Continued)
NOTE K—INCOME TAXES (Continued)
A reconciliation of the beginning and ending balances of unrecognized tax benefits is as follows:
| (In thousands) |
2009 | 2008 | 2007 | ||||||||
|---|---|---|---|---|---|---|---|---|---|---|---|
Unrecognized tax benefits, at beginning of the year |
1,789 | 5,749 | 5,861 | ||||||||
Additions for tax positions related to the current year |
— | — | — | ||||||||
Additions for tax positions of prior years |
— | — | — | ||||||||
Reductions for tax positions of prior years |
— | — | — | ||||||||
Settlements |
— | — | (112 | ) | |||||||
Reduction for lapse of applicable statute of limitations |
(80 | ) | (3,960 | ) | — | ||||||
Unrecognized tax benefits, at end of the year |
$ | 1,709 | $ | 1,789 | $ | 5,749 | |||||
As of the January 1, 2007 adoption date, the Company had accrued interest expense and penalties related to the unrecognized tax benefits of $0.4 million and $0.4 million, respectively. The Company recognizes accrued interest and penalties related to unrecognized tax benefits as a component of income tax expense. Reduction in accrued interest and penalties resulting from statute of limitation releases, net of additional accruals of interest and penalties, for the year ended December 31, 2008 was $0.7 million. Total penalties and interest accrued as of December 31, 2009 and 2008, were $0.1 million.
The Company is subject to income tax in U.S. federal, state and local jurisdictions and is subject to examination by federal, state, and local authorities. The Company is no longer subject to US Federal income tax examinations for years before 2006 and with few exceptions is no longer subject to state and local income tax examinations by tax authorities for years before 2005.
NOTE L—EMPLOYEE BENEFITS
Savings Plan
The Company maintains a 401(k) Savings and Retirement plan that covers all of the employees of the Company. Under this 401(k) plan, employees may defer such amounts of their compensation up to the levels permitted by the Internal Revenue Service. The Company recorded matching contributions of $3.2 million, $2.8 million, and $2.5 million, respectively, of contributions under this plan during 2009, 2008 and 2007, respectively.
Deferred Compensation
In conjunction with the acquisition of J.E. Hanger, Inc. of Georgia ("JEH") in 1996, the Company assumed the unfunded deferred compensation plan that had been established for certain key JEH officers. The plan provides for benefits ratably over the period of active employment from the time the contract is entered into to the time the participant retires. Participation was determined by JEH's Board of Directors. The Company purchased individual life insurance contracts with respect to each employee covered by this plan. The Company is the owner and beneficiary of the insurance contracts. The liability related to the deferred compensation arrangements amounted to approximately $0.4 million and $0.3 million at December 31, 2009 and 2008, respectively.
F-28
HANGER ORTHOPEDIC GROUP, INC.
NOTES TO CONSOLIDATED FINANCIAL STATEMENTS (Continued)
NOTE L—EMPLOYEE BENEFITS (Continued)
Supplemental Executive Retirement Plan
Effective January 2004, the Company implemented an unfunded noncontributory defined benefit plan (the "Plan") for certain senior executives. The Company has engaged an actuary to calculate the benefit obligation and net benefits cost at December 31, and have utilized the actuarial calculation as a basis for our benefit obligation liability. The Plan, which is administered by the Company, calls for annual payments upon retirement based on years of service and final average salary. Net periodic benefit expense is actuarially determined.
The Plan's net benefit cost is as follows:
| |
(In thousands) | ||||
|---|---|---|---|---|---|
Change in Benefit Obligation |
|||||
Benefit obligation at December 31, 2006 |
$ | 5,851 | |||
Service cost |
2,082 | ||||
Interest cost |
336 | ||||
Benefit obligation at December 31, 2007 |
8,269 | ||||
Service cost |
2,221 | ||||
Interest cost |
518 | ||||
Benefit obligation at December 31, 2008 |
11,008 | ||||
Service cost |
2,435 | ||||
Interest cost |
695 | ||||
Benefit obligation at December 31, 2009 |
$ | 14,138 | |||
Unfunded status |
$ |
14,138 |
|||
Unamortized net (gain) loss |
— | ||||
Net amount recognized |
$ | 14,138 | |||
Amounts Recognized in the Consolidated Balance Sheet |
|||||
Non-Current Accrued liabilities |
$ | 14,138 | |||
The following weighted average assumptions were used to determine the benefit obligation and net benefit cost at December 31:
| |
2009 | 2008 | |||||
|---|---|---|---|---|---|---|---|
Discount rate |
5.50 | % | 6.25 | % | |||
Average rate of increase in compensation |
3.25 | % | 3.25 | % | |||
F-29
HANGER ORTHOPEDIC GROUP, INC.
NOTES TO CONSOLIDATED FINANCIAL STATEMENTS (Continued)
NOTE L—EMPLOYEE BENEFITS (Continued)
At December 31, 2009, the estimated accumulated benefit obligation is $14.1 million. Future payments under the Plan are as follows:
| |
(In thousands) | |||
|---|---|---|---|---|
2010 |
— | |||
2011 |
1,037 | |||
2012 |
1,218 | |||
2013 |
1,218 | |||
2014 |
1,548 | |||
Thereafter |
8,477 | |||
|
$ | 13,498 | ||
NOTE M—STOCK-BASED COMPENSATION
Employee Plans
Under the Company's 2002 Stock Option Plan, 1.5 million shares of common stock were authorized for issuance. Options may only be granted at an exercise price that is not less than the fair market value of the common stock on the date of grant and may expire no later than ten years after grant. Vesting and expiration periods are established by the Compensation Committee of the Board of Directors, generally with vesting of four years following the date of grant and generally with expirations of ten years after grant. In 2003, the 2002 Stock Option Plan was amended to permit the grant of restricted shares of common stock in addition to stock options and to change the name of the plan to the 2002 Stock Incentive Plan. In May 2006, an additional 2.7 million shares of common stock were authorized for issuance. In May 2007, the Company's shareholders approved amendments to the 2002 Stock Incentive Plan, most notably the incorporation of the Company's current annual incentive plan for certain executive officers into the 2002 Stock Incentive Plan. The amendments resulted in the following changes to the 2002 Stock Incentive Plan: (i) addition of performance-based cash awards ("Incentive Awards") and renaming the 2002 Stock Incentive Plan to be the 2002 Stock Incentive and Bonus Plan; (ii) limitation on the number of options, shares of restricted stock, annual Incentive Awards and long term Incentive Awards that an individual can receive during any calendar year; (iii) addition of a list of specific performance goals that the Company may use for the provision of awards under the 2002 Stock Incentive and Bonus Plan; (iv) limitation on the total number of shares of stock issued pursuant to the exercise of incentive stock options; and (v) addition of a provision allowing for the Company to institute a compensation recovery policy, which would allow the Compensation Committee, in appropriate circumstances, to seek reimbursement of certain compensation realized under awards granted under the 2002 Stock Incentive and Bonus Plan. In August 2007, 205,000 performance-based restricted shares were granted to certain executives. These performance-based restricted shares are subject to the same vesting period as the service-based restricted shares for employees. However, the quantity of restricted shares to be released under this grant was dependent on the diluted EPS for the twelve month period from July 1, 2007 through June 30, 2008. The target EPS for this period was met, therefore, 100% of the performance-based restricted shares were released based on the four year vesting period. In November 2008, 165,490 performance-based restricted shares were granted to certain executives. These performance-based restricted shares are subject to the same vesting period as the service-based restricted shares for employees. However, the quantity of restricted
F-30
HANGER ORTHOPEDIC GROUP, INC.
NOTES TO CONSOLIDATED FINANCIAL STATEMENTS (Continued)
NOTE M—STOCK-BASED COMPENSATION (Continued)
shares to be released under this grant was dependent on the diluted EPS for the twelve month period from October 1, 2008 through September 30, 2009. The target EPS for this period was met, therefore, 120% of the performance-based restricted shares were released based on the four year vesting period.
During 2009 and 2008, no options were cancelled under the 2002 Stock Incentive and Bonus Plan. During 2007, options for 4,000 shares were cancelled under the 2002 Stock Incentive and Bonus Plan. At December 31, 2009, 865,991 shares of common stock were available for issuance.
Director Plans
During April and May 2003, the Compensation Committee of the Board of Directors and the shareholders of the Company, respectively, approved the 2003 Non-Employee Directors' Stock Incentive Plan ("2003 Directors' Plan") which replaced the Company's 1993 Non-Employee Director Stock Option Plan ("Director Plan"). The 2003 Directors' Plan authorized 500,000 shares of common stock for grant and permits the issuance of stock options and restricted shares of common stock. The 2003 Directors' Plan also provides for the automatic annual grant of 8,500 shares of restricted shares of common stock to each director and permits the grant of additional restricted stock in the event the director elects to receive his or her annual director fee in restricted shares of common stock rather than cash. Options may only be granted at an exercise price that is not less than the fair market value of the common stock on the date of grant and may expire no later than ten years after grant. Vesting and expiration periods are established by the Compensation Committee of the Board of Directors, generally with vesting of three years following grant and generally with expirations of ten years after grant. In May 2007, the Company's shareholders further approved an amendment to the 2003 Directors' Plan providing for the issuance by the Company of restricted stock units to its non-employee directors, at the option of such director. The restricted stock units effectively allow the director to elect to defer receipt of the shares of restricted stock which the director would ordinarily receive on an annual basis until (i) the January 15th of the year following the calendar year in which the director terminates service on the Board of Directors, or (ii) the fifth, tenth or fifteenth anniversary of the annual meeting date on the election form for that year. The director may elect to receive his or her annual grant of restricted stock, including shares to be received in lieu of the annual director fee, in the form of restricted stock units, with such election to take place on or prior to the date of the annual meeting of stockholders for such year. The restricted stock units are subject to the same vesting period as the shares of restricted stock issued under the 2003 Directors' Plan. There were no 2003 Directors' Plan option cancellations during 2009, 2008 and 2007. At December 31, 2009, 70,927 shares of common stock were available for issuance.
F-31
HANGER ORTHOPEDIC GROUP, INC.
NOTES TO CONSOLIDATED FINANCIAL STATEMENTS (Continued)
NOTE M—STOCK-BASED COMPENSATION (Continued)
Restricted Shares of Common Stock
A summary of the activity of restricted shares of common stock for the year ended December 31, 2009 is as follows:
| |
Employee Plans | Director Plans | |||||||||||
|---|---|---|---|---|---|---|---|---|---|---|---|---|---|
| |
Shares | Weighted Average Grant Date Fair Value |
Shares | Weighted Average Grant Date Fair Value |
|||||||||
Nonvested at December 31, 2006 |
993,375 | $ | 7.91 | 79,135 | $ | 7.52 | |||||||
Granted |
814,000 |
9.51 |
70,200 |
11.38 |
|||||||||
Vested |
(295,188 | ) | 8.48 | (26,379 | ) | 7.52 | |||||||
Forfeited |
(41,500 | ) | 8.27 | — | — | ||||||||
Nonvested at December 31, 2007 |
1,470,687 | $ | 8.67 | 122,956 | $ | 9.73 | |||||||
Granted |
567,850 |
16.18 |
66,742 |
12.59 |
|||||||||
Vested |
(453,247 | ) | 8.46 | (49,778 | ) | 9.34 | |||||||
Forfeited |
(28,250 | ) | 8.84 | — | — | ||||||||
Nonvested at December 31, 2008 |
1,557,040 | $ | 11.47 | 139,920 | $ | 11.23 | |||||||
Granted |
40,778 |
16.07 |
70,696 |
14.06 |
|||||||||
Vested |
(587,657 | ) | 10.42 | (81,493 | ) | 10.55 | |||||||
Forfeited |
(23,700 | ) | 11.05 | — | — | ||||||||
Nonvested at December 31, 2009 |
986,461 | $ | 12.29 | 129,123 | $ | 13.21 | |||||||
During the years ended December 31, 2009 and 2008, 669,150 and 503,025 restricted shares of common stock with an intrinsic value of $7.0 million and $4.3 million, respectively, became fully vested. As of December 31, 2009, total unrecognized compensation cost related to restricted shares of common stock was approximately $11.6 million and the related weighted-average period over which it is expected to be recognized is approximately two years. The aggregate granted shares have vesting dates through June 2013. The 2009 grant was $1.1 million at the date of grant which is amortized to expense ratably over the vesting period of granted shares.
F-32
HANGER ORTHOPEDIC GROUP, INC.
NOTES TO CONSOLIDATED FINANCIAL STATEMENTS (Continued)
NOTE M—STOCK-BASED COMPENSATION (Continued)
Options
The summary of option activity and weighted average exercise prices are as follows:
| |
Employee Plans | Director Plans | Non-Qualified Awards | ||||||||||||||||
|---|---|---|---|---|---|---|---|---|---|---|---|---|---|---|---|---|---|---|---|
| |
Shares | Weighted Average Exercise Price |
Shares | Weighted Average Exercise Price |
Shares | Weighted Average Exercise Price |
|||||||||||||
Outstanding at December 31, 2006 |
2,388,983 | $ | 10.70 | 188,411 | $ | 10.04 | 406,000 | $ | 5.95 | ||||||||||
Granted |
— |
— |
— |
— |
— |
— |
|||||||||||||
Terminated |
(514,250 | ) | 14.31 | — | — | — | — | ||||||||||||
Exercised |
(364,084 | ) | 3.91 | (35,298 | ) | 5.68 | — | — | |||||||||||
Outstanding at December 31, 2007 |
1,510,649 | $ | 11.10 | 153,113 | $ | 11.04 | 406,000 | $ | 5.95 | ||||||||||
Granted |
— | — | — | — | — | — | |||||||||||||
Terminated |
(193,914 | ) | 15.24 | (10,000 | ) | 18.63 | — | — | |||||||||||
Exercised |
(222,785 | ) | 3.04 | (7,649 | ) | 2.83 | — | — | |||||||||||
Outstanding at December 31, 2008 |
1,093,950 | $ | 12.01 | 135,464 | $ | 10.33 | 406,000 | $ | 5.95 | ||||||||||
Granted |
— | — | — | — | — | — | |||||||||||||
Terminated |
(20,658 | ) | 5.48 | (5,000 | ) | 14.00 | — | — | |||||||||||
Exercised |
(308,960 | ) | 8.16 | (35,000 | ) | 6.68 | — | — | |||||||||||
Outstanding at December 31, 2009 |
764,332 | $ | 13.74 | 95,464 | $ | 11.46 | 406,000 | $ | 5.95 | ||||||||||
Aggregate intrinsic value at December 31, 2009 |
$ | 10,505,152 | $ | 1,094,495 | $ | 2,415,000 | |||||||||||||
Weighted average remaining contractual term (years) |
3.2 | 4.1 | 0.3 | ||||||||||||||||
The intrinsic value of options exercised during the years ended December 31, 2009 and 2008 was $2.8 million and $0.7 million, respectively. Options exercisable under the Company's share-based compensation plans at December 31, 2009 and 2008 were 1.3 million and 1.6 million shares, respectively, with a weighted average exercise price of $11.07 and $12.76, an average remaining contractual term of 2.3 and 2.7 years, and an aggregate intrinsic value of $14.0 million and $17.0 million as of December 31, 2009 and 2008. Cash received by the Company related to the exercise of options during the years ended December 31, 2009 and 2008 amounted to $3.0 million and $0.3 million. As of December 31, 2009 and 2008, there is no unrecognized compensation cost related to stock option awards.
F-33
HANGER ORTHOPEDIC GROUP, INC.
NOTES TO CONSOLIDATED FINANCIAL STATEMENTS (Continued)
NOTE M—STOCK-BASED COMPENSATION (Continued)
Options
The summary of the options exercisable is as follows:
| |
Employee Plans |
Director Plans |
Non-Qualified Awards |
||||||||
|---|---|---|---|---|---|---|---|---|---|---|---|
December 31, |
|||||||||||
2009 |
764,332 | 95,464 | 406,000 | ||||||||
2008 |
1,093,950 | 135,464 | 406,000 | ||||||||
2007 |
1,510,649 | 139,475 | 406,000 | ||||||||
Information concerning outstanding and exercisable options as of December 31, 2009 is as follows:
| |
Options Outstanding | Options Exercisable | ||||||||||||||
|---|---|---|---|---|---|---|---|---|---|---|---|---|---|---|---|---|
| |
|
Weighted Average | |
|
||||||||||||
Range of Exercise Prices |
Number of Options or Awards |
Remaining Life (Years) |
Exercise Price |
Number of Options or Awards |
Weighted Average Exercise Price |
|||||||||||
$ 4.63 to $ 6.02 |
435,463 | 0.6 | $ | 5.90 | 435,463 | $ | 5.90 | |||||||||
8.08 to 12.10 |
124,605 | 4.7 | 8.72 | 124,605 | 8.72 | |||||||||||
13.50 to 16.75 |
705,728 | 3.0 | 14.68 | 705,728 | 14.68 | |||||||||||
|
1,265,796 | 2.3 | $ | 11.07 | 1,265,796 | $ | 11.07 | |||||||||
NOTE N—LEASES
Operating Leases
The Company leases office space under non-cancellable operating leases, the majority of which contain escalation clauses. The Company recognizes rent expense on a straight-line basis for leases with escalation clauses. Certain of these leases also contain renewal options. Rent expense was approximately $39.3 million, $35.4 million, and $33.1 million, for the years ended December 31, 2009, 2008, and 2007, respectively. Sublease rental income of $0.3 million, $0.4 million, and $0.4 million, for the years ended December 31, 2009, 2008, and 2007, respectively, was netted against rent expense. The Company estimates it will receive approximately $0.3 million of sublease rent income in the future.
Future minimum rental payments, by year and in the aggregate, under operating leases with terms of one year or more at December 31, 2009 are as follows:
| (In thousands) |
|
|||
|---|---|---|---|---|
2010 |
$ | 38,081 | ||
2011 |
32,312 | |||
2012 |
25,769 | |||
2013 |
18,282 | |||
2014 |
12,004 | |||
Thereafter |
9,305 | |||
|
$ | 135,753 | ||
F-34
HANGER ORTHOPEDIC GROUP, INC.
NOTES TO CONSOLIDATED FINANCIAL STATEMENTS (Continued)
NOTE O—RELATED PARTY TRANSACTIONS
The firm of Foley & Lardner LLP serves as the Company's outside general counsel. The Company's Chairman is the brother-in-law of the partner in charge of the relationship. Total fees paid by the Company to Foley & Lardner LLP were $2.7 million, $3.0 million, and $3.0 million for the years ended 2009, 2008 and 2007, respectively, which amounted to less than two-thirds of one percent of that firm's annual revenues for each such year. At December 31, 2009 and 2008, the Company had $0.1 and $0.4 million payable to Foley & Lardner LLP, respectively.
NOTE P—SEGMENT AND RELATED INFORMATION
The Company has identified two reportable segments in which it operates based on the products and services it provides. The Company evaluates segment performance and allocates resources based on the segments' income from operations.
The reportable segments are: (i) patient-care services and (ii) distribution. The reportable segments are described further below:
Patient-Care Services—This segment consists of the Company's owned and operated patient-care centers and fabrication centers of O&P components. The patient-care centers provide services to design and fit O&P devices to patients. These centers also instruct patients in the use, care and maintenance of the devices. Fabrication centers are involved in the fabrication of O&P components for both the O&P industry and the Company's own patient-care centers.
Distribution—This segment distributes O&P products and components to both the O&P industry and the Company's own patient-care practices.
Other—This consists of Hanger corporate, IN, Inc. and Linkia. IN, Inc. specializes in bringing emerging MyoOrthotics Technologies® to the O&P market. MyoOrthotics Technologies represents the merging of orthotic technologies with electrical stimulation. Linkia is a national managed-care agent for O&P services and a patient referral clearing house.
The accounting policies of the segments are the same as those described in the summary of "Significant Accounting Policies" in Note B to the consolidated financial statements.
F-35
HANGER ORTHOPEDIC GROUP, INC.
NOTES TO CONSOLIDATED FINANCIAL STATEMENTS (Continued)
NOTE P—SEGMENT AND RELATED INFORMATION (Continued)
Summarized financial information concerning the Company's reportable segments is shown in the following table. Intersegment sales mainly include sales of O&P components from the distribution segment to the patient-care centers segment and were made at prices which approximate market values.
| (In thousands) |
Patient-Care Services |
Distribution | Other | Consolidating Adjustments |
Total | ||||||||||||
|---|---|---|---|---|---|---|---|---|---|---|---|---|---|---|---|---|---|
2009 |
|||||||||||||||||
Net sales |
|||||||||||||||||
Customers |
$ | 670,458 | $ | 88,043 | $ | 1,569 | $ | — | $ | 760,070 | |||||||
Intersegments |
— | 155,017 | 2,782 | (157,799 | ) | — | |||||||||||
Depreciation and amortization |
10,288 | 893 | 5,138 | — | 16,319 | ||||||||||||
Income from operations |
125,185 | 25,634 | (60,467 | ) | 168 | 90,520 | |||||||||||
Interest (income) expense |
28,470 | 3,443 | (1,220 | ) | — | 30,693 | |||||||||||
Income (loss) before taxes and extraordinary items |
96,715 | 22,191 | (59,080 | ) | 168 | 59,994 | |||||||||||
Total assets |
821,988 |
119,989 |
(66,941 |
) |
— |
875,036 |
|||||||||||
Capital expenditures |
14,704 | 794 | 5,772 | — | 21,270 | ||||||||||||
2008 |
|||||||||||||||||
Net sales |
|||||||||||||||||
Customers |
$ | 619,977 | $ | 80,707 | $ | 2,445 | $ | — | $ | 703,129 | |||||||
Intersegments |
— | 136,679 | 3,264 | (139,943 | ) | — | |||||||||||
Depreciation and amortization |
11,855 | 735 | 4,593 | — | 17,183 | ||||||||||||
Income from operations |
103,957 | 23,423 | (50,427 | ) | 775 | 77,728 | |||||||||||
Interest (income) expense |
(6,484 | ) | 7,086 | 31,947 | — | 32,549 | |||||||||||
Income (loss) before taxes and extraordinary items |
96,715 | 22,191 | (83,112 | ) | 168 | 35,962 | |||||||||||
Total assets |
707,635 |
91,948 |
14,167 |
813,750 |
|||||||||||||
Capital expenditures |
11,175 | 505 | 7,650 | 19,330 | |||||||||||||
2007 |
|||||||||||||||||
Net sales |
|||||||||||||||||
Customers |
$ | 571,676 | $ | 64,440 | $ | 1,234 | $ | — | $ | 637,350 | |||||||
Intersegments |
— | 124,757 | 783 | (125,540 | ) | — | |||||||||||
Depreciation and amortization |
12,138 | 490 | 3,248 | — | 15,876 | ||||||||||||
Income from operations |
97,404 | 19,235 | (50,593 | ) | 1,934 | 67,980 | |||||||||||
Interest (income) expense |
(6,526 | ) | 7,001 | 36,512 | — | 36,987 | |||||||||||
Income (loss) before taxes and extraordinary items |
103,930 | 12,234 | (87,105 | ) | 1,934 | 30,993 | |||||||||||
Total assets |
729,904 |
75,087 |
(45,308 |
) |
— |
759,683 |
|||||||||||
Capital expenditures |
10,972 | 918 | 8,239 | — | 20,129 | ||||||||||||
The Company's foreign and export sales and assets located outside of the United States of America are not significant. Additionally, no single customer accounted for more than 10% of revenues in 2009, 2008, or 2007.
F-36
HANGER ORTHOPEDIC GROUP, INC.
SCHEDULE II VALUATION AND QUALIFYING ACCOUNTS
Year
|
Classification | Balance at beginning of year |
Additions Charged to Costs and Expenses |
Write-offs | Balance at end of year |
||||||||||
|---|---|---|---|---|---|---|---|---|---|---|---|---|---|---|---|
| (In thousands) |
|
|
|
|
|
||||||||||
| 2009 | Allowance for doubtful accounts | $ | 6,099 | $ | 16,128 | $ | 11,701 | $ | 10,526 | ||||||
| Inventory reserves | 283 | 315 | 145 | 453 | |||||||||||
2008 |
Allowance for doubtful accounts |
$ |
3,965 |
$ |
15,906 |
$ |
13,772 |
$ |
6,099 |
||||||
| Inventory reserves | 165 | 241 | 123 | 283 | |||||||||||
2007 |
Allowance for doubtful accounts |
$ |
3,369 |
$ |
15,774 |
$ |
15,178 |
$ |
3,965 |
||||||
| Inventory reserves | 123 | 94 | 52 | 165 | |||||||||||
Year
|
Classification | Balance at beginning of year |
Generated | Utilized/Released | Expired | Balance at end of year |
||||||||||||
|---|---|---|---|---|---|---|---|---|---|---|---|---|---|---|---|---|---|---|
| (In thousands) |
|
|
|
|
|
|
||||||||||||
| 2009 | Net Operating Loss | $ | 11,990 | $ | 63 | $ | — | $ | 15 | $ | 12,038 | |||||||
| Valuation Allowance | 11,278 | 386 | 305 | — | 11,359 | |||||||||||||
2008 |
Net Operating Loss |
$ |
12,255 |
$ |
247 |
$ |
432 |
$ |
80 |
$ |
11,990 |
|||||||
| Valuation Allowance | 10,813 | 844 | 367 | 12 | 11,278 | |||||||||||||
2007 |
Net Operating Loss |
$ |
18,668 |
$ |
632 |
$ |
1,188 |
$ |
5,857 |
$ |
12,255 |
|||||||
| Valuation Allowance | 13,448 | 956 | 3,591 | — | 10,813 | |||||||||||||
S-1
| Exhibit No. | Document | ||
|---|---|---|---|
| 3(a) | Certificate of Incorporation, as amended, of the Registrant. (Incorporated herein by reference to Exhibit 3.1 to the Registrant's Annual Report on Form 10-K for the fiscal year ended September 30, 1988). | ||
3(b) |
Certificate of Amendment of the Registrant's Certificate of Incorporation (which, among other things, changed the Registrant's corporate name from Sequel Corporation to Hanger Orthopedic Group, Inc.), as filed on August 11, 1989 with the Office of the Secretary of State of Delaware. (Incorporated herein by reference to Exhibit 3(b) to the Registrant's Current Report on Form 8-K dated February 13, 1990). |
||
3(c) |
Certificate of Agreement of Merger of Sequel Corporation and Delaware Sequel Corporation. (Incorporated herein by reference to Exhibit 3.1(a) to the Registrant's Annual Report on Form 10-K for the fiscal year ended September 30, 1988). |
||
3(d) |
Certificate of Ownership and Merger of Hanger Acquisition Corporation and J. E. Hanger, Inc. as filed with the Office of the Secretary of the State of Delaware on April 11, 1989. (Incorporated herein by reference to Exhibit 2(f) to the Registrant's Current Report on Form 8-K dated May 15, 1989). |
||
3(e) |
Certificate of Amendment to Certificate of Incorporation of the Registrant, as filed with the Secretary of State of Delaware on September 16, 1999. (Incorporated herein by reference to Exhibit 3 to the Registrant's Quarterly Report on Form 10-Q for the quarter ended September 30, 1999). |
||
3(f) |
Amended and Restated By-Laws of the Registrant. (Incorporated herein by reference to Exhibit 3.2 to the Registrant's Quarterly Report on Form 10-Q for the quarterly period ended September 30, 2008). |
||
10(a) |
Amended and Restated 2002 Stock Incentive Plan, as amended through May 10, 2007. (Incorporated herein by reference to Appendix 1 to the Registrant's Proxy Statement, dated April 10, 2007, relating to the Registrant's Annual Meeting of Stockholders held on May 10, 2007).* |
||
10(b) |
Amended and Restated 2003 Non-Employee Directors' Stock Incentive Plan, as amended through May 10, 2007. (Incorporated herein by reference to Appendix 2 to the Registrant's Proxy Statement, dated April 10, 2007, relating to the Registrant's Annual Meeting of Stockholders held on May 10, 2007). |
||
10(c) |
Form of Stock Option Agreement (Non-Executive Employees), Stock Option Agreement (Executive Employees), Restricted Stock Agreement (Non-Executive Employees) and Restricted Stock Agreement (Executive Employees). (Incorporated herein by reference to Exhibits 10.1, 10.2, 10.3 and 10.4, respectively, to the Registrant's Current Report on Form 8-K filed on February 24, 2005). |
||
10(d) |
Amended and Supplemental Executive Retirement Plan, dated January 1, 2005.* |
||
10(e) |
Purchase Agreement, dated as of May 23, 2006, between the Registrant and the Initial Purchasers named in Schedule I thereto relating to the Registrant's 101/4% Senior Notes due 2014. (Incorporated herein by reference to Exhibit 10.1 to the Current Report on Form 8-K filed by the Registrant on May 30, 2006). |
||
10(f) |
Indenture, dated as of May 26, 2006, among the Registrant, the Registrant's subsidiaries signatory thereto and Wilmington Trust Company, as trustee, relating to the Registrant's 101/4% Senior Notes due 2014. (Incorporated herein by reference to Exhibit 10.2 to the Current Report on Form 8-K filed by the Registrant on May 30, 2006). |
||
| Exhibit No. | Document | ||
|---|---|---|---|
| 10(g) | Registration Rights Agreement, dated as of May 26, 2006, among the Registrant, the Registrant's subsidiaries signatory thereto and the initial purchasers named therein relating to the Registrant's 101/4% Senior Notes due 2014. (Incorporated herein by reference to Exhibit 10.3 to the Current Report on Form 8-K filed by the Registrant on May 30, 2006). | ||
10(h) |
Registration Rights Agreement, dated as of May 26, 2006, among the Registrant and Ares Corporate Opportunities Fund, L.P. (Incorporated herein by reference to Exhibit 10.5 to the Registrant's Quarterly Report on Form 10-Q for the quarter ended June 30, 2006). |
||
10(i) |
Letter Agreements, dated May 26, 2006, between the Registrant and Ares Corporate Opportunities Fund, L.P. regarding board and management rights. (Incorporated herein by reference to Exhibit 10.6 to the Registrant's Quarterly Report on Form 10-Q for the quarter ended June 30, 2006). |
||
10(j) |
Credit Agreement, dated as of May 26, 2006, among the Registrant, the Several Lenders identified therein, Lehman Brothers Inc. and Citigroup Global Markets Inc., as Joint Lead Arrangers and Joint Book-Runners, Citicorp North America, Inc., as Administrative Agent, Lehman Commercial Paper Inc., as Syndication Agent, and LaSalle Bank National Association and General Electric Capital Corporation, as Co-Documentation Agents. (Incorporated herein by reference to Exhibit 10.7 to the Registrant's Quarterly Report on Form 10-Q for the quarter ended June 30, 2006). |
||
10(k) |
Guarantee and Collateral Agreement, dated as of May 26, 2006, made by the Registrant, as Borrower, and certain of its subsidiaries, in favor of Citicorp North America, Inc., as Administrative Agent. (Incorporated herein by reference to Exhibit 10.8 to the Registrant's Quarterly Report on Form 10-Q for the quarter ended June 30, 2006). |
||
10(l) |
Assignment and Acceptance dated October 23, 2009 related to Credit Agreement, dated as of May 26, 2006, among the Registrant, the Several Lenders identified therein, Lehman Commercial Paper Inc., as Assignor and Barclays Bank PLC, as Assignee, Citicorp North America, Inc., as Administrative Agent and Swing Line Lender, and Bank of America, N.A., as successor by merger to LaSalle Bank National Association as LC Issuing Bank. (Incorporated herein by reference to Exhibit 10.1 to the Registrant's Quarterly Report on Form 10-Q for the quarter ended September 30, 2009). |
||
10(m) |
First Amendment to Credit Agreement, by and among the Registrant, the Lenders party thereto and Citicorp North America, Inc., dated as of March 12, 2007. (Incorporated herein by reference to Exhibit 10 (cc) to the Registrant's Annual Report on Form 10-K for the year ended December 31, 2006). |
||
10(n) |
Fourth Amended and Restated Employment Agreement, effective as of January 1, 2005, by and between and Ivan R. Sabel and the Registrant. (Incorporated herein by reference to Exhibit 10.1 to the Registrant's Quarterly Report on Form 10-Q for the quarter ended September 30, 2007).* |
||
10(o) |
Third Amended and Restated Employment Agreement, effective as of January 1, 2005, by and between George E. McHenry and the Registrant. (Incorporated herein by reference to Exhibit 10.2 to the Registrant's Quarterly Report on Form 10-Q for the quarter ended September 30, 2007).* |
||
10(p) |
Fourth Amended and Restated Employment Agreement, effective as of January 1, 2005, by and between Thomas F. Kirk and the Registrant. (Incorporated herein by reference to Exhibit 10.3 to the Registrant's Quarterly Report on Form 10-Q for the quarter ended September 30, 2007).* |
||
| Exhibit No. | Document | ||
|---|---|---|---|
| 10(q) | Third Amended and Restated Employment Agreement, effective as of January 1, 2005, by and between Richmond L. Taylor and the Registrant. (Incorporated herein by reference to Exhibit 10.4 to the Registrant's Quarterly Report on Form 10-Q for the quarter ended September 30, 2007).* | ||
10(r) |
Second Amended and Restated Employment Agreement, effective as of September 13, 2007, by and between Ronald N. May and the Registrant. (Incorporated herein by reference to Exhibit 10 to the Current Report on Form 8-K filed by the Registrant on November 13, 2007).* |
||
10(s) |
Amendment to Fourth Amended and Restated Employment Agreement, dated as of February 5, 2008, by and between Ivan R. Sabel and the Registrant. (Incorporated herein by reference to Exhibit 10.1 to the Current Report on Form 8-K filed by the Registrant on February 6, 2008).* |
||
10(t) |
Amendment to Fourth Amended and Restated Employment Agreement, dated as of February 5, 2008, by and between Thomas F. Kirk and the Registrant. (Incorporated herein by reference to Exhibit 10.2 to the Current Report on Form 8-K filed by the Registrant on February 6, 2008). |
||
10(u) |
Amended and Restated Preferred Stock Purchase Agreement, dated as of May 25, 2006, by and among the Registrant, Ares Corporate Opportunities Fund, L.P. and the Initial Purchasers identified therein. (Incorporated herein by reference to Exhibit 10.4 to the Registrant's Quarterly Report on Form 10-Q for the quarter ended June 30, 2006). |
||
21 |
List of Subsidiaries of the Registrant. (Filed herewith). |
||
23.1 |
Consent of PricewaterhouseCoopers LLP. (Filed herewith). |
||
31.1 |
Written Statement of the Chief Executive Officer Pursuant to Section 302 of the Sarbanes-Oxley Act of 2002. (Filed herewith). |
||
31.2 |
Written Statement of the Chief Financial Officer Pursuant to Section 302 of the Sarbanes-Oxley Act of 2002. (Filed herewith). |
||
32 |
Written Statement of the Chief Executive Officer and Chief Financial Officer Pursuant to 18 U.S.C. Section 1350, as adopted Pursuant to Section 906 of the Sarbanes-Oxley Act of 2002. (Furnished herewith). |
||
- *
- Management contract or compensatory plan