Attached files
| file | filename |
|---|---|
| EX-99.1 - EX-99.1 - McEwen Mining Inc. | a18-3383_1ex99d1.htm |
| 8-K - 8-K - McEwen Mining Inc. | a18-3383_18k.htm |
|
|
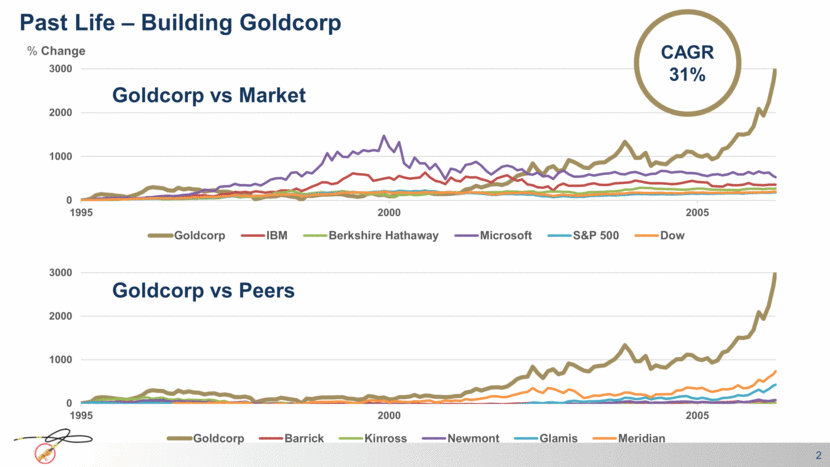
2 % Change Goldcorp vs Market Goldcorp vs Peers CAGR 31% Past Life – Building Goldcorp 0 1000 2000 3000 1995 2000 2005 Goldcorp Barrick Kinross Newmont Glamis Meridian |
|
|
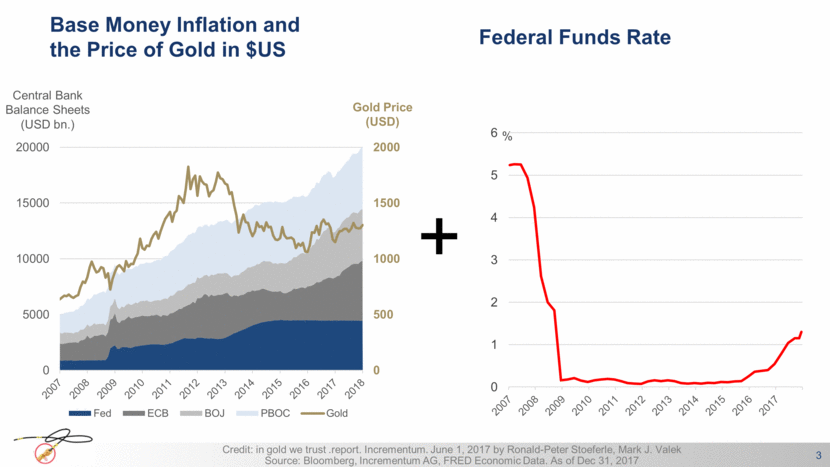
Base Money Inflation and the Price of Gold in $US 3 Credit: in gold we trust .report. Incrementum. June 1, 2017 by Ronald-Peter Stoeferle, Mark J. Valek Source: Bloomberg, Incrementum AG, FRED Economic Data. As of Dec 31, 2017 + Central Bank Balance Sheets (USD bn.) Gold Price (USD) % Federal Funds Rate 0 500 1000 1500 2000 0 5000 10000 15000 20000 Fed ECB BOJ PBOC Gold 0 1 2 3 4 5 6 |
|
|
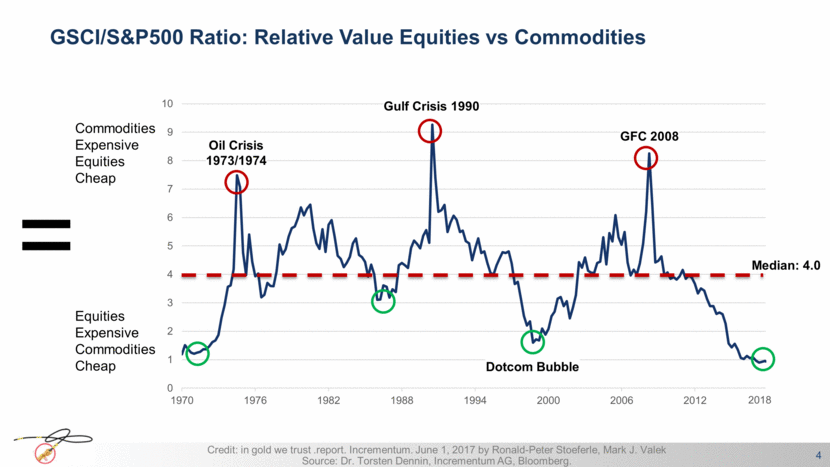
GSCI/S&P500 Ratio: Relative Value Equities vs Commodities 4 Credit: in gold we trust .report. Incrementum. June 1, 2017 by Ronald-Peter Stoeferle, Mark J. Valek Source: Dr. Torsten Dennin, Incrementum AG, Bloomberg. Commodities Expensive Equities Cheap Equities Expensive Commodities Cheap Oil Crisis 1973/1974 Gulf Crisis 1990 GFC 2008 Dotcom Bubble Median: 4.0 = 2018 0 1 2 3 4 5 6 7 8 9 10 1970 1976 1982 1988 1994 2000 2006 2012 |
|
|
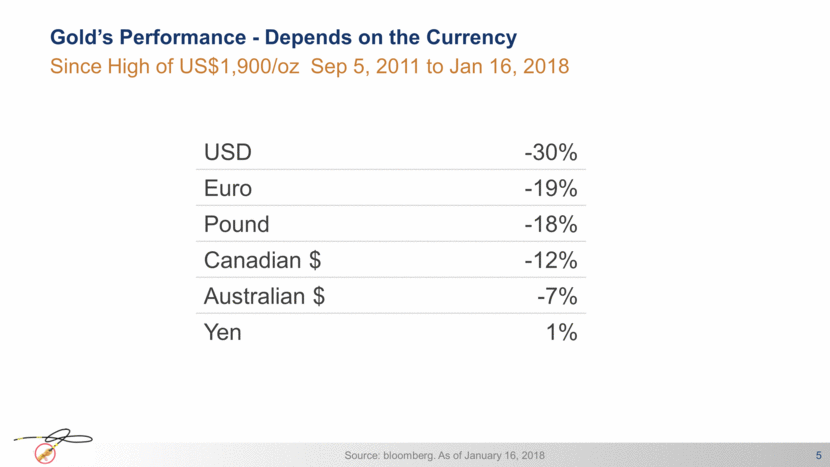
Gold’s Performance - Depends on the Currency 5 USD -30% Euro -19% Pound -18% Canadian $ -12% Australian $ -7% Yen 1% Since High of US$1,900/oz Sep 5, 2011 to Jan 16, 2018 Source: bloomberg. As of January 16, 2018 |
|
|
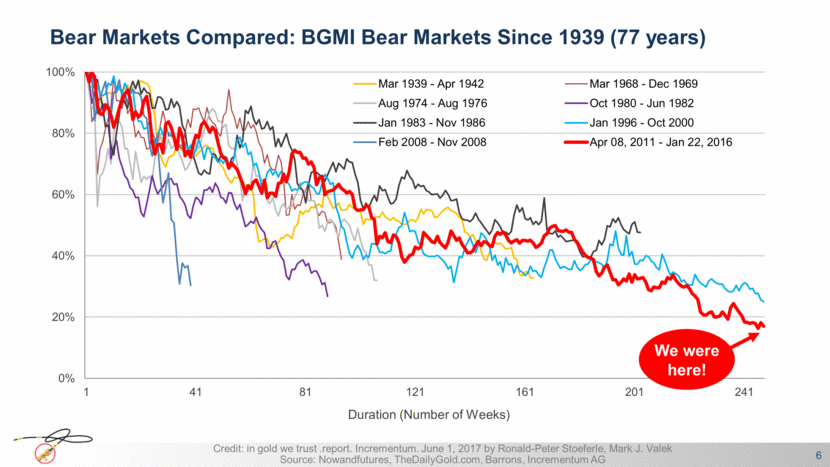
Bear Markets Compared: BGMI Bear Markets Since 1939 (77 years) 6 Credit: in gold we trust .report. Incrementum. June 1, 2017 by Ronald-Peter Stoeferle, Mark J. Valek Source: Nowandfutures, TheDailyGold.com, Barrons, Incrementum AG Duration (Number of Weeks) We were here! 0% 20% 40% 60% 80% 100% 1 41 81 121 161 201 241 Mar 1939 - Apr 1942 Mar 1968 - Dec 1969 Aug 1974 - Aug 1976 Oct 1980 - Jun 1982 Jan 1983 - Nov 1986 Jan 1996 - Oct 2000 Feb 2008 - Nov 2008 Apr 08, 2011 - Jan 22, 2016 |
|
|
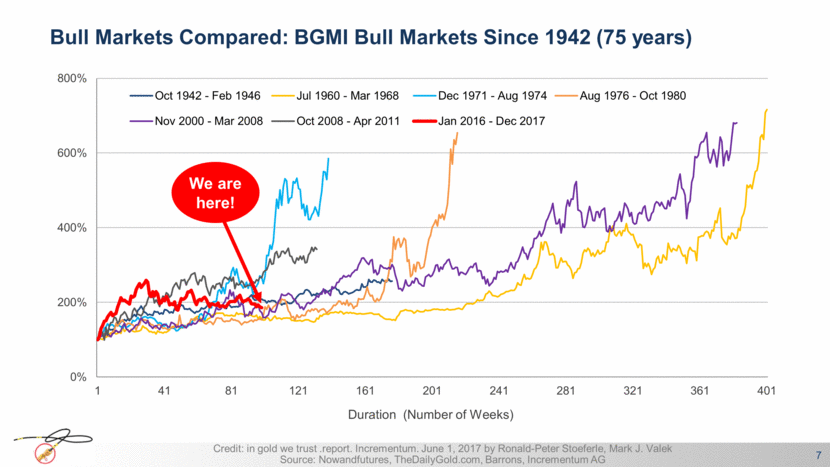
Bull Markets Compared: BGMI Bull Markets Since 1942 (75 years) 7 Credit: in gold we trust .report. Incrementum. June 1, 2017 by Ronald-Peter Stoeferle, Mark J. Valek Source: Nowandfutures, TheDailyGold.com, Barrons, Incrementum AG Duration (Number of Weeks) We are here! 0% 200% 400% 600% 800% 1 41 81 121 161 201 241 281 321 361 401 Oct 1942 - Feb 1946 Jul 1960 - Mar 1968 Dec 1971 - Aug 1974 Aug 1976 - Oct 1980 Nov 2000 - Mar 2008 Oct 2008 - Apr 2011 Jan 2016 - Dec 2017 |
|
|
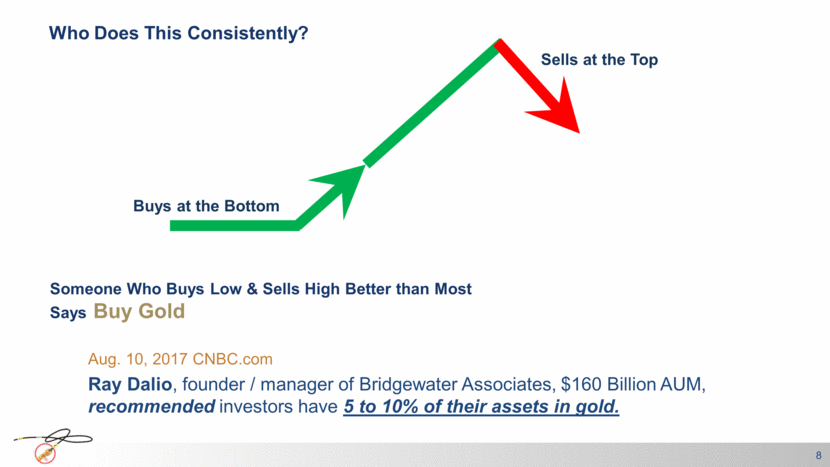
Someone Who Buys Low & Sells High Better than Most Says Buy Gold 8 Aug. 10, 2017 CNBC.com Ray Dalio, founder / manager of Bridgewater Associates, $160 Billion AUM, recommended investors have 5 to 10% of their assets in gold. Buys at the Bottom Sells at the Top Who Does This Consistently? |
|
|
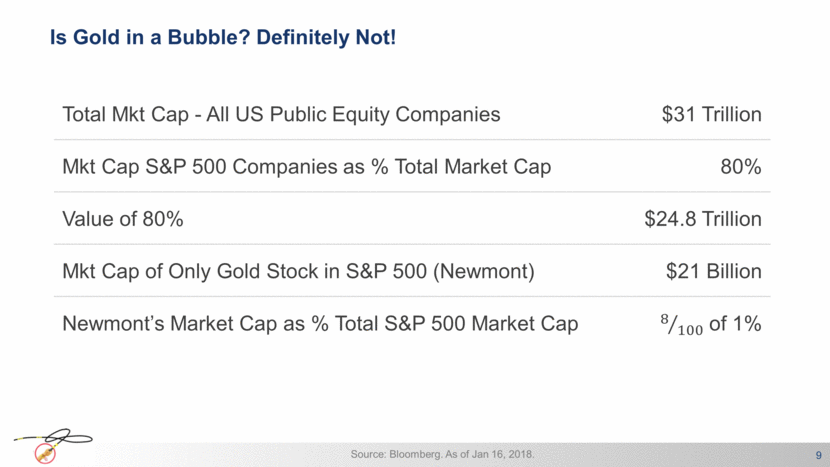
Is Gold in a Bubble? Definitely Not! 9 Total Mkt Cap - All US Public Equity Companies $31 Trillion Mkt Cap S&P 500 Companies as % Total Market Cap 80% Value of 80% $24.8 Trillion Mkt Cap of Only Gold Stock in S&P 500 (Newmont) $21 Billion Newmont’s Market Cap as % Total S&P 500 Market Cap of 1% Total Mkt Cap - All US Public Equity Companies $31 Trillion Mkt Cap S&P 500 Companies as % Total Market Cap 80% Value of 80% $24.8 Trillion Mkt Cap of Only Gold Stock in S&P 500 (Newmont) $21 Billion Newmont’s Market Cap as % Total S&P 500 Market Cap Source: Bloomberg. As of Jan 16, 2018. |
|
|
10 99% of all the precious metal producers in the world are ineligible to be included in the S&P 500 Our Goal is to be in the S&P 500 MUX is Striving to Qualify |
|
|
Cautionary Statement 11 This presentation contains certain forward-looking statements and information, including "forward-looking statements" within the meaning of the Private Securities Litigation Reform Act of 1995. The forward-looking statements and information expressed, as at the date of this presentation, McEwen Mining Inc.'s (the "Company") estimates, forecasts, projections, expectations or beliefs as to future events and results. Forward-looking statements and information are necessarily based upon a number of estimates and assumptions that, while considered reasonable by management, are inherently subject to significant business, economic and competitive uncertainties, risks and contingencies, and there can be no assurance that such statements and information will prove to be accurate. Therefore, actual results and future events could differ materially from those anticipated in such statements and information. Risks and uncertainties that could cause results or future events to differ materially from current expectations expressed or implied by the forward-looking statements and information include, but are not limited to, factors associated with fluctuations in the market price of precious metals, mining industry risks, political, economic, social and security risks associated with foreign operations, the ability of the corporation to receive or receive in a timely manner permits or other approvals required in connection with operations, risks associated with the construction of mining operations and commencement of production and the projected costs thereof, risks related to litigation, the state of the capital markets, environmental risks and hazards, uncertainty as to calculation of mineral resources and reserves, risk of delisting from a public exchange, and other risks. The Company's dividend policy will be reviewed periodically by the Board of Directors and is subject to change based on certain factors such as the capital needs of the Company and its future operating results. Readers should not place undue reliance on forward-looking statements or information included herein, which speak only as of the date hereof. The Company undertakes no obligation to reissue or update forward-looking statements or information as a result of new information or events after the date hereof except as may be required by law. See McEwen Mining's Annual Report on Form 10-K for the fiscal year ended December 31, 2016 and Quarterly Report on Form 10-Q for the quarter ended September 30, 2017, and other filings with the Securities and Exchange Commission, under the caption "Risk Factors", for additional information on risks, uncertainties and other factors relating to the forward-looking statements and information regarding the Company. All forward-looking statements and information made in this presentation are qualified by this cautionary statement. All currency information quoted in U.S. dollars. The technical contents of this presentation has been reviewed and approved by Nathan M. Stubina, Ph.D., P.Eng., FCIM, Managing Director and a Qualified Person as defined by Canadian Securities Administrators National Instrument 43-101 "Standards of Disclosure for Mineral Projects". To see cautionary note regarding NON-GAAP measures, go to www.mcewenmining.com/files/presentation_disclosure.pdf To see MUX reserves and resources table, go to www.mcewenmining.com/Operations/Reserves-and-Resources/default.aspx If you are risk adverse, don’t buy our stock. The past is not a reliable predicator of the future. Unexpected events can change forecasts. |
|
|
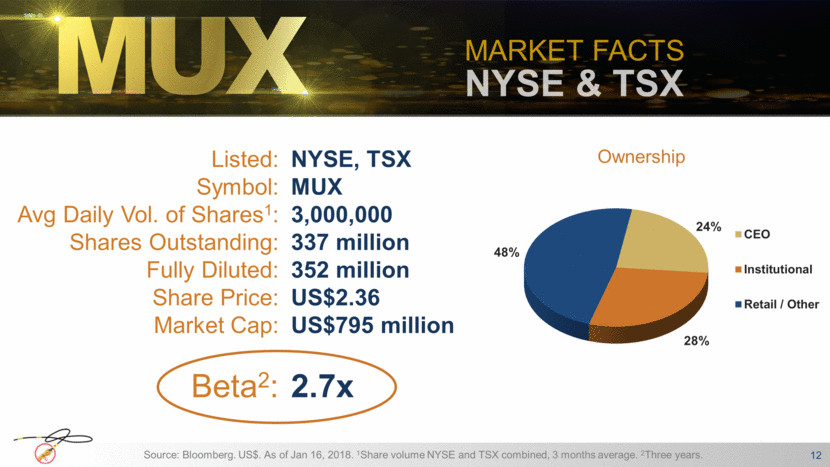
Listed: Symbol: Avg Daily Vol. of Shares1: Shares Outstanding: Fully Diluted: Share Price: Market Cap: Beta2: NYSE, TSX MUX 3,000,000 337 million 352 million US$2.36 US$795 million 2.7x 12 Source: Bloomberg. US$. As of Jan 16, 2018. 1Share volume NYSE and TSX combined, 3 months average. 2Three years. NYSE & TSX MARKET FACTS 24% 28% 48% Ownership CEO Institutional Retail / Other |
|
|
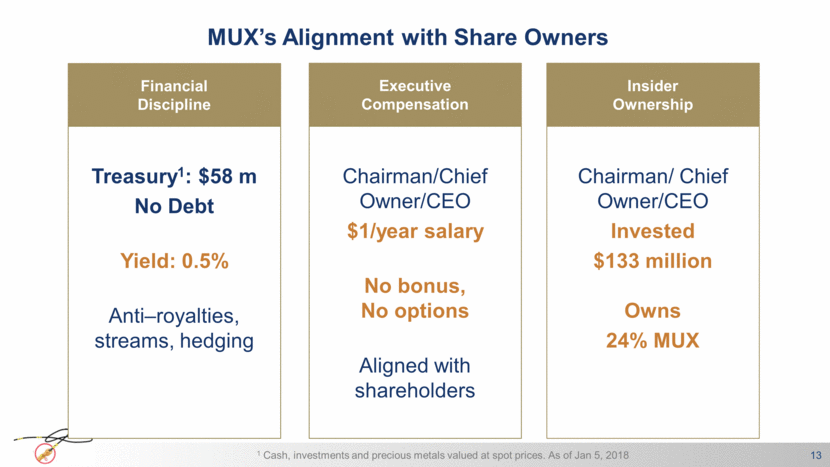
MUX’s Alignment with Share Owners 13 Financial Discipline Treasury1: $58 m No Debt Yield: 0.5% Anti–royalties, streams, hedging Executive Compensation Chairman/Chief Owner/CEO $1/year salary No bonus, No options Aligned with shareholders Insider Ownership Chairman/ Chief Owner/CEO Invested $133 million Owns 24% MUX 1 Cash, investments and precious metals valued at spot prices. As of Jan 5, 2018 |
|
|
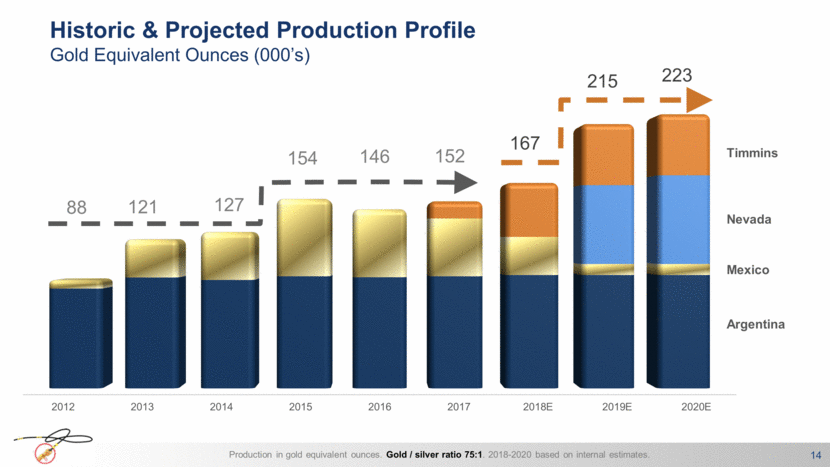
Historic & Projected Production Profile Gold Equivalent Ounces (000’s) 14 154 127 121 88 Production in gold equivalent ounces. Gold / silver ratio 75:1. 2018-2020 based on internal estimates. 152 167 146 215 223 Argentina Mexico Nevada Timmins 2012 2013 2014 2015 2016 2017 2018E 2019E 2020E |
|
|
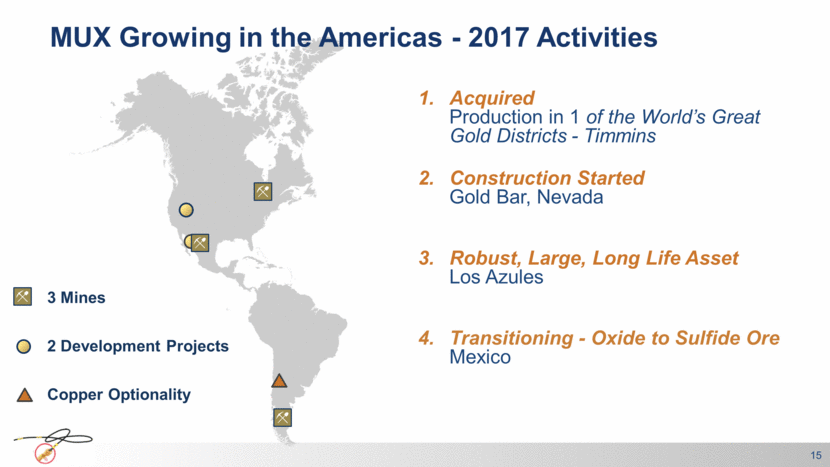
Acquired Production in 1 of the World’s Great Gold Districts - Timmins Construction Started Gold Bar, Nevada Robust, Large, Long Life Asset Los Azules Transitioning - Oxide to Sulfide Ore Mexico 15 3 Mines 2 Development Projects Copper Optionality MUX Growing in the Americas - 2017 Activities |
|
|
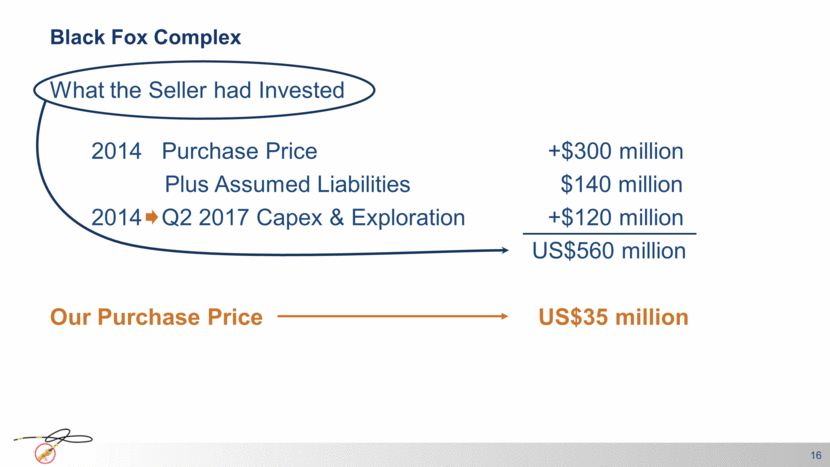
Black Fox Complex 16 What the Seller had Invested 2014 Purchase Price +$300 million Plus Assumed Liabilities $140 million 2014 Q2 2017 Capex & Exploration +$120 million US$560 million Our Purchase Price US$35 million |
|
|
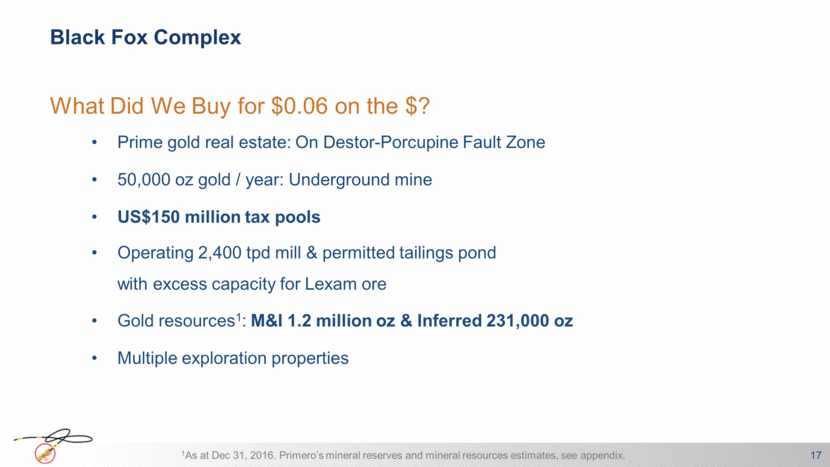
Black Fox Complex 17 1As at Dec 31, 2016. Primero’s mineral reserves and mineral resources estimates, see appendix. What Did We Buy for $0.06 on the $? Prime gold real estate: On Destor-Porcupine Fault Zone 50,000 oz gold / year: Underground mine US$150 million tax pools Operating 2,400 tpd mill & permitted tailings pond with excess capacity for Lexam ore Gold resources1: M&I 1.2 million oz & Inferred 231,000 oz Multiple exploration properties |
|
|
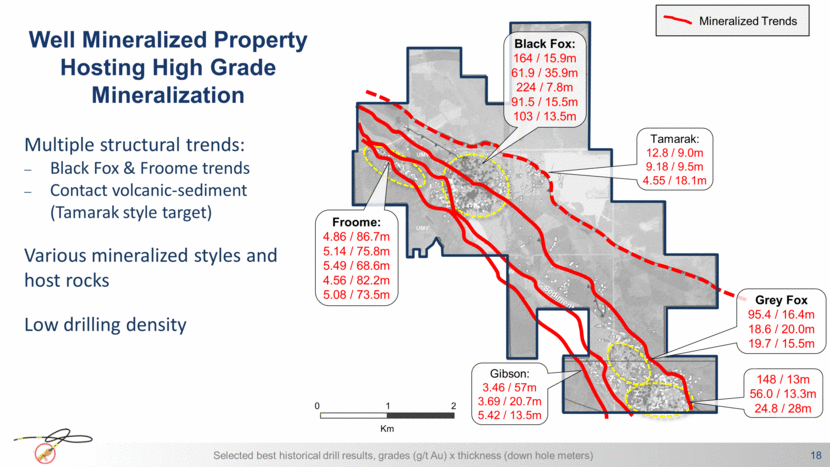
18 Well Mineralized Property Hosting High Grade Mineralization Multiple structural trends: Black Fox & Froome trends Contact volcanic-sediment (Tamarak style target) Various mineralized styles and host rocks Low drilling density Sediment Km 2 0 1 Black Fox: 164 / 15.9m 61.9 / 35.9m 224 / 7.8m 91.5 / 15.5m 103 / 13.5m Froome: 4.86 / 86.7m 5.14 / 75.8m 5.49 / 68.6m 4.56 / 82.2m 5.08 / 73.5m Tamarak: 12.8 / 9.0m 9.18 / 9.5m 4.55 / 18.1m 148 / 13m 56.0 / 13.3m 24.8 / 28m Gibson: 3.46 / 57m 3.69 / 20.7m 5.42 / 13.5m Grey Fox 95.4 / 16.4m 18.6 / 20.0m 19.7 / 15.5m Selected best historical drill results, grades (g/t Au) x thickness (down hole meters) Mineralized Trends |
|
|
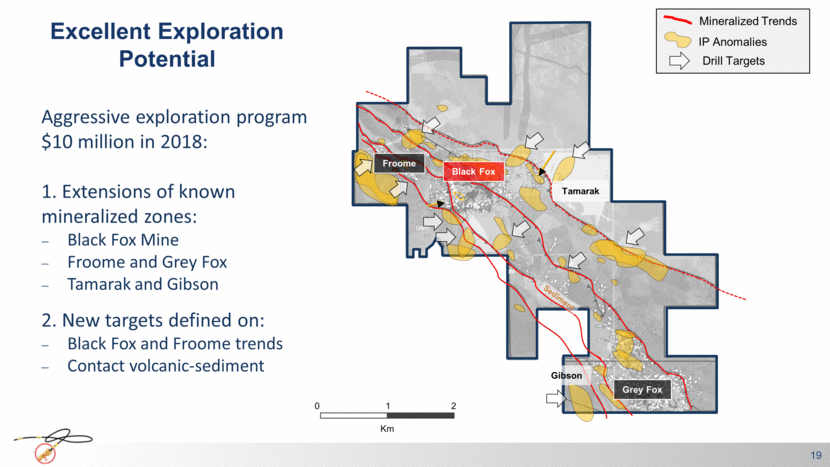
19 Excellent Exploration Potential Aggressive exploration program $10 million in 2018: 1. Extensions of known mineralized zones: Black Fox Mine Froome and Grey Fox Tamarak and Gibson 2. New targets defined on: Black Fox and Froome trends Contact volcanic-sediment Sediment Tamarak Froome Grey Fox Gibson Black Fox Drill Targets IP Anomalies Mineralized Trends Km 2 0 1 |
|
|
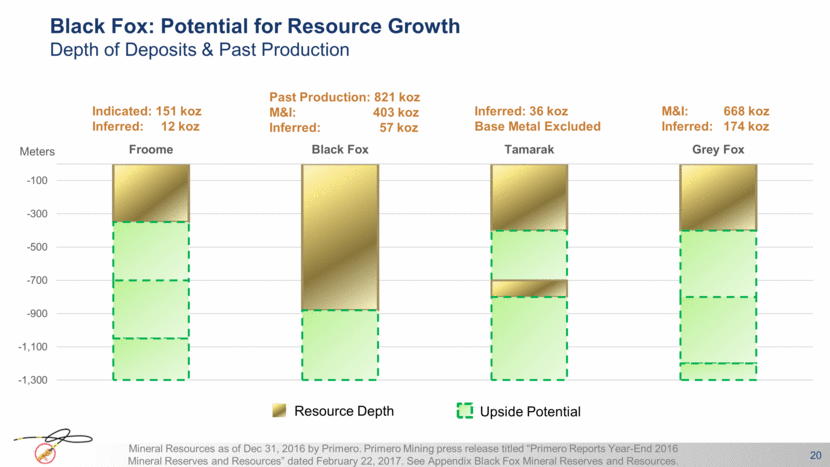
Black Fox: Potential for Resource Growth Depth of Deposits & Past Production 20 Meters Indicated: 151 koz Inferred: 12 koz Resource Depth M&I: 668 koz Inferred: 174 koz Past Production: 821 koz M&I: 403 koz Inferred: 57 koz Inferred: 36 koz Base Metal Excluded Mineral Resources as of Dec 31, 2016 by Primero. Primero Mining press release titled “Primero Reports Year-End 2016 Mineral Reserves and Resources” dated February 22, 2017. See Appendix Black Fox Mineral Reserves and Resources. Upside Potential -1,300 -1,100 -900 -700 -500 -300 -100 Froome Black Fox Tamarak Grey Fox |
|
|
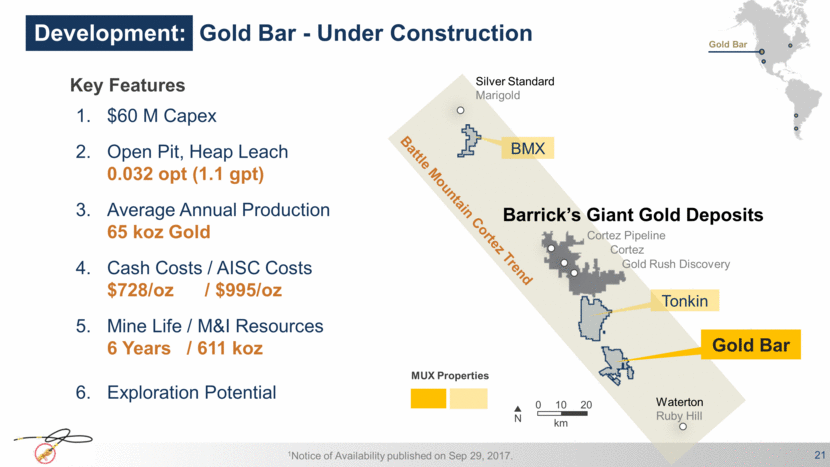
Tonkin Gold Bar BMX Cortez Silver Standard Marigold Waterton Ruby Hill Battle Mountain Cortez Trend Cortez Pipeline Gold Rush Discovery 0 10 20 km N 21 Barrick’s Giant Gold Deposits $60 M Capex Open Pit, Heap Leach 0.032 opt (1.1 gpt) Average Annual Production 65 koz Gold Cash Costs / AISC Costs $728/oz / $995/oz Mine Life / M&I Resources 6 Years / 611 koz Exploration Potential Key Features 1Notice of Availability published on Sep 29, 2017. MUX Properties Gold Bar Development: Gold Bar - Under Construction |
|
|
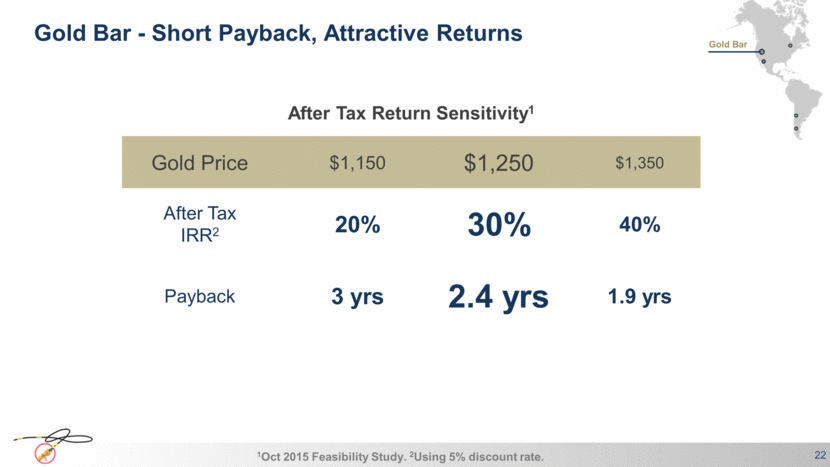
Gold Bar - Short Payback, Attractive Returns 22 Gold Price $1,150 $1,250 $1,350 After Tax IRR2 20% 30% 40% Payback 3 yrs 2.4 yrs 1.9 yrs After Tax Return Sensitivity1 1Oct 2015 Feasibility Study. 2Using 5% discount rate. Gold Bar |
|
|
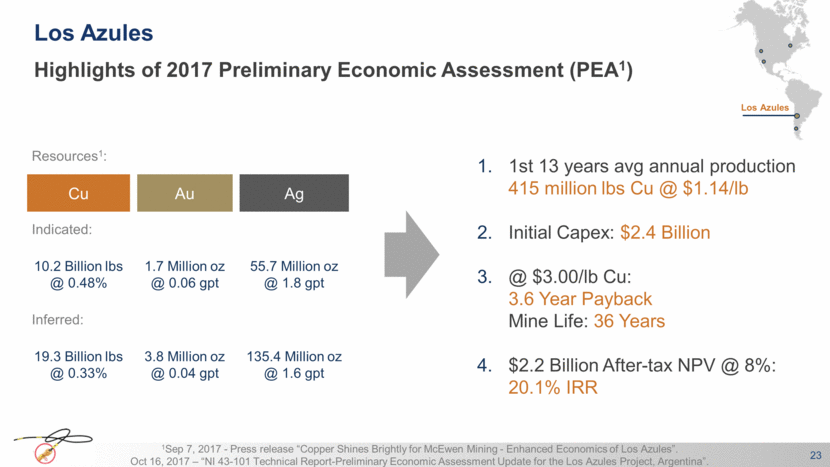
23 1st 13 years avg annual production 415 million lbs Cu @ $1.14/lb Initial Capex: $2.4 Billion @ $3.00/lb Cu: 3.6 Year Payback Mine Life: 36 Years $2.2 Billion After-tax NPV @ 8%: 20.1% IRR Highlights of 2017 Preliminary Economic Assessment (PEA1) 1Sep 7, 2017 - Press release “Copper Shines Brightly for McEwen Mining - Enhanced Economics of Los Azules”. Oct 16, 2017 – “NI 43-101 Technical Report-Preliminary Economic Assessment Update for the Los Azules Project, Argentina”. Los Azules Resources1: Cu Au Ag Indicated: 10.2 Billion lbs @ 0.48% 1.7 Million oz @ 0.06 gpt 55.7 Million oz @ 1.8 gpt Inferred: 19.3 Billion lbs @ 0.33% 3.8 Million oz @ 0.04 gpt 135.4 Million oz @ 1.6 gpt Los Azules |
|
|
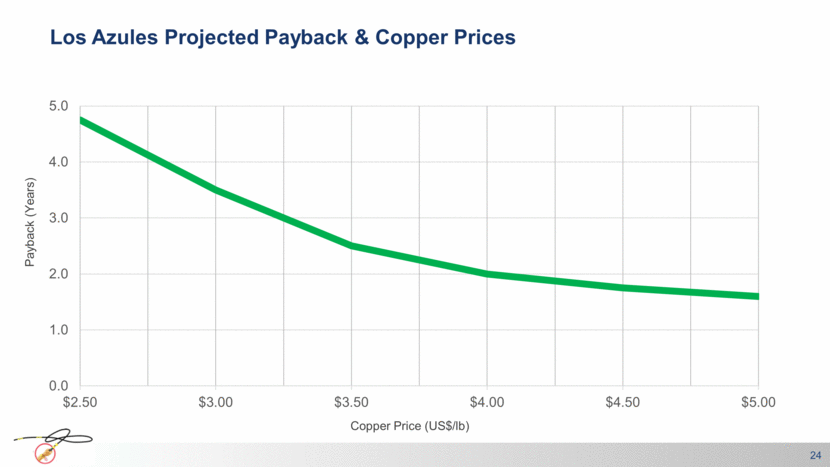
Los Azules Projected Payback & Copper Prices 24 Payback (Years) Copper Price (US$/lb) |
|
|
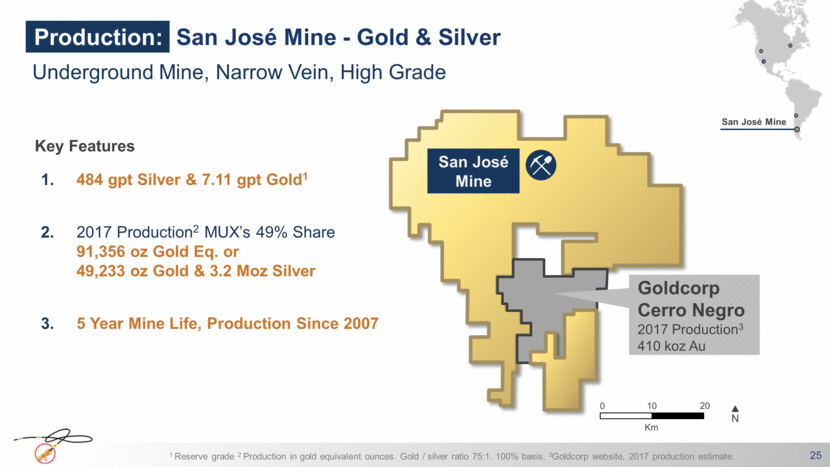
Production: San José Mine - Gold & Silver 25 1 Reserve grade 2 Production in gold equivalent ounces. Gold / silver ratio 75:1. 100% basis. 3Goldcorp website, 2017 production estimate. Underground Mine, Narrow Vein, High Grade 484 gpt Silver & 7.11 gpt Gold1 2017 Production2 MUX’s 49% Share 91,356 oz Gold Eq. or 49,233 oz Gold & 3.2 Moz Silver 5 Year Mine Life, Production Since 2007 San José Mine N 10 Km 0 20 Goldcorp Cerro Negro 2017 Production3 410 koz Au Key Features San José Mine |
|
|
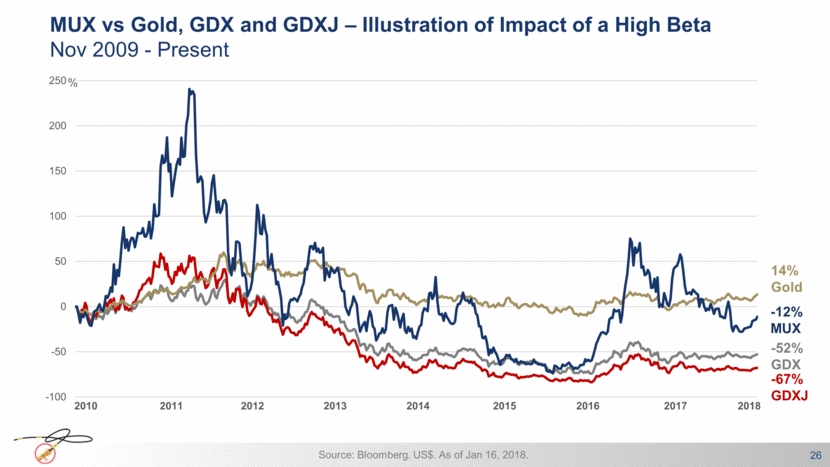
MUX vs Gold, GDX and GDXJ – Illustration of Impact of a High Beta Nov 2009 - Present 26 2010 2011 2012 2013 2014 2015 2016 2017 Source: Bloomberg. US$. As of Jan 16, 2018. % -52% GDX -12% MUX 14% Gold -67% GDXJ 2018 -100 -50 0 50 100 150 200 250 |
|
|
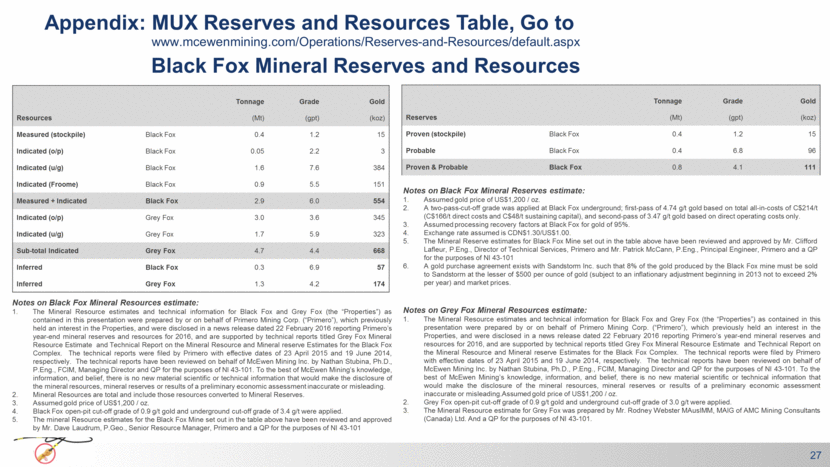
Appendix: MUX Reserves and Resources Table, Go to 27 Notes on Black Fox Mineral Reserves estimate: Assumed gold price of US$1,200 / oz. A two-pass-cut-off grade was applied at Black Fox underground; first-pass of 4.74 g/t gold based on total all-in-costs of C$214/t (C$166/t direct costs and C$48/t sustaining capital), and second-pass of 3.47 g/t gold based on direct operating costs only. Assumed processing recovery factors at Black Fox for gold of 95%. Exchange rate assumed is CDN$1.30/US$1.00. The Mineral Reserve estimates for Black Fox Mine set out in the table above have been reviewed and approved by Mr. Clifford Lafleur, P.Eng., Director of Technical Services, Primero and Mr. Patrick McCann, P.Eng., Principal Engineer, Primero and a QP for the purposes of NI 43-101 A gold purchase agreement exists with Sandstorm Inc. such that 8% of the gold produced by the Black Fox mine must be sold to Sandstorm at the lesser of $500 per ounce of gold (subject to an inflationary adjustment beginning in 2013 not to exceed 2% per year) and market prices. Resources Tonnage (Mt) Grade (gpt) Gold (koz) Measured (stockpile) Black Fox 0.4 1.2 15 Indicated (o/p) Black Fox 0.05 2.2 3 Indicated (u/g) Black Fox 1.6 7.6 384 Indicated (Froome) Black Fox 0.9 5.5 151 Measured + Indicated Black Fox 2.9 6.0 554 Indicated (o/p) Grey Fox 3.0 3.6 345 Indicated (u/g) Grey Fox 1.7 5.9 323 Sub-total Indicated Grey Fox 4.7 4.4 668 Inferred Black Fox 0.3 6.9 57 Inferred Grey Fox 1.3 4.2 174 Reserves Tonnage (Mt) Grade (gpt) Gold (koz) Proven (stockpile) Black Fox 0.4 1.2 15 Probable Black Fox 0.4 6.8 96 Proven & Probable Black Fox 0.8 4.1 111 Notes on Black Fox Mineral Resources estimate: The Mineral Resource estimates and technical information for Black Fox and Grey Fox (the “Properties”) as contained in this presentation were prepared by or on behalf of Primero Mining Corp. (“Primero”), which previously held an interest in the Properties, and were disclosed in a news release dated 22 February 2016 reporting Primero’s year-end mineral reserves and resources for 2016, and are supported by technical reports titled Grey Fox Mineral Resource Estimate and Technical Report on the Mineral Resource and Mineral reserve Estimates for the Black Fox Complex. The technical reports were filed by Primero with effective dates of 23 April 2015 and 19 June 2014, respectively. The technical reports have been reviewed on behalf of McEwen Mining Inc. by Nathan Stubina, Ph.D., P.Eng., FCIM, Managing Director and QP for the purposes of NI 43-101. To the best of McEwen Mining’s knowledge, information, and belief, there is no new material scientific or technical information that would make the disclosure of the mineral resources, mineral reserves or results of a preliminary economic assessment inaccurate or misleading. Mineral Resources are total and include those resources converted to Mineral Reserves. Assumed gold price of US$1,200 / oz. Black Fox open-pit cut-off grade of 0.9 g/t gold and underground cut-off grade of 3.4 g/t were applied. The mineral Resource estimates for the Black Fox Mine set out in the table above have been reviewed and approved by Mr. Dave Laudrum, P.Geo., Senior Resource Manager, Primero and a QP for the purposes of NI 43-101 Notes on Grey Fox Mineral Resources estimate: The Mineral Resource estimates and technical information for Black Fox and Grey Fox (the “Properties”) as contained in this presentation were prepared by or on behalf of Primero Mining Corp. (“Primero”), which previously held an interest in the Properties, and were disclosed in a news release dated 22 February 2016 reporting Primero’s year-end mineral reserves and resources for 2016, and are supported by technical reports titled Grey Fox Mineral Resource Estimate and Technical Report on the Mineral Resource and Mineral reserve Estimates for the Black Fox Complex. The technical reports were filed by Primero with effective dates of 23 April 2015 and 19 June 2014, respectively. The technical reports have been reviewed on behalf of McEwen Mining Inc. by Nathan Stubina, Ph.D., P.Eng., FCIM, Managing Director and QP for the purposes of NI 43-101. To the best of McEwen Mining’s knowledge, information, and belief, there is no new material scientific or technical information that would make the disclosure of the mineral resources, mineral reserves or results of a preliminary economic assessment inaccurate or misleading.Assumed gold price of US$1,200 / oz. Grey Fox open-pit cut-off grade of 0.9 g/t gold and underground cut-off grade of 3.0 g/t were applied. The Mineral Resource estimate for Grey Fox was prepared by Mr. Rodney Webster MAusIMM, MAIG of AMC Mining Consultants (Canada) Ltd. And a QP for the purposes of NI 43-101. Black Fox Mineral Reserves and Resources www.mcewenmining.com/Operations/Reserves-and-Resources/default.aspx |

