Attached files
| file | filename |
|---|---|
| 8-K - FORM 8-K - HMS HOLDINGS CORP | f8k_010818.htm |
Exhibit 99.1

J.P. MORGAN 36 th ANNUAL HEALTHCARE CONFERENCE J.P. MORGAN 36 TH ANNUAL HEALTHCARE CONFERENCE Bill Lucia, Chairman & CEO January 8, 2018
J.P. MORGAN 36 th ANNUAL HEALTHCARE CONFERENCE DISCLAIMERS FORWARD - LOOKING STATEMENTS . This presentation contains "forward - looking statements" within the meaning of the U . S . Private Securities Litigation Reform Act of 1995 . Such statements relate to our current expectations, projections and assumptions about our business, the economy and future events or conditions . They do not relate strictly to historical or current facts . Forward - looking statements can be identified by words such as “aims,” “anticipates,” “believes,” “estimates,” “expects,” “forecasts,” “intends,” “likely,” “may,” “plans,” “projects,” “seeks,” “targets,” “will,” “would,” “could,” “should,” and similar expressions and references to guidance, although some forward - looking statements may be expressed differently . In particular, these include statements relating to future actions, business plans, objectives and prospects, future operating or financial performance, and specifically include information found in the slides “Increased Throughput for Payment Integrity,” “Sources of Margin Expansion,” “Strong Cash Flow Model” and “Broad Strategic Themes for 2018 . ” Factors or events that could cause actual results to differ may emerge from time to time and are difficult to predict . Should known or unknown risks or uncertainties materialize, or should underlying assumptions prove inaccurate, actual results may differ materially from past results and those anticipated, estimated or projected . We caution you not to place undue reliance upon any of these forward - looking statements . Factors that could cause or contribute to such differences, include, but are not limited to : our ability to execute our business plans or growth strategy ; our ability to innovate, develop or implement new or enhanced solutions or services ; the nature of investment and acquisition opportunities we are pursuing, and the successful execution of such investments and acquisitions ; our ability to successfully integrate acquired businesses and realize synergies ; variations in our results of operations ; our ability to accurately forecast the revenue under our contracts and solutions ; our ability to protect our systems from damage, interruption or breach, and to maintain effective information and technology systems and networks ; our ability to protect our intellectual property rights, proprietary technology, information processes, and know - how ; significant competition for our solutions and services ; our failure to maintain a high level of customer retention or the unexpected reduction in scope or termination of key contracts with major customers ; customer dissatisfaction, our non - compliance with contractual provisions or regulatory requirements ; our failure to meet performance standards triggering significant costs or liabilities under our contracts ; our inability to manage our relationships with information and data sources and suppliers ; reliance on subcontractors and other third party providers and parties to perform services ; our ability to continue to secure contracts and favorable contract terms through the competitive bidding process and to prevail in protests or challenges to contract awards ; pending or threatened litigation ; unfavorable outcomes in legal proceedings ; our success in attracting qualified employees and members of our management team ; our ability to generate sufficient cash to cover our interest and principal payments under our credit facility or to borrow, obtain financing, maintain liquidity or use credit ; unexpected changes in our effective tax rates ; unanticipated increases in the number or amount of claims for which we are self - insured ; our ability to successfully remediate material weaknesses in our internal control over financial reporting ; changes in the U . S . healthcare environment or healthcare financing system, including regulatory, budgetary or political actions that affect procurement practices and healthcare spending ; our failure to comply with applicable laws and regulations governing individual privacy and information security or to protect such information from theft and misuse ; negative results of government or customer reviews, audits or investigations ; state or federal limitations related to outsourcing or certain government programs or functions ; restrictions on bidding or performing certain work due to perceived conflicts of interests ; the market price of our common stock and lack of dividend payments ; anti - takeover provisions in our corporate governance documents ; and other factors, risks and uncertainties described in our most recent Annual Report on Form 10 - K and in our other filings with the Securities and Exchange Commission . Any forward - looking statements are made as of the date of this presentation . Except as may be required by law, we disclaim any obligation to publicly update forward - looking statements, whether as a result of new information, future events or otherwise . NON - GAAP FINANCIAL INFORMATION . This presentation contains certain non - GAAP measures . These non - GAAP measures, as calculated by the Company, are not necessarily comparable to similarly titled measures reported by other companies . Additionally, these non - GAAP measures are not measurements of financial performance or liquidity under GAAP and should not be considered alternatives to the Company's other financial information determined under GAAP . See slide 35 for definitions and reconciliations of certain non - GAAP measures . MARKET AND INDUSTRY DATA . This presentation contains market and industry data and forecasts that have been obtained from publicly available information, various industry publications, other published industry sources and our internal data and estimates . We have not independently verified the information and cannot make any representation as to the accuracy or completeness of such information . None of the reports and other materials of third party sources referred to in this presentation were prepared for use in, or in connection with, this presentation . Our internal data and estimates are based upon information obtained from our customers, our partners, trade and business organizations, publicly available information and other contacts in the markets in which we operate and our management’s understanding of industry conditions . Estimates are difficult to develop and inherently uncertain and we cannot assure you that they are accurate . Our estimates involve risks and uncertainties and are subject to change based on various factors, including those discussed above .

J.P. MORGAN 36 th ANNUAL HEALTHCARE CONFERENCE PRESENTATION OUTLINE Business Overview and Market Opportunity 4 - 5 Key Assets ▪ Data ▪ Analytics ▪ Customers ▪ In - house Expertise 6 - 10 Growth Tailwinds ▪ Favorable Macro Environment ▪ Heritage COB Business ▪ Increased Throughput in Payment Integrity Business ▪ New Care Management & Consumer Engagement Vertical ▪ Understanding and Effectively Reaching Consumers 11 - 16 Going Forward ▪ Margins ▪ Financial Strength ▪ Strategic Direction 17 - 20 Conclusion 21 - 22 Appendix 23 - 35
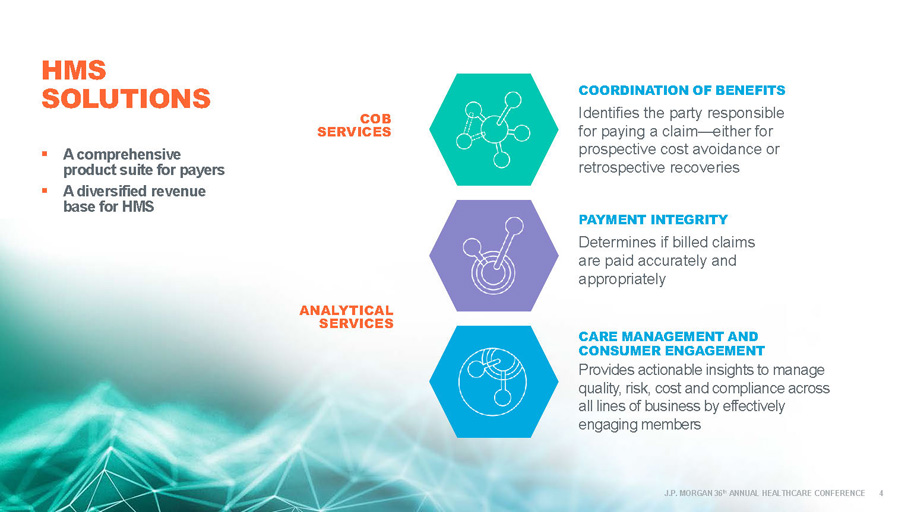
J.P. MORGAN 36 th ANNUAL HEALTHCARE CONFERENCE COB SERVICES ▪ A comprehensive product s uite for payers ▪ A diversified r evenue b ase for HMS COORDINATION OF BENEFITS Identifies the party responsible for paying a claim — either for prospective cost avoidance or retrospective recoveries PAYMENT INTEGRITY Determines if billed claims are paid accurately and appropriately CARE MANAGEMENT AND CONSUMER ENGAGEMENT Provides actionable insights to manage quality, risk, cost and compliance across all lines of business by effectively engaging members ANALYTICAL SERVICES HMS SOLUTIONS 4

J.P. MORGAN 36 th ANNUAL HEALTHCARE CONFERENCE 1 Inclusive of unnecessary services, service delivery inefficiency, excess administrative costs, overpricing, missed prevention op portunities. Sources: Harvard Business Review , “ How the U.S. Can Reduce Waste in Health Care Spending by $1 Trillion ” (October 13, 2015), and Journal of the American Medical Association , " Eliminating Waste in US Healthcare ” (April 2012) HMS now has expanded solutions, offering customers a full suite of services and tools to address: ▪ Payment errors ▪ Missed prevention opportunities ▪ Unnecessary services ▪ Inefficiencies in service delivery ▪ Excessive administrative costs ▪ Ineffective member outreach TACKLING THE ESTIMATED $1 TRILLION HEALTHCARE TAM EXPANSIVE MARKET OPPORTUNITY 5 1

J.P. MORGAN 36 th ANNUAL HEALTHCARE CONFERENCE HMS KEY ASSETS DATA ANALYTICS J.P MORGAN 36 th ANNUAL HEALTHCARE CONFERENCE 6 IN - HOUSE EXPERTISE CUSTOMERS

OUR DATA SOURCES Unique lives – health coverage information >300M P etabytes of data >7 >1.4B E ligibility coverage segments ( current/historical ) >3B P aid claim records received annually T rading partners for COB ( health plans, TPAs, PBMs, etc .) >1,250 Medicaid lives in customer eligibility files >90% Note: statistics are as of 9/30/17 J.P MORGAN 36 th ANNUAL HEALTHCARE CONFERENCE 7
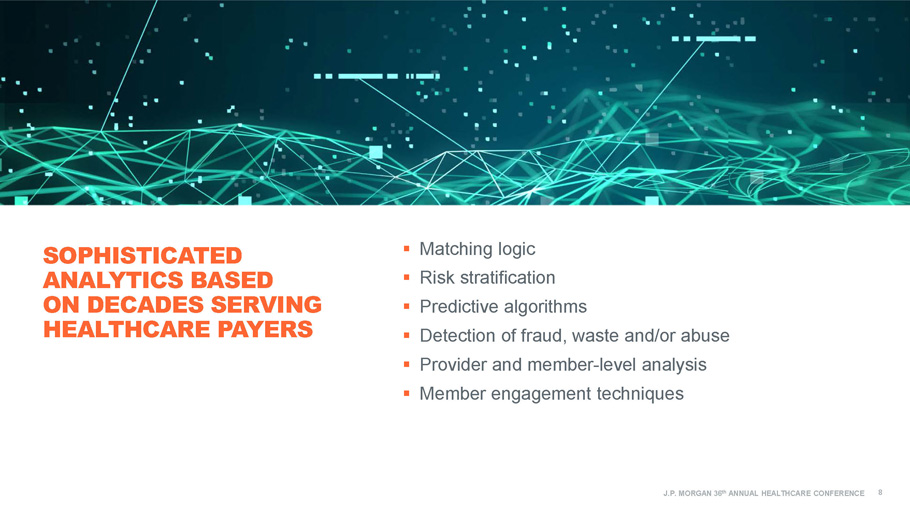
J.P. MORGAN 36 th ANNUAL HEALTHCARE CONFERENCE SOPHISTICATED ANALYTICS BASED ON DECADES SERVING HEALTHCARE PAYERS ▪ Matching logic ▪ Risk stratification ▪ Predictive algorithms ▪ Detection of fraud, waste and/or abuse ▪ Provider and member - level analysis ▪ Member engagement techniques 8

J.P. MORGAN 36 th ANNUAL HEALTHCARE CONFERENCE ~ 325 40+ >225 EXTENSIVE NATIONAL CUSTOMER BASE ▪ PBMs, TPAs and dozens of other risk - bearing entities including IPAs, hospital systems, ACOs and specialty care organizations ▪ Health Plans ▪ State M edicaid Programs ▪ Employers ▪ CMS, CDC and Department of Veterans Affairs 1 Including 23 of the top 25 health plans nationally , based on membership 2 Direct employer relationships to perform dependent eligibility audits 9 1 2

J.P. MORGAN 36 th ANNUAL HEALTHCARE CONFERENCE DEEP EXPERTISE ▪ Nationally acclaimed technology team that includes more than 1,000 data , analytics, engineering, infrastructure and security experts 1 ▪ Over 350 clinical experts including full - time medical directors, registered nurses and certified coders, supported by a panel of more than 700 credentialed physicians and ancillary providers in our contracted review networks that provide geographic and specialty coverage for all types of reviews 1 1 Includes full - time, part - time and contract employees 2 HMS is certified by the Health Information Trust Alliance (HITRUST ), which established the Common Security Framework (CSF) for organizations that create, access, store or exchange personal healt h a nd financial information 3 The annual Healthcare Informatics vendor ranking features global information technology suppliers that derive more than one t hir d of their revenue from healthcare payer and/or provider institutions 4 IDC ranking of companies with highest revenue derived from healthcare IT products and services in the U.S. during the past year ▪ 2017 Recognition and Awards include : ▪ certification 2 3 10 HealthTech top 50 ranking 4
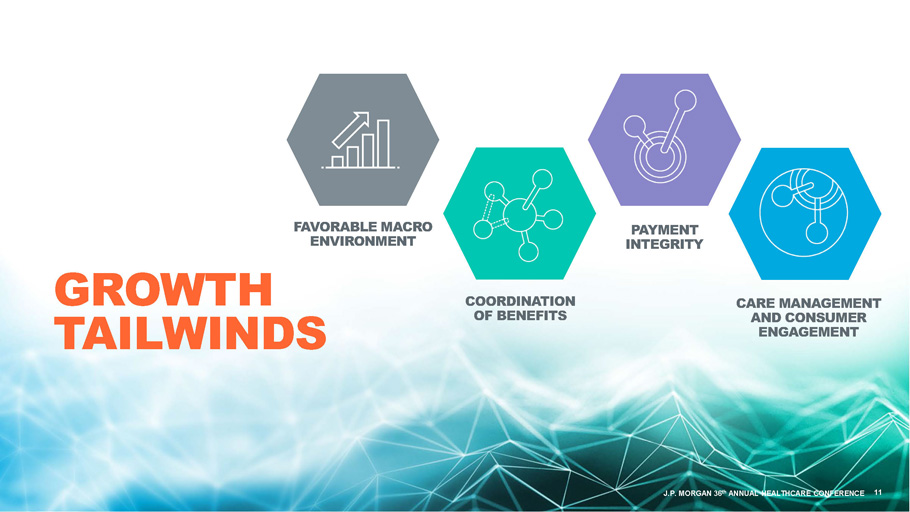
J.P. MORGAN 36 th ANNUAL HEALTHCARE CONFERENCE FAVORABLE MACRO ENVIRONMENT PAYMENT INTEGRITY CARE MANAGEMENT AND CONSUMER ENGAGEMENT GROWTH TAILWINDS COORDINATION OF BENEFITS 11 J.P. MORGAN 36 th ANNUAL HEALTHCARE CONFERENCE

J.P. MORGAN 36 th ANNUAL HEALTHCARE CONFERENCE FAVORABLE MACRO ENVIRONMENT ▪ Aging population with high - cost, chronic conditions 1 ▪ From 2016 to 2025, Medicare is projected to grow 28% in enrollment and 88% in spending 2 ▪ Medicaid expenditures are projected to grow 64 % from 2016 to 2025 3 ▪ Government program payment error rates remain high at ~10% 4 ▪ More than half of the U.S. population is projected to remain covered by employer - sponsored plans 5 ▪ Increased healthcare industry focus on improved population health, enhanced consumer outcomes and experience, and reduced costs 6 1 National Council on Aging, “ Fact Sheet: Chronic Disease Self - Management ” (December 2016) 2 Medicare enrollment of 72 million is expected to cost $1,277.8T by 2025. Source: CMS Office of the Actuary National Health Expenditures , Projection Table 17 (March 2017) 3 Medicaid projected to cost $929B by 2026. Source: CMS Office of the Actuary National Health Expenditures , Projection Table 17 (March 2017) 4 As of January 2018, the Medicaid improper payment rate was reported as 10.1% and the Medicare FFS improper payment rate was 9 .5 1%. Source: PaymentAccuracy.gov 5 175.5 million employees/dependents were covered by employer - sponsored insurance during plan year 2017; that number is expected to remain relatively stable through 2025. Source : CMS Office of the Actuary National Health Expenditures , Projection Table 17 (March 2017) 6 Institute for Healthcare Improvement, www.ihi.org/Topics/TripleAim 12

J.P. MORGAN 36 th ANNUAL HEALTHCARE CONFERENCE COORDINATION OF BENEFITS – OUR HERITAGE BUSINESS 1 ▪ Medicaid is federally mandated as “ payer of last resort ” 2 ▪ Substantial churn in the Medicaid population 3 ▪ Unparalleled data warehouse and sophisticated matching algorithms – key competitive advantages ▪ High ROI for customers ▪ Constant innovation leads to ongoing yield improvements ▪ 74% of total company revenue through Q3’17, with strong margins and cash flow 4 1 HMS has been in the COB business for more than 30 years. 2 Pursuant to Title XIX, Section 1902(a)(25) of the Social Security Act 3 Nearly 36% of people enrolled in Medicaid participate between one and 12 months. Source: US Census Bureau, “ 21.3 Percent of U.S. Population Participates in Government Assistance Programs Each Month ,” Release #CB14 - 97 (May 28, 2015) 4 $277.1 million of $372.7 total company revenue through Q3’17 and is up ~7% YOY compared to first 9 months of 2016 13

J.P. MORGAN 36 th ANNUAL HEALTHCARE CONFERENCE INCREASED THROUGHPUT FOR PAYMENT INTEGRITY ▪ Ongoing process improvements designed to shorten typical PI implementation time and increase the total number of PI implementations ▪ Plans in place to reduce implementation inventory of sold PI business during 2018 ▪ Enhanced use of analytics resulted in substantial increases in medical record requests and findings during Q4’17 ▪ Doubled the productivity of coders and nurse reviewers during 2017 using artificial intelligence, machine learning and natural language processing 14

J.P. MORGAN 36 th ANNUAL HEALTHCARE CONFERENCE ESSETTE & ELIZA ▪ Leveraging HMS data and analytics to produce population risk intelligence ▪ Better management of costs, clinical outcomes and the member experience for customers ▪ Recurring revenue model expands diversification A New Care Management and Consumer Engagement Vertical Created via A cquisition 15 Health Engagement Management
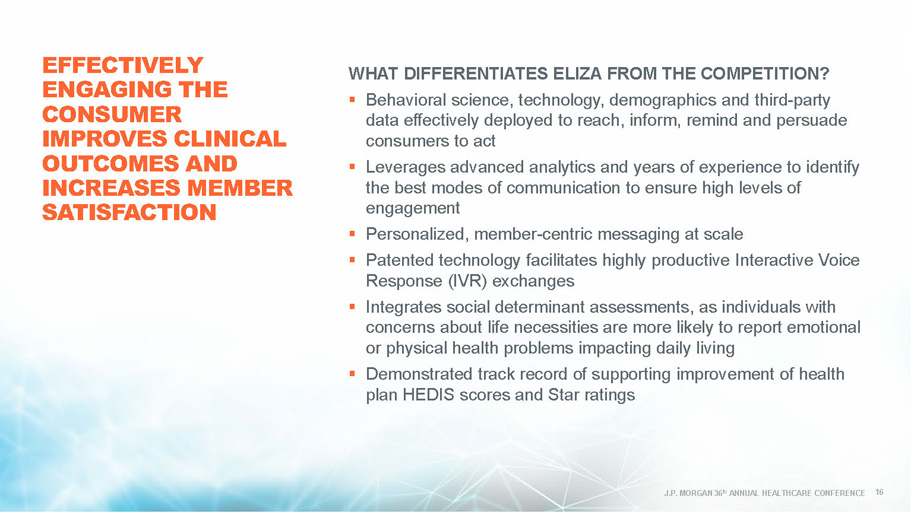
J.P. MORGAN 36 th ANNUAL HEALTHCARE CONFERENCE EFFECTIVELY ENGAGING THE CONSUMER IMPROVES CLINICAL OUTCOMES AND INCREASES MEMBER SATISFACTION WHAT DIFFERENTIATES ELIZA FROM THE COMPETITION? ▪ Behavioral science, technology, demographics and third - party data effectively deployed to reach, inform, remind and persuade consumers to act ▪ Leverages advanced analytics and years of experience to identify the best modes of communication to ensure high levels of engagement ▪ Personalized, member - centric messaging at scale ▪ Patented technology facilitates highly productive Interactive Voice Response (IVR) exchanges ▪ Integrates social determinant assessments, as individuals with concerns about life necessities are more likely to report emotional or physical health problems impacting daily living ▪ Demonstrated track record of supporting improvement of health plan HEDIS scores and Star ratings 16

J.P. MORGAN 36 th ANNUAL HEALTHCARE CONFERENCE FINANCIAL STRENGTH STRATEGIC DIRECTION MARGINS GOING FORWARD 17 J.P. MORGAN 36 th ANNUAL HEALTHCARE CONFERENCE

J.P. MORGAN 36 th ANNUAL HEALTHCARE CONFERENCE ▪ Process automation – machine learning and big data solutions continue to increase efficiency ▪ Ongoing investment to streamline and improve IT infrastructure ▪ Scalable business model – incremental revenue has higher contribution margins than the company average ▪ Growing percentage of subscription type revenue for Eliza engagement solutions should enhance margins 18 SOURCES OF MARGIN EXPANSION
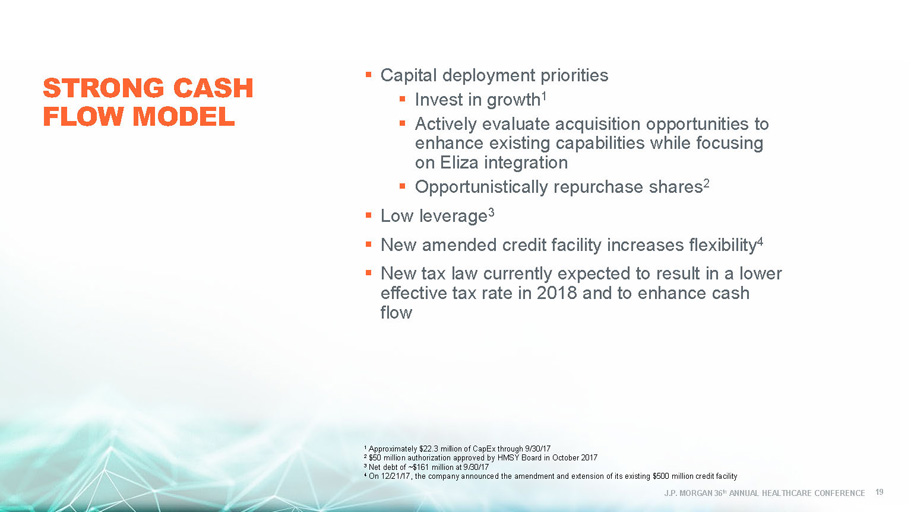
J.P. MORGAN 36 th ANNUAL HEALTHCARE CONFERENCE ▪ Capital deployment priorities ▪ Invest in growth 1 ▪ Actively evaluate acquisition opportunities to enhance existing capabilities while focusing on Eliza integration ▪ Opportunistically repurchase shares 2 ▪ Low leverage 3 ▪ New amended credit facility increases flexibility 4 ▪ New tax law currently expected to result in a lower effective tax rate in 2018 and to enhance cash flow 1 Approximately $22.3 million of CapEx through 9/30/17 2 $50 million authorization approved by HMSY Board in October 2017 3 Net debt of ~$161 million at 9/30/17 4 On 12/21/17, the company announced the amendment and extension of its existing $500 million credit facility 19 STRONG CASH FLOW MODEL J.P. MORGAN 36 th ANNUAL HEALTHCARE CONFERENCE
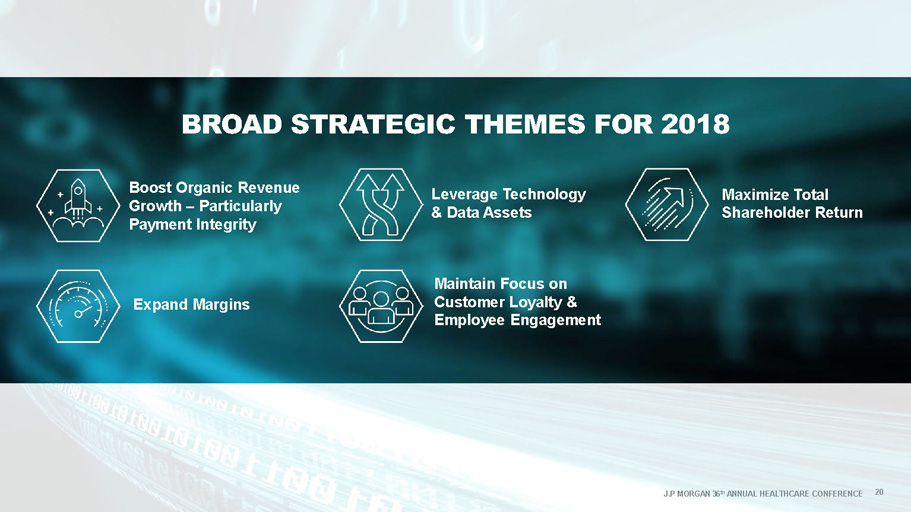
J.P MORGAN 36 th ANNUAL HEALTHCARE CONFERENCE 20 BROAD STRATEGIC THEMES FOR 2018 Boost Organic Revenue Growth – Particularly Payment Integrity Maintain Focus on Customer Loyalty & Employee Engagement Leverage Technology & Data Assets Maximize Total Shareholder Return Expand Margins

J.P. MORGAN 36 th ANNUAL HEALTHCARE CONFERENCE 21 J.P MORGAN 36 th ANNUAL HEALTHCARE CONFERENCE CONCLUSION

J.P. MORGAN 36 th ANNUAL HEALTHCARE CONFERENCE $0.07 $0.26 $0.72 $1.48 $2.60 $3.40 $5.50 $0.0 $1.0 $2.0 $3.0 $4.0 $5.0 $6.0 1970 1980 1990 2000 2010 2016 2025P Trillions National Health Expenditures 1970 - 2025 ($ Trillions) HELPING PAYERS BEND THE HEALTHCARE COST CURVE Relentless r ise in spending expected to grow to nearly 20% of GDP by 2025 1 CMS Office of the Actuary National Health Expenditures , Projection Table 17 (March 2017) 2 CMS Office of the Actuary, NHE Fact Sheet (December 6, 2017) 22 2 1

J.P. MORGAN 36 th ANNUAL HEALTHCARE CONFERENCE ▪ The HMS Product Suite ▪ Q3’17 Financial Information APPENDIX 23 J.P MORGAN 36 th ANNUAL HEALTHCARE CONFERENCE

J.P. MORGAN 36 th ANNUAL HEALTHCARE CONFERENCE 24 THE HMS PRODUCT SUITE COORDINATION OF BENEFITS PAYMENT INTEGRITY CARE MANAGEMENT AND CONSUMER ENGAGEMENT
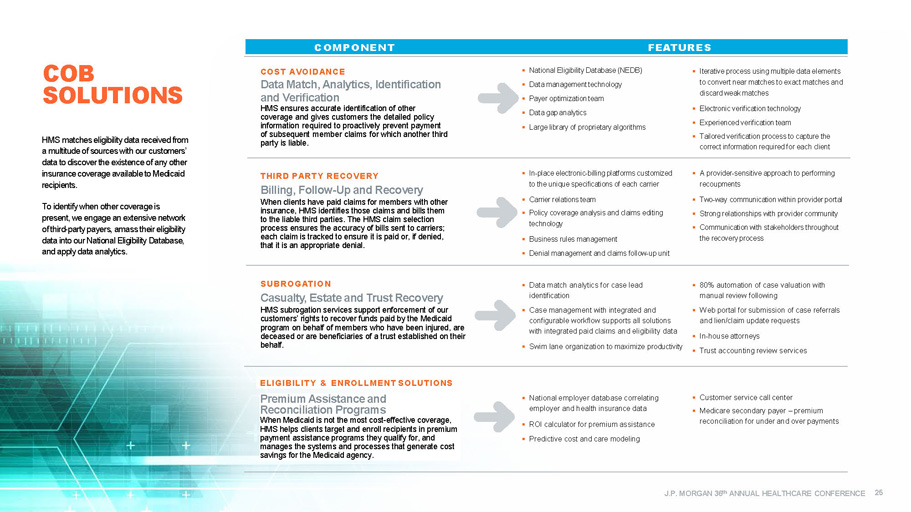
J.P. MORGAN 36 th ANNUAL HEALTHCARE CONFERENCE ▪ National Eligibility Data base (NEDB) ▪ Data m anagement technology ▪ Payer o ptimization team ▪ Data gap analytics ▪ Large library of proprietary algorithms ▪ Iterative process using multiple data elements to convert near matches to exact matches and discard weak matches ▪ Electronic verification technology ▪ Experienced verification team ▪ Tailored verification process to capture the correct information required for each client ▪ In - place electronic - billing platforms customized to the unique specifications of each carrier ▪ Carrier relations team ▪ Policy coverage analysis and claims editing technology ▪ Business rules management ▪ Denial management and claims follow - up unit ▪ A provider - sensitive approach to performing recoupments ▪ Two - way communication within provider portal ▪ Strong relationships with provider community ▪ Communication with stakeholders throughout the recovery process COST AVOIDANCE Data Match, Analytics, Identification and Verification HMS ensures accurate identification of other coverage and gives customers the detailed policy information required to proactively prevent payment of subsequent member claims for which another third party is liable . THIRD PARTY RECOVERY Billing, Follow - Up and Recovery When clients have paid claims for members with other insurance, HMS identifies those claims and bills them to the liable third parties. The HMS claim selection process ensures the accuracy of bills sent to carriers ; each claim is tracked to ensure it is paid or , if denied, that it is an appropriate denia l. ▪ Data match analytics for case lead identification ▪ Case m anagement with integrated and configurable workflow supports all solutions with i ntegrated paid claims and eligibility data ▪ Swim lane organization to maximize productivity ▪ 80% automation of case valuation with manual review following ▪ Web portal for submission of case referrals and lien/claim update requests ▪ In - house attorneys ▪ Trust accounting review services ▪ National employer database correlating employer and health insurance data ▪ ROI calculator for p remium a ssistance ▪ Predictive cost and care modeling ▪ Customer s ervice call center ▪ Medicare s econdary p ayer – p remium reconciliation for under and over payments SUBRO G A TIO N Casualty, Estate and Trust R ecovery HMS subrogation services support enforcement of our customers’ rights to recover funds paid by the Medicaid program on behalf of members who have been injured, are deceased or are beneficiaries of a t rust established on their behalf . ELIGIBILIT Y & ENROLLMENT SOLUTIONS Premium Assistance and Reconciliation Programs When Medicaid is not the most cost - effective coverage, HMS helps clients target and enroll recipients in premium payment assistance programs they qualify for, and manages the systems and processes that generate cost savings for the Medicaid agency . COB SOLUTIONS COMPONENT FEATURES COMPONENT FE A TURES HMS matches eligibility data received from a multitude of sources with our customers’ data to discover the existence of any other insurance coverage available to Medicaid recipients. To identify when other coverage is present, we engage an extensive network of third - party payers, amass their eligibility data into our National Eligibility Database, and apply data analytics . 25

J.P. MORGAN 36 th ANNUAL HEALTHCARE CONFERENCE ▪ Edit library addresses all types of errors and issues – beyond coding ▪ Edits address all service types – beyond professional ▪ Edits are configured to each client’s programs and policies ▪ Pre - p ay e dits enable more accurate auto - adjudication of claims ▪ Post - p ay d ata m ining identifies complex overpayments that client systems miss ▪ Recovery is supported by HMS via client and/or HMS p rovider p ortal ▪ Results/insights are integrated into client system/process . ▪ Pre - p ay and/or p ost - p ay ▪ Clinical algorithms and predictive models accurately target claims ▪ Record requests are supported by provider portal, integration with EHR systems ▪ OCR, automated record tabbing and smart search enable efficient record review ▪ Reviews are performed by RNs and certified coders, with oversight by medical directors ▪ Purpose - built review platform ensures efficiency, accuracy, tracking, QA and reporting ▪ Clinical determinations are fully supported through the appeal and recovery process ▪ Transparency with clients is achieved via our p ortal ▪ Utilization r eview , including prior - authorizations and post - pay claim review ▪ Long - t erm c are audits ▪ Bill a udits supported by analytics and proprietary charge review platforms ▪ Recoveries, fraud referrals, program insight ▪ Credit b alance audits include field audit and desk reviews, supported by our proprietary platform ▪ Behavioral health audits use proprietary provider scorecards, audit platform COMPONENT FE A TURES Claim Edits & Analytics Claim edits and analytics identify claims that have been improperly billed and paid according to regulatory, policy and industry rules. Clinical & Claim Reviews Clinical claim reviews identify improper coding, location/level of service and reimbursement errors by reviewing claims vs. medical records. Utilization Review & Provider Audits Specialty clinical and provider review programs address specific provider types or FWA issues within health plans. ▪ Provider p rofiles compare providers with peers on utilization and coding metrics ▪ Provider a lerts leverage external provider sanction data ▪ Guided f raud a nalytics target specific fraud patterns ▪ Business intelligence d ata e xploration t ools enable 360 - degree view of FWA within programs ▪ Network “link” analysis identifies outlier referral and collusion patterns ▪ Geospatial a nalysis identifies unlikely service patterns ▪ Special Investigative Unit (SIU) analysts (CFEs, SMEs) provide optional analytical clinical and investigative support ▪ Compliance with FWA regulatory requirements Fraud Analytics & SIU Support Fraud analytics identify high - risk providers and members, and potential fraud issues. The HMS PI portal solution enables clients to identify, investigate and track fraud within their programs. Dependent Eligibility Reviews HMS verifies that dependents listed on employees’ benefit plans are eligible for coverage, ensuring that employers only pay claims for those who meet plan criteria. ▪ Secure, customizable and interactive web portal ▪ Customizable employee communication ▪ Call center technology ▪ Multi - option for submission of verification, including web application PI SOLUTIONS The HMS suite of Payment Integrity (PI) solutions is a combination of software and services designed to ensure that payments for healthcare claims are paid correctly, according to contractual terms, free of error or duplication, and without fraudulent, wasteful or abusive practices. Our data analytics and algorithm libraries mine, analyze and provide actionable insight on opportunities to avoid or recover improper payments. 26

J.P. MORGAN 36 th ANNUAL HEALTHCARE CONFERENCE The HMS Essette Solution provides clients with integrated , modular applications that support care and disease management , utilization management, population management and other member - centric services. The HMS Eliza Solution enables personalized communications with healthcare consumers – across a multi - channel platform – to assess health status, identify barriers, close gaps in care, and increase member retention. Our flexible, scalable architecture and modular platform position HMS to easily accommodate the rapid evolution of care management and risk models , as well as expand solutions to address consumer engagement, performance management and program design – all key components of an effective health engagement technology framework. ESSETTE ▪ Care management ▪ Population management ▪ Utilization management ▪ Business intelligence ▪ Customer service ELIZA ▪ Targeting analytics ▪ Multi - channel communication capability ▪ Personalized communications ▪ Member engagement DATA ▪ Clinical data (EHR, lab, instrumentation) ▪ Administrative data (enrollment, claims and operational) ▪ Consumer data (point of sale, wearables, social media) ▪ Contextual data (geospatial, environment, census, market survey) ANALYTICS ▪ Population profiling ▪ Risk stratification ▪ Behavioral segmentation ▪ Predictive modeling ▪ Gaps in care ▪ BI/ dashboarding ▪ Workforce performance INFR ASTRUC TURE ▪ Clinical interoperability ▪ Relational and non - relational databases ▪ Big data platforms ▪ Real - time data ingestion ▪ Internet of T hings for healthcare ▪ Cloud/SaaS The Eliza and Essette Tool Kit CARE MANAGEMENT AND CONSUMER ENGAGEMENT HMS has a broad foundation of technology and service solutions to support a Health Engagement Management framework, enabling our customers to better manage quality, cost and compliance across the care continuum and all lines of business. Current initiatives focus on care management, risk management, patient engagement, and interoperability and are designed to support quality - of - care outcomes. 27 Product Suite

J.P. MORGAN 36 th ANNUAL HEALTHCARE CONFERENCE Essette Care Management Proven tools help customers improve care across the continuum, manage a comprehensive care team, and educate and engage patients. Features such as a 360 - degree view , evidence - based content , and role - based workflows help clients’ care managers navigate and automate personalized patient care paths. Essette Utilization Management Workflow is driven by evidence - based guidelines and authorization rules to be efficient while ensuring compliance and managing prior authorizations, inpatient stays, and concurrent and retrospective reviews . Essette Business Intelligence Data from other Essette modules and external sources is ingested to create dashboards, charts , and customizable reports so key business decisions can be made with confidence . Essette Customer Service Create s new issues, provide s immediate answers and efficiently route s problems to the appropriate case worker . Powerful and intuitive solutions customized with client - driven features ESSETTE MODULES Essette Appeals and Grievances Manage s member, provider, authorization denials, payment issues , and other types of appeals and grievances. Users are guided step by step through the process using automated tasks with configurable turnaround times and attachments . Essette Population Management Strat ifies members of all risk levels and organize s them into campaigns based on specific criteria such as claim information or pharmacy data. Complete s bulk actions for the population such as referring to c are m anagement or sending correspondence . Essette Advanced Analytics Actionable intelligence based on Johns Hopkins Adjusted Clinical Groups® (ACG) predictive models. Customizable dashboards and drill - down metrics — combined with industry - standard Healthcare Effectiveness Data and Information Set (HEDIS®) quality measurement — reduce costs and improve outcomes . 28
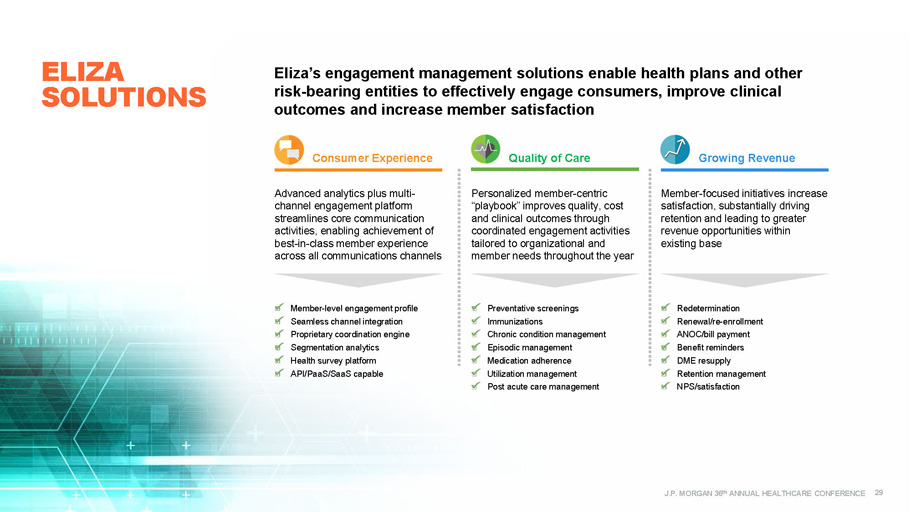
J.P. MORGAN 36 th ANNUAL HEALTHCARE CONFERENCE Quality of Care Growing Revenue Personalized member - centric “ playbook ” improves quality, cost and clinical outcomes through coordinated engagement activities tailored to organizational and member needs throughout the year Member - focused initiatives increase satisfaction, substantially driving retention and leading to greater revenue opportunities within existing base Preventative screenings Immunizations Chronic condition management Episodic management Medication adherence Utilization management Post acute care management Redetermination Renewal/re - enrollment ANOC/bill payment Benefit reminders DME resupply Retention management NPS/satisfaction Consumer Experience Advanced analytics plus multi - channel engagement platform streamlines core communication activities, enabling achievement of best - in - class member experience across all communications channels Member - level engagement profile Seamless channel integration Proprietary coordination engine Segmentation analytics Health survey platform API/PaaS/SaaS capable Eliza’s engagement management solutions enable health plans and other risk - bearing entities to effectively engage consumers, improve clinical outcomes and increase member satisfaction ELIZA SOLUTIONS 29

J.P. MORGAN 36 th ANNUAL HEALTHCARE CONFERENCE AN EXAMPLE OF COORDINATED ENGAGEMENT WITH ELIZA MEMBERS PLAYBOOK: Pregnant Mom with a Four - year - old Child ▪ Newly enrolled pregnant mother with a four - year - old child on the same plan ▪ Opt - in for SMS and email ▪ Timely, targeted outreach includes: ▪ Appointment scheduling ▪ Reminders ▪ Educational information ▪ Connecting with plan and community resources JAN FEB MAR APR Welcome/ HRA Prenatal (SMS Opt - in) Prenatal Follow - up (SMS) Well - child Visit Reminder Prenatal Check - in (Call) MAY JUNE JULY AUG Prenatal Follow - up (SMS) Prenatal Check - in (Call) Prenatal Follow - up (SMS) Prenatal Check - in (Call) SEPT OCT NOV DEC Postpartum/ Well - baby (call) Flu Reminder Postpartum Reminder (email) 60 - Day Reminder for Child Renewal (call) Well - baby (email) TRIGGERED OUTREACH • Notification of pregnancy • Notification of birth • Redetermination date • Well - child visit compliance 30

J.P. MORGAN 36 th ANNUAL HEALTHCARE CONFERENCE AN ELIZA SUCCESS STORY: RAPID DEPLOYMENT PROGRAM GOALS: ▪ Rapidly deploy mock Health Outcomes and Customer Experience survey prior to CMS blackout period to capture member and provider performance insights and drive focused clinical and service actions aimed at HOS and CAHPS Star score improvements ▪ Identify key member perceptions from a growing, diverse membership OUR APPROACH: ▪ Outreach surveyed members on key CAHPS access and service issues and HOS outcomes measures, while reinforcing the plan’s commitment to quality care ▪ Member alerts based on responses (pressing issues requiring immediate intervention) provided to heath plan daily for immediate intervention ▪ Member responses attributed back to PCPs and provider groups to allow for development of provider scoring. Provider ranking by measures provided to key groups and physicians . RESULTS DELIVERED: ▪ 53% of members were reached through IVR outreach; 40 % agreed to receive future emails, including verification of email address ▪ 4 measures increased 1 - 2 Stars ; 9 measures were maintained at 2017 levels ▪ Overall star score increased from 3.5 to 4 Stars Outreach revealed actionable opportunities at the member level 1 Mid - market Health Plan with more than 40k Medicare Advantage members 31 2 3 3 2 4 4 4 3 0 0.5 1 1.5 2 2.5 3 3.5 4 4.5 C05 - MENTAL HEALTH C24 - SERVICE C25 - QUALITY D09 - GETTING RX Year - Over - Year Star Improvements 2017 Star Scores 2018 Star Scores Increased HOS and CAHPS scores and identified at - risk members for a Medicare Advantage client 1

Financial Results Reconciliation of Net Income to GAAP EPS and Adjusted EPS Q3’17 QUARTERLY FINANCIAL INFORMATION Market and Product Revenue J.P MORGAN 36 th ANNUAL HEALTHCARE CONFERENCE 32

J.P. MORGAN 36 th ANNUAL HEALTHCARE CONFERENCE (Unaudited, $ in thousands, except per share amounts) 1 As revised. Refer to “Part II, Item 8. Consolidated Financial Statements and Supplementary Data, Notes to the Consolidated Financial Statements” footnote 15 “Quarterly Financial Data (Unaudited)” on page 125 in the Company’s 2016 Form 10 - K (see ttps ://www.sec.gov/Archives/edgar/data/1196501/000117184317003514/f10k_030117p.htm ) 2 Diluted adjusted EPS is a non - GAAP measure (see reconciliation on slide 35) Note: Certain amounts in the 2016 period presented have been adjusted to reflect the retrospective application required by th e e arly adoption of ASU No. 2016 - 09, Compensation – Stock Compensation (Topic 718): Improvements to Employee Share - Based Payment Accountin g, (“ASU 2016 - 09”) related to the recognition of excess tax benefits in the provision for income taxes Revenue $ 122,860 $ 125,590 $ 113,733 $ 133,313 $ 125,673 Cost of services: Compensation 48,298 47,229 48,920 51,853 49,012 Data processing 9,541 9,068 9,783 11,281 12,067 Occupancy 3,388 3,354 3,547 4,230 4,332 Direct project costs 10,997 9,301 10,443 10,101 9,548 Other operating costs 8,465 7,130 7,203 6,562 7,446 Amortization of acquisition related software and intangible assets 6,390 7,614 6,286 7,372 8,167 Total cost of services 87,079 83,696 86,182 91,399 90,572 Selling, general & administrative expenses 23,131 23,136 23,608 27,552 22,240 Total operating expenses 110,210 106,832 109,790 118,951 112,812 Operating income 12,650 18,758 3,943 14,362 12,861 Interest expense (2,121) (2,207) (2,286) (2,339) (3,109) Interest income 105 109 155 32 14 Income before income taxes 10,634 16,660 1,812 12,055 9,766 Income taxes (3,412) 7,509 370 5,538 3,394 Net income $ 14,046 $ 9,151 $ 1,442 $ 6,517 $ 6,372 Net income per diluted share $ 0.17 $ 0.11 $ 0.02 $ 0.08 $ 0.07 Weighted average common shares, diluted 84,853 85,822 85,580 85,826 85,730 Diluted adjusted EPS 2 $ 0.24 $ 0.18 $ 0.13 $ 0.16 $ 0.19 Q4'16 Q1'17 Q3'17Q2'17Q3'16 1 1 QUARTERLY FINANCIAL INFORMATION Q3 2017 Financial Results 33

J.P. MORGAN 36 th ANNUAL HEALTHCARE CONFERENCE QUARTERLY MARKET AND PRODUCT REVENUE Q3 2017 Financial Results (Unaudited, $ in millions) 1 As revised. Refer to “Part II, Item 8. Consolidated Financial Statements and Supplementary Data, Notes to the Consolidated Financial Statements” footnote 15 “Quarterly Financial Data (Unaudited)” on page 125 in the Company’s 2016 Form 10 - K for details (see https://www.sec.gov/Archives/edgar/data/1196501/000117184317003514/f10k_030117p.htm ) 2 Analytical services includes payment integrity (PI), Medicare RAC and care management and consumer engagement solutions 3 Includes quarterly revenue for payment integrity (PI) of $23.9 million, Medicare RAC of $0.8 million, and care management and consumer engagement of $10.9 million Total Revenue by Market Q3'15 Q4'15 Q1'16 Q2'16 Q3'16 Q4'16 Q1'17 Q2'17 Q3'17 State Government 54.6$ 54.5$ 50.7$ 57.6$ 53.0$ 57.7$ 53.3$ 57.9$ 51.6$ Commercial 52.0 58.5 56.0 53.5 57.9 62.9 55.1 69.4 67.6 Federal (including Medicare RAC) / Other 11.8 15.5 13.1 10.4 12.0 5.0 5.3 6.0 6.5 Total HMS Revenue 118.4 128.5 119.8 121.5 122.9 125.6 113.7 133.3 125.7 Total Revenue by Product Q3'15 Q4'15 Q1'16 Q2'16 Q3'16 Q4'16 Q1'17 Q2'17 Q3'17 Coordination of Benefits 84.2$ 87.1$ 82.9$ 89.7$ 86.3$ 95.0$ 88.5$ 98.5$ 90.1$ Analytical Services 2 34.2 41.4 36.9 31.8 36.6 30.6 25.2 34.8 35.6 Total HMS Revenue 118.4$ 128.5$ 119.8$ 121.5$ 122.9$ 125.6$ 113.7$ 133.3$ 125.7$ 1 1 1 1 1 1 34 3 2
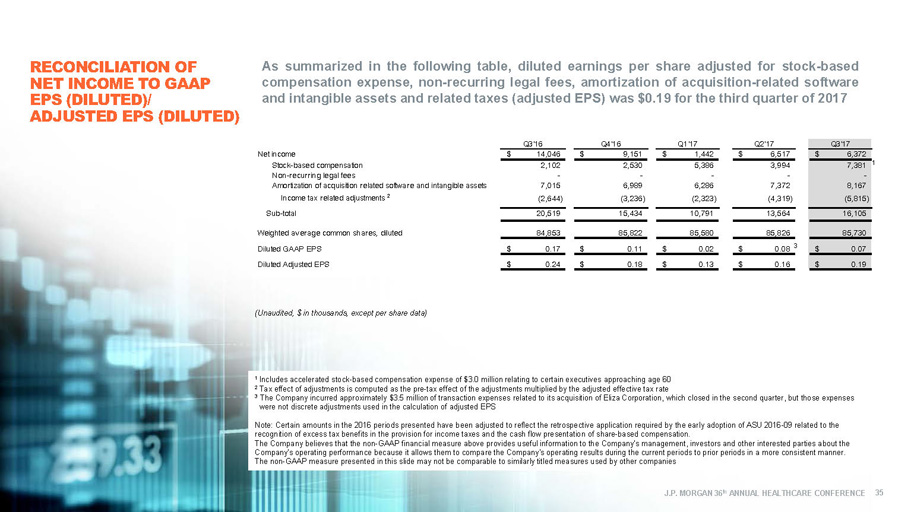
J.P. MORGAN 36 th ANNUAL HEALTHCARE CONFERENCE RECONCILIATION OF NET INCOME TO GAAP EPS (DILUTED)/ ADJUSTED EPS (DILUTED) (Unaudited, $ in thousands, except per share data) As summarized in the following table, diluted earnings per share adjusted for stock - based compensation expense, non - recurring legal fees, amortization of acquisition - related software and intangible assets and related taxes (adjusted EPS) was $ 0 . 19 for the third quarter of 2017 1 Includes accelerated stock - based compensation expense of $3.0 million relating to certain executives approaching age 60 2 Tax effect of adjustments is computed as the pre - tax effect of the adjustments multiplied by the adjusted effective tax rate 3 The Company incurred approximately $3.5 million of transaction expenses related to its acquisition of Eliza Corporation, whic h c losed in the second quarter, but those expenses were not discrete adjustments used in the calculation of adjusted EPS Note: Certain amounts in the 2016 periods presented have been adjusted to reflect the retrospective application required by t he early adoption of ASU 2016 - 09 related to the recognition of excess tax benefits in the provision for income taxes and the cash flow presentation of share - based compensation . The Company believes that the non - GAAP financial measure above provides useful information to the Company's management, investor s and other interested parties about the Company's operating performance because it allows them to compare the Company's operating results during the current periods to prior periods in a more consistent manner. The non - GAAP measure presented in this slide may not be comparable to similarly titled measures used by other companies Net income $ 14,046 $ 9,151 $ 1,442 $ 6,517 $ 6,372 Stock-based compensation 2,102 2,530 5,386 3,994 7,381 Non-recurring legal fees - - - - - Amortization of acquisition related software and intangible assets 7,015 6,989 6,286 7,372 8,167 (2,644) (3,236) (2,323) (4,319) (5,815) Sub-total 20,519 15,434 10,791 13,564 16,105 Weighted average common shares, diluted 84,853 85,822 85,580 85,826 85,730 Diluted GAAP EPS $ 0.17 $ 0.11 $ 0.02 $ 0.08 $ 0.07 Diluted Adjusted EPS $ 0.24 $ 0.18 $ 0.13 $ 0.16 $ 0.19 Q3'17Q3'16 Q4'16 Q2'17 Income tax related adjustments 2 Q1'17 35 1 3

Enterprising healthcare